Attached files
| file | filename |
|---|---|
| EXCEL - IDEA: XBRL DOCUMENT - Crimson Wine Group, Ltd | Financial_Report.xls |
| EX-31.1 - EX-31.1 - Crimson Wine Group, Ltd | c151-20141231ex311fe1ec7.htm |
| EX-32.1 - EX-32.1 - Crimson Wine Group, Ltd | c151-20141231ex3214fc69d.htm |
| EX-31.2 - EX-31.2 - Crimson Wine Group, Ltd | c151-20141231ex312eccc14.htm |
| EX-32.2 - EX-32.2 - Crimson Wine Group, Ltd | c151-20141231ex32204f56f.htm |
SECURITIES AND EXCHANGE COMMISSION
WASHINGTON, D.C. 20549
FORM 10-K
[x] ANNUAL REPORT PURSUANT TO SECTION 13 OR 15(d) OF THE SECURITIES EXCHANGE ACT OF 1934
For the fiscal year ended December 31, 2014
OR
[_] TRANSITION REPORT PURSUANT TO SECTION 13 OR 15(d) OF THE SECURITIES EXCHANGE ACT OF 1934
For the transition period from ___________ to ___________
Commission file number: 000-54866
CRIMSON WINE GROUP, LTD.
(Exact Name of Registrant as Specified in its Charter)
|
Delaware |
13-3607383 |
|
(State or other Jurisdiction of Incorporation or Organization) |
(I.R.S. Employer Identification No.) |
2700 Napa Valley Corporate Drive, Suite B
Napa, California 94558
(800) 486-0503
(Address, Including Zip Code, and Telephone Number, Including Area Code, of Registrant’s Principal Executive Offices)
Securities registered pursuant to Section 12(b) of the Act: None.
Securities registered pursuant to Section 12(g) of the Act:
Common Stock, par value $0.01 per share
(Title of Class)
Indicate by check mark if the registrant is a well-known seasoned issuer, as defined in Rule 405 of the Securities Act. Yes [ ] No [x]
Indicate by check mark if the registrant is not required to file reports pursuant to Section 13 or Section 15(d) of the Act. Yes [ ] No [x]
Indicate by check mark whether the registrant: (1) has filed all reports required to be filed by Section 13 or 15(d) of the Securities Exchange Act of 1934 during the preceding 12 months (or for such shorter period that the registrant was required to file such reports), and (2) has been subject to such filing requirements for the past 90 days. Yes [x] No [ ]
Indicate by check mark whether the registrant has submitted electronically and posted on its corporate Web site, if any, every Interactive Data File required to be submitted and posted pursuant to Rule 405 of Regulation S-T (§ 232.405 of this chapter) during the preceding 12 months (or for such shorter period that the registrant was required to submit and post such files). Yes [x] No [ ]
Indicate by check mark if disclosure of delinquent filers pursuant to Item 405 of Regulation S-K is not contained herein, and will not be contained, to the best of registrant’s knowledge, in definitive proxy or information statements incorporated by reference in Part III of this Form 10-K or any amendment to this Form 10-K [ ].
Indicate by check mark whether the registrant is a large accelerated filer, an accelerated filer, a non-accelerated filer, or a smaller reporting company. See definitions of “large accelerated filer," "accelerated filer,” and "smaller reporting company" in Rule 12b-2 of the Exchange Act. (Check one):
|
Large accelerated filer [ ] |
Accelerated filer [ x ] |
|
Non-accelerated filer [ ] |
Smaller reporting company [ ] |
Indicate by check mark whether the registrant is a shell company (as defined in Rule 12-b of the Exchange Act). Yes [ ] No [x]
Based upon the closing sales price of the Registrant’s Common Stock as published by the OTC Market Service as of June 30, 2014, the aggregate market value of the Registrant’s Common Stock held by non-affiliates was approximately $180,504,000 on that date.
As of March 12, 2015, there were 24,458,368 outstanding shares of the Registrant’s Common Stock, par value $.01 per share.
|
TABLE OF CONTENTS |
||||
|
Page Number |
||||
|
PART I |
||||
|
Item 1. |
Business |
3 |
||
|
Item 1A. |
Risk Factors |
7 |
||
|
Item 1B. |
Unresolved Staff Comments |
11 |
||
|
Item 2. |
Properties |
11 |
||
|
Item 3. |
Legal Proceedings |
12 |
||
|
Item 4. |
Mine Safety Disclosures |
12 |
||
|
PART II |
||||
|
Item 5. |
Market for the Registrant's Common Equity, Related Stockholder Matters and Issuer Purchases of Equity Securities |
13 |
||
|
Item 6. |
Selected Financial Data |
14 |
||
|
Item 7. |
Management's Discussion and Analysis of Financial Condition and Results of Operations |
15 |
||
|
Item 7A. |
Quantitative and Qualitative Disclosure About Market Risk |
19 |
||
|
Item 8. |
Financial Statements and Supplementary Data |
19 |
||
|
Item 9. |
Changes and Disagreements with Accountants on Accounting and Financial Disclosure |
20 |
||
|
Item 9A. |
Conclusion Regarding Effectiveness of Disclosure Controls and Procedures |
20 |
||
|
Item 9B. |
Other Information |
20 |
||
|
PART III |
||||
|
Item 10. |
Directors, Executive Officers and Corporate Governance |
21 |
||
|
Item 11. |
Executive Compensation |
23 |
||
|
Item 12. |
Security Ownership of Certain Beneficial Owners and Management and Related Stockholder Matters |
25 |
||
|
Item 13. |
Certain Relationships and Related Transactions and Directors Independence |
26 |
||
|
Item 14. |
Principal Accounting Fees and Services |
28 |
||
|
PART IV |
||||
|
Item 15. |
Exhibits and Financial Statement Schedules |
29 |
||
|
Signatures |
31 |
|||
2
EXPLANATORY NOTE
Crimson Wine Group, Ltd. qualifies as an “emerging growth company” pursuant to the provisions of the Jumpstart Our Business Startups Act (the “JOBS Act”), enacted on April 5, 2012. For as long as Crimson Wine Group, Ltd. remains an “emerging growth company” as defined in the JOBS Act, we may take advantage of certain exemptions from various reporting requirements that are applicable to other reporting companies which are not “emerging growth companies,” including reduced disclosure obligations regarding executive compensation in this Annual Report on Form 10−K (“Form 10−K”). Therefore, this Form 10−K does not include certain information regarding executive compensation that may be found in the annual reports of other reporting companies.
PART I
Item 1. Business.
THE COMPANY
Overview
Crimson Wine Group, Ltd. (“Crimson”) is a Delaware corporation whose business has been operating since 1991. As used herein, the term, “Company” refers to Crimson and its wholly-owned subsidiaries, except as the context may otherwise require. Prior to February 25, 2013, Crimson was a wholly-owned subsidiary of Leucadia National Corporation (“Leucadia”). On February 1, 2013, Leucadia declared a pro rata dividend of all of the outstanding shares of Crimson’s common stock in a manner that was structured to qualify as a tax-free spin-off for U.S. federal income tax purposes (the “Distribution”). Leucadia’s common shareholders received one share of Crimson common stock for every ten common shares of Leucadia, with cash in lieu of fractional shares, on February 25, 2013.
Crimson is in the business of producing and selling ultra premium and luxury wines (i.e., wines that retail for $14 to $25 and over $25 per 750ml bottle, respectively). Crimson is headquartered in Napa, California and through its subsidiaries owns four wineries: Pine Ridge Vineyards, Archery Summit, Chamisal Vineyards and Seghesio Family Vineyards. Pine Ridge Vineyards was acquired in 1991 and has been conducting operations since 1978, Crimson started Archery Summit in 1993, Chamisal Vineyards was acquired in 2008 and has been conducting operations since 1973, and Seghesio Family Vineyards was acquired in 2011 and has been conducting operations since 1895. Additionally, in 2005 and 2006 Crimson acquired Double Canyon vineyard land in the Horse Heaven Hills of Washington’s Columbia Valley. Since 2010, Double Canyon has produced wines in a third party custom crush facility. References to cases of wine herein refer to nine-liter equivalent cases.
Pine Ridge Vineyards
Pine Ridge Vineyards owns 158 acres and controls through leasing arrangements an additional 18 acres of estate vineyards in five Napa Valley appellations—Stags Leap District, Rutherford, Oakville, Carneros and Howell Mountain. Approximately 165 acres are currently planted and producing grapes. The winery and production facilities at Pine Ridge Vineyards have a permitted annual wine production capacity of up to 300,000 gallons, which equates to approximately 126,000 cases of wine; however, current fermentation and processing capacity is limited to approximately 80,000 cases without additional capital investment. The facility includes areas and equipment for traditional crush, fermentation, aging and bottling processes, and also has a tasting room, hospitality center and administrative offices. Built into the hillside for wine barrel storage are approximately 34,000 square feet of underground caves with a capacity to store over 4,000 barrels. In addition, there are special event dining areas both indoors and outdoors as well as in the underground caves.
The Pine Ridge Vineyards estate business is focused primarily on the production of high quality Cabernet Sauvignon and Bordeaux-style blends sold by Crimson under the Pine Ridge Vineyards brand name. Pine Ridge Vineyards also produces Chenin Blanc + Viognier, which is sold by Crimson under the Pine Ridge brand name and is made from purchased grapes and bulk wine juice processed at a third party custom winemaking facility with a contracted capacity of up to 147,000 cases. Incremental capacity options are under consideration and available.
Archery Summit
Archery Summit owns 103 acres and controls through leasing arrangements an additional 17 acres of estate vineyards in the Willamette Valley, Oregon. Approximately 113 acres are currently planted and producing grapes. The winery and production facilities at Archery Summit have a permitted annual wine production capacity of up to 50,000 gallons, which equates to approximately 21,000 cases of wine; however, current fermentation and processing capacity is limited to approximately 15,000 cases. The facility includes areas and equipment for gravity flow of wine with quality oriented crush, fermentation, aging and bottling processes, and also has a tasting room, hospitality center and administrative offices. The facility has approximately 8,300 square feet of underground caves for wine barrel storage with a capacity to store over 600 barrels. In addition, there are special event dining areas indoors as well as in the underground caves.
Archery Summit is focused primarily on producing estate grown, expressive single vineyard Pinot Noir from tightly spaced vines sold by Crimson under the Archery Summit brand name. Archery Summit also produces Vireton Pinot Gris, which is sold by Crimson under
3
the Archery Summit brand name and is made from purchased grapes processed at a third party custom winemaking facility with available contract capacity of over 10,000 cases.
Chamisal Vineyards
Chamisal Vineyards owns 98 acres of vineyards in the Edna Valley, California, of which 80 acres are currently planted and producing grapes. The Chamisal Vineyard was the first vineyard planted in the Edna Valley in 1973. The winery and production facilities at Chamisal have a permitted annual wine production capacity of up to 480,000 gallons which equates to approximately 200,000 cases of wine. The facility includes areas and equipment for quality oriented modern crush, fermentation, aging and bottling processes, as well as a tasting room, hospitality center and administrative offices. There are special event dining areas outdoors.
Chamisal is focused on producing estate grown, expressive single vineyard Chardonnay and Pinot Noir as well as a Stainless Chardonnay produced from both purchased and estate grown grapes. The wines are sold by Crimson under the Chamisal Vineyards brand name.
Seghesio Family Vineyards
Seghesio Family Vineyards owns 316 acres of estate vineyards in two Sonoma County, California appellations, the Alexander Valley and the Russian River Valley, which includes 21 acres purchased during the third quarter of 2014, of which approximately 307 acres are planted and producing grapes. Seghesio Family Vineyards has a long history of growing and producing Zinfandel and Italian varietal wines in the Sonoma region of California. The winery and production facilities at Seghesio Family Vineyards have a permitted annual wine production capacity of up to 404,000 gallons which equates to approximately 170,000 cases of wine. Seghesio Family Vineyards has plans to expand is annual production capacity up to 595,000 gallons which equates to approximately 250,000 cases of wine. The facility includes areas and equipment for traditional crush, fermentation, aging, bottling and warehousing processes, as well as a tasting room, private hospitality areas and administrative offices. There are indoor and outdoor special event dining areas. In Alexander Valley, Seghesio Family Vineyards also owns a historic non-operating winery, mansion and railroad depot, which Crimson intends to convert into educational, tasting, hospitality and potentially incremental production facilities.
Seghesio Family Vineyards is focused on producing estate grown Zinfandel and Italian varietal wines as well as a heritage Old Vine Zinfandel and Sonoma County Zinfandel produced from both purchased and estate grown grapes. The wines are sold by Crimson under the Seghesio Family Vineyards brand name.
Double Canyon Vineyards
Double Canyon Vineyards owns 185 acres of vineyards in the Horse Heaven Hills of Washington, of which 88 acres are currently planted and producing grapes, following the sale of 307 acres in May 2014, 285 of which were plantable. Double Canyon Vineyards sells the majority of its grapes to third parties; however, starting with the 2010 vintage, Double Canyon Vineyards produced and bottled, at an offsite custom crush winery, the first wine under the Double Canyon Vineyards brand name which was released in the Fall of 2012. Two wines under the Double Canyon brand were released during 2014. Double Canyon produces wines in a custom crush winery and plans to grow production of wines to be sold by Crimson under the Double Canyon brand name. This proprietorship was maintained in 2014 with a contracted capacity of up to 10,000 cases.
Double Canyon Vineyards is focused on producing estate grown Cabernet Sauvignon as well as a new Horse Heaven Hills Cabernet Sauvignon from both purchased and estate grown grapes, which was launched in July 2014.
Competition
The markets for ultra premium and luxury products in the wine industry are intensely competitive. Crimson’s wines compete domestically and internationally with premium or higher quality wines produced in Europe, South America, South Africa, Australia and New Zealand, as well as in the United States. Crimson competes on the basis of quality, price, brand recognition and distribution capability, and the ultimate consumer has many choices of products from both domestic and international producers. A result of the intense competition has been, and may continue to be, upward pressure on Crimson’s selling and promotional expenses. Many of Crimson’s competitors are significantly larger with greater financial, production, distribution and marketing resources. The U.S. is dominated by three large wineries with production largely based in California, representing over 60% of the domestic U.S. case sales volume. Further, Crimson’s wines may be considered to compete with all alcoholic and nonalcoholic beverages.
Demand for ultra premium and luxury wines can rise and fall with general economic conditions, and is also significantly affected by grape supply. Based on industry wide volume increases in these wine categories, Crimson believes more people are drinking wine than in the past. Crimson’s wines are sold at price points from $14 to $250 per bottle, however, in the wholesale channel, which represented 89% of Crimson’s volume in 2014, the majority of volume is in the $14-$25 price range, where category growth rates in the U.S. are highest.
4
Business Segments
Crimson reports operating results in two segments: Wholesale and Direct to Consumer. These business segments reflect how the Company’s operations are evaluated by senior management and the structure of its internal financial reporting. Both financial and certain nonfinancial data are reported and evaluated in assisting senior management with strategic planning. The Company evaluates performance based on the gross profit of the respective business segments. Selling expenses that can be directly attributable to the segment are included, however, centralized selling expenses and general and administrative expenses are not allocated between operating segments. Therefore, net income information for the respective segments is not available. Based on the nature of the Company’s business, revenue generating assets are utilized across segments. Therefore, discrete financial information related to segment assets and other balance sheet data is not available and that information continues to be aggregated. Further information about segments, including sales, cost of sales, gross margin, directly attributable selling expenses, and contribution margin of the segments for the years ended December 31, 2014, 2013 and 2012, can be found in Note 14 to the consolidated financial statements.
Sales and Marketing
Crimson has focused on brand development and distribution to increase revenues and profitability, which has included acquisitions of vineyards and wineries and the development of new brands with existing assets.
Crimson’s sales and marketing team coordinates the sales and distribution of its various brands, is responsible for maintaining domestic and export distributor relationships and oversees the timing and allocation of new releases. The sales team has employees in certain key markets in the U.S. and internationally as well as brokers in certain markets. Its wines are available through many principal retail channels for premium table wines, including fine wine restaurants, hotels, specialty shops, supermarkets and club stores, in all states domestically and in over 35 countries throughout the world.
Generally, Crimson will enter into agreements with brokers for those markets where it would not be cost effective to have an employee, or if the products are being sold to a customer who usually purchases products from brokers. Crimson may also use brokers if they represent the best distribution channel after considering local regulatory requirements. On an on-going basis the Company continues to evaluate the use of brokers in its various markets; during 2014, brokers were used by Crimson in 3 states in the U.S. and in certain export markets. Revenues generated through broker relationships represented approximately 3% of wine revenues during 2014. Agreements with brokers are generally terminable by either party upon notice. In the fourth quarter of 2013, the Company and a broker that represented 9% of wine revenue in 2013 agreed to terminate the broker relationship as the Company believed it could serve the related markets better and more cost effectively with its own employees.
Crimson’s wines are primarily sold to distributors, who then sell to retailers and restaurants. Domestic sales of Crimson’s wines are made through more than 55 independent wine and spirits distributors. International sales are made through independent importers and brokers.
As permitted under federal and local regulations, Crimson has been placing increasing emphasis on direct sales to consumers, which it is able to do through the Internet, wine clubs, and at the wineries’ tasting rooms. During 2014, direct sales to consumers represented 11% of case sales and 38% of wine revenues. Approximately 64% of the direct to consumer sales were through wine clubs, 26% were through the wineries’ tasting rooms and the balance from the Internet, outbound calling, and offers through e-commerce. Members typically join our wine clubs after visiting our tasting rooms at our various facilities, or after hearing about our wine clubs from other members. Our tasting rooms are located in vacation areas that typically attract consumers interested in wine making and touring the area. Direct sales to consumers are more profitable for Crimson as it is able to sell its products at a price closer to retail prices rather than the wholesale price received from distributors, however, for certain direct sales offers, some of the profit is offset by freight subsidies.
Crimson’s wines are distributed in California, Illinois, Colorado, Oregon, Hawaii, New Mexico, Arizona, Washington and Nevada predominantly by Southern Wine and Spirits. During 2014, sales to Southern Wine and Spirits accounted for 21% of case volume and 16% of wine sales. Sales to the top ten distributors accounted for 65% of volume and 50% of wine sales. These distributors also offer premium table wines of other companies that directly compete with Crimson’s products.
Domestic distributor wine sales are concentrated in certain states, with California accounting for 19% of case volume and 15% of wine sales during 2014. Other major domestic markets include New Jersey, Texas, Florida, Massachusetts, Illinois, and Minnesota where sales represented 32% of case volume and 23% of wine sales during 2014.
For 2014, export sales represented 7% of case volume and 6% of wine sales as compared to 9% of case volume and 8% of wine sales for 2013, and 8% of case volume and 7% of wine sales for 2012.
Crimson believes that the quality and locations of its wineries and tasting facilities help to create demand for its brands at the consumer level which positively impacts sales to distributors as well. Crimson participates in many wine tasting and other promotional events throughout the country in order to increase awareness and demand for its products. Many of Crimson’s brands are issued ratings or scores by local and national wine rating organizations, and higher scores will usually translate into greater demand and higher
5
pricing. Although some of Crimson’s brands are or have been highly rated in the past, and Crimson believes its farming and winemaking activities are of a quality to generate good ratings in the future, Crimson has no control over ratings issued by third parties which may not be favorable in the future.
Grape Supply
Crimson controls approximately 895 acres of vineyards in the Napa Valley, Sonoma County and Edna Valley in California, the Willamette Valley in Oregon and the Horse Heaven Hills in Washington; approximately 753 acres of these vineyards are planted, with the majority of the unplanted acres in Washington. This reflects the sale of 285 fallow acres in May 2014. Crimson expects to continue vineyard development plans for the non-producing California and Oregon properties and is considering plans to plant additional acres in Washington. Additionally, on an annual basis, Crimson has had up to 6% or more vineyard acreage under development. Newly planted vines take approximately four to five years to reach maturity and vineyards can be expected to have a useful life of 25 years before replanting is necessary. Depending on the site, soil and water conditions and spacing, Crimson’s experience has been that it costs approximately $20,000 to $60,000 per acre over a three year period to develop open land into a producing premium wine grape vineyard, before taking into account the cost of the land. With over 750 acres of planted estate holdings, Crimson could have annual capital investment requirements of $600,000 to $1,000,000 to replace existing vineyard sites as their economic useful life expires.
In 2014, approximately 32% of Crimson’s total grape supply came from Crimson controlled vineyards. Crimson purchases the balance of its supply from approximately 76 independent growers. The grower contracts range from one-year spot market purchases to intermediate and long term-agreements. No one grower represents more than 10% of Crimson’s grape supply. The top ten growers represent 39% of Crimson’s total grape supply.
Winemaking and grape growing are subject to a variety of agricultural risks. Various diseases, pests and certain weather conditions can materially and adversely affect the quality and quantity of grapes available to Crimson thereby materially and adversely affecting the supply of Crimson’s products and its profitability.
The table below summarizes Crimson’s wine grape supply and production from the last three harvests:
|
Harvest Year |
||||||
|
2014 |
2013 |
2012 |
||||
|
Estate grapes: |
||||||
|
Producing acres |
682 | 685 | 709 | |||
|
Tons harvested |
2,219 | 2,561 | 2,916 | |||
|
Tons per acre |
3.3 | 3.7 | 4.1 | |||
|
All grapes and purchased juice (in equivalent tons): |
||||||
|
Estate grapes |
2,219 | 2,561 | 2,916 | |||
|
Purchased grapes and juice |
4,703 | 4,149 | 3,921 | |||
|
Total (in tons) |
6,922 | 6,710 | 6,837 | |||
|
Total cases bottled |
387,000 | 352,000 | 277,000 | |||
Cases sold were 315,000, 308,000 and 260,000 for the years ended December 31, 2014, 2013 and 2012, respectively. Cases sold are disclosed for informational purposes, but do not necessarily correspond to the vintage year the grapes are grown and crushed. Depending on the wine, the production cycle to bottled sales is anywhere from one to three years.
Winemaking
Crimson’s winemaking philosophy includes the use of the latest in current industry winemaking advances to complement making wine in the traditional manner by starting with high quality fruit and handling it as gently and naturally as possible all the way to the bottle. Each of Crimson’s wineries is equipped with modern crush, fermentation and storage equipment as well as technology that is focused on producing the highest quality wines for each of the varietals it produces.
Government Regulation
Wine production and sales are subject to extensive regulation by the United States Department of Treasury Alcohol and Tobacco Tax and Trade Bureau (“TTB”), the California Department of Alcohol Beverage Control (“CABC”) and other state and federal governmental
6
authorities that regulate interstate sales, licensing, trade and pricing practices, labeling, advertising and other activities. In recent years, federal and state authorities have required warning labels on beverages containing alcohol. Restrictions or taxes imposed by government authorities on the sale of wine could increase the retail price of wine, which could have an adverse effect on demand for wine in general. New or revised regulations or increased licensing fees or excise taxes on wine, if enacted, could reduce demand for wine and have an adverse effect on Crimson’s business, negatively impacting Crimson’s results of operations and cash flows.
Crimson is also subject to a broad range of federal and state regulatory requirements regarding its agricultural operations and practices. Crimson’s agricultural operations are subject to regulations governing the storage and use of fertilizers, fungicides, herbicides, pesticides, fuels, solvents and other chemicals. These regulations are subject to change and conceivably could have a significant impact on operating practices, chemical usage, and other aspects of Crimson’s business.
Seasonality
There is a degree of seasonality in the growing cycles, procurement and transportation of grapes. The wine industry in general historically experiences seasonal fluctuations in revenues and net income. Typically, Crimson has lower sales and net income during the first quarter and higher sales and net income during the fourth quarter due to seasonal holiday buying as well as wine club shipment timing. Crimson expects these trends to continue.
Employees
At December 31, 2014, Crimson employed approximately 160 regular, full-time employees. Crimson also employs part-time and seasonal workers for its vineyard, production and hospitality operations. None of Crimson’s employees are represented by a collective bargaining unit and Crimson believes that its relationship with its employees is good.
Trademarks
Crimson maintains federal trademark registrations for its brands, proprietary products and certain logos, motifs and vineyard names. International trademark registrations are also maintained where it is appropriate to do so. Each of the United States trademark registrations is renewable indefinitely so long as the Company is making a bona fide usage of the trademark. The Company believes that its trademarks provide it with an important competitive advantage and has established a global network of attorneys, as well as branding, advertising and licensing professionals, to procure, maintain, protect, enhance and gain value from these registrations.
Investor Information
The Company is subject to the informational requirements of the Securities Exchange Act of 1934 (the “Exchange Act”). Accordingly, the Company files periodic reports, proxy statements and other information with the Securities and Exchange Commission (the “SEC”). Such reports, proxy statements and other information may be obtained by visiting the Public Reference Room of the SEC at 100 F Street, N.E., Washington, D.C. 20549 or by calling the SEC at 1-800-SEC-0330. In addition, the SEC maintains an Internet site (http://www.sec.gov) that contains reports, proxy and information statements and other information regarding the Company and other issuers that file electronically.
The Company’s website is http://www.crimsonwinegroup.com. The Company also makes available through its website without charge its annual report on Form 10-K, quarterly reports on Form 10-Q, current reports on Form 8-K and amendments to those reports filed or furnished pursuant to Section 13(a) or 15(d) of the Exchange Act, as soon as reasonably practicable after such reports are filed with or furnished to the SEC.
Cautionary Statement for Forward-Looking Information
Statements in this Report may contain forward-looking statements that are subject to risks and uncertainties. Forward-looking statements give our current expectations relating to our financial condition, results of operations, plans, objectives, future performance and business. You can identify forward-looking statements by the fact that they do not relate strictly to current or historical facts. These statements may include words such as “anticipate,” “estimate,” “expect,” “project,” “forecast,” “plan,” “intend,” “believe,” “may,” “should,” “would,” “could,” “likely,” and other words of similar expression.
Forward-looking statements give our expectations about the future and are not guarantees. These statements involve known and unknown risks, uncertainties and other factors that may cause our actual results, performance and achievements to materially differ from any future results, performance and achievements expressed or implied by such forward-looking statements. We caution you, therefore, not to rely on these forward-looking statements.
7
Factors that could cause actual results to differ materially from any results projected, forecasted, estimated or budgeted that may materially and adversely affect the Company’s actual results include, but are not limited to, those set forth in Item 1A. Risk Factors.
These forward-looking statements are applicable only as of the date hereof. Except as may be required by law, we undertake no obligation to modify or revise any forward-looking statements to reflect events or circumstances occurring after the date of this Report.
Item 1A. Risk Factors.
Our business is subject to a number of risks. You should carefully consider the following risk factors, together with all of the other information included or incorporated by reference in this Report, before you decide whether to purchase our common stock. The risks set out below are not the only risks we face. If any of the following risks occur, our business, financial condition and results of operations could be materially adversely affected. In such case, the trading price of our common stock could decline, and you may lose all or part of your investment.
Current economic conditions have adversely affected the sales and profitability of certain products. A worsening of current economic conditions could cause a decline in estimated future cash flows, potentially resulting in impairment charges for long-lived assets. Following 2008, for a period of several years, economic conditions resulted in reduced demand and lower revenues for certain of our products. As required, we have reviewed our long-lived assets for potential impairment and have recorded adjustments to the book value of long-lived assets as appropriate. If operating revenues deteriorate in the future, and/or we lower our estimates of future cash flows, significant impairment charges might have to be recorded.
We are dependent on certain key personnel. Our success depends to some degree upon the continued service of Patrick DeLong, who has been with the company since 2007, most recently as Chief Financial and Operating Officer and began service as President and Chief Executive Officer on January 1, 2015; Craig Williams, who began service as Chief Operating Officer and Chief Winegrower on January 1, 2015; and our winemakers at our various facilities. The loss of the services of one or more of our key employees could harm our business and our reputation and negatively impact our profitability, particularly if one or more of our key employees resigns to join a competitor or to form a competing company.
We could experience significant increases in operating costs and reduced profitability due to competition for skilled management and staff employees. We compete with other entities for skilled management and staff employees, including entities that operate in different market sectors than us. Costs to recruit and retain adequate personnel could adversely affect results of operations.
Various diseases, pests and certain weather conditions could affect quality and quantity of grapes. Various diseases, pests, fungi, viruses, drought, frosts and certain other weather conditions could affect the quality and quantity of grapes, decreasing the supply of our products and negatively impacting our operating results. Future government restrictions regarding the use of certain materials used in grape growing may increase vineyard costs and/or reduce production. We cannot guarantee that our grape suppliers will succeed in preventing disease in their existing vineyards or that we will succeed in preventing disease in our existing vineyards or future vineyards we may acquire. For instance, Pierce’s disease is a vine bacterial disease which kills grapevines and there is no known cure. Small insects called sharpshooters spread this disease. If our vineyards become contaminated with this or other diseases, operating results would decline, perhaps significantly.
The lack of sufficient water due to drought conditions could affect quality and quantity of grapes. The availability of adequate quantities of water for application at the correct time can be vital for grapes to thrive. Whether particular vineyards are experiencing water shortages depends, in large part, on their location. We are primarily dependent on wells accessing shared aquifers and shared reservoirs as a water source for our California vineyards and wineries. The current extended period of drought across much of California may put pressure on the use and availability of water for agricultural uses and in some cases governmental authorities have diverted water to other uses. The lack of available water could reduce our grape harvest and access to grapes and adversely impact results of operations. Scarcity of adequate water in our grape growing areas may also result in legal disputes among other land owners and water users causing the Company to expend resources to defend its access to water.
We may not be able to grow or acquire enough quality fruit for our wines. While we believe that we can secure sufficient supplies of grapes from a combination of our own production and from grape supply contracts with independent growers, we cannot be certain that grape supply shortages will not occur. Grape supply shortages resulting from a poor harvest can be caused by a variety of factors outside our control, resulting in reduced product that is available for sale. If revenues decline as a result of inadequate grape supplies, cash flows and profitability would also decline.
We face significant competition which could adversely affect our profitability. The wine industry is intensely competitive and highly fragmented. Our wines compete in several wine markets within the wine industry as a whole with many other domestic and foreign wines. Our wines also compete with comparably priced generic wines and with other alcoholic and, to a lesser degree, non-alcoholic beverages. A result of this intense competition has been and may continue to be upward pressure on our selling and promotional expenses. Many of our competitors have greater financial, technical, marketing and public relations resources than we do. There can be no assurance that in the future we will be able to successfully compete with our competitors or that we will not face
8
greater competition from other wineries and beverage manufacturers.
We compete for shelf space in retail stores and for marketing focus by our independent distributors, most of whom carry extensive product portfolios. Nationwide we sell our products primarily through independent distributors and brokers for resale to retail outlets, restaurants, hotels and private clubs across the U.S. and in some overseas markets. Sales to distributors are expected to continue to represent a substantial portion of our net revenues in the future. A change in our relationship with any of our significant distributors could harm our business and reduce our sales. The laws and regulations of several states prohibit changes of distributors, except under certain limited circumstances, making it difficult to terminate a distributor for poor performance without reasonable cause, as defined by applicable statutes. Any difficulty or inability to replace distributors, poor performance of our major distributors or our inability to collect accounts receivable from our major distributors could harm our business. There can be no assurance that the distributors and retailers we use will continue to purchase our products or provide our products with adequate levels of promotional support. Consolidation at the retail tier, among club and chain grocery stores in particular, can be expected to heighten competitive pressure to increase marketing and sales spending or constrain or reduce prices.
Contamination of our wines would harm our business. We are subject to certain hazards and product liability risks, such as potential contamination, through tampering or otherwise, of ingredients or products. Contamination of any of our wines could cause us to destroy our wine held in inventory and could cause the need for a product recall, which could significantly damage our reputation for product quality. We maintain insurance against certain of these kinds of risks, and others, under various insurance policies. However, our insurance may not be adequate or may not continue to be available at a price or on terms that are satisfactory to us and this insurance may not be adequate to cover any resulting liability.
A reduction in consumer demand for wines could harm our business. There have been periods in the past in which there were substantial declines in the overall per capita consumption of wine products in our markets. A limited or general decline in consumption in one or more of our product categories could occur in the future due to a variety of factors, including: a general decline in economic conditions; changes in consumer spending habits; increased concern about the health consequences of consuming alcoholic beverage products and about drinking and driving; a trend toward a healthier diet including lighter, lower calorie beverages such as diet soft drinks, juices and water products; the increased activity of anti-alcohol consumer groups; and increased federal, state or foreign excise and other taxes on alcoholic beverage products. Reductions in demand and revenues would reduce profitability and cash flows.
A decrease in wine score ratings by important rating organizations could have a negative impact on our ability to create greater demand and pricing. Many of Crimson’s brands are issued ratings or scores by local and national wine rating organizations, and higher scores usually translate into greater demand and higher pricing. Although some of Crimson’s brands have been highly rated in the past, and Crimson believes its farming and winemaking activities are of a quality to generate good ratings in the future, Crimson has no control over ratings issued by third parties which may not be favorable in the future.
Climate change, or legal, regulatory or market measures to address climate change, may negatively affect our business, operations or financial performance, and water scarcity or poor quality could negatively impact our production costs and capacity. Our business depends upon agricultural activity and natural resources, including the availability of water. There has been much public discussion related to concerns that carbon dioxide and other greenhouse gases in the atmosphere may have an adverse impact on global temperatures, weather patterns and the frequency and severity of extreme weather and natural disasters. Severe weather events and climate change may negatively affect agricultural productivity in our vineyards. The quality and quantity of water available for use is important to the supply of grapes and our ability to operate our business. Adverse weather, measures enacted to address climate change, and other environmental factors beyond our control could reduce our grape production and adversely impact our cash flows and profitability.
Environmental issues or hazardous substances on our properties could result in us incurring significant liabilities. We are subject to environmental regulations with respect to our operations, including those related to wastewater, air emissions, and hazardous materials use, storage and disposal. In addition, we own substantial amounts of real property that are critical to our business. If hazardous substances are discovered on any of our properties and the concentrations are such that the presence of such hazardous substances presents an unreasonable risk of harm to public health or the environment, we may be held strictly liable for the cost of investigation and remediation of hazardous substances. The cost of environmental remediation could be significant and adversely impact our financial condition, results of operations and cash flows.
Our indebtedness could have a material adverse effect on our financial health. In March 2013, we entered into a revolving credit facility with American AgCredit, FLCA and CoBank, FCB as joint lenders that is secured by substantially all of our assets. We plan to rely upon the revolving credit facility for potential incremental capital project funding and in the future may use it for acquisitions. No amounts are currently outstanding. The revolving credit facility includes covenants that require the maintenance of specified debt and equity ratios, limit the incurrence of additional indebtedness, limit dividends and other distributions to shareholders and limit certain mergers, consolidations and sales of assets. If we are unable to comply with these covenants, outstanding amounts could become immediately due and/or there could be a substantial increase in the rate of borrowing.
Changes in domestic laws and government regulations or in the implementation and/or enforcement of government rules and regulations may increase our costs or restrict our ability to sell our products into certain markets. Government laws and
9
regulations result in increased farming costs, and the sale of wine is subject to taxation in various state, federal and foreign jurisdictions. The amount of wine that we can sell directly to consumers outside of California is regulated, and in certain states we are not allowed to sell wines directly to consumers and/or the amount that can be sold is limited. Changes in these laws and regulations could have an adverse impact on sales and/or increase costs to produce and/or sell wine. The wine industry is subject to extensive regulation by the “TTB” and various foreign agencies, state liquor authorities, such as the “CABC”, and local authorities. These regulations and laws dictate such matters as licensing requirements, trade and pricing practices, permitted distribution channels, permitted and required labeling, and advertising and relations with wholesalers and retailers. Any expansion of our existing facilities or development of new vineyards or wineries may be limited by present and future zoning ordinances, environmental restrictions and other legal requirements. In addition, new regulations or requirements or increases in excise taxes, income taxes, property and sales taxes or international tariffs, could affect our financial condition or results of operations. Recently, many states have considered proposals to increase, and some of these states have increased, state alcohol excise taxes. New or revised regulations or increased licensing fees, requirements or taxes could have a material adverse effect on our financial condition, results of operations or cash flows.
We may not be able to insure certain risks economically. We may experience economic harm if any damage to our properties is not covered by insurance. We cannot be certain that we will be able to insure against all risks that we desire to insure economically or that all of our insurers will be financially viable if we make a claim.
We may be subject to litigation, for which we may be unable to accurately assess our level of exposure and which if adversely determined, may have a significant adverse effect on our consolidated financial condition or results of operations. Although our current assessment is that there is no pending litigation that could reasonably be expected to have a significant adverse impact, if our assessment proves to be in error, then the outcome of litigation could have a significant impact on our financial condition or results of operations or cash flows.
The payment of dividends in the future is subject to the discretion of our board of directors. We do not have a regular dividend policy and whether or not to pay any dividends will be determined each year by our board of directors.
If our intangible assets or goodwill become impaired, we may be required to record significant charges to earnings. We have substantial intangible assets and goodwill on our balance sheet as a result of acquisitions we have completed, in particular the acquisition of Seghesio Family Vineyards. We review intangible assets and goodwill for impairment annually or more frequently if events or circumstances indicate that these assets might be impaired. Application of impairment tests requires judgment. A significant deterioration in a key estimate or assumption or a less significant deterioration to a combination of assumptions or the sale of a part of a reporting unit could result in an impairment charge in the future, which could have a significant adverse impact on our reported earnings.
Our common stock is not listed on any securities exchange; as a result there may be a limited public market for our common stock. Prices for our common stock are quoted on the Over-The-Counter (OTC) Market. Securities whose prices are quoted on the OTC Market do not have the same liquidity as securities that trade on a recognized market or securities exchange. An active trading market for our common stock may not be sustained in the future. As a result, stockholders may find it more difficult to dispose of or obtain accurate quotations as to the market value of our common stock.
Our common stock price may experience volatility. The stock market has from time to time experienced extreme price and volume fluctuations that often have been unrelated to the operating performance of particular companies. Changes in earnings estimates by analysts, if any, and economic and other external factors may have a significant effect on the market price of our common stock. Fluctuations or decreases in the trading price of our common stock may also adversely affect the liquidity of the trading market for our common stock.
Future sales of our shares could depress the market price of our common stock. The market price of our common stock could decline as a result of sales of a large number of shares of our common stock in the market or the perception that these sales could occur. These sales, or the possibility that these sales may occur, also might make it more difficult for us to sell equity securities in the future at a time and at a price that we deem appropriate. Any disposition by any of our large shareholders of our common stock in the public market, or the perception that such dispositions could occur, could adversely affect prevailing market prices of our common stock.
Compliance with changing regulation of corporate governance and public disclosure may result in additional expenses. Changing laws, regulations and standards relating to corporate governance and public disclosure, including the Sarbanes-Oxley Act and the Dodd-Frank Wall Street Reform and Consumer Protection Act, are creating uncertainty for companies such as ours. We are committed to maintaining appropriate corporate governance and public disclosure. As a result, we may see an increase in general and administrative expenses and a diversion of management time and attention from revenue-generating activities to compliance activities, which could harm our business prospects.
We are an “emerging growth company” and we cannot be certain if we will be able to maintain such status or if the reduced disclosure requirements applicable to emerging growth companies will make our common stock less attractive to investors. We are an “emerging growth company,” as defined in the Jumpstart Our Business Startups Act (the “JOBS Act”), and have taken advantage of certain exemptions from various reporting requirements that are applicable to other public companies that are not emerging growth companies, including, but not limited to, not being required to comply with the auditor attestation requirements of
10
Section 404(b) of the Sarbanes-Oxley Act, reduced disclosure obligations regarding executive compensation in our periodic reports and proxy statements, and exemptions from the requirement of holding a nonbinding stockholder advisory vote on executive compensation, frequency of approval of executive compensation and any golden parachute payments not previously approved. We will retain emerging growth company status until the earliest of: (1) the last day of the fiscal year following the fifth anniversary of the date we first sold securities pursuant to an effective registration statement under the Securities Act; (2) the last day of the fiscal year in which we first had total annual gross revenues of $1 billion or more (indexed pursuant to the JOBS Act); (3) the date on which we are deemed to be a “large accelerated filer” as defined in Exchange Act Rule 12b-2 (i.e., an SEC registered company with a public float of at least $700 million that satisfies other tests); or (4) the date on which we have, within the previous three years, issued more than $1 billion of nonconvertible debt. Under the JOBS Act, emerging growth companies can delay adopting new or revised accounting standards until such time as those standards apply to private companies. However, we have irrevocably elected not to avail ourselves of this extended transition period for complying with new or revised accounting standards and, therefore, we will be subject to the same new or revised accounting standards as other public companies that are not emerging growth companies.
Additionally, we cannot predict if investors will find our common stock less attractive because we rely on these exemptions. If some investors find our common stock less attractive as a result of our reduced disclosures, there may be less active trading in our common stock and our stock price may be more volatile.
We may not be able to engage in certain corporate transactions after the Distribution. Under the tax matters agreement that we have entered into with Leucadia, we covenant not to take actions that would jeopardize the tax-free nature of the Distribution. Additionally, we are required to indemnify Leucadia and its affiliates against all tax-related liabilities caused by the failure of the Distribution to qualify for tax-free treatment for U.S. federal income tax purposes (including as a result of events subsequent to the Distribution that caused Leucadia to recognize gain under Section 355(e) of the Code) to the extent these liabilities arise as a result of actions taken by us or our affiliates (other than Leucadia) or as a result of changes in ownership of our common stock. If the Distribution is taxable to Leucadia, Leucadia would recognize gain, if any, equal to the difference between Leucadia’s tax basis in our Common Stock distributed in the distribution and the fair market value of our Common Stock. Leucadia does not expect that there would be significant gain, if any, recognized on the Distribution even if it were found to be taxable. This covenant (and, to some extent, this indemnification obligation) may limit our ability to pursue certain strategic transactions, including being acquired in a transaction for cash consideration or from engaging in certain tax-free combinations in which our shareholders do not ultimately possess a majority ownership interest in the combined entity.
Significant influence over our affairs may be exercised by our principal stockholders. As of March 16, 2015, the significant stockholders of our company are our Chairman, Ian M. Cumming (approximately 8.7% beneficial ownership, including ownership by certain family members, but excluding Mr. Cumming’s charitable foundation) and one of our directors, Joseph S. Steinberg (approximately 9.6% beneficial ownership, including ownership by trusts for the benefit of his respective family members, but excluding Mr. Steinberg’s private charitable foundation). Accordingly, Messrs. Cumming and Steinberg could exert significant influence over all matters requiring approval by our stockholders, including the election or removal of directors and the approval of mergers or other business combination transactions.
We may not be fully insured against risk of catastrophic loss to wineries, production facilities or distribution systems as a result of earthquakes or other events, which may cause us to experience a material financial loss. A significant portion of Crimson’s controlled vineyards as well as supplier and other third party warehouses or distribution centers are located in California, which is prone to seismic activity. If any of these vineyards and facilities were to experience a catastrophic loss, it could disrupt our operations, delay production, shipments and revenue, and result in potentially significant expenses to repair or replace the vineyard or facility. If such a disruption were to occur, we could breach agreements, our reputation could be harmed, and our business and operating results could be adversely affected. Although we carry insurance to cover property damage and business interruption as well as certain production assets in the case of a catastrophic event, certain significant assets are not covered in the case of certain catastrophes as we believe this to be a prudent financial decision. We take steps to minimize the damage that would be caused by a catastrophic event, but there is no certainty that our efforts would prove successful. If one or more significant catastrophic events occurred damaging our own or third party assets and/or services, we could suffer a major financial loss.
Our business and reputation could suffer if we are unable to protect our information systems against, or effectively respond to, cybersecurity incidents or if our information systems are otherwise disrupted. We depend on information technology, including public websites and cloud-based services, for many activities important to our business, including to interface with our customers and consumers, to engage in digital marketing activities, to enable and improve the effectiveness of our operations, to order and manage materials from suppliers, to maintain financial accuracy and efficiency, to comply with regulatory, financial reporting, legal and tax requirements, to collect and store sensitive data and confidential information, and to communicate electronically with our employees and the employees of our suppliers and other third parties. If we do not allocate and effectively manage the resources necessary to build and sustain our information technology infrastructure, if we fail to timely identify or appropriately respond to cybersecurity incidents, or if our information systems are damaged, destroyed or shut down (whether as a result of natural disasters, fires, power outages, acts of terrorism or other catastrophic events, network outages, software, equipment or telecommunications failures, user errors, or from deliberate cyberattacks such as malicious or disruptive software, denial of service attacks, malicious social engineering, hackers or otherwise), our business could be disrupted and we could, among other things, be subject to: transaction errors; processing
11
inefficiencies; the loss of, or failure to attract new, customers and consumers; the loss of revenues from unauthorized use, acquisition or disclosure of or access to confidential information; the loss of or damage to intellectual property or trade secrets, including the loss or unauthorized disclosure of sensitive data, confidential information or other assets; damage to our reputation; litigation; regulatory enforcement actions; violation of data privacy, security or other laws and regulations; and remediation costs. Further, our information systems and the information stored therein, could be compromised by, and we could experience similar adverse consequences due to, unauthorized outside parties intent on accessing or extracting sensitive data or confidential information, corrupting information or disrupting business processes or by inadvertent or intentional actions by our employees or agents. Similar risks exist with respect to the third-party vendors we rely upon for aspects of our information technology support services and administrative functions, including but not limited to payroll processing and health and benefit plan administration.
Item 1B. Unresolved Staff Comments.
None.
Item 2. Properties.
Crimson’s vineyards and winemaking facilities are described in Item 1. During 2014 the Company entered into a lease agreement in Napa to lease approximately 13,200 square feet of space for its administrative offices. The lease commenced July 1, 2014 for a term expiring June 30, 2020.
Item 3. Legal Proceedings.
From time to time, Crimson may be involved in legal proceedings in the ordinary course of its business. Crimson is not currently involved in any legal or administrative proceedings individually or together that it believes are likely to have a significant adverse effect on its business, results of operations or financial condition.
Item 4. Mine Safety Disclosures.
Not applicable.
12
PART II
|
Item 5. Market for the Registrant’s Common Equity, Related Stockholder Matters and Issuer Purchases of Equity Securities. |
The Company’s common stock is traded in the over-the-counter market, OTC Market, under the symbol “CWGL.” The Company’s common stock is not listed on any stock exchange, and price information for the common stock is not regularly quoted on any automated quotation system.
The following table sets forth the high and low sales price of the Company’s common stock, as published by the National Association of Securities Dealers OTC Bulletin Board Service.
|
High |
Low |
||||
|
2013 |
|||||
|
First Quarter (beginning February 25, 2013) |
$ |
10.87 |
$ |
7.26 |
|
|
Second Quarter |
9.90 |
8.40 |
|||
|
Third Quarter |
9.80 |
5.48 |
|||
|
Fourth Quarter |
9.55 |
7.95 |
|||
|
2014 |
|||||
|
First Quarter |
$ |
9.05 |
$ |
7.97 |
|
|
Second Quarter |
9.05 |
8.60 |
|||
|
Third Quarter |
9.78 |
8.76 |
|||
|
Fourth Quarter |
9.54 |
8.66 |
|||
|
2015 |
|||||
|
First Quarter (through March 12, 2015) |
$ |
9.49 |
$ |
8.80 |
|
On March 12, 2015, the closing sales price for the Company’s common stock was $9.10 per share. As of that date, there were 1,761 stockholders of record. No dividends have been paid since the Distribution. The Company does not have a regular dividend policy and whether or not to pay dividends will be determined each year by our board of directors. The payment of dividends will also be subject to the terms and covenants contained in the Company’s revolving credit facility.
As of the last fiscal year end, the Company had not authorized any securities for issuance under any equity plans.
There have been no sales of unregistered securities by the Company within the past year.
The Company and certain of its subsidiaries have net operating losses (“NOLs”) and other tax attributes, the amount and availability of which are subject to certain qualifications, limitations and uncertainties. In order to reduce the possibility that certain changes in ownership could result in limitations on the use of its tax attributes, the Company's certificate of incorporation contains provisions which generally restrict the ability of a person or entity from acquiring ownership (including through attribution under the tax law) of five percent or more of the common stock and the ability of persons or entities now owning five percent or more of the common stock from acquiring additional common stock. The restrictions will remain in effect until the earliest of (a) December 31, 2022, (b) the repeal of Section 382 of the Internal Revenue Code (or any comparable successor provision) and (c) the beginning of a taxable year of the Company to which certain tax benefits may no longer be carried forward.
The transfer agent for the Company’s common stock is American Stock Transfer & Trust Company, 59 Maiden Lane, New York, New York 10038.
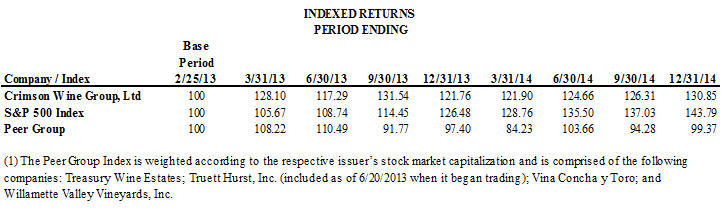
Stockholder Return Performance Graph
Set forth below is a graph comparing the cumulative total stockholder return on the Company’s common stock against the cumulative total return of the Standard & Poor’s 500 Stock Index and a peer group index (the “Peer Group Index”) (see footnote(1) to the graph) for the period commencing February 25, 2013 to December 31, 2014. Index data was furnished by Standard & Poor’s Capital IQ. The graph assumes that $100 was invested on February 25, 2013 in each of our common stock, the S&P 500 Index and the Peer Group Index and that all dividends were reinvested.
13
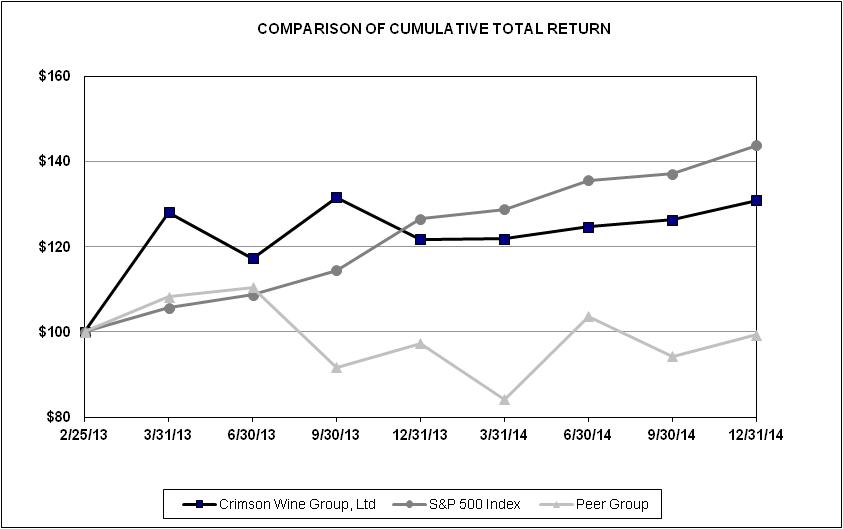
The stock price performance included in this graph is not necessarily indicative of future stock price performance. The Company neither makes nor endorses any predictions as to future stock performance.
Item 6. Selected Financial Data.
The following selected financial data have been summarized from the Company’s consolidated financial statements and are qualified in their entirety by reference to, and should be read in conjunction with, such consolidated financial statements and Management’s Discussion and Analysis of Financial Condition and Results of Operations, contained in Item 7 of this Report. Subsidiaries and operations are reflected in the consolidated results from the date of acquisition, which was May 31, 2011 for Seghesio Family Vineyards.
|
Year Ended December 31, |
||||||||||||||
|
2014 |
2013 |
2012 |
2011 |
2010 |
||||||||||
|
(In thousands, except per share amounts) |
||||||||||||||
|
SELECTED INCOME STATEMENT DATA |
||||||||||||||
14
|
Revenues |
$ |
58,114 |
$ |
56,472 |
$ |
48,774 |
$ |
39,306 |
$ |
23,762 | ||||
|
Gross Profit |
30,944 | 26,787 | 24,090 | 15,861 | 9,144 | |||||||||
|
Income (loss) from operations (a) |
9,021 | 5,359 | 5,103 | (174) | (792) | |||||||||
|
Net income (loss) |
5,000 | 7,108 | 211 | (4,310) | (4,318) | |||||||||
|
Net income (loss) per share (b) |
0.20 | 0.29 | 0.01 | (0.18) | (0.18) | |||||||||
|
At December 31, |
||||||||||||||
|
2014 |
2013 |
2012 |
2011 |
2010 |
||||||||||
|
(In thousands, except per share amounts) |
||||||||||||||
|
SELECTED BALANCE SHEET DATA |
||||||||||||||
|
Current Assets |
$ |
88,440 |
$ |
77,231 |
$ |
54,138 |
$ |
49,922 |
$ |
30,724 | ||||
|
Property and equipment |
108,707 | 109,036 | 108,986 | 110,783 | 64,263 | |||||||||
|
Goodwill and intangible assets |
18,353 | 19,873 | 21,079 | 22,593 | 177 | |||||||||
|
Total assets |
215,500 | 206,140 | 184,203 | 183,298 | 95,164 | |||||||||
|
Due to Leucadia and its affiliates |
- |
- |
152,183 | 151,441 | 103,421 | |||||||||
|
Long-term debt, including current maturities |
- |
- |
- |
- |
66 | |||||||||
|
Equity |
203,120 | 198,129 | 25,833 | 25,622 | (11,224) | |||||||||
|
Book value per share (b) |
8.30 | 8.10 | 1.06 | 1.05 | (0.46) | |||||||||
|
(a) |
Net (gain)/loss on the disposal of property and equipment previously reported was reclassified as a component of income from operations to conform with current year's presentation as follows; $(649,000) in 2013, $262,000 in 2012, $51,000 in 2011 and $(20,000) in 2010. |
|
(b) |
After the Distribution, there were 24,458,368 common shares outstanding. As appropriate, amounts presented in this Report give retroactive effect to the Distribution for all periods presented, including net income (loss) per share, book value per share and shares outstanding. Both before and after the Distribution, there were no dilutive or complex equity instruments or securities outstanding at any time. |
Item 7. Management’s Discussion and Analysis of Financial Condition and Results of Operations.
The purpose of this section is to discuss and analyze the Company’s consolidated financial condition, liquidity and capital resources and results of operations. This analysis should be read in conjunction with the consolidated financial statements, related footnote disclosures and “Cautionary Statement for Forward-Looking Information,” which appear elsewhere in this Report.
Liquidity and Capital Resources
General
Crimson’s principal sources of liquidity are its available cash, funds generated from operations and its revolving bank credit facility. In March 2013, Crimson entered into a $60,000,000 revolving credit facility with American AgCredit, FLCA and CoBank, FCB as joint lenders, comprised of an A facility and a B facility, which together is secured by substantially all of Crimson’s assets. Revolving credit facility A is for up to $10,000,000 of availability for a five year term, collateralized by accounts receivable, inventory and intangibles. Term revolving credit facility B is for up to $50,000,000 of availability for a fifteen year term, collateralized by real property, including vineyards and certain winery facilities of Crimson. Covenants include the maintenance of specified debt and equity ratios, limitations on the incurrence of additional indebtedness, limitations on dividends and other distributions to shareholders and restrictions on certain mergers, consolidations and sales of assets. In addition to commitment fees ranging from 0.25% to 0.375%, rates for the borrowings are priced based on a performance grid tied to certain financial ratios and would have been 1.671% to 1.988% at December 31, 2014. The facility can be used to fund acquisitions, capital projects and other general corporate purposes. No amounts have been borrowed under the facility to date.
Prior to the Distribution, Crimson relied upon Leucadia for debt financing and equity contributions for all of its liquidity needs, including $86,018,000 for the acquisition of Seghesio Family Vineyards in May 2011. As of December 31, 2012, the aggregate amount payable by Crimson to Leucadia and its affiliates was $152,183,000, all of which was contributed to capital before the Distribution. As a result, subsequent to the Distribution, Crimson did not record interest expense relating to this financing.
15
In March 2013, pursuant to the separation agreement entered into with Leucadia, Leucadia paid $14,175,000 to Crimson as a capital contribution. No additional capital contributions from Leucadia are required or anticipated to be made.
As of December 31, 2014, Crimson’s commitments for capital expenditures were not material. Crimson expects to spend approximately $7,700,000 for capital expenditures during 2015, of which $3,000,000 pertains to the second phase of a fermentation capacity project which includes the demolition of an aged fermentation building as well as replacement and expansion of capacity at Seghesio Family Vineyards and $620,000 for technology enhancements related to growth, including infrastructure expansion, and to enhance capabilities now expected by consumers, including mobile commerce. As such, these expenditures do not relate to required maintenance or similar costs to sustain our existing operations. The remaining $4,080,000 is for vineyard development, barrel purchases and other winery and facility improvements. Crimson expects to use its available cash and cash flows generated from operating activities to fund its capital expenditures.
In March, 2014, the board of directors of Crimson authorized a stock repurchase program pursuant to which the Company may repurchase up to $2 million of the Company’s common stock. The repurchases will be funded by available cash. How much common stock, if any, will be repurchased will depend on market conditions, including the price of the common stock. At December 31, 2014, no stock had been repurchased.
Consolidated Statements of Cash Flows
Net cash provided by operating activities was $8,928,000, $10,333,000 and $6,982,000 for the years ended December 31, 2014, 2013 and 2012, respectively. Cash flows from operating activities decreased during 2014 as compared to 2013, principally due to a larger increase in inventory, $5,817,000 in 2014 as compared to $1,232,000 in 2013, primarily due to strategic growth initiatives, increased grape purchases in 2014 as compared to 2013, related to the prior year harvest, and increased payments for income and franchise taxes, partially offset by increased operating income.
Cash flows from operating activities also reflect interest paid to Leucadia in 2013 and 2012. Interest paid to Leucadia was $0, $122,000 and $1,500,000 during 2014, 2013 and 2012, respectively.
Net cash used for investing activities was $8,923,000, $15,243,000 and $3,909,000 for the years ended December 31, 2014, 2013 and 2012, respectively. 2014 proceeds from disposals of property and equipment include $3,902,000, net of related selling fees, from the sale of an unplanted parcel of land and 2013 proceeds include $1,754,000 from the sale of a non-strategic vineyard. In addition, $9,500,000 and $10,500,000 during 2014 and 2013, respectively, was used for investing in FDIC insured U.S. Certificates of Deposit. 2014 includes $4,250,000 of matured FDIC insured U.S. Certificates of Deposit.
Cash provided by (used for) financing activities was $0, $12,475,000 and $(3,000,000) for the years ended December 31, 2014, 2013 and 2012, respectively. During 2013 and 2012, net cash used for financing activities reflects $1,700,000 and $3,000,000, respectively, of principal payments on debt to Leucadia and for 2013, the capital contribution of $14,175,000, discussed above.
As shown below, at December 31, 2014, Crimson’s contractual cash obligations totaled $22,635,000.
|
Payments Due by Period (in thousands) |
||||||||||||||||||||||
|
Contractual Cash Obligations |
Total |
Less than 1 Year |
1-3 Years |
4-5 Years |
After 5 Years |
|||||||||||||||||
|
Grape purchase contracts |
$ |
21,427 |
$ |
7,127 |
$ |
8,805 |
$ |
2,417 |
$ |
3,078 | ||||||||||||
|
Operating Leases, net of sublease income |
1,208 | 234 | 430 | 436 | 108 | |||||||||||||||||
|
Total Contractual Cash Obligations |
$ |
22,635 |
$ |
7,361 |
$ |
9,235 |
$ |
2,853 |
$ |
3,186 | ||||||||||||
Off-Balance Sheet Financing Arrangements
None.
Critical Accounting Estimates
Crimson’s discussion and analysis of its financial condition and results of operations are based upon its consolidated financial statements, which have been prepared in accordance with accounting principles generally accepted in the U.S. (“GAAP”). The preparation of these financial statements requires Crimson to make estimates and assumptions that affect the reported amounts in the financial statements and disclosures of contingent assets and liabilities. On an on-going basis, Crimson evaluates all of these estimates
16
and assumptions. The following areas have been identified as critical accounting estimates because they have the potential to have a significant impact on Crimson’s financial statements, and because they are based on assumptions that are used in the accounting records to reflect, at a specific point in time, events whose ultimate outcome won’t be known until a later date. Actual results could differ from these estimates.
Inventory—Inventories are stated at the lower of cost or market, with cost being determined on the first-in, first-out method. Costs associated with winemaking, and other costs associated with the manufacturing of products for resale, are recorded as inventory. In accordance with general practice within the wine industry, wine inventories are included in current assets, although a portion of such inventories may be aged for periods longer than one year. As required, Crimson reduces the carrying value of inventories that are obsolete or in excess of estimated usage to estimated net realizable value. Crimson’s estimates of net realizable value are based on analyses and assumptions including, but not limited to, historical usage, future demand and market requirements. Reductions to the carrying value of inventories are recorded in cost of sales. If future demand and/or pricing for Crimson’s products are less than previously estimated, then the carrying value of the inventories may be required to be reduced, resulting in additional expense and reduced profitability. Inventory write-downs of $517,000, $0 and $50,000 were recorded during 2014, 2013 and 2012, respectively.
Vineyard Development Costs—Crimson capitalizes internal vineyard development costs when developing new vineyards or replacing or improving existing vineyards. These costs consist primarily of the costs of the vines and expenditures related to labor and materials to prepare the land and construct vine trellises. Amortization of such costs as annual crop costs is recorded on a straight-line basis over the estimated economic useful life of the vineyard, which can be as long as 25 years. As circumstances warrant, Crimson re-evaluates the recoverability of capitalized costs, and will record impairment charges if required. Crimson has not recorded any significant impairment charges for its vineyards during the last three years.
Review of Long-lived Assets for Impairment—For intangible assets with definite lives, impairment testing is required if conditions exist that indicate the carrying value may not be recoverable. For intangible assets with indefinite lives and for goodwill, impairment testing is required at least annually or more frequently if events or circumstances indicate that these assets might be impaired. Crimson currently has no intangible assets with indefinite lives. Substantially all of Crimson’s goodwill and other intangible assets result from the acquisition of Seghesio Family Vineyards in May 2011. Amortization of intangible assets is recorded on a straight-line basis over the estimated useful lives of the assets, which range from 7 to 20 years. Crimson evaluates goodwill for impairment at the end of each year, and has concluded that goodwill is not impaired.
The Company evaluates long-lived assets for impairment whenever events or changes in circumstances indicate that the carrying amount of an asset or asset group may not be recoverable. Long-lived assets consist primarily of property and equipment. Circumstances that might cause the Company to evaluate its long-lived assets for impairment could include a significant decline in the prices the Company or the industry can charge for its products, which could be caused by general economic or other factors, changes in laws or regulations that make it difficult or more costly for the Company to distribute its products to its markets at prices which generate adequate returns, natural disasters, significant decrease in the demand for the Company’s products or significant increases in the costs to manufacture the Company’s products.
Recoverability of long-lived assets is measured by a comparison of the carrying amount of an asset group to future net cash flows expected to be generated by the asset group. If such assets are considered to be impaired, the impairment to be recognized is measured by the amount by which the carrying amount of the assets exceeds the fair value of the assets. The Company groups its long-lived assets with other assets and liabilities at the lowest level for which identifiable cash flows are largely independent of the cash flows of other assets and liabilities (or asset group). This would typically be at the winery level which is described above.
The Company did not recognize any impairment charges associated with long-lived assets during the three year period ended December 31, 2014.
Depletion Allowances—Crimson pays depletion allowances to its distributors based on their sales to their customers. These allowances are estimated on a monthly basis by Crimson, and allowances are accrued as a reduction of revenues. Subsequently, distributors will bill Crimson for actual depletions, which may be different from Crimson’s estimate. Any such differences are recognized in revenues when the bill is received. Crimson has historically been able to estimate depletion allowances without any material differences between actual and estimated expense.
Results of Operations
Overview
The Company generates revenues from sales of wine to wholesalers and direct to consumers, sales of bulk wine and grapes, special event fees, tasting fees and retail sales. Revenues and gross profit for the years ended December 31, 2014, 2013 and 2012 are as follows (in thousands):
|
2014 |
2013 |
2012 |
||||||
17
|
Revenues: |
||||||||
|
Wholesalers |
$ |
33,811 |
$ |
32,612 |
$ |
27,015 | ||
|
Direct to consumers |
20,343 | 19,656 | 18,113 | |||||
|
Bulk wine and grape sales, event fees and retail sales |
3,960 | 4,204 | 3,646 | |||||
|
$ |
58,114 |
$ |
56,472 |
$ |
48,774 | |||
|
Gross profit: |
||||||||
|
Wholesalers |
$ |
16,564 |
$ |
14,532 |
$ |
13,163 | ||
|
Direct to consumers |
14,277 | 12,394 | 10,598 | |||||
|
Bulk wine and grape sales, event fees and retail sales |
620 | (139) | 379 | |||||
|
Inventory write-down |
(517) |
- |
(50) | |||||
| 30,944 | 26,787 | 24,090 | ||||||
|
Operating expenses: |
||||||||
|
Sales and marketing |
13,227 | 12,807 | 11,452 | |||||
|
General and administrative |
10,240 | 9,172 | 7,273 | |||||
|
Administrative service fees paid to Leucadia National Corporation |
9 | 98 |
- |
|||||
| 23,476 | 22,077 | 18,725 | ||||||
|
Net (gain)/loss related to disposals of property and equipment |
(1,553) | (649) | 262 | |||||
|
Income from operations |
$ |
9,021 |
$ |
5,359 |
$ |
5,103 |
Crimson’s wines are primarily sold to distributors, who then sell to retailers and restaurants. As permitted under federal and local regulations, Crimson has also been placing increased emphasis on generating revenue from direct sales to consumers which occur through wine clubs, at the wineries’ tasting rooms and through the internet and direct outreach to customers. Direct sales to consumers are more profitable for Crimson as it is able to sell its products at a price closer to retail prices rather than the wholesale price received from distributors. From time to time Crimson may sell grapes or bulk wine, because the wine does not meet the quality standards for Crimson’s products, because market conditions have changed resulting in reduced demand for certain products, or because Crimson may have produced more of a particular varietal than it can use. When these sales occur they may result in a loss.
Cost of sales includes grape and bulk wine costs, whether purchased or produced from Crimson’s controlled vineyards, crush costs, winemaking and processing costs, bottling, packaging, warehousing and shipping and handling costs. For Crimson controlled vineyard produced grapes, grape costs include annual farming costs and amortization of vineyard development expenditures. For wines that age longer than one year, winemaking and processing costs continue to be incurred and capitalized to the cost of wine, which can range from 3 to 36 months. Reductions to the carrying value of inventories to estimated net realizable value are also included in costs of sales. The 2014 inventory write-down pertains to a new product launch that was abandoned and the wine reallocated to a private label program to one retail account.
At December 31, 2014, wine inventory includes approximately 840,000 cases of bottled and bulk wine in various stages of the aging process. Case wine is expected to be sold over the next 12 to 36 months and generally before the release date of the next vintage.
Income Statements
Revenues increased $1,642,000 in 2014 as compared to 2013 as a result of a 2.2% increase in case sales, a 1.4% increase in revenue per case, due to a shift in product mix across brands and channels, a 6.6% increase in event and other non-wine revenue, slightly offset by a decrease in bulk wine and grape sales. Wholesale revenue increased $1,199,000 in 2014 as compared to 2013, primarily attributable to the domestic market with a partial offset in the export market. Direct to consumer revenue increased $687,000 in 2014 as compared to 2013 primarily as a result of a $1,084,000 increase in wine revenue from Wine Club sales, primarily attributable to an increase in wine club membership, an increase in sales volume and an overall increase in price point for wine included in shipments across all brands, and a $146,000 increase in Special Events wine revenue, partially offset slightly by a $391,000 decrease in E-Commerce wine revenue and a $152,000 decrease in Tasting Room wine revenue, primarily a result of timing of sales initiatives and intentional allocation of available product. In addition, bulk wine and grape sales decreased $362,000, which is partially offset by an increase in non-wine revenue, including tasting fees and special events, of $118,000.
Revenues increased $7,698,000 in 2013 as compared to 2012 as a result of an 18.5% increase in case sales, an increase in bulk wine and grape sales, offset by a 1.8% reduction in revenue per case, due to a shift in product mix with more volume growth in lower priced products. Wholesale revenues increased $5,597,000 in 2013 as compared to 2012, of which $1,047,000 pertains to growth in the export market, and $4,550,000 to domestic wholesale where all brands recognized growth. Direct to consumer revenue increased $1,543,000
18
in 2013 as compared to 2012 primarily as a result of a $1,422,000 increase in revenue from wine club sales, predominately attributable to an increase in wine club membership and an overall increase in price point for wine included in shipments across all brands, and a $250,000 increase in tasting room revenue. In addition, revenue from bulk wine and grape sales increased $485,000. Revenue increases were partially offset by a $56,000 revenue decrease in special events and a $74,000 decrease in e-commerce.
Gross profit increased $4,157,000 in 2014 as compared to 2013 reflecting an increase in wine revenue in conjunction with a decrease in cost of goods per case, improved freight margin as a result of consolidated resources, and increased event margin driven by new events and event structure. Gross profit increased $2,697,000 in 2013 as compared to 2012 reflecting an increase in wine revenue across all channels, partially offset by an increase in cost of goods sold per case specific to certain wines with a onetime lower cost in the prior year and increased bulk wine sales with larger losses. In addition to changes in revenues, gross profit also reflects net losses on sales of bulk wine and grapes of $615,000, $1,072,000 and $467,000 for the years ended December 31, 2014, 2013 and 2012, respectively, and losses from inventory write-downs as reflected in the table above. The increase in bulk wine sales in 2013 as compared to 2012 is due to an unusually large harvest in vintage 2012.
Sales and marketing expenses increased $420,000 in 2014 as compared to 2013, which include a $48,000 decrease in variable cost components more than offset by a $468,000 increase in fixed costs components. Variable cost decreases were primarily due to a decrease in broker commissions, due to timing and the terminated broker relationship which concluded March 31, 2014, partially offset by increases in event expenses, distributor initiatives and company-wide sales promotional activities and wholesale samples. Fixed sales and marketing expenses increased primarily due to increased compensation related expense of $419,000 and travel related expense of $62,000, to accommodate growth and replace a significant broker in a top 5 U.S. market, internet redesign costs of $46,000, increased contract services of $45,000 for certain technology related to the wholesale channel, partially offset by a $131,000 decrease for promotional material costs pertinent to new labels and marketing initiatives.
Sales and marketing expenses increased $1,355,000 in 2013 as compared to 2012, which includes a $342,000 increase in variable cost components and a $1,013,000 increase in fixed cost components. Increases in variable sales and marketing expenses primarily resulted from an increase in broker commissions for higher sales in markets that use a broker, an increase in planned distributor incentives, and an increase in samples and merchant processing fees in proportion to volume, partially offset by decreased certain promotional costs, and decreased event-related expenses, proportionate to the decrease in special event revenue. Increase in fixed sales and marketing expenses increased primarily due to increased compensation of $388,000, which includes compensation related to the hiring of senior sales and marketing executives in the second quarter of 2012, resulting in partial year expense in 2012 and full year in 2013, and a senior sales and marketing executive in the third quarter of 2013, and advertising, public relations, point of sale and internet marketing of $386,000. Remaining increase is related to design services primarily for label redesigning of $64,000, travel of $100,000, of which $60,000 pertains to the wholesale domestic and export channel, and $81,000 in contract services related to wholesale data analysis tools.
General and administrative expenses increased $1,068,000 in 2014 as compared to 2013, principally due to $1,016,000 of severance paid during 2014, $750,000 of which was paid to the former Chief Executive Officer upon his resignation during the fourth quarter of 2014. No severance was incurred in 2013 or 2012. Other increases include a $132,000 increase in SEC related expense, primarily related to the proxy and annual report costs not incurred in 2013, a $133,000 increase in travel related expense as a result of research and long term planning initiatives, a $70,000 increase in consulting expense related to technological enhancements, $160,000 in new costs for lease and occupancy related expense pertaining to the corporate office lease commencing during the third quarter of 2014, a $96,000 increase in depreciation expense related to corporate office buildout and technological enhancement to accommodate growth and technological requirements, a $27,000 increase in overall office, computer and facility supplies and employee morale, and a $16,000 increase in other taxes related to standalone franchise requirements for twelve months of 2014 as compared to ten months of 2013. This is partially offset by a $537,000 decrease in employee compensation, as a result of $450,000 executive bonuses paid in June 2013 approved by the Crimson board of directors in relation to the spin-off combined with the resignation of the Chief Executive Officer during the fourth quarter of 2014, reducing salary compensation for two months and bonus expense a full year bonus payout per Company policy, partially offset by 2014 strategic hires to manage growth, and a $46,000 decrease in contract services, as result of bringing IT services in house.
General and administrative expenses increased $1,899,000 in 2013 as compared to 2012, principally due to $450,000 in executive bonuses approved by Crimson’s board of directors in relation to the spin-off from Leucadia, $605,000 in costs for new services to satisfy standalone public company requirements, a $209,000 increase in accounting fees related to standalone audit and filing requirements, $160,000 in other taxes related to standalone franchise tax requirements, $138,000 in contract services primarily related to technology and software support, $31,000 in property taxes, and $155,000 in insurance expense related to standalone policies.
Interest expense reflects the costs of funds borrowed from Leucadia, which funds were contributed to capital prior to the Distribution.
Income tax increased $6,196,000 in 2014 as compared to 2013 as a result of the recognition of statutory income taxes combined with the decrease of the amount of the valuation allowance reversed in 2014 as compared to 2013. Prior to December 31, 2013, the Company had recorded a full valuation allowance against its net deferred tax asset and statutory income taxes were reflected as a component of such valuation. At December 31, 2013, it was determined that sufficient evidence supported decreasing the valuation allowance by $2,500,000, resulting in an income tax benefit for 2013. During 2014 it was determined that sufficient evidence supported decreasing the valuation allowance by the remaining $265,000 to zero. For the years ended December 2014, 2013 and 2012, the income tax
19
provision reflects $769,000, $659,000 of which is presented as a component of the net deferred tax liability, $75,000 and $11,000, respectively, for California and Oregon state income tax. The Company’s effective tax rate, calculated by dividing the income tax provision by net income before income tax expense, is affected by recurring items such as the relative amount of income earned in jurisdictions, which we expect to be fairly consistent in the near term. It is also affected by discrete items that may occur in any given year, but are not consistent from year to year. The Company’s effective income tax rate is higher than the federal statutory rate primarily due to state income taxes.
Item 7A. Quantitative and Qualitative Disclosure About Market Risk.
Crimson does not currently have any exposure to financial market risk. Sales to international customers are denominated in U.S. dollars; therefore, Crimson is not exposed to market risk related to changes in foreign currency exchange rates. Prior to the Distribution, Crimson did not have any significant outstanding debt instruments other than amounts due to Leucadia; therefore, Crimson was not exposed to market risk relating to interest rates. As discussed above under Liquidity and Capital Resources, Crimson has a revolving credit facility, which would include interest at floating rates on borrowings.
Item 8. Financial Statements and Supplementary Data.
Financial Statements and supplementary data required by this Item 8 are set forth at the pages indicated in Item 15(a) below.
Item 9. Changes and Disagreements with Accountants on Accounting and Financial Disclosure.
None.
Item 9A. Conclusion Regarding Effectiveness of Disclosure Controls and Procedures.
The Company's management evaluated, with the participation of the Company's principal executive and principal financial officers, the effectiveness of the Company's disclosure controls and procedures (as defined in Rules 13a-15(e) and 15d-15(e) under the Securities Exchange Act of 1934, as amended (the “Exchange Act”)), as of December 31, 2014. Based on their evaluation, the Company's principal executive and principal financial officer concluded that the Company's disclosure controls and procedures were effective as of December 31, 2014.
Management’s Annual Report on Internal Control over Financial Reporting.
Our management is responsible for establishing and maintaining adequate internal control over financial reporting, as such term is defined in Exchange Act Rule 13a-15(f). Internal control over financial reporting is a process to provide reasonable assurance regarding the reliability of our financial reporting and the preparation of financial statements for external purposes in accordance with accounting principles generally accepted in the United States. Because of its inherent limitations, internal control over financial reporting is not intended to provide absolute assurance that a misstatement of our financial statements would be prevented or detected. Also, projections of any evaluation of internal control effectiveness to future periods are subject to the risk that controls may become inadequate because of changes in conditions, or that the degree of compliance with internal control policies or procedures may deteriorate. Under the supervision and with the participation of our management, including our CEO and CFO, we conducted an evaluation of the effectiveness of our internal control over financial reporting based on the framework in Internal Control—Integrated Framework (1992) issued by the Committee of Sponsoring Organizations of the Treadway Commission. Based on this evaluation, our management concluded that our internal control over financial reporting was effective as of December 31, 2014. For so long as we qualify as an "emerging growth company" under the JOBS Act, our independent registered public accounting firm will not be required to attest to the effectiveness of our internal control over financial reporting.
Changes in Internal Control over Financial Reporting.
There has been no change in the Company's internal control over financial reporting (as defined in Rules 13a-15(f) and 15d-15(f) under the Exchange Act) that occurred during the Company's fiscal quarter ended December 31, 2014, that has materially affected, or is reasonably likely to materially affect, the Company's internal control over financial reporting.
Item 9B. Other Information.
Not applicable.
20
PART III
Item 10. Directors, Executive Officers and Corporate Governance.
As of March 16, 2015, the directors and executive officers of the Company, their ages, the positions with the Company held by each of them, the periods during which they have served in such positions and a summary of their recent business experience is set forth below. Each of the biographies of the current directors listed below also contains information regarding such person’s service as a director, business experience, director positions with other public companies held currently or at anytime during the past five years, and the experience, qualifications, attributes and skills that the Board of Directors considered in selecting each of them to serve as a director of the Company.
Ian M. Cumming, age 74. Mr. Cumming has served as a director since March 1994 and Chairman of Crimson since April 2008. He has been a director of Skywest, Inc., a Utah-based regional air carrier, since June 1986, and a director of HomeFed Corporation (“HomeFed”), a California residential real estate development company, since May 1999. Mr. Cumming currently serves as a director of American Investment Company, a family-owned investment company with diversified holdings. Mr. Cumming previously served as a director of Leucadia until July 2013 and was Chairman of the Board until March 2013. He also previously served as a director of Jefferies Group, Inc. (“Jefferies”), a full service global investment bank and institutional securities firm that was acquired by Leucadia in March 2013. Mr. Cumming also previously served as a director of Fortescue Metals Group Ltd. (“Fortescue”), AmeriCredit Corp. and Mueller Industries, Inc. (“Mueller”), the Chairman of the Board of The FINOVA Group Inc. (“Finova”), and a member of the Board of Managers of Premier Entertainment Biloxi, LLC. (“Premier”). Mr. Cumming has managerial and investing experience in a broad range of businesses through his more than 30 years as Chairman and Chief Executive Officer of Leucadia. He also has experience serving on the boards of directors and committees of both public and private entities.
Joseph S. Steinberg, age 71. Mr. Steinberg was elected as a director in February 2013. Mr. Steinberg has been President of Leucadia since January 1979, a director of Leucadia since December 1978 and Leucadia’s Chairman of the Board since March 2013. Mr. Steinberg has been a director of HomeFed since August 1998 and Chairman of the Board of HomeFed since December 1999. Mr. Steinberg is also a director of Jefferies. Mr. Steinberg had previously served as a director of Jordan Industries, Inc., White Mountains Insurance Group, Ltd, Finova, Fortescue and Mueller, and was a member of the Board of Managers of Premier. Mr. Steinberg has managerial and investing experience in a broad range of businesses through his more than 30 years as President and a director of Leucadia. He also has experience serving on the boards and committees of both public and private companies.
John D. Cumming, age 47. Mr. Cumming was elected as a director in February 2013. Mr. Cumming has been the Chairman, Chief Executive Officer and President of Powdr Corporation, a private company engaged in the development of ski resorts, since 1994. Mr. Cumming has also been the President of the United States Ski and Snowboard Team Foundation since 2010. Mr. Cumming previously served in several senior roles at the Park City Foundation, including as a member of the Board of Trustees and Chairman. Mr. Cumming is also a director of Cumming Investment Company. Mr. Cumming has managerial and investing experience in a broad range of businesses through his service as a senior executive and director of Powdr, his involvement as a founding shareholder of Mountain Hardwear and his tenure on various boards of directors. Ian M. Cumming is the father of John D. Cumming.
Avraham M. Neikrug, age 45. Mr. Neikrug was elected as a director in February 2013. Mr. Neikrug has been the Managing Partner of Goldenhill Ventures, a private investment firm that specializes in buying and building businesses in partnership with management, since June 2011. Mr. Neikrug has served as Vice President in Goldenhill Ventures LLC since June 2011 and Spin Holdings LLC since December 1999. Mr. Neikrug has managerial and investing experience in a broad range of businesses through his founding and operating of JIR Inc., a company involved in the development of regional cable television throughout Russia, JIRP, a business-to-business internet service provider (ISP) based in Austria, and M&A Argentina, a private equity effort in Argentina. Avraham M. Neikrug’s father is a first cousin to Joseph S. Steinberg.
Douglas M. Carlson, age 58. Mr. Carlson was elected as a director in March 2013. Mr. Carlson has been Executive Vice President of Digital Content and Marketing of NOOK Media LLC, a subsidiary of Barnes & Noble, Inc., since October 2013. From April 2010 to September 2013, Mr. Carlson previously was Managing Partner of Rancho Valencia Resort & Spa, a tennis resort that includes fractional real estate. Prior to that, Mr. Carlson was Executive Chairman and Managing Director of Zinio, LLC and VIV Publishing, a digital publishing, retail and distribution platform for magazines, since 2005. Mr. Carlson co-founded FIJI Water Company LLC, Inc. in 1996 and served as its Chief Executive Officer from 1996 to 2005. Prior to joining FIJI, Mr. Carlson served as the Senior Vice President and Chief Financial Officer for The Aspen Skiing Company, from 1989 to 1996. Mr. Carlson has managerial and investing experience both within and outside the hospitality industry, as well as having been a certified public accountant.
Craig D. Williams, age 64. Mr. Williams was elected as a director in March 2013 and has served as Chief Operating Officer and Chief Winegrower since January 1, 2015. Mr. Williams has been owner of Craig Williams Wine Company, a consulting business focused on winemaking and viticulture, since 2008. From 1976 to 2008, Mr. Williams held a variety of winemaking roles at Joseph Phelps Vineyards, rising to Senior Vice President of Winegrowing, responsible for all viticulture and winemaking activities, from 1999 to 2008. Mr. Williams has managerial experience and experience in multiple aspects of the wine business.
Patrick M. DeLong, age 50. Mr. DeLong served as Chief Financial and Operating Officer of Crimson since July 2007 and was
21
appointed by the board of directors on December 17, 2014 to serve as President and Chief Executive Officer, effective January 1, 2015. Mr. DeLong served as Interim President and Chief Executive Officer from November 3, 2014 through December 31, 2014. Mr. DeLong will continue serving as acting Chief Financial Officer until a new Chief Financial Officer is hired. Mr. DeLong served as the Senior Vice President and Chief Financial Officer of Icon Estates, which was a fine wine division of Constellation Brands, Inc., from 2004 to 2006. Mr. DeLong was at the Robert Mondavi Corporation in a variety of roles from 1998 to 2004, including Senior Vice President of Finance & Planning.
Mike S. Cekay, age 43. Mr. Cekay has served as Senior Vice President of Global Sales of Crimson since May 2012. Mr. Cekay served as the Executive Vice President, Global Sales Manager of Don Sebastiani & Sons from 2009 to 2012. Mr. Cekay was Vice President of Sales at Future Brands LLC from 2007 to 2009. Mr. Cekay was Divisional Sales Vice President for Beam Wine Estates from 2005 to 2007.
Natasha K. Hayes, age 43. Mrs. Hayes has served as Vice President of Marketing of Crimson since May 2012. Mrs. Hayes was Marketing Director at Jackson Family Wines from 2010 to 2011. Mrs. Hayes was a consultant at Hayes Consulting from 2011 to May 2012, specializing in marketing. Mrs. Hayes was Group Marketing Director at Constellation Wine US from 2007 to 2010. Mrs. Hayes served as the Group Brand Manager of Fosters Wine Group, from 2001 to 2007.
Committees of the Board
The Board of Directors of the Company has a standing Audit Committee. It does not have a compensation or nominating committee. As our common stock is traded on the OTC Market, we are not subject to listing standards that would require us to have a compensation committee or that would require director nominees to be selected or recommended by a majority of independent directors or a nominating committee comprised solely of independent directors. The Board believes it is appropriate to have all directors involved in setting executive and director compensation and in the process of nominating directors, rather than delegate these responsibilities to a smaller group of directors. As indicated below, under the listing standards of the NASDAQ Stock Market, Messrs. Carlson and Neikrug are independent directors serving on the Board. The Company will continue to evaluate the need for a compensation committee and a nominating committee in the future.
Procedures for Recommending Nominees
A stockholder entitled to vote in the election of directors may nominate one or more persons for election as director at a meeting if written notice of that stockholder’s intent to make the nomination has been given to us, with respect to an election to be held at an annual meeting of stockholders, no earlier than 150 days and no later than 120 days before the first anniversary of our proxy statement in connection with the last annual meeting, and, with respect to an election to be held at a special meeting of stockholders, no earlier than 150 days before such special meeting and no later than 120 days before such special meeting, or if the first public notice of such special meeting is less than 130 days prior to the date of such special meeting, the tenth day following the date on which public notice of the meeting is first given to stockholders. The notice shall provide such information as required under the Company’s By-laws, including, without limitation, the name and address of the stockholder and his or her nominees, a representation that the stockholder is entitled to vote at the meeting and intends to nominate the person, a description of all arrangements or understandings between the stockholder and each nominee, other information as would be required to be included in a proxy statement soliciting proxies for the election of the stockholder’s nominees, the consent of each nominee to serve as a director of the Company if so elected, information concerning the stockholder’s direct and indirect ownership of securities of the Company, including with respect to any beneficial owner of securities of the Company held by the stockholder, and compensation received by or relationships between such stockholder with respect to the securities of the Company from any beneficial owner of such securities. We may require any proposed nominee to furnish other information as we may reasonably require to determine the eligibility of the proposed nominee to serve as a director of the Company.
Audit Committee
The Board of Directors has adopted a charter for the Audit Committee, which is available on our website, www.crimsonwinegroup.com. The Audit Committee consists of Mr. Carlson, who serves as the Chairman, and Mr. Neikrug. The Board of Directors has determined that Mr. Carlson is qualified as an audit committee financial expert within the meaning of regulations of the SEC and that each of Mr. Carlson and Mr. Neikrug is independent applying the NASDAQ Stock Market’s listing standards for independence and the SEC’s independence requirements for audit committee members.
Section 16(a) Beneficial Ownership Reporting Compliance
Section 16(a) of the Securities Exchange Act of 1934 requires our executive officers and directors, and persons who beneficially own more than 10% of a registered class of our equity securities, to file reports of ownership and changes in ownership with the SEC. Based solely upon a review of the copies of such forms furnished to us and written representations from our executive officers, directors and greater than 10% beneficial stockholders, we believe that all persons subject to the reporting requirements of Section 16(a) filed the required reports on a timely basis.
Code of Business Practice
22
We have a Code of Business Practice, which is applicable to all of our directors, officers and employees, and includes a Code of Practice applicable to our principal executive officers and senior financial officers. Both the Code of Business Practice and the Code of Practice are available on our website. We intend to post amendments to or waivers from our Code of Practice on our website as required by applicable law.
Item 11. Executive Compensation.
Introduction
As previously stated, the Board does not have a standing compensation committee and, as a result, the Board of Directors in its entirety will perform such functions as would otherwise be performed by a compensation committee. The Company believes that given the Company’s recent status as an independent public company, it is appropriate for all directors to be involved in the compensation process; however, the Board will continue to evaluate the desirability of forming a compensation committee in the future.
Stock Ownership Requirements
We do not have a formal stock ownership requirement, although two of our directors, Mr. Steinberg and Mr. Cumming, respectively, beneficially own approximately 9.6% and 8.7% of our outstanding common stock.
Accounting and Tax Matters
The Company does not currently provide share-based compensation to employees or directors. In the future, if share-based compensation is provided to employees or directors, the cost of such share-based compensation would be recognized in the Company’s financial statements based on their fair values at the time of grant and would be recognized as an expense over the vesting period of any such award in accordance with GAAP.
|
Summary Compensation Table |
||||||||||||||
|
Name and Principal Position |
Year |
Salary |
Bonus |
All Other Compensation |
Total |
|||||||||
|
Erle Martin, |
2014 |
$ |
358,567 |
$ |
250,000 |
$ |
838,606 |
$ |
1,447,173 |
|||||
|
President & Chief Executive Officer (1) |
2013 |
$ |
412,000 |
$ |
550,000 |
$ |
6,218 |
$ |
968,218 |
|||||
|
Patrick M. DeLong, |
2014 |
$ |
281,822 |
$ |
150,000 |
$ |
19,472 |
$ |
451,294 |
|||||
|
Chief Financial & Operating Officer (2) |
2013 |
$ |
275,000 |
$ |
400,000 |
$ |
4,843 |
$ |
679,843 |
|||||
|
Mike S. Cekay, |
2014 |
$ |
275,000 |
$ |
82,500 |
$ |
21,718 |
$ |
379,218 |
|||||
|
Senior Vice President of Sales |
2013 |
$ |
275,000 |
$ |
47,000 |
$ |
21,175 |
$ |
343,175 |
|||||
(1) Mr. Martin ceased being an employee of the Company on November 3, 2014.
(2) From November 3, 2014 through December 31, 2014, Mr. DeLong also served as Interim President and Chief Executive Officer. Effective January 1, 2015, Mr. DeLong was appointed President and Chief Executive Officer. Mr. DeLong will continue serving as acting Chief Financial Officer (but not Chief Operating Officer) until a new Chief Financial Officer is hired.
During 2013, bonuses for Mr. Martin and Mr. DeLong include $250,000 and $200,000, respectively, in executive bonuses approved by Crimson’s board of directors in relation to the spin-off from Leucadia. All other compensation represents 401(k) contributions, for Mr. Martin, a severance payment of $750,000 and accrued vacation payout of $81,600 upon termination of employment, and for Mr. DeLong and Mr. Cekay, a car allowance of $1,400 per month.
Mr. Martin resigned from his positions as President, Chief Executive Officer, and member of the Board of Directors during the fourth quarter of 2014 and received a severance payment in the amount of $750,000. The Board of Directors determined to not fill the vacant director position created by Mr. Martin’s resignation and instead adopted a resolution reducing the size of the Board of Directors from seven members to six.
Employment Agreements
Patrick DeLong. On June 27, 2007, we entered into an agreement with Mr. DeLong. The agreement continues until terminated by us or Mr. DeLong, or due to his death or disability which renders him unable to perform his duties under the agreement for 90 consecutive days in any 12-month period. Mr. DeLong’s annual base salary under the agreement was $225,000 per year. On March 1, 2012, Mr.
23
DeLong’s annual base salary was increased to $275,000 per year and on March 1, 2014 to $283,250 per year. On December 17, 2014, the board of directors appointed Mr. DeLong to serve as President and Chief Executive Officer, increasing his annual base salary to $340,000, effective January 1, 2015. Mr. DeLong is entitled to an annual bonus opportunity based on performance goals established by the Board of Directors and Mr. DeLong at the beginning of each calendar year. Mr. DeLong’s target bonus was 40% of his annual base salary for the first full calendar year, 45% for the second full calendar year and 50% for the third full calendar year and subsequent calendar years. We will notify Mr. DeLong if the bonus target becomes different than 50% of his base salary. Notwithstanding the provisions of the agreement, the board of directors may make a determination as to bonus payable to Mr. DeLong at its discretion. For example, in June 2013, the Board approved a cash bonus for Mr. DeLong of $200,000 in respect of Mr. DeLong’s work in connection with the Company’s spin-off from Leucadia. Pursuant to the agreement, Mr. DeLong is also eligible to participate in and receive any stock option grants and to participate in any standard company benefits. Mr. DeLong is also eligible to share a percentage of our pre-tax income, subject to terms determined by us pursuant to any long-term incentive or deferred compensation program. Mr. DeLong is entitled to certain benefits if his employment is terminated or upon other events. See “Potential Payments on Termination or Change of Control” below.
Mike Cekay. On March 26, 2012, we entered into an agreement with Mr. Cekay. The agreement continues until terminated by us or Mr. Cekay at any time and for any reason or for no reason with or without notice. Mr. Cekay’s annual base salary under the agreement is $275,000 per year. Mr. Cekay is eligible for an annual bonus in an amount to be determined by us in our discretion up to 30% bonus target of base salary plus an accelerator, based on sales contribution as compared to target, to be determined annually. The amount of any annual bonus will be based upon our performance and Mr. Cekay’s performance, as determined by us, against goals mutually agreed upon between Mr. Cekay and us. Pursuant to the agreement, Mr. Cekay is also eligible to participate in a long term incentive plan, receive a car allowance benefit of $1,400 per month and participate in standard company benefits. Mr. Cekay is not entitled to any benefits if his employment is terminated or upon other events.
Potential Payments on Termination or Change of Control
The information below describes and quantifies certain compensation that would become payable under each named executive officer’s employment agreement if, as of December 31, 2014, his employment had been terminated (including termination in connection with a change in control). Due to the number of factors that affect the nature and amount of any benefits provided upon the events discussed below, any actual amounts paid or distributed may be different. Factors that could affect these amounts include the timing during the year of any such event.
Patrick DeLong. In the event Mr. DeLong’s employment is terminated by us without cause, by him with good reason or by a successor (whether direct, indirect, by purchase, merger, consolidation or otherwise) before a change in control, he shall be entitled to continue to receive as severance, payment, in accordance with our current payroll practices, of his base salary in effect at the time of termination for 12 months.
Director Compensation
As approved in March 2013, our non-employee directors receive an annual retainer of $25,000 for serving on the Board of Directors and a per meeting fee of $2,500 for each Board or committee meeting attended in person. Mr. Carlson receives an additional $26,000 annually for serving as Chairman of the Audit Committee, and Mr. Neikrug receives an additional $17,000 annually for serving on the Audit Committee. The Company reimburses directors for reasonable travel expenses incurred in attending board and committee meetings. The 2014 director compensation for our non-employee directors is set forth below.
|
Director Compensation Table |
||||||||||||||||
|
Name |
Fees earned or paid in cash |
All Other Compensation |
Total |
|||||||||||||
|
Non-Employee Directors (a) |
||||||||||||||||
|
Ian M. Cumming |
$ |
32,500 |
$ |
- |
$ |
32,500 |
||||||||||
|
Joseph S. Steinberg |
$ |
35,000 |
$ |
- |
$ |
35,000 |
||||||||||
|
John D. Cumming |
$ |
32,500 |
$ |
- |
$ |
32,500 |
||||||||||
|
Craig D. Williams (b) |
$ |
35,000 |
$ |
- |
$ |
35,000 |
||||||||||
|
Non-Employee Directors |
||||||||||||||||
|
Avraham M. Neikrug (c) |
$ |
52,000 |
$ |
- |
$ |
52,000 |
||||||||||
|
Douglas Carlson (d) |
$ |
61,000 |
$ |
- |
$ |
61,000 |
||||||||||
24
|
(a) Non-employee directors receive an annual retainer of $25,000 for serving on the Board and a per meeting fee of $2,500 for each Board or committee meeting attended in person. |
||||||||||||||||
|
(b) Commencing January 1, 2015, Mr. Williams became an employee of the Company and ceased being eligible to receive separate compensation as a director. |
||||||||||||||||
|
(c) Mr. Neikrug receives an additional $17,000 annually for serving on the Audit Committee. |
||||||||||||||||
|
(d) Mr. Carlson receives an additional $26,000 annually for serving as Chairman of the Audit Committee. |
||||||||||||||||
Compensation Policies and Risk Management
The Company does not have a formal compensation plan for any of its employees. Annually, the Board of Directors will consider making incentive compensation awards that are purely discretionary, taking into account the employee’s individual performance as well as the Company’s performance for the particular year. Accordingly, the Company believes that its compensation policies do not reward employees for imprudent risk taking.
Item 12. Security Ownership of Certain Beneficial Owners and Management and Related Stockholder Matters.
Equity Compensation Plan Information
In connection with the Distribution, our Board of Directors adopted an equity compensation plan, which allows the Company to grant incentive stock options, nonqualified stock options, stock appreciation rights, restricted stock, and other stock-based awards, and performance-based compensation awards to its officers, employees, and non-employee directors. The equity compensation plan will be administered by our Board of Directors, which is authorized to select the officers, employees and non-employee directors to whom awards will be granted, and to determine the type and amount of such awards. The maximum number of shares available for issuance under the plan is 1 million. To the extent permitted by Section 162(m) of the Code, our Board of Directors is authorized to design any award so that the amounts or shares payable or distributed pursuant to such award will be treated as “qualified performance-based compensation” within the meaning of Section 162(m) of the Code and related regulations. The equity compensation plan was filed as an Exhibit to the Company’s Form 8K, filed on February 1, 2013. This summary of the plan is qualified in its entirety by reference to the full text of the plan. As of the date of this report, no grants have been made under the plan.
Present Beneficial Ownership
Set forth below is certain information as of March 16, 2015, with respect to the beneficial ownership of common shares, determined in accordance with Rule 13d-3 of the Securities Exchange Act of 1934, as amended, by (1) each person who, to our knowledge, is the beneficial owner of more than 5% of our outstanding common shares, which is our only class of voting securities, (2) each director, (3) each of the executive officers named in the Summary Compensation Table under “Executive Compensation,” (4) charitable foundations established by Mr. Ian M. Cumming and (5) all of our executive officers and directors as a group. Unless otherwise stated, the business address of each person listed is c/o Crimson Wine Group, 2700 Napa Valley Corporate Drive, Suite B, Napa, CA 94558.
|
Name and Address of Beneficial Owner |
Number of Shares and Nature of Beneficial Ownership |
Percent of Class |
|||
|
Douglas M. Carlson |
- |
- |
|||
|
Mike S. Cekay |
- |
- |
|||
|
Ian M. Cumming |
2,135,930 |
(a) |
8.7% | ||
|
John D. Cumming |
25,833 | 0.1% | |||
|
Patrick M. DeLong |
3,500 |
* |
|||
|
Avraham M. Neikrug |
30 |
* |
|||
|
Joseph S. Steinberg |
2,351,345 |
(b) |
9.6% | ||
|
Craig D. Williams |
- |
- |
|||
|
Cumming Foundation |
18,321 |
(c) |
* |
||
|
Cumming Philanthropic Organization |
10,166 |
(d) |
* |
||
|
John D. Cumming Family Foundation |
9,166 |
(e) |
* |
||
|
Joseph S. and Diane H. Steinberg 1992 Charitable Trust |
33,000 |
(f) |
0.1% | ||
25
|
All directors and executive officers as a group (8) |
4,516,638 |
(g) |
18.5% | ||
|
* Less than .1%. (a) Includes 21,600 (less than .1%) common shares beneficially owned by Mr. Cumming’s wife, as to which Mr. Cumming may be deemed to be the beneficial owner. |
|||||||||
|
(b) Includes 13,920 (less than .1%) shares of common stock beneficially owned by Mr. Steinberg’s wife and daughter, 1,876,239 (7.7%) shares of common stock held by corporations that are wholly owned by Mr. Steinberg, or held by corporations that are wholly owned by family trusts as to which Mr. Steinberg has sole voting and dispositive control, or held by such trusts, and 233,970 (1.0%) shares of common stock held in a trust for the benefit of Mr. Steinberg’s children as to which Mr. Steinberg may be deemed to be the beneficial owner. |
|||||||||
|
(c) Mr. Ian Cumming is a trustee and President of the Cumming Foundation, a private charitable foundation, and disclaims beneficial ownership of the shares of common stock held by the foundation. |
|||||||||
|
(d) Mr. Ian Cumming is a director and President of Cumming Philanthropic Organization, a Wyoming nonprofit corporation established by Mr. Cumming, and disclaims beneficial ownership of the shares of common stock held by the organization. |
|||||||||
(e) Mr. John D. Cumming is President and a director of the John D. Cumming Family Foundation, a private charitable foundation, and disclaims beneficial ownership of the shares of common stock held by the foundation.
(f) Mr. Steinberg and his wife are the trustees of the charitable trust. Mr. Steinberg and his wife disclaim beneficial ownership of the shares of common stock held by the charitable trust.
(g) Includes 30 shares of common stock owned of record by Mr. Neikrug’s minor son. Does not include shares owned by Cumming Foundation; Cumming Philanthropic Organization; John D. Cumming Family Foundation; and Joseph S. and Diane H. Steinberg 1992 Charitable Trust).
As of March 12, 2015, Cede & Co. held of record 20,189,910 shares of our common stock (approximately 82.5% of our total common stock outstanding). Cede & Co. held such shares as a nominee for broker-dealer members of The Depository Trust Company, which conducts clearing and settlement operations for securities transactions involving its members.
As described herein, our common stock is subject to transfer restrictions that are designed to reduce the possibility that certain changes in ownership could result in limitations on the use of our tax attributes. Our certificate of incorporation contains provisions that generally restrict the ability of a person or entity from acquiring ownership (including through attribution under the tax law) of 5% or more of our common shares and the ability of persons or entities now owning 5% or more of our common shares from acquiring additional common shares. Stockholders (and prospective stockholders) are advised that, under the tax law rules incorporated in these provisions, the acquisition of even a single share of common stock may be proscribed under our certificate of incorporation, given (among other things) the tax law ownership attribution rules as well as the tax law rules applicable to acquisitions made in coordination with or in concert with others. The restriction will remain until the earliest of (a) December 31, 2022, (b) the repeal of Section 382 of the Internal Revenue Code (or any comparable successor provision) and (c) the beginning of our taxable year to which these tax attributes may no longer be carried forward. The restriction may be waived by our Board of Directors.
Stockholders are advised to carefully monitor their ownership of our common stock and consult their own legal advisors and/or us to determine whether their ownership of our common shares approaches the proscribed level.
Item 13. Certain Relationships and Related Transactions and Director Independence.
Policies and Procedures with Respect to Transactions with Related Persons
The Board has adopted a policy for the review, approval and ratification of transactions that involve “related persons” and potential conflicts of interest (the “Related Person Transaction Policy”).
The Related Person Transaction Policy applies to each director and executive officer of the Company, any nominee for election as a director of the Company, any security holder who is known to own of record or beneficially more than five percent of any class of the Company’s voting securities, any immediate family member of any of the foregoing persons, and any corporation, firm, association or other entity in which one or more directors of the Company are directors or officers, or have a substantial financial interest (each a “Related Person”).
Under the Related Person Transaction Policy, a Related Person Transaction is defined as a transaction or arrangement involving a Related Person in which the Company is a participant or that would require disclosure in the Company’s filings in accordance with SEC rules.
Under the Related Person Transaction Policy, Related Persons must disclose to the Audit Committee any potential Related Person Transactions and must disclose all material facts with respect to such transaction. All Related Person Transactions will be reviewed by
26
the Audit Committee and, in its discretion, approved or ratified. In determining whether to approve or ratify a Related Person Transaction the Audit Committee will consider the relevant facts and circumstances of the Related Person Transaction, which may include factors such as the relationship of the Related Person with the Company, the materiality or significance of the transaction to the Company and the Related Person, the business purpose and reasonableness of the transaction, whether the transaction is comparable to a transaction that could be available to the Company on an arms-length basis, and the impact of the transaction on the Company’s business and operations.
From time to time, our directors and officers may engage in purchases of our products at substantial discounts (but not below cost) as determined to be reasonable under the circumstances. Generally, we do not believe any such transactions to be material to the Company or the related person and do not believe that any such transactions would impair the independence of any director. The Board has considered these possible purchases under the Related Person Transaction Policy and has determined that no such purchase will require prior approval by the Audit Committee.
Our Relationship with Leucadia following the Distribution
Following the Distribution, Crimson and Leucadia have operated their businesses separately, each as an independent company. We have entered into certain agreements with Leucadia that are described below.
Separation Agreement
The separation agreement provides for the allocation among the parties of rights and obligations under existing insurance policies with respect to occurrences prior to the separation and sets forth procedures for the administration of insured claims. In addition, the separation agreement allocates between the parties the right to proceeds and the obligation to incur certain deductibles under certain insurance policies. Leucadia is required, subject to the terms of the agreement, to obtain certain directors’ and officers’ insurance policies to apply against pre-separation claims.
Other matters governed by the separation agreement include, among others, access to financial and other records and information, intellectual property, legal privilege, confidentiality, access to and provision of records and treatment of outstanding guarantees.
Administrative Services Agreement
We and Leucadia entered into an administrative services agreement upon spin-off whereby Leucadia or its subsidiaries were to provide to us certain administrative services. The services that Leucadia was to provide to us include SEC and tax filing services, and the fees are intended to allow Leucadia to fully recover the costs directly associated with providing the services, plus out-of-pocket costs and expenses. The annual fee for these services was to be $180,000, payable in monthly installments of $15,000, with an initial one year term with an evergreen renewal clause for subsequent annual periods, and terminable by either party on six months prior notice. Effective August 1, 2013, Leucadia and the Company agreed to amend the administrative service agreement to reduce the administrative services provided to the Company by Leucadia and correspondingly reduce the monthly fee from $15,000 to $4,500. The Company began to provide the administrative services that were no longer provided to the Company by Leucadia. The amendment also provided that the administrative services agreement would terminate in full in February 2014, which it did.
Tax Matters Agreement
We and Leucadia have entered into a tax matters agreement which governs the parties’ respective rights, responsibilities and obligations with respect to taxes, the preparation and filing of tax returns, the control of audits and other tax proceedings and assistance and cooperation in respect of tax matters (the “Tax Matters Agreement”). As a former member of Leucadia’s consolidated U.S. federal income tax group, we have joint and several liability with Leucadia for the consolidated U.S. federal income taxes of the Leucadia group relating to the taxable periods in which we were part of the group. Under the Tax Matters Agreement, however, Leucadia has agreed to indemnify us against this liability and any similar liability for U.S., state or local income taxes that are determined on a consolidated, combined, unitary or similar basis for each taxable period in which we are included in such consolidated, combined, unitary or similar group with Leucadia. We remain responsible for any income taxes that are not determined on a consolidated, combined, unitary or similar basis with Leucadia.
Under the Tax Matters Agreement, we have agreed not to take actions that would jeopardize the tax-free nature of the Distribution. The Tax Matters Agreement also provides rules for allocating tax liabilities in the event that the Distribution is not tax-free. We agreed to indemnify Leucadia for such tax liabilities that are attributable to the failure of certain representations made by us or our affiliates to be true when made, certain actions by us or our affiliates or changes in ownership of our common stock.
Our obligations under the Tax Matters Agreement are not contractually limited in amount or subject to any cap. Further, even if we are not responsible for tax liabilities of Leucadia and its subsidiaries under the Tax Matters Agreement, we nonetheless could be liable under applicable tax law for such liabilities if Leucadia were to fail to pay them or to indemnify us under the Tax Matters Agreement.
Amounts Due to Leucadia and its Affiliates
27
Amounts due to Leucadia and its affiliates were $0, $0, and $152,183,000 as of December 31, 2014, 2013 and 2012, respectively. Amounts due to Leucadia and its affiliates did bear interest at a specified bank prime rate plus 0.125%. All amounts were payable on demand, except for the $45,000,000 note issued to Leucadia in connection with the acquisition of Seghesio Family Vineyards that was due May 13, 2013. Unpaid interest, if any, was added to the principal balance on a quarterly basis. Prior to the Distribution, the remaining balance due to Leucadia and its affiliates was contributed to capital. Interest expense to affiliates was $0, $783,000, and $5,192,000 for the years ended December 31, 2014, 2013 and 2012, respectively.
Director Independence
The Board of Directors has determined that Mr. Neikrug and Mr. Carlson and are independent applying the NASDAQ Stock Market’s listing standards for independence.
Item 14. Principal Accounting Fees and Services.
Prior to formation of the Audit Committee, the Board of Directors adopted a policy for pre-approval by the Audit Committee of all audit and non-audit work performed by the Company’s independent registered public accounting firm, Moss Adams LLP, and has pre-approved (i) certain general categories of work where no specific case-by-case approval is necessary (“general pre-approvals”) and (ii) categories of work which require the specific pre-approval of the Audit Committee (“specific pre-approvals”). For additional services or services in an amount above the annual amount that has been pre-approved, additional authorization from the Audit Committee is required. The Audit Committee has delegated to Chairman of the Audit Committee the ability to pre-approve all of these services in the absence of the full committee. Any pre-approval decisions made by the Chairman of the Audit Committee under this delegated authority will be reported to the full Audit Committee. All requests for services to be provided by Moss Adams LLP that do not require specific approval by the Audit Committee must be submitted to the Chief Financial Officer of the Company, who determines whether such services are in fact within the scope of those services that have received the general pre-approval of the Audit Committee. The Chief Financial Officer reports to the Audit Committee periodically, at a minimum quarterly.
Audit Fees
In accordance with the SEC’s definitions and rules, Audit Fees are fees paid to Moss Adams LLP for professional services for the audit of the Company’s consolidated financial statements included in the Company’s Form 10-K, the review of financial statements included in the Company’s Form 10-Qs, services that are normally provided in connection with statutory and regulatory filings or engagements, assurance and related services that are reasonably related to the performance of the audit or review of our financial statements. Audit Related Fees include professional services for the audit of the Company’s 401k plan, including compliance with regulatory matters, and consulting with respect to technical accounting and disclosure rules. Tax Fees are related to the transition of tax related services to an independent tax consulting firm upon spin-off from Leucadia.
The following table sets forth the aggregate fees incurred by us for the following periods relating to our independent accounting firm, Moss Adams LLP:
|
Year Ended December 31, |
||||||||
|
2014 |
2013 |
|||||||
|
Audit Fees |
$ |
240,400 |
$ |
251,600 | ||||
|
Audit Related Fees |
11,600 | 5,600 | ||||||
|
Tax Fees |
1,300 | 27,700 | ||||||
|
$ |
253,300 |
$ |
284,900 | |||||
28
PART IV
Item 15. Exhibits and Financial Statement Schedules.
|
(a)(1) |
Financial Statements. |
||
|
Report of Independent Registered Public Accounting Firm |
F-1 |
||
|
Consolidated Balance Sheets at December 31, 2014 and 2013 |
F-2 |
||
|
Consolidated Income Statements for the years ended December 31, 2014, 2013 and 2012 |
F-3 |
||
|
Consolidated Statements of Comprehensive Income for the years ended December 31, 2014, 2013 and 2012 |
F-4 |
||
|
Consolidated Statements of Cash Flows for the years ended December 31, 2014, 2013 and 2012 |
F-5 |
||
|
Consolidated Statements of Changes in Equity for the years ended December 31, 2014, 2013 and 2012 |
F-6 |
||
|
Notes to Consolidated Financial Statements |
F-7 |
||
(a)(2) Financial Statement Schedules.
|
Schedules are omitted because they are not required or are not applicable or the required information is shown in the financial statements or notes thereto. |
|
(a)(3) |
See item 15(b) below for a complete list of Exhibits to this Report including Executive Compensation Plans and Arrangements. |
(b) Exhibits
|
We will furnish any exhibit upon request made to our Corporate Secretary, 2700 Napa Valley Corporate Drive, Suite B, Napa, CA 94558. We charge $0.50 per page to cover expenses of copying and mailing. |
All documents referenced below were filed pursuant to the Securities Exchange Act of 1934 by the Company, file number 1-10153, unless otherwise indicated.
|
2.1 |
Separation Agreement, dated February 1, 2013, between Crimson Wine Group, Ltd. and Leucadia National Corporation (filed as Exhibit 2.1 to the Company’s Form 8K, filed on February 23, 2013 (the “February 23, 2013 Form 8-K”) (No. 000-54866)).* |
|
2.2 |
Severance Agreement and Release of all Claims, dated November 4, 2014, between Crimson Wine Group, Ltd. and Erle Martin (filed as Exhibit 10.1 to the Company’s Form 8K, filed on November 6, 2014 (No. 000-54866)).* |
|
3.1 |
Amended and Restated Certificate of Incorporation (filed as Exhibit 3.1 to the February 23, 2013 Form 8-K).* |
|
3.2 |
Amended and Restated Bylaws (filed as Exhibit 3.2 to the February 23, 2013 Form 8-K).* |
|
4.1 |
Form of Specimen Stock Certificate (filed as Exhibit 4.1 to Amendment No. 2 to the Company’s Registration Statement on Form 10-12G).* |
|
10.1 |
Employment Agreement between Leucadia Cellars & Estates, LLC and Patrick M. DeLong, dated June 19, 2007 (filed as Exhibit 10.1 to Amendment No. 1 to the Company’s Registration Statement on Form 10-12G).* + |
|
10.2 |
Employment Agreement between Crimson Wine Group, Ltd. and Mike S. Cekay, dated March 26, 2012 (filed as Exhibit 10.2 to Amendment No. 1 to the Company’s Registration Statement on Form 10-12G).* + |
29
|
10.3 |
Tax Matters Agreement dated February 1, 2013, between Crimson Wine Group, Ltd. and Leucadia National Corporation (filed as Exhibit 10.1 to the February 23, 2013 Form 8-K).* |
|
10.4 |
Administrative Services Agreement, dated February 23, 2013, between Crimson Wine Group, Ltd. and Leucadia National Corporation (filed as Exhibit 10.2 to the February 1, 2013 Form 8-K).* |
|
10.5 |
First Amendment to Administrative Services Agreement, dated August 1, 2013, between Crimson Wine Group, Ltd. and Leucadia National Corporation (filed as Exhibit 10.1 to the August 1, 2013 Form 8-K).* |
|
10.6 |
Crimson Wine Group, Ltd. 2013 Omnibus Incentive Plan (filed as Exhibit 10.3 to the February 23, 2013 Form 8-K).* + |
|
10.7 |
Credit Agreement dated as of March 22, 2013 among Crimson Wine Group, Ltd., Pine Ridge Winery, LLC, Chamisal Vineyards, LLC and Double Canyon Vineyards, LLC, and American AgCredit, FLCA, as Agent for the Lenders and for itself as a Lender. (filed as Exhibit 10.6 to the Company’s Form 10-K filed on March 28, 2013).* |
|
21.1 |
List of Subsidiaries of Crimson Wine Group, Ltd. (filed as Exhibit 10.5 to the Company’s Registration Statement on Form 10-12G).* |
|
31.1 |
Certification of Principal Executive Officer pursuant to Section 302 of the Sarbanes-Oxley Act of 2002. |
|
31.2 |
Certification of Principal Financial Officer pursuant to Section 302 of the Sarbanes-Oxley Act of 2002. |
|
32.1 |
Certification of Principal Executive Officer pursuant to Section 906 of the Sarbanes-Oxley Act of 2002.** |
|
32.2 |
Certification of Principal Financial Officer pursuant to Section 906 of the Sarbanes-Oxley Act of 2002.** |
|
101 |
Financial statements from the Annual Report on Form 10-K of Crimson Wine Group, Ltd. for the year ended December 31, 2014, formatted in Extensible Business Reporting Language (XBRL): (i) the Consolidated Balance Sheets, (ii) the Consolidated Income Statements, (iii) the Consolidated Statements of Comprehensive Income, (iv) the Consolidated Statements of Cash Flows, (v) the Consolidated Statements of Changes in Equity, and (vi) the Notes to Consolidated Financial Statements. |
|
* |
Incorporated by reference. |
|
** |
Furnished herewith pursuant to Item 601(b) (32) of Regulation S-K. |
|
+ |
Management Employment Contract or Compensatory Plan/Arrangement. |
30
SIGNATURES
Pursuant to the requirements of Section 13 or 15(d) of the Securities Exchange Act of 1934, the Registrant has duly caused this report to be signed on its behalf by the undersigned, thereunto duly authorized.
|
CRIMSON WINE GROUP, LTD. |
|||
|
Date: March 16, 2015 |
By: |
/s/ Patrick M. DeLong |
|
|
Name: Patrick M. DeLong |
|||
|
Title: President, Chief Executive Officer and Chief Financial Officer |
|||
|
(Principal Executive, Financial and Accounting Officer) |
|||
Pursuant to the requirements of the Securities Exchange Act of 1934, this report has been signed below by the following persons on behalf of the Registrant and in the capacities and on the dates indicated.
|
Date |
Signature |
Title |
|
March 16, 2015 By: |
/s/ Patrick M. DeLong |
President, Chief Executive Officer and Chief Financial Officer |
|
Patrick M. DeLong |
(Principal Executive, Financial and Accounting Officer) |
|
|
March 16, 2015 By: |
/s/ Ian M. Cumming |
Chairman of the Board and Director |
|
Ian M. Cumming |
||
|
March 16, 2015 By: |
/s/ Joseph S. Steinberg |
Director |
|
Joseph S. Steinberg |
||
|
March 16, 2015 By: |
/s/ John D. Cumming |
Director |
|
John D. Cumming |
||
|
March 16, 2015 By: |
/s/ Avraham M. Neikrug |
Director |
|
Avraham M. Neikrug |
||
|
March 16, 2015 By: |
/s/ Douglas M. Carlson |
Director |
|
Douglas M. Carlson |
||
|
March 16, 2015 By: |
/s/ Craig D. Williams |
Director, Chief Operating Officer and Chief Winegrower |
|
Craig D. Williams |
31
REPORT OF INDEPENDENT REGISTERED PUBLIC ACCOUNTING FIRM
To the Board of Directors and Shareholders of Crimson Wine Group, Ltd.
We have audited the accompanying consolidated balance sheets of Crimson Wine Group, Ltd. and subsidiaries (the “Company”), as of December 31, 2014 and 2013, and the related consolidated statements of income, comprehensive income, cash flows and changes in equity for each of the three years in the period ended December 31, 2014. These consolidated financial statements are the responsibility of the Company’s management. Our responsibility is to express an opinion on these consolidated financial statements based on our audits.
We conducted our audits in accordance with the standards of the Public Company Accounting Oversight Board (United States). Those standards require that we plan and perform the audits to obtain reasonable assurance about whether the consolidated financial statements are free of material misstatement. The Company is not required to have, nor were we engaged to perform, an audit of its internal control over financial reporting. Our audit included consideration of internal control over financial reporting as a basis for designing audit procedures that are appropriate in the circumstances, but not for the purpose of expressing an opinion on the effectiveness of the Company’s internal control over financial reporting. Accordingly, we express no such opinion. An audit also includes examining, on a test basis, evidence supporting the amounts and disclosures in the consolidated financial statements, assessing the accounting principles used and significant estimates made by management, as well as evaluating the overall consolidated financial statement presentation. We believe our audits provide a reasonable basis for our opinion.
As discussed further in Notes 1 and 12 to the consolidated financial statements, on February 25, 2013, the Company was spun-off from Leucadia National Corporation (“Leucadia”), through a distribution of the Company’s shares to Leucadia shareholders. Concurrent with the distribution, the Company’s outstanding balance due to Leucadia was contributed to the Company’s capital.
In our opinion, the consolidated financial statements referred to above present fairly, in all material respects, the consolidated financial position of Crimson Wine Group, Ltd. and subsidiaries, as of December 31, 2014 and 2013, and the consolidated results of their operations and their cash flows for each of the three years in the period ended December 31, 2014, in conformity with accounting principles generally accepted in the United States of America.
/s/ Moss Adams LLP
Santa Rosa, California
March 16, 2015
F-1
CRIMSON WINE GROUP, LTD.
CONSOLIDATED BALANCE SHEETS
December 31, 2014 and 2013
(Dollars in thousands, except par value)
|
2014 |
2013 |
||||
|
ASSETS |
|||||
|
Current assets: |
|||||
|
Cash and cash equivalents |
$ |
13,274 |
$ |
13,269 | |
|
Investments available for sale |
15,711 | 10,470 | |||
|
Accounts receivable, net |
5,784 | 5,144 | |||
|
Inventory |
49,593 | 44,293 | |||
|
Other current assets |
894 | 1,055 | |||
|
Deferred tax asset, current |
3,184 | 3,000 | |||
|
Total current assets |
88,440 | 77,231 | |||
|
Property and equipment, net |
108,707 | 109,036 | |||
|
Goodwill |
1,053 | 1,053 | |||
|
Intangible assets and other non-current assets |
17,300 | 18,820 | |||
|
Total assets |
$ |
215,500 |
$ |
206,140 | |
|
LIABILITIES |
|||||
|
Current liabilities: |
|||||
|
Accounts payable |
$ |
4,342 |
$ |
3,896 | |
|
Accrued compensation related expenses |
1,979 | 2,061 | |||
|
Other accrued expenses |
1,266 | 1,226 | |||
|
Customer deposits |
403 | 328 | |||
|
Total current liabilities |
7,990 | 7,511 | |||
|
Deferred rent, non-current |
123 |
- |
|||
|
Deferred tax liability, non-current |
4,267 | 500 | |||
|
Total non-current liabilities |
4,390 | 500 | |||
|
Total liabilities |
12,380 | 8,011 | |||
|
EQUITY |
|||||
|
Common shares, par value $0.01 per share, authorized 150,000,000 |
245 | 245 | |||
|
shares; 24,458,368 issued and outstanding |
|||||
|
Additional paid-in capital |
277,520 | 277,520 | |||
|
Accumulated other comprehensive loss |
(39) | (30) | |||
|
Accumulated deficit |
(74,606) | (79,606) | |||
|
Total equity |
203,120 | 198,129 | |||
|
Total liabilities and equity |
$ |
215,500 |
$ |
206,140 | |
The accompanying notes are an integral part of these consolidated financial statements.
F-2
CRIMSON WINE GROUP, LTD.
CONSOLIDATED INCOME STATEMENTS
For the years ended December 31, 2014, 2013 and 2012
(In thousands, except per share amounts)
|
2014 |
2013 |
2012 |
||||||
|
Net sales |
$ |
58,114 |
$ |
56,472 |
$ |
48,774 | ||
|
Cost of sales |
27,170 | 29,685 | 24,684 | |||||
|
Gross profit |
30,944 | 26,787 | 24,090 | |||||
|
Operating expenses: |
||||||||
|
Sales and marketing |
13,227 | 12,807 | 11,452 | |||||
|
General and administrative |
10,240 | 9,172 | 7,273 | |||||
|
Administrative service fees paid to Leucadia National |
||||||||
|
Corporation |
9 | 98 |
- |
|||||
|
Total operating expenses |
23,476 | 22,077 | 18,725 | |||||
|
Net (gain)/loss on disposals of property and equipment |
(1,553) | (649) | 262 | |||||
|
Income from operations |
9,021 | 5,359 | 5,103 | |||||
|
Other income (expense): |
||||||||
|
Interest expense |
(152) | (901) | (5,192) | |||||
|
Other income (expense), net |
(8) | 315 | 311 | |||||
|
Total other income (expense), net |
(160) | (586) | (4,881) | |||||
|
Income before income taxes |
8,861 | 4,773 | 222 | |||||
|
Income tax provision (benefit) |
3,861 | (2,335) | 11 | |||||
|
Net income |
$ |
5,000 |
$ |
7,108 |
$ |
211 | ||
|
Basic and fully diluted weighted-average shares outstanding |
24,458 | 24,458 | 24,458 | |||||
|
Basic and fully diluted earnings per share |
$ |
0.20 |
$ |
0.29 |
$ |
0.01 | ||
The accompanying notes are an integral part of these consolidated financial statements.
F-3
CRIMSON WINE GROUP, LTD.
CONSOLIDATED STATEMENTS OF COMPREHENSIVE INCOME
For the years ended December 31, 2014, 2013 and 2012
(In thousands)
|
2014 |
2013 |
2012 |
||||||
|
Net income |
$ |
5,000 |
$ |
7,108 |
$ |
211 | ||
|
Other comprehensive income (loss): |
||||||||
|
Net unrealized holding losses on investments |
||||||||
|
arising during the period, net of tax |
(9) | (30) |
- |
|||||
|
Comprehensive income |
$ |
4,991 |
$ |
7,078 |
$ |
211 | ||
The accompanying notes are an integral part of these consolidated financial statements.
F-4
CRIMSON WINE GROUP, LTD.
CONSOLIDATED STATEMENTS OF CASH FLOWS
For the years ended December 31, 2014, 2013 and 2012
(In thousands)
|
2014 |
2013 |
2012 |
||||||
|
Net cash flows from operating activities: |
||||||||
|
Net income |
$ |
5,000 |
$ |
7,108 |
$ |
211 | ||
|
Adjustments to reconcile net income to net cash provided by operations: |
||||||||
|
Depreciation and amortization of property and equipment |
5,555 | 5,343 | 5,444 | |||||
|
Amortization of intangible assets |
1,514 | 1,514 | 1,514 | |||||
|
Leucadia National Corporation and its affiliates interest expense added to |
||||||||
|
principal |
- |
572 | 3,823 | |||||
|
Loss on write-down of inventory |
517 |
- |
50 | |||||
|
Provision for doubtful accounts |
4 | 3 | 21 | |||||
|
Net (gain)/loss related to disposals of property and equipment |
(1,553) | (649) | 262 | |||||
|
Deferred rent |
123 |
- |
- |
|||||
|
Decrease in net deferred tax asset valuation allowance |
(265) | (2,500) |
- |
|||||
|
Provision for deferred income taxes |
3,848 |
- |
- |
|||||
|
Net change in: |
||||||||
|
Accounts receivable |
(644) | (646) | 84 | |||||
|
Inventory |
(5,817) | (1,232) | (4,105) | |||||
|
Other current assets |
161 | (183) | (193) | |||||
|
Other non-current assets |
6 | (309) |
- |
|||||
|
Accounts payable and expense accruals |
576 | 1,177 | (39) | |||||
|
Customer deposits |
75 | 99 | (99) | |||||
|
Income taxes payable |
(172) | 36 | 9 | |||||
|
Net cash provided by operating activities |
8,928 | 10,333 | 6,982 | |||||
|
Net cash flows from investing activities: |
||||||||
|
Purchase of investments available for sale |
(9,500) | (10,500) |
- |
|||||
|
Redemptions of investments available for sale |
4,250 |
- |
- |
|||||
|
Acquisition of property and equipment |
(7,664) | (6,534) | (3,946) | |||||
|
Proceeds from disposals of property and equipment |
3,991 | 1,791 | 37 | |||||
|
Net cash used for investing activities |
(8,923) | (15,243) | (3,909) | |||||
|
Net cash flows from financing activities: |
||||||||
|
Reduction of debt |
- |
(1,700) | (3,000) | |||||
|
Capital contribution by Leucadia National Corporation |
- |
14,175 |
- |
|||||
|
Net cash provided by (used for) financing activities |
- |
12,475 | (3,000) | |||||
|
Net increase in cash and cash equivalents |
5 | 7,565 | 73 | |||||
|
Cash and cash equivalents at January 1 |
13,269 | 5,704 | 5,631 | |||||
|
Cash and cash equivalents at December 31 |
$ |
13,274 |
$ |
13,269 |
$ |
5,704 | ||
|
Supplemental disclosure of cash flow information: |
||||||||
|
Cash paid during the period for: |
||||||||
|
Interest |
$ |
152 |
$ |
240 |
$ |
1,500 | ||
|
Income taxes |
$ |
448 |
$ |
129 |
$ |
1 | ||
|
Non-cash investing and financing activities: |
||||||||
|
Conversion of accrued interest to long-term debt |
$ |
- |
$ |
572 |
$ |
3,823 | ||
|
Conversion of due to Leucadia National Corporation to equity |
$ |
- |
$ |
151,043 |
$ |
- |
||
|
Unrealized holding losses on investments |
$ |
(9) |
$ |
(30) |
$ |
- |
||
The accompanying notes are an integral part of these consolidated financial statements
F-5
CRIMSON WINE GROUP, LTD.
CONSOLIDATED STATEMENTS OF CHANGES IN EQUITY
For the years ended December 31, 2014, 2013 and 2012
(In thousands, except par value)
|
Accumulated |
||||||||||||||
|
Common |
Additional |
Other |
||||||||||||
|
Shares $0.01 |
Paid-In |
Comprehensive |
Accumulated |
|||||||||||
|
Par Value |
Capital |
Loss |
Deficit |
Total |
||||||||||
|
Balance, January 1, 2012 |
$ |
245 |
$ |
112,302 |
$ |
- |
$ |
(86,925) |
$ |
25,622 | ||||
|
Net income |
- |
- |
- |
211 | 211 | |||||||||
|
Balance, December 31, 2012 |
245 | 112,302 |
- |
(86,714) | 25,833 | |||||||||
|
Net income |
- |
- |
- |
7,108 | 7,108 | |||||||||
|
Other comprehensive loss |
- |
- |
(30) |
- |
(30) | |||||||||
|
Cash capital contribution upon spin-off |
- |
14,175 |
- |
- |
14,175 | |||||||||
|
Debt conversion to equity upon spin-off |
- |
151,043 |
- |
- |
151,043 | |||||||||
|
Balance, December 31, 2013 |
245 | 277,520 | (30) | (79,606) | 198,129 | |||||||||
|
Net income |
- |
- |
- |
5,000 | 5,000 | |||||||||
|
Other comprehensive loss |
- |
- |
(9) |
- |
(9) | |||||||||
|
Balance, December 31, 2014 |
$ |
245 |
$ |
277,520 |
$ |
(39) |
$ |
(74,606) |
$ |
203,120 | ||||
The accompanying notes are an integral part of these consolidated financial statements.
F-6
CRIMSON WINE GROUP, LTD.
Notes to Consolidated Financial Statements
|
1. |
Explanatory Note: |
Crimson Wine Group, Ltd. (“Crimson”) is a Delaware corporation that has been operating since 1991. As used herein, the term “Company” refers to Crimson and its wholly-owned subsidiaries, except as the context may otherwise require. Prior to February 25, 2013, Crimson was a wholly-owned subsidiary of Leucadia National Corporation (“Leucadia”). On February 1, 2013, Leucadia declared a pro rata dividend of all of the outstanding shares of Crimson’s common stock in a manner that was structured to qualify as a tax-free spin-off for U.S. federal income tax purposes (the “Distribution”). Leucadia’s common shareholders received one share of Crimson common stock for every ten common shares of Leucadia (24,458,368 Crimson common shares in the aggregate), with cash in lieu of fractional shares, on February 25, 2013. The consolidated financial statements and notes thereto give retroactive effect to the Distribution for all periods presented.
Crimson qualifies as an “emerging growth company” as defined in the JOBS Act. An emerging growth company is defined as a company with total annual gross revenues of less than $1 billion in its most recently completed fiscal year. An emerging growth company will retain such status until the earliest of: (1) the last day of the fiscal year of the emerging growth company following the fifth anniversary of the date it first sold securities pursuant to an effective registration statement under the Securities Act of 1933; (2) the last day of the fiscal year in which the emerging growth company first had total annual gross revenues of $1 billion or more (indexed pursuant to the JOBS Act); (3) the date on which the emerging growth company is deemed to be a “large accelerated filer” as defined in Exchange Act Rule 12b-2 (i.e., an SEC registered company with a public float of at least $700 million that satisfies other tests); or (4) the date on which the emerging growth company has, within the previous three years, issued more than $1 billion of nonconvertible debt. Crimson has elected to opt out of the extended transition period for complying with new or revised accounting standards pursuant to Section 107(b) of the JOBS Act. This election is irrevocable.
|
2. |
Nature of Operations: |
The Company is in the business of producing and selling ultra premium and luxury wines (i.e., wines that retail for $14 to $25 and over $25 per 750ml bottle, respectively). Crimson is headquartered in Napa, California and through its wholly-owned subsidiaries owns four wineries: Pine Ridge Vineyards, Archery Summit, Chamisal Vineyards and Seghesio Family Vineyards. Pine Ridge was acquired in 1991 and has been conducting operations since 1978, Crimson started Archery Summit in 1993, Chamisal Vineyards was acquired in 2008 and has been conducting operations since 1973, and Seghesio Family Vineyards was acquired in 2011 and has been conducting operations since 1895. Additionally, in 2005 and 2006 Crimson acquired Double Canyon vineyard land in the Horse Heaven Hills of Washington’s Columbia Valley. Since 2010, Double Canyon has produced wines in a third party custom crush facility. References to cases of wine herein refer to nine-liter equivalent cases.
Pine Ridge Vineyards owns 158 acres and controls through leasing arrangements an additional 18 acres of estate vineyards in five Napa Valley appellations – Stags Leap District, Rutherford, Oakville, Carneros and Howell Mountain. Approximately 165 acres are currently planted and producing grapes. Archery Summit owns 103 acres and controls through leasing arrangements an additional 17 acres of estate vineyards in the Willamette Valley, Oregon. Approximately 113 acres are currently planted and producing grapes. Chamisal Vineyards owns 98 acres of vineyards in the Edna Valley, California, of which 80 acres are currently planted and producing grapes. Seghesio Family Vineyards owns 316 acres of vineyards in two Sonoma County appellations, the Alexander Valley and Russian River Valley, of which approximately 307 are currently planted and producing grapes. This reflects approximately 21 acres acquired with the Montafi Ranch Vineyard. Double Canyon Vineyards owns 185 plantable acres of vineyards in the Horse Heaven Hills of Washington, of which 88 acres are currently planted and producing grapes, following the sale of 307 acres in May 2014, 285 of which were plantable.
|
3. |
Significant Accounting Policies: |
(a) Critical Accounting Estimates: The Company’s consolidated financial statements have been prepared in accordance with accounting principles generally accepted in the United States (“GAAP”). The preparation of these financial statements requires the Company to make estimates and assumptions that affect the reported amounts in the financial statements and disclosures of contingent assets and liabilities. On an on-going basis, the Company evaluates all of these estimates and assumptions. The following areas have been identified as critical accounting estimates because they have the potential to have a significant impact on the Company's financial statements, and because they are based on assumptions which are used in the accounting records to reflect, at a specific point in time, events whose ultimate outcome won’t be known until a later date. Actual results could differ from these estimates.
Inventory - Inventories are stated at the lower of cost or market, with cost being determined on the first-in, first-out method. Costs
F-7
associated with winemaking, and other costs associated with the manufacturing of products for resale, are recorded as inventory. In accordance with general practice within the wine industry, wine inventories are included in current assets, although a portion of such inventories may be aged for periods longer than one year. As required, the Company reduces the carrying value of inventories that are obsolete or in excess of estimated usage to estimated net realizable value. The Company’s estimates of net realizable value are based on analyses and assumptions including, but not limited to, historical usage, future demand and market requirements. Reductions to the carrying value of inventories are recorded in cost of sales. If future demand and/or pricing for the Company’s products are less than previously estimated, then the carrying value of the inventories may be required to be reduced, resulting in additional expense and reduced profitability. Inventory write-downs of $517,000, $0 and $50,000 were recorded during 2014, 2013 and 2012, respectively.
Vineyard Development Costs – The Company capitalizes internal vineyard development costs when developing new vineyards or replacing or improving existing vineyards. These costs consist primarily of the costs of the vines and expenditures related to labor and materials to prepare the land and construct vine trellises. Amortization of such costs as annual crop costs is recorded on a straight-line basis over the estimated economic useful life of the vineyard, which can be as long as 25 years. As circumstances warrant, the Company re-evaluates the recoverability of capitalized costs, and will record impairment charges if required. The Company has not recorded any significant impairment charges for its vineyards during the last three years.
Review of Long-lived Assets for Impairment - For intangible assets with definite lives, impairment testing is required if conditions exist that indicate the carrying value may not be recoverable. For intangible assets with indefinite lives and for goodwill, impairment testing is required at least annually or more frequently if events or circumstances indicate that these assets might be impaired. The Company currently has no intangible assets with indefinite lives. Substantially all of the Company’s goodwill and other intangible assets result from the acquisition of Seghesio Family Vineyards in May 2011. Amortization of intangible assets is recorded on a straight-line basis over the estimated useful lives of the assets, which range from 7 to 20 years. The Company evaluates goodwill for impairment at the end of each year, and has concluded that goodwill is not impaired.
The Company evaluates long-lived assets for impairment whenever events or changes in circumstances indicate that the carrying amount of an asset or asset group may not be recoverable. Long-lived assets consist primarily of property and equipment. Circumstances that might cause the Company to evaluate its long-lived assets for impairment could include a significant decline in the prices of the Company or the industry can charge for its products, which could be caused by general economic or other factors, changes in laws or regulations that make it difficult or more costly for the Company to distribute its products to its markets at prices which generate adequate returns, natural disasters, significant decrease in demand for the Company’s products or significant increase in the costs to manufacture the Company’s products.
Recoverability of assets is measured by a comparison of the carrying amount of an asset group to future net cash flows expected to be generated by the asset group. If such assets are considered to be impaired, the impairment to be recognized is measured by the amount by which the carrying amount of the assets exceeds the fair value of the assets. The Company groups its long-lived assets with other assets and liabilities at the lowest level for which identifiable cash flows are largely independent of the cash flows of other assets and liabilities (or asset group). This would typically be at the winery level which is described in note 2 above. The Company did not recognize any impairment charges associated with long-lived assets during the three year period ended December 31, 2014.
Depletion allowances - The Company pays depletion allowances to its distributors based on their sales to their customers. These allowances are estimated on a monthly basis by the Company, and allowances are accrued as a reduction of sales. Subsequently, distributors will bill the Company for actual depletions, which may be different from the Company’s estimate. Any such differences are recognized in sales when the bill is received. The Company has historically been able to estimate depletion allowances without any material differences between actual and estimated expense.
(b) Consolidation policy: The consolidated financial statements include the accounts of the Company and its subsidiaries, all of which are wholly-owned. All intercompany balances and transactions are eliminated in consolidation.
(c) Cash and cash equivalents: The Company considers short-term investments, which have maturities of less than three months at the time of acquisition, to be cash equivalents. The Company had no short-term investments considered to be cash and cash equivalents at December 31, 2014 and 2013.
(d) Financial instruments and fair value: Investments available for sale include Certificates of Deposits at December 31, 2014 and 2013. All of our available for sale securities are Level 2 and recorded at fair value. Available for sale securities that mature greater than 12 months from original investment are recorded as short-term because the securities represent the investment of funds that are available for current operations. Net unrealized gains and losses, net of tax, on available for sale securities are recorded in accumulated other comprehensive loss. Unrealized losses that are considered other than temporary are recorded in other income (expense) – net, with the corresponding reduction to the carrying basis of the investment. No other than temporary losses were recorded for the years ended December 31, 2014, 2013 and 2012.
Fair value hierarchy: In determining fair value, we maximize the use of observable inputs and minimize the use of unobservable inputs by requiring that observable inputs be used when available. Observable inputs are inputs that market participants would use in pricing
F-8
the asset or liability based on market data obtained from independent sources. Unobservable inputs reflect our assumptions that market participants would use in pricing the asset or liability developed based on the best information available in the circumstances. We apply a hierarchy to categorize our fair value measurements broken down into three levels based on the transparency of inputs as follows:
|
Level 1: |
Quoted prices are available in active markets for identical assets or liabilities at the reported date. |
|
Level 2: |
Pricing inputs are other than quoted prices in active markets, which are either directly or indirectly observable as of the reported date. The nature of these financial instruments include cash instruments for which quoted prices are available but traded less frequently, derivative instruments whose fair value have been derived using a model where inputs to the model are directly observable in the market, or can be derived principally from or corroborated by observable market data, and instruments that are fair valued using other financial instruments, the parameters of which can be directly observed. |
|
Level 3: |
Instruments that have little to no pricing observability at the reported date. These financial instruments are measured using management’s best estimate of fair value, where the inputs into the determination of fair value require significant management judgment or estimation. |
Financial instruments are valued at quoted market prices, if available. Certain financial instruments have bid and ask prices that can be observed in the marketplace. For financial instruments whose inputs are based on bid-ask prices, the financial instrument is valued at the point within the bid-ask range that meets our best estimate of fair value. We use prices and inputs that are current at the measurement date. For financial instruments that do not have readily determinable fair values using quoted market prices, the determination of fair value is based upon consideration of available information, including types of financial instruments, current financial information, restrictions on dispositions, fair values of underlying financial instruments and quotations for similar instruments.
The valuation of financial instruments may include the use of valuation models and other techniques. Adjustments to valuations derived from valuation models may be made when, in management’s judgment, features of the financial instrument such as its complexity, the market in which the financial instrument is traded and risk uncertainties about market conditions require that an adjustment be made to the value derived from the models. Adjustments from the price derived from a valuation model reflect management’s judgment that other participants in the market for the financial instrument being measured at fair value would also consider in valuing that same financial instrument. To the extent that valuation is based on models or inputs that are less observable or unobservable in the market, the determination of fair value requires more judgment.
The availability of observable inputs can vary and is affected by a wide variety of factors, including, for example, the type of financial instrument and market conditions. As the observability of prices and inputs may change for a financial instrument from period to period, this condition may cause a transfer of an instrument among the fair value hierarchy levels. Transfers among the levels are recognized at the beginning of each period. The degree of judgment exercised in determining fair value is greatest for instruments categorized in Level 3.
(e) Accounts receivable: Accounts receivable are reported at net realizable value. Interest is not accrued on past-due amounts. Accounts are charged against the allowance to bad debt as they are deemed uncollectible based upon a periodic review of the accounts.
(f) Property and equipment: Property and equipment are stated at cost and are depreciated using the straight-line method over the related assets estimated useful lives. Costs of maintenance and repairs are charged to expense as incurred; significant renewals and betterments are capitalized. Costs incurred developing vineyards are capitalized until the vineyard becomes commercially productive. Net gain on the disposal of property and equipment previously reported was reclassified as a component of income from operations to conform with current year's presentation. The reclassification has no impact on previously reported net income, cash flow or equity.
(g) Concentrations of risk: The Company sells the majority of its wine through distributors and retailers. Receivables arising from these sales are not collateralized. For the years ended December 31, 2014, 2013 and 2012, sales to one customer accounted for approximately 15%, 14% and 14% of total sales, respectively. Amounts due from this customer represented approximately 32% and 26% of accounts receivable as of December 31, 2014 and 2013, respectively.
The Company maintains its cash in bank deposit accounts that, at times, may exceed FDIC insurance thresholds.
(h) Revenue recognition: The Company recognizes revenue from product sales upon shipment or delivery provided that persuasive evidence of an arrangement exists, which for sales to wholesalers is a purchase order, the price is fixed, title has transferred, collection of resulting receivables is reasonably assured, there are no customer acceptance requirements, and there are no remaining significant obligations. The cost of depletion allowances and price promotions are treated as reductions of revenues and can be reasonably estimated based upon experience. Revenue from products sold through retail locations, wine clubs and the internet is recognized when the product is received by the customer and payment is received, based on published retail prices and applicable published discounts. Revenue includes any shipping and handling costs billed to the customer, and such amounts are not expected to be sufficient
F-9
to cover actual costs.
(i) Cost of sales: Includes grape, juice and bulk wine costs, whether purchased or grown, crush costs, winemaking and processing costs, bottling, packaging, warehousing and shipping and handling costs. For vineyard produced grapes, grape costs include annual farming costs and amortization of vineyard development expenditures. For wines that age longer than one year, winemaking and processing costs continue to be incurred and capitalized to the cost of wine, which can range from 3 to 36 months.
(j) Taxes not on income: Excise taxes are levied by government agencies on the sale of alcoholic beverages, including wine. These taxes are not collected from customers but are instead the responsibility of the Company. Excise taxes of $1,045,000, $982,000 and $836,000 in 2014, 2013 and 2012, respectively, were recognized as a reduction to wine sales. Sales taxes that are collected from customers and remitted to governmental agencies are not reflected as revenues.
(k) Advertising costs: Advertising costs are expensed as incurred and were $158,000, $286,000 and $81,000 for the years ended December 31, 2014, 2013 and 2012, respectively.
(l) Income taxes: Income taxes are accounted for under the asset and liability method, which requires the recognition of deferred tax assets and liabilities for the expected future tax consequences of events that have been included in the consolidated financial statements. Under this method, deferred tax assets and liabilities are determined based on the differences between the financial statements and the tax basis of assets and liabilities using enacted tax rates in effect for the year in which the differences are expected to reverse. The effect of a change in tax rates on deferred tax assets and liabilities is recognized in income in the period that includes the enacted date.
Net tax assets are recorded to the extent the Company believes these assets will more likely than not be realized. In making such determination, the Company considers all available positive and negative evidence, including scheduled reversals of deferred tax liabilities, projected future taxable income, tax planning strategies and recent financial results of operations. Prior to 2013, the Company had recorded a full valuation allowance related to its net deferred tax asset. As of December 31, 2013, the Company determined it was more likely than not that a portion of the deferred tax asset would be realized in the future, and therefore reduced the valuation allowance resulting in the recognition of a net deferred tax asset of $2,500,000. As of December 31, 2014, the Company determined it is more likely than not that the remaining allowance will be realized in the future, and therefore reduced the valuation allowance to zero and recognized the remaining $265,000 as a portion of the deferred tax asset.
Prior to the Distribution, the Company and its subsidiaries were included in the consolidated federal and certain consolidated or combined state income tax returns of Leucadia. However, the provisions for income taxes in the consolidated income statements have been determined on a theoretical separate-return basis. The Company does not have any unrecognized tax benefits; however, if it did the Company would record accrued interest and penalties related to unrecognized tax benefits as income tax expense. See Note 12 for more information.
(m) Allocation of expenses: For the years ended December 31, 2014, 2013 and 2012, the consolidated financial statements include amounts billed/(credited) by Leucadia for general corporate insurance of $0, $(85,000) and $305,000, respectively, and for internal audit procedures related to Leucadia’s consolidated audit of internal controls over financial reporting of $0, $28,000 and $13,000, respectively. Amounts billed for insurance were determined either by the Company’s directly determined share of third-party insurance premiums or, if an allocation of third-party insurance premiums, based on the Company’s relative revenues and assets as compared to Leucadia’s consolidated revenues and consolidated assets. Costs related to internal audit services were based on actual hours spent and the internal auditors’ employment and travel costs. Subsequent to the Distribution, the Company became responsible for obtaining its own general corporate insurance policies and internal audit services, which resulted in additional expense as a result of standalone policies and requirements.
(n) Recent accounting pronouncements: Effective January 1, 2013, the Company adopted amended Financial Accounting Standards Board (the “FASB”) guidance for indefinite lived intangible asset impairment testing. The amended guidance allows an entity to assess qualitative factors to determine whether the existence of events and circumstances indicate that it is more likely than not that an indefinite lived intangible asset is impaired. If an entity concludes it is not more likely than not that an indefinite lived intangible asset is impaired, the entity is not required to take further action. If an entity concludes otherwise, then the entity would be required to determine the fair value of the indefinite lived intangible asset and compare the fair value with the carrying amount of the indefinite lived intangible asset. The Company adopted this amended guidance for its annual and interim periods beginning January 1, 2013. The adoption of this amended guidance did not have a significant impact on the Company's consolidated financial statements.
In April 2014, the FASB issued changes to reporting discontinued operations and disclosure of disposals of components of an entity. These changes require a disposal of a component to meet a higher threshold in order to be reported as a discontinued operation in an entity’s financial statements. The threshold is defined as a strategic shift that has, or will have, a major effect on an entity’s operations and financial results such as a disposal of a major geographical area or a major line of business. Additionally, the following two criteria have been removed from consideration of whether a component meets the requirements for discontinued operations presentation: (i) the operations and cash flows of a disposal component have been or will be eliminated from the ongoing operations of an entity as a result of
F-10
the disposal transaction, and (ii) an entity will not have any significant continuing involvement in the operations of the disposal component after the disposal transaction. Furthermore, equity method investments now may qualify for discontinued operations presentation. These changes also require expanded disclosures for all disposals of components of an entity, whether or not the threshold for reporting as a discontinued operation is met, related to profit or loss information and/or asset and liability information of the component. These changes became effective for the Company on January 1, 2015. Management has determined that the adoption of these changes will not have an immediate impact on the Company’s consolidated financial statements.
In May 2014, the FASB issued changes to the recognition of revenue for contracts with customers. These changes created a comprehensive framework for all entities in all industries to apply in the determination of when to recognize revenue, and, therefore, supersede virtually all existing revenue recognition requirements and guidance. This framework is expected to result in less complex guidance in application while providing a consistent and comparable methodology for revenue recognition. The core principle of the guidance is that an entity should recognize revenue to depict the transfer of promised goods or services to customers in an amount that reflects the consideration to which the entity expects to be entitled in exchange for those goods or services. To achieve this principle, an entity should apply the following steps: (i) identify the contract(s) with a customer, (ii) identify the performance obligations in the contract(s), (iii) determine the transaction price, (iv) allocate the transaction price to the performance obligations in the contract(s), and (v) recognize revenue when, or as, the entity satisfies a performance obligation. These changes become effective for the Company on January 1, 2017. Management is currently evaluating the potential impact of these changes on the Company’s consolidated financial statements.
In August 2014, the FASB issued guidance on determining when and how to disclose going-concern uncertainties in the financial statements. The new standard requires management to perform interim and annual assessments of an entity’s ability to continue as a going concern within one year of the date the financial statements are issued. An entity must provide certain disclosures if “conditions or events raise substantial doubt about [the] entity’s ability to continue as a going concern.” These changes apply to all entities and are effective for annual periods ending after December 15, 2016, and interim periods thereafter, with early adoption permitted. Management has determined that the adoption of these changes will not have a significant impact on the Company’s consolidated financial statements.
|
4. |
Inventory: |
A summary of inventory at December 31, 2014 and 2013 is as follows (in thousands):
|
2014 |
2013 |
||||
|
Case wine |
$ |
25,613 |
$ |
21,667 | |
|
Bulk wine |
23,630 | 22,280 | |||
|
Packaging and bottling supplies |
350 | 346 | |||
|
$ |
49,593 |
$ |
44,293 | ||
|
5. |
Property and Equipment: |
A summary of property and equipment at December 31, 2014 and 2013 is as follows (in thousands):
|
Depreciable Lives |
2014 |
2013 |
|||||
|
(in years) |
|||||||
|
Land and improvements |
N/A |
$ |
41,573 |
$ |
41,580 | ||
|
Buildings and improvements |
20-40 |
45,259 | 44,446 | ||||
|
Vineyards and improvements |
7-25 |
35,898 | 35,178 | ||||
|
Winery and vineyard equipment |
3-25 |
25,437 | 24,270 | ||||
|
Caves |
20-40 |
5,638 | 5,638 | ||||
|
Vineyards under development |
N/A |
1,894 | 1,338 | ||||
|
Construction in progress |
N/A |
633 | 311 | ||||
| 156,332 | 152,761 | ||||||
F-11
|
Accumulated depreciation and amortization |
(47,625) | (43,725) | |||||
|
$ |
108,707 |
$ |
109,036 |
For the years ended December 31, 2014, 2013 and 2012, depreciation expense was $5,555,000, $5,343,000 and $5,444,000, respectively, with $4,601,000, $4,495,000 and $4,639,000, respectively, capitalized into inventory and $954,000, $848,000 and $805,000, respectively, charged to the income statements.
In January 2013, the Company sold a non-strategic vineyard for net cash consideration of $1,754,000, after selling expenses. The Company recorded a pre-tax gain of $717,000, net of closing costs, during the first quarter of 2013. In May 2014, the Company sold a non-strategic unplanted parcel of land in Washington for net proceeds of $3,902,000, after selling expenses. The Company recorded a pre-tax gain of $1,818,000, net of closing costs, during the second quarter of 2014.
The Company is committed to spend approximately $412,000 in the aggregate for vineyards under development and construction in progress.
|
6. |
Financial Instruments |
The Company’s material financial instruments include cash and cash equivalents and investments classified as available for sale; investments classified as available for sale are the only assets or liabilities that are measured at fair value on a recurring basis. All of the Company’s investments mature within three years or less. The par value, amortized cost, gross unrealized gains and losses and estimated fair value of investments classified as available for sale as of December 31, 2014 and December 31, 2013 are as follows (in thousands):
|
Par Value |
Amortized Cost |
Gross Unrealized Gains |
Gross Unrealized Losses |
Significant Other Observable Inputs |
Total Fair Value Measurements |
||||||||||||
|
December 31, 2014 |
|||||||||||||||||
|
Certificates of Deposit |
$ |
15,750 |
$ |
15,750 |
$ |
7 |
$ |
(46) |
$ |
15,711 |
$ |
15,711 | |||||
|
December 31, 2013 |
|||||||||||||||||
|
Certificates of Deposit |
$ |
10,500 |
$ |
10,500 |
$ |
- |
$ |
(30) |
$ |
10,470 |
$ |
10,470 | |||||
As of December 31, 2014 and 2013, the Company did not have any assets or liabilities measured at fair value on a nonrecurring basis.
For cash and cash equivalents, the carrying amounts of such financial instruments approximate their fair values.
The Company does not invest in any derivatives or engage in any hedging activities.
|
7. |
Intangible and Other Non-Current Assets: |
A summary of intangible and other non-current assets at December 31, 2014 and 2013 is as follows (in thousands):
|
Amortizable Lives |
2014 |
2013 |
|||||
|
(in years) |
|||||||
|
Brand, net of accumulated amortization of $3,688 and $2,659 |
17 |
$ |
13,812 |
$ |
14,841 | ||
|
Distributor relationships, net of accumulated amortization of $666 and $480 |
14 |
1,934 | 2,120 | ||||
|
Customer relationships, net of accumulated amortization of $971 and $700 |
7 |
929 | 1,200 | ||||
|
Legacy permits, net of accumulated amortization of $64 and $46 |
14 |
186 | 204 | ||||
|
Other, net of accumulated amortization of $64 and $54 |
15-20 |
439 | 455 | ||||
|
$ |
17,300 |
$ |
18,820 | ||||
Amortization expense on intangible assets was $1,514,000, $1,514,000 and $1,514,000 for the years ended December 31, 2014, 2013 and 2012, respectively. The estimated aggregate future amortization expense for the intangible assets is $1,514,000 for each of the next four years and $1,359,000 in the fifth year.
|
8. |
Due to Leucadia and its Affiliates: |
F-12
Amounts that were due to Leucadia and its affiliates did bear interest at a specified bank prime rate plus 0.125%. All amounts were payable on demand, except for the $45,000,000 note issued to Leucadia in connection with the acquisition of Seghesio Family Vineyards that was originally due May 13, 2013. Unpaid interest, if any, was added to the principal balance on a quarterly basis. Interest expense to Leucadia and its affiliates was $0, $783,000 and $5,192,000 for the years ended December 31, 2014, 2013 and 2012, respectively.
On February 25, 2013, the remaining balance of due to affiliates was contributed by Leucadia to capital.
|
9. |
Stockholders’ Equity and Equity Incentive Plan: |
On February 25, 2013, Crimson was recapitalized, authorized shares were increased to 150,000,000 common shares, $.01 par value, and Leucadia distributed 24,458,368 Crimson common shares to Leucadia shareholders. The financial statements and notes thereto give retroactive effect to the Distribution for all periods presented. In addition, the Company is authorized to issue 15,000,000 shares of one or more series of preferred stock; no preferred stock has been issued. There were no dilutive or complex equity instruments or securities outstanding at any time during the periods presented.
In February 2013, the Company adopted the 2013 Omnibus Incentive Plan, which provides for the granting of up to 1,000,000 stock options or other common stock based awards. The terms of awards that may be granted, including vesting and performance criteria, if any, will be determined by the Company’s board of directors. No awards have been granted to date.
In March 2014, the Board of Directors of Crimson authorized a share repurchase program that provides for the repurchase of up to $2,000,000 of outstanding common stock. At December 31, 2014, no stock had been repurchased.
|
10. |
Debt: |
In March 2013, Crimson entered into a $60,000,000 revolving credit facility with American AgCredit, FLCA, as agent for the lenders identified in the revolving credit facility, comprised of a revolving loan facility and a term revolving loan facility, which together is secured by substantially all of Crimson’s assets. The revolving credit facility is for up to $10,000,000 of availability in the aggregate for a five year term, and the term revolving credit facility is for up to $50,000,000 in the aggregate for a fifteen year term. All obligations of Crimson under the revolving credit facility are collateralized by certain real property, including vineyards and certain winery facilities of Crimson, accounts receivable, inventory and intangibles. Covenants include the maintenance of specified debt and equity ratios, limitations on the incurrence of additional indebtedness, limitations on dividends and other distributions to shareholders and restrictions on certain mergers, consolidations and sales of assets. In addition to unused line fees ranging from 0.25% to 0.375%, rates for the borrowings are priced based on a performance grid tied to certain financial ratios and the London Interbank Offered Rate, and would have been 1.671% to 1.988% at December 31, 2014. The revolving credit facility can be used to fund acquisitions, capital projects and other general corporate purposes. No amounts have been borrowed under the facility to date.
|
11. |
Revenues and Gross Profit: |
The Company generates revenues from sales of wine to wholesalers and direct to consumers, sales of bulk wine and grapes, special event fees, tasting fees and retail sales. Revenues and gross profit for the years ended December 31, 2014, 2013 and 2012 are as follows (in thousands):
|
2014 |
2013 |
2012 |
|||||||
|
Revenues: |
|||||||||
|
Wholesalers |
$ |
33,811 |
$ |
32,612 |
$ |
27,015 | |||
|
Direct to consumers |
20,343 | 19,656 | 18,113 | ||||||
|
Bulk wine and grape sales, event fees and retail sales |
3,960 | 4,204 | 3,646 | ||||||
|
$ |
58,114 |
$ |
56,472 |
$ |
48,774 | ||||
|
Gross profit: |
|||||||||
|
Wholesalers |
$ |
16,564 |
$ |
14,532 |
$ |
13,163 | |||
|
Direct to consumers |
14,277 | 12,394 | 10,598 | ||||||
|
Bulk wine and grape sales, event fees and retail sales |
620 | (139) | 379 | ||||||
|
Inventory write-down |
(517) |
- |
(50) | ||||||
|
$ |
30,944 |
$ |
26,787 |
$ |
24,090 | ||||
Reductions to the carrying value of inventories to estimated net realizable value are reflected in the inventory write-down category of
F-13
gross profit in the table above. The 2014 inventory write-down pertains to a new product launch that was abandoned and the wine reallocated to a private label program to one retail account.
|
12. |
Income Taxes: |
The provision (benefit) for income taxes for years ended December 31, 2014, 2013 and 2012 are as follows (in thousands):
|
2014 |
2013 |
2012 |
||||||
|
State income taxes: |
||||||||
|
Current |
$ |
110 |
$ |
75 |
$ |
11 | ||
|
Deferred |
659 |
- |
- |
|||||
| 769 | 75 | 11 | ||||||
|
Federal income taxes: |
||||||||
|
Current |
166 | 90 |
- |
|||||
|
Deferred |
2,926 | (2,500) |
- |
|||||
| 3,092 | (2,410) |
- |
||||||
|
$ |
3,861 |
$ |
(2,335) |
$ |
11 | |||
Prior to the Distribution, which was declared on February 1, 2013 with the shares distributed on February 25, 2013, the Company and its subsidiaries were included in the consolidated federal and certain consolidated or combined state income tax returns of Leucadia. However, the provisions for income taxes in the consolidated income statements were determined on a theoretical separate-return basis. Due to the Company’s history of pre-tax losses, as of the Distribution date the Company did not reflect a benefit for its net operating loss carryforwards (“NOLs”) since the Company was unable to conclude it was more likely than not that it would have been able to generate future taxable income to use the NOLs. As noted in Note 3, as of December 31, 2013 the Company determined that it was more likely than not that some of the tax benefit related to the deferred tax assets would be realized and reduced the valuation allowance. Further is noted that as of December 31, 2014, it was determined that it is more likely than not that the remaining allowance would be realized and reduced the valuation allowance to zero. The Company filed a California state income tax return separate from Leucadia. The statute of limitations with respect to the Company’s California state tax return has expired for all years through 2008. The Company currently has no unrecognized tax benefits, and it is not reasonably possible to estimate the amount by which that could increase in the next twelve months since the timing of examinations, if any, is unknown.
Prior to the Distribution, no formal tax sharing agreement was entered into between the Company and Leucadia. On the Distribution date, the Company and Leucadia entered into a tax matters agreement that governs the parties’ respective rights, responsibilities and obligations with respect to tax liabilities and benefits, tax attributes, the preparation and filing of tax returns, the control of audits and other tax proceedings and other matters regarding taxes. In general, with respect to any periods ending at or prior to the Distribution, Leucadia will be responsible for any federal income tax liabilities and any state or local income taxes reportable on a consolidated, combined or unitary return, in each case, as would be applicable to the Company as if it filed tax returns on a stand-alone basis. With respect to any periods beginning after the Distribution, the Company will be responsible for any federal, state or local income taxes of it or any of its subsidiaries. The Company will not be required to reimburse Leucadia for any payments made by Leucadia for adjustments to taxable periods prior to the Distribution, nor will the Company be entitled to any refunds for adjustments to taxable periods prior to the Distribution. The Company is responsible for any adjustments or liabilities related to its California state income tax return for all periods.
The principal components of deferred taxes at December 31, 2014 and 2013 are as follows (in thousands):
|
2014 |
2013 |
||||
|
Deferred tax asset: |
|||||
|
Federal NOL carryover |
$ |
851 |
$ |
3,922 | |
|
California NOL carryover |
1,362 | 1,783 | |||
|
Federal AMT credit |
307 | 90 | |||
|
Inventory |
1,602 | 1,017 | |||
|
Intangible assets, net and goodwill |
68 | 523 | |||
|
Other |
327 | 196 | |||
| 4,517 | 7,531 | ||||
|
Valuation allowance |
- |
(265) | |||
F-14
| 4,517 | 7,266 | ||||
|
Deferred tax liability: |
|||||
|
Property and equipment |
(5,600) | (4,766) | |||
|
Net deferred tax asset (liability) |
$ |
(1,083) |
$ |
2,500 | |
|
Deferred tax asset, current |
$ |
3,184 |
$ |
3,000 | |
|
Deferred tax liability, non-current |
$ |
4,267 |
$ |
500 |
The change in the deferred tax asset valuation allowance was $265,000, $(25,371,000) and $(1,252,000) for 2014, 2013 and 2012 respectively. Subsequent to the Distribution, the Company retained all of its California State NOLs; however, the Company retained federal NOLs only to the extent that they had not been previously used in Leucadia’s consolidated return. Approximately $21,992,000 of the decrease in the valuation allowance for 2013 is due to the elimination of such NOLs. At December 31, 2013, the Company determined it was more likely than not that a portion of the NOLs would be utilized to offset future taxable income, and therefore, reduced the allowance to reflect a net deferred tax asset of $2,500,000. As of December 31, 2014, the Company determined it is more likely than not that the remaining allowance of $265,000 would be utilized to offset future taxable income, and therefore, reduced the allowance to zero. As of December 31, 2014, the Company has $2,504,000 of federal NOLs on a separate-return basis and $23,308,000 of California State NOLs. The federal NOL’s will not begin to expire until 2022. The expiration dates of California State NOLs are as follows (in thousands):
|
State |
||||||||||||||||
|
2015 |
$ |
452 | ||||||||||||||
|
2016 |
6,483 | |||||||||||||||
|
2017-2020 |
- |
|||||||||||||||
|
Thereafter |
16,373 | |||||||||||||||
|
$ |
23,308 | |||||||||||||||
Under certain circumstances, the ability to use the NOLs and future deductions could be substantially reduced if certain changes in ownership were to occur. In order to reduce this possibility, the Company’s certificate of incorporation includes a charter restriction that prohibits transfers of the Company’s common stock under certain circumstances.
The table below reconciles the expected statutory income tax rate to the actual income tax provision (benefit):
|
2014 |
2013 |
2012 |
||||||
|
Expected federal income tax expense (benefit) |
$ |
3,027 |
$ |
1,671 |
$ |
78 | ||
|
State income tax expense |
769 | 75 | 11 | |||||
|
Use of net operating loss |
- |
- |
(78) | |||||
|
Decrease in valuation allowance |
(265) | (2,500) |
- |
|||||
|
Tax expense not provided on income recorded prior |
||||||||
|
to reversal of deferred tax valuation allowance |
- |
(1,581) |
- |
|||||
|
Other |
330 |
- |
- |
|||||
|
Total |
$ |
3,861 |
$ |
(2,335) |
$ |
11 | ||
|
13. |
Employee Benefit Plan: |
A 401(k) profit sharing plan is provided to all employees who meet certain service requirements. The Company matches 25% of a participant’s salary deferral, subject to regulatory limitations. Total company contributions to the plan were $163,000, $150,000 and $132,000 for the years ended December 31, 2014, 2013 and 2012, respectively.
14. Business Segment Information
The Company has identified two operating segments, Wholesale Sales and Direct to Consumer Sales, based upon their different
F-15
distribution channels, margins and selling strategies. Wholesale Sales includes all sales through a third party where prices are given at a wholesale rate whereas Direct to Consumer Sales includes retail sales in the tasting room, remote sites and at on-site events, Wine Club sales, and other sales made directly to the consumer without the use of an intermediary. The two segments reflect how the Company's operations are evaluated by senior management and the structure of its internal financial reporting. The Company evaluates performance based on the gross profit of the respective business segments. Selling expenses that can be directly attributable to the segment are included, however, centralized selling expenses and general and administrative expenses are not allocated between operating segments. Therefore, net income information for the respective segments is not available. Based on the nature of the Company’s business, revenue generating assets are utilized across segments. Therefore, discrete financial information related to segment assets and other balance sheet data is not available and that information continues to be aggregated.
The following table outlines the sales, cost of sales, gross margin, directly attributable selling expenses, and contribution margin of the segments for the years ended December 31, 2014, 2013 and 2012. Sales figures are net of related excise taxes.
|
Year Ended December 31, |
|||||||||||||||||||||||||||
|
Wholesale |
Direct to Consumer |
Total Reportable Segment |
|||||||||||||||||||||||||
|
2014 |
2013 |
2012 |
2014 |
2013 |
2012 |
2014 |
2013 |
2012 |
|||||||||||||||||||
|
(In thousands) |
|||||||||||||||||||||||||||
|
Net sales |
$ |
33,811 |
$ |
32,612 |
$ |
27,015 |
$ |
20,343 |
$ |
19,656 |
$ |
18,113 |
$ |
54,154 |
$ |
52,268 |
$ |
45,128 | |||||||||
|
Cost of sales |
17,247 | 18,080 | 13,852 | 6,066 | 7,262 | 7,515 | 23,313 | 25,342 | 21,367 | ||||||||||||||||||
|
Gross margin |
16,564 | 14,532 | 13,163 | 14,277 | 12,394 | 10,598 | 30,841 | 26,926 | 23,761 | ||||||||||||||||||
|
Direct selling expense |
5,688 | 5,449 | 4,310 | 4,393 | 4,358 | 4,454 | 10,081 | 9,807 | 8,764 | ||||||||||||||||||
|
Contribution margin |
$ |
10,876 |
$ |
9,083 |
$ |
8,853 |
$ |
9,884 |
$ |
8,036 |
$ |
6,144 |
$ |
20,760 |
$ |
17,119 |
$ |
14,997 | |||||||||
|
% of reportable segment |
|||||||||||||||||||||||||||
|
total net sales |
62.4% | 62.4% | 59.9% | 37.6% | 37.6% | 40.1% | 100.0% | 100.0% | 100.0% | ||||||||||||||||||
Below is a reconciliation of the segment contribution margins to the consolidated income from operations:
|
Year Ended December 31, |
|||||||||||||||||||||||||||
|
Total Reportable Segment |
Other/Non-allocable (a) |
Total |
|||||||||||||||||||||||||
|
2014 |
2013 |
2012 |
2014 |
2013 |
2012 |
2014 |
2013 |
2012 |
|||||||||||||||||||
|
(In thousands) |
|||||||||||||||||||||||||||
|
Net sales |
$ |
54,154 |
$ |
52,268 |
$ |
45,128 |
$ |
3,960 |
$ |
4,204 |
$ |
3,646 |
$ |
58,114 |
$ |
56,472 |
$ |
48,774 | |||||||||
|
Cost of sales |
23,313 | 25,342 | 21,367 | 3,857 | 4,343 | 3,317 | 27,170 | 29,685 | 24,684 | ||||||||||||||||||
|
Gross margin |
30,841 | 26,926 | 23,761 | 103 | (139) | 329 | 30,944 | 26,787 | 24,090 | ||||||||||||||||||
|
Direct selling expense |
10,081 | 9,807 | 8,764 |
- |
- |
- |
10,081 | 9,807 | 8,764 | ||||||||||||||||||
|
Centralized selling expense |
- |
- |
- |
3,146 | 3,000 | 2,688 | 3,146 | 3,000 | 2,688 | ||||||||||||||||||
|
G&A expense/administrative service fee |
- |
- |
- |
10,249 | 9,270 | 7,273 | 10,249 | 9,270 | 7,273 | ||||||||||||||||||
|
Net (gain)/loss on disposals |
|||||||||||||||||||||||||||
|
of property and equipment |
- |
- |
- |
(1,553) | (649) | 262 | (1,553) | (649) | 262 | ||||||||||||||||||
|
Income from operations |
$ |
20,760 |
$ |
17,119 |
$ |
14,997 |
$ |
(11,739) |
$ |
(11,760) |
$ |
(9,894) |
$ |
9,021 |
$ |
5,359 |
$ |
5,103 | |||||||||
|
(a) Other/Non-allocable gross margin includes bulk wine and grape sales, event fees and retail sales. Other/Non-allocable expenses include centralized corporate expenses not specific to an identified reporting segment. |
|||||||||||||||||||||||||||
|
15. |
Commitments: |
The Company has certain property lease agreements that expire through 2022. These leases require annual base rent, supplemental rent based on the average market value of the grapes harvested, and certain operating expense payments. Future base rents required under these agreements are summarized as follows (in thousands):
|
2015 |
$ |
234 | ||
|
2016 |
219 | |||
|
2017 |
211 | |||
|
2018 |
217 | |||
|
2019 |
219 | |||
|
Thereafter |
108 | |||
|
$ |
1,208 |
F-16
Base rent expense was $49,000, $26,000 and $21,000 for the years ended December 31, 2014, 2013 and 2012, respectively. Estimated supplemental rent payments, which are based on the market value of harvested grapes, are presented in the grape and bulk wine purchase commitments below.
The Company has entered into long-term contracts through 2025 to purchase grapes and bulk wine from certain third parties and Seghesio family members who are employees of the Company. Total estimated commitments under these agreements are as follows (in thousands):
|
Third Party |
Related Party |
|||||||
|
2015 |
$ |
6,522 |
$ |
605 | ||||
|
2016 |
5,005 | 194 | ||||||
|
2017 |
3,412 | 194 | ||||||
|
2018 |
1,291 | 194 | ||||||
|
2019 |
932 |
- |
||||||
|
Thereafter |
3,078 |
- |
||||||
|
$ |
20,240 |
$ |
1,187 | |||||
The Company also purchases additional grapes and bulk wine under one-time purchase or short-term agreements. The total of all grapes and bulk wine purchased was $7,666,000, $6,929,000 and $6,544,000 for the years ended December 31, 2014, 2013 and 2012, respectively. Included in the totals previously stated are related party purchases of $579,000, $489,000 and $595,000 for the years ended December 31, 2014, 2013 and 2012, respectively.
|
16. |
Litigation: |
The Company and its subsidiaries may become parties to legal proceedings that are considered to be either ordinary, routine litigation incidental to their business or not significant to the Company’s consolidated financial position or liquidity. The Company does not believe that there is any pending litigation that could have a significant adverse impact on its consolidated financial position, liquidity or results of operations.
|
17. |
Selected Quarterly Financial Data (Unaudited): |
|
(In thousands, except per share amounts) |
First |
Second |
Third |
Fourth |
|||||||
|
Quarter |
Quarter |
Quarter |
Quarter |
||||||||
|
2014 |
|||||||||||
|
Net sales |
$ |
13,272 |
$ |
14,296 |
$ |
12,844 |
$ |
17,702 | |||
|
Gross profit |
$ |
7,002 |
$ |
8,197 |
$ |
6,940 |
$ |
8,805 | |||
|
Income from operations (a) |
$ |
1,718 |
$ |
3,911 |
$ |
1,565 |
$ |
1,827 | |||
|
Net income |
$ |
944 |
$ |
2,290 |
$ |
699 |
$ |
1,067 | |||
|
Basic and fully diluted earnings per common share |
$ |
0.04 |
$ |
0.09 |
$ |
0.03 |
$ |
0.04 | |||
|
Number of shares used in calculation |
24,458 | 24,458 | 24,458 | 24,458 | |||||||
|
2013 |
|||||||||||
|
Net sales |
$ |
12,006 |
$ |
15,221 |
$ |
12,486 |
$ |
16,759 | |||
|
Gross profit |
$ |
5,619 |
$ |
7,112 |
$ |
6,067 |
$ |
7,989 | |||
|
Income from operations (a) |
$ |
1,660 |
$ |
1,224 |
$ |
480 |
$ |
1,995 | |||
|
Net income |
$ |
967 |
$ |
1,245 |
$ |
407 |
$ |
4,489 | |||
|
Basic and fully diluted earnings per common share |
$ |
0.04 |
$ |
0.05 |
$ |
0.02 |
$ |
0.18 | |||
|
Number of shares used in calculation |
24,458 | 24,458 | 24,458 | 24,458 | |||||||
|
2012 |
|||||||||||
|
Net sales |
$ |
10,134 |
$ |
11,616 |
$ |
12,520 |
$ |
14,504 | |||
|
Gross profit |
$ |
5,160 |
$ |
5,724 |
$ |
6,912 |
$ |
6,294 | |||
|
Income from operations (a) |
$ |
851 |
$ |
891 |
$ |
2,611 |
$ |
750 | |||
F-17
|
Net income (loss) |
$ |
(376) |
$ |
(145) |
$ |
1,304 |
$ |
(572) | |||
|
Basic and fully diluted earnings (loss) per common share (b) |
$ |
(0.02) |
$ |
(0.01) |
$ |
0.05 |
$ |
(0.02) | |||
|
Number of shares used in calculation |
24,458 | 24,458 | 24,458 | 24,458 |
|
(a) |
Net (gain)/loss on the disposal of property and equipment previously reported was reclassified as a component of income from operations to conform with current year's presentation. |
|
|
(b) |
For 2012, the total of quarterly per share amounts does not equal the annual per share amount due to rounding. |
|
18. |
Subsequent events: |
The Company has evaluated subsequent events for disclosure through the date the financial statements were available to be issued.
F-18