Attached files
| file | filename |
|---|---|
| EX-32.1 - EXHIBIT 32.1 - PROCERA NETWORKS, INC. | ex32_1.htm |
| EX-23.2 - EXHIBIT 23.2 - PROCERA NETWORKS, INC. | ex23_2.htm |
| EX-21.1 - EXHIBIT 21.1 - PROCERA NETWORKS, INC. | ex21_1.htm |
| EX-31.1 - EXHIBIT 31.1 - PROCERA NETWORKS, INC. | ex31_1.htm |
| EX-23.1 - EXHIBIT 23.1 - PROCERA NETWORKS, INC. | ex23_1.htm |
| EX-31.2 - EXHIBIT 31.2 - PROCERA NETWORKS, INC. | ex31_2.htm |
| EXCEL - IDEA: XBRL DOCUMENT - PROCERA NETWORKS, INC. | Financial_Report.xls |
UNITED STATES
SECURITIES AND EXCHANGE COMMISSION
Washington, D.C. 20549
FORM 10-K
(Mark One)
| ☑ | ANNUAL REPORT PURSUANT TO SECTION 13 OR 15(d) OF THE SECURITIES EXCHANGE ACT OF 1934 |
For the fiscal year ended December 31, 2014
| ☐ | TRANSITION REPORT PURSUANT TO SECTION 13 OR 15(d) OF THE SECURITIES EXCHANGE ACT OF 1934 |
For the transition period from to.
Commission file number 001-33691
PROCERA NETWORKS, INC.
(Exact name of registrant as specified in its charter)
|
Delaware
|
|
33-0974674
|
|
(State or other jurisdiction of incorporation or organization)
|
|
(I.R.S. Employer Identification No.)
|
|
|
|
|
|
47448 Fremont Boulevard
|
|
94538
|
|
Fremont, California
|
|
(Zip Code)
|
|
(Address of principal executive offices)
|
|
|
Registrant’s telephone number, including area code: (510) 230-2777
Securities registered pursuant to Section 12(b) of the Act
|
Title of Each Class
|
|
Name of Each Exchange on Which Registered
|
|
Common Stock par value $0.001 per share
|
|
The NASDAQ Global Select Market
|
Securities registered pursuant to Section 12(g) of the Act:
None
Indicate by check mark if the registrant is a well-known seasoned issuer, as defined in Rule 405 of the Securities Act. Yes o No ☑
Indicate by check mark if the registrant is not required to file reports pursuant to Section 13 or Section 15(d) of the Act. Yes o No ☑
Indicate by check mark whether the registrant: (1) has filed all reports required to be filed by Section 13 or 15(d) of the Securities Exchange Act of 1934 during the preceding 12 months (or for such shorter period that the registrant was required to file such reports), and (2) has been subject to such filing requirements for the past 90 days. Yes þ No ☐
Indicate by check mark whether the registrant has submitted electronically and posted on its corporate Web site, if any, every Interactive Data File required to be submitted and posted pursuant to Rule 405 of Regulation S-T (§232.405 of this chapter) during the preceding 12 months (or for such shorter period that the registrant was required to submit and post such files). Yes þ No ☐
Indicate by check mark if disclosure of delinquent filers pursuant to Item 405 of Regulation S-K (§232.405 of this chapter) is not contained herein, and will not be contained, to the best of the registrant’s knowledge, in definitive proxy or information statements incorporated by reference in Part III of this Form 10-K or any amendment to this Form 10-K. þ
Indicate by check mark whether the registrant is a large accelerated filer, an accelerated filer, a non-accelerated filer, or a smaller reporting company. See the definitions of “large accelerated filer,” “accelerated filer” and “smaller reporting company” in Rule12b-2 of the Exchange Act. (Check one):
|
Large accelerated filer o
|
|
Accelerated filer þ
|
|
Non-accelerated filer o
(Do not check if a smaller reporting company)
|
|
Smaller reporting o
|
Indicate by check mark whether the registrant is a shell company (as defined in Rule 12b-2 of the Exchange Act). Yes o No ☑
The aggregate market value of the voting stock held by non-affiliates of the registrant on June 30, 2014, based upon the closing price of the common stock on such date as reported on the NASDAQ Global Market, was approximately $155,061,041. Shares of voting stock held by directors, officers and stockholders or stockholder groups whose beneficial ownership exceeds 5% of the registrant’s common stock outstanding have been excluded in that such persons may be deemed to be affiliates. The number of shares owned by stockholders whose beneficial ownership exceeds 5% was determined based upon information supplied by such persons and upon Schedules 13D and 13G, if any, filed with the Securities and Exchange Commission. This assumption regarding affiliate status is not necessarily a conclusive determination for other purposes.
The number of shares of common stock outstanding as of March 10, 2015 was 20,767,968.
DOCUMENTS INCORPORATED BY REFERENCE
Portions of the registrant’s Definitive Proxy Statement for its 2015 Annual Stockholders’ Meeting or an amendment to this Annual Report on Form 10-K to be filed with the Securities and Exchange Commission within 120 days of the registrant’s fiscal year ended December 31, 2014 are incorporated by reference into Part III of this Annual Report on Form 10-K.
PROCERA NETWORKS, INC.
FISCAL YEAR 2014
Form 10-K
ANNUAL REPORT
|
PART I
|
4
|
||
|
|
Item 1.
|
16
|
|
|
|
Item 1A.
|
31
|
|
|
|
Item 1B.
|
31
|
|
|
|
Item 2.
|
31
|
|
|
|
Item 3.
|
31
|
|
|
|
Item 4.
|
31
|
|
|
PART II
|
32
|
||
|
|
Item 5.
|
32
|
|
|
|
Item 6.
|
34
|
|
|
|
Item 7.
|
35
|
|
|
|
Item 7A.
|
49
|
|
|
|
Item 8.
|
50
|
|
|
|
Item 9.
|
78
|
|
|
|
Item 9A.
|
78
|
|
|
|
Item 9B.
|
80
|
|
|
PART III
|
80
|
||
|
|
Item 10.
|
80
|
|
|
|
Item 11.
|
87
|
|
|
|
Item 12.
|
100
|
|
|
|
Item 13.
|
102
|
|
|
|
Item 14.
|
103
|
|
|
PART IV
|
104 | ||
|
|
Item 15.
|
||
|
|
106
|
||
|
|
108
|
||
|
Exhibit 23.1
|
|||
|
|
Exhibit 23.2
|
|
|
|
|
Exhibit 31.1
|
|
|
|
|
Exhibit 31.2
|
|
|
|
|
Exhibit 32.1
|
|
|
In addition to historical information, this Annual Report on Form 10-K contains forward-looking statements regarding our strategy, financial performance and revenue sources that involve a number of risks and uncertainties, including those discussed under the title “RISK FACTORS” in Item 1A. Forward-looking statements in this report include, but are not limited to, those relating to our potential for future revenues; revenue growth and profitability; markets for our products; our ability to continue to innovate and obtain intellectual property protection; operating expense targets; liquidity; new product development; the possibility of acquiring (and our ability to consummate any acquisition of) complementary businesses, products, services and technologies; the geographical dispersion of our sales; expected tax rates; our international expansion plans; and our development of relationships with providers of leading Internet technologies. In some cases, you can identify forward-looking statements by terms such as “believe”, “expects”, “anticipates”, “intends”, “estimates”, “projects”, “target”, “goal”, “plans”, “objective”, “should”, or similar expressions or variations on such expressions.
While these forward-looking statements represent our current judgment on the future direction of our business, such statements are subject to many risks and uncertainties which could cause actual results to differ materially from any future performance suggested in this Annual Report on Form 10-K due to a number of factors, including, without limitation, our ability to produce and commercialize new product introductions; our ability to successfully compete in an increasingly competitive market; the perceived need for our products; our ability to convince potential customers of the value of our products; the costs of competitive solutions; our reliance on third party suppliers; continued capital spending by prospective customers and macro-economic conditions. Readers are cautioned not to place undue reliance on the forward-looking statements, which speak only as of the date of this Annual Report on Form 10-K. We undertake no obligation to publicly release any revisions or updates to forward-looking statements to reflect events, information or circumstances arising after the date of this document, except as required by federal securities laws. Therefore, you should not assume that our silence over time means that actual events are bearing out as expressed or implied in these forward-looking statements. See “RISK FACTORS” appearing in Item 1A.
Throughout this Annual Report on Form 10-K, we refer to Procera Networks, Inc., a Delaware corporation, as “Procera” or the “Company” and, together with its consolidated subsidiaries, as “we”, “our” and “us”, unless otherwise indicated. Any reference to “Netintact” refers collectively to our wholly owned subsidiaries, Procera Networks AB (formerly Netintact AB), a Swedish corporation, and Netintact, PTY, an Australian corporation.
PART I
We are a leading provider of Subscriber Experience Assurance, or SEA, solutions designed for network operators worldwide. Our PacketLogic solutions enable network operators to gain insights, make decisions, and take actions to ensure a high quality experience for Internet connected devices. Network operators deploy our technology to gain insights on their subscribers and networks, make decisions on service packaging and then deliver those solutions to subscribers connected to their network. We believe that the intelligence our products provide about subscribers and their experience enables our network operator customers to make better-informed business decisions and increases customer satisfaction in the highly competitive worldwide broadband market. Our network operator customers include service provider customers and enterprises. Our service provider customers include mobile service providers and broadband service providers, which include cable multiple system operators, or MSOs, telecommunications companies, Wi-Fi network operators, and Internet Service Providers, or ISPs. Our enterprise customers include educational institutions, commercial enterprises and government and municipal agencies. We sell our products directly to network operators; through partners, value added resellers and system integrators; and to other network solution suppliers for incorporation into their network solutions. Our products are delivered to network operators through pre-packaged hardware or as virtualized software, which we expect to become a larger part of our business going forward and open up new partnership opportunities.
Our SEA solutions are part of the high-growth market for mobile packet and broadband core and access products. This market is composed of three separate addressable market opportunities:
Deep Packet Inspection Market
Our products are sold either bundled with hardware or as pure software to deliver a solution that is a key element of the mobile packet and fixed broadband core ecosystems. Our solutions are often integrated with additional elements in the mobile packet and broadband core, including Policy Management and Charging functions, and are compliant with the widely adopted 3rd Generation Partnership Program, or 3GPP, standard. In order to respond to rapidly increasing demand for network capacity due to increasing subscribers and usage, service providers are seeking higher degrees of intelligence, optimization, network management, service creation and delivery in order to differentiate their offerings and deliver a high quality of experience to their subscribers. We believe the need to create more intelligent and innovative mobile and broadband networks will continue to drive demand for our products. We also sell our embedded Network Application Visibility Library, or NAVL, solutions to other network equipment vendors. Our embedded solutions enable network solutions suppliers to more quickly add application awareness to their platforms, since our NAVL Deep Packet Inspection, or DPI, engine products have been designed to be highly portable among many platforms and processors. NAVL eliminates the need for network solutions providers to research and develop their own DPI technology, saving significant time and resources while enabling them to more effectively compete in their market space. NAVL enables us to achieve indirect market share in the DPI market by supplying embedded solutions with our DPI engine. The market for DPI products was $887.0 million in 2014 and is expected to grow to just under $2.0 billion in 2018, a 2013–2018 compounded annual growth rate, or CAGR, of 22%.
Customer Experience Management (CEM) Market
In 2014, we introduced two significant products that increase our total addressable market: RAN Perspectives and our Insights Product Family. RAN Perspectives is a Subscriber Identity Module, or SIM-based applet, that a mobile operator can deploy on devices connected to their network. The applet will report the subscriber’s location and the signal strength and quality that their device has with the mobile network. This enables our solutions to have real-time location awareness and visibility into the Radio Access Network, or RAN, to complement our existing visibility into the broadband data network. Our Insights Product Family consists of unique visualization of our SEA solutions based on different roles inside of a network operator – Engineering, Customer Care, Marketing and Executives. By combining these two intelligence metrics, we are now competing in the Customer Experience Management, or CEM, market with companies such as Gigamon, NetScout, Ericsson, Huawei and other larger telecom vendors. MarketsandMarkets forecasts the CEM market to grow from $3.77 billion in 2014 to $8.39 billion in 2019. This represents a CAGR of 17.3% from 2014 to 2019.
Telecom Big Data Analytics Market
Procera’s Insights Product Family of products will compete with traditional big data products from companies such as IBM, Guavus and Zettics. Mind Commerce expects the Big Data driven telecom analytics market to grow at a CAGR of nearly 50% between 2014 and 2019. By the end of 2019, the market will eventually account for $5.4 billion in annual revenue.
Our products are marketed under the PacketLogic and NAVL brand names. We have a broad spectrum of products delivering SEA at the access, edge and core layers of the network. Our products are designed to offer maximum flexibility to our customers and enable differentiated services and revenue-enhancing applications, all while delivering a high quality of experience for subscribers. These products are offered as virtual or hardware appliances to customers, enabling them to choose their platform based upon their deployment needs and preferences.
On January 9, 2013, we completed our acquisition of Vineyard Networks Inc., or Vineyard, a privately held developer of Layer 7 DPI and application classification technology located in Kelowna, Canada. Vineyard’s integrated DPI and application classification technology provides enterprise and service provider networking infrastructure vendors with these capabilities through its integrated software suite, primarily through a variety of subscription-based original equipment manufacturer and partner agreements. This acquisition complements our hardware and application software-based DPI solutions, expands the way we sell solutions to customers, and increases our customer base, previously comprised primarily of network operators, thereby allowing us to provide complementary technology and solutions to a greater number of customers.
We were incorporated in the State of Nevada in 2002 and, in June 2013, we reincorporated from the State of Nevada to the State of Delaware. Our Company is headquartered in Fremont, California and we have key operating entities in Kelowna, Canada and Varberg, Sweden, as well as a geographically dispersed sales force. We sell our products through our direct sales force, resellers, distributors, system integrators and other equipment manufacturers in the Americas, Asia Pacific, Europe, the Middle East and Africa. Our corporate website address is www.proceranetworks.com. Investors may access our filings with the Securities and Exchange Commission, including our annual reports on Form 10-K, our quarterly reports on Form 10-Q, our current reports on Form 8-K and amendments to such reports on our website, free of charge, at www.proceranetworks.com, but the information on our website does not constitute part of this Annual Report on Form 10-K and is not incorporated by reference.
Industry Background
Network traffic has risen sharply in recent years as a result of the advent of ubiquitous broadband Internet Protocol, or IP, and mobile networks covering an increasing portion of the world’s population, the proliferation of sophisticated edge devices, including smartphones, tablets and laptops and the rise in connections, communications, social networking and data-intensive applications. According to the Cisco Visual Networking Index, globally, IP traffic will grow threefold from 2013 to 2018, a compound annual growth rate of 21%. Internet video is forecast to grow at a compound annual growth rate of 30%, up from 76.6 Exabytes per month in 2013. Mobile data traffic is forecast to reach 24 Exabytes per month in 2019, a compound annual growth rate of 57%.
Mobile data networks are an essential tool for consumers for streaming video, social networking and collaboration. Consumers are accessing content from multiple mobile broadband connections and have high expectations that this information will be available in real-time. Social networking, applications and entertainment content resides in the cloud in real-time and without quality access to the Internet, consumer access can be disrupted. Consumers are highly sensitive to disruptions and outages in mobile networks which can become headline news items. As networks advance in both speed and capacity, new advanced devices and applications will spur more competition for scarce bandwidth – including the Internet of Things, which is beginning to take hold through connected cars and other intelligent devices. This results in greater network congestion, causing network operators to balance subscriber demand for network bandwidth with the cost of building additional capacity. In addition, network providers must be able to adapt to evolving user behavior by rapidly introducing new services and business models to keep pace with demand, which we call service personalization. Our SEA solutions enable mobile and broadband network operators to provide high levels of personalization, service optimization, network assurance and rapid service creation to monetize network investments. Personalization is tailoring service plans to the needs of the consumer. For example, social networking users may judge Quality of Experience, or QoE, through their Facebook experience and video streamers may judge QoE by the speed and quality of Netflix or YouTube video downloads. A critical element for network operators to keep pace with demand and cope with evolving user behavior is to gain as much insight as possible into network activity at levels of detail that are not possible with existing routers, switches and broadband termination devices.
3GPP Policy Ecosystem
Within 3GPP, a framework has been defined for Policy Management and Policy Enforcement:
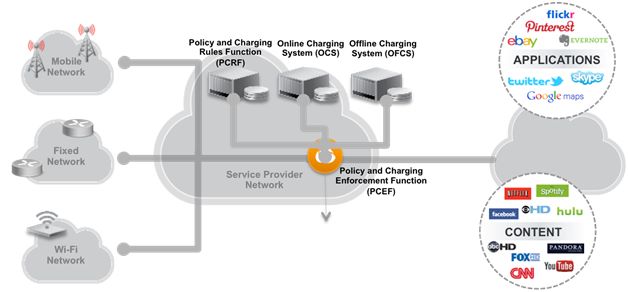
With the policy framework established by 3GPP, a management layer and an enforcement layer were created to control user behavior and network provisioning. The Policy and Charging Rules Function, or PCRF, was established as the policy decision point that establishes the policies that are applied to subscribers and mobile data traffic on the network. The Offline and Online Charging Systems (OFCS and OCS) were established as the charging entities on the network. The management layer on the network has specifically defined protocols for interacting with the network layer to translate the policy decisions into policy enforcement.
The policy enforcement layer on the network is designed to enforce policies as instructed by the policy management layer. However, different devices on the network have different levels of visibility and intelligence, translating to different capabilities for enforcing policies. More intelligent network elements can implement more sophisticated policies. Sophisticated policies go far beyond simple byte counters or session timers and can include subscriber, location, device and application awareness. Awareness gives a powerful advantage in the policy enforcement and billing ecosystem in that policy enforcement “instructions” for highly aware network elements can be much simpler than for “unaware” enforcement points. A contrasting example of this scenario would be if a PCRF is informed of congestion on a specific location, an intelligent policy enforcement point could be passed an instruction to “prioritize real-time applications at Site A”, where an unaware enforcement point would need to pass a number of new rules that might match specific devices and flows using access control lists, or a much less sophisticated congestion management policy that might make all users equally unsatisfied. The signaling load on the network normally will be considerably lower on an intelligent network than on an unaware network, as intelligent systems have a greater awareness of location, devices and applications for each active subscriber on the network.
Subscriber Experience
The broadband market is increasingly becoming a subscriber experience battleground. Incumbent operators are trying to retain their subscribers, and emerging competitive operators are trying to introduce disruptive billing models and an enhanced customer experience to poach subscribers. As the cost of re-acquiring subscribers can range from 5-7x the cost of acquiring a new subscriber, it is more important than ever for operators to ensure that they minimize customer losses while attracting as many high value subscribers as possible.
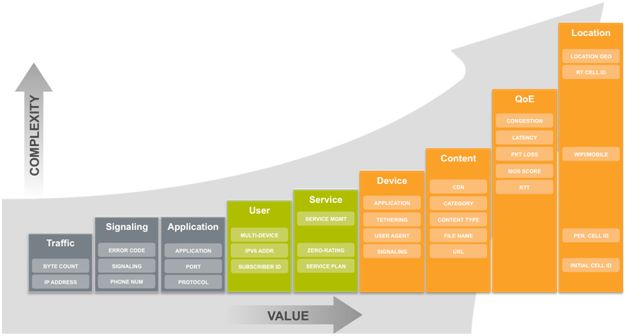
Our SEA solutions enable mobile and broadband network operators to provide exceptional levels of service to attract and maintain their subscriber base. SEA solutions use DPI technology as the core technology to gain awareness of subscribers, location, devices and applications. This awareness can then be used with an operator’s network to deliver superior collection of services and applications to mobile and broadband networks. This occurs in three distinct phases as operators deploy SEA solutions:
First, Operators Gain Insights from SEA solutions to understand the subscriber experience on their network. This intelligence ranges from very basic (traffic volume) to very sophisticated (location awareness), with each SEA metric adding specific value to the network operator’s network insights. Many of the more complex metrics add the most value, and therefore can have a greater impact on the ability of the operator to determine the real quality of experience delivered by their network:
With this information, network operators can Make Decisions on how to best package and deliver services to their subscribers. These decisions drive their overall business model, including how they will invest capital expenditures, or CAPEX, and operating expenses, or OPEX, to maintain their network as well as how they will offer services to their subscribers. Detailed insights enable them to tailor their service offerings to match the actual consumption of different subscriber groups through service personalization for maximizing revenue. It also allows them to optimize their return on investment on their capital by ensuring that investments in their network infrastructure have a direct impact on the subscriber experience. These decisions must combine the inputs of Engineering, Marketing, Customer Care, and Executives to ensure that the entire subscriber lifecycle is delivered with a high quality of experience. Each department must be presented with the relevant intelligence to their decision-making process, and that information must be tailored to their business needs. When these insights are presented visually with recommended actions, each department can move forward with their implementation plans.
Finally, the operators must take action to improve subscriber experience across their network and service offerings. This requires SEA solutions deployed in the network that can enforce policies at the same level of intelligence granularity that collected the initial subscriber experience intelligence. Enforcement must occur in real-time, as even momentary network issues are now visible to subscribers with services like streaming video, Voice over Internet Protocol, or VOIP, and social networking. Actions that can be taken on the network include congestion management, policy and charging, mitigation and traffic steering, each of which can be used to improve the subscriber experience.
Virtualization
Network Function Virtualization, or NFV, has been championed by network operators globally as a technology that will enable them to transform their networks into an agile infrastructure that is able to adapt to the changing landscape of broadband consumer usage.
In January 2013, the European Telecommunications Standards Institute, or ETSI, launched an initiative sponsored by seven of the largest operators in the world: AT&T, BT, Deutsche Telekom, Orange, Telecom Italia, Telefonica and Verizon to establish requirements and an architecture for the virtualization of network functions. Since that time it has grown to over 220 individual companies, including 37 of the world’s major service providers as well as representatives from both telecoms and IT vendors. The NFV member companies see tremendous potential in NFV for telecommunications deployments. The stated goals from the ETSI NFV initiative are focused around business benefits, but include potential solutions for challenges that may arise from the shift to commercial-off-the-shelf hardware from specialized hardware. The goals include reducing CAPEX through cost savings on hardware, reducing OPEX through cost savings on hardware (both support and through running multiple software packages on a single hardware platform), reducing time to market for new services through faster solution deployment on pre-positioned hardware platforms, and greater network flexibility through service orchestration technology. Network operators are demanding that solution providers of all types deliver their solutions in a virtualized offering, and this trend has the potential to shift the entire vendor landscape in the telecommunications market. Our technology is well suited for the shift to software-based solutions, and we believe we can take a leading role in the shift to virtualization for network operators.
In January 2013, the European Telecommunications Standards Institute, or ETSI, launched an initiative sponsored by seven of the largest operators in the world: AT&T, BT, Deutsche Telekom, Orange, Telecom Italia, Telefonica and Verizon to establish requirements and an architecture for the virtualization of network functions. Since that time it has grown to over 220 individual companies, including 37 of the world’s major service providers as well as representatives from both telecoms and IT vendors. The NFV member companies see tremendous potential in NFV for telecommunications deployments. The stated goals from the ETSI NFV initiative are focused around business benefits, but include potential solutions for challenges that may arise from the shift to commercial-off-the-shelf hardware from specialized hardware. The goals include reducing CAPEX through cost savings on hardware, reducing OPEX through cost savings on hardware (both support and through running multiple software packages on a single hardware platform), reducing time to market for new services through faster solution deployment on pre-positioned hardware platforms, and greater network flexibility through service orchestration technology. Network operators are demanding that solution providers of all types deliver their solutions in a virtualized offering, and this trend has the potential to shift the entire vendor landscape in the telecommunications market. Our technology is well suited for the shift to software-based solutions, and we believe we can take a leading role in the shift to virtualization for network operators.
Industry Growth Catalysts
According to Infonetics Research, the market for DPI products was $887.0 million in 2014 and is expected to grow to $2.0 billion in 2018, a 2013–2018 compounded annual growth rate of 22%. The increasing necessity for DPI will be spurred by growing subscriber demand for mobile content and applications, coupled with the network operators’ need to control usage, cost and create new personalized services. Growth will be aided in part by:
Increase in global broadband users – Broadband connectivity has become globally ubiquitous, particularly as underdeveloped and developing markets continue to gain increased broadband access. Global mobile broadband subscriptions passed 3.6 billion in 2014, and are predicted to grow to 4.6 billion by 2019. The number of unique devices (excluding machine-to-machine, or M2M) is forecasted to grow from 7.1 billion to a billion by 2020. We believe that the mobile network will continue to be the dominant broadband access network going forward. This increase in the number of broadband users is placing significant stress on bandwidth capacity. Network operators need to implement new tiered service plans and business models that utilize SEA solutions in order to effectively manage their user growth and deliver a high quality subscriber experience.
Device penetration – Mobile network operators have made significant investments in new technology to increase network performance and alleviate bandwidth congestion. At the same time, new mobile devices, including smartphones and tablets, are being introduced to take advantage of higher capacity 3G and LTE networks. IDC forecasts that mobile phones are expected to dominate overall device shipments, with 1.3 billion mobile phones shipped in 2014. It also forecasted that the worldwide tablet market will grow 47% with lower average selling prices attracting new users. Unlike legacy devices, new smartphones and tablets are designed to take advantage of data-intensive services, like video and gaming, which will deplete available capacity. In addition, The Internet of Things is beginning to take hold, with connected cars, mobile payments, and wearables making significant inroads in 2014, and will continue to become more pervasive in the future. Mobile network operators will need to continue to adopt SEA solutions that provide more sophisticated network insights and actions and include subscriber, location, device and application awareness.
Competitive pressure across network operators – The competition among network operators continues to increase as they battle for the latest generation of broadband users and seek to capture new revenue opportunities. It is incumbent upon network operators to upgrade their networks while they simultaneously improve user experience to grow their subscriber bases. Network operators who adapt best to the evolving requirements of their users with more flexible business models and service plans should be well positioned to attract and retain subscribers. In order to do so, we believe that operators will need to integrate SEA solutions into their existing network infrastructure.
Industry Challenges
The industry also faces a number of challenges as an increasing amount of bandwidth is necessary to run increasingly sophisticated and data-intense applications. These network operator challenges include:
De-coupling of usage and revenue – In recent years, network capacity and service speeds have increased along with progressively sophisticated edge devices connected to the network such as smartphones, tablets and laptops, resulting in a tremendous surge of network traffic. A large catalyst of this surge is the ease of capture, ingestion and delivery of video, coupled with emerging business models for video publishing. In addition, new business models and the increasing popularity of applications have turned mobile handsets into mobile entertainment devices. However, this surge in traffic has not been accompanied by a similar rise in revenue in large part due to unlimited usage subscriptions and application models that have circumvented the service provider billing systems, excluding the service providers’ revenue participation.
Multiple devices per user – As mobile connectivity becomes more pervasive, users in developed markets are increasingly adopting sophisticated devices. In addition to smartphones, a typical user can have multiple devices connected to the network, including tablets, e-readers, netbooks, laptops, televisions, gaming devices, digital music players, cameras, wearables, cars, and more. Machine-to-machine connectivity is becoming pervasive on the mobile network, further increasing the number of connected devices. This incremental device population is increasing traffic on the network, often without a proportional revenue increase.
New data-intensive applications – The advent of smartphones and tablets has enabled an ecosystem of applications that are increasing in popularity among users. Many of these applications are free to download and use, but are very data-intensive. Social networking applications in particular have led to constant subscriber connectivity and frequent information synchronization, which translates to higher session counts per user. Apple’s Siri and iCloud applications have dramatically increased background mobile data traffic for Apple devices and the increasing use of cloud-based services will only continue to drive bandwidth usage up on a per user basis.
Limited service differentiation – Mobile and broadband network operators have been limited in their ability to view and identify network traffic, which has therefore limited their ability to appropriately charge and differentiate themselves by offering advanced services. LTE mobile networks have begun to shift the charging models from unlimited to tiered service offerings, and many operators are adding more differentiation in their service offerings to accommodate both light and heavy users of applications, and offering value to high volume users of streaming services and social networking through many of their service plans.
Our Technology
The foundational element of our SEA solutions is our Datastream Recognition Definition Language, or DRDL, which is Procera’s core DPI technology. DRDL facilitates a broad range of criteria to properly identify the application of each individual datastream. The identification relies on bidirectional information, including header information, protocol, actual payload and other distinguishing characteristics of an application. This allows DRDL to properly identify even encrypted applications, which are becoming the norm on networks today.
The standard-syntax language of DRDL enables rapid development of new signatures. The DRDL database currently consists of over 2,300 signatures. DRDL interconnects control and data sessions of protocols like File Transfer Protocol, or FTP, VOIP and streaming media. During the identification process, DRDL aggregates detailed traffic properties like Multipurpose Internet Mail Extensions, or MIME, type, filename, chat channel and Session Initiation Protocol, or SIP, caller ID. A unique and integral feature of DRDL is the classification function. Connection flags classify the traffic based on its behavior. Typical classifications are “interactive”, “streaming”, “random-looking” and “bulky”. This classification system enables network operators to set preferences on unidentifiable traffic or when they need to be application agnostic.
We believe that our technology has several advantages that we extend to our mobile and broadband network operator customers, including:
Radical Simplicity – We believe our solutions are more powerful for service creation and service delivery than competitive solutions without sacrificing ease-of-use. Our Insights products are targeted at specific audiences inside the operator, and require little customization.
Service Flexibility – Our DRDL technology allows for a high degree of service flexibility. Our subscriber model is highly configurable to meet the varying needs of our customer base. We also enable our customers to provide mass personalization for their subscriber base, creating and delivering services based on individual customer needs and behaviors.
Granular Accuracy – We also provide deep visibility into our customers’ networks, enabling visibility to a subscriber level to determine location and device usage to enable a high degree of personalization and customer service. This also allows our customers to enforce policies on their network. RAN Perspectives and the Insights Product Family are especially notable in this area, with each providing unique details about subscriber connections that are not commonly available from other network intelligence solutions.
Performance & Scalability – We believe that our DRDL technology is robust and has industry-leading performance that supports millions of subscribers and tens of thousands of transactions per second.
Real-Time Analytics – All of our analytics are delivered in real-time, providing up-to-the-second visibility to our customers of subscriber location, behavior and activity. This allows our customers to deliver a high degree of QoS to their subscribers and manage network capacity. Our report studio technology delivers detailed business intelligence and reports, and has deep application visibility.
Virtualization – We believe that our software technology was designed as pure software, and as a result, has adapted to the NFV market shift faster than any of our competitors. We were the first to announce and demonstrate NFV based solutions, and our NFV solutions have a higher level of demonstrated performance than any other competitor to date.
Our Products & Solutions
We deliver SEA solutions for network operators, leveraging our industry-leading DRDL technology. Our solutions empower network operators with the ability to support more subscribers and services on their network with high performing and highly-scalable SEA systems. Our SEA solutions support deep levels of awareness and a broad universe of applications, enabling richer services to be offered to consumers. Our analytics and decision-making solutions provide highly targeted business intelligence reports that enable service providers to better understand consumer trends and rapidly respond to the dynamic subscriber experience landscape.
Product Lines
Our SEA solutions consist of four main product offerings that we market today:
Perspectives: Perspectives represents the Gain Insights component of the SEA solution. Each PacketLogic Perspective provides unique intelligence on the network and subscriber activity. The intelligence from each Perspective can be used for both analytics as well as enforcement throughout the PacketLogic solutions. The perspectives offered by Procera include:
| - | Traffic: Application awareness (i.e. classic DPI capabilities) |
| - | Subscriber: Subscriber awareness gained through integration with Business Support/Operational Support/Policy systems |
| - | RAN: Radio Access Network location and quality awareness from 3GPP signaling |
| - | Topology: Cable, Digital Subscriber Line, or DSL, fiber optics and WiFi location awareness through various Operational Support Systems integrations |
| - | Content: Uniform Resource Locator, or URL, categorization in real time of up to 100M URLs through various databases |
| - | Device: Device awareness through DPI and device database integrations |
| - | Routing: Peering awareness through integration with BGP signaling |
| - | Video: Over-the-top content and Managed Video service awareness through DPI on video traffic |
Presentation: Presentation represents the Make Decisions component of the SEA solution. The intelligence gathered in the PacketLogic Perspectives is presented to different audiences inside the network operator depending on when and how they need to see that data. The Presentation products offered by Procera include:
| - | Engineering Insights: Engineering-centric presentation on network and subscriber intelligence showing typical application and content consumption, subscriber tiering, peering usage and quality, network trends and forecasts, and location-specific usage and quality measurements |
| - | Customer Care Insights: Single-subscriber views designed to provide first-line customer care with a complete picture of a subscriber’s usage and network quality, including potential root cause analysis of issues that the customer may be experiencing |
| - | LiveView: A real-time view of the network designed for network engineers, with network segmentation by different perspectives (subscriber, application, location, service plans, etc.) that can be drilled down to a single subscriber session |
Products: Products represent the Take Action component of the SEA solutions. The products that we offer to the market today are:
| - | Statistics: Collection and storage of the statistical intelligence gleaned by Perspectives |
| - | Policy and Charging: Enforcement based on charging or policies set by PacketLogic or other integrations |
| - | Congestion Management: Managing congestion in the network through fair usage or sophisticated queuing and policing capabilities |
| - | Traffic Steering: Intelligent mirroring or service chaining based upon subscriber, application, service, or device characteristics to 3rd party services |
Platforms: Platforms represent the deployment form factor of software in the Procera solutions. The Platforms that we offer today include:
| - | PacketLogic/V: Virtual Platform for NFV deployments that can be packaged as equivalent to the PacketLogic appliances |
| - | PL20000: Up to 600 billions of bits per second, or Gbps, and ten million subscribers |
| - | PL9000: Up to 120Gbps and three million subscribers |
| - | PL8000: Up to 70Gbps and three million subscribers |
| - | PL7000: Up to 5Gbps and five hundred thousand subscribers |
Network Application Visibility Library – NAVL is Procera’s embedded DPI software engine that provides real-time, Layer-7 classification of network traffic. Running on popular processors and operating systems, NAVL allows integrators to remain focused on core competencies while implementing industry-leading DPI functionality from Procera in their products. The resultant savings in time-to-market and variable labor costs is significant. NAVL provides superior performance in application identification and metadata extraction enabling throughput levels of up to 4-8Gbps per core or processor, depending on configuration. Using a wide variety of inspection techniques including: surgical pattern matching, conversation semantics, protocol dissection, behavioral and statistical analysis, as well as future flow awareness and association, NAVL is among one of the most advanced technologies available for core DPI applications.
Product Benefits
Our solutions provide many benefits to our customers, including the following:
Superior Accuracy – Our proprietary DRDL and NAVL software solution allows us to provide our customers with a high degree of application identification accuracy and the flexibility to regularly update our software to keep up with the rapid introduction of new applications.
Higher Scalability – Our family of products is scalable from a few hundred megabits to 600 gigabits of traffic per second, up to 10 million subscribers and up to 480 million simultaneous data flows, which is critical to service providers as they upgrade to LTE (enabling higher bandwidth mobile phone networks), FTTX (high bandwidth fiber to the home or neighborhood used by telecom broadband network providers) and DOCSIS 3.0 (a high bandwidth broadband cable standard) technologies in the access network. NAVL, our software DPI engine, scales linearly with the number of processors and cores through its zero-copy, no-lock approach to data acquisition and inspection.
Platform Flexibility – Our PacketLogic products are deployable in many locations in the network and leverage off-the-shelf hardware or virtualized environments. Our products can rapidly leverage advances in computing technology which we believe to be a better solution than those that are dependent upon specific network silicon processors or hardware platforms. NAVL, our software DPI engine, is deployed on all industry standard platforms and operating systems.
Drop-in Simplicity – The NAVL product provides a software DPI solution that can be implemented simply on a broad array of processors and operating systems with little or no customization. The easy-to-use API ensures that integration partners can be up and running quickly in a matter of days compared to competitive offerings that often require weeks of integration planning and project management.
Global Services
Our products and solutions are supported by our Global Services team that provides a suite of services that include both pre- and post-sales technical services to our direct field sales organization, channel partners and customers; professional services for planning, implementation and deployment; customer services for support post-deployment; training for our customers to maximize use of our SEA products and solutions; and consulting services to assist in all service phases from initial planning and evaluation to onsite testing and operation. Customers also have access to the technical support team via a web-based partner portal, email and interactive chat forum. Issues are logged and tracked using a computerized tracking system that provides automatic levels of escalation and quick visibility into problems by our Research and Development organization. This tracking system also provides input to our development team for new feature requests from our worldwide customer base.
Limitations of Alternative Solutions
We believe that current generation DPI products available in the market have significant deficiencies, perhaps the greatest of which is their limited ability to accurately identify traffic types and applications. Because these DPI products provide limited visibility into traffic flows, they provide a limited ability to manage network traffic. First-generation DPI products were a good start at introducing network operators to the value of network visibility, and introduced the opportunity to provide some level of differentiated services. As applications have become more complex and increasingly web-based, differentiating between applications has become more challenging to products that have limited application signatures used to identify network traffic and less sophisticated application identification mechanisms.
Growth Strategy
Our goal is to become the leading provider of SEA solutions to mobile and broadband network operators on a global scale. We believe our PacketLogic and NAVL solutions position us to effectively compete for a larger share of the growing DPI market, as well as enter the Customer Experience Management and Telco Big Data markets. Additionally, our NAVL products provide an additional route to market for DPI technology through our integration partners and customers. We plan to achieve our strategic growth objectives through the following efforts:
Expand our technology advantage – Our technology was designed with the ability to rapidly identify new application signatures, and thereby adapt to a dynamic IP network environment across multiple hardware platforms. We are further developing our products and solutions based on feedback from our customers and industry experts as well as our ongoing research and development of technology, products and solutions that we believe will add value to our customers. We currently intend to build upon our innovations, continue to release leading-edge products with state-of-the-art capabilities and regularly release new solution features and performance upgrades. Our recent release of our patent-pending RAN Perspectives solution is an example of our organic innovations that has enabled us to enter new markets.
Expand our customer footprint with leading mobile and broadband network operators – Our PacketLogic and NAVL product lines provide us with a solution that can address the network needs of leading mobile and broadband network operators. We have built a team with deep network operator experience, both from a technology perspective and from selling to network operators. We have experienced significant traction in the network operator space, and these achievements have provided us with improved access to potential customers and valuable references, which we believe will continue to enhance our sales growth effort. In addition, we intend to increase our indirect distribution channel. We currently intend to utilize existing value added reseller partners and add new partners to increase our ability to address geographic regions and a greater quantity of customers. Our NAVL product has been implemented in a number of OEM products that serve the mobile and broadband market, thereby ensuring further adoption of our technology.
Pursue new partnerships – We currently intend to establish partnerships with complementary mobile packet core ecosystem vendors to increase the value we can provide and gain additional access to leading mobile and broadband network operators. Where feasible from a business as well as technical perspective, we intend to provide broader solutions by bundling our products with complementary products and technologies from other solution providers. We believe that the flexibility of our software platform gives us the potential to efficiently integrate with complementary solutions and thereby deliver greater benefits to our customers and enhance our ability to compete against competitors whose solutions are more hardware constrained. We believe that the push to virtualization will open up partnership opportunities for Procera, and we have already begun to partner with larger vendors as a result of our NFV progress.
Maximize opportunities with existing customers by increasing our share within their network footprint – We will continue to seek to increase our market share within our existing customers’ networks by expanding our product footprint within these networks. Typically, our first order from a new network operator represents a small portion of their total network as measured by either a single product function or by geography. We believe we can successfully sell additional solutions to our existing customers following their initial purchase as they realize the benefits of our products and seek to extend their SEA capabilities throughout their networks. In addition, many service providers operate dual networks (i.e., mobile and broadband) and in these instances, we believe there are opportunities for us to offer our solutions for each network. We have many captive mobile and broadband network operators that are well positioned to increase service creation and network performance. We believe we are well positioned to experience significant growth with these customers as they build out their capabilities and infrastructure.
Customers
We sell our products and solutions both directly and indirectly to our end-customers. As of December 31, 2014, we had customers in over 80 countries, representing approximately 700 customers throughout the world. Our customers are mobile and broadband network operators, which include cable MSOs, telecommunications companies, Wi-Fi operators and ISPs. Our enterprise customers include educational institutions, commercial enterprises and government and municipal agencies. Our service provider customers serve subscriber customers and enterprise customers operating private networks to optimize their internal networks.
Our current customers and anticipated future customers include the following:
Mobile Network Operators – Mobile network operators are constrained by the bandwidth of their wireless signals and infrastructure. Additional upgrades in bandwidth and network infrastructure are immediately consumed by new applications and devices that place greater stress on the network. Managing network traffic and broadband usage more intelligently can greatly improve QoE for subscribers and save significant resources for network operators.
MSOs – Multi-system operators, or MSOs, are constrained by the bandwidth of their network and the varying number of users connecting to any given loop in the network. Controlling network traffic by application type can greatly improve the quality of the experience of the average subscriber.
Fixed-Line Telecommunications Network Operators – Fixed-line telecommunications network operators use fiber infrastructure or DSL to offer broadband services to end customers. Many fixed-line telecommunications network operators also operate mobile networks and provide either bundled service to end customers or mobile and broadband service on a stand-alone basis. These service bundles are increasingly including video services as networks increase in capacity and capabilities. Adding intelligence to their networks can help them offer differentiated services.
Wi-Fi Operators – Wi-Fi operators offer Wi-Fi connectivity in many locations around the world. These offerings may be from standalone Wi-Fi operators, or be a combined offering from a mobile, fixed, or cable operator using Wi-Fi to complement their existing service offering and extend their connectivity reach for the operator.
ISPs – ISPs generally lease, rather than own, access infrastructure. They compete by attempting to offer the best of breed Internet service. ISPs’ greatest competitive advantages are brand and customer relationships. Our SEA solutions can improve the performance of ISPs by making the use of their bandwidth more efficient and by allowing them to offer best of breed quality.
Education, Business and Government Entities – Education institutions generally provide Internet access to students, faculty and employees. Education institutions are particularly vulnerable to low QoS for legitimate educational purposes because students frequently have made extensive use of high-bandwidth applications such as peer-to-peer services. Businesses and government entities rely on large and complex networks for communication infrastructure. They typically rely on service providers for Internet access and interconnectivity, and can use SEA to optimize the use of their expensive network resources, prioritize business critical applications and limit leisure or unauthorized use of expensive network resources.
Telecommunications and Enterprise Network Equipment Manufacturers – Network equipment and software manufacturers serving the enterprise and service provider markets can implement NAVL for application identification and metadata extraction. In so doing, these companies cut their development cycle and speed time to market while maintaining focus and energy on their core value proposition. To date, companies with solutions in all categories of this segment have implemented DPI purchased from Procera and demand continues to grow across numerous product types including but not limited to: Routers, Switches, Firewalls, intrusion detection and prevention systems, SIMs, security information and event management, Gateways and unified threat management.
For the year ended December 31, 2014, no single customer accounted for more than 10% of net revenues. For the year ended December 31, 2013, revenue from three customers, Shaw Communications, Inc., British Telecommunications plc and Itochu Techno-Solutions Corp. represented 13%, 12% and 10% of net revenues, respectively, with no other single customer accounting for more than 10% of net revenues. For the year ended December 31, 2012, revenue from one customer, Shaw Communications, Inc., represented 16% of net revenues, with no other single customer accounting for more than 10% of net revenues.
Foreign Operations
Sales made to customers located outside the United States as a percentage of total net revenues were 83%, 77% and 67% for the years ended December 31, 2014, 2013 and 2012, respectively. Revenues derived from foreign sales generally are subject to additional risks such as fluctuations in exchange rates, tariffs, the imposition of other trade barriers and potential currency restrictions. To date, however, we have experienced no significant negative impact from such risks. Further information regarding our foreign operations, as required by Item 101(d) of Regulation S-K, can be found in the Consolidated Financial Statements and related notes herein.
Business Segments and Geographic Information
We have one reportable operating segment. Our Chief Operating Decision Maker, our Chief Executive Officer, evaluates our performance and makes decisions regarding allocation of resources based on certain metrics including segment revenue, gross profit and certain operating income (loss) measures. See Note 16 – “Segment Information and Revenue by Geographic Region” of the Notes to Consolidated Financial Statements for details.
Partners
We have established critical technology, distribution and business partnerships to further promote our brand and suite of solutions for network operators. We believe these partnerships provide an immediate opportunity to extend our capabilities into adjacent, complementary points within the mobile packet core and broadband core. For example, we entered into a joint solution with one of our key technology partners that provides integrated policy management and PCRF functionality on top of our DPI platform – Revenue Express.
Competition
The market for our products and services is highly competitive as mobile and broadband network operators seek to manage the rapid growth of data on both broadband and mobile networks. Our primary competitors include:
| · | Allot Communications Ltd.; |
| · | Blue Coat Systems, Inc.; |
| · | Brocade Communications Systems, Inc.; |
| · | Cisco Systems, Inc.; |
| · | Citrix Systems, Inc. (acquired Bytemobile); |
| · | Ericsson; |
| · | F5 Networks, Inc.; |
| · | Gigamon; |
| · | Huawei Technologies Co., Ltd.; |
| · | Qosmos; |
| · | Science Applications International Corporation (acquired Cloudshield Technologies); |
| · | Sandvine Corporation; and |
| · | NetScout (acquired Tektronix, Inc.). |
We also face competition from vendors supplying platform products with some limited DPI functionality, such as switches and routers, session border controllers and VoIP switches. In addition, we face competition from large integrators that package third-party DPI solutions into their products, including Alcatel-Lucent and Ericsson. It is possible that these companies will develop their own DPI solutions or strategically acquire existing competitor DPI vendors in the future.
Most of our competitors are larger and more established enterprises with substantially greater financial and other resources. Some competitors may be willing to reduce prices and accept lower profit margins to compete with us. As a result of such competition, we could lose market share and sales, or be forced to reduce our prices to meet competition. However, we do not believe there is a dominant supplier in our market. Based on our belief in the superiority of our technology, we believe that we have an opportunity to increase our market share and benefit from what we believe will be growth in the DPI market.
Our primary method of differentiation from our competition is the breadth of the intelligence we can obtain, which comes from our DRDL technology as well as our new sources of intelligence like RAN Perspectives, which does not rely on only our traditional solutions. However, we also believe we effectively compete with respect to price and service. Our products now address service provider requirements ranging from 1 megabit (edge applications) to the 600 gigabit per second market (core applications).
Backlog
Our sales are made primarily pursuant to standard purchase orders for the delivery of products. Quantities of our products to be delivered and delivery schedules may vary based on changes in customers’ needs or circumstances. Customer orders generally can be cancelled, modified or rescheduled on short notice without significant penalty to the customer. In addition, most of our revenue in any quarter depends on customer orders for our products that we receive and fill in the same quarter. For these reasons, our backlog as of any particular date is not representative of actual sales for any succeeding period, and therefore we believe that backlog is not necessarily a reliable indicator of our future revenue trends.
Sales and Marketing
We use a combination of direct sales and channel partnerships to sell our products and services. As of December 31, 2014, we had 46 employees in sales and many independent channel partners worldwide. We also engage a worldwide network of value added resellers to reach particular geographic regions and markets.
Our marketing organization is focused on building our brand awareness, managing channel marketing efforts and supporting our sales force in additional capacities. As of December 31, 2014, we had 13 marketing professionals globally.
Research and Development
We have built a team of skilled software programmers who continue to develop enhancements to our PacketLogic modules and proprietary DRDL and NAVL processing software engines. We have enhanced our products with features and functionality to address the needs of mobile and broadband network operators, as well as to provide new functionality for network protection and subscriber management. As of December 31, 2014, we had 79 employees in research and development. Historically, substantially all of our research and development has been performed by our employees in Sweden. On January 9, 2013, we acquired Vineyard in Canada to expand our research and development efforts and enhance stability and disaster recovery capabilities. Our research and development costs were $16.7 million, $17.5 million, and $7.5 million for the years ended December 31, 2014, 2013 and 2012, respectively.
Intellectual Property
Our intellectual property is central to our competitive position and our future success will depend on our continued ability to protect our core technologies. We believe that our DRDL signature compiler, and the inherent complexity of our software-based PacketLogic and NAVL solutions, makes it difficult to copy or replicate our features. We rely primarily on patent law, trademark law, copyright law, trade secret law and contractual rights to protect our intellectual property rights in our proprietary software. To help ensure this protection, we include proprietary information and confidentiality provisions in our agreements with customers, third parties and employees.
Manufacturing
We purchase our hardware from a select group of supplier partners. We have negotiated minimum production quantities and lead times in our contracts to prevent supply shortages. We or our supplier partners will then load our proprietary software for specific orders, final testing and fulfillment. We believe that our process allows us to focus on development of our PacketLogic and NAVL software solutions, reduce manufacturing costs and more quickly adjust to changes in demand. We have not historically experienced any production capacity shortages and do not foresee a need to alter our process in the future.
We source completed hardware boards and chassis included in our products from leading industry suppliers, including Advantech Technologies Inc., Lanner Electronics, Inc., Dell Inc. and RadiSys Corporation. The hardware used in our products is comprised of standard components which are less susceptible to supply shortages and significant lead times. We believe our reliance on standard hardware components facilitates quicker time to market, rapid design cycles and the ability to take advantage of the latest semiconductor industry advances.
Employees
As of December 31, 2014, we had a total of 204 employees and 22 full-time independent contractors. As of December 31, 2014, we had 39 operations and technical support employees, 79 research and development employees, 59 sales and marketing employees and 27 general and administrative employees. As of December 31, 2014, our headcount was 52 employees in the United States, 83 employees in Sweden, 37 employees in Canada, seven employees in the United Kingdom, and a total of 25 employees in Malaysia, Hong Kong, Japan, Singapore, Austria, Australia, France, Germany, Korea, Argentina, Brazil, Russia, Spain, Taiwan, Thailand, South Africa and the United Arab Emirates.
Executive Officers of the Company
Set forth below are the name, age, position(s) and a description of the business experience of each of our executive officers as of December 31, 2014:
|
Name
|
|
Age
|
|
Position(s)
|
|
Employee
Since
|
|
James F. Brear
|
|
49
|
|
President, Chief Executive Officer and Director (Principal Executive Officer)
|
|
2008
|
|
Charles Constanti
|
|
51
|
|
Vice President, Chief Financial Officer and Secretary (Principal Financial & Accounting Officer)
|
|
2009
|
James F. Brear joined us as our President, Chief Executive Officer and a member of our Board of Directors in February 2008. Mr. Brear is a Silicon Valley industry veteran with more than 20 years of experience in the networking industry, most recently as Vice President of Worldwide Sales and Support for Bivio Networks, a maker of deep packet inspection platform technology, from July 2006 to January 2008. From September 2004 to July 2006, Mr. Brear was Vice President of Worldwide Sales for Tasman Networks (acquired by Nortel), a maker of converged WAN solutions for enterprise branch offices and service providers for managed WAN services. From April 2004 to July 2004, Mr. Brear served as Vice President of Sales at Foundry Networks, a provider of switching, routing, security and application traffic management solutions. Earlier in his career, Mr. Brear was the Vice President of Worldwide Sales for Force10 Networks (acquired by Dell) from March 2002 to April 2004, during which time the company grew from a pre-revenue start-up to the industry leader in switch routers for high performance Gigabit and 10 Gigabit Ethernet. In addition, he spent five years with Cisco Systems from July 1997 to March 2002 where he held senior management positions in Europe and North America with responsibility for delivering more than $750 million in annual revenues selling into the world’s largest service providers. Previously, Mr. Brear held a variety of sales management positions at both IBM and Sprint Communications. He is a member of the Young Presidents Organization (YPO) and holds a Bachelor of Arts degree from the University of California at Berkeley.
Charles Constanti joined us as our Chief Financial Officer in May 2009 and has over 25 years of public company financial experience. Most recently, Mr. Constanti was the vice president and CFO of Netopia, Inc., a NASDAQ-listed telecommunications equipment and software company, from April 2005 until its acquisition in February 2007 by Motorola, Inc., where he subsequently held a senior finance position until May 2009. From May 2001 to April 2005, Mr. Constanti was the vice president and corporate controller of Quantum Corporation, for which he earlier served in different accounting and finance positions since January 1997. Previously, Mr. Constanti held various finance positions at BankAmerica Corporation and was an auditor for PricewaterhouseCoopers. Mr. Constanti is an inactive certified public accountant. He earned a B.S., magna cum laude, in Accounting from Binghamton University.
Significant Employees of the Company
Set forth below are the name, age, position and a description of the business experience of each of our significant employees as of December 31, 2014:
|
Name
|
|
Age
|
|
Position
|
|
Employee
Since
|
|
Alexander Haväng
|
|
36
|
|
Chief Technical Officer
|
|
2006
|
|
Andy Lovit
|
|
54
|
|
Senior Vice President Global Sales and Services
|
|
2014
|
Alexander Haväng has been our Chief Technology Officer since August 2006 when we acquired Netintact AB. Mr. Haväng was a founder of Netintact AB, which was formed in August 2000. Mr. Haväng is responsible for our strategic technology direction. Mr. Haväng is widely known and a respected authority in the open source community, and is the lead architect for PacketLogic. Earlier in his career, Mr. Haväng was one of the chief architects for the open source streaming server software Icecast, along with the secure file transfer protocol GSTP. Mr. Haväng studied computer science at the Linköping University in Sweden.
Andy Lovit joined us as our Senior Vice President Global Sales and Services in September 2014 and brings more than 25 years of sales and executive management technology leadership experience to Procera. Mr. Lovit joined Procera from Fortress Solutions, where he served as the Senior Vice President of Global Field Operations from November 2012 to September 2014. Prior to Fortress Solutions, Mr. Lovit served as Senior Vice President and General Manager Americas for ATEME SA, an advanced video compression solutions provider, from September 2011 to November 2012. Prior to ATEME SA, Mr. Lovit served as Vice President of Worldwide Field Operations for Bivio Networks, which provided DPI Cyber Security Solutions to Global Service Providers and Governments from September 2008 to September 2011. Prior to Bivio Networks, Mr. Lovit served as Vice President of Worldwide Sales for AirTight Networks, Inc., a wireless security solutions provider, from July 2007 to August 2008. Prior to AirTight Networks, Mr. Lovit served as Senior Vice President of Service Provider Sales for Ericsson’s Multimedia/Television Group, which acquired TANDBERG Television from March 2006 to July 2007. Prior to Ericsson Multimedia/Television Group (TANDBERG Television), Mr. Lovit was Vice President of Global Sales and Field Operations for SkyStream Networks from January 2003 to March 2006 where he successfully grew revenue, which resulted in SkyStream Networks being acquired by TANDBERG Television. He has also held executive management positions at Paradyne Corporation, Onetta (acquired by Bookham Technologies), Mayan Networks, and 3Com. Mr. Lovit holds a Bachelor of Science degree in Business Administration from The Ohio State University.
Available information
Our annual reports on Form 10-K, our quarterly reports on Form 10-Q and our current reports on Form 8-K, and all amendments to those reports, filed or furnished pursuant to Section 13(a) or 15(d) of the Securities Exchange Act of 1934, as amended, are available free of charge on our website at www.proceranetworks.com as soon as reasonably practicable after we electronically file such reports with the Securities and Exchange Commission, or the SEC. Information contained in, or accessible through, our website is not incorporated by reference into and does not form a part of this report.
The SEC also maintains a website containing reports, proxy and information statements, annual filings and other relevant information available free of charge to the public at www.sec.gov.
You should carefully consider the risks described below, together with all of the other information included in this Annual Report on Form 10-K, in considering our business and prospects. Set forth below and elsewhere in this report and in other documents we file with the SEC are descriptions of the risks and uncertainties that could cause our actual results to differ materially from the results contemplated by the forward-looking statements contained in this report. Additional risks and uncertainties not presently known to us or that we currently deem immaterial also may impair our business operations. Each of these risk factors could adversely affect our business, operating results and financial condition, as well as adversely affect the value of an investment in our common stock.
Risks Related to Our Business
We have a limited operating history on which to evaluate our Company.
The products we sell today are derived primarily from the products of the Netintact companies that we acquired in 2006. We are continually working to improve our operations on a combined basis.
Furthermore, we have only recently launched many of our products and services on a worldwide basis, and we are continuing to develop relationships with distribution partners and otherwise exploit sales channels in new markets. Therefore, investors should consider the risks and uncertainties frequently encountered by companies in new and rapidly evolving markets, which include the following:
| · | successfully introducing new products and entering new markets; |
| · | successfully servicing and upgrading new products once introduced; |
| · | increasing brand recognition; |
| · | developing strategic relationships and alliances; |
| · | managing expanding operations and sales channels; |
| · | successfully responding to competition; and |
| · | attracting, retaining and motivating qualified personnel. |
If we are unable to address these risks and uncertainties, our results of operations and financial condition may be adversely affected.
Our actual operating results may differ significantly from our guidance and investor expectations.
From time to time, we may release guidance in our earnings releases, earnings conference calls or otherwise, regarding our future performance that represents our management’s estimates as of the time of release of the guidance. Any such guidance, which will include forward-looking statements, will be based on projections prepared by our management.
Projections are based upon a number of assumptions and estimates that, while presented with numerical specificity, are inherently subject to significant business, economic and competitive uncertainties and contingencies, many of which are beyond our control. These projections are also based upon specific assumptions with respect to future business decisions, some of which will change. We may state possible outcomes as high and low ranges, which are intended to provide a sensitivity analysis as variables are changed but are not intended to indicate that actual results could not fall outside of the suggested ranges. The principal reason why we may release guidance is to provide an opportunity for our management to discuss our business outlook with analysts and investors. With or without our guidance, analysts and other investors may publish their own expectations regarding our business, financial performance and results of operations. We do not accept any responsibility for any projections or reports published by any such third persons.
Guidance is necessarily speculative in nature, and it can be expected that some or all of the assumptions underlying the guidance furnished by us will not materialize or will vary significantly from actual results. Accordingly, our guidance is only an estimate of what our management believes is realizable as of the time of release. Actual results will vary from our guidance, and the variations may be material. If our actual performance does not meet or exceed our guidance or investor expectations, the trading price of our common stock may decline.
In addition, historically we have received, and in the future we may receive, a material portion of a quarter’s sales orders during the last two weeks of the quarter. Accordingly, there is a risk that our revenue may move from one quarter to the next, or not be realized at all, if we cannot fulfill all of the orders and satisfy all the revenue recognition criteria under our accounting policies before the quarter ends. If completed purchase orders are not obtained in a timely manner, our products are not shipped on time, we fail to manage our inventory properly, we fail to release new products on schedule or we are unable to fulfill orders for any other reason, our revenue for that quarter could fall below our expectations or those of securities analysts and investors, which may result in a decline in our stock price.
Our PacketLogic family of products is our primary product line. A substantial majority of our current revenues and a significant portion of our future growth depend on our ability to continue its commercialization.
A substantial majority of our current revenues and much of our anticipated future growth depend on the development, introduction and market acceptance of new and enhanced products in our PacketLogic product line that address additional market requirements in a timely and cost-effective manner. In the past, we have experienced delays in product development and such delays may occur in the future. Our future growth will largely be determined by market acceptance and continued development of our PacketLogic product line.
If additional customers do not adopt, purchase and deploy our PacketLogic products, our revenues will not grow and may decline. In addition, should our prospective customers fail to recognize, or our current customers lose confidence in, the value or effectiveness of our PacketLogic product line, the demand for our products and services will likely decline. Any significant price compression in our targeted markets as a result of newly introduced solutions could have a material adverse effect on our business. Moreover, when we announce new products or product enhancements that have the potential to replace or shorten the life cycle of our existing products, customers may defer purchasing our existing products. These actions could harm our operating results by unexpectedly decreasing sales and exposing us to greater risk of product obsolescence.
Marketing and sales of our products to large broadband service providers often involve a lengthy evaluation and sales cycle, which may cause our revenues to fluctuate from period to period and could result in us expending significant resources without making any sales.
Our sales cycles often are lengthy because our prospective customers generally follow complex procurement procedures and undertake significant testing to assess the performance of our products within their networks. As a result, we may invest significant time from initial contact with a prospective customer before that customer decides to purchase and incorporate our products in its network. We may also expend significant resources attempting to persuade large broadband service providers to incorporate our products into their networks without any measure of success. Even after deciding to purchase our products, initial network deployment and acceptance testing of our products by a large broadband service provider may last several years. Network operators, especially in North America, often require that products they purchase meet Network Equipment Building System, or NEBS, certification requirements, which relate to the reliability of telecommunications equipment. While our PacketLogic products and future products are and are expected to continue to be designed to meet NEBS certification requirements, they may fail to do so, and any failure to meet NEBS certification requirements could have a material adverse impact on our ability to sell our products.
Due to our lengthy sales cycle, particularly to larger customers, and our revenue recognition practices, we expect our revenue may fluctuate significantly from period to period. In pursuing sales opportunities with larger enterprises, we expect that we will make fewer sales to larger entities, but that the magnitude of individual sales will be greater. We may report substantial revenue growth in the period that we recognize the revenue from a large sale, which may not be repeated in an immediately subsequent period. Because our revenues may fluctuate materially from period to period, the price of our common stock may decline. In addition, even after we have received commitments from a customer to purchase our products, in accordance with our revenue recognition practices, we may not be able to recognize and report the revenue from that purchase for months or years after the time of purchase. As a result, there could be significant delays in our receipt and recognition of revenue following sales orders for our products.
In addition, if a competitor succeeds in convincing a prospective customer to adopt that competitor’s product, it may be difficult for us to displace the competitor at a later time because of the cost, time, effort and perceived risk to network stability involved in changing to a different vendor’s products. As a result, we may incur significant sales and marketing expenses without generating any sales.
We need to increase the functionality of our products and offer additional features in order to be competitive.
The market in which we operate is highly competitive and unless we continue to enhance the functionality of our products by adding additional features, our competitive position may deteriorate and the average selling prices for our products may decrease over time. Such a decrease also could result from the introduction of competing products or from the standardization of Deep Packet Inspection, or DPI, technology. To counter this trend, we endeavor to enhance our products by offering higher system speeds and additional performance features, such as additional protection functionality, supporting additional applications and enhanced reporting tools. We may also need to reduce our per unit manufacturing costs at a rate equal to or faster than the rate at which selling prices may decline. If we are unable to reduce these costs or to offer increased functionality and features, our results of operations and financial condition may be adversely affected.
If we fail to effectively manage our inventory, we could have excess inventory or experience inventory shortages, which could result in decreased revenue and gross margins and harm our business.
In determining the required quantities of our products to produce, we must make significant judgments and estimates based on inventory levels, market trends and other related factors. Because of the inherent nature of estimates, there could be significant differences between our estimates and the actual amounts of inventory we require. This could result in shortages if we fail to anticipate demand, or excess inventory and write-offs if we order more inventory than we need or if anticipated sales do not occur.
In addition, at any time, a significant amount of our inventory may be located off-site at customer locations while our customers evaluate and conduct trials of our products. If these trials do not result in sales of our products, we may need to take inventory charges or fully write-off such inventory. Additionally, inventory levels in excess of customer demand may result in inventory write-downs, and the sale of excess inventory at discounted prices could significantly impair our brand recognition and have an adverse effect on our business, results of operations or financial condition.
A substantial portion of our revenues may be dependent on a small number of Tier 1 service providers that purchase in large quantities. If we are unable to maintain or replace our relationships with these customers, our revenues may fluctuate and our growth may be limited.
Since 2008, when we first sold our products to Tier 1 service providers, a significant portion of our revenue has come from a limited number of customers. There can be no guarantee that we will be able to continue to achieve revenue growth from these customers because their capacity requirements have become or will become fulfilled. Additionally, we cannot guarantee that any customer will place follow-on orders after fulfillment of current orders. For this reason, we do not expect that any single customer will remain a significant customer from year to year, and we will need to attract new customers in order to sustain our revenues. Moreover, our current customers may cancel orders or their agreements with us. Order cancellations could adversely affect our product sales and revenues and, therefore, harm our business and results of operations.
For the year ended December 31, 2014, no single customer accounted for more than 10% of net revenues. For the year ended December 31, 2013, revenue from three customers, Shaw Communications, Inc., British Telecommunications plc and Itochu Techno-Solutions Corp. represented 13%, 12% and 10% of net revenues, respectively, with no other single customer accounting for more than 10% of net revenues. For the year ended December 31, 2012, revenue from one customer, Shaw Communications, Inc., represented 16% of net revenues, with no other single customer accounting for more than 10% of net revenues.
In any future year or quarter, the proportion of our revenues derived from a limited number of customers may be higher than in prior periods. If we cannot maintain or replace the customers that purchase large amounts of our products, or if they do not purchase products at the levels or at the times that we anticipate, our ability to maintain or grow our revenues will be adversely affected.
Changes in customer or product mix, downward pressure on sales prices, changes in volume of orders and other factors could cause our gross margin percentage to fluctuate or decline in the future.
Our gross profit margins have fluctuated from period to period, and these fluctuations are expected to continue in the future. Within the last three years, our gross profit margin has fluctuated from 49% for the three months ended September 30, 2013 to 72% for the three months ended September 30, 2012. Factors that may cause our gross margins to fluctuate include customer and product mix, market acceptance of our new products, competitive pricing dynamics, geographic and/or market segment pricing strategies, decreases in average selling prices of our products, our ability to successfully develop new products and our ability to manage manufacturing, labor and materials costs. A higher proportion of hardware sales versus software and service revenue in any period generally results in a lower gross profit margin for that period. In addition, our industry has been characterized by declining product prices over time, and we are under continuous pressure to reduce our prices to increase or even maintain our market share. Forecasting our gross margins is difficult due to our lengthy sales cycle, particularly with respect to larger customers, and our revenue recognition practices. Because our gross profit margins may fluctuate materially from period to period, or decline over time, the price of our common stock may decline.
We operate in a highly competitive market and may be unable to compete effectively with competitors which are substantially larger and more established and have greater resources.
In our rapidly evolving and highly competitive market, we compete on the price as well as the performance of our products. We expect competition to remain intense in the future. Increased competition could result in reduced prices and gross margins for our products and loss of market share, and could require us to increase spending on research and development, sales and marketing and customer support, any of which could have a negative financial impact on our business. We compete with Allot Communications Ltd., Tektronix, Inc. (acquired Arbor Networks), Blue Coat Systems, Inc., Brocade Communications Systems, Inc., Cisco Systems, Inc., Citrix Systems, Inc. (acquired Bytemobile), Science Applications International Corporation (acquired Cloudshield Technologies), Ericsson, F5 Networks, Inc., Huawei Technologies Co., Ltd. and Sandvine Corporation, as well as other companies which sell products incorporating competing technologies. In addition, our products and technology compete with other types of products that offer monitoring capabilities, such as probes and related software. We also face indirect competition from companies that offer broadband service providers increased bandwidth and infrastructure upgrades that increase the capacity of their networks, which may lessen or delay the need for bandwidth management solutions.
Most of our competitors are substantially larger than we are and have significantly greater name recognition and financial, sales and marketing, technical, manufacturing and other resources and more established distribution channels than we do. In addition, some prospective customers have in the past advised us that their concerns about our financial condition disqualified us from competing successfully for their business. It is possible that one or more prospective customers could raise similar concerns in the future. We may not be able to compete successfully against our current or potential competitors as our competitors may, among other things, be able to respond more rapidly to new or emerging technologies and changes in customer requirements or devote greater resources to the development, promotion and sale of their products than we can. Furthermore, prospective customers often have expressed greater confidence in the product offerings of our competitors. Additional competitors may enter our existing or future markets with solutions that may be less expensive, provide higher performance or provide additional features than our solutions. Given the opportunities in the bandwidth management solutions market, we also expect that other companies may enter the market with alternative products and technologies, which could reduce the sales or market acceptance of our products and services, perpetuate intense price competition or make our products obsolete. If any technology that is competing with ours is or becomes more reliable, higher performing, less expensive or has other advantages over our technology, then the demand for our products and services would decrease, which would harm our business.
Competition for experienced and skilled personnel is intense and our inability to attract and retain qualified personnel could significantly damage our business.
Our future performance will depend to a significant extent on the ability of our management to operate effectively, both individually and as a group. We are dependent on our ability to attract, retain and motivate high caliber key personnel. Our growth expectations will require us to attract experienced personnel to augment our current staff. We expect to continue to recruit experienced professionals in such areas as software and hardware development, sales, technical support, product marketing and management. We may expand our indirect channel partner program in the future and we would need to attract qualified business partners to broaden these sales channels. In our market, there is significant competition for qualified personnel and we may not be able to attract and retain such personnel. Our business may suffer if we encounter material delays in hiring additional personnel.
Our performance is substantially dependent on the continued services and on the performance of our executive officers and other key employees, including our Chief Executive Officer, James Brear, and our Chief Technical Officer, Alexander Haväng. The loss of the services of any of our executive officers or other key employees could materially and adversely affect our business. In addition, our engineering department is based in Varberg, Sweden, and many of our engineers were formerly employees of Netintact, which we acquired in 2006. In January 2013, we acquired Vineyard and we now employ many former Vineyard engineers and product developers in Kelowna, Canada. We are continuing to develop plans to integrate the Canadian and Swedish engineering teams, and this integration effort may result in changes to current job responsibilities. If some or all of our Sweden-based engineers or Canada-based engineers or product developers were no longer employed by us, our ability to develop new products and serve existing customers could be materially and adversely impacted, and our results of operations and financial condition could be negatively affected.
We believe we will need to attract, retain and motivate talented management and other highly skilled employees in order to execute on our business plan. We may be unable to retain our key employees or attract, assimilate and retain other highly qualified employees in the future. Competitors and others have in the past, and may in the future, attempt to recruit our employees. In California, where we are headquartered, non-competition agreements with employees generally are unenforceable. As a result, if an employee based in California leaves our Company for any reason, he or she will generally be able to begin employment with one of our competitors or otherwise compete immediately against us.
We currently do not have key person insurance in place. If we lose one of our key officers, we would need to attract, hire and retain an equally competent person to take his or her place. There is no assurance that we would be able to find such an employee in a timely fashion. If we fail to recruit an equally qualified replacement or incur a significant delay, our business plans may slow down. We could fail to implement our strategy or lose sales and marketing and development momentum.
Mergers or other strategic transactions involving our competitors could weaken our competitive position, limit our growth prospects or reduce our revenues.
We believe that there may be consolidation in our industry, which could lead to increased price competition and other forms of competition. Increased competition may cause pricing pressure and loss of market share, either of which could have a material adverse effect on our business, may limit our growth prospects or reduce our revenues and margins. Our competitors may establish or strengthen cooperative relationships with strategic partners or other parties. Established companies may not only develop their own products but may also merge with or acquire our current competitors as a means of entering our markets. New competitors or alliances among competitors may emerge and rapidly acquire significant market share. Any of these circumstances could materially and adversely affect our business and operating results.
If we are unable to effectively manage our anticipated growth, we may experience operating inefficiencies and have difficulty meeting demand for our products.
We seek to manage our growth so as not to exceed our available capital resources. If our customer base and market grow rapidly, we would need to expand to meet this demand. This expansion could place a significant strain on our management, products and support operations, sales and marketing personnel and other resources, which could harm our business.
If demand for our products and services grows rapidly, we may experience difficulties meeting the demand. For example, the installation and use of our products require customer training. If we are unable to provide adequate training and support for our products, the implementation process will be longer and customer satisfaction may be lower. In addition, we may not be able to exploit fully the growing market for our products and services, and our competitors may be better able to satisfy this demand. We cannot assure you that our systems, procedures or controls will be adequate to support the anticipated growth in our operations. The failure to meet the challenges presented by rapid customer and market expansion could cause us to miss sales opportunities and otherwise have a negative impact on our sales and profitability.
We may not be able to install management information and control systems in an efficient and timely manner, and our current or planned personnel, systems, procedures and controls may not be adequate to support our future operations.
A currently pending proxy contest could cause us to incur substantial costs, divert management's attention and resources, and have an adverse effect on our business.
On February 25, 2015, Tristan Partners L.P., a stockholder that, together with a group of affiliated stockholders, claims to collectively own approximately 1.5% of our outstanding common stock, nominated eight individuals for election to our Board of Directors at our 2015 Annual Meeting of Stockholders. In addition, on February 26, 2015, Castle Union Partners, L.P., a stockholder that, together with a group of affiliated stockholders, claims to collectively own approximately 6.6% of our outstanding common stock, nominated five individuals for election to our Board of Directors at our 2015 Annual Meeting of Stockholders.
As a result of these pending proxy contests, our business could be adversely affected because responding to proxy contests and reacting to other proposals from stockholders can be costly and time-consuming, disrupt our operations and divert the attention of management and our employees. We have retained the services of various professionals to advise us on these matters, including legal, financial and communications advisors, the costs of which may negatively impact our future financial results. In addition, perceived uncertainties as to our future direction, strategy or leadership created as a consequence of these and any similar stockholder initiatives may result in the loss of potential business opportunities, harm our ability to attract new investors and business partners, and cause our common share price to experience periods of volatility or stagnation. Moreover, if new individuals are elected to our Board of Directors with a specific agenda, it may adversely affect our ability to effectively and timely implement our current initiatives, retain and attract experienced executives and employees, and execute on our long-term strategy.
We have limited ability to protect our intellectual property and defend against claims, which may adversely affect our ability to compete.
We rely primarily on patent law, trademark law, copyright law, trade secret law and contractual rights to protect our intellectual property rights in our PacketLogic product line. We cannot assure you that the actions we have taken will adequately protect our intellectual property rights or that other parties will not independently develop similar or competing products that do not infringe on our intellectual property rights. We enter into confidentiality or license agreements with our employees, consultants and corporate partners, and take appropriate measures to control access to and distribution of our software, documentation and other proprietary information. Despite our efforts to protect our proprietary rights, unauthorized parties may attempt to copy or otherwise misappropriate or use our products or technology.
In an effort to protect our unpatented proprietary technology, processes and know-how, we require our employees, consultants, collaborators and advisors to execute confidentiality agreements. These agreements, however, may not provide us with adequate protection against improper use or disclosure of confidential information. These agreements may be breached, and we may not become aware of, or have adequate remedies in the event of, any such breach. In addition, in some situations, these agreements may conflict with, or be subject to, the rights of third parties with whom our employees, consultants, collaborators or advisors have previous employment or consulting relationships. Furthermore, others may independently develop substantially equivalent proprietary information and techniques or otherwise gain access to our trade secrets. Additionally, in some cases, customers have the right to request access to our source code upon demand. Some of our customers have obtained the source code for our products by exercising this right, and others may do so in the future. In addition, some of our customers have required us to deposit the source code of our products into a source code escrow. The conditions triggering the release of the escrowed source code vary by customer, but include, among other things, breach of the applicable customer agreement, failure to provide required product support or maintenance, or if we are subject to a bankruptcy proceeding or otherwise fail to carry on our business in the ordinary course. Disclosing the content of our source code may limit the intellectual property protection we can obtain or maintain for that source code or the products containing that source code and may facilitate intellectual property infringement claims against us. It also could permit a customer to which source code is disclosed to support and maintain that software product without being required to purchase our support or maintenance services. Each of these could harm our business, results of operations and financial condition.
Our industry is characterized by the existence of a large number of patents and frequent claims and related litigation regarding patent and other intellectual property rights. This type of litigation often is very costly and can continue for a lengthy period of time. If we are found to infringe on the proprietary rights of others, or if we agree to settle any such claims, we could be compelled to pay damages or royalties and either obtain a license to those intellectual property rights or alter our products so that they no longer infringe upon such proprietary rights. Any license could be very expensive to obtain or may not be available at all. Similarly, changing our products or processes to avoid any claims of infringement may be costly or impractical. Litigation resulting from claims that we are infringing the proprietary rights of others, or litigation that we initiate to protect our intellectual property rights, could result in substantial costs and a diversion of resources from sales and/or development activities, and could have a material adverse effect on our results of operations and financial condition.
Furthermore, the laws of foreign countries may not protect our intellectual property rights to the same extent as the laws of the U.S. If we fail to apply for intellectual property protection or if we cannot adequately protect our intellectual property rights in these foreign countries, our competitors may be able to compete more effectively against us, which could have a material adverse effect on our results of operations and financial condition.
Acquisitions may divert management’s attention, increase expenses and disrupt or otherwise have a negative impact on our business.
We may seek to acquire or make investments in complementary businesses, products, services or technologies on an opportunistic basis when we believe they will assist us in executing our business strategy. Growth through acquisitions has been a viable strategy used by other network control and management technology companies. We acquired the Netintact entities in 2006, and its products have formed the core of our current product offering. In January 2013, we acquired Vineyard Networks Inc., or Vineyard, a company based in Kelowna, Canada. We have integrated the employees of Vineyard into our organizational structure, and we are developing plans for further product and organizational integration, which will require both time and investment to accomplish. Any failure to properly integrate the personnel or technology we hire or acquire, including successfully maintaining cohesive technology development in distant locations, could have an adverse effect on us and our results of operations. Any future acquisitions that we may pursue could distract or divert the attention of our management and employees and cause us to incur various expenses related to identifying, investigating and pursuing suitable acquisitions, whether or not they are consummated.
Following any acquisition, the integration of the acquired business, product, service or technology is complex, time consuming and expensive, and may disrupt our business. These challenges include the timely and efficient execution of a number of post-transaction integration activities, including:
| · | integrating the operations and technologies of the two companies; |
| · | retaining and assimilating the key personnel of each company; |
| · | retaining existing customers of both companies and attracting additional customers; |
| · | leveraging our existing sales channels to sell new products into new markets; |
| · | developing an appropriate sales and marketing organization and sales channels to sell new products into new markets; |
| · | retaining strategic partners of each company and attracting new strategic partners; and |
| · | implementing and maintaining uniform standards, internal controls, processes, procedures, policies and information systems. |
The process of integrating operations and technology could cause an interruption of, or loss of momentum in, our business and the loss of key personnel. The diversion of management’s attention and any delays or difficulties encountered in connection with an acquisition and the integration of our operations and technology could have an adverse effect on our business, results of operations or financial condition. Furthermore, the execution of these post-transaction integration activities will involve considerable risks and may not come to pass as we envision. The inability to integrate the operations, technology and personnel of an acquired business with ours, or any significant delay in achieving integration, could have a material adverse effect on our results of operations and financial condition and, as a result, on the market price of our common stock.
We may not achieve the desired benefits from our acquisitions, including the revenue and other synergies and growth that we anticipate from the acquisition in the timeframe that we originally expect, and the costs of achieving these benefits may be higher than what we originally had anticipated because of a number of risks, including, but not limited to, the possibility that the acquisition may not further our business strategy as we expected and the possibility that we may not be able to expand the reach and customer base for current and future products as expected. For example, during the third quarter of fiscal year 2014, we recorded a partial impairment of the NAVL intangible assets and a full impairment of the NAVL reporting unit goodwill, which were acquired through our acquisition of Vineyard in January 2013. As a result of these risks, our acquisitions may not immediately contribute to our earnings as expected, or at all, we may not achieve expected revenue synergies or realization of efficiencies related to the integration of the businesses when expected, or at all, and we may not achieve the other anticipated strategic and financial benefits of the acquisitions.
We are in the process of expanding our research and development group and implementing new strategic initiatives. If we are not successful in implementing these initiatives, or if these initiatives do not result in the intended benefits, our operating results could suffer.
We have recently embarked upon several new initiatives that are designed to expand our product offerings and our addressable market. These initiatives include: (1) RAN Perspectives, a Radio Access Network awareness solution, to gain device and location intelligence that will compete with a new set of probe and Customer Experience Assurance solutions, (2) Video Perspectives, a new Video Intelligence offering that will compete with Big Data solutions, and (3) Network Function Virtualization versions of our PacketLogic products that will change our business model to shift more towards software sales rather than hardware combined with software. We will need to expend a significant amount of time and cost to develop and implement these initiatives, including adding key resources in research and development and marketing. Moreover, we may experience unanticipated difficulties or delays in implementing these initiatives, and we may not complete these initiatives on our expected timetable, if at all, or within our projected budget. Furthermore, there can be no assurance that these initiatives, once implemented, will improve our business or our financial performance, and we may incur expenses without the benefit of higher revenues. If we are unable to successfully implement these initiatives or fail to do so on a timely basis, or if these initiatives do not provide us with the intended benefits, our results of operations and financial condition will be adversely affected.
If our products contain undetected software or hardware errors or performance deficiencies, we could incur significant unexpected expenses, experience purchase order cancellations and lose sales.
Network products frequently contain undetected software or hardware errors, failures or bugs when new products or new versions or updates of existing products are released to the marketplace. Because we frequently introduce new versions and updates to our product line, previously unaddressed errors in the accuracy or reliability of our products, or issues with their performance, may arise. We expect that such errors or performance deficiencies will be found from time to time in the future in new or existing products, including the components incorporated therein, after the commencement of commercial shipments. These problems may have a material adverse effect on our business by requiring us to incur significant warranty repair costs and support related replacement costs, diverting the attention of our engineering personnel from new product development efforts, delaying the recognition of revenue and causing potentially significant customer relations problems.
In addition, if our products are not accepted by customers due to software or hardware defects or performance deficiencies, orders contingent upon acceptance may be cancelled or deferred until we have remedied the defects, which could result in lost sales opportunities or delayed revenue recognition. In this circumstance, or if warranty returns exceed the amount we have accrued for defect returns based on our historical experience, our results of operations and financial condition may be adversely affected.
Our products must properly interface with products from other vendors. As a result, when problems occur in a computer or communications network, it may be difficult to identify the sources of these problems. The occurrence of hardware and software errors, whether or not caused by our products, could result in the delay or loss of market acceptance of our products and any necessary revisions may cause us to incur significant expenses. The occurrence of any such problems would likely have a material adverse effect on our results of operations and financial condition.
We have incurred losses in previous periods and may incur losses in future periods.
We had an accumulated deficit of $94.0 million as of December 31, 2014. We may incur losses from operations in future periods. The profitability we achieved in the years ended December 31, 2012 and 2011 were the first in our history and may not be indicative of profitability in future periods. In addition, our sales and marketing, research and development and certain other costs have been increasing in recent years and we may not be able to manage this growth in costs effectively. Any losses incurred in the future may result from increased costs related to continued investments in sales and marketing, product development and administrative expenses and/or less than anticipated revenues. Furthermore, if our revenue growth does not continue or is slower than anticipated, or our operating expenses exceed expectations, our results of operations and financial condition may be adversely affected.
Failure to expand our sales teams or educate them about technologies and our product families may harm our operating results.
The sale of our products requires a multi-faceted approach directed at several levels within a prospective customer’s organization. We may not be able to increase net revenue unless we expand our sales teams to address all of the customer requirements necessary to sell our products. We expect to continue hiring in sales and marketing, but there can be no assurance that personnel additions will have a positive effect on our business.
If we are not able to successfully integrate new employees into our Company or to educate current and future employees with regard to rapidly evolving technologies and our product families, our results of operations and financial condition may be adversely affected.
Increased customer demands on our technical support services may adversely affect our relationships with our customers and our financial results.
We offer technical support services with our products because they are complex and time consuming to implement. We may be unable to respond quickly enough to accommodate short-term increases in customer demand for support services. We also may be unable to modify the format of our support services to compete with changes in support services offered by our competitors. Further customer demand for these services, without increases in corresponding revenues, could increase costs and adversely affect our operating results. If we experience financial difficulties, do not maintain sufficiently skilled workers and resources to satisfy our contracts, or otherwise fail to perform at a sufficient level under these contracts, the level of support services to our customers may be significantly disrupted, which could materially harm our relationships with these customers and our results of operations.
We must continue to develop and increase the productivity of our indirect distribution channels to increase net revenue and improve our operating results.
A key focus of our distribution strategy is developing and increasing the productivity of our indirect distribution channels through resellers and distributors. If we fail to develop and cultivate relationships with significant resellers, or if these resellers are not able to execute on their sales efforts, sales of our products may decrease and our operating results could suffer. Many of our resellers also sell products from other vendors that compete with our products. We cannot assure you that we will be able to enter into additional reseller and/or distribution agreements or that we will be able to manage our product sales channels. Our failure to take any of these actions could limit our ability to grow or sustain revenue. In addition, our operating results will likely fluctuate significantly depending on the timing and amount of orders from our resellers. We cannot assure you that our resellers and/or distributors will continue to market or sell our products effectively or continue to devote the resources necessary to provide us with effective sales, marketing and technical support. Such failure would negatively affect our ability to generate revenue and our potential to achieve profitability.
We rely on a small number of suppliers for our hardware products. If we are unable to have our products manufactured quickly enough to keep up with demand or we experience manufacturing quality problems, our operating results could be harmed.
If the demand for our products grows, we will need to increase our capacity for material purchases, production, testing and quality control functions. Any disruptions in product flow could limit our revenue growth, adversely affect our competitive position and reputation and result in additional costs or cancellation of orders under agreements with our customers.
While our PacketLogic products are software-based, we rely on independent suppliers to manufacture the hardware components on which our products are installed and operate. In certain circumstances, these suppliers also provide logistics services, which may include loading our software products onto the hardware platforms, testing and inspecting the products, and then shipping them directly to our customers. If these suppliers are unable to meet our demand, or fail to provide such logistics services as we may request in a timely manner, we may experience delays in product shipments. Other performance problems with suppliers may arise in the future, such as inferior quality, insufficient quantity of products or the interruption or discontinuance of operations of a supplier, any of which could have a material adverse effect on our business and operating results.
We do not know whether we will effectively manage our suppliers or whether these suppliers will meet our future requirements for timely delivery of product components of sufficient quality and quantity. If one or more of our suppliers were to experience financial difficulties or decide not to continue its business relationship with us, we would need to identify other suppliers to perform these services, and there could be product delivery delays while we seek to establish and implement the new relationship. We also plan to introduce new products and product enhancements, which will require that we rapidly achieve volume production by coordinating our efforts with those of our suppliers. Any delays in meeting customer demand or quality problems resulting from the inability of our suppliers to provide us with adequate supplies of high-quality product components, including problems relating to logistic services, could result in lost or reduced future sales to key customers and could have a material adverse effect on our sales and results of operations.
As part of our cost management efforts, we endeavor to lower per unit product costs from our suppliers by means of volume efficiencies that utilize manufacturing sites in lower-cost geographies. However, we cannot be certain when or if such cost reductions will occur. The failure to obtain such cost reductions would adversely affect our gross margins and operating results.
If our suppliers fail to adequately supply us with certain original equipment manufacturer, or OEM, sourced components, our product sales may suffer.
Reliance upon OEMs, as well as industry supply conditions, generally involves several additional risks, including the possibility of a shortage of components and reduced control over delivery schedules (which can adversely affect our distribution schedules) and increases in component costs (which can adversely affect our profitability). Most of our hardware products, or the components of our hardware components, are based on industry standards and are therefore available from multiple manufacturers. If our suppliers were to fail to deliver, alternative suppliers should be available, although qualification of the alternative manufacturers and establishment of reliable suppliers could result in delays and a possible loss of sales, which could adversely affect our operating results. However, in some specific cases we have single-sourced components because alternative sources are not currently available. If these components were not available for a period of time, we could experience product supply interruptions, delays or inefficiencies, which could have a material adverse effect on our results of operations and financial condition.
We have operations outside of the United States and a significant portion of our customers and suppliers are located outside of the United States, which subjects us to a number of risks associated with conducting international operations.
We market and sell our products throughout the world and have personnel in many parts of the world. In addition, we have sales offices and research and development facilities outside the United States and we conduct, and expect to continue to conduct, a significant amount of our business with companies that are located outside the United States, particularly in Europe and Asia. Any international expansion efforts that we may undertake may not be successful. In addition, conducting international operations subjects us to new risks that we have not generally faced in the United States. These risks include:
| · | trade and foreign exchange restrictions; |
| · | foreign currency exchange fluctuations; |
| · | economic or political instability in foreign markets; |
| · | greater difficulty in enforcing contracts, accounts receivable collections and longer collection periods; |
| · | changes in regulatory requirements; |
| · | difficulties and costs of staffing and managing foreign operations; |
| · | the uncertainty and limitation of protection for intellectual property rights in some countries; |
| · | costs of compliance with foreign laws and regulations and the risks and costs of non-compliance with such laws and regulations; |
| · | costs of complying with U.S. laws and regulations for foreign operations, including import and export control laws, tariffs, trade barriers, economic sanctions and other regulatory or contractual limitations on our ability to sell our products in certain foreign markets, and the risks and costs of non-compliance; |
| · | heightened risks of unfair or corrupt business practices in certain geographies and of improper or fraudulent sales arrangements; |
| · | the potential for political unrest, acts of terrorism, hostilities or war; |
| · | management communication and integration problems resulting from cultural differences and geographic dispersion; and |
| · | multiple and possibly overlapping tax structures. |
Our product and service sales may be subject to foreign governmental regulations, which vary substantially from country to country and change from time to time. Failure to comply with these regulations could adversely affect our business. Further, in many foreign countries, it is common for others to engage in business practices that are prohibited by our internal policies and procedures or U.S. regulations applicable to us. Although we implemented policies and procedures designed to ensure compliance with these laws and policies, there can be no assurance that all of our employees, contractors, distribution channels and agents will comply with these laws and policies. Violations of laws or key control policies by our employees, contractors, distribution channels or agents could result in delays in revenue recognition, financial reporting misstatements, fines, penalties or the prohibition of the importation or exportation of our products and services and could have a material adverse effect on our business and results of operations.
Unstable market and economic conditions may have serious adverse consequences on our business.
Our general business strategy may be adversely affected by the current volatile global business environment and continued unpredictable and unstable market conditions. If financial markets continue to experience volatility or deterioration, it may make any debt or equity financing that we require more difficult, more costly and more dilutive. In addition, a renewed or deeper economic downturn may result in reduced demand for our products, or adversely impact our customers’ ability to pay for our products, which would harm our operating results. There is also a risk that one or more of our current service providers, manufacturers and other partners may not survive in the current economic environment, which would directly affect our ability to attain our operating goals on schedule and on budget. Failure to secure any necessary financing in a timely manner and on favorable terms could have a material adverse effect on our results of operations and financial condition.
Our operating results could be adversely affected by product sales occurring outside the United States and fluctuations in the value of the United States Dollar against foreign currencies.
A significant and increasing percentage of our sales are generated outside of the United States. In most circumstances, our sales are denominated in the local currency. Revenues and operating expenses denominated in foreign currencies could affect our operating results as foreign currency exchange rates fluctuate. Changes in exchange rates between these foreign currencies and the U.S. Dollar will affect the recorded levels of our assets and liabilities because we translate foreign net sales, costs of goods, assets and liabilities into U.S. Dollars for presentation in our financial statements. The primary foreign currencies for which we currently have exchange rate fluctuation exposure are the Canadian dollar, the European Union Euro, the Swedish Krona, British Pound and the Australian Dollar. If our revenues continue to grow, in part because we have entered new foreign markets, we could be exposed to exchange rate fluctuations in other currencies. For example, during the year ended December 31, 2012, we established a sales office in Japan in order to attempt to penetrate the important Japanese marketplace in which we are a new competitor. Exchange rates between currencies such as the Japanese Yen and the U.S. Dollar have fluctuated significantly in recent years and may do so in the future. Hedging foreign currencies can be difficult, and other companies have incurred significant losses as a result of their foreign currency operations. We cannot predict the impact of future exchange rate fluctuations on our operating results. We currently do not hedge our foreign currency risk.
In addition, the ongoing sovereign debt crisis concerning certain European countries, including Greece, Italy, Ireland, Portugal and Spain, and related European financial restructuring efforts, may cause the value of the Euro to decline. Rating agency downgrades on European sovereign debt and continuing concern over the potential default of European government issuers has further contributed to this uncertainty. The ongoing uncertainty created by volatile currency markets in Russia may also affect our operating results. Because we are unlikely to be able to increase our selling prices to compensate for any deterioration in currencies, such currency fluctuations could adversely affect our operating results.
Accounting charges may cause fluctuations in our annual and quarterly financial results, which could negatively impact the market price of our common stock.
Our financial results may be materially affected by non-cash and other accounting charges. Such accounting charges may include:
| · | amortization of intangible assets, including acquired product rights; |
| · | impairment of goodwill and intangible assets; |
| · | stock-based compensation expense; and |
| · | impairment of long-lived assets. |
The foregoing types of accounting charges may also be incurred in connection with or as a result of business acquisitions. The price of our common stock could decline to the extent that our financial results are materially affected by the foregoing accounting charges. Our effective tax rate may increase, which could increase our income tax expense and reduce our net income.
Our effective tax rate could be adversely affected by several factors, many of which are outside of our control, including:
| · | changes in the relative proportions of revenues and income before taxes in the various jurisdictions in which we operate that have differing statutory tax rates; |
| · | changing tax laws, regulations and interpretations in multiple jurisdictions in which we operate, as well as the requirements of certain tax rulings; |
| · | changes in accounting and tax treatment of stock-based compensation; |
| · | the tax effects of purchase accounting for acquisitions and restructuring charges that may cause fluctuations between reporting periods; and |
| · | tax assessments, or any related tax interest or penalties, which could significantly affect our income tax expense for the period in which the settlements take place. |
The price of our common stock could decline if our financial results are materially adversely affected by one or more of the foregoing factors.
Our internal controls may be insufficient to ensure timely and reliable financial information.
Pursuant to Section 404 of the Sarbanes-Oxley Act of 2002, as amended, or the Sarbanes-Oxley Act, we are required to evaluate and provide a management report of our systems of internal control over financial reporting and our independent registered public accounting firm is required to attest to our internal control over financial reporting. Effective internal controls over financial reporting are necessary for us to provide reliable financial reports and effectively prevent fraud. A company’s internal control over financial reporting is a process designed to provide reasonable assurance regarding the reliability of financial reporting and the preparation of financial statements for external purposes in accordance with generally accepted accounting principles in the United States, or GAAP. A company’s internal control over financial reporting includes those policies and procedures that:
| · | pertain to the maintenance of records that, in reasonable detail, accurately and fairly reflect the transactions and dispositions of the assets of the company; |
| · | provide reasonable assurance that transactions are recorded as necessary to permit preparation of financial statements in accordance with GAAP, and that receipts and expenditures of the company are being made only in accordance with authorizations of management and directors of the company; and |
| · | provide reasonable assurance regarding prevention or timely detection of unauthorized acquisition, use, or disposition of the company’s assets that could have a material effect on the financial statements. |
A material weakness is a control deficiency, or combination of control deficiencies, that results in more than a remote likelihood that a material misstatement of the annual or interim financial statements will not be prevented or detected.
For each of the years ended December 31, 2014, 2013 and 2012 we did not identify any material weaknesses in our internal controls.
We have in the past and may in the future have deficiencies in our internal control processes and procedures. Under the supervision of our Audit Committee, we are continuing the process of identifying and implementing corrective actions as required to improve the design and effectiveness of our internal control over financial reporting, including the enhancement of systems and procedures. We have a small finance and accounting staff and limited resources and expect that we will continue to be subject to the risk of material weaknesses and significant deficiencies.
Even after corrective actions are implemented, the effectiveness of our controls and procedures may be limited by a variety of risks, including:
| · | faulty human judgment and simple errors, omissions or mistakes; |
| · | collusion of two or more people; |
| · | inappropriate management override of procedures; and |
| · | the risk that enhanced controls and procedures may still not be adequate to assure timely and reliable financial information. |
If we fail to have effective internal controls and procedures for financial reporting in place, we could be unable to provide timely and reliable financial information. Additionally, if we fail to have effective internal controls and procedures for financial reporting in place, it could adversely affect our ability to comply with financial reporting requirements under certain government contracts.
Legislative actions, higher insurance costs and new accounting pronouncements are likely to impact our future financial position and results of operations.
Legislative and regulatory changes and future accounting pronouncements and regulatory changes have, and will continue to have, an impact on our future financial position and results of operations. In addition, insurance costs, including health and workers’ compensation insurance premiums, have increased in recent years and are likely to continue to increase in the future. Recent and future pronouncements related to the accounting treatment of executive compensation and equity awards may also impact operating results. These and other potential changes could materially increase the expenses we report under GAAP and adversely affect our operating results.
Changes in accounting standards, especially those that relate to management estimates and assumptions, are unpredictable and subject to interpretation by management and our independent registered public accounting firm and may materially impact how we report and record our financial condition.
Our accounting policies and methods are fundamental to how we record and report our financial condition and results of operations. Some of these policies require use of estimates and assumptions that may affect the value of our assets or liabilities and financial results and are critical because they require management to make difficult, subjective and complex judgments about matters that are inherently uncertain. Under each of these policies, it is possible that materially different amounts would be reported under different conditions, using different assumptions, or as new information becomes available. From time to time, the Financial Accounting Standards Board, or FASB, and the SEC change the financial accounting and reporting standards that govern the preparation of our financial statements. In addition, accounting standard setters and those who interpret the accounting standards (such as the FASB, the SEC, other regulators and our outside independent registered public accounting firm) may change or even reverse their previous interpretations or positions on how these standards should be applied. These changes can be hard to predict and can materially impact how we record and report our financial condition and results of operations. In addition, we recently dismissed Ernst & Young LLP as our independent registered public accounting firm and retained McGladrey LLP as our independent registered public accounting firm. At the time of our dismissal of Ernst & Young LLP, we did not have any disagreement with Ernst & Young LLP regarding our accounting policies and practices. Our new independent registered public accounting firm may view our estimates and assumptions, or interpret policies, differently than our prior independent registered public accounting firm. In some cases, we could be required to apply a new or revised standard retroactively, or apply an existing standard differently (and also retroactively), resulting in a change in our results on a going forward basis or a potential restatement of historical financial results.
Unauthorized disclosure of data or unauthorized access to our information systems could adversely affect our business.
We may experience interruptions in our information systems on which our global operations depend. Further, we may face attempts by others to gain unauthorized access through the Internet to our information technology systems, to intentionally hack, interfere with or cause physical or digital damage to or failure of such systems (such as significant viruses or worms), which attempts we may be unable to prevent. We could be unaware of an incident or its magnitude and effects until after it is too late to prevent it and the damage it may cause. Any security breaches, unauthorized access, unauthorized usage, virus or similar breach or disruption could result in loss of confidential information, personal data and customer content, damage to our reputation, early termination of our contracts, litigation, regulatory investigations or other liabilities. If our security measures, or those of our partners or service providers, are breached as a result of third-party action, employee error, malfeasance or otherwise and, as a result, someone obtains unauthorized access to confidential information, personal data or customer content, our reputation will be damaged, our business may suffer or we could incur significant liability. The theft, unauthorized use or a cybersecurity attack that results in the publication of our trade secrets and other confidential business information as a result of such an incident could negatively affect our competitive position or the value of our investment in product or research and development, and third parties might assert against us or our customers claims related to resulting losses of confidential or proprietary information or end-user data and/or system reliability. In any such event, our business could be subject to significant disruption, and we could suffer monetary and other losses, including reputational harm.
Our headquarters are located in Northern California where disasters may occur that could disrupt our operations and harm our business.
Our corporate headquarters are located in Silicon Valley in Northern California. Historically, this region has been vulnerable to natural disasters and other risks, such as earthquakes, which at times have disrupted the local economy and posed physical risks to us and our local suppliers. In addition, terrorist acts or acts of war targeted at the United States, and specifically Silicon Valley, could cause damage or disruption to us, our employees, facilities, partners, suppliers, distributors and resellers and customers, which could have a material adverse effect on our operations and financial results. Although we currently have redundant capacity in Sweden and Canada in the event of a natural disaster or other catastrophic event in Silicon Valley, our business could nonetheless suffer. Our operations in Sweden and Canada are subject to disruption by extreme winter weather.
The requirements of being a public company may strain our resources and divert management’s attention.
As a public company, we are subject to the reporting requirements of the Securities Exchange Act of 1934, as amended, or the Exchange Act, the listing requirements of The Nasdaq Stock Market LLC and other applicable securities rules and regulations. Compliance with these rules and regulations will increase our legal and financial compliance costs, make some activities more difficult, time-consuming or costly and increase demand on our systems and resources. The Exchange Act requires, among other things, that we file annual, quarterly and current reports with respect to our business and operating results and maintain effective disclosure controls and procedures and internal control over financial reporting. In order to maintain and, if required, improve our disclosure controls and procedures and internal control over financial reporting to meet this standard, significant resources and management oversight may be required. As a result, management’s attention may be diverted from other business concerns, which could harm our business and operating results. Although we have hired several employees to comply with these requirements, we may need to hire more employees in the future, which will increase our costs and expenses.
In addition, changing laws, regulations and standards relating to corporate governance and public disclosure, including the Sarbanes-Oxley Act, the Dodd-Frank Wall Street Reform and Consumer Protection Act and new regulations of the SEC and The Nasdaq Stock Market LLC, have and will create additional compliance requirements for companies such as ours. The expenses incurred by public companies generally to meet SEC reporting, finance and accounting and corporate governance requirements have been increasing in recent years as a result of these changing laws, regulations and standards. To maintain high standards of corporate governance and public disclosure, we have invested, and intend to continue to invest, in reasonably necessary resources to comply with evolving standards. These investments have resulted in increased general and administrative expenses and a diversion of management time and attention from revenue-generating activities and may continue to do so in the future.
We may need to raise further capital, which could dilute or otherwise adversely affect our stockholders’ interest in our Company.
We believe that our existing cash, cash equivalents and short-term investments, along with the cash that we expect to generate from operations and any debt financing that management currently believes is available, will be sufficient to meet our anticipated cash needs for working capital and capital expenditures for the next twelve months.
A number of factors may negatively impact our level of cash availability and working capital requirements, including, without limitation:
| · | lower than anticipated revenues; |
| · | higher than expected cost of goods sold or operating expenses; |
| · | our inability to liquidate short-term investments; or |
| · | the inability of our customers to pay for the goods and services ordered. |
We believe that the ability to obtain equity and debt financing in the future will depend on our operating results, general economic conditions and global credit market conditions. If additional funds are raised through the issuance of equity or convertible debt securities, the percentage ownership of our stockholders will be reduced and such securities may have rights, preferences and privileges senior to those of our common stock. There can be no assurance that additional financing will be available on terms favorable to us or at all. If adequate funds are not available on acceptable terms, we may not be able to fund expansion, take advantage of unanticipated growth or acquisition opportunities, develop or enhance services or products or respond to competitive pressures. In addition, we may be required to defer or cancel product development programs, lay-off employees and/or take other steps to reduce our operating expenses. Our inability to raise additional financing or the terms of any financing we do raise could have a material adverse effect on our business, results of operations and financial condition.
Risks Related to Our Industry
The market for our products in the network provider market is still emerging and our growth may be harmed if network operators do not adopt DPI solutions.
The market for DPI technology is still emerging and the majority of our customers to date have been small and midsize network operators. We believe that the Tier 1 network operators present a significant market opportunity and are an important element of our long term strategy, but they are still in the early stages of adopting and evaluating the benefits and applications of DPI technology. Network operators may decide that full visibility into their networks or highly granular control over content based applications is not critical to their business. They may also determine that certain applications, such as voice-over Internet protocol, or VoIP, or Internet video, can be adequately prioritized in their networks by using router and switch infrastructure products without the use of DPI technology. They may also, in some instances, face regulatory constraints that could change the characteristics of the markets. Network operators may also seek an embedded DPI solution in capital equipment devices such as routers rather than the stand-alone solution offered by us. Furthermore, widespread adoption of our products by network operators will require that they migrate to a new business model based on offering subscriber and application-based tiered services. If network operators decide not to adopt DPI technology, our market opportunity would be reduced and our growth rate may be harmed, which could have a material adverse effect on our results of operations and financial condition.
If the bandwidth management solutions market fails to grow, our business will be adversely affected.
We believe that the market for bandwidth management solutions is in an early stage of development. We cannot accurately predict the future size of the market, the products needed to address the market, the optimal distribution strategy, or the competitive environment that will develop. In order for us to execute our strategy, our potential customers must recognize the value of more sophisticated bandwidth management solutions, decide to invest in the management of their networks and the performance of important business software applications and, in particular, adopt our bandwidth management solutions. The growth of the bandwidth management solutions market also depends upon a number of factors, including the availability of inexpensive bandwidth, especially in international markets, and the growth of wide area networks. The failure of the market to rapidly grow would adversely affect our sales and sales prospects, which could have a material adverse effect on our results of operations and financial condition and cause a decline in the price of our common stock.
Demand for our products depends, in part, on the rate of adoption of bandwidth-intensive broadband applications, such as peer-to-peer, and latency-sensitive applications, such as VoIP, Internet video and online video gaming applications.
Our products are used by broadband service providers and enterprises to provide awareness, control and protection of Internet traffic by examining and identifying packets of data as they pass an inspection point in the network, particularly bandwidth-intensive applications that cause congestion in broadband networks and impact the quality of experience of users. In addition to the general increase in applications delivered over broadband networks that require large amounts of bandwidth, such as peer-to-peer applications, demand for our products is driven particularly by the growth in applications which are highly sensitive to network delays and therefore require efficient network management. These applications include VoIP, Internet video and online video gaming applications. If the rapid growth in adoption of VoIP and in the popularity of Internet video and online video gaming applications does not continue, the demand for our products may not grow as anticipated, which could have a material adverse effect on our results of operations and financial condition.
The network equipment market is subject to rapid technological progress and, to remain competitive, we must continually introduce new products or upgrades that achieve broad market acceptance.
The network equipment market is characterized by rapid technological progress, frequent new product introductions, changes in customer requirements and evolving industry standards. If we do not regularly introduce new products or upgrades in this dynamic environment, our product lines may become less competitive or obsolete. Developments in routers and routing software could also significantly reduce demand for our products. Alternative technologies could achieve widespread market acceptance and displace the technology on which we have based our product architecture. We cannot assure you that our chosen technological approaches will achieve broad market acceptance or that other technology or devices will not supplant our products and technology.
Our products must comply with evolving industry standards and complex government regulations or else our products may not be widely accepted, which may prevent us from growing our net revenue or achieving profitability.
The market for network equipment products is characterized by the need to support new standards as they emerge, evolve and achieve acceptance. We will not be competitive unless we continually introduce new products and product enhancements that meet these emerging standards. We may not be able to effectively address the compatibility and interoperability issues that arise as a result of technological changes and evolving industry standards. Our products must be compliant with various United States federal government requirements and regulations and standards defined by agencies such as the Federal Communications Commission, or the FCC, in addition to standards established by governmental authorities in various foreign countries and recommendations of the International Telecommunication Union. If we do not comply with existing or evolving industry standards or if we fail to obtain timely domestic or foreign regulatory approvals or certificates, we will not be able to sell our products where these standards or regulations apply, which may prevent us from sustaining our net revenue or maintaining profitability.
Recently adopted regulatory actions may result in reduced capital spending by U.S. broadband service providers, which could adversely impact our opportunities for continued revenue growth.
On January 14, 2014, the D.C. Circuit Court of Appeals, in Verizon v. FCC, struck down major portions of the “net neutrality” rules adopted by the FCC in December 2010 governing the operating practices of U.S. broadband service providers. The FCC originally designed the rules to ensure an “open Internet” and included three key requirements for U.S. broadband service providers: (1) a prohibition on preventing end-user customers from accessing lawful content or running applications of their choice over the Internet and from connecting and using devices that do not harm the network; (2) a requirement to treat lawful content, applications and services in a nondiscriminatory manner; and (3) a transparency requirement compelling the disclosure of network management policies. The court struck down the anti-blocking and nondiscrimination provisions of the rules but upheld the transparency requirement. The court also found that the FCC has the statutory authority to impose such rules so long as they do not contravene other express statutory mandates. On May 15, 2014, the FCC adopted a Notice of Proposed Rulemaking that proposed new rules regarding anti-blocking and nondiscrimination, or Open Access NPRM, and sought public comment on whether and by how much the FCC should tighten regulation of Internet service providers. On February 26, 2015, the FCC broadly adopted the new rules pursuant to the Open Access NPRM, although, as of the date of filing of this Annual Report on Form 10-K, the exact language of the adopted order has not been published. The FCC justified its legal authority to adopt the new rules by, among other things, reclassifying broadband Internet access as a common carrier service subject to the FCC’s general authority under Title II of the Communications Act and relying on Section 706 of the Telecommunication Act of 1996. The new rules do not go into effect immediately. The FCC must release the order and publish the rules in the Federal Register, and it will not be effective until 60 days after the publication. The new rules adopted by the FCC are likely to be challenged in court, and there is no certainty as to how a court will rule. Any rules or legislative actions ultimately adopted under the banner of “net neutrality” could interfere with U.S. broadband service providers’ ability to reasonably manage and invest in their U.S. broadband networks, and could adversely affect the manner and price of providing broadband service. As a result, U.S. broadband service providers may lessen their capital investments in their networks and we may have fewer opportunities to sell our products to both current and prospective customers, and our opportunity for continued revenue growth could be adversely impacted. In addition, the new rules adopted by the FCC could influence net neutrality rulemaking by international regulatory bodies, further affecting our opportunity for revenue growth. If our revenue growth slows or our revenues decrease, our results of operations and our financial condition also may be adversely impacted.
Risks Related to Ownership of Our Common Stock
Our common stock price is likely to continue to be highly volatile.
The market price of our common stock has been and is likely to continue to be highly volatile. The market for small cap technology companies, including us, has been particularly volatile in recent years. We cannot assure stockholders that our stock will trade at the same levels of other stocks in our industry or that, in general, stocks in our industry will sustain their current market prices.
Factors that could cause such volatility may include, among other things:
| · | actual or anticipated fluctuations in our quarterly operating results; |
| · | announcements of technology innovations by our competitors; |
| · | changes in financial estimates by securities analysts; |
| · | conditions or trends in the network control and management industry; |
| · | the acceptance by institutional investors of our stock; |
| · | rumors, announcements or press articles regarding our operations, management, organization, financial condition or financial statements; or |
| · | the gain or loss of a significant customer. |
The stock market in general, and the market prices of stocks of technology companies, in particular, have experienced extreme price volatility that has adversely affected, and may continue to adversely affect, the market price of our common stock for reasons unrelated to our business or operating results.
If securities or industry analysts do not publish research or publish inaccurate or unfavorable research about our business, our stock price and trading volume could decline.
The trading market for our common stock will depend in part on the research and reports that securities or industry analysts publish about us or our business. If we do not establish and maintain adequate research coverage or if one or more of the analysts who covers us downgrades our stock or publishes inaccurate or unfavorable research about our business, our stock price would likely decline. If one or more of these analysts ceases coverage of our Company or fails to publish reports on us regularly, demand for our stock could decrease, which could cause our stock price and trading volume to decline.
Delaware law and our certificate of incorporation and bylaws contain provisions that may discourage, delay or prevent a change in our management team that our stockholders may consider favorable or otherwise have the potential to impact our stockholders’ ability to control our Company.
Delaware law and our amended and restated certificate of incorporation and amended and restated bylaws contain provisions that may have the effect of preserving our current management or may impact our stockholders’ ability to control our Company, such as:
| · | authorizing the issuance of “blank check” preferred stock with rights senior to those of our common stock, without any need for action by stockholders; |
| · | eliminating the ability of stockholders to call special meetings of stockholders; |
| · | restricting the ability of stockholders to take action by written consent, which requires stockholder action to be taken at an annual or special meeting of stockholders; |
| · | establishing advance notice requirements for nominations for election to the Board of Directors or for proposing matters that can be acted on by stockholders at stockholder meetings; and |
| · | prohibiting cumulative voting in the election of directors, which limits the ability of minority stockholders to elect director candidates. |
In addition, because we are incorporated in Delaware, we are governed by the provisions of Section 203 of the General Corporation Law of the State of Delaware which, subject to certain exceptions, prohibits stockholders owning in excess of 15% of our outstanding voting stock from merging or combining with us. These anti-takeover provisions and other provisions under Delaware law could discourage, delay or prevent a transaction involving a change in control of our Company, even if doing so would benefit our stockholders.
Moreover, these provisions could allow our Board of Directors to affect your rights as a stockholder since our Board of Directors can make it more difficult for common stockholders to replace members of the Board of Directors. Because our Board of Directors is responsible for appointing the members of our management team, these provisions could in turn affect any attempt to replace our current management team. In addition, the issuance of preferred stock could make it more difficult for a third party to acquire us and may impact the rights of common stockholders. All of the foregoing could adversely impact the price of our common stock and your rights as a stockholder.
Holders of our common stock may be diluted in the future.
We are authorized to issue up to 32.5 million shares of common stock and 15.0 million shares of preferred stock. Our Board of Directors has the authority, without seeking stockholder approval, to issue additional shares of common stock and/or preferred stock in the future for such consideration as our Board of Directors may consider sufficient. In addition, in connection with our acquisition of Vineyard, we issued an aggregate of 825,060 shares of our common stock to the former shareholders of Vineyard. If we were to issue equity securities as all or part of the purchase price for any future acquisitions, the issuance of such equity securities would have a dilutive effect on our existing stockholders. Additionally, if we finance acquisitions by issuing equity securities, our existing stockholders may be diluted. At December 31, 2014, there were 20,756,157 shares of our common stock outstanding, and outstanding stock options to purchase 1.6 million shares of our common stock, of which options to purchase 412,000 shares of our common stock were granted to new employees in connection with our acquisition of Vineyard in January 2013. As of December 31, 2014, we had outstanding restricted stock awards and restricted stock units with respect to 586,000 shares of our common stock. At December 31, 2014, we had an authorized reserve of 249,000 shares of common stock, which we may grant as stock options, restricted stock, restricted stock units or other equity awards pursuant to our existing equity incentive plan.
The issuance of additional common stock and/or preferred stock in the future would reduce the proportionate ownership and voting power of our common stock held by existing stockholders and also could cause the trading price of our common stock to decline.
Our bylaws designate the Court of Chancery of the State of Delaware as the sole and exclusive forum for certain types of actions and proceedings that may be initiated by our stockholders, which could limit our stockholders’ ability to obtain a favorable judicial forum for disputes with us or our directors, officers or other employees.
Our bylaws provide that, unless we consent in writing to an alternative forum, the Court of Chancery of the State of Delaware will be the sole and exclusive forum for (1) any derivative action or proceeding brought on our behalf, (2) any action asserting a claim of breach of a fiduciary duty owed by any director, officer or other employee to us or our stockholders, (3) any action asserting a claim against us or our directors, officers or employees arising pursuant to any provision of our bylaws, our amended and restated certificate of incorporation or the General Corporation Law of the State of Delaware, (4) any action asserting a claim against us or our directors, officers or employees that is governed by the internal affairs doctrine, or (5) any action to interpret, apply, enforce or determine the validity of our bylaws or our amended and restated certificate of incorporation. Any person purchasing or otherwise acquiring any interest in any shares of our capital stock shall be deemed to have notice of and to have consented to this provision of our bylaws. This choice-of-forum provision may limit our stockholders’ ability to bring a claim in a judicial forum that it finds favorable for disputes with us or our directors, officers or other employees, which may discourage such lawsuits. Alternatively, if a court were to find this provision of our bylaws inapplicable or unenforceable with respect to one or more of the specified types of actions or proceedings, we may incur additional costs associated with resolving such matters in other jurisdictions, which could materially and adversely affect our business, results of operations and financial condition.
We do not pay and do not expect to pay cash dividends on our common stock.
We have not paid any cash dividends. We do not anticipate paying cash dividends on our common stock in the foreseeable future and we cannot assure investors that funds will be legally available to pay dividends, or that, even if the funds are legally available, dividends will be declared and paid.
None.
Our corporate headquarters are located in Fremont, California, which consists of approximately 18,000 square feet of space housing administrative, sales and marketing, logistics and support functions. The current lease term runs through November 30, 2018.
Our European headquarters are located in Sweden, where we lease office space in Varberg and Malmo consisting of approximately 19,000 square feet. These facilities are used primarily for research and development, sales and marketing and support.
We currently lease office space totaling approximately 12,000 square feet in Kelowna, British Columbia, Canada. These facilities are primarily used for research and development, sales and marketing and support. The lease term ends on August 31, 2019 with an option to extend for another five years.
Our offices in Japan are located in Tokyo where we lease office space totaling approximately 1,000 square feet. This facility is primarily used for sales, marketing and support. We also maintain small offices in other countries, primarily to support the sales and marketing support activities in those areas.
We believe that our facilities are adequate for our needs in 2015 and that, if required, additional suitable space will be available on commercially acceptable terms.
We are at times involved in litigation and other legal claims in the ordinary course of business. When appropriate in management’s estimation, we may record reserves in our financial statements for pending litigation and other claims. Although it is not possible to predict with certainty the outcome of litigation, we do not believe that any of the current pending legal proceedings to which we are a party or to which any of our property is subject will have a material impact on our results of operations or financial condition.
Not applicable.
PART II
| Item 5. | Market for Registrant’s Common Equity, Related Stockholder Matters and Issuer Purchases of Equity Securities |
Our common stock is listed on the NASDAQ Global Select Market under the symbol “PKT”. The following table sets forth, for the periods indicated, the high and low intraday prices per share of our common stock, as reported by The NASDAQ Stock Market LLC, for the periods indicated.
|
Common Stock
|
||||||||||||||||
|
2014
|
2013
|
|||||||||||||||
|
High
|
Low
|
High
|
Low
|
|||||||||||||
|
First Quarter
|
$
|
15.17
|
$
|
10.06
|
$
|
19.67
|
$
|
11.35
|
||||||||
|
Second Quarter
|
$
|
10.81
|
$
|
8.33
|
$
|
15.13
|
$
|
10.12
|
||||||||
|
Third Quarter
|
$
|
10.72
|
$
|
9.12
|
$
|
16.48
|
$
|
11.68
|
||||||||
|
Fourth Quarter
|
$
|
9.54
|
$
|
5.60
|
$
|
15.50
|
$
|
13.40
|
||||||||
On March 10, 2015, the closing price of our common stock was $9.12.
Dividend Policy
We have not declared or paid any cash dividends on our common stock or other securities and do not anticipate paying any cash dividends in the foreseeable future. Any future determination to pay cash dividends will be at the discretion of the Board of Directors and will be dependent upon our financial condition, results of operations, capital requirements and such other factors as the Board of Directors deems relevant.
Recent Sales of Unregistered Securities
None.
Issuer Purchases of Equity Securities
None.
Stockholders
There were 155 stockholders of record of our common stock as of March 10, 2015.
Performance Graph
The graph below compares our cumulative five-year total stockholder return on common stock with the cumulative total returns of the NASDAQ Composite Index and the NASDAQ Computer Index. The graph below tracks the performance of a $100 investment in our common stock and in each index (assuming the reinvestment of all dividends) from December 31, 2009 to December 31, 2014.
The information under the heading “Performance Graph” is not “soliciting material,” and shall not be deemed filed for purposes of Section 18 of the Securities Exchange Act of 1934, as amended, or incorporated by reference in any filing under the Securities Act of 1933, as amended, or the Securities Exchange Act of 1934, as amended, whether made before or after the date hereof and irrespective of any general incorporation language in any such SEC filing except to the extent we specifically incorporate this section by reference.
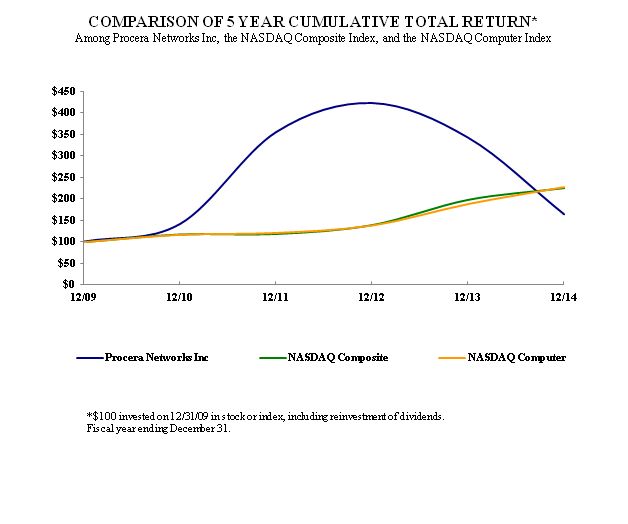
|
12/09
|
12/10
|
12/11
|
12/12
|
12/13
|
12/14
|
|||||||||||||||||||
|
Procera Networks, Inc.
|
$
|
100.00
|
$
|
140.91
|
$
|
354.09
|
$
|
421.59
|
$
|
341.36
|
$
|
163.41
|
||||||||||||
|
NASDAQ Composite Index
|
$
|
100.00
|
$
|
117.61
|
$
|
118.70
|
$
|
139.00
|
$
|
196.83
|
$
|
223.74
|
||||||||||||
|
NASDAQ Computer Index
|
$
|
100.00
|
$
|
116.85
|
$
|
121.01
|
$
|
138.35
|
$
|
187.60
|
$
|
226.41
|
The stock price performance included in this graph is not necessarily indicative of future stock price performance.
The following selected financial information has been derived from our audited consolidated financial statements. The information set forth below is not necessarily indicative of results of future operations and should be read in conjunction with Item 7, “Management’s Discussion and Analysis of Financial Condition and Results of Operations” and the Consolidated Financial Statements and notes thereto included in Item 8 of this Annual Report on Form 10-K in order to fully understand factors that may affect the comparability of the information presented below.
|
Fiscal Year Ended December 31,
|
||||||||||||||||||||
|
2014 (1)
|
2013 (2)
|
2012 (3)
|
2011 (4)
|
2010 (5)
|
||||||||||||||||
|
(in thousands, except per share data)
|
||||||||||||||||||||
|
STATEMENT OF OPERATIONS DATA:
|
||||||||||||||||||||
|
Net sales
|
$
|
75,413
|
$
|
74,673
|
$
|
59,627
|
$
|
44,404
|
$
|
20,323
|
||||||||||
|
Gross profit
|
$
|
44,206
|
$
|
40,813
|
$
|
40,158
|
$
|
26,323
|
$
|
11,510
|
||||||||||
|
Total operating expenses
|
$
|
68,671
|
$
|
58,835
|
$
|
34,853
|
$
|
22,380
|
$
|
14,247
|
||||||||||
|
Income (loss) from operations
|
$
|
(24,465
|
)
|
$
|
(18,022
|
)
|
$
|
5,305
|
$
|
3,943
|
$
|
(2,737
|
)
|
|||||||
|
Net income (loss)
|
$
|
(24,816
|
)
|
$
|
(16,284
|
)
|
$
|
5,331
|
$
|
3,755
|
$
|
(2,894
|
)
|
|||||||
|
Net income (loss) per share, basic
|
$
|
(1.21
|
)
|
$
|
(0.81
|
)
|
$
|
0.30
|
$
|
0.29
|
$
|
(0.27
|
)
|
|||||||
|
Net income (loss) per share, diluted
|
$
|
(1.21
|
)
|
$
|
(0.81
|
)
|
$
|
0.29
|
$
|
0.28
|
$
|
(0.27
|
)
|
|||||||
|
BALANCE SHEET DATA:
|
||||||||||||||||||||
|
Cash, cash equivalents and short-term investments
|
$
|
102,481
|
$
|
106,563
|
$
|
131,695
|
$
|
37,404
|
$
|
7,876
|
||||||||||
|
Working capital
|
$
|
119,415
|
$
|
126,876
|
$
|
144,195
|
$
|
44,654
|
$
|
12,607
|
||||||||||
|
Total assets
|
$
|
156,071
|
$
|
179,436
|
$
|
167,038
|
$
|
60,156
|
$
|
24,517
|
||||||||||
|
Deferred revenue, current and non-current
|
$
|
14,934
|
$
|
14,906
|
$
|
9,831
|
$
|
6,378
|
$
|
4,437
|
||||||||||
|
Long-term liabilities, excluding deferred revenue
|
$
|
583
|
$
|
1,833
|
$
|
-
|
$
|
-
|
$
|
-
|
||||||||||
|
Total stockholders’ equity
|
$
|
128,112
|
$
|
148,671
|
$
|
146,805
|
$
|
46,567
|
$
|
13,754
|
||||||||||
| (1) | In the third quarter of fiscal year 2014, we recorded total impairment charges of $12.4 million, consisting of $10.9 million to write down the value of goodwill, and $0.7 million and $0.8 million to write down the carrying values of developed technology and customer relationship intangible assets, respectively. See Note 7 – “Goodwill and Intangible Assets” of the Notes to Consolidated Financial Statements for additional details. |
| (2) | On January 9, 2013, we acquired Vineyard for an aggregate consideration of approximately $26.8 million, consisting of $20.9 million in purchase consideration for 100% of the outstanding securities of Vineyard and $5.9 million in deferred compensation to Vineyard’s founders. Of the total $26.8 million consideration, we paid $12.5 million in cash and issued 825,060 unregistered shares of our common stock with a value of approximately $14.3 million. |
| (3) | On April 25, 2012, we completed a registered offering of 4.5 million shares of common stock. The shares were sold to the public at $21.00 per share for gross proceeds of $94.5 million. We received net proceeds of approximately $88.0 million after deducting underwriting commissions and other offering expenses. |
| (4) | On June 24, 2011, we completed a registered offering of 3.0 million shares of our common stock, which included the exercise in full of the underwriters’ overallotment option to purchase 0.4 million additional shares of our common stock. The shares were sold to the public at $9.50 per share for gross proceeds of $28.8 million. We received net proceeds of approximately $26.5 million after deducting underwriting commissions and other offering expenses. |
| (5) |
On March 4, 2010, we closed a registered placement of our common stock primarily to institutional investors. We sold 1.8 million shares of our common stock at an offering price to the public of $4.00 per share for gross proceeds of $7.2 million, and received net proceeds of approximately $6.5 million after deducting the placement agent’s commission and legal and other offering costs.
|
The following Management’s Discussion and Analysis of Financial Condition and Results of Operations contains forward-looking statements that involve risks and uncertainties. We use words such as “may,” “will,” “expect,” “anticipate,” “estimate,” “intend,” “plan,” “predict,” “potential,” “believe,” “should” and similar expressions to identify forward-looking statements. These statements appearing throughout our Annual Report on Form 10-K are statements regarding our intent, belief or current expectations, primarily regarding our operations. You should not place undue reliance on these forward-looking statements, which apply only as of the date of this Annual Report on Form 10-K. Our actual results could differ materially from those anticipated in these forward-looking statements for many reasons, including those set forth under “Business,” “Risk Factors” and elsewhere in this Annual Report on Form 10-K.
Overview
We are a leading provider of SEA solutions designed for network operators worldwide. Our PacketLogic solutions enable network operators to gain insights, make decisions and take actions to ensure a high quality experience for Internet connected devices. Network operators deploy our technology to gain insights on their subscribers and networks, make decisions on service packaging and then deliver those solutions to subscribers connected to their network. We believe that the intelligence our products provide about subscribers and their experience enables our network operator customers to make better-informed business decisions and increases customer satisfaction in the highly competitive worldwide broadband market. Our network operator customers include service provider customers and enterprises. Our service provider customers include mobile service providers and broadband service providers, which include cable MSOs, telecommunications companies, Wi-Fi network operators and ISPs. Our enterprise customers include educational institutions, commercial enterprises, government and municipal agencies. We sell our products directly to network operators; through partners, value added resellers and system integrators; and to other network solution suppliers for incorporation into their network solutions. Our products are delivered to network operators through pre-packaged hardware or as virtualized software, which will become a large part of our business going forward and open up new partnership opportunities.
Our SEA solutions are part of the high-growth market for mobile packet and broadband core and access products. This market is composed of three separate addressable market opportunities:
Deep Packet Inspection Market
Our products are sold either bundled with hardware or as pure software to deliver a solution that is a key element of the mobile packet and broadband core ecosystems. Our solutions are often integrated with additional elements in the mobile packet and broadband core, including Policy Management and Charging functions, and are compliant with the widely adopted 3GPP standard. In order to respond to rapidly increasing demand for network capacity due to increasing subscribers and usage, service providers are seeking higher degrees of intelligence, optimization, network management, service creation and delivery in order to differentiate their offerings and deliver a high quality of experience to their subscribers. We believe the need to create more intelligent and innovative mobile and broadband networks will continue to drive demand for our products. We also sell our embedded NAVL solutions to other network equipment vendors. Our embedded solutions enable network solutions suppliers to more quickly add application awareness to their platforms, since our NAVL DPI engine products have been designed to be highly portable among many platforms and processors. NAVL eliminates the need for network solutions providers to research and develop their own DPI technology, saving significant time and resources while enabling them to more effectively compete in their market space. NAVL enables Procera to achieve indirect market share in the DPI market by supplying embedded solutions with our DPI engine. The market for DPI products was $887.0 million in 2014 and is expected to grow to just under $2.0 billion in 2018, a 2013–2018 compounded annual growth rate of 22%.
Customer Experience Management (CEM) Market
In 2014, we launched two significant products that increase our total addressable market: RAN Perspectives and our Insights Product Family. RAN Perspectives is a Subscriber Identity Module, or SIM-based applet, that a mobile operator can deploy on devices connected to their network. The applet will report the subscriber’s location and the signal strength and quality that their device has with the mobile network. This enables our solutions to have real-time location awareness and visibility into the Radio Access Network, or RAN, to complement our existing visibility into the broadband data network. By combining these two intelligence metrics, we are now competing in the Customer Experience Management, or CEM, market with companies such as Gigamon, NetScout, Ericsson, Huawei and other larger telecom vendors. MarketsandMarkets forecasts the CEM market to grow from $3.77 billion in 2014 to $8.39 billion in 2019. This represents a compound annual growth rate, or CAGR, of 17.3% from 2014 to 2019.
Telecom Big Data Analytics Market
Procera’s Insights Product Family consists of unique visualization of our SEA solutions based on different roles inside of a network operator – Engineering, Customer Care, Marketing and Executives. These products will compete with traditional big data products from companies such as IBM, Guavus and Zettics. Mind Commerce expects the Big Data driven telecom analytics market to grow at a CAGR of nearly 50% between 2014 and 2019. By the end of 2019, the market will eventually account for $5.4 billion in annual revenue.
Our products are marketed under the PacketLogic and NAVL brand names. We have a broad spectrum of products delivering SEA at the access, edge and core layers of the network. Our products are designed to offer maximum flexibility to our customers and enable differentiated services and revenue-enhancing applications, all while delivering a high quality of experience for subscribers. These products are offered as virtual or hardware appliances to customers, enabling them to choose their platform based upon their deployment needs and preferences.
On January 9, 2013, we completed our acquisition of Vineyard Networks Inc., or Vineyard, a privately held developer of Layer 7 DPI and application classification technology located in Kelowna, Canada. We acquired Vineyard in Canada to complement our hardware and application software-based IPE and DPI solutions, expand the way we sell solution to customers, increase our customer base, expand our research and development efforts and enhance stability and disaster recovery capabilities.
Our Company is headquartered in Fremont, California and we have key operating entities in Kelowna, Canada and Varberg, Sweden, as well as a geographically dispersed sales force. We sell our products through our direct sales force, resellers, distributors, systems integrators and other equipment manufacturers in the Americas, Asia Pacific and Europe.
Critical Accounting Policies
The discussion and analysis of our financial condition and results of operations are based upon financial statements which have been prepared in accordance with generally accepted accounting principles in the United States, or GAAP. The preparation of these financial statements requires us to make estimates and judgments that affect the reported amounts of assets, liabilities, revenue and expenses and related disclosure of contingent assets and liabilities. On an ongoing basis, we evaluate these estimates. We base our estimates on historical experience and on assumptions that are believed to be reasonable. These estimates and assumptions provide a basis for making judgments about the carrying values of assets and liabilities that are not readily apparent from other sources. Actual results may differ from these estimates under different assumptions or conditions, and these differences may be material.
In accordance with SEC guidance, the material accounting policies that we believe are the most critical to an investor’s understanding of our financial results and condition are discussed below.
Revenue Recognition
We recognize product revenue when all of the following have occurred: (1) we have entered into a legally binding arrangement with a customer resulting in the existence of persuasive evidence of an arrangement; (2) delivery has occurred, evidenced when product title transfers to the customer; (3) customer payment is deemed fixed or determinable and free of contingencies and significant uncertainties; and (4) collection is probable.
Sales of our PacketLogic products typically involve the integration of software and hardware appliance, where the hardware and software work together to deliver the essential functionality of the product. Product revenue consists of revenue from sales of appliances and software licenses. PacketLogic product sales include a perpetual license to our software that is essential to the functionality of the hardware, and on occasion include licenses to additional software. NAVL sales include term software licenses sold as a subscription. Revenue from sales of term licenses is recognized ratably over the subscription term, generally one year. Shipping charges billed to customers are included in product revenue and the related shipping costs are included in cost of product revenue. Virtually all sales include post-contract support, or PCS, services (included in support revenue), which consist of software updates and customer support. Software updates provide customers access to a growing library of electronic Internet traffic identifiers (signatures) and rights to non-specific software product upgrades, maintenance releases and patches released during the term of the support period. Support includes Internet access to technical content, telephone and Internet access to technical support personnel and hardware support.
Receipt of a customer purchase order is the primary method of determining that persuasive evidence of an arrangement exists.
Delivery of PacketLogic products generally occurs when a product is delivered to a common carrier F.O.B. shipping point. However, product revenue based on channel partner purchase orders is recorded based on obtaining evidence of sell-through to the end user customers until such time as we have established significant experience with the channel partner’s ability to complete the sales process, which requires judgment. Additionally, when we introduce new products for which there is no historical evidence of acceptance history, revenue is recognized on the basis of end-user acceptance until such history has been established. Delivery of PacketLogic license upgrades and NAVL licenses occur when such licenses are made available to customers.
Fees are typically considered to be fixed or determinable at the inception of an arrangement, generally based on specific products and quantities to be delivered. Our contracts generally do not include rights of return or acceptance provisions. To the extent that agreements contain such terms, we recognize revenue once the acceptance provisions or right of return lapses. Payment terms to customers generally range from net 30 to 90 days. Certain customers are occasionally granted longer terms based on our assessment of their credit risk. In the event payment terms are provided that differ from standard business practices, the fees are deemed to not be fixed or determinable and revenue is recognized when the payments become due, provided the remaining criteria for revenue recognition have been met.
We assess the ability to collect from our customers based on a number of factors, including credit worthiness of the customer and past transaction history of the customer. If the customer is not deemed credit worthy, we defer revenue from the arrangement until payment is received and all other revenue recognition criteria have been met.
Customer orders normally contain multiple items. The initial PacketLogic product delivery consists of the hardware and software elements and these elements have standalone value to the customer. Through the year ended December 31, 2014, the elements that remained undelivered at the time of product delivery were PCS services and occasionally uncompleted professional services not essential to the functionality of the product. Orders for our NAVL product consist of term software licenses and PCS services which are recognized ratably over the term of the arrangement, typically one year.
We allocate revenue to each element in an arrangement based on relative selling price using a selling price hierarchy. The selling price for a deliverable is based on its VSOE, if available, third party evidence, or TPE, if VSOE is not available, or our best estimate of selling price, or ESP, if neither VSOE nor TPE is available. The maximum revenue recognized on a delivered element is limited to the amount that is not contingent upon the delivery of additional items. In arrangements that include NAVL or non-essential software, or software deliverables, revenue is allocated to each separate unit of accounting for the non-software deliverables and to the software deliverables as a group using the relative selling prices of each of the deliverables in the arrangement. Revenue allocated to the software deliverables as a group is then allocated first to the PCS services based on VSOE, and then to the software, using the residual method under the software revenue recognition guidance.
We determine VSOE for PCS based on a percentage of products purchased, with different rates based on service level. We have determined that these rates represent VSOE for PCS based on our history of charging these rates for PCS to customers upon renewal. We have a history of such renewals, the vast majority of which are at the VSOE rate on a customer by customer basis. PCS revenue is recognized ratably over the life of the contract. A portion of service revenue is derived from customizations not essential to the functionality of the product, implementation and training services. We use the completed-contract method to recognize such revenue.
As our PacketLogic hardware and software products are rarely sold separately, we generally do not have VSOE for these products, and TPE is not available. We determine the ESP for these hardware and software deliverables by considering internal factors such as discounting and pricing policies and external factors such as market conditions in different geographies and competitive positioning.
In certain contracts, billing terms may be agreed upon based on performance milestones such as the execution of a measurement test, a partial delivery or the completion of a specified service. Payments received before the unconditional acceptance of a specific set of deliverables are recorded as deferred revenue until the conditional acceptance has been waived.
Valuation of Long-Lived Assets and Goodwill
We review our long-lived assets including property and equipment and purchased intangible assets for impairment whenever events or changes in circumstances indicate that the carrying amount may not be recoverable. Such events or circumstances that could trigger an impairment review include a significant disposal of a portion of such assets, an adverse change in the market involving the business employing the related asset, a significant decrease in the benefits realized from an acquired business, difficulties or delays in integrating the business or a significant change in the operations of an acquired business.
An impairment test involves a comparison of undiscounted cash flows from the use of the asset or asset group to the carrying value of the asset or asset group. Measurement of an impairment loss is based on the amount by which the carrying value of the asset or asset group exceeds its fair value.
We review our goodwill for impairment annually during the fourth quarter of the year or more frequently if an event or circumstance indicates that an impairment loss has occurred. The identification and measurement of goodwill impairment involves the estimation of fair value at a reporting unit level.
Goodwill impairment is determined using a two-step process. The first step of the goodwill impairment test is used to identify potential impairment by comparing the fair value of a reporting unit with its carrying amount, including goodwill. If the fair value of a reporting unit exceeds its carrying amount, goodwill of the reporting unit is considered not impaired and the second step of the impairment test is unnecessary. If the carrying amount of a reporting unit exceeds its fair value, the second step of the goodwill impairment test is performed to measure the amount of impairment loss, if any.
The second step of the goodwill impairment test compares the implied fair value of the reporting unit’s goodwill with the carrying amount of that goodwill. If the carrying amount of the reporting unit’s goodwill exceeds the implied fair value of that goodwill, an impairment loss is recognized in an amount equal to that excess. The implied fair value of goodwill is determined in the same manner as the amount of goodwill recognized in a business combination. That is, the fair value of the reporting unit is allocated to all of the assets and liabilities of that unit (including any unrecognized intangible assets) as if the reporting unit had been acquired in a business combination and the fair value of the reporting unit was the purchase price paid to acquire the reporting unit.
In 2014, we recorded total impairment charges of $12.4 million, consisting of $10.9 million to write down the value of goodwill, and $0.7 million and $0.8 million to write down the carrying values of developed technology and customer relationship intangible assets, respectively. See Note 7 – “Goodwill and Intangible Assets” of the Notes to Consolidated Financial Statements for additional details.
Inventory Valuation
Inventories consist primarily of finished goods and are stated at the lower of cost (on a specific identification or weighted average cost basis) or market. We record inventory write-downs for excess and obsolete inventories based on historical usage and forecasted demand, as well as determining what inventory, if any, is not saleable. Factors which could cause our forecasted demand to prove inaccurate include reliance on indirect sales channels and the variability of our sales cycle; the potential of announcements of new products or enhancements to replace or shorten the life cycle of current products, or cause customers to defer their purchases; and the potential of new or alternative technologies achieving widespread market acceptance and thereby rendering our existing products obsolete. If future demand or market conditions are less favorable than projections, additional inventory write-downs may be required and would be reflected in cost of sales in the period the revision is made.
Inventories also include demonstration units located at various customer locations and customer service inventories. Our demonstration units and customer service inventories are stated at lower of cost (on a specific identification or weighted average cost basis) or market. We provide demonstration units to customers who evaluate our products, and upon successful trial, may purchase such products. We carry customer service inventories because we generally provide product warranty for 12 months and earn revenue by providing enhanced and extended support contracts during and beyond this warranty period. Customer service inventories are provided for customer use permanently or on a temporary basis while the defective unit is being repaired. We reduce the carrying value of demonstration units and customer service inventories for differences between cost and estimated net realizable value, taking into consideration expected demand, technological obsolescence and other information, including the physical condition of the unit. If actual results vary significantly from expectations, additional write-downs may be required, resulting in additional charges to operations.
Stock-Based Compensation
We apply the provisions of the Financial Accounting Standards Board, or FASB, Accounting Standards Codification, or ASC, Topic 718, which requires the measurement and recognition of compensation expense for all share-based payment awards made to employees and non-employee directors based on estimated fair values. Under the fair value recognition provisions of this standard, our stock-based compensation cost is measured at the grant date based on the fair value of the award and is recognized as an expense on a straight-line basis over the requisite service period, which is the vesting period. We calculate the fair value of stock options using the Black-Scholes option-pricing model. The determination of the fair value of stock-based payment awards using an option-pricing model is affected by our stock price as well as assumptions regarding a number of complex and subjective variables. These variables include our expected stock price volatility over the term of the awards, actual and projected employee stock option exercise behaviors, risk-free interest rate and expected dividends.
We estimate the expected volatility of our common stock price based on its historical volatility over a period equivalent to the expected term of the option. We estimate the expected term of stock options using historical exercise data. We use the exact number of days between the grant and the exercise dates to calculate a weighted average of the holding periods for all awards (i.e., the average interval between the grant and exercise or post-vesting cancellation dates), adjusted as appropriate. We determine the risk-free interest rate for a period equivalent to the expected term of the option by extrapolating from the U.S. Treasury yield curve in effect at the time of the grant. We have never paid cash dividends and do not anticipate paying cash dividends in the foreseeable future. We estimate forfeitures based on our historical experience.
Accounting for Income Taxes
We record a tax provision for the anticipated tax consequences of the reported results of operations. In accordance with ASC Topic 740, the provision for income taxes is computed using the asset and liability method, under which deferred tax assets and liabilities are recognized for the expected future tax consequences of temporary differences between the financial reporting and tax bases of assets and liabilities, and for the operating losses and tax credit carryforwards. Deferred tax assets and liabilities are measured using the currently enacted tax rates that apply to taxable income in effect for the years in which those assets are expected to be realized or settled. We record a valuation allowance to reduce deferred tax assets to the amount that is believed more likely than not to be realized. Management believes that sufficient uncertainty exists regarding the future realization of deferred tax assets and, accordingly, a full valuation allowance has been provided against net deferred tax assets. Tax expense has taken into account any change in the valuation allowance for deferred tax assets where the realization of various deferred tax assets is subject to uncertainty.
Recent Accounting Pronouncements
In May 2014, the FASB issued Accounting Standards Update, or ASU, No. 2014-09, “Revenue from Contracts with Customers”, issued as a new Topic, ASC Topic 606. The new revenue recognition standard provides a five-step analysis of transactions to determine when and how revenue is recognized. The core principle of the guidance is that a company should recognize revenue to depict the transfer of promised goods and services to customers in an amount that reflects the consideration to which the entity expects to be entitled in exchange for those goods or services. This ASU is effective beginning in fiscal year 2017 and can be adopted by the Company either retrospectively or as a cumulative-effect adjustment as of the date of adoption. We are currently evaluating the effect that adopting this new accounting guidance will have on our consolidated financial statements.
In June 2014, the FASB issued ASU No. 2014-12, “Accounting for Share-Based Payments When the Terms of an Award Provide That a Performance Target Could Be Achieved after the Requisite Service Period”, or ASU 2014-12. The amendments in ASU 2014-12 require that a performance target that affects vesting and that could be achieved after the requisite service period be treated as a performance condition. A reporting entity should apply the existing guidance in ASC Topic No. 718, “Compensation – Stock Compensation”, as it relates to awards with performance conditions that affect vesting to account for such awards. The amendments in ASU 2014-12 are effective for annual periods and interim periods within those annual periods beginning after December 15, 2015. Early adoption is permitted. Entities may apply the amendments in ASU 2014-12 either: (1) prospectively to all awards granted or modified after the effective date; or (2) retrospectively to all awards with performance targets that are outstanding as of the beginning of the earliest annual period presented in the financial statements and to all new or modified awards thereafter. The adoption of ASU 2014-12 is not expected to have a material effect on our consolidated financial statements or disclosures.
In August 2014, the FASB issued ASU No. 2014-15, “Presentation of Financial Statements”, which provides new guidance related to the disclosures around going concern. The new standard provides guidance around management’s responsibility to evaluate whether there is substantial doubt about an entity’s ability to continue as a going concern and to provide related footnote disclosures. The new standard is effective for fiscal years, and interim periods within those fiscal years, beginning after December 15, 2016. Early adoption is permitted. The adoption of this standard is not expected to have a material impact on our consolidated financial statements.
Results of Operations
Revenue
|
Year Ended December 31,
|
Year Ended December 31,
|
|||||||||||||||||||||||||||||||
|
Increase
(Decrease)
|
Increase
(Decrease)
|
|||||||||||||||||||||||||||||||
|
2014
|
2013
|
Amount
|
Percent
|
2013
|
2012
|
Amount
|
Percent
|
|||||||||||||||||||||||||
|
($ in thousands)
|
($ in thousands)
|
|||||||||||||||||||||||||||||||
|
Net product sales
|
$
|
54,000
|
$
|
56,520
|
$
|
(2,520
|
)
|
(4
|
)%
|
$
|
56,520
|
$
|
47,723
|
$
|
8,797
|
18
|
%
|
|||||||||||||||
|
Net support revenue
|
21,413
|
18,153
|
3,260
|
18
|
%
|
18,153
|
11,904
|
6,249
|
52
|
%
|
||||||||||||||||||||||
|
Total revenue
|
$
|
75,413
|
$
|
74,673
|
$
|
740
|
1
|
%
|
$
|
74,673
|
$
|
59,627
|
$
|
15,046
|
25
|
%
|
||||||||||||||||
Our revenue is derived from two sources: (1) product revenue, which includes sales of our hardware appliances bundled with software licenses, separate software or term licenses or software upgrades; and (2) service revenue, which consists primarily of software maintenance and customer support revenue and secondarily of professional services. Maintenance and customer support revenue is recognized over the support period, which is typically twelve months. Our product revenues tend to vary seasonally and are typically higher in the second half of the year as compared to the first half of the year.
2014 Compared to 2013. Total revenue in 2014 was $75.4 million, an increase of 1% compared to $74.7 million in 2013, and reflected a 4% decrease in net product revenue offset by an 18% increase in net support revenue. The decrease in net product revenue in 2014 compared to 2013 reflected fewer orders from service provider customers in the United States region offset by growth in sales from service provider customers in international markets, including Europe, the Middle East and Latin America. The increase in net support revenue in 2014 compared to 2013 reflected the continued expansion of the installed base of our product to which we have sold ongoing support services, as well as growth in professional services revenue. The relative increases in total support revenue will fluctuate over time depending on the number of new customers, support renewals from continuing customers and completed professional service projects during the period. For the year ended December 31, 2014, no single customer accounted for more than 10% of net revenues. For the year ended December 31, 2013, revenue from three customers, Shaw Communications, Inc., British Telecommunications plc and Itochu Techno-Solutions Corp., represented 13%, 12% and 10% of net revenues, respectively, with no other single customer accounting for more than 10% of net revenues. NAVL revenue contributed $3.6 million in product revenue and $0.8 million in support revenue for the year ended December 31, 2014 compared to $1.7 million in product revenue and $0.9 million in support revenue for the year ended December 31, 2013.
2013 Compared to 2012. Total revenue in 2013 was $74.7 million, an increase of 25% compared to $59.6 million in 2012, and reflected an 18% increase in net product revenue and a 52% increase in net support revenue. The increase in net product revenue in 2013 compared to 2012 reflected orders from new Tier 1 service provider customers and follow-on orders from existing customers and continued sales to our network operator customers, including mobile service providers, fixed line service providers and cable MSOs, as well as NAVL revenue following the acquisition of Vineyard in January 2013. We also continued to add new enterprise and higher education customers. Additionally, the increase in revenue reflected our continued expansion in international markets, including the Middle East, Japan and Latin America. Net product revenue reflected increased sales of our mid-range PL8000 series products and PacketLogic Subscriber Management software, and the ramp-up in sales of our high-end PL20000 series products. The increase in net support revenue in 2013 compared to 2012 reflected the continued expansion of the installed base of our product to which we have sold ongoing support services, as well as growth in professional services revenue. There was no revenue in our 2012 results attributable to Vineyard as the acquisition was completed in early 2013.
Sales made to customers located outside the United States as a percentage of total net revenues were 83%, 77% and 67% for the years ended December 31, 2014, 2013 and 2012, respectively.
For the year ending December 31, 2015, we expect total revenue to increase approximately 15% compared to total revenue for the year ended December 31, 2014.
Cost of Sales
Cost of sales includes: (i) material costs and direct labor for products sold, (ii) costs for warranty, (iii) adjustments to inventory values, including the write-down of slow moving or obsolete inventory, and (iv) costs for support and professional service personnel.
The following table presents the breakdown of cost of sales by category for the years ended December 31, 2014, 2013 and 2012:
|
Year Ended December 31,
|
Year Ended December 31,
|
|||||||||||||||||||||||||||||||
|
2014
|
2013
|
Increase
(Decrease)
|
2013
|
2012
|
Increase
(Decrease)
|
|||||||||||||||||||||||||||
|
Amount
|
Percent
|
Amount
|
Percent
|
|||||||||||||||||||||||||||||
|
($ in thousands)
|
($ in thousands)
|
|||||||||||||||||||||||||||||||
|
Product Costs
|
$
|
26,676
|
$
|
30,461
|
$
|
(3,785
|
)
|
(12
|
)%
|
$
|
30,461
|
$
|
17,720
|
$
|
12,741
|
72
|
%
|
|||||||||||||||
|
Percent of net product revenue
|
49
|
%
|
54
|
%
|
54
|
%
|
37
|
%
|
||||||||||||||||||||||||
|
Support costs
|
4,531
|
3,399
|
$
|
1,132
|
33
|
%
|
3,399
|
1,749
|
$
|
1,650
|
94
|
%
|
||||||||||||||||||||
|
Percent of net support revenue
|
21
|
%
|
19
|
%
|
19
|
%
|
15
|
%
|
||||||||||||||||||||||||
|
Total cost of sales
|
$
|
31,207
|
$
|
33,860
|
$
|
(2,653
|
)
|
(8
|
)%
|
$
|
33,860
|
$
|
19,469
|
$
|
14,391
|
74
|
%
|
|||||||||||||||
|
Percent of net total revenue
|
41
|
%
|
45
|
%
|
45
|
%
|
33
|
%
|
||||||||||||||||||||||||
2014 compared to 2013. Total cost of sales in 2014 decreased by $2.7 million compared to 2013, and decreased as a percentage of total revenue by 4 percentage points. The decrease in cost of sales in 2014 reflected reduced material costs associated with a decrease in product sales, partially offset by higher support costs due to increased customer support and professional services headcount. Stock-based compensation recorded to cost of sales in each of the years ended December 31, 2014 and 2013 was $0.4 million.
2013 compared to 2012. Total cost of sales in 2013 increased by $14.4 million compared to 2012, and increased as a percentage of total revenue by 12 percentage points. The increase in cost of sales in 2013 reflected higher material costs associated with increased product sales and higher support costs for increased customer support and professional services headcount. The increase in the year ended December 31, 2013 also reflected $1.1 million of amortization of developed technology intangible assets acquired as part of the Vineyard acquisition in January 2013. The increase in cost of sales as a percentage of net total revenue primarily reflected a higher proportion of hardware sales bundled with software sales, including greater chassis-based hardware sales in 2013 as compared to 2012. Stock-based compensation recorded to cost of sales in the year ended December 31, 2013 was $0.4 million, compared to $0.2 million in the year ended December 31, 2012.
Gross Profit
|
Year Ended December 31,
|
Year Ended December 31,
|
|||||||||||||||||||||||||||||||
|
|
|
2014
|
|
2013
|
Increase
(Decrease)
|
|
2013
|
|
2012
|
Increase
(Decrease)
|
||||||||||||||||||||||
|
|
Amount
|
Percent
|
|
Amount
|
Percent
|
|||||||||||||||||||||||||||
|
|
($ in thousands)
|
($ in thousands)
|
||||||||||||||||||||||||||||||
|
|
||||||||||||||||||||||||||||||||
|
Gross profit
|
$
|
44,206
|
$
|
40,813
|
$
|
3,393
|
8
|
%
|
$
|
40,813
|
$
|
40,158
|
$
|
655
|
2
|
%
|
||||||||||||||||
|
Percent of total net revenue
|
59
|
%
|
55
|
%
|
55
|
%
|
67
|
%
|
||||||||||||||||||||||||
2014 compared to 2013. Our gross margin for 2014 increased by 4 percentage points to 59% from 55% in the year ended December 31, 2013. The increase resulted primarily from the higher level of support revenue in the year ended December 31, 2014, which has a higher margin than our product sales, and increased term license revenue. Additionally, we earned higher margins on our product sales in 2014 as compared to 2013.
2013 compared to 2012. Our gross margin for 2013 decreased by 12 percentage points to 55% from 67% in 2012. The decrease resulted from a higher proportion of hardware sales bundled with software sales, particularly from sales of our chassis-based PL20000 series products, which were sold with low initial quantities of bundled software licenses in 2013, higher support and service costs and amortization of acquired intangible assets. Gross profit in 2013 reflected increased sales of our chassis-based products, which typically have a lower margin compared with our appliance-based products.
Our gross margin rate in any given period is impacted by the product mix in that period, and we expect variability in our gross margin rate to continue in the future.
Operating Expenses
|
Year Ended December 31,
|
Year Ended December 31,
|
|||||||||||||||||||||||||||||||
|
|
2014
|
2013
|
Increase
(Decrease)
|
2013
|
2012
|
Increase
(Decrease)
|
||||||||||||||||||||||||||
|
Amount
|
Percent
|
Amount
|
Percent
|
|||||||||||||||||||||||||||||
|
($ in thousands)
|
($ in thousands)
|
|||||||||||||||||||||||||||||||
|
Research and development
|
$
|
16,722
|
$
|
17,548
|
$
|
(826
|
)
|
(5
|
)%
|
$
|
17,548
|
$
|
7,472
|
$
|
10,076
|
135
|
%
|
|||||||||||||||
|
Sales and marketing
|
27,831
|
29,251
|
(1,420
|
)
|
(5
|
)%
|
29,251
|
18,158
|
11,093
|
61
|
%
|
|||||||||||||||||||||
|
General and administrative
|
11,738
|
12,036
|
(298
|
)
|
(2
|
)%
|
12,036
|
9,223
|
2,813
|
30
|
%
|
|||||||||||||||||||||
|
Impairment of goodwill and purchased intangible assets
|
12,380
|
-
|
12,380
|
n/a
|
|
-
|
-
|
-
|
n/a
|
|
||||||||||||||||||||||
|
Total
|
$
|
68,671
|
$
|
58,835
|
$
|
9,836
|
17
|
%
|
$
|
58,835
|
$
|
34,853
|
$
|
23,982
|
69
|
%
|
||||||||||||||||
2014 compared to 2013. In 2014, our total operating expenses increased as compared to the year ended December 31, 2013 due to impairment charges of $12.4 million associated with NAVL goodwill and purchased intangible assets. Excluding these charges, total operating expenses decreased $2.5 million from the prior year. The decrease was primarily due to a decrease in amortization of deferred compensation costs associated with retention agreements with Vineyard’s three founders, which were $0.1 million in 2014 as these costs became fully amortized, compared to $5.8 million in 2013. The decrease also reflected a decrease in business development costs to $0.2 million in 2014 compared to $1.6 million in 2013. The costs in 2013 were primarily associated with the Vineyard acquisition. These reductions were partially offset by increases in product development costs for our next generation PacketLogic products, severance and related costs associated with cost reduction efforts and higher compensation costs associated with additional investment in sales and research and development personnel.
On a non-GAAP basis, after adjusting for stock-based compensation, amortization of intangible assets, cost reduction efforts, impairment of goodwill and intangible assets, deferred compensation and business development expenses, operating expenses in 2014 were $49.9 million compared to $46.3 million in 2013. The increase in operating expenses on a non-GAAP basis reflected investment in sales personnel and in product development and quality. (See page 44 for a reconciliation of this non-GAAP financial measure to the most comparable GAAP measure and other important information.)
We took certain cost reduction steps during 2014 to contain spending in order to improve our profitability. These steps consisted of a reduction in workforce, which resulted in severance and other employee-related costs of $1.1 million in 2014, and also included steps to reduce spending on outside professionals.
2013 compared to 2012. In 2013, our total operating expenses increased as compared to the year ended December 31, 2012 to support growth in the scale of our operations. In 2013, we also hired additional employees in each function of our company, added employees from the Vineyard acquisition, invested in testing equipment for the development of our products, continued investing in our operating and accounting system, and increased the use of outside services, including legal, audit and accounting services.
Research and Development
Research and development expenses include costs associated with personnel focused on the development or improvement of our products, prototype materials, initial product certifications, testing equipment and software costs. Research and development costs include sustaining and enhancement efforts for products already released and development costs associated with planned new products.
|
Year Ended December 31,
|
Year Ended December 31,
|
|||||||||||||||||||||||||||||||
|
|
|
2014
|
|
2013
|
Increase
(Decrease)
|
|
2013
|
|
2012
|
Increase
(Decrease)
|
||||||||||||||||||||||
|
|
Amount
|
Percent
|
|
Amount
|
Percent
|
|||||||||||||||||||||||||||
|
|
($ in thousands)
|
($ in thousands)
|
||||||||||||||||||||||||||||||
|
|
||||||||||||||||||||||||||||||||
|
Research and development
|
$
|
16,722
|
$
|
17,548
|
$
|
(826
|
)
|
(5
|
)
%
|
$
|
17,548
|
$
|
7,472
|
$
|
10,076
|
135
|
%
|
|||||||||||||||
|
As a percentage of net revenue
|
22
|
%
|
23
|
%
|
23
|
%
|
12
|
%
|
||||||||||||||||||||||||
2014 compared to 2013. Research and development expenses for 2014 decreased by $0.8 million compared to 2013. The decrease was mainly due to a reduction of $2.9 million in deferred compensation costs associated with the Vineyard acquisition, which was fully amortized in the first quarter of 2014. This decrease was partially offset by increases in compensation related expenses of $0.6 million associated with increased headcount, severance and related costs of $0.3 million, depreciation of $0.5 million and product development and certification costs for our new products of $0.5 million. Stock-based compensation recorded to research and development expense was $1.4 million in 2014 compared to $1.2 million in 2013.
On a non-GAAP basis, after adjusting for stock-based compensation, cost reduction efforts and deferred compensation, research and development expenses for the year ended December 31, 2014 were $15.0 million as compared to $13.4 million for the year ended December 31, 2013. The increase resulted primarily from higher product development costs and compensation costs associated with additional personnel as we expanded our research and development group to develop the next generation PacketLogic solutions and other new product initiatives. (See page 44 for a reconciliation of this non-GAAP financial measure to the most comparable GAAP measure and other important information.)
2013 compared to 2012. Research and development expenses for 2013 increased by $10.1 million compared to 2012 as a result of increased research and development personnel hired during 2013, the addition of employees from our acquisition of Vineyard and the corresponding additional employee compensation costs, as well as higher depreciation costs related to increased investments in testing equipment and software. We also recognized in 2013 $3.0 million in compensation costs related to retention agreements with two of the three founders of Vineyard Networks Inc. The additional personnel in 2013 were hired to enhance our core product features and functionality in order to support new sales and to achieve follow-on sales to our current customers. Stock-based compensation recorded to research and development expenses was $1.2 million in 2013 compared to $0.3 million in 2012.
Sales and Marketing
Sales and marketing expenses primarily include personnel costs, sales commissions and marketing expenses, such as trade shows, channel development and product marketing and promotional literature.
|
Year Ended December 31,
|
Year Ended December 31,
|
||||||||||||||||||||||||||||||||
|
|
|
2014
|
|
2013
|
Increase
(Decrease)
|
|
2013
|
|
2012
|
Increase
(Decrease)
|
|||||||||||||||||||||||
|
|
Amount
|
|
Percent
|
|
Amount
|
Percent
|
|||||||||||||||||||||||||||
|
|
($ in thousands)
|
($ in thousands)
|
|||||||||||||||||||||||||||||||
|
|
|||||||||||||||||||||||||||||||||
|
Sales and marketing
|
$
|
27,831
|
$
|
29,251
|
$
|
(1,420
|
)
|
(5
|
)%
|
$
|
29,251
|
$
|
18,158
|
$
|
11,093
|
61
|
%
|
||||||||||||||||
|
As a percentage of net revenue
|
37
|
%
|
39
|
%
|
39
|
%
|
31
|
%
|
|||||||||||||||||||||||||
2014 compared to 2013. Sales and marketing expenses for 2014 decreased by $1.4 million compared to 2013. The decrease was mainly due to a reduction of $2.9 million in deferred compensation costs associated with the Vineyard acquisition, which was fully amortized in the first quarter of 2014. This decrease was partially offset by an increase in severance and related expenses of $0.6 million and an increase in compensation and related costs associated with increased headcount in the EMEA region of $0.9 million. Stock-based compensation recorded to sales and marketing expense was $1.5 million in 2014 compared to $1.7 million in 2013.
On a non-GAAP basis, after adjusting for stock-based compensation, amortization of intangible assets, cost reduction efforts and deferred compensation, sales and marketing expenses for the year ended December 31, 2014 were $25.3 million as compared to $24.2 million for the year ended December 31, 2013. The $1.1 million increase was mainly due to an increase in employee compensation and related expenses for the year ended December 31, 2014 associated with higher headcount in business partnership development. (See page 44 for a reconciliation of this non-GAAP measure to the most comparable GAAP financial measure and other important information.)
2013 compared to 2012. Sales and marketing expenses for 2013 increased by $11.1 million compared to 2012. The increase reflected the addition of sales and marketing personnel in 2013, including the addition of employees from our acquisition of Vineyard, and the corresponding higher compensation costs and higher commission costs as a result of the increase in revenue. We also recognized in 2013 $2.9 million in compensation costs related to a retention agreement with one of the three founders of Vineyard Networks Inc. Stock-based compensation recorded to sales and marketing expense was $1.7 million in 2013 compared to $1.2 million in 2012.
General and Administrative
General and administrative expenses consist primarily of personnel and facilities costs related to our executive and finance functions and fees for professional services. Professional services include costs for legal advice and services, accounting and tax professionals, independent auditors and investor relations.
|
Year Ended December 31,
|
Year Ended December 31,
|
|||||||||||||||||||||||||||||||
|
|
|
2014
|
|
2013
|
Increase
(Decrease)
|
|
2013
|
|
2012
|
Increase
(Decrease)
|
||||||||||||||||||||||
|
|
Amount
|
Percent
|
|
Amount
|
Percent
|
|||||||||||||||||||||||||||
|
|
($ in thousands)
|
($ in thousands)
|
||||||||||||||||||||||||||||||
|
|
||||||||||||||||||||||||||||||||
|
General and administrative
|
$
|
11,738
|
$
|
12,036
|
$
|
(298
|
)
|
(2
|
)%
|
$
|
12,036
|
$
|
9,223
|
$
|
2,813
|
30
|
%
|
|||||||||||||||
|
As a percentage of net revenue
|
16
|
%
|
16
|
%
|
16
|
%
|
16
|
%
|
||||||||||||||||||||||||
2014 compared to 2013. General and administrative expenses for 2014 decreased by $0.3 million compared to 2013. The decrease was mainly due to a reduction of business development costs of $1.4 million, which in 2013, were primarily associated with the Vineyard acquisition, primarily for accounting and investment banking fees. This decrease was partially offset by an increase in compensation related expenses associated with higher headcount of $0.9 million. Stock-based compensation recorded to general and administrative expense was $1.9 million in 2014 compared to $1.8 million in 2013.
On a non-GAAP basis, after adjusting for stock-based compensation, cost reduction efforts and business development costs, general and administrative expenses for the year ended December 31, 2014 were $9.6 million as compared to $8.7 million for the year ended December 31, 2013. The increase was mainly due to an increase in compensation costs associated with higher headcount and higher costs for outside professional services. (See page 44 for a reconciliation of this non-GAAP financial measure to the most comparable GAAP measure and other important information.)
2013 compared to 2012. General and administrative expenses for 2013 increased by $2.8 million compared to 2012, reflecting increased accounting and human resource personnel and personnel related costs, increased legal and audit fees, and an increased use of contractors and outside services. The increase also reflected $1.6 million in business development costs including costs associated with the Vineyard acquisition for legal, accounting and investment banking fees in the year ended December 31, 2013, compared to $1.2 million in such costs in 2012. Stock-based compensation recorded to general and administrative expense was $1.8 million in 2013 compared to $1.1 million in 2012.
Impairment of Goodwill and Purchased Intangible Assets
During the third quarter of fiscal year 2014, we considered the effect of the economic environment in which our NAVL reporting unit markets our products and determined that sufficient indicators existed requiring us to perform an interim impairment review of the NAVL reporting unit goodwill and long-lived assets. The indicators consisted primarily of: (1) decelerating revenue growth during the third quarter of fiscal year 2014 and a decline in forecasted revenue in future quarters, and (2) lower than anticipated total addressable market for NAVL products. As a result, we performed impairment reviews of our NAVL goodwill and long-lived assets within the NAVL reporting unit. The reviews were performed at the NAVL reporting unit level. Based on our reviews, we recorded total impairment charges of $12.4 million: $10.9 million to write down the value of NAVL goodwill to zero, and $0.7 and $0.8 million to write down the carrying values of NAVL developed technology and customer relationship intangible assets, respectively, to their current estimated fair values. See Note 7 – “Goodwill and Intangible Assets” of the Notes to Consolidated Financial Statements for additional details.
Interest and Other Expense
|
Year Ended December 31,
|
Year Ended December 31,
|
|||||||||||||||||||||||||||||||
|
|
2014
|
|
2013
|
Increase
(Decrease)
|
|
2013
|
|
2012
|
Increase
(Decrease)
|
|||||||||||||||||||||||
|
|
Amount
|
Percent
|
|
Amount
|
Percent
|
|||||||||||||||||||||||||||
|
($ in thousands)
|
($ in thousands)
|
|||||||||||||||||||||||||||||||
|
Interest and other income
|
$
|
303
|
601
|
$
|
(298
|
)
|
(50
|
)%
|
$
|
601
|
362
|
$
|
239
|
66
|
%
|
|||||||||||||||||
|
Interest expense and other
|
(902
|
)
|
(40
|
)
|
(862
|
)
|
2,155
|
%
|
(40
|
)
|
(213
|
)
|
173
|
81
|
%
|
|||||||||||||||||
|
Total interest and other income (expense), net
|
$
|
(599
|
)
|
$
|
561
|
$
|
(1,160
|
)
|
(207
|
)%
|
$
|
561
|
$
|
149
|
$
|
412
|
277
|
%
|
||||||||||||||
2014 Compared to 2013. Interest and other income decreased in 2014 compared to 2013 due to lower interest earned on cash and investment balances in 2014. Interest expense and other increased in 2014 compared to 2013, due to an increase in foreign currency losses in the year ended December 31, 2014.
2013 Compared to 2012. Interest and other income increased in 2013 compared to 2012 due to realized foreign currency gains offset by slightly lower interest earned on cash and investment balances in 2013. Interest expense and other decreased in 2013 compared to 2012, reflecting reduced foreign currency transaction losses in 2013 compared to 2012.
Provision for (benefit from) Income Taxes
|
|
Year Ended December 31,
|
Year Ended December 31,
|
||||||||||||||||||||||||||||||
|
|
2014
|
2013
|
Increase
(Decrease)
|
2013
|
2012
|
Increase
(Decrease)
|
||||||||||||||||||||||||||
|
|
($ in thousands)
|
($ in thousands)
|
||||||||||||||||||||||||||||||
|
Income tax provision (benefit)
|
$
|
(248
|
)
|
$
|
(1,177
|
)
|
$
|
929
|
(79
|
)%
|
$
|
(1,177
|
)
|
$
|
123
|
$
|
(1,300
|
)
|
(1057
|
)%
|
||||||||||||
We are subject to taxation in the U.S., Australia, Canada, Japan, Singapore and Sweden, as well as in various U.S. states, including California. The benefit for income tax in the year ended December 31, 2014 was largely comprised of the reversal of the Canadian deferred tax liability related to the impairment of intangibles. The reduction in the tax benefit for the year ended December 31, 2014 relates to the valuation allowance placed on the Canadian net deferred tax asset which has the effect of limiting the tax benefit. The tax benefits were offset by state taxes, foreign withholding taxes and earnings taxed in foreign jurisdictions.
We have established a valuation allowance for substantially all of our deferred tax assets. We calculated the valuation allowance in accordance with the provisions of ASC Topic 740, which requires that a valuation allowance be established or maintained when it is “more likely than not” that all or a portion of deferred tax assets will not be realized. During 2013 and 2012, we were able to utilize a portion of our net operating loss carry-forwards and, to the extent utilized, we have reversed any previous reserve. We will continue to reserve for substantially all net deferred tax assets until there is sufficient evidence to warrant reversal.
Important Information Regarding non-GAAP Financial Measures
In this Annual Report on Form 10-K, we include unaudited non-GAAP financial measures. Our management believes that certain non-GAAP financial measures provide investors with additional useful information and regularly uses these supplemental non-GAAP financial measures internally to understand and manage our business and forecast future periods. In addition, our management believes that these non-GAAP financial measures, when taken together with the corresponding GAAP measures, provide additional insight into the underlying factors and trends affecting both our performance and our cash-generating potential.
Our non-GAAP financial measures include adjustments for stock-based compensation expenses; business development expenses; cost reduction efforts; acquisition-related intangible asset and deferred compensation amortization; and income tax effects. We have excluded the effect of stock-based compensation, the cost of outside professional services for negotiating and performing legal, accounting and tax due diligence for potential mergers and acquisitions and other strategic transactions, expenses connected with cost reduction efforts, acquisition-related intangible asset and deferred compensation amortization, impairment of goodwill and intangible assets and income tax effects from our non-GAAP gross profit, operating expenses and net income measures. Stock-based compensation, which represents the estimated fair value of stock options, restricted stock and restricted stock units granted to employees, is excluded since grant activities vary significantly from quarter to quarter in both quantity and fair value. In addition, although stock-based compensation will recur in future periods, excluding this expense allows us to better compare core operating results with those of our competitors who also generally exclude stock-based compensation from their core operating results and who may have different granting patterns and types of equity awards and who may use different option valuation assumptions than we do. Business development expenses are necessary as part of certain growth strategies, such as through mergers and acquisitions and other strategic transactions, and will occur when such transactions are pursued. We have excluded these expenses because they can vary materially from period-to-period and transaction-to-transaction and expenses associated with these business development activities are not considered a key measure of our operating performance. Cost reduction efforts occur with shifts in objectives and evolving requirements of the business and can result in fluctuating expenses connected with reducing employment in certain areas. We have excluded these expenses because they can vary significantly from period-to-period and are not considered a key measure of our operating performance. Acquisition-related intangible assets and deferred compensation amortization and income tax effects represent non-cash charges and benefits that result from the accounting for acquisitions. We have excluded these items because, in any period, they may not directly correlate to the underlying performance of our business and can vary materially from period-to-period and transaction-to-transaction. In addition, we exclude these acquisition-related costs and benefits when evaluating our current operating performance.
Our non-GAAP financial measures may not reflect the full economic impact of our activities. Further, these non-GAAP financial measures may be unique to us as they may differ from non-GAAP financial measures used by other companies, including our competitors. As such, this presentation of non-GAAP financial measures may not enhance the comparability of our results to the results of other companies. Therefore, these non-GAAP financial measures are limited in their usefulness and investors are cautioned not to place undue reliance on our non-GAAP financial measures. In addition, investors are cautioned that these non-GAAP financial measures are not intended to be considered in isolation and should be read in conjunction with our consolidated financial statements prepared in accordance with GAAP.
A reconciliation of unaudited non-GAAP financial measures to the most directly comparable GAAP financial measure, net loss, is as follows:
|
Year Ended December 31,
|
||||||||||||
|
2014
|
2013
|
2012
|
||||||||||
|
Sales:
|
||||||||||||
|
Product sales
|
$
|
54,000
|
$
|
56,520
|
$
|
47,723
|
||||||
|
Support sales
|
21,413
|
18,153
|
11,904
|
|||||||||
|
Total sales
|
75,413
|
74,673
|
59,627
|
|||||||||
|
Cost of sales:
|
||||||||||||
|
Product cost of sales, GAAP
|
26,676
|
30,461
|
17,720
|
|||||||||
|
Non-GAAP adjustments:
|
||||||||||||
|
Stock-based compensation (1)
|
(39
|
)
|
(84
|
)
|
(76
|
)
|
||||||
|
Amortization of intangibles (2)
|
(995
|
)
|
(1,094
|
)
|
-
|
|||||||
|
Cost reduction efforts (3)
|
(237
|
)
|
-
|
-
|
||||||||
|
Product cost of sales, non-GAAP
|
25,405
|
29,283
|
17,644
|
|||||||||
|
Support cost of sales, GAAP
|
4,531
|
3,399
|
1,749
|
|||||||||
|
Non-GAAP adjustments:
|
||||||||||||
|
Stock-based compensation (1)
|
(351
|
)
|
(302
|
)
|
(74
|
)
|
||||||
|
Support cost of sales, non-GAAP
|
4,180
|
3,097
|
1,675
|
|||||||||
|
Total cost of sales, non-GAAP
|
29,585
|
32,380
|
19,319
|
|||||||||
|
Gross profit, non-GAAP
|
45,828
|
42,293
|
40,308
|
|||||||||
|
Operating expenses:
|
||||||||||||
|
Research and development
|
16,722
|
17,548
|
7,472
|
|||||||||
|
Non-GAAP adjustments:
|
||||||||||||
|
Stock-based compensation (1)
|
(1,427
|
)
|
(1,225
|
)
|
(322
|
)
|
||||||
|
Cost reduction efforts (3)
|
(264
|
)
|
-
|
-
|
||||||||
|
Deferred compensation (5)
|
(65
|
)
|
(2,946
|
)
|
-
|
|||||||
|
Research and development, non-GAAP
|
14,966
|
13,377
|
7,150
|
|||||||||
|
Sales and marketing
|
27,831
|
29,251
|
18,158
|
|||||||||
|
Non-GAAP adjustments:
|
||||||||||||
|
Stock-based compensation (1)
|
(1,525
|
)
|
(1,682
|
)
|
(1,175
|
)
|
||||||
|
Amortization of intangibles (2)
|
(389
|
)
|
(472
|
)
|
-
|
|||||||
|
Cost reduction efforts (3)
|
(606
|
)
|
-
|
-
|
||||||||
|
Deferred compensation (5)
|
-
|
(2,863
|
)
|
-
|
||||||||
|
Sales and marketing, non-GAAP
|
25,311
|
24,234
|
16,983
|
|||||||||
|
General and administrative
|
11,738
|
12,036
|
9,223
|
|||||||||
|
Non-GAAP adjustments:
|
||||||||||||
|
Stock-based compensation (1)
|
(1,856
|
)
|
(1,764
|
)
|
(1,137
|
)
|
||||||
|
Cost reduction efforts (3)
|
(27
|
)
|
-
|
-
|
||||||||
|
Business development expenses (6)
|
(229
|
)
|
(1,616
|
)
|
(1,236
|
)
|
||||||
|
General and administrative, non-GAAP
|
9,626
|
8,656
|
6,850
|
|||||||||
|
Impairment of goodwill and purchased intangible assets
|
12,380
|
-
|
-
|
|||||||||
|
Non-GAAP adjustments:
|
||||||||||||
|
Impairment of goodwill and purchased intangible assets (4)
|
(12,380
|
)
|
-
|
-
|
||||||||
|
Impairment of goodwill and purchased intangible assets, non-GAAP
|
-
|
-
|
-
|
|||||||||
|
Total operating expenses, non-GAAP
|
49,903
|
46,267
|
30,983
|
|||||||||
|
Income (loss) from operations, non-GAAP
|
(4,075
|
)
|
(3,974
|
)
|
9,325
|
|||||||
|
Interest and other income (expense):
|
||||||||||||
|
Other income (expense), net
|
(599
|
)
|
561
|
149
|
||||||||
|
Income tax provision (benefit)
|
(248
|
)
|
(1,177
|
)
|
123
|
|||||||
|
Non-GAAP adjustment (7)
|
622
|
1,408
|
-
|
|||||||||
|
Income tax provision, non-GAAP
|
374
|
231
|
123
|
|||||||||
|
Net income (loss), non-GAAP
|
$
|
(5,048
|
)
|
$
|
(3,644
|
)
|
$
|
9,351
|
||||
|
Net income (loss) per share – diluted, non-GAAP
|
$
|
(0.25
|
)
|
$
|
(0.18
|
)
|
$
|
0.51
|
||||
|
Shares used in computing net income (loss) per share:
|
||||||||||||
|
Diluted
|
20,450
|
20,091
|
18,337
|
|||||||||
|
Reconciliation of net loss:
|
||||||||||||
|
U.S. GAAP as reported
|
$
|
(24,816
|
)
|
$
|
(16,284
|
)
|
$
|
5,331
|
||||
|
Non-GAAP adjustments:
|
||||||||||||
|
Stock-based compensation (1)
|
5,198
|
5,057
|
2,784
|
|||||||||
|
Amortization of intangibles (2)
|
1,384
|
1,566
|
-
|
|||||||||
|
Cost reduction efforts (3)
|
1,134
|
-
|
-
|
|||||||||
|
Impairment of goodwill and purchased intangible assets (4)
|
12,380
|
-
|
-
|
|||||||||
|
Deferred compensation (5)
|
65
|
5,809
|
-
|
|||||||||
|
Business development expenses (6)
|
229
|
1,616
|
1,236
|
|||||||||
|
Income tax provision, non-GAAP (7)
|
(622
|
)
|
(1,408
|
)
|
-
|
|||||||
|
As adjusted
|
$
|
(5,048
|
)
|
$
|
(3,644
|
)
|
$
|
9,351
|
||||
|
Reconciliation of diluted net loss per share:
|
||||||||||||
|
U.S. GAAP as reported
|
$
|
(1.21
|
)
|
$
|
(0.81
|
)
|
$
|
0.29
|
||||
|
Non-GAAP adjustments:
|
||||||||||||
|
Stock-based compensation (1)
|
0.25
|
0.25
|
0.15
|
|||||||||
|
Amortization of intangibles (2)
|
0.06
|
0.08
|
-
|
|||||||||
|
Cost reduction efforts (3)
|
0.06
|
-
|
-
|
|||||||||
|
Impairment of goodwill and purchased intangible assets (4)
|
0.61
|
-
|
-
|
|||||||||
|
Deferred compensation (5)
|
-
|
0.29
|
-
|
|||||||||
|
Business development expenses (6)
|
0.01
|
0.08
|
0.07
|
|||||||||
|
Income tax provision, non-GAAP (7)
|
(0.03
|
)
|
(0.07
|
)
|
-
|
|||||||
|
As adjusted
|
$
|
(0.25
|
)
|
$
|
(0.18
|
)
|
$
|
0.51
|
||||
|
Shares used in computing net income (loss) per share:
|
20,450
|
20,091
|
18,337
|
|||||||||
| (1) | Stock-based compensation expense is calculated in accordance with the fair value recognition provisions of ASC Topic 718. |
| (2) | Amortization expense associated with intangible assets acquired in the Vineyard acquisition. |
| (3) | Severance and other employee-related costs in connection with our cost-reduction efforts. |
| (4) | Impairment charges to write-down the carrying value of goodwill and purchased intangible assets associated with the Vineyard acquisition as a result of lower than anticipated total addressable market and revenue growth of our NAVL products. See Note 7 – “Goodwill and Intangible Assets” of the Notes to Consolidated Financial Statements for additional details. |
| (5) | Amortization of amounts paid under retention agreements with Vineyard’s three founders. These amounts were paid during the first quarter of fiscal year 2014, after one year of continuous employment with us. See Note 6 – “Acquisitions” in the Notes to Consolidated Financial Statements for additional details. |
| (6) | Includes the cost of outside professional services for negotiating and performing legal, accounting and tax due diligence for potential mergers and acquisitions and other significant partnership arrangements. |
| (7) | Income tax benefit associated with the following Vineyard acquisition-related items: reversal of Vineyard’s pre-existing income tax valuation allowance upon acquisition, amortization of acquired intangible assets, Canadian valuation allowance and book to tax differences on deferred revenue. |
Liquidity and Capital Resources
Cash, Cash Equivalents and Short-term Investments
The following table summarizes the changes in our cash balance for the periods indicated:
|
Year Ended December 31,
|
||||||||||||
|
|
2014
|
2013
|
2012
|
|||||||||
|
|
(in thousands)
|
|||||||||||
|
|
||||||||||||
|
Net cash provided by (used in) operating activities
|
$
|
(1,393
|
)
|
$
|
(10,803
|
)
|
$
|
7,157
|
||||
|
Net cash provided by (used in) investing activities
|
(72,371
|
)
|
70,894
|
(92,087
|
)
|
|||||||
|
Net cash provided by financing activities
|
352
|
156
|
91,809
|
|||||||||
|
Effect of exchange rate changes on cash and cash equivalents
|
577
|
(406
|
)
|
154
|
||||||||
|
Net increase (decrease) in cash and cash equivalents
|
$
|
(72,835
|
)
|
$
|
59,841
|
$
|
7,033
|
|||||
During the year ended December 31, 2014, we used $1.4 million in cash from operating activities. Cash used in operating activities during the year ended December 31, 2014 primarily consisted of our net loss of $24.8 million, offset by non-cash charges of $23.2 million and from net working capital sources of cash of $0.2 million. Non-cash charges consisted primarily of the impairment of goodwill and purchased intangible assets of $12.4 million, stock-based compensation of $5.2 million, amortization of intangible assets of $1.4 million, amortization of premium on investments of $0.8 million, depreciation expense of $2.4 million, amortization of deferred compensation of $0.1 million and provision for excess and obsolete inventory of $1.4 million, partially offset by changes in deferred taxes of $0.5 million. Working capital sources of cash mainly consisted of a decrease in accounts receivable of $2.6 million due to strong collections, a reduction in inventory of $1.8 million due to improved inventory management, a $0.4 million increase in accrued liabilities associated with a higher level of deferred rent, accrued severance and other compensation related costs and a $0.7 million increase in deferred revenues due to increased deferred term license revenue. Working capital uses of cash consisted primarily of a decrease in accounts payable of $1.9 million resulting primarily from a decrease in inventory purchases and an increase in prepaid expenses and other current assets of $3.4 million primarily associated with prepaid royalties and software licenses.
Net cash used by investing activities of $72.9 million during the year ended December 31, 2014 consisted of purchases of short-term investments of $118.7 million and property and equipment of $3.6 million, partially offset by proceeds from the sales and maturities of short-term investments of $49.4 million.
Net cash provided by financing activities of $0.4 million during the year ended December 31, 2014 represents net proceeds from the exercise of stock options.
During the year ended December 31, 2013, we used $10.8 million in cash from operating activities as compared to $7.2 million generated from operating activities for the year ended December 31, 2012. Cash used in operating activities during the year ended December 31, 2013 primarily consisted of our net loss of $16.3 million offset by non-cash charges of $16.3 million and from net working capital uses of cash of $10.9 million. Non-cash charges consisted primarily of stock-based compensation of $5.1 million, amortization of intangible assets of $1.6 million, amortization of premium on investments of $0.9 million, depreciation expense of $1.9 million, amortization of deferred compensation of $5.8 million and provision for excess and obsolete inventory of $1.0 million, partially offset by changes in deferred taxes of $1.5 million. Working capital uses of cash consisted primarily of an increase in inventory of $8.6 million resulting from material purchases in anticipation of future sales, an increase in accounts receivable of $7.9 million resulting from higher sales and certain longer payment terms, and an advance payment to escrow of $2.7 million recorded as deferred compensation related to retention agreements with Vineyard’s three founders, which was payable after one year of continuous employment with us. Working capital sources of cash included a decrease in prepaid expenses and other current assets of $2.0 million primarily resulting from the receipt of a tax credit, an increase in accounts payable of $1.7 million resulting primarily from an increase in inventory purchases, an increase in accrued liabilities of $1.5 million as a result of higher accrued commissions on the higher level of sales and increased compensation-related accruals associated with higher headcount, and a $4.6 million increase in deferred revenue as a result of initial support contracts and support renewals from our expanding customer base, as well as term NAVL software licenses sold following the acquisition of Vineyard in January 2013.
Net cash provided by investing activities of $70.9 million during the year ended December 31, 2013 consisted of proceeds from net purchases, sales and maturities of short-term investments of $84.0 million, partially offset by net cash consideration for the acquisition of Vineyard of $9.0 million, and equipment purchases primarily of lab and testing equipment for use in research and development of $4.1 million.
Net cash provided by financing activities of $0.2 million included net proceeds from the exercise of stock options of $0.7 million, offset by the repayment of debt acquired from the Vineyard acquisition of $0.5 million.
During 2012, we generated $7.2 million in cash from operating activities, primarily consisting of our net income of $5.3 million plus non-cash charges of $5.3 million, partially offset by net working capital uses of cash of $3.4 million. Non-cash charges consisted primarily of stock-based compensation of $2.8 million, depreciation expense of $0.9 million, inventory write-downs of $0.7 million and amortization of premiums paid for investments of $0.8 million. Working capital uses of cash included an increase in inventories of $4.2 million, an increase in accounts receivable of $5.0 million and an increase in prepaid expenses and other current assets of $1.1 million. The increase in inventories resulted from material purchases near the end of 2012 for the fulfillment of expected orders and an increase in inventories deployed at customer sites that were pending final customer acceptance. The increase in accounts receivable reflected an increase in the receivables balance associated with higher sales, as well as timing of shipments as large orders were shipped near year end. The increase in prepaid expenses and other current assets was due partially to interest receivable of $0.4 million from our invested capital and to increased prepaid expenses due to our growth as well as prepaid service agreements for our accounting and operating systems. Working capital sources of cash included an increase in deferred revenue of $3.3 million, an increase in accounts payable of $2.6 million and an increase in accrued liabilities of $1.0 million. The increase in deferred revenue reflected support renewal orders from our growing customer base, as well as support purchased on new product shipments. The increase in accounts payable reflected increased inventory purchases. The increase in accrued liabilities reflected higher accrued bonuses and sales commissions as a result of increased revenue.
Net cash used in investing activities of $92.1 million in 2012 reflected purchases of short-term investments of $117.8 million using cash raised through our equity offering in the second quarter of 2012, and purchases of lab and testing equipment for use in research and development of $4.0 million, partially offset by maturities and sales of short-term investments of $22.7 million and $7.0 million, respectively.
Net cash provided by financing activities of $91.8 million included net proceeds from the issuance of common stock of $88.0 million and proceeds from the exercise of stock options and warrants of $3.8 million.
Our cash, cash equivalents and short-term investments at December 31, 2014 consisted of bank deposits with third party financial institutions, money market funds and corporate bonds. Our investments are intended to establish a high-quality portfolio that preserves principal, meets liquidity needs, avoids inappropriate concentrations and delivers an appropriate yield in relationship to our investment guidelines and market conditions. Cash equivalents consist of highly liquid investments with remaining maturities of three months or less at the date of purchase. Short-term investments have a remaining maturity of greater than three months at the date of purchase and a weighted average maturity of less than one year. All investments are classified as available for sale.
On December 10, 2009, we entered into a two-year loan and security agreement for a secured credit facility of $2.0 million for short-term working capital purposes with Silicon Valley Bank. Borrowings under the facility bore interest at the prime rate plus 1%, but not less than 5% per annum. On February 3, 2012, the agreement was amended and restated to increase the credit facility from $2.0 million to $10.0 million for an additional two-year period beginning on that date. Borrowings under the amended credit facility bear interest at the prime rate plus 1%, but not less than 4.25% on an annual basis. At December 31, 2013, we had no borrowings under this credit facility. The credit facility expired on February 2, 2014.
Based on our current cash, cash equivalents and short-term investment balances and anticipated cash flow from operations, we believe that our working capital will be sufficient to meet the cash needs of our business for at least the next twelve months. Our future capital requirements will depend on many factors, including our rate of growth, the expansion of our sales and marketing activities, development of additional channel partners and sales territories, the infrastructure costs associated with supporting a growing business and greater installed base of customers, introduction of new products, enhancement of existing products and the continued acceptance of our products. We may also enter into arrangements that require investment such as complementary businesses, service expansion, technology partnerships or acquisitions.
In January 2013, we acquired Vineyard in Canada. The aggregate consideration of approximately $26.8 million USD, consisted of $12.5 million in cash and 825,060 shares of our common stock with a gross value of $14.3 million.
Off-Balance Sheet Arrangements
As of December 31, 2014, we had no off-balance sheet arrangements as described by Item 303(a)(4) of Regulation S-K. We have not entered into any transactions with unconsolidated entities whereby we have financial guarantees, subordinated retained interests, derivative instruments or other contingent arrangements that expose us to material continuing risks, contingent liabilities, or any other obligations under a variable interest in an unconsolidated entity that provide us with financing, liquidity, market risk or credit risk support.
Contractual Obligations
The following table summarizes the contractual obligations that we were reasonably likely to incur as of December 31, 2014 and the effect that such obligations are expected to have on our liquidity and cash flows in future periods.
|
Payments Due by Period
|
||||||||||||||||||||
|
In thousands
|
|
Total
|
< 1 Year
|
1-3 Years
|
3-5 Years
|
> 5 Years
|
||||||||||||||
|
Operating leases
|
$
|
4,371
|
$
|
1,016
|
$
|
1,973
|
$
|
711
|
$
|
671
|
||||||||||
|
Unconditional purchase obligations
|
16,270
|
8,649
|
7,621
|
-
|
-
|
|||||||||||||||
|
Total
|
$
|
20,641
|
$
|
9,665
|
$
|
9,594
|
$
|
711
|
$
|
671
|
||||||||||
We use third-party suppliers to assemble and test our hardware products. In order to reduce manufacturing lead-times and ensure an adequate supply of inventories, our agreements with some of these suppliers allow them to procure long lead-time component inventory based on rolling production forecasts provided by us. We may be contractually obligated to purchase long lead-time component inventory procured by certain suppliers in accordance with our forecasts. In addition, we issue purchase orders to our third-party suppliers that may not be cancelable at any time. As of December 31, 2014, we had open non-cancelable purchase orders amounting to approximately $16.3 million, primarily with our third-party suppliers.
Foreign Currency Risk
Our sales contracts are denominated predominantly in U.S. Dollars, Swedish Krona, British Pound, Australian Dollars, Canadian Dollars and the Euro. We incur operating expenses primarily in U.S. Dollars, Swedish Krona, and Canadian Dollars. Therefore, we are subject to fluctuations in these foreign currency exchange rates. To date, exchange rate fluctuations have had a minimal impact on our revenues, operating results and cash flows, and we have not used derivative instruments to hedge our foreign currency exposures. However, the effect of a 10% change in foreign currency exchange rates could have a material effect on our future operating results or cash flows, depending on which foreign currency exchange rates change and the directional change against the U.S. Dollar.
Interest Rate Sensitivity
We had unrestricted cash, cash equivalents and short term investments totaling approximately $102.5 million at December 31, 2014. Cash equivalents and short-term investments are composed of money market funds, U.S. treasury and agency securities, commercial paper, and corporate bonds. Our investment policy requires investments to be of high credit quality, primarily rated A/A2, with the objective of minimizing the potential risk of principal loss. Short-term investments have a weighted average maturity of less than one year and are classified as available-for sale, and, consequently, are recorded on the balance sheet at fair value with unrealized gains or losses reported as a separate component of accumulated other comprehensive income (loss). Because of the short weighted-average maturity of our investment portfolio at December 31, 2014, we believe that the fair value of our investment portfolio would not be significantly impacted by either a hypothetical 100 basis point increase or decrease in market interest rates. If hypothetical market interest rates increased by 100 basis points, we may incur $0.4 million of unrealized loss. If hypothetical market interest rates decreased by 100 basis points, we may incur $0.2 million of unrealized gain.
INDEX TO CONSOLIDATED FINANCIAL STATEMENTS
|
Page
|
|
|
Report of Independent Registered Public Accounting Firm
|
51
|
|
Report of Independent Registered Public Accounting Firm
|
52
|
|
Consolidated Balance Sheets as of December 31, 2014 and 2013
|
53
|
|
Consolidated Statements of Operations for the years ended December 31, 2014, 2013 and 2012
|
54
|
|
Consolidated Statements of Comprehensive Income (Loss) for the years ended December 31, 2014, 2013 and 2012
|
55
|
|
Consolidated Statements of Stockholders’ Equity for the years ended December 31, 2014, 2013 and 2012
|
56
|
|
Consolidated Statements of Cash Flows for the years ended December 31, 2014, 2013 and 2012
|
57
|
|
Notes to Consolidated Financial Statements
|
58
|
REPORT OF INDEPENDENT REGISTERED PUBLIC ACCOUNTING FIRM
The Board of Directors and Stockholders of Procera Networks, Inc.
We have audited the accompanying consolidated balance sheet of Procera Networks, Inc. as of December 31, 2014, and the related consolidated statements of operations, comprehensive income (loss), stockholders’ equity, and cash flows for the year then ended. Our audit also included the financial statement schedule of Procera Networks, Inc. listed in the Index at Item 15(b)(2) for the year ended December 31, 2014. These financial statements and financial statement schedule are the responsibility of the Company’s management. Our responsibility is to express an opinion on these financial statements and schedule based on our audit.
We conducted our audit in accordance with the standards of the Public Company Accounting Oversight Board (United States). Those standards require that we plan and perform the audit to obtain reasonable assurance about whether the financial statements are free of material misstatement. An audit includes examining, on a test basis, evidence supporting the amounts and disclosures in the financial statements. An audit also includes assessing the accounting principles used and significant estimates made by management, as well as evaluating the overall financial statement presentation. We believe that our audit provides a reasonable basis for our opinion.
In our opinion, the consolidated financial statements referred to above present fairly, in all material respects, the financial position of Procera Networks, Inc., at December 31, 2014, and the results of its operations and its cash flows for the year then ended, in conformity with U.S. generally accepted accounting principles. Also, in our opinion, the related financial statement schedule, when considered in relation to the basic consolidated financial statements taken as a whole, presents fairly in all material respects the information set forth therein.
We also have audited, in accordance with the standards of the Public Company Accounting Oversight Board (United States), Procera Networks, Inc.’s internal control over financial reporting as of December 31, 2014, based on criteria established in Internal Control-Integrated Framework issued by the Committee of Sponsoring Organizations of the Treadway Commission in 2013 and our report dated March 12, 2015 expressed an unqualified opinion on the effectiveness of Procera Networks, Inc. internal control over financial reporting.
/s/ McGladrey LLP
San Jose, California
March 12, 2015
REPORT OF INDEPENDENT REGISTERED PUBLIC ACCOUNTING FIRM
The Board of Directors and Stockholders of Procera Networks, Inc.
We have audited the accompanying consolidated balance sheet of Procera Networks, Inc. as of December 31, 2013, and the related consolidated statements of operations, comprehensive income (loss), stockholders’ equity, and cash flows for each of the two years in the period ended December 31, 2013. Our audit also included the financial statement schedule listed in the Index at Item 15(b)(2) for the years ended December 31, 2013 and 2012. These financial statements and schedule are the responsibility of the Company’s management. Our responsibility is to express an opinion on these financial statements and schedule based on our audit.
We conducted our audits in accordance with the standards of the Public Company Accounting Oversight Board (United States). Those standards require that we plan and perform the audit to obtain reasonable assurance about whether the financial statements are free of material misstatement. An audit includes examining, on a test basis, evidence supporting the amounts and disclosures in the financial statements. An audit also includes assessing the accounting principles used and significant estimates made by management, as well as evaluating the overall financial statement presentation. We believe that our audits provide a reasonable basis for our opinion.
In our opinion, the financial statements referred to above present fairly, in all material respects, the consolidated financial position of Procera Networks, Inc., at December 31, 2013, and the consolidated results of its operations and its cash flows for each of the two years in the period ended December 31, 2013, in conformity with U.S. generally accepted accounting principles. Also, in our opinion, the related financial statement schedule, when considered in relation to the basic financial statements taken as a whole, presents fairly in all material respects the information set forth therein.
/s/ Ernst & Young LLP
Redwood City, California
March 11, 2014
PROCERA NETWORKS, INC.
CONSOLIDATED BALANCE SHEETS
(in thousands, except par value)
|
December 31,
|
||||||||
|
2014
|
2013
|
|||||||
|
ASSETS
|
||||||||
|
Current assets:
|
||||||||
|
Cash and cash equivalents
|
$
|
17,939
|
$
|
90,774
|
||||
|
Short-term investments
|
84,542
|
15,789
|
||||||
|
Accounts receivable, net of allowance of $47 and $129 at December 31, 2014 and 2013, respectively
|
21,447
|
25,008
|
||||||
|
Inventories, net
|
14,837
|
18,836
|
||||||
|
Prepaid expenses and other
|
4,913
|
2,128
|
||||||
|
Total current assets
|
143,678
|
152,535
|
||||||
|
Property and equipment, net
|
8,322
|
7,121
|
||||||
|
Intangible assets, net
|
2,957
|
6,270
|
||||||
|
Goodwill
|
960
|
12,326
|
||||||
|
Deferred tax asset
|
-
|
1,101
|
||||||
|
Other non-current assets
|
154
|
83
|
||||||
|
Total assets
|
$
|
156,071
|
$
|
179,436
|
||||
|
LIABILITIES AND STOCKHOLDERS’ EQUITY
|
||||||||
|
Current liabilities:
|
||||||||
|
Accounts payable
|
$
|
5,207
|
$
|
7,305
|
||||
|
Deferred revenue
|
11,821
|
11,633
|
||||||
|
Accrued liabilities
|
7,235
|
6,721
|
||||||
|
Total current liabilities
|
24,263
|
25,659
|
||||||
|
Non-current liabilities:
|
||||||||
|
Deferred revenue
|
3,113
|
3,273
|
||||||
|
Deferred tax liability
|
-
|
1,690
|
||||||
|
Deferred rent
|
583
|
143
|
||||||
|
Total liabilities
|
27,959
|
30,765
|
||||||
|
Commitments and contingencies (Note 10)
|
||||||||
|
Stockholders’ equity:
|
||||||||
|
Preferred stock, $0.001 par value; 15,000 shares authorized; none issued and outstanding
|
-
|
-
|
||||||
|
Common stock, $0.001 par value; 32,500 shares authorized; 20,756 and 20,652 shares issued and outstanding at December 31, 2014 and 2013, respectively
|
21
|
21
|
||||||
|
Additional paid-in capital
|
225,313
|
219,763
|
||||||
|
Accumulated other comprehensive loss
|
(3,190
|
)
|
(1,897
|
)
|
||||
|
Accumulated deficit
|
(94,032
|
)
|
(69,216
|
)
|
||||
|
Total stockholders’ equity
|
128,112
|
148,671
|
||||||
|
Total liabilities and stockholders’ equity
|
$
|
156,071
|
$
|
179,436
|
||||
The accompanying notes are an integral part of these consolidated financial statements.
PROCERA NETWORKS, INC.
CONSOLIDATED STATEMENTS OF OPERATIONS
(in thousands, except per share data)
|
Year Ended December 31,
|
||||||||||||
|
2014
|
2013
|
2012
|
||||||||||
|
Sales:
|
||||||||||||
|
Product sales
|
$
|
54,000
|
$
|
56,520
|
$
|
47,723
|
||||||
|
Support sales
|
21,413
|
18,153
|
11,904
|
|||||||||
|
Total sales
|
75,413
|
74,673
|
59,627
|
|||||||||
|
Cost of sales:
|
||||||||||||
|
Product cost of sales
|
26,676
|
30,461
|
17,720
|
|||||||||
|
Support cost of sales
|
4,531
|
3,399
|
1,749
|
|||||||||
|
Total cost of sales
|
31,207
|
33,860
|
19,469
|
|||||||||
|
Gross profit
|
44,206
|
40,813
|
40,158
|
|||||||||
|
Operating expenses:
|
||||||||||||
|
Research and development
|
16,722
|
17,548
|
7,472
|
|||||||||
|
Sales and marketing
|
27,831
|
29,251
|
18,158
|
|||||||||
|
General and administrative
|
11,738
|
12,036
|
9,223
|
|||||||||
|
Impairment of goodwill and purchased intangible assets
|
12,380
|
-
|
-
|
|||||||||
|
Total operating expenses
|
68,671
|
58,835
|
34,853
|
|||||||||
|
Income (loss) from operations
|
(24,465
|
)
|
(18,022
|
)
|
5,305
|
|||||||
|
Interest and other income (expense):
|
||||||||||||
|
Interest and other income
|
303
|
601
|
362
|
|||||||||
|
Interest and other expense
|
(902
|
)
|
(40
|
)
|
(213
|
)
|
||||||
|
Total other income (expense), net
|
(599
|
)
|
561
|
149
|
||||||||
|
Income (loss) before income taxes
|
(25,064
|
)
|
(17,461
|
)
|
5,454
|
|||||||
|
Income tax provision (benefit)
|
(248
|
)
|
(1,177
|
)
|
123
|
|||||||
|
Net income (loss)
|
$
|
(24,816
|
)
|
$
|
(16,284
|
)
|
$
|
5,331
|
||||
|
Net income (loss) per share - basic
|
$
|
(1.21
|
)
|
$
|
(0.81
|
)
|
$
|
0.30
|
||||
|
Net income (loss) per share - diluted
|
$
|
(1.21
|
)
|
$
|
(0.81
|
)
|
$
|
0.29
|
||||
|
Shares used in computing net income (loss) per share:
|
||||||||||||
|
Basic
|
20,450
|
20,091
|
17,842
|
|||||||||
|
Diluted
|
20,450
|
20,091
|
18,337
|
|||||||||
The accompanying notes are an integral part of these consolidated financial statements.
PROCERA NETWORKS, INC.
CONSOLIDATED STATEMENTS OF COMPREHENSIVE INCOME (LOSS)
(in thousands)
|
Year Ended December 31,
|
||||||||||||
|
2014
|
2013
|
2012
|
||||||||||
|
Net income (loss)
|
$
|
(24,816
|
)
|
$
|
(16,284
|
)
|
$
|
5,331
|
||||
|
Unrealized gain (loss) on short-term investments, net of tax of $0
|
(26
|
)
|
(7
|
)
|
21
|
|||||||
|
Foreign currency translation adjustments
|
(1,267
|
)
|
(1,814
|
)
|
293
|
|||||||
|
Other comprehensive income (loss)
|
(1,293
|
)
|
(1,821
|
)
|
314
|
|||||||
|
Comprehensive income (loss)
|
$
|
(26,109
|
)
|
$
|
(18,105
|
)
|
$
|
5,645
|
||||
The accompanying notes are an integral part of these consolidated financial statements.
PROCERA NETWORKS, INC.
CONSOLIDATED STATEMENTS OF STOCKHOLDERS’ EQUITY
(in thousands)
|
Common Stock
|
Additional
Paid-In
|
Accumulated
Other
Comprehensive
Income
|
Accumulated
|
Total
Stockholders’
|
||||||||||||||||||||
|
Shares
|
Amount
|
Capital
|
(Loss)
|
Deficit
|
Equity
|
|||||||||||||||||||
|
Balances at December 31, 2011
|
14,628
|
$
|
15
|
$
|
105,205
|
$
|
(390
|
)
|
$
|
(58,263
|
)
|
$
|
46,567
|
|||||||||||
|
Net income
|
-
|
5,331
|
5,331
|
|||||||||||||||||||||
|
Other comprehensive income
|
314
|
-
|
314
|
|||||||||||||||||||||
|
Exercise of stock options
|
372
|
-
|
3,756
|
-
|
-
|
3,756
|
||||||||||||||||||
|
Exercise of warrants
|
44
|
-
|
27
|
-
|
-
|
27
|
||||||||||||||||||
|
Stock-based compensation
|
-
|
-
|
2,784
|
-
|
-
|
2,784
|
||||||||||||||||||
|
Issuance of common stock in registered placement, net of issuance costs
|
4,500
|
5
|
88,021
|
-
|
-
|
88,026
|
||||||||||||||||||
|
Issuance of restricted stock
|
152
|
-
|
-
|
-
|
-
|
-
|
||||||||||||||||||
|
Balances at December 31, 2012
|
19,696
|
20
|
199,793
|
(76
|
)
|
(52,932
|
)
|
146,805
|
||||||||||||||||
|
Net loss
|
-
|
(16,284
|
)
|
(16,284
|
)
|
|||||||||||||||||||
|
Other comprehensive loss
|
(1,821
|
)
|
-
|
(1,821
|
)
|
|||||||||||||||||||
|
Exercise of stock options
|
87
|
-
|
653
|
-
|
-
|
653
|
||||||||||||||||||
|
Stock-based compensation
|
-
|
-
|
5,057
|
-
|
-
|
5,057
|
||||||||||||||||||
|
Issuance of common stock as part of the Vineyard acquisition, net of issuance costs
|
825
|
1
|
14,260
|
-
|
-
|
14,261
|
||||||||||||||||||
|
Issuance of restricted stock
|
44
|
-
|
-
|
-
|
-
|
-
|
||||||||||||||||||
|
Balances at December 31, 2013
|
20,652
|
21
|
219,763
|
(1,897
|
)
|
(69,216
|
)
|
148,671
|
||||||||||||||||
|
Net loss
|
-
|
(24,816
|
)
|
(24,816
|
)
|
|||||||||||||||||||
|
Other comprehensive loss
|
(1,293
|
)
|
-
|
(1,293
|
)
|
|||||||||||||||||||
|
Exercise of stock options
|
62
|
-
|
352
|
-
|
-
|
352
|
||||||||||||||||||
|
Stock-based compensation
|
-
|
-
|
5,198
|
-
|
-
|
5,198
|
||||||||||||||||||
|
Issuance of restricted stock
|
42
|
-
|
-
|
-
|
-
|
-
|
||||||||||||||||||
|
Balances at December 31, 2014
|
20,756
|
$
|
21
|
$
|
225,313
|
$
|
(3,190
|
)
|
$
|
(94,032
|
)
|
$
|
128,112
|
|||||||||||
The accompanying notes are an integral part of these consolidated financial statements.
PROCERA NETWORKS, INC.
CONSOLIDATED STATEMENTS OF CASH FLOWS
(in thousands)
|
Year Ended December 31,
|
||||||||||||
|
2014
|
2013
|
2012
|
||||||||||
|
Cash flows from operating activities:
|
||||||||||||
|
Net income (loss)
|
$
|
(24,816
|
)
|
$
|
(16,284
|
)
|
$
|
5,331
|
||||
|
Adjustments to reconcile net income (loss) to net cash provided by (used in) operating activities:
|
||||||||||||
|
Compensation related to stock-based awards
|
5,198
|
5,057
|
2,784
|
|||||||||
|
Amortization of premium on investments
|
762
|
912
|
847
|
|||||||||
|
Depreciation
|
2,427
|
1,854
|
910
|
|||||||||
|
Amortization of intangible assets
|
1,384
|
1,573
|
-
|
|||||||||
|
Impairment of goodwill and purchased intangible assets
|
12,380
|
-
|
-
|
|||||||||
|
Amortization of deferred compensation
|
65
|
5,831
|
-
|
|||||||||
|
Provision for (recovery of) bad debts
|
(25
|
)
|
44
|
6
|
||||||||
|
Provision for excess and obsolete inventory
|
1,432
|
1,020
|
723
|
|||||||||
|
Loss on retirement of property and equipment
|
67
|
53
|
-
|
|||||||||
|
Change in deferred taxes
|
(513
|
)
|
(1,485
|
)
|
-
|
|||||||
|
Changes in assets and liabilities:
|
||||||||||||
|
Accounts receivable
|
2,571
|
(7,875
|
)
|
(5,037
|
)
|
|||||||
|
Inventories
|
1,761
|
(8,615
|
)
|
(4,245
|
)
|
|||||||
|
Prepaid expenses and other current assets
|
(3,395
|
)
|
1,971
|
(1,129
|
)
|
|||||||
|
Deferred compensation advanced to escrow
|
-
|
(2,701
|
)
|
-
|
||||||||
|
Accounts payable
|
(1,860
|
)
|
1,745
|
2,604
|
||||||||
|
Accrued liabilities
|
446
|
1,519
|
1,039
|
|||||||||
|
Deferred revenue
|
723
|
4,578
|
3,324
|
|||||||||
|
Net cash provided by (used in) operating activities
|
(1,393
|
)
|
(10,803
|
)
|
7,157
|
|||||||
|
Cash flows from investing activities:
|
||||||||||||
|
Purchase of Vineyard, net of cash received
|
-
|
(9,014
|
)
|
-
|
||||||||
|
Purchase of property and equipment
|
(3,053
|
)
|
(4,078
|
)
|
(3,976
|
)
|
||||||
|
Purchase of short-term investments
|
(118,669
|
)
|
(36,156
|
)
|
(117,807
|
)
|
||||||
|
Sales of short-term investments
|
26,891
|
11,212
|
7,001
|
|||||||||
|
Maturities of short-term investments
|
22,460
|
108,930
|
22,695
|
|||||||||
|
Net cash provided by (used in) investing activities
|
(72,371
|
)
|
70,894
|
(92,087
|
)
|
|||||||
|
Cash flows from financing activities:
|
||||||||||||
|
Proceeds from issuance of common stock
|
-
|
-
|
88,026
|
|||||||||
|
Proceeds from exercise of stock options
|
352
|
653
|
3,756
|
|||||||||
|
Proceeds from exercise of warrants
|
-
|
-
|
27
|
|||||||||
|
Repayments on line of credit
|
-
|
(497
|
)
|
-
|
||||||||
|
Net cash provided by financing activities
|
352
|
156
|
91,809
|
|||||||||
|
Effect of exchange rates on cash and cash equivalents
|
577
|
(406
|
)
|
154
|
||||||||
|
Net increase (decrease) in cash and cash equivalents
|
(72,835
|
)
|
59,841
|
7,033
|
||||||||
|
Cash and cash equivalents, beginning of period
|
90,774
|
30,933
|
23,900
|
|||||||||
|
Cash and cash equivalents, end of period
|
$
|
17,939
|
$
|
90,774
|
$
|
30,933
|
||||||
|
SUPPLEMENTAL CASH FLOW INFORMATION:
|
||||||||||||
|
Cash paid for income taxes
|
$
|
414
|
$
|
93
|
$
|
61
|
||||||
|
Cash paid for interest
|
$
|
-
|
$
|
-
|
$
|
10
|
||||||
| Accrued purchases of property and equipment | $ | 915 | - | - | ||||||||
|
Issuance of common stock in connection with Vineyard acquisition
|
$
|
-
|
$
|
14,261
|
$
|
-
|
||||||
The accompanying notes are an integral part of these consolidated financial statements.
PROCERA NETWORKS, INC.
NOTES TO CONSOLIDATED FINANCIAL STATEMENTS
| 1. | Description of Business |
Procera Networks, Inc. (“Procera” or the “Company”), is a leading provider of Subscriber Experience Assurance solutions based on Deep Packet Inspection (“DPI”) technology, that enable mobile and broadband network operators and enterprises managing private networks, including higher education institutions, businesses and government entities (collectively referred to as network operators) to gain enhanced visibility into, and control of, their networks and to create and deploy new services for their end user subscribers. The Company sells its products through its direct sales force, resellers, distributors, systems integrators and other equipment manufacturers in the Americas, Asia Pacific and Europe.
| 2. | Summary of Significant Accounting Policies |
Basis of Presentation
The consolidated financial statements include the accounts of Procera and its wholly owned subsidiaries. All significant intercompany balances and transactions have been eliminated. We have prepared the accompanying consolidated financial statements in accordance with accounting principles generally accepted in the United States of America and pursuant to the rules and regulations of the Securities and Exchange Commission (“SEC”).
During 2013, the Company identified immaterial errors in the consolidated financial statements for the year ended December 31, 2012, related to the recognition of revenue from a sale to a value added reseller, the accounting for inventory, and general and administrative fee accruals. Based on a quantitative and qualitative analysis of the errors as required by authoritative guidance, management concluded that the errors had no material impact on any of the Company’s previously issued financial statements, are immaterial to the Company’s results for the year ended December 31, 2013, and had no material effect on the trend of financial results.
The consolidated financial statements for the year ended December 31, 2013 reflect the following immaterial adjustments related to prior periods: the reversal of $0.6 million in revenue and related gross margin of $0.4 million, inventory charges of $0.4 million, and additional general and administrative costs of $43,000.
Use of Estimates
The preparation of consolidated financial statements in conformity with U.S. generally accepted accounting principles requires management to make estimates and judgments that affect the reported amounts of assets, liabilities, revenues and expenses and related disclosures of contingent assets and liabilities. Actual results could differ from those estimates. The accounting estimates that require management’s most significant and subjective judgments include the recognition of revenue, assessment of the recoverability of long-lived assets and goodwill, valuation of inventory, valuation and recognition of stock-based compensation, warranty estimates and accounting for income taxes.
Fair Value of Financial Instruments
The carrying amounts of certain of the Company’s financial instruments, including cash and cash equivalents, short-term investments, accounts receivable, accounts payable and accrued liabilities approximate fair value due to their short maturities.
Concentration of Risk
The financial instruments utilized by the Company that potentially subject the Company to a concentration of credit risk consist of cash and cash equivalents, short-term investments and accounts receivable. Cash and cash equivalents are deposited in demand and money market accounts in major financial institutions in the United States, Sweden, Canada and Australia. Accounts at financial institutions in the United States are guaranteed by the Federal Deposit Insurance Corporation (“FDIC”) up to certain limits. At times, the Company’s deposits or investments may exceed federally insured limits. At December 31, 2014 and 2013, the Company had approximately $17.7 million and $90.5 million, respectively, at financial institutions in excess of FDIC insured limits. The Company has not experienced any losses in such accounts.
The Company’s investment policies limit investments to those that are low risk and restrict placement of these investments to issuers evaluated as creditworthy. As of December 31, 2014, the Company’s investments were composed of money market funds, U.S. agency securities, certificates of deposit, commercial paper and corporate bonds. As of December 31, 2013, the Company’s investments were composed of commercial paper and money market funds.
The Company’s sales have at times been concentrated with certain large customers. The Company also sells to a geographically diverse base of customers. For the year ended December 31, 2014, no single customer accounted for more than 10% of net revenues. For the year ended December 31, 2013, revenue from three customers, Shaw Communications, Inc., British Telecommunications plc and Itochu Techno-Solutions Corp. represented 13%, 12% and 10% of net revenues, respectively, with no other single customer accounting for more than 10% of net revenues. For the year ended December 31, 2012, revenue from one customer, Shaw Communications, Inc., represented 16% of net revenues. At December 31, 2014, accounts receivable from one customer represented 13% of total accounts receivable with no other single customer accounting for more than 10% of the accounts receivable balance, and 93% of accounts receivable were due from customers outside of the United States. At December 31, 2013, one customer represented 32% of total accounts receivable, and 86% of accounts receivable were due from customers outside of the United States (see Note 16). The Company maintains an allowance for uncollectible accounts receivable based upon expected collectability of all accounts receivable. The Company performs ongoing credit evaluations of certain customers’ financial condition and generally requires no collateral from its customers.
The Company is dependent on a limited number of third-party suppliers for its hardware equipment. The Company is dependent on the ability of these suppliers to provide products on a timely basis and on favorable pricing terms. The loss of certain principal suppliers or a significant reduction in product availability from principal suppliers could have a material adverse effect on the Company. The Company believes that its relationships with its suppliers are satisfactory, and the Company has not historically experienced inadequate supply issues from its suppliers.
Cash and Cash Equivalents
The Company considers all highly liquid investments with original or remaining maturities of three months or less from the date of purchase to be cash equivalents.
Investments
The goals of the Company’s investment policy are preservation of capital and maintenance of liquidity. The Company invests in instruments that are of high credit quality, primarily rated AA+/Aa1, and have a maturity of up to 24 months. However, the weighted average maturity of the portfolio does not exceed 12 months. Investments that have a remaining maturity of greater than three months at the date of purchase and an effective maturity of less than one year are classified as short-term investments.
Investments are carried at fair value based upon quoted market prices at the end of the reporting period. As of each of December 31, 2014 and 2013, all investments were classified as available-for-sale with unrealized gains and losses recorded as a separate component of comprehensive income. The specific identification method is used to determine the cost of securities disposed of, with realized gains and losses reflected in interest and other income (expense).
The Company reviews its investments for impairment on a quarterly basis. For investments with an unrealized loss, the factors considered in the review include the credit quality of the issuer, the duration that the fair value has been less than the adjusted cost basis, severity of impairment, reason for the decline in value and potential recovery period, the financial condition and near-term prospects of the investees, and whether the Company would be required to sell an investment due to liquidity or contractual reasons before its anticipated recovery.
Accounts Receivables and Allowance for Doubtful Accounts
Trade accounts receivable are recorded at the invoiced amount. The Company maintains an allowance for doubtful accounts for estimated losses resulting from the inability of its customers to make required payments. The Company considers factors such as historical experience, credit quality, age of the accounts receivable balances, geographic or country-specific risks and economic conditions that may affect a customer’s ability to pay. The allowance for doubtful accounts is reviewed regularly and adjusted if necessary based on management’s assessment of a customer’s ability to pay. Individual accounts receivable are written off when all collection efforts have been exhausted.
Inventories
Inventories consist primarily of finished goods and are stated at the lower of cost (on a specific identification or weighted average cost basis) or market. The Company records inventory write-downs for excess and obsolete inventories based on historical usage and forecasted demand, as well as determining what inventory, if any, is not saleable. Factors which could cause its forecasted demand to prove inaccurate include the Company’s reliance on indirect sales channels and the variability of its sales cycle; the potential of announcements of new products or enhancements to replace or shorten the life cycle of current products, or cause customers to defer their purchases; and the potential of new or alternative technologies achieving widespread market acceptance and thereby rendering the Company’s existing products obsolete. If future demand or market conditions are less favorable than projections, additional inventory write-downs may be required and would be reflected in cost of sales in the period the revision is made.
Inventories also include demonstration units located at various customer locations and customer service inventories. The demonstration units and customer service inventories are stated at lower of cost (on a specific identification or weighted average cost basis) or market. The Company provides demonstration units to customers who evaluate the Company's products, and upon a successful trial, may purchase such products. The Company carries customer service inventories because it generally provides product warranty for 12 months and earns revenue by providing enhanced and extended support contracts during and beyond this warranty period. Customer service inventories are provided for customer use permanently or on a temporary basis while the defective unit is being repaired. The Company reduces the carrying value of demonstration units and customer service inventories for differences between cost and estimated net realizable value, taking into consideration expected demand, technological obsolescence and other information including the physical condition of the unit. If actual results vary significantly from expectations, additional write-downs may be required, resulting in additional charges to operations.
Property and Equipment
Property and equipment are stated at cost, less accumulated depreciation and amortization. Depreciation is calculated using the straight-line method over the estimated useful lives of the assets. Leasehold improvements are amortized using the straight-line method over the estimated useful lives of the improvements or the term of the lease, whichever is shorter. Whenever assets are retired or otherwise disposed of, the cost and related accumulated depreciation are removed from the accounts, and any resulting gain or loss is recognized in income for the period. The cost of maintenance and repairs is expensed as incurred; significant improvements are capitalized.
The estimated service lives of property and equipment are principally as follows:
|
Leasehold improvements
|
Lesser of useful life or lease term
|
|
Machinery, office and computer equipment
|
2–5 years
|
|
Computer software
|
3 years
|
|
Transportation vehicles
|
3–5 years
|
Goodwill
Goodwill has been measured as the excess of the cost of acquisition over the amount assigned to tangible and identifiable intangible assets acquired less liabilities assumed. The Company reviews goodwill for impairment annually during the fourth quarter of the year or more frequently if an event or circumstance indicates that an impairment loss has occurred. The identification and measurement of goodwill impairment involves the estimation of fair value at the Company’s reporting unit level.
Goodwill impairment is determined using a two-step process. The first step of the goodwill impairment test is used to identify potential impairment by comparing the fair value of a reporting unit with its carrying amount, including goodwill. If the fair value of a reporting unit exceeds its carrying amount, goodwill of the reporting unit is considered not impaired and the second step of the impairment test is unnecessary. If the carrying amount of a reporting unit exceeds its fair value, the second step of the goodwill impairment test is performed to measure the amount of impairment loss, if any.
The second step of the goodwill impairment test compares the implied fair value of the reporting unit’s goodwill with the carrying amount of that goodwill. If the carrying amount of the reporting unit’s goodwill exceeds the implied fair value of that goodwill, an impairment loss is recognized in an amount equal to that excess. The implied fair value of goodwill is determined in the same manner as the amount of goodwill recognized in a business combination. That is, the fair value of the reporting unit’s assets and liabilities (including any unrecognized intangible assets) are determined as if the reporting unit had been acquired in a business combination and the fair value of the reporting unit was the purchase price paid to acquire the reporting unit.
Accounting for long-lived assets
The Company reviews its long-lived assets, including property and equipment and purchased intangible assets, for impairment whenever events or changes in circumstances indicate that the carrying amount may not be recoverable. Examples of such events could include a significant disposal of a portion of such assets, an adverse change in the market involving the business employing the related asset, a significant decrease in the benefits realized from an acquired business, difficulties or delays in integrating the business or a significant change in the operation or use of an asset or acquired business.
An impairment test involves a comparison of undiscounted cash flows from the use of the asset or asset group to the carrying value of the asset or asset group. Measurement of an impairment loss is based on the amount by which the carrying value of the asset or asset group exceeds its fair value.
Product Warranty
The Company warrants its products against material defects for a specific period of time, generally 12 months. The Company provides for the estimated future costs of warranty obligations in cost of sales when the related revenue is recognized. The accrued warranty costs represent the best estimate at the time of sale of the total costs that the Company expects to incur to repair or replace product parts, which fail while still under warranty. The amount of accrued estimated warranty costs are primarily based on current information on repair costs. The Company assesses the adequacy of the recorded warranty obligation quarterly and makes adjustments to the obligation based on actual experience and changes in estimated future rates of return.
Commitments and Contingencies
Certain conditions may exist on the date the financial statements are issued, which may result in a loss to the Company but which will only be resolved when one or more future events occur or fail to occur. The Company’s management and its legal counsel assess such contingent liabilities, and such assessment inherently involves an exercise of judgment. In assessing loss contingencies related to legal proceedings that are pending against the Company or unasserted claims that may result in such proceedings, the Company and its legal counsel evaluate the perceived merits of any legal proceedings or unasserted claims as well as the perceived merits of the amount of relief sought or expected to be sought therein.
If the assessment of a contingency indicates that it is probable that a material loss has been incurred and the amount of the liability can be estimated, then the estimated liability would be accrued in the Company’s financial statements. If the assessment indicates that a potentially material loss contingency is not probable, but is reasonably possible, or is probable but cannot be estimated, then the nature of the contingent liability, together with an estimate of the range of possible loss if determinable and material, would be disclosed.
Loss contingencies considered remote are generally not disclosed unless they involve guarantees, in which case the nature of the guarantee would be disclosed.
Stock-Based Compensation
The Company accounts for all share-based payment transactions using a fair-value based measurement method. The Company calculates stock option-based compensation by estimating the fair value of each option as of its date of grant using the Black-Scholes option pricing model. The fair value of restricted stock and restricted stock unit grants is calculated based upon the closing stock price of the Company’s common stock on the date of the grant. These amounts are expensed over the requisite service period of each award, which is the vesting period, using the straight-line attribution method. Compensation expense is recognized only for those awards that are expected to vest, and, as such, amounts have been reduced by estimated forfeitures. The Company has historically issued stock options, restricted stock units and vested and nonvested stock grants to employees and outside directors whose only condition for vesting has been continued employment or service during the related vesting or restriction period.
Revenue Recognition
The Company recognizes product revenue when all of the following have occurred: (1) the Company has entered into a legally binding arrangement with a customer resulting in the existence of persuasive evidence of an arrangement; (2) delivery has occurred, evidenced when product title transfers to the customer; (3) customer payment is deemed fixed or determinable and free of contingencies and significant uncertainties; and (4) collection is probable.
Sales of the Company’s PacketLogic products typically involve the integration of software and a hardware appliance, where the hardware and software work together to deliver the essential functionality of the product. Product revenue consists of revenue from sales of appliances and software licenses. PacketLogic product sales include a perpetual license to the Company’s software that is essential to the functionality of the hardware, and on occasion include licenses to additional software. Network Application Visibility Library (“NAVL”) sales include term licenses sold as a subscription. Revenue from sales of term licenses is recognized ratably over the subscription term, generally one year. Shipping charges billed to customers are included in product revenue and the related shipping costs are included in cost of product revenue. Virtually all sales include post-contract support (“PCS”) services (included in support revenue), which consist of software updates and customer support. Software updates provide customers access to a growing library of electronic Internet traffic identifiers (signatures) and rights to non-specific software product upgrades, maintenance releases and patches released during the term of the support period. Support includes Internet access to technical content, telephone and Internet access to technical support personnel and hardware support.
Receipt of a customer purchase order is the primary method of determining that persuasive evidence of an arrangement exists.
Delivery of PacketLogic products generally occurs when a product is delivered to a common carrier F.O.B. shipping point. However, product revenue based on channel partner purchase orders is recorded based on obtaining evidence of sell-through to the end user customers until such time as the Company has established significant experience with the channel partner’s ability to complete the sales process, which requires judgment. Additionally, when the Company introduces new products for which there is no historical evidence of acceptance history, revenue is recognized on the basis of end-user acceptance until such history has been established. Delivery of Packetlogic license upgrades and NAVL licenses occur when such licenses are made available to customers.
Fees are typically considered to be fixed or determinable at the inception of an arrangement, generally based on specific products and quantities to be delivered. The Company’s contracts do not generally include rights of return or acceptance provisions. To the extent that agreements contain such terms, the Company recognizes revenue once the acceptance provisions or right of return lapses. Payment terms to customers generally range from net 30 to 90 days. Certain customers are occasionally granted longer terms based on the Company’s assessment of their credit risk. In the event payment terms are provided that differ from the Company’s standard business practices, the fees are deemed to not be fixed or determinable and revenue is recognized when the payments become due, provided the remaining criteria for revenue recognition have been met.
The Company assesses the ability to collect from its customers based on a number of factors, including credit worthiness of the customer and past transaction history of the customer. If the customer is not deemed credit worthy, the Company defers revenue from the arrangement until payment is received and all other revenue recognition criteria have been met.
Customer orders normally contain multiple items. The initial PacketLogic product delivery consists of the hardware and software elements, and these elements have standalone value to the customer. Through the year ended December 31, 2014, the elements that remained undelivered at the time of product delivery were PCS services and occasionally uncompleted professional services not essential to the functionality of the product. Orders for the NAVL products consist of term software licenses and PCS services which are recognized ratably over the term of the arrangement, typically one year.
Under the revenue recognition guidance discussed in the first paragraph above, the Company allocates revenue to each element in an arrangement based on relative selling price using a selling price hierarchy. The selling price for a deliverable is based on its VSOE, if available, third party evidence (“TPE”), if VSOE is not available, or the Company’s best estimate of selling price (“ESP”), if neither VSOE nor TPE is available. The maximum revenue recognized on a delivered element is limited to the amount that is not contingent upon the delivery of additional items. In arrangements that include NAVL or non-essential software (“software deliverables”), revenue is allocated to each separate unit of accounting for the non-software deliverables and to the software deliverables as a group using the relative selling prices of each of the deliverables in the arrangement. Revenue allocated to the software deliverables as a group is then allocated first to the PCS services based on VSOE, and then to the software, using the residual method under the software revenue recognition guidance.
The Company determines VSOE for PCS based on a percentage of products purchased, with different rated based on service level. The Company has determined that these rates represent VSOE for PCS based on its history of charging these rates for PCS to customers upon renewal. The Company has a history of such renewals, the vast majority of which are at the VSOE rate on a customer basis. PCS revenue is recognized ratably over the life of the contract. A portion of service revenue is derived from customizations not essential to the functionality of the product, implementation and training services. The Company uses the completed-contract method to recognize such revenue.
As the PacketLogic hardware and software products are rarely sold separately, the Company generally does not have VSOE for these products, and TPE is not available. The Company determines the ESP for these hardware and software deliverables considering internal factors such as discounting and pricing policies, and external factors such as market conditions in different geographies and competitive positioning.
In certain contracts, billing terms may be agreed upon based on performance milestones such as the execution of a measurement test, a partial delivery or the completion of a specified service. Payments received before the unconditional acceptance of a specific set of deliverables are recorded as deferred revenue until the conditional acceptance has been waived.
Income Taxes
The Company accounts for income taxes under an asset and liability approach. This process involves calculating the temporary and permanent differences between the carrying amounts of the assets and liabilities for financial reporting purposes and the amounts used for income tax purposes. The temporary differences result in deferred tax assets and liabilities, which are recorded on the Company’s consolidated balance sheets. The Company must assess the likelihood that its deferred tax assets will be recovered from future taxable income and, to the extent the Company believes that recovery is not likely, the Company must establish a valuation allowance. Changes in the Company’s valuation allowance in a period are recorded through the income tax provision on the consolidated statements of operations. The impact of an uncertain income tax position on the income tax return is recognized at the largest amount that is more-likely-than-not to be sustained upon audit by the relevant taxing authority. An uncertain income tax position will not be recognized if it has less than a 50% likelihood of being sustained.
Shipping and Handling Costs
The Company includes shipping and handling costs associated with inbound and outbound freight in costs of goods sold.
Research and Development
Research and development expenses include internal and external costs. Internal costs include salaries and employment related expenses, prototype materials, initial product certifications, equipment costs and allocated facility costs. External expenses consist of costs associated with outsourced software development activities.
Development costs incurred in the research and development of new products, other than software, and enhancements to existing products are expensed as incurred. Costs for the development of new software products and enhancements to existing products are expensed as incurred until technological feasibility has been established, at which time any additional development costs would be capitalized. To date, the Company’s software has been available for general release shortly after being determined to be technologically feasible, which the Company defines as a working prototype. Accordingly, those costs have not been material.
Advertising Costs
Advertising expenses consist primarily of costs incurred in the design, development and printing of Company literature and marketing materials. Advertising costs are expensed as incurred. Advertising expenses were not significant for the years ended December 31, 2014, 2013 and 2012.
Comprehensive Income (Loss)
Comprehensive income (loss) consists of net income or loss and other gains and losses affecting stockholders’ equity that, under generally accepted accounting principles, are excluded from net income or loss. For the Company, such items consist of unrealized gains and losses on available-for-sale short-term investments and foreign currency translation gains and losses.
Foreign Operations
The accompanying balance sheets contain certain recorded Company assets in foreign countries, primarily Sweden, Canada and Australia. Although these countries are considered economically stable and the Company has experienced no notable burden from foreign exchange transactions, export duties or government regulations, it is always possible that unanticipated events in foreign countries could have a material adverse effect on the Company’s operations.
Foreign Currency Translation
The functional currency of the Company’s foreign subsidiaries is the local currency. The revenue and expenses of such subsidiaries have been translated into U.S. dollars at average exchange rates prevailing during the period. Assets and liabilities have been translated at the rates of exchange on the balance sheet date. The resulting cumulative translation adjustments are reported in comprehensive income (loss). Currency transaction gains and losses are recognized in current operations.
Business Segments
The Company has one reportable operating segment. The Company's Chief Operating Decision Maker ("CODM"), the Chief Executive Officer, evaluates performance and makes decisions regarding allocation of resources based on certain metrics including segment revenue, gross profit and operating income (loss) measures (see Note 16).
| 3. | Recent Accounting Pronouncements |
In May 2014, the Financial Accounting Standards Board (“FASB”) issued Accounting Standards Update (“ASU”) No. 2014-09, “Revenue from Contracts with Customers”, issued as a new Topic, ASC Topic 606. The new revenue recognition standard provides a five-step analysis of transactions to determine when and how revenue is recognized. The core principle of the guidance is that a company should recognize revenue to depict the transfer of promised goods and services to customers in an amount that reflects the consideration to which the entity expects to be entitled in exchange for those goods or services. This ASU is effective beginning in fiscal year 2017 and can be adopted by the Company either retrospectively or as a cumulative-effect adjustment as of the date of adoption. The Company is currently evaluating the effect that adopting this new accounting guidance will have on its consolidated results of operations, cash flows and financial position.
In June 2014, the FASB issued ASU No. 2014-12, “Accounting for Share-Based Payments When the Terms of an Award Provide That a Performance Target Could Be Achieved after the Requisite Service Period”, or ASU 2014-12. The amendments in ASU 2014-12 require that a performance target that affects vesting and that could be achieved after the requisite service period be treated as a performance condition. A reporting entity should apply the existing guidance in ASC Topic No. 718, “Compensation – Stock Compensation”, as it relates to awards with performance conditions that affect vesting to account for such awards. The amendments in ASU 2014-12 are effective for annual periods and interim periods within those annual periods beginning after December 15, 2015. Early adoption is permitted. Entities may apply the amendments in ASU 2014-12 either: (1) prospectively to all awards granted or modified after the effective date; or (2) retrospectively to all awards with performance targets that are outstanding as of the beginning of the earliest annual period presented in the financial statements and to all new or modified awards thereafter. The adoption of ASU 2014-12 is not expected to have a material effect on the Company’s consolidated financial statements or disclosures.
In August 2014, the FASB issued ASU No. 2014-15, “Presentation of Financial Statements”, which provides new guidance related to the disclosures around going concern. The new standard provides guidance around management’s responsibility to evaluate whether there is substantial doubt about an entity’s ability to continue as a going concern and to provide related footnote disclosures. The new standard is effective for fiscal years, and interim periods within those fiscal years, beginning after December 15, 2016. Early adoption is permitted. The adoption of this standard is not expected to have a material impact on the Company’s consolidated financial statements.
| 4. | Cash Equivalents and Short-term Investments |
The Company’s cash equivalents and short-term investments at December 31, 2014 are as follows (in thousands):
|
Amortized
Cost
|
Gross
Unrealized
Gains
|
Gross
Unrealized
Losses
|
Fair
Value
|
|||||||||||||
|
Money market funds
|
$
|
109
|
$
|
-
|
$
|
-
|
$
|
109
|
||||||||
|
Commercial paper
|
10,794
|
2
|
-
|
10,796
|
||||||||||||
|
Treasury and agency notes and bills
|
54,442
|
5
|
(6
|
)
|
54,441
|
|||||||||||
|
Corporate bonds
|
25,419
|
2
|
(16
|
)
|
25,405
|
|||||||||||
|
Total investments
|
$
|
90,764
|
$
|
9
|
$
|
(22
|
)
|
$
|
90,751
|
|||||||
|
Reported as:
|
||||||||||||||||
|
Cash equivalents
|
$
|
6,208
|
$
|
1
|
$
|
-
|
$
|
6,209
|
||||||||
|
Short-term investments
|
84,556
|
8
|
(22
|
)
|
84,542
|
|||||||||||
|
Total
|
$
|
90,764
|
$
|
9
|
$
|
(22
|
)
|
$
|
90,751
|
|||||||
The Company’s cash equivalents and short-term investments at December 31, 2013 are as follows (in thousands):
|
Amortized
Cost
|
Gross
Unrealized
Gains
|
Gross
Unrealized
Losses
|
Fair
Value
|
|||||||||||||
|
Money market funds
|
$
|
79,869
|
$
|
-
|
$
|
-
|
$
|
79,869
|
||||||||
|
Commercial paper
|
15,776
|
13
|
-
|
15,789
|
||||||||||||
|
Total investments
|
$
|
95,645
|
$
|
13
|
$
|
-
|
$
|
95,658
|
||||||||
|
Reported as:
|
||||||||||||||||
|
Cash equivalents
|
$
|
79,869
|
$
|
-
|
$
|
-
|
$
|
79,869
|
||||||||
|
Short-term investments
|
15,776
|
13
|
-
|
15,789
|
||||||||||||
|
Total
|
$
|
95,645
|
$
|
13
|
$
|
-
|
$
|
95,658
|
||||||||
As of December 31, 2014, all investments were classified as available-for-sale with unrealized gains and losses recorded as a separate component of comprehensive income (loss). Cash equivalents consist of highly liquid investments with remaining maturities of three months or less at the date of purchase. Short-term investments generally have a remaining maturity of greater than three months at the date of purchase and an effective maturity of up to 24 months. However, the weighted average maturity of the portfolio does not exceed 12 months. As of December 31, 2014 and 2013, the Company had certain investments with a maturity greater than one year. Investments with maturities greater than one year were $12.8 million and $3.7 million as of December 31, 2014 and 2013, respectively. However, management has the ability, if necessary, to liquidate any of its investments in order to meet the Company’s liquidity needs in the next 12 months. Accordingly, investments with contractual maturities greater than one year from the date of purchase are classified as short-term on the accompanying consolidated balance sheets. None of the Company’s short-term investments have been at a continuous unrealized loss position for greater than 12 months.
The Company did not identify any investments that were other-than-temporarily impaired during the years ended December 31, 2014 and 2013.
The Company did not incur any material realized gains or losses in the years ended December 31, 2014, 2013 and 2012.
| 5. | Fair Value Measurements |
Fair value is the price that would be received from selling an asset or paid to transfer a liability in an orderly transaction between market participants at the measurement date. When determining fair value, the Company considers the principal or most advantageous market in which it would transact, and considers assumptions that market participants would use when pricing the asset or liability.
Fair Value Hierarchy
The three levels of inputs that may be used to measure fair value are as follows:
| Level 1- | Quoted prices in active markets for identical assets or liabilities. |
| Level 2- | Observable inputs other than Level 1 prices, such as quoted prices for similar assets or liabilities, quoted prices in markets with insufficient volume or infrequent transactions (less active markets), or model-derived valuations in which all significant inputs are observable or can be derived principally from or corroborated with observable market data for substantially the full term of the assets or liabilities. |
| Level 3- | Unobservable inputs to the valuation methodology that are significant to the measurement of the fair value of assets or liabilities. |
The following tables represent the Company’s fair value hierarchy for its financial assets as of December 31, 2014 measured at fair value on a recurring basis (in thousands):
|
Level 1
|
Level 2
|
Level 3
|
Total
|
|||||||||||||
|
Money market funds
|
$
|
109
|
$
|
-
|
$
|
-
|
$
|
109
|
||||||||
|
Commercial paper
|
-
|
10,796
|
-
|
10,796
|
||||||||||||
|
Treasury and agency notes and bills
|
-
|
54,442
|
-
|
54,442
|
||||||||||||
|
Corporate bonds
|
-
|
25,404
|
-
|
25,404
|
||||||||||||
|
Total assets measured at fair value
|
$
|
109
|
$
|
90,642
|
$
|
-
|
$
|
90,751
|
||||||||
The following tables represent the Company’s fair value hierarchy for its financial assets as of December 31, 2013 measured at fair value on a recurring basis (in thousands):
|
Level 1
|
Level 2
|
Level 3
|
Total
|
|||||||||||||
|
Money market funds
|
$
|
79,869
|
$
|
-
|
$
|
-
|
$
|
79,869
|
||||||||
|
Commercial paper
|
-
|
15,789
|
-
|
15,789
|
||||||||||||
|
Total assets measured at fair value
|
$
|
79,869
|
$
|
15,789
|
$
|
-
|
$
|
95,658
|
||||||||
In general, and where applicable, the Company uses quoted market prices in active markets for identical assets to determine fair value. This pricing methodology applies to Level 1 investments which are comprised of money market funds. If quoted prices in active markets for identical assets are not available, then the Company uses quoted prices for similar assets or inputs other than quoted prices that are observable, either directly or indirectly. These investments are included in Level 2 and consist of commercial paper, U.S. agency securities and corporate bonds. U.S. agency securities and corporate bonds are valued at a consensus price, which is a weighted average price based on market prices from a variety of industry standard data providers used as inputs to a distribution-curve based algorithm. Certificates of deposit and commercial paper are valued using market prices when available, adjusting for accretion of the purchase price to face value at maturity.
During the years ended December 31, 2014 and 2013, the Company did not have any transfers between Level 1 and Level 2 fair value instruments.
| 6. | Acquisitions |
On January 9, 2013, the Company completed its acquisition of Vineyard Networks Inc. (“Vineyard”), a privately held developer of Layer 7 DPI and application classification technology located in Kelowna, Canada. Vineyard’s integrated DPI and application classification technology provides enterprise and service provider networking infrastructure vendors with these capabilities through its integrated software suite, primarily through a variety of subscription based original equipment manufacturer and partner agreements. This acquisition complements the Company’s hardware and application software-based DPI solutions.
The total purchase price was $20.9 million, consisting of $9.8 million cash consideration and $11.1 million in the Company’s common stock in exchange for 100% of the outstanding securities of Vineyard. Of the consideration paid, $2.0 million and $1.9 million in cash and stock, respectively, was placed into escrow for a period of 18 or 36 months from the closing of the acquisition and to be released subject to resolution of certain contingencies. In July 2014, $1.9 million and $1.8 million in cash and stock, respectively, was released from escrow. In addition to the purchase consideration, the Company recorded deferred compensation of $5.9 million, consisting of $2.7 million in cash consideration and $3.2 million in the Company’s common stock, related to retention agreements with Vineyard’s three founders, which was disbursed from the escrow account in January 2014 after one year of continuous employment with the Company. The Company recognized $0.1 million and $5.8 million in compensation costs related to these retention agreements for the years ended December 31, 2014 and 2013, respectively.
For the year ended December 31, 2014, Vineyard contributed $4.4 million in revenue and $13.9 million in net loss, of which $12.4 million relates to the Company’s impairment charge recorded in the three months ended September 30, 2014. See Note 7 – “Goodwill and Intangible Assets” for additional details. For the year ended December 31, 2013, Vineyard contributed $2.7 million in revenue and $2.6 million in net loss.
The Company recognized acquisition-related costs for Vineyard of $1.0 million during the first quarter of 2013. These acquisition-related charges were expensed in the period incurred and reported in the Company’s consolidated statements of operations within general and administrative expenses.
The following table summarizes the net assets and liabilities acquired, including identifiable intangible assets, based on their respective fair values at the acquisition date (in thousands):
|
Assets acquired
|
||||
|
Cash
|
$
|
822
|
||
|
Accounts receivable, net
|
525
|
|||
|
Other current assets
|
2,095
|
|||
|
Identifiable intangible assets
|
8,460
|
|||
|
Goodwill (1)
|
12,346
|
|||
|
Other assets
|
303
|
|||
|
Total assets acquired
|
24,551
|
|||
|
Liabilities assumed
|
||||
|
Accounts payable and other accrued liabilities
|
420
|
|||
|
Deferred revenue
|
555
|
|||
|
Notes payable
|
511
|
|||
|
Deferred tax liability
|
2,141
|
|||
|
Total liabilities assumed
|
3,627
|
|||
|
Net assets acquired
|
$
|
20,924
|
||
| (1) | The Company made an election under Section 338(g) of the Internal Revenue Code of 1986, as amended, which resulted in tax-deductible goodwill related to the Vineyard transaction. The Company estimated that the tax-deductible goodwill and intangibles resulting from the election will approximate $17.6 million, to be amortized for U.S. tax purposes over a 15 year period that began on January 1, 2014. |
Intangible Assets Acquired
The following table presents details of the intangible assets acquired in connection with the acquisition of Vineyard, which was completed during the first quarter of 2013 (in thousands, except years):
|
Estimated Useful
Life
(in years)
|
Amount
|
|||||||
|
Developed technology
|
5
|
$
|
5,910
|
|||||
|
Customer relationships
|
5
|
2,550
|
||||||
|
Total
|
$
|
8,460
|
||||||
Acquired technology consists of existing research and development projects at the time of the acquisition that have reached technological feasibility. No in-process research and development was included in acquired intangible assets as of the acquisition date.
Pro Forma Financial Information
The following tables summarize the supplemental consolidated statements of operations information on an unaudited pro forma basis as if the acquisition of Vineyard occurred on January 1, 2012 and includes adjustments that were directly attributable to the foregoing transaction or were not expected to have a continuing impact on the Company. The pro forma results are for illustrative purposes only for the applicable period and do not purport to be indicative of the actual results that would have occurred had the transactions been completed as of the beginning of the period, nor are they indicative of results of operations that may occur in the future (in thousands, except per share amounts):
|
December 31,
|
||||||||
|
2013
|
2012
|
|||||||
|
Pro forma revenues
|
$
|
75,738
|
$
|
61,535
|
||||
|
Pro forma net loss
|
(7,827
|
)
|
(3,718
|
)
|
||||
|
Basic and diluted loss per share
|
(0.39
|
)
|
(0.20
|
)
|
||||
The pro forma financial information reflects acquisition-related expenses incurred, pro forma adjustments for the additional amortization associated with finite-lived intangible assets acquired, deferred compensation costs related to the retention of certain Vineyard employees, the change in stock compensation expense as a result of the exercise of stock options immediately prior to the closing of the Vineyard transaction, stock compensation related to the stock options granted to Vineyard employees, and the related tax expense. The pro forma net loss per share amounts also reflect the impact of the issuance of 518,000 shares in connection with the acquisition as if they were issued in January 2012.
These adjustments are as follows (in thousands):
|
December 31,
|
||||||||
|
2013
|
2012
|
|||||||
|
Acquisition-related expenses for Vineyard
|
$
|
(1,026
|
)
|
$
|
-
|
|||
|
Intangible amortization
|
36
|
1,661
|
||||||
|
Net change in stock compensation expense
|
(636
|
)
|
1,727
|
|||||
|
Increase (decrease) in deferred compensation expense
|
(5,809
|
)
|
5,874
|
|||||
|
Increase in weighted average common shares outstanding for shares issued and not already included in the weighted average common shares outstanding
|
165
|
518
|
||||||
| 7. | GOODWILL AND INTANGIBLE ASSETS |
Changes in the carrying value of goodwill for the twelve months ended December 31, 2014 were as follows (in thousands):
|
Year Ended
December 31, |
||||
|
Balance, December 31, 2013
|
$
|
12,326
|
||
|
Impairment of goodwill
|
(10,840
|
)
|
||
|
Translation adjustments
|
(526
|
)
|
||
|
Balance, December 31, 2014
|
$
|
960
|
||
The Company reviews its goodwill for impairment annually during the fourth quarter of the year or more frequently if events or circumstances indicate that an impairment loss may have occurred. The identification and measurement of goodwill impairment involves the estimation of fair value at a reporting unit level.
During the third quarter of fiscal year 2014, the Company considered the effect of the economic environment in which its NAVL reporting unit markets its products and determined that sufficient indicators existed requiring it to perform an interim impairment review of NAVL goodwill. The indicators consisted primarily of: (1) decelerating revenue growth during the third quarter of fiscal year 2014 and a decline in forecasted revenue in future quarters, and (2) lower than anticipated total addressable market for NAVL products.
The Company performed an impairment review for goodwill at the NAVL reporting unit level. In step one, the fair value of the NAVL reporting unit was compared to the carrying value. Based on this review, the Company determined that the carrying value exceeded the fair value indicating potential impairment. Therefore, the Company next performed step two, in which the fair value of the reporting unit was allocated to all of the assets and liabilities of the reporting unit on a fair value basis, including any unrecognized intangible assets, with any excess representing the implied fair value of goodwill. The fair value was determined using an income approach. Under the income approach, the present value of estimated future cash flows is determined based on management’s forecast of revenue growth rates and operating margins. As a result of reduced revenue growth rate assumptions associated with the impairment indicators noted above, the implied fair value of NAVL goodwill was determined to be zero. Therefore, the Company recorded an impairment charge for goodwill of $10.9 million during the third quarter of fiscal year 2014, representing 100% of the NAVL goodwill balance at September 30, 2014. The impairment charge is included in the Company’s consolidated statement of operations. The Company also recognized a deferred tax benefit of $0.1 million associated with the goodwill impairment charge.
No indicators were present in 2014 that would suggest impairment of the Comapny's remaining goodwill balance of $960,000, assigned to the Comapny's PacketLogic reporting unit. The Company performed its routine annual goodwill impairment test for goodwill assigned to the PacketLogic reporting unit during the fourth quarter of 2014 which indicated no impairment.
The Company reviews its long-lived assets for impairment whenever events or changes in circumstances indicate that the carrying amount of such assets may not be reoverable. Determination of recoverability is based on an estimate of undiscounted future cash flows resulting from the use of the asset. Measurement of an impairment loss for ling-lived assets is based on the amount by which the carrying value of the asset exceeds its fair value based on the discounted future cash flows.
As a result of the indicators noted above, the Company also evaluated the long-lived assets within the NAVL reporting unit for impairment. Such assets include acquired intangible assets and property, plant and equipment. The asset group evaluated included the entire NAVL reporting unit. The Company determined that the sum of the undiscounted future cash flows of the NAVL reporting unit did not exceed the carrying value of NAVL assets, indicating potential impairment. As a result, the fair value was determined for NAVL long-lived assets using an income approach as described above, which was then compared to the assets’ relative carrying values. As a result of reduced revenue growth rate assumptions associated with the impairment indicators noted above, the Company determined that the fair value of the NAVL intangible assets was below their carrying value, resulting in a partial impairment of the NAVL intangible assets. The Company recorded impairment charges for the third quarter of fiscal year 2014 of $0.7 million related to developed technology and $0.8 million related to customer relationships. The impairment charges are included in the Company’s consolidated statement of operations.
Intangible assets other than goodwill are amortized on a straight-line basis over their estimated remaining useful lives.
The following table is a summary of acquired intangible assets with remaining net book values at December 31, 2014 (in thousands, except weighted average remaining life):
|
Gross
Carrying
Value
|
Accumulated
Amortization
|
Net
Carrying
Value
|
Weighted
Average
Remaining Life
|
|||||||||||||
|
Developed technology
|
$
|
4,323
|
$
|
(1,927
|
)
|
$
|
2,396
|
3.02
|
||||||||
|
Customer relationships
|
1,354
|
(793
|
)
|
561
|
3.02
|
|||||||||||
|
Balance at December 31, 2014
|
$
|
5,677
|
$
|
(2,720
|
)
|
$
|
2,957
|
|||||||||
The following table is a summary of acquired intangible assets with remaining net book values at December 31, 2013 (in thousands, except weighted average remaining life):
|
Gross
Carrying
Value
|
Accumulated
Amortization
|
Net
Carrying
Value
|
Weighted
Average
Remaining Life
|
|||||||||||||
|
Developed technology
|
$
|
5,446
|
$
|
(1,066
|
)
|
$
|
4,380
|
4.01
|
||||||||
|
Customer relationships
|
2,350
|
(460
|
)
|
1,890
|
4.01
|
|||||||||||
|
Balance at December 31, 2013
|
$
|
7,796
|
$
|
(1,526
|
)
|
$
|
6,270
|
|||||||||
Amortization expense related to developed technology for the years ended December 31, 2014 and 2013 was $1.0 million and $1.1 million, respectively. Amortization expense related to customer relationships for the years ended December 31, 2014 and 2013 was $0.4 million and $0.5 million, respectively.
The changes in the carrying value of acquired intangible assets during the year ended December 31, 2014 were as follows (in thousands):
|
Gross
Carrying
Value
|
Accumulated
Amortization
|
Net
Carrying
Value
|
||||||||||
|
Balance at December 31, 2013
|
$
|
7,796
|
$
|
(1,526
|
)
|
$
|
6,270
|
|||||
|
Impairment of intangible assets
|
(1,540
|
)
|
—
|
(1,540
|
)
|
|||||||
|
Additions
|
—
|
(1,384
|
)
|
(1,384
|
)
|
|||||||
|
Translation adjustments
|
(579
|
)
|
190
|
(389
|
)
|
|||||||
|
Balance at December 31, 2014
|
$
|
5,677
|
$
|
(2,720
|
)
|
$
|
2,957
|
|||||
The following table presents the estimated future amortization of intangible assets as of December 31, 2014 (in thousands):
|
Fiscal Year
|
Amortization
|
|||
|
2015
|
$
|
979
|
||
|
2016
|
979
|
|||
|
2017
|
979
|
|||
|
2018
|
20
|
|||
|
Total
|
$
|
2,957
|
||
| 8. | Balance Sheet Details |
Inventories
Inventories are stated at the lower of cost (on a specific identification or weighted average cost basis), or market. Inventories at December 31, 2014 and 2013 consisted of the following (in thousands):
|
December 31,
|
||||||||
|
2014
|
2013
|
|||||||
|
Finished goods
|
$
|
14,638
|
$
|
18,617
|
||||
|
Raw materials
|
199
|
219
|
||||||
|
Inventories, net
|
$
|
14,837
|
$
|
18,836
|
||||
Property and Equipment
The following is a summary of property and equipment as of December 31, 2014 and 2013 (in thousands):
|
December 31,
|
||||||||
|
2014
|
2013
|
|||||||
|
Machinery and equipment
|
$
|
10,787
|
$
|
9,343
|
||||
|
Computer equipment
|
563
|
488
|
||||||
|
Office furniture and equipment
|
581
|
387
|
||||||
|
Leasehold improvements
|
1,894
|
539
|
||||||
|
Software
|
274
|
326
|
||||||
|
Accumulated depreciation
|
(5,777
|
)
|
(3,962
|
)
|
||||
|
Property and equipment, net
|
$
|
8,322
|
$
|
7,121
|
||||
Depreciation expense for the years ended December 31, 2014, 2013 and 2012 was $2.4 million, $1.9 million and $0.9 million, respectively.
Accrued Liabilities
Accrued liabilities at December 31, 2014 and 2013 consisted of the following (in thousands):
|
December 31,
|
||||||||
|
2014
|
2013
|
|||||||
|
Payroll and related
|
$
|
3,398
|
$
|
3,179
|
||||
|
Sales commissions
|
1,778
|
1,608
|
||||||
|
Warranty
|
113
|
131
|
||||||
|
Audit and legal services
|
231
|
198
|
||||||
|
Other
|
1,715
|
1,605
|
||||||
|
Total accrued liabilities
|
$
|
7,235
|
$
|
6,721
|
||||
Warranty Reserve
Changes in the warranty reserve during the years ended December 31, 2014 and 2013 were as follows (in thousands):
|
December 31,
|
||||||||
|
2014
|
2013
|
|||||||
|
Warranty accrual, beginning of period
|
$
|
131
|
$
|
406
|
||||
|
Provision for current period sales
|
140
|
58
|
||||||
|
Change in liability for pre-existing warranties
|
(60
|
)
|
(115
|
)
|
||||
|
Deductions for warranty claims processed during the period
|
(98
|
)
|
(218
|
)
|
||||
|
Warranty accrual, end of period
|
$
|
113
|
$
|
131
|
||||
Accumulated Other Comprehensive Income (Loss)
The components of accumulated other comprehensive loss were as follows (in thousands):
|
December 31,
|
||||||||
|
2014
|
2013
|
|||||||
|
Accumulated net unrealized gain (loss) on short-term investments
|
$
|
(13
|
)
|
$
|
13
|
|||
|
Accumulated foreign currency translation adjustments
|
(3,177
|
)
|
(1,910
|
)
|
||||
|
Accumulated other comprehensive loss
|
$
|
(3,190
|
)
|
$
|
(1,897
|
)
|
||
| 9. | Related Party Transactions |
On July 19, 2010, the Company entered into a Master OEM Purchase and Sales Agreement (the “OEM Agreement”) with GENBAND US LLC and GENBAND Ireland Ltd. (collectively, “GENBAND”), pursuant to which GENBAND could purchase any of the Company’s existing software and hardware products, as well as procure licenses and services related to such products from the Company. Pursuant to the OEM Agreement, the Company’s Board of Directors supported the election of Mark Pugerude, Chief Strategy Officer of GENBAND, as a director of the Company beginning in fiscal 2012 through the Company’s 2012 Annual Meeting of Stockholders on August 27, 2012, and B.G. Kumar, Executive Vice President and President of the Networking and Applications Product Unit of GENBAND, as a director of the Company beginning on August 27, 2012, the date of the Company’s 2012 Annual Meeting of Stockholders. Mr. Kumar’s service on the Company’s Board of Directors ended on May 30, 2013, the date of the Company’s 2013 Annual Meeting of Stockholders.
The Company recognized no revenue on sales to GENBAND in fiscal 2014. During the years ended December 31, 2013 and 2012, the Company recognized revenue of approximately $0.1 million and $1.7 million, respectively, on sales to GENBAND.
Effective April 15, 2013, the Company and GENBAND terminated the OEM Agreement and the letter agreement, dated July 19, 2010 (the “Letter Agreement”), between the Company and GENBAND US LLC. The terminations of the OEM Agreement and the Letter Agreement were effected pursuant to the execution of a transition agreement between the Company and GENBAND. The transition agreement permits GENBAND to continue to perform its functions for existing customers, as provided under the OEM Agreement, for the remainder of the current service term, and further provides that the Company will continue to provide support or maintenance to GENBAND’s existing customers under or in connection with the OEM Agreement and for which GENBAND previously submitted a purchase order.
| 10. | Commitments and Contingencies |
Legal
The Company is periodically involved in legal actions and claims that arise as a result of events that occur in the normal course of operations. The Company does not believe that any of its legal actions and claims will have, individually or in the aggregate, a material adverse effect on the Company’s financial position or results of operations.
Operating Leases
The Company leases its operating and office facilities for various terms under long-term, non-cancelable operating lease agreements. The leases expire at various dates through 2024 and provide for renewal options ranging from month-to-month to five year terms. In the normal course of business, it is expected that these leases will be renewed or replaced by leases on other properties. The leases provide for increases in future minimum annual rental payments based on defined increases which are generally meant to correlate with the Consumer Price Index, subject to certain minimum increases. Also, the agreements generally require the Company to pay executory costs (real estate taxes, insurance and repairs).
As of December 31, 2014, future minimum lease payments due under operating leases were as follows (in thousands):
|
Years ending December 31,
|
||||
|
2015
|
$
|
1,016
|
||
|
2016
|
896
|
|||
|
2017
|
666
|
|||
|
2018
|
411
|
|||
|
2019
|
237
|
|||
|
Beyond
|
1,145
|
|||
|
Total minimum lease payments
|
$
|
4,371
|
||
Rent expense for operating leases was $0.9 million for the year ended December 31, 2014, and $0.8 million and $0.4 million for the years ended December 31, 2013 and 2012, respectively.
Purchase Commitments with Suppliers
The Company issues purchase orders to third-party suppliers that may not be cancelable. As of December 31, 2014, the Company had open non-cancelable purchase orders amounting to approximately $16.3 million, primarily with the Company’s third-party suppliers.
| 11. | Guarantees |
Indemnification Agreements
The Company enters into standard indemnification arrangements with certain of its business partners and customers in the ordinary course of business. Pursuant to these arrangements, the Company agrees to indemnify, hold harmless and reimburse the indemnified parties for losses suffered or incurred by the indemnified party, generally business partners or customers, in connection with any patent, or any copyright or other intellectual property infringement claim by any third party with respect to the Company’s products. The term of these indemnification agreements is generally perpetual any time after the execution of the agreement. The maximum potential amount of future payments the Company could be required to make under these agreements is unlimited. The Company has never been a party to an infringement claim with respect to its products or incurred costs to defend lawsuits or settle claims related to these indemnification agreements. As a result, the Company believes the estimated fair value of these agreements is minimal.
The Company has entered into indemnification agreements with its directors and officers that may require the Company to indemnify its directors and officers against liabilities that may arise by reason of their status or service as directors or officers, other than liabilities arising from willful misconduct of a culpable nature; to advance their expenses incurred as a result of any proceeding against them as to which they could be indemnified; and to obtain directors’ and officers’ insurance if available on reasonable terms, which the Company currently has in place. The Company has not been required to indemnify any directors or officers under these agreements.
| 12. | Stockholders’ Equity |
Preferred Stock
The Company is authorized to issue up to 15.0 million shares of preferred stock, par value $0.001 per share. As of December 31, 2014 and 2013, no shares of preferred stock were issued and outstanding.
Common Stock Transactions
On January 9, 2013, the Company issued 825,000 unregistered shares of its common stock with a value of approximately $14.3 million, pursuant to the Company’s acquisition of Vineyard as part of the purchase consideration in exchange for 100% of the outstanding securities of Vineyard and deferred compensation to the founders of Vineyard. On February 13, 2013, the Company filed with the SEC a Registration Statement on Form S-3 covering the resale of these shares. The Registration Statement on Form S-3 was declared effective by the SEC on March 7, 2013. Pursuant to the Vineyard acquisition agreement, 518,000 shares were transferred to the former Vineyard shareholders at closing, with the remainder being held in escrow for a period of 12, 18 or 36 months from the closing of the acquisition. In January 2014, 178,000 shares were released from the escrow related to the retention agreements with Vineyard’s three founders after one year of continuous employment with the Company. In July 2014, 124,000 shares were released from escrow related to the resolution of certain contingencies. As of December 31, 2014, 5,000 shares remain in escrow.
Stock Incentive Plans
In August 2003, October 2004 and October 2007, the Company’s Board of Directors (the “Board”), and subsequently its stockholders, adopted the 2003 Stock Option Plan, 2004 Stock Option Plan and 2007 Equity Incentive Plan, respectively (collectively referred to as the “Plan”). In March 2011, the Board approved an increase of 400,000 shares of common stock that may be issued under the Plan to an aggregate of 1,100,000 shares. This increase was approved by the Company’s stockholders at the 2011 Annual Meeting of Stockholders. In March 2012, the Board approved an increase of 800,000 shares of common stock under the Plan, which increase was approved by the Company’s stockholders at the 2012 Annual Meeting of Stockholders. In March 2013, the Board approved an increase of 500,000 shares of common stock under the Plan, which increase was approved by the Company’s stockholders at the 2013 Annual Meeting of Stockholders. The aggregate number of shares reserved for issuance under the Plan at December 31, 2014 is 1,900,000.
The purpose of the Plan is to enable the Company to offer stock-based incentives to employees, directors and consultants with the objective of aligning those individuals’ interests with those of stockholders. Under the Plan, the Company is authorized to grant a wide variety of incentive awards, including incentive stock options, non-statutory stock options, restricted stock awards, restricted stock unit awards, stock appreciation rights, performance stock awards and performance cash awards to employees, directors and consultants. Incentive stock options may only be granted to Company employees.
As of December 31, 2014, 249,000 shares were available for future grant under the Plan. The options under the Plan vest over varying lengths of time pursuant to various option agreements that the Company has entered into with the grantees of such options. The Plan is administered by the Board. Subject to the provisions of the Plan, the Board has authority to determine the employees, directors and consultants who are to be awarded options and the terms of such awards, including the number of shares subject to such options, the fair market value of the common stock subject to options, the exercise price per share and other terms.
Incentive stock options must have an exercise price equal to at least 100% of the fair market value of a share on the date of the award and generally cannot have a duration of more than ten years. If the grant is to a stockholder holding more than 10% of the Company’s voting stock, the exercise price must be at least 110% of the fair market value on the date of grant. Options generally vest over a period of three to five years. Stock option exercises are settled with newly issued shares of common stock approved by stockholders for inclusion under the Plan. Awards are set forth in written agreements between the Company and the respective option holders. Awards under the Plan may not be made after the tenth anniversary of the date of adoption of each respective stock option plan but awards granted before that date may extend beyond that date.
Optionees have no rights as stockholders with respect to shares subject to the option prior to the exercise thereof. An option becomes exercisable at such time and for such amounts as determined by the Board. An optionee may exercise a part of the option from the date that part first becomes exercisable until the option expires. The purchase price for shares to be issued to an employee upon his or her exercise of an option is determined by the Board on the date the option is granted. The Plan provides for adjustment as to the number and kinds of shares covered by the outstanding options and the option price therefore to give effect to any stock dividend, stock split, stock combination or other reorganization.
Restricted stock awards are awards of shares of common stock that vest in accordance with terms and conditions established by the Board. Each restricted stock award is evidenced by an award agreement that sets forth the terms and conditions of the award. The Board sets the terms of the restricted stock award, including the size of the restricted stock award, the price to be paid by the recipient, if any, the vesting schedule and any performance criteria that may be required for the stock to vest. The award may vest based on continued employment and/or the achievement of performance goals. If a participant’s service terminates before the restricted stock is fully vested, all of the unvested shares will be forfeited by the participant unless otherwise provided in the restricted stock award agreement.
Restricted stock unit awards are awards of units that relate to shares of common stock that vest in accordance with terms and conditions established by the Board. Each restricted stock unit award is evidenced by an award agreement that sets forth the terms and conditions of the award. The Board sets the terms of the restricted stock unit award, including the size of the restricted stock unit award, the price to be paid by the recipient, if any, the vesting schedule and any performance criteria that may be required for the award to vest. The award may vest based on continued employment and/or the achievement of performance goals. If a participant’s service terminates before the restricted stock unit is fully vested, all of the unvested units will be forfeited by the participant unless otherwise provided in the restricted stock unit award agreement.
Stock Incentive Plan Activity
Stock Options
The following table summarizes the Company’s stock option activity (in thousands, except per share data):
|
Years Ended December 31,
|
||||||||||||||||||||||||
|
2014
|
2013
|
2012
|
||||||||||||||||||||||
|
Options
|
Weighted
Average
Exercise
Price
|
Options
|
Weighted
Average
Exercise
Price
|
Options
|
Weighted
Average
Exercise
Price
|
|||||||||||||||||||
|
Outstanding at the beginning of the year
|
1,824
|
$
|
15.07
|
1,332
|
$
|
14.93
|
1,198
|
$
|
10.35
|
|||||||||||||||
|
Granted
|
281
|
9.24
|
941
|
15.64
|
629
|
20.64
|
||||||||||||||||||
|
Exercised
|
(62
|
)
|
5.67
|
(82
|
)
|
7.36
|
(372
|
)
|
10.24
|
|||||||||||||||
|
Cancelled
|
(398
|
)
|
14.71
|
(367
|
)
|
18.30
|
(123
|
)
|
14.67
|
|||||||||||||||
|
Outstanding at the end of the year
|
1,645
|
$
|
14.71
|
1,824
|
$
|
15.07
|
1,332
|
$
|
14.93
|
|||||||||||||||
|
Vested and expected to vest at the end of the year
|
1,549
|
$
|
14.78
|
1,702
|
$
|
14.98
|
1,254
|
$
|
14.66
|
|||||||||||||||
|
Exercisable at the end of the year
|
919
|
$
|
14.72
|
674
|
$
|
12.59
|
618
|
$
|
11.58
|
|||||||||||||||
As of December 31, 2014, the aggregate intrinsic value of options outstanding, options vested and expected to vest, and options exercisable was $0.4 million, $0.4 million and $0.3 million, respectively. As of December 31, 2014, the weighted average remaining contractual life of options outstanding, options vested and expected to vest, and options exercisable was 7.59 years, 7.51 years and 6.73 years, respectively. The total intrinsic value of options exercised during the years ended December 31, 2014, 2013 and 2012 was $0.3 million, $0.6 million and $3.6 million, respectively. Total fair value of options vested during 2014, 2013 and 2012 was $3.9 million, $2.2 million and $1.9 million, respectively.
Restricted Stock
The following is a summary of the Company’s restricted stock and restricted stock unit activity (in thousands, except per share data):
|
Years Ended December 31,
|
||||||||||||||||||||||||
|
2014
|
2013
|
2012
|
||||||||||||||||||||||
|
Awards
|
Weighted
Average
Grant Date
Fair Value
|
Awards
|
Weighted
Average
Grant Date
Fair Value
|
Awards
|
Weighted
Average
Grant Date
Fair Value
|
|||||||||||||||||||
|
Unvested outstanding at the beginning of the year
|
302
|
$
|
16.63
|
253
|
$
|
15.79
|
136
|
$
|
9.24
|
|||||||||||||||
|
Granted
|
473
|
9.35
|
159
|
14.50
|
152
|
20.32
|
||||||||||||||||||
|
Vested
|
(136
|
)
|
15.24
|
(109
|
)
|
11.52
|
(35
|
)
|
10.04
|
|||||||||||||||
|
Forfeited
|
(53
|
)
|
11.16
|
(1
|
)
|
20.25
|
-
|
-
|
||||||||||||||||
|
Unvested outstanding at the end of the year
|
586
|
$
|
11.58
|
302
|
$
|
16.63
|
253
|
$
|
15.79
|
|||||||||||||||
Stock-Based Compensation
Stock-based employee compensation expense recognized pursuant to the Company’s stock incentive plans on the accompanying consolidated statements of operations is as follows (in thousands):
|
Years Ended December 31,
|
||||||||||||
|
2014
|
2013
|
2012
|
||||||||||
|
Cost of goods sold
|
$
|
390
|
$
|
386
|
$
|
150
|
||||||
|
Research and development
|
1,427
|
1,225
|
322
|
|||||||||
|
Sales and marketing
|
1,525
|
1,682
|
1,175
|
|||||||||
|
General and administrative
|
1,856
|
1,764
|
1,137
|
|||||||||
|
Total stock-based compensation expense
|
$
|
5,198
|
$
|
5,057
|
$
|
2,784
|
||||||
Stock-based compensation in the year ended December 31, 2013 includes a one-time $660,000 charge associated with the acceleration of Vineyard option grants at the closing of the acquisition.
No income tax benefits were recognized in the years ended December 31, 2014, 2013 and 2012 due to operating losses and operating loss carry-forwards available to offset income. No stock-based compensation has been capitalized in inventory due to the immateriality of such amounts.
As of December 31, 2014, total unrecognized compensation cost related to unvested stock options was $5.2 million, net of estimated forfeitures, which is expected to be recognized over an estimated weighted average amortization period of 2.39 years, and total unrecognized compensation cost related to non-vested restricted stock awards was $4.8 million, net of estimated forfeitures, which is expected to be recognized over an estimated weighted average amortization period of 2.82 years.
Valuation Assumptions
The fair value of each option grant is estimated on the date of grant using the Black-Scholes option valuation model. The fair value of each restricted stock and restricted stock unit grant is calculated based upon the closing stock price of the Company’s common stock on the date of the grant. The expense for stock-based awards is recognized over the requisite service period using the straight-line attribution approach.
The following assumptions were used in determining the fair value of stock options granted during the years ended December 31, 2014, 2013 and 2012:
|
Years Ended December 31,
|
||||||||||||
|
2014
|
2013
|
2012
|
||||||||||
|
Expected term (in years)
|
5.05
|
4.89
|
4.55
|
|||||||||
|
Expected volatility
|
64
|
%
|
76
|
%
|
78
|
%
|
||||||
|
Risk-free interest rate
|
1.57
|
%
|
1.09
|
%
|
0.65
|
%
|
||||||
|
Dividend yield
|
-
|
%
|
-
|
%
|
-
|
%
|
||||||
The weighted average grant date fair value of options granted during the years ended December 31, 2014, 2013 and 2012 was $4.64, $9.31 and $12.00, respectively.
The Company calculated the expected term of stock options granted using historical exercise data. Expected volatilities were estimated using the historical share price performance over a period equivalent to the expected term of the option. The risk-free interest rate for a period equivalent to the expected term of the option was extrapolated from the U.S. Treasury yield curve in effect at the time of the grant. The Company has never paid cash dividends and does not anticipate paying cash dividends in the foreseeable future.
| 13. | Income Taxes |
The components of income (loss) before income taxes are as follows (in thousands):
|
Years Ended December 31,
|
||||||||||||
|
2014
|
2013
|
2012
|
||||||||||
|
Domestic
|
$
|
(11,610
|
)
|
$
|
(13,287
|
)
|
$
|
1,761
|
||||
|
Foreign
|
(13,454
|
)
|
(4,174
|
)
|
3,693
|
|||||||
|
Income (loss) before income taxes
|
$
|
(25,064
|
)
|
$
|
(17,461
|
)
|
$
|
5,454
|
||||
The Company’s income tax provision (benefit) consists of the following (in thousands):
|
Years Ended December 31,
|
||||||||||||
|
2014
|
2013
|
2012
|
||||||||||
|
Current income taxes:
|
||||||||||||
|
Federal
|
$
|
-
|
$
|
-
|
$
|
-
|
||||||
|
State
|
10
|
(7
|
)
|
60
|
||||||||
|
Foreign
|
319
|
237
|
63
|
|||||||||
|
Total current income taxes
|
329
|
230
|
123
|
|||||||||
|
Deferred income taxes:
|
||||||||||||
|
Foreign
|
(577
|
)
|
(1,407
|
)
|
-
|
|||||||
|
Total deferred income taxes
|
(577
|
)
|
(1,407
|
)
|
-
|
|||||||
|
Income tax provision (benefit)
|
$
|
(248
|
)
|
$
|
(1,177
|
)
|
$
|
123
|
||||
Deferred income taxes reflect the net tax effects of net operating loss and tax credit carryovers and temporary differences between the carrying amounts of assets and liabilities for financial reporting purposes and the amounts used for income tax purposes. Significant components of the Company’s deferred tax assets are as follows (in thousands):
|
December 31,
|
||||||||
|
Deferred tax assets:
|
2014
|
2013
|
||||||
|
Federal, state and foreign net operating losses
|
$
|
12,110
|
$
|
10,508
|
||||
|
Research and other tax credits
|
1,703
|
1,122
|
||||||
|
Stock-based compensation expense
|
1,444
|
1,236
|
||||||
|
Goodwill and intangibles
|
4,759
|
-
|
||||||
|
Other
|
3,347
|
2,634
|
||||||
|
Valuation allowance
|
(22,492
|
)
|
(14,399
|
)
|
||||
|
Total deferred tax assets
|
871
|
1,101
|
||||||
|
Deferred tax liabilities:
|
||||||||
|
Intangible assets and others
|
(871
|
)
|
(1,690
|
)
|
||||
|
Net deferred tax liabilities
|
$
|
-
|
$
|
(589
|
)
|
|||
Reconciliation between the tax provision computed at the Federal statutory income tax rate of 34% and the Company’s actual effective income tax provision is as follows:
|
Years Ended December 31,
|
||||||||||||
|
2014
|
2013
|
2012
|
||||||||||
|
Computed at statutory rate
|
34
|
%
|
34
|
%
|
34
|
%
|
||||||
|
State income taxes
|
1
|
3
|
2
|
|||||||||
|
Stock compensation
|
(3
|
)
|
(6
|
)
|
(2
|
)
|
||||||
|
Foreign tax
|
5
|
(1
|
)
|
(23
|
)
|
|||||||
|
Acquisition expenses
|
-
|
|
(12
|
)
|
-
|
|||||||
|
Permanent items and other
|
(1
|
)
|
(4
|
)
|
4
|
|||||||
|
Valuation allowance
|
(35
|
)
|
(7
|
)
|
(13
|
)
|
||||||
|
Total
|
1
|
%
|
7
|
%
|
2
|
%
|
||||||
Realization of deferred tax assets is dependent upon future earnings, if any, the timing and amount of which are uncertain. Accordingly, the net deferred tax assets have been fully offset by a valuation allowance. The valuation allowance increased by $8.1 million and $1.8 million for the years ended December 31, 2014 and 2013, respectively.
As of December 31, 2014, the Company had net operating loss carryforwards for federal income tax purposes of approximately $31.0 million which will begin to expire in 2021. The Company also has state net operating loss carryforwards of approximately $23.5 million which will begin to expire in 2015. The net operating loss carryforwards include $1.9 million which relates to stock option deductions that will be recognized through additional paid in capital when utilized. As such, these deductions are not reflected in deferred tax assets. The Company also has foreign net operating loss carryforwards of $3.6 million which will begin to expire in 2029. The Company also has Federal and California research and development tax credits of $0.4 million and $0.3 million, respectively. The federal research credits will begin to expire in 2022 while the California research credits have no expiration date.
Utilization of the Company’s net operating loss carryforwards may be subject to substantial annual limitation due to the ownership change limitations provided by the Internal Revenue Code, and similar state provisions. Such an annual limitation could result in the expiration of the net operating loss carryforwards before utilization.
The Company files income tax returns in the U.S., various state jurisdictions and in the countries of Sweden, Canada, Australia, Singapore, and Japan. As of December 31, 2014, the federal returns for the years ended 2011 through the current period and most state returns for the years ended 2010 through the current period are still open to examination. In addition, all of the net operating losses and research and development credit carryforwards that may be used in future years are still subject to adjustment. The Company is also subject to examinations in foreign jurisdictions for the years ended 2008 through the current period.
The Company has indefinitely reinvested approximately $0.8 million of undistributed earnings of its foreign operations outside the U.S. as of December 31, 2014. No deferred tax liability has been recognized for the remittance of such earnings to the U.S. since it is the Company’s intention to utilize these earnings in these foreign jurisdictions. If these earnings were distributed, foreign tax credits may become available under current law to reduce or eliminate the resulting U.S. income tax liability.
The following table summarizes the activity related to unrecognized tax benefits (in thousands):
|
2014
|
2013
|
|||||||
|
Balance at January 1
|
$
|
196
|
$
|
193
|
||||
|
Increase related to current year tax position
|
9
|
2
|
||||||
|
Increase related to tax position of prior year
|
8
|
1
|
||||||
|
Balance at December 31
|
$
|
213
|
$
|
196
|
||||
As of December 31, 2014, the Company had a total of $0.2 million of net unrecognized tax benefits, none of which would affect the effective tax rate upon realization. The Company currently has a full valuation allowance against its U.S. net deferred tax assets which would impact the timing of the effective tax rate benefit should any of these uncertain tax positions be favorably settled in the future.
We recognize interest and penalties related to uncertain tax positions in income tax expense. As of December 31, 2014, we have no accrued interest or penalties related to uncertain tax positions. The Company does not anticipate that total unrecognized tax benefits will significantly change due to the settlement of audits and the expiration of statute of limitations prior to December 31, 2015.
| 14. | Net Income (Loss) Per Share |
Basic net income (loss) per share is computed by dividing net income (loss) by the weighted average number of common shares outstanding for the period. Diluted net income per share reflects the potential dilution that could occur from common shares issuable upon the exercise of outstanding stock options or warrants and the vesting of restricted stock awards, which are reflected in diluted earnings per share by application of the treasury stock method. Under the treasury stock method, the amount that the employee must pay for exercising stock options or warrants, the amount of stock-based compensation cost for future services that the Company has not yet recognized, and the amount of tax benefit that would be recorded in additional paid-in capital upon exercise are assumed to be used to repurchase shares.
The following table sets forth the computation of basic and diluted net income (loss) per share and potential shares of common stock that are not included in the diluted net income (loss) per share calculation because their effect is antidilutive (in thousands, except per share amounts):
|
Years Ended December 31,
|
||||||||||||
|
2014
|
2013
|
2012
|
||||||||||
|
Numerator:
|
||||||||||||
|
Net income (loss)
|
$
|
(24,816
|
)
|
$
|
(16,284
|
)
|
$
|
5,331
|
||||
|
Denominator:
|
||||||||||||
|
Weighted average common shares - basic
|
20,450
|
20,091
|
17,842
|
|||||||||
|
Dilutive effect of employee equity incentive plans
|
-
|
-
|
484
|
|||||||||
|
Dilutive effect of warrants
|
-
|
-
|
11
|
|||||||||
|
Weighted average common shares - diluted
|
20,450
|
20,091
|
18,337
|
|||||||||
|
Net income (loss) per share:
|
||||||||||||
|
Basic
|
$
|
(1.21
|
)
|
$
|
(0.81
|
)
|
$
|
0.30
|
||||
|
Diluted
|
$
|
(1.21
|
)
|
$
|
(0.81
|
)
|
$
|
0.29
|
||||
|
Anti-dilutive securities:
|
||||||||||||
|
Options and restricted stock
|
1,349
|
1,186
|
301
|
|||||||||
| 15. | Retirement Plans |
The Company allows eligible employees to participate in a 401(k) defined-contribution retirement plan, which allows contributions on a pre-tax basis. Generally, all employees based in the U.S. are eligible to participate in the plan which allows voluntary contributions, subject to the annual maximum allowed by the U.S. Internal Revenue Service. The Company may contribute as much as determined by the Board of Directors. The Company made $0.2 million and $0.2 million matching contributions to the defined-contribution retirement plan for the years ended December 31, 2014 and 2013, respectively. The Company did not make any matching contributions for the year ended December 31, 2012.
| 16. | Segment Information and Revenue by Geographic Region |
The Company has one reportable operating segment representing the PacketLogic business. The Company’s CODM evaluates the performance of segments and makes decisions regarding allocation of resources based on certain metrics including segment revenue, gross profit and operating income (loss) measures before other income (expense), net and income taxes. Certain operating expenses, including stock-based compensation expenses; business development expenses; cost reduction efforts; acquisition-related intangible asset and impairment charges, and deferred compensation amortization are not allocated to segments. The CODM does not review asset information by segment.
The following table presents information for the Company’s reportable segment (All Other represents the Company’s NAVL business; amounts in thousands):
|
|
PacketLogic
|
All Other
|
Total
|
|||||||||
|
Year ended December 31, 2014:
|
||||||||||||
|
Sales
|
$
|
71,028
|
$
|
4,385
|
$
|
75,413
|
||||||
|
Gross profit
|
42,097
|
3,731
|
45,828
|
|||||||||
|
Loss from operations
|
$
|
(3,522
|
)
|
$
|
(553
|
)
|
$
|
(4,075
|
)
|
|||
|
|
||||||||||||
|
Year ended December 31, 2013:
|
||||||||||||
|
Sales
|
$
|
72,015
|
$
|
2,658
|
$
|
74,673
|
||||||
|
Gross profit
|
40,088
|
2,205
|
42,293
|
|||||||||
|
Loss from operations
|
$
|
(1,526
|
)
|
$
|
(2,448
|
)
|
$
|
(3,974
|
)
|
|||
The following table reconciles segment gross profit and segment operating loss to consolidated results (in thousands):
|
Year Ended December 31,
|
||||||||
|
|
2014
|
2013
|
||||||
|
Segment gross profit
|
$
|
45,828
|
$
|
42,293
|
||||
|
Unallocated amounts:
|
||||||||
|
Stock-based compensation
|
(390
|
)
|
(386
|
)
|
||||
|
Amortization of intangibles
|
(995
|
)
|
(1,094
|
)
|
||||
|
Cost reduction efforts
|
(237
|
)
|
-
|
|||||
|
Consolidated gross profit
|
44,206
|
40,813
|
||||||
|
Segment operating loss
|
(4,075
|
)
|
(3,974
|
)
|
||||
|
Unallocated amounts:
|
||||||||
|
Stock-based compensation
|
(5,198
|
)
|
(5,057
|
)
|
||||
|
Amortization of intangibles
|
(1,384
|
)
|
(1,566
|
)
|
||||
|
Cost reduction efforts
|
(1,134
|
)
|
-
|
|||||
|
Impairment of goodwill and purchased intangible assets
|
(12,380
|
)
|
-
|
|||||
|
Deferred compensation
|
(65
|
)
|
(5,809
|
)
|
||||
|
Business development expenses
|
(229
|
)
|
(1,616
|
)
|
||||
|
Consolidated operating loss
|
$
|
(24,465
|
)
|
$
|
(18,022
|
)
|
||
The Company has one reportable operating segment. The Company’s Chief Operating Decision Maker, the Chief Executive Officer, evaluates the performance of the Company and makes decisions regarding allocation of resources based on total Company results.
Sales for geographic regions were based upon the customer’s location. The following table presents net sales by geographic region (in thousands):
|
Year Ended December 31,
|
||||||||||||
|
2014
|
2013
|
2012
|
||||||||||
|
Total sales:
|
||||||||||||
|
Europe, Middle East and Africa
|
$
|
37,653
|
$
|
29,328
|
$
|
16,819
|
||||||
|
Asia Pacific
|
15,665
|
15,954
|
13,751
|
|||||||||
|
United States
|
13,053
|
17,273 |
19,622
|
|||||||||
|
Canada and Latin America
|
9,042
|
12,118
|
9,435
|
|||||||||
|
Total
|
$
|
75,413
|
$
|
74,673
|
$
|
59,627
|
||||||
Property and equipment information is based on the physical location of the Company’s regional offices. The following table presents geographic information for property and equipment, net (in thousands):
|
Year Ended December 31,
|
||||||||
|
2014
|
2013
|
|||||||
|
Property and equipment, net:
|
||||||||
|
United States
|
$
|
1,207
|
$
|
1,444
|
||||
|
Canada
|
2,811
|
1,019
|
||||||
|
Europe
|
4,299
|
4,655
|
||||||
|
Asia Pacific
|
5
|
3
|
||||||
|
Total
|
$
|
8,322
|
$
|
7,121
|
||||
Sales made to customers located outside the United States as a percentage of total net revenues were 83%, 77% and 67% for the years ended December 31, 2014, 2013 and 2012, respectively.
For the year ended December 31, 2014, no single customer accounted for more than 10% of net revenues. For the year ended December 31, 2013, revenue from three customers, Shaw Communications, Inc., British Telecommunications plc and Itochu Techno-Solutions Corp. represented 13%, 12% and 10% of net revenues, respectively, with no other single customer accounting for more than 10% of net revenues. For the year ended December 31, 2012, revenue from one customer, Shaw Communications, Inc., represented 16% of net revenues, with no other single customer accounting for more than 10% of net revenues.
At December 31, 2014, accounts receivable from one customer represented 13% of total accounts receivable, with no other single customer accounting for more than 10% of the accounts receivable balance. At December 31, 2013, accounts receivable from one customer represented 32% of total accounts receivable, with no other single customer accounting for more than 10% of the accounts receivable balance. At December 31, 2014 and 2013, approximately 93% and 86%, respectively, of the Company’s total accounts receivable were due from customers outside the United States.
| 17. | Subsequent Events |
On February 13, 2015, the Company entered into a fifty-four month operating lease agreement to occupy two floors that total 4,499 square feet located in Malmö, Sweden. Base rent payments will begin in April 1, 2015 and the total estimated base rent payment over the life of the lease is approximately $400,000. In addition to the base rent payments, the Company will be obligated to pay its share of tax obligations.
Supplemental Quarterly Financial Data (unaudited)
The following is a summary of quarterly results of operations for the years ended December 31, 2014 and 2013 (in thousands, except per share data):
|
Year Ended December 31, 2014
|
||||||||||||||||
|
March 31
|
June 30
|
September
30
|
December
31
|
|||||||||||||
|
Total sales
|
|
$
|
14,541
|
|
$
|
20,608
|
|
$
|
16,109
|
|
$
|
24,155
|
||||
|
Gross profit
|
8,384
|
11,743
|
10,217
|
13,862
|
||||||||||||
| Income tax provision (benefit) | (147 | ) | 25 | (160 | ) | 34 | ||||||||||
|
Net loss
|
(5,976
|
)
|
(1,408
|
)
|
(15,712
|
)
|
(1,720
|
)
|
||||||||
|
Basic net loss per share (1)
|
(0.29
|
)
|
(0.07
|
)
|
(0.77
|
)
|
(0.08
|
)
|
||||||||
|
Diluted net loss per share (1)
|
(0.29
|
)
|
(0.07
|
)
|
(0.77
|
)
|
(0.08
|
)
|
||||||||
|
Year Ended December 31, 2013
|
||||||||||||||||
|
March 31
|
June 30
|
September
30
|
December
31
|
|||||||||||||
|
Total sales
|
|
$
|
14,171
|
|
$
|
17,839
|
|
$
|
21,333
|
|
$
|
21,330
|
||||
|
Gross profit
|
7,369
|
10,725
|
10,357
|
12,362
|
||||||||||||
| Income tax provision (benefit) | (623 | ) | (860 | ) | (205 | ) | 511 | |||||||||
|
Net loss
|
(6,717
|
)
|
(3,282
|
)
|
(2,983
|
)
|
(3,302
|
)
|
||||||||
|
Basic net loss per share (1)
|
(0.34
|
)
|
(0.16
|
)
|
(0.15
|
)
|
(0.16
|
)
|
||||||||
|
Diluted net loss per share (1)
|
(0.34
|
)
|
(0.16
|
)
|
(0.15
|
)
|
(0.16
|
)
|
||||||||
| (1) | Basic and diluted net loss per share is computed independently. Therefore, the sum of the quarterly net loss per share may not equal the total computed for the fiscal year or any cumulative interim period. |
None.
Evaluation of Disclosure Controls and Procedures
We have adopted and maintain disclosure controls and procedures that are designed to ensure that information required to be disclosed in our reports under the Securities Exchange Act of 1934, as amended, is recorded, processed, summarized and reported within the time periods specified in the SEC’s rules and forms and that such information is accumulated and communicated to our management, including our Chief Executive Officer and Chief Financial Officer, as appropriate, to allow for timely decisions regarding required disclosure. In designing and evaluating the disclosure controls and procedures, management recognizes that controls and procedures, no matter how well designed and operated, cannot provide absolute assurance of achieving the desired control objectives.
As required by Rule 13a-15(b), under the Securities Exchange Act of 1934, as amended, we carried out an evaluation, under the supervision and with the participation of management, including our Chief Executive Officer and Chief Financial Officer, of the effectiveness of the design and operation of our disclosure controls and procedures as of the end of the period covered by this report. Based on the foregoing, our Chief Executive Officer and Chief Financial Officer concluded that as of December 31, 2014, our disclosure controls and procedures were effective at the reasonable assurance level.
Management’s Report on Internal Control over Financial Reporting
We prepared the consolidated financial statements and other information in our Annual Report in accordance with accounting principles generally accepted in the United States of America and we are responsible for their accuracy. The financial statements necessarily include amounts that are based on our best estimates and judgments. In meeting our responsibility, we rely on internal accounting and related control systems. As our business grows and becomes more complex, we continually evaluate our internal control systems, processes, and talent and make changes to respond to the normal evolution of our business by revising and/or enhancing controls, processes and internal resources, and supplementing internal resources as appropriate with third-party consultants. The internal control systems are designed to ensure that transactions are properly authorized and recorded in our financial records and to safeguard our assets from material loss or misuse. Such assurance cannot be absolute because of inherent limitations in any internal control system.
Our management is responsible for establishing and maintaining adequate internal control over financial reporting as defined in Rule 13a-15(f) of the Securities Exchange Act of 1934, as amended.
Because of inherent limitations, internal control over financial reporting may not prevent or detect misstatements. Also, projections of any evaluation of effectiveness to future periods are subject to the risk that controls may become inadequate because of changes in conditions, or that the degree of compliance with the policies or procedures may deteriorate.
In connection with the preparation of our annual financial statements, under the supervision and with the participation of our management, including our Chief Executive Officer and Chief Financial Officer, we completed an assessment of the effectiveness of our internal control over financial reporting as of December 31, 2014. The assessment was based upon the framework described in the “Integrated Control-Integrated Framework” issued by the Committee of Sponsoring Organizations of the Treadway Commission (2013 Framework) (“COSO”). Our assessment included an evaluation of the design of internal control over financial reporting and testing of the operational effectiveness of internal control over financial reporting. We have reviewed the results of the assessment with the Audit Committee of our Board of Directors.
Based on our assessment under the criteria set forth in COSO, management has concluded that, as of December 31, 2014, we maintained effective internal control over financial reporting.
The effectiveness of our internal control over financial reporting as of December 31, 2014 has been audited by McGladrey, LLP, an independent registered public accounting firm, as stated in their report which appears herein.
Changes in Internal Control over Financial Reporting
There was no change in our internal control over financial reporting during the quarter ended December 31, 2014, that has materially affected, or is reasonably likely to materially affect, our internal control over financial reporting.
Limitation on Effectiveness of Controls and Procedures
In designing and evaluating the disclosure controls and procedures, management recognizes that any controls and procedures, no matter how well designed and operated, can provide only reasonable assurance of achieving the desired control objectives. In addition, the design of disclosure controls and procedures must reflect the fact that there are resource constraints and that management is required to apply its judgment in evaluating the benefits of possible controls and procedures relative to their costs.
REPORT OF INDEPENDENT REGISTERED PUBLIC ACCOUNTING FIRM ON
INTERNAL CONTROL OVER FINANCIAL REPORTING
The Board of Directors and Stockholders of Procera Networks, Inc.
We have audited Procera Networks, Inc.’s internal control over financial reporting as of December 31, 2014, based on criteria established in Internal Control - Integrated Framework issued by the Committee of Sponsoring Organizations of the Treadway Commission in 2013 (the COSO criteria). Procera Networks, Inc.’s management is responsible for maintaining effective internal control over financial reporting, and for its assessment of the effectiveness of internal control over financial reporting included in the accompanying Management’s Report on Internal Control Over Financial Reporting. Our responsibility is to express an opinion on the company’s internal control over financial reporting based on our audit.
We conducted our audit in accordance with the standards of the Public Company Accounting Oversight Board (United States). Those standards require that we plan and perform the audit to obtain reasonable assurance about whether effective internal control over financial reporting was maintained in all material respects. Our audit included obtaining an understanding of internal control over financial reporting, assessing the risk that a material weakness exists, testing and evaluating the design and operating effectiveness of internal control based on the assessed risk. Our audit also included performing such other procedures as we considered necessary in the circumstances. We believe that our audit provides a reasonable basis for our opinion.
A company’s internal control over financial reporting is a process designed to provide reasonable assurance regarding the reliability of financial reporting and the preparation of financial statements for external purposes in accordance with generally accepted accounting principles. A company’s internal control over financial reporting includes those policies and procedures that (a) pertain to the maintenance of records that, in reasonable detail, accurately and fairly reflect the transactions and dispositions of the assets of the company; (b) provide reasonable assurance that transactions are recorded as necessary to permit preparation of financial statements in accordance with generally accepted accounting principles, and that receipts and expenditures of the company are being made only in accordance with authorizations of management and directors of the company; and (c) provide reasonable assurance regarding prevention or timely detection of unauthorized acquisition, use, or disposition of the company’s assets that could have a material effect on the financial statements.
Because of its inherent limitations, internal control over financial reporting may not prevent or detect misstatements. Also, projections of any evaluation of effectiveness to future periods are subject to the risk that controls may become inadequate because of changes in conditions, or that the degree of compliance with the policies or procedures may deteriorate.
In our opinion, Procera Networks, Inc. maintained, in all material respects, effective internal control over financial reporting as of December 31, 2014, based on the COSO criteria.
We also have audited, in accordance with the standards of the Public Company Accounting Oversight Board (United States), the consolidated balance sheet of Procera Networks, Inc. as of December 31, 2014 and the related consolidated statements of operations, comprehensive income (loss), stockholders’ equity, and cash flows for the year then ended, and our report dated March 12, 2015, expressed an unqualified opinion thereon.
/s/ McGladrey LLP
San Jose, California
March 12, 2015
None.
PART III
Information Regarding Directors
The Board of Directors of the Company (the “Board”) consists of up to eight directors. Once elected, each director will hold office until the next annual meeting of stockholders and until his or her successor is elected, or, if sooner, until the director’s death, resignation or removal.
Set forth below are the name, age and principal occupation or position held with the Company, along with a brief biography of, each of our directors.
The Nominating and Corporate Governance Committee of the Board seeks to assemble a Board that, as a whole, possesses the appropriate balance of professional and industry knowledge, financial expertise and high-level management experience necessary to oversee and direct our business. To that end, the Nominating and Corporate Governance Committee has identified and evaluated directors in the broader context of the Board’s overall composition, with the goal of recruiting members who complement and strengthen the skills of other members and who also exhibit integrity, collegiality, sound business judgment and other qualities that the Nominating and Corporate Governance Committee views as critical to effective functioning of the Board. The brief biographies below include information, as of the date of this Annual Report on Form 10-K, regarding the specific and particular experience, qualifications, attributes or skills of each director that led the Nominating and Corporate Governance Committee to conclude that such director should serve on our Board. However, each of the members of the Nominating and Corporate Governance Committee may have a variety of reasons why he or she believes a particular person would be an appropriate nominee for the Board, and these views may differ from the views of other members.
There are no family relationships between or among any of our officers or directors.
|
Name
|
Age as of
February 13, 2015
|
Principal Occupation/
Position Held With Procera
|
||
|
Thomas Saponas
|
65
|
Chairperson of the Board
|
||
|
James F. Brear
|
49
|
President, Chief Executive Officer and Director
|
||
|
Staffan Hillberg
|
50
|
Director
|
||
|
Alan B. Lefkof
|
62
|
Director
|
||
|
Mary Losty
|
55
|
Director
|
||
|
Scott McClendon
|
75
|
Director
|
||
|
Douglas Miller
|
57
|
Director
|
||
|
William Slavin
|
69
|
Director
|
Mr. Thomas Saponas has served as a member of our Board since April 2004 and has served as Chairperson of the Board since October 2014. Mr. Saponas served as the Senior Vice President and Chief Technology Officer of Agilent Technologies, Inc. (NYSE: A) from August 1999 until he retired in October 2003. Prior to being named Chief Technology Officer, from June 1998 to April 1999, Mr. Saponas was Vice President and General Manager of Hewlett-Packard’s Electronic Instruments Group. Mr. Saponas has held a number of positions since the time he joined Hewlett-Packard. Mr. Saponas served as General Manager of the Lake Stevens Division from August 1997 to June 1998 and General Manager of the Colorado Springs Division from August 1989 to August 1997. In 1986, he was a White House Fellow in Washington, D.C. Mr. Saponas has a BSEE/CS (Electrical Engineering and Computer Science) and an MSEE from the University of Colorado. Mr. Saponas is a director of nGimat, a nanotechnology company, and was a director of Keithley Instruments (NYSE: KEI), an electronic instruments company, from 2004 to 2010.
The Nominating and Corporate Governance Committee believes that Mr. Saponas’ senior technology and general business management expertise, and related experience at public technology-based companies, give him the qualifications and skills to serve as our director, and that Mr. Saponas’ years of service as our director bring historic knowledge and continuity to the Board.
Mr. James F. Brear has served as a member of our Board and as our Chief Executive Officer and President since February 2008. He is a Silicon Valley industry veteran with more than 20 years of experience in the networking industry, most recently as Vice President of Worldwide Sales and Support for Bivio Networks, a maker of deep packet inspection platform technology, from July 2006 to January 2008. From September 2004 to July 2006, Mr. Brear was Vice President of Worldwide Sales for Tasman Networks (acquired by Nortel), a maker of converged WAN solutions for enterprise branch offices and service providers for managed WAN services. From April 2004 to July 2004, Mr. Brear served as Vice President of Sales at Foundry Networks, a provider of switching, routing, security and application traffic management solutions. Earlier in his career, Mr. Brear was the Vice President of Worldwide Sales for Force10 Networks (acquired by Dell) from March 2002 to April 2004, during which time the company grew from a pre-revenue start-up to the industry leader in switch routers for high performance Gigabit and 10 Gigabit Ethernet. In addition, he spent five years with Cisco Systems from July 1997 to March 2002 where he held senior management positions in Europe and North America with responsibility for delivering more than $750 million in annual revenues selling into the world’s largest service providers. Previously, Mr. Brear held a variety of sales management positions at both IBM and Sprint Communications. He is a member of the Young Presidents Organization (YPO) and holds a BA from the University of California at Berkeley.
The Nominating and Corporate Governance Committee believes that Mr. Brear’s current position as our Chief Executive Officer and extensive telecommunications sales expertise and business expertise, including experience at IBM, Cisco Systems and smaller companies where he achieved substantial sales growth, give him the qualifications and skills to serve as our director.
Mr. Staffan Hillberg has served as a member of our Board since January 2007. He is currently a member of the Compensation Committee and serves as the Chairperson of the Nominating and Corporate Governance Committee. Mr. Hillberg is currently the Chief Executive Officer of Wood & Hill Investment AB, a private equity group based in Sweden, and has served in this capacity since 2008. From 2004 to 2006, he held the position of Managing Partner at the MVI Group, one of the largest and oldest business angel networks in Europe with over 175 million Euros invested in 75 companies internationally. While at MVI he oversaw a number of successful exits among them, two initial public offerings in 2006 on the AIM exchange in London as well as an initial public offering on the Swiss Stock Exchange. From 2000 to 2003, he ran a local venture capital company as well as co-founded the computer security company AppGate, with operations in Europe and the USA, and was its Chief Executive Officer from 1998 to 2000, raising US$20 million from ABN Amro, Deutsche Telecom and GE Equity. From 1996 to1998, he was also responsible for the online activities of the Bonnier Group, the largest media group in Scandinavia, spearheading their internet activities and heading up their sponsorship of MIT Media Lab. Earlier he was the QuickTime Product Manager at Apple in Cupertino, California and before this Multimedia Evangelist with Apple Computer Europe in Paris, France, for two years. He has extensive experience as an investor and business angel having been involved in the listing of two companies in Sweden, Mirror Image and Digital Illusions, where the latter was acquired by Electronic Arts. Mr. Hillberg attended the M.Sc. program at Chalmers University of Technology in Sweden and has an MBA from INSEAD in France.
The Nominating and Corporate Governance Committee believes that Mr. Hillberg’s extensive venture capital and business experience in Sweden and involvement in helping companies grow and provide value to stockholders, give him the qualifications and skills to serve as our director. Additionally, Mr. Hillberg is Swedish and lives and works in Sweden. In consideration of our subsidiary in Sweden and the related high concentration of Swedish employees to our total employees, Mr. Hillberg’s knowledge of executing business in Sweden adds well-suited cultural diversity and perspective to our Board.
Mr. Alan B. Lefkof has served as a member of our Board since August 2012 and currently serves on the Nominating and Corporate Governance Committee and as the Chairperson of the Compensation Committee. Mr. Lefkof served as Corporate Vice President and General Manager of Motorola, Inc. and then the spinoff, Motorola Mobility Holdings, Inc., from February 2007 to February 2012. During the first three years of this five-year period, he led the Broadband Solutions Group within the Home Division and then later was responsible for establishing the Software Solutions Group, where he sponsored and integrated several software company acquisitions. Mr. Lefkof served as a Director and as President and Chief Executive Officer of Netopia, Inc., a developer of broadband networking equipment and carrier-class software for the remote management of broadband services (NASDAQ: NTPA), from June 1996 until it was acquired by Motorola, Inc. in February 2007. Prior to Netopia, Inc., Mr. Lefkof was President of Farallon Communications Inc., a local area networking company, from 1991 to 1996. From 1988 to 1990, he was President of the GRiD Division of Tandy Corporation, where Mr. Lefkof led the enterprise division for personal computers and laptops. Prior to that time, from 1982 to 1987, Mr. Lefkof held various positions with GRiD Systems Corporation, a Laptop and Pen-based computer company, including Chief Financial Officer, Vice President of Marketing and Director of Product Management. Mr. Lefkof began his career at McKinsey & Company, Inc., where he was a management consultant and held positions ranging from associate to senior engagement manager from 1977 to 1981. Mr. Lefkof earned an MBA in General Management from Harvard Business School and a BS in Management from Massachusetts Institute of Technology. Mr. Lefkof currently serves on the board of directors of Cognitive Electronics, Inc., a privately held company focused on Big Data analytics, and has previously served on the Board of Directors of other privately-held software companies. He also served as a member of the Board of Directors and was a member of the Audit and Compensation Committees of QuickLogic Corporation (NASDAQ: QUIK) from 2002 to 2004.
The Nominating and Corporate Governance Committee believes that Mr. Lefkof’s knowledge of and expertise in the software, broadband, mobile carrier and communications industries, as well as his extensive management experience, give him the qualifications and skills to serve as our director.
Ms. Mary Losty has served as a member of our Board since March 2007. She is currently a member of the Audit Committee and the Nominating and Corporate Governance Committee. Ms. Losty retired in 2010 as the General Partner at Cornwall Asset Management, LLC, a portfolio management firm located in Baltimore, Maryland, where she was responsible for the firm’s investment in numerous companies since 1998. Ms. Losty’s prior experience includes working as a portfolio manager at Duggan & Associates from 1992 to 1998 and as an equity research analyst at M. Kimelman & Company from 1990 to 1992. Prior to that, she worked as an investment banker at Morgan Stanley and Co., and for several years prior to that she was the top aide to James R. Schlesinger, a five-time U.S. cabinet secretary. Ms. Losty received both her BS and JD from Georgetown University, the latter with magna cum laude distinction. She is a retired member of the American Bar Association and a commissioner for Cambridge, Maryland’s Planning and Zoning Commission. Ms. Losty was a director of Blue Earth, Inc. (formerly Genesis Fluid Solutions Holdings, Inc.) from 2009 to 2011.
The Nominating and Corporate Governance Committee believes that Ms. Losty’s investing and business expertise give her the qualifications and skills to serve as our director, and are of particular importance as we continue to seek to finance our operations.
Mr. Scott McClendon has served as a member of our Board since March 2004 and served as Chairperson of the Board from November 2007 to October 2014. He is currently a member of the Audit Committee. Mr. McClendon has been the Chairman of the Board of Directors for Overland Storage (NASDAQ: OVRL) since March 2001. He also served as Overland’s interim Chief Executive Officer from November 2006 to August 2007 and as its President and Chief Executive Officer from October 1991 to March 2001, and was an officer and employee until June 2001. Prior to his tenure with Overland, he was employed by Hewlett Packard Company, a global manufacturer of computing, communications and measurement products and services, for over 32 years in various positions in engineering, manufacturing, sales and marketing. He last served as the General Manager of the San Diego Technical Graphics Division and Site Manager of Hewlett Packard in San Diego, California. Mr. McClendon was a director of SpaceDev, Inc., an aerospace development company, from 2002 to 2008. Mr. McClendon holds a BSEE and an MSEE from Stanford University.
The Nominating and Corporate Governance Committee believes that Mr. McClendon’s executive, financial and business expertise, including a diversified background of managing and directing public technology-based companies, provides him with the qualifications and skills to serve as our director, and that Mr. McClendon’s years of service as our director bring historic knowledge and continuity to the Board.
Mr. Douglas Miller has served as a member of our Board since May 2013. He serves as Chairperson of the Audit Committee. Mr. Miller served as senior vice president, chief financial officer and treasurer of Telenav, Inc., a wireless application developer specializing in personalized navigation services, from May 2006 until June 2012, and worked as a consultant for the company from June 2012 to December 2012. During his time at Telenav, Inc., Mr. Miller led the May 2010 IPO of the company. From July 2005 to May 2006, Mr. Miller served as vice president and chief financial officer of Longboard, Inc., a privately held provider of software products for the telecommunications industry. From October 1998 to July 2005, Mr. Miller held various management positions at Synplicity, Inc., a publicly traded electronic design automation software company, including senior vice president of finance and chief financial officer. Mr. Miller also served as vice president and chief financial officer of 3DLabs, Inc., a publicly held graphics semiconductor company, from April 1997 to May 1998, and as a partner at Ernst & Young LLP, a professional services organization, from October 1991 to April 1997. Mr. Miller is a certified public accountant (inactive). He holds a B.S.C. in Accounting from Santa Clara University.
The Nominating and Corporate Governance Committee believes that Mr. Miller’s years of experience as a chief financial officer for multiple companies in the high technology industry, and his experience in the finance and accounting fields, give him the qualifications and skills to serve as our director and as Chairperson of the Audit Committee. Our Board has determined that Mr. Miller is qualified as an “audit committee financial expert,” as defined by the applicable SEC rules, and that his background and expertise assists our Board in complying with its Audit Committee membership requirements.
Mr. William Slavin has served as a member of our Board since October 2010. He is currently a member of the Compensation Committee and the Nominating and Corporate Governance Committee. Mr. Slavin served in various executive positions at International Business Machines Corporation (NYSE: IBM) from 1993 until he retired in June 2005 from his position as Vice President, with responsibility for acquisitions and divestitures for the new Business Consulting Services. During his service at IBM, Mr. Slavin helped establish the business consulting and systems integration business, held executive positions in the US, Asia and Europe, and served on IBM’s Corporate Senior Leadership Team and the Global Management Board for Business Consulting Services, the organization formed with the acquisition of PricewaterhouseCoopers Consulting. Prior to joining IBM, Mr. Slavin was a partner with KPMG, where he was responsible for the western US technology consulting practice. Earlier, he founded Slavin Associates, a technology consulting firm, which was merged into Peat Marwick. Prior to Slavin Associates, he was a Principal with A.T. Kearney, and held technical management positions with Control Data Corporation and Lockheed Missiles and Space Co. Mr. Slavin earned an MBA from the University of Santa Clara and a BA from Claremont McKenna College with majors in economic theory and mathematics.
The Nominating and Corporate Governance Committee believes that Mr. Slavin’s executive, business and strategic consulting and wide breadth of business expertise, including a diversified consulting and business development background, give him the qualifications and skills to serve as our director.
Information Regarding Executive Officers
The information required by this item related to the executive officers can be found in the section captioned “Executive Officers of the Company” under Part I, “Item 1. Business” of this Annual Report on Form 10-K, and is also incorporated herein by reference.
Section 16(a) Beneficial Ownership Reporting Compliance
Section 16(a) of the Exchange Act requires our directors and officers, and persons who own more than ten percent of a registered class of our equity securities, to file with the SEC initial reports of ownership and reports of changes in ownership of our common stock and our other equity securities. Officers, directors and greater than ten percent stockholders are required by SEC regulations to furnish us with copies of all Section 16(a) forms they file.
To our knowledge, based solely on a review of the copies of such reports furnished to us and written representations that no other reports were required, during the year ended December 31, 2014, all Section 16(a) filing requirements applicable to our officers, directors and greater than ten percent beneficial owners were complied with.
Code of Ethics
We have adopted the Procera Networks, Inc. Code of Conduct and Ethics that applies to all officers, directors and employees. The Code of Conduct and Ethics is available on our website at http://www.proceranetworks.com/ir-corporate-governance.html. A copy of the Code of Conduct and Ethics can be obtained free of charge by writing to our Corporate Secretary at 47448 Fremont Blvd., Fremont, California 94538. If we make any substantive amendments to the Code of Conduct and Ethics or grant any waiver from a provision of the Code of Conduct and Ethics to any executive officer or director, we will promptly disclose the nature of the amendment or waiver on our website.
Meetings of the Board of Directors
The Board met 18 times and took action by unanimous written consent twice during the last fiscal year. All directors attended at least 75% of the aggregate number of meetings of the Board and of the committees on which they served that were held during the portion of the last fiscal year for which they were directors or committee members, respectively. It is our policy to invite directors and nominees for director to attend the Annual Meeting either in person or by telephone. We held one annual meeting of stockholders in 2014. James F. Brear and William Slavin attended the meeting in person or by teleconference.
Information Regarding Committees of the Board of Directors
The Board has three primary committees: an Audit Committee, a Compensation Committee and a Nominating and Corporate Governance Committee. The following table provides membership and meeting information for 2014 for each of these committees of the Board:
|
Name
|
Audit
|
Compensation
|
Nominating and
Corporate
Governance
|
|||
|
Thomas Saponas
|
(1)
|
(1)
|
||||
|
James F. Brear
|
||||||
|
Staffan Hillberg
|
X
|
X*
|
||||
|
Alan B. Lefkof
|
X*(2)
|
X
|
||||
|
Mary Losty
|
X
|
X
|
||||
|
Scott McClendon
|
X
|
|||||
|
Douglas Miller
|
X*
|
|||||
|
William Slavin
|
X(3)
|
X
|
||||
|
Total meetings in 2014
|
9
|
5
|
4
|
|||
|
Total actions by unanimous written consent in 2014
|
-
|
2
|
-
|
|
(1)
|
Mr. Saponas served on the Audit Committee until he resigned from the committee on March 11, 2015. He served on the Compensation Committee and as its Chairperson until he resigned from the committee on October 15, 2014.
|
|
(2)
|
Mr. Lefkof was appointed as the Chairperson of the Compensation Committee effective October 17, 2014.
|
|
(3)
|
Mr. Slavin was appointed to the Compensation Committee on August 28, 2014.
|
|
*
|
Committee Chairperson
|
Audit Committee
The Audit Committee of the Board (the “Audit Committee”) is a separately-designated standing audit committee established by the Board in accordance with Section 3(a)(58)(A) of the Securities Exchange Act of 1934, as amended (the “Exchange Act”). The Audit Committee is composed of three directors: Mr. Miller, Ms. Losty and Mr. McClendon. The Board reviews The NASDAQ Stock Market LLC (“NASDAQ”) listing standards definition of independence for Audit Committee members on an annual basis and has determined that all members of the Audit Committee are independent (as independence is currently defined in the NASDAQ listing standards). The Board has concluded that Mr. Miller is an “audit committee financial expert,” as defined by the applicable SEC rules. The Audit Committee has adopted a written charter that is available on our website at http://www.proceranetworks.com/ir-corporate-governance.html.
The Audit Committee acts on behalf of the Board in fulfilling the Board’s oversight responsibilities with respect to our corporate accounting and financial reporting processes, the systems of internal control over financial reporting and audits of financial statements, and also assists the Board in its oversight of the quality and integrity of our financial statements and reports and the qualifications, independence and performance of our independent registered public accounting firm. For this purpose, the Audit Committee performs several functions. The Audit Committee’s responsibilities include:
| · | appointing, determining the compensation of, retaining, overseeing and evaluating our independent registered public accounting firm and any other registered public accounting firm engaged for the purpose of performing other review or attest services for us; |
| · | prior to commencement of the audit engagement, reviewing and discussing with the independent registered public accounting firm a written disclosure by the prospective independent registered public accounting firm of all relationships between us, or persons in financial oversight roles, and such independent registered public accounting firm or their affiliates; |
| · | determining and approving engagements of the independent registered public accounting firm, prior to commencement of the engagement, and the scope of and plans for the audit; |
| · | monitoring the rotation of partners of the independent registered public accounting firm on our audit engagement; |
| · | reviewing with management and the independent registered public accounting firm any fraud that includes management or employees who have a significant role in our internal control over financial reporting and any significant changes in internal controls; |
| · | establishing and overseeing procedures for the receipt, retention and treatment of complaints regarding accounting, internal accounting controls or other auditing matters and the confidential and anonymous submission by employees of concerns regarding questionable accounting or auditing matters; |
| · | reviewing management’s efforts to monitor compliance with our policies designed to ensure compliance with laws and rules; and |
| · | reviewing and discussing with management and the independent registered public accounting firm the results of the annual audit and the independent registered public accounting firm’s assessment of the quality and acceptability of our accounting principles and practices and all other matters required to be communicated to the Audit Committee by the independent registered public accounting firm under generally accepted accounting standards, the results of the independent registered public accounting firm’s review of our quarterly financial information prior to public disclosure and our disclosures in our periodic reports filed with the SEC. |
The Audit Committee reviews, discusses and assesses its own performance and composition at least annually. The Audit Committee also periodically, and at least annually, reviews and assesses the adequacy of its charter, including its role and responsibilities as outlined in its charter, and recommends any proposed changes to the Board for its consideration and approval.
Compensation Committee
The Compensation Committee of the Board is composed of three directors: Mr. Lefkof, Mr. Hillberg and Mr. Slavin. All members of the Compensation Committee are independent (as independence is currently defined in the NASDAQ listing standards), are “outside directors” for purposes of Section 162(m) of the Internal Revenue Code of 1986, as amended (the “Code”), and are “non-employee directors” for purposes of Rule 16b-3 under the Exchange Act. The Compensation Committee has adopted a written charter that is available on our website at http://www.proceranetworks.com/ir-corporate-governance.html.
The Compensation Committee acts on behalf of the Board to fulfill the Board’s responsibilities in overseeing our compensation policies, plans and programs; and in reviewing and determining the compensation to be paid to our executive officers and non-employee directors. The responsibilities of the Compensation Committee include:
| · | reviewing, modifying and approving (or, if the Compensation Committee deems appropriate, making recommendations to the Board regarding) our overall compensation strategies and policies, and reviewing and approving corporate performance goals and objectives relevant to the compensation of our executive officers and senior management; |
|
|
· | determining and approving (or, if the Compensation Committee deems appropriate, recommending to the Board for determination and approval) the compensation and terms of employment of our Chief Executive Officer, including seeking to achieve an appropriate level of risk and reward in determining the long-term incentive component of the Chief Executive Officer’s compensation; |
|
|
· | determining and approving (or, if the Compensation Committee deems appropriate, recommending to the Board for determination and approval) the compensation and terms of employment of our executive officers and senior management; |
| · | evaluating and approving (or, if it deems appropriate, making recommendations to the full Board regarding) corporate performance goals and objectives relevant to the compensation of our executive officers and senior management; |
| · | reviewing and approving (or, if it deems appropriate, making recommendations to the Board regarding) the terms of employment agreements, severance agreements, change-of-control protections and other compensatory arrangements for our executive officers and senior management; |
| · | reviewing and approving the type and amount of compensation to be paid or awarded to non-employee directors; |
| · | reviewing and approving the adoption, amendment and termination of our stock option plans, stock appreciation rights plans, pension and profit sharing plans, incentive plans, stock bonus plans, stock purchase plans, bonus plans, deferred compensation plans and similar programs, as applicable; and administering all such plans, establishing guidelines, interpreting plan documents, selecting participants, approving grants and awards and exercising such other power and authority as may be permitted or required under such plans; |
| · | reviewing our incentive compensation arrangements to determine whether such arrangements encourage excessive risk-taking, and reviewing and discussing the relationship between our risk management policies and practices and compensation, and evaluating compensation policies and practices that could mitigate any such risk, at least annually; and |
| · | reviewing and recommending to the Board for approval the frequency with which we conduct a vote on executive compensation, taking into account the results of the most recent stockholder advisory vote on the frequency of the vote on executive compensation, and reviewing and approving the proposals and frequency of the vote on executive compensation to be included in our annual meeting proxy statements. |
Historically, the Compensation Committee has made recommendations to the Board for most of the significant adjustments to annual compensation, bonus objectives and equity awards at one or more meetings held during or leading up to the first quarter of the year and in the third quarter of the year. However, the Compensation Committee also considers matters related to individual compensation, such as compensation for new executive hires, as well as high-level strategic issues, such as the efficacy of our compensation strategy, potential modifications to that strategy and new trends, plans or approaches to compensation, at various meetings throughout the year. Generally, the Compensation Committee’s process comprises two related elements: the determination of compensation levels and the establishment of performance objectives for the current year. For executives other than the Chief Executive Officer, the Compensation Committee solicits and considers evaluations and recommendations submitted to the Compensation Committee by the Chief Executive Officer. In the case of the Chief Executive Officer, the evaluation of his performance is conducted by the Compensation Committee, which determines or makes recommendations to the Board with respect to his compensation, including any equity awards to be granted. For all executives and non-employee directors, as part of its deliberations, the Compensation Committee may review and consider, as appropriate, materials such as financial reports and projections, operational data, tax and accounting information, tally sheets that set forth the total compensation that may become payable to executives in various hypothetical scenarios, executive and director stock ownership information, our stock performance data, analyses of historical executive compensation levels and current company-wide compensation levels and recommendations of the Compensation Committee’s compensation consultant, including analyses of executive and director compensation paid at other companies identified by the compensation consultant.
The Compensation Committee reviews and discusses with management our Compensation Discussion and Analysis, and recommends to the Board that the Compensation Discussion and Analysis be approved for inclusion in our annual reports on Form 10-K, registration statements or proxy statements, as applicable.
Compensation Committee Processes and Procedures
The Compensation Committee holds regular or special meetings as its members deem necessary or appropriate. The Compensation Committee, through the chairperson of the Compensation Committee, reports all material activities of the Compensation Committee to the Board from time to time, or whenever so requested by the Board. The charter of the Compensation Committee grants the Compensation Committee full access to all of our books, records, facilities and personnel, as well as authority to select, retain and obtain, at our expense, advice and assistance from internal and external legal, accounting or other advisors and consultants and other external resources that the Compensation Committee considers necessary or appropriate in the performance of its duties. In particular, the Compensation Committee has the sole authority to retain and terminate any compensation consultants to assist in its evaluation of director, chief executive officer or other senior executive compensation, including sole authority to approve the compensation consultant’s reasonable fees and other retention terms. The Compensation Committee is directly responsible for the appointment, compensation and oversight of the work of any internal or external legal, accounting or other advisors and consultants retained by the Compensation Committee. The Compensation Committee may select an internal or external legal, accounting or other advisor or consultant only after considering the independence of such internal or external legal, accounting or other advisor or consultant using factors established by law and the rules and regulations of the SEC and Nasdaq.
During the past year, the Compensation Committee engaged Compensia, Inc. as a compensation consultant. As part of its engagement, Compensia, Inc. was requested by the Compensation Committee to develop a comparative group of companies and to perform analyses of competitive performance and compensation levels for the comparative group. Compensia, Inc. has not provided any services to Procera other than this engagement (and similar engagements in prior years), and receives compensation from Procera only for services provided to the Compensation Committee, and is therefore independent.
Under its charter, the Compensation Committee may form, and delegate authority to, subcommittees as appropriate.
The Compensation Committee reviews, discusses and assesses its own performance and composition at least annually. The Compensation Committee also periodically, and at least annually, reviews and assesses the adequacy of its charter, including its role and responsibilities as outlined in its charter, and recommends any proposed changes to the Board for its consideration and approval.
Nominating and Corporate Governance Committee
The Nominating and Corporate Governance Committee of the Board is composed of four directors: Mr. Hillberg, Mr. Lefkof, Ms. Losty and Mr. Slavin. All members of the Nominating and Corporate Governance Committee are independent (as independence is currently defined in the NASDAQ listing standards). The Nominating and Corporate Governance Committee has adopted a written charter that is available on our website at http://www.proceranetworks.com/ir-corporate-governance.html.
The Nominating and Corporate Governance Committee acts on behalf of the Board to fulfill the Board’s responsibilities in overseeing all aspects of our nominating and corporate governance functions. The responsibilities of the Nominating and Corporate Governance Committee include:
| · | making recommendations to the Board regarding corporate governance issues; |
| · | identifying, reviewing and evaluating candidates to serve as directors (consistent with criteria approved by the Board); |
| · | determining the minimum qualifications for service on the Board; |
| · | reviewing and evaluating incumbent directors; |
| · | serving as a focal point for communication between candidates, non-committee members and our management; |
| · | recommending to the Board for selection candidates to serve as nominees for director for the annual meeting of stockholders; |
| · | making other recommendations to the Board regarding matters relating to the directors, including director compensation; and |
| · | considering any recommendations for nominees and proposals submitted by stockholders. |
The Nominating and Corporate Governance Committee periodically, and at least annually, reviews, discusses and assesses the performance of the Board and committees of the Board. In fulfilling this responsibility, the Nominating and Corporate Governance Committee seeks input from senior management, the full Board and others. In assessing the Board, the Nominating and Corporate Governance Committee evaluates the overall composition of the Board, the Board’s contribution as a whole and its effectiveness in serving our best interests and the best interests of our stockholders.
The Nominating and Corporate Governance Committee believes that candidates for director should have certain minimum qualifications, including the ability to read and understand basic financial statements, being over 21 years of age and having the highest personal integrity and ethics. The Nominating and Corporate Governance Committee also considers such factors as possessing relevant expertise upon which to be able to offer advice and guidance to management, having sufficient time to devote to our affairs, demonstrated excellence in his or her field, having the ability to exercise sound business judgment and having the commitment to rigorously represent the long-term interests of our stockholders. However, the Nominating and Corporate Governance Committee retains the right to modify these qualifications from time to time. Candidates for director nominees are reviewed in the context of the current composition of the Board, our operating requirements and the long-term interests of our stockholders.
In conducting this assessment, the Nominating and Corporate Governance Committee considers diversity, age, skills, and such other factors as it deems appropriate given the current needs of the Board and us, to maintain a balance of knowledge, experience and capability. While the Nominating and Corporate Governance Committee considers diversity as one of a number of factors in identifying nominees for director, it does not have a formal policy in this regard. The Nominating and Corporate Governance Committee views diversity broadly to include diversity of experience, skills and viewpoint, as well as traditional diversity concepts such as race or gender. In consideration of our subsidiary in Sweden and the related high concentration of Swedish employees to our total employees, one of our independent directors is Swedish and lives in Sweden. In the case of incumbent directors whose terms of office are set to expire, the Nominating and Corporate Governance Committee reviews these directors’ overall service to us during their terms, including the number of meetings attended, level of participation, quality of performance, and any other relationships and transactions that might impair the directors’ independence. In the case of new director candidates, the Nominating and Corporate Governance Committee also determines whether the nominee is independent for NASDAQ purposes, which determination is based upon applicable NASDAQ listing standards, applicable SEC rules and regulations and the advice of counsel, if necessary. The Nominating and Corporate Governance Committee uses its network of contacts to compile a list of potential candidates, but may also engage, if it deems appropriate, a professional search firm. The Nominating and Corporate Governance Committee conducts any appropriate and necessary inquiries into the backgrounds and qualifications of possible candidates after considering the function and needs of the Board. The Nominating and Corporate Governance Committee meets to discuss and consider the candidates’ qualifications and then selects a nominee for recommendation to the Board by majority vote.
The Nominating and Corporate Governance Committee reviews, discusses and assesses its own performance and composition at least annually, and also periodically, and at least annually, reviews and assesses the adequacy of its charter, including its role and responsibilities as outlined in its charter, and recommends any proposed changes to the Board for its consideration and approval.
The Nominating and Corporate Governance Committee will consider director candidates recommended by our stockholders. The Nominating and Corporate Governance Committee does not intend to alter the manner in which it evaluates candidates, including the minimum criteria set forth above, based on whether or not the candidate was recommended by a stockholder. Stockholders who wish to recommend individuals for consideration by the Nominating and Corporate Governance Committee to become nominees for election to the Board may do so by delivering a written recommendation to the Nominating and Corporate Governance Committee at 47448 Fremont Blvd., Fremont, California 94538, Attention: Corporate Secretary, at least 45 days prior to the anniversary date of the mailing of our proxy statement for the last annual meeting of stockholders. Submissions must include the full name of the proposed nominee, a description of the proposed nominee’s business experience for at least the previous five years, complete biographical information, a description of the proposed nominee’s qualifications as a director and a representation that the nominating stockholder is a beneficial or record holder of our stock and has been a holder for at least one year. Any such submission must be accompanied by the written consent of the proposed nominee to be named as a nominee and to serve as a director if elected.
Compensation Discussion and Analysis
Overview of Compensation Program
The goal of our executive compensation program is to provide a structure of incentives and rewards that will drive behavior and performance in a way that builds long term value for our stockholders. In support of this goal we have implemented compensation and benefit programs that are designed to:
| · | Reward performance; |
| · | Align the interests of management and stockholders; |
| · | Enable the recruitment and retention of high quality executives; and |
| · | Provide fair and reasonable levels of compensation. |
Compensation Objectives
The following are the principal objectives of our compensation programs:
Performance – We strive to maintain a performance-oriented culture. Each of our compensation elements is designed to encourage performance improvement of our executive officers. We expect our executive officers to perform to high standards of competence.
Alignment with stockholders – We set our goals based on the business milestones that we believe are most likely to drive long term stockholder value and by tying significant elements of executive compensation to our business success. Cash bonuses are designed to acknowledge short-term goal accomplishment while over the long-term, executive officers can benefit directly from increases in the value of our common stock through equity participation, primarily in the form of stock options, restricted stock and restricted stock units.
Recruiting and retention – Building an outstanding organization and delivering excellence in all aspects of our performance require that we hire, and retain, high quality executives. We believe that an environment in which employees are able to have an enjoyable, challenging and rewarding work experience is critical to our ability to recruit and retain the right people. A crucial aspect of that environment is the structure of incentives and rewards that are embedded in the compensation program. We strive to keep this structure competitive so that qualified people are motivated to join our team and to continue to grow and succeed at Procera.
Fair and reasonable compensation – We strive to make our compensation programs fair in relation to other executives within the organization and in relation to comparable positions in other companies. We set compensation levels that are reasonable in terms of our overall financial and competitive condition as a company and that reflect the experience, skills and level of responsibility of the executive. We utilize executive compensation resources to aid in understanding how all components of our executive compensation levels compare to outside market conditions.
Compensation Process
The Compensation Committee of the Board operates under a Board-approved charter. This charter specifies the principal responsibilities of the Compensation Committee as follows: (i) to review, modify and approve (or make recommendations to the Board for) our overall compensation strategy, including performance goals, compensation plans, programs and policies, employment and similar agreements with executive officers; (ii) to determine the compensation and terms of employment of the chief executive officer and the other executive officers; (iii) to administer and to approve (or make recommendations to the Board for) the adoption, amendment or termination of benefit plans, including option plans, bonus plans and any deferred compensation plans; (iv) to review our incentive compensation arrangements in the context of risk management; (v) to review and recommend to the Board for approval the frequency with which we will conduct the say-on-pay vote; (vi) to review and approve (or make recommendations to the Board for) the compensation payable to our non-employee directors; and (vii) to establish appropriate insurance for the directors and officers. The Compensation Committee consists of three directors, each of whom satisfies the independence requirements of the NASDAQ guidelines as well as applicable SEC regulations and the “outside director” requirements under Internal Revenue Service regulations.
The performance of each of our executive officers is evaluated at least annually at the end of the calendar year. The chief executive officer’s performance is evaluated by the Compensation Committee and the performance of the other executive officers is evaluated by the chief executive officer and reviewed with the Compensation Committee. The factors taken into account in the evaluation of performance include the extent to which pre-established goals and business plans were accomplished and the extent to which the executive demonstrated leadership, creativity, teamwork and commitment, and embodied our company values. Other factors that are considered in making compensation determinations are the experience, skill level and level of responsibility of the executive and competitive market conditions.
All options, restricted stock and restricted stock unit awards granted to executive officers and directors must be approved by the Board or the Compensation Committee. At the time of hire, options, restricted stock and/or restricted stock unit awards are granted effective on or shortly after the employment start date for the executive. Generally, we assess all of our executive officers on an annual basis for potential additional stock option, restricted stock and/or restricted stock unit grants. These annual awards are approved by the Board or the Compensation Committee.
We conducted a say-on-pay vote at our 2013 Annual Meeting of Stockholders and more than 96% of the votes cast on the say-on-pay proposal were voted for approval of the 2012 executive compensation. In determining our 2014 executive compensation program, the Compensation Committee reviewed the results of the say-on-pay vote and concluded that material changes to the program were not desired by our stockholders for 2014. Therefore, our 2014 executive compensation approach was overall generally in line with the executive officer compensation approach for 2013.
Similarly, we conducted a say-on-pay vote at our 2014 Annual Meeting of Stockholders and approximately 88% of the votes cast on the say-on-pay proposal were voted for approval of the 2013 executive compensation. In determining our 2015 executive compensation program, the Compensation Committee reviewed the results of the say-on-pay vote and concluded that material changes to the program were not desired by our stockholders at this time. Therefore, our 2015 executive compensation approach is overall generally in line with the executive officer compensation approach for 2014.
Compensation Elements
General – We have implemented specific compensation elements to address our objectives, including base salary, a cash bonus plan, equity participation and benefits. These elements combine short-term and longer-term incentives and rewards in meeting our executive compensation goals.
Market Compensation Data – The Compensation Committee considers relevant market data in setting the compensation for our executive officers. During 2012, 2013 and 2014, the Compensation Committee selected Compensia, Inc. to provide a compensation assessment for establishing executive officer and director compensation. Compensia, Inc. was selected because of its experience in developing peer groups, assessing the market competitiveness of executive compensation programs and providing guidance on any adjustments needed to conform to market compensation programs. Compensia, Inc. also showed considerable experience with Silicon Valley high technology companies. Broad survey data of companies with similar revenue, growth, headcount and market capitalization was used as an aid in making compensation decisions for 2012, 2013 and 2014.
Base Salary and Cash Incentives – In determining base salaries and cash incentives for our executive officers, we benchmark each of our executive positions using data compiled by Compensia, Inc. The report used as the basis for the base salaries paid in, and the bonuses payable for, 2014, was the Compensia, Inc. Executive Compensation Assessment (the “2013 Compensation Assessment”), which included a survey of 16 publicly-traded technology and communication peer companies with revenue between $37 million and $139 million for the most recent four quarters available as of November 2013 with similar market capitalizations and growth factors, as well as a survey of publicly-traded high-technology companies with annual revenues between $50 million and $200 million published by Radford, an Aon Hewitt company. The 2013 Compensation Assessment summarized the compensation for chief executive officers and chief financial officers. The 16 peer companies identified in the 2013 Compensation Assessment were as follows:
|
8X8
|
Ellie Mae
|
Proofpoint
|
|
Brightcove
|
Imperva
|
SciQuest
|
|
Carbonite
|
Jive Software
|
SPS Commerce
|
|
Demandware
|
Numerex
|
Support.com
|
|
Digimarc
|
ORBCOMM
|
|
|
eGain Communications
|
PDF Solutions
|
Base Salary – In the last quarter of 2013, the Compensation Committee approved an increase in the base salary of the Company’s chief executive officer to $375,000, effective January 1, 2014, from $360,000 in 2013; and an increase in the base salary of the Company’s chief financial officer to $270,000, effective January 1, 2014, from $260,000 in 2013. These reflected an approximately 4% increase in base salary year-over-year. The Compensation Committee approved these increases after considering each executive officer’s significance to the Company, the Company’s financial situation and potential future performance of the Company and the market data provided by Compensia, Inc. Based on these considerations, the Compensation Committee determined that it was appropriate to provide merit increases in base salary at what the Compensation Committee expected to be within the typical range for merit increases for technology companies of similar size in similar industries in accordance with the 2013 Compensation Assessment. After the increases, the base salary for 2014 for the Company’s chief executive officer was at the 50th percentile of the peer group of companies and also at the approximately 62nd percentile of the broader market data contained in the 2013 Compensation Assessment, and the Company’s chief financial officer was slightly below the 25th percentile of the peer group of companies and at approximately the 60th percentile of the broader market data contained in the 2013 Compensation Assessment.
Cash Bonus – While we believe that the provision of short-term cash incentives is important to aligning the interests of executive officers and stockholders, and to the rewarding of performance, we also take into account our overall financial situation. The cash bonus targets for 2014 were based on pre-determined or specific corporate or individual performance targets.
The Compensation Committee established target cash bonus incentives for 2014 based in part on the 2013 Compensation Assessment. For 2014, the Compensation Committee did not make any changes to the target bonus as a percentage of base salary for our chief executive officer or our chief financial officer. Accordingly, for 2014, our chief executive officer and chief financial officer were eligible for a target bonus of 80% and 60% of base salary, respectively.
Bonus payouts for performance in the year ended December 31, 2014 were calculated based on: (1) an annual bonus (“Annual Bonus”), which was based on revenue and non-U.S. generally accepted accounting principles (“GAAP”) operating profit (pre-tax) (“Non-GAAP Operating Income”), and (2) a strategic marketing bonus (“Strategic Marketing Bonus”), which was based on the achievement of certain company milestones. The Annual Bonus and the Strategic Marketing Bonus were independent bonus opportunities and not contingent upon the executive receiving the other bonus.
Annual Bonus
Non-GAAP Operating Income represents net income (loss), excluding the effect of stock-based compensation and the cost of outside professional services for negotiating and performing legal, accounting and tax due diligence and other costs for potential mergers, acquisitions and other significant partnership arrangements. The bonus assessment was made for the performance period from January 1, 2014 to December 31, 2014. The range of potential payouts was from 0% to 200% of the on-target bonus amount, depending upon the level of revenue and Non-GAAP Operating Income achieved, using the following formula for each period: (a) base salary in effect at the end of the applicable period, which was December 31, 2014, multiplied by (b) the executive’s on‑target bonus percentage, multiplied by (c) the sum of the revenue metric and the Non-GAAP Operating Income metric.
The performance targets for a 100% bonus payout for the year ended December 31, 2014 included a revenue target of $90.0 million and a target Non-GAAP Operating Income of $5.0 million for the year ended December 31, 2014. The targets were based on our financial plan for 2014, which included revenue of $90.0 million, and operating income of $5.0 million projected for the year ended December 31, 2014. If we achieved $63.0 million of revenue for the year ended December 31, 2014, constituting 70% of the target, the revenue metric would be 25%. If we achieved $90.0 million of revenue for the year ended December 31, 2014, constituting 100% of the target, the revenue metric would be 50%. If our revenue for the year ended December 31, 2014 was $108.0 million or more, constituting 120% of the target, the revenue metric would be 100%. The revenue metric for revenue of between $63.0 million and $108.0 million for the year ended December 31, 2014 would be calculated using linear interpolation based on the foregoing metrics. If we achieved revenue of less than $63.0 million for the year ended December 31, 2014, the revenue metric would be zero.
If our Non-GAAP Operating Income for the year ended December 31, 2014 was $2.5 million, constituting 50% of the target, the Non-GAAP Operating Income metric would be 25%. If we achieved $5.0 million of Non-GAAP Operating Income for the year ended December 31, 2014, constituting 100% of the target, the Non-GAAP Operating Income metric would be 50%. If we achieved $10.0 million or more of Non-GAAP Operating Income for the year ended December 31, 2014, constituting 200% of the target, the Non-GAAP Operating Income metric would be 100%. The Non-GAAP Operating Income metric for Non-GAAP Operating Income of between $2.5 million and $10.0 million for the year ended December 31, 2014 would be calculated using linear interpolation based on the foregoing metrics. If we achieved Non-GAAP Operating Income of less than $2.5 million, or a net loss, for the year ended December 31, 2014, the Non-GAAP Operating Income metric would be zero.
Under the 2014 bonus plan, in the event we did not achieve Non-GAAP Operating Income for the year ended December 31, 2014, no Annual Bonus would be paid to the executives. For 2014, we achieved 84% of the established revenue target, and we had a non-GAAP net loss for the year. Therefore, our chief executive officer and chief financial officer did not receive an Annual Bonus for the year ended December 31, 2014.
Strategic Marketing Bonus
In addition to the Annual Bonus, our chief executive officer and chief financial officer were eligible to receive a Strategic Marketing Bonus equal to an aggregate of $120,000 and $64,800, respectively. Each executive was eligible to receive 25% of his target Strategic Marketing Bonus amount for every one of four company milestones achieved during the year ended December 31, 2014.
The Compensation Committee believed that including discrete strategic company milestones as part of the executive bonus plan for 2014 was important to focus the Company’s executives on achieving specific operational milestones designed to further attract customers and assist the Company in increasing its market share. The strategic Company milestones for 2014 related to receiving a beta product for testing from an identified supplier partner, obtaining product acceptance from an identified customer, commencing an active field trial for one of the Company’s products with a carrier or customer and generating a minimum amount of bookings for 2014 from identified customers. For the year ended December 31, 2014, the first three of the four strategic Company milestones were achieved. Therefore, our chief executive officer and chief financial officer each received 75% of his applicable Strategic Marketing Bonus amount.
Total Cash Compensation –Target total 2014 cash compensation, which is comprised of base salary and target bonus (including the strategic marketing bonus), was above the 75th percentiles of both the peers and broader market data for the Company’s chief executive officer and the Company’s chief financial officer based on the 2013 Compensation Assessment. Actual total 2014 cash compensation for the Company’s chief executive officer was $465,000, below the 25th percentile of the peer data target total cash and between the 25th and the 50th percentiles of the broader market data target total cash, based on the 2013 Compensation Assessment. Actual total 2014 cash compensation for the Company’s chief financial officer was $318,600, below the 25th percentile of the peer data target total cash and between the 25th and the 50th percentiles of the broader market data target total cash, based on the 2013 Compensation Assessment.
Equity Incentive – We utilize stock options, restricted stock and restricted stock units as the primary methods of equity participation for our executive officers. Equity awards are intended to reward and recognize long-term contribution to our stockholders. We determine stock options, restricted stock and restricted stock unit grants with reference to our own capitalization structure and the compensation assessments we receive from Compensia, Inc.
These awards were the outcome of the regular periodic review of executive compensation. The grants made in 2014 were divided between options and restricted stock units using a 50:50 ratio based on one restricted stock unit being equivalent to an option to purchase approximately three shares of our common stock. This ratio was determined based on the Black Scholes ratio of the value of a stock option in comparison to a restricted stock unit. The mix of options and restricted stock unit awards was designed to provide a balance of long-term growth opportunity and retention incentive for the executives. The options have the standard ten-year life and four-year vesting schedule used for option grants made to all company employees. The shares subject to the restricted stock unit awards will vest over a period of three years in 12 equal installments on each three-month anniversary of the grant date.
In December 2014, the Compensation Committee granted stock options to purchase 75,000 and 37,500 shares of our common stock to our chief executive officer and chief financial officer, respectively, and awarded restricted stock units with respect to 25,000 and 12,500 shares of our common stock to our chief executive officer and chief financial officer, respectively. These awards were below the 25th percentile of the peer data equity values and between the 25th and 50th percentiles of the broader market data equity values, based on the 2013 Compensation Assessment. These awards were based on the desire to retain the executives and incentivize them to improve the Company’s performance over the vesting periods.
Benefits – We provide a competitive range of health and other benefit programs to our executive officers. These are provided on the same basis to executive officers and other employees in the United States and include health and dental insurance, life and disability insurance and a 401(k) plan. Our employees in Sweden receive benefits at levels that are customary to the country.
Severance and Change of Control – We originally entered into employment agreements with our chief executive officer and chief financial officer when we negotiated their employment terms in order to induce them to accept employment with us. We have since amended their employment agreements to retain their services. The employment agreements for our chief executive officer and chief financial officer were each most recently amended and restated in December 2012. Under the restated agreements, in the event of a termination of employment for reasons other than “cause” or if our chief executive officer or chief financial officer terminates his employment with us for “good reason,” these officers are entitled to receive: (i) severance payments in an amount equal to the individual’s base salary multiplied by a specified amount; (ii) the full amount of any bonus earned in the prior fiscal year that had not been paid to the individual and the pro-rata portion of the annual bonus earned in the fiscal year in which the termination occurs; (iii) continuation of certain healthcare benefits for the executive and his dependents for twelve months; and (iv) if the termination occurs within twelve months after a “change in control,” the unvested portion of all outstanding equity awards held by him will immediately become fully vested; otherwise, the vesting of each equity award held by him shall be accelerated by 12 months and, if any of such officer’s equity awards are less than 100% vested after giving effect to the additional 12-month vesting, each vesting cliff for such award will be eliminated and the award shall be deemed to have vested on a pro rata daily basis measured from the vesting commencement date of the award. The employment agreements and the restricted stock, restricted stock unit and option vesting acceleration provisions are described in more detail below under “Employment, Severance, Separation and Change in Control Agreements”.
Code Section 162(m) Treatment Regarding Performance-Based Equity Awards
Under Section 162(m) of the Code, a public company is generally denied deductions for compensation paid to the chief executive officer and the next three most highly compensated executive officers, other than its chief financial officer, to the extent the compensation for any such individual exceeds $1,000,000 for the taxable year. Our executive compensation programs are designed to enable us to preserve the deductibility of compensation payable to executive officers, although deductibility will be only one of a number of factors considered in determining appropriate levels or types of compensation. Procera cannot guarantee that compensation that may be intended to preserve the deductibility of compensation payable to executive officers under Section 162(m) of the Code will in fact so qualify for deductibility.
In order to have the discretion to preserve, to the greatest extent possible, our tax deductions on stock and cash awards granted under the Procera Networks Inc. 2007 Equity Incentive Plan, as amended (the “Amended 2007 Plan”), Section 162(m) of the Code requires that our stockholders approve certain limitations on these awards. Therefore, the Amended 2007 Plan provides that no person may be granted stock awards whose value is determined by reference to an increase over an exercise or strike price that is less than one hundred percent (100%) of the fair market value of the common stock on the date of grant (such as options and stock appreciation rights) covering more than 150,000 shares of common stock (subject to adjustment for stock splits, recapitalizations and similar transactions) during any calendar year. In addition, no person may be granted performance stock awards covering more than 75,000 shares of common stock (subject to adjustment for stock splits, recapitalizations and similar transactions) during any calendar year. Finally, no person may be granted performance cash awards with a value exceeding $1,000,000 during any calendar year. All of these share limits are subject to adjustment upon certain changes in capitalization.
Code Section 409A
Code Section 409A imposes additional taxes on certain non-qualified deferred compensation arrangements that do not comply with its requirements. These requirements regulate an individual’s election to defer compensation and the individual’s selection of the timing and form of distribution of the deferred compensation. Code Section 409A generally also provides that distributions of deferred compensation only can be made on or following the occurrence of certain events (e.g., the individual’s separation from service, a predetermined date or fixed schedule, a change-in-control, or the individual’s death or disability). For certain executives, Code Section 409A requires that such individual’s distribution of certain non-qualified deferred compensation amounts commence no earlier than six months after such officer’s separation from service. We have and will continue to endeavor to structure our compensation arrangements to be exempt from or comply with Code Section 409A so as to avoid the adverse tax consequences associated therewith. We have not provided any executives or other employees with any gross-up in connection with Code Section 409A.
Hedging and Pledging Policies
As part of our Insider Trading Policy, our officers, directors, employees and consultants are prohibited from engaging in short sales of our securities and our officers, directors and employees are prohibited from engaging in hedging transactions involving our securities. Our Insider Trading Policy further prohibits officers, directors and employees from pledging securities as collateral for a loan unless pre-cleared by our Insider Trading Compliance Officer.
Compensation Recovery Policy
Under our bonus policy for executive officers, in the event that (i) achievement of a bonus is based on financial results that are subsequently the subject of a substantial restatement of our financial statements filed with the SEC and (ii) an executive officer’s fraud or intentional illegal conduct materially contributed to such financial restatement, our Compensation Committees may require recoupment of all or a portion of any after-tax portion of any such bonus paid to the executive officer under the bonus policy plan (in addition to seeking any other remedies available to us). Moreover, as a public company subject to the provisions of Section 304 of the Sarbanes-Oxley Act of 2002, if we are required as a result of misconduct to restate our financial results due to our material noncompliance with any financial reporting requirements under the federal securities laws, our chief executive officer and chief financial officer may be legally required to reimburse us for any bonus or other incentive-based or equity-based compensation they receive. We will also comply with the requirements of the Dodd-Frank Wall Street Reform and Consumer Protection Act and will adopt a compensation recovery policy once the SEC adopts final regulations on the subject.
Stock Ownership Policy
On August 27, 2014, the Compensation Committee adopted the Procera Networks, Inc. Stock Ownership Policy (the “Stock Ownership Policy”), which applies to each of our executive officers and non-employee directors. The purpose of the Stock Ownership Policy is to further align the long-term interests of our executive officers and directors with our other stockholders.
Under the Stock Ownership Policy, our executive officers and non-employee directors are expected to use the shares of common stock obtained upon the exercise of stock options and the vesting of restricted stock units and the shares of restricted stock received to establish significant levels of direct ownership in our company. The Stock Ownership Policy provides that our Chief Executive Officer should hold a number of shares of our common stock equal to the lesser of: (1) shares of our common stock valued at three times our Chief Executive Officer’s initial annual base salary; and (2) 115,000 shares of our common stock (subject to adjustment for stock splits, recapitalizations and similar transactions). Under the Stock Ownership Policy, each of our executive officers other than the Chief Executive Officer should hold a number of shares of our common stock equal to the lesser of: (a) shares of our common stock valued at the executive officer’s annual base salary; and (b) 25,000 shares of our common stock (subject to adjustment for stock splits, recapitalizations and similar transactions). The Stock Ownership Policy further provides that each of our non-employee directors should hold a number of shares of our common stock equal to the lesser of: (i) shares of our common stock valued at three times the initial cash retainer payable to the non-employee director for service on the Board (but not on any Board committees); and (ii) 7,500 shares of our common stock (subject to adjustment for stock splits, recapitalizations and similar transactions). For purposes of the Stock Ownership Policy, shares subject to stock options or unvested restricted stock units and shares of unvested restricted stock are not included in the calculations.
To provide our executive officers and non-employee directors with time to comply with the Stock Ownership Policy, the Compensation Committee determined that our executive officers and non-employee directors generally have until August 27, 2019 to meet the applicable ownership thresholds, provided that new executive officers and non-employee directors will have five years from the date of their designation as an executive officer or the date of their election or appointment as a non-employee director to meet the applicable ownership thresholds under the Stock Ownership Policy. Under the Stock Ownership Policy, our executive officers and non-employee directors are expected to use a portion of the shares of common stock obtained upon the exercise of stock options and the vesting of restricted stock units and the shares of restricted stock received to meet these thresholds. Accordingly, the Stock Ownership Policy provides that (1) until an executive officer achieves and maintains the applicable stock ownership level, he or she must retain 20% of the shares he or she receives as a result of the exercise, vesting or payment of any equity awards awarded by us to him or her, after shares are sold or withheld, as applicable, to pay the exercise price or satisfy any tax withholding obligations with respect to the award; and (2) until a non-employee director achieves and maintains the applicable stock ownership level, he or she must retain 20% of the shares he or she receives as a result of the exercise, vesting or payment of any equity awards awarded by us to him or her.
The Compensation Committee of the Board may amend the Stock Ownership Policy at any time in its discretion.
Risk Considerations in our Compensation Program
The Compensation Committee has addressed the concept of risk as it relates to our compensation program and the Compensation Committee does not believe our compensation program encourages excessive or inappropriate risk taking for the following reasons:
| · | We structure our pay to consist of both fixed and variable compensation. The fixed (or salary) portion of compensation is designed to provide a steady income regardless of our stock price performance so that executives do not feel pressured to focus exclusively on stock price performance to the detriment of other important business metrics. The variable (cash bonus and equity) portions of compensation are designed to reward both short- and long-term corporate performance. For short-term performance, our cash bonus is awarded based on targets for revenue and Non-GAAP Operating Income. For long-term performance, our stock option awards generally vest over four years and are only valuable if our stock price increases over time; and restricted stock and restricted stock unit awards vest in or over three years. We believe that these variable elements of compensation are a sufficient percentage of overall compensation to motivate executives to produce superior short- and long-term corporate results, while the fixed element is also sufficiently high that the executives are not encouraged to take unnecessary or excessive risks in doing so. |
| · | Because Non-GAAP Operating Income is a key performance measure for determining incentive payments, we believe our executives are encouraged to take a balanced approach that focuses on corporate operating profitability, and not just revenue targets alone, which by itself could incentivize management to drive sales levels without regard to cost structure. If we are not generating operating profits, there are minimal or no payouts under the bonus program. |
| · | We cap our cash bonus at 200% of the target payout, which we believe also mitigates excessive risk taking. The cap applies even if we dramatically exceed our targets. |
| · | We believe that our focus on Non-GAAP Operating Income (through our cash bonus program) and stock price performance (through our equity compensation program) provides a check on excessive risk taking. That is, even if our executives could inappropriately increase Non-GAAP Operating Income by excessive expense reductions or by abandoning less profitable revenue sources, this would be detrimental to us in the long run and could ultimately harm our stock price and the value of their equity awards. Likewise, if our executives were to add revenue sources at low margins in order to generate a higher growth company multiple and increased stock prices, it could decrease Non-GAAP Operating Income and the value of their cash bonus payments. |
| · | Our bonus program has been structured primarily around revenue and adjusted earnings for the past several years and we have seen no evidence that it encourages unnecessary or excessive risk taking. |
Summary Compensation Table
The following table shows for the years ended December 31, 2014, 2013 and 2012, compensation awarded to or paid to, or earned by, our Chief Executive Officer and Chief Financial Officer (the “Named Executive Officers”).
Summary Compensation Table for 2014
|
Name and Principal
Position(s)
|
Year
|
Salary ($)
|
Stock
Awards (1) ($)
|
Option
Awards (1) ($)
|
Non-Equity
Incentive Plan
Compensation (2)
($)
|
All Other
Compensation
|
Total ($)
|
|||||||||||||||||||
|
James F. Brear,
President and Chief Executive Officer
|
2014
|
375,000
|
169,250
|
264,761
|
90,000
|
6,641
|
(3)
|
905,652
|
||||||||||||||||||
|
2013
|
360,000
|
364,750
|
332,597
|
—
|
6,392
|
1,063,739
|
||||||||||||||||||||
|
2012
|
345,000
|
506,250
|
1,247,021
|
450,708
|
—
|
2,548,979
|
||||||||||||||||||||
|
Charles Constanti, Vice President and Chief Financial Officer
|
2014
|
270,000
|
84,625
|
132,381
|
48,600
|
10,400
|
(3)
|
546,006
|
||||||||||||||||||
|
2013
|
260,000
|
145,900
|
133,039
|
—
|
10,200
|
549,139
|
||||||||||||||||||||
|
2012
|
250,000
|
202,500
|
498,808
|
244,950
|
—
|
1,196,258
|
||||||||||||||||||||
|
(1)
|
The amounts in this column reflect the aggregate grant date fair value for the years ended December 31, 2014, 2013 and 2012, computed in accordance with ASC 718. These amounts reflect our accounting expense for these awards, and do not correspond to the actual value that will be recognized by the Named Executive Officers. Assumptions used in the calculation of these amounts are included in the notes to our audited financial statements for the year ended December 31, 2014 and in our discussion of Stock-Based Compensation in our Management’s Discussion and Analysis of Financial Condition and Results of Operations included in this Annual Report on Form 10-K for the year ended December 31, 2014.
|
|
(2)
|
The amounts in this column relate to amounts earned by the Named Executive Officers pursuant to our cash bonus program described above under “Compensation Elements—Cash Bonus”. For the year ended December 31, 2014, three of the four company milestones required for each of the Named Executive Officers to receive his applicable Strategic Marketing Bonus were achieved. Therefore, each of the chief executive officer and chief financial officer received 75% of his applicable potential Strategic Marketing Bonus amount for the year ended December 31, 2014.
|
|
(3)
|
Comprised of 401(k) plan matching contributions.
|
Grants of Plan-Based Awards
The following table shows, for fiscal year 2014, certain information regarding grants of plan-based awards to the Named Executive Officers:
Grants of Plan-Based Awards in 2014
|
Estimated Future Payouts Under
Non-Equity Incentive Plan Awards
|
All Other Stock
Awards:
Number of
Shares of Stock
or
|
Exercise
Price Per
Share
|
Grant Date
Fair Value of
Stock and
Option
|
||||||||||||||||||||||||
|
Name
|
Grant Date
|
Threshold($)
|
Target($)
|
Maximum($)
|
Units (#)
|
($/Sh)
|
Awards (1) ($)
|
||||||||||||||||||||
|
James F. Brear
|
12/02/14
|
—
|
—
|
—
|
25,000
|
(2)
|
—
|
169,250
|
|||||||||||||||||||
|
12/02/14
|
—
|
—
|
—
|
75,000
|
(3)
|
6.77
|
264,761
|
||||||||||||||||||||
|
N/A
|
(4
|
)
|
420,000
|
720,000
|
—
|
—
|
—
|
||||||||||||||||||||
|
Charles Constanti
|
12/02/14
|
—
|
—
|
—
|
12,500
|
(2)
|
—
|
84,625
|
|||||||||||||||||||
|
12/02/14
|
—
|
—
|
—
|
37,500
|
(3)
|
6.77
|
132,381
|
||||||||||||||||||||
|
N/A
|
|
(4
|
)
|
226,800
|
388,800
|
—
|
—
|
—
|
|||||||||||||||||||
|
(1)
|
Represents the aggregate grant date fair value of each individual equity award (on a grant-by-grant basis) as computed under ASC 718.
|
|
(2)
|
The shares subject to the restricted stock unit award will vest over a period of three years in 12 equal installments on each three-month anniversary of the grant date of December 2, 2014, as long as the Named Executive Officer remains in continuous service with us (as defined in the Amended 2007 Plan), subject to full or partial acceleration of vesting in certain situations such as the occurrence of a change in control, termination by us without cause or termination by the Named Executive Officer for good reason.
|
|
(3)
|
The option vests over a four year period, with 25% of the shares subject to the option vesting on the first anniversary of the grant date of December 2, 2014, and the balance vesting in 36 equal consecutive monthly installments thereafter until the option becomes fully vested and exercisable, subject to full or partial acceleration of vesting in certain situations such as the occurrence of a change in control, termination by us without cause or termination by the Named Executive Officer for good reason.
|
|
(4)
|
The award does not include a threshold.
|
Discussion of Summary Compensation and Grants of Plan-Based Awards Table
Our executive compensation policies and practices, pursuant to which the compensation set forth in the Summary Compensation Table and the Grants of Plan-Based Awards table was paid or awarded, are described above under “Compensation Discussion and Analysis.” A summary of certain material terms of our compensation plans and arrangements is set forth below.
Outstanding Equity Awards at Fiscal Year End
The following table shows certain information regarding equity awards held by the Named Executive Officers that were outstanding as of December 31, 2014.
Outstanding Equity Awards at December 31, 2014
|
Option Awards
|
Stock Awards
|
||||||||||||||||||||
|
Name
|
Number of
Securities
Underlying
Unexercised
Options (#)
Exercisable
|
Number of
Securities
Underlying
Unexercised
Options (#)
Unexercisable
|
Option
Exercise
Price ($)
|
Option
Expiration
Date
|
Equity Incentive
Plan Awards:
Number of
Unearned Shares,
Units or Other
Rights That Have
Not Vested (#)
|
Equity Incentive
Plan Awards:
Market or
Payout Value of
Unearned Shares,
Units or Other
Rights That Have
Not Vested ($)
|
|||||||||||||||
|
James F. Brear
|
143,417
|
—
|
14.10
|
02/12/2018
|
—
|
—
|
|||||||||||||||
|
2,083
|
—
|
5.00
|
11/13/2019
|
—
|
—
|
||||||||||||||||
|
50,000
|
(1)
|
50,000
|
(1)
|
20.25
|
12/03/2022
|
—
|
—
|
||||||||||||||
|
10,000
|
(2)
|
30,000
|
(2)
|
14.59
|
12/03/2023
|
—
|
—
|
||||||||||||||
|
—
|
(3)
|
75,000
|
(3)
|
6.77
|
12/02/2024
|
—
|
—
|
||||||||||||||
|
25,000
|
(4)
|
179,750
|
|||||||||||||||||||
|
25,000
|
(5)
|
179,750
|
|||||||||||||||||||
|
25,000
|
(6)
|
179,750
|
|||||||||||||||||||
|
Charles Constanti
|
60,000
|
—
|
6.90
|
05/21/2019
|
—
|
—
|
|||||||||||||||
|
20,000
|
(1)
|
20,000
|
(1)
|
20.25
|
12/03/2022
|
—
|
—
|
||||||||||||||
|
4,000
|
(2)
|
12,000
|
(2)
|
14.59
|
12/03/2023
|
—
|
—
|
||||||||||||||
|
—
|
(3)
|
37,500
|
(3)
|
6.77
|
12/2/2024
|
—
|
—
|
||||||||||||||
|
10,000
|
(4)
|
71,900
|
|||||||||||||||||||
|
10,000
|
(5)
|
71,900
|
|||||||||||||||||||
|
12,500
|
(6)
|
89,875
|
|||||||||||||||||||
|
(1)
|
The option vested as to 1/4 of the shares on the first anniversary of the vesting commencement date of December 3, 2012 and vests as to 1/48 of the shares per month thereafter until fully vested, subject to full or partial acceleration of vesting in certain situations such as the occurrence of a change in control, termination by us without cause or termination by the Named Executive Officer for good reason.
|
|
(2)
|
The option vested as to 1/4 of the shares on the first anniversary of the vesting commencement date of December 3, 2013 and vests as to 1/48 of the shares per month thereafter until fully vested, subject to full or partial acceleration of vesting in certain situations such as the occurrence of a change in control, termination by us without cause or termination by the Named Executive Officer for good reason.
|
|
(3)
|
The option will vest as to 1/4 of the shares on the first anniversary of the vesting commencement date of December 3, 2014 and vests as to 1/48 of the shares per month thereafter until fully vested, subject to full or partial acceleration of vesting in certain situations such as the occurrence of a change in control, termination by us without cause or termination by the Named Executive Officer for good reason.
|
|
(4)
|
The restricted shares will vest in a single installment on December 3, 2015, the third anniversary of the grant date of the award, subject to full or partial acceleration of vesting in certain situations such as the occurrence of a change in control, termination by us without cause or termination by the Named Executive Officer for good reason.
|
|
(5)
|
One half of the shares subject to this restricted stock unit award will vest on the 18-month anniversary of the vesting commencement date of December 3, 2013, and the remaining half of the shares will vest on the 3-year anniversary of the vesting commencement date of December 3, 2013, subject to full or partial acceleration of vesting in certain situations such as the occurrence of a change in control, termination by us without cause or termination by the Named Executive Officer for good reason.
|
|
(6)
|
The shares subject to the restricted stock unit award will vest over a period of three years in 12 equal installments on each three-month anniversary of the vesting commencement date of December 2, 2014, subject to full or partial acceleration of vesting in certain situations such as the occurrence of a change in control, termination by us without cause or termination by the Named Executive Officer for good reason.
|
2014 Option Exercises and Stock Vested
The following table presents information concerning the options exercised and stock vested during fiscal year 2014 for the Named Executive Officers.
Option Exercises and Stock Vested in 2014
|
Option Awards
|
Stock Awards
|
|||||||||||||||
|
Name
|
Number of
Shares
Acquired on
Exercise (#)
|
Value
Realized on
Exercise
($)(1)
|
Number of
Shares
Acquired on
Vesting (#)
|
Value
Realized on
Vesting ($)(2)
|
||||||||||||
|
James F. Brear
|
-
|
-
|
30,000
|
218,100
|
||||||||||||
|
Charles Constanti
|
-
|
-
|
15,000
|
109,050
|
||||||||||||
| (1) | The value realized on exercise is the product of the number of shares of our common stock underlying the exercised stock options multiplied by the difference between the price at which the Named Executive Officer sold the underlying shares of our common stock on the exercise date and the exercise price applicable to the exercised stock options. |
| (2) | The value realized on vesting is the product of the number of shares of our common stock vested multiplied by the closing price of our common stock on the vesting date. |
Pension Benefits—Nonqualified Defined Contribution and Other Nonqualified Deferred Compensation
No pension benefits were paid to any of our named executive officers during fiscal year 2014. We do not currently sponsor any non-qualified defined contribution plans or non-qualified deferred compensation plans.
Employment, Severance, Separation and Change in Control Agreements
We have entered into the following employment arrangements with each of the Named Executive Officers.
James F. Brear
On February 11, 2008, we entered into an executive employment agreement with James F. Brear, as Chief Executive Officer, President and a member of the Board, which was most recently amended and restated on December 4, 2012. Pursuant to the employment agreement, Mr. Brear was established at an annual base salary of $240,000, subject to annual review and increases at the discretion of the Board. Mr. Brear’s annual base salary was increased to $275,000 effective January 1, 2009, to $295,000 effective January 1, 2010, to $345,000 effective January 1, 2012, to $360,000 effective January 1, 2013 and to $375,000 effective January 1, 2014. Mr. Brear received an initial bonus of 50% of his annual base salary after his first six months of employment with us. In addition, Mr. Brear was eligible for an on-target annual discretionary performance bonus equal to 80% of his annual base salary in 2008 and 2009, 75% of his annual base salary in 2010, and 80% of his annual base salary in 2011 through 2014, as determined by the Board; provided, however, that for 2008, the annual bonus was prorated over the time between the end of the first six months of Mr. Brear’s employment and the end of 2008. For 2015, Mr. Brear’s base salary was increased to $386,250 effective January 1, 2015, and he is eligible for an on-target annual discretionary performance bonus equal to 80% of his annual base salary in 2015, and for an additional strategic marketing bonus of up to $75,000 based on the achievement of specific company milestones.
With the hiring of Mr. Brear in February 2008, we granted Mr. Brear an option to purchase 225,000 shares of our common stock and in November 2009, we granted Mr. Brear an option to purchase 50,000 shares of our common stock. These options vested over four years, with 25% of the shares vesting in one year and the remaining shares vesting in 36 equal monthly installments thereafter. In December 2010, we granted Mr. Brear 40,000 shares of restricted stock that vested on the three-year anniversary of the grant date. In November 2011, we granted Mr. Brear 30,000 shares of restricted stock that vested on the three-year anniversary of the grant date. In December 2012, we granted Mr. Brear: (a) an option to purchase 100,000 shares of our common stock, which vests over four years, with 25% of the shares vesting in one year and the remaining shares vesting in 36 equal monthly installments thereafter, and (b) 25,000 shares of restricted stock that will vest on the three-year anniversary of the grant date. In December 2013, we granted Mr. Brear: (i) an option to purchase 40,000 shares of our common stock, which vests over four years, with 25% of the shares vesting on the one year anniversary of the grant date and the remaining shares vesting in 36 equal monthly installments thereafter, and (ii) restricted stock units with respect to 25,000 shares of common stock, one half of which will vest on the 18-month anniversary of the grant date and the remaining half of which will vest on the three-year anniversary of the grant date. In December 2014, we granted Mr. Brear: (a) an option to purchase 75,000 shares of our common stock, which will vest over four years, with 25% of the shares vesting in one year and the remaining shares vesting in 36 equal monthly installments thereafter, and (b) restricted stock units with respect to 25,000 shares of common stock that will vest over a period of three years in 12 equal installments on each three-month anniversary of the grant date.
Under Mr. Brear’s employment agreement, either we or Mr. Brear may terminate his employment at any time. If we terminate Mr. Brear’s employment without cause or Mr. Brear terminates his employment with good reason, and provided that Mr. Brear executes and delivers to us a separation release of all claims within the specified time period, we will be obligated to pay Mr. Brear (i) a cash severance equal to 180% of his annual base salary, payable over 12 months, (ii) the maintenance of health insurance coverage and other employee benefits for Mr. Brear and his eligible dependents for a period of 12 months; (iii) the full amount of any annual bonus awarded for the completed year preceding termination if not already paid; (iv) a pro-rated annual bonus for the calendar year in which his employment terminates; and (v) if the termination occurs within 12 months after a change in control, the unvested portion of all outstanding equity awards held by Mr. Brear will immediately become fully vested; otherwise, the vesting of each equity award held by Mr. Brear shall be accelerated by 12 months and, if any of Mr. Brear’s equity awards are less than 100% vested after giving effect to the additional vesting, each vesting cliff for such award will be eliminated and the award shall be deemed to have vested on a pro rata daily basis measured from the vesting commencement date of the award. Under Mr. Brear’s employment agreement, he will also be entitled to receive certain benefits upon his death or termination for disability, including receipt of accrued salary, bonus and vacation, and payment of the pro rata amount of any bonus earned for the year of termination. In addition, if any of Mr. Brear’s equity awards are less than 100% vested as of the date of his death or termination for disability, each vesting cliff for such award will be eliminated and the award shall be deemed to have vested on a pro rata daily basis measured from the vesting commencement date through the date of his death or termination for disability.
Charles Constanti
On April 27, 2009, we entered into an executive employment agreement with Charles Constanti, as Vice President and Chief Financial Officer, which was amended and restated on December 3, 2012. Pursuant to this agreement, Mr. Constanti was established at an annual base salary of $225,000, subject to annual review and increases at the discretion of the Board. Mr. Constanti’s annual base salary was increased to $250,000 effective January 1, 2012, to $260,000 effective January 1, 2013, and to $270,000 effective January 1, 2014. In addition, Mr. Constanti was eligible for an on-target annual discretionary performance bonus equal to 60% of his annual base salary in 2009 through 2014, as determined by the Board; provided, however, that for 2009, the annual bonus was prorated for the period of employment beginning on May 11, 2009 until the end of 2009. For 2015, Mr. Constanti’s base salary was increased to $297,000 effective January 1, 2015, and he is eligible for an on-target annual discretionary performance bonus equal to 50% of his annual base salary in 2015, and for an additional strategic marketing bonus of up to $40,000 based on the achievement of specific company milestones.
With the hiring of Mr. Constanti in May 2009, we granted Mr. Constanti an option to purchase 100,000 shares of our common stock. This option vested over four years, with 25% of the shares vesting in one year and the remaining shares vesting in 36 equal monthly installments thereafter. In December 2010, we granted Mr. Constanti 20,000 shares of restricted stock that vested on the three-year anniversary of the grant date. In November 2011, we granted Mr. Constanti 15,000 shares of restricted stock that vested on the three-year anniversary of the grant date. In December 2012, we granted Mr. Constanti: (a) an option to purchase 40,000 shares of our common stock, which vests over four years, with 25% of the shares vesting in one year and the remaining shares vesting in 36 equal monthly installments thereafter, and (b) 10,000 shares of restricted stock that will vest on the three-year anniversary of the grant date. In December 2013, we granted Mr. Constanti: (i) an option to purchase 16,000 shares of our common stock, which vests over four years, with 25% of the shares vesting on the one year anniversary of the grant date and the remaining shares vesting in 36 equal monthly installments thereafter, and (ii) restricted stock units with respect to 10,000 shares of common stock, one half of which will vest on the 18-month anniversary of the grant date and the remaining half of which will vest on the three-year anniversary of the grant date. In December 2014, we granted Mr. Constanti: (a) an option to purchase 37,500 shares of our common stock, which will vest over four years, with 25% of the shares vesting in one year and the remaining shares vesting in 36 equal monthly installments thereafter, and (b) restricted stock units with respect to 12,500 shares of common stock that will vest over a period of three years in 12 equal installments on each three-month anniversary of the grant date.
Under Mr. Constanti’s employment agreement, either we or Mr. Constanti may terminate his employment at any time. If we terminate Mr. Constanti’s employment without cause or Mr. Constanti terminates his employment with good reason, and provided that Mr. Constanti executes and delivers to us a separation release of all claims within the specified time period, we will be obligated to pay Mr. Constanti (i) a cash severance equal to 160% of his annual base salary, payable over 12 months, (ii) the maintenance of health insurance coverage and other employee benefits for Mr. Constanti and his eligible dependents for a period of 12 months; (iii) the full amount of any annual bonus awarded for the completed year preceding termination if not already paid; (iv) a pro-rated annual bonus for the calendar year in which his employment terminates; and (v) if the termination occurs within 12 months after a change in control, the unvested portion of all outstanding equity awards held by Mr. Constanti will immediately become fully vested; otherwise, the vesting of each equity award held by Mr. Constanti shall be accelerated by 12 months and, if any of Mr. Constanti’s equity awards are less than 100% vested after giving effect to the additional vesting, each vesting cliff for such award will be eliminated and the award shall be deemed to have vested on a pro rata daily basis measured from the vesting commencement date of the award. Under Mr. Constanti’s employment agreement, he will also be entitled to receive certain benefits upon his death or termination for disability, including receipt of accrued salary, bonus and vacation, and payment of the pro rata amount of any bonus earned for the year of termination. In addition, if any of Mr. Constanti’s equity awards are less than 100% vested as of the date of his death or termination for disability, each vesting cliff for such award will be eliminated and the award shall be deemed to have vested on a pro rata daily basis measured from the vesting commencement date through the date of his death or termination for disability.
Potential Payouts upon Termination or Change in Control
Other than the provisions of the executive severance benefits to which our Named Executive Officers would be entitled to at December 31, 2014 as set forth above, we have no liabilities under termination or change in control conditions. We do not have a formal policy to determine executive severance benefits. Each executive severance arrangement is negotiated on an individual basis.
The table below estimates amounts, with respect to each of the Named Executive Officers, of (i) salary and benefits payable, and (ii) the portions of the restricted stock, restricted stock units and stock options that are assumed to be accelerated, calculated based on the intrinsic value of the equity awards at the closing price of our common stock of $7.19 on December 31, 2014, the last trading day of our common stock in 2014, in each case assuming that a change in control, termination of employment or both occurred on December 31, 2014 and that all eligibility requirements under applicable equity award agreements or employment agreements were met.
James F. Brear
|
Termination
|
|||||||||||||||
|
Executive Benefits, Payments
and Acceleration of Vesting of
Stock Awards
|
Upon Death or Disability
|
By Procera Without Cause or by Mr. Brear for
Good Reason
|
|||||||||||||
|
Within 12 months
following a Change in
Control
|
Outside of a
Change in Control
|
||||||||||||||
|
Value of Stock Award Vesting Acceleration
|
$
|
194,252
|
(1)
|
$
|
570,750
|
(2)
|
$
|
377,177
|
(3)
|
||||||
|
Cash Payments
|
$
|
—
|
$
|
765,000
|
$
|
765,000
|
|||||||||
|
Continuation of Benefits
|
$
|
—
|
$
|
24,516
|
(4)
|
$
|
24,516
|
(4)
|
|||||||
|
Total Cash Benefits and Payments
|
$
|
194,252
|
$
|
1,360,266
|
$
|
1,166,693
|
|||||||||
|
(1)
|
Relates to 1,488 unvested options, 17,305 shares of restricted stock and 9,625 shares subject to restricted stock units that would be subject to accelerated vesting. Excludes the value of 2,641 unvested out-of-the-money stock options as of December 31, 2014 that would be subject to accelerated vesting.
|
|
(2)
|
Relates to 75,000 unvested options, 25,000 shares of restricted stock and 50,000 shares subject to restricted stock units that would be subject to accelerated vesting. Excludes the value of 80,000 unvested out-of-the-money stock options as of December 31, 2014 that would be subject to accelerated vesting.
|
|
(3)
|
Relates to 20,225 unvested options, 25,000 shares of restricted stock and 26,277 shares subject to restricted stock units that would be subject to accelerated vesting. Excludes the value of 37,618 unvested out-of-the-money stock options as of December 31, 2014 that would be subject to accelerated vesting.
|
|
(4)
|
Comprised of healthcare insurance for Mr. Brear and his eligible dependents for 12 months, excluding employee contribution portions.
|
Charles Constanti
|
Termination
|
|||||||||||||||
|
Executive Benefits, Payments
and Acceleration of Vesting of
Stock Awards
|
Upon Death or Disability
|
By Procera Without Cause or by Mr. Constanti
for Good Reason
|
|||||||||||||
|
Within 12 months
following a Change in
Control
|
Outside of a
Change in Control
|
||||||||||||||
|
Value of Stock Award Vesting Acceleration
|
$
|
78,244
|
(1)
|
$
|
249,425
|
(2)
|
$
|
158,183
|
(3)
|
||||||
|
Cash Payments
|
$
|
—
|
$
|
480,600
|
$
|
480,600
|
|||||||||
|
Continuation of Benefits
|
$
|
—
|
$
|
24,516
|
(4)
|
$
|
24,516
|
(4)
|
|||||||
|
Total Cash Benefits and Payments
|
$
|
78,244
|
$
|
754,541
|
$
|
663,299
|
|||||||||
|
(1)
|
Relates to 744 unvested options, 6,922 shares of restricted stock and 3,915 shares subject to restricted stock units that would be subject to accelerated vesting. Excludes the value of 1,055 unvested out-of-the-money stock options as of December 31, 2014 that would be subject to accelerated vesting.
|
|
(2)
|
Relates to 37,500 unvested options, 10,000 shares of restricted stock and 22,500 shares subject to restricted stock units that would be subject to accelerated vesting. Excludes the value of 32,000 unvested out-of-the-money stock options as of December 31, 2014 that would be subject to accelerated vesting.
|
|
(3)
|
Relates to 10,113 unvested options, 10,000 shares of restricted stock and 11,409 shares subject to restricted stock units that would be subject to accelerated vesting. Excludes the value of 15,047 unvested out-of-the-money stock options as of December 31, 2014 that would be subject to accelerated vesting.
|
|
(4)
|
Comprised of healthcare insurance for Mr. Constanti and his eligible dependents for 12 months, excluding employee contribution portions.
|
Director Compensation
A combination of equity awards and fees are used to compensate non-employee directors for their service on the Board.
2014 Director Compensation
Under our current director compensation policy, which was most recently amended in October 2014, each of our non-employee directors is entitled to receive an annual cash retainer of $25,000, payable quarterly in arrears. The Chairperson of the Board is entitled to receive an additional annual cash retainer of $25,000 but is not entitled to receive compensation for service on any of the committees of the Board. The chairpersons of the Audit Committee, Compensation Committee and Nominating and Corporate Governance Committee are entitled to receive additional annual cash retainers of $10,000, $7,500 and $5,000, respectively, each payable quarterly in arrears. Other members of the Audit Committee, Compensation Committee and Nominating and Corporate Governance Committee, other than the Chairperson of the Board, are entitled to receive additional annual cash retainers of $5,000, $4,000 and $2,000, respectively, each payable quarterly in arrears.
Prior to the adoption of amendments to our director compensation policy in October 2014, the Chairperson of the Board was entitled to receive an annual cash retainer of $12,500, but was also eligible to receive compensation for service on the committees of the Board.
In addition to the annual cash retainers, each of our non-employee directors is entitled to receive an annual grant of restricted stock units with a total value of $55,000. Each award will be granted following the non-employee director’s appointment, election or re-election to the Board, with the quantity of shares subject to restricted stock units measured based on the closing price of our common stock on the date of grant. One quarter of the shares subject to the restricted stock unit award will vest on the first business day of each full fiscal quarter after the date of grant, subject to the director’s continuous service with us through the applicable vesting date.
The following table shows compensation information for our non-employee directors for the year ended December 31, 2014:
Director Compensation for 2014
|
Name
|
Fees Earned
or Paid in Cash
($)
|
Stock
Awards
(1)(2) ($)
|
Option
Awards
(1)(3) ($)
|
All Other
Compensation
($)
|
Total ($)
|
|||||||||||||||
|
Thomas Saponas (4)
|
40,625
|
55,008
|
—
|
—
|
95,633
|
|||||||||||||||
|
Staffan Hillberg (5)
|
48,456
|
55,008
|
—
|
—
|
103,464
|
|
||||||||||||||
|
Alan B. Lefkof (6)
|
31,875
|
55,008
|
—
|
—
|
86,883
|
|||||||||||||||
|
Mary Losty
|
32,000
|
55,008
|
—
|
—
|
87,008
|
|||||||||||||||
|
Scott McClendon (7)
|
42,500
|
55,008
|
—
|
—
|
97,508
|
|||||||||||||||
|
Douglas Miller
|
35,000
|
55,008
|
—
|
—
|
90,008
|
|||||||||||||||
|
William Slavin (8)
|
28,000
|
55,008
|
—
|
—
|
83,008
|
|||||||||||||||
| (1) | The amounts in this column reflect the aggregate grant date fair value computed in accordance with ASC 718. These amounts reflect our accounting expense for these awards, and do not correspond to the actual value that will be recognized by the directors. Assumptions used in the calculation of these amounts are included in the notes to our audited financial statements for the year ended December 31, 2014 and in our discussion of Stock-Based Compensation in our Management’s Discussion and Analysis of Financial Condition and Results of Operations included in this Annual Report on Form 10-K for the year ended December 31, 2014. |
| (2) | The following number of shares subject to unvested restricted stock units were outstanding as of December 31, 2014: Mr. Saponas – 2,866 shares; Mr. Hillberg – 2,866 shares; Mr. Lefkof – 2,866 shares; Ms. Losty – 2,866 shares; Mr. McClendon – 2,866 shares; Mr. Miller – 2,866 shares and Mr. Slavin – 2,866 shares. |
| (3) | Options exercisable for the following number of shares were outstanding as of December 31, 2014: Mr. Saponas – 29,850 shares; Mr. Hillberg – 20,579 shares; Mr. Lefkof – 5,000 shares; Ms. Losty – 16,055 shares; Mr. McClendon – 32,271 shares; Mr. Miller – 5,000 shares and Mr. Slavin – 5,000 shares. |
| (4) | Mr. Saponas was appointed as Chairperson of the Board on October 15, 2014, and resigned from the Compensation Committee on that date. |
| (5) | Comprised of $34,000 for service on the Board and $14,456 in annual compensation paid to Mr. Hillberg for his service as the Chairperson of the Board of our wholly owned Swedish subsidiary. |
| (6) | Mr. Lefkof was appointed as Chairperson of the Compensation Committee on October 17, 2014. |
| (7) | Mr. McClendon was replaced as Chairperson of the Board on October 15, 2014 and earned Chairperson fees for the full quarter ended December 31, 2014. |
| (8) | Mr. Slavin was appointed to the Compensation Committee on August 28, 2014. |
Compensation Committee Interlocks and Insider Participation
As noted above, the Compensation Committee consists of three directors, each of whom is a non-employee director: Mr. Hillberg, Mr. Lefkof and Mr. Slavin. None of the aforementioned individuals was, during 2014, an officer or employee of ours, was formerly an officer of ours or had any relationship requiring disclosure by us under Item 404 of Regulation S-K. No interlocking relationship as described in Item 407(e)(4) of Regulation S-K exists between any of our executive officers or Compensation Committee members, on the one hand, and the executive officers or compensation committee members of any other entity, on the other hand, nor has any such interlocking relationship existed in the past.
Compensation Committee Report1
The Compensation Committee has reviewed and discussed with management the Compensation Discussion and Analysis (“CD&A”) contained in this Annual Report on Form 10-K for the year ended December 31, 2014. Based on this review and discussion, the Compensation Committee has recommended to the Board of Directors that the CD&A be included in this Annual Report on Form 10-K for the year ended December 31, 2014.
Mr. Alan B. Lefkof
Mr. Staffan Hillberg
Mr. William Slavin
| 1 | The material in this report is not “soliciting material,” is furnished to, but not deemed “filed” with, the SEC and is not deemed to be incorporated by reference in any of our filings under the Securities Act of 1933, as amended, or the Securities Exchange Act of 1934, as amended, whether made before or after the date hereof and irrespective of any general incorporation language in any such filing. |
| Item 12. | Security Ownership of Certain Beneficial Owners and Management and Related Stockholder Matters |
Equity Compensation Plan Information
The following table provides certain information as of December 31, 2014 with respect to all of our equity compensation plans in effect on that date.
|
Plan Category
|
Number of
Securities to
be Issued
Upon
Exercise of
Outstanding
Options,
Warrants and
Rights (a)
|
Weighted
Average
Exercise Price
of Outstanding
Options,
Warrants and
Rights (b)
|
Number of
Securities
Remaining
Available for
Future Issuance
Under Equity
Compensation
Plans (Excluding
Securities
Reflected in
Column (a)) (c)
|
|||||||||
|
Equity compensation plans approved by stockholders
|
1,645,090
|
(1)
|
$
|
14.71
|
248,797
|
(2)
|
||||||
|
Equity compensation plans not approved by stockholders
|
—
|
—
|
—
|
|||||||||
|
Total:
|
1,645,090
|
$
|
14.71
|
248,797
|
||||||||
| (1) | Includes unexercised options and unvested restricted stock units issued pursuant to the Amended 2007 Plan. |
| (2) | Includes unissued awards available pursuant to the Amended 2007 Plan. |
Security Ownership of Certain Beneficial Owners and Management
The following table sets forth certain information regarding the ownership of our common stock as of February 13, 2015 by: (i) each director; (ii) each of the executive officers named in the Summary Compensation Table; (iii) all of our executive officers and directors as a group; and (iv) all those known by us to be beneficial owners of more than five percent of our common stock. Unless otherwise noted below, the address of each beneficial owner listed in the table is c/o Procera Networks, Inc., 47448 Fremont Blvd., Fremont, California 94538.
|
Beneficial Ownership (1)
|
|||||||
|
Beneficial Owner
|
Number of
Shares
|
Percent of
Total
|
|||||
|
Thomas Saponas (2)
|
146,587
|
*
|
|||||
|
James F. Brear (3)
|
307,166
|
1.5%
|
|||||
|
Staffan Hillberg (4)
|
37,291
|
*
|
|||||
|
Alan B. Lefkof (5)
|
15,844
|
*
|
|||||
|
Mary Losty (6)
|
189,304
|
*
|
|||||
|
Scott McClendon (7)
|
66,827
|
*
|
|||||
|
Douglas Miller (8)
|
13,223
|
*
|
|||||
|
William Slavin (9)
|
20,946
|
*
|
|||||
|
Charles Constanti (10)
|
143,966
|
*
|
|||||
|
All executive officers and directors as a group (9 persons) (11)
|
941,154
|
4.5%
|
|||||
|
BlackRock, Inc. (12)
|
2,661,126
|
12.8%
|
|||||
|
Castle Union LLC (13)
|
1,360,735
|
6.6%
|
|||||
| * | Less than one percent. |
| (1) | This table is based upon information supplied by officers and directors. Information about principal stockholders is based solely on filings by the beneficial owners with the SEC pursuant to Section 13(g) under the Exchange Act. Unless otherwise indicated in the footnotes to this table and subject to community property laws where applicable, we believe that each of the beneficial owners named in this table has sole voting and investment power with respect to the shares indicated as beneficially owned. Applicable percentages are based on 20,766,181 shares outstanding on February 13, 2015, adjusted as required by rules promulgated by the SEC. Shares of common stock subject to options that are exercisable within 60 days of February 13, 2015 are deemed to be outstanding and to be beneficially owned by the person or group holding such options for the purpose of computing the percentage ownership of such person or group but are not treated as outstanding for the purpose of computing the percentage ownership of any other person or group. |
| (2) | Represents 115,304 shares of our common stock, 1,433 shares subject to unvested restricted stock units that will vest within 60 days of February 13, 2015 and options to purchase 29,850 shares of our common stock that are exercisable in whole or in part within 60 days of February 13, 2015. |
| (3) | Represents 15,000 shares of our common stock, 25,000 shares of unvested restricted stock, unvested restricted stock units with respect to 50,000 shares of our common stock and options to purchase 217,166 shares of our common stock that are exercisable in whole or in part within 60 days of February 13, 2015. |
| (4) | Represents 14,862 shares of our common stock, 1,433 shares subject to unvested restricted stock units that will vest within 60 days of February 13, 2015 and options to purchase 20,996 shares of our common stock that are exercisable in whole or in part within 60 days of February 13, 2015. |
| (5) | Represents 9,411 shares of our common stock, 1,433 shares subject to unvested restricted stock units that will vest within 60 days of February 13, 2015 and options to purchase 5,000 shares of our common stock that are exercisable in whole or in part within 60 days of February 13, 2015. |
| (6) | Represents 171,816 shares of our common stock, 1,433 shares subject to unvested restricted stock units that will vest within 60 days of February 13, 2015 and options to purchase 16,055 shares of our common stock that are exercisable in whole or in part within 60 days of February 13, 2015. As of February 13, 2015, Ms. Losty has agreed to pledge up to an aggregate of 166,758 shares of common stock beneficially owned by her as collateral for a personal loan. |
| (7) | Represents 33,123 shares of our common stock, 1,433 shares subject to unvested restricted stock units that will vest within 60 days of February 13, 2015 and options to purchase 32,271 shares of our common stock that are exercisable in whole or in part within 60 days of February 13, 2015. |
| (8) | Represents 6,790 shares of our common stock, 1,433 shares subject to unvested restricted stock units that will vest within 60 days of February 13, 2015 and options to purchase 5,000 shares of our common stock that are exercisable in whole or in part within 60 days of February 13, 2015. |
| (9) | Represents 14,513 shares of our common stock, 1,433 shares subject to unvested restricted stock units that will vest within 60 days of February 13, 2015 and options to purchase 5,000 shares of our common stock that are exercisable in whole or in part within 60 days of February 13, 2015. |
| (10) | Represents 22,800 shares of our common stock, 10,000 shares of unvested restricted stock, unvested restricted stock units with respect to 22,500 shares of our common stock and options to purchase 88,666 shares of our common stock that are exercisable in whole or in part within 60 days of February 13, 2015. |
| (11) | Includes shares of unvested restricted stock and shares which our executive officers and directors have the right to acquire within 60 days of February 13, 2015 pursuant to outstanding options described in the notes above. |
| (12) | BlackRock, Inc. (“BlackRock”) filed a Schedule 13G/A on January 9, 2015, reporting that, as of December 31, 2014, it had sole voting or dispositive power with respect to an aggregate of 2,661,126 shares in its capacity as a parent holding company or control person in accordance with Rule 13d-1(b)(1)(ii)(G) under the Exchange Act. BlackRock’s address is 55 East 52nd Street, New York, New York 10022. |
| (13) | Castle Union LLC (“Castle Union”) filed a Schedule 13D/A on October 28, 2014, as amended on December 5, 2014, reporting that, as of December 3, 2014, it had shared voting and dispositive power with respect to an aggregate of 1,360,735 shares. Toan Tran and Stephen White, the managing members of Castle Union LLC, the general partner of Castle Union Partners, L.P. (“CUP”) and Castle Union Partners II, L.P. (“CUP II”), may be deemed to have shared voting and dispositive power over the shares held by CUP and CUP II. Castle Union’s address is 676 N. Michigan Ave., Suite 3605, Chicago, Illinois 60611. |
Transactions with Related Persons
Related-Person Transactions Policy and Procedures
We have not adopted a written related-person transactions policy. However, it is our practice and policy to comply with all applicable laws, rules and regulations regarding related-person transactions, including the Sarbanes-Oxley Act of 2002. A related person is any of our executive officers, directors or holders of more than 5% of our outstanding voting stock, including any of their immediate family members, and any entity owned or controlled by such persons. It is our policy that the Audit Committee review and approve or ratify transactions involving related persons in which the amount involved exceeds $120,000 and that are otherwise reportable under SEC disclosure rules. Such transactions include employment of immediate family members of any of our directors or executive officers. Management advises the Audit Committee of any such transaction that is proposed to be entered into or continued and seeks the Audit Committee’s approval of the transaction. Under its charter, the Audit Committee is charged with the review and oversight of all related-person transactions as required by NASDAQ and SEC rules, including the review of management’s efforts to monitor compliance with our programs and policies designed to ensure compliance with applicable law, rules and our Code of Conduct and Ethics. In considering related-person transactions, the Audit Committee takes into account the relevant available facts and circumstances. In the event a director has an interest in the proposed transaction, the director must recuse himself or herself from the deliberations and approval.
Certain Related-Person Transactions
Other than transactions involving equity and other compensation, termination, severance and other arrangements for our directors and executive officers that are described under “Director Compensation” and “Employment, Severance, Separation and Change in Control Agreements” above, since January 1, 2014, there has not been nor are there currently proposed any transactions or series of similar transactions to which we were or are to be a party in which the amount involved exceeds $120,000 and in which any director, executive officer, holder of more than 5% of our common stock or any member of the immediate family of any of the foregoing persons had or will have a direct or indirect material interest, other than the following:
Director and Executive Officer Indemnification Agreements
In addition to the indemnification provisions contained in our certificate of incorporation and bylaws, we generally enter into separate indemnification agreements with our directors and executive officers. These agreements require us, among other things, to indemnify the director or executive officer against specified expenses and liabilities, such as attorneys’ fees, judgments, fines and settlements, paid by the individual in connection with any action, suit or proceeding arising out of the individual’s status or service as our director or executive officer, other than liabilities arising from willful misconduct or conduct that is knowingly fraudulent or deliberately dishonest, and to advance expenses incurred by the individual in connection with any proceeding against the individual with respect to which the individual may be entitled to indemnification by us. We also intend to enter into these agreements with our future directors and executive officers.
Independence of the Board of Directors
As required under NASDAQ listing standards, a majority of the members of a listed company’s board of directors must qualify as “independent,” as affirmatively determined by the board of directors. The Board consults with our counsel to ensure that the Board’s determinations are consistent with relevant securities and other laws and regulations regarding the definition of “independent,” including those set forth in pertinent listing standards of NASDAQ, as in effect from time to time. The Board also reviewed a summary of the answers to annual questionnaires completed by each of our non-employee directors.
Consistent with these considerations, after review of all relevant identified transactions or relationships between each director, or any of his or her family members, and us, our senior management and our independent registered public accounting firm, the Board has affirmatively determined that the following seven directors are independent directors within the meaning of the applicable NASDAQ listing standards: Mr. Saponas, Mr. Hillberg, Mr. Lefkof, Ms. Losty, Mr. McClendon, Mr. Miller and Mr. Slavin. In making this determination, the Board found that none of these directors had a material or other disqualifying relationship with us. In addition to transactions required to be disclosed under SEC rules, the Board considered certain other relationships in making its independence determinations, and determined in each case that such other relationships did not impair the director’s ability to exercise independent judgment on our behalf.
In addition, the Board has determined that each member of each of the Audit Committee, Compensation Committee and Nominating and Corporate Governance Committee of the Board meets the applicable NASDAQ rules and regulations regarding “independence” and that each member is free of any relationship that would impair his or her individual exercise of independent judgment with regard to us.
Mr. Brear, our President and Chief Executive Officer, is not an independent director by virtue of his employment with us.
Principal Accountant Fees and Services
The information required by this item regarding principal accounting fees and services is incorporated by reference to the information set forth in the section titled “Principal Accounting Fees and Services” in our Definitive Proxy Statement for our 2015 Annual Stockholders Meeting or an amendment to this Annual Report on Form 10-K to be filed with the Securities and Exchange Commission within 120 days of our fiscal year ended December 31, 2014.
PART IV
| (a)(1) | Financial Statements |
The financial statements filed as part of this report are listed on the index to financial statements on page 50.
| (b)(2) | Financial Statement Schedules |
PROCERA NETWORKS, INC.
SCHEDULE II: VALUATION AND QUALIFYING ACCOUNTS
|
(in thousands)
|
Balance at
Beginning
of Year
|
Additions
Charged to
Expense or
Other
Accounts
|
Deductions
|
Balance at
End of Year
|
||||||||||||
|
Allowance for doubtful accounts:
|
||||||||||||||||
|
Year ended December 31, 2014
|
$
|
129
|
$
|
-
|
$
|
(82
|
)
|
$
|
47
|
|||||||
|
Year ended December 31, 2013
|
96
|
40
|
(7
|
)
|
129
|
|||||||||||
|
Year ended December 31, 2012
|
98
|
6
|
(8
|
)
|
96
|
|||||||||||
All other schedules have been omitted because the required information is not present or not present in the amounts sufficient to require submission of the schedule or because the information required is included in the consolidated financial statements or notes thereto.
| (a)(3) | Exhibits |
The following exhibits are incorporated by reference or filed herewith.
|
2.1*# Share Purchase Agreement, by and among the Company, Procera Networks Kelowna ULC, Vineyard Networks Inc., the shareholders of Vineyard Networks Inc. and John Drope & Associates Ltd., as representative of the shareholders of Vineyard Networks Inc., dated January 7, 2013, filed as Exhibit 2.1 to our current report on Form 8-K/A filed on February 13, 2013 and incorporated herein by reference.
|
|
3.1* Certificate of Incorporation filed on June 13, 2013, included as Exhibit 3.3 to our current report on Form 8-K filed on June 14, 2013 and incorporated herein by reference.
|
|
3.2* Amended and Restated Bylaws, effective March 11, 2014, included as Exhibit 3.1 to our current report on Form 8-K filed on March 13, 2014 and incorporated herein by reference.
|
|
4.1* Form of Common Stock Certificate, included as Exhibit 4.1 to our current report on Form 8-K filed on June 14, 2013 and incorporated herein by reference.
|
|
10.1*‡ 2003 Stock Option Plan, included as Exhibit 10.1 to our registration statement on Form SB-2 filed on January 8, 2004 and incorporated herein by reference.
|
|
10.2*‡ Amended 2004 Stock Option Plan, included as Exhibit 99.3 to our current report on Form 8-K filed on October 13, 2005 and incorporated herein by reference.
|
|
10.3*‡ Restated Executive Employment Agreement for James F. Brear, dated as of December 4, 2012, included as Exhibit 10.1 to our current report on Form 8-K filed on December 5, 2012 and incorporated herein by reference.
|
|
10.4*‡ Restated Executive Employment Agreement for Charles Constanti, dated as of December 3, 2012, included as Exhibit 10.2 to our current report on Form 8-K filed on December 5, 2012 and incorporated herein by reference.
|
|
10.5*‡ Form of Indemnity Agreement, included as Exhibit 10.1 to our current report on Form 8-K filed on June 14, 2013 and incorporated herein by reference.
|
|
10.6* Amended and Restated Loan and Security Agreement by and between the Company and Silicon Valley Bank, dated February 3, 2012, included as Exhibit 10.1 to our current report on Form 8-K filed on February 8, 2012 and incorporated herein by reference.
|
|
10.7*‡ Form of Restricted Stock Bonus Grant Notice (2007 Equity Incentive Plan, as amended), included as Exhibit 10.2 to our quarterly report on Form 10-Q filed on May 10, 2011 and incorporated herein by reference.
|
|
10.8*‡ Form of Restricted Stock Bonus Agreement (2007 Equity Incentive Plan, as amended), included as Exhibit 10.3 to our quarterly report on Form 10-Q filed on May 10, 2011 and incorporated herein by reference.
|
|
10.9*‡ 2007 Equity Incentive Plan, as amended, included as Exhibit 10.1 to our current report on Form 8-K filed on June 3, 2013 and incorporated herein by reference.
|
|
10.10*‡ Form of Inducement Grant Option Agreement entered into between the Company and certain Canadian employees, included as Exhibit 4.3 to our registration statement on Form S-8 filed on February 13, 2013 and incorporated herein by reference.
|
|
10.11*‡ Form of Inducement Grant Option Agreement entered into between the Company and certain U.S. employees, included as Exhibit 4.4 to our registration statement on Form S-8 filed on February 13, 2013 and incorporated herein by reference.
|
|
10.12‡ Form of Restricted Stock Unit Award Agreement for United States residents (2007 Equity Incentive Plan, as amended).
|
|
10.13‡ Form of Restricted Stock Unit Award Agreement for Swedish residents (2007 Equity Incentive Plan, as amended).
|
|
10.14‡ Form of Restricted Stock Unit Award Agreement for Canadian residents (2007 Equity Incentive Plan, as amended).
|
|
10.15‡ Form of Restricted Stock Unit Award Agreement for residents outside the United States, Sweden and Canada (2007 Equity Incentive Plan, as amended).
|
|
21.1 List of Subsidiaries.
|
|
23.1 Consent of Registered Public Accounting Firm – McGladrey LLP.
|
|
23.2 Consent of Registered Public Accounting Firm – Ernst & Young LLP.
|
|
24.1 Power of Attorney (included on signature page hereto).
|
|
31.1 Certification of Principal Executive Officer pursuant to Rule 13a-14(a) and 15d-14(a) of the Securities Exchange Act of 1934, as adopted pursuant to Section 302 of the Sarbanes-Oxley Act of 2002.
|
|
31.2 Certification of Principal Financial Officer pursuant to Rule 13a-14(a) and 15d-14(a) of the Securities Exchange Act of 1934, as adopted pursuant to Section 302 of the Sarbanes-Oxley Act of 2002.
|
|
32.1 Certification of Principal Executive Officer and Principal Financial Officer pursuant to 18 U.S.C. Section 1350, as adopted pursuant to Section 906 of the Sarbanes-Oxley Act of 2002.
|
|
101.INS XBRL Instance Document.
|
|
101.SCH XBRL Taxonomy Extension Schema.
|
|
101.CAL XBRL Taxonomy Extension Calculation Linkbase.
|
|
101.DEF XBRL Taxonomy Extension Definition Linkbase.
|
|
101.LAB XBRL Taxonomy Extension Label Linkbase.
|
|
101.PRE XBRL Taxonomy Extension Presentation Linkbase.
|
* Previously filed.
# The schedules and certain exhibits to the Share Purchase Agreement have been omitted pursuant to Item 601(b) of Regulation S-K. A copy of the omitted schedules and exhibits will be furnished to the U.S. Securities and Exchange Commission supplementally upon request.
‡ Indicates management contract or compensatory plan or arrangement.
| (b) Exhibits |
See Item 15(a)(3) above.
| (c) Financial Statement Schedules |
See Item 15(a)(2) above.
Pursuant to the requirements of Section 13 or 15(d) of the Securities Exchange Act of 1934, as amended, the Registrant has duly caused this Annual Report on Form 10-K to be signed on its behalf by the undersigned, thereunto duly authorized, in the City of Fremont, State of California, on this 12th day of March 2015.
|
Procera Networks, Inc.
|
||
|
Date: March 12, 2015
|
By:
|
/s/ James Brear
|
|
James Brear
|
||
|
President and Chief Executive Officer
|
||
|
Date: March 12, 2015
|
By:
|
/s/ Charles Constanti
|
|
Charles Constanti
|
||
|
Chief Financial Officer
|
||
POWER OF ATTORNEY
KNOW ALL PERSONS BY THESE PRESENTS, that each person whose signature appears below hereby constitutes and appoints, jointly and severally, James Brear and Charles Constanti, and each of them acting individually, as his or her attorney-in-fact, each with full power of substitution and resubstitution, for him or her in any and all capacities, to sign any and all amendments to this Annual Report on Form 10-K, and to file the same, with exhibits thereto and other documents in connection therewith, with the Securities and Exchange Commission, granting unto said attorneys-in-fact full power and authority to do and perform each and every act and thing requisite and necessary to be done in connection therewith as fully to all intents and purposes as he might or could do in person, hereby ratifying and confirming all that said attorneys-in-fact, or their substitute or substitutes, may lawfully do or cause to be done by virtue hereof.
Pursuant to the requirements of the Securities Exchange Act of 1934, this Report has been signed below by the following persons on behalf of the Registrant and in the capacities and on the dates indicated.
|
Name
|
Title
|
Date
|
||
|
/s/ James Brear
|
President, Chief Executive Officer
|
March 12, 2015
|
||
|
James Brear
|
(Principal Executive Officer) and Director
|
|||
|
/s/ Charles Constanti
|
Chief Financial Officer
|
March 12, 2015
|
||
|
Charles Constanti
|
(Principal Accounting and Financial Officer)
|
|||
|
/s/ Thomas Saponas
|
Director
|
March 12, 2015
|
||
|
Thomas Saponas
|
||||
|
/s/ Scott McClendon
|
Director
|
March 12, 2015
|
||
|
Scott McClendon
|
||||
|
/s/ Mary Losty
|
Director
|
March 12, 2015
|
||
|
Mary Losty
|
||||
|
/s/ Staffan Hillberg
|
Director
|
March 12, 2015
|
||
|
Staffan Hillberg
|
||||
|
/s/ Douglas Miller
|
Director
|
March 12, 2015
|
||
|
Douglas Miller
|
||||
|
/s/ Alan Lefkof
|
Director
|
March 12, 2015
|
||
|
Alan Lefkof
|
||||
|
/s/ William Slavin
|
Director
|
March 12, 2015
|
||
|
William Slavin
|
||||
|
2.1*# Share Purchase Agreement, by and among the Company, Procera Networks Kelowna ULC, Vineyard Networks Inc., the shareholders of Vineyard Networks Inc. and John Drope & Associates Ltd., as representative of the shareholders of Vineyard Networks Inc., dated January 7, 2013, filed as Exhibit 2.1 to our current report on Form 8-K/A filed on February 13, 2013 and incorporated herein by reference.
|
|
3.1* Certificate of Incorporation filed on June 13, 2013, included as Exhibit 3.3 to our current report on Form 8-K filed on June 14, 2013 and incorporated herein by reference.
|
|
3.2* Amended and Restated Bylaws, effective March 11, 2014, included as Exhibit 3.1 to our current report on Form 8-K filed on March 13, 2014 and incorporated herein by reference.
|
|
4.1* Form of Common Stock Certificate, included as Exhibit 4.1 to our current report on Form 8-K filed on June 14, 2013 and incorporated herein by reference.
|
|
10.1*‡ 2003 Stock Option Plan, included as Exhibit 10.1 to our registration statement on Form SB-2 filed on January 8, 2004 and incorporated herein by reference.
|
|
10.2*‡ Amended 2004 Stock Option Plan, included as Exhibit 99.3 to our current report on Form 8-K filed on October 13, 2005 and incorporated herein by reference.
|
|
10.3*‡ Restated Executive Employment Agreement for James F. Brear, dated as of December 4, 2012, included as Exhibit 10.1 to our current report on Form 8-K filed on December 5, 2012 and incorporated herein by reference.
|
|
10.4*‡ Restated Executive Employment Agreement for Charles Constanti, dated as of December 3, 2012, included as Exhibit 10.2 to our current report on Form 8-K filed on December 5, 2012 and incorporated herein by reference.
|
|
10.5*‡ Form of Indemnity Agreement, included as Exhibit 10.1 to our current report on Form 8-K filed on June 14, 2013 and incorporated herein by reference.
|
|
10.6* Amended and Restated Loan and Security Agreement by and between the Company and Silicon Valley Bank, dated February 3, 2012, included as Exhibit 10.1 to our current report on Form 8-K filed on February 8, 2012 and incorporated herein by reference.
|
|
10.7*‡ Form of Restricted Stock Bonus Grant Notice (2007 Equity Incentive Plan, as amended), included as Exhibit 10.2 to our quarterly report on Form 10-Q filed on May 10, 2011 and incorporated herein by reference.
|
|
10.8*‡ Form of Restricted Stock Bonus Agreement (2007 Equity Incentive Plan, as amended), included as Exhibit 10.3 to our quarterly report on Form 10-Q filed on May 10, 2011 and incorporated herein by reference.
|
|
10.9*‡ 2007 Equity Incentive Plan, as amended, included as Exhibit 10.1 to our current report on Form 8-K filed on June 3, 2013 and incorporated herein by reference.
|
|
10.10*‡ Form of Inducement Grant Option Agreement entered into between the Company and certain Canadian employees, included as Exhibit 4.3 to our registration statement on Form S-8 filed on February 13, 2013 and incorporated herein by reference.
|
|
10.11*‡ Form of Inducement Grant Option Agreement entered into between the Company and certain U.S. employees, included as Exhibit 4.4 to our registration statement on Form S-8 filed on February 13, 2013 and incorporated herein by reference.
|
|
10.12‡ Form of Restricted Stock Unit Award Agreement for United States residents (2007 Equity Incentive Plan, as amended).
|
|
10.13‡ Form of Restricted Stock Unit Award Agreement for Swedish residents (2007 Equity Incentive Plan, as amended).
|
|
10.14‡ Form of Restricted Stock Unit Award Agreement for Canadian residents (2007 Equity Incentive Plan, as amended).
|
|
10.15‡ Form of Restricted Stock Unit Award Agreement for residents outside the United States, Sweden and Canada (2007 Equity Incentive Plan, as amended).
|
|
21.1 List of Subsidiaries.
|
|
23.1 Consent of Registered Public Accounting Firm – McGladrey LLP.
|
|
23.2 Consent of Registered Public Accounting Firm – Ernst & Young LLP.
|
|
24.1 Power of Attorney (included on signature page hereto).
|
|
31.1 Certification of Principal Executive Officer pursuant to Rule 13a-14(a) and 15d-14(a) of the Securities Exchange Act of 1934, as adopted pursuant to Section 302 of the Sarbanes-Oxley Act of 2002.
|
|
31.2 Certification of Principal Financial Officer pursuant to Rule 13a-14(a) and 15d-14(a) of the Securities Exchange Act of 1934, as adopted pursuant to Section 302 of the Sarbanes-Oxley Act of 2002.
|
|
32.1 Certification of Principal Executive Officer and Principal Financial Officer pursuant to 18 U.S.C. Section 1350, as adopted pursuant to Section 906 of the Sarbanes-Oxley Act of 2002.
|
|
101.INS XBRL Instance Document.
|
|
101.SCH XBRL Taxonomy Extension Schema.
|
|
101.CAL XBRL Taxonomy Extension Calculation Linkbase.
|
|
101.DEF XBRL Taxonomy Extension Definition Linkbase.
|
|
101.LAB XBRL Taxonomy Extension Label Linkbase.
|
|
101.PRE XBRL Taxonomy Extension Presentation Linkbase.
|
* Previously filed.
# The schedules and certain exhibits to the Share Purchase Agreement have been omitted pursuant to Item 601(b) of Regulation S-K. A copy of the omitted schedules and exhibits will be furnished to the U.S. Securities and Exchange Commission supplementally upon request.
‡ Indicates management contract or compensatory plan or arrangement.
108