Attached files
| file | filename |
|---|---|
| EXCEL - IDEA: XBRL DOCUMENT - ASPEN AEROGELS INC | Financial_Report.xls |
| EX-32 - EX-32 - ASPEN AEROGELS INC | d842948dex32.htm |
| EX-31.2 - EX-31.2 - ASPEN AEROGELS INC | d842948dex312.htm |
| EX-23.1 - EX-23.1 - ASPEN AEROGELS INC | d842948dex231.htm |
| EX-31.1 - EX-31.1 - ASPEN AEROGELS INC | d842948dex311.htm |
Table of Contents
UNITED STATES
SECURITIES AND EXCHANGE COMMISSION
Washington, D.C. 20549
FORM 10-K
(Mark One)
| x | ANNUAL REPORT PURSUANT TO SECTION 13 OR 15(d) OF THE SECURITIES EXCHANGE ACT OF 1934 |
For the fiscal year ended December 31, 2014
OR
| ¨ | TRANSITION REPORT PURSUANT TO SECTION 13 OR 15(d) OF THE SECURITIES EXCHANGE ACT OF 1934 |
For the transition period from to
Commission file number: 001-36481
ASPEN AEROGELS, INC.
(Exact name of registrant as specified in its charter)
| Delaware | 04-3559972 | |
| (State or other jurisdiction of incorporation or organization) |
(I.R.S. Employer Identification No.) | |
| 30 Forbes Road, Building B Northborough, Massachusetts |
01532 | |
| (Address of principal executive offices) | (Zip Code) | |
Registrant’s telephone number, including area code (508) 691-1111
Securities registered pursuant to Section 12(b) of the Exchange Act:
| Title of each class |
Name of each exchange on which registered | |
| Common Stock, par value $.00001 per share | New York Stock Exchange |
Securities registered pursuant to Section 12(g) of the Exchange Act: None
Indicate by check mark if the registrant is a well-known seasoned issuer, as defined in Rule 405 of the Securities Act. Yes ¨ No x
Indicate by check mark if the registrant is not required to file reports pursuant to Section 13 or Section 15(d) of the Exchange Act. Yes ¨ No x
Indicate by check mark whether the registrant (1) has filed all reports required to be filed by Section 13 or 15(d) of the Securities Exchange Act of 1934 during the preceding 12 months (or for such shorter period that the registrant was required to file such reports), and (2) has been subject to such filing requirements for the past 90 days. Yes x No ¨
Indicate by check mark whether the registrant has submitted electronically and posted on its corporate Web site, if any, every Interactive Data File required to be submitted and posted pursuant to Rule 405 of Regulation S-T during the preceding 12 months (or for such shorter period that the registrant was required to submit and post such files). Yes x No ¨
Indicate by check mark if disclosure of delinquent filers pursuant to Item 405 of Regulation S-K is not contained herein, and will not be contained, to the best of registrant’s knowledge, in definitive proxy or information statements incorporated by reference in Part III of this Form 10-K or any amendment to this Form 10-K. ¨
Indicate by check mark whether the registrant is a large accelerated filer, an accelerated filer, a non-accelerated filer, or a smaller reporting company. See the definitions of “large accelerated filer”, “accelerated filer” and “smaller reporting company” in Rule 12b-2 of the Exchange Act.
| Large accelerated filer | ¨ | Accelerated filer | ¨ | |||
| Non-accelerated filer | x (Do not check if a smaller reporting company) | Smaller reporting company | ¨ | |||
Indicate by check mark whether the registrant is a shell company (as defined in Rule 12b-2 of the Exchange Act). Yes ¨ No x
The aggregate market value of the registrant’s common stock held by non-affiliates of the registrant (without admitting that any person whose shares are not included in such calculation is an affiliate) computed by reference to the price at which the common stock was last sold as of the last business day of the registrant’s most recently completed second fiscal quarter was approximately $207.4 million.
As of March 2, 2015, the registrant had 22,992,273 shares of common stock outstanding.
DOCUMENTS INCORPORATED BY REFERENCE
Portions of the registrant’s definitive Proxy Statement for its Annual Meeting of Stockholders to be held on June 17, 2015 are incorporated by reference into Part III of this Annual Report on Form 10-K to the extent stated herein.
Table of Contents
2
Table of Contents
| Item 1. | BUSINESS |
Aspen Aerogels, Inc. is an energy technology company that designs, develops and manufactures innovative, high-performance aerogel insulation used primarily in large-scale energy infrastructure facilities. In addition, we perform contract research services for a number of federal and non-federal government agencies, including the Department of Defense, the Department of Energy and other institutions. When used in this report, the terms “we,” “us,” “our” and “the Company” refer to Aspen Aerogels, Inc. and respective subsidiaries.
We design, develop and manufacture innovative, high-performance aerogel insulation. We believe our aerogel blankets deliver the best thermal performance of any widely used insulation product available on the market today and provide a combination of performance attributes unmatched by traditional insulation materials. Our products provide two to five times the thermal performance of widely used traditional insulation in a thin, easy-to-use and durable blanket form. Our end-use customers select our products where thermal performance is critical, and to save money, reduce energy use, preserve operating assets and protect workers.
Our technologically advanced products are targeted at the estimated $2.8 billion annual global market for energy infrastructure insulation materials. Our aerogel insulation has undergone rigorous technical validation and is used by many of the world’s largest oil producers and the owners and operators of refineries, petrochemical plants, LNG facilities and power generating assets, such as ExxonMobil, Formosa Petrochemical, Pemex Gas and NextEra Energy Resources. Our products replace traditional insulation in existing facilities during regular maintenance, upgrades and capacity expansions. In addition, we are increasingly being specified for use in new-build energy infrastructure facilities.
We introduced our two key product lines, Pyrogel and Cryogel in 2008. Our product revenue has grown from $17.2 million in 2008 to $99.3 million in 2014, representing a compound annual growth rate of 34%. We have sold more than $350 million of our products globally, representing an installed base of more than 150 million square feet of insulation. We believe that this initial success positions us for future growth and continued gain in market share.
We currently target our sales efforts in the energy infrastructure market, where we believe our products have the highest value applications. As we continue to expand our production capacity and enhance our technology, we believe we will have opportunities to address additional high value applications in the estimated $37 billion global insulation market.
We have grown our business by forming technical and commercial relationships with industry leaders, which has allowed us to optimize our products to meet the particular demands of targeted market sectors. We have benefited from our technical and commercial relationships with ExxonMobil in the oil refinery and petrochemical sector, with Technip in the offshore oil sector and with NextEra Energy Resources in the power generation sector. We will continue our strategy of working with innovative companies to target and penetrate additional market opportunities. We estimate that we generated 96% of our 2014 product revenue in the energy infrastructure insulation market.
Our patented aerogel product and manufacturing technologies are significant assets. Aerogels are complex structures in which 97% of the volume consists of air trapped between intertwined clusters of amorphous silica solids. These extremely low density solids provide superior insulating properties. Although aerogels are usually fragile materials, we have developed innovative and proprietary manufacturing processes that enable us to produce industrially robust aerogel insulation cost-effectively and at commercial scale.
3
Table of Contents
Our products enable compact design, reduce installation time and costs, promote freight and logistics cost savings, reduce system weight and required storage space and enhance job site safety. Our products reduce the incidence of corrosion under insulation, which is a significant maintenance cost and safety issue in energy infrastructure facilities. Our products also offer strong fire protection, which is a critical performance requirement in our markets. We believe our array of product attributes provides strong competitive advantages over traditional insulation. Although competing insulation materials may have one or more comparable attributes, we believe that no single insulation material currently available offers all of the properties of our aerogel insulation.
For the years ended December 31, 2014, 2013 and 2012, based on shipment destination or research services location, our U.S. revenues were $39.8 million, $30.2 million and $19.9 million, respectively, and our international revenues were $62.6 million, $55.9 million and $43.5 million, respectively.
We manufacture our products using proprietary technology at our facility in East Providence, Rhode Island. We have operated the East Providence facility at high volume and high yield since 2008. We successfully commenced operation of our second production line at this facility at the end of March 2011, which doubled our annual nameplate capacity to 40 million to 44 million square feet of aerogel blankets, depending on product mix.
To address anticipated near and mid-term capacity constraints caused by increasing demand for our products, we are in the process of expanding our production facility through the construction of a third production line. We currently expect that this third line will increase our annual nameplate capacity by 25% to 50 million to 55 million square feet and will be operational during the second quarter of 2015. We also plan to construct a second manufacturing facility in the United States, the location of which will be based on factors including, among others, proximity to raw material suppliers, energy costs, labor and construction costs, availability of government incentives and financing alternatives. We anticipate initial operation of a first production line at this facility during 2017.
Our Markets and Competition
Our core market is the energy infrastructure insulation market. This market is global, well-established and includes large and well-capitalized end-users. This market includes companies operating refinery, petrochemical, oil production, LNG production and storage facilities. The market also includes firms operating gas, coal, nuclear, hydro and solar thermal power generating plants. Insulation systems in the energy infrastructure market are designed to maintain hot and cold process piping and storage tanks at optimal temperatures, to protect plant and equipment from the elements and from the risk of fire, and to protect workers. The market is served by a well-organized, well-established, worldwide network of distributors, contractors and engineers.
Demand for insulation in the energy infrastructure market is composed of demand associated with new-build construction of facilities, capital expansions and related capital projects, as well as with routine, non-discretionary maintenance programs within existing facilities. Capital expansions and related capital projects in the energy infrastructure market are driven primarily by overall economic growth and projected growth in energy demand. Maintenance programs are essential to optimal operation of processing equipment, to protect workers and to minimize the risk of a catastrophic loss. Accordingly, we believe that demand for insulation for maintenance purposes in comparison to capital projects is less affected by volatility associated with economic cycles, energy prices and similar macroeconomic factors.
Global energy demand for all forms of energy is expected to increase steadily and, in order to serve this growing demand, we believe our end-use customers will continue to invest in major energy infrastructure projects. The major end-use markets that drive demand for our products include oil refining, petrochemical, natural gas and LNG, onshore oil production (including oil sands), offshore oil production and power generation.
4
Table of Contents
We also sell our products in the building and construction and other end markets, including the supply of fabricated insulation parts to original equipment manufacturers, or OEMs. These global OEMs develop products using our aerogels for applications as diverse as military and commercial aircraft, trains, buses, appliances, apparel, footwear and outdoor gear. While not our core market, we anticipate that we will continue to allocate a modest portion of our manufacturing capacity to serve these markets. We believe the key performance criteria for insulation in these markets includes thermal performance, compact design, durability and fire resistance.
We operate in a highly competitive environment. In general, we compete with traditional insulation materials based on product performance, price, availability and proximity to the customer. Customers may choose among a variety of traditional insulation materials that offer a range of characteristics including thermal performance, durability, vapor permeability, moisture resistance, ease of installation and upfront and lifecycle costs. Within each type of insulation material, there is also competition between the manufacturers of that material. Most types of traditional insulation materials are produced by a number of different manufactures and once customers have chosen the type of insulation material that they intend to use, they will choose a manufacturer of that material based primarily on each manufacturer’s price and delivery schedule. Insulation manufacturers include a range of large, high-volume, multinational manufacturers offering branded products and strong technical support services to small, low-volume, local manufacturers offering low prices and limited customer support.
We believe the primary competitive factors in our market are:
| • | product performance (along multiple criteria), quality and fitness for purpose; |
| • | product price, installed cost and lifecycle cost; |
| • | product availability; and |
| • | proximity to customer and logistics. |
Our products are priced at a premium to traditional insulation materials. While our competitors offer many traditional insulation products that are priced below our products on a per-unit basis, we believe our products have superior performance attributes and have the lowest cost on a fully-installed basis or offer significant life-cycle cost savings.
We also compete in the aerogel insulation market with Cabot Corporation, or Cabot, predominantly in the off-shore segment. In addition, we are aware of competitors in China that manufacture and market aerogel insulation products.
Within each of our target markets, we encounter these organizations and a significant number of other aggressive national, regional and local suppliers. Our competitors are seeking to both enhance traditional insulation materials and develop and introduce new and emerging insulation technologies. Competing technologies that outperform our insulation products in one or more performance attributes could be developed and successfully introduced. We are aware of certain companies in Asia that are marketing aerogel products similar to our aerogel products over the Internet but we are not aware of any sales of their products in our targeted geographic markets. See “Risk Factors— The energy infrastructure insulation market is highly competitive; if we are unable to compete successfully, we may not be able to increase or maintain our market share and revenues.”
Our market share in 2014 was less than 3.5% of the estimated $2.8 billion annual global market for energy infrastructure insulation materials. Many of our competitors have greater market presence, larger market share, longer operating histories, stronger name recognition, larger customer bases and significantly greater financial, technical, sales and marketing, manufacturing and other resources than we have and may be better able to withstand volatility within the industry and throughout the economy as a whole while retaining greater operating and financial flexibility. If our competitors lower their prices, or develop new products, or if we are unable to compete effectively, our growth opportunities, share of the market, margins and profitability may decline.
5
Table of Contents
Our Competitive Strengths
Because insulation is used in a wide variety of demanding applications, insulation materials must satisfy a wide range of performance criteria on a cost-effective basis. We believe that our aerogel technology has allowed us to create superior insulation products for our core markets that will allow us to continue to grow our share of the global insulation market. We believe that the potential for significant technological innovation in traditional insulation materials is limited and that new high-performance materials will be required to meet evolving market requirements for energy efficient insulation systems. Our line of high-performance aerogel blankets is positioned to meet these requirements. Our solution is driven by our innovative and proprietary technology that produces aerogels in a flexible and industrially robust blanket form and is supported by over a dozen years of research and development dedicated to new aerogel compositions, form factors and manufacturing technologies. We believe our aerogel blankets deliver a superior combination of performance attributes that enable end-users to save money, reduce energy use, preserve operating assets and protect workers across a wide range of applications in our target markets.
We believe the following combination of capabilities distinguishes us from our competitors and positions us to continue to gain market share in the energy infrastructure insulation market:
| • | Disruptive Products with a Compelling Value Proposition. Our aerogel products provide two to five times the thermal performance of widely used traditional insulation in a thin, easy-to-use and durable blanket form. We believe our array of product attributes provides strong competitive advantages over traditional insulation and will enable us to gain a larger share of the energy infrastructure insulation market. Although competing insulation materials may have one or more comparable attributes, we believe that no single insulation material currently available offers all of the properties of our aerogel insulation. |
| • | Attractive Energy End Markets. Our products are primarily used in large scale energy infrastructure facilities. Global energy demand for all forms of energy is expected to increase by 56% from 2010 to 2040, according to the International Energy Outlook 2013 report by the EIA. Given the continued growth in global energy consumption, and the construction of new facilities to satisfy this demand, we believe that we serve attractive and growing global end markets. In order to capture the opportunities in our end markets, we have a network of sales professionals and qualified distributors in more than 30 countries around the world. |
| • | Growing Installed Base with Industry-leading End-Users. We have an installed base of more than 150 million square feet of insulation, representing more than $350 million in cumulative product sales since 2008. Through our relationships with industry leading end-use customers, our products have undergone rigorous testing and technical validation and are now in use at many of the world’s largest oil producers, refiners and petrochemical companies. These relationships have shortened the sales cycle with other customers and have helped to facilitate our market penetration. We also have strong relationships with a global network of energy-focused distributors, contractors and engineering firms that understands the significant advantages our products provide to end-users. We believe our products have been used by 24 of the world’s largest 25 refining companies and 19 of the world’s largest 20 petrochemical companies and have been initially deployed in approximately 30% of the world’s 640 refineries. |
| • | Proven, Scalable Business Model. Our proprietary manufacturing technology is proven and has been successfully scaled up to meet increasing demand. We have operated the East Providence facility at high volume and high yield since 2008. We successfully commenced operation of our second production line at this facility in March 2011 and doubled our annual nameplate capacity to 40 million to 44 million square feet of aerogel blankets. We currently expect to commence operations on a third line in the East Providence facility during the second quarter of 2015 that we expect will increase our annual nameplate capacity by 25% to 50 million to 55 million square feet of aerogel blankets. |
6
Table of Contents
| • | Protected Technology Platform and Proprietary Manufacturing Capability. Our product solution is the result of more than a dozen years of research and development dedicated to new aerogel compositions, form factors and manufacturing technologies. Our intellectual property portfolio is supported by 75 issued patents, with an additional 50 pending in U.S. and foreign jurisdictions in areas related to product design, chemistry, process technology and market applications. In addition, we believe we have significant trade secrets related to product formulations and manufacturing techniques. We believe our portfolio of patents, trade secrets and know-how presents a significant barrier to potential new entrants in the production of aerogel blanket insulation. |
| • | Experienced Management Team with a Demonstrated Track Record. Our executive officers have an average of more than 20 years each of experience in global industrial companies, specialty chemical companies or related material science research. This management team is responsible for the development of our proprietary manufacturing technology, the commercial acceptance of our products, and the creation of a global distribution and marketing platform. As of December 31, 2014, we employed 244 research scientists, engineers, manufacturing line operators, sales and administrative staff, and management. We believe our dedicated and experienced team is an important competitive asset. |
Our Growth Strategy
We are targeting continued expansion of the use of our products within energy infrastructure facilities during regular maintenance, upgrades and expansions. In addition to opportunities to replace traditional insulation at existing facilities, we are also pursuing insulation applications at new-build and large capacity expansion projects around the world. Historically, a significant portion of our revenue has been derived from displacing traditional insulation at existing facilities, in particular during periods of planned plant maintenance or upgrades. We believe these maintenance applications will continue to comprise a large portion of our revenue mix.
Our strategy is to create economic value by leveraging our technological and market leadership in aerogels to be the premier provider of high-performance insulation products serving global energy infrastructure customers. Key elements of our strategy include:
| • | Broaden Market Diversity and Grow Market Share. We plan to focus additional resources to continue to grow our share of the energy infrastructure insulation market, both through increased sales to our existing customers and through sales to new customers. We plan to continue to expand our global sales force and distribution network and seek to promote greater enterprise-wide utilization of our products by existing end-use customers. To date, the majority of our revenue has been generated from applications in refineries and petrochemical facilities. We will continue to pursue and expect greater adoption of our products in the oil production, LNG production and storage, and power generation markets. In addition, our product revenue has been and will be generated in large part by demand for insulation associated with scheduled plant shutdowns, or turnarounds, and other maintenance-related projects. With our broad adoption and growing installed base, we expect that our products will be specified during the design phase in a growing number of new plant construction and capital expansion projects. We expect that growth in global energy demand will result in increased new-build and large capacity expansion projects, driving demand for our aerogel products. |
| • | Leverage Our Technology and Increase Capacity to Meet Demand. Demand for our aerogel products has grown significantly. From 2008 through 2014, our product revenue has grown at a compound annual growth rate of 34% to $99.3 million. To meet anticipated growth in demand for our products, we are engaged in the construction of a third production line in our East Providence facility and plan to construct a second manufacturing facility the United States. We expect that the third production line at our East Providence facility will increase our annual nameplate capacity by 10 million to 11 million square feet of aerogel blankets at a total construction cost of approximately $30.8 million. |
7
Table of Contents
| As of December 31, 2014, we have incurred $22.7 million of these costs. We expect this third production line to be operational during the second quarter of 2015. We also intend to build a second production plant in the United States after the completion of our third production line. We anticipate initial operation of the first production line at this facility during 2017. Based on our preliminary plans for this plant, our projected cost to construct this plant infrastructure for a multi-line facility and first production line is $80 million to $100 million with an estimated annual nameplate capacity of 26 million to 28 million square feet of aerogel blankets. The plant infrastructure design would also support future development of two additional similar production lines. |
| • | Expand Our Profit Margins and Return on Invested Capital. We will seek to continuously improve the cost efficiency of our manufacturing process to optimize the formulation of our products and to manage our supply chain to reduce costs As our overall manufacturing scale grows, we believe there will be additional opportunities to realize efficiencies and to reduce our per unit overhead costs. We believe our current expansion plan offers attractive returns on incremental invested capital. |
| • | Capitalize on Innovation. We employ a team of research scientists and process engineers focused on advancing our current aerogel technology and developing next generation aerogel compositions, form factors and manufacturing processes. We believe that we are well positioned to leverage a decade’s worth of research and development to design and commercialize additional disruptive aerogel products for the energy infrastructure market. In addition, as we continue to enhance our technology and expand our capacity, we believe we will have opportunities to address additional high value applications in the estimated $37 billion global insulation market. |
Our Products
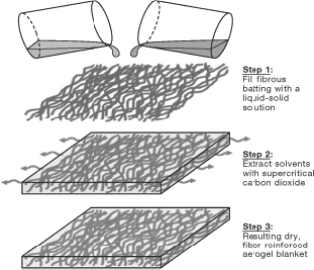
Aerogels are complex structures in which 97% of the volume consists of air trapped between intertwined clusters of amorphous silica solids. Aerogels are a very low density solid and are usually extremely fragile materials. However, our proprietary manufacturing process produces aerogels in a flexible, resilient, durable and easy-to-use blanket form.
The core raw material in the production of our aerogel products is a silica precursor. Our manufacturing process initially creates a semi-solid alcogel in which the silica structure is filled with ethanol. We produce aerogel by means of a supercritical extraction process that removes ethanol from the gel and replaces it with air. Our process allows the liquid ethanol to be extracted without causing the solid matrix in the gel to collapse from capillary forces.
Our material costs were the equivalent of 46%, 47% and 61% of product revenue for the years ended December 31, 2014, 2013 and 2012, respectively. We are seeking to lower our manufacturing costs and to improve the per square foot costs of our aerogel blankets by optimizing our chemistries and manufacturing processes to improve yields, by obtaining material price reductions from existing vendors, by qualifying new vendors for certain materials and by optimizing shipping costs. Our objective is both to reduce costs to enhance our competitive advantage and to ensure we deliver high quality finished products.
The materials used in the production of our products consist primarily of polyester and fiberglass battings, silica precursor and ethanol, which is used in the delivery of the silica precursor. Multiple sources of supply exist for all of our materials, and we believe the markets for these products are competitive and prices are relatively stable. We purchase silica precursor from several suppliers. Based on the current level of demand for our products, we believe that an adequate long-term supply of silica precursor is available. However, if demand for our products increases rapidly, we will need to work with suppliers to ensure that an adequate long-term supply of silica precursor will be available. Suppliers of silica precursor include industrial companies that produce it directly or that produce it as a byproduct of other industrial processes. We are working with a number of suppliers to plan for our potential future needs and to develop processes to reduce the long-term cost of the silica precursor used in our
8
Table of Contents
products. See “Risk Factors — Shortages of the raw materials used in the production of our products, increases in the cost of such materials or disruptions in our supply chain could adversely impact our financial condition and results of operations.”
The composition of our aerogel products minimizes the three mechanisms of thermal transport:
| • | Conduction. Heat conduction through a material is correlated to the material’s density. Aerogels are very low density solids. As a result, thermal conductivity through the aerogel material itself is extremely low. |
| • | Convection. Heat convection in gases is through movement of gas molecules. Due to the restricted movement of gases in the aerogel structure, thermal convection is eliminated inside the aerogels. |
| • | Radiation. Radiation requires no medium to transfer the heat. Thermal radiation is partially absorbed by aerogels. Our aerogel products also contain infrared absorbing additives to significantly reduce radiant heat transfer. |
We believe our aerogel products offer the lowest levels of thermal conductivity, or best insulating performance, of any widely used insulation available on the market today. Our aerogel blankets are reinforced with non-woven fiber batting. We manufacture and sell our blankets in 60 inch wide, three foot diameter rolls with a standard range of thickness of 5 millimeters to 10 millimeters. Our base products are all flexible, hydrophobic yet breathable, compression resistant and able to be cut with conventional cutting tools. We have specifically developed our line of aerogel blankets to meet the requirements of a broad set of applications within our target markets. The composition and attributes of our aerogel blankets are described below:
Energy Infrastructure Markets
| • | Pyrogel XT/XT-E. Pyrogel XT/XT-E, our best selling product, is reinforced with a glass-fiber batting and has an upper use temperature of 650° C. Pyrogel XT was initially designed for use in high temperature systems in refineries and petrochemical facilities, and we believe that it has wide applicability throughout the energy infrastructure market. Pyrogel XT’s hydrophobicity and vapor permeability reduce the risk of corrosion under insulation in high temperature operating systems when compared to traditional insulation. |
9
Table of Contents
| • | Pyrogel XTF. Pyrogel XTF is similar in thermal performance to Pyrogel XT, but is reinforced with a glass- and silica-fiber batting. Pyrogel XTF is specially formulated to provide strong protection against fire. |
| • | Cryogel Z. Cryogel Z is designed for sub-ambient and cryogenic applications in the energy infrastructure market. Cryogel Z is reinforced with a glass- and polyester-fiber batting and is produced with an integral vapor barrier. Cryogel Z is also specially formulated to minimize the incidence of stress corrosion cracking in stainless steel systems. We believe that Cryogel Z’s combination of properties allow for simplified designs and reduced installation costs in cold applications throughout the energy infrastructure market when compared to traditional insulation. |
| • | Spaceloft Subsea. Spaceloft Subsea is reinforced with glass- and polyester-fiber batting and is designed for use in pipe-in-pipe applications in offshore oil production. Spaceloft Subsea can be fabricated and pre-packaged to permit faster installation. Spaceloft Subsea allows for small profile carrier pipelines and associated reductions in capital costs. |
Other Markets
| • | Spaceloft. Spaceloft is reinforced with a glass/polyester fiber batting and is designed for use in the building and construction market. Spaceloft is either utilized in roll form by contractors in the field or fabricated by OEMs into strips, panels and systems that meet industry standards. Spaceloft is designed for use in solid wall buildings and where space is at a premium. |
| • | Cryogel X201. Cryogel X201 is similar in composition to Cryogel Z, but is produced without a vapor barrier. Cryogel X201 is designed for use in cold system designs where space is at a premium. Cryogel X201 is targeted to OEMs that design, produce and sell refrigerated appliances, cold storage equipment and aerospace systems. |
R-Values by Material
Insulation is a material or combination of materials that slows the transfer of heat from one side of the insulation material to the other. The lower a material’s thermal conductivity, the more slowly heat is transferred across it. R-values are a commonly used measure of an insulating material’s resistance to heat transfer. R-value is calculated as the thickness of an insulation material divided by the thermal conductivity of the insulation material. Materials with higher R-values have lower thermal conductivity and are better insulators. Traditional and specialty insulation materials provide a range of R-values. Aerogels has the highest R-value per meter of thickness in comparison to traditional insulation materials.
Qualification for Use
Our products have undergone rigorous testing and are now qualified for global usage in both routine maintenance and in capital projects at many of the world’s largest oil producers, refiners and petrochemical companies as ranked by a weighted measure of sales, profits, assets and market value. These end-users of our products have well defined practices, codes, specification and standards for materials and systems installed or used in their facilities. These specifications include insulation system design standards, material qualification and selection processes, and insulation application practices. As part of the material qualification process run by these companies, a new insulation must meet general industry standards, such as consensus standards developed by ASTM International, and, in some cases, company-specific internal standards to be considered for use. In addition, most of these companies require one or more field trials to establish fitness for use in specific applications. The companies either run these qualification processes and field trials internally or through third parties engaged by them, and they generally do not publicly disclose the results of their testing. While the specific processes and timelines vary from company to company, in general, upon successful completion of the qualification process for an insulation material, an end-user will typically deem the material to be qualified for
10
Table of Contents
use in its facilities on a local, regional or global basis for one or more applications. Because our end-use customers are typically businesses with very large operations, our insulation sales likely represent only a small portion of the total insulation used by any one of these companies. Accordingly, once our products are qualified at a company, we continue to seek to expand use of our products by the end-use customer.
Our Sales Channel
We market and sell our products primarily through our sales force. Our salespeople are based in North America, Europe and Asia and travel extensively to market and sell our products to new and existing customers. The efforts of our sales force are supported by a small number of sales consultants with extensive knowledge of a particular market or region. Our sales force is required to establish and maintain customer and partner relationships, to deliver highly technical information and to provide first class customer service. We plan to expand our sales force globally to support anticipated growth in customers and demand for our products.
Our sales force calls on and maintains relationships with participants at all levels of the insulation industry supply chain. Our salespeople have established and manage a network of insulation distributors to ensure rapid delivery of our products in critical regions. Our salespeople work to educate insulation contractors about the technical and operating cost advantages of aerogel blankets. Our sales force works with end-users and engineering firms to promote qualification, specification and acceptance of our products. In the energy infrastructure market, we rely heavily on the existing and well-established channel of distributors and contractors to deliver products to our customers. In addition, our salespeople work with OEMs and development partners to create new products and solutions to expand our market reach.
The sales cycle for a new insulation material is typically lengthy. Our sales cycle from initial customer trials to widespread use can take from one to three years, although we typically realize increasing revenue at each stage in the cycle. We believe our relationships with technically sophisticated customers serve to validate our technology, products and value proposition within a target market. These relationships have proven to shorten the sales cycle with other customers within specific market segments and to facilitate market share growth. We have focused our marketing efforts on developing technical support materials, installation guides, case studies and general awareness of the superior performance of our aerogel blankets. We rely on our website, printed technical materials, participation in industry conferences and tradeshows and presentation of technical papers to communicate our message to potential customers. We also receive strong word-of-mouth support from the growing network of distributors, contractors, OEMs and end-users that understand the benefits of our products.
As of December 31, 2014, we had 28 employees in our sales and marketing organization worldwide. Their efforts were supported by a team of seven sales consultants.
Our Customers and End-Users
Customers
As described below, our primary customers are distributors, contractors and OEMs that stock, install and fabricate insulation products, components and systems for technically sophisticated end-users that require high-performance insulation.
| • | Distributors: We currently operate through a global network of over 40 insulation distributors. In general, insulation distributors stock, sell and distribute aerogel materials to insulation contractors and end-users. The distribution of our product outside the United States is typically conducted under agreements that provide for exclusivity by geography linked to annual purchase volume minimums. These insulation distributors often will also proactively market and promote aerogel materials across their market. |
11
Table of Contents
| • | Contractors: We currently sell directly to a number of insulation contractors under project specific contracts or general purchase orders. Insulation contractors generally perform insulation installation, inspection and maintenance and project management for end-users. In addition, some insulation contractors provide end-users with project engineering and design services. Several of our agreements with contractors provide for exclusivity by market sector or geography linked to annual purchase volume minimums. |
| • | OEMs: We currently sell directly to more than 10 OEMs that design, fabricate and manufacture insulation components and systems for use in the energy infrastructure, other industrial, building and construction, transportation, appliance and apparel markets. |
| • | Direct Sales to End-Users: In certain instances, we sell directly to end-use customers in the energy infrastructure insulation market. In these instances, our end-use customer directly manages and controls specification, logistic, installation, inspection, maintenance and fabrication activities of our aerogel products. |
A major Asian energy company and a North American based distributor represented 13% and 12%, respectively, of our total revenue for 2014 and were our only customers representing 10% or more of our revenue for that period.
Our product revenue is generated by sales to customers around the world. In 2014, 37% of our product revenue was generated in the United States, 33% in Asia-Pacific, 17% in Europe, Middle East and Africa, 8% in Latin America and 5% in Canada based on shipment destination.
A substantial portion of our sales are to shipment destinations located outside the United States, including India, the United Kingdom, Taiwan, South Korea, Brazil, Canada, Hong Kong, Singapore, Angola and Germany based on our shipment destination or the location in which research services are performed. Total revenue generated from outside of the United States amounted to $62.6 million or 61% of total revenue, $55.9 million or 65% of total revenue and $43.5 million or 69% of total revenue, in the years ended December 31, 2014, 2013 and 2012, respectively. In addition, we may expand our operations outside of the United States. As a result, we are subject to a number of risks; see “Risk Factors — A substantial portion of our revenue comes from sales in foreign countries and we may expand our operations outside of the United States, which subjects us to increased economic, foreign exchange, operational and political risks that could increase our costs and make it difficult for us to operate profitably.”
End-Users
The end-users of our aerogel blankets include some of the largest and most well capitalized companies in the world. Our products are installed in more than 40 countries worldwide.
Energy Infrastructure
| • | Oil Refining: We believe we have had initial product deployments in approximately 30% of the world’s 640 refineries. In addition, we believe our aerogel blankets are used by 24 of the world’s 25 largest refining companies including ExxonMobil, Petrobras and Chevron, among others. Over time, these companies have used our products in an increasing range of applications and throughout an increasing number of their facilities. |
| • | Petrochemical: We believe our aerogel blankets are used by 19 of the world’s 20 largest petrochemical companies including Formosa Petrochemical, Hu-Chems Company and a major Asian energy company, among others. |
| • | Natural Gas and LNG: Our products are in use at facilities operated by ExxonMobil, Pemex Gas and Qatargas, among others. |
12
Table of Contents
| • | Onshore: Our aerogel blankets are in use in several Canadian oil sands facilities owned and operated by Suncor Energy, ConocoPhillips and Husky Energy, among others. |
| • | Offshore: Our products are currently used in subsea projects off the coast of Brazil, in the Gulf of Mexico, in the North Sea, off the coast of Malaysia and off the west coast of Africa. Our products are installed in offshore projects owned by Marathon Oil, ConocoPhillips and Shell, among others. |
| • | Power Generation: We are targeting operators of gas, coal, nuclear, hydro and solar power generating facilities. Although not a significant portion of our revenue today, our products are currently used, among others, at a facility owned and operated by NextEra Energy Resources. |
Other Markets
We rely on the efforts of a small network of OEMs and fabrication houses to serve the building and construction, transportation, apparel and appliance markets. Our OEMs and fabricators are manufacturers of components and systems for buildings, refrigerated and hot appliances, cold storage equipment, automobiles, aircraft, trains and electronic sectors and manufacturers of outdoor gear and apparel. While our products have not yet been widely adopted in these markets, we expect that the end-users of our products in these markets will include a wide range of institutions, businesses, individuals, and government agencies.
Manufacturing
We manufacture our products using our proprietary technology at our facility located in East Providence, Rhode Island. We have operated the East Providence facility at a high volume and high yield since 2008. Our manufacturing process is proven and has been scaled up to help meet increasing demand.
Our manufacturing group is led by a seasoned team with management experience at global industrial and specialty chemical companies. Our manufacturing workforce is experienced and, to date, we have experienced employee turnover consistent with others in our industry. We have well-defined maintenance, environmental, health and safety programs and operating processes in place. We utilize statistical processes and quality controls to measure the thermal conductivity, hydrophobicity and thickness of our aerogel blankets during the manufacturing process. We are ISO 9001:2008 certified.
We price our product and measure our product shipments in square feet. We successfully commenced operation of our second production line at this facility at the end of March 2011, which doubled our annual nameplate capacity to 40 million to 44 million square feet of aerogel blankets, depending on product mix. We are currently in the process of constructing a third production line at the East Providence facility. We currently expect that this third line will increase our current capacity by 25% to 50 million to 55 million square feet and will be completed in the second quarter of 2015. We plan to construct a second manufacturing facility in the United States, the location of which will be based on factors including, among others, proximity to raw material suppliers, energy costs, labor and construction costs, availability of governmental incentives and financing alternatives. We anticipate initial operation of a first production line at this facility during 2017.
We directly control all stages in the manufacture of our aerogel blankets. Our direct ownership of manufacturing operations allows us to maintain control of proprietary process technologies and to control product quality. Our production of aerogel blankets utilizes a continuous batch process and consists of the following key steps:
| • | Sol Preparation. Mixing of a silica precursor in ethanol, a catalyst and additives in set formulas to deliver the target properties of the resultant aerogel. |
| • | Casting. Application of the sol into a non-woven batting and initial formation of the gel structure. |
| • | Aging. Bathing of the gel-saturated blankets in fluids to impart desired physical and thermal properties. |
13
Table of Contents
| • | Extraction. Supercritical extraction of the ethanol liquid from the gel-saturated blanket to produce an aerogel blanket. |
| • | Heat Treatment. Drying to remove trace ethanol, ammonia salts and water from the aerogel blankets. |
| • | Finishing. Coating to enhance quality and product handling. |
| • | Quality Control. Utilizing statistical process and quality controls to measure thermal conductivity, hydrophobicity and thickness of our aerogel blankets. |
Our material costs were the equivalent of 46%, 47% and 61% of product revenue for the years ended December 31, 2014, 2013 and 2012, respectively. The materials used in the production of our products consist primarily of polyester and fiberglass battings, silica precursors and ethanol, which is used in the delivery of the silica precursor. Multiple sources of supply exist for all of our raw materials, and we believe the markets for these products are competitive and prices are relatively stable. We purchase silica precursor from several suppliers. Based on the current level of demand for our products, we believe that an adequate long-term supply of silica precursor is available. However, if demand for our products increases rapidly, we will need to work with suppliers to ensure that an adequate long-term supply of silica precursor will be available. Suppliers of silica precursor include industrial companies that produce it directly or that produce it as a byproduct of other industrial processes. We are working with a number of suppliers to plan for our potential future needs and to develop processes to reduce the long-term cost of the silica precursor used in our products. See “Risk Factors — Risks Related to Our Business and Strategy — Shortages of the raw materials used in the production of our products, increases in the cost of such materials or disruptions in our supply chain could adversely impact our financial condition and results of operations.”
We are seeking to lower our manufacturing costs and to improve the per square foot costs of our aerogel blankets by optimizing our chemistries and manufacturing processes to improve yields, by obtaining material price reductions from existing vendors, by qualifying new vendors for certain materials and by optimizing shipping costs. Our objective is both to reduce costs to enhance our competitive advantage and to ensure we deliver high quality finished products.
Research and Development
The mission of our research and development team is to leverage innovation in support of our commercial objectives, including by designing additional disruptive products for the energy infrastructure market and seeking methods to lower our manufacturing costs and to improve yields. Our research and development expenditures were $6.0 million, $5.2 million and $5.1 million for the years ended December 31, 2014, 2013 and 2012, respectively. In addition, we spent $1.6 million, $2.0 million and $1.4 million for the years ended December 31, 2014, 2013 and 2012, respectively, on research and development activities sponsored by federal and other government agencies. Our scientists and engineers work closely with customers to study and assess insulation application requirements and guide advancements in aerogel materials and manufacturing.
Contract Research and Government Support
We regularly seek funding from a number of federal and other government agencies in support of our research and development and manufacturing activities. Research performed under contract to the Department of Defense, the Department of Energy and other institutions allows us to develop and leverage technologies into broader commercial applications. We also work closely with customers in government and industry to develop potential aerogel solutions that leverage not only the thermal insulation performance but other benefits of aerogels as well. The research and development activities that we conduct under such contracts may produce intellectual property to which we may not have ownership or exclusive rights and will be unable to protect or monetize.
14
Table of Contents
Under our contracts, the U.S. government generally has the right not to exercise options to extend or expand our contracts and may modify, curtail or terminate the contracts at its convenience. Our government customers may not renew our existing contracts after the conclusion of their terms and we may not be able to enter into new contracts with U.S. government agencies. Any decision by the U.S. government not to exercise contract options or to modify, curtail or terminate our contracts or not to renew our contracts or enter into new contracts with us would adversely affect our revenues.
We have received $47.5 million in funding under government contracts from inception through December 31, 2014. Our contract research revenue was $3.1 million, $4.0 million and $3.1 million for the fiscal years ended December 31, 2014, 2013 and 2012, respectively.
Intellectual Property
Our success depends in part upon our ability to obtain, maintain and protect intellectual property rights that cover our product forms, applications and/or manufacturing technologies and specifications and the technology or know-how that enables these product forms, applications, technologies and specifications, to avoid and defend against claims that we infringe the intellectual property rights of others, and to prevent the unauthorized use of our intellectual property. Since aerogels were developed approximately 80 years ago, there has been a wide range of research, development and publication on aerogels, which makes it difficult to establish intellectual property rights to many key elements of aerogel technology and to obtain patent protection. Where we consider it appropriate, our policy is to seek to protect our proprietary rights by filing United States and foreign patent applications related to technology, inventions and improvements that we consider patentable and important to the development and conduct of our business and, in particular, our aerogel technology, product forms and their applications in promising markets and our manufacturing technologies. We also rely on trade secrets, trademarks, licensing agreements, confidentiality and nondisclosure agreements and continuing technological innovation to safeguard our intellectual property rights and develop and maintain our competitive advantage.
As of December 31, 2014, we owned 23 issued U.S. patents, 18 pending U.S. patent applications (including two and one, respectively, that we co-own with third parties), 52 issued foreign patents and 32 pending foreign patent applications (including seventeen and two, respectively, that we co-own with a third parties). The U.S. patents that we own are generally effective for 20 years from the filing date of the earliest application to which each U.S. patent claims priority. The scope and duration of each of our foreign patents varies in accordance with local law. Our patents start to expire in December 2021.
We believe that having distinctive names are an important factor in marketing our products, and therefore we use trademarks to brand some of our products, including Pyrogel, Cryogel and Spaceloft. As of December 31, 2014, we had five trademark registrations and one pending trademark application in the United States, 43 trademark registrations and 5 pending applications in other foreign jurisdictions, including the European Union, Japan, China, Canada, South Korea and Brazil. Although we have a foreign trademark registration program for selected marks, our approach may not be comprehensive enough or we may not be able to register or use such marks in each foreign country in which we seek registration.
Cross License Agreement with Cabot Corporation
In April 2006, we entered into a cross license agreement with Cabot Corporation, which was amended in September 2007. Under the terms of the cross license agreement, each party has granted certain intellectual property rights to the other. The cross license agreement remains in effect until the expiration of the last to expire of the issued patents or patent applications and acquired patents licensed thereunder. We hold a non-exclusive, worldwide license to those patents and patent applications owned or licensed by Cabot that are necessary for us to (1) practice our manufacturing technology within a field of use, which is defined in accordance with the specific chemistry of our aerogel products and the supercritical fluid technology that we use in our manufacturing technology and (2) use and sell the resulting aerogel blanket and derivative products. We paid Cabot in full for
15
Table of Contents
this license by paying $38 million over a period of approximately seven years, with the last payment made in March 2013. We have granted to Cabot a reciprocal, non-exclusive, worldwide license to certain patents and patent applications that we own that are necessary for Cabot to practice its processes within a field of use defined in accordance with the specific chemistry in its aerogel products and the drying technology that it uses to manufacture its products. The grant of license to each party covers issued patents, patent applications and patents issued from such counterpart applications, as well as patents licensed or acquired during a specified term, in each case that claim aerogels, or methods, materials of manufacture, or uses of aerogels.
If we intend to sell, transfer, pledge or mortgage any of the patent rights that we license to Cabot, such sale, transfer, pledge or mortgage is subject to the licenses granted to Cabot under the cross license agreement. We also bear full responsibility and liability for any loss, damage, personal injury or death resulting from, arising out of or connected with our use of the licensed Cabot intellectual property or our use or any third party’s use of any products manufactured using the licensed Cabot intellectual property. The right to assert infringement of one or more patents licensed under the cross license agreement resides solely with the patent owner and, thus, Cabot has the exclusive right, but not the obligation, to enforce its rights in its intellectual property licensed to us under the agreement at its own expense, and any decision as to whether or not to do so by Cabot must be accepted as final by us.
Our Company
We are a corporation organized under the laws of Delaware. In June 2008, we completed a reorganization pursuant to which our predecessor company merged with and into a newly formed Delaware corporation, renamed Aspen Aerogels, Inc. We own two wholly owned subsidiaries: Aspen Aerogels Rhode Island, LLC and Aspen Aerogels Germany, GmbH. We maintain our corporate offices in Northborough, Massachusetts.
On June 18, 2014, we completed our initial public offering, or IPO, of 7,500,000 shares of our common stock at a public offering price of $11.00 per share. As of March 2, 2015, we had 22,992,273 shares of our common stock outstanding.
We are required to file annual, quarterly and current reports, proxy statements and other information required by the Securities Exchange Act of 1934, as amended, or the Exchange Act, with the Securities and Exchange Commission, or the SEC. You may read and copy the reports and other information we file with the SEC at the SEC’s Public Reference Room at 100 F Street, N.E., Room 1580, Washington, D.C. 20549. You may also obtain copies of this information by mail from the public reference section of the SEC, 100 F Street, N.E., Washington, D.C. 20549, at prescribed rates. You may obtain information regarding the operation of the public reference room by calling 1-800-SEC-0330. The SEC also maintains a website that contains reports, proxy statements and other information about issuers, like us, who file electronically with the SEC. The address of that website is http://www.sec.gov.
We maintain a public internet site at http://www.aerogel.com, including an Investors section through which we make available, free of charge, our Annual Reports on Form 10-K, Quarterly Reports on Form 10-Q, Current Reports on Form 8-K, Proxy Statements and Forms 3, 4 and 5 filed on behalf of directors and executive officers, as well as any amendments to those reports filed or furnished pursuant to the Exchange Act as soon as reasonably practicable after we electronically file such material with, or furnish it to, the SEC. We also put on our websites the charters for our Board of Directors’ Audit Committee, Compensation and Leadership Development Committee, Nominating and Corporate Governance Committee, as well as our Code of Business Conduct and Ethics, our Corporate Governance Guidelines and other related materials. The information on our websites is not part of this annual report.
Our Investor Relations Department can be contacted at Aspen Aerogels, Inc., 30 Forbes Road, Building B, Northborough, MA 01532, Attention: Investor Relations; telephone: 508-691-1111; e-mail: ir@aerogel.com.
16
Table of Contents
Employees
As of December 31, 2014, we had 244 full-time employees and no part-time employees, with 43 in research and development, 152 in manufacturing operations and supply chain, 28 in sales and marketing and 21 in general and administrative functions. Of our employees, 237 are located in the United States and seven are located abroad. We consider our current relationship with our employees to be good. None of our employees are represented by labor unions or have collective bargaining agreements.
Seasonality
Our industry and product offering makes us less susceptible to seasonal patterns as our operating results are generated in part by demand for insulation associated with new-build construction of facilities, capital expansions and related capital projects, and larger maintenance-related projects in the energy infrastructure market. Historically, our second and fourth quarter results have shown an increase in revenue, which we believe is associated with our end-use customers’ maintenance schedules and timing of capital projects.
Environmental Matters
We are subject to federal, state, local and foreign laws and regulations designed to protect the environment and to regulate the discharge of materials into the environment. We believe that our policies, practices, and procedures are properly designed to prevent unreasonable risk of environmental damage and associated financial liability. To date, environmental control regulations have not had a significant adverse effect on our overall operations. See “Risk Factors — We may incur significant costs complying with environmental, health and safety laws and related claims, and failure to comply with these laws and regulations could expose us to significant liabilities, which could adversely affect our results of operations.”
| Item 1A. | RISK FACTORS |
Risks Related to Our Business and Strategy
We have incurred net losses since our inception, and we may continue to incur net losses in the future and may never reach profitability.
We have a history of losses, and we may not ever achieve profitability. We experienced net losses of $66.3 million, $47.6 million and $56.1 million for the years ended December 31, 2014, 2013 and 2012, respectively. As of December 31, 2014, our accumulated deficit was $399.1 million. We expect to continue to incur operating losses as a result of expenses associated with the continued development and expansion of our business. Our expenses include sales and marketing, research and development, and general and administrative costs. Furthermore, these expenses are not the only factors that may contribute to our net losses. For example, interest expense on any debt that we incur in the future could contribute to our net losses. Any failure to increase revenue or manage our cost structure as we implement initiatives to grow our business could prevent us from achieving profitability, or sustaining profitability if we do achieve it. In addition, our ability to achieve profitability is subject to a number of the risks and uncertainties discussed below, many of which are beyond our control. Failure to become and remain profitable may adversely affect the market price of our common stock and our ability to raise capital and continue operations.
We have yet to achieve positive total cash flow, and our ability to generate positive cash flow is uncertain.
To develop and expand our business, we have made significant up-front investments in our manufacturing capacity and incurred research and development, sales and marketing and general and administrative expenses. In addition, our growth has required a significant investment in working capital over the last several years. We generated positive cash flows from operating activities of $6.6 million during 2014; however, we experienced negative cash flows from operating activities of $13.7 million and $25.9 million for the years ended December 31, 2013 and 2012, respectively.
17
Table of Contents
While we generated positive cash flows from operating activities for the year ended December 31, 2014, we expect that for the foreseeable future our total cash flow will remain negative. In particular, we will need cash to fund our significant planned future capital expenditures to expand our manufacturing capacity. We will also require significant amounts of working capital to support our growth and we will need to increase our inventories of raw materials and our products as we seek to grow our business. In addition, from time to time, we may have debt maturities that will require cash in order to repay those obligations. We may not achieve sufficient revenue growth to generate positive future cash flow and, therefore, we may need to raise additional capital from investors to achieve our expected growth. An inability to generate positive cash flow for the foreseeable future or raise additional capital on reasonable terms, if at all, may decrease our long-term viability.
We are dependent on a sole manufacturing facility. Any significant disruption to this facility or the failure of either of our two production lines in this facility to operate according to our expectation could have a material adverse effect on our business and results of operations.
We currently operate only two production lines in one manufacturing facility, which is located in East Providence, Rhode Island. Our ability to meet the demands of our customers depends on efficient, proper and uninterrupted operations at this manufacturing facility. In the event of a significant disruption to our sole manufacturing facility or breakdown of either production line, we currently do not expect that we would have sufficient inventory in stock to meet demand until the production lines return to operation.
Power failures or disruptions, the breakdown, failure or substandard performance of equipment, or the damage or destruction of buildings and other facilities due to fire or natural disasters could severely affect our ability to continue our operations. In the event of such disruptions, we are unlikely to find suitable alternatives or may not be able to make needed repairs on a timely basis and at reasonable cost, which could have a material adverse effect on our business and results of operations. In particular, our manufacturing processes include the use of both high temperatures and flammable chemicals, which subjects us to a significant risk of loss resulting from fire.
We had occasional incidences of fires at our initial facility in Northborough, Massachusetts that preceded our current manufacturing facility in East Providence, Rhode Island. If our manufacturing facility were to be damaged or cease operations, it may reduce revenue, cause us to lose customers and otherwise adversely affect our business. The insurance policies we maintain to cover losses caused by fire or natural disaster, including business interruption insurance, may not adequately compensate us for any such losses and will not address a loss of customers that we expect would result. If our sole manufacturing facility was damaged or destroyed prior to the commencement of operations at a second manufacturing facility, which we currently expect will commence during 2017, we would be unable to operate our business for an extended period of time and our business and results of operations may be materially adversely affected, potentially even threatening our viability.
If we fail to achieve the increase in production capacity that our continued growth requires in a timely manner, or at all, our growth may be hindered and our business or results of operations may be materially adversely affected.
Our continued growth requires that we increase our production capacity. Consequently, we are actively engaged in the construction of a third production line in our manufacturing facility in East Providence and also plan to construct a second manufacturing facility to be located in the United States. If, for any reason, including our inability to obtain financing, the third production line or the second manufacturing facility should fail to be completed in a timely manner, or at all, or any of the production lines in any future manufacturing facilities do not operate according to our expectations, sales may be impeded, our growth may be hindered and our business or results of operations may be materially adversely affected.
18
Table of Contents
Many factors could delay or prevent the addition of a third production line or the construction of a second manufacturing facility or cause us to reduce the scale or scope of the new facilities, including:
| • | our inability to obtain financing on favorable terms, or at all; |
| • | design, engineering and construction difficulties or delays; |
| • | our failure or delay in obtaining necessary legal, regulatory and other approvals; |
| • | interruptions in the supply of the necessary equipment, or construction materials or labor or an increase in their price; |
| • | opposition of local interests; and |
| • | natural disasters, accidents, political unrest or unforeseen events. |
Many factors could prevent the third production line or the second manufacturing facility from producing at their expected effective or nameplate capacity or could cause us to reduce the scale or scope of the new facilities, including:
| • | design and engineering failures; |
| • | inability to retain and train a skilled workforce; |
| • | the challenges of operating significantly higher volume equipment at the planned second facility than currently employed at our existing facility in East Providence; |
| • | improper operation of the manufacturing equipment; |
| • | decreases in our manufacturing yields due to the inefficient use of the materials needed to make our products in our manufacturing process; |
| • | the availability of raw materials to support the levels of production that we anticipate at these facilities; |
| • | strikes or labor disputes; and |
| • | damage to the manufacturing equipment due to design and engineering flaws, construction difficulties or operator error. |
Any such expansion will place a significant strain on our senior management team and our financial and other resources. The costs associated with and the resources necessary for our expansion could exceed our expectations and result in a materially adverse impact on our business, results of operations, financial condition and cash flows.
If we are unable to complete the projects contemplated, the costs incurred in connection with such projects may not be recoverable. For example, during 2013, we redesigned and reduced the planned scale of the third production line. As a result, we reviewed the construction in progress assets associated with the third production line and determined that $3.0 million had no future use. In addition, we concluded that an additional $0.4 million of construction in progress assets were not utilized or functional. Accordingly, we recorded a $3.4 million impairment charge during 2013 related to the write-off of construction in progress assets. A similar redesign or reduction in scale could affect the planned third production line or the second manufacturing facility and similar impairments of our assets in the future could harm our financial condition.
If the expected growth in the demand for our products does not follow each of our planned capacity expansions, then our business will be materially adversely affected.
As we pursue our capacity expansion plans, we will incur significant capital expenses and increased levels of manufacturing expenses in anticipation of expected growth in demand for our products. In particular, we expect that these substantial additional expenditures will be made by us significantly in advance of the existence
19
Table of Contents
of the level of demand that would ensure the most efficient use of our planned new capacity. As a result, if the expected growth in demand for our products fails to materialize within a reasonable amount of time following each of our planned capacity expansions, then we would suffer decreased levels of cash flow and our financial condition and results of operations would be adversely affected.
We will require significant additional capital to pursue our growth strategy beyond the construction of our third line in our East Providence facility, but we may not be able to obtain additional financing on acceptable terms or at all.
The growth of our business will depend on substantial amounts of additional capital for construction of new production lines or facilities, ongoing operating expenses and continued development of our aerogel product lines. Our capital requirements will depend on many factors, including the rate of our revenue growth, our introduction of new products and enhancements to existing products, and our expansion of sales and marketing and product development activities. In particular, our plans to construct a second manufacturing facility in the United States are dependent on our ability to secure grants from state and local governments and to raise debt and potentially equity. There is no assurance of our ability to obtain any such type of financing on terms acceptable to us or at all.
In addition, we may consider strategic acquisitions of complementary businesses or technologies to grow our business, which could require significant capital and could increase our capital expenditures related to future operation of the acquired business or technology.
We may not be able to obtain loans or additional capital on acceptable terms or at all. Moreover, our loan and security agreement with Silicon Valley Bank under which we have the ability to borrow up to $20.0 million contains restrictions on our ability to incur additional indebtedness, which, if not waived, could prevent us from obtaining needed capital. Any future credit facilities or debt instruments would likely contain similar restrictions. We may not be able to obtain bank credit arrangements or effect an equity or debt financing on terms acceptable to us or at all in order to fund our future capacity expansion plans. A failure to obtain additional financing when needed could adversely affect our ability to maintain and grow our business.
A sustained downturn in the energy industry, due to lower oil and gas prices or reduced energy demand, could decrease demand for some of our products and services, which could have a material adverse effect on our business, financial condition and results of operations.
Demand for a significant portion of our products and services depends upon the level of capital expenditure by companies in the energy industry, which depends, in part, on energy prices. Prices of oil and gas have been volatile over the past several years, with a moderate increase throughout 2010, higher volatility from 2011 through the first half of 2014, and a significant decrease in the second half of 2014. We expect that a continued decline in energy prices or a continuation of current lower energy prices will result in a reduction in capital expenditures by many companies in the energy industry, and in particular by end-users of our products involved in the construction and expansion of offshore and onshore oil and gas production facilities. Sustained lower energy prices may also relax our end-users’ need to improve energy savings by using premium-priced insulation products like ours, thus reducing demand for our products and causing downward pressure on the pricing of our products. A sustained downturn in the capital expenditures of our customers, whether due to a decrease in the market price of oil and gas or otherwise, may delay projects, decrease demand for our products and services and cause downward pressure on the prices we charge, which, in turn, could have a material adverse effect on our business, financial condition and results of operations. Such downturns, including the perception that they might continue, could have a significant negative impact on the market price of our common stock.
20
Table of Contents
The markets we serve are subject to general economic conditions and cyclical demand, which could harm our business and lead to significant shifts in our results of operations from quarter to quarter that make it difficult to project long-term performance.
Our results of operations have been, and may in the future be, adversely affected by general economic conditions and the cyclical pattern of certain industries in which our customers and end-users operate. Demand for our products and services depends in large part upon the level of capital and maintenance expenditures by many of our customers and end-users, in particular those in the energy, petrochemical and power generation industries, and firms that design, construct and operate facilities for these industries.
These customers’ expenditures historically have been cyclical in nature and vulnerable to economic downturns. In particular, profitability in the energy industry is highly sensitive to supply and demand cycles and commodity prices, which historically have been volatile; and our customers in this industry historically have tended to delay large capital projects, including expensive maintenance and upgrades, during industry downturns. Customer project delays may cause fluctuations in the timing or the amount of revenue earned and our results of operations in a particular period. Prolonged periods of little or no economic growth could decrease demand for oil and gas which, in turn, could result in lower demand for our products and a negative impact on our results of operations and cash flows. In addition, this historically cyclical demand and potential customer project delays may lead to significant shifts in our results of operations from quarter to quarter, which limits our ability to make accurate long-term predictions about our future performance. We estimate that sales to end-use customers in the energy industry accounted for approximately 96% of our 2014 revenues and we expect that they will account for a significant portion of our future revenues.
Growth has placed significant demands on our management systems and our infrastructure. If we fail to manage our growth effectively, we may be unable to execute our business plan, address competitive challenges and meet applicable product specifications and technical and delivery requirements.
We may be unable to manage our growth. To manage our anticipated future growth, we must continue to:
| • | improve our existing, and implement additional, managerial capabilities, manufacturing, sales and marketing, and engineering operations, research and development capabilities, regulatory compliance systems and financial control and reporting systems; |
| • | expand our manufacturing and distribution facilities; and |
| • | continue to recruit and train additional qualified personnel. |
All of these measures will require significant expenditures and will demand the attention of management. At certain points in the past, significant growth in demand for our products has put our management and manufacturing systems under strain. In addition, the physical expansion of our operations may lead to significant costs and may divert our management and business development resources. Furthermore, we compete for personnel and advisors with other companies and other organizations, many of which are larger and have greater name recognition and financial and other resources than we do. Due to our limited resources, we may not be able to effectively manage the expansion of our operations or recruit and adequately train additional qualified personnel or retain personnel. Any inability to manage growth could result in a loss of existing customers and revenues, delays in the execution of our business plans, and disruption of our operations. If we fail to achieve the necessary level of efficiency in our organization as it grows, our business, results of operations and financial condition would be harmed.
We allocate our operations, sales and marketing, research and development, general and administrative and financial resources based on our business plan, which includes assumptions about current and future orders from customers. However, these factors are uncertain. If our assumptions regarding these factors prove to be incorrect or if competing products gain further acceptance, then actual demand for our aerogel products could be significantly less than the demand we anticipate and we may not be able to sustain our revenue growth or achieve profitability.
21
Table of Contents
Shortages of the raw materials used in the production of our products, increases in the cost of such materials or disruptions in our supply chain could adversely impact our financial condition and results of operations.
The raw materials used in the production of our products consist primarily of polyester and glass fiber battings, silica precursors and additives. Although we are not dependent on any one supplier, we are dependent on the ability of our third-party suppliers to supply such materials on a timely and consistent basis. While these raw materials are available from numerous sources, they may be subject to fluctuations in availability and price. In addition, fluctuations in ethanol prices may affect the cost of silica precursors.
Our third-party suppliers may not dedicate sufficient resources to meet our scheduled delivery requirements or our suppliers may not have sufficient resources to satisfy our requirements during any period of sustained demand. Failure of suppliers to supply, delays in supplying or disruptions in the supply chain for our raw materials, or allocations in the supply of certain high demand raw components, could materially adversely affect our ability to meet our delivery schedules on a timely and competitive basis and results of operations. Most of our raw materials are procured through individual purchase orders and not through long-term contracts that ensure a fixed price or guaranteed supply. This procurement strategy may not support sustained long-term supply chain stability.
Fluctuations in the prices of these raw materials could have a material adverse effect on results of operations. Our ability to pass increases in raw material prices on to our customers is limited due to competitive pricing pressure and the time lag between increased costs and implementation of related price increases.
In particular, we purchase silica precursors from several suppliers, mostly pursuant to individual purchase orders and not pursuant to long-term contracts. We do not have a secure, long-term supply of silica precursors. We may not be able to establish arrangements for secure, long-term silica precursor supplies at prices consistent with our current costs or may incur a delay in supply while we seek alternative sources. Any inability to continue to purchase silica precursors pursuant to purchase orders, without long-term agreements in place, or to otherwise establish a long-term supply of silica precursors at prices consistent with our current costs, would have a material adverse effect on our ability to increase our sales and achieve profitability.
From time to time we have had difficulty consistently producing product that meets applicable product specifications and technical and delivery requirements, and such difficulties could expose us to financial, contractual or other liabilities.
Our insulation products are technologically advanced and require a precise and complex manufacturing process. Because of the precision and complexity of this manufacturing process and the high-performance characteristics of our products, from time to time we have had difficulty consistently producing product that meets applicable specifications and technical and delivery requirements, including our, our customers’ and the end-user’s specifications and requirements. The rapid growth in demand for our products has contributed to this difficulty by putting significant pressure on our management, our personnel and our production facilities. See “Risk Factors — Growth has placed significant demands on our management systems and our infrastructure. If we fail to manage our growth effectively, we may be unable to execute our business plan, address competitive challenges and meet applicable product specifications and technical and delivery requirements.”
Any failure to meet these product specifications or technical and delivery requirements could result in the termination of existing customer contracts or purchase orders, the elimination or reduction of future purchase orders, the impairment of customer relationships, and the incurrence of financial, contractual or other liabilities. Products that do not meet these specifications or requirements may also expose us to warranty and product liability claims and associated adverse publicity. Any such termination, reduction, impairment, liability or publicity could result in a broader loss of existing customers and revenues and delay the execution of our business plans, disrupt our operations and harm our results of operation and financial condition.
22
Table of Contents
The market for insulation products incorporating aerogel blankets is relatively undeveloped and our products may never be widely adopted, which would have a material adverse effect on our business.
The market for insulation products utilizing aerogel blankets is relatively undeveloped. Accordingly, our future results of operations will depend in large part on our ability to gain market share of the global energy infrastructure insulation market. Our ability to gain market share in this market is highly dependent on the acceptance of our products by large, well-established end-users, distributors, contractors and OEMs. The energy infrastructure insulation market has historically been slow to adopt new technologies and products. Most insulation types currently in use in these markets have been in use for over 50 years. In addition, there is a tendency of end-users in some of our markets to opt for the frequently lower short-term costs of traditional insulation materials. If we fail to successfully educate existing and potential end-users, distributors, contractors and OEMs regarding the benefits of our aerogel products, or if existing users of our products no longer rely on aerogel insulation for their insulation needs, our ability to sell our products and grow our business could be limited.
In particular, because we are still often a new supplier to our end-use customers, we may face concerns from these end-use customers about our reliability and our ability to produce our products in a volume sufficient to meet their supply needs. As a result, we may experience a reluctance or unwillingness by existing end-use customers to expand their use of our products and by potential end-use customers to begin using our products. Our products may never reach mass adoption, and changes or advances in technologies could adversely affect the demand for our products.
A failure to increase, or a decrease in, demand for aerogel insulation products caused by lack of end-user or distribution channel acceptance, technological challenges or competing technologies and products would result in a lower revenue growth rate or decreased revenue, either of which could materially adversely affect our business and results of operations.
Our products are expensive relative to other insulation products, which could make it more difficult for us to grow our revenue and achieve broader adoption of our aerogel products.
While we believe our products have superior performance attributes and may sometimes have the lowest cost on a fully-installed basis or offer life-cycle cost savings, our competitors offer many traditional insulation products that are priced below our products. Our products are expensive relative to other insulation products and end-use customers may not value our products’ performance attributes sufficiently to pay their premium price. This could make it more difficult for us to grow our revenue and achieve broader adoption of our aerogel products. In addition, some of the benefits of our products are based on reduced installation time and related labor expense. In regions where labor costs are significantly lower than in the United States and Europe, the cost benefits of reduced installation times may not be adequate to overcome the relatively high price of our products and may make it more difficult for us to grow our revenue in such regions.
The energy infrastructure insulation market is highly competitive; if we are unable to compete successfully, we may not be able to increase or maintain our market share and revenues.
We face strong competition primarily from established manufacturers of traditional insulation materials. Large producers of traditional insulation materials, such as Johns Mansville, Saint-Gobain, Knauf Gips, Owens Corning and Rockwool, dominate the insulation market. In addition, we face competition from other companies seeking to develop high-performance insulation materials, including aerogel insulation. For example, Cabot Corporation manufactures, markets and sells a different form of aerogel insulation that is competitive with our products, particularly in the offshore oil and gas sector for use in pipe-in-pipe applications. Many of our competitors are substantially larger and better capitalized than we are and possess greater financial resources. In addition, we are aware of competitors in China that manufacture and market aerogel insulation products. Our competitors could focus their substantial financial resources to develop new or additional competing products or develop products that are more attractive to potential customers than the products that we offer.
23
Table of Contents
Because some insulation manufacturers are substantially larger and better capitalized than we are, they may have the ability to sell their products at substantially lower costs to a large, existing customer base. Our products are expensive relative to other insulation products and end-use customers may not value our products’ superior performance attributes sufficiently to pay their premium price. In addition, from time to time we may increase the prices for our products and these price increases may not be accepted by our end-use customers and could result in a decreased demand for our products. Similarly, we may make changes to our products in order to respond to customer demand or to improve their performance attributes and these changes may not be accepted by our end-use customers and could result in a decrease in demand for our products. These competitive factors could:
| • | make it more difficult for us to attract and retain customers; |
| • | cause us to slow the rate of increase of our prices, delay or cancel planned price increases, lower our prices or discount our prices in order to compete; and |
| • | reduce our market share and revenues. |
Any of the above outcomes could have a material adverse effect on our financial condition and results of operations.
A substantial portion of our revenue comes from sales in foreign countries and we may expand our operations outside of the United States, which subjects us to increased economic, foreign exchange, operational and political risks that could increase our costs and make it difficult for us to operate profitably.
A substantial portion of our sales are to shipment destinations outside the United States, including India, the United Kingdom, Taiwan, South Korea, Brazil, Canada, Hong Kong, Singapore, Angola and Germany. Total revenue generated from outside of the United States, based on our shipment destination or research services location, amounted to $62.6 million or 61% of total revenue, $55.9 million or 65% of total revenue and $43.5 million or 69% of total revenue, for the years ended December 31, 2014, 2013 and 2012, respectively. As a result, we are subject to a number of risks, including, but not limited to:
| • | labor rules and collective bargaining arrangements in foreign jurisdictions; |
| • | difficulty in staffing and managing (including ensuring compliance with internal policies and controls) geographically widespread operations; |
| • | the effect of applicable U.S. and foreign tax structures, including tax rates that may be higher than tax rates in the United States or taxes that may be duplicative of those imposed in the United States; |
| • | trade relations among the United States and those foreign countries in which our customers and suppliers have operations, including protectionist measures such as tariffs and import or export licensing requirements; |
| • | general economic and political conditions in each country, which may interfere with, among other things, our supply chain, our customers and all of our activities in a particular location; |
| • | difficulty in the enforcement of contractual obligations in non-U.S. jurisdictions and the collection of accounts receivable from foreign accounts; |
| • | different regulatory regimes in the various countries in which we operate or sell our products; |
| • | inadequate intellectual property protection in foreign countries; |
| • | the difficulties and increased expense in complying with multiple and potentially conflicting domestic and foreign laws, regulations, product approvals and trade standards, including the U.S. Foreign Corrupt Practices Act and similar anti-bribery laws in non-U.S. jurisdictions, as well as the rules and regulations of the U.S. Office of Foreign Assets Control and similar sanctions laws; |
24
Table of Contents
| • | foreign currency exchange controls, restrictions and fluctuations, which could result in reduced revenue and increased operating expense; |
| • | transportation delays or interruptions; and |
| • | terrorist activity and political unrest, particularly given the use of our products at energy facilities. |
Sales of our products are generally conducted in U.S. dollars and we also bid for foreign projects in U.S. dollars. The recent strengthening of the U.S. dollar against the local currencies in many of the countries into which we sell our products has resulted in our products becoming more expensive relative to competing insulation products priced in the local currency. If the U.S. dollar remains at its current levels or strengthens further, our sales into foreign countries with relatively weaker currencies may be adversely impacted and we may be less competitive in bidding for projects in those markets.
Our success will depend in large part on our ability to manage the effects of continued global political or economic uncertainty, especially in our significant geographic markets.
Because of our significant international operations we could be materially adversely affected by violations of the U.S. Foreign Corrupt Practices Act and similar anti-corruption, anti-bribery and anti-kickback laws.
We operate on a global basis, with 63% of our product sales in 2014 being made to destinations outside the United States, including Canada, Mexico, Europe, Asia, South America and the Middle East. Our business operations and sales in countries outside the United States are subject to anti-corruption, anti-bribery and anti-kickback laws and regulations, including restrictions imposed by the Foreign Corrupt Practices Act, or FCPA, as well as the United Kingdom Bribery Act of 2010, or UK Bribery Act. The FCPA, UK Bribery Act, and similar anti-corruption, anti-bribery and anti-kickback laws in other jurisdictions generally prohibit companies and their intermediaries and agents from making improper payments to government officials or any other persons for the purpose of obtaining or retaining business. We operate and sell our products in many parts of the world that have experienced governmental corruption to some degree and, in certain circumstances, strict compliance with anti-corruption, anti-bribery and anti-kickback laws may conflict with local customs and practices. We train our employees concerning anti-corruption, anti-bribery and anti-kickback laws and have policies in place that prohibit employees from making improper payments. We continue to implement internal controls and procedures designed to ensure that we comply with anti-corruption, anti-bribery and anti-kickback laws, rules and regulations and mitigate and protect against corruption risks. We cannot provide assurance that our internal controls and procedures will protect us from reckless, criminal or other acts committed by our employees or third-parties with whom we work. If we are found to be liable for violations of the FCPA or similar anti-corruption, anti-bribery and anti-kickback laws in international jurisdictions, either due to our own acts or out of inadvertence, or due to the acts or inadvertence of others, we could suffer criminal or civil fines or penalties or other repercussions, including reputational harm, which could have a material and adverse effect on our business, results of operations and financial condition.
A failure to comply with export control or economic sanctions laws and regulations could have a material adverse impact on our business, results of operations or financial condition. We may be unable to ensure that our distributors comply with applicable sanctions and export control laws.
We operate on a global basis, with 63% of our product sales in 2014 being made to destinations outside the United States, including Canada, Mexico, Europe, Asia, South America and the Middle East. We face several risks inherent in conducting business internationally, including compliance with applicable economic sanctions laws and regulations, such as laws and regulations administered by the United States Department of Treasury’s Office of Foreign Assets Control, or OFAC, the United States Department of State and the United States Department of Commerce. We must also comply with all applicable export control laws and regulations of the United States and other countries. Violations of these laws or regulations could result in significant additional sanctions including criminal or civil fines or penalties, more onerous compliance requirements, more extensive debarments from export privileges or loss of authorizations needed to conduct aspects of our international business.
25
Table of Contents
In certain countries, we may engage third party agents or intermediaries, such as customs agents, to act on our behalf and if these third party agents or intermediaries violate applicable laws, their actions may result in criminal or civil fines or penalties or other sanctions being assessed against us. We take certain measures designed to ensure our compliance with U.S. export and economic sanctions law and we believe that we have never sold our products to Iran, Cuba, Sudan or Syria through third party agents or intermediaries or made any effort to attract business from any of these countries. However, it is possible that some of our products were sold or will be sold to distributors or other parties that, without our knowledge or consent, re-exported or will re-export such products to these countries. Although none of our non-U.S. distributors are located in, or to our knowledge, conduct business with Iran, Cuba, Sudan or Syria, we may not be successful in ensuring compliance with limitations or restrictions on business with these or other countries subject to economic sanctions. There can be no assurance that we will be in compliance with export control or economic sanctions laws and regulations in the future.
Any such violation could result in significant criminal or civil fines, penalties or other sanctions and repercussions, including reputational harm that could materially adversely impact our business, results of operations or financial condition.
We rely on sales to a limited number of direct customers, including distributors, contractors, OEMs, and end-use customers for the substantial majority of our revenue, and the loss of one or more significant direct customers or several of our smaller direct customers could materially harm our business. In addition, we understand from our direct customers that a substantial majority of their sales of our products are to a small number of end-use customers and the loss of one or more significant end-use customers or several of our smaller end-use customers could materially harm our business.
A substantial majority of our revenue is generated from sales to a limited number of direct customers, including distributors, contractors, OEMs and end-use customers. For the years ended December 31, 2014, 2013 and 2012, total revenue from our top ten direct customers represented 63%, 65% and 59% of our revenues, respectively. In 2014, a major Asian energy company represented 13% of our total revenue and a North American distributor represented 12% of our total revenue; in 2013, a North American distributor represented 15% of our total revenue and an Asian distributor represented 11% of our total revenue; and in 2012, a North American distributor represented 13% of our total revenue. For each of the periods discussed above, there were no other customers that represented 10% or more of our total revenues. Although the composition of our significant distributors, contractors, OEMs and end-use customers will vary from period to period, we expect that most of our revenues will continue, for the foreseeable future, to come from sales to a relatively small number of direct customers. In addition, we understand from our direct customers that a substantial majority of their sales of our products are to a small number of end-use customers.
Our direct customer concentration also creates accounts receivable concentrations and related risks. As of December 31, 2014, three of our direct customers accounted for 17%, 17% and 11% of our accounts receivable, respectively.
The substantial majority of our sales to distributors are transacted on a purchase order basis. The contracts we enter into with our direct customers generally do not include long-term commitments or minimum volumes that ensure future sales of our products. In addition, we understand that our direct customers’ contracts with end-use customers also generally do not include such commitments or minimums. Consequently, our results of operations may fluctuate significantly from period-to-period based on the actions of one or more significant direct customers or end-use customers.
A direct customer may take actions that affect us for reasons that we cannot anticipate or control, such as reasons related to an end-use customer’s financial condition, changes in business strategy or operations, the introduction of alternative competing products, or as the result of the perceived quality or cost-effectiveness of our products. Our agreements with these direct customers may be cancelled if we fail to meet certain product
26
Table of Contents
specifications or materially breach the agreement or for other reasons outside of our control. In addition, our direct customers may seek to renegotiate the terms of current agreements or renewals. The loss of, or a reduction in sales or anticipated sales to, one or more of our significant direct customers or end-use customers or several of our smaller direct customers or end-use customers could have a material adverse effect on our business, financial condition and results of operations.
If we are unable to maintain our technological advantage over our competitors, our business may be adversely affected.
We are researching, developing, manufacturing and selling high-performance aerogel insulation products. Rapid and ongoing changes in technology and product standards could quickly render our products less competitive, or even obsolete, particularly if we fail to continue to improve the performance of our insulation products. We are currently developing new applications for our existing products as well as new aerogel technologies; however, we may not be successful in doing so and new applications or technologies may not be commercially useful. Other companies that are seeking to enhance traditional insulation materials have recently introduced or are developing other emerging and potential insulation technologies. These competitors are engaged in significant development work on these various insulation products. Competing technologies that outperform our insulation in one or more performance attributes could be developed and successfully introduced.
We are also aware of certain companies that have developed or are developing products using aerogel technology similar to our technology and these or other companies could introduce aerogel products that compete directly with our products and outperform them in one or more performance attributes. As a result of this competition and potential competition, our products may not compete effectively in our target markets.
Negative perceptions regarding the safety, quality or other attributes of our products or a failure or a perceived failure of our products could have a material adverse effect on our results of operations and could make us unable to continue our business.
Given the history of asbestos as an insulation material, we believe that there is an elevated level of attention towards perceived health and safety risks in the insulation industry. As a consequence, it is essential to our existing business and to our future growth that our products are considered safe. Even modest perceptions by existing or potential distributors, contractors or end-use customers in our target markets that our products are not safe could have a critical impact on our ability to sell our products and to continue as a business. There is risk of an actual or perceived failure of our products or other negative perceptions regarding our products, such as perceived health hazards. For example, dust is produced by our products during their installation and use, which increases the likelihood of the perception of hazard. Another example is the potential for material failure in very high temperature applications. Like most insulation products, our Pyrogel XT and XT-E products will normally go through a controlled burn-in process immediately after exposure to high temperatures. If installed improperly, the burn-in may proceed too rapidly and the material may become damaged. Further, our competitors have in the past, and may in the future, seek to perpetuate such perceptions. We are currently taking steps to educate our distributors, contractors, OEMs and end-use customers on the nature of our products and the proper installation procedures in order to mitigate these risks. Such an event, or the perception of such an event, could quickly result in our direct and end-use customers replacing our products with traditional insulation materials which could have a material adverse effect on our results of operations.
Our activities and operations are subject to numerous health and safety laws and regulations. If we violate such regulations, we could face penalties and fines or be required to curtail or cease operations.
We are subject to numerous health and safety laws and regulations in each of the jurisdictions in which we operate. These health and safety laws and regulations apply to us including with regard to hazardous substances that we use in our manufacturing process and that certain of our products contain. These hazardous substances include titanium dioxide and carbon black, each of which has been determined, in certain forms and at certain levels, to be possibly carcinogenic or otherwise harmful to humans.
27
Table of Contents
Our processes also require the use of other regulated substances in raw material delivery and manufacturing, including among others, ethanol. Applicable laws and regulations require us to obtain and maintain permits and approvals and implement health and safety programs and procedures to control risks associated with our operations. Compliance with those laws and regulations can require us to incur substantial costs. Moreover, if our compliance programs are not successful, we could be subject to penalties or to revocation of our permits, which may require us to curtail or cease operations of the affected facilities. In particular, the construction of our third production line in our East Providence facility have required and will require us to obtain and maintain new permits from various regulatory authorities and if the issuance of such permits was delayed or denied, it would slow or potentially prevent the expansion of our manufacturing capacity. Violations of laws, regulations and permit requirements may also result in criminal sanctions, injunctions and the denial or revocation of our various permits.
While we use hazardous substances, including titanium dioxide and carbon black, in forms and at levels that are subject to current rules and regulations, such rules and regulations may become more stringent such that we are required to modify our manufacturing process and such that our customers’ use of our products may be impacted. Changes in the products or manufacturing processes may require the customers to perform an extensive re-qualification process, which our customers may not want to undertake for various reasons, resulting in the customer switching to competing products. In addition, changes in our production or manufacturing process may result in uses above currently permitted levels. Such uses or changes in rules or regulations could materially adversely affect our business, financial condition and results of operations.
Health and safety laws, regulations and permit requirements may become more stringent or otherwise change. Any such changes could require us to incur materially higher costs than we currently have. Our costs of complying with current and future health and safety laws, regulations and permit requirements, and any liabilities, fines or other sanctions resulting from violations of them, could adversely affect our business, financial condition and results of operations.
Our revenue may fluctuate, which may result in a high degree of variability in our results of operations and make it difficult for us to plan based on our future outlook and to forecast our future performance.
Our revenue may fluctuate from period to period due to a wide variety of factors. Since we rely on sales to a limited number of direct customers and end-use customers, changes in demand from one or more direct customers or end-users can significantly impact our revenue from period to period. In addition, the sales cycles for our products, including their qualification for use, are long and can result in unpredictability in our revenues. We expect to have an increasing percentage of our products sold for use in capital projects, which orders tend to be larger and more sporadic, that will further increase this unpredictability and the difficulty for us in forecasting quarterly or annual performance. Because of these factors, we have a limited basis on which to predict our quarterly revenue. Our profitability from period-to-period may also vary due to the mix of products that we sell in different periods. These factors may result in a high degree of variability in our results of operations and will make it difficult for us to accurately evaluate and plan based on our future outlook and to forecast quarterly or annual performance.
Our results of operations could be adversely affected if our operating expenses incurred do not correspond with the timing of our revenues.
Most of our operating expenses, such as manufacturing facility expenses, employee compensation and research expenses, are either relatively fixed in the short-term or incurred in advance of sales. In addition, our spending levels are based in part on our expectations regarding future revenues. As a result, if revenues for a particular quarter are below expectations, we may not be able to proportionately reduce operating expenses for that quarter. Our reliance on sales to a limited number of direct customers and end-use customers, the length of our sales cycles and the potentially increasing percentage of our products sold for use in capital projects each can cause sporadic demand for our products which would limit our ability to predict future sales. This limitation
28
Table of Contents
could result in our being unable to reduce spending quickly enough to compensate for reductions in sales and could therefore adversely affect our results of operations for any particular operating period.
If we do not continue to develop and maintain distribution channels for our products and to meet our customers’ demand for our products, our results of operations could be adversely affected.
For a significant portion of our revenues, we rely on sales to distributors who then sell our products to end-users in our target markets. Our success depends, in part, on our maintaining satisfactory relationships with these distributors. Our distributors require us to meet expectations of delivery, quality and pricing of our products, at both the distribution channel level and at the level of the end-user of our products. If we fail to meet expected standards, our revenues would decline and this could materially adversely affect our business, results of operations and financial condition. In addition, we have been unable at times to produce sufficient amounts of our products to meet demand from our customers and we may not be able to avoid capacity constraints in the future if demand exceeds our expectations or we fail to bring into operation as planned the third production line at our East Providence facility or the second manufacturing facility to be located in the United States. If we are unable to deliver our products within such short timeframes, we may be at risk of losing direct or end-use customers. Accordingly, shortfalls in sales could materially adversely affect our business and results of operations.
The qualification process for our products can be lengthy and unpredictable, potentially delaying adoption of our products and causing us to incur significant expense potentially without recovery.
Qualification of our products by many of our direct and end-use customers can be lengthy and unpredictable and many of these direct and end-use customers have extended budgeting and procurement processes. This extended sales process requires the dedication of significant time by our personnel and our use of significant financial resources, with no certainty of success or recovery of our related expenses. Furthermore, even after an extensive qualification process, our products may fail to meet the standards sought by our end-use customers and may not be qualified for use by such end-use customers. Additionally, our continued process improvements and cost-reduction efforts may require us or the end-users to re-qualify our products. Failure to qualify or re-qualify our products may result in us losing such companies as end-users of our products, which would cause a decrease in our revenue or revenue growth rate either of which could materially adversely affect our business and results of operations.
We may enter into agreements that may limit our ability to broadly market our products or could involve future obligations, which could make it more difficult for us to commercialize certain of our products and negatively affect our business and results of operations.
In order to commercialize our products, we may enter into commercial arrangements with distributors, OEMs or other customers. These agreements have contained, and may in the future contain, exclusivity, ownership and other terms that may limit our ability to commercialize any products or technology developed in connection with such agreements, including in ways that we do not envision at the time of entering into the agreement. These agreements may contain technical specifications or minimum volumes that must be achieved. However, these agreements may not obligate either party to make any purchases. As a result, our ability to commercialize products in a certain region or for a certain application may be limited and as a consequence our business, financial condition and results of operations could be materially adversely affected.
We are exposed to the credit risk of some of our direct customers, including distributors, contractors and OEMs, which subjects us to the risk of non-payment for our products.
We distribute our products through a network of distributors, contractors and OEMs, some of which may not be well-capitalized and may be of a lower credit quality. This direct customer network subjects us to the risk of non-payment for our products. Although we have not experienced a significant incidence of non-payment for
29
Table of Contents
our products, such non-payments may occur in the future. In addition, during periods of economic downturn in the global economy, our exposure to credit risks from our direct customers may increase, and our efforts to monitor and mitigate the associated risks may not be effective. In the event of non-payment by one or more of our direct customers, our business, financial condition and results of operations could be materially adversely affected.
Our working capital requirements involve estimates based on demand and production expectations and may decrease or increase beyond those currently anticipated, which could harm our results of operations and financial condition.
In order to fulfill the product delivery requirements of our direct and end-use customers, we plan for working capital needs in advance of customer orders. As a result, we base our funding and inventory decisions on estimates of future demand. If demand for our products does not increase as quickly as we have estimated or drops off sharply, our inventory and expenses could rise, and our business and results of operations could suffer. Alternatively, if we experience sales in excess of our estimates, our working capital needs may be higher than those currently anticipated. Our ability to meet this excess customer demand depends on our ability to arrange for additional financing for any ongoing working capital shortages, since it is likely that cash flow from sales will lag behind these investment requirements. In addition, we plan to increase our inventory in order to meet our expected future demand. This would result in an increase in our working capital requirements that could harm our results of operations and financial condition.
Breakdowns, security breaches, loss of data and other disruptions of our information technology systems could compromise sensitive information related to our business, prevent us from accessing critical information and expose us to liability, which would cause our business and reputation to suffer.
In the ordinary course of our business, we collect and store sensitive data, including intellectual property, our proprietary business information and that of our suppliers, customers and business partners, and personally identifiable information about our employees. We manage and maintain our applications and data utilizing on-site and off-site systems. These applications and data encompass a wide variety of business critical information including research and development information, commercial information and business and financial information.
The secure processing, storage, maintenance and transmission of this critical information is vital to our operations and business strategy, and we devote resources to protecting such information. Although we take measures to protect sensitive information from unauthorized access or disclosure, our information technology and infrastructure may be vulnerable to breakdowns, attacks by hackers, viruses, breaches or interruptions due to employee error, malfeasance or other disruptions, or lapses in compliance with privacy and security mandates. Any such virus, breakdown, attack, breach or interruption could compromise our networks and the information stored there could be accessed by unauthorized parties, publicly disclosed, lost or stolen. We have measures in place that are designed to detect and respond to such security incidents and breaches of privacy and security mandates, but there can be no assurance that our management or diligence efforts will prevent such breakdowns or breaches in our systems. Any such access, disclosure or other loss of information could result in legal claims or proceedings, liability under laws that protect the privacy of personal information or other laws, government enforcement actions and regulatory penalties. Unauthorized access, loss or dissemination could also disrupt our operations, customer support services, research and development activities, company financial information, various general and administrative aspects of our business and damage our reputation, any of which could adversely affect our business.
30
Table of Contents
We may incur significant costs complying with environmental, health and safety laws and related claims, and failure to comply with these laws and regulations could expose us to significant liabilities, which could adversely affect our results of operations.
Costs of compliance with regional, national, state and local existing and future environmental, health and safety laws and regulations could adversely affect our cash flow and results of operations. We are required to comply with numerous environmental laws and regulations and to obtain numerous governmental permits in order to operate our facilities and in connection with the design, development, manufacture and transport of our products and the storage, use, handling and disposal of hazardous substances, including environmental, health and safety laws, regulations and permits governing air emissions. We may incur significant additional costs to comply with these requirements. If we fail to comply with these requirements, we could be subject to civil or criminal liability, damages and fines, and our operations could be curtailed or suspended. In addition, certain foreign laws and regulations may affect our ability to export products outside of the United States. Existing environmental, health and safety laws and regulations could be revised or reinterpreted and new laws and regulations could be adopted or become applicable to us or our products, and future changes in environmental, health and safety laws and regulations could occur. These factors may materially increase the amount we must invest to bring our processes into compliance and impose additional expense on our operations.
Among the changes to environmental laws and regulations that could occur is the adoption of regulatory frameworks to reduce greenhouse gas emissions, which a number of countries, particularly in the European Union, have adopted, or are considering adopting. These include adoption of cap and trade regimes, carbon taxes, restrictive permitting, increased efficiency standards, and incentives or mandates for renewable energy, any of which could increase the costs of manufacturing our products and increase our compliance costs, which could materially adversely affect our business and results of operations.
In addition, private lawsuits, including claims for remediation of contamination, personal injury or property damage, or actions by regional, national, state and local regulatory agencies, including enforcement or cost-recovery actions, may materially increase our costs. Certain environmental laws make us potentially liable on a joint and several basis for the remediation of contamination at or emanating from properties or facilities we currently or formerly owned or operated or properties to which we arranged for the disposal of hazardous substances. Such liability may require us to pay more than our fair share and could require us to address contamination caused by others. For example, the site of our East Providence facility contains certain levels of contamination caused by prior third-party activities on and near the site. Such contamination remains in place under a state-approved deed restriction, and we are required to comply with such deed restriction and the accompanying soil management plan. In general, the deed restriction prohibits the residential use of the property and the use of groundwater as potable water, and requires the maintenance of engineering controls and annual inspections to help prevent exposure to contaminated soils. The soil management plan requires us to notify the state environmental agency with respect to any soil excavation, stockpiling, sampling and off-site disposal of excavated soil. Although we have not had to make material expenditures to satisfy these requirements to date, in the future, we may incur additional costs to comply with these requirements and failure to do so could disrupt the operation of our facility or could subject us to liability for environmental remediation. We may incur liability relating to the remediation of contamination, including contamination we did not cause. Furthermore, ethanol, one of the materials that we handle in large quantities in our manufacturing process is subject to additional laws and regulations including those administered by the U.S. Alcohol and Tobacco Tax and Trade Bureau. While we seek to comply with the stringent requirements of these laws and regulations, these laws and regulations are complex and are subject to interpretation. Any changes in these laws or regulations or changes in our manufacturing processes may require us to request changes to our existing permits or obtain new permits. Any requests to change our existing permits or obtain new permits may be delayed or denied and may require us to modify our manufacturing processes, which could be costly and time consuming and could adversely affect our business and results of operations.
31
Table of Contents
We may not be able to obtain or maintain, from time to time, all required environmental regulatory approvals. A delay in obtaining any required environmental regulatory approvals or failure to obtain and comply with them could materially adversely affect our business and results of operations.
We may face certain product liability or warranty claims from our products, including from improper installation of our products by third parties. As a consequence, we could lose existing and future business and our ability to develop, market and sell our insulation could be harmed.
The design, development, production and sale of our products involve an inherent risk of product liability claims and associated adverse publicity. We may be named directly in product liability suits relating to our products, even for defects resulting from errors of our distributors, contractors, OEMs or end-use customers. These claims could be brought by various parties, including distributors, contactors, OEMs and other direct end-use customers who are purchasing products directly from us, or end-use customers who purchase our products from our distributors. We could also be named as co-parties in product liability suits that are brought against the distributors, contractors, OEMs and end-use customers. Our products are often installed in our end-use customers’ complex and capital intensive facilities in inherently hazardous or dangerous environments, including in the energy, petrochemical and power generation industries, where the potential liability from risk of loss could be substantial. The failure of our products to perform to customer expectations, whether or not because of improper installation, could give rise to warranty claims against us. We are currently taking steps to educate our distributors, contractors, OEMs and end-use customers about the proper installation procedures to mitigate the risk of an uncontrolled burn-in for very high temperature applications of Pyrogel XT and XT-E. However, installation of our products is handled by third parties over whom we have no control and errors or defects in their installation may also give rise to claims against us, diminish our brand or divert our resources from other purposes. Any of these claims, even if without merit, could result in costly litigation or divert management’s attention and resources. In addition, many of our products are integrated into the final products of our customers. The integration of our products may entail the risk of product liability or warranty claims based on malfunctions or hazards from both our products and the final products of our customers.
A material product liability claim may seriously harm our results of operations, as well as damage our customer relationships and reputation. Although we carry general liability insurance, our current insurance coverage could be insufficient to protect us from all liability that may be imposed under these types of claims. Insurance coverage is expensive, may be difficult to obtain and may not be available in the future on acceptable terms or at all. Our distributors, contractors, OEMs and end-use customers may not have adequate insurance to cover against potential claims. This insurance may not provide adequate coverage against potential losses, and if claims or losses exceed our liability insurance coverage, we may go out of business. In addition, insurance coverage may become more expensive, which would harm our results of operations.
Our contracts with U.S. government agencies may subject us to audits, criminal penalties, sanctions and other expenses and fines.
We perform contract research services for U.S. government agencies and our products are sold to customers that may incorporate them into government projects. U.S. government agencies, including the Defense Contract Audit Agency and the Department of Labor, routinely audit government contractors. These agencies review a contractor’s compliance with contract terms and conditions, performance under its contracts, cost structure and compliance with applicable laws, regulations and standards. The U.S. government also may review the adequacy of a contractor’s systems and policies, including a contractor’s purchasing, property, estimating, billing, accounting, compensation and management information systems. Any costs found to be overcharged or improperly allocated to a specific contract or any amounts improperly billed or charged for products or services will be subject to reimbursement to the government. As a government contractor, we are required to disclose to the U.S. government credible evidence of certain violations of law and contract overpayments. If we are found to have participated in improper or illegal activities, we may be subject to civil and criminal penalties and administrative sanctions, including termination of contracts, forfeiture of profits, suspension of payments, fines
32
Table of Contents
and suspension or prohibition from doing business with the U.S. government. Any negative publicity related to such contracts, regardless of the accuracy of such publicity, may adversely affect our business or reputation.
Our contracts with U.S. government agencies may not be funded by future appropriations and are subject to modification or termination at any time prior to their completion.
Our contracts with U.S. government agencies are subject to the availability of appropriated funds. The U.S. government funds our contract research work through a variety of funding programs that rely on monies appropriated by Congress. At any point, the availability of funding could change, thus reducing the opportunities for new or continued revenues to us from government contract work. Revenue from contracts with U.S. government agencies constituted 3.0%, 4.7% and 4.8% of total revenue in 2014, 2013 and 2012, respectively. We expect that our revenue under such contracts will continue to decline due to the recent trend toward tightening of federal spending guidelines and programs.
In addition, under our contracts, the U.S. government generally has the right not to exercise options to extend or expand our contracts and may modify, curtail or terminate the contracts at its convenience. Our government customers may not renew our existing contracts after the conclusion of their terms and we may not be able to enter into new contracts with U.S. government agencies. Any decision by the U.S. government not to exercise contract options or to modify, curtail or terminate our contracts or not to renew our contracts or enter into new contracts with us would adversely affect our revenues.
Our revolving credit facility contains financial and operating restrictions that may limit our access to credit. If we fail to comply with covenants in our revolving credit facility, we may be required to repay our indebtedness thereunder, which may have an adverse effect on our liquidity.
Provisions governing our revolving credit facility impose restrictions on our ability to operate, including, for some of the agreements and instruments, but not for others, our ability to:
| • | incur capital expenditures; |
| • | incur additional debt; |
| • | pay dividends and make distributions; |
| • | redeem or repurchase capital stock; |
| • | create liens; |
| • | enter into transactions with affiliates; and |
| • | merge or consolidate with or into other entities. |
Our revolving credit facility also contains other customary covenants. We may not be able to comply with these covenants in the future. Our failure to comply with these covenants may result in the declaration of an event of default and could cause us to be unable to borrow funds under our revolving credit facility. In addition to preventing additional borrowings under our revolving credit facility, an event of default, if not cured or waived, may result in the acceleration of the maturity of indebtedness outstanding under the revolving credit facility, which would require us to pay all amounts outstanding. Such an event may also lead our lenders to exercise their security interest in our assets, including all of our real property and equipment at our East Providence facility. If an event of default occurs, we may not be able to cure it within any applicable cure period, if at all. If the maturity of our indebtedness is accelerated, we may not have sufficient funds available for repayment or we may not have the ability to borrow or obtain sufficient funds to replace the accelerated indebtedness on terms acceptable to us, or at all.
33
Table of Contents
If we lose key personnel upon whom we are dependent, or if we are unable to successfully recruit and retain skilled employees, we may not be able to manage our operations and meet our strategic objectives.
Our continued success depends to a considerable degree upon the continued services of a small number of our employees with critical knowledge of our products, our manufacturing process, our intellectual property, our customers and our global operations. The loss or unavailability of any of these individuals could harm our ability to execute our business plan, maintain important business relationships and complete certain product development initiatives, which could harm our business. In the event that any of these key individuals leave their employment with us or take new employment with a competitor, our business and results of operations could be materially adversely affected. In addition, our continued success depends upon the availability, contributions, vision, skills, experience and effort of our senior management, financial, sales and marketing, engineering and production teams. We do not maintain “key person” insurance on any of our employees. We have entered into employment agreements with certain members of our senior management team, but none of these agreements guarantee the services of the individual for a specified period of time. All of the agreements with members of our senior management team provide that employment is at-will and may be terminated by the employee at any time and without notice.
Although we do not have any reason to believe that we may lose the services of any our employees with critical knowledge of our products, our manufacturing processes, our customers and our global operations or any of our senior management, financial, sales and marketing, engineering and production teams in the foreseeable future, the loss of the services of any of these individuals might impede our operations or the achievement of our strategic and financial objectives. The loss or interruption of the service of any of these individuals or our inability to attract or retain other qualified personnel or advisors could have a material adverse effect on our business, financial condition and results of operations and could significantly reduce our ability to manage our operations and implement our strategy.
Our ability to use our net operating loss carryforwards may be subject to limitation, which could result in a higher effective tax rate and adversely affect our financial condition and results of operations.
We performed analyses pursuant to Section 382 of the Internal Revenue Code of 1986, as amended, or the Internal Revenue Code, as well as similar state provisions, in order to determine whether any limitations might exist on the utilization of net operating losses and other tax attributes. Generally, a change of more than 50% in the ownership of a company’s stock, by value, over a three year period constitutes an ownership change for U.S. federal income tax purposes. An ownership change may limit a company’s ability to use its net operating loss carryforwards attributable to the period prior to such change. Based on these analyses, we determined that it is more likely than not that an ownership change occurred on June 18, 2014 upon the closing of our IPO, resulting in an annual limitation on the use of our net operating losses and other tax attributes as of such date. As a result, our prior net operating losses were limited to $155.2 million, including built-in gains of $42.0 million at the date of that ownership change. The use of our net operating loss carryforwards may be restricted further in the event of any future changes in our ownership.
Risks Related to Our Intellectual Property
Our inability to protect our intellectual property rights could negatively affect our business and results of operations.
Our ability to compete effectively depends in part upon developing, maintaining and/or protecting intellectual property rights relevant to our aerogel product forms, applications, manufacturing technologies and brand names. We rely principally on a combination of patent protection, trade secret laws, confidentiality and nondisclosure agreements, trademark registrations, common law rights and licensing arrangements to establish and protect the intellectual property rights relevant to our business. However, these measures may not be adequate in every given case to permit us to gain or keep any competitive advantage, particularly in those countries where the laws do not protect our proprietary rights as fully as or where the enforcement tools are
34
Table of Contents
weaker or less effective than those in the United States. In particular, since aerogels were developed approximately 80 years ago, there has been a wide range of research, development and publication related to aerogels, which makes it difficult to establish intellectual property rights to many key elements of aerogel technology and to obtain patent protection. Accordingly, much of the general technology that we use in our manufacture of aerogel blankets is not protected by patents.
Where we consider it appropriate, our strategy is to seek patent protection in the United States and other countries on technologies used in or relating to our aerogel product forms, applications and manufacturing technologies. As of December 31, 2014, we had 23 issued U.S. patents and 52 issued foreign patents, including two U.S. patents and 17 foreign patents that we co-own with third parties. The issuance of a patent is not conclusive as to its scope, validity or enforceability. Thus, any patent held by us or to be issued to us from a pending patent application, could be challenged, invalidated or held unenforceable in litigation or proceedings before the U.S. Patent and Trademark Office, or USPTO, and/or other patent tribunals. Third parties could develop technologies that circumvent the patent protection we have secured. No consistent policy regarding the breadth of patent claims has emerged to date in the United States and the landscape could become more uncertain in view of future rule changes by the USPTO, the introduction of patent reform legislation and decisions in patent law cases by the federal courts including the United States Supreme Court.
The patent landscape outside the United States is even less predictable. As a result, the validity and enforceability of patents cannot be predicted with certainty. For example, we are aware of competitors that manufacture and market aerogel insulation products in China, where it may be difficult for us to enforce our intellectual property rights against these or other competitors. In addition, we may fail to apply for patents on important technologies or product candidates in a timely fashion, if at all, and our existing and future patents may not be sufficiently broad to prevent others from practicing our technologies or from developing competing products or technologies, in particular given the long history of aerogel development. Furthermore, third parties could practice our intellectual property rights in territories where we do not have patent protection. Such third parties may then try to import products made using our intellectual property rights into the United States or other countries. Our strategy is to seek registration of trademarks for our brands in many, but not all of the jurisdictions in which we sell our products based on various factors, including our sales volumes in the jurisdiction, our ability to enforce local laws and cost. Our strategy may not be adequate to protect our brands in all circumstances, especially in foreign jurisdictions.
As of December 31, 2014, we had 18 pending U.S. patent applications and 32 pending foreign patent applications, including one pending U.S. patent application and two foreign pending patent applications that we co-own with other third parties. Our pending patent applications are directed to various enabling technologies for the product forms, applications and manufacturing technologies that support our current business, as well as aspects of products under development or contemplated for the future. The issuance of patents from these applications involves complex legal and factual questions and, thus, we cannot provide assurance that any of our pending patent applications will result in the issuance of patents to us. The USPTO, relevant foreign patent offices and other relevant patent tribunals may deny or require significant narrowing of claims in our pending patent applications. Patents issued as a result of any of our pending patent applications may not cover our enabling technology and/or the products or processes that support our current or future business or afford us with significant commercial protection against others with similar technology. Proceedings before the USPTO could result in adverse decisions as to the priority of our inventions and the narrowing or invalidation of claims in issued patents. In addition, our pending patent applications filed in foreign countries are subject to laws, rules and procedures that differ from those of the United States, and thus foreign patent applications may not be granted even if counterpart United States patents are issued.
35
Table of Contents
Patents covering technologies that are similar or superior to our technologies may be developed or obtained by third parties. We may need to seek licenses to these technologies, which could limit our ability to manufacture our products and have a material adverse effect on our business and results of operations.
Competitors or other third parties may independently develop and obtain patents covering technologies that are similar or superior to the product forms, applications or manufacturing technologies that we employ. In such event, we may need to obtain licenses for these technologies. However, we may not be able to obtain licenses on reasonable terms, if at all, which could limit our ability to manufacture our current and/or future products and operate our business.
Our contracts with the U.S. government and other third parties could negatively affect our intellectual property rights.
To further our product development efforts, our scientists and engineers work closely with customers, the U.S. government and other third parties to research and develop advancements in aerogel product forms, applications and manufacturing technologies. We have entered into agreements with private third parties and have been awarded numerous research contracts with the U.S. government to independently or jointly research, design and develop new devices and systems that incorporate aerogel material. We also expect to enter into similar private agreements and be awarded similar government contracts in the future. In some instances, the research and development activities that we conduct under contract with the U.S. government and/or with private third parties may produce intellectual property to which we may not have ownership or exclusive rights and will be unable to protect or monetize.
Moreover, when we develop new technologies using U.S. government funding, the government may obtain certain rights in any resulting patents, technical data and/or other confidential and proprietary information, generally including, at a minimum, a non-exclusive license authorizing the U.S. government to use the invention, technical data or software for non-commercial purposes. Federal government funding may limit when and how we can deploy our technology developed under those contracts. In addition, inventions must be reported promptly to the funding agencies, the federal funding must be disclosed in any resulting patent applications, and our rights in such inventions will normally be subject to government license rights, periodic post-contract utilization reporting, foreign manufacturing restrictions and “march-in” rights. March-in rights refer to the right of the U.S. government to require us to grant a license to the technology to a responsible applicant or, if we refuse, the government may grant the license itself. The U.S. government may exercise its march-in rights if it determines that action is necessary because we fail to achieve practical application of any technology developed under contract with the government or because action is necessary to alleviate health or safety needs, to meet requirements of federal regulations or to give preference to United States industry. The U.S. government may also have the right to disclose our confidential and proprietary information to third parties. In addition, failure to comply with all the government contract requirements may result in us losing the patent rights.
Our U.S. government-sponsored research contracts are also subject to audit and require that we provide regular written technical updates on a monthly, quarterly or annual basis, and, at the conclusion of the research contract, a final report on the results of our technical research. Because these reports are generally available to the public, third parties may obtain some aspects of our confidential and proprietary information relating to our product forms, applications and/or manufacturing processes. If we fail to provide these reports or to provide accurate and complete reports, the U.S. government could obtain rights to any intellectual property arising from the related research.
Furthermore, there could be disputes between us and a private third party as to the ownership rights to any inventions that we develop in collaboration with such third party. Any such dispute may cause us to incur substantial costs, and could place a significant strain on our financial resources, divert the attention of management from our core business and harm our reputation.
36
Table of Contents
We rely on trade secrets to protect our technology, and our failure to obtain or maintain trade secret protection could adversely affect our competitive business position.
We rely in part on trade secret protection to protect confidential and proprietary information relating to our technology, particularly where we do not believe patent protection is appropriate or obtainable. We continue to develop and refine the manufacturing technologies used to produce our aerogel products and believe that we have already developed, and will continue to develop, significant know-how related to these technologies. However, trade secrets can be difficult to protect. We may not be able to maintain the secrecy of this information and competitors may develop or acquire equally or more valuable information related to the manufacture of comparable aerogel products. Our strategy for scale-up of commercial production will continue to require us to share confidential and proprietary information with the U.S. government and other third parties. While we take reasonable efforts to protect our trade secrets, our employees, consultants, contractors or scientific and other advisors, or those of our business partners, may intentionally or inadvertently disclose our confidential and proprietary information to competitors. Any enforcement of claims by us that a third party has obtained and is using our trade secrets is expensive, time consuming and uncertain. In addition, foreign courts are sometimes less willing than United States courts to protect trade secrets.
We require all employees and consultants to execute confidentiality and/or nondisclosure agreements upon the commencement of an employment or consulting arrangement with us, which agreements generally require that all confidential and proprietary information developed by the individual or made known to the individual by us during the course of the individual’s relationship with us be kept confidential and not disclosed to third parties. These agreements further generally provide that inventions conceived by the individual in the course of rendering services to us will be our exclusive property. Nevertheless, these agreements may not be honored and our confidential and proprietary information may be disclosed, or these agreements may be unenforceable or difficult to enforce. We also require customers and vendors to execute confidentiality and/or nondisclosure agreements. However, we have not obtained such agreements from all of our customers and vendors. Moreover, some of our customers may be subject to laws and regulations that require them to disclose information that we would otherwise seek to keep confidential. Our confidential and proprietary information may be otherwise disclosed without our authorization or knowledge. Moreover, third parties could reverse engineer our manufacturing processes, independently develop substantially equivalent confidential and proprietary information or otherwise gain access to our trade secrets. Failure to maintain trade secret protection could enable others to produce competing products and adversely affect our competitive business position.
We could become subject to intellectual property litigation that could be costly, limit or invalidate our intellectual property rights, divert time and efforts away from business operation, require us to pay damages and/or otherwise have an adverse material impact on our business.
The success of our business is highly dependent on protecting our intellectual property rights. Unauthorized parties may attempt to copy or otherwise obtain and use our products and/or enabling technology. Policing the unauthorized use of our intellectual property rights is difficult and expensive, as is enforcing these rights against unauthorized use by others. Identifying unauthorized use of our intellectual property rights is difficult because we may be unable to monitor the technologies and/or materials being employed by other parties. The steps we have taken or will take may not prevent unauthorized use of our intellectual property rights, particularly in foreign countries where enforcement of intellectual property rights may be more difficult than in the United States.
Our continued commercial success will also depend in part upon not infringing the patents or violating other intellectual property rights of third parties. We are aware of patents and patent applications generally relating to aspects of our technologies filed by, and issued to, third parties. Our knowledge of the patent landscape with respect to the technologies currently embodied within our aerogel products and the technologies that we practice in manufacturing those products indicates that the third-party patent rights most relevant to our business are those owned by Cabot and licensed to us under the cross license agreement with Cabot. Nevertheless, we cannot determine with certainty whether patents or patent applications of other parties may materially affect our ability
37
Table of Contents
to conduct our business. There may be existing patents of which we are unaware that we may inadvertently infringe, resulting in claims against us or our customers. In recent years, Chinese, Japanese and South Korean entities have filed a significant number of patent applications related to aerogel products in both their home countries and in foreign countries. These application patents may make it more difficult for OEMs and end-use customers in these countries to use our products in new and different applications, which in turn may limit our ability to penetrate new markets.
In the event that the manufacture, use and/or sale of our products or technologies is challenged, or if our product forms or technologies conflict with patent rights of others or our operations conflict with trademark or similar rights of others, third parties could bring legal actions against us in the United States, Europe or other countries, claiming damages and seeking to enjoin the manufacturing and/or marketing of our products. In addition, it is not possible to predict with certainty what patent claims may arise from pending patent applications of third parties. In the United States, for example, patent prosecution can proceed in secret prior to issuance of a patent, provided such application is not filed in a foreign jurisdiction. For U.S. patent applications that are also filed in foreign jurisdictions, such patent applications will not be published until 18 months from the filing date of the application. As a result, third parties may be able to obtain patents with claims relating to our product forms, applications and/or manufacturing processes which they could attempt to assert against us or our end-users. In either case, litigation may be necessary to enforce, protect or defend our intellectual property rights or to determine the validity and scope of the intellectual property rights of others. Any such litigation could be unsuccessful, cause us to incur substantial costs, divert resources and the efforts of our personnel away from daily operations, harm our reputation and/or result in the impairment of our intellectual property rights. In some cases, litigation may be threatened or brought by a patent holding company (otherwise known as non-practicing entities or patent “trolls”) or other adverse patent owner who has no relevant product revenues and against which our patents may provide little or no deterrence. If we are found to infringe any patents, we could be required to:
| • | pay substantial monetary damages, including lost profits, reasonable royalties and/or treble damages if an infringement is found to be willful; |
| • | totally discontinue or substantially modify any products or processes that are found to be in violation of another party’s intellectual property rights; and/or |
| • | seek a license to continue making and selling our products and/or using our manufacturing processes, which we may not be able to obtain on reasonable terms, if at all, which could significantly increase our operating expenses and/or decrease our revenue. |
If our competitors are able to use our technology without payment to us, our ability to compete effectively could be harmed. Our contracts generally indemnify our customers for third-party claims of intellectual property infringement related to the manufacture and use of our products, and typically up to the amount of the purchase price paid for the product, which could cause us to become involved, and subject to liability, in litigation between our customers and third parties. The expense of defending these claims may adversely affect our results of operations.
Loss of the intellectual property rights that we license from Cabot Corporation would have a material adverse impact on our business.
We have licensed certain intellectual property rights from Cabot under a cross license agreement. These intellectual property rights have been and continue to be critical to the manufacture of our existing products and may also be important to our research, development and manufacture of new products. Any loss of the intellectual property rights granted to us thereunder, including as a result of ineffective protection of such rights by Cabot or a breach of or dispute under the agreement by either party would have a material adverse impact on our financial condition, results of operations and growth prospects, and might prevent us from continuing our business.
38
Table of Contents
Risks Related to Our Common Stock
We have incurred and will continue to incur costs and demands upon management as a result of complying with the laws and regulations affecting public companies in the United States, which may adversely affect our results of operations.
We are subject to the reporting requirements of the Exchange Act that require us to file, among other things, quarterly reports on Form 10-Q and annual reports on Form 10-K. Under Section 302 of the Sarbanes-Oxley Act of 2002, or the Sarbanes-Oxley Act, as a part of each of these reports, our chief executive officer and chief financial officer are required to evaluate and report their conclusions regarding the effectiveness of our disclosure controls and procedures and to certify that they have done so. Effective internal controls are necessary for us to provide reliable financial reports and prevent fraud. In addition, under Section 404 of the Sarbanes-Oxley Act, we will be required to include a report of management on our internal control over financial reporting in our Form 10-K, beginning with our Form 10-K for our fiscal year ending December 31, 2015. In addition, upon the later of our second annual report or the first annual report required to be filed with the SEC following the date we are no longer an “emerging growth company” as defined in the Jumpstart Our Business Startups Act, or JOBS Act, the independent registered public accounting firm auditing our financial statements will be required to attest to and report on the effectiveness of our internal control over financial reporting. The process of improving and documenting our internal controls and complying with Section 404 will be expensive and time consuming, and will require significant attention of management.
Complying with these and other requirements applicable to public companies may place a strain on our personnel, information technology systems and resources and divert management’s attention from other business concerns. We may need to hire additional accounting and financial staff with appropriate public company experience and technical accounting knowledge, and we may not be able to do so without incurring additional costs.
These and other requirements may also make it more difficult or more costly for us to obtain or maintain certain types of insurance, including directors’ and officers’ liability insurance. We may be forced to accept reduced policy limits and coverage or incur substantially higher costs to obtain the same or similar coverage.
The impact of these requirements could also make it more difficult for us to attract and retain qualified persons to serve on our board of directors, our board committees or as executive officers. Any one of these requirements could have a material adverse effect on our business, financial condition and results of operations.
Because we are a public company, we are obligated to develop and maintain proper and effective internal control over financial reporting. If our internal controls over financial reporting are determined to be ineffective, or if our auditors are otherwise unable to attest to their effectiveness when required, investor confidence in our company, and our common stock price, may be adversely affected.
We will be required, pursuant to Section 404 of the Sarbanes-Oxley Act, to furnish a report by management on, among other things, the effectiveness of our internal control over financial reporting for the first fiscal year beginning after the completion of our initial public offering, which will be for the fiscal year ending December 31, 2015, and in each year thereafter. Our independent registered public accounting firm will not be required to formally attest to the effectiveness of our internal control over financial reporting until the later of our second annual report or the first annual report required to be filed with the SEC following the date we are no longer an “emerging growth company,” as defined in the JOBS Act. These assessments will be required to include disclosure of any material weaknesses identified by our management in our internal control over financial reporting.
Although our independent registered public accounting firm has not completed an audit of our internal controls over financial reporting, significant deficiencies in internal controls were identified in connection with the preparation of our financial statements for the fiscal years ended December 31, 2013 and 2014. We determined
39
Table of Contents
that we had significant deficiencies relating to our need for additional accounting and financial reporting staff and internal controls over financial reporting for income taxes. We have taken actions to remediate these significant deficiencies, including the retention of external consultants to provide additional resources and hiring an additional full-time financial and accounting staff person during the year ended December 31, 2014. We cannot assure you that there will not be material weaknesses or other significant deficiencies in our internal controls in the future.
We are in the very early stages of the costly and challenging process of compiling our system of internal controls over financial reporting and processing documentation necessary to perform the evaluation needed to comply with Section 404. We may discover, and not be able to remediate, future significant deficiencies or material weaknesses. We may not be able to complete our evaluation, testing and any required remediation in a timely fashion, any of which would make us less likely to detect or prevent fraud. During the evaluation and testing process, if we identify one or more material weaknesses in our internal controls over financial reporting, we will be unable to assert that our internal controls are effective. If we are unable to assert that our internal controls over financial reporting are effective, we could lose investor confidence in the accuracy and completeness of our financial reports or it could cause us to fail to meet our reporting obligations, which could have a material adverse effect on the price of our common stock. In addition, a delay in compliance with Section 404 could subject us to a variety of administrative sanctions, including SEC action, ineligibility for short form resale registration, the suspension or delisting of our common stock from The New York Stock Exchange, and the inability of registered broker-dealers to make a market in our common stock, which would further reduce our stock price and could harm our business.
We are eligible to be treated as an “emerging growth company” as defined in the JOBS Act, and we cannot be certain if the reduced disclosure requirements applicable to emerging growth companies makes or will make our common stock less attractive to investors.
We are an “emerging growth company”, as defined in the JOBS Act. For as long as we continue to be an emerging growth company, we may take advantage of exemptions from various reporting requirements that are applicable to other public companies that are not emerging growth companies, including:
| • | not being required to comply with the auditor attestation requirements of Section 404 of the Sarbanes-Oxley Act, as described above; |
| • | reduced disclosure obligations regarding executive compensation in our periodic reports and proxy statements; and |
| • | exemptions from the requirements of holding a nonbinding advisory vote on executive compensation and stockholder approval of any golden parachute payments not previously approved. |
We will remain an emerging growth company until the earliest to occur of (i) the end of the fiscal year for which we report $1.0 billion or more in annual revenues, (ii) the end of the fiscal year in which the market value of our common stock held by non-affiliates exceeds $700 million on the last business day of our second fiscal quarter, (iii) our issuance, in a three year period, of more than $1.0 billion of non-convertible debt, and (iv) December 31, 2019. Even after we no longer qualify as an emerging growth company, we may still qualify as a “smaller reporting company” which would allow us to take advantage of many of the same exemptions from disclosure requirements, including not being required to comply with the auditor attestation requirements of Section 404 of the Sarbanes-Oxley Act and reduced disclosure obligations regarding executive compensation in our periodic reports and proxy statements. We cannot predict if investors find or will find our common stock less attractive because we may rely on these exemptions. If some investors find our common stock less attractive as a result, there may be a less active trading market for our common stock and our stock price may be more volatile.
40
Table of Contents
The trading market in our common stock has been limited and substantially less liquid than the average trading market for a stock quoted on The New York Stock Exchange.
Since our initial listing on The New York Stock Exchange on June 13, 2014, the trading market in our common stock has been limited and substantially less liquid than the average trading market for companies listed on The New York Stock Exchange. The listing of our common stock on The New York Stock Exchange does not assure that a meaningful, consistent and liquid trading market currently exists or will exist in the future. We cannot predict whether a more active market for our common stock will develop in the future. An absence of an active trading market could adversely affect our stockholders’ ability to sell our common stock at current market prices in short time periods, or possibly at all. An inactive market may also impair our ability to raise capital by selling our common stock and may impair our ability to acquire other companies, products or technologies by using our common stock as consideration. Additionally, analyst coverage of our common stock may be limited and such lack of coverage may have a depressive effect on the market price for our common stock. As of December 31, 2014, approximately 59% of our outstanding shares of common stock were held by our executive officers, directors, principal stockholders and their respective affiliates, which may adversely affect the liquidity of the trading market for our common stock, in as much as federal securities laws restrict sales of our shares by these stockholders. If our affiliates continue to hold their shares of common stock, there will be a more limited trading volume in our common stock, which may make it more difficult for investors to sell their shares or increase the volatility of our stock price.
We expect that the price of our common stock will fluctuate substantially which could subject us to securities class action litigation and result in substantial losses to our stockholders.
The price of our common stock may fluctuate substantially due to a number of factors, including the following, some of which are beyond our control:
| • | volume and timing of orders for our products; |
| • | quarterly and yearly variations in our or our competitors’ results of operations; |
| • | our announcement or our competitors’ announcements regarding new products, product enhancements, significant contracts, number of distributors, acquisitions or strategic investments; |
| • | announcements of technological innovations relating to aerogels, thermal management and energy infrastructure insulation; |
| • | results of operations that vary from the expectations of securities analysts and investors; |
| • | the periodic nature of our sales cycles, in particular for capital projects in the industrial markets; |
| • | our ability to develop, obtain regulatory clearance or approval for and market new and enhanced products on a timely basis; |
| • | future sales of our common stock, including sales by our executive officers, directors and significant stockholders and their respective affiliates; |
| • | announcements by third parties of significant claims or proceedings against us, including with regards to intellectual property and product liability; |
| • | changes in accounting principles; and |
| • | general U.S. and global economic conditions and other factors, including factors unrelated to our operating performance or the operating performance of our competitors. |
Furthermore, the U.S. stock market has at times experienced extreme volatility that in some cases has been unrelated or disproportionate to the operating performance of particular companies. These broad market and industry fluctuations may adversely affect the market price of our common stock, regardless of our actual operating performance.
41
Table of Contents
In the past, following periods of market volatility, stockholders have instituted securities class action litigation. If we become involved in securities litigation, it could have a substantial cost and divert resources and the attention of our senior management team from our business regardless of the outcome of such litigation.
Securities analysts may not continue coverage of our common stock or may issue negative reports, which may have a negative impact on the market price of our common stock.
The trading market for our common stock relies in part on the research and reports that industry or financial analysts publish about us or our business. Securities analysts may elect not to provide research coverage of our common stock. If securities analysts do not cover or continue to cover our common stock, the lack of research coverage may cause the market price of our common stock to decline. If one or more of the analysts who elects to cover us downgrades our stock, our stock price would likely decline substantially. If one or more of these analysts ceases coverage of us, we could lose visibility in the market, which in turn could cause our stock price to decline. In addition, rules mandated by the Sarbanes-Oxley Act and a global settlement reached in 2003 between the SEC, other regulatory agencies and a number of investment banks have led to a number of fundamental changes in how analysts are reviewed and compensated. In particular, many investment banking firms are required to contract with independent financial analysts for their stock research. It may be difficult for companies such as ours, with smaller market capitalizations, to attract independent financial analysts that will cover our common stock. This could have a negative effect on the market price of our stock.
Our directors, officers and principal stockholders have significant voting power and may take actions that may not be in the best interests of our other stockholders.
As of December 31, 2014, our executive officers, directors and principal stockholders and their affiliates collectively controlled approximately 59% of our outstanding shares of common stock without giving effect to the voting waiver by the Fidelity Funds referenced in the immediately subsequent risk factor. As a result, these stockholders, if they act together, will be able to control the management and affairs of our company and most matters requiring stockholder approval, including the election of directors and approval of significant corporate transactions. This concentration of ownership may have the effect of delaying or preventing a change of control and might adversely affect the market price of our common stock. This concentration of ownership may not be in the best interests of our other stockholders.
Anti-takeover provisions in our restated certificate of incorporation and restated bylaws, and Delaware law, could delay or discourage a takeover.
Anti-takeover provisions in our restated certificate of incorporation and restated bylaws and Delaware law may have the effect of deterring or delaying attempts by our stockholders to remove or replace management, engage in proxy contests and effect changes in control. The provisions of our charter documents include:
| • | procedures for advance notification of stockholder nominations and proposals; |
| • | the inability of our stockholders to call a special meeting of the stockholders and the inability of our stockholders to act by written consent; |
| • | the ability of our board of directors to create new directorships and to fill any vacancies on the board of directors; |
| • | the ability of our board of directors to amend our restated bylaws without stockholder approval; and |
| • | the ability of our board of directors to issue up to 5,000,000 shares of preferred stock without stockholder approval upon the terms and conditions and with the rights, privileges and preferences as our board of directors may determine. |
42
Table of Contents
Further, as a result of the agreement we entered into with the Fidelity Funds in June 2014 whereby the Fidelity Funds have waived their right to vote with respect to any shares they or their affiliates possess in excess of 14.9% of our total outstanding shares, it could be more difficult for stockholders to achieve any specific percentage voting threshold. Based on the Schedule 13G/A filed by Fidelity Funds on February 13, 2015, we believe the Fidelity Funds beneficially owned approximately 29.5% of our outstanding shares of common stock as of December 31, 2014 and, as a result, approximately 14.6% of our shares of common stock will not be voted for so long as such shares continue to be held by the Fidelity Funds.
In addition, as a Delaware corporation, we are subject to Delaware law, including Section 203 of the Delaware General Corporation Law. In general, Section 203 prohibits a Delaware corporation from engaging in any business combination with any interested stockholder for a period of three years following the date that the stockholder became an interested stockholder unless certain specific requirements are met as set forth in Section 203. These provisions, alone or together, could have the effect of deterring or delaying changes in incumbent management, proxy contests or changes in control.
Our restated certificate of incorporation designates a state or federal court located within the State of Delaware as the exclusive forum for certain types of actions and proceedings that may be initiated by our stockholders, which could limit our stockholders’ ability to obtain a favorable judicial forum for disputes with us or our directors, officers of employees.
Our restated certificate of incorporation provides that, subject to limited exceptions, a state or federal court located within the State of Delaware will be the exclusive forum for (1) any derivative action or proceeding brought on our behalf, (2) any action asserting a claim of breach of a fiduciary duty owed by any of our directors, officers or other employees to us or our stockholders, (3) any action asserting a claim against us arising pursuant to any provision of the Delaware General Corporation Law, our restated certificate of incorporation or our bylaws, or (4) any other action asserting a claim against us that is governed by the internal affairs doctrine. Any person or entity purchasing or otherwise acquiring any interest in shares of our capital stock shall be deemed to have notice of and to have consented to the provisions of our restated certificate of incorporation described above. This choice of forum provision may limit a stockholder’s ability to bring a claim in a judicial forum that it finds favorable for disputes with us or our directors, officers or other employees, which may discourage such lawsuits against us and our directors, officers and employees. Alternatively, if a court were to find these provisions of our restated certificate of incorporation inapplicable to, or unenforceable in respect of, one or more of the specified types of actions or proceedings, we may incur additional costs associated with resolving such matters in other jurisdictions, which could adversely affect our business and financial condition.
You may experience future dilution as a result of future equity offerings.
In the future, we may offer additional shares of our common stock or other securities convertible into or exchangeable for our common stock in order to raise additional capital. We cannot assure you that we will be able to sell shares or other securities in any other offering at a price per share that is equal to or greater than the price per share you paid for our shares. Investors purchasing shares or other securities in the future could have rights, preferences or privileges senior to those of existing stockholders and you may experience dilution. You may incur additional dilution upon the exercise of any outstanding stock options or warrants or vesting of restricted stock or other equity awards.
We do not intend to pay cash dividends in the foreseeable future and, consequently, your ability to achieve a return on your investment will depend on appreciation in the price of our common stock.
We have never declared or paid cash dividends on our common stock and we do not intend to pay any cash dividends on our common stock in the foreseeable future. We currently expect to retain all available funds and any future earnings for use in the operation and expansion of our business. In addition, the terms of our revolving credit facility restrict our ability to pay dividends and any future credit facilities, loan agreements, debt instruments or
43
Table of Contents
other agreements may further restrict our ability to pay dividends. Payments of future dividends, if any, will be at the discretion of our board of directors after taking into account various factors, including our business, results of operations and financial condition, current and anticipated cash needs, plans for expansion and any legal or contractual limitations on our ability to pay dividends. As a result, capital appreciation, if any, of our common stock will be your sole source of potential gain for the foreseeable future.
44
Table of Contents
CAUTIONARY STATEMENT REGARDING FORWARD-LOOKING STATEMENTS
This report includes forward-looking statements within the meaning of Section 27A of the Securities Act of 1933, as amended, or the Securities Act, and Section 21E of the Exchange Act that relate to future events or our future financial performance and involve known and unknown risks, uncertainties and other factors that may cause our actual results, levels of activity, performance or achievements to differ materially from any future results, levels of activity, performance or achievements expressed or implied by these forward-looking statements. Words such as, but not limited to, “believe,” “expect,” “anticipate,” “estimate,” “intend,” ”seek,” “may,” “plan,” “potential,” “predict,” “project,” “targets,” “likely,” “will,” “would,” “could,” “should,” “continue,” and similar expressions or phrases, or the negative of those expressions or phrases, are intended to identify forward-looking statements, although not all forward-looking statements contain these identifying words. Although we believe that we have a reasonable basis for each forward-looking statement contained in this report, we caution you that these statements are based on our projections of the future that are subject to known and unknown risks and uncertainties and other factors that may cause our actual results, level of activity, performance or achievements expressed or implied by these forward-looking statements, to differ. The description of our Business set forth in Item 1, the Risk Factors set forth in this Item 1A and our Management’s Discussion and Analysis of Financial Condition and Results of Operations set forth in Item 7 as well as other sections in this report, discuss some of the factors that could contribute to these differences. These forward-looking statements include, among other things, statements about:
| • | the expected future growth of the market for aerogel insulation and continued gain in market share, in particular in energy infrastructure facilities; |
| • | our expectation that the growth in global energy demand will result in increased new-build and large capacity expansion projects, driving demand for our aerogel products; |
| • | our plans to continue our strategy of working with innovative companies to target and penetrate additional market opportunities; |
| • | our belief that an adequate long-term supply of silica-precursor is available; |
| • | our belief that our portfolio of patents, trade secrets and know-how presents a significant barrier to potential new entrants in the production of aerogel blanket insulation; |
| • | our belief that our products possess strong competitive advantages over traditional insulation materials, including the superior thermal performance and the thin, easy-to-use and durable blanket form of our products; |
| • | our expectation that we will commence operation in our planned third production line during the second quarter of 2015; |
| • | our expectation that our planned third production line will increase our annual nameplate capacity by 25% to 50 million to 55 million square feet of aerogel blankets; |
| • | our plans to construct a second manufacturing facility in the United States, the exact location of which will be based on factors including, among others, labor and construction costs, availability of governmental incentives, protection of intellectual property and proximity to raw material suppliers; |
| • | our expectation that the first production line at the planned second manufacturing facility will become operational during 2017; |
| • | our belief that our end-use customers will continue to invest in major energy infrastructure projects; |
| • | our expectation that we will continue to sell our products in the building and constructions and other end markets; |
| • | our estimate that design, development and construction costs for this second manufacturing facility and its first production line will range from $80 million to $100 million; |
45
Table of Contents
| • | our expectation that our planned second manufacturing facility and its first production line will provide an additional annual nameplate capacity of 26 million to 28 million square feet of aerogel blankets; |
| • | our belief that we can finance our planned second manufacturing facility and its first production line with anticipated cash flows from operations, local government grants, debt financings and potentially equity financings; |
| • | our belief that the potential for significant technological innovation in traditional insulation materials is limited and that new high-performance materials will be required to meet evolving market requirements for energy efficient insulations systems; |
| • | our belief that our aerogel products and manufacturing processes are proprietary and that we can protect our patents, trade secrets and know-how associated therewith; |
| • | our belief that we can continue to improve the cost efficiency of our manufacturing process; |
| • | our belief that our products have the lowest cost on a fully-installed basis or offer significant life-cycle cost savings in energy infrastructure and certain other applications as compared to traditional insulation materials; |
| • | our plans to expand our sales force globally to support anticipated growth in customers and demand for our products; |
| • | our expectation to continue to hire a significant number of employees in order to support our anticipated growth; |
| • | our expectations for certain expenses to decrease as a percentage of revenue in the long-term and for certain expenses to decrease during 2015; |
| • | our expectation that the cost of product revenue will increase in the near term, but will decrease in the long-term and that the cost of product revenue as a percentage of product revenue will decrease during 2015; |
| • | our expectations that gross profit as a percentage of total revenue will increase in the long-term and that the gross profit as a percentage of total revenue will increase during 2015; |
| • | the expected future development of new aerogel technologies; and |
| • | our expectations about limitations of net operating losses. |
We may not actually achieve the plans, intentions or expectations disclosed in our forward-looking statements, and you should not place undue reliance on our forward-looking statements. Actual results or events could differ materially from the plans, intentions and expectations disclosed in the forward-looking statements we make. We have included important cautionary statements in this report, particularly in the Risk Factors set forth in Item 1A of this Annual Report on Form 10-K, that we believe could cause actual results or events to differ materially from the forward-looking statements that we make. Our forward-looking statements do not reflect the potential impact of any future acquisitions, mergers, dispositions, joint ventures or investments we may make.
You should read this report and the documents that we reference in this report and have filed as exhibits to this report completely and with the understanding that our actual future results may be materially different from what we expect. The forward-looking statements contained in this report are made as of the date of this report, and we do not assume, and specifically disclaim, any obligation to update any forward-looking statements, whether as a result of new information, future events or otherwise.
46
Table of Contents
| Item 1B. | UNRESOLVED STAFF COMMENTS |
None.
| Item 2. | PROPERTIES |
Our corporate headquarters are located in Northborough, Massachusetts, where we occupy approximately 83,000 square feet under a lease expiring on December 31, 2016. We also own an approximately 143,000 square foot manufacturing facility in East Providence, Rhode Island. In addition, we lease a 24,000 square foot facility and a 128,000 square foot facility both located in East Providence, Rhode Island, which leases expire on February 29, 2016 and March 31, 2019, respectively. We intend to construct a second manufacturing facility to be located in the United States.
| Item 3. | LEGAL PROCEEDINGS |
We are not currently a party to any material legal proceedings.
| Item 4. | MINE SAFETY DISCLOSURES |
Not applicable.
47
Table of Contents
| Item 5. | MARKET FOR REGISTRANT’S COMMON EQUITY, RELATED STOCKHOLDER MATTERS AND ISSUER PURCHASES OF EQUITY SECURITIES |
Market Information and Dividend Policy
Our common stock began trading on The New York Stock Exchange, or NYSE, on June 13, 2014 under the symbol “ASPN.” The following table sets forth, for the period indicated, the high and low sales prices of our common stock as reported by the NYSE since our IPO:
| 2014 | High | Low | ||||||
| Second Quarter (beginning June 13, 2014) |
$ | 11.74 | $ | 10.25 | ||||
| Third Quarter |
$ | 11.56 | $ | 8.04 | ||||
| Fourth Quarter |
$ | 10.50 | $ | 6.46 | ||||
As of March 2, 2015, there were 105 stockholders of record of our common stock. We have not paid dividends to our stockholders since our inception and we do not plan to pay cash dividends in the foreseeable future. We currently intend to retain earnings, if any, to finance the development and expansion of our business.
Stock Performance Graph
The following graph and table compare the cumulative total stockholder return for our common stock during the period from June 13, 2014 (the date our common stock commenced trading on the NYSE) through December 31, 2014 in comparison to the S&P Oil & Gas Equipment Select Industry Index and the Russell 2000. The graph and the table below assume (i) that $100 was invested at the market close on June 13, 2014 in the common stock of Aspen Aerogels, Inc., the S&P Oil & Gas Equipment Select Industry Index and the Russell 2000, and (ii) reinvestment of dividends. The comparisons in the graph and table are required by the SEC and are not intended to be indicative of the possible future performance of our common stock.
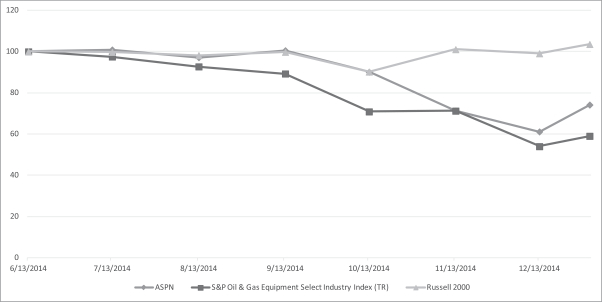
48
Table of Contents
Unregistered Sales of Equity Securities and Use of Proceeds
(a) Unregistered Sales of Equity Securities. Not applicable.
(b) Use of Proceeds from Initial Public Offering of Common Stock. We registered shares of our common stock in connection with our initial public offering pursuant to a registration statement on Form S-1 (File No. 333-195523), which was declared effective by the SEC on June 12, 2014, and a registration statement on Form S-1 (File No. 333-196719) filed pursuant to Rule 462(b) of the Securities Act.
We received aggregate net proceeds from the offering of approximately $74.7 million, after deducting $4.3 million of underwriting discounts and approximately $3.5 million of offering expenses.
As of December 31, 2014, we used $19.8 million of the net proceeds of the offering to repay all amounts outstanding under our subordinated notes and our revolving credit facility and $11.3 million of the net proceeds of the offering for capital expenditures. The remainder of the net proceeds is held in a deposit account and money market account with a major financial institution in North America. We have broad discretion in the use of the net proceeds from our initial public offering and could spend the proceeds in ways that do not improve our results of operations or enhance the value of our stock. There has been no material change in our planned use of the balance of the net proceeds from the offering as described in our final prospectus filed with the SEC on June 16, 2014.
(c) Purchases of Equity Securities By the Issuer and Affiliated Purchasers. We did not repurchase any of our equity securities during the year ended December 31, 2014.
| Item 6. | SELECTED FINANCIAL DATA |
The following table sets forth our selected consolidated financial data for the periods, and as of the dates, indicated. You should read the following selected consolidated financial data in conjunction with our consolidated financial statements and the related notes thereto included elsewhere in this Annual Report on Form 10-K and the “Management’s Discussion and Analysis of Financial Condition and Results of Operations” section of this Annual Report on Form 10-K.
We derived the consolidated statement of operations data for the years ended December 31, 2014, 2013 and 2012, and the consolidated balance sheet data as of December 31, 2014 and 2013, from our audited consolidated financial statements and the related notes thereto included elsewhere in this Annual Report. We derived the consolidated statement of operations data for the fiscal years ended December 31, 2011 and 2010, and the consolidated balance sheet data as of December 31, 2012, 2011 and 2010, from our audited consolidated financial statements and the related notes thereto that are not included in this Annual Report.
49
Table of Contents
| Year Ended December 31 | ||||||||||||||||||||
| 2014 | 2013 | 2012 | 2011 | 2010 | ||||||||||||||||
| Consolidated statements of operations data: |
||||||||||||||||||||
| Revenue: |
||||||||||||||||||||
| Product |
$ | 99,259 | $ | 82,057 | $ | 60,389 | $ | 42,717 | $ | 38,690 | ||||||||||
| Research services |
3,140 | 4,037 | 3,064 | 3,233 | 4,519 | |||||||||||||||
|
|
|
|
|
|
|
|
|
|
|
|||||||||||
| Total revenue |
102,399 | 86,094 | 63,453 | 45,950 | 43,209 | |||||||||||||||
| Cost of revenue: |
||||||||||||||||||||
| Product |
83,677 | 73,399 | 70,025 | 47,071 | 35,399 | |||||||||||||||
| Research services |
1,642 | 1,964 | 1,396 | 1,505 | 2,119 | |||||||||||||||
|
|
|
|
|
|
|
|
|
|
|
|||||||||||
| Gross profit (loss) |
17,080 | 10,731 | (7,968 | ) | (2,626 | ) | 5,691 | |||||||||||||
| Operating expenses: |
||||||||||||||||||||
| Research and development |
5,980 | 5,159 | 5,142 | 4,085 | 2,985 | |||||||||||||||
| Sales and marketing |
10,290 | 9,271 | 8,564 | 5,565 | 4,526 | |||||||||||||||
| General and administrative |
16,853 | 12,833 | 11,299 | 8,291 | 5,675 | |||||||||||||||
| Write-off of construction in progress |
— | 3,440 | — | — | — | |||||||||||||||
|
|
|
|
|
|
|
|
|
|
|
|||||||||||
| Total operating expenses |
33,123 | 30,703 | 25,005 | 17,941 | 13,186 | |||||||||||||||
|
|
|
|
|
|
|
|
|
|
|
|||||||||||
| Income (loss) from operations |
(16,043 | ) | (19,972 | ) | (32,973 | ) | (20,567 | ) | (7,495 | ) | ||||||||||
| Other income (expense): |
||||||||||||||||||||
| Interest income (expense) |
(50,281 | ) | (30,599 | ) | (21,790 | ) | (8,822 | ) | (2,415 | ) | ||||||||||
| Gain on extinguishment of convertible notes |
— | 8,898 | — | — | — | |||||||||||||||
| Loss on exchange of convertible notes |
— | (5,697 | ) | — | — | — | ||||||||||||||
| Debt extinguishment costs |
— | — | (1,379 | ) | — | — | ||||||||||||||
| Costs associated with postponed public offering |
— | (241 | ) | — | (3,443 | ) | — | |||||||||||||
|
|
|
|
|
|
|
|
|
|
|
|||||||||||
| Total other income (expense), net |
(50,281 | ) | (27,639 | ) | (23,169 | ) | (12,265 | ) | (2,415 | ) | ||||||||||
|
|
|
|
|
|
|
|
|
|
|
|||||||||||
| Net income (loss) |
(66,324 | ) | (47,611 | ) | (56,142 | ) | (32,832 | ) | (9,910 | ) | ||||||||||
|
|
|
|
|
|
|
|
|
|
|
|||||||||||
| Accretion (deemed dividends) on preferred stock |
— | (996 | ) | 47,201 | (23,665 | ) | (57,007 | ) | ||||||||||||
| Extinguishment of redeemable feature for convertible preferred stock |
— | 86,161 | — | — | — | |||||||||||||||
| Earnings attributable to preferred stock shareholders |
— | (36,216 | ) | — | — | — | ||||||||||||||
|
|
|
|
|
|
|
|
|
|
|
|||||||||||
| Net income (loss) attributable to common stockholders |
$ | (66,324 | ) | $ | 1,338 | $ | (8,941 | ) | $ | (56,497 | ) | $ | (66,917 | ) | ||||||
|
|
|
|
|
|
|
|
|
|
|
|||||||||||
| Per share data: |
||||||||||||||||||||
| Net income (loss) attributable to common stockholders per share: |
||||||||||||||||||||
| Basic |
$ | (5.37 | ) | $ | 426.52 | $ | (2,851.08 | ) | $ | (18,248.39 | ) | $ | (21,882.60 | ) | ||||||
|
|
|
|
|
|
|
|
|
|
|
|||||||||||
| Diluted |
$ | (5.37 | ) | $ | 410.56 | $ | (2,851.08 | ) | $ | (18,248.39 | ) | $ | (21,882.60 | ) | ||||||
|
|
|
|
|
|
|
|
|
|
|
|||||||||||
| Weighted-average common shares outstanding: |
||||||||||||||||||||
| Basic |
12,349,456 | 3,137 | 3,136 | 3,096 | 3,058 | |||||||||||||||
|
|
|
|
|
|
|
|
|
|
|
|||||||||||
| Diluted |
12,349,456 | 3,259 | 3,136 | 3,096 | 3,058 | |||||||||||||||
|
|
|
|
|
|
|
|
|
|
|
|||||||||||
50
Table of Contents
| As of December 31 | ||||||||||||||||||||
| 2014 | 2013 | 2012 | 2011 | 2010 | ||||||||||||||||
| Consolidated balance sheet data: |
||||||||||||||||||||
| Cash |
$ | 49,719 | $ | 1,574 | $ | 1,343 | $ | 11,241 | $ | 26,800 | ||||||||||
| Working capital (1) |
53,168 | (3,370 | ) | 1,132 | 12,532 | 24,723 | ||||||||||||||
| Total assets |
145,043 | 90,233 | 95,301 | 102,154 | 88,795 | |||||||||||||||
| Total debt |
165 | 138,555 | 110,083 | 60,462 | 8,139 | |||||||||||||||
| Redeemable preferred stock |
— | — | 86,250 | 133,451 | 109,786 | |||||||||||||||
| Total stockholders’ equity (deficit) |
123,716 | (61,966 | ) | (120,795 | ) | (113,513 | ) | (58,103 | ) | |||||||||||
| (1) | Working capital means current assets minus current liabilities. |
| Item 7. | MANAGEMENT’S DISCUSSION AND ANALYSIS OF FINANCIAL CONDITION AND RESULTS OF OPERATIONS |
The following discussion of our financial condition and results of operations should be read in conjunction with the “Selected Financial Data” and our consolidated financial statements and the related notes thereto included in this Annual Report on Form 10-K. In addition to historical information, some of the information contained in the following discussion and analysis or set forth elsewhere in this reporting, including information with respect to our plans and strategy for our business, includes forward looking information that involves risks, uncertainties and assumptions. You should read the Risk Factors set forth in Item 1A of this Annual Report on Form 10-K for a discussion of important factors that could cause actual results to differ materially from the results described in or implied by the forward-looking statements contained in the following discussion and analysis. Our actual results and the timing of events could differ materially from those anticipated by these forward looking statements.
Overview
We design, develop and manufacture innovative, high-performance aerogel insulation. We believe our aerogel blankets deliver the best thermal performance of any widely used insulation product available on the market today and provide a combination of performance attributes unmatched by traditional insulation materials. Our end-use customers select our products where thermal performance is critical and to save money, reduce energy use, preserve operating assets and protect workers.
Our insulation is used by oil producers and the owners and operators of refineries, petrochemical plants, LNG facilities, power generating assets and other energy infrastructure. Our Pyrogel and Cryogel product lines were introduced in 2008 and have undergone rigorous technical validation by industry leading end-users and achieved significant market adoption. We also derive product revenue from the building and construction and other end markets. Customers in these markets use our aerogels for applications as diverse as wall systems, military and commercial aircraft, trains, buses, appliances, apparel, footwear and outdoor gear.
We generate product revenue through the sale of our line of aerogel blankets. We market and sell our products primarily through a sales force based in North America, Europe and Asia. The efforts of our sales force are supported by a small number of sales consultants with extensive knowledge of a particular market or region. Our sales force is responsible for establishing and maintaining customer and partner relationships, delivering highly technical information and ensuring high-quality customer service.
Our salespeople work directly with end-use customers and engineering firms to promote qualification, specification and acceptance of our products. We also rely on an existing and well-established channel of qualified insulation distributors and contractors in more than 30 countries around the world that ensures rapid delivery of our products and strong end-user support. Our salespeople also work to educate insulation contractors about the technical and operating cost advantages of our aerogel blankets.
51
Table of Contents
We also perform research services under contracts with various agencies of the U.S. government, including the Department of Defense and the Department of Energy, and other institutions. Research performed under contract with government agencies and other institutions enables us to develop and leverage technologies into broader commercial applications.
We manufacture our products using our proprietary process and technology at our facility in East Providence, Rhode Island. We have operated the East Providence facility since 2008. We commenced operation of a second production line at this facility during 2011, which doubled our annual nameplate capacity to 40 million to 44 million square feet of aerogel blankets, depending on product mix. We commenced construction of a third production line in the East Providence facility during 2014 with a total construction cost estimate of $30.8 million, which includes previously constructed assets of approximately $4.3 million and new design and construction costs of approximately $26.5 million. We have expended an aggregate of $22.7 million for the construction of the third production line as of December 31, 2014. We expect that this third production line will increase our annual nameplate capacity by 10 million to 11 million square feet of aerogel blankets when operation commences during the second quarter of 2015.
Our revenue for the year ended December 31, 2014 was $102.4 million, which represented an increase of 19% from the year ended December 31, 2013. Net loss for the year ended December 31, 2014 was $66.3 million and diluted loss per share attributable to common stockholders was $5.37. Net loss for the year ended December 31, 2014 included a total of $38.8 million of charges or $3.14 per share attributable to common stockholders related to expenses recorded in connection with the closing of our initial public offering including (i) initial recognition of compensation cost of performance-based stock options of $5.6 million, and (ii) accretion of convertible notes to final conversion value of $33.2 million.
Key Metrics and Non-GAAP Financial Measures
We regularly review a number of metrics, including the following key metrics, to evaluate our business, measure our performance, identify trends affecting our business, formulate financial projections and make strategic decisions.
Square Foot Operating Metric
We price our product and measure our product shipments in square feet. We estimate our annual production capacity was 40 million to 44 million square feet of aerogel blankets depending on product mix at December 31, 2014. We believe the square foot operating metric allows us and our investors to measure the growth in our manufacturing capacity and product shipments on a uniform and consistent basis. The following chart sets forth product shipments associated with recognized revenue in square feet for the periods presented:
| Year Ended December 31 | ||||||||||||
| 2014 | 2013 | 2012 | ||||||||||
| (Square feet in thousands) | ||||||||||||
| Product shipments in square feet |
38,222 | 35,560 | 27,280 | |||||||||
Adjusted EBITDA
We use Adjusted EBITDA, a non-GAAP financial measure, as a means to assess our operating performance. We define Adjusted EBITDA as net income (loss) before interest expense, taxes, depreciation, amortization, stock-based compensation expense and other items, from time to time, that we do not believe are indicative of our core operating performance, which in previous periods included loss on disposal of assets, gain or loss on extinguishment or exchange of debt, write-off of costs of postponed financing activities and write-off of construction in progress. Adjusted EBITDA is a supplemental measure of our performance that is not presented in accordance with GAAP. Adjusted EBITDA should not be considered as an alternative to net income (loss) or
52
Table of Contents
any other measure of financial performance calculated and presented in accordance with GAAP. In addition, our definition and presentation of Adjusted EBITDA may not be comparable to similarly titled measures presented by other companies.
We use Adjusted EBITDA:
| • | as a measure of operating performance because it does not include the impact of items that we do not consider indicative of our core operating performance; |
| • | for planning purposes, including the preparation of our annual operating budget, to allocate resources to enhance the financial performance of our business; and |
| • | as a performance measure used under our bonus plan. |
We also believe that the presentation of Adjusted EBITDA provides useful information to investors with respect to our results of operations and in assessing the performance and value of our business. Various measures of EBITDA are widely used by investors to measure a company’s operating performance without regard to items that can vary substantially from company to company depending upon financing and accounting methods, book values of assets, capital structures and the methods by which assets were acquired.
Although measures similar to Adjusted EBITDA are frequently used by investors and securities analysts in their evaluation of companies, we understand that Adjusted EBITDA has limitations as an analytical tool, and you should not consider it in isolation or as a substitute for GAAP, income from operations or an analysis of our results of operations as reported under GAAP. Some of these limitations are:
| • | Adjusted EBITDA does not reflect our historical cash expenditures or future requirements for capital expenditures or other contractual commitments; |
| • | Adjusted EBITDA does not reflect changes in, or cash requirements for, our working capital needs; |
| • | Adjusted EBITDA does not reflect stock-based compensation expense; |
| • | Adjusted EBITDA does not reflect our tax expense or cash requirements to pay our income taxes; |
| • | Adjusted EBITDA does not reflect our interest expense, or the cash requirements necessary to service interest or principal payments on our debt; |
| • | Although depreciation, amortization and impairment charges are non-cash charges, the assets being depreciated, amortized or impaired will often have to be replaced in the future, and Adjusted EBITDA does not reflect any cash requirements for these replacements; and |
| • | Other companies in our industry may calculate EBITDA or Adjusted EBITDA differently than we do, limiting their usefulness as a comparative measure. |
Because of these limitations, our Adjusted EBITDA should not be considered as a measure of discretionary cash available to us to reinvest in the growth of our business or as a measure of cash available for us to meet our obligations.
To properly and prudently evaluate our business, we encourage you to review the GAAP financial statements included elsewhere in this Annual Report on Form 10-K, and not to rely on any single financial measure to evaluate our business.
53
Table of Contents
The following table presents a reconciliation of net income (loss), the most directly comparable GAAP measure, to Adjusted EBITDA for the years presented:
| Year Ended December 31 | ||||||||||||
| 2014 | 2013 | 2012 | ||||||||||
| ($ in thousands) | ||||||||||||
| Net income (loss) |
$ | (66,324 | ) | $ | (47,611 | ) | $ | (56,142 | ) | |||
| Interest expense (1) |
50,281 | 30,599 | 21,790 | |||||||||
| Depreciation and amortization |
10,183 | 10,061 | 9,684 | |||||||||
| Loss on disposal of assets |
119 | 230 | 2,489 | |||||||||
| Stock-based compensation (2) |
8,781 | 4,426 | 1,654 | |||||||||
| Gain on extinguishment of convertible notes |
— | (8,898 | ) | — | ||||||||
| Loss on exchange of convertible notes |
— | 5,697 | — | |||||||||
| Debt extinguishment costs |
— | — | 1,379 | |||||||||
| Write-off of costs associated with postponed public offering |
— | 241 | — | |||||||||
| Write-off of construction in progress |
— | 3,440 | — | |||||||||
|
|
|
|
|
|
|
|||||||
| Adjusted EBITDA |
$ | 3,040 | $ | (1,815 | ) | $ | (19,146 | ) | ||||
|
|
|
|
|
|
|
|||||||
| (1) | Interest expense consists primarily of fair market value adjustments related to our subordinated notes, senior convertible notes, convertible notes and Series C warrants, subordinated note and convertible note issuance costs, the amortization of the subordinated note debt discount, and imputed interest on our obligations under our cross license agreement with Cabot Corporation. |
| (2) | Represents non-cash stock-based compensation related to vesting and modifications of stock option grants, vesting of restricted stock units and restricted common stock. |
The following table presents a reconciliation of net income (loss), the most directly comparable GAAP measure, to Adjusted EBITDA for the quarters presented:
| Three months ended | Three months ended | |||||||||||||||||||||||||||||||
| 2014 | 2013 | |||||||||||||||||||||||||||||||
| March 31 | June 30 | Sept. 30 | Dec. 31 | March 31 | June 30 | Sept. 30 | Dec. 31 | |||||||||||||||||||||||||
| Net income (loss) |
$ | (19,049 | ) | (42,148 | ) | (2,412 | ) | (2,715 | ) | $ | 1,027 | $ | (18,984 | ) | $ | (12,704 | ) | $ | (16,950 | ) | ||||||||||||
| Interest expense (income) (1) |
16,151 | 34,027 | 47 | 56 | (3,366 | ) | 15,620 | 8,039 | 10,306 | |||||||||||||||||||||||
| Depreciation and amortization |
2,631 | 2,547 | 2,513 | 2,492 | 2,469 | 2,479 | 2,483 | 2,630 | ||||||||||||||||||||||||
| Loss on disposal of assets |
15 | — | — | 104 | — | — | — | 230 | ||||||||||||||||||||||||
| Stock-based compensation (2) |
339 | 6,006 | 1,054 | 1,382 | 495 | 510 | 2,916 | 505 | ||||||||||||||||||||||||
| Gain on extinguishment of convertible notes |
— | — | — | — | (8,898 | ) | — | — | — | |||||||||||||||||||||||
| Loss on exchange of convertible notes |
— | — | — | — | 5,212 | 485 | — | — | ||||||||||||||||||||||||
| Costs associated with postponed public offering |
— | — | — | — | — | 241 | — | — | ||||||||||||||||||||||||
| Write-off of construction in progress |
— | — | — | — | — | — | — | 3,440 | ||||||||||||||||||||||||
|
|
|
|
|
|
|
|
|
|
|
|
|
|
|
|
|
|||||||||||||||||
| Adjusted EBITDA |
$ | 87 | $ | 432 | $ | 1,202 | $ | 1,319 | $ | (3,061 | ) | $ | 351 | $ | 734 | $ | 161 | |||||||||||||||
|
|
|
|
|
|
|
|
|
|
|
|
|
|
|
|
|
|||||||||||||||||
| (1) | Interest expense (income) consists primarily of fair market value adjustments related to our subordinated notes, convertible notes and the issuance of our Series C warrants, subordinated note and convertible note issuance costs, the amortization of the subordinated note debt discount and imputed interest on our obligations under our cross license agreements with Cabot Corporation. |
54
Table of Contents
| (2) | Represents non-cash stock-based compensation related to vesting and modifications of stock option grants, vesting of restricted stock units and restricted common stock. |
Our Adjusted EBITDA is affected by a number of factors including the mix of aerogel products sold, average selling prices, average material costs, our actual manufacturing costs, the costs associated with and timing of expansions and start-up of additional production capacity, and the amount and timing of operating expenses. As we continue to grow our base of product revenue and to build out manufacturing capacity, we expect increased manufacturing expenses will periodically have a negative impact on Adjusted EBITDA, but will set the framework for improved Adjusted EBITDA moving forward. Accordingly, we expect that our Adjusted EBITDA will vary from period to period as we expand our manufacturing capacity.
Emerging Growth Company Status
The JOBS Act permits an “emerging growth company” such as us to take advantage of an extended transition period to comply with new or revised accounting standards applicable to public companies. We are choosing to opt out of this provision and, as a result, we will comply with new or revised accounting standards as required when they are adopted. This decision to opt out of the extended transition period under the JOBS Act is irrevocable.
Components of Our Results of Operations
Revenue
We recognize product revenue from the sale of our line of aerogel products and research services revenue from the provision of services under contracts with various agencies of the U.S. government and other institutions. Product revenue is recognized upon transfer of title and risk of loss, which is generally upon shipment or delivery. The following table sets forth the total revenue for the periods presented:
| Year Ended December 31 | ||||||||||||
| 2014 | 2013 | 2012 | ||||||||||
| Revenue: |
||||||||||||
| Product |
$ | 99,259 | $ | 82,057 | $ | 60,389 | ||||||
| Research services |
3,140 | 4,037 | 3,064 | |||||||||
|
|
|
|
|
|
|
|||||||
| Total revenue |
$ | 102,399 | $ | 86,094 | $ | 63,453 | ||||||
|
|
|
|
|
|
|
|||||||
Product revenue accounted for 97%, 95% and 95% of total revenue for the years ended December 31, 2014, 2013 and 2012, respectively. We expect continued growth in product revenue due to increasing market adoption of our line of aerogel blankets within all segments of the energy infrastructure market. We expect that research services revenue will continue to decline as a percentage of total revenue.
A substantial majority of our revenue is generated from a limited number of direct customers, including distributors, contractors, OEMs and end-use customers. Our 10 largest customers accounted for approximately 60% of our total revenue during the year ended December 31, 2014, and we expect that most of our revenue will continue to come from a relatively small number of customers for the foreseeable future. In 2014, sales to a major Asian energy company and a North American distributor represented 13% and 12% of total revenue, respectively; in 2013, sales to a North American and an Asian distributor represented 15% and 11% of total revenue, respectively; and in 2012, sales to a North American distributor represented 13% of total revenue. For each of the periods discussed above, there were no other customers that represented 10% or more of our total revenues.
55
Table of Contents
We conduct business across the globe, with a substantial portion of our sales outside the United States. In addition, we may expand our operations outside of the United States. Total revenue from outside of the United States, based on shipment destination or services location, amounted to $62.6 million, or 61% of our total revenues, $55.9 million, or 65% of our total revenue, and $43.5 million or 69% of our total revenue, in the years ended December 31, 2014, 2013 and 2012, respectively.
Cost of Revenue
Cost of revenue for our product revenue consists primarily of materials and manufacturing expense, including direct labor and manufacturing overhead, including depreciation. Cost of product revenue is recorded when the related product revenue is recognized. Cost of product revenue also includes stock-based compensation of manufacturing employees and costs of shipping.
Material is our most significant component of cost of product revenue and includes fibrous batting, silica materials and additives. Material costs as a percentage of product revenue were 46%, 47% and 61% for the years ended December 31, 2014, 2013 and 2012, respectively. Material costs as a percentage of product revenue vary from product to product due to differences in average selling prices, material requirements, blanket thickness and manufacturing yields. As a result, material costs as a percentage of revenue will vary from period to period due to changes in the mix of aerogel products sold. However, in general, we expect material costs in the aggregate to decline as a percentage of revenue as we seek to achieve higher selling prices, material sourcing improvements and manufacturing yield enhancements for our aerogel products.
Manufacturing expense is also a significant component of cost of revenue. Manufacturing expense as a percentage of product revenue was 38%, 42% and 56% for the years ended December 31, 2014, 2013 and 2012, respectively. We incurred a significant increase in manufacturing expense associated with the operation of our second production line in the East Providence facility beginning in 2011. These costs were principally fixed in nature and constituted an increased percentage of product revenue during 2011 and 2012 as we increased production toward nameplate capacity. During 2013 and 2014, manufacturing expense decreased as a percentage of product revenue as a result of strong revenue growth supported by the expanded manufacturing capacity and improved manufacturing productivity. As we continue to increase manufacturing capacity in our East Providence facility and a second plant, we expect manufacturing expense as a percentage of product revenue will increase in the near-term following each expansion but will decrease in the long-term with increased revenues supported by the effect of completed capacity expansions.
Cost of revenue for our research services revenue consists of direct labor costs of research personnel engaged in the contract research, third-party consulting expense, and associated direct material costs. This cost of revenue also includes overhead expenses associated with project resources, development tools and supplies. Cost of revenue for our research services revenue is recorded when the related research services revenue is recognized.
Gross Profit
Our gross profit as a percentage of revenue is affected by a number of factors, including the mix of aerogel products sold, average selling prices, average material costs, our actual manufacturing costs and the costs associated with expansions and start-up of production capacity. As we continue to build out our manufacturing capacity, we expect increased manufacturing expenses will periodically have a negative impact on gross profit, but will set the framework for improved gross profit moving forward. Accordingly, we expect our gross profit in absolute dollars and as a percentage of revenue to vary from period to period as we expand our manufacturing capacity. However, in general, following the completion of our capacity expansions, we expect gross profit to improve as a percentage of revenue in the long-term due to increases in manufacturing productivity, increased production volumes, improved manufacturing yields and material purchasing efficiencies.
56
Table of Contents
Operating Expenses
Operating expenses consist of research and development, sales and marketing, and general and administrative expenses. The largest component of our operating expenses is personnel costs, consisting of salaries, benefits, incentive compensation and stock-based compensation. We expect to continue to hire a significant number of new employees in order to support our anticipated growth. In any particular period, the timing of additional hires could materially affect our operating expenses, both in absolute dollars and as a percentage of revenue.
Research and Development Expenses
Research and development expenses consist primarily of expenses for personnel engaged in the development of next generation aerogel compositions, form factors and manufacturing technologies. These expenses also include testing services, prototype expenses, consulting services, equipment depreciation, facilities costs and related overhead. We expense research and development costs as incurred. We expect to continue to devote substantial resources to the development of new aerogel technology. We believe that these investments are necessary to maintain and improve our competitive position. We expect that our research and development expenses will continue to increase as we continue to invest in additional research and engineering personnel and the infrastructure required in support of their efforts. Accordingly, we expect that our research and development expenses will continue to increase in absolute dollars but decrease as a percentage of revenue in the long-term.
Sales and Marketing Expenses
Sales and marketing expenses consist primarily of personnel costs, incentive compensation, marketing programs, travel and related costs, consulting expenses and facilities-related costs. We plan to expand our sales force and sales consultants globally to drive anticipated growth in customers and demand for our products. We expect that sales and marketing expenses will continue to increase in absolute dollars but decrease as a percentage of revenue in the long-term.
General and Administrative Expenses
General and administrative expenses consist primarily of personnel costs, legal expenses, consulting and professional services, audit and tax consulting costs, and expenses for our executive, finance, human resources and information technology organizations. General and administrative expenses have increased as we have incurred additional costs related to operating as a publicly-traded company, which include costs of compliance with securities, corporate governance and related laws and regulations, investor relations expenses, increased insurance premiums, including director and officer insurance, and increased audit and legal fees. In addition, we expect to add general and administrative personnel to support the anticipated growth of our business and continued expansion of our manufacturing operations. We expect that general and administrative expenses will continue to increase in absolute dollars but decrease as a percentage of revenue in the long-term.
Other Income (Expense)
Other income (expense) consists of (i) interest expense consisting primarily of fair market value adjustments to our subordinated notes, convertible notes and the issuance of our Series C warrants, subordinated and convertible note issuance costs, the amortization of the subordinated note debt discount, and imputed interest on our prior obligations under our cross license agreement with Cabot Corporation, (ii) gains or losses on extinguishment or exchange of subordinated notes and convertible notes and (iii) costs associated with a postponed public offering.
57
Table of Contents
Provision for Income Taxes
We have incurred net losses since inception and have not recorded benefit provisions for U.S. federal income taxes or state income taxes since the tax benefits of our net losses have been offset by valuation allowances due to the uncertainty associated with the utilization of net operating loss carryforwards.
For the year ended December 31, 2014, we performed an analysis pursuant to Internal Revenue Code Section 382, as well as similar state provisions, in order to determine whether any limitations might exist on the utilization of net operating losses and other tax attributes. Based on this analysis, we have determined that an ownership change occurred as a result of our initial public offering in June 2014, resulting in an annual limitation on the use of our net operating losses and other tax attributes as of such date. As a result, our prior net operating losses were limited to $155.2 million, including built-in gains of $42.0 million at the date of that ownership change.
Results of Operations
The following tables set forth our results of operations for the periods presented:
| Year Ended December 31 | ||||||||||||
| 2014 | 2013 | 2012 | ||||||||||
| ($ in thousands) | ||||||||||||
| Revenue: |
||||||||||||
| Product |
$ | 99,259 | $ | 82,057 | $ | 60,389 | ||||||
| Research services |
3,140 | 4,037 | 3,064 | |||||||||
|
|
|
|
|
|
|
|||||||
| Total revenue |
102,399 | 86,094 | 63,453 | |||||||||
| Cost of revenue: |
||||||||||||
| Product |
83,677 | 73,399 | 70,025 | |||||||||
| Research services |
1,642 | 1,964 | 1,396 | |||||||||
|
|
|
|
|
|
|
|||||||
| Gross profit (loss) |
17,080 | 10,731 | (7,968 | ) | ||||||||
| Operating Expenses: |
||||||||||||
| Research and development |
5,980 | 5,159 | 5,142 | |||||||||
| Sales and marketing |
10,290 | 9,271 | 8,564 | |||||||||
| General and administrative |
16,853 | 12,833 | 11,299 | |||||||||
| Write-off of construction in progress |
— | 3,440 | — | |||||||||
|
|
|
|
|
|
|
|||||||
| Total operating expenses |
33,123 | 30,703 | 25,005 | |||||||||
|
|
|
|
|
|
|
|||||||
| Income (loss) from operations |
(16,043 | ) | (19,972 | ) | (32,973 | ) | ||||||
|
|
|
|
|
|
|
|||||||
| Other income (expense): |
||||||||||||
| Interest income (expense) (1) |
(50,281 | ) | (30,599 | ) | (21,790 | ) | ||||||
| Gain on extinguishment of convertible notes |
— | 8,898 | — | |||||||||
| Loss on exchange of convertible notes |
— | (5,697 | ) | — | ||||||||
| Debt extinguishment costs |
— | — | (1,379 | ) | ||||||||
| Costs associated with postponed public offering |
— | (241 | ) | — | ||||||||
|
|
|
|
|
|
|
|||||||
| Total other income (expense), net |
(50,281 | ) | (27,639 | ) | (23,169 | ) | ||||||
|
|
|
|
|
|
|
|||||||
| Net income (loss) |
$ | (66,324 | ) | $ | (47,611 | ) | $ | (56,142 | ) | |||
|
|
|
|
|
|
|
|||||||
| (1) | Interest income (expense) consists primarily of fair market value adjustments related to our subordinated notes, convertible notes and the issuance of our Series C warrants, subordinated note and convertible note issuance costs, the amortization of the subordinated note debt discount and imputed interest on our prior obligations under our cross license agreement with Cabot Corporation. |
58
Table of Contents
Year ended December 31, 2014 compared to year ended December 31, 2013
The following tables set forth our results of operations for the periods presented:
| Year Ended December 31 | Year Ended December 31 |
|||||||||||||||||||||||
| 2014 | 2013 | $ Change | % Change | 2014 | 2013 | |||||||||||||||||||
| ($ in thousands) | (Percentage of total revenue) |
|||||||||||||||||||||||
| Revenue: |
||||||||||||||||||||||||
| Product |
$ | 99,259 | $ | 82,057 | $ | 17,202 | 21 | % | 97 | % | 95 | % | ||||||||||||
| Research services |
3,140 | 4,037 | (897 | ) | (22 | )% | 3 | % | 5 | % | ||||||||||||||
|
|
|
|
|
|
|
|
|
|
|
|
|
|||||||||||||
| Total revenue |
102,399 | 86,094 | 16,305 | 19 | % | 100 | % | 100 | % | |||||||||||||||
| Cost of revenue: |
||||||||||||||||||||||||
| Product |
83,677 | 73,399 | 10,278 | 14 | % | 82 | % | 85 | % | |||||||||||||||
| Research services |
1,642 | 1,964 | (322 | ) | (16 | )% | 2 | % | 2 | % | ||||||||||||||
|
|
|
|
|
|
|
|
|
|
|
|
|
|||||||||||||
| Gross profit (loss) |
17,080 | 10,731 | 6,349 | 59 | % | 17 | % | 12 | % | |||||||||||||||
| Operating expenses: |
||||||||||||||||||||||||
| Research and development |
5,980 | 5,159 | 821 | 16 | % | 6 | % | 6 | % | |||||||||||||||
| Sales and marketing |
10,290 | 9,271 | 1,019 | 11 | % | 10 | % | 11 | % | |||||||||||||||
| General and administrative |
16,853 | 12,833 | 4,020 | 31 | % | 16 | % | 15 | % | |||||||||||||||
| Write-off of construction in progress |
— | 3,440 | (3,440 | ) | (100 | )% | — | % | 4 | % | ||||||||||||||
|
|
|
|
|
|
|
|
|
|
|
|
|
|||||||||||||
| Total operating expenses |
33,123 | 30,703 | 2,420 | 8 | % | 32 | % | 36 | % | |||||||||||||||
|
|
|
|
|
|
|
|
|
|
|
|
|
|||||||||||||
| Income (loss) from operations |
(16,043 | ) | (19,972 | ) | 3,929 | 20 | % | (16 | )% | (23 | )% | |||||||||||||
| Other income (expense): |
||||||||||||||||||||||||
| Interest expense |
(50,281 | ) | (30,599 | ) | (19,682 | ) | (64 | )% | (49 | )% | (36 | )% | ||||||||||||
| Gain on extinguishment of convertible notes |
— | 8,898 | (8,898 | ) | (100 | )% | — | % | 10 | % | ||||||||||||||
| Loss on exchange of convertible notes |
— | (5,697 | ) | 5,697 | 100 | % | — | % | (7 | )% | ||||||||||||||
| Costs associated with postponed public offering |
— | (241 | ) | 241 | 100 | % | — | % | — | % | ||||||||||||||
|
|
|
|
|
|
|
|
|
|
|
|
|
|||||||||||||
| Total other income (expense), net |
(50,281 | ) | (27,639 | ) | (22,642 | ) | (82 | )% | (49 | )% | (32 | )% | ||||||||||||
|
|
|
|
|
|
|
|
|
|
|
|
|
|||||||||||||
| Net income (loss) |
$ | (66,324 | ) | $ | (47,611 | ) | $ | (18,713 | ) | (39 | )% | (65 | )% | (55 | )% | |||||||||
|
|
|
|
|
|
|
|
|
|
|
|
|
|||||||||||||
Revenue
| Year Ended December 31 | Change | |||||||||||||||||||||||
| 2014 | 2013 | |||||||||||||||||||||||
| Amount | Percentage of Revenue |
Amount | Percentage of Revenue |
Amount | Percentage | |||||||||||||||||||
| ($ in thousands) | ||||||||||||||||||||||||
| Revenue: |
||||||||||||||||||||||||
| Product |
$ | 99,259 | 97 | % | $ | 82,057 | 95 | % | $ | 17,202 | 21 | % | ||||||||||||
| Research services |
3,140 | 3 | % | 4,037 | 5 | % | (897 | ) | (22 | )% | ||||||||||||||
|
|
|
|
|
|
|
|||||||||||||||||||
| Total revenue |
$ | 102,399 | 100 | % | $ | 86,094 | 100 | % | $ | 16,305 | 19 | % | ||||||||||||
|
|
|
|
|
|
|
|||||||||||||||||||
The following chart sets forth product shipments in square feet for the periods presented:
| Year Ended December 31 |
Change | |||||||||||||||
| 2014 | 2013 | Amount | Percentage | |||||||||||||
| Product shipments in square feet (in thousands) |
38,222 | 35,560 | 2,662 | 7 | % | |||||||||||
59
Table of Contents
Total revenue increased by $16.3 million, or 19%, in 2014 to $102.4 million from $86.1 million in 2013 as a result of an increase in product revenue.
Product revenue increased by $17.2 million, or 21%, to $99.3 million in 2014 from $82.1 million in 2013. This increase was principally the result of an increase in sales of our aerogel products in the North American, Asian and South American petrochemical markets and in the offshore oil market. The revenue increase reflects price increases during in 2014 and a shift in mix of aerogel products sold toward higher priced products including those sold in the offshore oil market. The average selling price per square foot of our products increased by an effective $0.29, or 13%, to $2.60 per square foot for the year ended December 31, 2014 from $2.31 per square foot for the year ended December 31, 2013. In volume terms, product shipments increased 2.7 million square feet, or 7%, to 38.2 million square feet of aerogel products for the year ended December 31, 2014, as compared to 35.6 million square feet in the year ended December 31, 2013. The increase in demand during the year ended December 31, 2014 included increased sales of $13.5 million for use in a petrochemical facility expansion by a major Asian energy company and $5.9 million for use in offshore projects in the Gulf of Mexico by an Asia-based contractor.
Research services revenue decreased by $0.9 million, or 22%, to $3.1 million in 2014 from $4.0 million in 2013. The decrease was primarily due to a reduction in active research contracts during 2014. During 2014, we provided research services on eight contracts compared to 18 contracts in 2013. This decrease in active contracts is principally the result of certain limitations on our eligibility to receive contract awards under federal guidelines and programs due to a variety of factors including the size of our revenues, the number of our employees and the makeup of our ownership.
Product revenue as a percentage of total revenue was 97% and 95% of total revenue in 2014 and 2013, respectively. Research services revenue was 3% and 5% of total revenue in 2014 and 2013, respectively. We expect that product revenue will continue to increase as a percentage of our total revenue due to the anticipated growth in demand for our products in the energy infrastructure market.
Cost of Revenue
| Year Ended December 31 | Change | |||||||||||||||||||||||||||||||
| 2014 | 2013 | |||||||||||||||||||||||||||||||
| Amount | Percentage of Related Revenue |
Percentage of Total Revenue |
Amount | Percentage of Related of Revenue |
Percentage of Total Revenue |
Amount | Percentage | |||||||||||||||||||||||||
| ($ in thousands) | ||||||||||||||||||||||||||||||||
| Cost of revenue: |
||||||||||||||||||||||||||||||||
| Product |
$ | 83,677 | 84 | % | 82 | % | $ | 73,399 | 89 | % | 85 | % | $ | 10,278 | 14 | % | ||||||||||||||||
| Research services |
1,642 | 52 | % | 2 | % | 1,964 | 49 | % | 2 | % | (322 | ) | (16 | )% | ||||||||||||||||||
|
|
|
|
|
|
|
|||||||||||||||||||||||||||
| Total cost of revenue |
$ | 85,319 | 83 | % | 83 | % | $ | 75,363 | 88 | % | 88 | % | $ | 9,956 | 13 | % | ||||||||||||||||
|
|
|
|
|
|
|
|||||||||||||||||||||||||||
Total cost of revenue increased by $10.0 million, or 13%, to $85.3 million in 2014 from $75.4 million in 2013. The increase in total cost of revenue was the result of an increase of $7.0 million in material costs and an increase of $3.3 million in manufacturing expense to support increased product revenue offset by a decrease of $0.3 million in cost of research services to support research services revenue.
Product cost of revenue increased by $10.3 million, or 14%, to $83.7 million in 2014 from $73.4 million in 2013. Product cost of revenue as a percentage of product revenue decreased to 84% during 2014 from 89% in 2013 as a result of a reduction in both material costs and manufacturing expense as a percentage of product revenue during the year. The reduction in material costs as a percentage of product revenue was the result of improved manufacturing yields and purchasing efficiency. The reduction in manufacturing expense as a percentage of product revenue was the result of improved manufacturing throughput and efficiency.
60
Table of Contents
We expect that cost of product revenue will increase in dollar terms, but decrease as a percentage of product revenue, during 2015. The anticipated increase in cost of product revenue reflects an expected increase in manufacturing expense associated with the start-up and operation of a third manufacturing line in the East Providence facility and in material costs in support of revenue growth. The anticipated decrease in product cost as a percentage of product revenue reflects an expected decrease in material costs as a percentage of product revenue due to price increases enacted during the second half of 2014, improved manufacturing yields, sourcing efficiencies, and the mix of aerogel products sold, offset, in part, by an expected increase in manufacturing expense as a percentage of product revenue due to the start-up and initial operation of the third manufacturing line.
Research services cost of revenue decreased by $0.3 million, or 16%, to $1.6 million in 2014 from $2.0 million in 2013. The decrease in research services cost of revenue was due to a reduction in active research contracts during 2014, offset, in part, by an unfavorable mix of labor and expense required to perform the contracted research.
Gross Profit (Loss)
| Year Ended December 31 | Change | |||||||||||||||||||||||
| 2014 | 2013 | |||||||||||||||||||||||
| Amount | Percentage of Revenue |
Amount | Percentage of Revenue |
Amount | Percentage | |||||||||||||||||||
| ($ in thousands) | ||||||||||||||||||||||||
| Gross profit (loss) |
$ | 17,080 | 17 | % | $ | 10,731 | 12 | % | $ | 6,349 | 59 | % | ||||||||||||
Gross profit increased by $6.3 million to $17.1 million in 2014 from $10.7 million in 2013. Gross profit as a percentage of total revenue increased to 17% of total revenue for 2014 from 12% in 2013. The increase in gross profit as a percentage of revenue was principally the result of a reduction in material costs and manufacturing expense as a percentage of product revenue due to improved manufacturing yields, sourcing efficiencies and productivity at our East Providence facility. Price increases enacted during 2014 and the mix of aerogel products sold also contributed to the increase in gross profit as a percentage of revenue during 2014. We expect gross profit as a percentage of total revenue during 2015 to increase due to price increases enacted during the fourth quarter of 2014, in combination with anticipated improvements in manufacturing yields, sourcing efficiencies, and the mix of aerogel products sold, offset, in part, by an expected increase in manufacturing expense due to the start-up and initial operation of the third manufacturing line.
Research and Development Expenses
| Year Ended December 31 | Change | |||||||||||||||||||||||
| 2014 | 2013 | |||||||||||||||||||||||
| Amount | Percentage of Revenue |
Amount | Percentage of Revenue |
Amount | Percentage | |||||||||||||||||||
| ($ in thousands) | ||||||||||||||||||||||||
| Research and development expenses |
$ | 5,980 | 6 | % | $ | 5,159 | 6 | % | $ | 821 | 16 | % | ||||||||||||
R&D expenses increased by $0.8 million to $6.0 million in 2014 from $5.2 million in 2013. This increase was primarily the result of an increase in employee compensation expenses, including $0.8 million of stock-based compensation charges and $0.1 million of incentive compensation expenses, offset by a reduction in spending on outside engineering services of $0.1 million. We expect that our research and development expenses will increase as we invest in additional research and engineering personnel and the infrastructure required in support of their efforts. However, we expect that research and development expenses will decline as a percentage of total revenue in the long-term due to projected growth in product revenue.
61
Table of Contents
Sales and Marketing Expenses
| Year Ended December 31 | Change | |||||||||||||||||||||||
| 2014 | 2013 | |||||||||||||||||||||||
| Amount | Percentage of Revenue |
Amount | Percentage of Revenue |
Amount | Percentage | |||||||||||||||||||
| ($ in thousands) | ||||||||||||||||||||||||
| Sales and marketing expenses |
$ | 10,290 | 10 | % | $ | 9,271 | 11 | % | $ | 1,019 | 11 | % | ||||||||||||
Sales and marketing expenses increased by $1.0 million, or 11%, to $10.3 million in 2014 from $9.3 million during 2013. The $1.0 million increase is the result of a $0.7 million increase in stock-based compensation charges and a $0.3 million increase in payroll and related costs associated with an increase in sales personnel. We plan to continue to expand our sales force during 2015 to support anticipated growth in customers and demand for our products. We expect that sales and marketing expenses will increase in absolute dollars in the long term as we increase sales personnel and our marketing efforts. However, we expect that sales and marketing expenses will decrease as a percentage of total revenue in the long-term due to projected growth in product revenue.
General and Administrative Expenses
| Year Ended December 31 | Change | |||||||||||||||||||||||
| 2014 | 2013 | |||||||||||||||||||||||
| Amount | Percentage of Revenue |
Amount | Percentage of Revenue |
Amount | Percentage | |||||||||||||||||||
| ($ in thousands) | ||||||||||||||||||||||||
| General and administrative expenses |
$ | 16,853 | 16 | % | $ | 12,833 | 15 | % | $ | 4,020 | 31 | % | ||||||||||||
G&A, or general and administrative, expenses increased by $4.0 million, or 31%, to $16.9 million in 2014 from $12.8 million in 2013. The $4.0 million increase was primarily the result of an increase in stock based compensation charges of $2.3 million, an increase in incentive compensation expenses of $0.7 million and an increase in professional services and other expenses of $1.0 million principally related to operating as a publicly-traded company. The increased costs to operate as a public company include costs of compliance with securities, corporate governance and related laws and regulations, investor relations expenses, director and officer insurance premiums, and legal and audit fees. We expect that G&A expenses will decrease in absolute dollars during 2015 due to a reduction in share based compensation charges despite continued increases in public company related expense. In addition, we expect to add general and administrative personnel to support the anticipated growth of our business and continued expansion of our manufacturing operations. However, we expect general and administrative expenses will decline as a percentage of total revenue in the long-term as a result of projected growth in product revenue.
Other Income (Expense)
| Year Ended December 31 | Change | |||||||||||||||||||||||
| 2014 | 2013 | |||||||||||||||||||||||
| Amount | Percentage of Revenue |
Amount | Percentage of Revenue |
Amount | Percentage | |||||||||||||||||||
| ($ in thousands) | ||||||||||||||||||||||||
| Other income (expense): |
||||||||||||||||||||||||
| Interest expense |
$ | (50,281 | ) | (49 | )% | $ | (30,599 | ) | (36 | )% | $ | (19,682 | ) | (64 | )% | |||||||||
| Gain on extinguishment of convertible notes |
— | — | % | 8,898 | 10 | % | (8,898 | ) | (100 | )% | ||||||||||||||
| Loss on exchange of convertible notes |
— | — | % | (5,697 | ) | (7 | )% | 5,697 | 100 | % | ||||||||||||||
| Costs associated with postponed public offering |
— | — | % | (241 | ) | — | % | 241 | 100 | % | ||||||||||||||
|
|
|
|
|
|
|
|||||||||||||||||||
| Total other income (expense), net |
$ | (50,281 | ) | (49 | )% | $ | (27,639 | ) | (32 | )% | $ | (22,642 | ) | (82 | )% | |||||||||
|
|
|
|
|
|
|
|||||||||||||||||||
62
Table of Contents
Total other expense was $50.3 million for the year ended December 31, 2014 as compared to $27.6 million in the comparable period in 2013.
During 2014, we incurred $50.3 million in interest expense comprised of changes in fair value of $1.5 million for the subordinated notes, $11.4 million for the senior convertible notes and $37.1 million for the convertible notes, and $0.3 million in debt closing costs and other interest expense. The changes in fair value of the respective notes were calculated based on the final payment and conversion amounts of the notes into equity upon the consummation of our IPO on June 18, 2014. The increase of $22.6 million in total other expense during 2014 was due primarily to the accretion of the convertible notes to their final conversion value in connection with the IPO.
During the year ended December 31, 2013, we incurred $30.6 million in interest expense comprised of changes in fair value of the subordinated notes of $3.8 million, senior convertible notes of $5.6 million, expense related to recognition of fair value upon issuance of Series C preferred stock warrants of $10.7 million and interest expense of $9.3 million on the convertible notes. In addition, we recorded charges for debt financing costs of $0.6 million and other interest charges of $0.6 million to interest expense during the period.
During the year ended December 31, 2013, we also incurred a $5.7 million loss on exchange of convertible notes, an $8.9 million gain on the extinguishment of convertible notes and $0.2 million of costs associated with a postponed public offering. No such transactions occurred during the year ended December 31, 2014.
Year ended December 31, 2013 compared to year ended December 31, 2012
The following tables set forth our results of operations for the periods presented:
| Year Ended December 31 | Year Ended December 31 |
|||||||||||||||||||||||
| 2013 | 2012 | $ Change | % Change | 2013 | 2012 | |||||||||||||||||||
| ($ in thousands) | (Percentage of total revenue) |
|||||||||||||||||||||||
| Revenue: |
||||||||||||||||||||||||
| Product |
$ | 82,057 | $ | 60,389 | $ | 21,668 | 36 | % | 95 | % | 95 | % | ||||||||||||
| Research services |
4,037 | 3,064 | 973 | 32 | % | 5 | % | 5 | % | |||||||||||||||
|
|
|
|
|
|
|
|
|
|
|
|
|
|||||||||||||
| Total revenue |
86,094 | 63,453 | 22,641 | 36 | % | 100 | % | 100 | % | |||||||||||||||
| Cost of revenue: |
||||||||||||||||||||||||
| Product |
73,399 | 70,025 | 3,374 | 5 | % | 85 | % | 110 | % | |||||||||||||||
| Research services |
1,964 | 1,396 | 568 | 41 | % | 2 | % | 2 | % | |||||||||||||||
|
|
|
|
|
|
|
|
|
|
|
|
|
|||||||||||||
| Gross profit (loss) |
10,731 | (7,968 | ) | 18,699 | 235 | % | 12 | % | (13 | )% | ||||||||||||||
| Operating expenses: |
||||||||||||||||||||||||
| Research and development |
5,159 | 5,142 | 17 | 0 | % | 6 | % | 8 | % | |||||||||||||||
| Sales and marketing |
9,271 | 8,564 | 707 | 8 | % | 11 | % | 13 | % | |||||||||||||||
| General and administrative |
12,833 | 11,299 | 1,534 | 14 | % | 15 | % | 18 | % | |||||||||||||||
| Write-off of construction in progress |
3,440 | — | 3,440 | 100 | % | 4 | % | — | % | |||||||||||||||
|
|
|
|
|
|
|
|
|
|
|
|
|
|||||||||||||
| Total operating expenses |
30,703 | 25,005 | 5,698 | 23 | % | 36 | % | 39 | % | |||||||||||||||
|
|
|
|
|
|
|
|
|
|
|
|
|
|||||||||||||
| Income (loss) from operations |
(19,972 | ) | (32,973 | ) | 13,001 | 39 | % | (23 | )% | (52 | )% | |||||||||||||
| Other income (expense): |
||||||||||||||||||||||||
| Interest expense |
(30,599 | ) | (21,790 | ) | (8,809 | ) | (40 | )% | (36 | )% | (34 | )% | ||||||||||||
| Gain on extinguishment of convertible notes |
8,898 | — | 8,898 | 100 | % | 10 | % | — | % | |||||||||||||||
| Loss on exchange of convertible notes |
(5,697 | ) | — | (5,697 | ) | (100 | )% | (7 | )% | — | % | |||||||||||||
| Debt extinguishment costs |
— | (1,379 | ) | 1,379 | 100 | % | — | % | (2 | )% | ||||||||||||||
| Costs associated with postponed public offering |
(241 | ) | — | (241 | ) | (100 | )% | — | % | — | % | |||||||||||||
|
|
|
|
|
|
|
|
|
|
|
|
|
|||||||||||||
| Total other income (expense), net |
(27,639 | ) | (23,169 | ) | (4,470 | ) | (19 | )% | (32 | )% | (37 | )% | ||||||||||||
|
|
|
|
|
|
|
|
|
|
|
|
|
|||||||||||||
| Net income (loss) |
$ | (47,611 | ) | $ | (56,142 | ) | $ | 8,531 | 15 | % | (55 | )% | (88 | )% | ||||||||||
|
|
|
|
|
|
|
|
|
|
|
|
|
|||||||||||||
63
Table of Contents
Revenue
| Year Ended December 31 | Change | |||||||||||||||||||||||
| 2013 | 2012 | |||||||||||||||||||||||
| Amount | Percentage of Revenue |
Amount | Percentage of Revenue |
Amount | Percentage | |||||||||||||||||||
| ($ in thousands) | ||||||||||||||||||||||||
| Revenue: |
||||||||||||||||||||||||
| Product |
$ | 82,057 | 95 | % | $ | 60,389 | 95 | % | $ | 21,668 | 36 | % | ||||||||||||
| Research services |
4,037 | 5 | % | 3,064 | 5 | % | 973 | 32 | % | |||||||||||||||
|
|
|
|
|
|
|
|||||||||||||||||||
| Total revenue |
$ | 86,094 | 100 | % | $ | 63,453 | 100 | % | $ | 22,641 | 36 | % | ||||||||||||
|
|
|
|
|
|
|
|||||||||||||||||||
The following chart sets forth product shipments in square feet for the periods presented:
| Year Ended December 31 |
Change | |||||||||||||||
| 2013 | 2012 | Amount | Percentage | |||||||||||||
| Product shipments in square feet (in thousands) |
35,560 | 27,280 | 8,280 | 30 | % | |||||||||||
Total revenue increased by $22.6 million, or 36%, in 2013 to $86.1 million from $63.5 million in 2012 primarily as a result of an increase in product revenue.
Product revenue increased by $21.7 million, or 36%, to $82.1 million in 2013 from $60.4 million in 2012. This increase was principally the result of an increase in sales of our aerogel products in the refinery and petrochemical sectors in Asia, North America and South America during 2013. This increase in demand during 2013 included increased sales of $4.9 million to one distributor in Asia primarily related to construction of a new petrochemical plant in Taiwan, increased sales of $4.6 million to another distributor in the United States for general distribution into the energy infrastructure market, and increased sales of $4.6 million to a South American distributor primarily related to construction of expanded capacity in a petrochemical plant in Brazil. In volume terms, product shipments increased 8.3 million square feet, or 30%, to 35.6 million square feet of aerogel products in 2013, as compared to 27.3 million square feet in 2012. We also increased the prices of some of our products during 2013. We did not increase the prices of our products during 2012.
Research services revenue increased by $1.0 million, or 32%, to $4.0 million in 2013 from $3.1 million in 2012 primarily due to revenue generated in 2013 under a significant contract with the Department of Energy.
Product revenue as a percentage of total revenue was 95% of total revenue in 2013 and 2012. Research services revenue was 5% of total revenue in 2013 and 2012. We expect that product revenue will increase as a percentage of our total revenue due to the anticipated growth in demand for our products in the energy infrastructure market.
Cost of Revenue
| Year Ended December 31 | Change | |||||||||||||||||||||||||||||||
| 2013 | 2012 | |||||||||||||||||||||||||||||||
| Amount | Percentage of Related Revenue |
Percentage of Total Revenue |
Amount | Percentage of Related of Revenue |
Percentage of Total Revenue |
Amount | Percentage | |||||||||||||||||||||||||
| ($ in thousands) | ||||||||||||||||||||||||||||||||
| Cost of revenue: |
||||||||||||||||||||||||||||||||
| Product |
$ | 73,399 | 89 | % | 85 | % | $ | 70,025 | 116 | % | 110 | % | $ | 3,374 | 5 | % | ||||||||||||||||
| Research services |
1,964 | 49 | % | 2 | % | 1,396 | 46 | % | 2 | % | 568 | 41 | % | |||||||||||||||||||
|
|
|
|
|
|
|
|||||||||||||||||||||||||||
| Total cost of revenue |
$ | 75,363 | 88 | % | 88 | % | $ | 71,421 | 113 | % | 113 | % | $ | 3,942 | 6 | % | ||||||||||||||||
|
|
|
|
|
|
|
|||||||||||||||||||||||||||
64
Table of Contents
Total cost of revenue increased by $3.9 million, or 6%, to $75.3 million in 2013 from $71.4 million in 2012. The increase in total cost of revenue was the result of an increase of $2.0 million in material costs and an increase of $1.3 million in manufacturing expense to support increased product revenue and an increase of $0.6 million in cost of research services to support increased research services revenue.
Product cost of revenue increased by $3.4 million, or 5%, to $73.4 million in 2013 from $70.0 million in 2012. Product cost of revenue as a percentage of product revenue decreased to 89% during 2013 from 116% in 2012 as a result of a reduction in both material costs and manufacturing expense as a percentage of product revenue during the year. The reduction in material costs as a percentage of product revenue was the result of improved manufacturing yields and purchasing efficiency. The reduction in manufacturing expense as a percentage of product revenue was the result of improved manufacturing throughput and efficiency.
Research services cost of revenue increased by $0.6 million, or 41%, to $2.0 million in 2013 from $1.4 million in 2012. The increase was due in large part to the 32% growth in research service revenue during 2013 in combination with an increase in cost of research services revenue as a percentage of research services revenue to 49% in 2013 from 46% in 2012. The increase in cost of research services revenue was due to an unfavorable mix of labor and expense required to perform the contracted research, each of which carries a different rate of reimbursement.
Gross Profit (Loss)
| Year Ended December 31 | Change | |||||||||||||||||||||||
| 2013 | 2012 | |||||||||||||||||||||||
| Amount | Percentage of Revenue |
Amount | Percentage of Revenue |
Amount | Percentage | |||||||||||||||||||
| ($ in thousands) | ||||||||||||||||||||||||
| Gross profit (loss) |
$ | 10,731 | 12 | % | $ | (7,968 | ) | (13 | )% | $ | 18,699 | 235 | % | |||||||||||
Gross profit increased by $18.7 million to $10.7 million in 2013 from a gross loss of $8.0 million in 2012. This increase in gross profit was principally the result of a reduction in material costs and manufacturing expenses as a percentage of product revenue due to improved manufacturing yields, purchasing efficiency and productivity at our East Providence facility. In addition, the increase in the price of some of our products during 2013 also contributed to the increase in gross profit. Gross profit as a percentage of total revenue increased to 12% of total revenue in 2013 from a gross loss of 13% of total revenue in 2012.
Research and Development Expenses
| Year Ended December 31 | Change | |||||||||||||||||||||||
| 2013 | 2012 | |||||||||||||||||||||||
| Amount | Percentage of Revenue |
Amount | Percentage of Revenue |
Amount | Percentage | |||||||||||||||||||
| ($ in thousands) | ||||||||||||||||||||||||
| Research and development expenses |
$ | 5,159 | 6 | % | $ | 5,142 | 8 | % | $ | 17 | 0 | % | ||||||||||||
R&D expenses increased by $0.1 million to $5.2 million in 2013 from $5.1 million in 2012. This increase was principally the result of an increase of $0.6 million in payroll and related costs for engineering personnel partially offset by a decrease of $0.3 million in material expense and $0.2 million in contract engineering expense. R&D costs as a percentage of total revenue decreased to 6% during 2013 from 8% during 2012. This decrease was the result of growth in total revenue during 2013.
65
Table of Contents
Sales and Marketing Expenses
| Year Ended December 31 | Change | |||||||||||||||||||||||
| 2013 | 2012 | |||||||||||||||||||||||
| Amount | Percentage of Revenue |
Amount | Percentage of Revenue |
Amount | Percentage | |||||||||||||||||||
| ($ in thousands) | ||||||||||||||||||||||||
| Sales and marketing expenses |
$ | 9,271 | 11 | % | $ | 8,564 | 13 | % | $ | 707 | 8 | % | ||||||||||||
Sales and marketing expenses increased by $0.7 million, or 8%, to $9.3 million in 2013 from $8.6 million during 2012. The $0.7 million increase was primarily the result of the growth of $1.0 million in payroll and related costs associated with an increase in sales personnel and incentive compensation, partially offset by a $0.1 million decrease in other selling expense and a $0.2 million decrease in travel expense. Sales and marketing expenses as a percentage of total revenue decreased to 11% during 2013 from 13% in 2012. This decrease was the result of the growth in total revenue during 2013.
General and Administrative Expenses
| Year Ended December 31 | Change | |||||||||||||||||||||||
| 2013 | 2012 | |||||||||||||||||||||||
| Amount | Percentage of Revenue |
Amount | Percentage of Revenue |
Amount | Percentage | |||||||||||||||||||
| ($ in thousands) | ||||||||||||||||||||||||
| General and administrative expenses |
$ | 12,833 | 15 | % | $ | 11,299 | 18 | % | $ | 1,534 | 14 | % | ||||||||||||
G&A expenses increased by $1.5 million, or 14%, to $12.8 million in 2013 from $11.3 million in 2012. This increase was primarily the result of a $3.0 million increase in payroll and related costs of executive, finance and human resource personnel partially offset by a $1.4 million decrease in legal and professional fees, and a $0.1 million decrease in all other expense. G&A expenses as a percentage of total revenue decreased to 15% for 2013 from 18% in 2012. This decrease was principally driven by the strong increase in total revenue in 2013.
Write-off of construction in progress
During 2013, we redesigned and reduced the planned scale of the third production line. As a result, we reviewed the construction in progress assets associated with the third production line and determined that $3.0 million had no future use. In addition, we concluded that an additional $0.4 million of construction in progress assets were not utilized or functional. Accordingly, we recorded a $3.4 million impairment charge during 2013 related to the write-off of construction in progress assets. We did not record any write-offs of construction in progress in 2012.
Other Income (Expense)
| Year Ended December 31 | Change | |||||||||||||||||||||||
| 2013 | 2012 | |||||||||||||||||||||||
| Amount | Percentage of Revenue |
Amount | Percentage of Revenue |
Amount | Percentage | |||||||||||||||||||
| ($ in thousands) | ||||||||||||||||||||||||
| Other income (expense): |
||||||||||||||||||||||||
| Interest expense |
$ | (30,599 | ) | (36 | )% | $ | (21,790 | ) | (34 | )% | $ | (8,809 | ) | (40 | )% | |||||||||
| Gain on extinguishment of convertible notes |
8,898 | 10 | % | — | — | % | 8,898 | 100 | % | |||||||||||||||
| Loss on exchange of convertible notes |
(5,697 | ) | (7 | )% | — | — | % | (5,697 | ) | (100 | )% | |||||||||||||
| Debt extinguishment costs |
— | — | % | (1,379 | ) | (2 | )% | 1,379 | 100 | % | ||||||||||||||
| Costs associated with postponed public offering |
(241 | ) | — | % | — | — | % | (241 | ) | (100 | )% | |||||||||||||
|
|
|
|
|
|
|
|||||||||||||||||||
| Total other income (expense), net |
$ | (27,639 | ) | (32 | )% | $ | (23,169 | ) | (37 | )% | $ | (4,470 | ) | (19 | )% | |||||||||
|
|
|
|
|
|
|
|||||||||||||||||||
66
Table of Contents
Total other income (expense), net increased by $4.5 million, or 19%, to $27.6 million in 2013 from $23.2 million in 2012. This increase was primarily the result of an increase in interest expense of $8.8 million, a $5.7 million loss on exchange of convertible notes related to an exchange of convertible notes for senior convertible notes, and costs associated with a postponed public offering of $0.2 million, partially offset by an $8.9 million gain on the extinguishment of convertible notes related to an amendment to the terms of the notes and a decrease of $1.4 million in debt extinguishment costs. The increase in interest expense was primarily due to the recognition of the fair value upon issuance of the Series C warrants, which was treated as an issuance cost in the March 2013 financing.
Liquidity and Capital Resources
Overview
We have experienced significant losses and invested significant resources since our inception to develop and commercialize our aerogel technology and to build a manufacturing infrastructure capable of supplying aerogel products at the volumes and costs required by our customers. These investments have included research and development and other operating expenses, capital expenditures and investment in working capital balances.
We are currently experiencing rapid revenue growth as we gain share in our target markets. Our current financial forecast anticipates continued revenue growth, increased gross profit and improving cash flows from operations. However, we expect to incur significant capital expenditures through 2017 related to the expansion of our manufacturing capacity to keep pace with expected growth in demand.
We believe that our existing cash balance and available credit will be sufficient (i) to fund the completion of the construction of our third production line in East Providence, and (ii) to fund a portion of the design, development and construction of a second production plant in the United States. We expect to supplement our cash balance with anticipated cash flows from operations, local government grants, debt financings and potentially equity financings to provide the capital required to complete the first production line in our second facility.
Primary Sources of Liquidity
Our principal sources of liquidity are currently our cash and cash equivalents and revolving credit facility with Silicon Valley Bank. Cash and cash equivalents consist primarily of cash and money market accounts on deposit with banks. As of December 31, 2014, we had $49.7 million of cash and cash equivalents.
From our inception to December 2014, our primary sources of liquidity were funds raised through issuances of common stock, preferred stock, subordinated notes, senior convertible notes and convertible notes to venture capital funds and other private investors. In June 2014, we completed an initial public offering of our common stock and received net proceeds of $74.7 million after underwriting discounts and offering expenses. Upon the closing of the offering, all principal and accrued interest of our senior convertible notes and our convertible notes automatically converted into shares of our common stock. In addition, we utilized $19.8 million of the net proceeds of the offering to repay all amounts outstanding under our subordinated notes and revolving credit facility. At December 31, 2014, our total debt obligations were $0.2 million in capital lease obligations. At December 31, 2014, we also had $1.4 million of outstanding letters of credit.
In March 2011, we entered into a $10.0 million revolving credit facility with Silicon Valley Bank. This facility has been amended at various dates through 2014. On September 3, 2014, we further amended the loan and security agreement to extend the maturity date of the revolving credit facility to August 31, 2016 and to increase the maximum amount we are permitted to borrow, subject to continued covenant compliance and borrowing base requirements, from $10 million to $20 million. At our election, the interest rate applicable to borrowings under the amended revolving credit facility may be based on the prime rate or LIBOR. Prime rate-based rates vary from
67
Table of Contents
prime rate plus 0.75% per annum to prime rate plus 1.75% per annum, while LIBOR-based rates vary from LIBOR plus 3.75% per annum to LIBOR plus 4.25% per annum. In addition, we are required to pay a monthly unused revolving line facility fee of 0.5% per annum of the average unused portion of the revolving credit facility.
Due to the borrowing base limitations of the revolving credit facility, the effective amount available to us under the facility at December 31, 2014 was $12.4 million after giving effect to the $1.4 million of letters of credit outstanding. As of December 31, 2014, we had no outstanding balances drawn on the revolving credit facility.
Analysis of Cash Flow
The following table summarizes our cash flows for the periods indicated:
| Year Ended December 31 | ||||||||||||
| 2014 | 2013 | 2012 | ||||||||||
| ($ in thousands) | ||||||||||||
| Net cash provided by (used in): |
||||||||||||
| Operating activities |
$ | 6,648 | $ | (13,688 | ) | $ | (25,879 | ) | ||||
| Investing activities |
(13,241 | ) | (3,329 | ) | (9,785 | ) | ||||||
| Financing activities |
54,738 | 17,248 | 25,766 | |||||||||
|
|
|
|
|
|
|
|||||||
| Net increase (decrease) in cash |
48,145 | 231 | (9,898 | ) | ||||||||
| Cash, beginning of period |
1,574 | 1,343 | 11,241 | |||||||||
|
|
|
|
|
|
|
|||||||
| Cash, end of period |
$ | 49,719 | $ | 1,574 | $ | 1,343 | ||||||
|
|
|
|
|
|
|
|||||||
Operating Activities
During 2014, net cash provided by operating activities was $6.6 million, as compared to $13.7 million in net cash used in operating activities during 2013, representing a $20.3 million year-to-year improvement. This $20.3 million improvement was primarily the result of a favorable year-to-year change in net loss adjusted for non-cash items of $4.9 million and a year-to-year improvement in cash from changes in operating assets and liabilities of $15.2 million.
During 2013, net cash used in operating activities was $13.7 million, as compared to $25.9 million in net cash used in operating activities during 2012, representing a $12.2 million year-to-year improvement. This improvement was primarily the result of a favorable year-to-year change in net loss adjusted for non-cash items of $17.2 million offset, in part, by a year-to-year increase in cash used to fund changes in operating assets and liabilities of $5.0 million.
Investing Activities
Net cash used in investing activities is primarily related to capital expenditures to support our growth. Net cash used in investing activities for 2014 and 2013 totaled $13.2 million and $3.3 million, respectively. Capital expenditures in 2014 and 2013 included amounts spent for machinery and equipment to improve the throughput and efficiency of our existing East Providence manufacturing operations. Capital expenditures in 2014 also included expenditures for machinery, equipment and construction of the third manufacturing line in our East Providence facility.
Financing Activities
Cash flows from financing activities primarily include (i) the net proceeds from the completion of our initial public offering, (ii) issuances of senior convertible notes and convertible notes, (iii) repayments of our subordinated notes, (iv) borrowings and repayments under our revolving credit facility, (v) repayments under capital leases, (vi) issuances of common stock, and (vii) related expenses.
68
Table of Contents
Net cash provided by financing activities for the year ended December 31, 2014 totaled $54.7 million. Financing activities during the period included $74.7 million of net proceeds from the initial public offering and $4.5 million for borrowings under the revolving credit facility, offset, in part, by $18.8 million of repayments on our subordinated notes, $5.5 million of repayments under the revolving credit facility and other payments of $0.2 million.
Net cash provided by financing activities in 2013 totaled $17.2 million and included $18.5 million in proceeds from the issuance of senior convertible notes and $19.9 million from borrowings under the revolving credit facility, offset, in part, by $20.2 million in repayments under our revolving credit facility and $0.9 million in payments for financing costs.
Capital Spending and Future Capital Requirements
We have made capital expenditures primarily to develop and expand our manufacturing capacity. Our capital expenditures totaled $13.2 million in 2014, $3.3 million in 2013 and $10.2 million in 2012. As of December 31, 2014, we had capital commitments of approximately $11.2 million, which included commitments for which we have entered into contracts as well as commitments authorized by our Board of Directors. These commitments relate to the improvement of our existing production lines and the construction of our third production line in the East Providence facility. These commitments consist of engineering costs, equipment costs, construction costs and related financing costs. We plan to fund these capital commitments from available cash proceeds of our IPO.
We estimate that design, development and construction of our third production line in the East Providence facility will cost approximately $30.8 million. Included in the third production line cost estimate is approximately $4.3 million of assets purchased prior to 2014. As of December 31, 2014, we have expended an aggregate of $22.7 million related to this effort. We intend to fund capital expenditures related to design, development and construction of our planned second manufacturing facility with the remaining proceeds from the IPO, cash flow from operations, local government grants and debt financings and potentially equity financings. We estimate that the total expenditures for the second plant infrastructure and the first production line in our second manufacturing facility will be approximately $80 million to $100 million.
We expect to make approximately $2.7 million in capital expenditures for environmental control facilities in 2015, most of which relate to emission control equipment to support our two existing production lines and the newly constructed third production line.
Off-Balance Sheet Arrangements
Since inception, we have not engaged in any off balance sheet activities as defined in Item 303(a)(4) of Regulation S-K.
Contractual Obligations and Commitments
The following table summarizes our contractual obligations as of December 31, 2014, under contracts that provide for fixed and determinable payments over the periods indicated:
| Contractual Obligations |
Total | Less than 1 Year |
1-3 Years | 4-5 Years | More than 5 Years |
|||||||||||||||
| ($ in thousands) | ||||||||||||||||||||
| Purchase order commitments |
$ | 6,873 | $ | 6,873 | $ | — | $ | — | $ | — | ||||||||||
| Supplier purchase commitments |
4,556 | 4,556 | ||||||||||||||||||
| Operating leases |
3,664 | 1,126 | 2,334 | 170 | 34 | |||||||||||||||
| Capital leases |
181 | 87 | 94 | |||||||||||||||||
| Accrued asset retirement obligations |
1,018 | — | 1,018 | — | — | |||||||||||||||
|
|
|
|
|
|
|
|
|
|
|
|||||||||||
| Total |
$ | 16,292 | $ | 12,642 | $ | 3,446 | $ | 170 | $ | 34 | ||||||||||
|
|
|
|
|
|
|
|
|
|
|
|||||||||||
69
Table of Contents
Operating and Capital Leases
We lease our office space for our corporate offices in Northborough, Massachusetts, which expires in 2016, and warehouse space and land nearby our East Providence facility, which expire at various dates from 2016 through 2021, under non-cancelable operating lease agreements. See “Item 2 — Properties.” We also lease vehicles and equipment under non-cancelable capital leases that expire at various dates.
Revolving Credit Facility
In March 2011, we entered into a $10 million revolving credit facility with Silicon Valley Bank. This facility has been amended at various dates through 2014. On September 3, 2014, the Company amended the loan and security agreement to extend the maturity date of the revolving credit facility to August 31, 2016 and to increase the maximum amount the Company is permitted to borrow, subject to continued covenant compliance and borrowing base requirements, from $10 million to $20 million. At our election, the interest rate applicable to borrowings under the amended revolving credit facility may be based on the prime rate or the LIBOR. Prime rate-based rates vary from prime rate plus 0.75% per annum to prime rate plus 1.75% per annum, while LIBOR-based rates vary from LIBOR plus 3.75% per annum to LIBOR plus 4.25% per annum. The amended revolving credit facility is secured by a first priority security interest in all assets of the Company, including those at the East Providence facility and proceeds from our intellectual property.
Accrued Asset Retirement Obligations
We have asset retirement obligations arising from requirements to perform certain asset retirement activities at the termination of our Northborough facility lease and upon disposal of certain machinery and equipment. The liability was initially measured at fair value and subsequently adjusted for accretion expense and changes in the amount or timing of the estimated cash flows. The corresponding asset retirement costs are capitalized as part of the carrying amount of the related long-lived asset and amortized over the asset’s remaining useful life.
Recent Accounting Pronouncements
In May 2014, the Financial Accounting Standards Board, or FASB, issued Accounting Standards Update, or ASU, 2014-09, Revenue from Contracts with Customers. The standard will eliminate the transaction- and industry-specific revenue recognition guidance under current U.S. GAAP and replace it with a principle based approach for determining revenue recognition. Public entities are required to apply the revenue recognition standard for annual reporting period beginning on or after December 15, 2016, including interim periods within that annual reporting period. Early application is not permitted. We have not yet selected a transition method and are evaluating the effect that the updated standard will have on our consolidated financial statements and related disclosures.
In August 2014, the FASB issued ASU 2014-15, Presentation of Financial Statements—Going Concern: Disclosure of Uncertainties about an Entity’s Ability to Continue as a Going Concern. The standard requires an entity’s management to evaluate whether there are conditions or events that raise substantial doubt about the entity’s ability to continue as a going concern within one year after the date that the financial statements are issued. Public entities are required to apply standards for annual reporting periods ending after December 15, 2016, and interim periods thereafter. Early application is permitted. We have early adopted this standard and it did not have a material impact on our consolidated financial statements.
From time to time, new accounting pronouncements are issued by the FASB or other standard setting bodies and adopted by the Company as of the specified effective date. Unless otherwise discussed, we believe that the impact of recently issued standards that are not yet effective will not have a material impact on our financial position or results of operations upon adoption.
70
Table of Contents
Critical Accounting Policies and Estimates
Our financial statements are prepared in accordance with accounting principles generally accepted in the United States of America. The preparation of our financial statements and related disclosures requires us to make estimates, assumptions and judgments that affect the reported amount of assets, liabilities, revenue, costs and expenses and related disclosures. We believe that the estimates, assumptions and judgments involved in these accounting policies have the greatest potential impact on our financial statements; and therefore, we consider these to be our critical accounting policies. Accordingly, we evaluate our estimates and assumptions on an ongoing basis. Our actual results may differ from these estimates under different assumptions and conditions. See note 2 to our consolidated financial statements included elsewhere in this Annual Report on Form 10-K for information about these critical accounting policies, as well as a description of our other significant accounting policies.
Revenue Recognition
We recognize product revenue from the sale of our line of aerogel products generally upon shipment or delivery, and research services revenue upon delivery of research and development services, including under contracts with various agencies of the U.S. government. Revenue is recognized when all of the following criteria are met: persuasive evidence of an arrangement exists, the price to the buyer is fixed or determinable, delivery has occurred or services have been provided and collectability is reasonably assured. Product revenue is recognized upon transfer of title and risk of loss, which is generally upon shipment or delivery. In general, our customary shipping terms are FOB shipping point. Products are typically delivered without significant post-sale obligations to customers other than standard warranty obligations for product defects. We provide warranties for our products and record the estimated cost within cost of sales in the period that the revenue is recorded. Our standard warranty period extends one to two years from the date of sale, depending on the type of product purchased. Our warranties provide that our products will be free from defects in material and workmanship, and will, under normal use, conform to the specifications for the product. For the years ended December 31, 2014, 2013 and 2012, warranty charges have been insignificant.
Research services revenue is derived from the execution of contracts awarded by the U.S. federal government, other government agencies and other institutions. Our research and development arrangements require us to provide research in which we investigate new applications of aerogel technology. We record revenue earned on research services contracts using the percentage-of-completion method in two ways: (1) for firm-fixed-price contracts, we accrue that portion of the total contract price that is allocable, on the basis of our estimates of costs incurred to date to total contract cost; (2) for cost-plus-fixed-fee contracts, we record revenue that is equal to total payroll cost incurred times a stated factor plus reimbursable expenses, to a stated upper limit. The primary cost in these arrangements is the labor effort expended in completing the research and the only deliverable other than labor hours expended is the reporting of the research results to the customer. Because the input measure of labor hours expended is also reflective of the output measure, it is a reliable means to measure the extent of progress towards completion. Contract costs and rates used to allocate overhead to contracts are subject to audit by the respective contracting government agency. Revisions in cost estimates and fees during the course of the contract are reflected in the accounting period in which the facts that require the revisions become known.
Stock-based Compensation
We maintain an equity incentive plan pursuant to which our board of directors may grant qualified and nonqualified stock options, restricted stock and restricted stock units to board members, officers, key employees and others who provide or have provided service to us.
We measure the costs associated with stock-based grants based on their estimated fair value at date of grant. We recognize the costs of stock-based awards as service or performance conditions are met. Future expense amounts for any particular quarterly or annual period could be affected by changes in our assumptions or changes in market conditions.
71
Table of Contents
Stock Options
We use the Black-Scholes option-pricing model to estimate the fair value of stock option awards. The determination of the estimated fair value of stock option awards is based on a number of complex and subjective assumptions. These assumptions include the determination of the estimated fair value of the underlying security (prior to the IPO), the expected volatility of the underlying security, a risk-free interest rate, the expected term of the option, and the forfeiture rate for the award class. The following assumptions were used to estimate the fair value of the option awards:
| Year Ended December 31 |
||||||||||||
| 2014 | 2013 | 2012 | ||||||||||
| Weighted-average assumptions: |
||||||||||||
| Expected term (in years) |
6.17 | 5.47 | 6.02 | |||||||||
| Expected volatility |
50.09 | % | 48.99 | % | 58.06 | % | ||||||
| Risk free rate |
1.94 | % | 1.69 | % | 0.95 | % | ||||||
| Expected dividend yield |
— | % | — | % | — | % | ||||||
| • | The expected term represents the period that our stock-based awards are expected to be outstanding and is determined using the simplified method described in ASC Topic 718, Compensation — Stock Compensation, for all grants. We believe this is a better representation of the estimated life than our actual limited historical exercise behavior. |
| • | For the years ended December 31, 2014, 2013 and 2012, the expected volatility is based on the weighted-average volatility of up to six companies within various industries that we believe are similar to our own. |
| • | The risk-free interest rate is based on U.S. Treasury zero-coupon issues with a remaining term equal to the expected life assumed at the date of grant. |
| • | We use an expected dividend yield of zero, since we do not intend to pay cash dividends on our common stock in the foreseeable future, nor have we paid dividends on our common stock in the past. |
As share-based compensation expense is recognized based on awards ultimately expected to vest, it has been reduced for an estimated forfeiture rate of 6.5% for the year ended December 31, 2014, and 3% for the years ended December 31, 2013 and 2012, respectively. Forfeitures are required to be estimated at the time of grant and revised, if necessary, in subsequent periods, if actual forfeitures differ from those estimates. Forfeitures were estimated based on voluntary termination behavior as well as analysis of actual option forfeitures.
For performance-based stock options issued during the year ended December 31, 2013, we used a Monte Carlo simulation model to estimate the number of options we expected to remain outstanding and eligible for vesting upon completion of an IPO. The simulation model was based on a number of complex assumptions including the terms of the performance condition, the expected value of our common stock at the time of an IPO, the expected time from the date of grant to an IPO, and expected volatility. The compensation cost of these performance-based options was determined by multiplying the Black-Scholes estimate of grant date fair value by the percentage of options expected to remain outstanding and eligible for vesting upon completion of an IPO. As a result of the closing of the IPO, the awards began vesting and we recorded $6.4 million of stock-based compensation related to these performance-based awards during the year ended December 31, 2014.
In September 2014, we issued non-qualified stock options, or NSOs to purchase 934,018 shares of common stock to employees under the 2014 Employee, Director and Consultant Equity Incentive Plan, or 2014 Equity Plan. The NSOs contain service-based vesting provisions over either a three or four year period.
Income Taxes
Income taxes are accounted for under the asset and liability method. Deferred tax assets and liabilities are recognized for the future tax consequences attributable to differences between the financial statement carrying
72
Table of Contents
amounts of existing assets and liabilities and their respective tax bases and operating loss and tax credit carryforwards. Deferred tax assets and liabilities are measured using enacted tax rates expected to apply to taxable income in the years in which those temporary differences are expected to be recovered or settled. The effect on deferred tax assets and liabilities of a change in tax rates is recognized in income in the period that includes the enactment date.
We recognize the effect of income tax positions only if those positions are more likely than not of being sustained. We account for uncertain tax positions using a recognition threshold and measurement attribute for the financial statement recognition and measurement of a tax position taken or expected to be taken in a tax return. Differences between tax positions taken in a tax return and amounts recognized in the financial statements are recorded as adjustments to income taxes payable or receivable, or adjustments to deferred taxes, or both. Changes in recognition or measurement are reflected in the period in which the change in judgment occurs. We recognize penalties and interest related to recognized tax positions, if any, as a component of income tax expense.
Management’s judgment and estimates are required in determining our tax provision, deferred tax assets and liabilities and any valuation allowance recorded against deferred tax assets. We review the recoverability of deferred tax assets during each reporting period by reviewing estimates of future taxable income, future reversals of existing taxable temporary differences and tax planning strategies that would, if necessary, be implemented to realize the benefit of a deferred tax asset before expiration. We have recorded a full valuation allowance against our deferred tax assets due to the uncertainty associated with the utilization of the net operating loss carryforwards. In assessing the realizability of deferred tax assets, we consider all available evidence, historical and prospective, with greater weight given to historical evidence, in determining whether it is more likely than not that some portion or all of the deferred tax assets will not be realized. The ultimate realization of our deferred tax assets generally is dependent upon generation of future taxable income.
Fair Value Option and Fair Value Measurements
ASC Subtopic 825-10 provides entities with an option to measure many financial instruments and certain other items at fair value. Under this guidance, unrealized gains and losses on items for which the fair value option has been elected are reported in earnings each reporting period. As a result of electing this option, we recorded our subordinated notes and convertible notes at fair value in order to measure these liabilities at an amount that more accurately reflects the economics of these instruments.
The fair value of the convertible notes was determined by utilizing a probability weighted discounted cash flow analysis. This analysis determined the amount to be paid on the notes in either cash or shares at the occurrence of certain events in which the convertible notes would be converted into shares of our common stock or would be repaid to the lender in cash. The probability weighted discounted cash flow analysis utilized assumptions related to the probability of each of the various events occurring and discount rates.
Based upon the above we had determined that the valuation of the subordinated notes and convertible notes were a Level 3 valuation as the valuation utilized several unobservable inputs. Accordingly, valuations of subordinated notes and convertible notes had required the input of highly subjective assumptions to create a probability weighted discounted cash flow analysis. These assumptions included significant judgments and estimates inherent in the determination of these valuations. These significant judgments included the time to and the probability of completing an initial public offering or other liquidity event and the appropriate valuation methods.
Impairment of Long-Lived Assets
Long-lived assets are reviewed for impairment whenever events or changes in circumstances indicate that the carrying amount of an asset may not be recoverable. Recoverability of assets to be held and used is measured by a comparison of the carrying amount of an asset to future undiscounted net cash flows expected to be
73
Table of Contents
generated by the asset. If the carrying amount of an asset exceeds its estimated undiscounted future cash flows, an impairment charge is recognized for the amount by which the carrying amount of the asset exceeds the fair value of the asset. Fair value is determined through various valuation techniques including discounted cash flows models, quoted market values and third-party independent appraisals, as considered necessary.
| Item 7A. | QUANTITATIVE AND QUALITATIVE DISCLOSURES ABOUT MARKET RISK |
Market risk represents the risk of loss that may impact our financial position due to adverse changes in financial market prices and rates. Our market risk exposure results primarily from fluctuations in interest rates as well as from inflation. In the normal course of business, we are exposed to market risks, including changes in interest rates which affect our line of credit under our revolving credit facility as well as cash flows. We may also face additional exchange rate risk in the future as we expand our business internationally.
Interest Rate Risk
We are exposed to changes in interest rates in the normal course of our business. At December 31, 2014, we had unrestricted cash of $49.7 million. These amounts were held for working capital and capital expansion purposes and were invested primarily in deposit and money market accounts at a major financial institution in North America Due to the short-term nature of these investments, we believe that our exposure to changes in the fair value of our cash as a result of changes in interest rates is not material.
As of December 31, 2014, we have no debt outstanding other than capital leases obligations of approximately $0.2 million with fixed interest rates. At December 31, 2014, we also had $1.4 million of outstanding letters of credit.
In September 2014, we amended our loan and security agreement to extend the maturity date of the revolving credit facility to August 31, 2016 and to increase the maximum amount we are permitted to borrow, subject to continued covenant compliance and borrowing base requirements, from $10 million to $20 million. At our election, the interest rate applicable to borrowings under the amended revolving credit facility may be based on the prime rate or the LIBOR. Prime rate-based rates vary from prime rate plus 0.75% per annum to prime rate plus 1.75% per annum, while LIBOR-based rates vary from LIBOR plus 3.75% per annum to LIBOR plus 4.25% per annum. In addition, we are required to pay a monthly unused revolving line facility fee of 0.5% per annum of the average unused portion of the revolving credit facility.
Due to the borrowing base limitations, the effective amount available to us under the revolving credit facility at December 31, 2014 is $12.4 million after giving effect to the $1.4 million of letters of credit outstanding. As of December 31, 2014, we had no outstanding balances drawn on the revolving credit facility.
Inflation Risk
Although we expect that our operating results will be influenced by general economic conditions, we do not believe that inflation has had a material effect on our results of operations during the periods presented in this report. However, our business may be affected by inflation in the future.
Foreign Currency Exchange Risk
We are subject to inherent risks attributed to operating in a global economy. Principally all of our revenue, receivables, purchases and debts are denominated in U.S. dollars but expansion of our international assets and operations will increase our potential exposure to fluctuations in foreign currencies.
| Item 8. | FINANCIAL STATEMENTS AND SUPPLEMENTARY DATA |
74
Table of Contents
Report of Independent Registered Public Accounting Firm
The Board of Directors and Stockholders
Aspen Aerogels, Inc.:
We have audited the accompanying consolidated balance sheets of Aspen Aerogels, Inc. and subsidiaries as of December 31, 2014 and 2013, and the related consolidated statements of operations, stockholders’ equity (deficit), and cash flows for each of the years in the three-year period ended December 31, 2014. These consolidated financial statements are the responsibility of the Company’s management. Our responsibility is to express an opinion on these consolidated financial statements based on our audits.
We conducted our audits in accordance with the standards of the Public Company Accounting Oversight Board (United States). Those standards require that we plan and perform the audit to obtain reasonable assurance about whether the financial statements are free of material misstatement. An audit includes examining, on a test basis, evidence supporting the amounts and disclosures in the financial statements. An audit also includes assessing the accounting principles used and significant estimates made by management, as well as evaluating the overall financial statement presentation. We believe that our audits provide a reasonable basis for our opinion.
In our opinion, the consolidated financial statements referred to above present fairly, in all material respects, the financial position of Aspen Aerogels, Inc. and subsidiaries as of December 31, 2014 and 2013, and the results of their operations and their cash flows for each of the years in the three-year period ended December 31, 2014, in conformity with U.S. generally accepted accounting principles.
/s/ KPMG LLP
Boston, Massachusetts
March 13, 2015
75
Table of Contents
ASPEN AEROGELS, INC.
Consolidated Balance Sheets
| December 31, | ||||||||
| 2014 | 2013 | |||||||
| (In thousands, except share and per share data) |
||||||||
| Assets |
||||||||
| Current assets: |
||||||||
| Cash and cash equivalents |
$ | 49,719 | $ | 1,574 | ||||
| Accounts receivable, net of allowance for doubtful accounts |
17,924 | 18,762 | ||||||
| Inventories |
4,897 | 6,892 | ||||||
| Prepaid expenses and other current assets |
836 | 791 | ||||||
|
|
|
|
|
|||||
| Total current assets |
73,376 | 28,019 | ||||||
| Property, plant and equipment, net |
71,492 | 62,023 | ||||||
| Other assets |
175 | 191 | ||||||
|
|
|
|
|
|||||
| Total assets |
$ | 145,043 | $ | 90,233 | ||||
|
|
|
|
|
|||||
| Liabilities, Convertible Preferred Stock and Stockholders’ Equity (Deficit) |
||||||||
| Current liabilities: |
||||||||
| Subordinated notes, current portion |
$ | — | $ | 17,306 | ||||
| Convertible notes, current portion |
— | 435 | ||||||
| Capital leases, current portion |
76 | 75 | ||||||
| Revolving line of credit |
— | 1,000 | ||||||
| Accounts payable |
14,202 | 7,114 | ||||||
| Accrued expenses |
5,588 | 4,814 | ||||||
| Deferred revenue |
292 | 595 | ||||||
| Other current liabilities |
50 | 50 | ||||||
|
|
|
|
|
|||||
| Total current liabilities |
20,208 | 31,389 | ||||||
| Senior convertible notes |
— | 28,135 | ||||||
| Convertible notes, excluding current portion |
— | 91,439 | ||||||
| Capital leases, excluding current portion |
89 | 165 | ||||||
| Other long-term liabilities |
1,030 | 1,071 | ||||||
|
|
|
|
|
|||||
| Total liabilities |
21,327 | 152,199 | ||||||
|
|
|
|
|
|||||
| Commitments and contingencies (Note 12) |
||||||||
| Stockholders’ equity (deficit): |
||||||||
| Series C convertible preferred stock, $0.00001 par value; no shares authorized, issued or outstanding at December 31, 2014; 116,024,242 shares authorized, 20,000 issued and outstanding at December 31, 2013 |
— | — | ||||||
| Series B convertible preferred stock, $0.00001 par value; no shares authorized, issued or outstanding at December 31, 2014; 1,601,053 shares authorized, issued and outstanding December 31, 2013 |
— | — | ||||||
| Series A convertible preferred stock, $0.00001 par value; no shares authorized, issued or outstanding at December 31, 2014; 5,284,347 shares authorized, issued and outstanding at December 31, 2013 |
— | — | ||||||
| Preferred Stock, $0.00001 par value; 5,000,000 shares authorized, no shares issued or outstanding at December 31, 2014; no shares authorized, issued and outstanding at December 31, 2013 |
— | — | ||||||
| Common stock, $0.00001 par value; 125,000,000 shares authorized, 22,992,273 shares issued and 22,992,273 outstanding at December 31, 2014; 255,702 shares authorized, 3,137 shares issued and outstanding at December 31, 2013 |
— | — | ||||||
| Additional paid-in capital |
522,800 | 270,794 | ||||||
| Accumulated deficit |
(399,084 | ) | (332,760 | ) | ||||
|
|
|
|
|
|||||
| Total stockholders’ equity (deficit) |
123,716 | (61,966 | ) | |||||
|
|
|
|
|
|||||
| Total liabilities, convertible preferred stock and stockholders’ equity (deficit) |
$ | 145,043 | $ | 90,233 | ||||
|
|
|
|
|
|||||
See accompanying notes to consolidated financial statements.
76
Table of Contents
ASPEN AEROGELS, INC.
Consolidated Statements of Operations
| Year Ended December 31, | ||||||||||||
| 2014 | 2013 | 2012 | ||||||||||
| (In thousands, except share and per share data) |
||||||||||||
| Revenue: |
||||||||||||
| Product |
$ | 99,259 | $ | 82,057 | $ | 60,389 | ||||||
| Research services |
3,140 | 4,037 | 3,064 | |||||||||
|
|
|
|
|
|
|
|||||||
| Total revenue |
102,399 | 86,094 | 63,453 | |||||||||
| Cost of revenue: |
||||||||||||
| Product |
83,677 | 73,399 | 70,025 | |||||||||
| Research services |
1,642 | 1,964 | 1,396 | |||||||||
|
|
|
|
|
|
|
|||||||
| Gross profit (loss) |
17,080 | 10,731 | (7,968 | ) | ||||||||
|
|
|
|
|
|
|
|||||||
| Operating expenses: |
||||||||||||
| Research and development |
5,980 | 5,159 | 5,142 | |||||||||
| Sales and marketing |
10,290 | 9,271 | 8,564 | |||||||||
| General and administrative |
16,853 | 12,833 | 11,299 | |||||||||
| Write-off of construction in progress |
— | 3,440 | — | |||||||||
|
|
|
|
|
|
|
|||||||
| Total operating expenses |
33,123 | 30,703 | 25,005 | |||||||||
|
|
|
|
|
|
|
|||||||
| Income (loss) from operations |
(16,043 | ) | (19,972 | ) | (32,973 | ) | ||||||
|
|
|
|
|
|
|
|||||||
| Other income (expense): |
||||||||||||
| Interest expense |
(50,281 | ) | (30,599 | ) | (21,790 | ) | ||||||
| Gain on extinguishment of convertible notes |
— | 8,898 | — | |||||||||
| Loss on exchange of convertible notes |
— | (5,697 | ) | — | ||||||||
| Debt extinguishment costs |
— | — | (1,379 | ) | ||||||||
| Costs associated with postponed public offering |
— | (241 | ) | — | ||||||||
|
|
|
|
|
|
|
|||||||
| Total other income (expense), net |
(50,281 | ) | (27,639 | ) | (23,169 | ) | ||||||
|
|
|
|
|
|
|
|||||||
| Net income (loss) |
$ | (66,324 | ) | $ | (47,611 | ) | $ | (56,142 | ) | |||
|
|
|
|
|
|
|
|||||||
| Net income (loss) attributable to common stockholders |
$ | (66,324 | ) | $ | 1,338 | $ | (8,941 | ) | ||||
|
|
|
|
|
|
|
|||||||
| Net income (loss) attributable to common stockholders per common share: |
||||||||||||
| Basic |
$ | (5.37 | ) | $ | 426.52 | $ | (2,851.08 | ) | ||||
|
|
|
|
|
|
|
|||||||
| Diluted |
$ | (5.37 | ) | $ | 410.56 | $ | (2,851.08 | ) | ||||
|
|
|
|
|
|
|
|||||||
| Weighted-average common shares outstanding: |
||||||||||||
| Basic |
12,349,456 | 3,137 | 3,136 | |||||||||
|
|
|
|
|
|
|
|||||||
| Diluted |
12,349,456 | 3,259 | 3,136 | |||||||||
|
|
|
|
|
|
|
|||||||
See accompanying notes to consolidated financial statements.
77
Table of Contents
ASPEN AEROGELS, INC.
Consolidated Statements of Stockholders’ Equity (Deficit)
(In thousands, except share and per share data)
| Series C convertible preferred stock $0.00001 Par Value |
Series B convertible preferred stock $0.00001 Par Value |
Series A convertible preferred stock $0.00001 Par Value |
Preferred Stock $0.00001 Par Value |
Common Stock $0.00001 Par Value |
Additional Paid-in Capital |
Accumulated Deficit |
Total Stockholders’ Equity (Deficit) |
|||||||||||||||||||||||||||||||||||||||||||||
| Shares | Value | Shares | Value | Shares | Value | Shares | Value | Shares | Value | |||||||||||||||||||||||||||||||||||||||||||
| Balance at December 31, 2011 |
— | $ | — | — | $ | — | — | $ | — | — | $ | — | 3,134 | $ | — | $ | 115,494 | $ | (229,007 | ) | $ | (113,513 | ) | |||||||||||||||||||||||||||||
| Net income (loss) |
— | — | — | — | — | — | — | — | — | — | — | (56,142 | ) | (56,142 | ) | |||||||||||||||||||||||||||||||||||||
| Issuance of common stock |
— | — | — | — | — | — | — | — | 3 | — | 5 | — | 5 | |||||||||||||||||||||||||||||||||||||||
| Stock compensation expense |
— | — | — | — | — | — | — | — | — | — | 1,654 | — | 1,654 | |||||||||||||||||||||||||||||||||||||||
| Dividends on redeemable convertible preferred stock |
— | — | — | — | — | — | — | — | — | — | (4,191 | ) | — | (4,191 | )) | |||||||||||||||||||||||||||||||||||||
| Changes in redeemable convertible preferred stock to redemption value |
— | — | — | — | — | — | — | — | — | — | 51,392 | — | 51,392 | |||||||||||||||||||||||||||||||||||||||
|
|
|
|
|
|
|
|
|
|
|
|
|
|
|
|
|
|
|
|
|
|
|
|
|
|
|
|||||||||||||||||||||||||||
| Balance at December 31, 2012 |
— | — | — | — | — | — | — | — | 3,137 | — | 164,354 | (285,149 | ) | (120,795 | ) | |||||||||||||||||||||||||||||||||||||
| Net income (loss) |
— | — | — | — | — | — | — | — | — | — | — | (47,611 | ) | (47,611 | ) | |||||||||||||||||||||||||||||||||||||
| Stock compensation expense |
— | — | — | — | — | — | — | — | — | — | 4,426 | — | 4,426 | |||||||||||||||||||||||||||||||||||||||
| Dividends on redeemable convertible preferred stock |
— | — | — | — | — | — | — | — | — | — | (996 | ) | — | (996 | ) | |||||||||||||||||||||||||||||||||||||
| Changes in redemption value of redeemable convertible preferred stock at extinguishment |
— | — | — | — | — | — | — | — | — | — | 86,161 | — | 86,161 | |||||||||||||||||||||||||||||||||||||||
| Reclassification of redeemable convertible preferred stock from temporary to permanent equity |
— | — | 1,601,053 | — | 5,284,347 | — | — | — | — | — | 1,085 | — | 1,085 | |||||||||||||||||||||||||||||||||||||||
| Issuance of Series C convertible preferred stock |
20,000 | — | — | — | — | — | — | — | — | — | — | — | — | |||||||||||||||||||||||||||||||||||||||
| Issuance of Series C preferred stock warrants, net of issuance costs |
— | — | — | — | — | — | — | — | — | — | 15,764 | — | 15,764 | |||||||||||||||||||||||||||||||||||||||
|
|
|
|
|
|
|
|
|
|
|
|
|
|
|
|
|
|
|
|
|
|
|
|
|
|
|
|||||||||||||||||||||||||||
| Balance at December 31, 2013 |
20,000 | — | 1,601,053 | — | 5,284,347 | — | — | — | 3,137 | — | 270,794 | (332,760 | ) | (61,966 | ) | |||||||||||||||||||||||||||||||||||||
| Net income (loss) |
— | — | — | — | — | — | — | — | — | — | — | (66,324 | ) | (66,324 | ) | |||||||||||||||||||||||||||||||||||||
| Issuance of common stock |
— | — | — | — | — | — | — | — | 31 | — | 3 | — | 3 | |||||||||||||||||||||||||||||||||||||||
| Stock compensation expense |
— | — | — | — | — | — | — | — | — | — | 8.781 | — | 8,781 | |||||||||||||||||||||||||||||||||||||||
| Net cashless exercise of Series C warrants |
86,997,362 | — | — | — | — | — | — | — | — | — | — | — | — | |||||||||||||||||||||||||||||||||||||||
| Conversion of convertible preferred stock to common stock |
(87,017,362 | ) | — | (1,601,053 | ) | — | (5,284,347 | ) | — | — | — | 115,982 | — | — | — | — | ||||||||||||||||||||||||||||||||||||
| Conversion of convertible debt to common stock |
— | — | — | — | — | — | — | — | 15,319,034 | — | 168,510 | — | 168,510 | |||||||||||||||||||||||||||||||||||||||
| Proceeds from initial public offering, net of issuance costs |
— | — | — | — | — | — | — | — | 7,500,000 | — | 74,712 | — | 74,712 | |||||||||||||||||||||||||||||||||||||||
| Issuance of restricted stock |
— | — | — | — | — | — | — | — | 61,816 | — | — | — | — | |||||||||||||||||||||||||||||||||||||||
| Forfeiture of restricted stock |
— | — | — | — | — | — | — | — | (7,727 | ) | — | — | — | — | ||||||||||||||||||||||||||||||||||||||
|
|
|
|
|
|
|
|
|
|
|
|
|
|
|
|
|
|
|
|
|
|
|
|
|
|
|
|||||||||||||||||||||||||||
| Balance at December 31, 2014 |
— | $ | — | — | $ | — | — | $ | — | — | $ | — | 22,992,273 | $ | — | $ | 522,800 | $ | (399,084 | ) | $ | 123,716 | ||||||||||||||||||||||||||||||
|
|
|
|
|
|
|
|
|
|
|
|
|
|
|
|
|
|
|
|
|
|
|
|
|
|
|
|||||||||||||||||||||||||||
See accompanying notes to consolidated financial statements.
78
Table of Contents
ASPEN AEROGELS, INC.
Consolidated Statements of Cash Flows
| Year Ended December 31, | ||||||||||||
| 2014 | 2013 | 2012 | ||||||||||
| (In thousands) | ||||||||||||
| Cash flows from operating activities: |
||||||||||||
| Net income (loss) |
$ | (66,324 | ) | $ | (47,611 | ) | $ | (56,142 | ) | |||
| Adjustments to reconcile net income (loss) to net cash provided by (used in) operating activities: |
||||||||||||
| Depreciation and amortization |
10,183 | 10,061 | 9,684 | |||||||||
| Write-off of construction in progress |
— | 3,440 | — | |||||||||
| Loss on disposal of assets |
119 | 230 | 2,489 | |||||||||
| Debt issuance costs and noncash interest expenses |
47 | 998 | 2,959 | |||||||||
| Write-off of costs associated with postponed public offering |
— | 241 | — | |||||||||
| Accretion of debt to fair value |
50,011 | 18,696 | 18,678 | |||||||||
| Gain on extinguishment of convertible notes |
— | (8,898 | ) | — | ||||||||
| Loss on exchange of convertible notes |
— | 5,697 | — | |||||||||
| Issuance of Series C preferred stock warrants in connection with senior convertible notes |
— | 10,677 | — | |||||||||
| Stock compensation expense |
8,781 | 4,426 | 1,654 | |||||||||
| Loss on extinguishment of debt |
— | — | 1,379 | |||||||||
| Other |
(31 | ) | (25 | ) | (2 | ) | ||||||
| Changes in operating assets and liabilities: |
||||||||||||
| Accounts receivable |
838 | (4,809 | ) | (6,796 | ) | |||||||
| Inventories |
1,995 | (547 | ) | 3,177 | ||||||||
| Prepaid expenses and other assets |
(129 | ) | (287 | ) | (2 | ) | ||||||
| Accounts payable |
687 | (1,686 | ) | 1,676 | ||||||||
| Accrued expenses |
774 | 2,297 | 1,086 | |||||||||
| Deferred revenue |
(303 | ) | (588 | ) | 281 | |||||||
| Other liabilities |
— | (6,000 | ) | (6,000 | ) | |||||||
|
|
|
|
|
|
|
|||||||
| Net cash provided by (used in) operating activities |
6,648 | (13,688 | ) | (25,879 | ) | |||||||
|
|
|
|
|
|
|
|||||||
| Cash flows from investing activities: |
||||||||||||
| Capital expenditures |
(13,241 | ) | (3,329 | ) | (10,236 | ) | ||||||
| Decrease in restricted cash |
— | — | 451 | |||||||||
|
|
|
|
|
|
|
|||||||
| Net cash used in investing activities |
(13,241 | ) | (3,329 | ) | (9,785 | ) | ||||||
|
|
|
|
|
|
|
|||||||
| Cash flows from financing activities: |
||||||||||||
| Borrowings under line of credit |
4,500 | 19,929 | 25,515 | |||||||||
| Repayments under line of credit |
(5,500 | ) | (20,267 | ) | (24,177 | ) | ||||||
| Proceeds from issuance of long-term debt |
— | 18,500 | 24,890 | |||||||||
| Repayment of borrowings under long-term debt |
(18,849 | ) | — | — | ||||||||
| Financing costs |
(47 | ) | (872 | ) | (425 | ) | ||||||
| Proceeds from initial public offering |
74,712 | — | — | |||||||||
| Repayment of obligations under capital lease |
(80 | ) | (42 | ) | (42 | ) | ||||||
| Proceeds from issuance of common stock |
2 | — | 5 | |||||||||
|
|
|
|
|
|
|
|||||||
| Net cash provided by financing activities |
54,738 | 17,248 | 25,766 | |||||||||
|
|
|
|
|
|
|
|||||||
| Net increase (decrease) in cash |
48,145 | 231 | (9,898 | ) | ||||||||
| Cash at beginning of period |
1,574 | 1,343 | 11,241 | |||||||||
|
|
|
|
|
|
|
|||||||
| Cash at end of period |
$ | 49,719 | $ | 1,574 | $ | 1,343 | ||||||
|
|
|
|
|
|
|
|||||||
| Supplemental disclosures of cash flow information: |
||||||||||||
| Interest paid |
$ | 223 | $ | 228 | $ | 152 | ||||||
|
|
|
|
|
|
|
|||||||
| Income taxes paid |
$ | — | $ | — | $ | — | ||||||
|
|
|
|
|
|
|
|||||||
| Supplemental disclosures of non-cash activities: |
||||||||||||
| Conversion of convertible and senior convertible notes to common stock |
$ | 168,510 | $ | — | $ | — | ||||||
|
|
|
|
|
|
|
|||||||
| Accrued dividends on preferred stock |
$ | — | $ | 996 | $ | 4,191 | ||||||
|
|
|
|
|
|
|
|||||||
| Changes in redemption value of redeemable convertible preferred stock |
$ | — | $ | (86,161 | ) | $ | (51,392 | ) | ||||
|
|
|
|
|
|
|
|||||||
| Reclassification of redeemable convertible preferred stock from temporary to permanent equity |
$ | — | $ | (1,085 | ) | $ | — | |||||
|
|
|
|
|
|
|
|||||||
| Changes in accrued capital expenditures |
$ | 6,401 | $ | (523 | ) | $ | (38 | ) | ||||
|
|
|
|
|
|
|
|||||||
| Capitalized interest |
$ | 34 | $ | 70 | $ | 2,270 | ||||||
|
|
|
|
|
|
|
|||||||
| Capital lease |
$ | 5 | $ | 160 | $ | — | ||||||
|
|
|
|
|
|
|
|||||||
See accompanying notes to consolidated financial statements.
79
Table of Contents
ASPEN AEROGELS, INC.
NOTES TO CONSOLIDATED FINANCIAL STATEMENTS
(1) Description of Business
Nature of Business
Aspen Aerogels, Inc. (the Company) is an energy technology company that designs, develops and manufactures innovative, high-performance aerogel insulation. The Company also conducts research and development related to aerogel technology supported by funding from several agencies of the U.S. government and other institutions in the form of research and development contracts.
The Company maintains its corporate offices in Northborough, Massachusetts. The Company has two wholly owned subsidiaries: Aspen Aerogels Rhode Island, LLC and Aspen Aerogels Germany, GmbH.
On June 18, 2014, the Company completed an initial public offering (IPO) of 7,500,000 shares of its common stock at a public offering price of $11.00 per share. The Company received net proceeds of $74.7 million after deducting underwriting discounts and commissions of $4.3 million and offering expenses of approximately $3.5 million. Upon the closing of the offering, all of the Company’s then-outstanding (i) warrants to purchase Series C preferred stock, (the “Series C warrants”) were subject to an automatic net cashless exercise, (ii) convertible preferred stock (including the shares of Series C preferred stock issued upon the automatic net cashless exercise of Series C warrants) automatically converted into 115,982 shares of common stock, and (iii) Convertible Notes (see note 8) and Senior Convertible Notes (see note 7) automatically converted into 15,319,034 shares of common stock.
Prior to the closing of the offering, the Company completed a 1-for-824.7412544 reverse stock split of its common stock. All common shares and related per share amounts in the financial statements and notes have been adjusted retroactively to reflect the reverse stock split.
(2) Summary of Basis of Presentation and Significant Accounting Policies
Principles of Consolidation
The accompanying consolidated financial statements, which have been prepared in accordance with generally accepted accounting principles in the United States of America, include the accounts of the Company and its wholly owned subsidiaries. All intercompany balances and transactions have been eliminated in consolidation.
Reclassification
The December 31, 2013 balance sheet reflects a $0.2 million reclassification of the Company’s sales returns reserve from a component of accrued expenses to a reduction of accounts receivable, a $0.1 million reclassification of other assets to prepaid expenses and other current assets and a reclassification of $0.1 million of other long term liabilities to other current liabilities to conform to the current period’s presentation. The change has no impact on the results of operations.
Use of Estimates
The preparation of the consolidated financial statements requires the Company to make a number of estimates and assumptions that affect the reported amounts of assets and liabilities at the date of the consolidated financial statements and the reported amounts of revenues and expenses during the reporting period. Significant items subject to such estimates and assumptions include allowances for doubtful accounts, inventory valuation, the carrying amount of property and equipment, fair value of debt and capital stock, stock-based compensation
80
Table of Contents
and deferred income taxes. The Company evaluates its estimates and assumptions on an on-going basis using historical experience and other factors, including the current economic environment, which it believes to be reasonable under the circumstances. Management adjusts such estimates and assumptions when facts and circumstances dictate. Illiquid credit markets, volatile equity markets and declines in business investment increase the uncertainty inherent in such estimates and assumptions. As future events and their effects cannot be determined with precision, actual results could differ significantly from these estimates. Changes in these estimates resulting from continuing changes in the economic environment will be reflected in the financial statements in future periods.
Cash & Cash Equivalents
Cash equivalents include short-term, highly liquid instruments, which consist of money market accounts. All cash and cash equivalents are maintained with major financial institutions in North America. Deposits with these financial institutions may exceed the amount of insurance provided on such deposits; however, these deposits typically may be redeemed upon demand and, therefore, bear minimal risk.
Fair Value of Financial Instruments
Fair value is an exit price that represents the amount that would be received from the sale of an asset or paid to transfer a liability in an orderly transaction between market participants. Accordingly, fair value is a market-based measurement that should be determined based on assumptions that market participants would use in pricing an asset or liability. The Company discloses the manner in which fair value is determined for assets and liabilities based on a three-tiered fair value hierarchy. The hierarchy ranks the quality and reliability of the information used to determine the fair values. The three levels of inputs described in the standard are:
Level 1: Quoted prices in active markets for identical assets or liabilities.
Level 2: Observable inputs, other than Level 1 prices, for the assets or liabilities, either directly or indirectly, for substantially the full term of the assets or liabilities.
Level 3: Unobservable inputs that are supported by little or no market activity and that are significant to the fair value of the assets or liabilities. Under the Fair Value Option Subsections of Financial Accounting Standards Board (FASB) ASC Subtopic 825-10, Financial Instruments — Overall, the Company has the irrevocable option to report most financial assets and financial liabilities at fair value on an instrument by instrument basis, with changes in fair value reported in earnings each reporting period. As a result of electing this option, the Company recorded its Subordinated Notes, Senior Convertible Notes and Convertible Notes at fair value in order to measure these liabilities at amounts that more accurately reflect the economics of these instruments (see notes 6, 7 and 8).
At December 31, 2014, no financial assets or liabilities were measured at fair value. At December 31, 2013, the Company’s Subordinated Notes, Senior Convertible Notes and Convertible Notes were valued utilizing Level 3 inputs.
Concentration of Credit Risk
Financial instruments, which potentially expose the Company to concentrations of credit risk, consist principally of accounts receivable. The Company’s customers consist primarily of insulation distributors, insulation contractors and select end-users located throughout the world. The Company performs ongoing credit evaluations of its customers’ financial condition and generally requires no collateral to secure accounts receivable. The Company maintains an allowance for doubtful accounts based on its assessment of the collectability of accounts receivable. The Company reviews the allowance for doubtful accounts quarterly. The Company has not experienced any meaningful non-payment or write-offs of accounts receivable. Accordingly, the allowance for doubtful accounts was zero at December 31, 2014 and 2013. The Company does not have any off-balance-sheet credit exposure related to its customers.
81
Table of Contents
For the year ended December 31, 2014, two customers represented 13% and 12% of total revenue, respectively. For the year ended December 31, 2013, two customers represented 15% and 11% of total revenue, respectively. For the year ended December 31, 2012, one customer represented 13% of total revenue.
At December 31, 2014, the Company had three customers that accounted for 17%, 17% and 11% of accounts receivable, respectively. At December 31, 2013, the Company had three customers that accounted for 20%, 14% and 11% of accounts receivable, respectively.
Inventories
Inventory consists of finished products and raw materials. Inventories are carried at lower of cost, determined using the first-in, first-out (FIFO) method, or market. Cost includes materials, labor and manufacturing overhead. Manufacturing overhead is allocated to the costs of conversion based on normal capacity of the Company’s production facility. Abnormal freight, handling costs and material waste is expensed in the period it occurs.
The Company periodically reviews its inventories and makes provisions as necessary for estimated excess, obsolete or damaged goods to ensure values approximate the lower of cost or market. The amount of any such provision is equal to the difference between the cost of inventory and the estimated market value based upon assumptions about future demand, selling prices and market conditions.
Property, Plant and Equipment, Net
Property, plant and equipment are stated at cost. Assets held under capital leases are stated at the lesser of the present value of future minimum payments, using the Company’s incremental borrowing rate, or the fair value of the property at the inception of the lease. Expenditures for maintenance and repairs are charged to expense as incurred, whereas major betterments are capitalized as additions to property, plant and equipment.
Interest expense capitalization commences at the time a capital project begins construction and concludes when the project is completed. The Company has capitalized interest costs as part of the historical cost of constructing its manufacturing facilities. The Company capitalized less than $0.1 million, $0.1 million and $2.3 million in interest costs related to the build-out of the East Providence facility during the years ended December 31, 2014, 2013 and 2012, respectively.
Depreciation on plant and equipment is calculated on the straight-line method over the estimated useful lives of the assets. Assets related to capital leases are amortized on a straight-line basis over the shorter of the lease term or estimated useful life of the asset.
Assets utilized in the Company’s operations that are taken out of service with no future use are charged to cost of sales or operating expenses, depending on the department in which the asset was utilized. Write-offs of construction in progress are charged to operating expenses upon the determination of no future use.
Other Assets
Other assets primarily include long-term deposits and patent costs. Patent costs are amortized over the life of the patent.
Impairment of Long-Lived Assets
Long-lived assets are reviewed for impairment whenever events or changes in circumstances indicate that the carrying amount of an asset or asset group may not be recoverable. Recognition and measurement of a potential impairment is performed on assets grouped with other assets and liabilities at the lowest level where
82
Table of Contents
identifiable cash flows are largely independent of the cash flows of other assets and liabilities. Recoverability of assets to be held and used is measured by a comparison of the carrying amount of an asset or asset group to future undiscounted net cash flows expected to be generated by the asset or asset group. If the carrying amount of an asset or asset group exceeds its estimated undiscounted future cash flows, an impairment charge is recognized for the amount by which the carrying amount of the asset or asset group exceeds the fair value of the asset or asset group. Fair value is determined through various valuation techniques including discounted cash flows models, quoted market values and third-party independent appraisals, as considered necessary.
Asset Retirement Obligations
The Company records asset retirement obligations associated with its lease obligations and the retirement of tangible long-lived assets. The Company reviews legal obligations associated with the retirement of long-lived assets that result from contractual obligations or the acquisition, construction, development and/or normal use of the assets. If it is determined that a legal obligation exists, regardless of whether the obligation is conditional on a future event, the fair value of the liability for an asset retirement obligation is recognized in the period in which it is incurred, if a reasonable estimate of fair value can be made. An amount equal to the fair value of the liability is also recorded as a long-term asset that is depreciated over the estimated life of the asset. The difference between the gross expected future cash outflow and its present value is accreted over the life of the related lease as an operating expense.
Deferred Revenue
The Company records deferred revenue for product sales when (i) the Company has delivered products but other revenue recognition criteria have not been satisfied or (ii) payments have been received in advance of products being delivered.
Redeemable Convertible Preferred Stock
The Company’s Series A and Series B redeemable convertible preferred stock were classified as temporary equity and shown net of issuance costs at December 31, 2012. The Company recognized changes in the redemption value and adjusted the carrying amount of the redeemable convertible preferred stock to equal the redemption value at the end of each reporting period.
As part of an amendment to its certificate of incorporation in 2013, the Company changed the terms of its redeemable convertible preferred stock such that the fair value of the shares immediately after the amendment was significantly different from the fair value of the shares immediately before the amendment. Accordingly, the Company accounted for the amendment as an extinguishment. The change in fair value upon extinguishment was recorded in additional paid-in capital (see note 13).
Revenue Recognition
The Company recognizes revenue from the sale of products and delivery of research and development services. Revenue is recognized when all of the following criteria are met: persuasive evidence of an arrangement exists, the price to the buyer is fixed or determinable, delivery has occurred or services have been provided, and collectability is reasonably assured.
Product Revenue
Product revenue is generally recognized upon transfer of title and risk of loss, which is generally upon shipment or delivery. The Company’s customary shipping terms are free on board (FOB) shipping point; however, some products are shipped using FOB destination shipping terms. Revenue associated with products shipped FOB destination is recognized when the products reach their specified destination. Products are typically delivered without significant post-sale obligations to customers.
83
Table of Contents
Sales returns are recorded based on historical sales and return information. Products that exhibit unusual sales return patterns due to quality or other manufacturing matters are specifically investigated and analyzed as part of the sales return accrual. The sales return accrual represents a reserve for products that may be returned due to quality concerns or authorized for destruction in the field. Sales return reserves are recorded at full original sales value. The Company rarely exchanges products from inventory for returned products. Sales return reserves were $0.1 million and $0.2 million at December 31, 2014 and 2013, respectively.
Warranty
The Company provides warranties for its products and records the estimated cost within cost of sales in the period that the related revenue is recorded. The Company’s standard warranty period extends one to two years from the date of sale, depending on the type of product purchased. The warranties provide that the Company’s products will be free from defects in material and workmanship, and will, under normal use, conform to the specifications for the product. For the years ended December 31, 2014, 2013 and 2012, warranty claims and charges have been insignificant.
Research Services Revenue
The Company performs research services under contracts with various government agencies and other institutions. The Company records revenue earned on research services contracts using the percentage-of-completion method in two ways: (1) for firm-fixed-price contracts, the Company accrues that portion of the total contract price that is allocable, on the basis of the Company’s estimates of costs incurred to date to total contract costs; (2) for cost-plus-fixed-fee contracts, the Company records revenue that is equal to total payroll cost incurred times a stated factor plus reimbursable expenses, to a stated upper limit. The primary cost is the labor effort expended in completing research and the only deliverable other than the labor hours expended is reporting of research results to the customer. Because the input measure of labor hours expended is also reflective of the output measure, it is a reliable means to measure the extent of progress towards completion. Revisions in cost estimates and fees during the course of the contract are reflected in the accounting period in which the facts that require the revisions become known.
Provision is made for the entire amount of future estimated losses on contracts when the current contract estimate is a loss while claims for additional contract compensation are not reflected in the accounts until the year in which such claims are identifiable and receipt is probable. Contract costs and rates used to allocate overhead to contracts are subject to audit by the respective contracting government agency. Adjustments to revenue as a result of audit are recorded in the period they become known. Adjustments to revenue as a result of audit have been insignificant.
Shipping and Handling Costs
Shipping and handling costs are classified as a component of cost of revenue. Customer payments of shipping and handling costs are recorded as product revenue.
Stock-based Compensation
Stock-based compensation cost is measured at the grant date based on the fair value of the award. Expense is recognized on a straight-line basis over the requisite service period for all awards with service conditions. For performance-based awards, the grant date fair value is recognized as expense when the condition is probable of being achieved, and then on a graded basis over the requisite service period. The Company uses the Black-Scholes option-pricing model to determine the fair value of service-based option awards, which requires a number of complex and subjective assumptions including fair value of the underlying security, the expected volatility of the underlying security, a risk-free interest rate and the expected term of the option. The fair value of restricted stock and restricted stock unit grants is determined using the closing trading price of the Company’s
84
Table of Contents
common stock on the date of grant. For performance-based stock options issued during the year ended December 31, 2013, the Company used a Monte Carlo simulation model to estimate the number of options the Company expected to remain outstanding and eligible for vesting upon completion of an IPO. The simulation model was based on a number of complex assumptions including the terms of the performance condition, the expected value of the Company’s common stock at the time of its IPO, the expected time from the date of grant to its IPO, and expected volatility. The compensation cost of these performance-based options was determined by multiplying the Black-Scholes estimate of grant date fair value by the percentage of options expected to remain outstanding and eligible for vesting upon completion of the Company’s IPO.
Research and Development
Costs incurred in the research and development of the Company’s products are expensed as incurred and include compensation and related costs, services provided by third-party contractors, materials and supplies and are classified as research and development expenses. Research and development costs directly associated with research services revenue are classified as research services in cost of revenue.
Earnings Per Share
Prior to the IPO, net income (loss) per common share was calculated using the two-class method, which is an earnings allocation formula that determines net income (loss) per share for the holders of the Company’s common shares and participating securities. Prior to their conversion to common stock at the time of the Company’s IPO, the Company’s Series A preferred stock, Series B preferred stock, Series C preferred stock and Series C preferred stock warrants contained participation rights in any dividend to be paid by the Company to holders of its common shares and were deemed to be participating securities. Net income (loss) available to common shareholders and participating securities was allocated to each share on an as-if-converted basis as if all of the earnings for the period had been distributed. The participating securities did not include a contractual obligation to share in losses of the Company and were not included in the calculation of net loss per share in the periods that have a net loss.
Diluted net income (loss) per share is computed using the more dilutive of (a) the two-class method, or (b) the if-converted method. The Company allocates net income (loss) first to preferred stockholders and holders of warrants to purchase preferred stock based on dividend rights and then to common stockholders, preferred stockholders and preferred warrant holders based on ownership interests. The weighted-average number of common shares included in the computation of diluted net income (loss) gives effect to all potentially dilutive common equivalent shares, including outstanding stock options and warrants. Common equivalent shares are excluded from the computation of diluted net income (loss) per share if their effect is antidilutive.
Subsequent to the IPO, the Company calculates net income (loss) per common share based on the weighted-average number of common shares outstanding during each period. Potential common stock equivalents are determined using the treasury stock method. The weighted-average number of common shares included in the computation of diluted net income (loss) gives effect to all potentially dilutive common equivalent shares, including outstanding stock options, restricted stock units and warrants. Common equivalent shares are excluded from the computation of diluted net income (loss) per share if their effect is antidilutive.
Income Taxes
Income taxes are accounted for under the asset and liability method. Deferred tax assets and liabilities are recognized for the future tax consequences attributable to differences between the financial statement carrying amounts of existing assets and liabilities and their respective tax bases and operating loss and tax credit carryforwards. Deferred tax assets and liabilities are measured using enacted tax rates expected to apply to taxable income in the years in which those temporary differences are expected to be recovered or settled. The effect on deferred tax assets and liabilities of a change in tax rates is recognized in income in the period that includes the enactment date.
85
Table of Contents
The Company recognizes the effect of income tax positions only if those positions are more likely than not of being sustained. The Company accounts for uncertain tax positions using a recognition threshold and measurement attribute for the financial statement recognition and measurement of a tax position taken or expected to be taken in a tax return. Differences between tax positions taken in a tax return and amounts recognized in the financial statements are recorded as adjustments to income taxes payable or receivable, or adjustments to deferred taxes, or both. Changes in recognition or measurement are reflected in the period in which the change in judgment occurs. The Company recognizes penalties and interest related to uncertain tax positions, if any, as a component of income tax expense.
Segments
Operating segments are identified as components of an enterprise about which separate, discrete financial information is available for evaluation by the chief operating decision maker in making decisions on how to allocate resources and assess performance. The Company’s chief operating decision maker is the Chief Executive Officer. The Company’s chief operating decision maker reviews consolidated operating results to make decisions about allocating resources and assessing performance for the entire Company. The Company views its operations and manages its business as one operating segment.
Information about the Company’s revenues, based on shipment destination or research services location, is presented in the following table:
| Year Ended December 31 | ||||||||||||
| 2014 | 2013 | 2012 | ||||||||||
| (In thousands) | ||||||||||||
| Revenue: |
||||||||||||
| U.S. |
$ | 39,809 | $ | 30,164 | $ | 19,909 | ||||||
| International |
62,590 | 55,930 | 43,544 | |||||||||
|
|
|
|
|
|
|
|||||||
| Total |
$ | 102,399 | $ | 86,094 | $ | 63,453 | ||||||
|
|
|
|
|
|
|
|||||||
Recently Issued Accounting Standards
In May 2014, the FASB issued Accounting Standards Update (ASU) 2014-09, Revenue from Contracts with Customers. The standard will eliminate the transaction- and industry-specific revenue recognition guidance under current U.S. GAAP and replace it with a principle based approach for determining revenue recognition. Public entities are required to apply the revenue recognition standard for annual reporting period beginning on or after December 15, 2016, including interim periods within that annual reporting period. Early application is not permitted. The Company has not yet selected a transition method and is evaluating the effect that the updated standard will have on its consolidated financial statements and related disclosures.
In August 2014, the FASB issued ASU 2014-15, Presentation of Financial Statements—Going Concern: Disclosure of Uncertainties about an Entity’s Ability to Continue as a Going Concern. The standard requires an entity’s management to evaluate whether there are conditions or events that raise substantial doubt about the entity’s ability to continue as a going concern within one year after the date that the financial statements are issued. Public entities are required to apply standards for annual reporting periods ending after December 15, 2016, and interim periods thereafter. Early application is permitted. The Company early adopted this standard and it did not have a material impact on its consolidated financial statements.
From time to time, new accounting pronouncements are issued by the FASB or other standard setting bodies and adopted by the Company as of the specified effective date. Unless otherwise discussed, the Company believes that the impact of recently issued standards that are not yet effective will not have a material impact on its financial position or results of operations upon adoption.
86
Table of Contents
(3) Inventories
Inventories consist of the following:
| December 31 | ||||||||
| 2014 | 2013 | |||||||
| (In thousands) | ||||||||
| Raw material |
$ | 4,052 | $ | 2,813 | ||||
| Finished goods |
845 | 4,079 | ||||||
|
|
|
|
|
|||||
| Total |
$ | 4,897 | $ | 6,892 | ||||
|
|
|
|
|
|||||
(4) Property, Plant and Equipment, Net
Property, plant and equipment consist of the following:
| December 31 | ||||||||||
| 2014 | 2013 | Useful life | ||||||||
| (In thousands) | ||||||||||
| Construction in progress |
$ | 24,124 | $ | 6,177 | — | |||||
| Buildings |
16,303 | 16,303 | 30 years | |||||||
| Machinery and equipment |
78,378 | 77,466 | 5 — 10 years | |||||||
| Computer equipment and software |
5,556 | 5,298 | 3 years | |||||||
|
|
|
|
|
|||||||
| Total |
124,361 | 105,244 | ||||||||
| Accumulated depreciation and amortization |
(52,869 | ) | (43,221 | ) | ||||||
|
|
|
|
|
|||||||
| Property, plant and equipment, net |
$ | 71,492 | $ | 62,023 | ||||||
|
|
|
|
|
|||||||
Plant and equipment under capital leases consist of the following:
| December 31 | ||||||||
| 2014 | 2013 | |||||||
| (In thousands) | ||||||||
| Office equipment, at cost |
$ | 118 | $ | 113 | ||||
| Vehicles, at cost |
288 | 288 | ||||||
|
|
|
|
|
|||||
| Total capital leases |
406 | 401 | ||||||
| Accumulated amortization |
(265 | ) | (178 | ) | ||||
|
|
|
|
|
|||||
| Capital leases, net |
$ | 141 | $ | 223 | ||||
|
|
|
|
|
|||||
Depreciation expense was $10.1 million, $10.0 million and $9.6 million for the years ended December 31, 2014, 2013 and 2012, respectively. Amortization associated with assets under capital leases was less than $0.1 million, for each of the years ended December 31, 2014, 2013 and 2012.
During the fourth quarter of 2012, certain equipment related to the Company’s manufacturing operations in the East Providence facility was taken out of service with no future alternative use. The remaining carrying value of the equipment of $2.5 million was charged to cost of sales.
During the fourth quarter of 2013, the Company completed its 2014 operating plan, which contemplated alternatives to complete the build out of the East Providence facility. In conjunction with this process, the Company performed an assessment of on-hand, long-lead time equipment for the third production line and determined that certain costs and partially completed assets had no future alternative use. As a result, the Company recorded a write-off of construction in progress totaling $3.4 million, inclusive of $0.4 million of capitalized interest, for the year ended December 31, 2013. In addition, $2.3 million of equipment was identified as having an alternative use as spare parts for the existing production lines.
87
Table of Contents
Construction in progress totaling $24.1 million and $6.2 million, at December 31, 2014 and 2013, respectively, related primarily to the construction of a third production line and other capital projects at the East Providence facility.
(5) Accrued Expenses
Accrued expenses consist of the following:
| December 31 | ||||||||
| 2014 | 2013 | |||||||
| (In thousands) | ||||||||
| Employee compensation |
$ | 4,851 | $ | 3,926 | ||||
| Professional fees |
76 | 200 | ||||||
| Deferred rent |
155 | 112 | ||||||
| Other accrued expenses |
506 | 576 | ||||||
|
|
|
|
|
|||||
| $ | 5,588 | $ | 4,814 | |||||
|
|
|
|
|
|||||
(6) Subordinated Notes
Subordinated Notes consists of the following:
| December 31 | ||||||||
| 2014 | 2013 | |||||||
| (In thousands) | ||||||||
| Subordinated Notes |
$ | — | $ | 17,306 | ||||
| Current maturities of Subordinated Notes |
— | (17,306 | ) | |||||
|
|
|
|
|
|||||
| Subordinated Notes, excluding current portion |
$ | — | $ | — | ||||
|
|
|
|
|
|||||
On December 29, 2010, the Company issued 12% Secured Subordinated Promissory Notes (the Subordinated Notes) for aggregate proceeds of $10.0 million with an original maturity date of December 29, 2015. The proceeds were used to fund the expansion of a second manufacturing line at the East Providence facility. The Subordinated Notes were collateralized by certain of the Company’s assets at the East Providence facility.
All accrued interest on the Subordinated Notes was compounded semi-annually and added to principal on June 30th and December 31st of each year. Accrued and unpaid interest on the Subordinated Notes was due and payable at maturity. The Subordinated Notes were subject to certain financial covenants, which include a minimum tangible net worth calculation.
In conjunction with the financing, the Company issued 181 detachable stock warrants to purchase the Company’s common stock at $8.25 per share. The warrants were immediately exercisable and set to expire on December 29, 2017. The Company determined that the warrants, which are subject to net share settlement, are equity classified. A portion of the debt proceeds totaling $2.2 million was allocated to the warrants based on the estimated fair value of the warrants using the Black Scholes option pricing model and the following assumptions: (i) risk free interest rate of 2.75%, (ii) life of 7.5 years, (iii) volatility of 50%, and (iv) expected dividend yield of zero. The debt discount was being amortized to interest expense utilizing the effective interest rate method over the term of the Subordinated Notes.
The Company executed several amendments to the Subordinated Notes prior to September 26, 2012, in which the maturity date of the Subordinated Notes was extended to March 2, 2014 and the interest rate was increased to 12.75% and then to 15% per annum. The Company determined that these amendments were not substantial and represented modifications at the respective amendment dates.
88
Table of Contents
In connection with the issuances of the Convertible Notes on September 26, 2012, the terms of the Subordinated Notes were amended (i) to increase the interest rate to 20% per annum and (ii) to add a premium which provided each note holder with additional interest equal to the amount of interest that would have accrued to the date of the amendment if the notes had provided interest at a rate of 20% per annum on the original principal amount and from the initial date of issuance. The applicable premium of $1.4 million of additional interest was due upon maturity. In conjunction with the Company’s March 2013 financing (see note 7), the Company further amended the terms of the Subordinated Notes to extend the maturity date to September 30, 2014.
The Company determined that the present value of the cash flow pursuant to the Subordinated Notes, as amended on September 26, 2012, was more than 10% greater than the remaining cash flow pursuant to the notes prior to the amendment. Accordingly, the Company accounted for the amendment as an extinguishment and reissuance of new Subordinated Notes. The Company recorded a $1.4 million loss associated with the extinguishment, which represents the difference between the carrying value of the original Subordinated Notes and the fair value of the new Subordinated Notes.
Subsequent to the extinguishment and upon reissuance of the Subordinated Notes, the Company elected the fair value option for the Subordinated Notes and recorded the instrument at fair value. The fair value of the Subordinated Notes was determined by analysis of the amount to be paid on the notes at the occurrence of certain events in which the Subordinated Notes would be repaid to the noteholders in cash. The probability weighted discounted cash flow analysis utilized assumptions related to the probability of the occurrence of each of the various events and appropriate discount rates for each of the scenarios.
At December 31, 2012 the valuations were calculated at an implied discount of approximately 31% and were weighted as follows: repayment prior to maturity on June 30, 2013, 65%; and repayment at maturity on September 30, 2014, 35%. There would not be a material difference if the weightings were increased or decreased by 10%. At December 31, 2012, the aggregate fair value of the Subordinated Notes was determined to be $13.5 million, with an aggregate unpaid principal balance totaling $13.1 million.
At December 31, 2013 the valuations were calculated at an implied discount of approximately 20% and were weighted as follows: repayment prior to maturity on June 30, 2014, 20%; and repayment at maturity on September 30, 2014, 80%. There would not be a material difference if the weightings were increased or decreased by 10%. At December 31, 2013, the aggregate fair value of the Subordinated Notes was determined to be $17.3 million, with an aggregate unpaid principal balance totaling $15.9 million.
Upon the completion of the Company’s IPO discussed in note 1, the Company used a portion of the net proceeds to repay $18.8 million of the original principal balance and accrued interest on the Subordinated Notes. As of June 20, 2014, all obligations under the Subordinated Notes had been paid in full.
The following table presents a roll-forward of the fair value of Level 3 (significant unobservable inputs) Subordinated Notes for the years ended December 31, 2014, 2013 and 2012:
| Balance at December 31, 2011 |
$ | — | ||
| Transfer into Level 3 on September 26, 2012 (1) |
12,435 | |||
| Change in fair value included in interest expense |
1,100 | |||
|
|
|
|||
| Balance at December 31, 2012 |
13,535 | |||
| Change in fair value included in interest expense |
3,771 | |||
|
|
|
|||
| Balance at December 31, 2013 |
17,306 | |||
| Change in fair value included in interest expense |
1,543 | |||
| Repayment |
(18,849 | ) | ||
|
|
|
|||
| Balance at December 31, 2014 |
$ | — | ||
|
|
|
| (1) | Fair value option election was made on September 26, 2012. |
89
Table of Contents
Interest expense, inclusive of changes in fair value and amortization of deferred financing costs, related to the Subordinated Notes for the years ended December 31, 2014, 2013 and 2012 was $1.5 million, $3.8 million and $2.9 million, respectively. Of these totals, $0.0 million, $0.0 million and $0.3 million have been capitalized as part of the costs of the second production line at the Company’s East Providence facility for the years ended December 31, 2014, 2013 and 2012, respectively (see note 10).
(7) Senior Convertible Notes
Senior Convertible Notes consist of the following:
| December 31, | ||||||||
| 2014 | 2013 | |||||||
| (In thousands) | ||||||||
| March 2013 Investor Notes |
$ | — | $ | 24,482 | ||||
| March 2013 Arcapita Notes |
— | 3,653 | ||||||
|
|
|
|
|
|||||
| Total Senior Convertible Notes |
$ | — | $ | 28,135 | ||||
|
|
|
|
|
|||||
Effective March 28, 2013, the Company entered into a Note and Warrant Purchase Agreement (March 2013 NPA) authorizing the issuance of $22.5 million of Senior Subordinated Convertible Notes (the March 2013 Investor Notes) and Senior Subordinated Arcapita Notes (the March 2013 Arcapita Notes) (collectively, the Senior Convertible Notes). At each closing under the March 2013 NPA, the Company issued warrants to purchase shares of a newly created Series C Preferred Stock (the Series C) based on the principal balance of Senior Convertible Notes issued to each purchaser. The Company determined that the Series C warrants, which were subject to net share settlement, were equity classified. Collectively, the warrants issued pursuant to the March 2013 NPA were exercisable for Series C shares equal to 85.7% of the then outstanding capital stock of the Company on a fully diluted basis. The warrants had an exercise price of $0.0001 per share, were immediately exercisable and an expiration date of March 28, 2023.
The March 2013 Investor Notes accrued interest at a rate of 8% per annum compounded annually and added to principal on December 31st of each year. Accrued and unpaid interest was payable upon maturity or on the date of any prepayment. Accrued interest was payable in cash at the time of payment of principal or converted with the outstanding principal amount into common shares of the Company upon an IPO. Upon maturity, the Company was required to pay 1.375 times the aggregate principal amount and accrued interest on the March 2013 Investor Notes then outstanding or $33.8 million on March 28, 2016.
The March 2013 Arcapita Notes were non-interest-bearing and were scheduled to mature on March 28, 2016. The March 2013 Arcapita Notes included an option to purchase one share of nonparticipating preferred stock, as defined, on the maturity date. This preferred stock was to be senior to all other series of the Company’s outstanding convertible preferred stock and have a liquidation preference totaling $5.2 million at maturity. If this option were to have been exercised, the Company would have created a new series of preferred stock.
Pursuant to side letter agreements, in March and May 2013, holders of $7.5 million of Convertible Notes (see note 8) issued in November 2012 and January 2013 (the Initial Notes) exchanged their original principal balance for an equivalent principal amount of Senior Convertible Notes (the Exchanged Notes) and a pro-rata share of Series C warrants issued under the March 2013 NPA. The Company accounted for the warrant as a debt issuance cost and recorded an immediate charge for the fair value of the Series C warrants totaling $5.4 million in interest expense. Pursuant to the exchange, the holders of the Exchanged Notes received notes senior in preference to the Initial Notes and with an extended maturity date of March 28, 2016.
Given that the terms of the Exchanged Notes were substantially different than the terms of the Initial Notes, the exchange was accounted for as an extinguishment of debt. Upon the exchange, the Company recognized a
90
Table of Contents
loss totaling $5.7 million representing the difference between (i) the fair value of the Exchanged Notes at reissuance and the fair value of Series C preferred stock warrants, and (ii) the carrying value of the Initial Notes. The Company elected to account for all of the issuances of its Senior Convertible Notes and various embedded derivatives in accordance with ASC Topic 825-10, Fair Value Option for Financial Liabilities, whereby the Company initially and subsequently measured this financial instrument in its entirety at fair value, with the changes in fair value recorded each reporting period in other interest expense (income).
In March and May 2013, the Company issued an additional $15.0 million of Senior Convertible Notes. The noteholders received a pro-rata share of Series C warrants for their participation in the financing. The Company accounted for the warrant issuances as a debt issuance cost and recorded an immediate charge for the fair value of the Series C warrants totaling $10.7 million in interest expense (see note 10). In conjunction with the March 2013 NPA, the Company incurred $0.9 million of debt issuance costs, which was allocated between the debt and equity instruments related to the transaction. $0.6 million was allocated to the notes and recorded through interest expense, while the remaining $0.3 million was allocated to the warrants with an offset for additional paid-in capital.
Net proceeds from the issuance of the Senior Convertible Notes were used (i) for investment in working capital to support revenue growth (ii) for capital expenditures to improve the efficiency and throughput of existing manufacturing assets and (iii) to settle all cash obligations under the Company’s cross license agreement with Cabot Corporation (see note 11).
Upon the completion of the Company’s IPO discussed in note 1, the outstanding principal and accrued interest on the Senior Convertible Notes were marked to an aggregate fair value of $39.5 million and automatically converted into 3,591,604 shares of common stock equal to the unpaid principal amount of the Senior Convertible Notes and accrued interest as of June 18, 2014 divided by the Conversion Price, which was 62.5% of the initial public offering price of $11.00 per share. In addition, all outstanding Series C warrants were automatically net exercised, which, together with the then outstanding shares of Series C preferred stock, converted into 104,734 shares of common stock upon the closing of the Company’s IPO.
Fair Value Option
The following table presents the difference between the aggregate fair value and the aggregate unpaid principal balance of the Senior Convertible Notes recorded at fair value at December 31, 2013:
| Aggregate fair value | Aggregate unpaid principal balance |
Fair value over unpaid principal balance |
||||||||||
| (In thousands) | ||||||||||||
| March 2013 Investor Notes |
$ | 24,482 | $ | 19,567 | $ | 4,915 | ||||||
| March 2013 Arcapita Notes |
3,653 | 2,980 | 673 | |||||||||
|
|
|
|
|
|
|
|||||||
| Total Senior Convertible Notes |
$ | 28,135 | $ | 22,547 | $ | 5,588 | ||||||
|
|
|
|
|
|
|
|||||||
Fair Value Measurements
The change in the fair values of the Senior Convertible Notes during the year ended December 31, 2014 and 2013 was determined by utilizing probability weighted discounted cash flow analyses, which took into consideration market and general economic events, as well as the Company’s financial results and other data available. These analyses determined the amount to be paid on the Senior Convertible Notes in either cash or shares at the occurrence of certain events in which the Senior Convertible Notes would be converted into shares of the Company’s common stock or would be repaid in cash. The probability weighted discounted cash flow
91
Table of Contents
analyses utilized assumptions related to the probability of the occurrence of each of the various events and appropriate discount rates for each of the scenarios as of December 31, 2013 are as follows:
| Potential exit scenario event |
Estimated exit date of future event |
Estimated probability of future event |
||||||
| IPO scenario 1 |
06/30/14 | 45 | % | |||||
| IPO scenario 2 |
03/31/15 | 5 | % | |||||
| Sale scenario 1 |
06/30/14 | 15 | % | |||||
| Sale scenario 2 |
03/31/15 | 15 | % | |||||
| Dissolution |
09/30/14 | 5 | % | |||||
| Private company |
At maturity | 15 | % | |||||
The above scenarios incorporated a weighted average implied discount rate of 41.7%.
The final payment amount of the Senior Convertible Notes upon the closing of the Company’s IPO was determined to be $39.5 million.
The following table presents a roll-forward of the fair value of Level 3 (significant unobservable inputs) Senior Convertible Notes for the years ended December 31, 2014, 2013 and 2012:
| March 2013 Investor Notes |
March 2013 Arcapita Notes |
Total Senior Convertible Notes |
||||||||||
| Beginning balance as of December 31, 2012 |
$ | — | $ | — | $ | — | ||||||
| Issuances of senior convertible notes |
13,435 | 1,536 | 14,971 | |||||||||
| Fair value of notes exchanged for senior convertible notes |
6,132 | 1,444 | 7,576 | |||||||||
| Conversion of the Senior Convertible Notes |
4,915 | 673 | 5,588 | |||||||||
|
|
|
|
|
|
|
|||||||
| Balance at December 31, 2013 |
24,482 | 3,653 | 28,135 | |||||||||
| Change in fair value included in interest expense |
9,803 | 1,570 | 11,373 | |||||||||
| Conversion of Convertible Notes |
(34,285 | ) | (5,223 | ) | (39,508 | ) | ||||||
|
|
|
|
|
|
|
|||||||
| Balance at December 31, 2014 |
$ | — | $ | — | $ | — | ||||||
|
|
|
|
|
|
|
|||||||
Changes in fair value of the Company’s Senior Convertible Notes for the years ended December 31, 2014 and 2013 was $11.4 million and $5.6 million, respectively. The charge for the fair value of the Series C warrants of $10.7 million was included in interest income (expense) for the year ended December 31, 2013.
(8) Convertible Notes
Convertible Notes consist of the following:
| December 31 | ||||||||
| 2014 | 2013 | |||||||
| (In thousands) | ||||||||
| Investor Notes |
$ | — | $ | 87,479 | ||||
| Arcapita Notes |
— | 4,395 | ||||||
|
|
|
|
|
|||||
| Total Convertible Notes |
— | 91,874 | ||||||
| Current maturities of convertible notes |
— | (435 | ) | |||||
|
|
|
|
|
|||||
| Convertible Notes, excluding current portion |
$ | — | $ | 91,439 | ||||
|
|
|
|
|
|||||
92
Table of Contents
Commencing in June 2011 and concluding in January 2013, the Company issued a total of $69.9 million of 8% subordinated convertible notes (the Investor Notes) to new and existing investors. The Investor Notes had original maturity dates of June 1, 2014, June 14, 2014 and December 6, 2014, depending on their date of issuance. Commencing in December 2011 and concluding in September 2012, the Company issued a total of $3.5 million of noninterest bearing convertible notes to an existing investor (the Arcapita Notes). The Arcapita Notes were originally set to mature on December 6, 2014. Net proceeds from the Investor Notes and Arcapita Notes (collectively, the Convertible Notes) were used to fund the completion of the Company’s second production line at the East Providence facility, to begin the construction of a third production line at the East Providence facility, and to fund the Company’s operating cash requirements.
In conjunction with the execution of the March 2013 NPA (see note 7) on March 28, 2013, the holders of all but approximately $0.3 million of original principal amount of the Convertible Notes agreed to extend the original maturity date of their notes by two years. Given that the term of the Convertible Notes, as amended, differed substantially from the original term, the amendment was accounted for as an extinguishment of debt. On March 28, 2013, the Company recognized a gain on extinguishment totaling $8.9 million which represents the difference between (i) the fair value of the Convertible Notes at reissuance, and (ii) the fair value of the Convertible Notes just prior to the amendment.
The Investor Notes earned interest at a rate of 8% per annum compounded annually and to be added to principal on December 31st of each year. Accrued and unpaid interest was payable at maturity or on the date of any prepayment. Accrued interest was payable in cash at the time of payment of principal or converted with the outstanding principal amount into common shares of the Company upon an IPO. Upon maturity, the Company was to be required to pay 1.375 times the aggregate principal amount and accrued interest on the Investor Notes then outstanding. Aggregate principal amounts due on December 6, 2014, June 1, 2016 and December 6, 2016 are $0.5 million, $61.0 million and $63.5 million, respectively.
The Arcapita Notes were non-interest-bearing and due on December 6, 2016. The Arcapita Notes included an option to purchase one share of nonparticipating preferred stock, as defined, on the maturity date. This preferred stock was to be senior to all other series of the Company’s outstanding convertible preferred stock and to have a liquidation preference totaling $6.8 million. If this option were to have been exercised, the Company would have created a new series of preferred stock.
The Company elected to record the Convertible Notes at fair value upon issuance. The aggregate fair value of the notes was $91.9 million at December 31, 2013.
Upon the closing of the Company’s IPO discussed in note 1, the outstanding principal and accrued interest on the Convertible Notes were marked to an aggregate fair value of $129.0 million and automatically converted into 11,727,430 shares of common stock equal to the unpaid principal amount of the Convertible Notes and accrued interest divided by the Conversion Price, which was 62.5% of the initial public offering price of $11.00 per share.
Fair Value Option
The following table presents the difference between the aggregate fair value and the aggregate unpaid principal balance of the Convertible Notes recorded at fair value at December 31, 2013:
| Aggregate fair value | Aggregate unpaid principal balance |
Fair value over unpaid principal balance |
||||||||||
| (In thousands) | ||||||||||||
| Investor Notes |
$ | 87,479 | $ | 68,264 | $ | 19,215 | ||||||
| Arcapita Notes |
4,395 | 3,479 | 916 | |||||||||
|
|
|
|
|
|
|
|||||||
| Total Convertible Notes |
$ | 91,874 | $ | 71,743 | $ | 20,131 | ||||||
|
|
|
|
|
|
|
|||||||
93
Table of Contents
Fair Value Measurements
The change in the fair values of the Senior Convertible Notes during the year ended December 31, 2014 and 2013 was determined by utilizing probability weighted discounted cash flow analyses, which took into consideration market and general economic events, as well as the Company’s financial results and other data available. These analyses determined the amount to be paid on the Senior Convertible Notes in either cash or shares at the occurrence of certain events in which the Senior Convertible Notes would be converted into shares of the Company’s common stock or would be repaid in cash. The probability weighted discounted cash flow analyses utilized assumptions related to the probability of the occurrence of each of the various events and appropriate discount rates for each of the scenarios as of December 31, 2013 were as follows:
| December 31, 2013 | ||||||||
| Potential exit scenario event |
Estimated exit date of future event |
Estimated probability of future event |
||||||
| IPO scenario 1 |
06/30/14 | 45 | % | |||||
| IPO scenario 2 |
03/31/15 | 5 | % | |||||
| Sale scenario 1 |
06/30/14 | 15 | % | |||||
| Sale scenario 2 |
03/31/15 | 15 | % | |||||
| Dissolution |
09/30/14 | 5 | % | |||||
| Private company |
At maturity | 15 | % | |||||
The above scenarios incorporated weighted average implied discount rates of 31% and 40% at December 31, 2012 and 2013, respectively.
Given that the valuation of the Convertible Notes utilized several unobservable inputs, the Company determined that the valuation of the Convertible Notes was a Level 3 valuation.
The final payment amount of the Convertible Notes upon the closing of the Company’s IPO was determined to be $129.0 million.
The following table presents a roll-forward of the fair value of Level 3 (significant unobservable inputs) Convertible Notes for the years ended December 31, 2014, 2013 and 2012:
| Investor Notes |
Arcapita Notes |
Total Convertible Notes |
||||||||||
| Balance at December 31, 2011 |
$ | 50,118 | $ | 585 | $ | 50,703 | ||||||
| Issuances of convertible notes |
21,991 | 2,900 | 24,891 | |||||||||
| Change in fair value included in interest expense |
18,811 | 683 | 19,494 | |||||||||
|
|
|
|
|
|
|
|||||||
| Balance at December 31, 2012 |
90,920 | 4,168 | 95,088 | |||||||||
| Issuances of convertible notes |
2,090 | 1,440 | 3,530 | |||||||||
| Fair value of notes exchanged for senior convertible notes |
(5,971 | ) | (1,282 | ) | (7,253 | ) | ||||||
| Gain on extinguishment of convertible notes |
(8,498 | ) | (400 | ) | (8,898 | ) | ||||||
| Change in fair value included in interest expense |
8,938 | 469 | 9,407 | |||||||||
|
|
|
|
|
|
|
|||||||
| Balance at December 31, 2013 |
87,479 | 4,395 | 91,874 | |||||||||
| Change in fair value included in interest expense |
35,036 | 2,092 | 37,128 | |||||||||
| Conversion of Convertible Notes |
(122,515 | ) | (6,487 | ) | (129,002 | ) | ||||||
|
|
|
|
|
|
|
|||||||
| Balance at December 31, 2014 |
$ | — | $ | — | $ | — | ||||||
|
|
|
|
|
|
|
|||||||
94
Table of Contents
The charge recognized as a result of the change in the fair value of the Company’s Convertible Notes was $37.1 million, $9.4 million and $17.6 million for the years ended December 31, 2014, 2013 and 2012, respectively (see note 10).
(9) Revolving Line of Credit
In March 2011, the Company entered into a $10.0 million revolving credit facility with Silicon Valley Bank. This facility has been amended at various dates through 2014.
On September 3, 2014, the Company amended and restated the loan and security agreement to extend the maturity date of the facility to August 31, 2016 and increase the maximum amount the Company is permitted to borrow, subject to continued covenant compliance and borrowing base requirements, from $10 million to $20 million. At the Company’s election, the interest rate applicable to borrowings under the amended revolving credit facility may be based on the prime rate or the LIBOR. Prime rate-based rates vary from prime rate plus 0.75% per annum to prime rate plus 1.75% per annum, while LIBOR-based rates vary from LIBOR plus 3.75% per annum to LIBOR plus 4.25% per annum. In addition, the Company is required to pay a monthly unused revolving line facility fee of 0.5% per annum of the average unused portion of the revolving credit facility. The amended revolving credit facility is secured by a first priority security interest in all assets of the Company, including those at the East Providence facility, except for certain exclusions.
At December 31, 2014 and 2013, the Company had drawn $0.0 million and $1.0 million, respectively, on the revolving credit facility. The Company also had outstanding letters of credit backed by the revolving credit facility of $1.4 million and $1.2 million at December 31, 2014 and 2013, respectively, which reduce the funds otherwise available to the Company. Based on the available borrowing base, the effective amount available to the Company at December 31, 2014 was $12.4 million after giving respect to the $1.4 million of outstanding letters of credit. Under the amended revolving credit facility, the Company is required to comply with financial covenants relating to, among other items, minimum Adjusted EBITDA, maximum unfinanced capital expenditures and other non-financial covenants. At December 31, 2014, the Company was in compliance with all such financial covenants.
(10) Interest Expense
Interest expense consists of the following:
| Year ended December 31 | ||||||||||||
| 2014 | 2013 | 2012 | ||||||||||
| Changes in fair value: |
||||||||||||
| Subordinated notes |
$ | 1,543 | $ | 3,771 | $ | 1,100 | ||||||
| Senior convertible notes |
11,373 | 5,588 | — | |||||||||
| Convertible notes, net of capitalization (1) |
37,095 | 9,337 | 17,578 | |||||||||
| Issuance of Series C preferred stock warrants in connection with senior convertible notes |
— | 10,677 | — | |||||||||
| Subordinated notes interest, net of capitalization (2) |
— | — | 822 | |||||||||
| Amortization of deferred financing costs for subordinated notes |
— | — | 636 | |||||||||
| Debt closing costs |
47 | 585 | 425 | |||||||||
| Imputed interest on Cabot obligation |
— | 391 | 1,018 | |||||||||
| Other interest |
223 | 250 | 211 | |||||||||
|
|
|
|
|
|
|
|||||||
| $ | 50,281 | $ | 30,599 | $ | 21,790 | |||||||
|
|
|
|
|
|
|
|||||||
| (1) | The charge recognized as a result of the change in the fair value of the Company’s Convertible Notes is presented net of capitalized interest expense of $0.1 million, $0.1 million and $1.9 million for the years ended December 31, 2014, 2013 and 2012, respectively. |
95
Table of Contents
| (2) | Interest expense recognized from the Company’s Subordinated Notes is presented net of capitalized interest expense of $0.0 million, $0.0 million and $0.3 million for the years ended December 31, 2014, 2013 and 2012, respectively. |
Debt closing costs and commitment fees, consisting primarily of legal and related fees, associated with the issuance or modification of the Company’s Subordinated Notes, Senior Convertible Notes, Convertible Notes, and revolving credit facility are amortized over the term of the debt instrument and recorded in interest expense.
Capitalized interest relates primarily to costs associated with the Company’s third production line and significant improvements for the second production line at the East Providence facility.
(11) Other Long-term Liabilities
Other long-term liabilities consist of the following:
| December 31 | ||||||||
| 2014 | 2013 | |||||||
| (In thousands) | ||||||||
| Asset retirement obligations (ARO) |
$ | 1,018 | $ | 1,009 | ||||
| Other |
62 | 112 | ||||||
|
|
|
|
|
|||||
| 1,080 | 1,121 | |||||||
| Current maturities of other long-term liabilities |
(50 | ) | (50 | ) | ||||
|
|
|
|
|
|||||
| Other long-term liabilities, less current maturities |
$ | 1,030 | $ | 1,071 | ||||
|
|
|
|
|
|||||
The Company has asset retirement obligations (ARO) arising from requirements to perform certain asset retirement activities upon the termination of its Northborough, Massachusetts facility lease and upon disposal of certain machinery and equipment. The liability was initially measured at fair value and subsequently adjusted for accretion expense and changes in the amount or timing of the estimated cash flows. The corresponding asset retirement costs are capitalized as part of the carrying amount of the related long-lived asset and depreciated over the asset’s remaining useful life.
A summary of ARO activity consists of the following:
| Year Ended December 31 | ||||||||
| 2014 | 2013 | |||||||
| (In thousands) | ||||||||
| Balance at beginning of period |
$ | 1,009 | $ | 1,000 | ||||
| Accretion of discount expense |
40 | 34 | ||||||
| Settlement costs |
(31 | ) | (25 | ) | ||||
|
|
|
|
|
|||||
| Balance at end of period |
$ | 1,018 | $ | 1,009 | ||||
|
|
|
|
|
|||||
In August 2013, the Company extended its Northborough, Massachusetts facility lease to August 2016. As a result, the Company classified the ARO as long term at December 31, 2014 and 2013.
On April 1, 2006, the Company and Cabot Corporation entered into a Cross License Agreement to license certain intellectual property rights. Such licenses will expire on the last day of the life of each issued patent or patent applications and acquired patents licensed thereunder. On September 21, 2007, the Cross License Agreement was amended to modify the consideration payable to Cabot by the Company to $38.0 million in cash in quarterly installments over a seven-year period. The Company adjusted its obligation to Cabot to reflect a revised net present value of the consideration payable to Cabot of $19.3 million. The discount of $18.7 million was amortized to interest expense over the term of the payment schedule.
96
Table of Contents
The consideration provided to Cabot was for the value of the licensed patents and patent applications, the avoidance of potential claims on prior use of Cabot issued patents and related costs. $1.0 million of the total consideration was allocated to the fair market value of the patents and patent applications licensed from Cabot, $0.5 million was allocated to the fair market value of the patents and patent applications licensed to Cabot, and the remainder was allocated to general and administrative expenses.
The remaining consideration payable to Cabot under the Cross License Agreement was paid in full during 2013.
(12) Commitments and Contingencies
Capital Leases
The Company has entered into certain capital leases for computer equipment and vehicles. The leases are payable in monthly installments and expire at various dates through 2017. The recorded balance of capital lease obligations as of December 31, 2014 and 2013 was $0.2 million and $0.2 million, respectively. Future minimum payments under capital leases at December 31, 2014 are as follows:
| Year |
Capital Lease Obligations |
|||
| (In thousands) | ||||
| 2015 |
$ | 87 | ||
| 2016 |
64 | |||
| 2017 |
30 | |||
|
|
|
|||
| Total |
181 | |||
| Less portion representing interest |
(16 | ) | ||
|
|
|
|||
| Present value of future minimum payments |
165 | |||
| Current maturities of capital lease payments |
(76 | ) | ||
|
|
|
|||
| Capital leases, excluding current portion |
$ | 89 | ||
|
|
|
|||
Operating Leases
The Company leases facilities and office equipment under operating leases expiring at various dates through 2021. Under these agreements, the Company is obligated to pay annual rentals, as noted below, plus real estate taxes, and certain operating expenses. Some operating leases contain rent escalation clauses whereby the rent payments increase over the term of the lease. In such cases, rent expense is recognized on a straight-line basis over the lease term.
Future minimum lease payments under operating leases at December 31, 2014 are as follows:
| Year |
Operating Leases |
|||
| (In thousands) | ||||
| 2015 |
$ | 1,126 | ||
| 2016 |
1,133 | |||
| 2017 |
600 | |||
| 2018 |
601 | |||
| 2019 |
170 | |||
| Thereafter |
34 | |||
|
|
|
|||
| Total minimum lease payments |
$ | 3,664 | ||
|
|
|
|||
97
Table of Contents
The Company incurred rent expense under all operating leases of approximately $1.2 million in each of the years ended December 31, 2014, 2013 and 2012.
Letters of Credit
Pursuant to the terms of its Northborough, Massachusetts facility lease, the Company has been required to provide the lessor with letters of credit securing certain obligations. In addition, the Company has been required to provide certain customers with letters of credit securing obligations under commercial contracts.
The Company had letters of credit outstanding for $1.4 million and $1.2 million at December 31, 2014 and 2013, respectively. These letters of credit are secured by the Company’s revolving credit facility (see note 9).
Litigation
The Company is, from time to time, a party to litigation that arises in the normal course of its business operations. The Company is not presently a party to any litigation for which it believes a loss is probable requiring an amount to be accrued or a possible loss contingency requiring disclosure.
(13) Conversion of Redeemable Convertible Preferred Stock
The fair value of the Company’s Series A Redeemable Convertible Preferred Stock (Series A) and Series B Redeemable Convertible Preferred Stock (Series B) was estimated using the probability-weighted expected return method, or PWERM, which considers the value of preferred and common stock based upon analysis of the future values for equity assuming various future outcomes, including initial public offerings, merger or sale, dissolutions or continued operation as a private company. Accordingly, share value is based upon the probability-weighted present value of expected future net cash flows, considering each of the possible future events, as well as the rights and preferences of each share class. As such, the Company’s redeemable convertible preferred stock was valued utilizing Level 3 inputs.
In conjunction with the execution of the March 2013 NPA, the redemption and dividend rights of the Company’s issued and outstanding Series B and Series A were eliminated and the liquidation preference of the Series B and Series A was reduced to an aggregate of $4.0 million. During March 2013, the Company recorded decreases in the redemption value of the Company’s Series B and Series A shares of $30.0 million and $56.1 million, respectively, reflecting the changes in the fair market value of the Series B and Series A shares at the time of the March 2013 Financing. Given that the release of the redemption rights substantially impacted the fair value of the Series B and Series A, the elimination of the rights was accounted for as an extinguishment of the securities. As a result, the Company recorded a gain on extinguishment of Series B and Series A of approximately $86.2 million recorded in additional paid-in capital available to common stockholders. Additionally, the remaining value of the Series B and Series A of $1.1 million subsequent to extinguishment was recorded in additional paid-in capital upon reclassification from temporary to permanent equity.
At the time of the March 2013 Financing, the Company’s board of directors established the price per share of the Company’s Series B and Series A shares at $0.20 and $0.15 per share, respectively, as determined by the PWERM method. This valuation took into consideration market and general economic events as well as the Company’s financial results and other data available at that time. In addition, the board reaffirmed that the continued use of market multiples based on comparable companies was appropriate. At the time of the March 2013 financing, the various scenarios, excluding dissolution, resulted in equity fair values ranging from $20.0 million to $215.0 million. At the time of the March 2013 financing, the valuations were weighted as follows: IPO, 40%; sale of the Company/assets, 45%; dissolution, 10%; and remain private, 5%. The estimated fair value of one share of common and preferred stock was estimated under each of the four scenarios and the associated probabilities to arrive at a probability weighted value per share.
98
Table of Contents
Upon the closing of the Company’s IPO discussed in note 1, the outstanding shares of Series A, Series B and Series C converted into 115,982 shares of common stock.
(14) Stockholders’ Equity (Deficit)
On June 18, 2014, the Company completed an IPO of 7,500,000 shares of its common stock at a public offering price of $11.00 per share. The Company received net proceeds of $74.7 million after deducting underwriting discounts and commissions of $4.3 million and other offering expenses of approximately $3.5 million. Upon the closing of the offering, all of the Company’s then-outstanding (i) Series C warrants to purchase Series C preferred stock, were subject to an automatic net cashless exercise, (ii) convertible preferred stock (including the shares of Series C preferred stock issued upon the automatic net cashless exercise of Series C warrants) automatically converted into 115,982 shares of common stock, and (iii) Convertible Notes (see note 8) and Senior Convertible Notes (see note 7) automatically converted into 15,319,034 shares of common stock.
At December 31, 2014, the Company was authorized to issue 130,000,000 shares of stock, of which 125,000,000 shares were designated as common stock and 5,000,000 shares were designated as preferred stock.
(15) Employee Benefit Plan
The Company sponsors the Aspen Aerogels, Inc. 401(k) Plan. Under the terms of the plan, the Company’s employees may contribute a percentage of their pretax earnings. The Company has not provided matching contributions nor has it made any contributions to the plan.
(16) Employee Stock Ownership Plans
Effective June 12, 2014, upon the pricing of the IPO, the Company adopted the 2014 Employee, Director and Consultant Equity Incentive Plan (the 2014 Equity Plan). Under the 2014 Equity Plan, the Company may grant incentive stock options, non-qualified stock options, restricted stock and other stock-based awards. Stock options under the plan are to be granted with an exercise price not less than the fair market value of the Company’s common stock at the date of grant.
Upon the completion of the IPO, the Company issued 61,816 shares of restricted common stock vesting over a period of one year with an aggregate value at issuance of approximately $0.7 million to its non-employee directors under the 2014 Equity Plan. In September 2014, the Company issued 318,517 restricted stock units (RSUs) and non-qualified stock options (NSOs) to purchase 934,018 shares of common stock to employees under the 2014 Equity Plan. The RSUs and NSOs will vest over a four year period for certain executive employees and over a three year period for other employees.
Stock-based compensation is included in cost of sales or operating expenses, as applicable, and consists of the following:
| Year Ended December 31 |
||||||||||||
| 2014 | 2013 | 2012 | ||||||||||
| (In thousands) | ||||||||||||
| Cost of product revenue |
$ | 1,121 | $ | 496 | $ | 221 | ||||||
| Research and development expenses |
1,046 | 267 | 112 | |||||||||
| Sales and marketing expenses |
1,390 | 727 | 384 | |||||||||
| General and administrative expenses |
5,224 | 2,936 | 937 | |||||||||
|
|
|
|
|
|
|
|||||||
| Total stock-based compensation |
$ | 8,781 | $ | 4,426 | $ | 1,654 | ||||||
|
|
|
|
|
|
|
|||||||
99
Table of Contents
During the years ended December 31, 2014, 2013 and 2012, the Company issued stock options with a 10-year term that contain service conditions. Generally, these stock options vest and become exercisable over a service period of three to four years from the date of grant.
During the year ended December 31, 2013, the Company also issued stock options with a 10-year term that contain both a performance condition and a service condition. The performance-based options were to vest and become exercisable only in the event of the completion of the Company’s IPO and then over a service period of three to four years from the date of grant. The number of shares subject to the performance-based options was to be reduced, as necessary, such that each holder’s total option holdings would equal a target percentage of the Company’s common stock deemed outstanding immediately prior to the IPO. The aggregate target percentage for all holders of performance-based options issued during the year ended December 31, 2013 was 15.384%. If the number of shares subject to these options was insufficient to achieve the target percentage in an IPO, the Company was under no obligation to grant additional options to the holder.
At December 31, 2014, 1,244,781 shares of common stock were reserved for stock-based awards granted under the 2014 Equity Plan. In addition, 96,369 shares of common stock are reserved for stock-based awards granted under the Company’s 2001 Equity Plan, which was replaced by the 2014 Equity Plan. Any cancellations or forfeitures of these awards will become available for grant under the 2014 Equity Plan. At December 31, 2014, there were 3,750,420 shares available for grant under the 2014 Equity Plan.
Valuation and Amortization Method
Prior to the IPO, the Board of Directors had historically determined the fair value of the Company’s common stock based on the market approach and the income approach to estimate the enterprise value of the business under various liquidity event scenarios, including an IPO by the Company and the sale of the Company. To support the valuations, the Company utilized a probability-weighted expected return under those various liquidity scenarios, public guideline companies, management cash flow projections and other assumptions to derive the enterprise value of the business. The Company then derived the estimated fair value of each class of stock, taking into consideration the rights and preferences of each instrument based on a probability-weighted expected return.
The fair value of each stock option was estimated as of the date of grant using the Black-Scholes option pricing model. Key inputs into this formula included expected term, expected volatility, expected dividend yield and the risk-free rate. Each assumption is set forth and discussed below.
For the performance-based stock options issued during the year ended December 31, 2013, the Company used a Monte Carlo simulation model to estimate the number of options expected to remain outstanding and eligible for vesting upon completion of the Company’s IPO. The simulation model was based on a number of complex assumptions including the terms of the performance condition, the value of our common stock at the time of the Company’s IPO, the expected time from the date of grant to the Company’s IPO and expected volatility. The number of options expected to remain outstanding and eligible for vesting upon completion of the Company’s IPO was estimated to be 96.8% and 97.4% of the options granted at August 7, 2013 and December 20, 2013, respectively. The fair value of each performance-based stock option was determined by multiplying the Black-Scholes estimate of grant date fair value by the percentage of options expected to remain outstanding and eligible for vesting upon completion of the Company’s IPO.
For stock options with a service condition, the fair value is amortized on a straight-line basis over the requisite service period of the options, which is generally a three- to four-year vesting period from the date of grant. For the performance-based stock options issued during the year ended December 31, 2013, a portion of the fair value was recognized as expense when the IPO performance condition was achieved and the remainder over the requisite service period, which is generally a three- to four-year vesting period from the date of grant.
100
Table of Contents
Expected Term
The expected term represents the period that the Company’s stock-based awards are expected to be outstanding. The Company uses the simplified method as prescribed by FASB ASC 718 to calculate the expected term for options granted, as it does not have sufficient historical exercise data to provide a reasonable basis upon which to estimate the expected term.
Expected Volatility
Due to the Company’s limited historical data, the estimated volatility reflects the incorporation of the historical volatility of comparable companies with publicly available share prices. In 2014, 2013 and 2012, the expected volatility is based on the weighted average volatility of up to seven companies within various industries that the Company believes are similar to its own.
Expected Dividend
The Company uses an expected dividend yield of zero. The Company does not intend to pay cash dividends on its common stock in the foreseeable future, nor has it paid dividends on its common stock in the past.
Risk-free Interest Rate
The risk-free interest rate is based on U.S. Treasury zero-coupon issues with a remaining term equal to the expected life assumed at the date of grant.
Estimated Forfeitures
Forfeitures are required to be estimated at the time of grant and revised, if necessary, in subsequent periods, if actual forfeitures differ from those estimates. Forfeitures are estimated based on voluntary termination behavior as well as analysis of actual option forfeitures. Accordingly, share-based compensation expense has been reduced by an estimated annual forfeiture rate for the years ended December 31, 2014, 2013 and 2012.
Assumptions Utilized
The following information relates to the fair value of the option awards estimated by use of the Black-Scholes option pricing model:
| Year Ended December 31 | ||||||||||||
| 2014 | 2013 | 2012 | ||||||||||
| Weighted average assumptions: |
||||||||||||
| Expected term (in years) |
6.17 | 5.47 | 6.02 | |||||||||
| Expected volatility |
50.09 | % | 48.99 | % | 58.06 | % | ||||||
| Risk free rate |
1.94 | % | 1.69 | % | 0.95 | % | ||||||
| Expected dividend yield |
0.00 | % | 0.00 | % | 0.00 | % | ||||||
| Weighted average fair value: |
||||||||||||
| Grant-date fair value of options granted |
$ | 5.37 | $ | 0.12 | $ | 5.60 | ||||||
| Grant-date fair value of options vested |
$ | 97.31 | $ | 0.18 | $ | 2.30 | ||||||
| Aggregate intrinsic value of options exercised |
$ | 4,816.50 | $ | — | $ | — | ||||||
Modifications
On August 7, 2013, the Company canceled substantially all options held by Company employees and granted two sets of new options to these employees. Each recipient received a grant of options containing service-based
101
Table of Contents
vesting conditions and a second grant of options containing both service and performance-based vesting conditions. The performance-based vesting was met upon the successful completion of the IPO of the Company’s common stock.
On December 20, 2013, the Company canceled all options held by members of the Company’s board of directors and granted two sets of new options to these directors. Each recipient received a grant of options containing service-based vesting conditions and a second grant of options containing both service and performance-based vesting conditions. The performance-based vesting was met upon the successful completion of the IPO of the Company’s common stock.
As a result of the cancellation and concurrent grant of options, the Company accounted for these transactions as modifications in determining the stock-based compensation expense to be recognized over the remaining service period. The total incremental compensation expense resulting from the modification was $7.8 million and $1.0 million for the two grant dates, respectively. The incremental compensation expense associated with the service based awards of $2.0 million will be recognized over the remaining service period of the new options. The Company recorded $0.4 million and $6.4 million associated with the service and performance-based awards, respectively, during the year ended December 31, 2014 as a result of the IPO in June 2014.
Outstanding Options
The following table summarizes information about stock options outstanding:
| Number of Shares |
Weighted Average Grant Date Fair Value Per Share |
Weighted Average Exercise Price Per Share |
Weighted Average Remaining Contractual Term (Years) |
Aggregate Intrinsic Value |
||||||||||||||||
| ($ in thousands, except share and per share data) | ||||||||||||||||||||
| Options outstanding at December 31, 2013 |
97,183 | $ | 97.36 | $ | 92.25 | 9.63 | ||||||||||||||
| Granted |
934,018 | $ | 5.37 | $ | 10.78 | |||||||||||||||
| Forfeited |
(4,660 | ) | $ | 20.14 | $ | 21.45 | ||||||||||||||
| Exercised |
(31 | ) | $ | 95.92 | $ | 74.23 | $ | 4,816.50 | ||||||||||||
|
|
|
|||||||||||||||||||
| Options outstanding at December 31, 2014 |
1,026,510 | $ | 14.01 | $ | 18.44 | 9.59 | $ | — | ||||||||||||
|
|
|
|||||||||||||||||||
| Exercisable at December 31, 2014 |
63,731 | $ | 97.31 | $ | 82.10 | 8.59 | $ | — | ||||||||||||
|
|
|
|||||||||||||||||||
| Expected to vest at December 31, 2014 |
827,504 | $ | 8.82 | $ | 13.46 | 9.66 | $ | — | ||||||||||||
|
|
|
|||||||||||||||||||
As of December 31, 2014, total unrecognized compensation cost related to nonvested options granted under the Plan was $6.8 million. The unrecognized compensation cost consisted of $5.9 million relating to service-based awards and $0.9 million to performance-based awards. The unrecognized compensation cost for the service-based options and performance-based awards is expected to be recognized over a weighted average period of 2.76 and 1.60 years, respectively.
102
Table of Contents
Restricted Stock Awards and Restricted Stock Units
The Company values restricted stock awards and RSUs based on the closing trading value of our shares on the date of grant. Information related to grants of RSUs during 2014 is as follows:
| Restricted Stock Units |
Weighted Average Grant Date Fair Value |
|||||||
| Balance at December 31, 2013 |
— | $ | — | |||||
| Granted |
318,517 | $ | 10.78 | |||||
| Vested |
— | — | ||||||
| Forfeited |
(3,877 | ) | $ | 10.78 | ||||
|
|
|
|
|
|||||
| Balance outstanding at December 31, 2014 |
314,640 | $ | 10.78 | |||||
|
|
|
|
|
|||||
Restricted stock awards granted during 2014 are considered issued and outstanding common stock and are excluded from the table above.
As of December 31, 2014, total unrecognized compensation cost related to restricted stock awards and RSUs granted under the 2014 Equity Plan was $0.3 million and $2.6 million and is expected to be recognized over a weighted average period of 0.44 and 3.11 years, respectively.
(17) Net Income (Loss) Per Share
The computation of basic and diluted net income (loss) per share attributable to common stockholders consists of the following:
| Year ended December 31 | ||||||||||||
| 2014 | 2013 | 2012 | ||||||||||
| (In thousands, except share and per share data) | ||||||||||||
| Numerator: |
||||||||||||
| Net income (loss) |
$ | (66,324 | ) | $ | (47,611 | ) | $ | (56,142 | ) | |||
| Deemed dividends on participating preferred stock (inclusive of issuance costs and changes in redemption value, including extinguishment): |
||||||||||||
| Series B |
— | 29,622 | 3,772 | |||||||||
| Series A |
— | 55,543 | 43,429 | |||||||||
|
|
|
|
|
|
|
|||||||
| Total preferred stock deemed dividends |
— | 85,165 | 47,201 | |||||||||
| Earnings attributable to participating convertible preferred stock shareholders and Series C preferred stock warrant holders |
— | (36,216 | ) | — | ||||||||
|
|
|
|
|
|
|
|||||||
| Net income (loss) attributable to common stockholders |
$ | (66,324 | ) | $ | 1,338 | $ | (8,941 | ) | ||||
|
|
|
|
|
|
|
|||||||
| Denominator: |
||||||||||||
| Weighted average shares outstanding, basic |
12,349,456 | 3,137 | 3,136 | |||||||||
| Effect of warrants to purchase common stock |
— | 122 | — | |||||||||
|
|
|
|
|
|
|
|||||||
| Weighted average shares outstanding, diluted |
12,349,456 | 3,259 | 3,136 | |||||||||
|
|
|
|
|
|
|
|||||||
| Net income (loss) attributable to common stockholders per common share, basic |
$ | (5.37 | ) | $ | 426.52 | $ | (2,851.08 | ) | ||||
| Effect of warrants to purchase common stock |
— | (15.96 | ) | — | ||||||||
|
|
|
|
|
|
|
|||||||
| Net income (loss) attributable to common stockholders per common share, diluted |
$ | (5.37 | ) | $ | 410.56 | $ | (2,851.08 | ) | ||||
|
|
|
|
|
|
|
|||||||
103
Table of Contents
Potential dilutive common shares that were excluded from the computation of diluted net income (loss) attributable to common stockholders per common share because they were anti-dilutive consist of the following:
| Year ended December 31 | ||||||||||||
| 2014 | 2013 | 2012 | ||||||||||
| Series B (a) |
— | — | 1,941 | |||||||||
| Series A (a) |
— | — | 6,407 | |||||||||
| Common stock options |
1,026,510 | 21,846 | 2,749 | |||||||||
| Restricted common stock units |
314,640 | — | — | |||||||||
| Common stock warrants |
131 | — | 137 | |||||||||
|
|
|
|
|
|
|
|||||||
| Total |
1,341,281 | 21,846 | 11,234 | |||||||||
|
|
|
|
|
|
|
|||||||
| (a) | Common stock equivalent reflecting conversion of preferred shares. |
As of December 31, 2014, there was no dilutive impact of the common stock options, restricted common stock units and common stock warrants. All other potentially dilutive instruments were converted into shares of common stock upon the closing of the Company’s IPO on June 18, 2014.
As of December 31, 2013 the Company had outstanding $28.1 million of Senior Convertible Notes and $91.9 million of Convertible Notes, which were convertible into common stock upon the occurrence of an IPO at prices that are not determinable until the occurrence of those future events (see notes 7 and 8), and 97,183 outstanding common stock options, which were exercisable into common stock upon the occurrence of an IPO and the performance of service during the vesting period (see note 16). As of December 31, 2012 the Company had $95.1 million of outstanding Convertible Notes which were convertible into common stock upon the occurrence of an IPO at prices that were not determinable until the occurrence of those future events (see note 8). Because the necessary conditions for the conversion of these convertible notes and common stock options had not been satisfied during the respective years ended, the Company has excluded these convertible notes and performance options from the table above and the calculation of diluted net (loss) income per share for the respective years ended.
(18) Income Taxes
The Company incurred net operating losses and recorded a full valuation allowance against net deferred assets for all periods presented. Accordingly, the Company has not recorded a provision for federal or state income taxes.
The reconciliation between the U.S. statutory income tax rate and the Company’s effective rate consists of the following:
| Year Ended December 31 | ||||||||||||
| 2014 | 2013 | 2012 | ||||||||||
| U.S. federal income tax statutory rate |
35 | % | 35 | % | 35 | % | ||||||
| Debt and warrant fair value adjustments |
(26 | %) | (16 | %) | (12 | %) | ||||||
| Changes in valuation allowance for deferred tax assets |
1 | % | 6 | % | (22 | %) | ||||||
| Write down of losses not previously benefitted |
(11 | %) | (22 | %) | 0 | % | ||||||
| Other |
1 | % | (3 | %) | (1 | %) | ||||||
|
|
|
|
|
|
|
|||||||
| Effective tax rate |
— | — | — | |||||||||
|
|
|
|
|
|
|
|||||||
104
Table of Contents
The tax effects of temporary differences between financial statement and tax accounting that gave rise to significant portions of the Company’s deferred tax assets and deferred tax liabilities at December 31, 2014 and 2013 are presented below:
| December 31 | ||||||||
| 2014 | 2013 | |||||||
| (In thousands) | ||||||||
| Deferred tax assets: |
||||||||
| Net operating loss carryforwards |
$ | 61,457 | $ | 67,503 | ||||
| Transaction related costs |
— | 1,494 | ||||||
| Stock-based compensation |
4,479 | 2,460 | ||||||
| Tax credit carryforwards |
379 | 393 | ||||||
| Reserves and accruals |
282 | 896 | ||||||
| Intangible assets and amortization |
384 | — | ||||||
| Other |
5 | 127 | ||||||
|
|
|
|
|
|||||
| Total gross deferred tax assets |
66,986 | 72,873 | ||||||
| Deferred tax liabilities: |
||||||||
| Depreciation |
$ | (3,311 | ) | $ | (2,717 | ) | ||
|
|
|
|
|
|||||
| Total deferred tax liabilities |
(3,311 | ) | (2,717 | ) | ||||
|
|
|
|
|
|||||
| Total deferred tax assets and liabilities |
63,675 | 70,156 | ||||||
| Valuation allowance |
(63,675 | ) | (70,156 | ) | ||||
|
|
|
|
|
|||||
| Net deferred tax asset |
$ | — | $ | — | ||||
|
|
|
|
|
|||||
The net change in the valuation allowance for the year ended December 31, 2014, was a decrease of $6.5 million. The Company has recorded a full valuation allowance against its deferred tax assets due to the uncertainty associated with the utilization of the net operating loss carryforwards and other future deductible items. In assessing the realizability of deferred tax assets, the Company considers all available evidence, historical and prospective, with greater weight given to historical evidence, in determining whether it is more likely than not that some portion or all of the deferred tax assets will not be realized. The ultimate realization of the Company’s deferred tax assets generally is dependent upon generation of future taxable income.
At December 31, 2014, the Company has $161.4 million of net operating losses available to offset future federal income, if any, and which expire on various dates through December 31, 2034.
For the year ended December 31, 2010, the Company performed an analysis pursuant to Section 382 of the Internal Revenue Code of 1986, as amended (the Internal Revenue Code) as well as similar state provisions, in order to determine whether any limitations might exist on the utilization of net operating losses and other tax attributes. Based on this analysis, the Company has determined that it is more likely than not that an ownership change occurred on June 10, 2008, resulting in an annual limitation on the use of its net operating losses and other tax attributes as of such date. The Company also determined that built-in gains of $29.5 million existed at the date of the ownership change. Built-in gains increase the limitation under the Internal Revenue Code Section 382 to the extent triggered during the five year period subsequent to the date of change, which period ended in June 2013.
For the year ended December 31, 2013, the Company performed an analysis pursuant to Internal Revenue Code Section 382, as well as similar state provisions, in order to determine whether any limitations might exist on the utilization of net operating losses and other tax attributes. Based on this analysis, the Company has determined that no ownership changes occurred as a result of the March 2013 financing (see note 7) and, as a result, there was no annual limitation on the use of its net operating losses and other tax attributes as of such date.
105
Table of Contents
For the year ended December 31, 2014, the Company performed an analysis pursuant to Internal Revenue Code Section 382, as well as similar state provisions, in order to determine whether any limitations might exist on the utilization of net operating losses and other tax attributes. Based on this analysis, the Company has determined that an ownership change occurred as a result of the June 2014 IPO, resulting in an annual limitation on the use of its net operating losses and other tax attributes as of such date. Net operating losses of $113.2 million were determined to be available. The Company also determined that built-in gains of $42.0 million existed at the date of the ownership change. Built-in gains increase the limitation under the Internal Revenue Code to the extent triggered during the five-year period subsequent to the date of change. Absent the disposition of certain built-in gain assets within the five-year period subsequent to the change in ownership, the entire $42.0 million of net operating losses will expire in June 2019.
At December 31, 2014, the Company has $106.0 million of apportioned net operating losses available to offset future state taxable income, if any, and which begin to expire at various dates between 2015 and 2034.
For each of the years ended December 31, 2014, 2013 and 2012, the Company did not have any material unrecognized tax benefits and thus no interest and penalties related to unrecognized tax benefits were recorded. In addition, the Company does not expect that the amount of unrecognized tax benefits will change significantly within the next twelve months.
The Company files a federal income tax return in the United States and income tax returns in various state and foreign jurisdictions. All tax years are open for examination by the taxing authorities for both federal and state purposes.
(19) Related Party Transactions
The Company had the following transactions with related parties:
During the years ended 2014, 2013 and 2012, the Company sold aerogel products to one stockholder totaling $4.7 million, to three stockholders totaling $8.9 million and to four stockholders totaling $10.7 million, respectively. The Company had trade receivables with these stockholders of $2.0 million and $2.0 million at December 31, 2014 and 2013, respectively.
Prior to the closing of the Company’s IPO in June 2014, several stockholders of the Company held Subordinated Notes, Senior Convertible Notes and Convertible Notes (see notes 6, 7 and 8).
(20) Subsequent Events
The Company has evaluated subsequent events through March 13, 2015, the date of issuance of the consolidated financial statements for the year ended December 31, 2014.
106
Table of Contents
QUARTERLY RESULTS OF OPERATIONS
(in thousands, except per share data)
(unaudited)
| Three Months Ended | ||||||||||||||||
| March 31, | June 30, | Sept 30, | Dec 31, | |||||||||||||
| 2014 |
||||||||||||||||
| Total revenue |
$ | 22,363 | $ | 26,615 | $ | 25,437 | $ | 27,984 | ||||||||
| Gross profit |
3,346 | 3,425 | 5,072 | 5,236 | ||||||||||||
| Income (loss) from operations |
(2,898 | ) | (8,121 | ) | (2,365 | ) | (2,658 | ) | ||||||||
| Net income (loss) |
(19,049 | ) | (42,148 | ) | (2,412 | ) | (2,714 | ) | ||||||||
| Net income (loss) attributable to common stockholders |
(19,049 | ) | (42,148 | ) | (2,412 | ) | (2,714 | ) | ||||||||
| Net income (loss) attributable to common stockholders per common share - basic |
$ | (6,065.89 | ) | $ | (13.88 | ) | $ | (0.10 | ) | $ | (0.12 | ) | ||||
| Net income (loss) attributable to common stockholders per common share - diluted |
$ | (6,065.89 | ) | $ | (13.88 | ) | $ | (0.10 | ) | $ | (0.12 | ) | ||||
| 2013 |
||||||||||||||||
| Total revenue |
$ | 17,005 | $ | 22,978 | $ | 21,880 | $ | 24,232 | ||||||||
| Gross profit |
38 | 3,531 | 3,580 | 3,583 | ||||||||||||
| Income (loss) from operations |
(6,025 | ) | (2,638 | ) | (4,665 | ) | (6,644 | ) | ||||||||
| Net income (loss) |
1,027 | (18,984 | ) | (8,038 | ) | (16,950 | ) | |||||||||
| Net income (loss) attributable to common stockholders |
20,251 | (18,984 | ) | (12,703 | ) | (16,950 | ) | |||||||||
| Net income (loss) attributable to common stockholders per common share - basic |
$ | 6,455.53 | $ | (6,051.64 | ) | $ | (4,049.41 | ) | $ | (5,403.25 | ) | |||||
| Net income (loss) attributable to common stockholders per common share - diluted |
$ | 6,455.21 | $ | (6,051.64 | ) | $ | (4,049.41 | ) | $ | (5,403.25 | ) | |||||
The reported results for 2014 included interest expense comprised of changes in fair value of the subordinated notes, senior convertible notes, convertible notes and debt closing costs and other interest expense of: $16.2 million in the first quarter, $34.0 million in the second quarter, less than $0.1 million in the third quarter and $0.1 million in the fourth quarter. The changes in fair value of the respective notes were calculated based on the expected conversion amounts of the notes into equity at the closing of our initial public offering.
The reported results for 2013 included interest expense comprised of changes in fair value of the subordinated notes, senior convertible notes, convertible notes, debt closing costs, other interest expense, loss on exchange of convertible notes, gain on the extinguishment of convertible notes and costs associated with a postponed public offering of: $7.1 million of income in the first quarter, $16.3 million in the second quarter, $8.0 million in the third quarter and $10.3 million in the fourth quarter. The changes in fair value of the respective notes were calculated based on the expected conversion amounts of the notes into equity at the closing of our initial public offering.
107
Table of Contents
Report of Independent Registered Public Accounting Firm
The Board of Directors and Stockholders
Aspen Aerogels, Inc.:
Under date of March 13, 2015, we reported on the consolidated balance sheets of Aspen Aerogels, Inc. and subsidiaries as of December 31, 2014 and 2013, and the related consolidated statements of operations, stockholders’ equity (deficit), and cash flows for each of the years in the three-year period ended December 31, 2014, which are included in the annual report on Form 10-K for the year ended December 31, 2014. In connection with our audits of the aforementioned consolidated financial statements, we also audited the related consolidated financial statement schedule of Valuation and Qualifying Accounts included in the Form 10-K. This financial statement schedule is the responsibility of the Company’s management. Our responsibility is to express an opinion on this financial statement schedule based on our audits.
In our opinion, such financial statement schedule, when considered in relation to the basic consolidated financial statements taken as a whole, presents fairly, in all material respects, the information set forth therein.
/s/ KPMG LLP
Boston, Massachusetts
March 13, 2015
108
Table of Contents
Schedule II
VALUATION AND QUALIFYING ACCOUNTS
(in millions)
| Description |
Balance at Beginning of Year |
Charges to Costs and Expenses (a) |
Deductions to Allowances for Uncollectible Accounts (b) |
Charges to (Deductions from) Other Accounts (c) |
Balance at End of Year |
|||||||||||||||
| Year Ended December 31, 2014: |
||||||||||||||||||||
| Allowances for uncollectible accounts and sales returns and allowances |
$ | 209 | — | — | (89 | ) | $ | 120 | ||||||||||||
| Year Ended December 31, 2013: |
||||||||||||||||||||
| Allowances for uncollectible accounts and sales returns and allowances |
$ | 421 | — | — | (212 | ) | $ | 209 | ||||||||||||
| Year Ended December 31, 2012: |
||||||||||||||||||||
| Allowances for uncollectible accounts and sales returns and allowances |
$ | 282 | — | (103 | ) | 242 | $ | 421 | ||||||||||||
| (a) | Represents allowances for uncollectible accounts established through selling, general and administrative expenses. |
| (b) | Represents actual write-offs of uncollectible accounts. |
| (c) | Represents net change in allowances for sales returns, recorded as contra-revenue. |
109
Table of Contents
| Item 9. | CHANGES IN AND DISAGREEMENTS WITH ACCOUNTANTS ON ACCOUNTING AND FINANCIAL DISCLOSURE |
Not applicable.
| Item 9A. | CONTROLS AND PROCEDURES |
(a) Evaluation of Disclosure Controls and Procedures. We maintain disclosure controls and procedures that are designed to ensure that information required to be disclosed in the reports that we file or submit under the Exchange Act, is recorded, processed, summarized and reported within the time periods specified in the SEC’s rules and forms and is accumulated and communicated to our management, including our principal executive officer and principal financial officer, or persons performing similar functions, as appropriate to allow timely decisions regarding required disclosure.
As of December 31, 2014, our management, with the participation of our principal executive officer and principal financial officer, evaluated the effectiveness of our disclosure controls and procedures (as defined in Rules 13a-15(e) and 15d-15(e) under the Exchange Act). Our management recognizes that any controls and procedures, no matter how well designed and operated, can provide only reasonable assurance of achieving their objectives, and management necessarily applies its judgment in evaluating the cost-benefit relationship of possible controls and procedures. Based on such evaluation, our principal executive officer and principal financial officer have concluded, that, as of December 31, 2014, our disclosure controls and procedures were effective to ensure that information required to be disclosed by us in the reports that we file or submit under the Exchange Act is recorded, processed, summarized and reported within the time periods specified in the SEC’s rules and forms, and is accumulated and communicated to our management, including our principal executive officer and principal financial officer, or persons performing similar functions, as appropriate to allow timely decisions regarding required disclosure.
(b) Changes in Internal Controls. There were no changes in our internal control over financial reporting, as such term is defined in Rules 13a-15(f) and 15(d)-15(f) promulgated under the Exchange Act, identified in connection with the evaluation of such internal control that occurred during the fourth quarter of the last fiscal year that have materially affected, or are reasonably likely to materially affect, our internal control over financial reporting.
(c) Management’s Report on Internal Control over Financial Reporting. The Annual Report on Form 10-K does not include a report of management’s assessment regarding internal control over financial reporting or an attestation report of our independent registered public accounting firm due to a transition period established by the rules of the SEC for newly public companies.
| Item 9B. | OTHER INFORMATION |
On March 11, 2015, the Board of Directors approved a salary increase for our executive officers, which increase will be effective as of March 28, 2015. The new annual base salaries approved for Mr. Donald R. Young, Mr. John F. Fairbanks and Mr. Corby Whitaker are $480,000, $283,371 and $300,500, respectively. The Board of Directors also increased the target bonus amount for Mr. Young from 75% of his year-end base salary for 2015, as reported in our Current Report on Form 8-K filed with the SEC on January 15, 2015, to 90% of his year-end base salary for 2015.
110
Table of Contents
| Item 10. | DIRECTORS, EXECUTIVE OFFICERS AND CORPORATE GOVERNANCE |
The response to this item is incorporated by reference from the discussion responsive thereto under the captions “Management and Corporate Governance,” “Section 16(a) Beneficial Ownership Reporting Compliance,” and “Code of Business Conduct and Ethics” in the Company’s Proxy Statement for the 2015 Annual Meeting of Stockholders.
| Item 11. | EXECUTIVE AND DIRECTOR COMPENSATION |
The response to this item is incorporated by reference from the discussion responsive thereto under the caption “Executive Officer and Director Compensation” in the Company’s Proxy Statement for the 2015 Annual Meeting of Stockholders.
| Item 12. | SECURITY OWNERSHIP OF CERTAIN BENEFICIAL OWNERS AND MANAGEMENT AND RELATED STOCKHOLDER MATTERS |
The response to this item is incorporated by reference from the discussion responsive thereto under the captions “Security Ownership of Certain Beneficial Owners and Management,” “Equity Compensation Plan Information” in the Company’s Proxy Statement for the 2015 Annual Meeting of Stockholders.
| Item 13. | CERTAIN RELATIONSHIPS AND RELATED TRANSACTIONS, AND DIRECTOR INDEPENDENCE |
The response to this item is incorporated by reference from the discussion responsive thereto under the captions “Certain Relationships and Related Person Transactions” and “Management and Corporate Governance” in the Company’s Proxy Statement for the 2015 Annual Meeting of Stockholders.
| Item 14. | PRINCIPAL ACCOUNTING FEES AND SERVICES |
The response to this item is incorporated by reference from the discussion responsive thereto under the caption “Independent Public Accountants” in the Company’s Proxy Statement for the 2015 Annual Meeting of Stockholders.
111
Table of Contents
| Item 15. | EXHIBITS, FINANCIAL STATEMENT SCHEDULES |
Item 15(a). The following documents are filed as part of this Annual Report on Form 10-K:
Item 15(a)(1) The following consolidated financial statements of the Company are included in Part II, Item 8 of this Annual Report on Form 10-K:
Report of Independent Registered Public Accounting Firm
Consolidated Balance Sheets as of December 31, 2014 and 2013
Consolidated Statements of Operations for the Years Ended December 31, 2014, 2013, and 2012
Consolidated Statements of Stockholders’ Equity (Deficit) for the Years Ended December 31, 2014, 2013 and 2012
Consolidated Statements of Cash Flows for the Years Ended December 31, 2014, 2013 and 2012
Notes to Consolidated Financial Statements
Item 15(a)(2) The following financial statements schedule is included in Part II, Item 8:
Schedule II – Valuation and Qualifying Accounts
All other financial statement schedules have not been included because they are not applicable or the information is included in the financial statements or notes thereto.
Item 15(a)(3) Exhibits
The following is a list of exhibits filed as part of this Annual Report on Form 10-K.
| Exhibit |
Exhibit Description |
Filed |
Incorporated by |
Filing Date |
SEC File/Reg. Number |
|||||||
| 3.1 |
Restated Certificate of Incorporation of the Registrant, as filed with the Secretary of State of the State of Delaware on June 18, 2014. | Form 8-K (Exhibit 3.2) |
6/19/14 | 001-36481 | ||||||||
| 3.2 |
Restated Bylaws of Aspen Aerogels, Inc. | Form 8-K (Exhibit 3.3) |
6/19/14 | 001-36481 | ||||||||
| 4.1 |
Form of common stock certificate. | Amendment No. 1 to Form S-1 (Exhibit 4.1) |
5/14/14 | 333-195523 | ||||||||
| 4.2 |
Form of warrant to purchase common stock issued by the Registrant in connection with 2004 and 2005 financing arrangements, as amended and restated. | Form S-1 (Exhibit 4.2) |
4/28/14 | 333-195523 | ||||||||
| 4.3 |
Form of warrant to purchase common stock issued by the Registrant in connection with the 2005 equity financing, as amended and restated. | Form S-1 (Exhibit 4.3) |
4/28/14 | 333-195523 | ||||||||
| 4.4 |
Form of warrant to purchase common stock issued by the Registrant in connection with the 2008 reorganization. | Form S-1 (Exhibit 4.4) |
4/28/14 | 333-195523 | ||||||||
| 4.5 |
Form of warrant to purchase common stock issued by the Registrant in connection with the 2008 financing. | Form S-1 (Exhibit 4.5) |
4/28/14 | 333-195523 | ||||||||
| 4.6 |
Form of warrant to purchase common stock issued by the Registrant in connection with the 2010 subordinated note and warrant financing. | Form S-1 (Exhibit 4.6) |
4/28/14 | 333-195523 | ||||||||
112
Table of Contents
| Exhibit |
Exhibit Description |
Filed |
Incorporated by |
Filing Date |
SEC File/Reg. Number | |||||
| 4.7 |
Sixth amended and restated registration rights agreement, dated as of June 11, 2012, by and among the Registrant and the investors named therein, as amended. | Form S-1 (Exhibit 4.8) |
4/28/14 | 333-195523 | ||||||
| 9.1 |
Letter agreement, dated as of June 11, 2014, by and between the Registrant and the Fidelity Funds. | Amendment No. 5 to Form S-1 (Exhibit 9.1) |
6/12/14 | 333-195523 | ||||||
| 10.1 |
2001 equity incentive plan, as amended.+ | Form S-1 (Exhibit 10.1.1) |
4/28/14 | 333-195523 | ||||||
| 10.2 |
Form of incentive stock option agreement granted under 2001 equity incentive plan, as amended.+ | Form S-1 (Exhibit 10.1.2) |
4/28/14 | 333-195523 | ||||||
| 10.3 |
Form of 2013 incentive stock option agreement for options issued in exchange for the forfeiture of options granted under 2001 equity incentive plan, as amended.+ | Form S-1 (Exhibit 10.1.3) |
4/28/14 | 333-195523 | ||||||
| 10.4 |
Form of 2013 performance-based incentive stock option agreement granted under 2001 equity incentive plan, as amended.+ | Form S-1 (Exhibit 10.1.4) |
4/28/14 | 333-195523 | ||||||
| 10.5 |
Form of non-qualified stock option agreement granted under 2001 equity incentive plan, as amended.+ | Form S-1 (Exhibit 10.1.5) |
4/28/14 | 333-195523 | ||||||
| 10.6 |
Form of 2013 non-qualified stock option agreement for options issued in exchange for the forfeiture of options granted under 2001 equity incentive plan, as amended.+ | Form S-1 (Exhibit 10.1.6) |
4/28/14 | 333-195523 | ||||||
| 10.7 |
Form of 2013 performance-based non-qualified stock option agreement granted under 2001 equity incentive plan, as amended.+ | Form S-1 (Exhibit 10.1.7) |
4/28/14 | 333-195523 | ||||||
| 10.8 |
Form of 2013 independent director stock option agreement for options issued in exchange for the forfeiture of options granted under 2001 equity incentive plan, as amended.+ | Form S-1 (Exhibit 10.1.8) |
4/28/14 | 333-195523 | ||||||
| 10.9 |
Form of 2013 performance-based independent director stock option agreement granted under 2001 equity incentive plan, as amended.+ | Form S-1 (Exhibit 10.1.9) |
4/28/14 | 333-195523 | ||||||
| 10.10 |
2014 employee, director and consultant equity incentive plan.+ | Form S-8 (Exhibit 99.10) |
8/13/14 | 333-198124 | ||||||
| 10.11 |
Form of stock option agreement granted under 2014 employee, director and consultant equity incentive plan.+ | Amendment No. 1 to Form S-1 (Exhibit 10.2.2) |
5/14/14 | 333-195523 | ||||||
| 10.12 |
Form of restricted stock unit agreement for executive officers under 2014 employee, director and consultant equity incentive plan.+ | Form 10-Q (Exhibit 10.3) |
11/7/14 | 001-36481 | ||||||
| 10.13 |
Form of restricted stock agreement for directors under 2014 employee, director and consultant equity incentive plan.+ | Amendment No. 1 to Form S-1 (Exhibit 10.2.3) |
5/14/14 | 333-195523 |
113
Table of Contents
| Exhibit |
Exhibit Description |
Filed |
Incorporated by |
Filing Date |
SEC File/Reg. Number | |||||
| 10.14 |
Multi-tenant industrial net lease, dated August 20, 2001, by and between the Registrant and Cabot II — MA1M03, LLC (as successor landlord to TMT290 Industrial Park, Inc.), as amended. | Form S-1 (Exhibit 10.3) |
4/28/14 | 333-195523 | ||||||
| 10.15 |
Amended and Restated Loan and Security Agreement, dated September 3, 2014 and effective as of August 31, 2014, by and between the Company and Silicon Valley Bank. | Form 8-K (Exhibit 10.1) |
9/9/14 | 001-36481 | ||||||
| 10.16 |
Executive agreement, dated as of August 5, 2011, by and between the Registrant and Donald R. Young, as amended by the First Amendment thereto, dated as of October 23, 2012.+ | Form S-1 (Exhibit 10.10) |
4/28/14 | 333-195523 | ||||||
| 10.17 |
Executive agreement, dated as of August 5, 2011, by and between the Registrant and John F. Fairbanks, as amended by the First Amendment thereto, dated as of November 6, 2012.+ | Form S-1 (Exhibit 10.11) |
4/28/14 | 333-195523 | ||||||
| 10.18 |
Executive agreement, dated as of August 5, 2011, by and between the Registrant and George L. Gould, Ph.D.+ | Form S-1 (Exhibit 10.12) |
4/28/14 | 333-195523 | ||||||
| 10.19 |
Executive agreement, dated as of August 5, 2011, by and between the Registrant and Kevin A. Schmidt.+ | Form S-1 (Exhibit 10.13) |
4/28/14 | 333-195523 | ||||||
| 10.20 |
Executive agreement, dated as of January 30, 2012, by and between the Registrant and Corby C. Whitaker.+ | Form S-1 (Exhibit 10.14) |
4/28/14 | 333-195523 | ||||||
| 10.21 |
Bonus plan.+ | Amendment No. 2 to Form S-1 (Exhibit 10.15) |
5/22/14 | 333-195523 | ||||||
| 10.22 |
2014 participation letters of executive officers under bonus plan.+ | Amendment No. 3 to Form S-1 (Exhibit 10.15.1) |
6/2/14 | 333-195523 | ||||||
| 10.23 |
Non-employee director compensation policy.+ | Amendment No. 1 to Form S-1 (Exhibit 10.16) |
5/14/14 | 333-195523 | ||||||
| 10.24 |
Cross license agreement dated as of April 1, 2006 by and between Cabot Corporation and the Registrant, as amended.* | Form S-1 (Exhibit 10.15) |
4/28/14 | 333-195523 | ||||||
| 10.25 |
Form of indemnification agreement with directors and certain officers.+ | Amendment No. 1 to Form S-1 (Exhibit 10.18) |
5/14/14 | 333-195523 | ||||||
| 21.1 |
Subsidiaries of the Registrant. | Form S-1 (Exhibit 21.1) |
4/28/14 | 333-195523 | ||||||
| 23.1 |
Consent of KPMG LLP. | X | ||||||||
| 31.1 |
Certification of principal executive officer under Section 302(a) of the Sarbanes-Oxley Act of 2002. | X |
114
Table of Contents
| Exhibit |
Exhibit Description |
Filed |
Incorporated by |
Filing Date |
SEC File/Reg. Number | |||||
| 31.2 | Certification of principal financial officer under Section 302(a) of the Sarbanes-Oxley Act of 2002. |
X | ||||||||
| 32 | Certifications of the principal executive officer the Sarbanes-Oxley Act of 2002. |
X | ||||||||
| 101 | The following materials from the Registrant’s Annual Report on Form 10-K for the fiscal year ended
December 31, 2014, formatted in XBRL 2014
and 2013, (ii) Consolidated Statements of Consolidated Statements of Cash Flows for the Years Ended December 31, 2014, 2013, and and (v)
Notes to Consolidated Financial |
X |
| + | Management contract or compensatory plan or arrangement. |
| * | Confidential treatment has been granted with respect to certain portions of this Exhibit, which portions have been omitted and filed separately with the Securities and Exchange Commission as part of an application for confidential treatment pursuant to the Securities Act of 1933, as amended. |
115
Table of Contents
Pursuant to the requirements of Section 13 or 15(d) of the Securities Exchange Act of 1934, the registrant has duly caused this report to be signed on its behalf by the undersigned, thereunto duly authorized.
| ASPEN AEROGELS, INC. | ||||
| Date: March 13, 2015 | By: | /s/ Donald R. Young | ||
|
| ||||
| Donald R. Young | ||||
| President and Chief Executive Officer | ||||
| (principal executive officer) | ||||
Pursuant to the requirements of the Securities Exchange Act of 1934, this report has been signed below by the following persons on behalf of the registrant and in the capacities indicated below and on the dates indicated.
| Signature |
Title |
Date | ||
| /s/ Donald R. Young Donald R. Young |
President, Chief Executive Officer and Director (principal executive officer) |
March 13, 2015 | ||
| /s/ John F. Fairbanks John F. Fairbanks |
Vice President, Chief Financial Officer and Treasurer (principal financial officer and principal accounting officer) |
March 13, 2015 | ||
| /s/ Mark L. Noetzel Mark L. Noetzel |
Chairman of the Board | March 13, 2015 | ||
| /s/ P. Ramsay Battin P. Ramsay Battin |
Director | March 13, 2015 | ||
| /s/ Robert M. Gervis Robert M. Gervis |
Director | March 13, 2015 | ||
| /s/ Craig A. Huff Craig A. Huff |
Director | March 13, 2015 | ||
| /s/ Steven R. Mitchell Steven R. Mitchell |
Director | March 13, 2015 | ||
| /s/ William P. Noglows William P. Noglows |
Director | March 13, 2015 | ||
| /s/ Richard F. Reilly Richard F. Reilly |
Director | March 13, 2015 | ||
116