Attached files
| file | filename |
|---|---|
| EXCEL - IDEA: XBRL DOCUMENT - Glori Energy Inc. | Financial_Report.xls |
| EX-32.1 - EXHIBIT 32.1 - Glori Energy Inc. | gloriexhibit3211.htm |
| EX-31.1 - EXHIBIT 31.1 - Glori Energy Inc. | gloriexhibit3111.htm |
| EX-32.2 - EXHIBIT 32.2 - Glori Energy Inc. | gloriexhibit3221.htm |
| EX-31.2 - EXHIBIT 31.2 - Glori Energy Inc. | gloriexhibit3121.htm |
| EX-14.1 - EXHIBIT 14.1 - Glori Energy Inc. | a141codeofethics.htm |
| EX-99.2 - EXHIBIT 99.2 - Glori Energy Inc. | a992cobbreport01-01x15.htm |
| EX-23.2 - EXHIBIT 23.2 - Glori Energy Inc. | gloriholdingsconsentletter.htm |
| EX-23.1 - EXHIBIT 23.1 - Glori Energy Inc. | a231fy2014gloriauditconsent.htm |
| EX-99.2 - EXHIBIT 99.2 - Glori Energy Inc. | a991collarinireport01-01x15.htm |
| EX-23.3 - EXHIBIT 23.3 - Glori Energy Inc. | a233consentofcobb.htm |
UNITED STATES
SECURITIES AND EXCHANGE COMMISSION
Washington, D. C. 20549
Form 10-K
(Mark One)
þ | ANNUAL REPORT PURSUANT TO SECTION 13 OR 15(d) OF THE SECURITIES EXCHANGE ACT OF 1934 | |
For the Fiscal Year Ended December 31, 2014
or
o | TRANSITION REPORT PURSUANT TO SECTION 13 OR 15(d) OF THE SECURITIES EXCHANGE ACT OF 1934 | |
Commission File Number: 000-55261
GLORI ENERGY INC.
(Exact name of registrant as specified in its charter)
Delaware | 46-4527741 | |
(State or Other Jurisdiction of | (I.R.S. Employer | |
Incorporation or Organization) | Identification No.) | |
10350 Richmond Avenue, Suite 850 | ||
Houston, Texas 77042 | 77042 | |
(Address of Principal Executive Offices) | (Zip Code) | |
Registrant’s telephone number, including area code (713) 237-8880
Securities registered pursuant to Section 12(b) of the Act:
Title of each class | Name of each exchange on which registered |
Common stock, par value $0.0001 per share | The NASDAQ Capital Market LLC |
Warrants | Other OTC |
Indicate by check mark if the registrant is a well-known seasoned issuer, as defined in Rule 405 of the Securities Act.
o Yes þ No
Indicate by check mark if the registrant is not required to file reports pursuant to Section 13 or Section 15(d) of the Act.
o Yes þ No
Indicate by check mark whether the registrant (1) has filed all reports required to be filed by Section 13 or 15(d) of the Securities Exchange Act of 1934 during the preceding 12 months (or for such shorter period that the registrant was required to file such reports), and (2) has been subject to such filing requirements for the past 90 days.
þ Yes o No
Indicate by check mark whether the registrant has submitted electronically and posted on its corporate Web site, if any, every Interactive Data File required to be submitted and posted pursuant to Rule 405 of Regulation S-T (§ 232.405 of this chapter) during the preceding 12 months (or for such shorter period that the registrant was required to submit and post such files).
þ Yes o No
Indicate by check mark if the disclosure of delinquent filers pursuant to Item 405 of Regulation S-K (§ 229.405 of this chapter) is not contained herein, and will not be contained, to the best of the registrant’s knowledge, in definitive proxy or information statements incorporated by reference in Part III of this Form 10-K or any amendment to this Form 10-K.
o
Indicate by check mark whether the registrant is a large accelerated filer, an accelerated filer, a non-accelerated filer, or a smaller reporting company. See definitions of “large accelerated filer,” “accelerated filer” and “smaller reporting company” in Rule 12b-2 of the Exchange Act. (Check one):
Large accelerated filer o | Accelerated filer þ | Non-accelerated filer o | Smaller reporting company þ | |||
(Do not check if a smaller reporting company.) | ||||||
Indicate by check mark whether the registrant is a shell company (as defined in Rule 12-b2 of the Exchange Act). o Yes þ No
The aggregate market value of Common Stock held by non-affiliates of the Registrant on June 30, 2014 was approximately $146,974,000.
There were 31,571,357 $0.001 par value common shares outstanding on March 09, 2015.
Documents Incorporated By Reference
Portions of the registrant’s definitive proxy statement for its 2015 annual meeting of the stockholders, which proxy statement will be filed no later than 120 days after the close of the registrant’s fiscal year ended December 31, 2014, are hereby incorporated by reference into Part III of this Annual Report on Form 10-K.
INDEX TO FORM 10-K
Page | ||
As used in this report, “we,” “us,” “our,” the “Company” and “Glori” mean Glori Energy Inc. and our subsidiaries, unless the context indicates otherwise. | ||||
1
PART I
Item 1. Business
This Annual Report on Form 10-K and the documents incorporated herein by reference contain forward-looking statements based on expectations, estimates, and projections as of the date of this filing. These statements by their nature are subject to risks, uncertainties, and assumptions and are influenced by various factors. As a consequence, actual results may differ materially from those expressed in the forward-looking statements. See the risk factors set forth in Item 1A of this Annual Report on Form 10-K, Part II, Item 7A—Quantitative and Qualitative Disclosures About Market Risk and Part II and Item 7A—Special Note Regarding Forward-Looking Statements.
Overview
Glori Energy is a Houston-based energy technology and oil production company that deploys its proprietary AERO Technology to increase the amount of oil that can be produced from conventional fields at a substantially lower cost than traditional enhanced oil recovery methods ("AERO System"). Only about one-third of the oil discovered in a typical reservoir is recoverable using conventional oil production technology, leaving the remaining two-thirds trapped in the reservoir rock. Our AERO System technology stimulates the native microorganisms that reside in the reservoir to improve the recoverability of this trapped oil. The AERO System can reverse production declines and significantly increase ultimate reserve recovery at a low incremental cost per barrel. Glori owns and operates oil fields onshore in the U.S. where it deploys its technology, and additionally markets the AERO System as a technology service to exploration and production ("E&P") companies globally. Glori derives revenues from fees earned as a service provider of our technology to third party E&P companies, and also uses its technology to increase oil production in fields that we acquire and operate in the United States.
We intend to acquire and redevelop additional mature oil fields with historically long-lived, predictable production profiles that fit our criteria for the AERO System. We target mature sandstone assets onshore in the United States with good permeability and production supported by waterflood or waterdrive systems, or with clear potential for waterflooding. We believe our acquisition strategy can enhance the revenues, cash flows and returns from such oil fields through waterflood optimization and implementation of our AERO System of enhanced oil recovery. We believe this strategy will enable us to further demonstrate the efficacy of our AERO System while allowing us to capture the increase in revenues and ultimate recovery. We believe the acquisition of principally proved producing oil reserves, with production and cash flow history, is an economically attractive, low-risk complement to our service business which is dependent on customer adoption of the AERO System technology. Further, by owning our own oil properties, we can manage the implementation of AERO System in a controlled environment and accelerate the industry adoption of our technology.
Glori Energy Technology Inc., a Delaware corporation (formerly Glori Energy Inc.) ("GETI"), was incorporated in November 2005 (as successor in interest to Glori Oil LLC) to increase production and recovery from mature oil wells using state of the art biotechnology solutions.
In January 2014, GETI entered into a merger and share exchange agreement with Infinity Cross Border Acquisition Corporation ("INXB") and certain of its affiliates, Glori Acquisition Corp., Glori Merger Subsidiary, Inc., and Infinity-C.S.V.C. Management Ltd., as INXB Representative (such transaction, the "Merger"). On April 14, 2014, the Merger and share exchange agreement was closed and the merger was consummated. As part of the Merger, Infinity Cross Border Acquisition Corporation merged with and into Glori Acquisition Corp., with Glori Acquisition Corp. surviving the merger. Following that merger, Glori Merger Subsidiary, Inc. merged with and into GETI, with GETI surviving the merger. Following the Merger, GETI became the wholly-owned subsidiary of Glori Acquisition Corp., and Glori Acquisition Corp. adopted the name "Glori Energy Inc."
In March 2014, GETI incorporated Glori Energy Production Inc., a wholly-owned subsidiary of Glori Holdings Inc., to purchase the Coke Field Assets (as defined below) and incur the associated acquisition debt, as described in detail in NOTE 4 in Item 15 to Part IV of this Annual Report on Form 10-K.
Glori Energy Inc., GETI, Glori Oil (Argentina) Limited, Glori Oil S.R.L., Glori Canada Ltd., Glori Holdings Inc., Glori California Inc., OOO Glori Energy and Glori Energy Production Inc. are collectively referred to as the “Company”, "Glori", "Glori Energy", "we", "us", and "our" in this Annual Report on Form 10-K.
2
Glori's common stock is publicly traded on the National Association of Securities Dealers Automatic Quotation System (NASDAQ). Our corporate headquarters is located at 10350 Richmond Ave., Suite 850, Houston, Texas 77042. As of December 31, 2014, we had a total of 42 active employees consisting of 10 employees engaged in research and development, 23 employees in operations and 11 employees in management, business development and administrative positions. We make our annual report on Form 10-K, quarterly reports on Form 10-Q, current reports on Form 8-K, and amendments to those reports, filed or furnished pursuant to section 13(a) or 15(d) of the Securities Exchange Act of 1934, available free of charge on or through our website, www.glorienergy.com, as soon as reasonably practicable after we electronically file such material with, or furnish it to, the SEC. Additionally, we maintain our code of ethics and business conduct, audit committee charter, compensation committee charter, policy governing director qualifications and nominations, policy governing related person transactions, insider trading policy and corporate governance guidelines in the corporate governance section of our website. The SEC also maintains a website, www.sec.gov, which contains our reports, proxy and information statements and other information we have filed.
Glori Technology Services
Glori’s AERO System incorporates a dedicated field deployment unit designed to work with existing waterflood operations. Waterflooding is a commonly used process of injecting water into the reservoir in order to increase oil recovery. The AERO System does not have any significant new impact on the environment because it utilizes existing production equipment and infrastructure, and does not change the nature of the customer’s oil production operations. In an existing waterflooded oil field, implementation of the AERO System does not require the drilling of new wells nor does it require other significant new capital investment.
Glori believes its AERO System increases the oil production rate and the ultimate quantity of oil recovered over the life of the oil field, and extends the life of the field by integrating sophisticated biotechnology with traditional oil production techniques. Glori has performed extensive laboratory and field testing to validate, integrate and advance technology transferred from three different scientific groups that collectively represent decades of funded research and development. Glori’s technology is protected by several patents and patent applications. Glori and its collaborators, Statoil Petroleum AS, or Statoil, in Norway, The Energy and Resources Institute, or "TERI", in India, and Bio Topics S.A., in Argentina, have collectively applied AERO and predecessor technologies in more than 100 wells throughout the world. Glori estimates that these technology implementations have recovered over six million barrels of oil that would not have otherwise been recovered. Glori anticipates continuing to demonstrate results with its AERO System technology and expand its customer base as well as utilizing AERO System technology on its own oil fields.
Glori Market Opportunity
Glori’s market for its AERO System consists of domestic and international oil production from sandstone reservoirs with permeability greater than 75 milli-darcies which are under waterflood or are waterflood candidates.
Glori believes its AERO System represents the most cost effective enhanced oil recovery method from both a capital expenditure and an operating cost perspective. Glori believes that its primary competition for this sizable market is from traditional enhanced oil recovery technologies, such as gas injection and chemical injection, as well as from other microbial enhanced oil recovery methods. Glori believes that its AERO System is superior to traditional enhanced oil recovery technologies both economically and environmentally and that the AERO System is able to recover oil that traditional enhanced oil recovery methods cannot recover on an economic basis. Because the AERO System works with naturally occurring microbes in the reservoir, Glori believes its processes do not cause any damage to the environment. Glori also views its AERO System as presenting a lower capital expenditure profile than traditional enhanced oil recovery technologies because it requires no new meaningful infrastructure investment when deployed in an operating waterflood.
Technology
Oil Production
During the primary recovery stage, oil is produced through natural drive mechanisms. Recovery factor during this stage is low, typically about 10%. Secondary production generally begins once the pressure in the reservoir is insufficient to force the oil to the surface and is performed by adding external energy to the reservoir through injection of fluids, water or gas, to increase the reservoir pressure. Typical recovery factors in secondary production can reach 30%, depending on the properties of oil and the characteristics of the reservoir rock. About two thirds of the original oil in place remains trapped in the reservoir even after waterflooding.
3
Glori’s Technology
The AERO System acts to improve the performance of secondary production water floods by stimulating the native micro-organisms that reside in the reservoir to improve the recoverability of this trapped oil. Glori does not introduce specific microbes selected for its purposes, nor does it rely upon genetically-engineered microorganisms. Instead Glori adds customized nutrients to the reservoir to grow the existing indigenous microbes in that reservoir. Microbes residing in oil reservoirs have the natural ability to use oil as a food source to facilitate growth given the right conditions. Growth of microbes on the oil is a fundamental requirement for AERO System functionality. Because the oil acts as a food source, the bulk of ingredients to fuel the AERO System are already in the reservoir, limiting the externally added components to the specific nutrients Glori introduces and the injected water that constitutes the waterflood. The microbial growth and activities occur only where the oil is trapped. This process is complex and depends on several distinct groups of microbes performing specialized tasks in the chain of biological reactions. The complexity of the process makes it vulnerable to disruption from external changes in the surrounding environment. Glori leverages its knowledge of how to establish a consistent environment with the right characteristics for effective deployment of the AERO System in order to mobilize trapped oil.
As part of the implementation of the AERO System process, Glori scientists analyze the injection water and water treatment system at the candidate oil field to determine if the water quality is compatible with AERO System requirements. Glori does not need potable water for the AERO System to be successful, but it does need the water to be non-detrimental to the microbe’s desired activities.
When the analysis and process development for the candidate field have been completed, the project moves into the field deployment phase. Glori has designed its deployment systems to integrate with current oil field waterflood equipment to simplify installation. This has resulted in modular field units that can be customized for continuous input of nutrients to the reservoir. Glori’s field units are equipped with sensors to monitor performance remotely, which allows us to service oil fields efficiently in remote locations. The oil that is produced from the utilization of the AERO System is delivered to market using the existing wells and pipelines that are already available to the oil producer. The additional oil that is captured by the AERO System is not altered in the process. Glori has verified this process by continuous operation of an oil field pilot project for more than three years during which no significant change in the n-alkane distribution could be detected.
Depending on the amount of oil trapped in the reservoir, Glori expects the production benefits from AERO System deployment to be sustained over many years until the field becomes uneconomic. At this point, Glori believes up to an additional 20% of the previously trapped oil will have been produced. Although Glori currently applies the technology primarily to mature waterfloods, Glori anticipates further performance improvements when its AERO System process is initiated at an earlier stage of oil recovery.
Research and Development
Glori has made significant investments in the development of the AERO System and will continue to fund further technology development in the future. Deployment of the AERO System enables and activates key microbial functionalities within an oil reservoir. These functionalities mobilize otherwise trapped oil resulting in increased production of oil. The functionalities required for successful deployment of the AERO System will be analogous between different reservoir conditions, but the microbes performing them and the nutrients required to best stimulate their growth may be different. To understand this complex system of diverse microbes and their interactions requires understanding the molecular mechanisms at work. As Glori’s knowledge of the biochemistry of oil mobilization by the AERO System develops, it expects to have the ability to both improve current deployment strategies and deploy the AERO System in a greater range of reservoir conditions.
Glori’s research and development strategy seeks to extend the reach and effectiveness of the AERO System. Efforts towards this goal are focused on 1) continued optimization of implementation primarily focused on biology and chemistry of water used in injection systems Glori continues to make significant progress in developing a system to treat reservoir water for optimum performance, 2) exploring the limits of permeability, viscosity, and other key parameters to afford continued enhancements in field performance and increase the range of suitable projects, and 3) understanding the mechanism of residual oil release which will suggest areas for further improvements as well as afford data to build models to better predict field outcomes.
Glori’s research and development programs are designed to drive down costs per incremental barrel of oil produced by increasing oil yield and production rates as well as by increasing both the number of candidate oil fields and the scale of deployment.
In 2009, Glori entered into a technology cooperation agreement with Statoil, which has been replaced by an updated 2011 agreement, further extended in 2014. The collaboration agreements incorporates intellectual property and know-how that Statoil has been developing for many years.
4
In July 2014, Glori was awarded U.S. Patent 8,783,345, Microbial Enhanced Oil Recovery Delivery Systems and Methods, which provides patent coverage for additional methodologies in the successful implementation of the AERO technology. In September 2014, Glori was awarded U.S. Patent 8,826,975, Systems and Methods of Microbial Enhanced Oil Recovery, which affords key intellectual property protection for Glori's AERO technology. Glori owns the intellectual property (IP) rights of these patents and inventors include personnel from both Glori and Statoil.
Glori’s Competitive Strengths
• | Disruptive and proven technology: Glori believes that the AERO System is a transformative and disruptive innovation that manipulates the existing reservoir microbial communities to improve the recovery of oil in waterflood or water drive oil fields. Glori believes its AERO System is applicable in more oil fields than other existing enhanced oil recovery technologies. |
• | Attractive returns from acquisition of oil fields: Glori intends to acquire additional mature oil fields which are under waterdrive, waterflood or are good candidates for waterflood. By acquiring oil fields and implementing the AERO System technology, Glori can capture 100% of the increase in production, revenues and ultimate oil recovery, resulting in the potential for superior acquisition returns. Additionally, by acquiring its own fields, Glori expects to accelerate the industry adoption of its technology. |
• | Established commercial contracts: Glori customers include international oil companies and independent oil and gas companies in North America and Brazil. Glori's business does not depend on any particular customer. See also the discussion included in Item 1A under the heading "Our revenue to date has been derived from a limited number of customers, and the loss of any of these customers could materially harm our business, financial condition and results of operations." |
• | Profitable stand-alone economics: Glori’s current commercial application of the AERO System is profitable on a project level basis. The total operating cost per barrel, excluding minimal upfront capital costs, attributed to the use of Glori’s technology is minimal. Unlike many other emerging clean-energy technologies, successful commercialization of the AERO System does not depend on the availability of government subsidies or mandates. |
• | Capital-light technology: Unlike other enhanced oil recovery processes, the AERO System can be deployed to waterflood reservoirs with very little capital expenditure. The AERO System is applied to a reservoir by utilizing Glori’s field deployment module, which requires relatively minor capital investment. Glori believes its technology has the potential to create a sustainable source of additional economic oil production that will extend the lives of oil fields and related infrastructure for many years. |
• | Clean alternative to traditional enhanced oil recovery: Glori’s AERO System increases the oil recoverable from an existing field using infrastructure already in place. When deployed in a waterflood reservoir, no new wells need to be drilled, no new pipelines are laid, no new significant energy input is required into the process and there is no new disruption to the environment. Furthermore, because the activity is biological and occurs in the reservoir, there is minimal consequent carbon dioxide or greenhouse gas footprint. Once the application of the AERO System ends, the microbes in the reservoir are no longer supplied with nutrients and the reservoir will return to its pre-treatment status. By way of comparison, other enhanced oil recovery techniques require significant energy input, such as thermal injection, or significant additional infrastructure to implement, such as gas injection. In addition, other enhanced oil recovery techniques introduce new environmental impacts, in particular gas injection and chemical injection techniques, which result in a sizable carbon dioxide or greenhouse gas footprint or the addition of a large quantity of chemicals or polymers into the reservoir. |
• | Intellectual property position: Glori’s intellectual property, consisting of substantial know-how and trade secrets, is the result of decades of research and development by Glori, Statoil Petroleum AS, or Statoil, in Norway, The Energy and Resources Institute, or TERI, in India, and Bio Topics S.A., or Biotopics, in Argentina. Glori also has multiple patents and patent applications. Glori believes its intellectual property and decades of research provide it with a strong competitive advantage and creates a high barrier to entry. |
• | Experienced management and technical team: Glori’s management and technical team’s expertise includes microbiology, chemistry and biochemistry, microbial genomics, engineering, geology and geosciences, petroleum engineering, reservoir engineering and production management, and in their respective careers, Glori’s team members played key roles in the commercialization of dozens of successful large-scale industrial biotechnology and traditional oil field acquisition and development projects. |
5
Milestones and Commercialization Strategy
Technology Milestones
Confirmation of microbial activity: Glori has determined through field sampling and laboratory testing that essentially all hydrocarbon bearing reservoirs either contain microbes or can be injected with source water that does contain microbes that are capable of utilizing the residual hydrocarbon to grow, and in doing so create biomass as biofilms. Glori is continuously refining its methodologies to grow these microbes and Glori’s criteria for selection of nutrients to facilitate certain functionalities in the process. Below is a table that shows, from the sample set Glori has tested, 80% of hydrocarbon bearing reservoirs contain microbes suitable for enhanced recovery. For those that do not show evidence of viable microbes, there is associated “source water” (usually from a subterranean reservoir at a different depth from the target reservoir) that does contain viable microbes.
Improvement in oil recovery factors: Over the past five years, Glori has achieved a number of significant advances in its research and development effort. Glori’s application of technology progressed from small, discreet application at producing wells under a “huff and puff” process (whereby the nutrient mix is injected into a producer well which is then shut-in for a period of days to allow the microbes to grow before the well is re-opened to production), to full scale application at injection wells under a continuous injection process. In addition, Glori added microbial genomics and bioinformatics capabilities in its laboratory facilities to further advance Glori understanding of the microbial processes involved in oil mobilization.
Development of Glori’s AERO System technology: In 2010, Glori implemented its pilot commercial AERO System project in the field. In April 2011, Glori applied for patent protection of this technology. In 2012, Glori applied for two additional patents associated with exploitation of the AERO mechanism.
Commercialization Milestones
Demonstration of commercial application: First deployed in 2010 and subsequently deployed in multiple field projects, the AERO System has demonstrated improvements in oil production and decrease in decline rates in commercial demonstration projects in the USA and Canada. These AERO System implementations build on predecessor technology implementations that collectively account for over 100 treatments in different wells in multiple locations around the world. The AERO System performance is presented in SPE paper 144205 and has won recognition with multiple industry awards including winner of the Energy Institute 2013 Innovation Award, finalist in the World Oil Award for New Horizons, runner up for World Petroleum Congress Excellence in Innovation, winner Corporate LiveWire 2015 Innovations and Excellence in Oil and Gas and was named to the Global Cleantech Group 2013 Cleantech 100 report.
Commercialization Strategy
Glori’s mission is to use microbiology to efficiently recover large quantities of oil currently trapped in reservoirs using existing oil wells. To achieve this Glori intends to:
• | Acquire and operate oil fields: Deployment of the AERO System technology to its own oil fields will enable Glori to capture 100% of the revenues and cash flow benefit from the increased production and to generate enhanced acquisition returns. In October 2010, Glori acquired the North Etzold field to test and further develop the AERO System. To accelerate adoption of the AERO System, Glori plans to strategically acquire and develop additional mature oil fields in geographies that it expects will improve its portfolio of field successes. |
• | Expand Glori’s project portfolio: As of December 31, 2014, Glori had five customer projects in the Field Deployment stage and another seven projects in the Reservoir Analysis and Treatment Design phase. Glori expects to add additional projects that are currently in various stages of evaluation. Glori expects industry adoption to grow over time and as acceptance and recognition increases, it expects its AERO System revenues to grow significantly. |
• | Optimize Glori’s performance and expand the applicability of the AERO System: While Glori is already active on a commercial scale, it intends to continue to improve its performance and predictability of the AERO System additional customer projects and assets Glori acquires. Glori believes that in the future it will develop additional capabilities that will expand the types of fields to which it can apply its technology, such as expanding the applicability of Glori’s technology to heavier oils and carbonate reservoirs. |
6
AERO System Service Offering
Glori employs a two-step process to screen and evaluate an oil field for AERO System suitability, whether for an oil field to be acquired or for a customer. This process ensures a systematic, engineered and customized approach to technology deployment in each reservoir. The same process is used to screen an oil field acquisition.
Reservoir Analysis and Treatment Design Phase (Analysis Phase): Glori obtains representative oil and water samples from the reservoir as part of its screening process to evaluate AERO System potential. Samples are taken to Glori’s Houston laboratory where detailed geochemical analysis is performed. The heart of the Analysis Phase deals with microbiological activities, where the indigenous formation microbes are analyzed for functionality. The general activities for the Analysis Phase are:
• | Review field characteristics data; |
• | Perform a geological suitability analysis of the target structure; |
• | Collect samples from targeted wells; |
• | Conduct geochemical characterization of oil and water; |
• | Determine the presence of indigenous microbes in the reservoir fluids. |
• | Incubate and study indigenous microbes; and |
• | Develop an optimal nutrient package for field application including any needed modifications to the field injection water. |
Tests are performed at Glori’s Houston laboratory using microbes from the reservoir and nutrient media with the formation water and oil to verify AERO System performance under simulated reservoir conditions. Several iterations of tests are often performed to optimize the system compositions to achieve the optimal AERO System activity. If microbial growth appropriate for economical oil recovery can be demonstrated, the project then moves forward to the Field Deployment Phase. The Reservoir Analysis and Treatment Design phase typically takes an aggregate of two months to complete.
Field Deployment Phase: Once the viability of the AERO System is demonstrated in the Analysis Phase, a detailed project development plan is finalized, and the project proceeds to the Field Deployment Phase where the AERO System is initiated in the oil field to stimulate the indigenous microbes in the oil bearing reservoir.
Glori mobilizes skid-mounted injection equipment to the field location. This equipment has been specially designed and tested by Glori at its Houston facility, and may be manufactured by select third parties. The equipment is continuously monitored and operated remotely from Glori’s project command center in Houston. The equipment remains on the lease throughout the duration of AERO System activities. It is usually installed near the waterflood water injection plant where Glori’s microbial nutrient media are injected into waterflood flowlines for delivery to the reservoir.
Once initiated, Glori and its customer continually evaluate the technical, operational and economic results of the Field Deployment Phase activity. Assuming the project meets the desired criteria, Glori will work with the customer to prepare a project expansion plan, up to and including full-field deployment of the AERO System.
Typically, Glori starts the Field Deployment Phase as an initial field validation in a small section of a producing field. Results from the AERO System are typically detected within two to three months after it initiates the Field Deployment Phase. After the initial Field Deployment Phase field validation is complete, Glori may enter into a longer term contract with its customer to continue or expand the use of the AERO System throughout the oil field.
Oil field Acquisition Strategy
Glori intends to acquire and redevelop mature oil fields with historically long-lived, predictable production profiles. Glori believes it can enhance the revenues, cash flows and acquisition returns from such oil fields through well recompletions, secondary recovery, waterflood optimization and implementation of its AERO System of enhanced oil recovery. Glori also plans to selectively acquire fields which may have low current production but have (i) excellent reservoir qualities, (ii) significant original oil in place remaining, and (iii) provide opportunities to re-enter existing wells, return them to production, and deploy the AERO System to capture significant economic quantities of oil. Glori believes this strategy will enable it to further demonstrate the efficacy of its AERO System while allowing it to capture the increase in revenues and ultimate recovery. Often these mature fields have not been fully exploited and have not been exposed to enhanced oil recovery technologies.
7
Additionally, by owning its own oil properties Glori will be able to manage the implementation of the AERO System in a controlled environment and accelerate the industry adoption of the technology. Glori has assembled a team of oil industry professionals with extensive experience in all facets of acquiring and managing oil properties. Glori is seeking and evaluating acquisitions that fit its criteria for the AERO System. These fields are mature active waterdrive or waterflood fields, or assets with clear waterflood potential, sandstone reservoirs with good permeability and are located onshore in the United States. Glori’s acquisition team is developing a “pipeline” of potential acquisitions, both through direct private negotiations as well as the public bid process.
The AERO System and the efficiency it brings to oil production is central to the future of the combined business, as it gives Glori its competitive advantage in the field of enhanced oil recovery. As a result, Glori has taken steps to protect the underlying intellectual property.
The AERO System is based on intellectual property and know-how developed by Statoil (a multinational Norwegian company), and has been further developed and expanded through a collaboration agreement by Statoil and Glori scientists and engineers. Glori’s access to this underlying intellectual property includes access to certain key U.S. patents granted by a technology cooperation agreement with Statoil, dated April 11, 2011. This agreement gives Glori perpetual, irrevocable, royalty free licenses to U.S. patent 5,163,510 (Method of microbial enhanced oil recovery, issued 11/17/1992, expiration date 2/21/2011), U.S. patent 6,546,962 (Introduction of air into injection water, issued 4/15/2003, expected expiration 7/7/2020), and U.S. patent 7,124,817 (Method of treating a hydrocarbon bearing formation, issued 10/24/2006, expiration 11/3/2020). Glori holds three U.S. patents, US Patent 7,681,638 (Wellbore treatment for reducing wax deposits, expiration 6/12/2028), US Patent 8,783,345 (Microbial enhanced oil recovery delivery systems and methods, issued 7/22/2014, expected expiration in 2032), and US Patent 8,826,975 (Systems and methods of microbial enhanced oil recovery, issued 9/9/2014, expected expiration in 2032). US Patent 8,826,975 affords key intellectual property coverage for Glori’s AERO technology and effectively extends both the scope and coverage time of certain of the Statoil patents. In addition, Glori has filed two active U.S. patent applications, including U.S. Appl. No. 13/826827 (Ultra Low Concentration Surfactant Flooding, filed 3/14/13) and U.S. Appl. No. 13/827639 (Optimizing Enhanced Oil Recovery by the Use of Oil Tracers, filed 3/14/13).
Glori’s Properties
The following is a description of the meanings of some of the oil and gas industry terms used in Glori's Properties section of this Annual Report on Form 10-K and throughout the remainder of this Annual Report on Form 10-K.
Bbl | Barrels of oil or other liquid hydrocarbons. One barrel is 42 gallons of liquid volume. | |
Boe | Barrel of oil equivalent, determined by using the ratio of 6 Mcf of natural gas to one Bbl of oil. | |
MBbls | Thousand barrels of crude oil or other liquid hydrocarbons. | |
Mcf | Thousand cubic feet of natural gas. | |
MBoe | Thousand barrels of oil equivalent, determined by using the ratio of 6 Mcf of natural gas to one Bbl of oil. | |
Mmcf | Million cubic feet of natural gas. | |
In the fourth quarter of 2010, Glori acquired the North Etzold field, an oil field in Kansas, and in September 2012 Glori acquired the contiguous South Etzold field. The Etzold field is located in Seward County, Kansas and includes total acreage of 760 acres with an average Working Interest (as defined below) percentage of 100%. Current net production is approximately 10 Bbl per day. "Working Interest" means the right granted to the lessee of a property to explore for and to produce and own natural gas or other minerals. The Working Interest owners bear the exploration, development, and operating costs on either a cash, penalty or carried basis.
On March 14, 2014, Glori Energy Production Inc. closed the acquisition of the Coke Field Assets for a purchase price of approximately $40 million as described in detail in NOTE 4 in item 15 to part IV of this Annual Report on Form 10-K. In September 2014, Glori acquired three additional leases at Coke Field from a private seller for $2 million. For the month ended December 2014, the average net daily production associated with the Coke Field Assets was 505 Boe per day (approximately 99% oil and 1% natural gas). The Coke Field Assets are located in the East Texas basin in Wood County, Texas and include total acreage of 2,446, and have an average Working Interest percentage of 98.7% (the average of producing well Working Interest).
The Coke Field Assets are comprised of the majority of the Coke Field along with three leases in the Quitman Field. All leases are operated by the Company. The Coke Field is a salt dome structure discovered in 1942.
8
The primary oil producing zone has been the upper Paluxy formation at about 6,300 ft. which has a natural water drive. Glori became the operator of the Coke Field Assets on March 14, 2014. Glori’s Working Interest is 100% in all the Paluxy wells. The Sub-Clarksville formation occurs at about 4,100 ft and a unit has been formed across the whole field. Glori’s Working Interest in the Sub-Clarksville unit is 87.82%. Glori’s Working Interest is 100% in the three Quitman Field leases.
How Glori Evaluates Its Operations
Glori uses a variety of financial and operational metrics to assess the performance of its oil operations, including:
• | production volumes; |
• | realized prices on the sale of oil; |
• | lease operating expenses; and |
• | operating cash flow |
Oil and Natural Gas Production Volumes, Prices and Production Costs
Glori’s oil and natural gas production data presented below is based on the proved reserve reports as of January 1, 2013, 2014 and 2015 by William M. Cobb & Associates, Inc. for the Coke Field Assets and Collarini Associates for the Etzold field. Copies of the January 1, 2015 proved reserve reports prepared with respect to these properties are included as exhibits to this Annual Report on Form 10-K.
The following table sets forth our production volumes, net production prices and production costs of oil and natural gas produced by Glori for the years ended December 31, 2012, 2013 and 2014:
Year Ended December 31, | |||||||||||
2012 | 2013 | 2014 | |||||||||
Production data: | |||||||||||
Oil (MBbls) | 5 | 6 | 133 | ||||||||
Natural Gas (MMcf) | — | — | 72 | ||||||||
Total (MBoe) (1) | 5 | 6 | 145 | ||||||||
Average sales price per Bbl/Mcf: | |||||||||||
Oil | $ | 87 | $ | 92 | $ | 87 | |||||
Natural gas | — | — | $ | 2.43 | |||||||
Average production costs per Boe: | |||||||||||
Lease operating expense | $ | 96 | $ | 69 | $ | 46 | |||||
Production taxes | 4 | 4 | 4 | ||||||||
Depreciation, depletion and amortization | 19 | 28 | 27 | ||||||||
Impairment | $ | — | $ | 348 | $ | 91 | |||||
(1) Assumes a ratio of 6 Mcf of natural gas per barrel of oil.
Over time, production from a given well or formation decreases. Growth in Glori’s future production and reserves will depend on its ability to implement the AERO System and to continue to add proved reserves in excess of its production. Accordingly, one of Glori’s key focuses is on adding reserves through acquisitions. Glori’s ability to add reserves through development projects and acquisitions is dependent on many factors, including its ability to borrow or raise capital, obtain regulatory approvals, procure necessary equipment, materials, and personnel and successfully identify and consummate acquisitions. Please read “Risk Factors— Risks Related to our Business” in Item 1A in this Form 10K for a discussion of these and other risks affecting Glori’s proved reserves and production.
Drilling and Other Exploratory and Development Activities
Productive wells are producing wells plus other wells mechanically capable of production. As of December 31, 2014, Glori had 29 total gross and net productive wells. During 2012 and 2013, there was one productive well drilled at the Etzold Field and no exploratory wells drilled.
9
Delivery Commitments
Glori does not have any long-term commitments to provide a fixed and determinable quantity of oil under existing contracts or agreements.
Third Party Commitments
Subsequent to the purchase of the Coke Field, Glori hired a third party broker to secure a new first purchaser that would yield the highest price per barrel. Effective July 1, 2014, Glori entered into an agreement to sell all net oil production from its Coke Field Assets to a new third-party oil purchaser secured by this broker. Pursuant to this agreement, Glori owes the third party broker a 50% commission on the sales price difference between the two purchasers for one year. The new first purchaser agreement came into effect on August 1, 2014 through August 31, 2014 and continued month to month thereafter.
Oil and Natural Gas Data
Proved Reserves
Evaluation and Review of Proved Reserves. Glori has retained William M. Cobb and Associates, Inc., independent petroleum engineers, to provide an estimate of proved reserves for the Coke Field Assets as of January 1, 2014 and 2015 and Collarini Associates, independent petroleum engineers, to provide an estimate of proved reserves at the Etzold property as of January 1, 2013, 2014 and 2015.
Neither Collarini Associates nor William M. Cobb and Associates, Inc. own interests in any of Glori’s properties, nor are they employed by Glori on a contingent basis. A copy of the independent petroleum engineering firms’ proved reserve reports at January 1, 2015 are included as an exhibits to this Annual Report on Form 10-K.
The technical persons responsible for preparing Glori’s proved reserve estimates meet the requirements with regard to qualifications, independence, objectivity and confidentiality set forth in the Standards Pertaining to the Estimating and Auditing of Oil and Gas Reserves Information promulgated by the Society of Petroleum Engineers.
Glori maintains an internal staff of petroleum engineers and geoscience professionals who work closely with its independent reserve engineers to ensure the integrity, accuracy and timeliness of the data used to calculate its proved reserves relating to its assets. Glori’s internal technical team members meet with its independent reserve engineers periodically during the period covered by the proved reserve report to discuss the assumptions and methods used in the proved reserve estimation process. Glori provides historical information to its independent petroleum engineers for its properties, such as ownership interest, oil and natural gas production, well test data, commodity prices and operating and development costs. Mr. Tor Meling, Glori’s Vice President of Reservoir Engineering, is primarily responsible for overseeing the preparation of all of Glori’s reserve estimates. Mr. Meling is a petroleum engineer with over 25 years of reservoir and operations experience, and Glori’s geoscience staff has an average of approximately 30 years of energy industry experience per person.
The preparation of Glori’s proved reserve estimates are completed in accordance with its internal control procedures. These procedures, which are intended to ensure reliability of reserve estimations, include the following:
• | review and verification of historical production data, which data is based on actual production as reported by Petro-Hunt L.L.C. (the prior owner and operator of the Coke Field Assets); |
• | preparation of reserve estimates by Mr. Meling or under his direct supervision; |
• | review by Glori’s Chief Executive Officer of all of its reported proved reserves at the close of each quarter, including the review of all significant reserve changes and new PUDs additions, if any; |
• | direct reporting responsibilities by Mr. Meling to Glori’s Chief Executive Officer; and |
• | verification of property ownership by competent legal counsel or individuals under counsel’s direct supervision prior to an acquisition. |
Estimation of Proved Reserves. Under SEC rules, proved reserves are those quantities of oil and natural gas, which, by analysis of geoscience and engineering data, can be estimated with reasonable certainty to be economically producible—from a given date forward, from known reservoirs and under existing economic conditions, operating methods and government regulations—prior to the time at which contracts providing the right to operate expire, unless evidence indicates that renewal is reasonably certain, regardless of whether deterministic or probabilistic methods are used for the estimation. If deterministic methods are used, the SEC has defined reasonable certainty for proved reserves as a “high degree of confidence that the quantities will be recovered.”
10
All of Glori’s proved reserves as of December 31, 2014 were estimated using a deterministic method. The estimation of reserves involves two distinct determinations.
The first determination results in the estimation of the quantities of recoverable oil and natural gas and the second determination results in the estimation of the uncertainty associated with those estimated quantities in accordance with the definitions established under SEC rules. The process of estimating the quantities of recoverable oil and natural gas reserves relies on the use of certain generally accepted analytical procedures. These analytical procedures fall into four broad categories or methods: (i) production performance-based methods; (ii) material balance-based methods; (iii) volumetric-based methods; and (iv) analogy. These methods may be used singularly or in combination by the reserve evaluator in the process of estimating the quantities of reserves. Reserves for proved developed producing ("PDP") wells were estimated using production performance methods for the vast majority of properties. Certain new producing properties with very little production history were forecast using a combination of production performance and analogy to similar production, both of which are considered to provide a relatively high degree of accuracy. Non-producing reserve estimates, for developed and undeveloped properties, were forecast using either volumetric or analogy methods, or a combination of both. These methods provide a relatively high degree of accuracy for predicting proved developed non-producing and PUDs for Glori’s properties, due to the mature nature of the properties targeted for development and an abundance of subsurface control data.
To estimate economically recoverable proved reserves and related future net cash flows, Collarini Associates and William M. Cobb and Associates, Inc. considered many factors and assumptions, including the use of reservoir parameters derived from geological, geophysical and engineering data which cannot be measured directly, economic criteria based on current costs and the SEC pricing requirements and forecasts of future production rates.
Under SEC rules, reasonable certainty can be established using techniques that have been proven effective by actual production from projects in the same reservoir or an analogous reservoir or by other evidence using reliable technology that establishes reasonable certainty. Reliable technology is a grouping of one or more technologies (including computational methods) that has been field tested and has been demonstrated to provide reasonably certain results with consistency and repeatability in the formation being evaluated or in an analogous formation. To establish reasonable certainty with respect to our estimated proved reserves, the technologies and economic data used in the estimation of our proved reserves have been demonstrated to yield results with consistency and repeatability, and include production and well test data, downhole completion information, geologic data, electrical logs, radioactivity logs, core analyses, available seismic data and historical well cost and operating expense data.
Summary of Oil and Natural Gas Reserves.
The following table presents Glori’s proved oil and natural gas reserves as of December 31, 2012, 2013, and 2014 based on the proved reserve reports as of January 1, 2013, 2014 and 2015 by William M. Cobb & Associates Inc., Glori's independent petroleum engineering firm for the Coke Field Asses and Collarini Associates, Glori’s independent petroleum engineering firm for the Etzold field. All of Glori’s proved reserves are located in the United States. Glori’s estimates of net proved reserves have not been filed with or included in reports to any federal authority or agency other than the SEC in connection with this offering. Future exploration, exploitation and development expenditures, as well as future commodity prices and service costs, will affect the reserve volumes attributable to the acquired properties. The reserve estimates shown below were determined using a 12-month average price for oil and natural gas for the years ended December 31, 2013 and 2014.
December 31, | |||||
2013 | 2014 | ||||
Estimated Proved Reserves: | |||||
Oil (MBbls) | 18 | 1,402 | |||
Natural Gas (MMcf) | — | 54 | |||
Total (MBoe) (1) | 18 | 1,411 | |||
Estimated Proved Developed Reserves: | |||||
Oil (MBbls) | 18 | 1,402 | |||
Natural Gas (MMcf) | — | 54 | |||
Total (MBoe) (1) | 18 | 1,411 | |||
Estimated Proved Undeveloped Reserves: | |||||
Oil (MBbls) | — | — | |||
Natural Gas (MMcf) | — | — | |||
Total (MBoe) (1) | — | — | |||
(1) Assumes a ratio of 6 Mcf of natural gas per barrel of oil.
11
The changes from December 31, 2013 estimated proved reserves to December 31, 2014 estimated proved reserves reflect production during this period of approximately 145 MBoe. The increase in proved developed reserves is due to the purchase of the Coke Field Assets of approximately 1,792 MBoe. The change also includes the downward revision of PDP reserves due to an increase in costs incurred over our prior year reserve report.
Reserve engineering is and must be recognized as a subjective process of estimating volumes of economically recoverable oil and natural gas that cannot be measured in an exact manner. The accuracy of any reserve estimate is a function of the quality of available data and of engineering and geological interpretation. As a result, the estimates of different engineers often vary. In addition, the results of drilling, testing and production may justify revisions of such estimates. Accordingly, reserve estimates often differ from the quantities of oil and natural gas that are ultimately recovered. Estimates of economically recoverable oil and natural gas and of future net revenues are based on a number of variables and assumptions, all of which may vary from actual results, including geologic interpretation, prices and future production rates and costs. For risks associated with proved reserves see “Risk Factors” in Item 1A of this Annual Report on Form 10-K. Additional information regarding our proved reserves can be found in the notes to Glori’s financial statements included in Item 15 to Part IV of this Form 10-K and the proved reserve reports as of January 1, 2015, which are included as exhibits to this Annual Report on Form 10-K.
Oil & Gas Properties, Wells, Operations, and Acreage
Productive wells consist of producing wells and wells capable of production, including natural gas wells awaiting pipeline connections to commence deliveries and oil wells awaiting connection to production facilities. Gross wells are the total number of producing wells in which Glori has a Working Interest, and net wells are the sum of its fractional Working Interests owned in gross wells. As of December 31, 2014, Glori owned an average 99.2% Working Interest in 29 gross and 28.8 net productive wells.
Coke Field Assets
On March 14, 2014, Glori Energy Production, a newly created subsidiary of Glori Holdings Inc., a subsidiary of the Company, acquired certain oil, gas and mineral leases in Wood County Texas (the “Coke Field Acquisition”). In September 2014, we closed on the acquisition of a 74.8% net revenue interest in three producing leases and approximately 136.5 gross acres at the Coke Field from a private seller for $2 million. The leases contain two wells which had an initial production rate at acquisition of 27 barrels net of oil per day and one water injection well.
Etzold
We acquired a 100% Working Interest in the Etzold Field in October 2010, with our leasehold position located in Seward County, Kansas. We held approximately 760 gross (760 net) acres as of December 31, 2014, all of which are developed and either producing from or prospective for the Etzold Field.
Other
We paid out lease bonuses during 2014 in Texas in the amount of approximately $200,000 for the prospective rights to mineral operations consisting of 1,068 gross acres.
12
Gross, Developed and Undeveloped Acreage
The following table sets forth information as of December 31, 2014 relating to Glori’s gross, developed and undeveloped leasehold acreage:
Developed Acreage (1) | Undeveloped Acreage (2) | Total Acreage | |||||||||||||||
Gross (3) | Net (4) | Gross (3) | Net (4) | Gross (3) | Net (4) | ||||||||||||
Etzold Field | 760 | 760 | — | — | 760 | 760 | |||||||||||
Coke Field | 2,667 | 2,587 | — | — | 2,667 | 2,587 | |||||||||||
Other | — | — | 1,068 | 488 | 1,068 | 488 | |||||||||||
Total | 3,427 | 3,347 | 1,068 | 488 | 4,495 | 3,835 | |||||||||||
(1) | Developed acres are acres spaced or assigned to productive wells and does not include undrilled acreage held by production under the terms of the lease. Developed acres are determined on surface acres. |
(2) | Undeveloped acres are acres on which wells have not been drilled or completed to a point that would permit the production of commercial quantities of oil or natural gas, regardless of whether such acreage contains proved reserves. |
(3) | A gross acre is an acre in which a Working Interest is owned. The number of gross acres is the total number of acres in which a Working Interest is owned. |
(4) | A net acre is deemed to exist when the sum of the fractional ownership Working Interests in gross acres equals one. |
The Coke Field
On March 14, 2014, Glori Energy Production Inc. closed the acquisition of the Coke Field Assets for a purchase price of approximately $40 million as described in detail in NOTE 4 in Item 15 in Part IV of this Annual Report on Form 10-K. The Coke Field Assets are in the East Texas Basin, located in Wood County, Texas, and include an average Working Interest percentage of 98.7% (average of Producing well Working Interest). As of January 1, 2015, the net proved developed producing oil and natural gas reserves associated with the Coke Field Assets based upon estimates provided by William M. Cobb & Associates, Inc. were 1,396 MBoe (approximately 99% oil and 1% natural gas). For December 2014 the average net daily production associated with the Coke Field Assets was 505 Boe per day (approximately 99% oil and 1% natural gas).
The Coke Field Assets are comprised of the majority of the Coke Field along with three leases in the Quitman Field. All leases are operated by Glori as of March 14, 2014. The Coke Field is a salt dome structure discovered in 1942. The primary oil producing zone has been the upper Paluxy formation at about 6,300 ft. which has a natural water drive. Glori’s Working Interest is 100% in all the Paluxy wells. The Sub-Clarksville formation occurs at about 4,100 ft and a unit has been formed across the whole field. Glori’s Working Interest in the Sub-Clarksville unit is 87.82%. Glori’s Working Interest is 100% in the three Quitman Field leases.
The Etzold Field
In the fourth quarter of 2010, Glori acquired the North Etzold field, a non-producing oil field in Seward County, Kansas as a greenfield lab for our AERO technology science team. This oil field has served as a controlled environment to implement revisions in technology and surface systems to accelerate development and adoption of Glori’s AERO System technology. Collarini Associates, one of Glori’s independent petroleum engineering firms, has estimated that as of January 1, 2015, proved reserves net to Glori’s interest in its property was approximately 15 MBoe, all of which were classified as PDP.
At December 31, 2014, the Etzold property was being assessed for long-term economic viability, with specific attention to reducing direct operating expenses primarily by continuing the initiative commenced in the second quarter of 2014 to reducing the number of wells being operated. These considerations included historical direct operating expenses and production history of each producing well. As a result of this effort, the direct production costs for the property have been reduced from approximately $76 per barrel in 2013 to approximately $56 per barrel in 2014, primarily due to significantly reduced electricity use as many of our previously uneconomic well were shut in. Etzold continued its intended role of providing a controlled environment for AERO implementation strategies, especially with respect to the quality of water used in the injection process.
As of December 31, 2014, no wells were in the process of being drilled (including wells temporarily suspended), and no waterfloods were in process of being installed.
13
Title to Properties
Prior to completing an acquisition of producing oil and natural gas leases, Glori performs title reviews on the most significant leases and, depending on the materiality of properties, it may obtain a title opinion, obtain an updated title review or opinion or review previously obtained title opinions. Glori’s oil and natural gas properties are subject to customary royalty and other interests, liens for current taxes and other burdens which it believes do not materially interfere with the use of or affect its carrying value of the properties.
Glori believes that it has satisfactory title to all of its material assets. Although title to these properties is or may be subject to encumbrances in some cases, such as customary interests generally retained in connection with the acquisition of real property, customary royalty interests and contract terms and restrictions, liens under operating agreements, liens related to environmental liabilities associated with historical operations, liens for current taxes and other burdens, easements, restrictions and minor encumbrances customary in the oil and natural gas industry, Glori believes that none of these liens, restrictions, easements, burdens and encumbrances will materially detract from the value of these properties or from its interest in these properties or materially interfere with its use of these properties in the operation of its business. In addition, Glori believes that it has obtained sufficient rights-of-way grants and permits from public authorities and private parties for it to operate its business in all material respects as described in this Annual Report on Form 10-K.
Facilities
Glori’s leases its headquarters in Houston, Texas, which comprises approximately 7,800 square feet and is leased through September 2016. Glori also leases its laboratory and warehouse facility which comprises approximately 17,000 square feet and is leased through May 2017. Glori believes its current facilities are adequate for its current needs and for the foreseeable future.
Item 1A. Risk Factors
Risk Factors Relating to our Business
Our business is difficult to evaluate due to its limited operating history.
Since our inception in November 2005, the majority of our resources have been dedicated to our research development and testing efforts, and we have only recently begun to transition into the early stages of (i) commercializing the AERO System and (ii) acquiring, restoring and operating mature oil fields that fit our criteria for the AERO System. In addition, we do not have a stable operating history that you can rely on in connection with your evaluation of our current business and future business prospects. Our business and prospects must be carefully considered in light of the limited history of the AERO System and our acquisition of mature oil fields, and the many business risks, uncertainties and difficulties that are typically encountered by companies that have uncertain revenues and are committed to focusing on research, development and technology testing for an indeterminate period of time.
Our proposed business strategies described in this Annual Report on Form 10-K incorporate our management’s current analysis of potential markets, opportunities and difficulties that we face.
We cannot assure you that our underlying assumptions accurately reflect current trends and conditions in our industry that the AERO System will be successful or that we will be able to profitably operate any oil fields that we acquire. Our business strategies may change substantially from time to time or may be abandoned as our management reassesses opportunities and reallocates resources. If we are unable to develop or implement these strategies, or if the AERO System becomes not economically viable, we may never achieve profitability. Even if we do achieve profitability, we cannot predict the level of such profitability, and it may not be sustainable.
We have incurred substantial losses to date, may continue to incur losses in the future and may never achieve or sustain profitability.
We have incurred substantial net losses since inception, including net losses of $11.9 million, $10.6 million and $18.7 million for the years ended December 31, 2012, 2013 and 2014 respectively, and these losses may continue. As of December 31, 2014, we had an accumulated deficit of $64.1million. We expect to incur additional costs and expenses related to the continued development and expansion of our business, including our research and development operations, the commercialization of the AERO System and the acquisition, restoration and operation of additional mature oil fields. Our ability to achieve profitability depends on our success in increasing industry acceptance of the AERO System and the completion and successful integration of oil property acquisitions. There can be no assurance that we will achieve profitability.
14
The AERO System has only been applied to a limited number of reservoirs, and the viability of the AERO System in a broader range of reservoirs is still uncertain.
Our AERO System has only been applied in a limited number of sandstone reservoirs to date. The future success of our business depends on our ability (i) to demonstrate that the AERO System has the ability to increase oil recovery on a more widespread basis, on a larger scale and on attractive economic terms and (ii) to profitably restore and operate any oil fields we may acquire. Reservoir characteristics differ and, consequently, certain elements of our services are specifically engineered for each reservoir. As a result, we may not be able to achieve results in other reservoirs consistent with those we have thus far achieved in the reservoirs where the AERO System has successfully been applied. For example, as discussed in detail below, in 2010, we acquired a non-producing oil field in Kansas known as the North Etzold field, which was to be used primarily as a field laboratory for the AERO System. The North Etzold field consisted of 14 shut-in wells which had been stripped of wellbore tubulars, artificial lift equipment and the associated oil and water processing and storage facilities. While the Phase 1 Recompletion resulted in a 45% increase in the daily production rate from the primary production well after implementation of the AERO System, the Phase 2 Recompletion, which was done simultaneously with the implementation of the AERO System, did not result in oil production sufficient to cover the direct production costs. Consequently, implementation of the AERO System could yield less favorable oil production rates and overall oil recovery results than those thus far achieved where the AERO System has successfully been applied.
The AERO System may not be commercially viable in marginally producing wells if the base and incremental production does not support the cost of operating such wells. Accordingly, the incremental oil associated with implementation of the AERO System will also continue only as long as oil can continue to be produced economically. Any inability to broaden our customer base and increase commercialization of the AERO System applications effectively or to realize sufficiently favorable oil recovery results in a significant number of other reservoirs, including those we may acquire, will limit the commercial acceptance and viability of the AERO System, which would materially harm our business, financial condition and results of operations.
The success of the AERO System is dependent upon the information we receive.
The success of an application of the AERO System to a particular reservoir is dependent upon information that we receive regarding the reservoir characteristics and geology. If this information is inaccurate, we may not be able to achieve results in such a reservoir consistent with those we have thus far achieved in the reservoirs where the AERO System has been applied successfully. With respect to our customers, because of the uniqueness of our technology and the early stage of its development, we must educate potential customers on our technology in order to be able to generate business. New customers generally prefer to initially test our technology in a small portion of their lowest-priority oil field.
Since our test only includes a small portion of the injection wells and production wells in the oil field, it is important that the customer be able to identify which injection wells are servicing the production wells in the test area. For example, on a recent project one of the customer’s production wells was subsequently determined to be outside of the sand-body structure, and therefore not directly connected to the reservoir, so any waterflooding or application of the AERO System could not be effective for that production well since water could not flow from the injection well to the production well.
We may have difficulties gaining market acceptance and successfully marketing the AERO System to our potential customers.
A primary component of our business strategy is to market the AERO System to oil producers. To gain market acceptance and successfully market the AERO System to oil producers, we must effectively demonstrate the commercial advantages of using the AERO System as an alternative to, or in addition to, other enhanced oil recovery methods. We must prove that the AERO System is a cost effective method of significantly increasing the amount of oil that can be recovered from a reservoir. If we are unable to demonstrate this to oil producers, we will not be able to penetrate this market, generate new business or retain existing customers. In addition, until the efficacy of our technology is more widely demonstrated we are likely to experience long sales cycles and long test cycles, which may harm our business, financial condition and results of operations.
Our revenue to date has been derived from a limited number of customers, and the loss of any of these customers could materially harm our business, financial condition and results of operations.
We have a limited number of customers. For the year ended December 31, 2014, all of our service revenue was generated from 15 customers. If any of these customers terminates or significantly reduces its business with us, or if we fail to generate new business, our business, financial condition and results of operations could be materially harmed. However, we intend to mitigate this risk by continuing to diversify our revenue stream by acquiring, restoring and operating mature oil fields that fit our criteria for the AERO System.
15
Oil prices are volatile, and a decline in the price of oil could harm our business, financial condition and results of operations.
Our results of operations and future growth will depend on the level of activity for oil development and production. Demand for the AERO System depends on our customers’ willingness to make operating and capital expenditures for waterflooding procedures and the AERO System. Our business will suffer if these expenditures decline. The recent decline in oil prices and the uncertainty about future oil prices may adversely affect the prices we can obtain from our customers or prevent us from obtaining new customers for our services. The decline in oil prices will result in a decrease in revenues from the Coke Field and from other oil fields we acquire and make it more difficult to acquire other oil fields. Our customers’ willingness to develop and produce oil using waterflooding and the AERO System is highly dependent on prevailing market conditions and oil prices that are influenced by numerous factors over which we have no control, including:
• | changes in the supply of or the demand for oil; |
• | the condition of the United States and worldwide economies; |
• | market uncertainty; |
• | the level of consumer product demand; |
• | the actions taken by foreign oil producing nations; |
• | domestic and foreign governmental regulation and taxes; |
• | political conditions or hostilities in oil producing nations; |
• | the price and availability of alternate fuel sources; |
• | terrorism; and |
• | the availability of pipeline or other takeaway capacity. |
Oil prices have historically been volatile and cyclical. A prolonged reduction in the price of oil will likely affect oil production levels and therefore affect demand for our services. In addition, a prolonged significant reduction in the price of oil could make it more difficult for us to collect outstanding account receivables from our customers. A material decline in oil prices or oil development or production activity levels could materially harm our business, financial condition and results of operations.
Oil fields, once acquired, may not be appropriate for our purposes or may have environmental or other liabilities associated with them that may negatively affect our business, financial condition and results of operations.
In addition to marketing the AERO System, we intend to acquire mature fields and implement the AERO System. We cannot assure you that the oil fields we acquire will result in commercially viable projects.
The potential of a given property to continue to produce oil or resume production of oil and to be adaptable to the AERO System cannot be determined with a high level of precision prior to our acquisition of the property. We will continue to perform due diligence reviews of the properties we seek to acquire in a manner that we believe is both consistent with practices in the industry and necessary to determine the characteristics of such properties and the viability of the oil fields for the application of the AERO System. However, these reviews are inherently incomplete and cannot assure us of the quality of the oil fields or of the likelihood of success of the AERO System in enhancing their production of oil. It is generally not possible for us to test a property or conduct an in-depth review of its related records as part of its acquisition. Even if we are able to complete an in-depth review and sampling of these properties, such a review may not reveal existing or potential problems or permit us to become sufficiently familiar with the properties to fully assess their potential for successful application of the AERO System.
Even when problems are identified, it may be necessary for us to assume known or unknown environmental and other risks and liabilities to complete the acquisition of such properties. In addition, since the properties we are targeting are older, mature oil fields, their existing infrastructure may be out of date, damaged, in need of repair or removed, and we could incur unanticipated costs to repair or replace this infrastructure. The discovery of any unanticipated material liabilities or remediation costs or the incurrence of any unanticipated costs associated with our oil field acquisitions could harm our results of operations and financial condition.
If water that is not toxic to microbes is not available at a well site, the AERO System will not work or will require additional costs either to clean the water or bring in non-toxic water to the AERO System to perform correctly and, therefore, may not be a viable option for some oil fields.
The AERO System requires non-toxic water to support microbial activity in the reservoir. The water used in waterflooding does not have to be potable water, but if suitable water is not being used, the AERO System will not work unless additional costs are expended to clean the water or to bring in water that is non-toxic. These additional costs may make the AERO System less cost effective or not cost effective for some oil fields. For example, in a recent implementation of the AERO System, the salinity of the produced water used in the waterflood operations was very high, making it toxic to most microbes.
16
While our customer began using water from an existing nearby water well to provide a better environment for the microbes, which made the AERO System more effective, we may not be able to provide non-toxic water to some oil fields, eliminating these oil fields as candidates for the AERO System.
The AERO System is currently usable only in oil reservoirs with specific characteristics, which limits the potential market for our services.
For an oil reservoir to be suitable for the AERO System, the reservoir must be waterflooded or a candidate for waterflooding, must be composed of sandstone, must have permeability greater than 75 milli-darcies and must have a suitable water source. This limits the potential market for our services, which may negatively impact our results of operations and profitability.
Our operations involve operating hazards, which, if not insured or indemnified against, could harm our results of operations and financial condition.
Our operations are subject to hazards inherent in our technology, including exposure to pressurized air that may be used in the AERO System equipment and pressurized fluids that may be associated with the water injection system, and to hazards typically associated with oil field service operations, oil field development and oil production activities, including fire, explosions, blowouts, spills and damage or loss from natural disasters, each of which could result in substantial damage to the oil producing formations and oil wells, production facilities, other property, equipment and the environment or in personal injury or loss of life.
These hazards could also result in the suspension of operations or in claims by employees, customers or third parties which could have a material adverse effect on our financial condition. Operations also may be suspended because of equipment breakdowns and failure of subcontractors to perform or supply goods or services.
Some of these risks are either not insurable or insurance is available only at rates that we consider uneconomical. Although we will maintain liability insurance in an amount that we consider consistent with industry practice, the nature of these risks is such that liabilities could exceed policy limits. We may not always be successful in obtaining contractual indemnification from our customers, and customers who provide contractual indemnification protection may not maintain adequate insurance or otherwise have the financial resources necessary to support their indemnification obligations. Our insurance or indemnification arrangements may not adequately protect it against liability or loss from all the hazards of our operations. The occurrence of a significant event that we have not fully insured or indemnified against or the failure of a customer to meet its indemnification obligations to us could materially and adversely affect our results of operations and financial condition.
Our operations involve risks associated with the sale and distribution of crude oil.
The sale of our crude oil production (if any) depends on a number of factors beyond our control, including the availability, proximity and capacity of, and costs associated with, gathering, processing, compression and transportation facilities owned by third parties. In addition, lack of financing, construction and permitting delays, permitting costs and other constraints could limit or delay the construction of new gathering, processing, compression and transportation facilities by third parties or us, and we may experience delays or increased costs in accessing the pipelines, gathering systems or rail systems necessary to transport our production to points of sale or delivery. Any significant change in market or other conditions affecting gathering, processing, or transportation facilities or the availability of these facilities, including due to our failure or inability to obtain access to these facilities on terms acceptable to it or at all, could materially and adversely affect our business and, in turn, our financial condition and results of operations.
A portion of our oil production in any region may be interrupted, or shut in, from time to time for numerous reasons, including as a result of weather conditions, accidents, loss of pipeline or gathering system access, field labor issues or strikes, or capital constraints that limit the ability of third parties to construct gathering systems, processing facilities, or interstate pipelines to transport our production, or we might voluntarily curtail production in response to market conditions. If a substantial amount of our production is interrupted at the same time, it could temporarily adversely affect our cash flows.
Our hedging activities may prevent the realization of the full benefits of price increases.
To the extent that we engage in commodity-price-risk management activities to protect our cash flows from commodity price declines, we may be prevented from realizing the full benefits of price increases above the levels of the derivative instruments used to manage price risk.
17
In addition, our commodity-price-risk management may expose us to the risk of financial loss in certain circumstances, including instances in which: i) our production is less than the hedged volumes, ii) there is a widening of price basis differentials between delivery points for our production and the delivery point assumed in the hedge arrangement, iii) the counterparties to our hedging or other price-risk management contracts fail to perform under those arrangements or iv) a sudden unexpected event materially impacts oil prices.
We periodically enter into or may enter into hedging activities with respect to a portion of our production to manage our exposure to oil, gas and natural gas liquids price volatility. To the extent that we engage in price risk management activities as protection from commodity price declines, we may be prevented from fully realizing the benefits of commodity price increases above the prices established by our hedging contracts. In addition, our hedging arrangements may expose us to the risk of financial loss in certain circumstances, including instances in which the counterparties to our hedging contracts fail to perform under the contracts.
The loss of key personnel or the failure to attract and retain highly qualified personnel could compromise our ability to effectively manage our business and pursue our growth strategy.
Our future performance depends on the continued service of our key technical, development, sales, services and management personnel. In particular, we are heavily dependent on the following key employees: Stuart M. Page, President and Chief Executive Officer, Michael Pavia, Chief Technology Officer, Thomas Holland, Senior Vice President of Production, Ken Nimitz, Senior Vice President of Operations, and Victor M. Perez, Chief Financial Officer. The loss of key employees could result in significant disruptions to our business, and the integration of replacement personnel could be costly and time consuming, could cause additional disruptions to our business and could be unsuccessful. We do not carry key person life insurance covering any of our employees.
Our future success also depends on the continued ability to attract and retain highly qualified technical, development, sales, services and management personnel. A significant increase in the wages paid by competing employers could reduce our skilled labor force and increase the wages that we must pay to motivate, retain or recruit skilled employees.
In addition, wage inflation and the cost of retaining our key personnel in the face of competition for such personnel may increase our costs faster than we can offset these costs with increased prices or increased sales of the AERO System.
We may require substantial additional financing to achieve our goals and to make future acquisitions, and a failure to obtain this capital when needed or on acceptable terms could materially affect our growth rate and force us to delay, limit, reduce or terminate our research and development and commercialization efforts.
Since our inception, most of our resources have been dedicated toward research and development, as well as demonstrating the effectiveness of the AERO System in our labs and in the field. We also intend to expend substantial resources for the foreseeable future on further developing the AERO System and also we intend to expend significant resources on the acquisition and operation of additional mature oil fields to continue to test and demonstrate the AERO System in reservoirs with a variety of characteristics. We cannot assure you that debt or equity financing will be available or sufficient to meet our requirements. Our inability to access sufficient amounts of capital on acceptable terms, or at all, for our operations could materially harm our business, financial condition and results of operations.
Our quarterly operating results may fluctuate in the future.
Our financial condition and operating results have varied significantly in the past and may continue to fluctuate from quarter to quarter and year to year in the future due to a variety of factors, many of which are beyond our control. Factors relating to our business that may contribute to these fluctuations are described elsewhere in this Annual Report on Form 10-K. Accordingly, the results of any prior quarterly or annual periods should not be relied upon as indications of our future operating performance.
Our industry is highly competitive, and if we do not compete successfully, our business, financial condition and results of operations will be harmed.
The enhanced oil recovery industry is large and intensely competitive. Our competition comes mainly from other methods of enhanced oil recovery, such as thermal injection (for example, steam), gas injection (for example, carbon dioxide) and chemical injection into producing properties. There are also other companies developing or planning to commercialize microbial technology that is similar to the AERO System or other emerging enhanced oil recovery technologies, including Dupont, Geo Fossil Fuels, LLC, and Titan Oil Recovery, Inc. Some of our competitors have longer operating histories, greater recognition in the industry and substantially greater financial and other resources for developing new technologies as well as for recruiting and retaining qualified personnel than we do. Their greater financial resources may also make them better able to withstand downturns in the market, expand into new areas more aggressively or operate in developing markets without immediate financial returns.
18
Strong competition and significant investments by competitors to develop new and better technology may make it difficult for us to maintain and expand our customer base, force us to reduce our prices or increase our costs to develop new technology. Our success will depend on our ability to adapt to these competitive forces, to adapt to technological advances and to educate potential customers about the benefits of using our technology rather than our competitors’ technology. Our failure to respond successfully to these competitive challenges could harm our business, financial condition and results of operations.
Our industry is characterized by technological change, and if we fail to keep up with these changes, our business, financial condition and results of operations will be harmed.
The enhanced oil recovery industry is characterized by changes in technology, evolving methods of oil recovery and emerging competition. Our future business prospects largely depend on our ability to anticipate and respond to technological changes and to develop competitive products. If other enhanced oil recovery methods yield better results or are less expensive than our method, our business will suffer. We may not be able to respond successfully to new technological developments and challenges or identify and respond to new market opportunities, services or products offered by competitors. In addition, our efforts to respond to new methods of oil recovery and competition may require significant capital investments and resources, and we may not have the necessary resources to respond to these challenges. Failure to keep up with future technological changes could harm our business, financial condition and results of operations.
Our acquisition of oil fields will cause us to incur a variety of costs and could face numerous risks that would adversely affect our business and operations.
If appropriate opportunities become available, we may acquire businesses, assets, technologies or products to enhance our business in the future. In connection with any future acquisitions, we could:
• | issue additional equity securities which would dilute our current stockholders; |
• | incur substantial debt to fund the acquisitions which increase our risk of non-compliance without loan agreements; or |
• | assume significant liabilities. |
Acquisitions involve numerous risks, including problems integrating the purchased operations, technologies or products, unanticipated costs and other liabilities, diversion of management’s attention from our core business, adverse effects on existing business relationships with current and/or prospective partners, customers and/or suppliers, risks associated with entering markets in which we have no or limited prior experience and potential loss of key employees.
We may not be able to successfully integrate any businesses, assets, products, technologies or personnel that we might acquire in the future without a significant expenditure of operating, financial and management resources, if at all. The integration process could divert management time from focusing on operating our business, result in a decline in employee morale and cause retention issues to arise from changes in compensation, reporting relationships, future prospects or the direction of the business. Acquisitions may also require us to record goodwill (a non-amortizable intangible assets that will be subject to impairment testing on a regular basis and potential periodic impairment charges) incur amortization expenses related to certain intangible assets and incur large and immediate write-offs and restructuring and other related expenses, all of which could harm our operating results and financial condition. In addition, we may acquire companies that have insufficient internal financial controls, which could impair our ability to integrate the acquired company and adversely impact our financial reporting. If we fail in our integration efforts with respect to any of our acquisitions and are unable to efficiently operate as a combined organization, our business, financial condition and results of operations may be materially harmed.
If we fail to manage future growth effectively, our business could be harmed.
If the AERO System becomes commercially accepted, we may experience rapid growth. Any such growth would likely place significant demands on our management and on our operational and financial infrastructure. To manage growth effectively, we would need to, among other things, improve and enhance our managerial, operational and financial controls, hire sufficient numbers of capable employees and upgrade our infrastructure. We would also need to manage an increasing number of relationships with our customers, suppliers, business partners and other third parties. These activities would require significant expenditures and allocation of valuable management resources. If we fail to maintain the efficiency of our organization as it grows, our revenues and profitability may be harmed, and we might be unable to achieve our business objectives.
19
Some of our contracts will be governed by non-U.S. law, which may make them more difficult or expensive to enforce than contracts governed by United States law.
We expect that some of our customer contracts will be governed by non-U.S. law, which may create both legal and practical difficulties in case of a dispute or conflict. We plan to establish operations in regions where the ability to protect contractual and other legal rights may be limited compared to regions with better-established legal systems. In addition, having to pursue litigation in a non-U.S. country may be more difficult or expensive than pursuing litigation in the United States.
Our business operations in countries outside the United States are subject to a number of United States federal laws and regulations, including restrictions imposed by the Foreign Corrupt Practices Act as well as trade sanctions administered by the Office of Foreign Assets Control of the United States Department of Treasury and the United States Department of Commerce, which could adversely affect our operations if violated.
We must comply with all applicable export control laws and regulations of the United States and other countries. We cannot provide services to certain countries subject to United States trade sanctions administered by the Office of Foreign Asset Control of the United States Department of the Treasury or the United States Department of Commerce unless we first obtain the necessary authorizations. In addition, we are subject to the Foreign Corrupt Practices Act, which generally prohibits bribes or unreasonable gifts to non-U.S. governments or officials. Violations of these laws or regulations could result in significant additional sanctions including fines, more onerous compliance requirements, more extensive debarments from export privileges or loss of authorizations needed to conduct aspects of our international business. In certain countries, we may engage third party agents or intermediaries to act on our behalf in dealings with government officials, such as customs agents, and if these third party agents or intermediaries violate applicable laws, their actions may result in penalties or sanctions being assessed against us.
Our international operations are subject to additional or different risks than our United States operations.
We intend to expand our AERO System services and operations into a number of countries outside the United States. There are many risks inherent in conducting business internationally that are in addition to or different than those affecting our United States operations, including:
• | sometimes vague and confusing regulatory requirements that can be subject to unexpected changes or interpretations; |
• | import and export restrictions; |
• | tariffs and other trade barriers; |
• | difficulty in staffing and managing geographically dispersed operations and culturally diverse work forces and increased travel, infrastructure and legal compliance costs associated with multiple international locations; |
• | differences in employment laws and practices among different countries, including restrictions on terminating employees; |
• | differing technology standards; |
• | fluctuations in currency exchange rates; |
• | imposition of currency exchange controls; |
• | potential political and economic instability in some regions; |
• | legal and cultural differences in the conduct of business; |
• | less due process and sometimes arbitrary application of laws and sanctions, including criminal charges and arrests; |
• | difficulties in raising awareness of applicable United States laws to our agents and third party intermediaries; |
• | potentially adverse tax consequences; |
• | difficulties in enforcing contracts and collecting receivables; |
• | difficulties and expense of maintaining international sales distribution channels; and |
• | difficulties in maintaining and protecting our intellectual property. |
Operating internationally exposes our business to increased regulatory and political risks in some non-U.S. jurisdictions where it operates. In addition to different laws and regulations, changes in governments or changes in governmental policies in these jurisdictions may alter current interpretation of laws and regulations affecting our business. We also face increased risk of incidents such as war or other international conflict and nationalization.
Many of the countries in which we plan to operate have legal systems that are less developed and less predictable than legal systems in the United States. It may be difficult for us to obtain effective legal redress in the courts of some jurisdictions, whether in respect of a breach of law or regulation, or in an ownership dispute because of: (i) a high degree of discretion on the part of governmental authorities, which results in less predictability; (ii) a lack of judicial or administrative guidance on interpreting applicable rules and regulations; (iii) inconsistencies or conflicts between or within various laws, regulations, decrees, orders and resolutions; (iv) the relative inexperience of the judiciary and courts in such matters or (v) a predisposition in favor of local claimants against United States companies.
20
In certain jurisdictions, the commitment of local business people, government officials and agencies and the judicial system to abide by legal requirements and negotiated agreements may be unreliable. In particular, agreements may be susceptible to revision or cancellation and legal redress may be uncertain or time-consuming. Actions of governmental authorities or officers may adversely affect joint ventures, licenses, license applications or other legal arrangements, and such arrangements in these jurisdictions may not be effective or enforced.
The authorities in the countries where we operate, or plan to operate, may introduce additional regulations for the oil industry with respect to, but not limited to, various laws governing prospecting, development, production, taxes, price controls, export controls, currency remittance, expropriation of property, foreign investment, maintenance of claims, environmental legislation, land use, land claims of local people, water use, labor standards, occupational health network access and other matters. New rules and regulations may be enacted or existing rules and regulations may be applied or interpreted in a manner which could limit our ability to provide our technology. Amendments to current laws and regulations governing operations and activities in the oil and gas industry could harm our operations and financial results.
Compliance with and changes in tax laws or adverse positions taken by taxing authorities could be costly and could affect our operating results. Compliance related tax issues could also limit our ability to do business in certain countries. Changes in tax laws or tax rates, the resolution of tax assessments or audits by various taxing authorities, disagreements with taxing authorities over our tax positions and the ability to fully utilize our tax loss carry-forwards and tax credits could have a significant financial impact on our future operations and the way it conducts, or if it conducts, business in the affected countries.
Our ability to use our net operating loss carryforwards to offset future taxable income may be subject to certain limitations.
As of December 31, 2014, we had operating loss carryforwards, or NOLs, of approximately $51.9 million. In general, under Section 382 of the U.S. Internal Revenue Code of 1986, as amended, a corporation that undergoes an “ownership change” is subject to limitations on its ability to utilize its NOLs to offset future taxable income. We believe that our issuance of series B preferred stock on October 15, 2009 resulted in a Section 382 ownership change limitation. We estimate that approximately $5.4 million of our NOLs will expire early due to Section 382 ownership change limitations. In addition, if we undergo an additional ownership change, our ability to utilize NOLs could be further limited by Section 382 of the Internal Revenue Code. Future changes in our stock ownership, some of which are outside of our control, could result in an ownership change under Section 382 of the Internal Revenue Code. Furthermore, our ability to utilize NOLs of companies that we may acquire in the future may be subject to limitations.
Our loan agreements place financial restrictions and operating restrictions on our business, which may limit our flexibility to respond to opportunities and may harm our business, financial condition and results of operations.
The operating and financial restrictions and covenants in our loan agreements restrict any future financing agreements and could restrict our ability to finance future operations or capital needs or to engage, expand or pursue our business activities. For example, these loan agreements restrict our ability to:
• | change the nature of our business; |
• | enter into a merger, consolidate or make an investment in other entities; |
• | incur additional indebtedness; |
• | incur liens on the property secured by the loan agreements and our intellectual property; |
• | pay cash dividends; and |
• | sell or dispose of our assets (including sale and leaseback arrangements), including our oil properties. |
Our compliance with these provisions may materially adversely affect our ability to react to changes in market conditions, take advantage of business opportunities we believe to be desirable, obtain future financing, fund needed capital expenditures, finance acquisitions or withstand a future downturn in our business. In addition, our note purchase agreement requires us to maintain specified financial ratios.
Our ability to comply with the covenants and restrictions contained in these loan agreements may be affected by events beyond our control. The recent decline in oil prices has increased the likelihood that we may violate covenants such as maximum leverage and collateral coverage ratios required by our loan agreements. If we violate any of the restrictions or covenants in our loan agreements, the indebtedness under the loan agreements may become immediately due and payable. We might not have, or be able to obtain, sufficient funds to make these accelerated payments. Even if we could obtain alternative financing, that financing may not be on terms that are favorable or acceptable to us.
21
Our estimated proved reserves are based on many assumptions that may turn out to be inaccurate. The actual quantities and present value of our proved reserves may prove to be materially lower than it has estimated.
The process of estimating oil reserves is complex. It requires interpretations of available technical data and many assumptions, including assumptions relating to current and future economic conditions and commodity prices. Any significant inaccuracies in these interpretations or assumptions could materially affect the estimated quantities and present value of reserves shown in our financial statements provided as part of this Annual Report on Form 10-K.
In order to prepare our estimates, we must project production rates and the timing of development expenditures. We must also analyze available geological, geophysical, production and engineering data. The extent, quality and reliability of this data can vary. The process also requires economic assumptions about matters such as oil prices, operating expenses, capital expenditures, taxes and availability of funds. Although the reserve information contained herein is reviewed by our independent reserve engineers, William M. Cobb & Associates, Inc. and Collarini Associates, estimates of oil and natural gas reserves are inherently imprecise. Furthermore, different reserve engineers may make different estimates of reserves and cash flows based on the same available data.
Actual future production, oil prices, revenues, taxes, development expenditures, operating expenses and quantities of recoverable oil reserves will vary from our estimates. Any significant variance could materially affect the estimated quantities and present value of reserves shown in our financial statements provided as part of this Annual Report on Form 10-K. In addition, we may adjust estimates of proved reserves to reflect production history, prevailing oil prices and other factors, many of which are beyond our control.
The decline in oil price may result in impairment charges.
Declines, as well as anticipated declines, in oil and gas prices could result in impairment and decline in the value of our oil properties. The price of oil declined 36% during the fourth quarter of 2014 based on the Cushing, Oklahoma - West Texas Intermediate monthly average spot prices of $93.21 per barrel in September 2014 and $59.29 in December 2014. Subsequent to December 2014, the oil prices decreased further to $47.22 per barrel for January 2015. The 2014 decline resulted in an impairment charge of $13.2 million.
Risks Related to our Intellectual Property
We may not be able to protect our proprietary information or technology adequately.
Our success depends on our proprietary information and technology. We have adopted an intellectual property strategy, relying on a combination of patents and trade secret laws, as well as on confidentiality and non-compete agreements, in order to establish and protect our proprietary rights. Our pending and future patent applications may not issue as patents or, if issued, may not issue in a form that will provide us with any meaningful protection or any competitive advantage. Existing or future patents may be challenged, including with respect to the development and ownership thereof, or narrowed, invalidated or circumvented, which could limit our ability to stop competitors from developing and marketing similar technology or limit the length of terms of patent protection we may have for our technology. In addition, any such challenge could be costly and become a significant diversion of our management’s time and resources. Further, other companies may design around technology we have patented, licensed or developed and, therefore, diminish any competitive advantage we may have from our technology. Also, changes in patent laws or their interpretation in the United States and other countries could diminish the value of our intellectual property or narrow the scope of our patent protection.
These concerns apply equally to patents we have licensed or may in the future license, which may likewise be challenged, invalidated or circumvented. In addition, we generally do not control the patent prosecution and maintenance of subject matter that we license from others. Generally, the licensors are primarily or wholly responsible for the patent prosecution and maintenance activities pertaining to the patent applications and patents we license, while we may only be afforded opportunities to comment on such activities. Accordingly, we are unable to exercise the same degree of control over licensed intellectual property as we exercise over our own intellectual property, and we face the risk that our licensors will not prosecute or maintain it as effectively as we would like.
22
Third parties may infringe or misappropriate our patents or other intellectual property rights, which could adversely affect our business, financial condition and results of operations. Litigation may be necessary to enforce our intellectual property rights, protect our trade secrets or determine the validity and scope of the proprietary rights of others. In order to protect or enforce our intellectual property rights, we may initiate litigation against third parties, such as infringement suits or interference proceedings. Such litigation may be costly and may not be successful. Litigation may be necessary to:
• | assert claims of infringement; |
• | enforce our patents; |
• | enforce our licenses; |
• | protect our trade secrets or know-how; or |
• | determine the enforceability, scope and validity of the proprietary rights of others. |
The steps we have taken to deter misappropriation of our proprietary information and technology may be insufficient to protect us, and we may be unable to prevent infringement of our intellectual property rights or misappropriation of our proprietary information. Any infringement or misappropriation could harm any competitive advantage we currently derive or may derive in the future from our proprietary rights. In addition, if we operate in foreign jurisdictions in the future, we may not be able to protect our intellectual property in the foreign jurisdictions in which we operate. The legal systems of certain countries do not favor the aggressive enforcement of intellectual property and the laws of certain foreign countries may not protect our rights to the same extent as the laws of the United States. Any actions taken in those countries may have results that are different than if such actions were taken under the laws of the United States. Patent litigation and other challenges to our patents are costly and unpredictable and represent a significant diversion of our management’s time and resources. Our intellectual property may also fall into the public domain. If we are unable to protect our proprietary rights, we may be at a disadvantage to others who did not incur the substantial time and expense we have incurred to create our technology.
Confidentiality agreements with employees and others may not adequately prevent disclosures of trade secrets and other proprietary information.
We rely in part on trade secret protection to protect our confidential and proprietary information and processes. However, trade secrets are difficult to protect. We have taken measures to protect our trade secrets and proprietary information, but these measures may not be effective. We require new employees and consultants to execute confidentiality agreements upon the commencement of an employment or consulting arrangement with us. These agreements generally require that all confidential information developed by the individual or made known to the individual by us during the course of the individual’s relationship with us be kept confidential and not disclosed to third parties. These agreements also generally provide that know-how and inventions conceived by the individual in the course of rendering services to us are our exclusive property. Nevertheless, these agreements may be breached or may not be enforceable, our proprietary information may be disclosed, and others may independently develop substantially equivalent proprietary information and techniques or otherwise gain access to our trade secrets, and we may not have adequate remedies for any resulting losses. Costly and time-consuming litigation could be necessary to enforce and determine the scope of our proprietary rights, and failure to obtain or maintain trade secret protection could adversely affect our competitive business position.
Our technology may infringe upon the intellectual property rights of others. Intellectual property infringement claims would be time consuming and expensive to defend and may result in limitations on our ability to use the intellectual property subject to these claims.
Claims asserting that we have violated or infringed upon third party intellectual property rights may be brought against us in the future. We may be unaware of intellectual property rights of others that may cover some of our technology or third parties may have or eventually be issued patents on which our current and future technology may infringe. The complexity of the technology involved and the uncertainty of intellectual property litigation increase these risks. Any claims and any resulting litigation could subject us to significant liability for damages, cause us to incur significant expenses and divert management time. A court could enter orders temporarily, preliminarily or permanently enjoining us from making, using, selling or importing any current and future technology or could enter an order mandating that we undertake certain remedial activities.
An adverse determination in any litigation of this type could require us to design around a third party’s patent or license alternative technology from another third party, which may not be available on acceptable terms or at all. If we cannot do these things on a timely and cost-effective basis, our revenues may decrease substantially, and we could be exposed to significant liability. In addition, litigation is time-consuming and expensive to defend and could result in limitations on our ability to use the intellectual property subject to these claims.
23
Environmental and Regulatory Risks
We are subject to complex laws and regulations, including environmental regulations, which can adversely affect the cost, manner or feasibility of our business.
Our operations are subject to federal, state and local laws and regulations, including environmental and health and safety laws and regulations governing, among other things, the generation, storage, handling, emission, use, transportation and discharge of hazardous substances and other materials into the environment, the integrity of groundwater aquifers and the health and safety of our employees. These laws and regulations can adversely affect the cost, manner or feasibility of doing business.
We incur, and expect to continue to incur, capital and operating costs to comply with environmental laws and regulations. Many laws and regulations require permits for the operation of various facilities, and these permits are subject to revocation, modification and renewal. Governmental authorities have the power to enforce compliance with their regulations, and violations could subject us to fines, injunctions or both.
We could be held liable for contamination at or from our current or former properties and any sites we acquire in the future, as well as for contamination at or from third party sites where we have operated or have disposed of waste, regardless of fault. We could also be subject to claims from landowners alleging property damage as a result of our operations. Further, we could be held liable for any and all consequences arising out of human exposure to hazardous substances or other environmental damage. In addition, if we are named in an environmental lawsuit alleging contamination at any such site, even if we are not at fault, any such lawsuit could harm our reputation and be costly and become a significant diversion of our management’s time and resources.
Environmental laws are complex, change frequently and have tended to become more stringent over time. Changes in, or additions to, environmental and health and safety laws and regulations could lead to increased operating and compliance costs.
Therefore, no assurance can be given that our cost of complying with current and future environmental and health and safety laws, and our liabilities arising from past or future releases of, or exposure to, hazardous substances or other materials will not materially harm our business, financial condition and results of operations.
We rely on oil producers to obtain the appropriate permits to operate their wells and waterflood systems, and if they fail to obtain proper permits they could be subject to fines or penalties, and that could harm our business.
In the typical application of the AERO System to a reservoir, the well operator (which may include us) will be responsible for having all applicable permits for operating its wells and waterflood systems. If the well operator fails to have such permits, it could be subject to fines or penalties, which could, in turn, harm our business. In addition, because our technology is new, regulatory agencies may not be sure how to apply existing rules to the AERO System or may have concerns that could delay or restrict use of the AERO System in some wells. Any such delays or restrictions could harm our business.
Climate change legislation and regulatory initiatives could result in increased operating costs and decreased demand for our products and services.
Changes in environmental requirements may negatively impact demand for our services. For example, oil exploration and production may decline as a result of environmental requirements (including land use policies responsive to environmental concerns). State, national, and international governments and agencies have been evaluating climate-related legislation and other regulatory initiatives that would restrict emissions of greenhouse gases in areas in which we conduct business. Because our business depends on the level of activity in the oil industry, existing or future laws, regulations, treaties or international agreements related to greenhouse gases and climate change, including incentives to conserve energy or use alternative energy sources, could have a negative impact on our business if such laws, regulations, treaties, or international agreements reduce the worldwide demand for oil or oil prices. Likewise, such restrictions may result in additional compliance obligations with respect to the release, capture and use of greenhouse gases such as carbon dioxide that could adversely affect our business, financial condition and results of operations.
The adoption of any future federal or state laws or implementing regulations imposing restrictions on hydraulic fracturing, if extended to oil recovery operations, could materially harm our business, financial condition and results of operations.
The Environmental Protection Agency, or EPA, has recently focused on concerns about the risk of water contamination and public health problems from drilling and hydraulic fracturing activities. The EPA is conducting a comprehensive research study on the potential adverse effects that hydraulic fracturing may have on water quality and public health. While our technology is unrelated to hydraulic fracturing, it is possible that any federal, state and local laws and regulations that might be imposed on fracturing activities could also apply to oil recovery operations.
24
Although it is not possible to predict the outcome of EPA’s study or whether any new legislation or regulations would impact our business, such future laws and regulations could result in increased compliance costs or additional operating restrictions, which, in turn, could materially harm our financial position, results of operations and cash flows.
As a result of the acquisition of the Coke Field Assets, our producing properties are located primarily in the East Texas Basin, making us vulnerable to risks associated with operating in one major geographic area.
With the closing of the Coke Field Acquisition, substantially all of our producing properties are geographically concentrated in the East Texas Basin. At December 31, 2014, substantially all of Glori’s total estimated proved reserves were attributable to properties located in this area.
As a result of this concentration, we may be disproportionately exposed to the impact of regional supply and demand factors, delays or interruptions of production from wells in this area caused by governmental regulation, processing or transportation capacity constraints, market limitations, availability of equipment and personnel, water shortages or other drought related conditions or interruption of the processing or transportation of oil, natural gas or NGLs.
We are susceptible to the potential difficulties associated with rapid growth and expansion and have a limited operating history.
With the closing of the Coke Field Acquisition and the Merger, we have grown rapidly. Our management believes that our future success depends on our ability to manage the rapid growth that we have experienced and the demands from increased responsibility on management personnel. The following factors could present difficulties:
• | increased responsibilities for our executive level personnel; |
• | increased administrative burden; |
• | increased capital requirements; and |
• | increased organizational challenges common to large, expansive operations. |
Our operating results could be adversely affected if we do not successfully manage these potential difficulties. The historical financial information incorporated herein is not necessarily indicative of the results that may be realized in the future. In addition, our operating history is limited and the results from our current producing wells are not necessarily indicative of future operations.
We may be subject to risks in connection with acquisitions of properties.
The successful acquisition of producing properties requires an assessment of several factors, including:
• | recoverable reserves; |
• | future oil and natural gas prices and their applicable differentials; |
• | operating costs; and |
• | potential environmental and other liabilities. |
The accuracy of these assessments is inherently uncertain. In connection with these assessments, we perform a review of the subject properties that we believe to be generally consistent with industry practices. Our review will not reveal all existing or potential problems nor will it permit us to become sufficiently familiar with the properties to fully assess their deficiencies and capabilities. Inspections may not always be performed on every well, and environmental problems, such as groundwater contamination, are not necessarily observable even when an inspection is undertaken. Even when problems are identified, the seller may be unwilling or unable to provide effective contractual protection against all or part of the problems.
We may incur losses as a result of title defects in the properties in which we invest.
The existence of a material title deficiency can render a lease worthless and can adversely affect our results of operations and financial condition. While we conduct customary due diligence prior to acquiring a property, the failure of title may not be discovered until after we acquire the property, in which case we may lose the lease and the right to produce all or a portion of the minerals under the property.
25
Item 1B. Unresolved Staff Comments
None.
Item 2. Properties
Information regarding the Company's properties called for by this item is included in Item 1, Business - Glori's Properties. We also have various operating leases for rental of office, laboratory, and warehouse space. The Company also has various other commitments such as technology hardware and support and software commitments. See Item 7, Management's Discussion and Analysis of Financial Condition and Results of Operations, and NOTE 13, Commitments and Contingencies, in the Consolidated Financial Statements in Item 15 to Part IV of this Annual Report on Form 10-K for the future minimum rental payments. Such information is incorporated herein by reference.
Item 3. Legal Proceedings
Legal Proceedings
From time to time, the Company may be subject to legal proceedings and claims that arise in the ordinary course of business. The Company is not a party to any material litigation or proceedings and is not aware of any material litigation or proceedings, pending or threatened against it. We are subject to various legal proceedings, claims, and governmental inspections, audits or investigations arising out of our business which cover matters such as general commercial, governmental regulations, environmental, employment and other actions. Although the outcomes of these routine claims cannot be predicted with certainty, in the opinion of management, the ultimate resolution of these matters will not have a material adverse effect on our financial position or results of operations.
Item 4. Mine Safety Disclosures
Not applicable.
26
PART II
Item 5. Market for Registrant's Common Equity, Related Stockholder Matters and Issuer Purchases of Equity Securities.
Market Information for Common Stock
Our common stock has been listed on the NASDAQ since April 14, 2014. Prior to that time, the trading prices are not available since there was no public market for our stock. The following table sets forth for the indicated periods the high and low intra-day sales prices per share for our common stock for 2014 since our initial trading date.
High | Low | ||||||
Second Quarter (from April 14) | $ | 12.44 | $ | 7.51 | |||
Third Quarter | 11.00 | 6.23 | |||||
Fourth Quarter | 7.85 | 3.00 | |||||
Holders of Record
As of December 31, 2014, there were approximately 700 stockholders of record of our common stock, and the closing price of our common stock was $4.18 per share as reported on the NASDAQ. Because many of our shares of common stock are held by brokers and other institutions on behalf of stockholders, we are unable to estimate the total number of stockholders represented by these record holders.
Dividend Policy
To date, we have not declared or paid any cash dividend on our common stock. Any future payments of cash dividends on our common stock will be at the discretion of our board of directors and dependent upon our revenues and earnings, financial strategy, capital requirements and overall financial condition and subject to our covenants in our loan agreement with Hercules which prevents us from paying dividends to our stockholders until the debt underlying those agreements is paid. For the foreseeable future we presently intend to retain any earnings for use in our business operations.
Unregistered Sales of Securities
We have not sold any of our equity securities during the period covered by this Report that were not registered under the Securities Act.
Purchases of Equity Securities by the Issuer and Affiliated Purchasers
During the fourth quarter of the fiscal year covered by this report, no purchases were made by or on behalf of the Company or any “affiliated purchaser,” as defined in Rule 10b-18(a)(3) under the Exchange Act, of shares or other units of any class of the Company’s equity securities.
27
Share-Based Compensation
The following table sets forth information about our equity compensation plans at December 31, 2014:
Plan Category | Number of securities to be issued upon exercise of outstanding options, warrants and rights | Weighted-average exercise price of outstanding options | Number of securities remaining available for future issuance under equity compensation plans | |||||
Glori Oil Limited 2006 Stock Option and Grant Plan (1) | 2,005,852 | 0.78 | — | |||||
Glori Energy Inc. 2014 Long Term Incentive Plan | — | — | 2,000,000 | |||||
(1) | As a result of the Merger which was consummated on April 14, 2014, the issued and outstanding stock options were canceled and reissued as stock options in the newly merged entity at a conversion ratio of 2.9 pre-Merger stock options to 1 post-Merger stock option. The exercise price of the Glori stock options also increased by the same factor of 2.9. All option disclosures in the note above are shown as converted using these factors. |
Glori Oil Limited 2006 Stock Option and Grant Plan – The Company’s pre-Merger long term incentive plan the Glori Oil Limited 2006 Stock Option and Grant Plan allowed for the issuance of stock options. These options were typically issued at an exercise price equal to the fair market value of the Company’s common stock at the grant date, as determined by the Board of Directors. Generally, the options vest 25 percent after 1 year, and thereafter ratably by month over the next 36 months, and may be exercised for a period of 10 years subject to vesting. As of April 14, 2014 the plan was amended such that no further options would be issued.
Glori Energy Inc. 2014 Long Term Incentive Plan – The plan was adopted by the Company’s Board in December 2014 and is approved by the shareholders. Under the plan, the Board of Directors may grant options, incentive stock options, stock appreciation rights and performance based awards. Awards made under the plan are subject to such terms and conditions, without limitation as may be determined by the board.
For a further detail of the options, exercise prices and number of securities to be issued upon option exercise see NOTE 14 included in the Notes to Consolidated Financial Statements in Item 15 to Part IV of this Annual Report on Form 10-K.
28
Stock Performance Graph
The following graph shows a comparison from April 14, 2014, the date our common stock commenced trading on the NASDAQ through December 31, 2014 of the cumulative total return for our common stock, the Russell 2000 Index and the Russell 3000 Index. The graph assumes that $100 was invested at the market close on April 14, 2014 in the common stock of the Company, the Russell 2000 Index and the Russell 3000 Index. The stock price performance of the following graph is not necessarily indicative of future stock price performance.
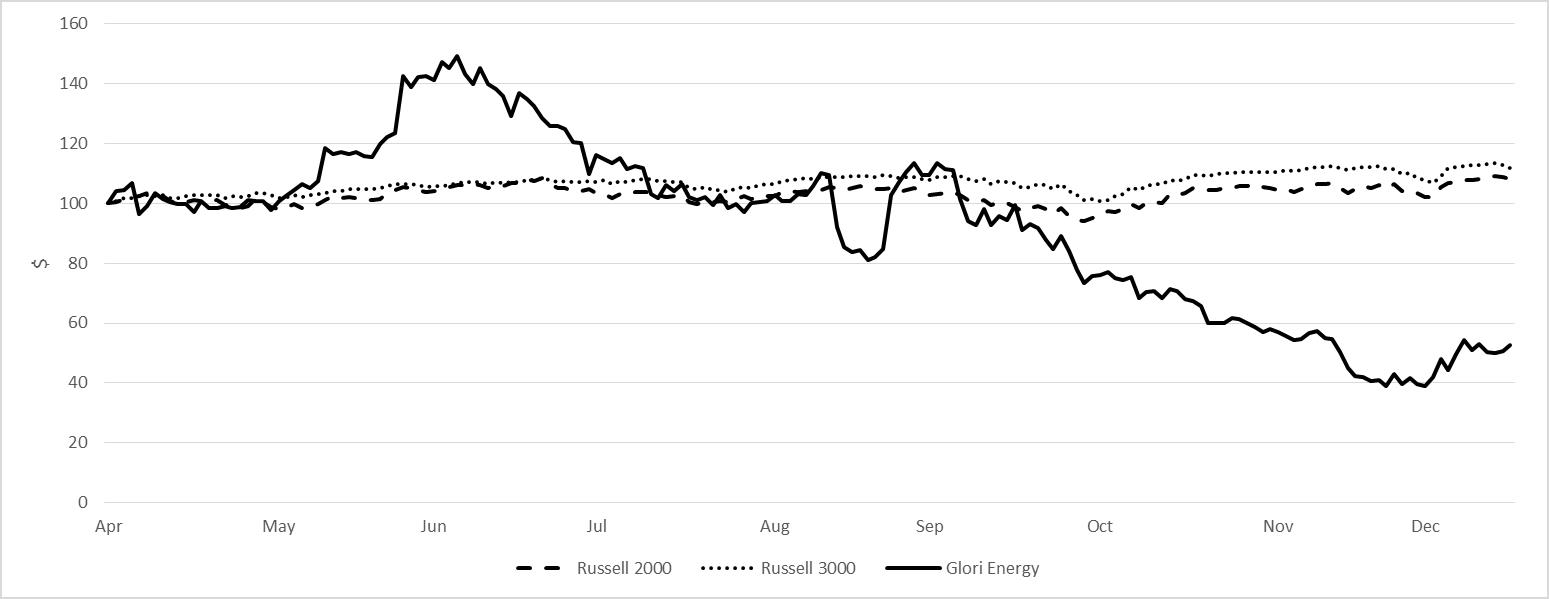
Item 6. Selected Financial Data
The following table (in thousands, except per share data) presents selected historical financial data for the periods indicated. The selected consolidated financial data are derived from our audited consolidated financial statements (taking into account the Merger). The following selected historical financial data should be read in connection with Item 7. Management’s Discussion and Analysis of Financial Condition and Results of Operations and the audited Consolidated Financial Statements and related notes included in Item 15 to Part IV of this Annual Report on Form 10-K.
As of and for the Years Ended December 31, | |||||||||||
2012 | 2013 | 2014 | |||||||||
Revenues: | |||||||||||
Oil and gas revenues | $ | 463 | $ | 576 | $ | 11,724 | |||||
Service revenues | 1,718 | 2,643 | 4,135 | ||||||||
Total revenues | 2,181 | 3,219 | 15,859 | ||||||||
Net loss | (11,940 | ) | (10,609 | ) | (18,756 | ) | |||||
Net loss per share, basic and diluted | $ | (11.32 | ) | $ | (9.61 | ) | $ | (0.65 | ) | ||
Cash | $ | 18,707 | $ | 20,867 | $ | 29,751 | |||||
Property, plant and equipment, net | 5,040 | 2,810 | 28,813 | ||||||||
Total assets | 24,477 | 24,619 | 67,435 | ||||||||
Long-term debt | 7,879 | 5,270 | 19,225 | ||||||||
Total stockholders' equity | $ | 24,477 | $ | 16,196 | $ | 41,215 | |||||
29
Item 7. Management's Discussion and Analysis of Financial Condition and Results of Operations
The following discussion and analysis should be read in conjunction with our Consolidated Financial Statements and Notes thereto included in Item 15 to Part IV of this Annual Report on Form 10-K. Our discussion and analysis includes forward-looking information that involves risks and uncertainties and should be read in conjunction with Risk Factors under Item 1A of this Annual Report on Form 10-K, along with Forward-Looking Information under Item 7A of this Annual Report on Form 10-K for information on the risks and uncertainties that could cause our actual results to be materially different from our forward-looking statements.
Management's Overview
On January 8, 2014, we executed a merger and share exchange agreement with Infinity Corp. and certain of its affiliates. On April 14, 2014, the Merger was consummated. We obtained effective control of Infinity Corp. subsequent to the Merger and thus the Merger was accounted for as a reverse acquisition and recapitalization of the Company. Subsequent to the Merger, our shareholders retained a substantial majority of voting interest and positions on the Board of Directors. Additionally our management is retained and our operations comprise the ongoing operations post-Merger. In connection with the Merger, we received approximately $24.7 million, net of certain expenses and fees, and approximately $13.7 million in cash from the private placement of common stock for total proceeds of $38.4 million.
On March 14, 2014, we acquired the Coke Field Assets from Petro-Hunt for (i) $38.0 million in cash and a $2.0 million convertible note payable to Petro-Hunt, subject to certain purchase price adjustments primarily for net revenues in excess of direct operating expenses of the property from January 1, 2014 through the closing date, March 14, 2014, and (ii) the assumption of the asset retirement obligation related to plugging and abandoning the Coke Field Assets. Subsequent to the Merger the note payable to Petro-Hunt was converted into common stock.
Critical Accounting Policies and Estimates
The discussion of Glori’s financial condition and results of operations is based upon its consolidated financial statements, which have been prepared in accordance with United States generally accepted accounting principles. The preparation of these financial statements requires Glori to make estimates and judgments that affect the reported amounts of assets, liabilities, revenues, costs and expenses. On an ongoing basis, Glori evaluates its estimates and assumptions, including those related to revenues, bad debts, long-lived assets, income taxes, asset retirement obligation, fair value of derivatives, asset impairment and stock-based compensation. These estimates are based on historical experience and on various other assumptions that Glori believes are reasonable under the circumstances. The results of Glori’s analysis form the basis for making assumptions about the carrying values of assets and liabilities that are not readily apparent from other sources. Actual results may differ from these estimates, and the impact of such differences may be material to Glori’s consolidated financial statements.
Critical accounting policies are those policies that, in management’s view, are most important in the portrayal of Glori’s financial condition and results of operations. The footnotes to Glori’s consolidated financial statements also include disclosure of significant accounting policies. The methods, estimates and judgments that Glori uses in applying its accounting policies have a significant impact on the results that Glori reports in its financial statements. These critical accounting policies require Glori to make difficult and subjective judgments, often as a result of the need to make estimates regarding matters that are inherently uncertain. Those critical accounting policies and estimates that require the most significant judgment are discussed below.
AERO Services Related Accounting Policies and Estimates
Revenue Recognition. Service revenues are recognized when all services are concluded in accordance with the contract. The Company’s service contracts typically include a single contract for each phase of service. During the initial phase known as Reservoir Analysis and Treatment Design (the “Analysis Phase”), the Company samples the target field and evaluates project feasibility and nutrient formulation by assessing field characteristics such as geology, microbial environment and geochemistry of the oil and water. The completion of the Analysis Phase contract typically coincides with the delivery of a report of findings to the customer at which point the Analysis Phase revenues are recognized. Once the viability of the AERO System is demonstrated in the Analysis Phase, a new contract is executed for the Field Deployment Phase. During the Field Deployment Phase the AERO System is initiated in the oil field to stimulate the indigenous microbes in the oil bearing reservoir. The Field Deployment Phase revenues are recognized ratably over the Field Deployment Phase injection work timeline.
Previous to 2014, the majority of the Company’s revenues for AERO services were executed under a single contract which covered both Analysis Phase and Field Deployment Phase work.
30
The single contract for both services resulted in lack of commercial evidence that the Analysis Phase services provided value on a stand-alone basis and thus both services were viewed as a single unit-of-accounting under ASC 605, Revenue Recognition: Multiple-Element Arrangements. In accordance with this guidance, the Company deferred revenue received in the Analysis Phase and recognize this revenue and the Field Deployment Phase revenue uniformly over the Field Deployment Phase injection timeline. Any termination of the project after the completion of the Analysis Phase would result in the immediate recognition of that portion of the revenues outlined in the contract.
Oil and Gas Extraction Specific Policies and Estimates
Successful Efforts Method. Glori uses the successful efforts method of accounting for oil producing activities. Costs to acquire mineral interests in oil and gas properties, to drill and equip exploratory wells that find proved reserves, and to drill and equip development wells are capitalized.
Revenue Recognition. Glori follows the sales method of accounting for crude oil revenues. Under this method, Glori recognizes revenues on production as it is taken and delivered to its purchasers, net of royalties. Revenues from natural gas production are recorded using the sales method. When sales volumes exceed the Company’s entitled share, production imbalance occurs. If production imbalance exceeds the Company’s share of the remaining estimated proved natural gas reserves for a given property, the Company records a liability.
Depletion. The estimates of crude oil reserves utilized in the calculation of depletion are estimated in accordance with guidelines established by the Society of Petroleum Engineers, the SEC and the Financial Accounting Standards Board, which require that reserve estimates be prepared under existing economic and operating conditions with no provision for price and cost escalations except by contractual arrangements. Glori emphasizes that reserve estimates are inherently imprecise. Accordingly, the estimates are expected to change as more current information becomes available. Glori’s policy is to amortize capitalized costs on the unit of production method, based upon these reserve estimates.
Glori assesses its proved properties for possible impairment on an annual basis at a minimum, or as circumstances warrant, based on geological trend analysis, changes in proved reserves or relinquishment of acreage. When impairment occurs, the adjustment is recorded to accumulated depletion.
Asset Retirement Obligation. Glori accounts for its plugging and abandonment liability for permanently shutting in wells, or asset retirement obligation ("ARO") in accordance with ASC 410, Asset Retirement and Environmental Obligations. The fair value of a liability for an ARO is required to be recognized in the period in which it is incurred if a reasonable estimate of fair value can be made, and the associated retirement costs are capitalized as part of the carrying amount of the long-lived asset. Glori determines its ARO by calculating the present value of the estimated cash flows related to the liability based upon estimates derived from management and external consultants familiar with the requirements of the retirement and Glori’s ARO is reflected in the accompanying consolidated balance sheets as a noncurrent liability. Glori has not funded nor dedicated any assets to this retirement obligation. The liability is periodically adjusted to reflect (1) new liabilities incurred; (2) liabilities settled during the period; (3) accretion expense; and (4) revisions to estimated future plugging and abandonment costs.
Impairment of Oil and Natural Gas Properties. Glori reviews its proved oil and natural gas properties for impairment whenever events and circumstances indicate a potential decline in the recoverability of their carrying value. We compare expected undiscounted future net cash flows from each field to the unamortized capitalized cost of the asset. If the future undiscounted net cash flows, based on the our estimate of future oil and natural gas prices and operating costs and anticipated production from proved reserves, are lower than the unamortized capitalized cost, then the capitalized cost is reduced to fair value. The factors used to determine fair value include, but are not limited to, estimates of reserves, future commodity pricing, future production estimates, and anticipated capital expenditures. Unproved properties are reviewed quarterly to determine if there has been impairment of the carrying value, with any such impairment charged to expense in the period. Drilling activities in an area by other companies may also effectively condemn leasehold positions. Given the complexities associated with oil and natural gas estimates and the history of price volatility in the oil and natural gas markets, events may arise that will require the Company to record an impairment of its oil and natural gas properties and there can be no assurance that such impairments will not be required in the future nor that they will not be material.
Derivative Instruments. At the end of each reporting period we record on our balance sheet the mark-to-market valuation of our commodity derivative instruments. The unrealized estimated change in fair value of the derivatives is reported in other (expense) income as gain (loss) on commodity derivative instruments.
31
Stock-Based Compensation. Prior to the adoption of Glori’s 2014 Long-Term Incentive Plan, it had one stock-based compensation plan, the Glori Oil Limited Amended and Restated 2006 Stock Option and Grant Plan, or the 2006 Plan. All equity instruments granted under the 2006 Plan are settled in stock and no awards under the 2014 Plan had been made as of December 31, 2014. Since the adoption of its 2006 Plan, Glori has recorded all share based payment expenses in accordance with the provisions of ASC 718, Compensation- Stock Compensation. The following table summarizes the stock options granted in 2012, 2013, and 2014 with their exercise prices and the fair value of the underlying common stock per share.
Date of Issuance | Number of Options | Exercise Price per Share | Fair Value per Underlying Share | ||||||
January 3, 2012 | 101,478 | 1.16 | 1.16 | ||||||
January 24, 2012 | 4,000 | 1.16 | 1.16 | ||||||
February 10, 2012 | 307,500 | 1.16 | 1.16 | ||||||
March 19, 2012 | 300,000 | 1.16 | 1.16 | ||||||
September 26, 2012 | 160,000 | 1.16 | 1.16 | ||||||
June 4, 2013 | 1,397,494 | 1.16 | 1.16 | ||||||
June 10, 2013 | 20,000 | 1.16 | 1.16 | ||||||
June 17, 2013 | 40,000 | 1.16 | 1.16 | ||||||
June 19, 2013 | 192,500 | 1.16 | 1.16 | ||||||
July 3, 2013 | 10,000 | 1.16 | 1.16 | ||||||
July 29, 2013 | 10,000 | 1.16 | 1.16 | ||||||
August 29, 2013 | 10,000 | 1.16 | 1.16 | ||||||
November 1, 2013 | 3,000 | 1.16 | 1.16 | ||||||
November 25, 2013 | 150,000 | 1.16 | 1.16 | ||||||
December 2, 2013 | 50,000 | 1.16 | 1.16 | ||||||
December 16, 2013 | 767,179 | 1.16 | 1.16 | ||||||
January 1, 2014 | 7,103 | 1.16 | 1.16 | ||||||
In the absence of a public market for Glori common stock, prior to April 14, 2014, Glori engaged a third-party valuation advisor to provide a valuation of its stock. Glori’s board of directors considered the October 31, 2011 valuation in making its fair value determination as of October 31, 2011. This valuation resulted in a $1.15 fair value per common share. Glori’s board of directors continued to utilize the October 31, 2011 common stock valuation to establish the exercise price for the stock options granted from December 26, 2011 through December 31, 2012, as it was the most recent valuation of Glori common stock, and Glori’s board of directors determined that no material developments had occurred in its business to change that valuation materially.
As of January 1, 2013, Glori’s board of directors determined that there have been material developments in its business and, accordingly, engaged the same third-party valuation advisor that provided the 2011 valuation to provide a valuation of Glori common stock as of January 1, 2013. The valuation resulted in a fair value per common share of $0.40. Based on the valuation, Glori’s board of directors set the exercise price of the options equal to the fair value of the common shares at $0.40. With the new lower exercise price fair value the compensation committee of the board of directors elected to reprice the previously issued 2012 options with an exercise price of $1.15. The reduction in exercise price affected 1.8 million options, and the repricing adjustment resulted in expense of approximately $47,000 recognized in June 2013.
As a result of the Merger, which consummated on April 14, 2014, the issued and outstanding stock options were canceled and reissued as stock options in the newly merged entity at a conversion ratio of 2.9 pre-Merger entity stock options to 1 post-Merger stock option. The exercise price of the Glori stock options shown above also increased by the same factor of 2.9, from $0.40 to $1.16.
Glori recognizes expense for stock-based compensation using the calculated fair value of options on the grant date of the awards. Glori does not issue fractional shares nor pay cash in lieu of fractional shares and currently does not have any awards accounted for as a liability.
Glori’s policy is to recognize compensation expense for service-based awards on a straight-line basis over the requisite service period for the entire award. Stock-based compensation expense is based on awards ultimately expected to vest.
32
The fair value of each option award was estimated on the grant date using a Black-Scholes option valuation model, which uses certain assumptions as of the date of grant:
Risk-free interest rate — risk-free rate, for periods within the contractual terms of the options, is based on the U.S. Treasury yield curve in effect at the time of grant;
Expected volatility — based on peer group price volatility for periods equivalent to the expected term of the options;
Expected dividend yield — expected dividends based on Glori’s expected dividend rate at the date of grant;
Expected life (in years) — expected life adjusted based on management’s best estimate for the effects of non-transferability, exercise restriction and behavioral considerations; and
Expected forfeiture rate — expected forfeiture rate based on historical and expected employee turnover.
Glory Energy has computed the fair value of all options granted during the years ended December 31, 2012, 2013, and 2014 using the following assumptions:
2012 | 2013 | 2014 | |||
Risk-free interest rate | 0.87% | 2.23% | 2.44% | ||
Expected volatility | 89% | 55% | 55% | ||
Expected dividend yield | — | — | — | ||
Expected life (in years) | 4.47 | 7.09 | 7.00 | ||
Expected forfeiture rate | — | — | — | ||
Taxes. Glori accounts for income taxes using the asset and liability method wherein deferred tax assets and liabilities are recognized for the future tax consequences attributable to temporary differences between the financial statement carrying amounts of existing assets and liabilities and their respective tax bases and to net operating loss carry forwards, measured by enacted tax rates for years in which taxes are expected to be paid, recovered or settled. A valuation allowance is established to reduce deferred tax assets if, based on the weight of available evidence, it is more likely than not that some portion or all of the deferred tax assets will not be realized. As of December 31, 2014, Glori has a total valuation allowance of $19.5 million.
Glori follows ASC 740, Income Taxes (ASC 740), which creates a single model to address accounting for the uncertainty in income tax positions and prescribes a minimum recognition threshold a tax position must meet before recognition in the consolidated financial statements. As of December 31, 2013, the Company had an uncertain tax position related to not filing Form 926 Return by a U.S. Transferor of Property to a Foreign Corporation in the amount of approximately $31,000, for the tax year 2011. This form would have reported cash transfers to support the operations of its subsidiary Glori Oil S.R.L. The Company has amended this return and believes any liability will be abated and no longer has an uncertain tax position; accordingly, the Company has not recognized any liability in the accompanying consolidated financial statements. The Company does not expect a material change to the consolidated financial statements related to uncertain tax positions in the next 12 months. The Company recognizes interest and penalties accrued related to unrecognized tax benefits in income tax expense.
Glori’s ability to use its net operating loss carryforwards to offset future taxable income may be subject to certain limitations. In general, under Section 382 of the U.S. Internal Revenue Code of 1986, as amended, a corporation that undergoes an “ownership change” is subject to limitations on its ability to utilize its pre-change net operating loss carryforwards, or NOLs, to offset future taxable income. Glori believes that its issuance of series B preferred stock on October 15, 2009 resulted in a Section 382 ownership change limitation. Glori estimates that approximately $5.4 million of Glori’s $51.9 million NOLs as of December 31, 2014 will expire unused due to Section 382 ownership change limitations. Future changes in Glori’s stock ownership, some of which are outside of its control, could result in an ownership change under Section 382 of the Internal Revenue Code. Furthermore, Glori’s ability to utilize NOLs of companies that it may acquire in the future may be subject to limitations.
33
Recently Issued Accounting Pronouncements
In May 2014, the Financial Accounting Standards Board (FASB) and the International Accounting Standards Board (IASB) issued a comprehensive new revenue recognition standard that will supersede existing revenue recognition guidance under United States generally accepted accounting principles (U.S. GAAP) and International Financial Reporting Standards (IFRS). The issuance of this guidance completes the joint effort by the FASB and the IASB to improve financial reporting by creating common revenue recognition guidance for U.S. GAAP and IFRS.
The core principle of the new guidance is that a company should recognize revenue to depict the transfer of promised goods or services to customers in an amount that reflects the consideration to which the company expects to be entitled in exchange for those goods or services. The standard creates a five-step model that requires companies to exercise judgment when considering the terms of a contract and all relevant facts and circumstances. The standard allows for several transition methods: (a) a full retrospective adoption in which the standard is applied to all of the periods presented, or (b) a modified retrospective adoption in which the standard is applied only to the most current period presented in the financial statements, including additional disclosures of the standard’s application impact to individual financial statement line items.This standard is effective for annual reporting periods beginning after December 15, 2016, including interim periods within that reporting period. We are currently evaluating this standard and the impact it will have on our future revenue recognition policies.
34
Historical Results of Operations for Glori
The following table sets forth selected financial data for the periods indicated (in thousands):
Year ended December 31, | |||||||||||
2012 | 2013 | 2014 | |||||||||
Revenues: | |||||||||||
Oil and gas revenues | $ | 463 | $ | 576 | $ | 11,724 | |||||
Service revenues | 1,718 | 2,643 | 4,135 | ||||||||
Total revenues | 2,181 | 3,219 | 15,859 | ||||||||
Operating expenses: | |||||||||||
Oil and gas operations | 1,768 | 2,211 | 10,777 | ||||||||
Service operations | 2,115 | 2,281 | 3,528 | ||||||||
Science and technology | 1,459 | 1,682 | 1,868 | ||||||||
Selling, general and administrative | 3,411 | 4,279 | 5,920 | ||||||||
Write-off of deferred offering costs | 1,492 | 126 | — | ||||||||
Impairment of oil and gas properties | — | 2,190 | 13,160 | ||||||||
Depreciation, depletion and amortization | 578 | 622 | 4,624 | ||||||||
Total operating expenses | 10,823 | 13,391 | 39,877 | ||||||||
Loss from operations | (8,642 | ) | (10,172 | ) | (24,018 | ) | |||||
Other (expense) income: | |||||||||||
Interest expense | (480 | ) | (959 | ) | (3,023 | ) | |||||
(Loss) gain on change in fair value of warrants | (506 | ) | 592 | 2,454 | |||||||
Gain on commodity derivatives | — | — | 6,023 | ||||||||
Loss on change in fair value of derivative liability | (2,317 | ) | — | — | |||||||
Other income (expense) | 5 | (70 | ) | 17 | |||||||
Total other (expense) income, net | (3,298 | ) | (437 | ) | 5,471 | ||||||
Net loss before taxes on income | (11,940 | ) | (10,609 | ) | (18,547 | ) | |||||
Income tax expense | — | — | 209 | ||||||||
Net loss | $ | (11,940 | ) | $ | (10,609 | ) | $ | (18,756 | ) | ||
35
The following table sets forth selected production data for the periods indicated:
Year Ended December 31, | |||||||||||
2012 | 2013 | 2014 | |||||||||
Revenues (in thousands): | |||||||||||
Oil revenues | $ | 463 | $ | 576 | $ | 11,549 | |||||
Natural gas revenues | — | — | 175 | ||||||||
Total revenues | $ | 463 | $ | 576 | $ | 11,724 | |||||
Volumes: | |||||||||||
Oil Volumes (MBbls) | 5 | 6 | 133 | ||||||||
Gas Volumes (MMcf) | — | — | 72 | ||||||||
Gas Volumes (MBoe) | — | — | 12 | ||||||||
Total Volumes (MBoe) | 5 | 6 | 145 | ||||||||
Price: | |||||||||||
Average oil price per Bbl | $ | 87 | $ | 92 | $ | 87 | |||||
Average gas price per Mcf | — | — | $2.43 | ||||||||
The following table details oil and gas operations expense for the periods indicated (in thousands):
Year Ended December 31, | |||||||||||
2012 | 2013 | 2014 | |||||||||
Lease operating expense | $ | 513 | $ | 433 | $ | 6,631 | |||||
Ad valorem taxes | 15 | 42 | 438 | ||||||||
Severance taxes | 21 | 26 | 547 | ||||||||
Acquisition expenses | 73 | 145 | 503 | ||||||||
Oil and gas overhead expense | 1,146 | 1,565 | 2,658 | ||||||||
Oil and gas operations expense | $ | 1,768 | $ | 2,211 | $ | 10,777 | |||||
Years ended December 31, 2013 and 2014
Oil and gas revenues. Oil and gas revenues increased by $11.1 million from $576 thousand in 2013 to $11.7 million in 2014. The increase was attributable to the purchase of the Coke Field Assets which closed on March 14, 2014 and resulted in the inclusion of an additional $11.1 million of oil and gas revenues.
Service revenues. Service revenues increased by $1.5 million, or 56%, from $2.6 million in 2013 to $4.1 million in 2014. The increase in revenues was attributable to increases of $823 thousand in Analysis Phase services and $660 thousand in Field Deployment Phase services. The increase in Analysis Phase revenues was due to revenues for eleven projects that were completed during 2014 compared to six projects in 2013. The increase in Field Deployment Phase revenues was primarily due to a large Canadian project that progressed into the Field Deployment Phase in December 2013 and was ongoing throughout 2014.
Oil and gas operations. Oil and gas operating expense increased by $8.6 million from $2.2 million in 2013 to $10.8 million in 2014. The increase was mainly attributable to the acquisition of the Coke Field Assets which was completed on March 14, 2014 and resulted in an additional $6.2 million in lease operating expenses, $396 thousand in ad valorem taxes and $521 thousand in severance taxes. There was an additional $358 thousand in transactional costs associated with the Coke Field acquisition, including third party due diligence costs. Oil and gas overhead charges increased $365 thousand in 2014 for employee compensation and recruiting expenses due to additional professional and technical personnel. Consulting fees increased $613 thousand in 2014, mainly due to payments to a third party consultant who located a new purchaser for Coke Field oil production, which resulted in a higher realized price per barrel than that received from the previous purchaser.
Service operations. Service operations expense increased by $1.2 million, or 54.7%, from $2.3 million in 2013 to $3.5 million in 2014. A majority of the increase, totaling $698 thousand, is attributable to increased nutrient and trucking costs related to a project in Canada in 2014.
36
We also incurred additional costs of $273 thousand related to contract labor in preparation for a project in Brazil which commenced in the third quarter of 2014. The remainder of the increase is attributable to added personnel in 2014 and an increase in allocated rent expense.
Science and technology. Science and technology expenses increased by $186 thousand from $1.7 million in 2013 to $1.9 million in 2014 mostly due to increases in expenses for employee compensation due to added personnel and an increase in lab supplies.
Selling, general and administrative. SG&A expenses increased by $1.6 million, or 38.4%, from $4.3 million in 2013 to $5.9 million in 2014. The majority of the increase of approximately $1.5 million, was due to the legal, accounting and other professional fees that were incurred in connection with the Merger, the acquisition of the Coke Field Assets, and the required nonrecurring regulatory filings associated with being a new public company, such as Forms S-4, S-8, S-3, and 20-F.
Impairment of oil and gas properties. During the fourth quarter of 2014, due to the significant decline in oil prices, we recognized an estimated $12.7 million impairment loss on our Coke Field Assets, acquired March 2014. As of year-end 2014, we had not yet implemented our AERO technology at the Coke Field. We also recognized a full impairment charge of approximately $450 thousand for our Etzold Field property, which was originally purchased in 2010 in exchange for nominal consideration and served as a field laboratory for our AERO technology. During 2013, Glori wrote off $2.2 million of the Etzold Field property due to a decline in proved reserves as of December 31, 2013, resulting from an internal decision to cease capital expenditures required to develop such reserves based on preliminary results.
Depreciation, depletion and amortization. DD&A increased by $4.0 million from $622 thousand in 2013 to $4.6 million in 2014. The increase was principally due to an increase in depletion expense of $3.8 million related to the acquisition of the Coke Field Assets in March 2014. Additionally as a result of the Coke Field acquisition, accretion of the asset retirement obligation increased $122 thousand and depreciation increased $97 thousand in the 2014 compared to 2013.
Total other (expense) income, net. Total other (expense) income, net increased by $5.9 million from expense of $437 thousand in 2013 to income of $5.5 million in 2014. Our commodity swaps that were entered into in connection with the acquisition of the Coke Field Assets in 2014 resulted in income of $6.0 million, of which $5.8 million was an unrealized gain and $227 thousand a realized gain. We also incurred a gain on change in fair value of warrant liabilities of $2.5 million in 2014, an increase of $1.9 million over 2013, due to a first quarter decrease in the fair valuation of the warrants. These increases in other income were partially offset by an increase in interest expense of $2.1 million due to the acquisition financing incurred in connection with the Coke Field Assets.
Year ended December 31, 2012 and 2013
Oil and gas revenues. Oil and gas revenues increased by $113 thousand from $463 thousand in 2012 to $576 thousand in 2013. The increase in oil sales was due to an increase in production and prices in 2013.
Service revenues. Service revenues increased by $925 thousand, or 54%, from $1.7 million in 2012 to $2.6 million in 2013. The increase was primarily attributable to an increase in Field Deployment Phase revenues of $1.5 million. The increase was partially offset by a decrease of $574 thousand in Analysis Phase revenues. The Field Deployment Phase increase was driven by two additional projects in Texas during 2013 and the commencement of a project in late 2012 whereby the majority of revenues were recognized in 2013, and three additional projects in Canada during 2013. The $574 thousand decrease in Analysis Phase revenues was primarily due to the completion of the Analysis Phase for three Canadian projects in 2013.
Oil and gas operations. Oil and gas operating expense increased by $443 thousand from $1.8 million in 2012 to $2.2 million in 2013. The overall increase was caused by an increase of $438 thousand due to additional corporate personnel required for upcoming oil production and acquisition activities.
Service operations. Service operations expense increased $166 thousand from $2.1 million in 2012 to $2.3 million in 2013. The increase was driven by a $212 thousand increase in our Canadian field service expenses as a result of three additional projects in 2013 and a $218 thousand increase due to commencement of operations in Brazil, offset in part by a $211 thousand decrease in California operations due to water treatment expenses on a single project in 2012 that were not incurred in 2013.
Science and technology. Science and technology expenses increased by $223 thousand, or 15%, from $1.5 million in 2012 to $1.7 million in 2013. The overall increase was attributable to an increase of $116 thousand in compensation expenses as a result of increased staffing requirements, an increase in intellectual property related legal expenses of $93 thousand, and a $79 thousand increase in expenses for laboratory supplies as a result of increased project activity. The noted increases in expenses were offset by a decline in expenses of $59 thousand due to the conclusion of field trials for a particular customer.
37
Selling, general and administrative. Selling, general and administrative expenses increased by $868 thousand, or 25%, from $3.4 million in 2012 to $4.3 million in 2013. The increase was caused by a number of factors including an increase in compensation expense of $775 thousand, due primarily to increased stock based compensation expense and a full year’s compensation for an employee added in mid-2012, an increase of $47 thousand related to consulting services associated with developing AERO services projects in Russia, and an increase of $130 thousand in accounting and legal fees, partially offset by a $122 thousand decrease in promotional spending by the business development department during 2013.
Write-off of deferred offering costs. During 2012, Glori wrote off $1.5 million in deferred offering costs accumulated during the Company’s IPO efforts in 2011 and 2012. The IPO efforts were withdrawn due to unfavorable market conditions. During 2013, Glori wrote off $126 thousand in deferred offering costs related to an additional C-1 preferred stock offering that was withdrawn in the fourth quarter as Glori management focused efforts towards the proposed Merger with Infinity Cross Border Acquisition Corporation.
Impairment of oil and gas properties. During 2013, Glori wrote off $2.2 million of the Company’s oil and gas property, the Etzold Field. The property was originally procured in exchange for nominal consideration and served as field laboratory for our AERO technology. The write-off was the result of a decline in proved reserves as of December 31, 2013. The revision in reserves was due to Glori’s decision not to spend the additional capital required to develop such reserves based on expected results.
Depreciation, depletion and amortization. Depreciation, depletion and amortization increased by $44 thousand or 8%, from $578 thousand in 2012 to $622 thousand in 2013. The increase was attributable to an increase in depletion expense of $74 thousand resulting from greater production on the Etzold property and from a reduction in the proved reserves estimates originated from Glori’s third party reserve report. This increase was partially offset by a decrease in depreciation of $30 thousand as many of the Glori’s initial asset investments became fully depreciated in 2012.
Total other (expense) income, net. Total other expense, net decreased $2.9 million from an expense of $3.3 million in 2012 to $437 thousand in 2013. The loss on change in fair value of the derivative liabilities decreased $2.3 million when compared to 2012 due to a 2012 increase in the fair value of the derivatives. In April 2013, Glori's Board of Directors removed the condition that created the embedded derivative and as a result there was no change in the fair value of derivative in 2013. The previously recorded fair value of the derivative was treated as a capital contribution and removed from the balance sheet during 2013. In 2013, there was a gain of $592 thousand recognized for the change in the fair value of the warrant liabilities due to a decrease in valuation, compared to a loss of $506 thousand in 2012. The $1.1 million decrease in expense when comparing 2013 to 2012 changes in fair value of the warrant liabilities was the result of a decrease in assumed proceeds of anticipated liquidity events for the ensuing 3 year period. Interest expense increased $479 thousand from $480 thousand in 2012 to $959 thousand in 2013. The increase resulted primarily from the full commitment indebtedness to Hercules outstanding for the entirety of 2013 but only the second half of 2012.
Liquidity and Capital Resources
Our primary sources of liquidity and capital since our formation have been proceeds from equity issuances and borrowings. To date, our primary use of capital has been to fund acquisitions, principally the purchase of the Coke Field Assets, fund our operations and repayment of debt. During 2014, we received approximately $38.4 million in proceeds related to the Merger and private placement of common stock. We also issued C-2 Preferred Stock and C-2 Preferred Warrants (which were subsequently exchanged for common stock in the newly merged entity) for an additional $5.0 million in net proceeds and we received $4.2 million from the exercise of warrants. During the period, we also borrowed $24.0 million which was used to partially finance the purchase of the Coke Field Assets, a producing oil field in Wood County, Texas from Petro-Hunt for $38.0 million and a $2.0 million convertible note payable.
At December 31, 2014, we had working capital of $26.2 million, made up of current assets of $34.3 million and current liabilities of $8.0 million. The current asset balance is comprised of cash and cash equivalents of $29.8 million, accounts receivable of $1.4 million, prepaid expenses and other current assets of $244 thousand and commodity derivative contracts receivable of $2.9 million. Included in current liabilities is $2.3 million in accounts payable, $653 thousand in deferred revenues, $1.8 million in accrued expenses, $2.4 million in current portion of long-term debt, and a deferred tax liability of $970 thousand.
At December 31, 2013, we had working capital of $15.1 million, made up of current assets of $21.3 million and current liabilities of $6.2 million. The current asset balance includes cash and cash equivalents of $20.9 million, accounts receivable of $307 thousand, prepaid and other current assets of $71 thousand and inventory of $24 thousand.
38
Included in current liabilities is $534 thousand in accounts payable, $1.8 million in deferred revenues, $417 thousand in accrued expenses and $3.5 million in current portion of long-term debt.
During 2014, we received cash proceeds which significantly increased our cash balance and thus our working capital position. On April 14, 2014 we completed the Merger with Infinity Corp. and certain of its affiliates. The Merger resulted in net cash proceeds to us of approximately $24.7 million and approximately $13.7 million in additional cash from the private placement of 1,722,482 shares of common stock at $8.00 per share from Infinity Group, Hicks Equity Partners LLC and other investors. All of the previously outstanding common shares, preferred shares and warrants were exchanged for 23,584,557 common shares in the newly merged entity. Additionally, on April 14, 2014, the Petro-Hunt convertible note, also included in current liabilities for $2.0 million, was converted to 250,000 common shares.
During the next twelve months, we expect our principal sources of liquidity to be from cash on hand, new credit facilities to be used for financing future potential oil property acquisitions and cash flows from operating activities. If we are successful in acquiring additional oil properties, the associated debt facilities will be based on the value of the oil and gas reserves acquired and secured by the respective assets. We expect these sources of liquidity will enable us to fund our capital expenditures and working capital needs for the next twelve months.
We intend to pursue additional acquisitions of producing oil assets on which to deploy the AERO System. Planned capital expenditures for the next twelve months consist of approximately $3.0 million for further Coke Field development and implementation of our AERO System technology and approximately $300 thousand for field equipment for our AERO System service for customers and for our research and development laboratory in Houston, Texas. As of December 31, 2014, we did not have any commitments for the acquisition of oil properties or any other significant capital commitments.
Revenues and cash flows from the Coke Field Assets will, in the near-term, represent the majority of our cash from operating activities until we complete other acquisitions of oil producing assets or experience significant growth in our services revenues. Operating cash flow from the Coke Field Assets, after direct operating expenses and related overhead costs, will principally be dedicated to servicing acquisition-related debt and capital expenditures. Such operating cash flow will be influenced by a number of factors such as oil production rates, oil prices and operating expenses. While we have entered into hedges for a portion of our oil production, variability in operating cash flow may require us to pursue additional resources to fund future capital expenditures and service associated debt.
The price of oil declined 36% during the fourth quarter of 2014 based on the Cushing, Oklahoma - West Texas Intermediate monthly average spot prices of $93.21 per barrel in September 2014 and $59.29 in December 2014. Subsequent to December 2014, the oil prices decreased further to approximately $50 per barrel in February 2015. A sustained lower oil price through March 2015 will negatively impact first quarter oil revenues and profitability from the Coke Field Assets, which will be partially offset by other income realized from oil price swap settlements. Using an estimated average oil price of $50 per barrel and assuming fourth quarter volumes, oil and gas revenues would have decreased from $3.2 million as reported in the fourth quarter to $2.3 million, and the realized gain on monthly oil swap settlements would have increased from $630 thousand in the fourth quarter to $1.1 million.
Future cash requirements and the requirement for new financing will be dependent primarily upon our success in generating additional acquisition opportunities and the related capital expenditures. Although we believe that we will have sufficient liquidity and capital resources to meet our operating requirements, we may pursue additional opportunities which could require additional debt or equity financing. If we are not successful in securing such additional financing on favorable terms, our ability to achieve our desired level of revenues growth could be materially adversely affected.
The following table sets forth the major sources and uses of cash for the periods presented (in thousands):
Years Ended December 31, | |||||||||||
2012 | 2013 | 2014 | |||||||||
Net cash used in operating activities | $ | (6,867 | ) | $ | (6,553 | ) | $ | (8,186 | ) | ||
Net cash used in investing activities | (2,332 | ) | (530 | ) | (42,362 | ) | |||||
Net cash provided by financing activities | 19,060 | 9,243 | 59,432 | ||||||||
39
Operating Activities
During 2014, our operating activities used $8.2 million in cash. Our net loss for 2014 was $18.8 million. Non-cash items totaled an expense of $10.4 million, consisting of $4.6 million of depreciation, depletion and amortization, $13.2 million impairment of our oil and gas properties, $296 thousand for stock based compensation expense, $439 thousand for amortization of deferred loan costs and other non-cash expenses totaling $163 thousand. These non-cash expenses were partially offset by a $2.5 million gain on the change in fair value of the warrant liabilities and a $5.8 million gain on the change in fair value of the commodity price swap. Changes in operating assets and liabilities increased net cash by $138 thousand for the period. The cash increase from changes in operating assets and liabilities was caused by an increase in accounts payable of $1.3 million, an increase of accrued expenses of $1.1 million and a decrease in inventory of $22 thousand. These sources of cash were partially offset by uses of cash by an increase in accounts receivable of $1.1 million, an increase in prepaid expenses of $171 thousand, and a decrease in deferred revenues of $1.1 million. The increases in accounts receivable is primarily due to a $900 thousand receivable from December oil production on the Coke Field and a $293 thousand receivable for the December commodity swap settlement. Accounts payable and accrued payables also increased over the prior year as a result of increased operating expenses due to the addition of the Coke Field and accrued compensation at year end 2014. Deferred revenues decreased in 2014 as we commenced the Field Deployment Phase of our project in Brazil.
During 2013, our operating activities used $6.6 million in cash. Our net loss for 2013 was $10.6 million. Non-cash items totaled an expense of $3.5 million, consisting of $622 thousand of depreciation, depletion and amortization, $2.2 million impairment of our oil and gas property, $774 thousand for stock based compensation expense, $156 thousand of amortization of deferred loan costs and other and various other non-cash expenses totaling $394 thousand. These non-cash expenses were partially offset by a $592 thousand gain on the change in fair value of warrant liabilities. Changes in operating assets and liabilities increased net cash by $512 thousand for the period. The cash increase from changes in operating assets and liabilities was caused by a decrease in prepaid expenses of $51 thousand, a decrease in inventory of $21 thousand and an increase in deferred revenues of $758 thousand. These sources of cash were partially offset by uses of cash through an increase in accounts receivable of $156 thousand, a decrease in accounts payable of $125 thousand and a decrease of accrued expenses of $37 thousand. The increase in deferred revenue resulted from the commencement of new projects for which revenue could not yet be recognized.
During 2012, our operating activities used $6.9 million in cash. Our net loss for 2012 was $11.9 million. Non-cash items totaled an expense of $5.3 million, consisting of a loss on the change in fair value of the derivative liabilities of $2.3 million, a net write-off of deferred offering costs of $1.5 million, depreciation, depletion and amortization charges of $578 thousand, a loss on the change in fair value of the warrant liability of $506 thousand, stock-based compensation expense of $291 thousand and $139 thousand for various other non-cash expenses. Changes in operating assets and liabilities decreased net cash by $250 thousand for the period. The cash decrease from changes in operating assets and liabilities was caused by an increase of prepaid expenses of $106 thousand, an increase of inventory of $7 thousand and a decrease in accounts payable of $761 thousand. These uses of cash were partially offset by sources of cash through a decrease in accounts receivable of $141 thousand, an increase in deferred revenues of $362 thousand and an increase in accrued expenses of $121 thousand. The increase in deferred revenues relates to additional contracts entered into by the Company which contain multiple deliverable elements and require deferred recognition accounting treatment. The decrease in accounts payable and accrued expenses resulted from the payment of various costs related to legal and accounting fees which had accumulated as of December 31, 2011.
Our future cash flow from operations will depend on many factors including our ability to acquire oil fields, successfully deploy our AERO System technology on such oil fields and oil prices. Other variables affecting our cash flow from operations are the adoption rate of our technology and the demand for our services, which is also impacted by the level of oil prices and the capital expenditure budgets of our customers and potential customers.
Investing Activities
Our capital expenditures were $42.4 million in 2014, compared to $530 thousand and $2.3 million in 2013 and 2012, respectively. Capital expenditures for 2014 consisted primarily of the purchase of the Coke Field Assets in March of 2014 for $40 million and $1.0 million of capital expenditures related to the construction of skid mounted injection equipment used in the AERO Field Deployment Phase process. Capital expenditures for 2013 consisted primarily of $445 thousand for the construction of skid mounted injection equipment used in the AERO System process. Capital expenditures for 2012 consisted primarily of expenditures in connection with redeveloping our Etzold Field property for $1.4 million and the construction of skid-mounted injection equipment used in the AERO process totaling $736 thousand.
40
Financing Activities
During 2014, cash provided by financing activities was $59.4 million consisting primarily of gross cash proceeds received in the Merger and private placement of common stock of $38.4 million and new credit facilities totaling $24.0 million which were used to fund a portion of the Coke Field acquisition. The new borrowings mainly consisted of an $18.0 million senior secured term loan facility, a $4.0 million subordinated debt and a $2.0 million convertible note to the seller, Petro-Hunt L.L.C. ("Petro-Hunt"). Additionally $5.0 million was received from the first quarter issuance of C-2 preferred shares and warrants which were subsequently exchanged for common stock in the Merger during the second quarter of 2014 and $4.2 million was received from the exercise of warrants and stock options during the period. Cash generated from financing activities during 2014 was partially offset by principal payments on long-term debt of $8.1 million, payments for deferred offering costs of $3.3 million and payments for deferred loan costs of $767 thousand. The deferred offering costs represent primarily legal expense payments related to the Merger and the deferred loan costs payments represent financing fees and legal expenses associated with the new $18.0 million senior secured term loan facility and the $4.0 million subordinated debt facility.
On January 8, 2014, we executed the merger and share exchange agreement with Infinity Corp. On April 14, 2014, the Merger was consummated. Pursuant to the terms of the Merger, in exchange for our outstanding shares and warrants, Infinity Corp. issued 23,584,557 shares of common stock on a pro rata basis to the stockholders and warrant holders of Glori Energy. We obtained effective control of Infinity Corp. subsequent to the Merger and thus the Merger was accounted as a reverse acquisition and recapitalization of the Company. Our shareholders retained a substantial majority of voting interest and positions on the Board of Directors, our management was retained and our operations continue to comprise the ongoing operations post-Merger. We received a total of $24.7 million in cash from the Merger and $13.7 million cash from the private placement in public equity, the "PIPE" investments for total proceeds of $38.4 million.
The $18 million note issued on March 14, 2014 is a three year senior secured term loan facility, issued by Glori Energy Production, secured by the Coke Field Assets, and bears interest at 11.0% per annum. The credit agreement requires quarterly principal payments equal to 50% of the excess cash flow, as defined therein, from the Coke Field Assets during the first year and 75% of excess cash flow thereafter subject to a minimum quarterly principal payment of $112,500 plus interest. The credit agreement also requires Glori Energy Production Inc. to enter into price swaps covering approximately 75% of its oil production for projected proved developed production. In May and November of each year, in accordance with a procedure outlined in the credit agreement, the value of the collateral securing the note is redetermined based on engineering reserve reports submitted by Glori Energy Production. Dependent on the results of such redetermination, Glori Energy Production may be required to make additional principal payments on the loan. The $4 million note issued on March 14, 2014 is a two year subordinated secured term note bearing interest at 12.0% per annum and is secured by the assets of GETI, but subordinated to existing GETI debt. As a condition of this financing, the lender of our term debt in the original amount of $8 million as described in NOTE 9 of the Consolidated Financial Statements, amended certain covenants which had restricted the incurrence of additional debt, liens and capital expenditures. The $4.0 million note principal and $400 thousand prepayment penalty plus accrued interest was paid in full on May 13, 2014.
In addition to the debt, effective March 13, 2014, we issued to certain of our current investors 1,842,028 Series C-2 Preferred Stock and 1,640,924 Series C-2 preferred share warrants for gross proceeds of $5 million. The proceeds were allocated $2.8 million to the preferred shares and $2.3 million to the preferred warrants, based upon our most recent company valuation at the time of issuance. On April 14, 2014, these preferred shares and warrants were exchanged for 1,133,869 shares of common stock in the Merger. On April 14, 2014 Petro-Hunt converted their $2 million convertible note from us to common shares at $8.00 per share or 250,000 shares of common stock, pursuant to certain rights arising in connection with the PIPE Investment.
During 2013, cash provided by financing activities was $9.2 million, primarily due to the net proceeds of $12.1 million from a bundled sale transaction consisting of 4,462,968 shares of C-1 preferred stock, 6,337,494 shares of C preferred warrants and 3,975,718 shares of C-1 preferred warrants, which were subsequently exchanged for 2,956,812 shares in the Merger. Glori also received $18 thousand in proceeds from the issuance of common stock during the period. These financing activity inflows were partially offset by principal payments of $2.7 million primarily related to the monthly payments on Glori’s $8 million secured term promissory note which began in April 2013 and deferred offering cost payments made of $163 thousand primarily related to the C-1 financing transaction.
During 2012, cash provided by financing activities was $19.1 million, primarily due to the issuance of series C preferred stock for $11.8 million in proceeds. Glori also received $7.6 million in net proceeds from the issuance of the Hercules note, a secured promissory note, in mid-2012. In addition to the note proceeds, Glori received $195 thousand from Hercules in exchange for a warrant. These proceeds were partially offset by payments of $534 thousand made in 2012 for deferred offering costs.
41
Off-Balance Sheet Arrangements
We do not have any off-balance sheet arrangements, except for operating lease obligations presented in the table below.
Contractual Obligations and Commercial Commitments
At December 31, 2014, we had contractual obligations and commercial commitments as follows (in thousands):
Payments Due By Period | ||||||||||||||||||||
Less Than | More Than | |||||||||||||||||||
Contractual Obligations | Total | 1 Year | 1-3 Years | 3-5 Years | 5 Years | |||||||||||||||
Operating lease obligations(1) | $ | 703 | $ | 355 | $ | 348 | $ | — | $ | — | ||||||||||
Asset retirement obligation(2) | 1,329 | — | 287 | 655 | 387 | |||||||||||||||
Long-term debt(3) | 24,200 | 4,642 | 19,558 | — | — | |||||||||||||||
Total | $ | 26,232 | $ | 4,997 | $ | 20,193 | $ | 655 | $ | 387 | ||||||||||
(1) | Our commitments for operating leases primarily relate to the leases of office and warehouse facilities in Houston, Texas and warehouse facilities in Gull Lake, Saskatchewan. |
(2) | Relates to our oil properties, net of accretion. |
(3) | Includes expected future interest payments. |
Item 7A. Quantitative and Qualitative Disclosures About Market Risk
Commodities Risk
Our major commodity price risk exposure is to the prices received for our oil production. Our results of operations and operating cash flows are affected by changes in market prices. Realized commodity prices received for our production are the spot prices applicable to oil in the region produced. Prices received for oil, condensate, and natural gas are volatile and unpredictable and are beyond our control. To mitigate a portion of the exposure to adverse market changes, we have entered into derivative instruments. For the year ended December 31, 2014, a 10% change in the prices received for oil, condensate, and natural gas production would have had an approximate $1.2 million impact on our revenues prior to commodity derivatives which mitigate our commodity pricing risk. See NOTE 8 in the Notes to the Consolidated Financial Statements in Part I, Item 1 of this report for additional information regarding our commodity derivative activities. Oil prices have decreased beyond 10% of our average 2014 price realization per barrel of oil equivalent as of December 31, 2014; see Item 7. Management's Discussion and Analysis of Financial Condition and Results of Operations - Liquidity and Capital Resources for further discussion on commodity price volatility.
Interest Rate Risk
Our floating rate loan facilities expose us to interest rate risk. Our two major credit facilities outstanding are based on interest at a floating rates that are subject to increase based upon certain increases in the prime rate or LIBOR. Therefore upward fluctuations in interest rates expose us to additional interest payments. As of December 31, 2014, our total long-term debt was $19.2 million. An increase of 100 basis points in both the prime and LIBOR interest rate would have exposed us to an additional $172,000 of interest during 2014.
SPECIAL NOTE REGARDING FORWARD-LOOKING STATEMENTS
This Annual Report on Form 10-K contains forward-looking statements. Forward-looking statements provide our current expectations or forecasts of future events. Forward-looking statements include statements about our expectations, beliefs, plans, objectives, intentions, assumptions and other statements that are not historical facts. Words or phrases such as “anticipate,” “believe,” “continue,” “estimate,” “expect,” “intend,” “may,” “ongoing,” “plan,” “potential,” “predict,” “project,” “will” or similar words or phrases, or the negatives of those words or phrases, may identify forward-looking statements, but the absence of these words does not necessarily mean that a statement is not forward-looking. Examples of forward-looking statements in this Annual Report on Form 10-K include, but are not limited to, statements regarding our disclosure concerning Glori's proposed operations, cash flows, and financial position.
42
MARKET, INDUSTRY AND OTHER DATA
Unless otherwise indicated, information contained in this Annual Report on Form 10-K concerning Glori’s industry and the markets in which Glori operates, including its general expectations and market position, market opportunity and market size, is based on information from various sources, on assumptions that it has made that are based on that information and other similar sources and on Glori’s knowledge of the markets for its services. That information involves a number of assumptions and limitations, and you are cautioned not to give undue weight to such estimates. While Glori believes that information from third-party sources used in this Annual Report on Form 10-K is generally reliable, it has not independently verified the accuracy or completeness of this information. In addition, projections, assumptions and estimates of Glori’s future performance and the future performance of the industry in which Glori operates are necessarily subject to a high degree of uncertainty and risk due to a variety of factors, including those described in “Risk Factors” and elsewhere in this Annual Report on Form 10-K. These and other factors could cause results to differ materially from those expressed in the estimates made by the independent parties and by Glori.
Item 8. Financial Statements and Supplementary Data
The financial statements and supplementary financial information required to be filed under this Item 8 are presented in Part IV, Item 15 of this Annual Report on Form 10-K and are incorporated herein by reference.
Item 9. Changes in and Disagreements with Accountants on Accounting and Financial Disclosure
None.
43
Item 9A. Controls and Procedures
Evaluation of Disclosure Controls and Procedures
Our management, with the participation of our principal executive officer and principal financial officer, has evaluated the effectiveness of our disclosure controls and procedures (as defined in Rules 13a- 15(e) and 15d- 15(e) under the Securities Exchange Act of 1934, as amended (the “Exchange Act”)), as of the end of the period covered by this Annual Report on Annual Report on Form 10-K. Based on such evaluation, our principal executive officer and principal financial officer have concluded that as of such date, our disclosure controls and procedures were effective.
Management’s Annual Report on Internal Control Over Financial Reporting
Our management is responsible for establishing and maintaining adequate internal control over our financial reporting. As discussed elsewhere in this Annual Report on Form 10-K, we completed the Merger on April 14, 2014. Prior to the Merger, GETI was a privately held company and therefore its controls were not required to be designed or maintained in accordance with Exchange Act Rule 13a-15. The design of public company internal controls over financial reporting for the Company following the Merger has required and will continue to require significant time and resources from our management and other personnel. As a result, management was unable, without incurring unreasonable effort or expense, to conduct an assessment of our internal control over financial reporting as of December 31, 2014. Therefore, we are excluding management’s report on internal control over financial reporting pursuant to Section 215.02 of the SEC’s Compliance and Disclosure Interpretations of Regulation S-K. In the future, management’s assessment of our internal control over financial reporting will include an evaluation of such elements as the design and operating effectiveness of key financial reporting controls, process documentation, accounting policies and our overall control environment.
This Annual Report on Form 10-K does not include an audit report on the effectiveness of our internal controls over financial reporting as of December 31, 2014 by our registered public accounting firm as permitted due to our status as an emerging growth company under the Jumpstart Our Business Startups Act of 2012.
Changes in Internal Control over Financial Reporting
There have been no changes in our internal control over financial reporting during the fiscal quarter ended December 31, 2014, that has materially affected, or is reasonably likely to materially affect, our internal control over financial reporting.
Item 9B. Other Information
None.
44
PART III
Item 10. Directors and Executive Officers after the Business Combination
The information concerning "Directors and Executive Officers after the Business Combination shall be included in the Proxy Statement to be filed relating to our 2015 Annual Meeting of Stockholders and is incorporated herein by reference.
Item 11. Executive Compensation
The information concerning "Executive Compensation" required by Item 11 shall be included in the Proxy Statement to be filed relating to our 2015 Annual Meeting of Stockholders and is incorporated herein by reference.
Item 12. Security Ownership of Certain Beneficial Owners and Management and Related Stockholder Matters
The information concerning "Security Ownership of Certain Beneficial Owners" and "Management and Related Stockholder Matters" required by Item 12 shall be included in our Proxy Statement to be filed relating to the 2015 Annual Meeting of Stockholders and is incorporated herein by reference.
Item 13. Certain Relationships and Related Transactions, and Director Independence
The information concerning “Certain Relationships and Related Transactions, and Director Independence” required by Item 13 shall be included in our Proxy Statement to be filed relating to the 2015 Annual Meeting of Stockholders and is incorporated herein by reference.
Item 14. Principal Accounting Fees and Services
The information concerning "Principal Accounting Firm Fees" required by Item 14 shall be included in the Proxy Statement to be filed relating to our 2015 Annual Meeting of Stockholders and is incorporated herein by reference.
45
PART IV
SIGNATURES
Pursuant to the requirements of Section 13 or 15(d) of the Securities Exchange Act of 1934, we have duly caused this report to be signed on our behalf by the undersigned, thereunto duly authorized.
GLORI ENERGY INC. | ||
By: | /s/ Stuart Page | |
Stuart Page, President, Chief Executive Officer, and Director | ||
By: | /s/ Victor M. Perez | |
Victor M. Perez, Chief Financial Officer and Principal Financial Officer | ||
By: | /s/ Harry Friske | |
Harry Friske, Controller and Principal Accounting Officer | ||
Date: March 12, 2015
Pursuant to the requirements of the Securities Exchange Act of 1934, this report has been signed on our behalf on March 12, 2015 by the following Directors:
/s/ John U. Clarke | /s/ Mark Chess | /s/ Matthew Gibbs | ||||||
John U. Clarke | Mark Chess | Matthew Gibbs | ||||||
/s/ Thomas O. Hicks | /s/ Ganesh Kishore | /s/ Mark B. Puckett | ||||||
Thomas O. Hicks | Ganesh Kishore | Mark B. Puckett | ||||||
/s/ Damon L. Rawie | /s/ Jonathan Schulhof | /s/ Rocky Duckworth | ||||||
Damon L. Rawie | Jonathan Schulhof | Rocky Duckworth | ||||||
/s/ James C. Musselman | ||||||||
James C. Musselman | ||||||||
46
INDEX TO FINANCIAL STATEMENTS | |
Table of Contents | |
Page | |
Consolidated Financial Statements of Glori Energy Inc. and Subsidiaries | |
Report of Independent Registered Public Accounting Firm | |
Consolidated Balance Sheets – As of December 31, 2013 and 2014 | |
Consolidated Statements of Operations – For the years ended December 31, 2012, 2013 and 2014 | |
Consolidated Statements of Stockholders’ Equity - For the years ended December 31, 2012, 2013, and 2014 | |
Consolidated Statements of Cash Flows – For the years ended December 31, 2012. 2013 and 2014 | |
Notes to Consolidated Financial Statements | |
F-1
REPORT OF INDEPENDENT REGISTERED PUBLIC ACCOUNTING FIRM
Board of Directors and Shareholders
Glori Energy Inc.
We have audited the accompanying consolidated balance sheets of Glori Energy Inc. and Subsidiaries (the “Company”) as of December 31, 2013 and 2014, and the related consolidated statements of operations, stockholders’ equity, and cash flows for each of the three years in the period ended December 31, 2014. These financial statements are the responsibility of the Company’s management. Our responsibility is to express an opinion on these financial statements based on our audits.
We conducted our audits in accordance with the standards of the Public Company Accounting Oversight Board (United States). Those standards require that we plan and perform the audit to obtain reasonable assurance about whether the financial statements are free of material misstatement. We were not engaged to perform an audit of the Company’s internal control over financial reporting. Our audits included consideration of internal control over financial reporting as a basis for designing audit procedures that are appropriate in the circumstances, but not for the purpose of expressing an opinion on the effectiveness of the Company’s internal control over financial reporting. Accordingly, we express no such opinion. An audit also includes examining, on a test basis, evidence supporting the amounts and disclosures in the financial statements, assessing the accounting principles used and significant estimates made by management, as well as evaluating the overall financial statement presentation. We believe that our audits provide a reasonable basis for our opinion.
In our opinion, the consolidated financial statements referred to above present fairly, in all material respects, the financial position of Glori Energy Inc. and Subsidiaries as of December 31, 2013 and 2014, and the results of their operations and their cash flows for each of the three years in the period ended December 31, 2014 in conformity with accounting principles generally accepted in the United States of America.
/s/ GRANT THORNTON LLP
Houston, Texas
March 12, 2015
F-2
GLORI ENERGY INC. AND SUBSIDIARIES
CONSOLIDATED BALANCE SHEETS
(in thousands, except share and per share data)
As of December 31, | |||||||
2013 | 2014 | ||||||
ASSETS | |||||||
Current assets: | |||||||
Cash and cash equivalents | $ | 20,867 | $ | 29,751 | |||
Accounts receivable, less allowance for doubtful accounts of $80 and $0 as of December 31, 2013 and 2014, respectively | 307 | 1,371 | |||||
Commodity derivatives | — | 2,905 | |||||
Prepaid expenses and other current assets | 71 | 242 | |||||
Inventory | 24 | 2 | |||||
Total current assets | 21,269 | 34,271 | |||||
Property and equipment: | |||||||
Proved oil and gas properties - successful efforts | 3,141 | 45,694 | |||||
Other property and equipment | 4,892 | 5,941 | |||||
8,033 | 51,635 | ||||||
Less: accumulated depreciation, depletion and amortization | (5,223 | ) | (22,822 | ) | |||
Total property and equipment, net | 2,810 | 28,813 | |||||
Commodity derivatives | — | 2,891 | |||||
Deferred offering costs | 378 | — | |||||
Deferred loan costs | 162 | 490 | |||||
Deferred tax asset | — | 970 | |||||
Total assets | $ | 24,619 | $ | 67,435 | |||
LIABILITIES AND STOCKHOLDERS’ EQUITY | |||||||
Current liabilities: | |||||||
Accounts payable | $ | 534 | $ | 2,251 | |||
Deferred revenues | 1,753 | 653 | |||||
Accrued expenses | 417 | 1,792 | |||||
Current portion of long-term debt | 3,499 | 2,380 | |||||
Current deferred tax liability | — | 970 | |||||
Total current liabilities | 6,203 | 8,046 | |||||
Long-term liabilities: | |||||||
Long-term debt, less current portion | 1,771 | 16,845 | |||||
Other long-term liabilities | 449 | 1,329 | |||||
Total long-term liabilities | 2,220 | 18,174 | |||||
Total liabilities | 8,423 | 26,220 | |||||
Commitments and contingencies | |||||||
Stockholders' equity: | |||||||
Common stock, $.0001 par value, 100,000,000 shares authorized, 22,450,688 and 31,499,303 shares issued and outstanding as of December 31, 2013 and 2014, respectively | 2 | 3 | |||||
Additional paid-in capital | 61,609 | 105,383 | |||||
Accumulated deficit | (45,415 | ) | (64,171 | ) | |||
Total stockholders' equity | 16,196 | 41,215 | |||||
Total liabilities and stockholders' equity | $ | 24,619 | $ | 67,435 | |||
The accompanying notes are an integral part of these consolidated financial statements.
F-3
GLORI ENERGY INC. AND SUBSIDIARIES
CONSOLIDATED STATEMENTS OF OPERATIONS
(in thousands, except per share data)
Year ended December 31, | |||||||||||
2012 | 2013 | 2014 | |||||||||
Revenues: | |||||||||||
Oil and gas revenues | $ | 463 | $ | 576 | $ | 11,724 | |||||
Service revenues | 1,718 | 2,643 | 4,135 | ||||||||
Total revenues | 2,181 | 3,219 | 15,859 | ||||||||
Operating expenses: | |||||||||||
Oil and gas operations | 1,768 | 2,211 | 10,777 | ||||||||
Service operations | 2,115 | 2,281 | 3,528 | ||||||||
Science and technology | 1,459 | 1,682 | 1,868 | ||||||||
Selling, general and administrative | 3,411 | 4,279 | 5,920 | ||||||||
Write-off of deferred offering costs | 1,492 | 126 | — | ||||||||
Impairment of oil and gas properties | — | 2,190 | 13,160 | ||||||||
Depreciation, depletion and amortization | 578 | 622 | 4,624 | ||||||||
Total operating expenses | 10,823 | 13,391 | 39,877 | ||||||||
Loss from operations | (8,642 | ) | (10,172 | ) | (24,018 | ) | |||||
Other (expense) income: | |||||||||||
Interest expense | (480 | ) | (959 | ) | (3,023 | ) | |||||
(Loss) gain on change in fair value of warrants | (506 | ) | 592 | 2,454 | |||||||
Gain on commodity derivatives | — | — | 6,023 | ||||||||
Loss on change in fair value of derivative liability | (2,317 | ) | — | — | |||||||
Other income (expense) | 5 | (70 | ) | 17 | |||||||
Total other (expense) income, net | (3,298 | ) | (437 | ) | 5,471 | ||||||
Net loss before taxes on income | (11,940 | ) | (10,609 | ) | (18,547 | ) | |||||
Income tax expense | — | — | 209 | ||||||||
Net loss | $ | (11,940 | ) | $ | (10,609 | ) | $ | (18,756 | ) | ||
Net loss per common share, basic and diluted | $ | (11.32 | ) | $ | (9.61 | ) | $ | (0.65 | ) | ||
Weighted average common shares outstanding, basic and diluted | 1,055 | 1,104 | 28,855 | ||||||||
The accompanying notes are an integral part of these consolidated financial statements.
F-4
GLORI ENERGY INC. AND SUBSIDIARIES
CONSOLIDATED STATEMENTS OF STOCKHOLDERS’ EQUITY
(in thousands, except share data)
Stockholders' equity | |||||||||||||||||||
Additional | Total | ||||||||||||||||||
Common stock | paid-in | Accumulated | stockholders' | ||||||||||||||||
Shares | Par value | capital | deficit | equity | |||||||||||||||
Balances as of January 1, 2012, as converted (See Note 3) | 16,168,502 | $ | 2 | $ | 33,975 | $ | (22,866 | ) | $ | 11,111 | |||||||||
Stock based compensation | — | — | 291 | — | 291 | ||||||||||||||
Change in fair value of warrant liability | — | — | 701 | — | 701 | ||||||||||||||
Common share issuance | 19,680 | — | 227 | — | 227 | ||||||||||||||
Share issuance, as converted (formerly C preferred shares, See Note 3) | 3,226,691 | — | 11,786 | — | 11,786 | ||||||||||||||
Net loss | — | — | — | (11,940 | ) | (11,940 | ) | ||||||||||||
Balances as of December 31, 2012, as converted (see Note 3) | 19,414,873 | $ | 2 | $ | 46,980 | $ | (34,806 | ) | $ | 12,176 | |||||||||
Stock based compensation | — | — | 774 | — | 774 | ||||||||||||||
Change in fair value of warrant liability | — | — | 1,347 | — | 1,347 | ||||||||||||||
Termination of derivative liability | — | — | 2,329 | — | 2,329 | ||||||||||||||
Fair value of preferred shares in excess of proceeds | — | — | (1,938 | ) | — | (1,938 | ) | ||||||||||||
Common share issuance, as converted | 79,003 | — | 17 | — | 17 | ||||||||||||||
Share issuance, as converted (formerly C-1 preferred shares and warrants, see Note 3) | 2,956,812 | — | 12,100 | — | 12,100 | ||||||||||||||
Net loss | — | — | — | (10,609 | ) | (10,609 | ) | ||||||||||||
Balances as of December 31, 2013, as converted | 22,450,688 | $ | 2 | $ | 61,609 | $ | (45,415 | ) | $ | 16,196 | |||||||||
Stock based compensation | — | — | 296 | — | 296 | ||||||||||||||
Issuance, repurchase and cancellation of common shares | — | — | (30 | ) | — | (30 | ) | ||||||||||||
Change in fair value of warrant liability | — | — | (2,454 | ) | — | (2,454 | ) | ||||||||||||
Share issuance, as converted (formerly C-2 preferred shares and warrants, see Note 3) | 1,133,869 | — | 5,049 | — | 5,049 | ||||||||||||||
Recapitalization due to merger (see Note 3) | 6,658,449 | 1 | 34,725 | — | 34,726 | ||||||||||||||
Debt conversion to common stock | 250,000 | — | 2,000 | — | 2,000 | ||||||||||||||
Warrants exchanged for common shares | 583,010 | — | — | — | — | ||||||||||||||
Warrants exercised | 423,287 | — | 4,188 | — | 4,188 | ||||||||||||||
Net loss | — | — | — | (18,756 | ) | (18,756 | ) | ||||||||||||
Balances as of December 31, 2014 | 31,499,303 | $ | 3 | $ | 105,383 | $ | (64,171 | ) | $ | 41,215 | |||||||||
The accompanying notes are an integral part of these consolidated financial statements.
F-5
GLORI ENERGY INC. AND SUBSIDIARIES
CONSOLIDATED STATEMENTS OF CASH FLOWS
(in thousands)
Years ended December 31, | |||||||||||
2012 | 2013 | 2014 | |||||||||
Net loss | (11,940 | ) | $ | (10,609 | ) | $ | (18,756 | ) | |||
Adjustments to reconcile net loss to net cash used in operating activities: | |||||||||||
Depreciation, depletion and amortization of property and equipment | 578 | 622 | 4,624 | ||||||||
Bad debt expense | — | 80 | — | ||||||||
Stock-based compensation | 291 | 774 | 296 | ||||||||
Amortization of deferred loan costs and other | 57 | 156 | 439 | ||||||||
Accretion of end-of-term charge | 48 | 96 | 96 | ||||||||
Loss on disposal of property and equipment | — | 25 | — | ||||||||
Loss (gain) on change in fair value of warrant liabilities | 506 | (592 | ) | (2,454 | ) | ||||||
Accretion of discount on long-term debt | 34 | 67 | 67 | ||||||||
Loss on change in fair value of derivative liabilities | 2,317 | — | — | ||||||||
Unrealized gain on change in fair value of commodity derivatives | — | — | (5,796 | ) | |||||||
Write-off of deferred offering costs | 1,492 | 126 | — | ||||||||
Impairment of oil and gas property | — | 2,190 | 13,160 | ||||||||
Changes in operating assets and liabilities: | |||||||||||
Accounts receivable | 141 | (156 | ) | (1,087 | ) | ||||||
Prepaid expenses | (106 | ) | 51 | (171 | ) | ||||||
Inventory | (7 | ) | 21 | 22 | |||||||
Accounts payable | (761 | ) | (125 | ) | 1,339 | ||||||
Deferred revenues | 362 | 758 | (1,100 | ) | |||||||
Accrued expenses | 121 | (37 | ) | 1,135 | |||||||
Net cash used in operating activities | (6,867 | ) | (6,553 | ) | (8,186 | ) | |||||
Cash flows from investing activities: | |||||||||||
Purchase of proved oil and gas property | (1,370 | ) | (60 | ) | (41,353 | ) | |||||
Purchase of other property and equipment | (962 | ) | (470 | ) | (1,009 | ) | |||||
Net cash used in investing activities | (2,332 | ) | (530 | ) | (42,362 | ) | |||||
Cash flows from financing activities: | |||||||||||
Proceeds from issuance of common stock, preferred stock and preferred warrants | 12,038 | 12,118 | 5,019 | ||||||||
Proceeds from issuance of long-term debt | 7,557 | — | 24,035 | ||||||||
Proceeds from exercise of warrants and stock options | — | — | 4,188 | ||||||||
Proceeds from merger with Infinity Corp. including private placement of common stock | — | — | 38,441 | ||||||||
Payments on long-term debt | (1 | ) | (2,676 | ) | (8,147 | ) | |||||
Payments for deferred offering costs | (534 | ) | (163 | ) | (3,337 | ) | |||||
Payments for deferred loan costs | — | (36 | ) | (767 | ) | ||||||
Net cash provided by financing activities | 19,060 | 9,243 | 59,432 | ||||||||
Net increase in cash and cash equivalents | 9,861 | 2,160 | 8,884 | ||||||||
Cash and cash equivalents, beginning of period | 8,846 | 18,707 | 20,867 | ||||||||
Cash and cash equivalents, end of period | $ | 18,707 | $ | 20,867 | $ | 29,751 | |||||
Non-cash financing and investing activities: | |||||||||||
Contribution of capital equal to fair value of derivative due to termination of derivative liability | $ | — | $ | 2,329 | $ | — | |||||
Fair value of preferred stock and preferred warrants in excess of proceeds | — | (1,938 | ) | — | |||||||
Asset retirement obligation assumed | — | 883 | |||||||||
Issuance of preferred stock in settlement of accrued expense | 170 | — | — | ||||||||
Supplemental cash flow information: | |||||||||||
Interest paid | $ | 271 | $ | 732 | $ | 2,990 | |||||
The accompanying notes are an integral part of these consolidated financial statements.
F-6
GLORI ENERGY INC. AND SUBSIDIARIES
NOTES TO CONSOLIDATED FINANCIAL STATEMENTS
NOTE 1 - ORGANIZATION, NATURE OF BUSINESS AND LIQUIDITY
Glori Energy Technology Inc., a Delaware corporation (formerly Glori Energy Inc.) ("GETI"), was incorporated in November 2005 (as successor in interest to Glori Oil LLC) to increase production and recovery from mature oil wells using state of the art biotechnology solutions.
In January 2014, GETI entered into a merger and share exchange agreement with Infinity Cross Border Acquisition Corporation ("INXB") and certain of its affiliates, Glori Acquisition Corp., Glori Merger Subsidiary, Inc., and Infinity-C.S.V.C. Management Ltd., an INXB Representative. On April 14, 2014, the merger and share exchange agreement was closed and the merger was consummated. As a result of this transaction, Infinity Cross Border Acquisition Corporation merged with and into Glori Acquisition Corp., with Glori Acquisition Corp. surviving the merger. Following that merger, Glori Merger Subsidiary, Inc. merged with and into GETI, with GETI surviving the merger. Following both of these mergers (collectively referred to herein as the "Merger"), GETI became the wholly-owned subsidiary of Glori Acquisition Corp., and Glori Acquisition Corp. adopted the name "Glori Energy Inc."
In March 2014, GETI incorporated Glori Energy Production Inc., a wholly-owned subsidiary of Glori Holdings Inc., to purchase the Coke Field Assets (see NOTE 4) and incur the associated acquisition debt.
Glori Energy Inc., GETI, Glori Oil (Argentina) Limited, Glori Oil S.R.L., Glori Canada Ltd., Glori Holdings Inc., Glori California Inc., OOO Glori Energy and Glori Energy Production Inc. are collectively referred to as the “Company” in the consolidated financial statements.
NOTE 2 – SUMMARY OF SIGNIFICANT ACCOUNTING POLICIES
Principles of Consolidation
The accompanying consolidated financial statements include the accounts of Glori Energy Inc. and its wholly-owned subsidiaries. Intercompany balances and transactions have been eliminated in consolidation.
Use of Estimates
The preparation of the consolidated financial statements in conformity with accounting principles generally accepted in the United States of America requires management to make estimates and assumptions that affect the reported amounts of assets and liabilities, disclosure of contingent assets and liabilities at the date of the consolidated financial statements and the reported amounts of revenues and expenses during the reporting period. Actual results could differ from these estimates.
Cash and Cash Equivalents
The Company considers all highly liquid investments with original maturities of three months or less when purchased to be cash equivalents.
Concentrations of Credit Risk
The Company maintains its cash in bank deposits with financial institutions. These bank deposits, at times, exceed Federal Deposit Insurance Corporation limits of $250,000 per depositor. The Company monitors the financial condition of the financial institutions and has not experienced any losses on such accounts. The Company is not party to any financial instruments which would have off-balance sheet credit or interest rate risk.
F-7
The Company derived service revenues from eight customers during 2012, eleven customers during 2013, and fifteen customers during 2014. The following is a reconciliation of the customers that exceeded 10% of total service revenues in each of those periods:
Percentage of service revenues Year ended December 31, | |||||||||
Customer | 2012 | 2013 | 2014 | ||||||
A | 12 | % | 14 | % | * | ||||
B | 16 | % | * | 36 | % | ||||
C | 15 | % | — | — | |||||
D | 19 | % | 20 | % | 17 | % | |||
E | 12 | % | * | — | |||||
F | 11 | % | — | — | |||||
G | * | 20 | % | — | |||||
H | — | 16 | % | — | |||||
I | * | — | 10 | % | |||||
J | — | * | 10 | % | |||||
* Revenues were less than 10% for the period.
Management does not believe that these customers constitute a significant credit risk.
The Company had outstanding receivables related to service revenues from seven customers as of December 31, 2013 and four customers as of December 31, 2014. The following is a reconciliation of the customers that exceeded 10% of total accounts receivable from service revenues as of each of these dates:
Percentage of outstanding accounts receivable from service revenues December 31, | ||||
Customer | 2013 | 2014 | ||
A | 13% | — | ||
B | 10% | — | ||
D | 19% | — | ||
I | — | 19% | ||
J | 20% | — | ||
K | — | 54% | ||
L | * | 27% | ||
M | 23% | — | ||
Oil and natural gas sales are made on a monthly basis or under short-term contracts at the current area market price. The Company would not expect that the loss of any purchaser would have a material adverse effect upon its operations. Additionally management does not believe any of our purchasers constitute a significant credit risk. For the year ended December 31, 2014, there were two purchasers that accounted for 57% and 39% of total oil revenue. For the years ended December 31, 2012 and 2013, all of the Company’s oil production was bought by a single purchaser. The Company sells its natural gas to a different purchaser than that of its oil sales. Natural gas sales did not exceeded 10% of total oil and gas revenues for the year ended 2014. Prior to 2014, the Company had no natural gas sales. At December 31, 2014, the Company had a $900,000 receivable for December oil sales from a single oil purchaser.
The Company also engages in NYMEX swaps with a third party company (See NOTE 8).
F-8
Accounts Receivable
Accounts receivable consists of amounts due in the ordinary course of business, from companies engaged in the exploration of oil and gas and from third party purchasers of the Company's oil and natural gas production. The Company performs ongoing credit evaluation of its customers and generally does not require collateral. Allowances are maintained for potential credit issues as they arise through management’s analysis of factors such as amount of time outstanding, customer payment history and customer financial condition. The Company has incurred inconsequential credit losses since inception.
Inventory
Inventory is stated at average cost and consists primarily of raw materials in the form of chemicals and finished goods that have been blended as part of the Company’s AERO nutrient system.
Oil and Natural Gas Properties
The Company follows the successful efforts method of accounting for oil and gas operations whereby the cost to acquire mineral investments in oil and gas properties, to drill successful exploratory wells, to drill and equip development wells and to install production facilities are capitalized. Certain exploration costs, including unsuccessful exploratory wells and geological and geophysical costs, are charged to operations as incurred. The Company’s acquisition and development costs of proved oil and gas properties are amortized using the units-of-production method, at the field level, based on total proved reserves and proved developed reserves as estimated by independent petroleum engineers.
Other Property and Equipment
Property and equipment are recorded at cost. Expenditures for major additions and improvements are capitalized and depreciated over the remaining useful lives of the associated assets, and repairs and maintenance costs are charged to expense as incurred. When property and equipment are retired or otherwise disposed, the cost and accumulated depreciation are removed from the accounts, and any resulting gain or loss is included in the results of operations for the respective period.
Depreciation and amortization for long-lived assets are recognized over the estimated useful lives of the respective assets by the straight-line method as follows:
Laboratory and manufacturing facility | 5 years or the remaining term of the lease, whichever is shorter | |
Laboratory and field service equipment, office equipment and trucks | 5 years | |
Computer equipment | 3 years | |
Impairment of Long-Lived Assets
The Company reviews the recoverability of its long-lived assets, such as property, equipment and oil and gas properties, when events or changes in circumstances occur that indicate the carrying value of the asset or asset group may not be recoverable. The assessment of possible impairment is based on the Company’s ability to recover the carrying value of the asset or asset group from the expected future pre-tax cash flows (undiscounted) of the related operations. Individual assets are grouped for impairment purposes at the lowest level for which there are identifiable cash flows that are largely independent of the cash flows of other groups of assets, generally on a field-by-field basis for oil and gas properties. If these cash flows are less than the carrying value of such asset, an impairment loss is recognized for the difference between estimated fair value and carrying value.
The Company deferred costs incurred for a planned initial public offering (“IPO”) of common stock prior to and during 2012, including legal and other professional fees. The registration statement was withdrawn in 2012 due to market conditions, and as a result, the Company recorded a write-off of the deferred costs of $1,492,000 during 2012.
During 2013, the Company had deferred offering costs for a C-1 preferred stock offering initially planned for the fourth quarter 2013. These costs, in the amount of $126,000, were written off as the Company abandoned the offering in pursuit of alternate financing through the Merger (see NOTE 3).
F-9
The Company impaired its proved-oil and gas properties for the fiscal years ended December 31, 2013 and 2014. The Company uses a discounted future cash flow approach based on the proved and probable reserves at estimated future prices based on the futures commodities prices less regional discounts to calculate the value of the reserves at fiscal year-end to perform the impairment analysis. The write off during the fiscal year ended December 31, 2013 was the result of a decline in proved reserves on the Company’s 2013 fiscal year end reserve report from the 2012 fiscal year end reserve report for the Etzold Field. The decline arose from the Company’s decision to abandon the development of proved undeveloped reserves in the field as results indicated these reserves would be uneconomic to produce. The impairment in 2014 was a result in a sharp decline in oil prices. The reduction in asset value of proved oil and gas properties of $2,190,000 and $13,160,000 represents the impairment amounts incurred in 2013 and 2014, respectively, which are shown as impairment of oil and gas properties on the consolidated statement of operations.
Derivatives
The Company uses derivative instruments in the form of commodity price swaps to manage price risks resulting from fluctuations in commodity prices of oil associated with future production. These derivative instruments are recorded on the balance sheet at fair value as assets or liabilities and the changes in the fair value of derivatives are recorded each period in current earnings. Fair value is assessed, measured and estimated by obtaining the NYMEX futures oil commodity pricing. Gains and losses on the valuation of derivatives and settlement of matured commodity derivatives contracts are included in gain (loss) on commodity derivatives in other income within the period in which they occur.
Asset Retirement Obligation
The Company recognizes the present value of the estimated future abandonment costs of its oil and gas properties in both assets and liabilities. If a reasonable estimate of the fair value can be made, the Company will record a liability for legal obligations associated with the future retirement of long-lived assets that result from the acquisition, construction, development and/or normal operation of the assets. The fair value of a liability for an asset retirement obligation is recognized in the period in which the liability is incurred. The fair value is measured using expected future cash outflows (estimated using current prices that are escalated by an assumed inflation rate) discounted at the Company’s credit-adjusted risk-free interest rate. The liability is then accreted each period until it is settled or the asset is sold, at which time the liability is reversed and any gain or loss resulting from the settlement of the obligation is recorded. The initial fair value of the asset retirement obligation is capitalized and subsequently depreciated or amortized as part of the carrying amount of the related asset. The Company has recorded asset retirement obligations related to its oil and gas properties. There are no assets legally restricted for the purpose of settling asset retirement obligations.
Financial Instruments
Financial instruments consist of cash and cash equivalents, accounts receivable, accounts payables, long-term debt, derivatives, and warrants. The carrying values of cash and cash equivalents and accounts receivable and payables approximate fair value due to their short-term nature. Derivatives are recorded at fair value (see NOTE 7 and NOTE 8).
Net Loss Per Share
Basic net loss per share is computed using the weighted-average number of shares of common stock outstanding during the period. In periods that have income, basic net earnings per common share is computed under the two-class method per guidance in Accounting Standards Codification (ASC) 260, Earnings per Share. The two-class method is an earnings allocation formula that determines earnings per share for each class of common stock and participating security according to dividends declared (or accumulated) and participation rights in undistributed earnings. Under the two-class method, basic earnings per common share is computed by dividing net earnings attributable to common shares after allocation of earnings to participating securities by the weighted-average number of common shares outstanding during the year. However, in periods of net loss, participating securities other than common stock are not included in the calculation of basic loss per share because there is no contractual obligation for owners of these securities to share in the Company’s losses, and the effect of their inclusion would be anti-dilutive. Diluted earnings (loss) per common share is computed using the two-class method or the if-converted method, whichever is more dilutive (see NOTE 10).
Diluted net loss per share is the same as basic net loss per share for all periods presented because any potentially dilutive common shares were anti-dilutive. Such potentially dilutive shares are excluded from the computation of diluted net loss per share when the effect would be to reduce net loss per share. Therefore, in periods when a loss is reported, the calculation of basic and diluted loss per share results in the same value.
F-10
Revenue Recognition
Oil and natural gas revenues are recognized when production is sold to a purchaser at a fixed or determinable price, when delivery has occurred and title has transferred, and if collectibility of the revenue is probable. Revenues from natural gas production are recorded using the sales method. When sales volumes exceed the Company’s entitled share, production imbalance occurs. If production imbalance exceeds the Company’s share of the remaining estimated proved natural gas reserves for a given property, the Company records a liability. The Company has no significant gas imbalances as of December 31, 2013 and 2014.
Service revenues are recognized when all services are concluded in accordance with the contract. The Company’s service contracts typically include a single contract for each phase of service. During the initial phase known as Reservoir Analysis and Treatment Design (the “Analysis Phase”), the Company samples the target field and evaluates project feasibility and nutrient formulation by assessing field characteristics such as geology, microbial environment and geochemistry of the oil and water. The completion of the Analysis Phase contract typically coincides with the delivery of a report of findings to the customer at which point the Analysis Phase revenues are recognized. Once the viability of the AERO System is demonstrated in the Analysis Phase, a new contract is executed for the Field Deployment Phase. During the Field Deployment Phase the AERO System is initiated in the oil field to stimulate the indigenous microbes in the oil bearing reservoir. The Field Deployment Phase revenues are recognized ratably over the Field Deployment Phase injection work timeline.
Previous to 2014, the majority of the Company’s revenues for AERO services were executed under a single contract which covered both Analysis Phase and Field Deployment Phase work. The single contract for both services resulted in lack of commercial evidence that the Analysis Phase services provided value on a stand-alone basis and thus both services were viewed as a single unit-of-accounting under ASC 605, Revenue Recognition: Multiple-Element Arrangements. In accordance with this guidance, the Company deferred revenue received in the Analysis Phase and recognize this revenue and the Field Deployment Phase revenue uniformly over the Field Deployment Phase injection timeline. Any termination of the project after the completion of the Analysis Phase would result in the immediate recognition of that portion of the revenues outlined in the contract.
As of December 31, 2013 and 2014, the Company had deferred revenues of approximately $1,753,000 and $653,000 respectively, pursuant to contracts requiring substantial future performance.
Science and Technology
The Company expenses all science and technology costs as incurred. The science and technology work performed predominantly relates to the Analysis Phase and the fees are primarily made up of employee compensation, lab supplies and materials, legal fees, and corporate overhead allocations.
Income Taxes
The Company accounts for income taxes using the asset and liability method wherein deferred tax assets and liabilities are recognized for the future tax consequences attributable to temporary differences between the financial statement carrying amounts of existing assets and liabilities and their respective tax bases and to net operating loss carry forwards, measured by enacted tax rates for years in which taxes are expected to be paid, recovered or settled. A valuation allowance is established to reduce deferred tax assets if, based on the weight of available evidence, it is more likely than not that some portion or all of the deferred tax assets will not be realized.
The Company follows ASC 740, Income Taxes (“ASC 740”), which creates a single model to address accounting for the uncertainty in income tax positions and prescribes a minimum recognition threshold a tax position must meet before recognition in the consolidated financial statements.
The Company’s tax years 2005 through 2014 remain open and subject to examination by the Internal Revenue Service (“IRS”) and are open for examination until the expiration of statute of limitations under the IRS Code.
Stock-Based Compensation
Since the initiation of the 2006 Stock Option and Grant Plan, the Company has recorded all share-based payment expense associated with option awards in accordance with ASC 718, Compensation - Stock Compensation. Accordingly, the Company selected the Black-Scholes option-pricing model as the most appropriate method to value option awards and recognizes compensation cost, as determined on the grant date, on a straight-line basis over the option awards’ vesting period.
F-11
Fair Value of Financial Instruments
FASB standards define fair value as the exchange price that would be received for an asset or paid to transfer a liability (an exit price) in the principal or most advantageous market for the asset or liability in an orderly transaction between market participants on the measurement date. The standard also establishes a fair value hierarchy that requires an entity to maximize the use of observable inputs and minimize the use of unobservable inputs when measuring fair value. The standard describes three levels of inputs that may be used to measure fair value:
Level 1 – Quoted prices in active markets for identical assets or liabilities.
Level 2 – Observable inputs other than Level 1 prices, such as quoted prices for similar assets or liabilities; or other inputs that are observable or can be corroborated by observable market data.
Level 3 – Unobservable inputs that are supported by little or no market activity and that are financial instruments whose values are determined using pricing models, discounted cash flow methodologies, or similar techniques, as well as instruments for which the determination of fair value requires significant judgment or estimation.
If the inputs used to measure the financial assets and liabilities fall within more than one level described above, the categorization is based on the lowest level input that is significant to the fair value measurement of the instrument.
Accounting for Sales Tax
The Company uses the net method for accounting for sales taxes charged to customers and accordingly does not include sales or similar taxes as revenues; the Company does include sales and similar taxes paid as part of the cost of goods or services acquired.
Deferred Offering Costs
The Company has capitalized certain costs such as legal fees incurred related to the merger with Infinity Cross Border Acquisition Group (see NOTE 3).
Reclassifications
Certain 2012 and 2013 amounts related to oil and gas revenues, service revenues, oil and gas operations, service operations and depreciation, depletion and amortization have been reclassified for comparative purposes.
F-12
NOTE 3 - MERGER WITH INFINITY CROSS BORDER ACQUISITION CORPORATION
On January 8, 2014, GETI executed the Merger with Infinity Cross Border Acquisition Corporation (“Infinity Corp.” - a special purpose acquisition company or blank check company publicly traded on NASDAQ) and certain of its affiliates. On April 14, 2014, the Merger was consummated. Pursuant to the terms of the Merger, in exchange for all of GETI's outstanding shares and warrants, Infinity Corp. issued 23,584,557 shares of common stock on a pro rata basis to the stockholders and warrant holders of GETI. GETI obtained effective control of Infinity Corp. subsequent to the Merger and thus the Merger was accounted as a reverse acquisition and recapitalization of GETI in accordance with ASC 805 - Business Combinations. Subsequent to the Merger, the GETI shareholders retained a substantial majority of voting interest and positions on the Board of Directors. Additionally GETI's management is retained and GETI's operations comprise the ongoing operations post-Merger.
In the consolidated financial statements, the number of shares of common stock attributable to the Company is reflected retroactive to January 1, 2012 to facilitate comparability to prior periods. Accordingly, the number of shares of common stock presented as outstanding as of January 1, 2012 totals 16,168,502 which represents the number of common shares that were received for pre-Merger GETI preferred stock, common stock and warrants as of January 1, 2012.
F-13
The following table (in thousands, except share amounts) presents the consolidated statements of temporary equity and stockholders' equity as if the Merger had occurred on January 1, 2012. The beginning balances as of January 1, 2012, shown in the table below, represent the Company's pre-Merger temporary equity and stockholders' equity previously stated as of January 1, 2012. The balances as of January 1, 2012, as converted, represent the post-Merger stockholders' equity received in exchange for the pre-Merger temporary equity and stockholders' equity at January 1, 2012.
Temporary equity - convertible redeemable preferred stock | Stockholders' equity | |||||||||||||||||||||||||||||||||||||||||||||||||
Total | Additional | Total | ||||||||||||||||||||||||||||||||||||||||||||||||
Series A Preferred | Series B Preferred | Series C Preferred | Series C-1 Preferred | temporary | Common stock | paid-in | Accumulated | stockholders' | ||||||||||||||||||||||||||||||||||||||||||
Shares | Amount | Shares | Amount | Shares | Amount | Shares | Amount | equity | Shares | Par value | capital | deficit | equity | |||||||||||||||||||||||||||||||||||||
Balances as of January 1, 2012 | 475,541 | $ | 12,709 | 2,901,052 | $ | 21,990 | 28,776,041 | $ | 7,888 | — | $ | — | $ | 42,587 | 3,009,592 | $ | 1 | $ | — | $ | (31,477 | ) | $ | (31,476 | ) | |||||||||||||||||||||||||
Reversal of pre-Merger temporary equity | (475,541 | ) | (12,709 | ) | (2,901,052 | ) | (21,990 | ) | (28,776,041 | ) | (7,888 | ) | — | — | (42,587 | ) | — | — | — | 42,587 | 42,587 | |||||||||||||||||||||||||||||
Reversal of pre-Merger common shares | — | — | — | — | — | — | — | — | — | (3,009,592 | ) | (1 | ) | 1 | — | — | ||||||||||||||||||||||||||||||||||
Conversion of pre-Merger shares to post Merger shares | — | — | — | — | — | — | — | — | — | 16,168,502 | 2 | (2 | ) | — | — | |||||||||||||||||||||||||||||||||||
Segregate historical accumulated deficit from additional paid-in capital | — | — | — | — | — | — | — | — | — | — | — | 33,976 | (33,976 | ) | — | |||||||||||||||||||||||||||||||||||
Balances as of January 1, 2012, as converted | — | $ | — | — | $ | — | — | $ | — | — | $ | — | $ | — | 16,168,502 | $ | 2 | $ | 33,975 | $ | (22,866 | ) | $ | 11,111 | ||||||||||||||||||||||||||
Not shown in the above table is the pre-Merger issuance by GETI of common shares, preferred shares and warrants. On January 19, 2012, GETI issued 4,420,566 C preferred shares. These shares were exchanged for 3,226,691 shares of common stock in the Merger. During 2012, there were 57,071 common shares issued which were exchanged for 19,680 shares of common stock in the Merger. On April 30, 2013, GETI issued 4,462,968 C-1 preferred shares and 3,975,718 C-1 preferred warrants. These shares and warrants were exchanged for 2,956,812 shares of common stock in the Merger. During 2013, there were 229,108 common shares issued which were exchanged for 79,003 shares of common stock in the Merger. On March 13, 2014, GETI issued 1,842,028 C-2 preferred shares and 1,640,924 C-2 preferred warrants. These shares and warrants were exchanged for 1,133,869 shares of common stock in the Merger.
F-14
The following table shows the number of common stock of the Company issued and outstanding related to the consummation of the Merger:
Number of Shares | ||||||
Ordinary shares issued to Infinity Corp. founder shareholders | 1,437,500 | |||||
Ordinary shares issued to Infinity Corp. shareholders | 5,750,000 | |||||
Less: Ordinary shares redeemed | (2,351,533 | ) | ||||
Ordinary shares issued underwriter for UPO warrant conversion | 100,000 | |||||
Ordinary shares issued for PIPE Investment (excluding Petro-Hunt portion of the PIPE Investment) | 812,500 | |||||
Ordinary shares issued for PIPE Investment (Petro-Hunt portion of PIPE Investment) | 250,000 | |||||
Ordinary shares issued for the optional PIPE Investment | 909,982 | |||||
Ordinary shares issued to Glori Energy Inc. shareholders | 23,584,557 | |||||
30,493,006 | ||||||
In connection with the Merger, the Company received approximately $24.7 million, net of certain expenses and fees, and approximately $13.7 million in cash from the private placement of 1,722,482 shares of common stock at $8.00 per share from Infinity Group, Hicks Equity Partners LLC and other investors. All of GETI’s previously outstanding common shares, preferred shares and warrants were exchanged for approximately 23,584,557 common shares in the newly merged entity, and accordingly, the Company no longer has liabilities for the fair value of such warrants and temporary equity previously reported in the Company's consolidated balance sheets. Additionally on April 14, 2014 Petro-Hunt L.L.C. ("Petro-Hunt") exercised its option to convert their $2.0 million receivable from the Company to common shares at $8.00 per share or 250,000 shares (see NOTE 9).
In addition to the common stock issued in the Merger the Company has 5,321,700 warrants outstanding at December 31, 2014 to purchase common stock of the Company at a per share price of $10 which expire on July 19, 2017.
F-15
NOTE 4 - PROPERTY AND EQUIPMENT
Property and equipment consists of the following (in thousands):
December 31, | |||||||
2013 | 2014 | ||||||
Proved oil and gas properties - successful efforts | $ | 3,141 | $ | 45,694 | |||
Construction in progress | 902 | 589 | |||||
Laboratory and warehouse facility | 591 | 640 | |||||
Laboratory and field service equipment | 2,968 | 3,158 | |||||
Office equipment, computer equipment, vehicles and other | 431 | 1,554 | |||||
8,033 | 51,635 | ||||||
Less: accumulated depreciation, depletion and amortization (1) | (5,223 | ) | (22,822 | ) | |||
Total property and equipment, net | $ | 2,810 | $ | 28,813 | |||
(1) Includes impairment and excludes accretion of asset retirement obligation.
Depreciation, depletion and amortization consists of the following (in thousands):
Year ended December 31, | |||||||||||
2012 | 2013 | 2014 | |||||||||
Depreciation and amortization expense | $ | 457 | $ | 426 | $ | 523 | |||||
Depletion expense | 103 | 177 | 3,960 | ||||||||
Accretion of asset retirement obligation | 18 | 19 | 141 | ||||||||
Total depreciation, depletion, and amortization of property and equipment | $ | 578 | $ | 622 | $ | 4,624 | |||||
On March 14, 2014, a subsidiary of the Company, Glori Energy Production Inc., acquired certain oil, gas and mineral leases in Wood County Texas (the “Coke Field Assets”) from Petro-Hunt L.L.C. (“Petro-Hunt”) for (i) $38.0 million in cash and a $2.0 million convertible note payable (see NOTE 9) to Petro-Hunt, subject to certain purchase price adjustments primarily for net revenues in excess of direct operating expenses of the property from January 1, 2014 through the closing date, March 14, 2014, and (ii) the assumption of the asset retirement obligation related to plugging and abandoning the Coke Field Assets.
Of the total $39.2 million total purchase price of the Coke Field Assets, the Company recognized, at approximate fair market value, assets such as office equipment and trucks included in property and equipment on the Company’s consolidated balance sheet of approximately $310,000 and items such as tubular stock of $327,000 classified in other property and equipment on the Company’s consolidated balance sheet. The remaining purchase price balance was allocated to proved oil and gas properties in property and equipment on the Company’s consolidated balance sheet. Also included in proved oil and gas properties, the Company recognized an asset associated with the asset retirement obligation (plugging and abandonment of wells) of $745,000 and an offsetting liability included in other long-term liabilities on the Company’s consolidated balance sheet.
In September 2014, the Company purchased additional oil, gas and mineral leases adjacent to the Coke Field Assets (the "Southwest Operating Assets"). The Company purchased the Southwest Operating Assets for $2,000,000 and assumed an asset retirement obligation of an estimated $138,000.
The Company has included revenues and expenses related to the Coke Field Assets for the period from March 14 through December 31, 2014 in the consolidated statement of operations for the year ended December 31, 2014 and for the acquisition of the Southwest Operating Assets September 1 through December 31, 2014. For this period, the revenues and net loss attributable to the Coke Field Assets and Southwest Operating Assets were $11,398,000 and $(7,061,000), respectively. The net loss includes a $6,023,000 gain on commodity derivatives related to the Company's volume based production swaps (see NOTE 8) and loss on impairment of oil and gas properties of $12,707,000.
F-16
The following summary presents unaudited pro forma information for the Company for the year ended December 31, 2013 and 2014, as if the Coke Field acquisition had been consummated at January 1, 2012, 2013 and 2014, respectively (in thousands, except per share amounts):
Year ended December 31, | |||||||||||
2012 | 2013 | 2014 | |||||||||
Total revenues | $ | 13,270 | $ | 14,308 | $ | 18,604 | |||||
Net loss | (10,528 | ) | (9,197 | ) | (19,111 | ) | |||||
Net loss per common shares, basic and diluted | $ | (9.98 | ) | $ | (8.33 | ) | $ | (0.66 | ) | ||
Weighted average shares outstanding: | |||||||||||
Basic | 1,055 | 1,104 | 28,855 | ||||||||
Diluted | 1,055 | 1,104 | 28,855 | ||||||||
NOTE 5 – ASSET RETIREMENT OBLIGATION
The Company accounts for its asset retirement obligation (“ARO”) in accordance with ASC 410, Asset Retirement and Environmental Obligations. The ARO liability reflects the estimated present value of the amount of dismantlement, removal, site
reclamation, and similar activities associated with our oil and gas properties. The fair value of a liability for an ARO is required to be recognized in the period in which it is incurred if a reasonable estimate of fair value can be made and the associated retirement costs can be capitalized as part of the carrying amount of the long-lived asset. The Company determined its ARO by calculating the present value of the estimated cash flows related to the liability based upon estimates derived from management and external consultants familiar with the requirements of the retirement, and the ARO is reflected in the accompanying consolidated balance sheets as an other long-term liability. The Company has not funded nor dedicated any assets to the retirement obligation.
The liability is periodically adjusted to reflect (1) new liabilities incurred; (2) liabilities settled during the period; (3) accretion expense; and (4) revisions to estimated future plugging and abandonment costs.
The following is a reconciliation of the liability as of December 31, 2013 and 2014 (in thousands):
December 31, | |||||||
2013 | 2014 | ||||||
Balance at the beginning of period | $ | 228 | $ | 305 | |||
Liabilities acquired during the period | — | 883 | |||||
Accretion expense | 19 | 141 | |||||
Revision in expected cash flows | 58 | — | |||||
Balance at the end of the period | $ | 305 | $ | 1,329 | |||
F-17
NOTE 6 – ACCRUED EXPENSES
As of December 31, 2013 and 2014, the significant components of accrued expenses reported in the accompanying consolidated balance sheets are as follows (in thousands):
December 31, | |||||||
2013 | 2014 | ||||||
Accrued compensation and benefits | $ | 158 | $ | 892 | |||
Accrued end-of-term charge (See Note 9) | — | 240 | |||||
Accrued interest | 46 | 15 | |||||
Accrued taxes | 46 | 223 | |||||
Accrued legal and professional fees | 61 | — | |||||
Accrued royalties | — | 164 | |||||
Accrued other | 106 | 258 | |||||
$ | 417 | $ | 1,792 | ||||
NOTE 7 – FAIR VALUE MEASUREMENTS
The following table summarizes the financial assets measured at fair value, on a recurring basis as of December 31, 2014 (in thousands):
Fair value measurements using | |||||||||||||||
Level 1 | Level 2 | Level 3 | Total | ||||||||||||
December 31, 2014 | |||||||||||||||
Short-term commodity derivatives, asset | $ | — | $ | 2,905 | $ | — | $ | 2,905 | |||||||
Long-term commodity derivatives, asset | — | 2,891 | — | 2,891 | |||||||||||
$ | — | $ | 5,796 | $ | — | $ | 5,796 | ||||||||
The Level 2 instruments presented in the table above consists of derivative instruments made up of commodity price swaps. The fair values of the Company's commodity derivative instruments are based upon the NYMEX futures value of oil less the contracted per barrel rate to be received. The Company records a liability associated with the futures contracts when the futures price of oil is greater than the contracted per barrel rate to be received and an asset when the futures price of oil is less than the contracted per barrel rate to be received.
NOTE 8 - DERIVATIVE INSTRUMENTS
The Company utilizes derivative financial instruments to manage risks related to changes in oil prices. The Company is currently engaged in oil commodity price swaps where a fixed price is received for a portion of the Company's oil production. In return, the Company pays a floating price based upon NYMEX oil prices. Although these arrangements are designed to reduce the downside risk of a decline in oil prices on the covered production, they conversely limit potential income from increases in oil prices and expose the Company to the credit risk of counterparties. The Company manages the default risk of counterparties by engaging in these agreements with only high credit quality multinational energy companies and through the continuous monitoring of their performance.
F-18
As of December 31, 2014 the Company had the following open positions on its outstanding commodity derivative contracts:
Period | Volume/Month (Bbls) | Price/Unit | Fair Value - Asset | |||||||
January 2015 - March 2015 | 8,400 | $ | 94.11 | 1,013,000 | ||||||
April 2015 - March 2016 | 7,300 | $ | 86.50 | 2,447,000 | ||||||
April 2016 - March 2017 | 6,550 | $ | 82.46 | 1,421,000 | ||||||
April 2017 - March 2018 | 5,800 | $ | 80.53 | 915,000 | ||||||
The derivative contracts are carried at fair value on the consolidated balance sheet as assets or liabilities. The Company has not elected to designate any of these as derivative contracts for hedge accounting. Accordingly, for each reporting period the contracts are marked-to-market and the resulting unrealized changes in the fair value of the assets and liabilities are recognized on the consolidated statements of operations. The payables and receivables resulting from the closed derivative contracts result in realized gains and losses recorded on the Company's consolidated statements of operations. The unrealized and realized gains and losses on derivative instruments are recognized in the gain on commodity derivatives line item located in other (expense) income. As of December 31, 2014 the Company had a current asset for commodity derivatives of $2,905,000 and a long-term asset for commodity derivatives of $2,891,000.
The following tables summarize the unrealized and realized gain on commodity derivatives (in thousands):
Year ended December 31, | ||||
2014 | ||||
Unrealized gain on commodity derivatives | 5,796 | |||
Realized gain on commodity derivatives | 227 | |||
6,023 | ||||
NOTE 9 - LONG TERM DEBT
On June 11, 2012, the Company entered into a secured term promissory note in the amount of $8.0 million. The note contains a 10.0% annual interest rate subject to increase based upon an increase in the prime rate. The loan is secured by substantially all assets of the Company, with the exception of the Coke Field Assets. The lender also received a warrant to purchase shares of the Company’s stock, which was exchanged for 18,208 common shares upon consummation of the Merger. Equal monthly principal payments are due over 27 months beginning in April 2013 through June 2015, plus an end of term charge of $280,000. As of December 31, 2013 and 2014, the ratable liability for the end of term charge was $144,000 and $240,000, respectively, and it is included in other long-term liabilities and accrued expenses in current liabilities on the accompanying 2013 and 2014 consolidated balance sheets, respectively. The loan agreement contains covenants which place restrictions on the incurrence of debt, liens and capital expenditures. As of December 31, 2013 and December 31, 2014 the outstanding loan balance was $5,238,000 and $1,750,000, respectively. The Company is in compliance with all the covenants as of December 31, 2014. Subsequent to December 31, 2014, all remaining principal and interest on the note was paid (See NOTE 16).
On March 14, 2014 in connection with the closing of the acquisition of the Coke Field Assets, the Company entered into two financing agreements of $18.0 million and $4.0 million in order to fund a portion of the $38.0 million in cash required for the acquisition.
The $18.0 million note is a senior secured term loan facility of Glori Energy Production Inc. and is secured by the Coke Field Assets and shares of common stock of Glori Energy Production Inc. The loan has a three year term bearing interest at 11.0% per annum, subject to increase upon a LIBOR rate increase above 1%. The credit agreement requires quarterly principal payments equal to 50% of the excess cash flows, as defined, from the Coke Field Assets during the first year and 75% thereafter subject to a minimum quarterly principal payment of $112,500 plus interest.
F-19
The loan was funded net of closing costs of 2%, or $360,000, which is included in deferred loan costs on the consolidated balance sheets and is being amortized over the loan term. The loan agreement contains covenants which place restrictions on Glori Energy Production’s ability to incur additional debt, incur other liens, make other investments, capital expenditures and the sale of assets.
Commencing with the quarter ended June 30, 2014, Glori Energy Production is also required to maintain certain financial ratios related to debt, working capital and proved reserves, all as defined in the loan agreement. In May and November of each year, in accordance with a procedure outlined in the loan agreement, the value of the collateral securing the note is redetermined based on engineering reserve reports submitted by Glori Energy Production. As of December 31, 2014, the outstanding loan balance was $17,428,000. Glori Energy Production Inc. is in compliance with all covenants as of December 31, 2014.
The $4.0 million note has a two year term bearing interest at 12.0% per annum and is secured by the assets of the Company but is subordinated to existing Company debt. The loan was funded net of closing costs of 2%, or $80,000, which were initially included in deferred loan costs on the consolidated balance sheet. The $4.0 million note principal and a $400,000 prepayment penalty plus accrued interest was paid in full on May 13, 2014, and the related remaining deferred loan costs were expensed.
On March 14, 2014, in connection with the purchase of the Coke Field Assets, a subsidiary of the Company, Glori Energy Production Inc., issued to Petro-Hunt an unsecured, subordinated convertible promissory note for $2.0 million bearing interest at 6.0% per annum. On April 14, 2014 the note was converted into 250,000 shares of post-Merger common stock.
Maturities on long-term debt during the next three years are as follows (in thousands):
Year ended December 31, | Amount | |||
2015 | $ | 2,380 | ||
2016 | 472 | |||
2017 | 16,373 | |||
$ | 19,225 | |||
NOTE 10 - LOSS PER SHARE
The Company follows current guidance for share-based payments which are considered as participating securities. Share-based payment awards that contain non-forfeitable rights to dividends, whether paid or unpaid, are designated as participating securities and are included in the computation of basic earnings per share. However, in periods of net loss, participating securities other than common stock are not included in the calculation of basic loss per share because there is not a contractual obligation for owners of these securities to share in the Company’s losses, and the effect of their inclusion would be anti-dilutive.
F-20
The following table sets forth the computation of basic and diluted earnings per share (in thousands, except per share data):
Year ended December 31, | |||||||||||
2012 | 2013 | 2014 | |||||||||
Numerator: | |||||||||||
Net loss | $ | (11,940 | ) | $ | (10,609 | ) | $ | (18,756 | ) | ||
Denominator: | |||||||||||
Weighted-average common shares outstanding - basic | 1,055 | 1,104 | 28,855 | ||||||||
Effect of dilutive securities | — | — | — | ||||||||
Weighted-average common shares - diluted | 1,055 | 1,104 | 28,855 | ||||||||
Net loss per common share - basic and diluted | $ | (11.32 | ) | $ | (9.61 | ) | $ | (0.65 | ) | ||
The following weighted average securities outstanding during the periods below were not included in the calculation of diluted shares outstanding as they would have been anti-dilutive (in thousands):
Year ended December 31, | ||||||||
2012 | 2013 | 2014 | ||||||
Common stock warrants | — | — | 4,895 | |||||
Common stock options | 1,738 | 1,898 | 2,311 | |||||
NOTE 11 - INCOME TAXES
At December 31, 2013 and 2014, the Company had operating loss carryforwards for federal income tax reporting purposes of approximately $36.9 million and $51.9 million, respectively, which will begin to expire in the year 2025, net operating losses for state income tax reporting purposes of approximately $5.3 million and $5.7 million, respectively, which will begin to expire in 2021, and tax credits of approximately $450,000 which will begin to expire in 2027. The Net Operating Loss ("NOL") carry forward has been reduced by approximately $5.4 million because management estimates such amount of the loss carry forwards will expire due to limitations from changes in control.
F-21
Income tax benefit for the periods presented differs from the U.S. Federal benefit calculated at the statutory income tax rate due to the following (in thousands):
Year ended December 31, | |||||||||||
2012 | 2013 | 2014 | |||||||||
Federal benefit at statutory income tax rate | $ | (4,059 | ) | $ | (3,607 | ) | $ | (6,692 | ) | ||
R&D credits | — | (118 | ) | (83 | ) | ||||||
Non-deductible (taxable) expenses & other items | 596 | (17 | ) | (380 | ) | ||||||
State income taxes - net of federal benefit | (25 | ) | (19 | ) | (221 | ) | |||||
Foreign income taxes | — | — | 209 | ||||||||
Embedded derivative cancellation | — | 797 | — | ||||||||
Change in valuation allowance | 3,488 | 2,964 | 7,376 | ||||||||
Taxes on income | $ | — | $ | — | $ | 209 | |||||
F-22
The tax effects of temporary differences that give rise to significant portions of the Company’s net deferred tax assets at December 31, 2013 and 2014 are as follows (in thousands):
Year ended December 31, | |||||||
2013 | 2014 | ||||||
Current deferred tax asset | |||||||
Deferred revenue and other | $ | 410 | $ | 248 | |||
Allowance for doubtful accounts | 27 | — | |||||
437 | 248 | ||||||
Less Valuation allowance | (437 | ) | (225 | ) | |||
— | 23 | ||||||
Current deferred tax liability | |||||||
Current portion of swap asset | — | 993 | |||||
Current deferred tax liability, net | — | 970 | |||||
Non-current deferred tax asset | |||||||
NOL carryforwards (long-term) | 10,737 | 16,077 | |||||
R&D credits | 367 | 450 | |||||
Other accrued expenses | 22 | — | |||||
Stock compensation | 129 | 154 | |||||
Depreciable property basis | 556 | 740 | |||||
Oil and gas properties | 104 | 4,040 | |||||
11,915 | 21,461 | ||||||
Less Valuation allowance | (11,915 | ) | (19,503 | ) | |||
— | 1,958 | ||||||
Non-current deferred tax liability | |||||||
Non-current portion of swap asset | — | 988 | |||||
Non-current deferred tax asset, net | — | 970 | |||||
Total deferreds, net | $ | — | $ | — | |||
F-23
The provision (benefit) for income taxes from continuing operations for the periods indicated are comprised of the following (in thousands):
Year ended December 31, | |||||||
2013 | 2014 | ||||||
Current tax provision (benefit): | |||||||
Federal | — | — | |||||
Foreign | — | 209 | |||||
State | — | — | |||||
Total | $ | — | $ | 209 | |||
Deferred tax provision (benefit): | |||||||
Federal | — | — | |||||
Foreign | — | — | |||||
State | — | — | |||||
Total | $ | — | $ | — | |||
Total tax provision (benefit): | |||||||
Federal | — | — | |||||
Foreign | — | 209 | |||||
State | — | — | |||||
Total | $ | — | $ | 209 | |||
The valuation allowance for deferred tax assets increased by $7.4 million in 2014. In determining the carrying value of a deferred tax asset, accounting standards provide for the weighing of evidence in estimating whether and how much of a deferred tax asset may be recoverable. As we have incurred net operating losses in 2014 and prior years, relevant accounting guidance suggests that cumulative losses in recent years constitute significant negative evidence, and that future expectations about income are insufficient to overcome a history of such losses. Therefore, with the before-mentioned adjustment of $7.4 million, we have reduced the carrying value of our net deferred tax asset to zero. The valuation allowance has no impact on our net operating loss position for tax purposes, and if we generate taxable income in future periods, we will be able to use our NOLs to offset taxes due at that time. We will continue to assess the valuation allowance against deferred tax assets considering all available evidence obtained in future reporting periods.
Internal Revenue Code Section 382 places a limitation (the “Section 382 Limitation”) on the amount of taxable income that can be offset by an NOL after a change in control (typically, a greater than 50% change in ownership) of a loss corporation. Generally, after a control change, loss corporations cannot deduct NOL carryforwards in excess of the Section 382 Limitation.
Management believes that the issuance of Series B Preferred Stock on October 15, 2009 has resulted in the Section 382 Limitation, and thereby the federal net operating loss carryovers have been reduced by the estimated effect.
As of December 31, 2013 the Company had an uncertain tax position related to not filing Form 926 Return by a U.S. Transferor of Property to a Foreign Corporation in the amount of approximately $31,000, for the tax years 2010 and 2011 and these forms would have reported cash transfers to support the operations of its subsidiary Glori Oil S.R.L. The Company has amended these returns and believes any liability will be abated and no longer has an uncertain tax position; accordingly, the Company has not recognized any liability in the accompanying consolidated financial statements. The Company does not expect a material change to the consolidated financial statements related to uncertain tax positions in the next 12 months. The Company recognizes interest and penalties accrued related to unrecognized tax benefits in income tax expense.
F-24
NOTE 12 – EMPLOYEE RETIREMENT SAVINGS PLAN
The Company sponsors an employee retirement saving plan (the “401(k) Plan”) that is intended to qualify under Section 401(k) of the Internal Revenue Code. The 401(k) Plan is designed to provide eligible employees with an opportunity to make regular voluntary contributions into a long-term investment and saving program. There is no minimum age or service requirement to participate, and the Company may make discretionary matching contributions. For the years ended December 31, 2012 and 2013, the Company made no discretionary matching contributions. For the year ended December 31, 2014 the Company made matching contributions of $67,000.
NOTE 13 - COMMITMENTS AND CONTINGENCIES
Litigation
From time to time, the Company may be subject to legal proceedings and claims that arise in the ordinary course of business. The Company is not a party to any material litigation or proceedings and is not aware of any material litigation or proceedings, pending or threatened against it.
Commitments
The Company leases two buildings in Houston, Texas and a warehouse facility in Gull Lake, Saskatchewan under operating leases. The Company has a two-year lease agreement for 7,805 square feet of office space in Houston's Westchase District for $18,498 per month, with a one-year extension option at a 4% increase in rent and two one-year extension options at a to be mutually agreed upon market rate with the lessor. The Company's original Houston building lease, which contains office space, warehouse space and a laboratory, expires in May 2017 and is leased for $10,586 per month. The Saskatchewan warehouse is a month-to-month lease which rents for $1,000 per month CDN and is cancelable with 30 days’ notice.
Approximate minimum future rental payments under these noncancelable operating leases as of December 31, 2014 are as follows (in thousands):
Year ended December 31, | ||||
2015 | $ | 356 | ||
2016 | 295 | |||
2017 | 53 | |||
$ | 704 | |||
Total rent expense for the years ended December 31, 2012, 2013, and 2014, was $181,000, $265,000, and $291,000, respectively.
NOTE 14 - STOCK-BASED COMPENSATION
Stock Incentive Plan
As a result of the Merger with Infinity Corp. which consummated on April 14, 2014, the issued and outstanding stock options were canceled and reissued as stock options in the newly merged entity at a conversion ratio of 2.9 to 1.0 pre-Merger stock options to post-Merger stock options. The exercise price of the Glori stock options also increased by the same factor of 2.9. All option disclosures in the note below are shown as converted using these factors. As of December 31, 2013, the total common stock available for issuance pursuant to the Glori Oil Limited 2006 Stock Option and Grant Plan (the “Plan”) was 2,581,190, as converted. As of April 14, 2014, the plan was amended such that no further options would be issued.
In December 2014, the Company approved the adoption of the 2014 Long Term Incentive Plan ("the 2014 Plan") which authorized 2,000,000 shares to be available for issuance to officers, directors, employees, and affiliates of the Company. Options are issued at an exercise price equal to the fair market value of the Company’s common stock at the grant date. Generally, the options vest 25 percent after one year, and thereafter ratably by month over the following 36 months, and may be exercised for a period of 10 years subject to vesting.
Stock-based compensation expense is included primarily in selling, general and administrative expense and was $291,000, $774,000, and $296,000 for the years ended December 31, 2012, 2013, and 2014, respectively.
F-25
The Company has future unrecognized compensation expense for nonvested shares at December 31, 2014 of $246,000 which are maintaining weighted average vesting period of 1.6 years.
The following table summarizes the activity of the Company’s plan related to stock options:
Number of options | Weighted average exercise price per share | Weighted average remaining contractual term (years) | Aggregate intrinsic value | |||||||||
Outstanding - January 1, 2012, as converted | 1,453,534 | $ | 1.02 | 8.4 | ||||||||
Awarded | 301,026 | 3.34 | ||||||||||
Forfeited or Expired (1) | (16,927 | ) | 1.13 | |||||||||
Outstanding as of December 31, 2012 | 1,737,633 | 1.42 | 7.7 | $ | 3,339,000 | |||||||
Awarded | 913,853 | 1.16 | ||||||||||
Exercised | (79,003 | ) | 0.23 | 74,000 | ||||||||
Forfeited or Expired (1) | (250,303 | ) | 1.86 | |||||||||
Outstanding as of December 31, 2013 | 2,322,180 | 0.81 | 7.7 | 782,000 | ||||||||
Awarded | 7,103 | 1.16 | ||||||||||
Exercised | (9,397 | ) | 1.16 | 70,000 | ||||||||
Forfeited or Expired (1) | (19,836 | ) | 1.16 | |||||||||
Outstanding as of December 31, 2014 | 2,300,050 | $ | 0.82 | 6.72 | $ | 7,725,000 | ||||||
Exercisable as of December 31, 2014 (2) | 2,099,345 | $ | 0.79 | 6.60 | $ | 7,119,000 | ||||||
(1) | Management considers the circumstances generating these forfeitures to be unusual and nonrecurring in nature; accordingly, no allowance for forfeitures of options to purchase shares has been considered in determining future vesting or expense. |
(2) | The employee options shown as exercisable are subject to a one year lock up agreement pursuant to the terms of the Merger whereby these options, although fully vested, cannot be exercised until April 15, 2015, the day after the first anniversary of the Merger. |
The weighted-average grant date fair value for equity options granted during the year was $0.22 and $1.16 for the year ended December 31, 2013 and 2014, respectively. The total fair value of options vested during the years ended December 31, 2012, 2013, and 2014 was $223,000, $818,000, and $303,000, respectively.
The Company has computed the fair value of all options granted during the years ended December 31, 2012, 2013 and 2014 using the Black-Scholes option pricing model using the following assumptions:
Year ended December 31, | |||||
2012 | 2013 | 2014 | |||
Risk-free interest rate | 0.87% | 2.23% | 2.44% | ||
Expected volatility | 89% | 55% | 55% | ||
Expected dividend yield | — | — | — | ||
Expected life (in years) | 4.47 | 7.09 | 7.00 | ||
Expected forfeiture rate | — | — | — | ||
F-26
NOTE 15 – SEGMENT INFORMATION
The Company generates revenues through the production and sale of oil and natural gas (the “Oil and Gas Segment”) and through the Company’s services provided to third party oil companies (the “AERO Services Segment”). The Oil and Gas Segment produces and develops the Company’s acquired oil and natural gas interests and the revenues derived from this segment are from sales to the first purchaser.
The Company currently uses three such arrangements, one for the Etzold Field located in Seward County, Kansas and one for natural gas and one for oil for the Coke and Quitman Fields located in Wood County, Texas.
The AERO Services Segment derives revenues from external customers by providing the Company’s biotechnology solutions of enhanced oil recovery through a two-step process consisting of (1) the Analysis Phase and (2) the Field Deployment Phase.
The Analysis Phase work is a reservoir screening process whereby the Company obtains field samples and evaluates the Company’s potential for AERO Services Segment success. This process is performed at the Company’s Houston laboratory facilities. The Science and Technology expenses shown on the Company’s consolidated statements of operations are the expenses that are directly attributable to the Analysis Phase and expenses associated with the Company’s on-going research and development of its technology.
In the Field Deployment Phase, the Company deploys skid mounted injection equipment used to inject nutrient solution in the oil reservoir. The work in this phase is performed in oil fields of customers located in the United States and internationally and in the Company’s own oil fields. The service operations expense shown on the Company’s consolidated statements of operations are the expenses that are directly attributable to the Field Deployment Phase.
Earnings of industry segments exclude income taxes, interest income, interest expense and unallocated corporate expenses.
Although the AERO Services Segment provides enhanced oil recovery services to the Oil and Gas Segment, the Company does not utilize intercompany charges. The direct costs of the services such as the injection solution, transportation of the solution and expenses associated with the injection are charged directly to the Oil and Gas Segment. All of the AERO Services Segment capital expenditures and depreciation associated with injection equipment is viewed as part of the AERO Services Segment.
The following tables set forth summary financial data by operating segments (in thousands):
Oil and Gas | AERO Services | Corporate | Total | ||||||||||||
Year ended December 31, 2012 | |||||||||||||||
Revenues | $ | 463 | $ | 1,718 | $ | — | $ | 2,181 | |||||||
Operating expenses | 1,768 | 2,115 | 4,870 | 8,753 | |||||||||||
Write-off of deferred offering costs | — | — | 1,492 | 1,492 | |||||||||||
Depreciation, depletion and amortization | 130 | 398 | 50 | 578 | |||||||||||
Loss from operations | (1,435 | ) | (795 | ) | (6,412 | ) | (8,642 | ) | |||||||
Other expense | — | — | (3,298 | ) | (3,298 | ) | |||||||||
Net loss | $ | (1,435 | ) | $ | (795 | ) | $ | (9,710 | ) | $ | (11,940 | ) | |||
Property, plant and equipment, net | $ | 2,957 | $ | 2,007 | $ | 76 | $ | 5,040 | |||||||
Total assets | $ | 2,957 | $ | 2,283 | $ | 19,237 | $ | 24,477 | |||||||
F-27
Oil and Gas | AERO Services | Corporate | Total | ||||||||||||
Year ended December 31, 2013 | |||||||||||||||
Revenues | $ | 576 | $ | 2,643 | $ | — | $ | 3,219 | |||||||
Operating expenses | 2,211 | 2,281 | 5,961 | 10,453 | |||||||||||
Impairment of oil and gas properties | 2,190 | — | — | 2,190 | |||||||||||
Write-off of deferred offering costs | — | — | 126 | 126 | |||||||||||
Depreciation, depletion and amortization | 200 | 387 | 35 | 622 | |||||||||||
Loss from operations | (4,025 | ) | (25 | ) | (6,122 | ) | (10,172 | ) | |||||||
Other expense | — | — | (437 | ) | (437 | ) | |||||||||
Net loss | $ | (4,025 | ) | $ | (25 | ) | $ | (6,559 | ) | $ | (10,609 | ) | |||
Property, plant and equipment, net | $ | 658 | $ | 2,090 | $ | 62 | $ | 2,810 | |||||||
Total assets | $ | 658 | $ | 2,421 | $ | 21,540 | $ | 24,619 | |||||||
Oil and Gas (1) | AERO Services | Corporate | Total | ||||||||||||
Year ended December 31, 2014 | |||||||||||||||
Revenues | $ | 11,724 | $ | 4,135 | $ | — | $ | 15,859 | |||||||
Operating expenses | 10,777 | 3,528 | 7,788 | 22,093 | |||||||||||
Impairment of oil and gas property | 13,160 | — | — | 13,160 | |||||||||||
Depreciation, depletion and amortization | 4,188 | 404 | 32 | 4,624 | |||||||||||
(Loss) income from operations | (16,401 | ) | 203 | (7,820 | ) | (24,018 | ) | ||||||||
Other income (expense) | 6,023 | — | (552 | ) | 5,471 | ||||||||||
Taxes on income | — | — | 209 | 209 | |||||||||||
Net loss | $ | (10,378 | ) | $ | 203 | $ | (8,581 | ) | $ | (18,756 | ) | ||||
Property, plant and equipment, net | $ | 27,078 | $ | 1,636 | $ | 99 | $ | 28,813 | |||||||
Total assets | $ | 34,163 | $ | 1,789 | $ | 31,483 | $ | 67,435 | |||||||
(1) | The Oil and Gas Segment for the year ended December 31, 2014 includes direct revenues and expenses not previously included in prior years related to the Coke Field Assets and the Southwest Operating Assets. Included in 2014 are revenues of $11,398,000, operating expenses (including severance taxes) of $7,873,000, depreciation, depletion and amortization of $3,902,000 and gain on commodity derivatives of $6,023,000 (included in other income (expense)) related to these acquisitions and impairment of oil and gas properties of $12,707,000 which are not included in the year ended December 31, 2013 or year ended December 31, 2012. |
F-28
The following table shows the total revenue by geography (in thousands):
Year ended December 31, | |||||||||||
2012 | 2013 | 2014 | |||||||||
Revenues | |||||||||||
United States | $ | 1,957 | $ | 2,201 | $ | 13,233 | |||||
Canada | 224 | 952 | 2,220 | ||||||||
Other foreign countries | — | 66 | 406 | ||||||||
Total revenues | $ | 2,181 | $ | 3,219 | $ | 15,859 | |||||
NOTE 16 – SUBSEQUENT EVENTS
On March 2, 2015, the Company elected to prepay its entire remaining indebtedness to Hercules. The total payment was approximately $900,000 which included the end-of-term charge of $280,000.
NOTE 17 – SUPPLEMENTAL INFORMATION FOR OIL AND GAS PRODUCING ACTIVITIES (Unaudited)
Reserve Quantity Information
For all years presented, the estimate of proved reserves and related valuations were based on reports prepared by the Company’s independent petroleum engineers.
Proved reserve estimates included herein conform to the definitions prescribed by the U.S. Securities and Exchange Commission. The estimates of proved reserves are inherently imprecise and are continually subject to revision based on production history, results of additional exploration and development, price changes and other factors.
Proved reserves are estimated quantities of crude oil, natural gas and natural gas liquids, which geological and engineering data demonstrate with reasonable certainty to be recoverable in future years from known reservoirs under economic and operating conditions existing as of the end of each respective year. Proved developed reserves are those that are expected to be recovered through existing wells with existing equipment and operating methods.
The Company presents the volume disclosures below on an MBoe basis as the Company believes it's natural gas revenues and volumes are immaterial to it's overall oil and gas operations.
F-29
Presented below is a summary of the changes in estimated proved reserves of the Company, all of which are located in the United States, for the years ended December 31, 2013 and 2014:
Quantities of Proved Reserves:
Crude Oil | ||
(MBoe) | ||
Proved Developed Reserves, December 31, 2012 | 160 | |
Production | (5 | ) |
Purchase of minerals in place (1) | 75 | |
Revisions of previous estimates (2) | (127 | ) |
Proved Developed Reserves, December 31, 2012 | 103 | |
Production | (6 | ) |
Revisions of previous estimates (3) | (79 | ) |
Proved Developed Reserves, December 31, 2013 | 18 | |
Purchase of minerals in place (4) | 1,792 | |
Production | (145 | ) |
Revisions of previous estimates (5) | (254 | ) |
Proved Developed Reserves, December 31, 2014 | 1,411 | |
(1) | In September 2012, the Company acquired a 100% working interest in a property adjacent to the Company’s previously leased property in Kansas, the Etzold Field. |
(2) | The Etzold field was developed in phases. During 2011 only the initial phase was operating and thus the reserves for the second phase were based on the results achieved in the initial phase. These reserve estimates declined as of December 31, 2012 since the second phase production results were not as economically favorable as the initial phase. |
(3) | Unfavorable production results on wells achieved in 2013 led to the Company's decision to abandon the proved developed behind pipe reserves as recent results indicated these reserves would be uneconomic to produce. |
(4) | Purchase of the Coke Field Assets on March 14, 2014 and the Southwest Operating Assets on September 1, 2014. |
(5) | The reserves revision is due to an increase in costs over our prior year reserve report. |
Proved Developed and Undeveloped Reserves:
Crude Oil | ||
(MBoe) | ||
December 31, 2012 | ||
Proved developed reserves | 103 | |
Proved undeveloped reserves | — | |
Total | 103 | |
December 31, 2013 | ||
Proved developed reserves | 18 | |
Proved undeveloped reserves | — | |
Total | 18 | |
December 31, 2014 | ||
Proved developed reserves | 1,411 | |
Proved undeveloped reserves | — | |
Total | 1,411 | |
F-30
Capitalized Costs Related to Oil and Gas Producing Activities
The following table presents the Company’s capitalized costs related to oil and gas producing activities at December 31, 2013 and 2014 (in thousands):
December 31, | |||||||
2013 | 2014 | ||||||
Unproved properties | $ | — | $ | 196 | |||
Proved properties | 3,141 | 45,694 | |||||
Total | 3,141 | 45,890 | |||||
Less - accumulated depreciation, depletion and amortization (1) | (2,493 | ) | (19,612 | ) | |||
Net capitalized costs | $ | 648 | $ | 26,278 | |||
(1) | Accumulated depreciation, depletion and amortization includes the 2013 oil and gas property impairment of $2,190,000 and the 2014 impairment of $13,160,000. |
Costs Incurred in Oil and Gas Producing Activities
The following table presents the net costs incurred in property acquisition, exploration and development activities for the years ended December 31, 2013 and 2014 (in thousands):
Year ended December 31, | |||||||||||
2012 | 2013 | 2014 | |||||||||
Acquisition of properties | $ | 139 | $ | — | $ | 42,788 | |||||
Development | 1,227 | 84 | — | ||||||||
Total costs incurred | $ | 1,366 | $ | 84 | $ | 42,788 | |||||
F-31
Results of Operations from Oil and Gas Producing Activities
The following table presents the Company’s results of operations from oil and gas producing activities for the years ended December 31, 2012, 2013 and 2014 (in thousands):
For the Year ended December 31, | |||||||||||
2012 | 2013 | 2014 | |||||||||
Revenues from oil and gas producing activities | $ | 463 | $ | 576 | $ | 11,724 | |||||
Production costs | 513 | 433 | 6,631 | ||||||||
Ad valorem taxes | 15 | 42 | 438 | ||||||||
State severance taxes | 21 | 26 | 547 | ||||||||
Impairment of oil and gas property | — | 2,190 | 13,160 | ||||||||
Depreciation, depletion and amortization | 111 | 177 | 3,960 | ||||||||
Total expenses | 660 | 2,868 | 24,736 | ||||||||
Pre-tax loss from producing activities | (197 | ) | (2,292 | ) | (13,012 | ) | |||||
Income tax expense | — | — | — | ||||||||
Results of oil and gas producing activities | $ | (197 | ) | $ | (2,292 | ) | $ | (13,012 | ) | ||
Standardized Measure of Discounted Future Net Cash Flows
The standardized measure of discounted future net cash flows relating to proved oil and gas reserves and the changes in standardized measure of discounted future net cash flows relating to proved oil and natural gas reserves were prepared in accordance with ASC 932, Extractive Activities – Oil and Gas. Future cash inflows as of December 31, 2013 and 2014, were computed by applying average fiscal-year prices (calculated as the unweighted arithmetic average of the first-day-of-the-month price for each month within the 12-month periods ended December 31, 2013 and 2014) to estimated future production. Future production and development costs are computed by estimating the expenditures to be incurred in developing and producing the proved oil and natural gas reserves at year-end, based on year-end costs and assuming the continuation of existing economic conditions.
Future income tax expense is calculated by applying appropriate year-end tax rates to future pretax net cash flows relating to proved oil and natural gas reserves, less the tax basis of the properties involved. Future income tax expense gives effect to permanent differences, tax credits and loss carry forwards relating to the proved oil and natural gas reserves. Future net cash flows are discounted at a rate of 10% annually to derive the standardized measure of discounted future net cash flows. This calculation does not necessarily result in an estimate of the fair value of the Company’s oil and gas properties.
F-32
Presented below is the standardized measure of discounted future net cash flows (in thousands):
Year ended December 31, | |||||||||||
2012 | 2013 | 2014 | |||||||||
Future cash inflows | $ | 9,087 | $ | 1,603 | $ | 133,235 | |||||
Future production and development costs | |||||||||||
Production | (5,203 | ) | (896 | ) | (86,032 | ) | |||||
Development | (721 | ) | — | — | |||||||
Future cash flows before income taxes | 3,163 | 707 | 47,203 | ||||||||
Future income taxes | (225 | ) | — | — | |||||||
Future net cash flows after income taxes | 2,938 | 707 | 47,203 | ||||||||
10% annual discount for estimated timing of cash flows | (1,150 | ) | (146 | ) | (17,111 | ) | |||||
Standardized measure of discounted future net cash flows | $ | 1,788 | $ | 561 | $ | 30,092 | |||||
The following reconciles the changes in the standardized measure of discounted future net cash flows (in thousands):
Year ended December 31, | |||||||||||
2012 | 2013 | 2014 | |||||||||
Balance, beginning of year | $ | 1,020 | $ | 1,788 | $ | 561 | |||||
Changes from: | |||||||||||
Sales, net of production costs | 65 | (101 | ) | (4,108 | ) | ||||||
Net changes in prices and production costs | (1,233 | ) | (15 | ) | 2,445 | ||||||
Changes in estimated future development costs | (596 | ) | (655 | ) | — | ||||||
Development costs incurred during the year, previously estimated | 1,031 | — | — | ||||||||
Revisions to quantity estimates | (770 | ) | (638 | ) | (8,044 | ) | |||||
Accretion of discount | 245 | 56 | 56 | ||||||||
Purchases of reserves in place | 1,351 | — | 38,211 | ||||||||
Net changes in income taxes | (164 | ) | (65 | ) | — | ||||||
Changes in timing of cash flows and other | 839 | 191 | 971 | ||||||||
Balance, end of year | $ | 1,788 | $ | 561 | $ | 30,092 | |||||
F-33
NOTE 18 - SELECTED QUARTERLY FINANCIAL RESULTS (Unaudited)
Unaudited quarterly operating results were as follows (in thousands; except per share data):
2013 (Quarter ended) | |||||||||||||||
March 31 | June 30 | September 30 | December 31 | ||||||||||||
(Unaudited) | |||||||||||||||
Net revenues | $ | 724 | $ | 935 | $ | 775 | $ | 785 | |||||||
Loss from operations | (2,028 | ) | (1,821 | ) | (1,766 | ) | (4,557 | ) | |||||||
Net loss applicable to stockholders | (2,308 | ) | (2,074 | ) | (825 | ) | (5,402 | ) | |||||||
Net loss per common share, basic and diluted (1) | $ | (2.17 | ) | $ | (1.92 | ) | $ | (0.73 | ) | $ | (4.76 | ) | |||
Weighted average shares outstanding, basic and diluted (2) | 1,064 | 1,078 | 1,136 | 1,136 | |||||||||||
2014 (Quarter ended) | |||||||||||||||
March 31 | June 30 | September 30 | December 31 | ||||||||||||
(Unaudited) | |||||||||||||||
Net revenues | $ | 1,002 | $ | 5,556 | $ | 5,458 | $ | 3,843 | |||||||
Loss from operations | (2,796 | ) | (1,880 | ) | (1,633 | ) | (17,709 | ) | |||||||
Net loss applicable to stockholders | (684 | ) | (6,060 | ) | (356 | ) | (11,656 | ) | |||||||
Net loss per common share, basic and diluted (1) | $ | (0.60 | ) | $ | (0.20 | ) | $ | (0.01 | ) | $ | (0.37 | ) | |||
Weighted average shares outstanding, basic and diluted (2) | 1,137 | 29,642 | 31,475 | 31,499 | |||||||||||
1) Quarterly loss per share is based on the weighted average number of shares outstanding during the quarter. Because of changes in the number of shares outstanding during the quarters, due to the exercise of stock options and issuance of common stock, the sum of quarterly losses per share may not equal loss per share for the year.
2) As a result of the Merger with Infinity Corp., which consummated on April 14, 2014, the issued and outstanding common stock was canceled and reissued as common stock in the newly merged entity at a conversion ratio of 2.9 pre-Merger common stock to 1 post-Merger common stock. For the periods prior to the Merger, the above table reflects the common stock as converted to post-Merger common stock using this ratio.
F-34
EXHIBIT INDEX | |
Exhibit | Description |
2.1 | Merger and Share Exchange Agreement, dated January 8, 2014, by and among Infinity Cross Border Acquisition Corporation, Glori Acquisition Corp., Glori Merger Subsidiary, Inc., Infinity-C.S.V.C. Management Ltd. in its capacity as the INXB Representative and Glori Energy Inc. (incorporated by reference to Exhibit 2.1 to the Company’s Form 8-K/A filed with the Securities and Exchange Commission on May 2, 2014) |
2.2 | First Amendment to the Merger and Share Exchange Agreement, dated February 20, 2014, by and among Infinity Cross Border Acquisition Corporation, Glori Acquisition Corp., Glori Merger Subsidiary, Inc., Infinity-C.S.V.C. Management Ltd. in its capacity as the INXB Representative and Glori Energy Inc. (incorporated by reference to Exhibit 2.2 to the Company’s Form 8-K filed with the Securities and Exchange Commission on April 18, 2014) |
2.3 | Second Amendment to the Merger and Share Exchange Agreement, dated March 20, 2014, by and among Infinity Cross Border Acquisition Corporation, Glori Acquisition Corp., Glori Merger Subsidiary, Inc., Infinity-C.S.V.C. Management Ltd. in its capacity as the INXB Representative and Glori Energy Inc. (incorporated by reference to Exhibit 2.3 to the Company’s Form 8-K/A filed with the Securities and Exchange Commission on May 2, 2014) |
3.1 | Amended and Restated Certificate of Incorporation of Glori Energy Inc. (incorporated by reference to Exhibit 3.3 of the Company's Form 8-K/A, filed May 2, 2014) |
3.2 | Amended and Restated Bylaws of Glori Energy, Inc. (incorporated by reference to Exhibit 3.4 of the Company's Form 8-K, filed April 18, 2014) |
4.1 | Rights of Common Stockholders (incorporated by reference to Exhibit 3.1 and 3.2 hereto) |
4.2 | Lock-Up Agreement by and among Glori Acquisition Corp., Glori Energy Inc., Infinity-C.S.V.C. Management Ltd. in its capacity as the INXB Representative and each of the signatories thereto (incorporated by reference to Exhibit 4.3 of the Company's Form 8-K/A, filed May 2, 2014) |
4.3 | Registration Rights Agreement dated April 14, 2014 by and among Glori Acquisition Corp. and each of the signatories thereto (incorporated by reference to Exhibit 4.1 to the Company’s Form 8-K/A filed with the Securities and Exchange Commission on May 2, 2014) |
4.4 | Registration Rights Agreement dated April 14, 2014 by and among Infinity Cross Border Acquisition Corporation, Glori Acquisition Corp. and each of the buyers thereto (incorporated by reference to Exhibit 4.2 to the Company’s Form 8-K/A filed with the Securities and Exchange Commission on May 2, 2014) |
4.5 | Amendment No. 1 to Warrant Agreement dated April 14, 2014 between Infinity Cross Border Acquisition Corp. and Continental Stock Transfer & Trust Company (incorporated by reference to Exhibit 4.4 to the Company’s Form 8-K/A filed with the Securities and Exchange Commission on May 2, 2014) |
4.6 | Warrant Agreement dated June 12, 2014 by and between Glori Energy Inc. and Continental Stock Transfer & Trust Company (including form of Warrant Certificate) (incorporated by reference to Exhibit 4.6 of the Company’s Form S-3/A, filed June 16, 2014) |
10.1 | Share Purchase Agreement, dated January 7, 2014, by and among Infinity Cross Border Acquisition Corporation, Glori Acquisition Corp. and each of the buyers thereto (incorporated by reference to Exhibit 10.1 of the Company’s Form 8-K, filed April 18, 2014 |
10.2 | Agency Representation Agreement, effective December 31, 2013, by and among Glori Energy, Inc. and Petro-King Oilfield Technology LTD (incorporated by reference to Exhibit 10.5 of the Company's Form 8-K, filed April 18, 2014) |
10.3 | Loan and Security Agreement, dated as of June 11, 2012, by and among Glori Energy Inc., Glori California Inc., Glori Holdings Inc., Glori Oil (Argentina) Limited and Hercules Technology Growth Capital, Inc.(incorporated by reference to Exhibit 10.6 of the Company's Form 8-K, filed April 18, 2014) |
10.4 | Amendment No. 1 to Loan and Security Agreement, dated June 27, 2013, by and among Glori Energy Inc., Glori California Inc., Glori Holdings Inc., Glori Oil (Argentina) Limited and Hercules Technology Growth Capital, Inc.(incorporated by reference to Exhibit 10.7 of the Company's Form 8-K, filed April 18, 2014) |
10.5 | Warrant Agreement, dated June 11, 2012, by and among Glori Energy Inc. and Hercules Technology Growth Capital, Inc. (incorporated by reference to Exhibit 10.8 of the Company's Form 8-K, filed April 18, 2014) |
10.6 | Convertible Note Purchase Agreement, dated May 31, 2011, by and among Glori Energy Inc. and Energy Technology Ventures, LLC (incorporated by reference to Exhibit 10.9 of the Company's Form 8-K, filed April 18, 2014) |
10.7 | Series C-1 Preferred Stock and Warrant Purchase Agreement, dated April 30, 2013, by and among Glori Energy Inc. and the purchasers thereto (incorporated by reference to Exhibit 10.11 of the Company's Form 8-K, filed April 18, 2014) |
F-35
10.8 | Series C-2 Preferred Stock and Warrant Purchase Agreement, dated March 14, 2014, by and among Glori Energy Inc. and the purchasers thereto (incorporated by reference to Exhibit 10.12 of the Company's Form 8-K, filed April 18, 2014) |
10.9 | Note Purchase Agreement dated March 14, 2014, by and among Glori Energy Production Inc. and the purchasers thereto (incorporated by reference to Exhibit 10.13 of the Company's Form 8-K/A, filed May 2, 2014) |
10.10 | Second Lien Secured Term Note, dated March 13, 2014, by Glori Energy Inc. to E.W. Holdings Inc. (incorporated by reference to Exhibit 10.14 of the Company's Form 8-K/A, filed May 2, 2014) |
10.11 | Amendment and Assumption Agreement to the Glori Oil Limited 2006 Stock Option and Grant Plant dated April 14, 2014 (incorporated by reference to Exhibit 10.15 of the Company's Form 8-K, filed April 18, 2014) |
10.12 | Form of Termination and Release Agreement (incorporated by reference to Exhibit 10.18 of the Company's Form 8-K, filed April 18, 2014) |
10.13 | BP Swap Agreement (incorporated by reference to Exhibit 10.2 of the Company's Form 10-Q filed August 13, 2014) |
10.14 | Second Amendment to Note Purchase Agreement made and entered into as of August 11, 2014, between Glori Energy Production Inc., Stellus Capital Investment Corporation and each of the holders signatory signed thereto (incorporated by reference to Exhibit 10.1 of the Company's Form 10-Q filed August 13, 2014) |
10.15 | Office space lease agreement entered into as of October 2, 2014, between Glori Energy Inc. and Fugro N.V. (incorporated by reference to Exhibit 10.1 of the Company's Form 10-Q, filed November 12, 2014) |
10.16 † | Employment Agreement by and between Stuart M. Page and Glori Acquisition Corp. (incorporated by reference to Exhibit 10.2 of the Company's Form 8-K/A filed May 2, 2014) |
10.17 † | Employment Agreement by and between Victor M. Perez and Glori Acquisition Corp. (incorporated by reference to Exhibit 10.3 of the Company's Form 8-K/A, filed May 2, 2014) |
10.18 † | Employment Agreement by and between William M. Bierhaus II and Glori Acquisition Corp. (incorporated by reference to Exhibit 10.4 of the Company's Form 8-K/A, filed May 2, 2014) |
10.19 † | Form of Indemnification Agreement (incorporated by reference to Exhibit 10.16 of the Company's Form 8-K, filed April 18, 2014) |
10.20 † | Form of Director Agreement (incorporated by reference to Exhibit 10.17 of the Company's Form 8-K, filed April 18, 2014) |
10.21 † | Glori Oil Limited 2006 Stock Option and Grant Plan (incorporated by reference to Exhibit 99.1 of the Company’s Form S-8, filed August 21, 2014) |
10.22 † | Glori Energy Inc. 2014 Long Term Incentive Plan (incorporated by reference to Exhibit 99.1 of the Company’s Form S-8, filed December 29, 2014) |
10.23 † | Form of Employee Incentive Stock Option Award Agreement (incorporated by reference to Exhibit 99.2 of the Company’s Form S-8, filed December 29, 2014) |
10.24 † | Form of Employee Nonqualified Stock Option Award Agreement (incorporated by reference to Exhibit 99.3 of the Company’s Form S-8, filed December 29, 2014) |
10.25 † | Form of Employee Restricted Stock Award Agreement (incorporated by reference to Exhibit 99.4 of the Company’s Form S-8, filed December 29, 2014) |
10.26 † | Form of Director Restricted Stock Award Agreement (incorporated by reference to Exhibit 99.5 of the Company’s Form S-8, filed December 29, 2014) |
10.27 † | Form of Director Nonqualified Stock Option Award Agreement (incorporated by reference to Exhibit 99.6 of the Company’s Form S-8, filed December 29, 2014) |
10.28 † | Form of Consultant Restricted Stock Award Agreement (incorporated by reference to Exhibit 99.7 of the Company’s Form S-8, filed December 29, 2014) |
10.29 † | Form of Consultant Nonqualified Stock Option Award Agreement (incorporated by reference to Exhibit 99.8 of the Company’s Form S-8, filed December 29, 2014) |
14.1* | Code of Ethics and Business Conduct |
21.1 | List of Subsidiaries (incorporated by reference to Exhibit 21.1 of the Company's Form 8K, filed May 2, 2014) |
23.1* | Consent of Grant Thornton LLP |
23.2* | Consent of Collarini Associates |
23.3* | Consent of William M. Cobb & Associates Inc. |
31.1* | Certification by Stuart Page, Chief Executive Officer pursuant to Section 302 of the Sarbanes-Oxley Act of 2002 |
31.2* | Certification by Victor Perez, Chief Financial Officer pursuant to Section 302 of the Sarbanes-Oxley Act of 2002 |
32.1* | Certification by Stuart Page, Chief Executive Officer pursuant to Section 906 of the Sarbanes-Oxley Act of 2002 |
F-36
32.2* | Certification by Victor Perez, Chief Financial Officer pursuant to Section 906 of the Sarbanes-Oxley Act of 2002 |
99.1* | Collarini Associates Forecast of Production and Reserves at January 1, 2015 |
99.2* | William M. Cobb & Associates, Inc. reserve engineer report at January 1, 2015 |
101.INS* | XBRL Instance Document |
101.SCH* | XBRL Taxonomy Extension Schema Document |
101.CAL* | XBRL Taxonomy Extension Calculation Linkbase Document |
101.DEF* | XBRL Taxonomy Extenstion Definition Linkbase Document |
101.LAB* | XBRL Taxonomy Extension Label Linkbase Document |
101.PRE* | XBRL Taxonomy Extension Presentation Linkbase Document |
* | Filed herewith |
† | Indicates management contract or compensatory plan or arrangement. |
F-37