Attached files
| file | filename |
|---|---|
| 8-K - FORM 8-K - Manitex International, Inc. | d885132d8k.htm |
 Manitex
International, Inc. Corporate Presentation
(NASDAQ: MNTX)
March 2015
Exhibit 99.1 |
 2
Forward Looking Statements & Non-GAAP Measures
Safe Harbor Statement under the U.S. Private Securities Litigation Reform Act of 1995: This
presentation contains statements that are forward-looking in nature which express
the beliefs and expectations of management including statements regarding the
Company’s expected results of operations or liquidity; statements concerning projections,
predictions, expectations, estimates or forecasts as to our business, financial and
operational results and future economic performance; and statements of
management’s goals and objectives and other similar expressions concerning matters
that are not historical facts. In some cases, you can identify forward-looking
statements by terminology such as “anticipate,”
“estimate,”
“plan,”
“project,”
“continuing,”
“ongoing,”
“expect,”
“we believe,”
“we intend,”
“may,”
“will,”
“should,”
“could,”
and similar expressions. Such statements are based on current plans, estimates and
expectations and involve a number of known and unknown risks, uncertainties and other
factors that could cause the Company's future results, performance or achievements to
differ significantly from the results, performance or achievements expressed or
implied
by
such
forward-looking
statements.
These
factors
and
additional
information
are
discussed
in
the
Company's
filings with the Securities and Exchange Commission and statements in this presentation should
be evaluated in light of these important factors. Although we believe that these
statements are based upon reasonable assumptions, we cannot guarantee future results.
Forward-looking statements speak only as of the date on which they are made, and the
Company undertakes no obligation to update publicly or revise any forward-looking
statement, whether as a result of new information, future developments or otherwise.
Non-GAAP
Measures:
Manitex
International
from
time
to
time
refers
to
various
non-GAAP
(generally
accepted
accounting
principles) financial measures in this presentation. Manitex believes that this
information is useful to understanding its operating results without the impact of
special items. See Manitex’s Q4 2014 earnings release on the Investor Relations
section of our website www.manitexinternational.com for a description and/or reconciliation of
these measures. 3/6/2015
Nasdaq: MNTX |
 Global
provider of highly specialized cranes-
straight-mast and
knucklebooms
Materials and container
handling equipment also
sold through
dealerships, globally
Miscellaneous
specialized equipment
Company Snapshot
Manitex
International, Inc.
Niches
Served
Company
Origin
Energy exploration and
field development
Power line construction
Military
Railroads
Ports
Government/agency
Construction-residential
and non-residential
Launched as a private
company in 2003
Publicly traded on
NASDAQ: MNTX
Steady organic growth
Industry consolidator:
consistently adding
branded product lines
through M&A since
going public in 2006
3
3/6/2015
Nasdaq: MNTX |
 Company
Timeline 4
3/6/2015
Nasdaq: MNTX
July 2013: Acquires
Sabre Manufacturing LLC
December 2009: Acquires
Load King Trailers
July 2009: Acquires
Badger Equipment Co.
November 2006:
Veri-Tek
Acquires LiftKing
July 2007: VCC
acquires Noble
forklift
May 2008: Name changed to Manitex International
and listed on Nasdaq (MNTX)
October 2008:
Crane &
Machinery and
Schaeff Forklift
acquired
July 2006: Manitex
merges into Veri-Tek,
Intl. (VCC)
July 2010: CVS
Operating Agreement
2006
2007
2008
2009
2010
2011
2012
2013
July 2011: Closes
Acquisition of CVS
January 2003:
Manitowoc
divests
Manitex
March 2002:
Manitowoc
(NYSE:MTW)
acquires Grove
November 2013:
Acquires Valla SpA
of Piacenza, Italy
January 2015: Closes on
PM Group SpA
December 2014:
Closes on JV with
Terex for ASV
2015
2014 |
 •
Leading Italian
manufacturer of truck-
mounted hydraulic knuckle
boom cranes
•
Diverse product lines
ranging up to 108 metric
tonnes in lifting capacity;
sales in 50 countries
•
Engineered lifting equipment
•
Manitex boom trucks
•
SkyCrane aerial platforms
•
Sign cranes
•
RT forklifts
•
Special mission-oriented
vehicles
•
Carriers
•
Heavy material handling
•
Transporters & steel mill
equipment
Product Overview-Our Largest Product Groups
5
3/6/2015
Nasdaq: MNTX
•
Compact track loaders and
skid-steer loaders
•
Commercial and Residential
Markets
•
Generally ideal for pick &
carry and digging
applications, site clearance |
 Competitive
Positioning 6
Core Competencies
Strong brand history
Acknowledged product
development record
International dealers enable us to
follow demand
Focused on specialized equipment
and niche end-markets
Products
Niche markets
Broad end-user base
Highly customized/specialized;
will configure-to-order
Parts and service an important
part of business model
Superior ROI
Lower capital commitment for a boom truck vs.
competitors’
custom cranes of similar lifting capacity
Usually less or no special permitting vs. competitors’
custom cranes of similar lifting capacity
3/6/2015
Nasdaq: MNTX |
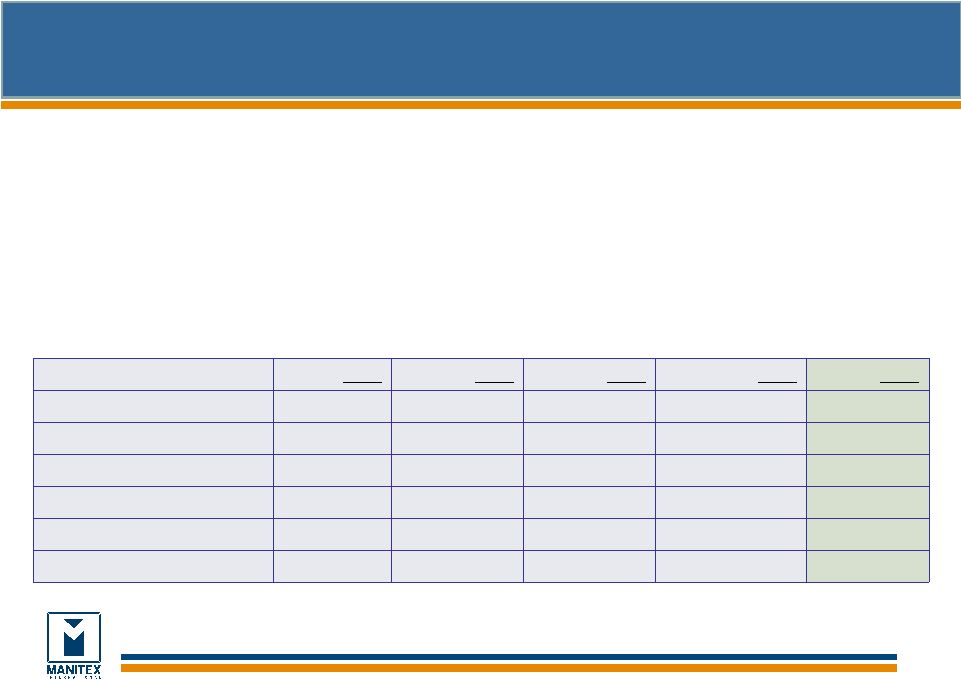 Financial Summary-Snapshot
$000, except %
2010
2011
2012
2013
2014
Revenues
$95,875
$142,291
$205,249
$245,072
$264,081
Gross Margin (%)
24.3%
20.6%
19.7%
19.0%
18.3%
Adjusted EBITDA**
$8,676
$11,120
$17,957
$21,483
$20,864
Adj. EBITDA Margin (%)**
9.0%
7.8%
8.7%
8.8%
7.9%
Net income**
$2,109
$2,780
$8,077
$10,178
$8,816**
Backlog
$39,905
$83,700
$130,352
$77,281
$107,327
Key Statistics
Stock Price
(3/5/15)
$11.70/share
Market Cap
(3/5/15)
$186.6M
Total Ent. Value
(3/5/15)*
$368M
Ticker / Exchange
MNTX/NasdaqCM
Capitalization
Basic Shares O/S
*
15.9M
Diluted Shares O/S
*
15.9M
Est. Total Debt
*
$186M
7
3/6/2015
Nasdaq: MNTX
*12/31/14 adjusted to include equity and debt issuance associated with
PM-Group transaction subsequent to 12/31/2014
** Excludes $1.7M in after-tax acquisition and other
costs--see
reconciliation of non-GAAP items, slide 20) |
 Key Transactions
2014/2015 -ASV and PM-Group 8
3/6/2015
Nasdaq: MNTX
•
ASV
(closed
12/2014)
is
our
Joint
Venture
with
Terex
Corporation
that
brings
a
broad
product
line
of
rubber-track
crawler
and
skid-steer
loaders
and
accessories
to
the
product
group.
•
ASV,
Inc.
had
trailing
twelve
month
revenues
of
approximately
$130
million.
•
Manitex
contributes
$25M
into
the
Joint
Venture,
with
$20M
in
common
shares
and
debt
securities
being
issued
to
Terex,
as
well
as
$5M
in
cash;
the
JV
has
$44M
in
non-recourse
debt.
•
PM-Group
S.p.A.,
(closed
1/2015)
is
a
leading
Italian
manufacturer
of
truck
mounted
hydraulic
knuckle
boom
cranes
with
a
product
range
spanning
more
than
50
models.
•
PM-Group
had
trailing
twelve
month
revenues
of
approximately
$100
million
.
•
Consideration
was
$91
million,
consisting
of
a
combination
of
debt,
equity,
and
the
assumption
of
$60
million
in
non-recourse
PM-Group
debt
and
liabilities.
A $500 Million+ Enterprise Entering 2015 |
 Consistent
Financial Growth 9
Historically
Consistent
EBITDA
Margin of
9.0%
2010-2013
CAGR was
36.7% (pre-
PM Group
and pre-ASV)
*2014 pro
forma bar
includes ASV
and PM
$M
Opportunity
2016E
2015E |
 Lifting Equipment
Market Overview—Straight Mast
Market Overview
Principal products: boom truck cranes that vary in height
& tonnage capacity
Smaller tonnage cranes (<30 tons) more focused on
general construction markets; larger cranes (30+ tons)
focus on power line construction and energy
Larger tonnage cranes in higher demand since economic
downturn
Boom truck cranes typically less expensive than rough
terrain and all terrain cranes
Manitex Market Position
Broader market: ~65% of cranes shipped in the smaller
tonnage range; ~75% of Manitex shipments have been in
larger tonnage
Focus on being a niche player allows specialization tailored
towards customers’
needs
Production distribution skewed toward larger tonnage
machines
First to launch 50-ton crane (May 2007)
Have developed a series of products around the demand
for larger tonnage cranes
10
3/6/2015
Nasdaq: MNTX |
 The Knuckle boom
Market- $2.3 Billion Globally
(Management Estimates)
11
3/6/2015
Nasdaq: MNTX
•
Large Market of $2.3 BN is roughly 2X the size of
the straight-mast boom truck market (global)
•
PM has a geographically diverse customer base with
70% of its business outside Europe
•
North American knuckleboom market is growing
•
Opportunity to increase PM Group’s No. American
market presence through Manitex’s distribution
network |
 Replacement
Parts & Service Consistent Recurring Revenue
12
•
Consistent recurring revenue stream throughout the cycle
–
Typically generates 10%-20% of net sales in a quarter/year (ASV is approx. 25%)
–
Typically carry 2x gross margin of core equipment business
•
Spares relate to swing drives, rotating components, and booms
among others, many of which are proprietary
–
Serve additional brands
–
Service team for crane equipment
–
Automated proprietary system implemented in principal operations
3/6/2015
Nasdaq: MNTX |
 Investment
Highlights 13
•
Niche markets with
solid demand
drivers for products
•
Steadying of
construction
environment and
energy markets
driving demand
•
Diverse end
markets result in
risk mitigation
•
Customer focused
design strategy
•
Diversified product
offering
•
Quickly adaptable
to changes in
demand*
•
Commitment to
innovation,
research, &
product
development
•
Revenue and
earnings growth
have consistently
outpaced market
and industrial peers
since 2009
•
Backlog at $107M
as of 12/31/2014
•
Manitex dealer
network provides
footprint for on-
going North
American expansion
•
PM Group has little
penetration in US
and has excellent
non-US and non-
Europe customer
base
•
No Customer
represents over 10%
of annual revenues
•
Seasoned senior
management:
over 70 years of
collective industry
experience
•
Successfully
integrated
multiple
acquisitions
•
Significant
management
ownership
Growth in
End Markets
Flexible
Operating
Model
Broad Industry
& Geographic
Distribution
Growth in
Key Financial
Metrics
Experienced
Management
3/6/2015
Nasdaq: MNTX
*In 2009 “Great Recession”
only ONE quarter without positive EBITDA
A consolidator in the lifting and hauling industry, Manitex International serves
addressable markets with an estimated $4 BN in annual sales
|
 14
Financial Overview
Manitex International, Inc.
Q4 2014
3/6/2015
Nasdaq: MNTX
*Q4 2014 Results may contain adjustments, please see reconciliation to GAAP
on Slide 20 and Manitex Full Year and Fourth Quarter 2014 earnings
release |
 Key Figures
- Quarterly
15
USD thousands except as noted
Q4-2014
Q4-2013
Q3-2014
Net sales
$66,909
$65,431
$66,197
Gross profit
12,601
12,779
10,915
Gross margin %
18.8%
19.5%
16.5%
Operating expenses
10,865
7,759
7,504
Adjusted Net Income
2,185
2,991
1,768
Adjusted EBITDA
5,330
6,225
4,519
EBITDA % of Sales
8.0%
9.5%
6.8%
Backlog ($ million)
107.3
77.3
102.1
3/6/2015
Nasdaq: MNTX |
 Summary Balance
Sheet 16
$000s
31-Dec-14
31-Dec-13
31-Dec-12
31-Dec-11
31-Dec-10
Current Assets
173,502
$121,798
$104,777
$71,209
$54,703
Fixed Assets
28,846
11,143
10,297
11,017
10,659
Other Long-Term Assets
114,960
49,673
36,430
39,365
40,155
Total Assets
$317,308
$182,614
$151,504
$121,591
$105,517
Current Liabilities
84,032
$47,930
$43,351
$30,177
$23,011
Long-Term Liabilities
103,270
49,693
48,620
44,620
39,232
Total Liabilities
187,302
97,623
91,971
74,797
62,243
Shareholders’
Equity
130,006
84,991
59,533
46,794
43,274
Total Liabilities & Shareholders’
Equity
$317,308
$182,614
$151,504
$121,591
$105,517
3/6/2015
Nasdaq: MNTX |
 17
Working Capital
“Focused
manufacturer of
engineered lifting
equipment”
$000
Q4-2014
Q4-2013
Working Capital
$89,470
$73,868
Days sales outstanding (DSO)
95
53
Days payable outstanding (DPO)
60
45
Inventory turns
2.3
2.9
Current ratio
2.1
2.5
Operating working capital
129,112
86,677
Operating working capital % of annualized LQS
48.2%
33.1%
Working capital ratios skewed by annualized quarters sales and cost of
goods sold only include 12 days for ASV from acquisition.
Excluding impact of ASV transaction, DSO, DPO and inventory turns were
71 days, 43 days, and 3.1 days respectively |
 18
“Focused
manufacturer of
engineered lifting
equipment”
$000
Dec 31, 2014
Dec 31, 2013
Total Cash
$4,370
$6,091
Total Debt
112,294
54,201
Total Equity
130,006
84,991
Net capitalization
237,930
133,131
Net debt / capitalization
45.4%
36.1%
Trailing 12 month Adjusted EBITDA
20,864
21,483
Debt / Adjusted EBITDA
5.4x
2.5x
•
Net capitalization is the sum of debt plus equity minus cash
•
Net debt is total debt less cash
Debt and Liquidity
Debt at 12/31/14 includes:
Non recourse debt at ASV $43.6 million (term and revolving credit
facilities) Fair value of convertible debt for ASV transaction
$6.6 million and $1.6 million note for transaction fees paid by
Terex
Manitex revolving credit facilities and Italian working capital
facilities ($53.7 million) Total
available
liquidity
as
12/31/14
under
credit
facilities
of
approximately
$25
million.
Average Debt Cost approximates 6%
Full year of ASV contribution would have resulted in a Debt/Adjusted
EBITDA ratio of approximately 3.2x in 2014 |
 * Non-GAAP
Reconciliations 19
3/6/2015
Nasdaq: MNTX
Three Months Ended
Twelve Months Ended
December 31,
2014
December 31,
2013
December 31,
2014
December 31,
2013
Net income
472
2,991
7,103
10,178
Net loss attributable to noncontrolling
interest
(136)
--
(136)
--
Income tax
393
1,182
3,676
4,269
Interest expense
958
765
3,150
2,946
Foreign currency transaction losses (gain)
80
23
107
95
Other (income) expense
(31)
59
36
50
Acquisition and other expense
2,356
-
2,356
-
Depreciation & Amortization
1,238
1,205
4,572
3,945
Adjusted Earnings before interest,
taxes, depreciation and amortization
(Adjusted EBITDA)
$5,330
$6,225
$20,864
$21,483
Adjusted EBITDA % to sales
8.0%
9.5%
7.9%
8.8%
Three Months Ended
Twelve Months Ended
December 31,
2014
December 31,
2013
December 31,
2014
December 31,
2013
Net income as reported
472
2,991
7,103
10,178
Pre –
tax acquisition and other expenses
2,517
--
2,517
-
Tax effect based on jurisdictional blend
(804)
--
(804)
-
Adjusted Net Income
$2,185
$2,991
$8,816
$10,178
Weighted average diluted shares
outstanding
14,029,205
13,821,352
13,904,289
12,717,575
Diluted earnings per share as reported
$0.03
$0.22
$0.51
$0.80
Total EPS Effect
$0.13
--
$0.12
--
Adjusted Diluted earnings per share
$0.16
$0.22
$0.63
$0.80
Reconciliation of GAAP Net Income to Adjusted EBITDA (in thousands)
Reconciliation of GAAP Net Income to Adjusted Net Income (in
thousands) |
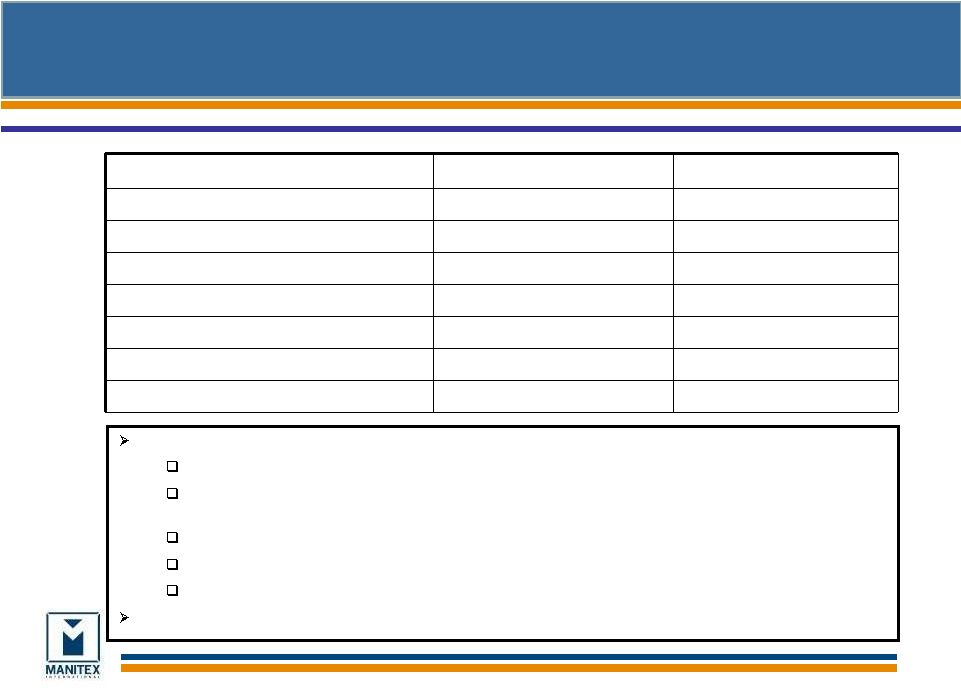
 Experienced
Management Team 20
Name & Title
Experience
David Langevin
Chairman & CEO
20+ years principally with Terex
Andrew Rooke
President & COO
20+ years principally with Rolls Royce, GKN Sinter Metals,
Off-Highway & Auto Divisions
David Gransee
CFO & Treasurer
Formerly with Arthur Andersen, 15+ years with Eon Labs
(formerly listed)
Robert Litchev
President –
Manufacturing Operations
10+ years principally with Terex
Scott Rolston
SVP Strategic Planning
13+ years principally with Manitowoc
Bruce Peterson
SVP Sales and Marketing
20+ years principally with Manitowoc
3/6/2015
Nasdaq: MNTX |
 Operating
Companies 21
Brand
Products
End Markets
Drivers
•
Boom trucks and cranes
•
Sign cranes
•
Parts
•
Energy exploration
•
Power transmission
•
Industrial projects
•
Infrastructure development
•
Strong end market demand for specialized,
competitively differentiated products for oil, gas,
and energy sectors
•
Product development
•
Rough terrain cranes
•
Specialized construction
equipment
•
Parts
•
Railroad
•
Construction
•
Refineries
•
Municipality
•
Equipment replacement cycle in small tonnage
flexible cranes for refinery market
•
More efficient product offering across end
markets
•
Rough terrain forklifts
•
Special mission-oriented vehicles
•
Custom specialized carriers
•
Parts
•
Military
•
Utility
•
Ship building
•
Commercial
•
Steady, profitable growth from both commercial
and military application of products
•
Custom trailers
•
Hauling systems for heavy
equipment transport
•
Parts
•
Energy
•
Mining
•
Railroad
•
Commercial construction
•
U.S. energy exploration build-out
•
Oil and gas exploration
•
General infrastructure construction
•
Reach stackers
•
Container handling forklifts
•
Parts
•
Global container market
•
International container market and global trade
•
Re-establishing customer relationships and select
product categories
•
Specialized equipment for liquid
storage & containment
•
8,000-21,000 gallon capacities
•
Large client base in energy sector
•
Petrochemical
•
Waste management
•
Oil & gas drilling
•
Reputation for quality & innovation
•
Serves a market of over $1B annually
•
At acquisition, TTM (3/31/13) revenues ~ $39.1M,
adjusted EBITDA ~ $4.5M, EBIT ~ $4.2M
3/6/2015
Nasdaq: MNTX |
 Operating
Companies 22
Brand
Products
End Markets
Drivers
•
Precision pick & carry cranes
•
Automotive
•
Chemical / petrochemical
•
Industrial projects
•
Infrastructure development
•
Aerospace
•
Construction
•
Strong end market demand for specialized,
competitively differentiated products
•
Environmental (electric) or hazardous (spark free)
developments
•
Product development
3/6/2015
Nasdaq: MNTX
•
Knuckle boom cranes
•
Truck-mounted Aerial Platforms
•
Energy
•
Construction
•
Infrastructure
•
Utilities
•
Growing acceptance of knucklebooms in North
American markets
•
Oil and gas exploration creating demand
•
Product development
•
Compact track loaders
•
Skid-steer loaders
•
Construction
•
Infrastructure
•
Improving fundamentals in general construction
markets, residential and light commercial |