Attached files
| file | filename |
|---|---|
| EXCEL - IDEA: XBRL DOCUMENT - VICOR CORP | Financial_Report.xls |
| EX-23.1 - EX-23.1 - VICOR CORP | d850860dex231.htm |
| EX-32.2 - EX-32.2 - VICOR CORP | d850860dex322.htm |
| EX-31.2 - EX-31.2 - VICOR CORP | d850860dex312.htm |
| EX-21.1 - EX-21.1 - VICOR CORP | d850860dex211.htm |
| EX-31.1 - EX-31.1 - VICOR CORP | d850860dex311.htm |
| EX-23.2 - EX-23.2 - VICOR CORP | d850860dex232.htm |
| EX-32.1 - EX-32.1 - VICOR CORP | d850860dex321.htm |
UNITED STATES SECURITIES AND EXCHANGE COMMISSION
Washington, D.C. 20549
Form 10-K
| þ | ANNUAL REPORT PURSUANT TO SECTION 13 OR 15(d) |
| OF THE SECURITIES EXCHANGE ACT OF 1934 |
For the fiscal year ended December 31, 2014
| ¨ | TRANSITION REPORT PURSUANT TO SECTION 13 OR 15(d) |
| OF THE SECURITIES EXCHANGE ACT OF 1934 |
For the transition period from to
Commission file number 0-18277
VICOR CORPORATION
(Exact name of registrant as specified in its charter)
| Delaware | 04-2742817 | |
| (State or other jurisdiction of incorporation or organization) |
(IRS employer identification no.) | |
| 25 Frontage Road, Andover, Massachusetts | 01810 | |
| (Address of principal executive offices) | (Zip code) |
Registrant’s telephone number, including area code:
(978) 470-2900
Securities registered pursuant to Section 12(b) of the Act:
| Common Stock, $.01 par value |
The NASDAQ Stock Market LLC | |
| (Title of Class) | (Name of Each Exchange on Which Registered) |
Securities registered pursuant to Section 12(g) of the Act:
None
Indicate by check mark if the registrant is a well-known seasoned issuer, as defined in Rule 405 of the Securities Act. Yes ¨ No þ
Indicate by check mark if the registrant is not required to file reports pursuant to Section 13 or Section 15(d) of the Act. Yes ¨ No þ
Indicate by check mark whether the registrant (1) has filed all reports required to be filed by Section 13 or 15(d) of the Securities Exchange Act of 1934 during the preceding 12 months (or for such shorter period that the registrant was required to file such reports), and (2) has been subject to such filing requirements for the past 90 days. Yes þ No ¨
Indicate by check mark whether the registrant has submitted electronically and posted on its corporate Web site, if any, every Interactive Data File required to be submitted and posted pursuant to Rule 405 of Regulation S-T during the preceding 12 months (or for such shorter period that the registrant was required to submit and post such files). Yes þ No ¨
Indicate by check mark if disclosure of delinquent filers pursuant to Item 405 of Regulation S-K is not contained herein, and will not be contained, to the best of registrant’s knowledge, in definitive proxy or information statements incorporated by reference in Part III of this Form 10-K or any amendment to this Form 10-K. þ
Indicate by check mark whether the registrant is a large accelerated filer, an accelerated filer, a non-accelerated filer, or a smaller reporting company. See the definitions of “large accelerated filer,” “accelerated filer” and “smaller reporting company” in Rule 12b-2 of the Exchange Act. (Check one):
| Large Accelerated Filer ¨ |
Accelerated Filer þ |
Non-accelerated Filer ¨ | Smaller Reporting Company ¨ | |||
| (Do not check if a smaller reporting company) | ||||||
Indicate by check mark whether the registrant is a shell company (as defined in Rule 12b-2 of the Exchange Act). Yes ¨ No þ
The aggregate market value of the voting and non-voting common equity of the registrant held by non-affiliates (for this purpose, persons and entities other than executive officers and directors) of the registrant, as of the registrant’s most recently completed second fiscal quarter (June 30, 2014) was approximately $136,352,200.
| Title of Each Class |
Number of Shares of Common Stock Outstanding as of February 27, 2015 | |
| Common Stock | 26,916,279 | |
| Class B Common Stock | 11,758,218 |
DOCUMENTS INCORPORATED BY REFERENCE
Portions of the Company’s definitive proxy statement (the “Definitive Proxy Statement”) to be filed with the Securities and Exchange Commission pursuant to Regulation 14A and relating to the Company’s 2015 annual meeting of stockholders are incorporated by reference into Part III.
PART I
In this Annual Report on Form 10-K, unless the context indicates otherwise, references to “Vicor®,” “the Company,” “our company,” “we,” “us,” “our,” and similar references, refer to Vicor Corporation and subsidiaries.
This Annual Report on Form 10-K contains forward-looking statements within the meaning of Section 27A of the Securities Act of 1933, as amended, and Section 21E of the Securities Exchange Act of 1934, as amended (the “Exchange Act”). The words “believes,” “expects,” “anticipates,” “intend,” “estimate,” “plans,” “assumes,” “may,” “will,” “would,” “should,” “continue,” “prospective,” “project,” and other similar expressions identify forward-looking statements. Forward-looking statements also include statements regarding: the transition of our business strategically and organizationally from serving a large number of relatively low volume customers across diversified markets and geographies to serving a small number of relatively large volume customers, typically concentrated in computing and communications; the level of customer orders overall and, in particular, from large customers and the delivery lead times associated therewith; the financial and operational impact of customer changes to shipping schedules; the derivation of a portion of our sales in each quarter from orders booked in the same quarter; our ongoing development of power conversion architectures, switching topologies, packaging technologies, and products; our plans to invest in expanded manufacturing capacity and the timing and location thereof; our belief regarding currency risk being mitigated because of limited foreign exchange fluctuation exposure; our continued success depending in part on our ability to attract and retain qualified personnel; our belief cash generated from operations and the total of our cash and cash equivalents will be sufficient to fund operations for the foreseeable future; our intentions regarding the declaration and payment of cash dividends; our intentions regarding protecting our rights under our patents; and our expectation that no current litigation or claims will have a material adverse impact on our financial position or results of operations. These statements are based upon our current expectations and estimates as to the prospective events and circumstances that may or may not be within our control and as to which there can be no assurance. Actual results could differ materially from those implied by forward-looking statements as a result of various factors, including our ability to: develop and market new products and technologies cost effectively and on a timely basis; leverage our new technologies in standard products to promote market acceptance of our new approach to power system architecture; leverage design wins into increased product sales; continue to meet requirements of key customers and prospects; enter into licensing agreements increasing our market opportunity and accelerating market penetration; realize significant royalties under such licensing agreements; achieve sustainable bookings rates for our products across served markets and geographies; improve manufacturing and operating efficiencies; successfully enforce our intellectual property rights; successfully defend outstanding litigation; hire and retain key personnel; and maintain an effective system of internal controls over financial reporting, including our ability to obtain required financial information for investments on a timely basis, our ability to assess the value of assets, including illiquid investments, and the accounting therefor. These and other factors that may influence actual results are described in this Annual Report on Form 10-K, including but not limited to those described under Part I, Item I — “Business,” under Part I, Item 1A — “Risk Factors,” under Part I, Item 3 — “Legal Proceedings,” and under Part II, Item 7 — “Management’s Discussion and Analysis of Financial Condition and Results of Operations”. The discussion of our business contained herein, including the identification and assessment of factors that may influence actual results, may not be exhaustive. Therefore, the information presented should be read together with other documents we file with the Securities and Exchange Commission from time to time, including Forms 10-Q and 8-K, which may supplement, modify, supersede or update the factors discussed in this Annual Report on Form 10-K. We do not undertake any obligation to update any forward-looking statements as a result of future events or developments, except as required by law.
| ITEM 1. | BUSINESS |
Overview
We design, develop, manufacture, and market modular components and complete systems for converting, regulating, and controlling electric current. In electrically-powered devices utilizing Alternating Current (“AC”)
2
voltage from a primary AC source (for example, a wall outlet), a power system converts AC voltage into the stable Direct Current (“DC”) voltage necessary to power subsystems and/or individual applications or “loads.” In many electronic devices, this DC voltage may be further converted to one or more higher or lower voltages required by a range of loads. In equipment utilizing DC voltage from a primary DC source (for example, a generator or battery), the initial DC voltage frequently requires further conversion to one or more voltages. Because numerous applications requiring different DC voltages and varied power ratings may exist within an electronic device, and system power architectures themselves vary, we offer an extensive range of products and accessories in numerous application-specific configurations.
Our website, www.vicorpower.com, sets forth detailed information describing all of our products and the applications for which they may be used. The information contained on our website is not a part of, nor incorporated by reference into, this Annual Report on Form 10-K and shall not be deemed “filed” under the Exchange Act.
We were incorporated in Delaware in 1981. Shares of our Common Stock were listed on the NASDAQ National Market System in April 1990 under the ticker symbol VICR, and we completed an initial public offering of our shares in May 1991.
Market Background and Our Strategy
The global merchant market for AC-DC and DC-DC power conversion solutions is highly fragmented and made up of many large, diversified manufacturers, as well as many more, smaller manufacturers focused on specialized products or narrowly defined market segments or geographies. The overall market, including those segments in which we compete, is characterized by rapid commoditization and intense price competition.
Our products are sold worldwide to customers ranging from smaller, independent manufacturers of highly specialized electronic devices to larger original equipment manufacturers (“OEMs”) and their contract manufacturers. Beginning in 2011, we began to shift our focus toward higher volume opportunities with these larger OEMs and their contract manufacturers. We serve customers across a range of industries and geographies.
Since our founding, our strategy has been characterized by differentiation based on superior product performance. We have emphasized innovations in technologies, product design, and packaging. Much of our differentiation has been based on proprietary implementations of high frequency, soft switching topologies enabling DC-DC converter modules to be smaller and more efficient than conventional alternatives and, therefore, less vulnerable to commoditization pressures.
We offer a comprehensive range of component-level building blocks to configure a power system specific to a customer’s needs. Since introducing and popularizing the encapsulated “brick” package format during the 1980s, our product focus has been on high performance DC-DC switching converters, which provide the transformation, regulation, isolation, filtering, and/or input protection necessary to power and protect sophisticated electronic loads. A secondary and highly complementary product strategy has been to vertically integrate our component-level building blocks into complete power systems representing turnkey AC-DC and DC-DC solutions for our customers’ power needs. We target markets and applications for which the high conversion efficiency (i.e., the ratio of output power in watts to the power consumed by the device) and high power density (i.e., the amount of power in watts divided by the volume of the device) of our products are well suited.
The market for power supplies and their enabling components has consistently evolved in response to advancing technologies and corresponding changes in customer requirements. Throughout our history, we have modified our strategy to adapt to evolving market challenges and opportunities, leveraging our strength in research and development. In response to current trends and changes in customer requirements, we are implementing a strategy addressing both the realities of today’s power conversion marketplace and our vision of
3
its long-term direction. Our balanced strategy involves maintaining a profitable legacy business in bricks and brick-based system solutions, while investing in the next generation of power management components incorporating innovations of our VI ChipTM and Picor® subsidiaries.
Our product strategy has been characterized by differentiation based on superior product performance, notably highly differentiated conversion efficiency and power density. Our initial market focus in the 1980s and 1990s was on the rapidly expanding telecommunications infrastructure market, within which we had established a leadership position based on early innovations, many of which were patented. However, during the 2000s, in response to the sudden and sustained decline of the telecommunication infrastructure market, the expiration of many of our patents, the consolidation of numerous competitors, and the commoditization pressures of globalization, we shifted our strategy to emphasize “mass customization”, using highly automated, efficient, domestic manufacturing to serve customers with product design and performance requirements, across a wide range of worldwide market segments, that could not be met by high volume oriented competitors. This strategy remains the basis upon which our Brick Business Unit (“BBU”) competes.
We believe traditional power architectures, components, and systems may not provide the performance necessary to address tomorrow’s power system requirements, given trends toward higher currents, more and diverse on-board voltages, and the higher speeds and performance demands of numerous complex loads, as well as the importance of the efficiency with which architectures, components, and systems address these requirements. We also realized the rapid commoditization and intense price competition
characterizing the broader market ultimately would impact the performance of our legacy business in bricks and brick-based systems. Based on this outlook, we established the VI Chip and Picor subsidiaries to focus on development of a new approach to power conversion and power management intended to reestablish our technological leadership, while providing significant growth opportunities. VI Chip and Picor are offering highly differentiated, highly integrated products addressing high volume opportunities. Our goal is to avoid commoditization and pricing pressures by maintaining technological leadership and a compelling value proposition.
Our strategy has been, and will continue to be supported by our long-standing commitment to research and development of power conversion technologies, advanced packaging and manufacturing, and innovative products. We incurred approximately $41,500,000, $39,900,000, and $38,800,000 in research and development expenses in 2014, 2013, and 2012, respectively, representing approximately 18.4%, 20.0%, and 17.7% of revenues in 2014, 2013, and 2012, respectively. An important element of our current strategy involves high levels of customer engagement and support, which has resulted in significant expansion of our sales and sales support infrastructure. We incurred approximately $38,056,000, $35,478,000, and $34,276,000 in marketing and sales expenses in 2014, 2013, and 2012, respectively, representing approximately 16.9%, 17.8%, and 15.7% of revenues in 2014, 2013, and 2012, respectively. We intend to maintain spending in support of research and development and marketing and sales at levels, on an absolute basis, consistent with prior periods. If we successfully execute our strategy, we believe our revenue should increase and, if so, the percentages of revenue represented by spending on research and development and marketing and sales should decline.
Business Segments
Our business segments are organized by key product lines supporting our balanced strategy, reflecting business models and market segmentation:
| • | Brick Business Unit |
The BBU segment, our largest, designs, develops, manufactures, and markets power modules in three formats: our well-established, encapsulated modules, known as bricks; our line of intermediate bus converters, which are open-frame (i.e., not encapsulated) devices; and our line of modular power solutions incorporating our VI Chip modules and complementary circuitry into thermally advantageous packaging, which we market as VI BrickTM modules. The BBU also designs, develops, manufactures,
4
and markets a line of “configurable” products, which are complete DC-input power systems assembled using our modular power components. The BBU also includes the operations of Vicor Custom PowerTM, which is our turnkey custom power solutions business, and Vicor Japan Company, Ltd. (“VJCL”), our majority-owned Japanese subsidiary. In December 2014, we completed the consolidation of manufacturing WestcorTM division products from its facility in Sunnyvale, California to our primary manufacturing facility in Andover, Massachusetts. Westcor had been focused only on AC-input configurable products.
Organized around and operating on a “mass customization” model, the BBU manufactures products based on customer specifications. We believe the BBU offers one of the broadest product lines in our industry, with many thousands of standard combinations of input voltage, output voltage, power level, and accessory components available. Mass customization, with an emphasis on manufacturing efficiency and ongoing cost reduction, allows the BBU, without the need for a significant investment in finished goods inventory, to profitably serve the needs of low volume customers seeking module performance they may not be able to obtain from our larger, volume-oriented competitors.
The BBU serves customers across a wide range of markets world-wide, with concentrations in defense electronics, industrial automation and equipment, rail transportation, and test and measurement instrumentation. While the BBU’s customer base is highly fragmented, our diverse customer relationships and the broad range of applications into which our products are designed are typically long in duration. This, along with the breadth of market segments and geographies served, has contributed to the stability of the BBU’s performance over the past decade. BBU segment revenue has been influenced in recent years by continued weakness in the defense electronics sector, the continued economic uncertainty in Europe, and slower than expected growth from certain new product opportunities, although the negative impact of these trends has been offset by the BBU’s penetration of certain geographies, notably the Chinese market.
The BBU offers an extensive product line, with products well-established as important enabling components of conventional power systems architectures. Families of DC-DC converter modules are offered across a wide range of input voltage (10 to 425 volts DC) and output power (up to 600 watts), allowing end users the ability to select easy to use power component products appropriate to their individual applications. The product families differ in maximum power ratings, performance characteristics, package size, and, in certain cases, characteristics specific to the targeted market. We also offer a range of complementary modules and accessories facilitating customer design of complete power systems. Utilizing our modular power components as core elements, we offer configurable products providing complete power solutions configured to a customer’s specific needs. These “near-custom” products exploit the benefits and flexibility of our modular approach to offer a wider range of power levels at higher performance, higher power density, lower cost, and faster delivery than many competitive offerings. Configurable products are designed, developed and manufactured by the BBU, which offers a range of AC-DC and DC-DC configurable products, including those AC-DC configurable products formerly manufactured by our Westcor division, and by VJCL, which offers configurable products addressing the specific requirements of Japanese customers. The BBU’s Vicor Custom Power business designs and manufactures low-volume, high value-add power supplies, utilizing, as is the case with our configurable business, our modular power components as core elements. These custom power supplies are designed to meet customers’ specific requirements, which are often associated with the harsh environments of aerospace and defense applications.
| • | VI Chip Business Unit |
This segment consists of VI Chip Corporation, a subsidiary of Vicor that designs, develops, manufactures, and markets a range of advanced power conversion components. In 2013, we expanded our VI Chip product line, introducing the “ChiP” concept (ChiP is an acronym for “Converter housed in Package”), a product platform designed with the goal of setting best-in-class standards for the next generation of scalable power modules. While our original VI Chip modules were designed to facilitate
5
implementations of our Factorized Power ArchitectureTM (“FPA”), an innovative, component-based, power system architecture, ChiP modules support all known power distribution architectures, including FPA, and represent a significant extension of our modular power system design methodology, the basis for our transition to an OEM-focused strategy.
The ChiP platform has been designed to have lower manufacturing costs than the original VI Chip module platform, thereby allowing us to offer highly differentiated products, not only with superior total cost of ownership over time, but at attractive initial price points. Our goal is to offer ChiP modules and solutions on a cents per watt basis near or equivalent to the prices of competitive product offerings, thereby presenting OEM customers with a compelling value proposition.
During 2014, we introduced ChiP variants of the following VI Chip product families: the PRM® (Pre-Regulator Module), a family of non-isolated regulators; the VTM® (Voltage Transformation Module), an isolated current multiplier; and the BCM® (Bus Converter Module), an intermediate bus converter; and the DCM® (Direct Current Module), an isolated DC-DC converter. ChiP modules are offered, or will be offered, as stand-alone modules with package sizes ranging from 13 by 23 mm to 61 by 23 mm.
ChiP modules also are being incorporated into our latest packaging innovation, the “VIA” (an acronym for “Vicor Integrated Adaptor”), a thermally-advantageous package, with attractive costs, containing a range of complementary capabilities and circuitry, creating a turn-key power management solution, further enabling improved design flexibility and accelerated time to market for customers. Our ChiP format PFM® (Power Factor Module), an isolated AC-DC converter with power factor correction circuitry, will be offered only in the VIA package. We announced the VIA package in October 2014, displayed VIA prototypes at a major international trade show in November 2014, and have targeted mid-year 2015 for commercial availability.
While ChiP modules and VIAs are targeted toward high-volume OEM applications, notably in computing and networking, VIAs also are intended to be applicable to the lower-volume needs of the BBU’s broad customer base. The VIA package concept has been designed to be economically suitable for the BBU’s strategy of mass customization (i.e., expedited short production runs of customer configured products). Notably, we have developed a range of DCM-based VIAs, also expected to be released by mid-year 2015, designed to achieve efficiencies and power densities far exceeding any competing DC-DC converters. As such, we are expecting these DCM-based VIAs to contribute to improved BBU revenue in coming years, as traditional DC-DC converter customers in the BBU’s markets design their own next generation products.
We continue to offer the first generation of VI Chip PRM, VTM, and BCM modules, in full (i.e., 32.5 by 22.0 by 6.73 mm) and half (i.e., 22.0 by 16.5 by 6.73 mm) sizes, targeting FPA implementations, notably in defense electronics, medical instrumentation, and test and measurement applications. For the fourth quarter of 2014, first generation VI Chips represented approximately one-third of total volume for the VI Chip segment, and we anticipate such shipments to represent a similar percentage of total segment volume for 2015.
VI Chip serves customers across a range of markets, with concentrations in aerospace and defense electronics, computing, medical instrumentation, networking, and semiconductor test and measurement. We are also pursuing opportunities for VI Chip in solid state lighting and electric and hybrid vehicles. VI Chip’s customer base currently is concentrated, with a small number of customers, whether OEMs or their contract manufacturers, notably in the datacenter segment of the computing market and in defense electronics, representing the majority of VI Chip demand during any period. We expect the broader product offerings enabled by our ChiP modules and VIA platform will allow us to broaden and diversify the VI Chip customer base.
| • | Picor Business Unit |
This segment consists of Picor Corporation, a subsidiary of Vicor. Picor is a fabless (i.e., it utilizes third parties to manufacture its products) designer, developer, and marketer of high performance
6
integrated circuits and related products for use in a variety of power system applications. Picor develops these products to be incorporated into Vicor’s products, to be sold as a complement to our products, or for sale to third parties for separate applications. Much of the differentiation of our BBU and VI Chip products has been a result of implementation of our power conversion innovations in proprietary microcontroller circuitry developed by Picor.
In 2014, Picor reached a milestone in its development of an expanded merchant business, generating more than half of segment revenue from third parties for both the third and fourth quarters of the year. This growth of third-party revenue was the result of the success of Picor’s line of Cool-PowerTM non-isolated, point of load regulators, which was introduced in 2012. Incorporating proprietary soft switching topology and Picor’s high performance silicon controller architecture, these high performance regulators provide best-in-class power efficiency, allowing customers to deploy more efficient power distribution designs based on higher input voltages. We believe these products will be an important contributor to our long-term success, as they represent a meaningful element of our strategy of offering differentiated solutions across all customer needs, complementing our other component offerings, thereby allowing us to offer a complete solution from AC conversion to DC transformation and regulation at the point of load. With emphasis on executing its merchant strategy, Picor frequently collaborates with VI Chip in pursuit of high volume opportunities involving highly differentiated, integrated solutions utilizing VI Chip and Picor modules. Picor point of load regulators are paired with VI Chip ChiP VTMs as the 48V bus solution sold to datacenter and server customers powering Intel processors.
Picor also is pursuing merchant opportunities on its own, as well as working closely with our stocking distribution partners, in pursuit of stand-alone, high volume opportunities. Given the applications for which its merchant products are well-suited, Picor’s third-party customers are concentrated in the datacenter and supercomputing segments of the computing market.
See Note 16 — Segment Information to the Consolidated Financial Statements for certain financial information by business segment.
Applications, Customers, and Backlog
The applications in which our products are used are in the higher-performance, higher-power segments of the power systems market. As stated, the BBU has customers concentrated in defense electronics, industrial automation and equipment, rail transportation, and test and measurement instrumentation, while VI Chip and Picor have customers concentrated in the datacenter and supercomputer segments of the computing market, although VI Chip and Picor target applications in aerospace and defense electronics, instrumentation and test equipment, and networking as well. With our strategic emphasis on larger, high-volume customers, we expect to experience a greater concentration of sales among relatively fewer customers.
For the year ended December 31, 2014, one customer (NuPower Electronic, Ltd.) accounted for approximately 14.7% of net revenues, and our five largest customers represented approximately 32.6% of net revenues. For the year ended December 31, 2013, two customers (NuPower Electronic, Ltd. and Tech-Front Computer, Ltd.) accounted for approximately 10.9% and 10.1% of net revenues, respectively, and our five largest customers represented approximately 29.2% of net revenues. For the year ended December 31, 2012, one customer (Foo Kee Electronics, Ltd.) accounted for approximately 10.1% of net revenues, and our five largest customers represented approximately 25.4% of net revenues.
International revenues, as a percentage of total revenues, were approximately 60.5%, 59.5%, and 51.1% in 2014, 2013, and 2012, respectively. International sales have increased from historical levels primarily due to higher volumes of shipments to foreign contract manufacturers utilized by domestic and international OEMs. As we have substantially expanded our sales and customer support activities and resources internationally, particularly in Asia, we expect international sales to continue to increase as a percentage of total revenue.
7
As of December 31, 2014, we had a backlog of approximately $54,249,000, compared to $44,659,000 as of December 31, 2013. Backlog consists of orders for products for which shipment is scheduled within the following 12 months, subject to normal customer cancellation policies. A portion of our revenue in any quarter is, and will continue to be, derived from orders booked and shipped in the same quarter. Over the past two years, the portion of sales booked and shipped in the same quarter has represented less than two-fifths of our quarterly revenue, as we typically only build products to customer specifications upon receipt of a purchase order. Products sold by the BBU typically have a lead time (i.e., the period between receipt of an order and shipment of the product) of less than six weeks. Products sold by VI Chip typically have a lead time in excess of 10 weeks, although lead times have shortened during periods of sustained volume, and we continue to reduce lead times across all VI Chip products. Picor, given its fabless model, builds inventories based on expected customer demand and orders from stocking distribution partners. As such, the portion of sales booked and shipped in the same quarter can vary considerably depending on the relative volumes of BBU, VI Chip, and Picor products booked within the quarter.
Competition
The global power conversion industry is highly competitive and continues to consolidate, given commoditization pressures. The competitive landscape is made up of large, diversified manufacturers, as well as many more, smaller manufacturers focused on specialized products or narrowly defined market segments or geographies. Numerous competitors in the market segments in which we compete have significantly greater financial and marketing resources and longer operating histories than we do. Generally, competition is based on product price, product performance, design flexibility (i.e., ease of use), and product availability.
As we shift our strategy to focus more on higher volume OEM opportunities, we are emphasizing the differentiation of our products’ superior performance, advantageous design flexibility, and lower total cost of ownership, as well as the integration of our products into complete or near-complete solutions for customers’ power conversion requirements. We also seek to position ourselves with customers across all markets served such that we reduce our vulnerability to commoditization. However, in each of our three business segments, because of the differences in products, targeted customers, and applications, and the role of distributors in serving customers, competitive characteristics can vary.
With the BBU, our strategy continues to be based largely on a high level of responsiveness to customer requirements enabled by our mass customization capabilities across what we believe to be among the broadest product lines in the industry. We believe the BBU has a strong competitive position, particularly within a highly fragmented customer base requiring relatively low volumes of high density power system solutions across a variety of input-output configurations. We believe the primary competitive variables in the market segments in which the BBU competes are price and performance, but, along with our mass customization model, we seek to offer differentiating levels of pre-sale and post-sale technical support. The competitive landscape in which the BBU operates is extremely fragmented, but dominated by a number of large global manufacturers possessing financial, operational, and marketing resources far greater than the Company.
With VI Chip, our strategy has been based largely on highly differentiated products offered to customers (e.g., global OEMs in computing, networking, and test and measurement, along with large customers in the defense electronics segment) well-positioned to benefit from the advantages offered by our products. VI Chip currently competes with vendors of switched power component solutions, many of which are the manufacturers with which the BBU competes. Because of its pursuit of higher volume opportunities, VI Chip encounters longer sales cycles and more frequent competition from large global manufacturers in the industry than does the BBU. Further, VI Chip’s competitive landscape has broadened to include vendors of solid state (i.e., semiconductor-based) solutions, many of which have significantly broader product lines, well-established customer relationships, and extensive financial, operational, and marketing resources.
8
Picor also competes with global suppliers of integrated circuits for power conversion applications, many of which have significantly greater financial, operational, and marketing resources, as well as significantly broader product and solution offerings. We believe Picor is developing a strong competitive position based on proprietary topologies, innovative semiconductor design, and System in Package (“SiP”) packaging. Based on Picor’s expanding product roadmap, we anticipate Picor will experience more direct competition with these larger suppliers, as we target their customers with our increasingly silicon-centric power conversion solutions, frequently complemented by VI Chip and VI Brick modules in an integrated power system solution.
Patents and Intellectual Property
An important element of our strategy is to protect our competitive leadership with domestic and foreign patents and patent applications that cover our products and much of their enabling technologies. We believe our competitive leadership is further protected by proprietary trade secrets associated with our use of certain components and materials of our own design, as well as our significant experience with manufacturing, packaging, and testing these complex devices.
We believe our patents afford advantages by building fundamental and multilayered barriers to competitive encroachment upon key features and performance benefits of our principal product families. Our patents cover the fundamental switching topologies used to achieve the performance attributes of our converter product lines; converter array architectures; product packaging design; product construction; high frequency magnetic structures; as well as automated equipment and methods for circuit and product assembly.
In the United States, we have been issued 98 patents, which expire between 2015 and 2032. We also have a number of patent applications pending in the United States and certain countries of Europe and Asia. We intend to vigorously protect our rights under these patents. Although we believe patents are an effective way of protecting our technology, there can be no assurances our patents will prove to be enforceable in any given jurisdiction.
In addition to generating revenue from product sales, we seek to license our intellectual property. In granting licenses, we generally retain the right to use our patented technologies and manufacture and sell our products in all licensed geographic areas and fields of use. Licenses are granted and administered through our wholly-owned subsidiary, VLT, Inc., which owns our patents. Revenues from licensing arrangements have not exceeded 10% of our consolidated revenues in any of the last three fiscal years.
Our Organization
We are headquartered in Andover, Massachusetts, where the BBU’s manufacturing facilities are located. VI Chip Corporation also is headquartered in Andover, Massachusetts, where its manufacturing facilities are located. Picor Corporation is headquartered in North Smithfield, Rhode Island, and has personnel based in Andover, Massachusetts. Our Vicor Custom Power locations are geographically distributed across the United States and all are incorporated in Delaware. VLT, Inc., incorporated in California, is our wholly-owned licensing subsidiary. VICR Securities Corporation, incorporated in Massachusetts, is a subsidiary established to hold certain investment securities.
Internationally, we conduct business through subsidiaries incorporated in or branch offices established in individual countries. VJCL, which is engaged in sales and customer support activities exclusively for the Japanese market, is headquartered in Tokyo, Japan. Vicor B.V., a wholly-owned subsidiary incorporated in the Netherlands, serves as our European distribution center. We have established individual subsidiaries or branch offices to conduct the activities of Technical Support Centers (“TSCs”) located outside of the United States.
Our subsidiaries and their legal domicile are set forth in Exhibit 21.1 to this Annual Report on Form 10-K. The activities of all of the above named entities are consolidated in the financial statements presented herein.
9
As of December 31, 2014, we had 965 full time employees and 49 part time employees. None of our employees are subject to a collective bargaining agreement. We believe our continued success depends, in part, on our ability to attract and retain qualified personnel. Although there is strong demand for qualified personnel, we have not to date experienced difficulty in attracting and retaining sufficient engineering and technical personnel to meet our needs (see Part I, Item 1A — “Risk Factors”).
| • | Sales and Marketing |
We reach and serve customers through several channels: a direct sales force world-wide; a network of independent sales representative organizations in North America and South America; independent non-stocking distributors in Europe and Asia; and two stocking distributors, Digi-Key Corporation and Future Electronics Incorporated. These channels are supported by regional TSCs, each offering application engineering and sales support for customers and our channel partners. Domestic TSCs are located in: Andover, Massachusetts; Lombard, Illinois; and Sunnyvale, California. International TSCs are located in: Hong Kong, China; Shanghai, China; Camberley (London), England; Munich, Germany; Bangalore, India; Milan, Italy; and Seoul, South Korea. During 2014, we established a sales office in Taipei, Taiwan (Republic of China), and expect to expand this office into a TSC in the near future.
Because of the technically complex nature of our products and the applications they address, we maintain an extensive staff of Field Applications Engineers to support our own sales and customer support activities, as well as those of our channel partners. Field Application Engineers, based in our TSCs, provide direct technical support worldwide by reviewing new applications and technical matters with existing and potential customers, as well as our channel partners. Product Line Engineers, located in our Andover headquarters, support Field Application Engineers assigned to all of our TSCs.
We utilize an in-house distributor support initiative, Vicor Express™, to support our regional distributors in the European Union and small, low volume customers not served by these regional distributors. Vicor Express is focused on new customer lead generation through marketing in local languages, support of small-volume customers targeted for transition to distributors as volumes increase, and close coordination of distributor activities with these customers. Vicor Express customers place orders, denominated in Euros or Pounds Sterling, with Vicor B.V., which serves as importer of record for direct shipments by Vicor from Andover, Massachusetts, to customers in the European Union. European TSCs participating in the Vicor Express initiative do not accept purchase orders from any customers and do not record any revenue associated with shipments from Vicor to Vicor B.V.
Vicor also reaches customers via our electronic commerce capability through our website, www.vicorpower.com. Registered customers in the United States, Canada, and certain European countries are able to purchase prototype quantities of selected products online. Our Internet-based resources are an increasingly important element of our efforts to interact and support customers. Within our website, the Vicor PowerBenchTM is a workspace of tools and references allowing engineers to select, architect, and implement power systems using Vicor’s products. During 2014, we significantly enhanced our highly differentiated WhiteboardTM tool, which allows users to configure and analyze their own power system designs or those from an extensive library of designs addressing a wide range of applications. Users can modify the operating condition for each component of their design to match the intended application and perform efficiency and loss analysis of individual components and the full power system. We are aggressively expanding the range and capabilities of engineering tools we make available online to customers and prospective customers.
We generally sell our products on the basis of our standard terms and conditions, and we most commonly warrant our products for a period of two years. In a limited number of circumstances, we have entered into supply contracts with certain high-volume customers calling for extended warranty terms. With our distribution partners, we also enter into contracts. With our stocking distributors, these contracts provide for our product warranties to transfer to the end customer upon final sale of our product(s) by the distributor.
10
| • | Manufacturing, Quality Assurance, and Supply Chain Management |
Our BBU and VI Chip manufacturing facilities are located in Andover, Massachusetts, where we are headquartered. Picor, given its fabless model, outsources manufacturing, packaging, and testing of its products under contract to partners in the United States and Asia.
Our primary manufacturing processes consist of assembly of electronic components onto printed circuit boards, automatic testing of components, wave, reflow and infrared soldering of assembled components, encapsulation or over-molding of converter subassemblies, final environmental stress screening of certain products, and product inspection and testing using automated equipment. These processes are largely automated, but their labor components require relatively high levels of skill and training.
We continue to pursue a manufacturing strategy based upon the continuous improvement of product quality, volume throughput, and reduced manufacturing costs. Product quality and reliability are critical to our success and, as such, we emphasize quality and reliability in our design and manufacturing activities. We follow industry best practices in manufacturing and are compliant with ISO 9001 certification standards (as set forth by the International Organization for Standardization). Our quality assurance practices include rigorous testing and, as necessary, burn-in (i.e., extended operation of a product to confirm performance) of our products using automated equipment.
We intend to make continuing investments in automated manufacturing equipment, particularly for our ChiP platform. To date, we have repurposed certain equipment and processes to meet ChiP capacity needs. As such, we have incurred capital expenditures lower than previously anticipated. Based on current estimates of ChiP and VIA manufacturing volumes, we do not expect to incur capital expenditures during 2015 materially higher than we incurred during 2013 and 2014.
Components and materials used in our products are purchased from a variety of vendors. Most of the components are available from multiple sources, whether directly from suppliers or indirectly through distributors. In instances of single source items, we maintain levels of inventories we consider to be appropriate to enable meeting the delivery requirements of customers. Incoming components, assemblies, and other parts are subjected to several levels of inspection procedures, and we maintain robust data on our inventories in order to support our quality assurance procedures. Picor, given its fabless model, relies on a limited number of wafer foundries and suppliers of packaging and test services.
Available Information
We maintain a website with the address www.vicorpower.com and make available free of charge through this website our Annual Reports on Form 10-K, Quarterly Reports on Form 10-Q, Current Reports on Form 8-K, and amendments to these reports filed or furnished pursuant to Section 13(a) or 15(d) of the Exchange Act, as soon as reasonably practicable after we electronically file such material with, or furnish such material to, the Securities and Exchange Commission. We also make available on our website our Code of Business Conduct and Ethics, as well as the charters for the Audit and Compensation Committees of our Board of Directors.
While our website sets forth extensive information, including information regarding our products and the applications in which they may be used, such information is not a part of, nor incorporated by reference into, this Annual Report on Form 10-K and shall not be deemed “filed” under the Exchange Act.
11
| ITEM 1A. | RISK FACTORS |
This Annual Report on Form 10-K contains forward-looking statements within the meaning of Section 27A of the Securities Act of 1933, as amended, and Section 21E of the Exchange Act. Actual results could differ materially from those projected in the forward-looking statements as a result of, among other factors, the risk factors set forth below.
Our future operating results are difficult to predict and are subject to fluctuations.
Our operating results, including revenues, gross margins, operating expenses, and net income (loss), have fluctuated on a quarterly and annual basis. As of December 31, 2014, we have incurred net losses for nine consecutive quarters. Our operating performance improved through 2014, but significant legal fees and costs associated with the consolidation of manufacturing Westcor AC-DC systems to our primary manufacturing facility in Andover, Massachusetts contributed to losses for the year. Despite improving operating forecasts, we cannot predict when, or if, we will return to profitability. Our future operating results may be materially affected by a number of factors, many of which are beyond our control, including:
| • | the timing of our new product introductions and our ability to meet customer expectations for timely delivery of fully qualified products; |
| • | changes in customer demand for our current products and for end products incorporating our products, as well as our ability to respond efficiently to such changes in demand, including changes in order lead times and the volumes of product for which orders are received and the product shipped within an individual quarter; |
| • | our ability to manage our supply chain, inventory levels, and our own manufacturing capacity or that of third-party partners in the event of delays or cancellation of significant customer orders; |
| • | our ability to effectively coordinate changes in the mix of products we manufacture and sell, while managing our ongoing transition in organizational focus from traditional brick power components to our new products; |
| • | our ability to provide and maintain a high level of support to an increasing number of demanding, high volume customers; |
| • | the ability of our third party suppliers, service subcontractors, and manufacturers to supply us with sufficient quantities of high quality products, components, or services on a timely basis; |
| • | the effectiveness of our efforts to continuously reduce product costs and manage operating expenses; |
| • | our ability to utilize our manufacturing facilities at efficient levels, maintaining production capacity and manufacturing yields; |
| • | the timing of new product introductions or other competitive actions (e.g., product price reductions) by our competitors; |
| • | the ability to hire, retain, and motivate qualified employees to meet the demands of our customers; |
| • | intellectual property disputes; |
| • | potential significant litigation-related costs; |
| • | adverse economic conditions in the United States and those international markets in which we operate; |
| • | adverse budgetary conditions within the U.S. government, particularly the Department of Defense, which continue to limit spending on current and anticipated programs into which we sell or anticipate to sell our products; |
| • | costs related to compliance with increasing worldwide governance, quality, environmental, and other regulations; and |
12
| • | the effects of events outside of our control, including natural disasters, public health emergencies, terrorist activities, political risks, including international conflicts, information security breaches, communication interruptions, and other force majeure. |
As a result of these and other factors, we cannot assure you we will not experience significant fluctuations in future operating results on a quarterly or annual basis. In addition, if our operating results do not meet the expectations of investors, the market price of our Common Stock may decline.
Our stock price has been volatile and may fluctuate in the future.
Because of the factors set forth below, among others, the trading price of our Common Stock has fluctuated and may continue to fluctuate significantly:
| • | volatility of the financial markets; |
| • | uncertainty regarding the prospects of domestic and foreign economies; |
| • | uncertainty regarding domestic and international political conditions, including tax policies; |
| • | actual or anticipated fluctuations in our operating performance or that of our competitors; |
| • | the performance and prospects of our major customers; |
| • | announcements by us or our competitors of significant new products, technical innovations or litigation; |
| • | investor perception of our company and the industry in which we operate; |
| • | the absence of earnings estimates and supporting research by investment analysts; |
| • | the liquidity of the market for our Common Stock; |
| • | the uncertainty of the declaration and payment of future cash dividends on our Common Stock; and |
| • | the concentration of ownership of our Common Stock by Dr. Vinciarelli, our Chairman of the Board, Chief Executive Officer, and President. |
We do not actively communicate with investment analysts and, as a consequence, there are no earnings estimates or supporting research coverage of Vicor and our Common Stock. While we seek to be transparent in our financial reporting, public statements, and related disclosures, the absence of research coverage may limit investor interest in our Common Stock. Because our operating results have fluctuated on a quarterly and annual basis, investors may have difficulty in assessing our current and future performance.
In the past, we have declared and paid cash dividends on our Common Stock. The payment of dividends is based on the periodic determination by our Board of Directors that we have adequate capital to fund anticipated operating requirements and that excess cash is available for distribution to stockholders via a dividend. We have no formal policy regarding dividends and, as such, investors cannot make assumptions regarding the possibility of future dividend payments nor the amounts and timing thereof.
The ownership of our Common Stock is concentrated between Dr. Vinciarelli and a limited number of institutional investors. Dr. Vinciarelli owned, as of December 31, 2014, 9,758,893 shares of our Common Stock, as well as 11,023,648 shares of our Class B Common Stock (convertible on a one-for-one basis into Common Stock), together representing 54.8% of total issued and outstanding shares. Accordingly, the market float for our Common Stock and average daily trading volumes are relatively small, which can negatively impact investors’ ability to buy or sell shares of our Common Stock in a timely manner.
13
Dr. Vinciarelli owns 93.7% of our issued and outstanding Class B shares, which possess 10 votes per share. Dr. Estia J. Eichten, a member of our Board of Directors, owns the majority of the balance of Class B shares issued and outstanding. As such, Dr. Vinciarelli, controlling in aggregate 83.0% of our outstanding voting securities, has effective control of our governance.
The ongoing uncertainty in global economies could materially and adversely affect our business and consolidated operating results.
Disruption and further deterioration of global economic conditions may reduce customer purchases of our products, thereby reducing our revenues and earnings. In addition, such adverse conditions may, among other things, result in increased price competition for our products, increased risk of excess and obsolete inventories, increased risk in the collectability of our accounts receivable from our customers, increased risk in potential reserves for doubtful accounts and write-offs of accounts receivable, and higher operating costs as a percentage of revenues.
We compete with many companies possessing far greater resources.
Some of our competitors have greater financial, manufacturing, technical, sales and marketing resources than we have. We compete with domestic and foreign manufacturers of integrated power supplies and power conversion components. With the growth of our VI Chip and Picor product lines, we increasingly are competing with global manufacturers of power management products with far larger organizations and broader semiconductor-based product lines. Competition is generally based on design and quality of products, product performance, features and functionality, and product pricing, availability and capacity, with the relative importance of these factors varying among products, markets and customers. Existing or new competitors may develop products or technologies that more effectively address the demands of our customers and markets with enhanced performance, features and functionality or lower cost. If we fail to develop and commercialize leading-edge technologies and products that are cost effective and maintain high standards of quality, and introduce them to the market on a timely basis, our competitive position and results of operations could be materially adversely affected.
Our future success depends upon our ability to develop and market differentiated, leading-edge power conversion products for larger customers, potentially contributing to lengthy product development and sales cycles that may result in significant expenditures before revenues are generated. Our future operating results are dependent on the growth in such customers’ businesses and on our ability to profitably develop and deliver products meeting customer requirements.
The power system industry and the industries in which many of our customers operate are characterized by intense competition, rapid technological change, quickened product obsolescence, and price erosion for mature products, each of which could have an adverse effect on our results of operations. We are following a strategy based on the development of differentiated products addressing what we believe to be the long-term limitations of traditional power architectures. The development of such new products is often a complex, time-consuming, and costly process involving significant investment in research and development, with no assurance of return on investment. There can be no assurance we will be able to develop and introduce new and improved products in a timely or efficient manner or new and improved products, if developed, will achieve market acceptance.
Our future success depends substantially upon customer acceptance of our innovative products. As we have been in the early stages of market penetration for these products, we have experienced lengthy periods during which we have focused our product development efforts on the specific requirements of a limited number of large customers, followed by further periods of delay before meaningful purchase orders are received. These lengthy development and sales cycle times increase the possibility a customer may decide to cancel or change product plans, which could reduce or eliminate our sales to that customer. As a result, we may incur significant product development expenses, as well as significant sales and marketing expenses, before we generate the
14
related revenues for these products. Furthermore, we may never generate the anticipated revenues from a product after incurring such expenses if our customer cancels or changes its product plans.
We are shifting our market strategy to focus on larger opportunities with global manufacturers. Our growth is therefore dependent on the growth in the sales of these customers’ products as well as their own development of new products. If we fail to anticipate changes in our customers’ businesses and their changing product needs or successfully identify and enter new markets, our results of operations and financial position could be negatively impacted. We cannot assure you the markets we serve will grow in the future, our existing and new products will meet the requirements of these markets, or we can maintain adequate gross margins or profits in these markets.
Further stagnation of spending by the U.S. Department of Defense or a pronounced shift in the nature of such spending may negatively influence our operating results.
Customers in the defense electronics segment historically have contributed a meaningful portion of our revenue, primarily in the BBU, which sells military-grade brick modules and, through our Vicor Custom businesses, customer-specific systems incorporating our brick modules. However, shifts in Department of Defense spending priorities and ongoing budget constraints have contributed to a decline in such revenue as a percentage of our consolidated revenue. An additional risk to our defense electronics volume is associated with the organizational structure, capacity, and ownership of our Vicor Custom businesses. If orders for customer-specific systems, primarily for C4I (Command, Control, Communications, Computing, and Intelligence) applications, do not increase during 2015, we may choose to consolidate our locations and otherwise rationalize our associated cost structure. Given uncertainty regarding project funding and the overall federal budget, we are not forecasting a material change in orders and revenue for 2015 from defense contractors.
Our operating results recently have been influenced by a limited number of customers, and our future results may be similarly influenced.
Since it was established, our VI Chip subsidiary has derived a substantial portion of its revenue in any given year from one customer, whether through sales directly to the customer or indirectly to the customer’s contract manufacturers. Similarly, our Picor subsidiary has derived a substantial portion of its third-party revenue from a limited number of customers, including those customers served by VI Chip. This concentration of revenue is a reflection of the relatively early stage of adoption of the technologies, architectures, and products offered by these subsidiaries, and their targeting of market leading innovators as initial customers. Our current sales and marketing strategy, in part, is focused on accelerating the adoption of VI Chip and Picor products by a diversified customer base across a number of identified market segments. However, we cannot assure you our new strategy will be successful and such diversification of customers will be achieved.
We rely on third-party vendors and subcontractors for supply of components, assemblies, and services and, therefore, cannot control the availability or quality of such components, assemblies, and services.
We depend on third-party vendors and subcontractors to supply components, assemblies, and services used in our products, some of which are supplied by a single vendor, and have experienced shortages of certain semiconductor components, incurred additional and unexpected costs to address the shortages, and experienced delays in production and shipping. If suppliers or subcontractors cannot provide their products or services on time or to our specifications, we may not be able to meet the demand for our products and our delivery times may be negatively affected. In addition, we cannot directly control the quality of the products and services provided by third parties. In order to grow revenue, we likely will need to identify and qualify new suppliers and subcontractors to supplant or replace existing suppliers and subcontractors. This may cause disruptions in production, delays in shipping, or increases in prices paid to third parties.
15
We may not be able to procure necessary key components for our products, or we may purchase excess raw material inventory or unusable inventory, possibly impacting our operating results.
The power systems industry, and the electronics industry as a whole, can be subject to pronounced business cycles and otherwise subject to sudden and sharp changes in demand. Our success, in part, is dependent on our ability to forecast and procure inventories of raw materials and components to match production schedules and customer delivery requirements. Many of our products, notably VI Chip modules and Picor components, require raw materials supplied by a limited number of vendors and, in some instances, a single vendor. During certain periods, key materials required to build our products may become unavailable in the timeframe required for us to meet our customers’ needs. Our inability to secure sufficient materials and components to build products for our customers has, in the past, negatively impacted our sales and operating results and could do so again. We may choose to mitigate this risk by increasing the levels of inventory for certain raw materials and components. Such increased inventory levels may increase the potential risk for excess and obsolescence should our forecasts fail to materialize or if there are negative factors impacting our customers’ end markets, leading to order cancellation. If we purchase excess inventory or determine certain inventory is unusable, we may have to record additional inventory reserves or write off the unneeded inventory, which could have an adverse effect on our gross margins and on our operating results.
We are exposed to foreign economic, political and other risks.
For the years ended December 31, 2014, 2013, and 2012, our revenues from sales outside the United States were 60.5%, 59.5%, and 51.1%, respectively, of the Company’s total revenues. We expect international sales will continue to be a significant component of total sales, since many of the global manufacturers we target as customers increasingly utilize offshore contract manufacturers and rely upon those contract manufacturers to place orders directly with us. We also expect international revenue from our distributors to increase.
While our currency risks are limited, as our sales are denominated in U.S. Dollars worldwide, with the exception of Japan, our international activities expose us to special risks including, but not limited to, regulatory requirements, economic and political instability, transportation delays, foreign currency controls and market fluctuations, trade barriers and tariffs, and foreign exchange rates. In addition, our international customers’ business may be negatively affected by the ongoing crisis in the global credit and financial markets, or by economic sanctions, as were imposed in 2014 by the U.S. Department of the Treasury against certain Russian entities. Sudden or unexpected changes in the foregoing could have a material adverse effect on our operating results.
We may be unable to adequately protect our proprietary rights, which may limit our ability to compete effectively.
We operate in an industry in which the ability to compete depends on the development or acquisition of proprietary technologies that must be protected to preserve the exclusive use of such technologies. We devote substantial resources to establish and protect our patents and proprietary rights, and we rely on patent and intellectual property law to protect such rights. This protection, however, may not prevent competitors from independently developing products similar or superior to our products. We may be unable to protect or enforce current patents, may rely on unpatented technology that competitors could restrict, or may be unable to acquire patents in the future, all of which may have a material adverse effect on our competitive position. In addition, the intellectual property laws of foreign countries may not protect our rights to the same extent as those of the United States. We have been and may need to continue to defend or challenge patents. We have incurred and expect to incur significant costs in and devoted and expect to devote significant resources to these efforts which, if unsuccessful, may have a material adverse effect on our operating results and financial position.
16
We face intellectual property infringement claims that could be disruptive to operations and costly to resolve and may encounter similar infringement claims in the future.
The power supply industry is characterized by vigorous protection and pursuit of intellectual property rights. We have in the past and may in the future receive communications from third parties asserting that our products or manufacturing processes infringe on a third party’s patent or other intellectual property rights. Such assertions, if publicly disclosed, have in the past and may in the future inhibit the willingness of potential customers to purchase certain of our products. In the event a third party makes a valid intellectual property claim against us and a license is not available to us on commercially reasonable terms, or at all, we could be forced to either redesign or stop production of products incorporating that technology, and our operating results could be materially and adversely affected. In addition, litigation may be necessary to defend us against claims of infringement, and this litigation could be costly, extend over a lengthy period of time, and divert the attention of key personnel. An adverse outcome in these types of matters could have a material adverse impact on our operating results and financial condition.
In January 2011, we were named, along with our customer, Cisco Systems, Inc., in a complaint for patent infringement filed by SynQor, Inc. (see Part I, Item 3 — “Legal Proceedings”). We have filed a counterclaim asserting SynQor has engaged in unfair and deceptive trade practices and tortiously interfered with our ability to sell products. We also maintain SynQor’s claims are baseless and the patents in question are invalid and were obtained through inequitable conduct before the U.S. Patent and Trademark Office. We believe SynQor’s actions have inhibited our ability to sell our products to potential customers fearful of the threat of litigation by SynQor. Pre-trial proceedings began in 2013, but, as of March 6, 2015, the trial has not been scheduled. We have incurred substantial legal fees defending this matter and expect to continue to do so. Neither we nor our counsel in the matter currently has sufficient information upon which to base any conclusion regarding the outcome of these legal proceedings.
Any expenses or liability resulting from the outcome of litigation could adversely affect our operating results and financial condition.
From time to time, we may be subject to claims or litigation, including intellectual property litigation as described elsewhere in this Annual Report on Form 10-K. Any such claims or litigation may be time-consuming and costly, divert management resources, require us to change our products, or have other adverse effects on our business. Any of the foregoing could have a material adverse effect on our operating results and could require us to pay significant monetary damages.
The outcomes of legal proceedings and claims brought against us are subject to significant uncertainty. An estimated loss from a loss contingency such as a legal proceeding or claim is accrued by a charge to income if it is probable that an asset has been impaired or a liability has been incurred and the amount of the loss can be reasonably estimated. Disclosure of a contingency is required if there is at least a reasonable possibility that a loss has been incurred. In determining whether a loss should be accrued, we evaluate, among other factors, the degree of probability of an unfavorable outcome and the ability to make a reasonable estimate of the amount of loss. Changes in these factors could materially impact our financial statements. As of December 31, 2014, our evaluation led us to conclude no accrual of a loss contingency was warranted.
We may face legal claims and litigation from product warranty or other claims that could be costly to resolve.
We have in the past and may in the future encounter legal action from customers, vendors, or others concerning product warranty or other claims. We generally offer a two-year warranty from the date title passes from us for all of our standard products. We invest significant resources in the testing of our products; however, if any of our products contain defects, we may be required to incur additional development and remediation costs, pursuant to our warranty policies. These issues may divert our technical and other resources from other
17
product development efforts and could result in claims against us by our customers or others, including liability for costs associated with product returns, which may adversely impact our operating results. If any of our products contain defects, or have reliability, quality or compatibility problems, our reputation may be damaged, which could make it more difficult for us to sell our products to existing and prospective customers and could adversely affect our operating results. We are currently party to a limited number of supply agreements with certain customers contractually committing us to warranty and indemnification requirements exceeding those to which we have been exposed in the past. While we maintain insurance coverage for such exposure, we could incur significant financial cost beyond the limits of such coverage, as well as operational disruption and damage to our competitive position and image if faced with a significant product warranty or other claim.
Our ability to successfully implement our business strategy may be limited if we do not retain our key personnel and attract and retain skilled and experienced personnel.
Our success depends on our ability to retain the services of our executive officers. The loss of one or more members of senior management could materially adversely affect our business and financial results. In particular, we are dependent on the services of Dr. Vinciarelli, our founder, Chairman of the Board, Chief Executive Officer, and President. The loss of the services of Dr. Vinciarelli could have a material adverse effect on our development of new products and on our results of operations. In addition, we depend on highly skilled engineers and other personnel with technical skills that are in high demand and are difficult to replace. Our continued operations and growth depend on our ability to attract and retain skilled and experienced personnel in a very competitive employment market. If we are unable to attract and retain these employees, our ability to successfully implement our business strategy may be harmed.
Extended interruption of production at our manufacturing facility in Andover, Massachusetts, could materially reduce our revenue and increase costs.
All modular power components, whether for direct sale to customers or for sale to our subsidiaries and divisions for incorporation into their respective products, as well as all DC configurable products, are manufactured at our Andover, Massachusetts, production facility. As of January 2015, with the closure of our Sunnyvale, California, manufacturing facility, all Westcor AC-DC systems also are manufactured at our Andover facility. Substantial damage to this facility due to fire, natural disaster, power loss or other events could interrupt manufacturing. Any prolonged inability to utilize all or a significant portion of this facility could have a material adverse effect on our results of operations.
Disruption of our information technology infrastructure could adversely affect our business.
We depend heavily on our computing and communications infrastructure to achieve our business objectives, particularly for email communications, financial and operational record keeping, and our computer-integrated manufacturing processes that control all aspects of our operations in our manufacturing facility in Andover, Massachusetts. If a problem occurs impairing this infrastructure, the resulting disruption could impede our ability to record or process orders, manufacture and ship in a timely manner, or otherwise carry on business in the normal course. From time to time, we have experienced brief disruptions of our computing and communications infrastructure due to the effects of inclement weather on our access to the power grid or the public telecommunications infrastructure. To address this specific vulnerability, in 2012 we established our own proprietary fiber optic loop to connect our two facilities in Andover, Massachusetts, and invested in expanded data storage capabilities at each location, enabling robust data backup and failover routines. Since 2012, we have experienced no interruption of our computing and communications capabilities. While we carry business interruption insurance that would mitigate financial losses from such an interruption to an extent, such insurance may be insufficient to compensate us for the potentially significant amounts incurred. Any such events, if prolonged, could have a material and adverse effect on our operating results and financial condition.
18
Our systems are designed to protect us from network security breaches and associated disruptions. However, we remain vulnerable to computer viruses and related software-based challenges to the integrity of our systems, unauthorized or illegal break-ins or malicious network hacking, equipment or software sabotage, acts of vandalism to our systems by third parties, and, in the extreme, forms of cyber-terrorism. Our security measures or those of our third-party service providers may not detect or prevent such network security breaches or associated disruptions. Also, we provide confidential information to third-party business partners in certain circumstances when doing so is necessary to conduct business. While we employ confidentiality agreements to protect such information, our own security measures or those of our third-party service providers may not be sufficient to protect such information in the event the computing infrastructure of these third-party business partners is compromised. Security breaches of our computing and communications infrastructure or that of a third-party business partner could result in the misappropriation or unauthorized release of confidential information belonging to us or to our employees, partners, customers or suppliers, which could result in an interruption to our operations, result in a violation of privacy or other laws, expose us to a risk of litigation, or damage our reputation, any of which could have a material and adverse effect on our operating results and financial condition.
If we fail to maintain an effective system of internal controls or discover material weaknesses in our internal controls over financial reporting, we may not be able to report our financial results accurately or timely or detect fraud, which could have a material adverse effect on our business.
An effective internal control environment is necessary for us to produce reliable financial reports and is an important part of our effort to prevent financial fraud. Section 404 of the Sarbanes-Oxley Act of 2002 requires our management to report on, and our independent registered public accounting firm to attest to, the effectiveness of our internal control over financial reporting. We have an ongoing program to perform the system and process evaluation and testing necessary to comply with these requirements and to continuously improve and remediate internal controls over financial reporting. In addition, we will need to adopt the new framework for internal control, Internal Control – Integrated Framework (2013), as issued by the Committee of Sponsoring Organizations of the Treadway Commission (COSO), in the future.
While management evaluates the effectiveness of our internal controls on a regular basis, these controls may not always be effective. There are inherent limitations on the effectiveness of internal controls, including collusion, management override, and failure in human judgment. In addition, control procedures are designed to reduce rather than eliminate business risks. In the event that our Chief Executive Officer, Chief Financial Officer, or independent registered public accounting firm determines that our internal controls over financial reporting are not effective as defined under Section 404, we may be unable to produce reliable financial reports or prevent fraud, which could materially adversely affect our business. In addition, we may be subject to sanctions or investigation by government authorities or self-regulatory organizations, such as the Securities and Exchange Commission or The NASDAQ Stock Market LLC. Any such actions could affect investor perceptions of the Company and result in an adverse reaction in the financial markets due to a loss of confidence in the reliability of our financial statements, which could cause the market price of our Common Stock to decline or limit our access to capital.
New regulations related to conflict minerals could adversely impact our business.
The Dodd-Frank Wall Street Reform and Consumer Protection Act contains provisions to improve transparency and accountability concerning the supply of certain minerals, known as conflict minerals (including gold, tantalum, tin, and tungsten, and their related ores), originating from the Democratic Republic of Congo (“DRC”) and adjoining countries. As a result, in August 2012 the SEC released final rules for annual disclosure and reporting for those companies who use conflict minerals mined from the DRC and adjoining countries in their products. We began to implement processes within our supply chain to comply these rules beginning in 2012 and filed our initial Form SD in May 2014. There have been and will continue to be costs associated with complying with these disclosure requirements, including due diligence to determine the sources of conflict
19
minerals used in our products and other potential changes to products, processes, or sources of supply as a consequence of such verification activities. The implementation of these rules could adversely affect the sourcing, supply, and pricing of materials used in our products. As there may be only a limited number of suppliers offering “conflict free” conflict minerals, we cannot be sure that we will be able to obtain necessary conflict minerals from such suppliers in sufficient quantities or at competitive prices. Also, we may face reputational challenges if we determine that certain of our products contain minerals not determined to be conflict free or if we are unable to sufficiently verify the origins for all conflict minerals used in our products through the procedures we may implement.
| ITEM 1B. | UNRESOLVED STAFF COMMENTS |
None.
| ITEM 2. | PROPERTIES |
Our corporate headquarters building in Andover, Massachusetts, which we own, provides approximately 90,000 square feet of office space for our sales, marketing, engineering, and administrative personnel and is used by and supports all business segments. We also own a building of approximately 230,000 square feet in Andover, Massachusetts, which houses all Massachusetts manufacturing activities.
In December 2014, we completed the consolidation of manufacturing Westcor’s products, from a single-story industrial building of approximately 31,000 square feet in Sunnyvale, California, to our manufacturing facility in Andover, Massachusetts. The Sunnyvale building was purchased in 1994 and is carried on our consolidated balance sheet at a net book value, as of December 31, 2014, of approximately $769,000. We have offered the building for lease to third parties and expect to enter into a lease agreement during 2015.
All other domestic and foreign facilities are leased from third-party lessors on arms’ length terms. We believe our owned and leased facilities are adequate for our present needs and expect them to remain adequate for the foreseeable future.
| ITEM 3. | LEGAL PROCEEDINGS |
On January 28, 2011, SynQor, Inc. (“SynQor”) filed a complaint for patent infringement against Ericsson, Inc. (“Ericsson”), Cisco Systems, Inc. (“Cisco”) and Vicor in U.S. District Court for the Eastern District of Texas (“the Texas Action”). This immediately followed a complaint filed by us on January 26, 2011, in U.S. District Court for the District of Massachusetts, in which we sought a declaratory judgment that our bus converter products do not infringe any valid claim of certain of SynQor’s U.S. patents, and that the claims of those patents are invalid. With respect to Vicor, SynQor’s complaint alleges our products, including, but not limited to, unregulated bus converters used in intermediate bus architecture power supply systems, infringe certain SynQor patents. SynQor seeks, among other items, an injunction against further infringement and an award of unspecified compensatory and enhanced damages, interest, costs and attorney fees. On February 8, 2011, SynQor filed a motion for preliminary injunction seeking an order enjoining us from manufacturing, using, selling, and offering for sale in the United States and/or importing into the United States certain identified unregulated bus converters, as well as any other bus converters not significantly different from those products. On February 17, 2011, we withdrew our Massachusetts action without prejudice to allow the litigation to proceed in Texas. On May 16, 2011, SynQor announced it was withdrawing its motion for preliminary injunction against us. On that date, SynQor also announced it and Ericsson had entered into a definitive settlement agreement. On September 16, 2011, the U.S. District Court for the Eastern District of Texas issued an order setting a trial date of July 7, 2014. On September 20, 2011, SynQor filed an amended complaint in the Texas Action. The amended complaint repeated the allegations of patent infringement against us contained in SynQor’s original complaint, and included additional patent infringement allegations with respect to U.S. Patent No. 8,023,290 (“290 patent”), which was issued on that day. As with SynQor’s original complaint, the amended complaint alleged our products,
20
including but not limited to our unregulated bus converters used in intermediate bus architecture power supply systems, infringed the asserted patents. On October 4, 2011, we filed an answer and counterclaims to SynQor’s amended complaint, in which we allege the 290 patent is unenforceable because it was procured through inequitable conduct before the U.S. Patent and Trademark Office and seek damages against SynQor for SynQor’s unfair and deceptive trade practices and tortious interference with prospective economic advantage in connection with SynQor’s allegations of patent infringement against us. On January 2, 2014, the court issued its claim construction order following a claim construction hearing held on December 17, 2013. On January 16, 2014, we filed a motion seeking reconsideration of certain aspects of the court’s claim construction ruling. On March 31, 2014, the court issued an order severing the case against us and Cisco into two separate matters, with separate trials to be held with respect to SynQor’s claims against Cisco and SynQor’s claims against us. On June 30, 2014, we filed a number of motions seeking summary judgment in this matter, including for a finding of no direct, indirect, or willful infringement and for a finding of indefiniteness with respect to U.S. Patent No. 7,272,021. The court has yet to rule on these motions. On October 23, 2014, the court issued an order continuing trial in this matter indefinitely. On January 7, 2015, our case and that of Cisco were assigned to a new judge within the U.S. District Court for the Eastern District of Texas. On January 30, 2015, SynQor filed a motion requesting a status conference. That motion has not yet been addressed by the court. On February 6, 2015, SynQor filed a motion to consolidate ours and Cisco’s cases for trial. That motion has not yet been briefed by the parties. As of March 6, 2015, we have received no notice from the court regarding the timing of rulings on our summary judgment motions or the scheduling of a trial in this matter.
We continue to believe none of our products, including our unregulated bus converters, infringe any valid claim of the asserted SynQor patents, either alone or when used in an intermediate bus architecture implementation. We believe SynQor’s claims lack merit and, therefore, continue to vigorously defend ourselves against SynQor’s patent infringement allegations.
In addition to the SynQor matter, we are involved in certain other litigation and claims incidental to the conduct of our business. While the outcome of lawsuits and claims against us cannot be predicted with certainty, we do not expect any such current litigation or claims to have a material adverse impact on our financial position or results of operations.
| ITEM 4. | MINE SAFETY DISCLOSURES |
Not Applicable.
21
PART II
| ITEM 5. | MARKET FOR REGISTRANT’S COMMON EQUITY, RELATED STOCKHOLDER MATTERS AND ISSUER PURCHASES OF EQUITY SECURITIES |
Our Common Stock is listed on The NASDAQ Stock Market LLC, under the trading symbol “VICR.” Shares of our Class B Common Stock are not registered with the Securities and Exchange Commission, are not listed on any exchange nor traded on any market, and are subject to transfer restrictions under our Restated Certificate of Incorporation, as amended.
The following table sets forth the quarterly high and low sales prices for the Common Stock as reported by The NASDAQ Stock Market for the periods indicated:
| 2014 |
High | Low | ||||||
| First Quarter |
$ | 13.81 | $ | 9.63 | ||||
| Second Quarter |
11.25 | 6.76 | ||||||
| Third Quarter |
10.20 | 7.20 | ||||||
| Fourth Quarter |
13.96 | 8.43 | ||||||
| 2013 |
High | Low | ||||||
| First Quarter |
$ | 5.78 | $ | 4.77 | ||||
| Second Quarter |
6.85 | 4.91 | ||||||
| Third Quarter |
8.92 | 6.58 | ||||||
| Fourth Quarter |
13.94 | 7.53 | ||||||
As of February 27, 2015, there were 180 holders of record of our Common Stock and 13 holders of record of our Class B Common Stock. These numbers do not reflect persons or entities that hold their shares in nominee or “street name” through various brokerage firms.
Dividend Policy
We do not have a policy mandating the declaration of cash dividends at any particular time or on a regular basis. We did not pay cash dividends on our Common Stock for the years ended December 31, 2014 or 2013.
Dividends are declared periodically, only at the discretion of our Board of Directors, and any such declaration depends on actual cash from operations, our financial condition and capital requirements, the recommendation of our management, and any other factors the Board of Directors may consider relevant at the time.
From time to time, excess cash held at the subsidiary level is transferred to the Company via cash dividends declared by the subsidiary. Because we own less than 100% of the common stock of certain subsidiaries, such subsidiary dividends can result in payments to outside shareholders of those subsidiaries. During the year ended December 31, 2014, two of our subsidiaries paid a total of $3,900,000 in cash dividends, of which an aggregate of $3,738,000 was paid to us and $162,000 was paid to outside shareholders (i.e., paid to certain subsidiary employees who own common stock in the subsidiary). During the year ended December 31, 2013, three of our subsidiaries paid a total of $2,100,000 in cash dividends, of which an aggregate of $1,569,000 was paid to us and $531,000 was paid to outside shareholders. Dividends paid to outside shareholders of our subsidiaries are accounted for as a reduction in noncontrolling interest.
22
Issuer Purchases of Equity Securities
| Period |
Total Number of Shares (or Units) Purchased |
Average Price Paid per Share (or Unit) |
Total Number of Shares (or Units) Purchased as Part of Publicly Announced Plans or Programs |
Maximum Number (of Approximate Dollar Value) of Shares (or Units) that May Yet Be Purchased Under the Plans or Programs |
||||||||||||
| October 1 — 31, 2014 |
— | $ | — | — | $ | 8,541,000 | ||||||||||
| November 1 — 30, 2014 |
— | $ | — | — | $ | 8,541,000 | ||||||||||
| December 1 — 31, 2014 |
— | $ | — | — | $ | 8,541,000 | ||||||||||
|
|
|
|
|
|
|
|
|
|||||||||
| Total |
— | $ | — | — | $ | 8,541,000 | ||||||||||
|
|
|
|
|
|
|
|
|
|||||||||
In November 2000, our Board of Directors authorized the repurchase of up to $30,000,000 of our Common Stock (the “November 2000 Plan”). The November 2000 Plan authorizes us to make such repurchases from time to time in the open market or through privately negotiated transactions. The timing and amounts of Common Stock repurchases are at the discretion of management based on its view of economic and financial market conditions.
23
Stockholder Return Performance Graph
The graph set forth below presents the cumulative, five-year stockholder return for each of the Company’s Common Stock, the Standard & Poor’s 500 Index (“S&P 500 Index”), a value-weighted index made up of 500 of the largest, by market capitalization, listed companies, and the Standard & Poor’s SmallCap 600 Index (“S&P SmallCap 600 Index”), a value-weighted index of 600 listed companies with market capitalizations between $200,000,000 and $1,000,000,000.
The graph assumes an investment of $100 on December 31, 2009, in each of our Common Stock, the S&P 500 Index, and the S&P SmallCap 600 Index, and assumes reinvestment of all dividends. The historical information set forth below is not necessarily indicative of future performance.
Comparison of Five Year Cumulative Return
Among Vicor Corporation, S&P 500 Index
and S&P SmallCap 600 Index
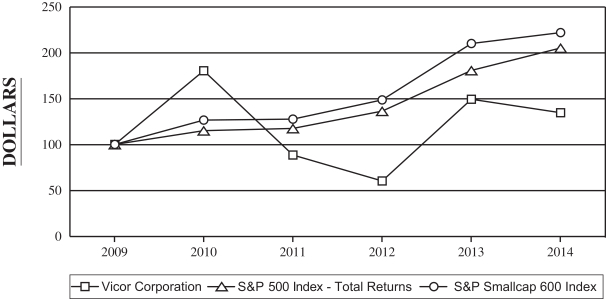
| 2009 | 2010 | 2011 | 2012 | 2013 | 2014 | |||||||||||||||||
| Vicor Corporation |
$100.00 | $ | 180.14 | $ | 88.54 | $ | 60.29 | $ | 149.27 | $ | 134.59 | |||||||||||
| S&P 500 Index |
$100.00 | $ | 115.06 | $ | 117.49 | $ | 136.30 | $ | 180.44 | $ | 205.14 | |||||||||||
| S&P SmallCap 600 Index |
$100.00 | $ | 126.31 | $ | 127.59 | $ | 148.42 | $ | 209.74 | $ | 221.81 | |||||||||||
Our equity plan information required by this item is incorporated by reference to the information in Part III, Item 12 of this Annual Report on Form 10-K.
24
| ITEM 6. | SELECTED FINANCIAL DATA |
The following selected consolidated financial data with respect to our statements of operations for the years ended December 31, 2014, 2013, and 2012, and with respect to our balance sheet as of December 31, 2014 and 2013, are derived from our audited Consolidated Financial Statements, which appear elsewhere in this Annual Report on Form 10-K. The following selected consolidated financial data with respect to our statements of operations for the years ended December 31, 2011 and 2010, and with respect to our balance sheets as of December 31, 2012, 2011, and 2010, are derived from our Consolidated Financial Statements, which are not included herein. The data should be read in conjunction with the Consolidated Financial Statements, related notes and other financial information included herein.
| Year Ended December 31, | ||||||||||||||||||||
| Statement of Operations Data |
2014 | 2013 | 2012 | 2011 | 2010 | |||||||||||||||
| (In thousands, except per share data) | ||||||||||||||||||||
| Net revenues |
$ | 225,731 | $ | 199,160 | $ | 218,507 | $ | 252,968 | $ | 250,733 | ||||||||||
| Income (loss) from operations |
(14,763 | ) | (20,467 | ) | (2,785 | ) | 13,686 | 29,122 | ||||||||||||
| Consolidated net income (loss) |
(14,070 | ) | (23,504 | ) | (3,798 | ) | 9,309 | 33,539 | ||||||||||||
| Net income (loss) attributable to noncontrolling interest |
(183 | ) | 136 | 279 | 466 | 214 | ||||||||||||||
| Net income (loss) attributable to Vicor Corporation |
(13,887 | ) | (23,640 | ) | (4,077 | ) | 8,843 | 33,325 | ||||||||||||
| Net income (loss) per share — basic and diluted attributable to Vicor Corporation |
(0.36 | ) | (0.60 | ) | (0.10 | ) | 0.21 | 0.80 | ||||||||||||
| Weighted average shares — basic |
38,569 | 39,195 | 41,811 | 41,797 | 41,700 | |||||||||||||||
| Weighted average shares — diluted |
38,569 | 39,195 | 41,811 | 41,856 | 41,772 | |||||||||||||||
| Cash dividends per share |
$ | — | $ | — | $ | — | $ | 0.15 | $ | 0.30 | ||||||||||
| As of December 31, | ||||||||||||||||||||
| Balance Sheet Data | 2014 | 2013 | 2012 | 2011 | 2010 | |||||||||||||||
| (In thousands) | ||||||||||||||||||||
| Working capital |
$ | 90,321 | $ | 97,869 | $ | 128,498 | $ | 124,386 | $ | 105,454 | ||||||||||
| Total assets |
155,542 | 165,640 | 202,581 | 208,141 | 204,912 | |||||||||||||||
| Total liabilities |
24,990 | 23,303 | 20,608 | 23,431 | 25,900 | |||||||||||||||
| Total equity |
130,552 | 142,337 | 181,973 | 184,710 | 179,012 | |||||||||||||||
| ITEM 7. | MANAGEMENT’S DISCUSSION AND ANALYSIS OF FINANCIAL CONDITION AND RESULTS OF OPERATIONS |
Overview
We design, develop, manufacture, and market modular power components and complete power systems and have organized our business segments according to our key product lines. The BBU segment designs, develops, manufactures and markets our modular power converters and configurable products, and also includes the six entities comprising Vicor Custom Power, and the BBU operations of VJCL. In December 2014, we completed the consolidation of manufacturing Westcor division products from its facility in Sunnyvale, California to our primary manufacturing facility in Andover, Massachusetts. The VI Chip segment includes VI Chip Corporation, which designs, develops, manufactures, and markets our FPA products. The VI Chip segment also includes the VI Chip business conducted through VJCL. The Picor segment includes Picor Corporation, which designs, develops, manufactures, and markets integrated circuits and related products for use in a variety of power management and power system applications. Picor develops these products for use in our BBU and VI Chip modules, to be sold as complements to our BBU and VI Chip products, or for sale to third parties for separate (i.e., stand-alone) applications.
25
We sell our products primarily to customers in the higher-performance, higher-power segments of the power systems market. The BBU has customers concentrated in defense electronics, industrial automation and equipment, rail transportation, and test and measurement instrumentation, while VI Chip and Picor have customers concentrated in the datacenter and supercomputer segments of the computing market, although VI Chip and Picor also target applications in aerospace and defense electronics, test and measurement instrumentation, and networking. With our strategic emphasis on larger, high-volume customers, we expect to experience a greater concentration of sales among relatively few customers.
Our bookings, revenues, and operating results in 2014 were negatively influenced by slower than anticipated customer adoption of our new products, sustained macroeconomic uncertainty across certain markets and geographies, the consequences of customer concentration, and the high cost of ongoing litigation. Our decision to consolidate manufacturing of Westcor AC-DC systems in Andover, Massachusetts, also negatively influenced results. Certain markets in which we have historically focused remain weak, notably defense electronics. Geographically, European demand remains weak due to economic uncertainty across much of the region. Because we are shifting our strategy toward serving fewer, higher volume customers with our innovative new products, we currently are vulnerable to swings in demand from a relatively small number of early adopting customers, although our objective is to diversify our customer base, given the breadth of applications of these new products. However, until customer adoption of these new products accelerates, we may not achieve such customer diversification. As addressed elsewhere, we intend to continue our vigorous defense of certain intellectual property claims and cannot predict the ultimate cost of such defense nor when the matter might be resolved.
For the year ended December 31, 2014, revenues increased 13.3% to $225,731,000 from $199,160,000 in 2013. Export sales as a percentage of total revenues were approximately 60.5% in 2014 and 59.5% in 2013. Gross margin increased to $97,120,000 in 2014 from $81,479,000 in 2013. Gross margin, as a percentage of revenue, increased to 43.0% in 2014 from 40.9% in 2013.
Backlog, representing the total of orders for products received for which shipment is scheduled within the next 12 months, was approximately $54,249,000 at the end of 2014 as compared to $44,659,000 at the end of 2013.
Operating expenses for 2014 increased $9,937,000, or 9.7%, to $111,883,000 from $101,946,000 in 2013 due to an increase in selling, general, and administrative expenses of $7,460,000, and an increase in research and development expenses of $1,631,000. During the second half of 2014, we recorded a pre-tax charge of $2,207,000 for the cost of severance and other associated costs related to our consolidation of the manufacturing of Westcor AC-DC systems in Andover, Massachusetts, which was completed in December 2014. (See Note 10 to the Consolidated Financial Statements for details associated with this consolidation). During the first quarter of 2013, we recorded a pre-tax charge of $1,361,000 for severance and other employee-related costs for a company-wide workforce reduction initiated and completed in February 2013. The primary element of the increase in selling, general, and administrative expenses was legal fees of $6,818,000, due to the ongoing litigation with SynQor, Inc. (See Part I, Item 3 – “Legal Proceedings”). The primary elements of the increase in research and development expenses were compensation expenses of $1,083,000, depreciation and amortization of $259,000, project and pre-production materials of $148,000, and facilities expenses of $132,000.
For 2014, no tax benefit could be recognized for the majority of our losses due to a full valuation allowance against all domestic deferred tax assets, which was established in the fourth quarter of 2013.
We reported a net loss in 2014 of $(13,887,000) as compared to a net loss of $(23,640,000) in 2013, and a net loss per share of $(0.36) in 2014, as compared to a net loss per share of $(0.60) in 2013.
In 2014, depreciation and amortization totaled $9,805,000 and capital additions were $7,128,000, compared to $10,008,000 and $6,179,000, respectively, for 2013.
26
Inventories decreased by approximately $3,368,000, or 11.3%, to $26,328,000 at the end of 2014 as compared to $29,696,000 at the end of 2013. This decrease was associated with decreases in VI Chip and BBU inventories of $2,134,000 and $1,383,000, respectively, partially offset by an increase in Picor inventories of $149,000.
The following table sets forth certain items of selected consolidated financial information as a percentage of net revenues for the Years shown, ended December 31. This table and the subsequent discussion should be read in conjunction with the selected financial data and the Consolidated Financial Statements and related footnotes contained elsewhere in this report.
| Year Ended December 31, | ||||||||||||
| 2014 | 2013 | 2012 | ||||||||||
| Net revenues |
100.0 | % | 100.0 | % | 100.0 | % | ||||||
| Gross margin |
43.0 | % | 40.9 | % | 41.9 | % | ||||||
| Selling, general and administrative expenses |
30.2 | % | 30.5 | % | 25.5 | % | ||||||
| Research and development expenses |
18.4 | % | 20.0 | % | 17.7 | % | ||||||
| Loss before income taxes |
(6.4 | )% | (10.3 | )% | (1.2 | )% | ||||||
Critical Accounting Policies and Estimates
Management’s Discussion and Analysis of Financial Condition and Results of Operations is based upon our Consolidated Financial Statements, which have been prepared in accordance with accounting principles generally accepted in the United States. The preparation of these financial statements requires management to make estimates and assumptions that affect the reported amounts of assets, liabilities, revenues, expenses, and related disclosures of contingent assets and liabilities. On an ongoing basis, we evaluate our estimates and assumptions, and our associated judgments, including those related to inventories, impairment of long-lived assets, income taxes, contingencies, and litigation. We base our estimates, assumptions, and judgments on historical experience, knowledge of current conditions, and on various other factors we believe to be reasonable under the circumstances, the results of which form the basis for making judgments about the carrying value of assets and liabilities that are not readily apparent from other sources. Actual results may differ from these estimates under different assumptions or conditions. We also have other policies we consider key accounting policies, such as our policy for revenue recognition, including the deferral of revenue on sales to distributors until the products are sold to the end user. However, the application of these other policies does not require us to make significant estimates and assumptions difficult to support quantitatively.
Inventories
We employ a variety of methodologies to estimate allowances for our inventory for estimated obsolescence or unmarketable inventory, based upon our existing backlog, historical consumption, and assumptions about future demand and market conditions. For BBU products produced at our Andover facility, our principal manufacturing location, the methodology used compares on-hand quantities to projected demand and historical consumption, such that amounts of inventory on hand in excess of a three-year projected consumption or three-year historical consumption, whichever is higher, are fully reserved. VI Chip uses a one-year projected consumption assumption. Historical consumption assumptions are one-year for VI Chip and two-year for Picor, since their products are still at a relatively early stage. While we have used our best efforts and believe we have used the best available information to estimate future demand, due to uncertainty in the economy and our business and the inherent difficulty in predicting future demand, it is possible actual demand for our products will differ from our estimates. If actual future demand or market conditions are less favorable than those projected by management, additional inventory reserves for existing inventories may need to be recorded in future periods.
27
Long-Lived Assets
We review property, plant, and equipment and finite-lived intangible assets for impairment whenever events or changes in circumstances indicate the carrying value of such assets may not be recoverable. We determine whether the carrying value of an asset or asset group is recoverable based on comparison to the undiscounted expected future cash flows the assets are expected to generate over their remaining economic lives. If the value of an asset is considered not recoverable, the impairment loss is equal to the amount by which the carrying value of the asset exceeds its estimated fair value, which is determined by either a quoted market price, if any, or a value determined by utilizing a discounted cash flow technique. Evaluation of impairment of long-lived assets requires estimates of future operating results that are used in the preparation of the expected future undiscounted cash flows. Actual future operating results and the remaining economic lives of our long-lived assets could differ from the estimates used in assessing the recoverability of the carrying value of these assets. These differences could result in impairment charges, which could have a material adverse impact on our results of operations.
Income Taxes
We make certain estimates, assumptions, and judgments in determining income tax expense for financial statement reporting purposes. These estimates, assumptions, and judgments occur in the calculation of tax credits, benefits, and deductions, and in the calculation of certain assets and liabilities that arise from differences in the timing and of the recognition of revenue and expense for tax and financial statement purposes, as well as the interest and penalties relating to uncertain tax positions. Significant changes to these estimates, assumptions, and judgments may result in an increase or decrease to our tax provision in a subsequent period.
Significant management judgment also is required in determining whether deferred tax assets will be realized in full or in part. We assess the need for a valuation allowance on a quarterly basis. We record a valuation allowance to reduce our deferred tax assets to the amount we believe is more likely than not to be realized. In assessing the need for a valuation allowance, we consider all positive and negative evidence, including scheduled reversals of deferred tax liabilities, projected future taxable income, tax planning strategies, and past financial performance. In 2013, we recorded an increase to the valuation allowance to cover all domestic net deferred tax assets. The valuation allowance against these deferred tax assets may require adjustment in the future based on changes in the mix of temporary differences, changes in tax laws, and operating performance. If and when we determine the valuation allowance should be released (i.e., reduced), the adjustment would result in a tax benefit reported in that period’s Consolidated Statements of Operations, the effect of which would be an increase in reported net income. A portion of such an adjustment may be accounted for through an increase to “Additional paid-in capital”, a component of Stockholders’ Equity. The amount of any such tax benefit associated with release of our valuation allowance in a particular quarter may be material.
We follow a two-step process to determine the amount of tax benefit to recognize in our financial statements for tax positions taken on tax returns. The first step is to evaluate the tax position to determine the likelihood it would be sustained upon examination by a tax authority. If the tax position is deemed “more-likely-than-not” to be sustained, the second step is to assess the tax position to determine the amount of tax benefit to recognize in the financial statements. The amount of the benefit that may be recognized is the largest amount that has a greater than 50 percent likelihood of being realized upon ultimate settlement. If the tax position does not meet the “more-likely-than-not” threshold then it is not recognized in the financial statements. We accrue interest and penalties, if any, related to unrecognized tax benefits as a component of income tax expense. If the estimates, assumptions, and judgments made by us change, the unrecognized tax benefits may have to be adjusted, and such adjustments may be material.
Contingencies
From time to time, we receive notices of product failure claims, notices of infringement of patent or other intellectual property rights of others, or notices associated with other claims. In January 2011, we were named in
28
a lawsuit for patent infringement filed by SynQor, Inc. (See Part I, Item 3 — “Legal Proceedings”) that is ongoing. We assess each notice and associated matter to determine if a contingent liability should be recorded. In making this assessment, we may consult, depending on the nature of the matter, with external legal counsel and technical experts. Based on the information we obtain, combined with our judgment regarding all the facts and circumstances of each matter, we determine whether it is probable a contingent loss may be incurred and whether the amount of such loss can be reasonably estimated. Should a loss be probable and reasonably estimable, we record such a loss (i.e., we establish a loss contingency). In determining the amount of the loss to be recorded, we consider advice received from experts in the specific matter, current status of legal proceedings (if any), prior case history, comparable precedent litigation, and other factors. Should the estimates, assumptions, and judgments made by us change, we may need to record additional losses (i.e., add to our loss contingency) that may be material.
New Accounting Pronouncements
From time to time, new accounting pronouncements are issued by the Financial Accounting Standards Board (“FASB”) that we adopt as of the specified effective date. Unless otherwise discussed, we believe the impact of recently issued accounting standards will not have a material impact on our future financial condition and results of operations. See Note 2—Impact of recently issued accounting standards, to the Consolidated Financial Statements for a description of recently issued and adopted accounting pronouncements, including the dates of adoption and expected impact on our financial position and results of operations.
Year ended December 31, 2014 compared to Year ended December 31, 2013
Net revenues for 2014 were $225,731,000, an increase of $26,571,000 or 13.3%, as compared to $199,160,000 for 2013.
The components of revenue for the years ended December 31 were as follows (dollars in thousands):
| Increase (decrease) | ||||||||||||||||
| 2014 | 2013 | $ | % | |||||||||||||
| BBU |
$ | 184,224 | $ | 163,013 | $ | 21,211 | 13.0 | % | ||||||||
| VI Chip |
32,929 | 33,279 | (350 | ) | (1.1 | )% | ||||||||||
| Picor |
8,578 | 2,868 | 5,710 | 199.1 | % | |||||||||||
|
|
|
|
|
|
|
|||||||||||
| Total |
$ | 225,731 | $ | 199,160 | $ | 26,571 | 13.3 | % | ||||||||
|
|
|
|
|
|
|
|||||||||||
The overall year to year increase in net revenues is primarily due to an approximately 10.7% increase in bookings for 2014 compared to 2013 and, particularly, a 23.8% increase in booking in the second half of 2014 compared to the same period in 2013. The increase in BBU revenues is primarily attributed to increases in BBU component revenues of approximately $16,202,000, primarily due to increased shipments to customers in China, Vicor Custom Power revenues of approximately $3,628,000, Westcor revenues of approximately $834,000, and VJCL revenues of approximately $613,000. The decline in VI Chip revenues was expected, as the segment’s major datacenter customer transitioned to a new VI Chip product platform. One aspect of this transition is that certain Picor products are required in the new platform, replacing certain VI Chip products. This product shift was the primary reason for the increase in Picor bookings and shipments in 2014, compared to 2013. VI Chip bookings and shipments did increase in the second half of 2014, as orders were received for products under the new platform.
Gross margin for 2014 increased $15,641,000, or 19.2%, to $97,120,000 from $81,479,000 in 2013. Gross margin as a percentage of net revenues increased to 43.0% in 2014 from 40.9% in 2013. The increase in gross margin and gross margin percentage was attributed primarily to the increase in net revenues and the shift to a larger proportion of higher margin BBU and Picor products.
29
Income (loss) from operations by segment for the years ended December 31 were as follows (dollars in thousands):
| Increase (decrease) | ||||||||||||||||
| 2014 | 2013 | $ | % | |||||||||||||
| BBU |
$ | 15,499 | $ | 12,062 | $ | 3,437 | 28.5 | % | ||||||||
| VI Chip |
(29,015 | ) | (28,204 | ) | (811 | ) | (2.9 | )% | ||||||||
| Picor |
(407 | ) | (3,326 | ) | 2,919 | 87.8 | % | |||||||||
| Corporate |
(840 | ) | (999 | ) | 159 | 15.9 | % | |||||||||
|
|
|
|
|
|
|
|||||||||||
| Total |
$ | (14,763 | ) | $ | (20,467 | ) | $ | 5,704 | 27.9 | % | ||||||
|
|
|
|
|
|
|
|||||||||||
The increase in BBU operating profit in 2014 compared to 2013 was due to an increase in revenues and a related increase in gross margin, partially offset by increases in operating expenses. The primary increases in operating expenses were legal fees, compensation expenses, and charges for severance and other costs associated with consolidation of our Westcor manufacturing facility. Legal fees, which are charged to the BBU segment, are associated with the ongoing patent infringement claim filed against the Company in 2011 by SynQor. While legal fees decreased in the fourth quarter of 2014, they are expected to increase once a trial date is established. All segments incurred higher compensation expenses due to higher personnel headcount and annual merit increases. The VI Chip segment continues to incur significant operating losses as revenue volume and related gross margins are not sufficient to cover fixed manufacturing costs and operating expenses, particularly research and development expenses. The decrease in Picor operating loss in 2014 compared to 2013 was due to the increase in revenues and the related increase in gross margin. The cash needs for each segment are primarily for working capital and capital expenditures. Positive cash flow from BBU historically has funded, and is expected to continue to fund, VI Chip and Picor operations, as well as the capital expenditures for all segments for the foreseeable future.
Selling, general, and administrative expenses were $68,197,000 for 2014, an increase of $7,460,000, or 12.3%, as compared to $60,737,000 for 2013. As a percentage of net revenues, selling, general and administrative expenses decreased to 30.2% in 2014 from 30.5% in 2013.
The components of the $7,460,000 increase in selling, general, and administrative expenses were as follows (in thousands):
| Increase (decrease) | ||||||||
| Legal fees |
$ | 6,818 | 166.2 | %(1) | ||||
| Compensation |
1,119 | 3.2 | %(2) | |||||
| Facilities expenses |
180 | 14.2 | % | |||||
| Business taxes and fees |
163 | 45.8 | % | |||||
| Bad debt expense |
(215 | ) | (78.0 | )%(3) | ||||
| Stockholder reporting |
(228 | ) | (52.7 | )%(4) | ||||
| Training and professional development |
(262 | ) | (80.1 | )%(5) | ||||
| Other, net |
(115 | ) | (0.6 | )% | ||||
|
|
|
|||||||
| $ | 7,460 | 12.3 | % | |||||
|
|
|
|||||||
| (1) | Increase attributed to legal expenses associated with the patent infringement claim filed against the Company during the first quarter of 2011 by SynQor. See Note 15 to the Consolidated Financial Statements. |
| (2) | Increase primarily attributed to annual compensation adjustments in May 2014 and an increase in sales and marketing headcount. |
| (3) | Decrease attributed to additional expense recognized in the second quarter of 2013 pertaining to one customer, without a comparable increase in 2014. |
30
| (4) | Decrease primarily attributed to additional expenses incurred in 2013 in connection with the public tender offers for shares of our Common Stock and for the Offer to Exchange. |
| (5) | Decrease primarily attributed to additional expenses incurred in 2013 for corporate management and sales personnel training. |
Research and development expenses increased $1,631,000, or 4.1%, to $41,479,000 in 2014 from $39,848,000 in 2013. As a percentage of net revenues, research and development decreased to 18.4% in 2014 from 20.0% in 2013, primarily due to the increase in net revenues.
The components of the $1,631,000 increase in research and development expenses were as follows (in thousands):
| Increase (decrease) | ||||||||
| Compensation |
$ | 1,083 | 4.0 | %(1) | ||||
| Depreciation and amortization |
259 | 12.5 | %(2) | |||||
| Project and pre-production materials |
148 | 3.3 | % | |||||
| Facilities expenses |
132 | 7.0 | % | |||||
| Other, net |
9 | 0.2 | % | |||||
|
|
|
|||||||
| $ | 1,631 | 4.1 | % | |||||
|
|
|
|||||||
| (1) | Increase primarily attributed to annual compensation adjustments in May 2014. |
| (2) | Increase primarily attributed to additions of engineering test equipment for VI Chip. |
During the second half of 2014, we recorded a pre-tax charge of $2,207,000 for the cost of severance and other associated expenses related to our consolidation of the manufacturing of Westcor AC-DC systems from Sunnyvale, California, to our manufacturing facility in Andover, Massachusetts. During the first quarter of 2013, we recorded a pre-tax charge of $1,361,000 for the cost of severance and other employee-related costs for a company-wide workforce reduction initiated and completed in February 2013.
The significant changes in the components of “Other income, net” for the years ended December 31 were as follows (in thousands):
| 2014 | 2013 | Increase (decrease) |
||||||||||
| Credit gains (losses) on available for sale securities |
$ | 311 | $ | (78 | ) | $ | 389 | |||||
| Foreign currency losses, net |
(196 | ) | (94 | ) | (102 | ) | ||||||
| Interest income |
80 | 97 | (17 | ) | ||||||||
| Gain on disposal of equipment |
22 | 26 | (4 | ) | ||||||||
| Other |
51 | 51 | — | |||||||||
|
|
|
|
|
|
|
|||||||
| $ | 268 | $ | 2 | $ | 266 | |||||||
|
|
|
|
|
|
|
|||||||
The Company’s exposure to market risk for fluctuations in foreign currency exchange rates relates primarily to the operations of VJCL, for which the functional currency is the Japanese Yen. The functional currency of the Company’s other subsidiaries in Europe and Asia is the U.S. Dollar. The decrease in interest income for the period was due to lower average balances on the Company’s long-term investments.
Loss before income taxes was $(14,495,000) in 2014 as compared to $(20,465,000) in 2013.
31
The (benefit) provision for income taxes and the effective income tax rate for the years ended December 31 were as follows (dollars in thousands):
| 2014 | 2013 | |||||||
| (Benefit) provision for income taxes |
$ | (425 | ) | $ | 3,039 | |||
| Effective income tax rate |
(2.9 | %) | 14.8 | % | ||||
In 2014, the Company could not recognize a tax benefit for the majority of its losses due to a full valuation allowance against all domestic deferred tax assets. During the third quarter of 2014, the Company recognized a tax benefit of approximately $552,000 as a discrete item for the release of certain income tax reserves, due to the completion of an Internal Revenue Service examination of its 2010 and 2011 federal corporate income tax returns during the quarter. For the year ended December 31, 2013, a net income tax provision was recorded primarily due to an increase in the valuation allowance for all remaining domestic net deferred tax assets not previously covered by a valuation allowance. In 2013, we recorded an increase to the valuation allowance of approximately $10,241,000 due to the following factors: (1) our forecast of future taxable income, of the appropriate nature, based on our quarterly assessment was not sufficient to support the recoverability of the remaining tax assets; (2) our recent cumulative losses and forecast of continued losses into 2014; (3) our ability to carryback federal net operating losses or credits to utilize against federal taxable income will generate only $1,600,000 in cash refunds and (4) our lack of prudent and feasible tax planning strategies. The tax expense due to the increase in the valuation allowance was partially offset by a benefit for a net operating loss carryback for federal income tax purposes and the recognition of a benefit from the federal research tax credit for 2012 of $549,000, as a discrete item in the first quarter of 2013. The federal research tax credit for 2012 and 2013 was extended on January 2, 2013, pursuant to the American Taxpayer Relief Act of 2012 (“ATRA”).
Net income (loss) of noncontrolling interest decreased by $319,000 for 2014 to ($183,000), as compared to $136,000 for 2013. This was due to net losses during 2014 recorded by entities in which others hold a noncontrolling equity interest (i.e., three Vicor Custom Power subsidiaries and VJCL).
Net loss per share attributable to Vicor Corporation was $(0.36) for the year ended December 31, 2014, compared to net loss per share of $(0.60) for the year ended December 31, 2013.
Year ended December 31, 2013 compared to Year ended December 31, 2012
Net revenues for 2013 were $199,160,000, a decrease of $19,347,000 or 8.9%, as compared to $218,507,000 for 2012.
The components of revenue for the years ended December 31 were as follows (dollars in thousands):
| Increase (decrease) | ||||||||||||||||
| 2013 | 2012 | $ | % | |||||||||||||
| BBU |
$ | 163,013 | $ | 179,919 | $ | (16,906 | ) | (9.4 | )% | |||||||
| VI Chip |
33,279 | 35,394 | (2,115 | ) | (6.0 | )% | ||||||||||
| Picor |
2,868 | 3,194 | (326 | ) | (10.2 | )% | ||||||||||
|
|
|
|
|
|
|
|||||||||||
| Total |
$ | 199,160 | $ | 218,507 | $ | (19,347 | ) | (8.9 | )% | |||||||
|
|
|
|
|
|
|
|||||||||||
The decrease in BBU revenues was primarily attributed to decreases in BBU component revenues of approximately $12,518,000 and Vicor Custom Power revenues of approximately $4,598,000, partially offset by an increase in Westcor revenues of approximately $444,000. The overall decrease in BBU revenues for 2013 was due to continued weakness in the defense electronics sector, the continued recession in Europe, and slower than expected growth from certain new product opportunities. The decrease in VI Chip and Picor revenues reflects a dependence on a limited number of customers, corresponding decreases in orders from those customers, and
32
slower than anticipated introduction of new products. In addition, certain shipments initially scheduled for the fourth quarter of 2013 for a large VI Chip customer and for a large Vicor Custom Power program were re-scheduled into 2014, further contributing to the revenue declines. Overall orders for 2013 increased by 8.6%, compared to 2012. This increase was attributed to increases in VI Chip and Picor orders of 82.8% and 23.6%, respectively, compared to 2012.
Gross margin for 2013 decreased $10,172,000, or 11.1%, to $81,479,000 from $91,651,000 in 2012. Gross margin as a percentage of net revenues decreased to 40.9% in fiscal 2013 from 41.9% in fiscal 2012. The decrease in gross margin and gross margin percentage was primarily attributed to the decrease in net revenues and a shift in product mix.
Income (loss) from operations by segment for the years ended December 31 were as follows (dollars in thousands):
| Increase (decrease) | ||||||||||||||||
| 2013 | 2012 | $ | % | |||||||||||||
| BBU |
$ | 12,062 | $ | 28,114 | $ | (16,052 | ) | (57.1 | )% | |||||||
| VI Chip |
(28,204 | ) | (27,409 | ) | (795 | ) | (2.9 | )% | ||||||||
| Picor |
(3,326 | ) | (2,786 | ) | (540 | ) | (19.4 | )% | ||||||||
| Corporate |
(999 | ) | (704 | ) | (295 | ) | (41.9 | )% | ||||||||
|
|
|
|
|
|
|
|||||||||||
| Total |
$ | (20,467 | ) | $ | (2,785 | ) | $ | (17,682 | ) | (634.9 | )% | |||||
|
|
|
|
|
|
|
|||||||||||
The decrease in operating profit for all three segments in 2013 compared to 2012 was due to a decrease in revenues and a related decrease in gross margin for the reasons discussed above, as well as increases in operating expenses. The primary increases in operating expenses were associated with legal fees and compensation expenses. Legal fees, which are charged to the BBU segment, increased significantly in the fourth quarter of 2013 and were expected to remain at high levels through 2014, as the Company approached the scheduled July 2014 trial date in its litigation with SynQor, Inc. The increase in compensation expense was driven by the annual merit increases and by increased stock-based compensation expense as a result of an option exchange conducted by the Company in 2013 discussed in more detail in Note 3 to the Consolidated Financial Statements (the “Option Exchange”). The cash needs for each segment are primarily for working capital and capital expenditures. Positive cash flow from BBU has historically funded, and is expected to continue to fund, VI Chip and Picor operations, as well as capital expenditures for all segments for the foreseeable future.
Selling, general and administrative expenses were $60,737,000 for 2013, an increase of $5,082,000, or 9.1%, as compared to $55,655,000 for 2012. As a percentage of net revenues, selling, general and administrative expenses increased to 30.5% in 2013 from 25.5% in 2012, due to the decrease in net revenues and the increase in such expenses.
The components of the $5,082,000 increase in selling, general, and administrative expenses were as follows (in thousands):
| Increase (decrease) | ||||||||
| Legal fees |
$ | 2,315 | 129.4 | %(1) | ||||
| Compensation |
2,152 | 6.6 | %(2) | |||||
| Audit, tax, and accounting fees |
390 | 28.0 | %(3) | |||||
| Bad debt expense |
238 | 624.8 | %(4) | |||||
| Training and professional development |
191 | 140.3 | %(5) | |||||
| Stockholder reporting |
148 | 51.9 | %(6) | |||||
| Commissions expense |
(439 | ) | (8.4 | )%(7) | ||||
| Other, net |
87 | 0.6 | % | |||||
|
|
|
|||||||
| $ | 5,082 | 9.1 | % | |||||
|
|
|
|||||||
33
| (1) | Increase attributed to legal expenses associated with the patent infringement claim filed against the Company during the first quarter of 2011 by SynQor. See Note 15 to the Consolidated Financial Statements. |
| (2) | Increase primarily attributed to annual compensation adjustments in May 2013 and an increase in Vicor stock-based compensation expense related to the Offer to Exchange and other stock option grants in the second quarter of 2013. See Note 3 to the Consolidated Financial Statements. |
| (3) | Increase primarily attributed to additional fees incurred for 2012 audit. |
| (4) | Increase attributed to an increase in allowance for bad debts, pertaining to one customer. |
| (5) | Increase primarily attributed to corporate management and sales personnel training. |
| (6) | Increase primarily attributed to expenses incurred in 2013 in connection with the tender offers for shares of our Common Stock of the first and second quarters of 2013, and for the Offer to Exchange of the second quarter of 2013. |
| (7) | Decrease primarily attributed to the decrease in net revenues subject to commissions. |
Research and development expenses increased $1,104,000, or 2.8%, to $39,848,000 in 2013 from $38,744,000 in 2012. As a percentage of net revenues, research and development increased to 20.0% in 2013 from 17.7% in 2012, primarily due to the decrease in net revenues.
The components of the $1,104,000 increase in research and development expenses were as follows (in thousands):
| Increase (decrease) | ||||||||
| Compensation |
$ | 551 | 2.1 | %(1) | ||||
| Project and pre-production materials |
459 | 11.4 | %(2) | |||||
| Depreciation and amortization |
229 | 12.4 | %(3) | |||||
| Supplies expense |
87 | 12.1 | %(4) | |||||
| Certification expenses |
76 | 36.8 | % | |||||
| Computer expenses |
38 | 9.1 | % | |||||
| Deferred costs |
(133 | ) | (579.7 | )%(5) | ||||
| Employment recruiting |
(137 | ) | (78.4 | )% | ||||
| Set-up and tooling expenses |
(140 | ) | (45.3 | )%(6) | ||||
| Other, net |
74 | 1.8 | % | |||||
|
|
|
|||||||
| $ | 1,104 | 2.8 | % | |||||
|
|
|
|||||||
| (1) | Increase primarily attributed to annual compensation adjustments in May 2013. |
| (2) | Increase attributed to increases in spending by the BBU and VI Chip segments. |
| (3) | Increase primarily attributed to additions of engineering equipment for the BBU and Picor segments in 2013. |
| (4) | Increase primarily attributed to an increase in engineering supplies for new VI Chip products. |
| (5) | Decrease primarily attributed to an increase in deferred costs capitalized for certain non-recurring engineering projects for which the related revenues have been deferred. |
| (6) | Decrease primarily attributed to a decrease in tooling charges associated with the development of VI Chip products. |
During the first quarter of 2013, we recorded a pre-tax charge of $1,361,000 for the cost of severance and other employee-related costs for a company-wide workforce reduction initiated and completed in February 2013.
34
The significant changes in the components of “Other income (expense), net” for the years ended December 31 were as follows (in thousands):
| 2013 | 2012 | Increase (decrease) |
||||||||||
| Interest income |
$ | 97 | $ | 136 | $ | (39 | ) | |||||
| Credit losses on available for sale securities |
(78 | ) | (9 | ) | (69 | ) | ||||||
| Foreign currency losses, net |
(94 | ) | (46 | ) | (48 | ) | ||||||
| Gain on disposal of equipment |
26 | 33 | (7 | ) | ||||||||
| Other |
51 | 80 | (29 | ) | ||||||||
|
|
|
|
|
|
|
|||||||
| $ | 2 | $ | 194 | $ | (192 | ) | ||||||
|
|
|
|
|
|
|
|||||||
The Company’s exposure to market risk for fluctuations in foreign currency exchange rates relates primarily to the operations of VJCL, for which the functional currency is the Japanese Yen. The functional currency of the Company’s other subsidiaries in Europe and Asia is the U.S. Dollar. The decrease in interest income for the period was due to lower average balances on the Company’s long-term investments as well as a general decrease in interest rates.
Income (loss) before income taxes was $(20,465,000) in 2013 as compared to $(2,591,000) in 2012.
The provision for income taxes and the effective income tax rate for the years ended December 31 were as follows (dollars in thousands):
| 2013 | 2012 | |||||||
| Provision for income taxes |
$ | 3,039 | $ | 1,207 | ||||
| Effective income tax rate |
14.8 | % | 46.6 | % | ||||
For the year ended December 31, 2013, a net income tax provision was recorded primarily due to an increase in the valuation allowance for all remaining domestic net deferred tax assets not previously covered by a valuation allowance. In 2013, we recorded an increase to the valuation allowance of approximately $10,241,000, due to the following factors: (1) our forecast of future taxable income, of the appropriate nature, based on our quarterly assessment was not sufficient to support the recoverability of the remaining tax assets; (2) our recent cumulative losses and forecast of continued losses into 2014; (3) our ability to carryback federal net operating losses or credits to utilize against federal taxable income will generate only $1,600,000 in cash refunds; and (4) our lack of prudent and feasible tax planning strategies. The tax expense due to the increase in the valuation allowance was partially offset by a benefit for a net operating loss carryback for federal income tax purposes and the recognition of a benefit from the federal research tax credit for 2012 of $549,000, as a discrete item in the first quarter of 2013. The federal research tax credit for 2012 and 2013 was extended on January 2, 2013, pursuant to renewal of ATRA. The effective income tax rate for the year ended December 30, 2012, was higher than the statutory tax rate due to higher state tax expense from separate company calculations based off expected taxable income from Vicor-only operations that could not be offset by operating losses in other business segments. In addition, the Company did not have the ability to generate federal research and development credits as those credits had yet to be extended by the United States Congress for 2012, as noted above.
Net income of noncontrolling interest decreased by $143,000 in 2013 to $136,000 as compared to $279,000 in 2012. This was due to lower net income during 2013 recorded by entities in which others hold a noncontrolling equity interest (i.e., three Vicor Custom Power subsidiaries and VJCL).
Net loss per share attributable to Vicor Corporation was $(0.60) per basic share for the year ended December 31, 2013, compared to $(0.10) per basic share for the year ended December 31, 2012.
35
LIQUIDITY AND CAPITAL RESOURCES
At December 31, 2014, we had $55,187,000 in cash and cash equivalents. The ratio of current assets to current liabilities was 4.9:1 at December 31, 2014 as compared to 5.7:1 at December 31, 2013. Working capital decreased $7,548,000 to $90,321,000 at December 31, 2014 from $97,869,000 at December 31, 2013.
The primary working capital changes were due to the following (in thousands):
| Increase (decrease) | ||||
| Cash and cash equivalents |
$ | (1,152 | ) | |
| Short-term investments |
(193 | ) | ||
| Accounts receivable |
748 | |||
| Inventories |
(3,368 | ) | ||
| Deferred tax assets |
(24 | ) | ||
| Other current assets |
(1,057 | ) | ||
| Accounts payable |
745 | |||
| Accrued compensation and benefits |
(608 | ) | ||
| Accrued expenses |
(337 | ) | ||
| Accrued severance charges |
(1,855 | ) | ||
| Income taxes payable |
(26 | ) | ||
| Deferred revenue |
(421 | ) | ||
|
|
|
|||
| $ | (7,548 | ) | ||
|
|
|
|||
The primary use of cash for the year ended December 31, 2014, was for the purchase of manufacturing equipment of $7,128,000. The primary sources of cash and cash equivalents were the net sales and maturities of investments of $3,120,000, operating activities of $2,191,000, and proceeds from issuance of Common Stock of $788,000.
In November 2000, our Board of Directors authorized the repurchase of up to $30,000,000 of Common Stock (the “November 2000 Plan”). The November 2000 Plan authorizes us to make such repurchases from time to time in the open market or through privately negotiated transactions. The timing of such repurchases and the number of shares purchased in each transaction are at the discretion of management based on its view of economic and financial market conditions. We did not repurchase shares of Common Stock under the November 2000 Plan during the year ended December 31, 2014. As of December 31, 2014, we had approximately $8,541,000 remaining for share purchases under the November 2000 Plan.
During the year ended December 31, 2014, two of our subsidiaries paid a total of $3,900,000 in cash dividends, of which $3,738,000 was paid to us and $162,000 was paid to outside shareholders. Dividends paid to outside shareholders of our subsidiaries are accounted for as a reduction in noncontrolling interest.
As of December 31, 2014, we had no off-balance sheet arrangements.
The table below summarizes our contractual obligations as of December 31, 2014 (in thousands):
| Payments Due by Period | ||||||||||||||||||||
| Contractual Obligations |
Total | Less than 1 Year |
Years 2 & 3 | Years 4 & 5 | More Than 5 Years |
|||||||||||||||
| Operating lease obligations |
$ | 2,996 | $ | 1,514 | $ | 1,223 | $ | 189 | $ | 70 | ||||||||||
|
|
|
|
|
|
|
|
|
|
|
|||||||||||
Our primary liquidity needs are for making continuing investments in manufacturing equipment. We believe cash generated from operations and the total of our cash and cash equivalents will be sufficient to fund planned operations and capital equipment purchases for the foreseeable future. We have approximately $841,000 of capital expenditure commitments, principally for manufacturing equipment, as of December 31, 2014.
36
We do not consider the impact of inflation and changing prices on our business activities or fluctuations in the exchange rates for foreign currency transactions to have been significant during the last three fiscal years.
| ITEM 7A. | QUANTITATIVE AND QUALITATIVE DISCLOSURES ABOUT MARKET RISK |
We are exposed to a variety of market risks, including changes in interest rates affecting the return on our cash and cash equivalents and fluctuations in foreign currency exchange rates. As our cash and cash equivalents consist principally of cash accounts and money market securities, which are short-term in nature, we believe our exposure to market risk on interest rate fluctuations for these investments is not significant. Our short-term and long-term investments consist mainly of municipal and corporate debt securities, of which an auction rate security that had experienced failed auctions of $3,000,000 at par value, which had been purchased through and are held by a broker-dealer affiliate of Bank of America, N.A. (the “Failed Auction Security”) represents a significant portion. While the Failed Auction Security is a highly rated investment, with Aaa/AA+ ratings, continued failure to sell at its reset dates could negatively impact the carrying value of the investment, in turn leading to impairment charges in future periods. Changes in the fair value of the Failed Auction Security attributable to credit loss are recorded through earnings, with the remainder of any change recorded in “Accumulated other comprehensive (loss) income”, a component of Stockholders’ Equity. Should a decline in the value of the Failed Auction Security be other than temporary, the losses would be recorded in “Other income (expense), net.” We do not believe there was an “other-than-temporary” decline in value in this security as of December 31, 2014. We estimate our annual interest income would change by approximately $37,000 in 2014 for each 100 basis point increase or decrease in interest rates.
Our exposure to market risk for fluctuations in foreign currency exchange rates relates primarily to the operations of VJCL, for which the functional currency is the Japanese Yen, and changes in the Dollar/Yen exchange rate, as the functional currency of our subsidiaries in Europe and Asia is the U.S. Dollar. Therefore, we believe market risk is mitigated since these operations are not materially exposed to foreign exchange fluctuations. Relative to foreign currency exposure against the Yen existing on December 31, 2014, we estimate a 10% unfavorable movement in the Dollar/Yen exchange rate would increase foreign currency loss by approximately $97,000.
37
| ITEM 8. | FINANCIAL STATEMENTS AND SUPPLEMENTARY DATA |
INDEX
38
REPORT OF INDEPENDENT REGISTERED ACCOUNTING FIRM
Board of Directors and Stockholders
Vicor Corporation
We have audited the accompanying consolidated balance sheets of Vicor Corporation and subsidiaries as of December 31, 2014 and 2013, and the related consolidated statements of operations, comprehensive income (loss), cash flows and equity for the years then ended. In connection with our audits of the consolidated financial statements, we also have audited the financial statement schedule listed in Item 15(a)(2). These consolidated financial statements and the financial statement schedule are the responsibility of the Company’s management. Our responsibility is to express an opinion on these consolidated financial statements and the financial statement schedule based on our audits.
We conducted our audits in accordance with the standards of the Public Company Accounting Oversight Board (United States). Those standards require that we plan and perform the audit to obtain reasonable assurance about whether the financial statements are free of material misstatement. An audit includes examining, on a test basis, evidence supporting the amounts and disclosures in the financial statements. An audit also includes assessing the accounting principles used and significant estimates made by management, as well as evaluating the overall financial statement presentation. We believe that our audits provide a reasonable basis for our opinion.
In our opinion, the consolidated financial statements referred to above present fairly, in all material respects, the financial position of Vicor Corporation and subsidiaries as of December 31, 2014 and 2013, and the results of their operations and their cash flows for the years then ended, in conformity with U.S. generally accepted accounting principles. Also in our opinion, the related financial statement schedule, when considered in relation to the basic consolidated financial statements taken as a whole, presents fairly, in all material respects, the information set forth therein.
We also have audited, in accordance with the standards of the Public Company Accounting Oversight Board (United States), Vicor Corporation’s internal control over financial reporting as of December 31, 2014, based on criteria established in Internal Control – Integrated Framework (1992) issued by the Committee of Sponsoring Organizations of the Treadway Commission (COSO), and our report dated March 6, 2015 expressed an unqualified opinion on the effectiveness of the Company’s internal control over financial reporting.
/s/ KPMG LLP
Boston, Massachusetts
March 6, 2015
39
REPORT OF INDEPENDENT REGISTERED PUBLIC ACCOUNTING FIRM
Board of Directors and Stockholders
Vicor Corporation
We have audited the accompanying consolidated balance sheet of Vicor Corporation (a Delaware corporation) and its subsidiaries (collectively, the “Company”) as of December 31, 2012 (not presented herein), and the related consolidated statements of operations, comprehensive income (loss), equity, and cash flows for the year ended December 31, 2012. Our audit of the basic consolidated financial statements included the financial statement schedule for the year ended December 31, 2012 listed in the index appearing under Item 15 (a)(2). These financial statements and financial statement schedule are the responsibility of the Company’s management. Our responsibility is to express an opinion on these financial statements and financial statement schedule based on our audit.
We conducted our audit in accordance with the standards of the Public Company Accounting Oversight Board (United States). Those standards require that we plan and perform the audit to obtain reasonable assurance about whether the financial statements are free of material misstatement. An audit includes examining, on a test basis, evidence supporting the amounts and disclosures in the financial statements. An audit also includes assessing the accounting principles used and significant estimates made by management, as well as evaluating the overall financial statement presentation. We believe that our audit provides a reasonable basis for our opinion.
In our opinion, the consolidated financial statements referred to above present fairly, in all material respects, the financial position of Vicor Corporation and subsidiaries as of December 31, 2012, and the results of their operations and their cash flows for the year ended December 31, 2012 in conformity with accounting principles generally accepted in the United States of America. Also in our opinion, the related financial statement schedule, when considered in relation to the basic consolidated financial statements taken as a whole, presents fairly, in all material respects, the information set forth therein.
/s/ GRANT THORNTON LLP
Boston, Massachusetts
March 7, 2013
40
CONSOLIDATED BALANCE SHEETS
December 31, 2014 and 2013
(In thousands, except per share data)
| 2014 | 2013 | |||||||
| ASSETS | ||||||||
| Current assets: |
||||||||
| Cash and cash equivalents |
$ | 55,187 | $ | 56,339 | ||||
| Short-term investments |
270 | 463 | ||||||
| Accounts receivable, less allowance of $183 in 2014 and $198 in 2013 |
28,431 | 27,683 | ||||||
| Inventories, net |
26,328 | 29,696 | ||||||
| Deferred tax assets |
107 | 131 | ||||||
| Other current assets |
3,155 | 4,212 | ||||||
|
|
|
|
|
|||||
| Total current assets |
113,478 | 118,524 | ||||||
| Long-term investments, net |
3,002 | 5,188 | ||||||
| Property, plant and equipment, net |
37,387 | 40,092 | ||||||
| Other assets |
1,675 | 1,836 | ||||||
|
|
|
|
|
|||||
| Total assets |
$ | 155,542 | $ | 165,640 | ||||
|
|
|
|
|
|||||
| LIABILITIES AND EQUITY | ||||||||
| Current liabilities: |
||||||||
| Accounts payable |
$ | 7,932 | $ | 8,677 | ||||
| Accrued compensation and benefits |
8,663 | 8,055 | ||||||
| Accrued expenses |
3,178 | 2,841 | ||||||
| Accrued severance charges |
1,904 | 49 | ||||||
| Income taxes payable |
41 | 15 | ||||||
| Deferred revenue |
1,439 | 1,018 | ||||||
|
|
|
|
|
|||||
| Total current liabilities |
23,157 | 20,655 | ||||||
| Long-term deferred revenue |
637 | 974 | ||||||
| Long-term income taxes payable |
867 | 1,339 | ||||||
| Deferred income taxes |
329 | 335 | ||||||
|
|
|
|
|
|||||
| Total liabilities |
24,990 | 23,303 | ||||||
| Commitments and contingencies (Note 15) |
||||||||
| Equity: |
||||||||
| Vicor Corporation stockholders’ equity: |
||||||||
| Preferred Stock, $.01 par value, 1,000,000 shares authorized; no shares issued |
||||||||
| Class B Common Stock: 10 votes per share, $.01 par value, 14,000,000 shares authorized, 11,758,218 shares issued and outstanding in 2014 and 2013 |
118 | 118 | ||||||
| Common Stock: 1 vote per share, $.01 par value, 62,000,000 shares authorized 38,580,480 shares issued and 26,908,994 shares outstanding (38,453,439 shares issued and 26,781,953 shares outstanding in 2013) |
393 | 392 | ||||||
| Additional paid-in capital |
171,901 | 169,474 | ||||||
| Retained earnings |
94,758 | 108,645 | ||||||
| Accumulated other comprehensive loss |
(471 | ) | (526 | ) | ||||
| Treasury stock at cost: 11,671,486 shares in 2014 and 2013 |
(138,927 | ) | (138,927 | ) | ||||
|
|
|
|
|
|||||
| Total Vicor Corporation stockholders’ equity |
127,772 | 139,176 | ||||||
| Noncontrolling interest |
2,780 | 3,161 | ||||||
|
|
|
|
|
|||||
| Total equity |
130,552 | 142,337 | ||||||
|
|
|
|
|
|||||
| Total liabilities and equity |
$ | 155,542 | $ | 165,640 | ||||
|
|
|
|
|
|||||
See accompanying notes.
41
CONSOLIDATED STATEMENTS OF OPERATIONS
Years Ended December 31, 2014, 2013 and 2012
(In thousands, except per share amounts)
| 2014 | 2013 | 2012 | ||||||||||
| Net revenues |
$ | 225,731 | $ | 199,160 | $ | 218,507 | ||||||
| Cost of revenues |
128,611 | 117,681 | 126,856 | |||||||||
|
|
|
|
|
|
|
|||||||
| Gross margin |
97,120 | 81,479 | 91,651 | |||||||||
| Operating expenses: |
||||||||||||
| Selling, general and administrative |
68,197 | 60,737 | 55,655 | |||||||||
| Research and development |
41,479 | 39,848 | 38,744 | |||||||||
| Severance and other charges |
2,207 | 1,361 | — | |||||||||
| Impairment of goodwill |
— | — | 2,012 | |||||||||
| Gain from litigation-related settlement |
— | — | (1,975 | ) | ||||||||
|
|
|
|
|
|
|
|||||||
| Total operating expenses |
111,883 | 101,946 | 94,436 | |||||||||
|
|
|
|
|
|
|
|||||||
| Loss from operations |
(14,763 | ) | (20,467 | ) | (2,785 | ) | ||||||
| Other income (expense), net: |
||||||||||||
| Total unrealized gains (losses) on available-for-sale securities, net |
750 | (54 | ) | 511 | ||||||||
| Portion of gains recognized in other comprehensive income (loss) |
(439 | ) | (24 | ) | (520 | ) | ||||||
|
|
|
|
|
|
|
|||||||
| Net credit gains (losses) recognized in earnings |
311 | (78 | ) | (9 | ) | |||||||
| Other income (expense), net |
(43 | ) | 80 | 203 | ||||||||
|
|
|
|
|
|
|
|||||||
| Total other income (expense), net |
268 | 2 | 194 | |||||||||
|
|
|
|
|
|
|
|||||||
| Loss before income taxes |
(14,495 | ) | (20,465 | ) | (2,591 | ) | ||||||
| (Benefit) provision for income taxes |
(425 | ) | 3,039 | 1,207 | ||||||||
|
|
|
|
|
|
|
|||||||
| Consolidated net loss |
(14,070 | ) | (23,504 | ) | (3,798 | ) | ||||||
| Less: Net income (loss) attributable to noncontrolling interest |
(183 | ) | 136 | 279 | ||||||||
|
|
|
|
|
|
|
|||||||
| Net loss attributable to Vicor Corporation |
$ | (13,887 | ) | $ | (23,640 | ) | $ | (4,077 | ) | |||
|
|
|
|
|
|
|
|||||||
| Net loss per common share attributable to Vicor Corporation: |
||||||||||||
| Basic |
$ | (0.36 | ) | $ | (0.60 | ) | $ | (0.10 | ) | |||
| Diluted |
$ | (0.36 | ) | $ | (0.60 | ) | $ | (0.10 | ) | |||
| Shares used to compute net loss per common share attributable to Vicor Corporation: |
||||||||||||
| Basic |
38,569 | 39,195 | 41,811 | |||||||||
| Diluted |
38,569 | 39,195 | 41,811 | |||||||||
See accompanying notes.
42
CONSOLIDATED STATEMENTS OF COMPREHENSIVE INCOME (LOSS)
Years Ended December 31, 2014, 2013 and 2012
(In thousands)
| 2014 | 2013 | 2012 | ||||||||||
| Consolidated net loss |
$ | (14,070 | ) | $ | (23,504 | ) | $ | (3,798 | ) | |||
| Foreign currency translation losses, net of tax benefit (1) |
(410 | ) | (496 | ) | (355 | ) | ||||||
| Unrealized gains on available-for-sale securities, net of tax (2) |
429 | 17 | 520 | |||||||||
|
|
|
|
|
|
|
|||||||
| Other comprehensive income (loss) |
19 | (479 | ) | 165 | ||||||||
|
|
|
|
|
|
|
|||||||
| Consolidated comprehensive loss |
(14,051 | ) | (23,983 | ) | (3,633 | ) | ||||||
| Less: Comprehensive income (loss) attributable to noncontrolling interest |
(219 | ) | 71 | 234 | ||||||||
|
|
|
|
|
|
|
|||||||
| Comprehensive loss attributable to Vicor Corporation |
$ | (13,832 | ) | $ | (24,054 | ) | $ | (3,867 | ) | |||
|
|
|
|
|
|
|
|||||||
| (1) | Net of tax benefit of $0, $(378) and $(241) for 2014, 2013, and 2012, respectively. |
| (2) | The deferred tax assets associated with cumulative unrealized losses on available for sale securities are completely offset by a tax valuation allowance as of December 31, 2014, 2013, and 2012. Therefore, there is no income tax benefit recognized for the years ended December 31, 2014, 2013, and 2012. |
See accompanying notes.
43
CONSOLIDATED STATEMENTS OF CASH FLOWS
Years Ended December 31, 2014, 2013 and 2012
(In thousands)
| 2014 | 2013 | 2012 | ||||||||||
| Operating activities: |
||||||||||||
| Consolidated net loss |
$ | (14,070 | ) | $ | (23,504 | ) | $ | (3,798 | ) | |||
| Adjustments to reconcile consolidated net loss to net cash provided by (used for) operating activities: |
||||||||||||
| Depreciation and amortization |
9,805 | 10,008 | 10,423 | |||||||||
| Stock-based compensation expense |
1,634 | 2,450 | 1,244 | |||||||||
| Provision for doubtful accounts |
66 | — | — | |||||||||
| Deferred income taxes |
18 | 4,491 | (369 | ) | ||||||||
| Impairment of goodwill |
— | — | 2,012 | |||||||||
| Decrease in long-term deferred revenue |
(139 | ) | (139 | ) | (139 | ) | ||||||
| (Decrease) increase in long-term income taxes payable |
(472 | ) | (155 | ) | 135 | |||||||
| Excess tax benefit of share-based compensation |
— | — | (105 | ) | ||||||||
| Gain on disposal of equipment |
(22 | ) | (26 | ) | (33 | ) | ||||||
| Credit (gain) loss on available for sale securities |
(311 | ) | 78 | 9 | ||||||||
| Change in current assets and liabilities, net |
5,682 | 2,107 | 7,859 | |||||||||
|
|
|
|
|
|
|
|||||||
| Net cash provided by (used for) operating activities |
2,191 | (4,690 | ) | 17,238 | ||||||||
| Investing activities: |
||||||||||||
| Purchases of investments |
(340 | ) | — | (270 | ) | |||||||
| Sales and maturities of investments |
3,460 | 1,024 | 3,630 | |||||||||
| Additions to property, plant and equipment |
(7,128 | ) | (6,179 | ) | (7,396 | ) | ||||||
| Proceeds from sale of equipment |
22 | 26 | 33 | |||||||||
| (Increase) decrease in other assets |
(43 | ) | 49 | (81 | ) | |||||||
|
|
|
|
|
|
|
|||||||
| Net cash used for investing activities |
(4,029 | ) | (5,080 | ) | (4,084 | ) | ||||||
| Financing activities: |
||||||||||||
| Purchases of Common Stock |
— | (17,100 | ) | — | ||||||||
| Proceeds from issuance of Common Stock |
788 | 27 | 9 | |||||||||
| Noncontrolling interest dividends paid |
(162 | ) | (531 | ) | (378 | ) | ||||||
| Excess (reversal of) tax benefit of share-based compensation |
— | (451 | ) | 105 | ||||||||
|
|
|
|
|
|
|
|||||||
| Net cash provided by (used for) financing activities |
626 | (18,055 | ) | (264 | ) | |||||||
| Effect of foreign exchange rates on cash |
60 | (390 | ) | (244 | ) | |||||||
|
|
|
|
|
|
|
|||||||
| Net (decrease) increase in cash and cash equivalents |
(1,152 | ) | (28,215 | ) | 12,646 | |||||||
| Cash and cash equivalents at beginning of period |
56,339 | 84,554 | 71,908 | |||||||||
|
|
|
|
|
|
|
|||||||
| Cash and cash equivalents at end of period |
$ | 55,187 | $ | 56,339 | $ | 84,554 | ||||||
|
|
|
|
|
|
|
|||||||
| Change in assets and liabilities: |
||||||||||||
| Accounts receivable |
$ | (1,151 | ) | $ | (821 | ) | $ | 4,052 | ||||
| Inventories, net |
3,202 | 33 | 5,591 | |||||||||
| Other current assets |
1,029 | (1,647 | ) | 380 | ||||||||
| Accounts payable and accrued liabilities |
300 | 4,580 | (1,670 | ) | ||||||||
| Accrued severance charges |
1,855 | 49 | — | |||||||||
| Income taxes payable |
26 | (321 | ) | (84 | ) | |||||||
| Deferred revenue |
421 | 234 | (410 | ) | ||||||||
|
|
|
|
|
|
|
|||||||
| $ | 5,682 | $ | 2,107 | $ | 7,859 | |||||||
|
|
|
|
|
|
|
|||||||
| Supplemental disclosures: |
||||||||||||
| Cash paid during the year for income taxes, net of refunds |
$ | (1,529 | ) | $ | (61 | ) | $ | 975 | ||||
See accompanying notes.
44
CONSOLIDATED STATEMENTS OF EQUITY
Years Ended December 31, 2014, 2013 and 2012
(In thousands)
| Class B Common Stock |
Common Stock |
Additional Paid-In Capital |
Retained Earnings |
Accumulated Other Comprehensive Income (Loss) |
Treasury Stock |
Total Vicor Corporation Stockholders’ Equity |
Noncontrolling Interest |
Total Equity |
||||||||||||||||||||||||||||
| Balance on December 31, 2011 |
$ | 118 | $ | 387 | $ | 166,227 | $ | 136,362 | $ | (322 | ) | $ | (121,827 | ) | $ | 180,945 | $ | 3,765 | $ | 184,710 | ||||||||||||||||
| Sales of Common Stock |
3 | 9 | 12 | 12 | ||||||||||||||||||||||||||||||||
| Noncontrolling interest dividends paid |
(378 | ) | (378 | ) | ||||||||||||||||||||||||||||||||
| Excess tax benefit of stock-based compensation |
105 | 105 | 105 | |||||||||||||||||||||||||||||||||
| Stock-based compensation expense |
1,244 | 1,244 | 1,244 | |||||||||||||||||||||||||||||||||
| Net settlement stock option exercises |
(87 | ) | (87 | ) | (87 | ) | ||||||||||||||||||||||||||||||
| Components of comprehensive income, net of tax |
||||||||||||||||||||||||||||||||||||
| Net income (loss) |
(4,077 | ) | (4,077 | ) | 279 | (3,798 | ) | |||||||||||||||||||||||||||||
| Other comprehensive income (loss) |
210 | 210 | (45 | ) | 165 | |||||||||||||||||||||||||||||||
|
|
|
|
|
|
|
|||||||||||||||||||||||||||||||
| Total comprehensive income (loss) |
(3,867 | ) | 234 | (3,633 | ) | |||||||||||||||||||||||||||||||
|
|
|
|
|
|
|
|
|
|
|
|
|
|
|
|
|
|
|
|||||||||||||||||||
| Balance on December 31, 2012 |
118 | 390 | 167,498 | 132,285 | (112 | ) | (121,827 | ) | 178,352 | 3,621 | 181,973 | |||||||||||||||||||||||||
| Sales of Common Stock |
2 | 25 | 27 | 27 | ||||||||||||||||||||||||||||||||
| Noncontrolling interest dividends paid |
(531 | ) | (531 | ) | ||||||||||||||||||||||||||||||||
| Reversal of excess tax benefit of stock-based compensation |
(451 | ) | (451 | ) | (451 | ) | ||||||||||||||||||||||||||||||
| Stock-based compensation expense |
2,450 | 2,450 | 2,450 | |||||||||||||||||||||||||||||||||
| Net settlement stock option exercises |
(48 | ) | (48 | ) | (48 | ) | ||||||||||||||||||||||||||||||
| Purchase of treasury stock |
(17,100 | ) | (17,100 | ) | (17,100 | ) | ||||||||||||||||||||||||||||||
| Components of comprehensive income, net of tax |
||||||||||||||||||||||||||||||||||||
| Net income (loss) |
(23,640 | ) | (23,640 | ) | 136 | (23,504 | ) | |||||||||||||||||||||||||||||
| Other comprehensive loss |
(414 | ) | (414 | ) | (65 | ) | (479 | ) | ||||||||||||||||||||||||||||
|
|
|
|
|
|
|
|||||||||||||||||||||||||||||||
| Total comprehensive income (loss) |
(24,054 | ) | 71 | (23,983 | ) | |||||||||||||||||||||||||||||||
|
|
|
|
|
|
|
|
|
|
|
|
|
|
|
|
|
|
|
|||||||||||||||||||
| Balance on December 31, 2013 |
118 | 392 | 169,474 | 108,645 | (526 | ) | (138,927 | ) | 139,176 | 3,161 | 142,337 | |||||||||||||||||||||||||
| Sales of Common Stock |
1 | 787 | 788 | 788 | ||||||||||||||||||||||||||||||||
| Noncontrolling interest dividends paid |
(162 | ) | (162 | ) | ||||||||||||||||||||||||||||||||
| Stock-based compensation expense |
1,634 | 1,634 | 1,634 | |||||||||||||||||||||||||||||||||
| Other |
6 | 6 | 6 | |||||||||||||||||||||||||||||||||
| Components of comprehensive income, net of tax |
||||||||||||||||||||||||||||||||||||
| Net loss |
(13,887 | ) | (13,887 | ) | (183 | ) | (14,070 | ) | ||||||||||||||||||||||||||||
| Other comprehensive income (loss) |
55 | 55 | (36 | ) | 19 | |||||||||||||||||||||||||||||||
|
|
|
|
|
|
|
|||||||||||||||||||||||||||||||
| Total comprehensive loss |
(13,832 | ) | (219 | ) | (14,051 | ) | ||||||||||||||||||||||||||||||
|
|
|
|
|
|
|
|
|
|
|
|
|
|
|
|
|
|
|
|||||||||||||||||||
| Balance on December 31, 2014 |
$ | 118 | $ | 393 | $ | 171,901 | $ | 94,758 | $ | (471 | ) | $ | (138,927 | ) | $ | 127,772 | $ | 2,780 | $ | 130,552 | ||||||||||||||||
|
|
|
|
|
|
|
|
|
|
|
|
|
|
|
|
|
|
|
|||||||||||||||||||
See accompanying notes.
45
NOTES TO CONSOLIDATED FINANCIAL STATEMENTS
1. DESCRIPTION OF BUSINESS
Vicor Corporation (the “Company” or “Vicor”) designs, develops, manufactures, and markets modular power converters, power system components, and power systems. The Company also licenses certain rights to its technology in return for recurring royalties. The principal markets for the Company’s power converters and systems are large original equipment manufacturers (“OEMs”) and their contract manufacturers, and smaller, lower volume users, which are broadly distributed across several major market areas.
2. SIGNIFICANT ACCOUNTING POLICIES
Principles of consolidation
The Consolidated Financial Statements include the accounts of the Company and its subsidiaries. All intercompany transactions and balances have been eliminated upon consolidation. Certain of the Company’s Vicor Custom Power subsidiaries are not majority owned by the Company. These entities are consolidated by the Company as management believes that the Company has the ability to exercise control over their activities and operations.
Use of estimates
The preparation of financial statements in conformity with accounting principles generally accepted in the United States requires management to make estimates and assumptions that affect the reported amounts of assets and liabilities and disclosure of contingencies at the date of the financial statements and the reported amounts of revenue and expenses during the reporting period. Such estimates and assumptions relate to the useful lives of fixed assets and identified intangible assets, recoverability of long-lived assets, fair value of long-term investments, allowances for doubtful accounts, the net realizable value of inventory, potential reserves relating to litigation matters, accrued liabilities, accrued taxes, deferred tax valuation allowances, assumptions pertaining to share-based payments, and other reserves. Actual results could differ from those based on these estimates and assumptions, and such differences may be material to the financial statements.
Revenue recognition
Product revenue is recognized in the period when persuasive evidence of an arrangement with a customer exists, the products are shipped and title has transferred to the customer, the price is fixed or determinable, and collection is considered probable.
The Company defers revenue and the related cost of sales on shipments to two stocking distributors until the distributors resell the products to their customers. The agreements with these stocking distributors allow them to receive price adjustment credits or to return qualifying products for credit, as determined by the Company, in order to reduce the amounts of slow-moving, discontinued, or obsolete product from their inventory. These stocking distributors are also granted price adjustment credits in the event of a price decrease subsequent to the date the product was shipped and invoiced to the stocking distributor. Given the uncertainties associated with the levels of price adjustment credits to be granted to stocking distributors, the sales price to the stocking distributor is not fixed or determinable until the stocking distributor resells the products to its customers. Therefore, the Company defers revenue and the related cost of sales on shipments to stocking distributors until the stocking distributors resell the products to their customers. Accordingly, the Company’s revenue fully reflects end-customer purchases and is not impacted by stocking distributor inventory levels. Agreements with stocking distributors limit returns of qualifying product to the Company to a certain percentage of the value of the Company’s shipments to that stocking distributor during the prior quarter. In addition, stocking distributors are
46
VICOR CORPORATION
NOTES TO CONSOLIDATED FINANCIAL STATEMENTS (Continued)
allowed to return unsold products if the Company terminates the relationship with the stocking distributor. Title to the inventory transferred to the stocking distributor at the time of shipment or delivery to the stocking distributor, as well as payment from the stocking distributor, are due in accordance with the Company’s standard payment terms. These payment terms are not contingent upon the stocking distributors’ sale of the products to their end-customers. Upon title transfer to stocking distributors, the Company reduces inventory for the cost of goods shipped, the margin (i.e., revenues less cost of revenues) is recorded as deferred revenue, and an account receivable is recorded. As of December 31, 2014, the Company had gross deferred revenue of approximately $1,769,000 and gross deferred cost of revenues of approximately $808,000 under agreements with stocking distributors ($1,269,000 and $516,000, respectively, as of December 31, 2013).
The Company evaluates revenue arrangements with potential multi-element deliverables to determine if there is more than one unit of accounting. A deliverable constitutes a separate unit of accounting when it has standalone value and there are no customer-negotiated refund or return rights for the undelivered elements. The Company enters into arrangements containing multiple elements that may include a combination of non-recurring engineering services (“NRE”), prototype units, and production units. The Company has determined NRE and prototype units represent one unit of accounting and production units represent a separate unit of accounting, based on an assessment of the respective standalone value. The Company defers revenue recognition for NRE and prototype units until completion of the final milestone under the NRE arrangement, which is generally the delivery of the prototype. Recognition generally takes place within six to twelve months of the initiation of the arrangement. Revenue for the production units is recognized upon shipment, consistent with other product revenue summarized above. During 2014, 2013, and 2012, revenue recognized under multi-element arrangements accounted for less than 3% of net revenues.
License fees are recognized as earned. The Company recognizes revenue on such arrangements only when the contract is signed, the license term has begun, all obligations have been delivered to the customer, and collection is probable.
Foreign currency translation
The financial statements of Vicor Japan Company, Ltd. (“VJCL”), a majority-owned subsidiary, for which the functional currency is the Japanese Yen, have been translated into U.S. Dollars using the exchange rate in effect at the balance sheet date for balance sheet amounts and the average exchange rates in effect during the year for income statement amounts. The gains and losses resulting from the changes in exchange rates from year to year have been reported in other comprehensive income.
Transaction gains and losses resulting from the remeasurement of foreign currency denominated assets and liabilities of the Company’s foreign subsidiaries where the functional currency is the U.S. Dollar are included in other income (expense), net. Foreign currency losses included in other income (expense), net, were approximately ($196,000), ($94,000), and ($46,000) in 2014, 2013, and 2012, respectively.
Cash and cash equivalents
Cash and cash equivalents include funds held in disbursement (i.e., checking) and money market accounts, certificates of deposit, and debt securities with maturities of less than three months at the time of purchase. Cash and cash equivalents are valued at cost, approximating market value. The Company’s money market securities, which are classified as cash equivalents on the balance sheet, are purchased and redeemed at par value. Their estimated fair value is equal to their cost, and, due to the nature of the securities and their classification as cash equivalents, there are no unrealized gains or losses recorded at the balance sheet dates.
47
VICOR CORPORATION
NOTES TO CONSOLIDATED FINANCIAL STATEMENTS (Continued)
Short-term and long-term investments
The Company’s principal sources of liquidity are its existing balances of cash and cash equivalents, as well as cash generated from operations. Consistent with the guidelines of the Company’s investment policy, the Company can invest, and has historically invested, its cash balances in demand deposit accounts, money market funds, brokered certificates of deposit and auction rate securities meeting certain quality criteria. All of the Company’s investments are subject to credit, liquidity, market, and interest rate risk.
The Company’s short-term and long-term investments are classified as available-for-sale securities. Available-for-sale securities are recorded at fair value, with unrealized gains and losses, net of tax, attributable to credit loss recorded through the statement of operations and unrealized gains and losses, net of tax, attributable to other non-credit factors recorded in “Accumulated other comprehensive loss,” a component of Total Equity. In determining the amount of credit loss, the Company compares the present value of cash flows expected to be collected to the amortized cost basis of the securities, considering credit default risk probabilities and changes in credit ratings, among other factors.
The amortized cost of debt securities is adjusted for amortization of premiums and accretion of discounts to maturity, the net amount of which, along with interest and realized gains and losses, is included in “Other income (expense), net” in the Consolidated Statements of Operations. The Company periodically evaluates investments to determine if impairment is required, whether an impairment is other than temporary, and the measurement of an impairment loss. The Company considers a variety of impairment indicators such as, but not limited to, a significant deterioration in the earnings performance, credit rating, or asset quality of the investment.
Fair value measurements
The Company accounts for certain financial assets at fair value, defined as the price that would be received to sell an asset or paid to transfer a liability (i.e., an exit price) in the principal or most advantageous market for the asset or liability in an orderly transaction between market participants on the measurement date. As such, fair value is a market-based measurement that should be determined based on assumptions that market participants would use in pricing an asset or liability. A three-level hierarchy is used to show the extent and level of judgment used to estimate fair value measurements:
| Level 1 |
Inputs used to measure fair value are unadjusted quoted prices available in active markets for the identical assets or liabilities as of the reporting date. | |
| Level 2 |
Inputs used to measure fair value, other than quoted prices included in Level 1, are either directly or indirectly observable as of the reporting date through correlation with market data, including quoted prices for similar assets and liabilities in active markets and quoted prices in inactive markets. Level 2 also includes assets and liabilities valued using models or other pricing methodologies that do not require significant judgment since the input assumptions used in the models, such as interest rates and volatility factors, are corroborated by readily observable data from actively quoted markets for substantially the full term of the financial instrument. | |
| Level 3 |
Inputs used to measure fair value are unobservable inputs supported by little or no market activity and reflect the use of significant management judgment. These values are generally determined using pricing models for which the assumptions utilize management’s estimates of market participant assumptions. | |
The carrying amounts of cash and cash equivalents, accounts receivable and accounts payable approximate fair value because of the short maturity of these financial instruments.
48
VICOR CORPORATION
NOTES TO CONSOLIDATED FINANCIAL STATEMENTS (Continued)
Allowance for doubtful accounts
The Company maintains allowances for doubtful accounts for estimated losses resulting from the inability of its customers to make required payments, based on assessments of customers’ credit-risk profiles and payment histories. If the financial condition of the Company’s customers were to deteriorate, resulting in an impairment of their ability to make payments, additional allowances may be required. The Company does not require collateral from its customers, although there have been circumstances when the Company has required cash in advance (i.e., a partial down-payment) to facilitate orders in excess of a customer’s established credit limit. To date, such amounts have not been material.
Inventories
Inventories are valued at the lower of cost (determined using the first-in, first-out method) or net realizable value. Fixed production overhead is allocated to the inventory cost per unit based on the normal capacity of the production facilities. Abnormal production costs, including fixed cost variances from normal production capacity, if any, are charged to cost of revenues in the period incurred. All shipping and handling costs incurred in connection with the sale of products are included in cost of revenues.
The Company provides reserves for inventories estimated to be excess, obsolete, or unmarketable. The Company’s estimation process for assessing net realizable value is based upon its known backlog, projected future demand, historical consumption and expected market conditions. If the Company’s estimated demand and/or market expectations were to change or if product sales were to decline, the Company’s estimation process may cause larger inventory reserves to be recorded, resulting in larger charges to cost of revenues.
Concentrations of risk
Financial instruments potentially subjecting the Company to significant concentrations of credit risk consist principally of cash and cash equivalents, of which a significant portion is held by one financial institution, short-term and long-term investments, and trade accounts receivable. The Company maintains cash and cash equivalents and certain other financial instruments with various large financial institutions. Generally, amounts invested with these financial institutions are in excess of federal deposit insurance limits. The Company has not experienced any losses in such accounts, and management believes the Company is not exposed to significant credit risk. The Company’s short-term and long-term investments consist of highly rated (Aaa/AA+) municipal and corporate debt securities in which a significant portion are invested in an auction rate security. As of December 31, 2014, the Company was holding a single auction rate security with a par value of $3,000,000, which is collateralized by student loans. Through December 31, 2014, auctions held for the Company’s auction rate security have failed. The funds associated with an auction rate security that has failed auction may not be accessible until a successful auction occurs, a buyer is found outside of the auction process, the security is called, or the underlying securities have matured. If the credit rating of the issuer of the auction rate security held deteriorates, the Company may be required to adjust the carrying value of the investment for an other-than-temporary decline in value through an impairment charge. The Company’s investment policy, approved by the Board of Directors, limits the amount the Company may invest in any issuer, thereby reducing credit risk concentrations.
The Company’s products are sold worldwide to customers ranging from smaller, independent manufacturers of highly specialized electronic devices, to larger OEMs and their contract manufacturers. The applications in which these products are used are in the higher-performance, higher-power segments of the power systems market, including, in alphabetical order, aerospace and defense electronics, enterprise and high performance computing, industrial automation, telecommunications and networking infrastructure, test and measurement instrumentation, and vehicles and transportation. While, overall, the Company has a broad customer base and
49
VICOR CORPORATION
NOTES TO CONSOLIDATED FINANCIAL STATEMENTS (Continued)
sells into a variety of industries, the Company’s VI Chip and Picor subsidiaries have derived a substantial portion of their revenue from a limited number of customers. This concentration of revenue is a reflection of the relatively early stage of adoption of the technologies, architectures and products offered by these subsidiaries, and their targeting of market leading innovators as initial customers. Concentrations of credit risk with respect to trade accounts receivable are limited due to the number of entities comprising the Company’s customer base. As of December 31, 2014, two customers accounted for approximately 14.9% and 11.6% of trade account receivables, respectively. As of December 31, 2013, two customers accounted for approximately 12.9% and 12.5% of trade account receivables, respectively. Credit losses have consistently been within management’s expectations.
During 2014, one customer accounted for approximately 14.7% of net revenues. During 2013, two customers accounted for approximately 10.9% and 10.1% of net revenues, respectively. During 2012, one customer accounted for approximately 10.1% of net revenues. International sales, based on customer location, as a percentage of total net revenues, were approximately 60.5% in 2014, 59.5% in 2013, and 51.1% in 2012. During 2014, net revenues from customers in Hong Kong and China accounted for approximately 20.2% and 12.0%, respectively, of total net revenues. During 2013, net revenues from customers in Hong Kong and China accounted for approximately 16.2% and 11.3%, respectively, of total net revenues. Net revenues from customers in Hong Kong and Taiwan accounted for approximately 12.5% and 9.0%, respectively, of total net revenues in 2012.
Components and materials used in the Company’s products are purchased from a variety of vendors. While most of the components are available from multiple sources, some key components for certain VI Chip and Picor products, in particular, are supplied by single vendors. In instances of single source items, the Company maintains levels of inventories management considers appropriate to enable meeting the delivery requirements of customers. If suppliers or subcontractors cannot provide their products or services on time or to the required specifications, the Company may not be able to meet the demand for its products and its delivery times may be negatively affected.
Long-lived assets
The Company reviews property, plant and equipment and finite-lived intangible assets for impairment whenever events or changes in circumstances indicate the carrying value of such assets may not be recoverable. Management determines whether the carrying value of an asset or asset group is recoverable based on comparison to the undiscounted expected future cash flows the assets are expected to generate over their remaining economic lives. If an asset value is not recoverable, the impairment loss is equal to the amount by which the carrying value of the asset exceeds its fair value, which is determined by either a quoted market price, if any, or a value determined by utilizing a discounted cash flow technique. Evaluation of impairment of long-lived assets requires estimates of future operating results that are used in the preparation of the expected future undiscounted cash flows. Actual future operating results and the remaining economic lives of our long-lived assets could differ from the estimates used in assessing the recoverability of these assets. These differences could result in impairment charges, which could be material.
Intangible assets
Values assigned to patents are amortized using the straight-line method over periods ranging from three to 20 years. Patents and other intangible assets are included in “Other assets” in the accompanying Consolidated Balance Sheets.
50
VICOR CORPORATION
NOTES TO CONSOLIDATED FINANCIAL STATEMENTS (Continued)
Other investments
The Company accounts for its investment in Great Wall Semiconductor Corporation (“GWS”) under the equity method of accounting.
Advertising expense
The cost of advertising is expensed as incurred. The Company incurred $1,832,000, $1,884,000, and $1,910,000 in advertising costs during 2014, 2013 and 2012, respectively.
Product warranties
The Company generally offers a two-year warranty for all of its products. The Company provides for the estimated cost of product warranties at the time product revenue is recognized. Factors influencing the Company’s warranty reserves include the number of units sold, historical and anticipated rates of warranty returns, and the cost per return. The Company periodically assesses the adequacy of warranty reserves and adjusts the amounts as necessary. Warranty obligations are included in “Accrued expenses” in the accompanying Consolidated Balance Sheets.
Legal Costs
Legal costs in connection with litigation are expensed as incurred.
Net loss per common share
The Company computes basic earnings per share using the weighted average number of common shares outstanding and diluted earnings per share using the weighted average number of common shares outstanding plus the effect of outstanding dilutive stock options, if any. The following table sets forth the computation of basic and diluted loss per share for the years ended December 31 (in thousands, except per share amounts):
| 2014 | 2013 | 2012 | ||||||||||
| Numerator: |
||||||||||||
| Net loss attributable to Vicor Corporation |
$ | (13,887 | ) | $ | (23,640 | ) | $ | (4,077 | ) | |||
|
|
|
|
|
|
|
|||||||
| Denominator: |
||||||||||||
| Denominator for basic loss per share-weighted average shares (1) |
38,569 | 39,195 | 41,811 | |||||||||
| Effect of dilutive securities: |
||||||||||||
| Employee stock options (2) |
— | — | — | |||||||||
|
|
|
|
|
|
|
|||||||
| Denominator for diluted loss per share — adjusted weighted-average shares and assumed conversions (3) |
38,569 | 39,195 | 41,811 | |||||||||
|
|
|
|
|
|
|
|||||||
| Basic loss per share |
$ | (0.36 | ) | $ | (0.60 | ) | $ | (0.10 | ) | |||
|
|
|
|
|
|
|
|||||||
| Diluted loss per share |
$ | (0.36 | ) | $ | (0.60 | ) | $ | (0.10 | ) | |||
|
|
|
|
|
|
|
|||||||
| (1) | Denominator represents weighted average number of Common Shares and Class B Common Shares outstanding. |
51
VICOR CORPORATION
NOTES TO CONSOLIDATED FINANCIAL STATEMENTS (Continued)
| (2) | Options to purchase 1,895,675, 1,989,248, and 545,345 shares of Common Stock in 2014, 2013, and 2012, respectively, were not included in the calculation of net loss per share as the effect would have been antidilutive. |
| (3) | Denominator represents weighted average number of Common Shares and Class B Common Shares outstanding for the year, adjusted to include the dilutive effect, if any, of outstanding options. |
Income taxes
Deferred tax assets and liabilities are determined based on the differences between financial reporting and tax bases of assets and liabilities and are measured using the enacted income tax rates and laws expected to be in effect when the temporary differences are expected to reverse. Deferred tax assets are reduced by a valuation allowance if management determines it is more likely than not that some portion or all of the deferred tax assets will not be realized. Additionally, deferred tax assets and liabilities are separated into current and noncurrent amounts based on the classification of the related assets and liabilities for financial reporting purposes (or the expected reversal thereof).
The Company follows a two-step process to determine the amount of tax benefit to recognize. The first step is to evaluate the tax position to determine the likelihood it would be sustained upon examination by a tax authority. If the tax position is deemed “more-likely-than-not” to be sustained, the second step is to assess the tax position to determine the amount of tax benefit to be recognized in the financial statements. The amount of the benefit that may be recognized is the largest amount that possesses greater than 50 percent likelihood of being realized upon ultimate settlement. If the tax position does not meet the “more-likely-than-not” threshold, then it is not recognized in the financial statements. Additionally, the Company accrues interest and penalties, if any, related to unrecognized tax benefits as a component of income tax expense. The unrecognized tax benefits, including accrued interest and penalties, if any, are included in “Long-term income taxes payable” in the accompanying Consolidated Balance Sheets.
Stock-based compensation
The Company uses the Black-Scholes option-pricing model to calculate the grant-date fair value of stock option awards, whether they possess time-based vesting provisions or performance-based vesting provisions. For stock options with time-based vesting provisions, the calculated compensation expense, net of expected forfeitures, is recognized on a straight-line basis over the service period of the award, which is generally five years for stock options. For stock options with performance-based vesting provisions, recognition of compensation expense, net of expected forfeitures, commences if and when the achievement of the performance criteria is deemed probable. For stock options with performance-based vesting provisions, compensation expense, net of expected forfeitures, when recognized, is recognized over the relevant performance period.
Comprehensive income (loss)
The components of comprehensive income (loss) include, in addition to net income (loss), unrealized gains and losses on investments, net of tax and foreign currency translation adjustments related to VJCL, net of tax.
Impact of recently issued accounting standards
In May 2014, the Financial Accounting Standards Board (“FASB”) issued new guidance for revenue recognition, which will require an entity to recognize the amount of revenue to which it expects to be entitled for the transfer of promised goods or services to customers. The new guidance will replace most existing revenue
52
VICOR CORPORATION
NOTES TO CONSOLIDATED FINANCIAL STATEMENTS (Continued)
recognition guidance in U.S. Generally Accepted Accounting Principles when it becomes effective which, for the Company, will be on January 1, 2017. Early application is not permitted. The standard permits the use of either the retrospective or cumulative effect transition method. The Company is evaluating the effect the new guidance will have on its consolidated financial statements and related disclosures. The Company has not yet selected a transition method nor has it determined the effect of the standard on its ongoing financial reporting.
Effective January 1, 2014, the Company adopted new accounting guidance related to the financial statement presentation of an unrecognized tax benefit when a net operating loss carryforward, a similar tax loss, or a tax credit carryforward exists. The guidance requires an unrecognized tax benefit to be presented as a decrease in a deferred tax asset where a net operating loss, a similar tax loss, or a tax credit carryforward exists and certain criteria are met. The adoption of this new guidance did not impact the Company’s financial position or results of operations.
3. STOCK-BASED COMPENSATION AND EMPLOYEE BENEFIT PLANS
Vicor currently grants options for the purchase of common stock (i.e., “stock options”) under the following equity compensation plans that are stockholder-approved:
Amended and Restated 2000 Stock Option and Incentive Plan (the “2000 Plan”) — Under the 2000 Plan, the Board of Directors or the Compensation Committee of the Board of Directors may grant stock incentive awards based on the Company’s Common Stock, including stock options, stock appreciation rights, restricted stock, performance shares, unrestricted stock, deferred stock, and dividend equivalent rights. Awards may be granted to employees and other key persons, including non-employee directors. Incentive stock options may be granted to employees at a price at least equal to the fair market value per share of the Common Stock on the date of grant, and non-qualified options may be granted to non-employee directors at a price at least equal to 85% of the fair market value of the Common Stock on the date of grant. A total of 4,000,000 shares of Common Stock have been reserved for issuance under the 2000 Plan. The period of time during which an option may be exercised and the vesting periods are determined by the Compensation Committee. The term of each option may not exceed 10 years from the date of grant.
Picor Corporation (“Picor”), a privately held, majority-owned subsidiary of Vicor, currently grants stock options under the following equity compensation plan that has been approved by its Board of Directors:
2001 Stock Option and Incentive Plan, as amended (the “2001 Picor Plan”) — Under the 2001 Picor Plan, the Board of Directors of Picor may grant equity-based awards associated with Picor Common Stock, including stock options, restricted stock, or unrestricted stock. Awards may be granted to employees and other key persons, including non-employee directors and full or part-time officers. No incentive stock options have been granted since November 11, 2011, and no such option were outstanding as of December 31, 2014. Non-qualifying stock options may be granted to employees at a price at least equal to the fair market value per share of Picor Common Stock, based on judgments made by Picor’s Board of Directors on the date of grant. All stock option awards must be approved by both the Picor Board of Directors and the Compensation Committee of the Company’s Board of Directors. A total of 20,000,000 shares of Picor Common Stock have been reserved for issuance under the 2001 Picor Plan. The period of time during which an option may be exercised and the vesting periods are determined by the Picor Board of Directors. The term of each option may not exceed 10 years from the date of grant.
53
VICOR CORPORATION
NOTES TO CONSOLIDATED FINANCIAL STATEMENTS (Continued)
VI Chip Corporation (“VI Chip”), a privately held, majority-owned subsidiary of Vicor, currently grants stock options under the following equity compensation plan that has been approved by its Board of Directors:
2007 Stock Option and Incentive Plan, as amended (the “2007 VI Chip Plan”) — Under the 2007 VI Chip Plan, the Board of Directors of VI Chip may grant equity-based awards associated with VI Chip Common Stock, including stock options, restricted stock, or unrestricted stock. Awards may be granted to employees and other key persons, including non-employee directors and full or part-time officers. No incentive stock options have been granted since November 11, 2011, and no such option were outstanding as of December 31, 2014. Non-qualifying stock options may be granted to employees at a price at least equal to the fair market value per share of the VI Chip Common Stock, based on judgments made by VI Chip’s Board of Directors on the date of grant. A total of 12,000,000 shares of VI Chip Common Stock have been reserved for issuance under the 2007 VI Chip Plan. The period of time during which an option may be exercised and the vesting periods are determined by the VI Chip Board of Directors. The term of each option may not exceed 10 years from the date of grant.
All time-based (i.e., non-performance-based) options for the purchase of Vicor common stock are granted at an exercise price equal to or greater than the market price for Vicor common stock at the date of the grant. All time-based (i.e., non-performance-based) options for the purchase of VI Chip or Picor common stock are granted at an exercise price equal to or greater than the estimated fair market value of the respective share price, based on a value calculated using a discounted cash flow model at the date of grant consistent with the requirements of Section 409A of the Internal Revenue Code.
On May 17, 2013, the Company commenced an Offer to Exchange (the “Exchange Offer”) to its employees and directors to voluntarily exchange certain outstanding options to purchase shares of the Company’s common stock granted under the 2000 Plan, on a one-for-one basis, for replacement options to purchase shares of common stock, also to be granted under the Company’s 2000 Plan (the “Option Exchange”). All outstanding options under the 2000 Plan granted to employees and directors prior to January 1, 2013, whether or not vested, were eligible for the Option Exchange (“Eligible Options”). Eligible Options included those options with time-based vesting provisions (“Time-Based Eligible Options”) and those options with performance-based vesting provisions tied to the achievement of certain quarterly revenue targets by the Company’s Brick Business Unit (the “BBU”) (“Performance-Based Eligible Options”). Options for the purchase of shares of common stock of the Company’s subsidiaries, VI Chip and Picor, were not eligible for the Option Exchange.
Pursuant to the Exchange Offer, which expired June 17, 2013 (the “Offer Expiration Date”), 638 eligible participants tendered, and the Company accepted for exchange, options to purchase an aggregate of 1,531,077 shares of the Company’s common stock, representing approximately 91% of Eligible Options. Upon acceptance, the tendered options were cancelled, and the Company granted an equivalent number of new options (the “Replacement Options”) under the 2000 Plan. All Replacement Options vest over five years, have a 10 year term, and have terms substantially similar to other time-based vesting options awarded under the 2000 Plan. Replacement Options granted in exchange for Time-Based Eligible Options have an exercise price equal to $6.29 (being 120% of the last reported sale price per share of the Company’s common stock on the NASDAQ on the Offer Expiration Date). Replacement Options granted in exchange for Performance-Based Eligible Options have an exercise price equal to (i) $6.29 (being 120% of the last reported sale price per share of the Company’s common stock on the NASDAQ on the Offer Expiration Date) with respect to Replacement Options that vest on or prior to the first anniversary of the Offer Expiration Date; (ii) $7.34 (being 140% of the last reported sale price per share of the Company’s common stock on the NASDAQ on the Offer Expiration Date) with respect to Replacement Options that vest after the first anniversary of the Offer Expiration Date but on or prior to the second anniversary of the Offer Expiration Date; (iii) $8.38 (being 160% of the last reported sale price per share of the Company’s common stock on the NASDAQ on the Offer Expiration Date) with respect to Replacement
54
VICOR CORPORATION
NOTES TO CONSOLIDATED FINANCIAL STATEMENTS (Continued)
Options that vest after the second anniversary of the Offer Expiration Date but on or prior to the third anniversary of the Offer Expiration Date; (iv) $9.43 (being 180% of the last reported sale price per share of the Company’s common stock on the NASDAQ on the Offer Expiration Date) with respect to Replacement Options that vest after the third anniversary of the Offer Expiration Date but on or prior to the fourth anniversary of the Offer Expiration Date; and (v) $10.48 (being 200% of the last reported sale price per share of the Company’s common stock on the NASDAQ on the Offer Expiration Date) with respect to Replacement Options that vest after the fourth anniversary of the Offer Expiration Date.
For financial reporting purposes, the exchange of Time-Based Eligible Options for Replacement Options was considered a modification of both the exercise price and the vesting terms of the cancelled options. The accounting for these modifications resulted in total incremental expense of approximately $365,000, which, combined with the remaining unrecognized expense from the original grant date value of approximately $318,000, will be recognized over the associated service period (i.e., the five year vesting period) for each new vesting tranche. Because the Company had not previously recorded stock-based compensation expense for the Performance-Based Eligible Options, as the Company determined it was not probable the Brick Business Unit would meet the revenue targets required to trigger vesting of such options, the exchange of Replacement Options for Performance-Based Eligible Options has been accounted for as the grant of new options as of June 17, 2013, the Offer Expiration Date. As referenced above, because these Replacement Options have five different exercise prices (i.e., an increasing exercise price for each of the five different vesting periods, each with a different term to expiration), the value of such Replacement Options, calculated using the Black-Scholes methodology, was based on the assumption each vesting tranche represented a distinct instrument. The resulting total expense of approximately $2,300,000 will be recognized over the associated service period for each vesting tranche, as if the grant were, in substance, five grants of distinct instruments with different exercise prices and different, sequentially shorter, terms to expiration. The unrecognized compensation expense for these Replacement Options was approximately $940,000 as of December 31, 2014.
Under the retirement provisions of the 2000 Plan and the option agreements applicable to the Replacement Options, the Company records all stock-based compensation expense for an option grant by the earlier of (a) the end of the associated service period (i.e., the vesting period) or (b) by age 62.5 of the employee or director to whom the options were awarded. Because of the age of certain recipient employees and directors, a number of Replacement Options granted were subject to immediate recognition of the associated total stock-based compensation expense. Accordingly, as a result of the Option Exchange, the Company recorded stock-based compensation expense during the second quarter of 2013 of approximately $625,000, of which approximately $450,000 was the result of immediate expense recognition due to the age of the recipient employee or director.
Separate from the Option Exchange, on May 14, 2013, the Company awarded options to purchase, at an exercise price of $5.35 per share, an aggregate of 150,000 shares of common stock, under the 2000 Plan, to certain officers. In addition, on June 21, 2013, the Company awarded options to purchase, at an exercise price of $5.67 per share, an aggregate of 70,552 shares of common stock, under the 2000 Plan, to directors as a component of their annual compensation. The total stock-based compensation expense recognized during the second quarter of 2013 for these awards was approximately $208,000, of which approximately $190,000 was the result of immediate expense recognition due to the age of the recipient officer or director.
During the third quarter of 2010, the Company granted an aggregate of 1,243,750 Performance-Based Eligible Options. Based on the final results of the Option Exchange, a total of 58,250 of these Performance-Based Eligible Options remain outstanding as of December 31, 2014. Under the accounting rules for performance-based awards, the Company is required to assess, on an ongoing basis, the probability of whether the performance criteria will be achieved. If and when achievement is deemed probable, the Company will begin
55
VICOR CORPORATION
NOTES TO CONSOLIDATED FINANCIAL STATEMENTS (Continued)
to recognize the associated compensation expense for the remaining stock options over the relevant performance period. As of December 31, 2014, the Company determined it was not probable the revenue targets would be achieved and, accordingly, has not recorded any compensation expense relating to these options since the grant date. The unrecognized compensation expense of these performance-based options was approximately $365,000 as of December 31, 2014.
On December 31, 2010, the Company granted 2,984,250 non-qualified stock options under the 2007 VI Chip Plan with performance-based vesting provisions tied to achievement of certain margin targets by the VI Chip subsidiary. As of December 31, 2010, the Company determined it was probable the margin targets would be achieved and, accordingly, began recording stock-based compensation expense relating to these options beginning January 1, 2011. This determination remains the same as of December 31, 2014 and, accordingly, expense has been recorded through that date. The unrecognized compensation expense for these performance-based options was approximately $621,000 as of December 31, 2014.
During the fourth quarter of 2014, the Company, in effect, cancelled certain stock options previously awarded to three corporate officers in 2013 and awarded to those officers new stock options representing an equivalent value, as calculated using the Black-Scholes option-pricing model. Subsequent to the 2013 awards, the Company determined those grants exceeded the limit on the number of stock options that may be granted to an individual in a year, according to the terms of the 2000 Plan. In connection with this action, recorded for financial reporting purposes as a modification of existing options, a total of 129,028 stock options awarded in 2013 were cancelled and a total of 150,355 new stock options were awarded. The cancellation of the 2013 stock options and the award of new stock options did not have a material impact on the Company’s results of operations.
Stock-based compensation expense for the years ended December 31 was as follows (in thousands):
| 2014 | 2013 | 2012 | ||||||||||
| Cost of revenues |
$ | 183 | $ | 163 | $ | 45 | ||||||
| Selling, general and administrative |
1,176 | 1,942 | 864 | |||||||||
| Research and development |
275 | 345 | 335 | |||||||||
|
|
|
|
|
|
|
|||||||
| Total stock-based compensation |
$ | 1,634 | $ | 2,450 | $ | 1,244 | ||||||
|
|
|
|
|
|
|
|||||||
The decrease in stock-based compensation expense in 2014 compared to 2013 and the increase in stock-based compensation expense in 2013 compared to 2012 were both primarily due to the Offer to Exchange, described above.
The fair value for options awarded for the years shown below was estimated at the date of grant using the Black-Scholes option pricing model with the following weighted-average assumptions:
| Non Performance- based Stock Options |
||||||||||||
| Vicor: |
2014 | 2013 | 2012 | |||||||||
| Risk-free interest rate |
2.2 | % | 1.2 | % | 0.7 | % | ||||||
| Expected dividend yield |
— | — | 0.6 | % | ||||||||
| Expected volatility |
52 | % | 39 | % | 52 | % | ||||||
| Expected lives (years) |
6.6 | 4.9 | 4.1 | |||||||||
56
VICOR CORPORATION
NOTES TO CONSOLIDATED FINANCIAL STATEMENTS (Continued)
| Non Performance- based Stock Options |
||||||||||||
| VI Chip: |
2014 | 2013 | 2012 | |||||||||
| Risk-free interest rate |
2.3 | % | 1.6 | % | 1.2 | % | ||||||
| Expected dividend yield |
— | — | — | |||||||||
| Expected volatility |
41 | % | 48 | % | 50 | % | ||||||
| Expected lives (years) |
6.5 | 6.5 | 6.5 | |||||||||
| Picor: |
2014 | 2013 | 2012 | |||||||||
| Risk-free interest rate |
2.2 | % | 1.2 | % | 1.2 | % | ||||||
| Expected dividend yield |
— | — | — | |||||||||
| Expected volatility |
42 | % | 49 | % | 50 | % | ||||||
| Expected lives (years) |
6.5 | 6.5 | 6.5 | |||||||||
Risk-free interest rate:
Vicor — The Company uses the yield on zero-coupon U.S. Treasury “Strip” securities for a period that is commensurate with the expected term assumption for each vesting period.
Picor and VI Chip — Picor and VI Chip use the yield to maturity of a seven-year U.S. Treasury bond, as it most closely aligns to the expected exercise period.
Expected dividend yield:
Vicor — The Company determines the expected dividend yield by annualizing the most recent prior cash dividends declared by the Company’s Board of Directors and dividing that result by the closing stock price on the date of that dividend declaration. Dividends are not paid on options.
Picor and VI Chip — Picor and VI Chip have not and do not expect to declare and pay dividends in the foreseeable future. Therefore, the expected dividend yield is not applicable.
Expected volatility:
Vicor — Vicor uses historical volatility to estimate the grant-date fair value of the options, using the expected term for the period over which to calculate the volatility (see below). The Company does not expect its future volatility to differ from its historical volatility. The computation of the Company’s volatility is based on a simple average calculation of monthly volatilities over the expected term.
Picor — As Picor is a nonpublic entity, historical volatility information is not available. An industry sector index of six publicly traded fabless semiconductor firms was developed for calculating historical volatility for Picor. Historical prices for each of the companies in the index based on the market price of the shares on each day of trading over the expected term were used to determine the historical volatility.
VI Chip — As VI Chip is a nonpublic entity, historical volatility information is not available. An industry sector index of 11 publicly traded fabless semiconductor firms was developed for calculating historical volatility for VI Chip. Historical prices for each of the companies in the index based on the market price of the shares on each day of trading over the expected term were used to determine the historical volatility.
57
VICOR CORPORATION
NOTES TO CONSOLIDATED FINANCIAL STATEMENTS (Continued)
Expected term:
Vicor — The Company uses historical employee exercise and option expiration data to estimate the expected term assumption for the Black-Scholes grant-date valuation. The Company believes this historical data is currently the best estimate of the expected term of options, and all groups of the Company’s employees exhibit similar exercise behavior.
Picor and VI Chip — Due to the lack of historical information, the “simplified” method as prescribed by the Securities and Exchange Commission was used to determine the expected term on grant awards that meet the definition of “plain vanilla”. For options that did not meet the criteria of “plain vanilla”, the Company calculated the expected term based on its best estimate of what the expected term would be.
Forfeiture rate:
The amount of stock-based compensation recognized during a period is based on the value of the portion of the awards that are ultimately expected to vest. Forfeitures are estimated at the time of grant and revised, if necessary, in subsequent periods if actual forfeitures differ from those estimates. The term “forfeitures” is distinct from “cancellations” or “expirations” and represents only the unvested portion of the surrendered option. The forfeiture analysis is re-evaluated quarterly and the forfeiture rate is adjusted as necessary. Ultimately, the actual expense recognized over the vesting period will only be for those shares that vest.
Vicor — The Company currently expects, for Vicor options, based on an analysis of historical forfeitures, approximately 78% of its options will actually vest. An annual forfeiture rate of 8.0% has been applied to all unvested options as of December 31, 2014. For 2013, the Company similarly expected 78% of its options would actually vest and applied an annual forfeiture rate of 8.00%.
Picor — The Company currently expects, for Picor options, based on an analysis of historical forfeitures, approximately 92% of its options will actually vest. An annual forfeiture rate of 2.75% has been applied to all unvested options as of December 31, 2014. For 2013, the Company similarly expected 92% of its options would actually vest and applied an annual forfeiture rate of 2.75%.
VI Chip — The Company currently expects, for VI Chip options, based on an analysis of historical forfeitures, approximately 77% of its options will actually vest. An annual forfeiture rate of 7.75% has been applied to all unvested options as of December 31, 2014. For 2013, the Company expected 80% of its options would actually vest and applied an annual forfeiture rate of 7.00%.
58
VICOR CORPORATION
NOTES TO CONSOLIDATED FINANCIAL STATEMENTS (Continued)
Vicor Stock Options
A summary of the activity under the 2000 Plan as of December 31, 2014 and changes during the year then ended, is presented below (in thousands except for share and weighted-average data):
| Options Outstanding |
Weighted- Average Exercise Price |
Weighted- Average Remaining Contractual Life in Years |
Aggregate Intrinsic Value |
|||||||||||||
| Outstanding on December 31, 2013 |
1,989,248 | $ | 7.71 | |||||||||||||
| Granted |
343,650 | $ | 9.24 | |||||||||||||
| Forfeited and expired |
(310,182 | ) | $ | 7.83 | ||||||||||||
| Exercised |
(127,041 | ) | $ | 6.20 | ||||||||||||
|
|
|
|||||||||||||||
| Outstanding on December 31, 2014 |
1,895,675 | $ | 8.01 | 8.41 | $ | 7,796 | ||||||||||
|
|
|
|||||||||||||||
| Exercisable on December 31, 2014 |
306,173 | $ | 6.90 | 7.85 | $ | 1,642 | ||||||||||
|
|
|
|||||||||||||||
| Vested or expected to vest as of December 31, 2014(1) |
1,707,311 | $ | 7.97 | 8.42 | $ | 7,167 | ||||||||||
|
|
|
|||||||||||||||
| (1) | In addition to the vested options, the Company expects a portion of the unvested options to vest at some point in the future. The number of options expected to vest is calculated by applying an estimated forfeiture rate to the unvested options. |
As of December 31, 2013 and 2012, the Company had options exercisable for 54,284 and 255,694 shares respectively, for which the weighted average exercise prices were $9.72 and $12.79, respectively.
During the years ended December 31, 2014, 2013, and 2012 under all plans, the total intrinsic value of Vicor options exercised (i.e., the difference between the market price at exercise and the price paid by the employee to exercise the options) was $751,000, $15,000, and $2,000, respectively. The total amount of cash received by the Company from options exercised in 2014, 2013, and 2012, was $788,000, $13,000, and $4,000, respectively. The total grant-date fair value of stock options that vested during the years ended December 31, 2014, 2013, and 2012 was approximately $1,096,000, $489,000, and $449,000, respectively.
As of December 31, 2014, there was $1,369,000 of total unrecognized compensation cost related to unvested non-performance based awards for Vicor. That cost is expected to be recognized over a weighted-average period of 2.16 years for those awards. The expense will be recognized as follows: $705,000 in 2015, $399,000 in 2016, $195,000 in 2017, $62,000 in 2018, and $8,000 in 2019.
The weighted-average fair value of Vicor options granted was $5.50, $1.90, and $2.47, in 2014, 2013, and 2012, respectively.
59
VICOR CORPORATION
NOTES TO CONSOLIDATED FINANCIAL STATEMENTS (Continued)
Picor Stock Options
A summary of the activity under the 2001 Picor Plan as of December 31, 2014 and changes during the year then ended, is presented below (in thousands except for share and weighted-average data):
| Options Outstanding |
Weighted- Average Exercise Price |
Weighted- Average Remaining Contractual Life in Years |
Aggregate Intrinsic Value |
|||||||||||||
| Outstanding on December 31, 2013 |
9,404,367 | $ | 0.66 | |||||||||||||
| Granted |
1,150,400 | $ | 0.41 | |||||||||||||
| Forfeited and expired |
(684,700 | ) | $ | 0.73 | ||||||||||||
| Exercised |
— | $ | — | |||||||||||||
|
|
|
|||||||||||||||
| Outstanding on December 31, 2014 |
9,870,067 | $ | 0.62 | 5.89 | $ | — | ||||||||||
|
|
|
|||||||||||||||
| Exercisable on December 31, 2014 |
6,643,377 | $ | 0.67 | 5.08 | $ | — | ||||||||||
|
|
|
|||||||||||||||
| Vested or expected to vest as of December 31, 2014(1) |
9,749,482 | $ | 0.62 | 5.86 | $ | — | ||||||||||
|
|
|
|||||||||||||||
| (1) | In addition to the vested options, the Company expects a portion of the unvested options to vest at some point in the future. Options expected to vest is calculated by applying an estimated forfeiture rate to the unvested options. |
As of December 31, 2013 and 2012, Picor had options exercisable for 5,869,044 and 5,329,950 shares, respectively, for which the weighted average exercise prices were $0.69 and $0.69, respectively.
During the years ended December 31, 2013, and 2012, the total intrinsic value of Picor options exercised was $146,000 and $279,000, respectively. There were no Picor options exercised in 2014. The total amounts of cash received by Picor from options exercised in 2013 and 2012 were $14,000 and $172,000, respectively. The total grant-date fair value of stock options vesting during the years ended December 31, 2014, 2013, and 2012 was approximately $0, $398,000, and $61,000, respectively.
As of December 31, 2014, there was $631,000 of total unrecognized compensation cost related to unvested share-based awards for Picor. That cost is expected to be recognized over a weighted-average period of 2.7 years for all Picor awards. The expense will be recognized as follows: $358,000 in 2015, $140,000 in 2016, $78,000 in 2017, $43,000 in 2018, and $12,000 in 2019.
The weighted-average fair value of Picor options granted was $0.19 in 2014, $0.31 in 2013, and $0.32 in 2012.
60
VICOR CORPORATION
NOTES TO CONSOLIDATED FINANCIAL STATEMENTS (Continued)
VI Chip Stock Options
A summary of the activity under the 2007 VI Chip Plan as of December 31, 2014 and changes during the year then ended, is presented below (in thousands except for share and weighted-average data):
| Options Outstanding |
Weighted- Average Exercise Price |
Weighted- Average Remaining Contractual Life in Years |
Aggregate Intrinsic Value |
|||||||||||||
| Outstanding on December 31, 2013 |
10,744,250 | $ | 1.00 | |||||||||||||
| Granted |
117,500 | $ | 1.00 | |||||||||||||
| Forfeited and expired |
(146,750 | ) | $ | 1.01 | ||||||||||||
| Exercised |
— | $ | — | |||||||||||||
|
|
|
|||||||||||||||
| Outstanding on December 31, 2014 (1) |
10,715,000 | $ | 1.00 | 3.83 | $ | — | ||||||||||
|
|
|
|||||||||||||||
| Exercisable on December 31, 2014 |
7,377,950 | $ | 1.00 | 2.64 | $ | — | ||||||||||
|
|
|
|||||||||||||||
| Vested or expected to vest as of December 31, 2014(2) |
10,423,793 | $ | 1.00 | 3.75 | $ | — | ||||||||||
|
|
|
|||||||||||||||
| (1) | Of the total VI Chip options outstanding on December 31, 2014, 5,500,000 options had been granted to Dr. Vinciarelli, the Company’s Chief Executive Officer. |
| (2) | In addition to the vested options, the Company expects a portion of the unvested options to vest at some point in the future. Options expected to vest is calculated by applying an estimated forfeiture rate to the unvested options. |
As of December 31, 2013 and 2012, VI Chip had options exercisable for 7,267,600 and 7,304,100 shares, respectively, for which the weighted average exercise price was $1.00.
There were no VI Chip options exercised in 2014 and 2013. The total intrinsic value of VI Chip options exercised in 2012 was negligible. The total amount of cash received by VI Chip from options exercised in 2012 was $6,000.
As of December 31, 2014, there was $820,000 of total unrecognized compensation cost related to unvested share-based awards for VI Chip. That cost is expected to be recognized over a weighted-average period of 1.4 years for all VI Chip awards. The expense will be recognized as follows: $233,000 in 2015, $192,000 in 2016, $177,000 in 2017, $149,000 in 2018, and $69,000 in 2019.
The weighted-average fair value of VI Chip options granted was $0.02, $0.29, and $0.46 in 2014, 2013, and 2012, respectively.
401(k) Plan
The Company sponsors a savings plan available to all domestic employees, which qualifies under Section 401(k) of the Internal Revenue Code. Employees may contribute to the plan in amounts representing from 1% to 80% of their pre-tax salary, subject to statutory limitations. The Company matches employee contributions to the plan at a rate of 50%, up to the first 3% of an employee’s compensation. The Company’s matching contributions currently vest at a rate of 20% per year, based upon years of service. The Company’s contributions to the plan were approximately $877,000, $825,000, and $813,000 in 2014, 2013, and 2012, respectively.
61
VICOR CORPORATION
NOTES TO CONSOLIDATED FINANCIAL STATEMENTS (Continued)
Stock Bonus Plan
Under the Company’s 1985 Stock Bonus Plan, as amended, shares of Common Stock may be awarded to employees from time to time as determined by the Board of Directors. On December 31, 2014, 109,964 shares were available for further award. All shares awarded to employees under this plan have vested. No further awards are contemplated under this plan at the present time.
4. SHORT-TERM AND LONG-TERM INVESTMENTS
As of December 31, 2014, the Company held one auction rate security with a par value of $3,000,000. This auction rate security consists of a collateralized debt obligation, supported by a pool of student loans, sponsored by state student loan agencies and corporate student loan servicing firms. The interest rate for the security is reset at regular intervals ranging from seven to 28 days. The auction rate security held by the Company traded at par prior to February 2008 and is callable at par at the option of the issuer.
Until February 2008, the auction rate securities market was liquid, as the investment banks conducting the periodic “Dutch auctions” by which interest rates for the securities had been established had committed their capital to support such auctions in the event of insufficient third-party investor demand. Starting the week of February 11, 2008, a substantial number of auctions failed, as demand from third-party investors weakened and the investment banks conducting the auctions chose not to commit capital to support such auctions (i.e., investment banks chose not to purchase securities themselves in order to balance supply and demand, thereby facilitating a successful auction, as they had done in the past). The consequences of a failed auction are (a) an investor must hold the specific security until the next scheduled auction (unless that investor chooses to sell the security to a third party outside of the auction process) and (b) the interest rate on the security generally resets to an interest rate set forth in each security’s indenture.
As of December 31, 2014, the Company held one auction rate security that had experienced failed auctions, representing $3,000,000 at par value, (the “Failed Auction Security”), compared to December 31, 2013, when the Company had auction rate securities, including the Failed Auction Security, that had experienced failed auctions of $6,000,000 at par value, which had been purchased through and are held by a broker-dealer affiliate of Bank of America, N.A. (the “Failed Auction Securities”). The Failed Auction Security held by the Company is Aaa/AA+ rated by the major credit rating agencies, which is collateralized by student loans, and is guaranteed by the U.S. Department of Education under the Federal Family Education Loan Program. Management is not aware of any reason to believe the issuer of the Failed Auction Security is presently at risk of default. Through December 31, 2014, the Company has continued to receive interest payments on the Failed Auction Security in accordance with the terms of its indenture. Management believes the Company ultimately should be able to liquidate the Failed Auction Security without significant loss primarily due to the overall quality of the issue held and the collateral securing the substantial majority of the underlying obligation. However, current conditions in the auction rate securities market have led management to conclude the recovery period for the Failed Auction Security exceeds 12 months. As a result, the Company continued to classify the Failed Auction Security as long-term as of December 31, 2014.
The following is a summary of available-for-sale securities (in thousands):
| December 31, 2014 | Cost | Gross Unrealized Gains |
Gross Unrealized Losses |
Estimated Fair Value |
||||||||||||
| Failed Auction Security |
$ | 3,000 | $ | — | $ | 425 | $ | 2,575 | ||||||||
| Brokered certificates of deposit |
700 | — | 3 | 697 | ||||||||||||
|
|
|
|
|
|
|
|
|
|||||||||
| $ | 3,700 | $ | — | $ | 428 | $ | 3,272 | |||||||||
|
|
|
|
|
|
|
|
|
|||||||||
62
VICOR CORPORATION
NOTES TO CONSOLIDATED FINANCIAL STATEMENTS (Continued)
| December 31, 2013 | Cost | Gross Unrealized Gains |
Gross Unrealized Losses |
Estimated Fair Value |
||||||||||||
| Failed Auction Securities |
$ | 6,000 | $ | — | $ | 1,175 | $ | 4,825 | ||||||||
| Brokered certificates of deposit |
820 | 6 | — | 826 | ||||||||||||
|
|
|
|
|
|
|
|
|
|||||||||
| $ | 6,820 | $ | 6 | $ | 1,175 | $ | 5,651 | |||||||||
|
|
|
|
|
|
|
|
|
|||||||||
All of the Failed Auction Securities as of December 31, 2014 and 2013, respectively have been in an unrealized loss position for greater than 12 months. A Failed Auction Security held as of December 31, 2013 was redeemed at par value of $3,000,000 during the fourth quarter of 2014.
The amortized cost and estimated fair value of available-for-sale securities on December 31, 2014, by contractual maturities, are shown below (in thousands):
| Cost | Estimated Fair Value |
|||||||
| Due in one year or less |
$ | 270 | $ | 270 | ||||
| Due in two to ten years |
430 | 427 | ||||||
| Due in ten to twenty years |
— | — | ||||||
| Due in twenty to forty years |
3,000 | 2,575 | ||||||
|
|
|
|
|
|||||
| $ | 3,700 | $ | 3,272 | |||||
|
|
|
|
|
|||||
Based on the fair value measurements described in Note 5, the fair value of the Failed Auction Security on December 31, 2014, with a par value of $3,000,000, was estimated by the Company to be approximately $2,575,000. The gross unrealized loss of $425,000 on the Failed Auction Securities consists of two types of estimated loss: an aggregate credit loss of $84,000 and an aggregate temporary impairment of $341,000. In determining the amount of credit loss, the Company compared the present value of cash flows expected to be collected to the amortized cost basis of the securities, considering credit default risk probabilities and changes in credit ratings as significant inputs, among other factors (see Note 5).
The following table represents a rollforward of the activity related to the credit loss recognized in earnings on available-for-sale auction rate securities held by the Company for the years ended December 31 (in thousands):
| 2014 | 2013 | 2012 | ||||||||||
| Balance at the beginning of the period |
$ | 395 | $ | 317 | $ | 308 | ||||||
| Reductions for securities sold during the period |
(272 | ) | (7 | ) | — | |||||||
| Additions for the amount related to credit loss for which other-than-temporary impairment was not previously recognized |
(39 | ) | 85 | 9 | ||||||||
|
|
|
|
|
|
|
|||||||
| Balance at the end of the period |
$ | 84 | $ | 395 | $ | 317 | ||||||
|
|
|
|
|
|
|
|||||||
At this time, the Company has no intent to sell the Failed Auction Security and does not believe it is more likely than not the Company will be required to sell the security. If current market conditions deteriorate further, the Company may be required to record additional unrealized losses. If the credit rating of the security deteriorates, the Company may be required to adjust the carrying value of the investment through impairment charges recorded in the Consolidated Statement of Operations, and any such impairment adjustments may be material.
63
VICOR CORPORATION
NOTES TO CONSOLIDATED FINANCIAL STATEMENTS (Continued)
Based on the Company’s ability to access cash and cash equivalents and its expected operating cash flows, management does not anticipate the current lack of liquidity associated with the Failed Auction Security held will affect the Company’s ability to execute its current operating plan.
5. FAIR VALUE MEASUREMENTS
The Company accounts for certain financial assets at fair value, defined as the price that would be received to sell an asset or paid to transfer a liability (i.e., an exit price) in the principal or most advantageous market for the asset or liability in an orderly transaction between market participants on the measurement date. As such, fair value is a market-based measurement that should be determined based on assumptions market participants would use in pricing an asset or liability. A three-level hierarchy is used to show the extent and level of judgment used to estimate fair value measurements.
Assets measured at fair value on a recurring basis include the following as of December 31, 2014 (in thousands):
| Using | ||||||||||||||||
| Quoted Prices in Active Markets (Level 1) |
Significant Other Observable Inputs (Level 2) |
Significant Unobservable Inputs (Level 3) |
Total Fair Value as of December 31, 2014 |
|||||||||||||
| Cash equivalents: |
||||||||||||||||
| Money market funds |
$ | 11,207 | $ | — | $ | — | $ | 11,207 | ||||||||
| Short-term investments: |
||||||||||||||||
| Brokered certificates of deposit |
— | 270 | — | 270 | ||||||||||||
| Long-term investments: |
||||||||||||||||
| Failed Auction Security |
— | — | 2,575 | 2,575 | ||||||||||||
| Brokered certificates of deposit |
— | 427 | — | 427 | ||||||||||||
Assets measured at fair value on a recurring basis include the following as of December 31, 2013 (in thousands):
| Using | ||||||||||||||||
| Quoted Prices in Active Markets (Level 1) |
Significant Other Observable Inputs (Level 2) |
Significant Unobservable Inputs (Level 3) |
Total Fair Value as of December 31, 2013 |
|||||||||||||
| Cash equivalents: |
||||||||||||||||
| Money market funds |
$ | 12,407 | $ | — | $ | — | $ | 12,407 | ||||||||
| Short-term investments: |
||||||||||||||||
| Brokered certificates of deposit |
— | 463 | — | 463 | ||||||||||||
| Long-term investments: |
||||||||||||||||
| Failed Auction Securities |
— | — | 4,825 | 4,825 | ||||||||||||
| Brokered certificates of deposit |
— | 363 | — | 363 | ||||||||||||
The Company has brokered certificates of deposit classified as Level 2 because the fair value for these investments has been determined utilizing observable inputs from non-active markets. The fair values fluctuate with changes in market interest rates obtained from information available in publicly quoted markets. Management tested the reported fair values by comparing them to net present value calculations utilizing a discount rate based on U.S. Treasury bill and bond yields for similar maturities.
64
VICOR CORPORATION
NOTES TO CONSOLIDATED FINANCIAL STATEMENTS (Continued)
As of December 31, 2014, there was insufficient observable auction rate security market information available to determine the fair value of the Failed Auction Security using Level 1 or Level 2 inputs. As such, the Company’s investment in the Failed Auction Security was deemed to require valuation using Level 3 inputs. Management, after consulting with advisors, valued the Failed Auction Security using analyses and pricing models similar to those used by market participants (i.e., buyers, sellers, and the broker-dealers responsible for execution of the Dutch auction pricing mechanism by which each issue’s interest rate was set). Management utilized a probability weighted discounted cash flow (“DCF”) model to determine the estimated fair value of this security as of December 31, 2014. The major assumptions used in preparing the DCF model included: estimates for the amount and timing of future interest and principal payments based on default probability assumptions used to measure the credit loss of 2.8%; the rate of return required by investors to own these securities in the current environment, which we estimate to be 5.0% above the risk free rate of return; and an estimated timeframe of three to five years for successful auctions for these securities to occur. In making these assumptions, management considered relevant factors including: the formula applicable to each security defining the interest rate paid to investors in the event of a failed auction (the “Penalty Rate”); forward projections of the interest rate benchmarks specified in such formulas; the likely timing of principal repayments; the probability of full repayment considering the guarantees by the U.S. Department of Education of the underlying student loans, guarantees by other third parties, and additional credit enhancements provided through other means; and publicly available pricing data for recently issued student loan asset-backed securities not subject to auctions. In developing its estimate of the rate of return required by investors to own these securities, management compared the Penalty Rates of the Failed Auction Security with yields of actively traded long-term bonds with similar characteristics and, reflecting the limited liquidity for auction rate securities and the discounts to par value seen in recent tender offers by issuers and arms’ length market transactions between informed buyers and sellers, estimated the implied yield (i.e., the discount to par value) necessary to complete a sale of the Failed Auction Security. Management has calculated an increase or decrease in the liquidity risk premium of 5.0% referenced above of 1.0% (i.e., 100 basis points) as used in the model, would decrease or increase, respectively, the fair value of the Failed Auction Security by approximately $100,000.
For purposes of the valuation process for the Failed Auction Security, “management” consists of senior members of the Company’s finance department. The fair value measurements for the Failed Auction Security are reviewed and updated on a quarterly basis. The calculations are prepared by the Company’s Corporate Controller, in conjunction with information provided by its valuation advisors, and include the development and substantiation of the unobservable inputs. The methodology, assumptions, and calculations are reviewed and approved by the Company’s Chief Financial Officer and Chief Accounting Officer.
The significant unobservable inputs used in the fair value measurement of the Company’s Failed Auction Security are the cumulative probability of earning the maximum rate until maturity, the cumulative probability of principal return prior to maturity, the cumulative probability of default, the liquidity risk premium, and the recovery rate in default. Significant increases (decreases) in any of those inputs in isolation would result in changes in fair value measurement. Significant increases (decreases) in the cumulative probability of earning the maximum rate until maturity, the cumulative probability of principal return prior to maturity, and the recovery rate in default would result in a higher (lower) fair value measurement, while increases (decreases) in the cumulative probability of default and the liquidity risk premium would result in a (lower) higher fair value measurement.
Generally, the interrelationships are such that a change in the assumption used for the cumulative probability of principal return prior to maturity is accompanied by a directionally similar change in the assumption used for the cumulative probability of earning the maximum rate until maturity and a directionally opposite change in the assumptions used for the cumulative probability of default and the liquidity risk premium. The recovery rate in default is somewhat independent and based upon the securities’ specific underlying assets and published recovery rate indices.
65
VICOR CORPORATION
NOTES TO CONSOLIDATED FINANCIAL STATEMENTS (Continued)
Quantitative information about Level 3 fair value measurements as of December 31, 2014 are as follows (dollars in thousands):
| Fair Value |
Valuation Technique |
Unobservable Input | Weighted Average |
|||||||||
| Failed Auction Security |
$ | 2,575 | Discounted cash flow |
Cumulative probability of earning the maximum rate until maturity |
0.02 | % | ||||||
| Cumulative probability of principal return prior to maturity |
93.74 | % | ||||||||||
| Cumulative probability of default | 6.24 | % | ||||||||||
| Liquidity risk premium | 5.00 | % | ||||||||||
| Recovery rate in default | 40.00 | % | ||||||||||
The following table summarizes the change in the fair values for those assets valued on a recurring basis utilizing Level 3 inputs for the year ended December 31, 2014 (in thousands):
| Balance at the beginning of the period |
$ | 4,825 | ||
| Redemptions |
(3,000 | ) | ||
| Credit gains on available for sales securities included in Other income (expense), net |
311 | |||
| Gain included in Other comprehensive income (loss) |
439 | |||
|
|
|
|||
| Balance at the end of the period |
$ | 2,575 | ||
|
|
|
6. INVENTORIES
Inventories as of December 31 were as follows (in thousands):
| 2014 | 2013 | |||||||
| Raw materials |
$ | 18,252 | $ | 19,744 | ||||
| Work-in-process |
3,339 | 3,979 | ||||||
| Finished goods |
4,737 | 5,973 | ||||||
|
|
|
|
|
|||||
| Net balance |
$ | 26,328 | $ | 29,696 | ||||
|
|
|
|
|
|||||
7. PROPERTY, PLANT AND EQUIPMENT
Property, plant and equipment are stated at cost and are depreciated and amortized over a period of three to 39 years generally under the straight-line method for financial reporting purposes and accelerated methods for income tax purposes.
Property, plant and equipment as of December 31 were as follows (in thousands):
| 2014 | 2013 | |||||||
| Land |
$ | 2,089 | $ | 2,089 | ||||
| Buildings and improvements |
43,800 | 43,083 | ||||||
| Machinery and equipment |
228,663 | 224,481 | ||||||
| Furniture and fixtures |
5,905 | 6,047 | ||||||
| Construction in-progress and deposits |
2,568 | 1,327 | ||||||
|
|
|
|
|
|||||
| 283,025 | 277,027 | |||||||
| Accumulated depreciation and amortization |
(245,638 | ) | (236,935 | ) | ||||
|
|
|
|
|
|||||
| Net balance |
$ | 37,387 | $ | 40,092 | ||||
|
|
|
|
|
|||||
66
VICOR CORPORATION
NOTES TO CONSOLIDATED FINANCIAL STATEMENTS (Continued)
Depreciation expense for the years ended December 31, 2014, 2013 and 2012 was approximately $9,833,000, $10,180,000, and $10,546,000 respectively. As of December 31, 2014, the Company had approximately $841,000 of capital expenditure commitments.
8. OTHER INVESTMENTS
The Company’s gross investment in non-voting convertible preferred stock of GWS totaled $5,000,000 as of December 31, 2014, and December 31, 2013, giving the Company an approximately 27% ownership interest in GWS. GWS and its subsidiary design and sell semiconductors, conduct research and development activities, develop and license patents, and litigate against those who infringe upon its patented technologies. A director of the Company is the founder, Chairman of the Board, President and Chief Executive Officer (“CEO”), as well as the majority voting shareholder, of GWS. The Company and GWS are parties to an intellectual property cross-licensing agreement, a license agreement and two supply agreements under which the Company purchases certain components from GWS. Purchases from GWS totaled approximately $2,146,000, $1,959,000, and $2,087,000 in 2014, 2013, and 2012, respectively. The Company owed GWS approximately $170,000 and $152,000 as of December 31, 2014 and 2013, respectively.
The Company accounts for its investment in GWS under the equity method of accounting. The Company has determined that, while GWS is a variable interest entity, the Company is not the primary beneficiary. The key factors in the Company’s assessment were that the CEO of GWS has: (i) the power to direct the activities of GWS that most significantly impact its economic performance, and (ii) has an obligation to absorb losses or the right to receive benefits from GWS, respectively, that could potentially be significant to GWS.
The balance in the Company’s net investment in GWS was zero as of December 31, 2014 and 2013.
9. INTANGIBLE ASSETS
Patent costs, which are included in other assets in the accompanying balance sheets, as of December 31 were as follows (in thousands):
| 2014 | 2013 | |||||||
| Patent costs |
$ | 2,721 | $ | 3,170 | ||||
| Accumulated amortization |
(1,689 | ) | (2,007 | ) | ||||
|
|
|
|
|
|||||
| $ | 1,032 | $ | 1,163 | |||||
|
|
|
|
|
|||||
Definite lived intangible assets, such as patent rights, are amortized and tested for impairment if a triggering event occurs.
Patent renewal fees were $25,000 and $38,000 in 2014 and 2013, respectively.
Amortization expense was approximately $170,000, $264,000 and $314,000 in 2014, 2013 and 2012, respectively. The estimated future amortization expense from patent assets held as of December 31, 2014, is projected to be $143,000, $130,000, $124,000, $108,000 and $102,000, in fiscal years 2015, 2016, 2017, 2018, and 2019, respectively.
In 2012, the Company performed the first step of the quantitative goodwill impairment assessment for VJCL and determined the carrying value of VJCL exceeded its fair value. The Company, therefore, performed the second step of its evaluation to calculate the impairment and, as a result, recorded a full impairment charge of $2,012,000 during the fourth quarter of 2012.
67
VICOR CORPORATION
NOTES TO CONSOLIDATED FINANCIAL STATEMENTS (Continued)
10. SEVERANCE AND OTHER CHARGES
In July 2014, the Company’s management authorized the consolidation of the manufacturing of Westcor division products, of the Brick Business Unit segment, by transferring those operations from Westcor’s Sunnyvale, California facility to the Company’s primary manufacturing facility in Andover, Massachusetts, by the end of 2014. As a result, the Company recorded a pre-tax charge of $2,207,000 in the second half of 2014, primarily for the cost of severance and other employee-related costs involving cash payments based on each employee’s respective length of service. The Company also incurred other costs related to the relocation of the manufacturing operations, primarily freight costs for the transfer of inventories and equipment, and employee travel expenses, of which approximately $303,000 was expensed in the second half of 2014. The severance payments will commence in January 2015. These charges were recorded as “Severance and other charges” in the Consolidated Statement of Operations. The related liability is presented as “Accrued severance charges” in the Consolidated Balance Sheets.
A summary of the activity related to the severance charges, is as follows (in thousands):
| Balance as of December 31, 2013 |
$ | — | ||
| Charges |
1,904 | |||
| Payments |
— | |||
|
|
|
|||
| Balance as of December 31, 2014 |
$ | 1,904 | ||
|
|
|
| 11. PRODUCT | WARRANTIES |
Product warranty activity for the years ended December 31 was as follows (in thousands):
| 2014 | 2013 | 2012 | ||||||||||
| Balance at the beginning of the period |
$ | 283 | $ | 364 | $ | 572 | ||||||
| Accruals for warranties for products sold in the period |
281 | 327 | 439 | |||||||||
| Fulfillment of warranty obligations |
(350 | ) | (297 | ) | (554 | ) | ||||||
| Revisions of estimated obligations |
(10 | ) | (111 | ) | (93 | ) | ||||||
|
|
|
|
|
|
|
|||||||
| Balance at the end of the period |
$ | 204 | $ | 283 | $ | 364 | ||||||
|
|
|
|
|
|
|
|||||||
12. STOCKHOLDERS’ EQUITY
Each share of Common Stock entitles the holder thereof to one vote on all matters submitted to the stockholders.
Each share of Class B Common Stock entitles the holder thereof to ten votes on all such matters.
Shares of Class B Common Stock are not transferable by a stockholder except to or among the stockholder’s spouse, certain of the stockholder’s relatives, and certain other defined transferees. Class B Common Stock is not listed or traded on any exchange or in any market. Class B Common Stock is convertible at the option of the holder thereof at any time and without cost to the stockholder into shares of Common Stock on a one-for-one basis.
Under a tender offer completed on April 22, 2013, the Company purchased 1,341,575 shares of Common Stock for an aggregate cost of $6,708,000.
68
VICOR CORPORATION
NOTES TO CONSOLIDATED FINANCIAL STATEMENTS (Continued)
Under a previous tender offer completed on March 7, 2013, the Company purchased 1,931,513 shares of Common Stock for an aggregate cost of $10,392,000.
In November 2000, the Board of Directors of the Company authorized the repurchase of up to $30,000,000 of the Company’s Common Stock (the “November 2000 Plan”). The plan authorizes the Company to make repurchases from time to time in the open market or through privately negotiated transactions. The timing of this program and the amount of the stock that may be repurchased is at the discretion of management based on its view of economic and financial market conditions. There were no repurchases under the November 2000 Plan in 2014, 2013, and 2012. On December 31, 2014 and 2013, the Company had approximately $8,541,000 available for share repurchases under the November 2000 Plan.
Dividends are declared at the discretion of the Company’s Board of Directors and depend on actual cash from operations, the Company’s financial condition and capital requirements and any other factors the Company’s Board of Directors may consider relevant at the time. Common Stock and Class B Common Stock participate in dividends and earnings equally.
During the year ended December 31, 2014, two subsidiaries paid a total of $3,900,000 in cash dividends, of which $3,738,000 was paid to the Company and $162,000 was paid to outside shareholders. During the year ended December 31, 2013, three subsidiaries paid a total of $2,100,000 in cash dividends, of which $1,569,000 was paid to the Company and $531,000 was paid to outside shareholders. During the year ended December 31, 2012, three subsidiaries paid a total of $1,600,000 in cash dividends, of which $1,222,000 was paid to the Company and $378,000 was paid to outside shareholders. Dividends paid to outside shareholders of our subsidiaries are accounted for as a reduction in noncontrolling interest.
During 2014, a total of 127,041 shares of Common Stock were issued upon the exercise of stock options.
On December 31, 2014, there were 14,719,889 shares of Vicor Common Stock reserved for issuance for Vicor stock options and upon conversion of Class B Common Stock.
13. OTHER INCOME (EXPENSE), NET
The major changes in the components of other income (expense), net for the years ended December 31 were as follows (in thousands):
| 2014 | 2013 | 2012 | ||||||||||
| Interest income |
$ | 80 | $ | 97 | $ | 136 | ||||||
| Foreign currency losses, net |
(196 | ) | (94 | ) | (46 | ) | ||||||
| Gain on disposal of equipment |
22 | 26 | 33 | |||||||||
| Credit gains (losses) on available for sale securities |
311 | (78 | ) | (9 | ) | |||||||
| Other |
51 | 51 | 80 | |||||||||
|
|
|
|
|
|
|
|||||||
| $ | 268 | $ | 2 | $ | 194 | |||||||
|
|
|
|
|
|
|
|||||||
14. INCOME TAXES
The tax provision is based on the annual effective tax rate for the year, which includes estimated federal, state and foreign income taxes on the Company’s pre-tax income and estimated federal and state income taxes for certain noncontrolling interest subsidiaries that are not part of the Company’s consolidated income tax returns. The tax provisions also include discrete items, principally related to tax credits, tax provision vs. tax return differences and accrued interest for potential liabilities.
69
VICOR CORPORATION
NOTES TO CONSOLIDATED FINANCIAL STATEMENTS (Continued)
The reconciliation of the federal statutory rate to the effective income tax rate for the years ended December 31 is as follows:
| 2014 | 2013 | 2012 | ||||||||||
| Statutory federal tax rate |
(34.0 | %) | (34.0 | %) | (34.0 | %) | ||||||
| State income taxes, net of federal income tax benefit |
0.8 | 1.1 | (9.4 | ) | ||||||||
| Tax credits |
(12.4 | ) | (8.1 | ) | 0.6 | |||||||
| U.S. manufacturing deduction |
— | 1.7 | (3.8 | ) | ||||||||
| Permanent items |
0.4 | 0.6 | 2.2 | |||||||||
| Book income attributable to noncontrolling interest |
(0.6 | ) | 0.4 | 6.8 | ||||||||
| Foreign rate differential and deferred items |
(0.3 | ) | (0.2 | ) | 0.1 | |||||||
| Increase (decrease) in tax reserves |
(3.7 | ) | (0.1 | ) | 0.3 | |||||||
| Increase in valuation allowance |
46.9 | 53.3 | 84.5 | |||||||||
| Other |
— | 0.1 | (0.7 | ) | ||||||||
|
|
|
|
|
|
|
|||||||
| (2.9 | %) | 14.8 | % | 46.6 | % | |||||||
|
|
|
|
|
|
|
|||||||
In 2014, the Company could not recognize a tax benefit for the majority of its losses due to a full valuation allowance against all domestic deferred tax assets, as described below. During the third quarter of 2014, the Company recognized a tax benefit of approximately $552,000 as a discrete item for the release of certain income tax reserves, due to the completion of an Internal Revenue Service examination of its 2010 and 2011 federal corporate income tax returns during the quarter (see below).
On January 2, 2013 the American Taxpayer Relief Act of 2012 (“ATRA”) was signed into law. Under prior law, a taxpayer was entitled to a research tax credit for qualifying amounts paid or incurred on or before December 31, 2011. The ATRA, in effect, renewed the research credit for two years to December 31, 2013. The extension of the research tax credit was retroactive and includes amounts paid or incurred after December 31, 2011. Since the law was enacted in 2013, the federal research tax credit for 2012 of $549,000 was recorded as a discrete item in the first quarter of 2013.
For financial reporting purposes, income (loss) before income taxes for the years ended December 31 include the following components (in thousands):
| 2014 | 2013 | 2012 | ||||||||||
| Domestic |
$ | (14,223 | ) | $ | (20,466 | ) | $ | (3,109 | ) | |||
| Foreign |
(272 | ) | 1 | 518 | ||||||||
|
|
|
|
|
|
|
|||||||
| $ | (14,495 | ) | $ | (20,465 | ) | $ | (2,591 | ) | ||||
|
|
|
|
|
|
|
|||||||
70
VICOR CORPORATION
NOTES TO CONSOLIDATED FINANCIAL STATEMENTS (Continued)
Significant components of the provision (benefit) for income taxes for the years ended December 31 are as follows (in thousands):
| 2014 | 2013 | 2012 | ||||||||||
| Current: |
||||||||||||
| Federal |
$ | (690 | ) | $ | (1,848 | ) | $ | 920 | ||||
| State |
147 | 284 | 425 | |||||||||
| Foreign |
124 | 112 | 231 | |||||||||
|
|
|
|
|
|
|
|||||||
| (419 | ) | (1,452 | ) | 1,576 | ||||||||
| Deferred: |
||||||||||||
| Federal |
(6 | ) | 4,491 | (369 | ) | |||||||
|
|
|
|
|
|
|
|||||||
| $ | (425 | ) | $ | 3,039 | $ | 1,207 | ||||||
|
|
|
|
|
|
|
|||||||
The Company intends to continue to reinvest certain of its foreign earnings indefinitely. Accordingly, no U.S. income taxes have been provided for approximately $2,940,000 of unremitted earnings of international subsidiaries. As of December 31, 2014, the amount of unrecognized deferred tax liability on these earnings was $185,000.
71
VICOR CORPORATION
NOTES TO CONSOLIDATED FINANCIAL STATEMENTS (Continued)
Significant components of the Company’s deferred tax assets and liabilities as of December 31 were as follows (in thousands):
| 2014 | 2013 | |||||||
| Deferred tax assets: |
||||||||
| Research and development tax credit carryforwards |
$ | 10,756 | $ | 8,754 | ||||
| Net operating loss carryforwards |
3,560 | 2,497 | ||||||
| Stock-based compensation |
3,465 | 3,048 | ||||||
| Inventory reserves |
3,024 | 2,687 | ||||||
| Vacation accrual |
1,821 | 1,645 | ||||||
| Investment tax credit carryforwards |
1,446 | 1,367 | ||||||
| Foreign tax credits |
1,405 | — | ||||||
| Accrued severance |
525 | — | ||||||
| Alternative minimum tax credit carryforward |
340 | 340 | ||||||
| Deferred revenue |
178 | 279 | ||||||
| Unrealized loss on investments |
131 | 399 | ||||||
| Warranty reserves |
65 | 88 | ||||||
| Bad debt reserves |
59 | 65 | ||||||
| Capital loss carryforward |
— | 680 | ||||||
| Other |
446 | 428 | ||||||
|
|
|
|
|
|||||
| Total deferred tax assets |
27,221 | 22,277 | ||||||
| Less: Valuation allowance for deferred tax assets |
(25,818 | ) | (20,214 | ) | ||||
|
|
|
|
|
|||||
| Net deferred tax assets |
1,403 | 2,063 | ||||||
| Deferred tax liabilities: |
||||||||
| Depreciation |
(176 | ) | (918 | ) | ||||
| Prepaid expenses |
(755 | ) | (598 | ) | ||||
| Patent amortization |
(365 | ) | (416 | ) | ||||
| Unremitted Vicor Custom Power earnings |
(329 | ) | (335 | ) | ||||
|
|
|
|
|
|||||
| Total deferred tax liabilities |
(1,625 | ) | (2,267 | ) | ||||
|
|
|
|
|
|||||
| Net deferred tax liabilities |
$ | (222 | ) | $ | (204 | ) | ||
|
|
|
|
|
|||||
As of December 31, 2014, the Company has a valuation allowance of approximately $25,818,000 primarily against all domestic net deferred tax assets, for which realization cannot be considered more likely than not at this time. Management assesses the need for the valuation allowance on a quarterly basis. In assessing the need for a valuation allowance, the Company considers all positive and negative evidence, including scheduled reversals of deferred tax liabilities, projected future taxable income, tax planning strategies, and past financial performance. In 2013, the Company recorded an increase to the valuation allowance of approximately $10,241,000 for all remaining domestic net deferred tax assets not previously covered by a valuation allowance due to the following factors: (1) the Company’s forecast of future taxable income, of the appropriate nature, based on its quarterly assessment was not sufficient to support the recoverability of the remaining domestic deferred tax assets; (2) recent cumulative losses and the Company’s projection of continued losses into 2014; (3) while the Company has the ability to carryback federal net operating losses or credits to utilize against federal taxable income, it will generate only $1,600,000 in cash refunds (which were received in the fourth quarter of 2014); and (4) the lack of prudent and feasible tax planning strategies. These assessment factors remain essentially unchanged, as the Company remains in a significant cumulative loss position as of December 31, 2014. As a result, management believes a full valuation allowance against all domestic net deferred tax assets is
72
VICOR CORPORATION
NOTES TO CONSOLIDATED FINANCIAL STATEMENTS (Continued)
warranted as of December 31, 2014. The valuation allowance against these deferred tax assets may require adjustment in the future based on changes in the mix of temporary differences, changes in tax laws, and operating performance. If and when the Company determines the valuation allowance should be released (i.e., reduced), the adjustment would result in a tax benefit reported in that period’s Consolidated Statements of Operations, the effect of which would be an increase in reported net income. A portion of such an adjustment may be accounted for through an increase to “Additional paid-in capital”, a component of Stockholders’ Equity. The amount of any such tax benefit associated with release of our valuation allowance in a particular quarter may be material.
As a result of certain realization requirements under the stock-based compensation guidance, the table of deferred tax assets and liabilities shown above does not include certain deferred tax assets as of December 31, 2014, that arose directly from tax deductions related to stock-based compensation greater than stock-based compensation recognized for financial reporting. Equity will be increased by $3,024,000 if and when such deferred tax assets are ultimately realized. The Company uses ASC 740 ordering when determining when excess tax benefits have been realized.
The research and development tax credit carryforwards expire beginning in 2015 for state purposes and in 2025 for federal purposes. The Company has federal net operating loss carryforwards which expire beginning in 2033, as well as net operating loss carryforwards in certain states, which expire beginning in 2015 through 2034.
A reconciliation of the beginning and ending amount of unrecognized tax benefits is as follows (in thousands):
| 2014 | 2013 | 2012 | ||||||||||
| Balance on January 1 |
$ | 2,072 | $ | 1,506 | $ | 1,405 | ||||||
| Additions based on tax provisions related to the current year |
161 | 566 | 134 | |||||||||
| Reductions for tax positions of prior years |
(967 | ) | — | (33 | ) | |||||||
| Lapse of statute |
(12 | ) | — | — | ||||||||
|
|
|
|
|
|
|
|||||||
| Balance on December 31 |
$ | 1,254 | $ | 2,072 | $ | 1,506 | ||||||
|
|
|
|
|
|
|
|||||||
The Company has reviewed the tax positions taken, or to be taken, in its tax returns for all tax years currently open to examination by a taxing authority. The total amount of unrecognized tax benefits, that is the aggregate tax effect of differences between tax return positions and the benefits recognized in the Company’s financial statements, as of December 31, 2014, 2013, and 2012 of $1,254,000, $2,072,000, and $1,506,000, respectively, if recognized, may decrease the Company’s income tax provision and effective tax rate. None of the unrecognized tax benefits as of December 31, 2014, are expected to significantly change during the next twelve months.
The Company recognizes accrued interest and penalties, if any, related to unrecognized tax benefits as a component of income tax expense. During the years ended December 31, 2014, 2013, and 2012, the Company recognized approximately $32,000, ($28,000), and $32,000, respectively, in net interest (benefit) expense. As of December 31, 2014 and 2013, the Company had accrued approximately $181,000 and $149,000, respectively, for the potential payment of interest.
The Company files income tax returns in the United States and various foreign tax jurisdictions. These tax returns are generally open to examination by the relevant tax authorities from three to seven years from the date they are filed. The tax filings relating to the Company’s federal and state taxes are currently open to examination for tax years 2012 and 2013 and 2007 through 2013, respectively. In addition, the 2003, 2004, and 2007 tax years resulted in losses. These years may also be subject to examination since the losses were carried forward and
73
VICOR CORPORATION
NOTES TO CONSOLIDATED FINANCIAL STATEMENTS (Continued)
utilized in future years. In August 2013, the Company received notice from the Internal Revenue Service that its federal corporate tax returns for the tax years 2010 and 2011 had been selected for examination. The examination was completed resulting in a net refund due the Company of approximately $17,000, which was received and recorded as a discrete benefit in the third quarter of 2014.
The Company’s subsidiary in Italy, Vicor Italy S.r.l. (“Vicor Italy”), underwent during 2014 a tax inspection for tax years 2009 through 2013, covering corporation, regional and value added taxes. Vicor Italy received a preliminary tax audit report dated June 30, 2014. The Company filed a response to the preliminary tax audit report in the third quarter of 2014. While management believes it is too early to determine the likelihood or amount of potential liability at this time, it does not believe the ultimate impact of this matter will be material to the Company’s financial statements.
Other than the Vicor Italy matter discussed above there are no other income tax examinations or audits currently in process.
15. COMMITMENTS AND CONTINGENCIES
The Company leases certain of its office and manufacturing space. The future minimum rental commitments under non-cancelable operating leases with remaining terms in excess of one year are as follows (in thousands):
| Year |
||||
| 2015 |
$ | 1,514 | ||
| 2016 |
811 | |||
| 2017 |
412 | |||
| 2018 |
139 | |||
| 2019 and thereafter |
120 | |||
Rent expense was approximately $1,824,000, $1,820,000 and $1,677,000 in 2014, 2013 and 2012, respectively. The Company also pays tenant-related executory costs such as taxes, maintenance, and insurance.
On January 28, 2011, SynQor, Inc. (“SynQor”) filed a complaint for patent infringement against Ericsson, Inc. (“Ericsson”), Cisco Systems, Inc. (“Cisco”) and the Company in U.S. District Court for the Eastern District of Texas (the “Texas Action”). This immediately followed a complaint filed by the Company on January 26, 2011, in U.S. District Court for the District of Massachusetts, in which the Company sought a declaratory judgment that its bus converter products do not infringe any valid claim of certain of SynQor’s U.S. patents, and that the claims of those patents are invalid. With respect to the Company, SynQor’s complaint alleges the Company’s products, including, but not limited to, unregulated bus converters used in intermediate bus architecture power supply systems, infringe certain SynQor patents. SynQor seeks, among other items, an injunction against further infringement and an award of unspecified compensatory and enhanced damages, interest, costs and attorney fees. On February 8, 2011, SynQor filed a motion for preliminary injunction seeking an order enjoining the Company from manufacturing, using, selling, and offering for sale in the United States and/or importing into the United States certain identified unregulated bus converters, as well as any other bus converters not significantly different from those products. On February 17, 2011, the Company withdrew its Massachusetts action without prejudice to allow the litigation to proceed in Texas. On May 16, 2011, SynQor announced it was withdrawing its motion for preliminary injunction against the Company. On that date, SynQor also announced it and Ericsson had entered into a definitive settlement agreement. On September 16, 2011, the U.S. District Court for the Eastern District of Texas issued an order setting a trial date of July 7, 2014. On September 20, 2011, SynQor filed an amended complaint in the Texas Action. The amended complaint repeated
74
VICOR CORPORATION
NOTES TO CONSOLIDATED FINANCIAL STATEMENTS (Continued)
the allegations of patent infringement against the Company contained in SynQor’s original complaint, and included additional patent infringement allegations with respect to U.S. Patent No. 8,023,290 (“290 patent”), which was issued on that day. As with SynQor’s original complaint, the amended complaint alleged the Company’s products, including but not limited to the Company’s unregulated bus converters used in intermediate bus architecture power supply systems, infringed the asserted patents. On October 4, 2011, the Company filed an answer and counterclaims to SynQor’s amended complaint, in which the Company alleges the 290 patent is unenforceable because it was procured through inequitable conduct before the U.S. Patent and Trademark Office and seeks damages against SynQor for SynQor’s unfair and deceptive trade practices and tortious interference with prospective economic advantage in connection with SynQor’s allegations of patent infringement against the Company. On January 2, 2014, the court issued its claim construction order following a claim construction hearing held on December 17, 2013. On January 16, 2014, the Company filed a motion seeking reconsideration of certain aspects of the court’s claim construction ruling. On March 31, 2014, the court issued an order severing the case against the Company and Cisco into two separate matters, with separate trials to be held with respect to SynQor’s claims against Cisco and SynQor’s claims against the Company. On June 30, 2014, the Company filed a number of motions seeking summary judgment in this matter, including for a finding of no direct, indirect, or willful infringement and for a finding of indefiniteness with respect to U.S. Patent No. 7,272,021. The court has yet to rule on these motions. On October 23, 2014, the court issued an order continuing trial in this matter indefinitely. On January 7, 2015, the Company’s case and that of Cisco were assigned to a new judge within the U.S. District Court for the Eastern District of Texas. On January 30, 2015, SynQor filed a motion requesting a status conference. That motion has not yet been addressed by the court. On February 6, 2015, SynQor filed a motion to consolidate the Company’s and Cisco’s cases for trial. That motion has not yet been briefed by the parties. As of March 6, 2015, the Company has received no notice from the court regarding the timing of rulings on our summary judgment motions or the scheduling of a trial in this matter.
The Company continues to believe that none of its products, including its unregulated bus converters, infringe any valid claim of the asserted SynQor patents, either alone or when used in an intermediate bus architecture implementation. The Company believes SynQor’s claims lack merit and, therefore, continues to vigorously defend itself against SynQor’s patent infringement allegations. The Company does not believe a loss is probable for this matter. If a loss were to be incurred, though, the Company cannot estimate the amount of possible loss or range of possible loss at this time.
On February 22, 2007, the Company announced it had reached an agreement in principle with Ericsson, Inc., the U.S. affiliate of LM Ericsson, to settle a lawsuit brought by Ericsson against the Company in California state court. Under the terms of the settlement agreement entered into on March 29, 2007, after a court ordered mediation, the Company paid $50,000,000 to Ericsson, of which $12,800,000 was reimbursed by the Company’s insurance carriers. Accordingly, the Company recorded a net loss of $37,200,000 from the litigation–related settlements in the fourth quarter of 2006. The Company subsequently sought further reimbursement from its insurance carriers. On November 14, 2008, a jury in the United States District Court for the District of Massachusetts found in favor of the Company in a lawsuit against certain of its insurance carriers with respect to the Ericsson settlement. The jury awarded $17,300,000 in damages to the Company, although the verdict was subject to challenge in the trial court and on appeal. Both parties filed certain motions subsequent to the ruling and, on March 2, 2009, the judge in the case rendered his decision on the subsequent motions, reducing the jury award by $4,000,000. On March 26, 2009, the U.S. District Court, District of Massachusetts (the “Court”) issued its judgment in the matter, affirming the award of $13,300,000, plus prejudgment interest from the date of breach on March 29, 2007, through March 26, 2009, the date of judgment in the amount of approximately $3,179,000. The insurance carriers filed their appeal to this total judgment in the amount of approximately $16,479,000 and an oral argument was held in early February 2010 on the insurer’s appeal. On March 16, 2012, the U.S. Court of Appeals for the First Circuit vacated the judgment in favor of the Company and remanded the case for
75
VICOR CORPORATION
NOTES TO CONSOLIDATED FINANCIAL STATEMENTS (Continued)
proceedings consistent with the Court’s opinions. On October 3, 2012, a stipulation of dismissal with prejudice was filed with the Court, reflecting the contemporaneous settlement agreement between the Company and the insurance carriers in which the Company received a cash payment of $1,975,000 in exchange for its release of the insurance carriers from future claims. The settlement amount of $1,975,000 was recorded as a gain from litigation–related settlement in the fourth quarter of 2012.
In addition to the SynQor matter, the Company is involved in certain other litigation and claims incidental to the conduct of its business. While the outcome of lawsuits and claims against the Company cannot be predicted with certainty, management does not expect any current litigation or claims to have a material adverse impact on the Company’s financial position or results of operations.
| 16. SEGMENT | INFORMATION |
The Company has organized its business segments according to its key product lines. The BBU segment designs, develops, manufactures, and markets the Company’s modular power converters and configurable products, and also includes the six entities comprising Vicor Custom Power, the BBU operations of VJCL, and the operations of the Company’s Westcor division. The VI Chip segment includes VI Chip Corporation, which designs, develops, manufactures, and markets the Company’s factorized power architecture (“FPA”) products. The VI Chip segment also includes the VI Chip business conducted through VJCL. The Picor segment includes Picor Corporation, which designs, develops, manufactures, and markets integrated circuits and related products for use in a variety of power management and power system applications. Picor develops these products to be sold as part of Vicor’s products or to third parties for separate applications.
The Company’s Chief Executive Officer (i.e., the chief operating decision maker) evaluates performance and allocates resources based on segment revenues and segment operating income (loss). The operating income (loss) for each segment includes selling, general, and administrative and research and development expenses directly attributable to the segment. Certain of the Company’s indirect overhead costs, which include corporate selling, general, and administrative expenses, are allocated among the segments based upon an estimate of costs associated with each segment. Assets allocated to each segment are based upon specific identification of such assets, which include accounts receivable, inventories, fixed assets and certain other assets. The Corporate segment consists of those operations and assets shared by all segments. The costs of certain centralized executive and administrative functions are recorded in this segment, as are certain shared assets, most notably cash and cash equivalents, deferred tax assets, long-term investments, the Company’s facilities in Massachusetts, real estate, and other assets. The Company’s accounting policies and method of presentation for segments are consistent with that used throughout the Consolidated Financial Statements.
The following table provides significant segment financial data as of and for the years ended December 31 (in thousands):
| BBU | VI Chip | Picor | Corporate | Eliminations | Total | |||||||||||||||||||
| (1) | ||||||||||||||||||||||||
| 2014: |
||||||||||||||||||||||||
| Net revenues |
$ | 184,224 | $ | 34,701 | $ | 15,570 | $ | — | $ | (8,764 | ) | $ | 225,731 | |||||||||||
| Income (loss) from operations |
15,499 | (29,015 | ) | (407 | ) | (840 | ) | — | (14,763 | ) | ||||||||||||||
| Total assets |
151,923 | 17,677 | 5,691 | 75,758 | (95,507 | ) | 155,542 | |||||||||||||||||
| Depreciation and amortization |
4,711 | 3,265 | 410 | 1,419 | — | 9,805 | ||||||||||||||||||
76
VICOR CORPORATION
NOTES TO CONSOLIDATED FINANCIAL STATEMENTS (Continued)
| BBU | VI Chip | Picor | Corporate | Eliminations | Total | |||||||||||||||||||
| (1) | ||||||||||||||||||||||||
| 2013: |
||||||||||||||||||||||||
| Net revenues |
$ | 163,013 | $ | 35,333 | $ | 10,416 | $ | — | $ | (9,602 | ) | $ | 199,160 | |||||||||||
| Income (loss) from operations |
12,062 | (28,204 | ) | (3,326 | ) | (999 | ) | — | (20,467 | ) | ||||||||||||||
| Total assets |
126,585 | 21,370 | 4,308 | 81,364 | (67,987 | ) | 165,640 | |||||||||||||||||
| Depreciation and amortization |
6,185 | 3,232 | 407 | 184 | — | 10,008 | ||||||||||||||||||
| 2012: |
||||||||||||||||||||||||
| Net revenues |
$ | 179,919 | $ | 38,083 | $ | 9,724 | $ | — | $ | (9,219 | ) | $ | 218,507 | |||||||||||
| Income (loss) from operations |
28,114 | (27,409 | ) | (2,786 | ) | (704 | ) | — | (2,785 | ) | ||||||||||||||
| Total assets |
97,507 | 21,105 | 5,365 | 119,007 | (40,403 | ) | 202,581 | |||||||||||||||||
| Depreciation and amortization |
4,958 | 3,568 | 414 | 1,483 | — | 10,423 | ||||||||||||||||||
| (1) | The elimination for net revenues is principally related to inter-segment revenues of Picor to BBU and VI Chip and for inter-segment revenues of VI Chip to BBU. The elimination for total assets is principally related to inter-segment accounts receivable due to BBU for the funding of VI Chip and Picor operations. |
17. QUARTERLY RESULTS OF OPERATIONS (Unaudited)
The following table sets forth certain unaudited quarterly financial data for the years ended December 31 (in thousands, except per share amounts):
| First | Second | Third | Fourth | Total | ||||||||||||||||
| 2014: |
||||||||||||||||||||
| Net revenues |
$ | 53,233 | $ | 53,361 | $ | 58,402 | $ | 60,735 | $ | 225,731 | ||||||||||
| Gross margin |
22,792 | 22,662 | 25,550 | 26,116 | 97,120 | |||||||||||||||
| Consolidated net loss |
(5,426 | ) | (4,932 | ) | (3,669 | ) | (43 | ) | (14,070 | ) | ||||||||||
| Net income (loss) attributable to noncontrolling interest |
(48 | ) | (97 | ) | 5 | (43 | ) | (183 | ) | |||||||||||
| Net loss attributable to Vicor Corporation |
(5,378 | ) | (4,835 | ) | (3,674 | ) | — | (13,887 | ) | |||||||||||
| Net loss per share attributable to Vicor Corporation: |
||||||||||||||||||||
| Basic and diluted |
(0.14 | ) | (0.13 | ) | (0.10 | ) | — | (0.36 | ) | |||||||||||
| First | Second | Third | Fourth | Total | ||||||||||||||||
| 2013: |
||||||||||||||||||||
| Net revenues |
$ | 41,946 | $ | 46,865 | $ | 55,091 | $ | 55,258 | $ | 199,160 | ||||||||||
| Gross margin |
16,607 | 18,461 | 22,980 | 23,431 | 81,479 | |||||||||||||||
| Consolidated net loss |
(4,986 | ) | (4,600 | ) | (898 | ) | (13,020 | ) | (23,504 | ) | ||||||||||
| Net income attributable to noncontrolling interest |
4 | 16 | 34 | 82 | 136 | |||||||||||||||
| Net loss attributable to Vicor Corporation |
(4,990 | ) | (4,616 | ) | (932 | ) | (13,102 | ) | (23,640 | ) | ||||||||||
| Net loss per share attributable to Vicor Corporation: |
||||||||||||||||||||
| Basic and diluted |
(0.12 | ) | (0.12 | ) | (0.02 | ) | (0.34 | ) | (0.60 | ) | ||||||||||
In the fourth quarter of 2013, the Company recorded an increase of $10,132,000 to the income tax valuation allowance against deferred tax assets (See Note 14).
77
| ITEM 9. | CHANGES IN AND DISAGREEMENTS WITH ACCOUNTANTS ON ACCOUNTING AND FINANCIAL DISCLOSURE |
None.
| ITEM 9A. | CONTROLS AND PROCEDURES |
Attached as exhibits to this Annual Report on Form 10-K are certifications of our CEO and Chief Financial Officer (“CFO”), which are required in accordance with Rule 13a-14 of the Exchange Act. This “Controls and Procedures” section includes information concerning the controls and controls evaluation referred to in the certifications.
(a) Evaluation of disclosure controls and procedures
As required by Rule 13a-15 under the Exchange Act, management, with the participation of our CEO and CFO, conducted an evaluation regarding the effectiveness of our disclosure controls and procedures, as of the end of the last fiscal year. The term “disclosure controls and procedures,” as defined in Rules 13a-15(e) and 15d-15(e) under the Exchange Act, means controls and other procedures of a company that are designed to ensure that information required to be disclosed by a company in the reports that it files or submits under the Exchange Act is recorded, processed, summarized and reported, within the time periods specified in the Securities and Exchange Commission’s rules and forms. Disclosure controls and procedures include, without limitation, controls and procedures designed to ensure that information required to be disclosed by a company in the reports that it files or submits under the Exchange Act is accumulated and communicated to the Company’s management, including its principal executive and principal financial officers, as appropriate to allow timely decisions regarding required disclosure. We recognize any controls and procedures, no matter how well designed and operated, can provide only reasonable assurance of achieving their objectives and we necessarily apply our judgment in evaluating the cost-benefit relationship of possible controls and procedures. Based on the evaluation of the Company’s disclosure controls and procedures as of December 31, 2014, the Chief Executive Officer and Chief Financial Officer concluded, as of such date, the Company’s disclosure controls and procedures were effective at the reasonable assurance level.
(b) Management’s Report on Internal Control Over Financial Reporting
Our management is responsible for establishing and maintaining adequate internal control over financial reporting to provide reasonable assurance regarding the reliability of our financial reporting and the preparation of financial statements for external purposes in accordance with generally accepted accounting principles. Internal control over financial reporting includes those policies and procedures; (a) pertaining to the maintenance of records that in reasonable detail accurately and fairly reflect the transactions and dispositions of our assets; (b) providing reasonable assurance that transactions are recorded as necessary to permit preparation of financial statements in accordance with generally accepted accounting principles, and that receipts and expenditures are being made only in accordance with authorizations of our management and Board of Directors; and (c) providing reasonable assurance regarding prevention or timely detection of unauthorized acquisition, use, or disposition of our assets that could have a material effect on our financial statements.
Management assessed our internal control over financial reporting as of December 31, 2014, the end of our fiscal year. Management based its assessment on criteria established in Internal Control — Integrated Framework (1992) issued by the Committee of Sponsoring Organizations of the Treadway Commission (COSO). Management’s assessment included evaluation of such elements as the design and operating effectiveness of key financial reporting controls, process documentation, accounting policies, and our overall control environment.
78
Based on our assessment, management has concluded that our internal control over financial reporting was effective as of December 31, 2014.
The effectiveness of our internal control over financial reporting as of December 31, 2014 has been audited by KPMG LLP, our independent registered public accounting firm, as stated in their report which is included immediately below.
79
REPORT OF INDEPENDENT REGISTERED PUBLIC ACCOUNTING FIRM
The Board of Directors and Stockholders
Vicor Corporation:
We have audited Vicor Corporation’s internal control over financial reporting as of December 31, 2014, based on criteria established in Internal Control — Integrated Framework (1992) issued by the Committee of Sponsoring Organizations of the Treadway Commission (COSO). Vicor Corporation’s management is responsible for maintaining effective internal control over financial reporting and for its assessment of the effectiveness of internal control over financial reporting, included in the accompanying Management’s Report on Internal Control Over Financial Reporting. Our responsibility is to express an opinion on the Company’s internal control over financial reporting based on our audit.
We conducted our audit in accordance with the standards of the Public Company Accounting Oversight Board (United States). Those standards require that we plan and perform the audit to obtain reasonable assurance about whether effective internal control over financial reporting was maintained in all material respects. Our audit included obtaining an understanding of internal control over financial reporting, assessing the risk that a material weakness exists, and testing and evaluating the design and operating effectiveness of internal control based on the assessed risk. Our audit also included performing such other procedures as we considered necessary in the circumstances. We believe that our audit provides a reasonable basis for our opinion.
A company’s internal control over financial reporting is a process designed to provide reasonable assurance regarding the reliability of financial reporting and the preparation of financial statements for external purposes in accordance with generally accepted accounting principles. A company’s internal control over financial reporting includes those policies and procedures that (1) pertain to the maintenance of records that, in reasonable detail, accurately and fairly reflect the transactions and dispositions of the assets of the company; (2) provide reasonable assurance that transactions are recorded as necessary to permit preparation of financial statements in accordance with generally accepted accounting principles, and that receipts and expenditures of the company are being made only in accordance with authorizations of management and directors of the company; and (3) provide reasonable assurance regarding prevention or timely detection of unauthorized acquisition, use, or disposition of the company’s assets that could have a material effect on the financial statements.
Because of its inherent limitations, internal control over financial reporting may not prevent or detect misstatements. Also, projections of any evaluation of effectiveness to future periods are subject to the risk that controls may become inadequate because of changes in conditions, or that the degree of compliance with the policies or procedures may deteriorate.
In our opinion, Vicor Corporation maintained, in all material respects, effective internal control over financial reporting as of December 31, 2014, based on criteria established in Internal Control — Integrated Framework (1992) issued by the Committee of Sponsoring Organizations of the Treadway Commission (COSO).
We also have audited, in accordance with the standards of the Public Company Accounting Oversight Board (United States), the consolidated balance sheets of Vicor Corporation and subsidiaries as of December 31, 2014 and 2013, and the related consolidated statements of operations, comprehensive income (loss), cash flows and equity for each of the years then ended, and our report dated March 6, 2015 expressed an unqualified opinion on those consolidated financial statements.
/s/ KPMG LLP
Boston, Massachusetts
March 6, 2015
80
(c) Inherent Limitations on Effectiveness of Controls
The Company’s management, including the CEO and CFO, does not expect that our disclosure controls or our internal control over financial reporting will prevent or detect all errors and all fraud. A control system, no matter how well designed and operated, can provide only reasonable, not absolute, assurance that the control system’s objectives will be met. The design of a control system must reflect the fact that there are resource constraints, and the benefits of controls must be considered relative to their costs. Further, because of the inherent limitations in all control systems, no evaluation of controls can provide absolute assurance that misstatements due to error or fraud will not occur or that all control issues and instances of fraud, if any, within the Company have been detected. These inherent limitations include the realities that judgments in decision-making can be faulty and that breakdowns can occur because of simple error or mistake. Controls can also be circumvented by the individual acts of some persons, by collusion of two or more people, or by management override of the controls. The design of any system of controls is based in part on certain assumptions about the likelihood of future events, and there can be no assurance that any design will succeed in achieving its stated goals under all potential future conditions. Projections of any evaluation of controls effectiveness to future periods are subject to risks. Over time, controls may become inadequate because of changes in conditions or deterioration in the degree of compliance with policies or procedures.
(d) Changes in Internal Control Over Financial Reporting
There was no change in our internal control over financial reporting that occurred during the fiscal quarter ended December 31, 2014, that has materially affected, or is reasonably likely to materially affect, the Company’s internal control over financial reporting.
81
| ITEM 9B. | OTHER INFORMATION |
None.
PART III
| ITEM 10. | DIRECTORS, EXECUTIVE OFFICERS AND CORPORATE GOVERNANCE |
Incorporated by reference from the Company’s Definitive Proxy Statement for its 2015 annual meeting of stockholders.
| ITEM 11. | EXECUTIVE COMPENSATION |
Incorporated by reference from the Company’s Definitive Proxy Statement for its 2015 annual meeting of stockholders.
| ITEM 12. | SECURITY OWNERSHIP OF CERTAIN BENEFICIAL OWNERS AND MANAGEMENT AND RELATED STOCKHOLDER MATTERS |
Incorporated by reference from the Company’s Definitive Proxy Statement for its 2015 annual meeting of stockholders.
| ITEM 13. | CERTAIN RELATIONSHIPS AND RELATED TRANSACTIONS AND DIRECTOR INDEPENDENCE |
Incorporated by reference from the Company’s Definitive Proxy Statement for its 2015 annual meeting of stockholders.
| ITEM 14. | PRINCIPAL ACCOUNTANT FEES AND SERVICES |
Incorporated by reference from the Company’s Definitive Proxy Statement for its 2015 annual meeting of stockholders.
PART IV
| ITEM 15. | EXHIBITS AND FINANCIAL STATEMENT SCHEDULES |
(a) (1) Financial Statements
See index in Item 8.
(a) (2) Schedules
Schedule II Valuation and Qualifying Accounts
All other schedules for which provision is made in the applicable accounting regulation of the Securities and Exchange Commission are not required under the related instructions or are inapplicable, and therefore have been omitted.
82
(b) Exhibits
| Exhibits |
Description of Document | |||
| 3.1 |
• | Restated Certificate of Incorporation, dated February 28, 1990 (1) | ||
| 3.2 |
• | Certificate of Ownership and Merger Merging Westcor Corporation, a Delaware Corporation, into Vicor Corporation, a Delaware Corporation, dated December 3, 1990 (1) | ||
| 3.3 |
• | Certificate of Amendment of Restated Certificate of Incorporation, dated May 10, 1991 (1) | ||
| 3.4 |
• | Certificate of Amendment of Restated Certificate of Incorporation, dated June 23, 1992 (1) | ||
| 3.5 |
• | Bylaws, as amended (9) | ||
| 4.1 |
• | Specimen Common Stock Certificate (2) | ||
| 10.1* |
• | 1984 Stock Option Plan of the Company, as amended (2) | ||
| 10.2* |
• | 1993 Stock Option Plan (3) | ||
| 10.3* |
• | 1998 Stock Option and Incentive Plan (4) | ||
| 10.4* |
• | Amended and Restated 2000 Stock Option and Incentive Plan (5) | ||
| 10.5* |
• | Form of Non-Qualified Stock Option under the Vicor Corporation Amended and Restated 2000 Stock Option and Incentive Plan (6) | ||
| 10.6* |
• | Sales Incentive Plan (7) | ||
| 10.7* |
• | Picor Corporation 2001 Stock Option and Incentive Plan (8) | ||
| 10.8* |
• | Form of Non-Qualified Stock Option under the Picor Corporation 2001 Stock Option and Incentive Plan (8) | ||
| 10.9* |
• | VI Chip Corporation Amended 2007 Stock Option and Incentive Plan (11) | ||
| 10.10* |
• | Form of Non-Qualified Stock Option Agreement under the VI Chip Corporation Amended 2007 Stock Option and Incentive Plan (10) | ||
| 10.11* |
• | Form of Incentive Stock Option Agreement under the VI Chip Corporation Amended 2007 Stock Option and Incentive Plan (11) | ||
| 10.12* |
• | Form of Stock Restriction Agreement under the VI Chip Corporation Amended 2007 Stock Option and Incentive Plan (11) | ||
| 21.1 |
• | Subsidiaries of the Company (12) | ||
| 23.1 |
• | Consent of KPMG LLP (12) | ||
| 23.2 |
• | Consent of Grant Thornton LLP (12) | ||
| 31.1 |
• | Certification of Chief Executive Officer pursuant to Rule 13a-14(a) of the Securities Exchange Act of 1934 (12) | ||
| 31.2 |
• | Certification of Chief Financial Officer pursuant to Rule 13a-14(a) of the Securities Exchange Act of 1934 (12) | ||
| 32.1 |
• | Certification of Chief Executive Officer pursuant to 18 U.S.C. Section 1350, as adopted pursuant to Section 906 of the Sarbanes-Oxley Act of 2002 (12) | ||
| 32.2 |
• | Certification of Chief Financial Officer pursuant to 18 U.S.C. Section 1350, as adopted pursuant to Section 906 of the Sarbanes-Oxley Act of 2002 (12) | ||
| 101 |
• | The following material from the Company’s Annual Report on Form 10-K, for the year ended December 31, 2014, formatted in XBRL (Extensible Business Reporting Language): (i) the Consolidated Balance Sheets; (ii) the Consolidated Statements of Operations; (iii) the Consolidated Statements of Comprehensive Income (Loss); (iv) the Consolidated Statements of Cash Flows; (v) the Consolidated Statements of Equity; and (vi) the Notes to Consolidated Financial Statements. | ||
| * | Indicates a management contract or compensatory plan or arrangement required to be filed pursuant to Item 15(b) of Form 10-K. |
| (1) | Filed as an exhibit to the Company’s Annual Report on Form 10-K filed on March 29, 2001 and incorporated herein by reference. |
| (2) | Filed as an exhibit to the Company’s Registration Statement on Form 10, as amended, under the Securities Exchange Act of 1934 (File No. 0-18277), and incorporated herein by reference. |
83
| (3) | Filed as an exhibit to the Company’s Registration Statement on Form S-8, as amended, under the Securities Act of 1933 (No. 33-65154), and incorporated herein by reference. |
| (4) | Filed as an exhibit to the Company’s Registration Statement on Form S-8, as amended, under the Securities Act of 1933 (No. 333-61177), and incorporated herein by reference. |
| (5) | Filed as an exhibit to the Company’s Proxy Statement for use in connection with its 2002 Annual Meeting of Stockholders, which was filed on April 29, 2002 (File No. 0-18277), and incorporated herein by reference. |
| (6) | Filed as an exhibit to the Company’s Quarterly Report on Form 10-Q filed on November 4, 2004 (File No. 0-18277) and incorporated herein by reference. |
| (7) | Filed as an exhibit to the Company’s Annual Report on Form 10-K filed on March 16, 2005 (File No. 0-18277) and incorporated herein by reference. |
| (8) | Filed as an exhibit to the Company’s Annual Report on Form 10-K filed on March 14, 2006 (File No. 0-18277) and incorporated herein by reference. |
| (9) | Filed as an exhibit to the Company’s Quarterly Report on Form 10-Q filed on November 8, 2006 (File No. 0-18277) and incorporated herein by reference. |
| (10) | Filed as an exhibit to the Company’s Current Report on Form 8-K, dated June 6, 2007 (File No. 0-18277) and incorporated herein by reference. |
| (11) | Filed as an exhibit to the Company’s Current Report and Form 8-K, dated March 6, 2008 (File No. 0-18277) incorporated herein by reference. |
| (12) | Filed herewith. |
84
SCHEDULE II
VALUATION AND QUALIFYING ACCOUNTS
Years ended December 31, 2014, 2013 and 2012
| Description |
Balance at Beginning of Period |
Charge to Costs and Expenses |
Other Charges, Deductions (1) |
Balance at End of Period |
||||||||||||
| Allowance for doubtful accounts: |
||||||||||||||||
| Year ended: |
||||||||||||||||
| December 31, 2014 |
$ | 198,000 | $ | 66,000 | $ | (81,000 | ) | $ | 183,000 | |||||||
| December 31, 2013 |
292,000 | 255,000 | (349,000 | ) | 198,000 | |||||||||||
| December 31, 2012 |
266,000 | 37,000 | (11,000 | ) | 292,000 | |||||||||||
| (1) | Reflects uncollectible accounts written off, net of recoveries. |
85
SIGNATURES
Pursuant to the requirements of Section 13 or 15(d) of the Securities Exchange Act of 1934, the Registrant has duly caused this report to be signed on its behalf by the undersigned, thereunto duly authorized.
| Vicor Corporation | ||
| By: | /s/ James A. Simms | |
| James A. Simms | ||
| Vice President, Chief Financial Officer | ||
Date: March 6, 2015
Pursuant to the requirements of the Securities Exchange Act of 1934, this report has been signed below by the following persons on behalf of the registrant in the capacities and on the dates indicated.
| Signature |
Title |
Date | ||
| /s/ Patrizio Vinciarelli Patrizio Vinciarelli |
President, Chief Executive Officer and Chairman of the Board (Principal Executive Officer) |
March 6, 2015 | ||
| /s/ James A. Simms James A. Simms |
Chief Financial Officer and Vice President (Principal Financial Officer and Principal Accounting Officer) |
March 6, 2015 | ||
| /s/ Estia J. Eichten Estia J. Eichten |
Director | March 6, 2015 | ||
| /s/ David T. Riddiford David T. Riddiford |
Director | March 6, 2015 | ||
| /s/ Barry Kelleher Barry Kelleher |
Director | March 6, 2015 | ||
| /s/ Samuel J. Anderson Samuel J. Anderson |
Director | March 6, 2015 | ||
| /s/ Claudio Tuozzolo Claudio Tuozzolo |
Director | March 6, 2015 | ||
| /s/ Jason L. Carlson Jason L. Carlson |
Director | March 6, 2015 | ||
| /s/ Liam K. Griffin Liam K. Griffin |
Director | March 6, 2015 | ||
| /s/ H. Allen Henderson H. Allen Henderson |
Director | March 6, 2015 | ||
86