Attached files
| file | filename |
|---|---|
| 8-K - 8-K - CrossAmerica Partners LP | d884116d8k.htm |
Exhibit 99.1
CST Brands, Inc Company Update March 2015 CST CAP CROSSAMERICA PARTNERS L. P.
CST CAP CROSSAMERICA PARTNERS L. P. 1 Safe Harbor Statements Forward-Looking Statements Statements contained in this presentation that state the Company’s or management’s expectations or predictions of the future are forward-looking statements are intended to be covered by the safe harbor provisions of the Securities Act of 1933, as amended, and the Securities Exchange Act of 1934, as amended. The words “believe,” “expect,” “should,” “intends,” “estimates,” and other similar expressions identify forward-looking statements. It is important to note that actual results could differ materially from those projected in such forward-looking statements. For more information concerning factors that could cause actual results to differ from those expressed or forecasted, see CST filings with the Securities and Exchange Commission (“SEC”), including the Risk Factors in our most recently filed Annual Reports on Form 10-K as filed with the SEC and available on CST Brand’s website at www.cstbrands.com and CrossAmerica’s website at www.crossamericapartners.com. If any of these risks or uncertainties materialize, or if our underlying assumptions prove to be incorrect, actual results may vary significantly from what we projected. Any forward-looking statement you see or hear during this presentation reflects our current views as of the date of this presentation with respect to future events. We assume no obligation to publicly update or revise these forward-looking statements for any reason, whether as a result of new information, future events, or otherwise. Non-GAAP Financial Measures To supplement our consolidated and combined financial statements prepared in accordance with accounting principles generally accepted in the United States (“GAAP”) and to better reflect period-over-period comparisons, we use non-GAAP financial measures that either exclude or include amounts that are not normally excluded or included in the most directly comparable measure, calculated and presented in accordance with GAAP. Non-GAAP financial measures do not replace and are not superior to the presentation of GAAP financial results, but are provided to improve overall understanding of our current financial performance and our prospects for the future. We believe the non-GAAP financial results provide useful information to both management and investors regarding certain additional financial and business trends relating to financial condition and operating results. In addition, management uses these measures, along with GAAP information, for reviewing financial results and evaluating our historical operating performance. The non-GAAP adjustments for all periods presented are based upon information and assumptions available as of the date of this presentation. The non-GAAP information is not prepared in accordance with GAAP and may not be comparable to non-GAAP information used by other companies. Information regarding the non-GAAP financial measure referenced in this presentation, including the reconciliation to the nearest GAAP measure can be found in our financial results press releases, available on our web sites: www.cstbrands.com and www.crossamericapartners.com.
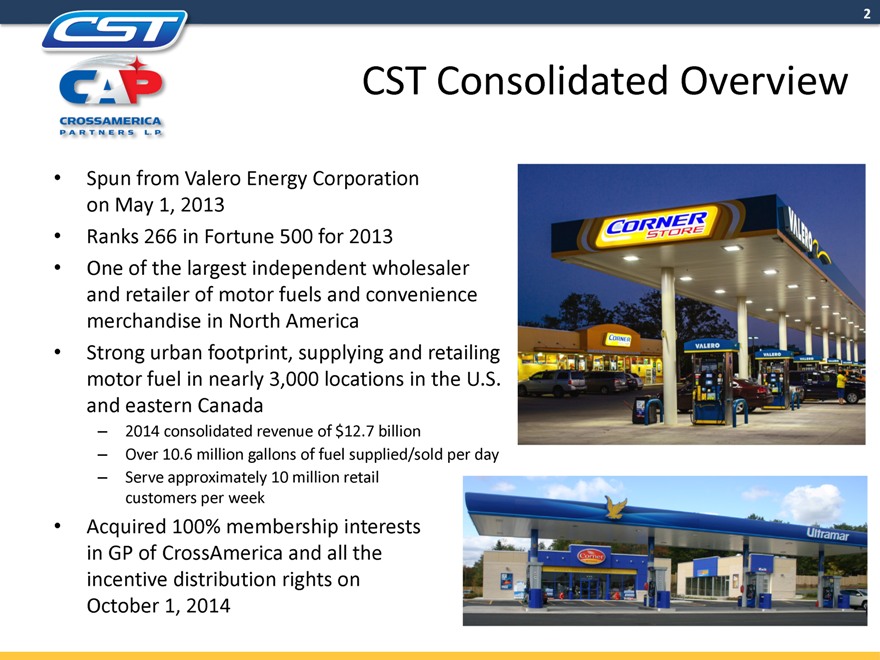
CST CAP CROSSAMERICA PARTNERS L. P. 2 CST Consolidated Overview • Spun from Valero Energy Corporation on May 1, 2013 • Ranks 266 in Fortune 500 for 2013 • One of the largest independent wholesaler and retailer of motor fuels and convenience merchandise in North America • Strong urban footprint, supplying and retailing motor fuel in nearly 3,000 locations in the U.S. and eastern Canada – 2014 consolidated revenue of $12.7 billion – Over 10.6 million gallons of fuel supplied/sold per day – Serve approximately 10 million retail customers per week • Acquired 100% membership interests in GP of CrossAmerica and all the incentive distribution rights on October 1, 2014
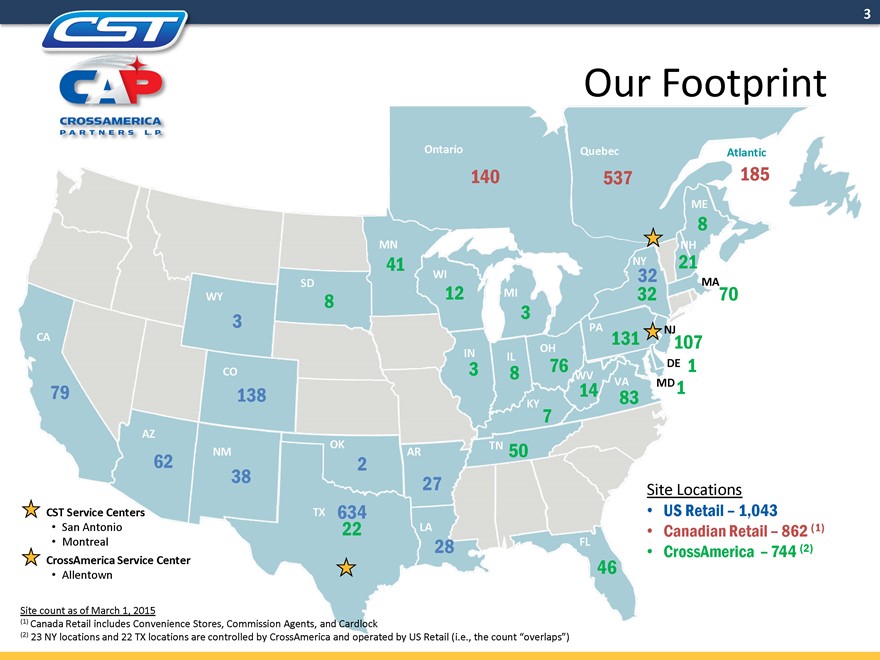
3 CST CAP CROSSAMERICA PARTNERS L. P. Our Footprint Ontario Quebec Atlantic 140 537 185 ME 8 MN NH 41 NY 21 WI 32 SD MA WY 8 12 MI 32 70 3 3 PA NJ CA OH 131 107 IN IL 76 DE 1 CO 3 8 WV 79 14 VA MD 1 138 83 KY 7 AZ OK TN 62 NM AR 50 2 38 27 Site Locations CST Service Centers TX 634 • US Retail – 1,043 • San Antonio 22 LA • Canadian Retail – 862 (1) • Montreal FL CrossAmerica Service Center 28 • CrossAmerica – 744 (2) • Allentown 46 Site count as of March 1, 2015 (1) Canada Retail includes Convenience Stores, Commission Agents, and Cardlock (2) 23 NY locations and 22 TX locations are controlled by CrossAmerica and operated by US Retail (i.e., the count “overlaps”)
CST CAP CROSSAMERICA PARTNERS L. P. 4 Our Family of Brands Proprietary Brands Licensed Brands CORNER STORE NICE N EASY GROCERY SHOPPES VALERO BP EXXON GULF SUNOCO CITGO CHEVRON SASUPERAMERICA SUBWAY COUNTRY STYLE PIZZA PIZZA BURGER KING ESSO MOBIL ULTRAMAR FRESH CHOICES DEPANNEUR EXPRESS MART STOP IN FOOD STORES EASY STREET EATERY TRANSIT CAFÉ FREEDOM ULTRAWASH
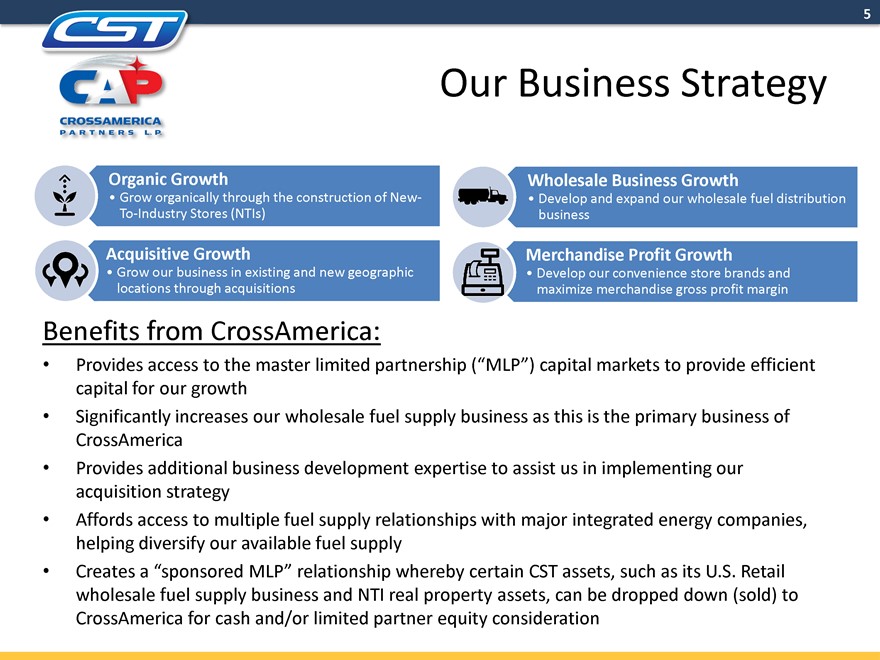
CST CAP CROSSAMERICA PARTNERS L. P. 5 Our Business Strategy Organic Growth Wholesale Business Growth • Grow organically through the construction of New- • Develop and expand our wholesale fuel distribution To-Industry Stores (NTIs) business Acquisitive Growth Merchandise Profit Growth • Grow our business in existing and new geographic • Develop our convenience store brands and locations through acquisitions maximize merchandise gross profit margin Benefits from CrossAmerica: • Provides access to the master limited partnership (“MLP”) capital markets to provide efficient capital for our growth • Significantly increases our wholesale fuel supply business as this is the primary business of CrossAmerica • Provides additional business development expertise to assist us in implementing our acquisition strategy • Affords access to multiple fuel supply relationships with major integrated energy companies, helping diversify our available fuel supply • Creates a “sponsored MLP” relationship whereby certain CST assets, such as its U.S. Retail wholesale fuel supply business and NTI real property assets, can be dropped down (sold) to CrossAmerica for cash and/or limited partner equity consideration
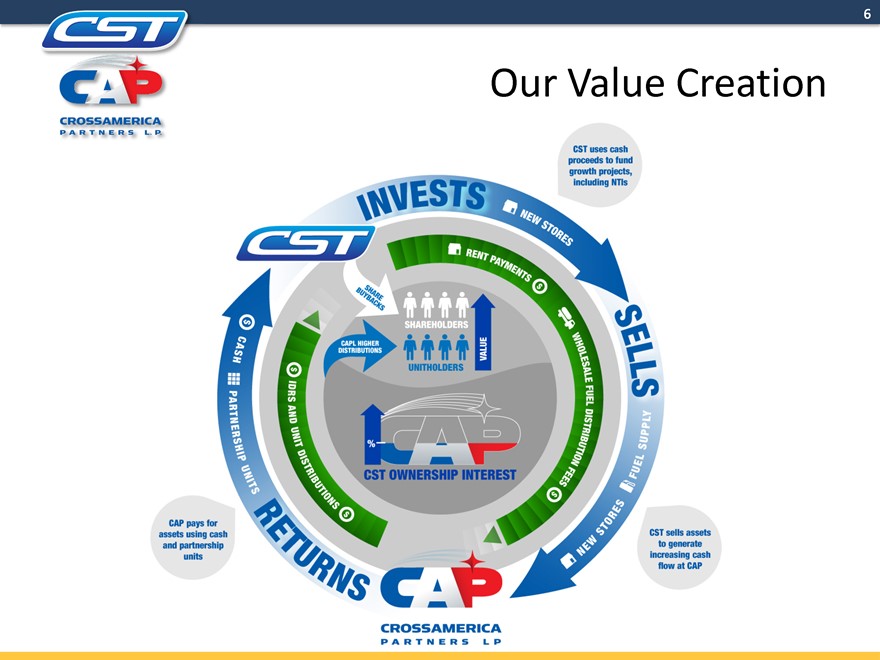
CST CAP CROSSAMERICA PARTNERS L. P. 6 Our Value Creation SELLS CAP INVESTS CST RENT PAYMENTS NEW STORES
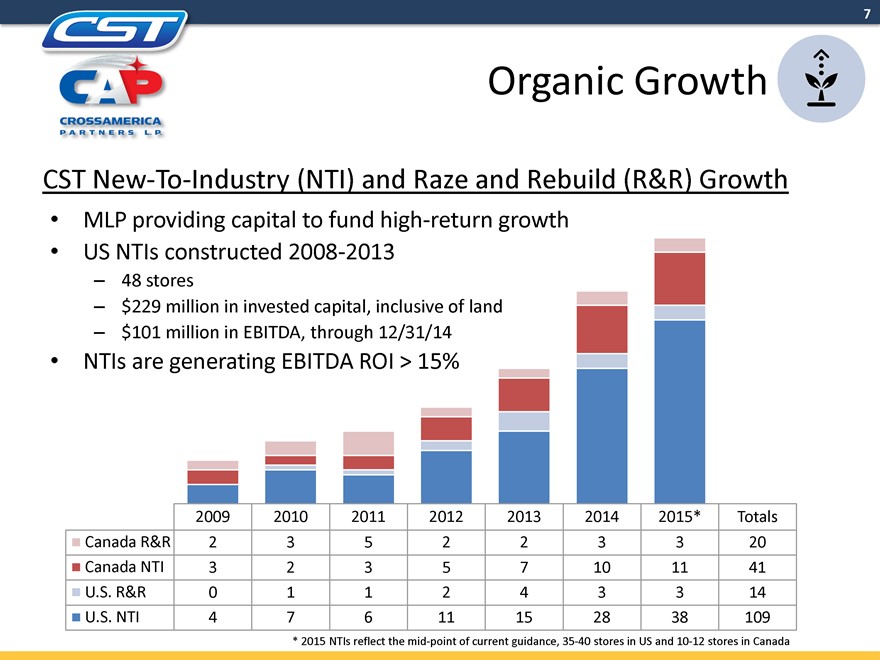
CST CAP CROSSAMERICA PARTNERS L. P. 7 Organic Growth CST New-To-Industry (NTI) and Raze and Rebuild (R&R) Growth • MLP providing capital to fund high-return growth • US NTIs constructed 2008-2013 – 48 stores – $229 million in invested capital, inclusive of land – $101 million in EBITDA, through 12/31/14 • NTIs are generating EBITDA ROI > 15% 2009 2010 2011 2012 2013 2014 2015* Totals Canada R&R 2 3 5 2 2 3 3 20 Canada NTI 3 2 3 5 7 10 11 41 U.S. R&R 0 1 1 2 4 3 3 14 U.S. NTI 4 7 6 11 15 28 38 109 * 2015 NTIs reflect the mid-point of current guidance, 35-40 stores in US and 10-12 stores in Canada
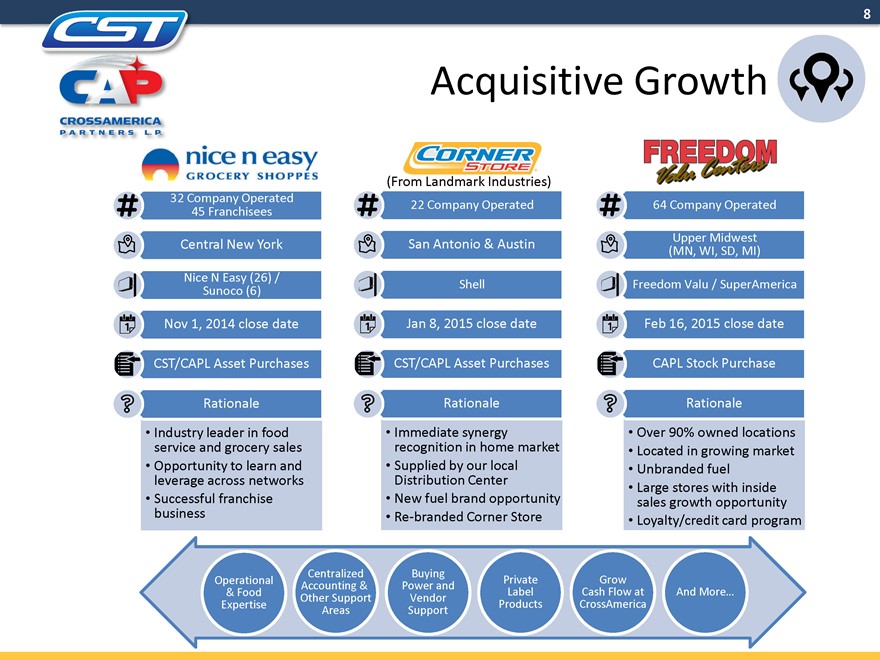
CST CAP CROSSAMERICA PARTNERS L. P. 8 Acquisitive Growth (From Landmark Industries) 32 Company Operated 22 Company Operated 64 Company Operated 45 Franchisees Central New York San Antonio & Austin (MN, Upper WI, Midwest SD, MI) Nice N Easy (26) / Shell Freedom Valu / SuperAmerica Sunoco (6) Nov 1, 2014 close date Jan 8, 2015 close date Feb 16, 2015 close date CST/CAPL Asset Purchases CST/CAPL Asset Purchases CAPL Stock Purchase Rationale Rationale Rationale •Industry leader in food •Immediate recognition synergy in home market •Over 90% owned locations service and grocery sales •Located in growing market •Opportunity to learn and •Distribution Supplied by our Center local •Unbranded fuel leverage across networks •Large stores with inside •Successful franchise •New fuel brand opportunity sales growth opportunity business •Re-branded Corner Store •Loyalty/credit card program Centralized Buying Operational Private Grow Accounting & Power and & Food Label Cash Flow at And More… Other Support Vendor Expertise Products CrossAmerica Areas Support
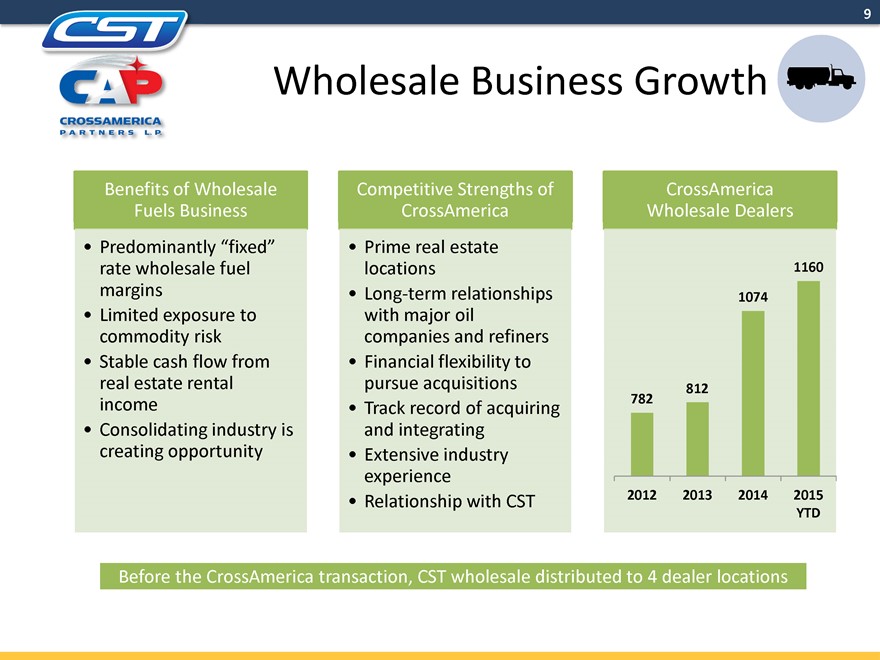
CST CAP CROSSAMERICA PARTNERS L. P. 9 Wholesale Business Growth Benefits of Wholesale Competitive Strengths of CrossAmerica Fuels Business CrossAmerica Wholesale Dealers • Predominantly “fixed” • Prime real estate rate wholesale fuel locations 1160 margins • Long-term relationships 1074 • Limited exposure to with major oil commodity risk companies and refiners • Stable cash flow from • Financial flexibility to real estate rental pursue acquisitions 782 812 income • Track record of acquiring • Consolidating industry is and integrating creating opportunity • Extensive industry experience • Relationship with CST 2012 2013 2014 2015 YTD Before the CrossAmerica transaction, CST wholesale distributed to 4 dealer locations
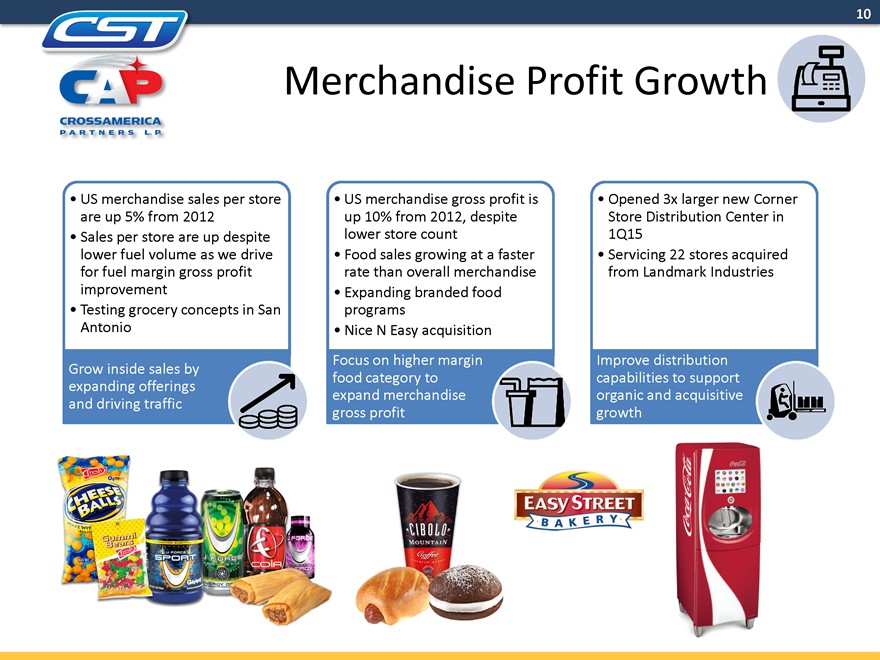
CST CAP CROSSAMERICA PARTNERS L. P. 10 Merchandise Profit Growth •US merchandise sales per store •US merchandise gross profit is •Opened 3x larger new Corner are up 5% from 2012 up 10% from 2012, despite Store Distribution Center in •Sales per store are up despite lower store count 1Q15 lower fuel volume as we drive •Food sales growing at a faster •Servicing 22 stores acquired for fuel margin gross profit rate than overall merchandise from Landmark Industries improvement •Expanding branded food •Testing grocery concepts in San programs Antonio •Nice N Easy acquisition Focus on higher margin Improve distribution Grow inside sales by food category to capabilities to support expanding offerings expand merchandise organic and acquisitive and driving traffic gross profit growth CHESS BALLS EASY STREET BAKERY
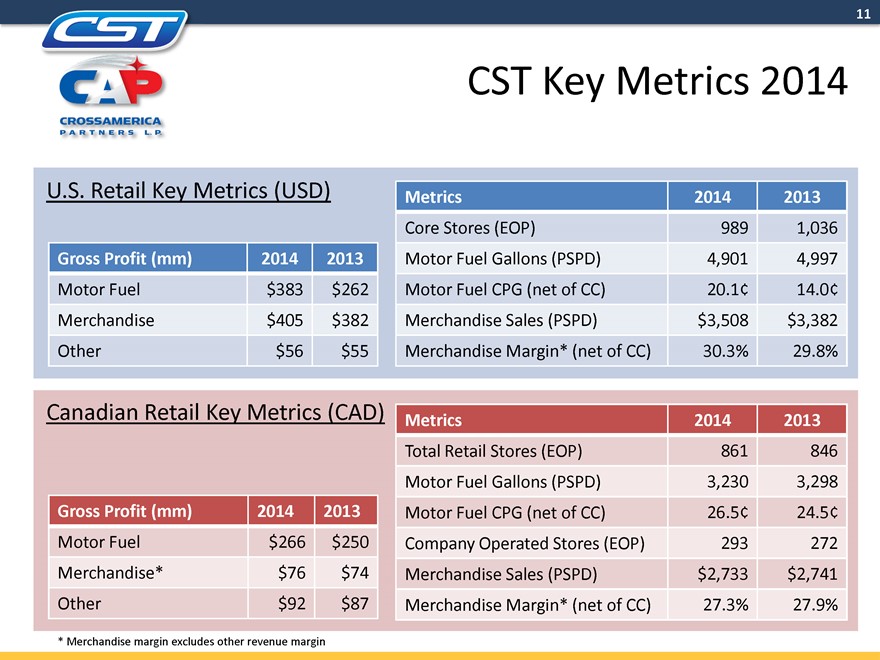
CST CAP CROSSAMERICA PARTNERS L. P. 11 CST Key Metrics 2014 U.S. Retail Key Metrics (USD) Metrics 2014 2013 Core Stores (EOP) 989 1,036 Gross Profit (mm) 2014 2013 Motor Fuel Gallons (PSPD) 4,901 4,997 Motor Fuel $383 $262 Motor Fuel CPG (net of CC) 20.1¢ 14.0¢ Merchandise $405 $382 Merchandise Sales (PSPD) $3,508 $3,382 Other $56 $55 Merchandise Margin* (net of CC) 30.3% 29.8% Canadian Retail Key Metrics (CAD) Metrics 2014 2013 Total Retail Stores (EOP) 861 846 Motor Fuel Gallons (PSPD) 3,230 3,298 Gross Profit (mm) 2014 2013 Motor Fuel CPG (net of CC) 26.5¢ 24.5¢ Motor Fuel $266 $250 Company Operated Stores (EOP) 293 272 Merchandise* $76 $74 Merchandise Sales (PSPD) $2,733 $2,741 Other $92 $87 Merchandise Margin* (net of CC) 27.3% 27.9% * Merchandise margin excludes other revenue margin
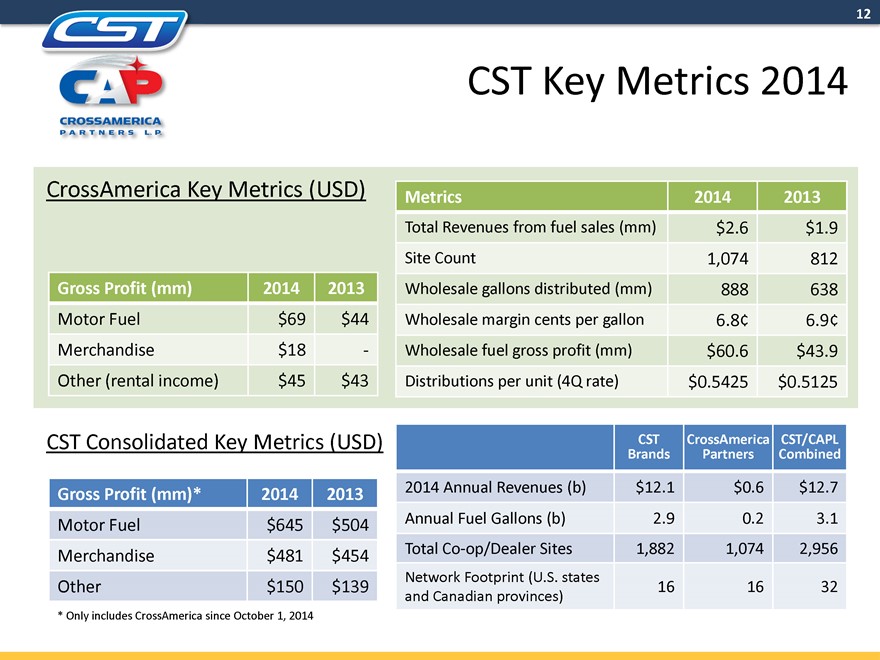
12 CST CAP CROSSAMERICA PARTNERS L. P. CST Key Metrics 2014 CrossAmerica Key Metrics (USD) Metrics 2014 2013 Total Revenues from fuel sales (mm) $2.6 $1.9 Site Count 1,074 812 Gross Profit (mm) 2014 2013 Wholesale gallons distributed (mm) 888 638 Motor Fuel $69 $44 Wholesale margin cents per gallon 6.8¢ 6.9¢ Merchandise $18 - Wholesale fuel gross profit (mm) $60.6 $43.9 Other (rental income) $45 $43 Distributions per unit (4Q rate) $0.5425 $0.5125 CST Consolidated Key Metrics (USD) Brands CST CrossAmerica Partners Combined CST/CAPL Gross Profit (mm)* 2014 2013 2014 Annual Revenues (b) $12.1 $0.6 $12.7 Motor Fuel $645 $504 Annual Fuel Gallons (b) 2.9 0.2 3.1 Merchandise $481 $454 Total Co-op/Dealer Sites 1,882 1,074 2,956 Network Footprint (U.S. states Other $150 $139 16 16 32 and Canadian provinces) * Only includes CrossAmerica since October 1, 2014
13 CST CAP CROSSAMERICA PARTNERS L. P. CST Delight More Customers Everyday
14 CST CAP CROSSAMERICA PARTNERS L. P. Appendix
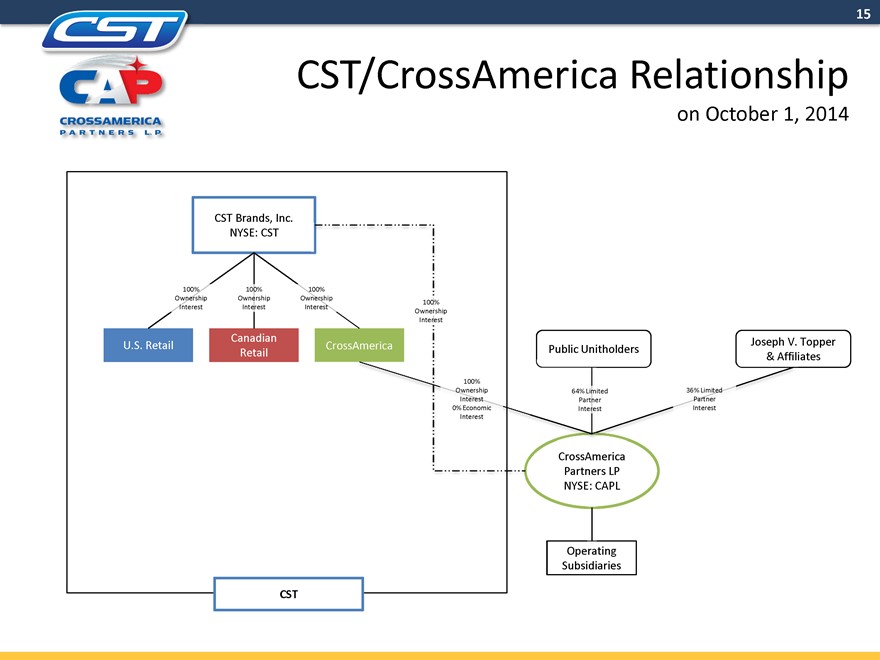
15 CST CAP CROSSAMERICA PARTNERS L. P. CST/CrossAmerica Relationship on October 1, 2014 CST Brands, Inc. NYSE: CST 100% 100% 100% Ownership Ownership Ownership 100% Interest Interest Interest Ownership Interest Canadian Joseph V. Topper U.S. Retail Public Unitholders Retail & Affiliates 100% Ownership 64% Limited 36% Limited Interest Partner Partner 0% Economic Interest Interest Interest CrossAmerica Partners LP NYSE: CAPL Operating Subsidiaries CST
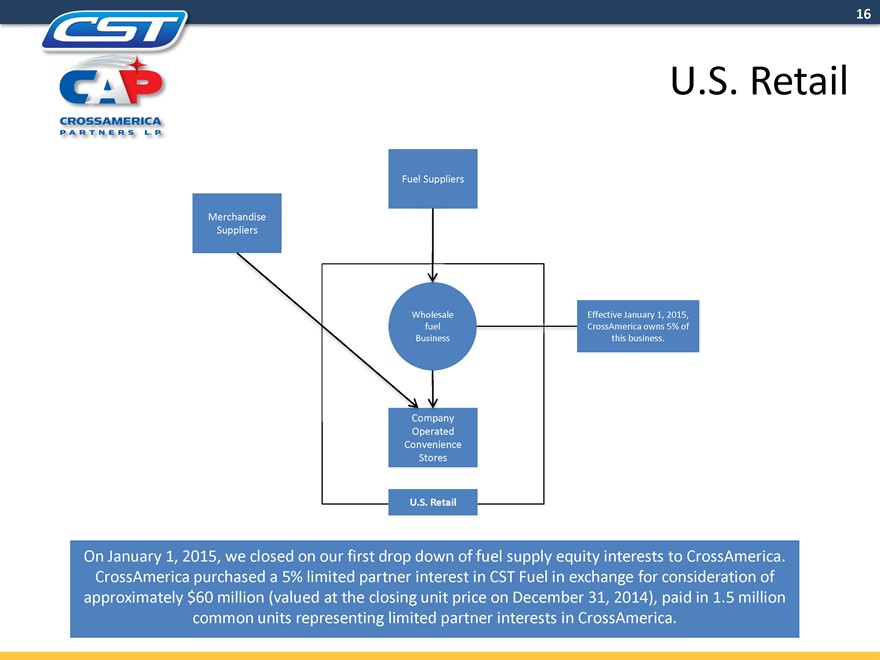
16 CST CAP CROSSAMERICA PARTNERS L. P. U.S. Retail Fuel Suppliers Merchandise Suppliers olesale Effective January 1, 2015, el CrossAmerica owns 5% of ness this business. y Operated Convenience Stores U.S. Retail On January 1, 2015, we closed on our first drop down of fuel supply equity interests to CrossAmerica. CrossAmerica purchased a 5% limited partner interest in CST Fuel in exchange for consideration of approximately $60 million (valued at the closing unit price on December 31, 2014), paid in 1.5 million common units representing limited partner interests in CrossAmerica.
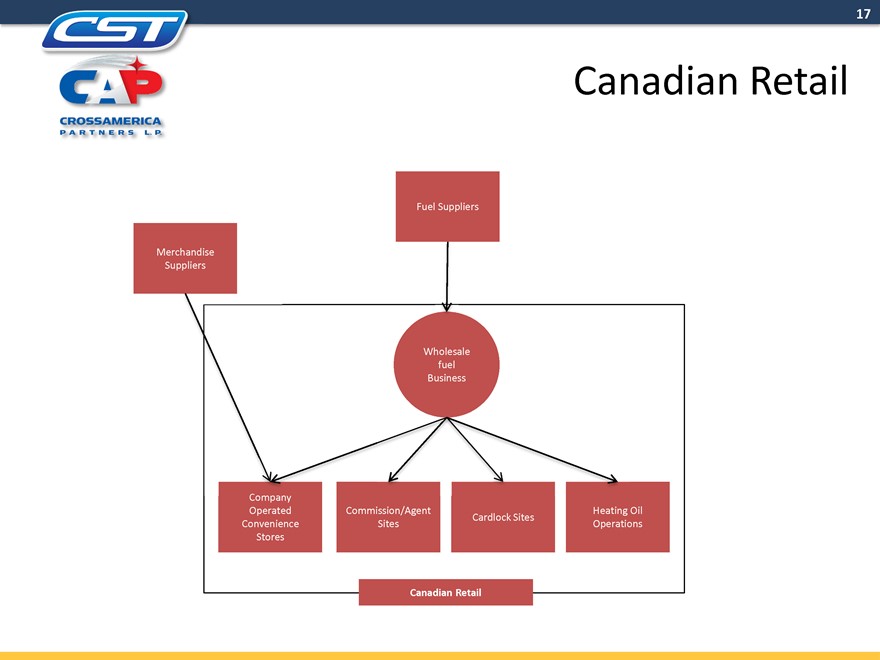
CST CAP CROSSAMERICA PARTNERS L. P. 17 Canadian Retail Fuel Suppliers Merchandise Suppliers Wholesale fuel Business Operated Commission/Agent Heating Oil Cardlock Sites Convenience Sites Operations Stores Canadian Retail
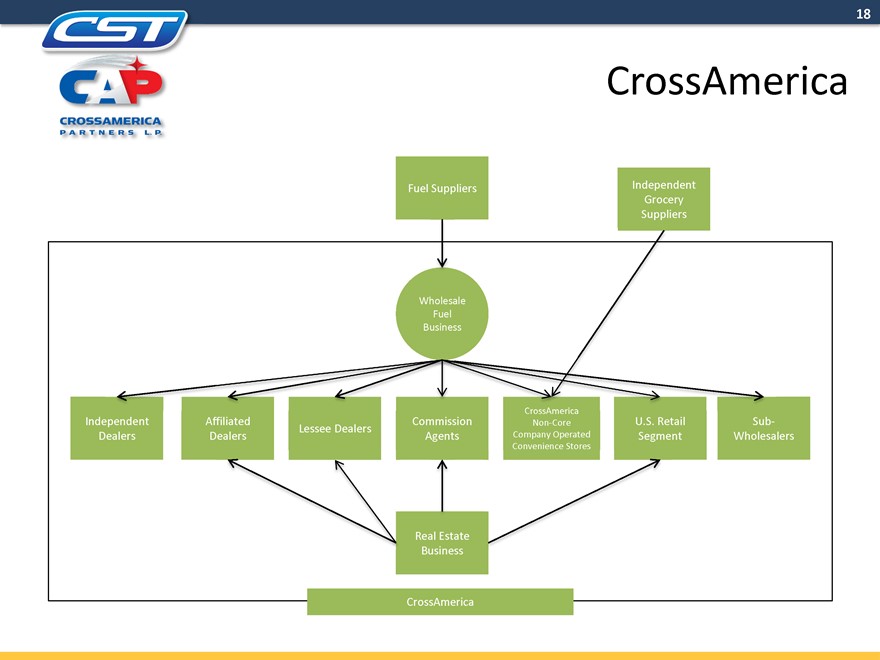
CST CAP CROSSAMERICA PARTNERS L. P. 18 CrossAmerica Fuel Suppliers Independent Grocery Suppliers Wholesale Fuel Business Independent Affiliated Commission Non-Core U.S. Retail Sub-Lessee Dealers Dealers Dealers Agents Company Operated Segment Wholesalers Convenience Stores Real Estate Business CrossAmerica
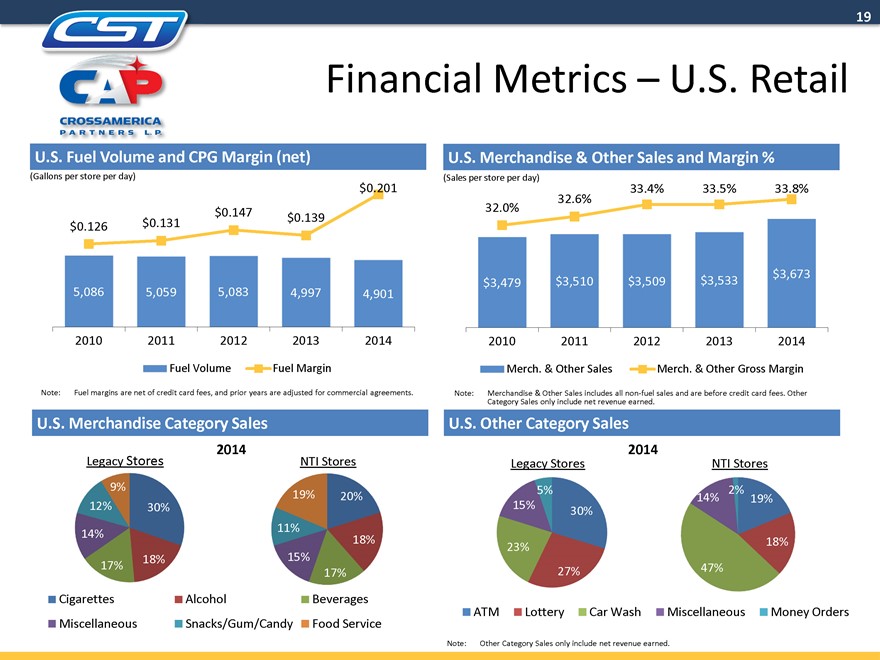
CST CAP CROSSAMERICA PARTNERS L. P. 19 Financial Metrics – U.S. Retail U.S. Fuel Volume and CPG Margin (net) U.S. Merchandise & Other Sales and Margin % (Gallons per store per day) $0.201 (Sales per store per day) 33.4% 33.5% 33.8% 32.6% $0.147 32.0% $0.131 $0.139 $0.126 $3,533 $3,673 $3,479 $3,510 $3,509 5,086 5,059 5,083 4,997 4,901 2010 2011 2012 2013 2014 2010 2011 2012 2013 2014 Fuel Volume Fuel Margin Merch. & Other Sales Merch. & Other Gross Margin Note: Fuel margins are net of credit card fees, and prior years are adjusted for commercial agreements. Note: Merchandise & Other Sales includes all non-fuel sales and are before credit card fees. Other Category Sales only include net revenue earned. U.S. Merchandise Category Sales U.S. Other Category Sales 2014 2014 Legacy Stores NTI Stores Legacy Stores NTI Stores 9% 5% 2% 19% 20% 14% 19% 12% 30% 15% 30% 14% 11% 18% 18% 23% 18% 15% 17% 27% 47% 17% Cigarettes Alcohol Beverages ATM Lottery Car Wash Miscellaneous Money Orders Miscellaneous Snacks/Gum/Candy Food Service Note: Other Category Sales only include net revenue earned.
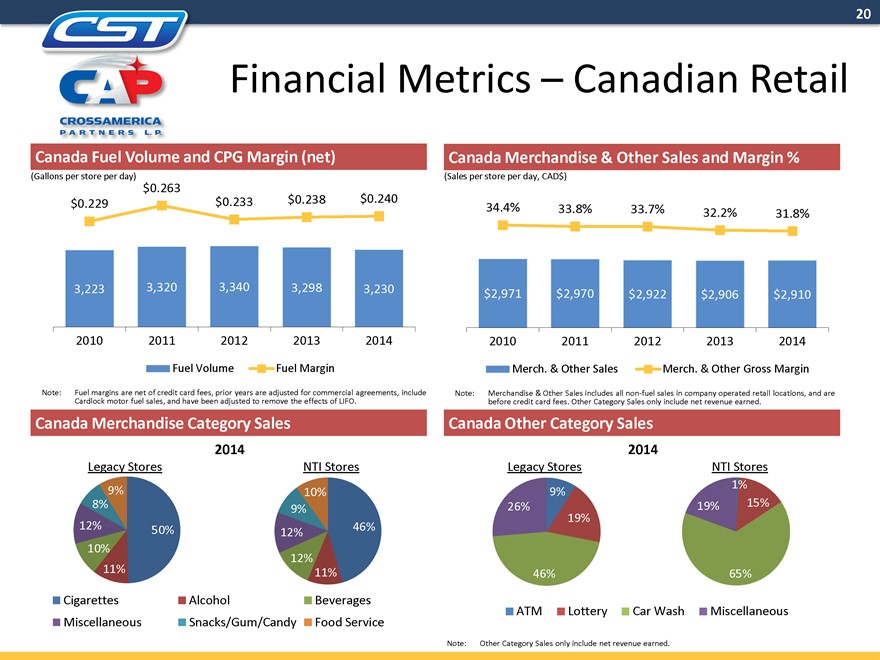
CST CAP CROSSAMERICA PARTNERS L. P. 20 Financial Metrics – Canadian Retail Canada Fuel Volume and CPG Margin (net) Canada Merchandise & Other Sales and Margin % (Gallons per store per day) $0.263 (Sales per store per day, CAD$) $0.229 $0.233 $0.238 $0.240 34.4% 33.8% 33.7% 32.2% 31.8% 3,223 3,320 3,340 3,298 3,230 $2,971 $2,970 $2,922 $2,906 $2,910 2010 2011 2012 2013 2014 2010 2011 2012 2013 2014 Fuel Volume Fuel Margin Merch. & Other Sales Merch. & Other Gross Margin Note: Cardlock Fuel margins motor are fuel net sales, of credit and card have fees, been prior adjusted years to are remove adjusted the for effects commercial of LIFO. agreements, include Note: Merchandise & Other Sales includes all non-fuel sales in company operated retail locations, and are before credit card fees. Other Category Sales only include net revenue earned. Canada Merchandise Category Sales Canada Other Category Sales 2014 2014 Legacy Stores NTI Stores Legacy Stores NTI Stores 9% 1% 10% 9% 8% 26% 19% 15% 9% 19% 12% 50% 46% 12% 10% 12% 11% 11% 46% 65% Cigarettes Alcohol Beverages ATM Lottery Car Wash Miscellaneous Miscellaneous Snacks/Gum/Candy Food Service Note: Other Category Sales only include net revenue earned.
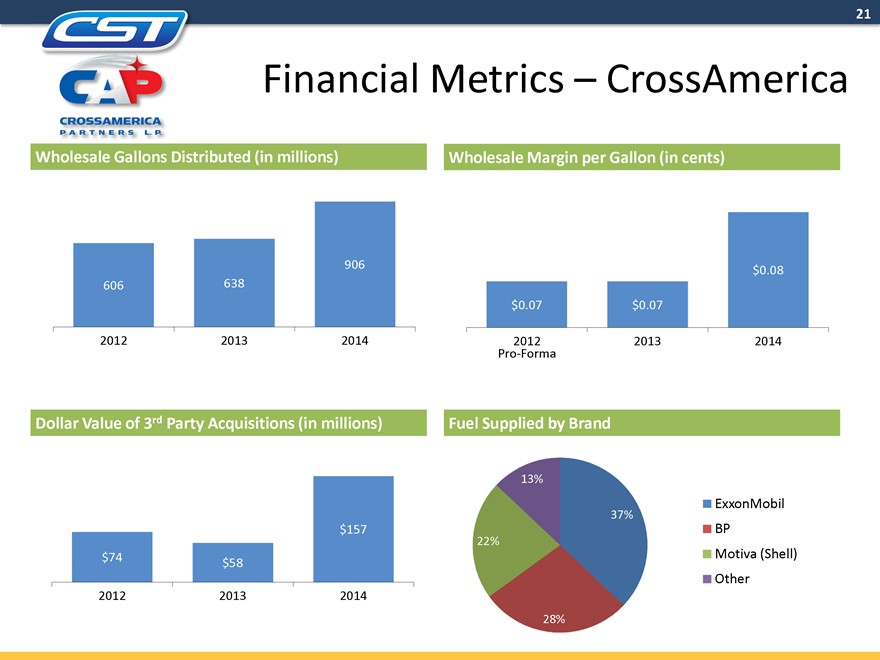
CST CAP CROSSAMERICA PARTNERS L. P. 21 Financial Metrics – CrossAmerica Wholesale Gallons Distributed (in millions) Wholesale Margin per Gallon (in cents) 906 $0.08 606 638 $0.07 $0.07 2012 2013 2014 Pro-Forma 2012 2013 2014 Dollar Value of 3rd Party Acquisitions (in millions) Fuel Supplied by Brand 13% ExxonMobil 37% BP $157 22% $74 Motiva (Shell) $58 Other 2012 2013 2014 28%
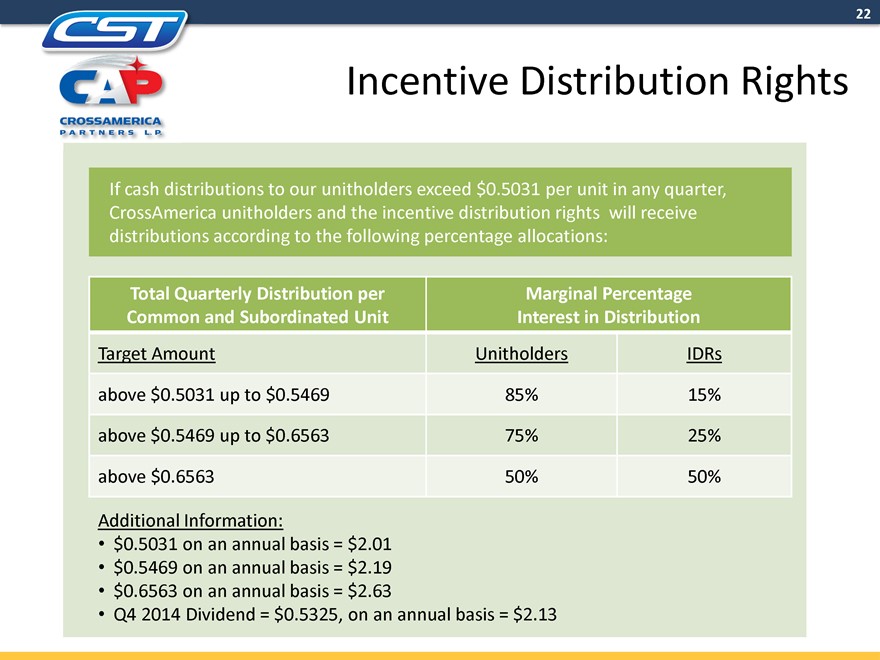
CST CAP CROSSAMERICA PARTNERS L. P. 22 Incentive Distribution Rights If cash distributions to our unitholders exceed $0.5031 per unit in any quarter, CrossAmerica unitholders and the incentive distribution rights will receive distributions according to the following percentage allocations: Total Quarterly Distribution per Marginal Percentage Common and Subordinated Unit Interest in Distribution Target Amount Unitholders IDRs above $0.5031 up to $0.5469 85% 15% above $0.5469 up to $0.6563 75% 25% above $0.6563 50% 50% Additional Information: • $0.5031 on an annual basis = $2.01 • $0.5469 on an annual basis = $2.19 • $0.6563 on an annual basis = $2.63 • Q4 2014 Dividend = $0.5325, on an annual basis = $2.13
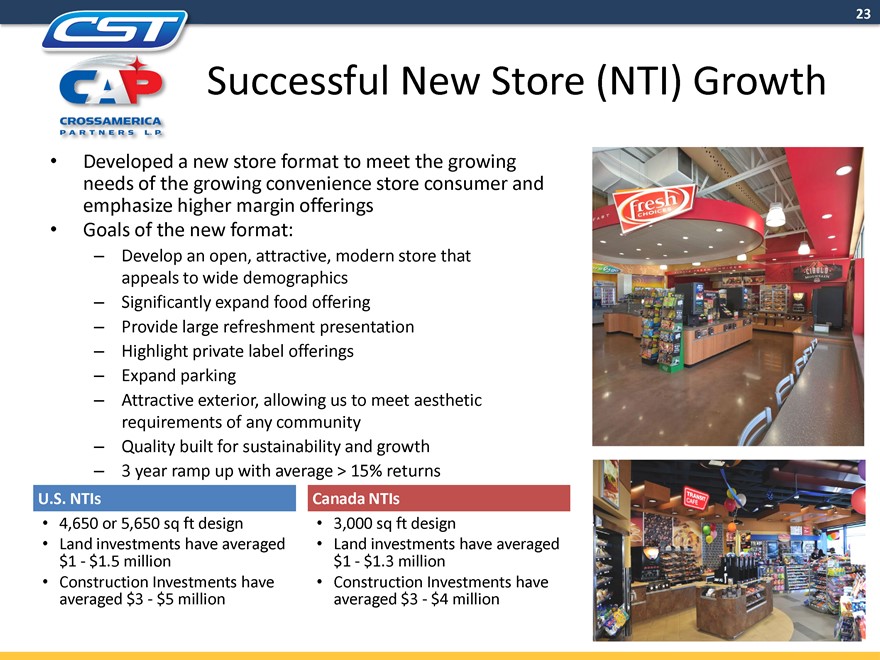
CST CAP CROSSAMERICA PARTNERS L. P. 23 Successful New Store (NTI) Growth • Developed a new store format to meet the growing needs of the growing convenience store consumer and emphasize higher margin offerings • Goals of the new format: – Develop an open, attractive, modern store that appeals to wide demographics – Significantly expand food offering – Provide large refreshment presentation – Highlight private label offerings – Expand parking – Attractive exterior, allowing us to meet aesthetic requirements of any community – Quality built for sustainability and growth – 3 year ramp up with average > 15% returns U.S. NTIs Canada NTIs • 4,650 or 5,650 sq ft design • 3,000 sq ft design • Land investments have averaged • Land investments have averaged $1 - $1.5 million $1 - $1.3 million • averaged Construction $3 - Investments $5 million have • averaged Construction $3 - Investments $4 million have averaged $3 - $4 million