Attached files
SECURITIES AND EXCHANGE COMMISSION
Washington, D.C. 20549
FORM 10-K
(Mark One)
|
☒ |
ANNUAL REPORT PURSUANT TO SECTION 13 OR 15(d) OF THE SECURITIES EXCHANGE ACT OF 1934 |
For the fiscal year ended December 31, 2014
|
☐ |
TRANSITION REPORT PURSUANT TO SECTION 13 OR 15(d) OF THE SECURITIES EXCHANGE ACT OF 1934 |
For the transition period from to
Commission file number 001-16317
CONTANGO OIL & GAS COMPANY
(Exact name of registrant as specified in its charter)
|
|
||
|
|
|
|
|
Delaware |
|
95-4079863 |
|
(State or other jurisdiction of incorporation or organization) |
|
(IRS Employer Identification No.) |
717 Texas Avenue, Suite 2900
Houston, Texas 77002
(Address of principal executive offices)
(713) 236-7400
(Registrant’s telephone number, including area code)
Securities registered pursuant to Section 12(b) of the Act:
|
|
||
|
|
|
|
|
Title of each class |
|
Name of exchange on which registered |
|
Common Stock, Par Value $0.04 per share |
|
NYSE MKT |
Securities registered pursuant to Section 12(g) of the Act: None
Indicate by check mark if the registrant is a well-known seasoned issuer, as defined in Rule 405 of the Securities Act. Yes ☒ No ☐
Indicate by check mark if the registrant is not required to file reports pursuant to Section 13 or Section 15(d) of the Act. Yes ☐ No ☒
Indicate by check mark whether the registrant (1) has filed all reports required to be filed by Section 13 or 15(d) of the Securities Exchange Act of 1934 during the preceding 12 months (or for such shorter period that the registrant was required to file such reports), and (2) has been subject to such filing requirements for the past 90 days. Yes ☒ No ☐
Indicate by check mark whether the registrant has submitted electronically and posted on its corporate Web site, if any, every Interactive Data File required to be submitted and posted pursuant to Rule 405 of Regulation S-T (§ 232.405 of this chapter) during the preceding 12 months (or for such shorter period that the registrant was required to submit and post such files). Yes ☒ No ☐
Indicate by check mark if disclosure of delinquent filers pursuant to Item 405 of Regulation S-K is not contained herein, and will not be contained, to the best of registrant’s knowledge, in definitive proxy or information statements incorporated by reference in Part III of this Form 10-K or any amendment to this Form 10-K. ☒
Indicate by check mark whether the registrant is a large accelerated filer, an accelerated filer, a non-accelerated filer, or a smaller reporting company. See the definitions of “large accelerated filer,” “accelerated filer” and “smaller reporting company” in Rule 12b-2 of the Exchange Act. (Check one):
|
Large accelerated filer ☐ |
Accelerated filer ☒ |
Non-accelerated filer ☐ |
Smaller reporting company ☐ |
|
|
|
(Do not check if smaller reporting company) |
|
Indicate by check mark whether the registrant is a shell company (as defined in Rule 12b-2 of the Exchange Act). Yes ☐ No ☒
At June 30, 2014, the aggregate market value of the registrant’s common stock held by non-affiliates (based upon the closing sale price of shares of such common stock as reported on the NYSE MKT, was $618 million. As of February 27, 2015, there were 19,155,847 shares of the registrant’s common stock outstanding.
Documents Incorporated by Reference
Items 10, 11, 12, 13 and 14 of Part III have been omitted from this report since the registrant will file with the Securities and Exchange Commission, not later than 120 days after the close of its fiscal year, a definitive proxy statement, pursuant to Regulation 14A. The information required by Items 10, 11, 12, 13 and 14 of this report, which will appear in the definitive proxy statement, is incorporated by reference into this Form 10-K.
CONTANGO OIL & GAS COMPANY AND SUBSIDIARIES
ANNUAL REPORT ON FORM 10-K FOR THE FISCAL YEAR ENDED DECEMBER 31, 2014
TABLE OF CONTENTS
|
|
|
|
|
|
|
|||
|
|
|
Page |
|
|
|
PART I |
|
|
| 1 | |||
|
|
1 | ||
|
|
2 | ||
|
|
3 | ||
|
|
7 | ||
|
|
7 | ||
|
|
7 | ||
|
|
8 | ||
|
|
8 | ||
|
|
9 | ||
|
|
16 | ||
|
|
17 | ||
|
|
18 | ||
|
|
18 | ||
|
|
18 | ||
|
|
18 | ||
|
|
18 | ||
| 18 | |||
| 34 | |||
| 35 | |||
|
|
35 | ||
|
|
35 | ||
|
|
35 | ||
|
|
36 | ||
|
|
37 | ||
|
|
37 | ||
|
|
37 | ||
|
|
39 | ||
|
|
40 | ||
|
|
40 | ||
|
|
41 | ||
| 42 | |||
| 43 | |||
|
|
|
|
|
|
|
PART II |
|
|
| 44 | |||
|
|
44 | ||
|
|
45 | ||
|
|
46 | ||
|
|
46 | ||
|
|
47 | ||
| 48 | |||
ii
iii
CAUTIONARY STATEMENT ABOUT FORWARD-LOOKING STATEMENTS
Certain statements contained in this report may contain “forward-looking statements” within the meaning of Section 27A of the Securities Act of 1933, and Section 21E of the Securities Exchange Act of 1934, as amended. The words and phrases “should be”, “will be”, “believe”, “expect”, “anticipate”, “estimate”, “forecast”, “goal” and similar expressions identify forward-looking statements and express our expectations about future events. Although we believe the expectations reflected in such forward-looking statements are reasonable, such expectations may not occur. These forward-looking statements are made subject to certain risks and uncertainties that could cause actual results to differ materially from those stated. Risks and uncertainties that could cause or contribute to such differences include, without limitation, those discussed in the section entitled “Risk Factors” included in this report and those factors summarized below:
|
· |
our financial position; |
|
· |
our business strategy, including outsourcing; |
|
· |
meeting our forecasts and budgets; |
|
· |
expectations regarding natural gas and oil markets in the United States; |
|
· |
natural gas and oil price volatility; |
|
· |
operational constraints, start-up delays and production shut-ins at both operated and non-operated production platforms, pipelines and natural gas processing facilities; |
|
· |
the risks associated with acting as operator of deep high pressure and high temperature wells, including well blowouts and explosions; |
|
· |
the risks associated with exploration, including cost overruns and the drilling of non-economic wells or dry holes, especially in prospects in which we have made a large capital commitment relative to the size of our capitalization structure; |
|
· |
the timing and successful drilling and completion of natural gas and oil wells; |
|
· |
availability of capital and the ability to repay indebtedness when due; |
|
· |
availability and cost of rigs and other materials and operating equipment; |
|
· |
timely and full receipt of sale proceeds from the sale of our production; |
|
· |
the ability to find, acquire, market, develop and produce new natural gas and oil properties; |
|
· |
interest rate volatility; |
|
· |
uncertainties in the estimation of proved reserves and in the projection of future rates of production and timing of development expenditures; |
|
· |
operating hazards attendant to the natural gas and oil business including weather, environmental risks, accidental spills, blowouts and pipeline ruptures, and other risks; |
|
· |
downhole drilling and completion risks that are generally not recoverable from third parties or insurance; |
|
· |
potential mechanical failure or under-performance of significant wells, production facilities, processing plants or pipeline mishaps; |
|
· |
actions or inactions of third-party operators of our properties; |
|
· |
actions or inactions of third-party operators of pipelines or processing facilities; |
|
· |
the ability to find and retain skilled personnel; |
|
· |
strength and financial resources of competitors; |
|
· |
federal and state legislative and regulatory developments and approvals; |
|
· |
worldwide economic conditions; |
|
· |
the ability to construct and operate infrastructure, including pipeline and production facilities; |
iv
|
· |
the continued compliance by us with various pipeline and gas processing plant specifications for the gas and condensate produced by us; |
|
· |
operating costs, production rates and ultimate reserve recoveries of our natural gas and oil discoveries; |
|
· |
expanded rigorous monitoring and testing requirements; and |
|
· |
ability to obtain insurance coverage on commercially reasonable terms. |
Any of these factors and other factors contained in this report could cause our actual results to differ materially from the results implied by these or any other forward-looking statements made by us or on our behalf. Although we believe our estimates and assumptions to be reasonable, they are inherently uncertain and involve a number of risks and uncertainties that are beyond our control. Our assumptions about future events may prove to be inaccurate. We caution you that the forward-looking statements contained in this report are not guarantees of future performance, and we cannot assure you that those statements will be realized or the forward-looking events and circumstances will occur. All forward-looking statements speak only as of the date of this report.
Reserve engineering is a process of estimating underground accumulations of oil, natural gas and natural gas liquids that cannot be measured in an exact way. The accuracy of any reserve estimate depends on the quality of available data, the interpretation of such data and price and cost assumptions made by reserve engineers. In addition, the results of drilling, testing and production activities may justify revisions of estimates that were made previously. If significant, such revisions would change the schedule of any further production and development drilling. Accordingly, reserve estimates may differ significantly from the quantities of oil, natural gas and natural gas liquids that are ultimately recovered.
All forward-looking statements, expressed or implied, in this report are expressly qualified in their entirety by this cautionary statement. This cautionary statement should also be considered in connection with any subsequent written or oral forward-looking statements that we or person acting on our behalf may issue.
We do not intend to publicly update or revise any forward-looking statements as a result of new information, future events or otherwise, except as required by law. These cautionary statements qualify all forward-looking statements attributable to us or persons acting on our behalf.
All references in this Form 10-K to the “Company”, “Contango”, “we”, “us” or “our” are to Contango Oil & Gas Company and wholly-owned subsidiaries. Unless otherwise noted, all information in this Form 10-K relating to natural gas and oil reserves and the estimated future net cash flows attributable to those reserves is based on estimates prepared by independent engineers, and is net to our interest.
v
PART I
We are a Houston, Texas based independent energy company engaged in the acquisition, exploration, development, exploitation and production of crude oil and natural gas properties offshore in the shallow waters of the Gulf of Mexico (“GOM”) and in the onshore Texas Gulf Coast and Rocky Mountain regions of the United States.
On October 1, 2013, we completed a merger with Crimson Exploration Inc. (“Crimson”), in an all-stock transaction pursuant to which Crimson became a wholly-owned subsidiary of Contango (the “Merger"). Accordingly, we issued approximately 3.9 million shares of common stock in exchange for all of Crimson's outstanding capital stock, resulting in Crimson stockholders owning 20.3% of the post-Merger Contango. The Company has its headquarters and principal corporate office in Houston, Texas.
On October 1, 2013, our Board of Directors approved a change in fiscal year end from June 30 to December 31. On March 3, 2014, we filed a Transition Report on Form 10-KT which covered the transition period of July 1, 2013 through December 31, 2013, which included six months of Contango activity (July - December) and three months of post-Merger Crimson activity (October - December). Also, on March 28, 2014 we filed an Annual Report on Form 10-K/A to present the financial statements of the Company on a calendar year basis which included the twelve months ended December 31, 2013 and 2012. This Annual report on Form 10-K presents our information for the twelve-month periods ended December 31, 2014, 2013 and 2012. Unless otherwise noted, all references to "years" in this report refer to the twelve-month periods ended December 31 of each year.
We have historically focused our operations in the GOM, but our merger with Crimson has given us access to lower risk, long life, onshore resource plays. In 2014, our drilling activity focused primarily on the Woodbine oil and liquids-rich play in Madison and Grimes counties, Texas (our Southeast Texas Region), on the Buda Limestone oil and liquids-rich play in Zavala and Dimmit counties, Texas (our South Texas Region), in the Cretaceous Sands in Fayette and Gonzales counties, Texas (also in our South Texas Region) and the late 2014/early 2015 commencement of drilling in Wyoming where we are targeting the Mowry Shale and the Muddy Sandstone formations. We believe these areas provide long-term growth potential from multiple formations that we believe to be productive for oil and natural gas.
Additionally, we have (i) a 37% equity investment in Exaro Energy III LLC (“Exaro”) that is primarily focused on the development of proved natural gas reserves in the Jonah Field in Wyoming; (ii) leasehold positions and minor non-operated producing properties in Louisiana and Mississippi targeting the Tuscaloosa Marine Shale (“TMS”); (iii) operated properties producing from various conventional formations in various counties along the Texas Gulf Coast; (iv) operated producing properties in the Denver Julesburg Basin (“DJ Basin”) in Weld and Adams counties in Colorado, which we believe may also be prospective in the Niobrara Shale oil play; (v) operated producing properties in the Haynesville Shale, Mid Bossier and James Lime formations in East Texas; and (vi) six exploratory prospects in the shallow waters of the GOM.
Our production for the year ended December 31, 2014 was approximately 40.3 Bcfe (or 110.5 Mmcfed), was 61% from our offshore properties and was 64% natural gas. Our production for the three months ended December 31, 2014 was approximately 9.8 Bcfe (or 106.2 Mmcfed), was 64% from our offshore properties and was 68% natural gas. As of December 31, 2014, our proved reserves were approximately 76% proved developed, were 52% offshore, were 65% natural gas and were 96% attributed to wells and properties operated by us.
As of December 31, 2014, our proved reserves, as estimated by Netherland, Sewell & Associates, Inc. (“NSAI”) and William M. Cobb and Associates (“Cobb”), our independent petroleum engineering firms for our onshore and offshore properties, respectively, in accordance with reserve reporting guidelines required by the Securities and Exchange Commission (“SEC”), were approximately 275.2 Bcfe, consisting of 179.7 Bcf of natural gas, 8.4 MMBbl of crude oil and condensate and 7.5 MMBbl of natural gas liquids (“NGLs”), with a present value, discounted at a 10% rate (PV‑10), of $796.9 million, and a Standardized Measure of Discounted Future Net Cash Flows (“Standardized Measure”) of $648.0 million. PV-10 is a non-GAAP financial measure. A reconciliation of our Standardized Measure to PV‑10 is provided under Item 2. Properties ‑ PV-10.
1
The following summary table sets forth certain information with respect to our proved reserves as of December 31, 2014 (excluding our reserves attributable to our investment in Exaro, as estimated by NSAI and Cobb) and our net average daily production for the year ended December 31, 2014:
|
Region |
Estimated Proved Reserves (Bcfe) |
% Crude Oil / Condensate |
% Natural Gas |
% Natural Gas Liquids |
% Proved Developed |
Average Daily Production (Mmcfe/d) |
||||||||||
|
Offshore GOM |
143.8 | 5 |
% |
80 |
% |
15 |
% |
100 |
% |
67.1 | ||||||
|
Southeast Texas |
63.8 | 43 |
% |
36 |
% |
21 |
% |
40 |
% |
25.9 | ||||||
|
South Texas |
54.8 | 23 |
% |
60 |
% |
17 |
% |
53 |
% |
14.5 | ||||||
|
Other (1) |
12.8 | 31 |
% |
63 |
% |
6 |
% |
33 |
% |
3.0 | ||||||
|
Total |
275.2 | 110.5 | ||||||||||||||
|
(1) |
East Texas, Mississippi, Louisiana, and Colorado |
Recently, our strategy has been to grow reserves and production by developing our existing property base, by utilizing our cash flow to drill selected high-potential Gulf of Mexico exploratory prospects, to exploit our lower-risk unproved oil and liquids resource potential in our onshore resource plays, and to pursue new onshore resource play opportunities organically, or through acquisition, that are complementary to our existing asset base. Due to the current low price environment, and the uncertainty for prices for the immediate future, our 2015 strategy will be to limit drilling to that which is necessary to fulfill commitments, preserve core acreage or test the geological viability of new plays or untested formations. Our priorities for 2015 will be to limit drilling until commodity prices improve and/or service costs decline, to preserve our healthy balance sheet by limiting capital expenditures to a level below cash flow, and to identify strategic opportunities for growth in this low price environment.
Specific key elements of our long-term business strategy have been:
|
· |
Enhance our portfolio by dedicating the majority of our drilling capital to our oil and liquids-rich opportunities. Due to the superior economics of oil production, as compared to natural gas, we have allocated the majority of our recent capital budget to oil and liquids-weighted opportunities as we strive to transition from a heavily weighted natural gas production profile to a more balanced reserve and production profile between oil/liquids and natural gas. Our long term strategy is to continue to develop the oil and natural gas liquids resource potential that we believe exists in numerous formations within our various oil/liquids weighted resource plays. |
|
· |
Pursue accretive, opportunistic acquisitions that meet our strategic and financial objectives. We intend to continue evaluating opportunistic acquisitions of crude oil and natural gas properties, both undeveloped and developed, in areas where we currently have a presence and/or specific operating expertise, and pursue sizable undeveloped acreage positions, at reasonable cost, in new areas that we feel have significant exploration, exploitation or operational upside. |
|
· |
Selectively exploit, under a higher commodity price environment, our existing onshore producing conventional natural gas property portfolio to generate additional cash flows. We believe our multi-year drilling inventory of exploitation opportunities on our existing onshore conventional natural gas oriented producing properties provides us with a solid, dependable platform for future reserve and production growth. We have 3D seismic data that covers substantially all of our Liberty County acreage in Southeast Texas, giving us a higher degree of confidence in the potential in this area. However, as a result of our desire to more extensively develop our resource plays, we do not expect to allocate significant drilling capital to further develop these assets in 2015. |
In 2014 specifically, we focused on our inventory of crude oil and liquids-rich projects with drilling programs in each of the Woodbine play in Madison and Grimes counties, Texas, the Buda play in Dimmit County, Texas and initiated drilling in our newly acquired acreage in the Fayette County, Texas, and Wyoming plays. We have developed a significant inventory of quality drilling opportunities on our existing property base that we believe should provide multiyear reserve growth.
2
Our 2015 Strategy
As a result of the dramatic downturn in crude oil, natural gas and natural gas liquids prices in 2014 and early 2015, the negative impact of those price declines on the economics of most domestic resource plays, and the continuing uncertainty as to when, or how much, the commodity price environment might improve, our capital expenditure program for 2015 is expected to be focused on: (i) the preservation of our strong and flexible financial position, including limiting our overall capital expenditure budget to no more than internally generated cash flow; (ii) focusing drilling expenditures on strategic projects; (iii) identification of opportunities for cost efficiencies in all areas of our operations; and (iv) continuing to identify and, when appropriate, pursue new resource potential opportunities, internally and through acquisition. Our current capital budget for 2015 should allow us to meet our contractual requirements, remain in position to preserve our term acreage where we deem appropriate and maintain our already strong financial profile. We will continuously monitor the commodity price environment, stability and forecast, and if warranted, make adjustments to our investment strategy as the year progresses.
We believe that a continuing low commodity price environment could put pressure on over-leveraged or under-funded oil and natural gas exploration and production companies to consider asset sales or strategic combinations. Should a complementary and accretive opportunity materialize, our strong financial profile, cash flow and liquidity should position us to capitalize on such an opportunity. Accordingly, we plan to closely monitor the industry to identify and evaluate appropriate acquisition opportunities. Our acquisition efforts will typically be focused on areas in which we can leverage our geographic and geological expertise, and where we can develop an inventory of additional drilling prospects that we believe will enable us to grow production and add reserves.
Properties
As of December 31, 2014, our offshore production consisted of seven federal and six State of Louisiana Company-operated wells in the shallow waters of the GOM. These 13 wells produce from four fields. The following summary table sets forth certain information with respect to our offshore reserves as of December 31, 2014 and average daily production for the year ended December 31, 2014:
|
Field |
Estimated Proved Reserves (Bcfe) |
% Crude Oil / Condensate |
% Natural Gas |
% Natural Gas Liquids |
% Proved Developed |
Average Daily Production (Mmcfe/d) |
||||||||||
|
Dutch and Mary Rose |
128.0 | 5 |
% |
80 |
% |
15 |
% |
100 |
% |
56.4 | ||||||
|
Vermilion 170 |
14.1 | 2 |
% |
82 |
% |
16 |
% |
100 |
% |
7.5 | ||||||
|
Other Offshore |
1.7 | 2 |
% |
97 |
% |
1 |
% |
100 |
% |
3.2 | ||||||
|
Total |
143.8 | 67.1 | ||||||||||||||
Dutch and Mary Rose Field
We operate five federal wells located at Eugene Island 10 (“Dutch”), and five state wells located in adjacent state of Louisiana waters (“Mary Rose”). These ten wells produce to a Company-owned and operated production platform at Eugene Island 11. While we do not own the lease for the Eugene Island 11 block, this does not impact our ability to operate our facilities located on that block. Operators in the GOM may place platforms and facilities on any location without having to own the lease, provided that permission and proper permits from the Bureau of Safety and Environmental Enforcement (“BSEE”) have been obtained. We have obtained such permission and permits. We installed our facilities at Eugene Island 11 because that was the optimal gathering location in proximity to our wells and marketing pipelines.
From our production platform we are able to access two separate markets which minimizes downtime risk and provides the ability for us to select the best sales price for our oil and natural gas production. Oil and natural gas production can flow via a TC Offshore (formerly ANR) pipeline to third-party owned and operated onshore processing facilities near Patterson, Louisiana. Alternatively, natural gas can flow to the American Midstream (Seacrest), LP pipeline via our 8” pipeline, which has been designed with a capacity of 80 Mmcfd, and from there to a third-party owned and operated onshore processing facility at Burns Point, Louisiana. Condensate can also flow via an ExxonMobil Pipeline Company pipeline to onshore markets and multiple refineries.
3
We installed a turbine type compressor of sufficient capacity, based on normal production decline rates, to ultimately service all ten Dutch and Mary Rose wells at the Eugene Island 11 platform in July 2014. As of December 31, 2014, we had incurred approximately $11.7 million to design, build and install the compressor. We started central compression at the platform during the third quarter of 2014.
In December 2013, we exercised a preferential right and purchased an additional 7.84% working interest and 6.53% net revenue interest in the five Company-operated Dutch wells from an independent oil and gas company for approximately $15 million, net after customary purchase price adjustments.
Vermilion 170 Field
We operate one well at Vermilion 170 which flows to a Company-owned and operated production platform at the same location. This platform services natural gas and condensate production, which flow via the Sea Robin Pipeline to a third-party owned and operated onshore processing plants. Based on production and decline rates, we designed, built and installed a compressor in 2013 at a cost of approximately $1.4 million. We anticipate commencing compression in late 2015 or early 2016.
In January 2013, sustained casing pressure was identified between the production tubing and the production casing at our Vermilion 170 well. Diagnostic tests revealed that the production tubing had parted downhole requiring a workover of the well. Well production was shut-in in January, and the original tubing and casing were successfully removed. Operations were conducted to replace the tubing and restore the well, which resumed production in June 2013. During December 2014, our Vermillion 170 well production was shut-in for fourteen days due to issues with the Sea Robin Pipeline.
Other Offshore
Our Ship Shoal 263 and South Timbalier 17 fields have been included in “Other Offshore." We operate one well at Ship Shoal 263, which produces to a Company-owned and operated production platform at the same location.
On April 29, 2014, we reached total depth on our Ship Shoal 255 prospect in the GOM, and no commercial hydrocarbons were found. As a result, for the twelve months ended December 31, 2014, we recognized $31.5 million in exploration expense for the cost of drilling the well plus $15.6 million in impairment expense associated with $3.5 million of leasehold costs and $12.1 million related to a platform located in Block Ship Shoal 263 that was expected to be used by the Ship Shoal 255 well had it been successful.
On July 30, 2013, we spud our South Timbalier 17 prospect in state of Louisiana offshore waters, and on August 22, 2013 we announced completion of a successful well at a total measured depth of approximately 11,400 feet. After we completed the well and laid flowlines to a third-party owned facility, we commenced production in July 2014. Our net costs incurred to drill, complete and bring this well on production were $15.9 million as of December 31, 2014. We have a 75% working interest (53.3% net revenue interest) before payout, and a 59.3% working interest (42.1% net revenue interest) after payout. In December 2014, due to the low price environment, the net book value of our South Timbalier 17 exceeded the future undiscounted cash flows associated with its recoverable reserves, and we recognized an impairment expense of approximately $7.7 million during the year ended December 31, 2014.
During the year ended December 31, 2012, we spud our Ship Shoal 134 and South Timbalier 75 prospects, and no commercial hydrocarbons were found. The Company has plugged and abandoned both wells. We incurred approximately $50.0 million to drill, plug and abandon these wells, including approximately $6.6 million in leasehold costs.
We currently hold six untested exploratory prospects on 15 offshore lease blocks. During the year ended December 31, 2014, we recognized full impairment related to the prospects which we do not currently intend to drill. We will pursue opportunities to realize future value from these leases through farmout, a sale or a possible trade for onshore opportunities.
Southeast Texas (Woodbine)
As of December 31, 2014, our Southeast Texas region included approximately 39,900 gross (23,000 net) acres, proven reserves of 63.8 Bcfe, and 91 gross (50.7 net) producing wells. Crimson has been active in this area since 2008, primarily focusing on
4
conventional wells in the Yegua and Cook Mountain sands in Liberty County until 2012. In 2012, Crimson shifted its focus to the horizontal development of the Woodbine formation in Madison and Grimes counties. During 2013, Crimson, and subsequently Contango, drilled 12 gross (8.0 net) wells on acreage targeting the Woodbine formation. During 2014, we drilled 18 gross (11.6 net) wells on acreage targeting the Woodbine formation. As of December 31, 2014, eight of these wells were producing, two were being evaluated and eight were in various stages of drilling or completion.
For 2015, our current budget includes completing the six wells initiated in late 2014 utilizing a pad drilling strategy on 500 foot spacing in the Chalktown area. When drilling from pads, several wells are drilled in succession, then completed in succession, and then put on production simultaneously to maximize recovery. Our 2015 budget also includes a single well in our Chalktown area that satisfies a farm-in commitment and a horizontal test of the previously untested Lower Lewisville formation in our Grimes County area. Should commodity prices improve and/or service costs decline meaningfully, we may increase our activity in this area. We currently have approximately 16,100 net acres in Madison and Grimes counties (approximately 50% of which is held by production), with a multi-year inventory of potential drilling locations, including the Woodbine, Eagle Ford Shale and Georgetown/Buda formations. As of December 31, 2014, we had 28 gross wells (17.9 net) producing in the Woodbine formation, including 20 gross wells (12.9 net) in the Force area, four gross wells (2.2 net) in the Iola/Grimes area and four gross wells (2.8 net) in the Chalktown area.
On December 31, 2013, we sold to an independent oil and gas company approximately 7.1% of our interest in all developed and undeveloped properties in Madison and Grimes Counties for approximately $20.4 million, or $91,007 per flowing barrel of equivalent daily production and $47.32 per equivalent barrel of proved reserves.
South Texas (Buda/Eagle Ford)
As of December 31, 2014, our South Texas region included approximately 165,800 gross (83,200 net) acres, proven reserves of 53.7 Bcfe, and 273 gross (143.4 net) producing wells. Of this, approximately 41,300 gross (21,400 net) acres are targeting the Buda and Eagle Ford Shale plays, approximately 70% of which is held by production. Crimson began development of the Eagle Ford Shale in Bee County in 2010 and in Karnes, Zavala and Dimmit counties in 2011. During 2013, Contango and Crimson drilled seven gross wells (3.3 net) in the Buda formation in Zavala and Dimmit counties. Six of the wells were successful, while one was a mechanical failure which was side tracked in 2014. During 2014, we drilled 14 gross wells (6.8 net) in the Buda formation in Zavala and Dimmit counties, all of which are currently producing. We drilled one additional well in Zavala and Dimmit counties during the fourth quarter of 2014 as a vertical pilot well to test the viability of the Eagle Ford and other formations in the area. We are evaluating the recovered cores before deciding on a development strategy for these areas. Our current capital program does not contemplate further drilling in Zavala and Dimmit counties in 2015 without improvement in the commodity price environment and/or service cost structure. Our estimated net proven Buda/Eagle Ford reserves in this area were 15.4 Bcfe, comprised of 76% liquids, with 26 gross (13.3 net) producing wells, as of December 31, 2014.
South Texas (Elm Hill Project)
As of December 31, 2014, we held approximately 55,900 gross acres (25,100 net) in Fayette, Gonzales, Caldwell and Bastrop counties, Texas. We believe that the current acreage position, if the play is successful, could add up to 200 gross drilling locations to our drilling inventory. During 2014, we drilled four gross wells (2.0 net) in this area, two of which commenced production during the fourth quarter of 2014, with the other two expected to commence production in early 2015. We currently plan to drill one more well during the first quarter of 2015 and then monitor area results before determining future plans for the area.
The remaining 68,600 gross (36,700 net) acres in our South Texas region are located in our conventional fields that produce primarily from the Wilcox, Frio, and Vicksburg sands. Our estimated net proved conventional reserves in this region were 38.3 Bcfe, comprised of 76% gas, with 245 gross (129.1 net) producing wells, as of December 31, 2014.
Natrona County, Wyoming (FRAMS Project)
In 2014, we acquired the right to earn approximately 119,300 gross acres (93,000 net acres with an 80% working interest) in Natrona County, Wyoming. During the fourth quarter of 2014, we sold a 20% working interest in this prospect to an independent oil and gas company, reducing our potential ownership to approximately 69,900 net acres with a 60% working interest. We spud our first well in this play during the fourth quarter of 2014 targeting the Mowry Shale, and expect to complete that well late in the first quarter
5
or early second quarter of 2015. We will evaluate results from the first well for a number of months and determine future drilling plans for this area.
Weston County, Wyoming (N. Cheyenne Project)
In 2014, we acquired the right to earn approximately 49,000 gross acres (44,000 net acres with a 90% to 100% working interest) in Weston County, Wyoming. During the fourth quarter of 2014, we sold a 20% working interest in this prospect to an independent oil and gas company, reducing our potential ownership to approximately 35,000 net acres with a 72% to 80% working interest. We spud our first well in this play during the first quarter of 2015 targeting the Muddy Sandstone formation, and currently plan to complete that well early in the second quarter of 2015. We will evaluate results from the first well for a number of months and determine future drilling plans for this area. This acreage is approximately 125 miles to the northeast of our Natrona County acreage.
Other (East Texas)
As of December 31, 2014, our East Texas region included approximately 7,400 gross (4,300 net) acres primarily in San Augustine County, with proven reserves of 8.3 Bcfe comprised of 65% gas, and ten gross (5.1 net) producing wells. Crimson actively developed the dry gas Haynesville and Mid-Bossier Shales in this area in 2009 through 2011 during a more favorable natural gas price environment. During 2014, we drilled two gross (1.2 net) wells targeting the shallower, liquids-rich James Lime formation on our acreage in San Augustine County. We believe that the further exploitation of our acreage in the Haynesville, Mid-Bossier and James Lime formations will provide long-term natural gas reserve and production growth potential in the future; however, we do not anticipate devoting drilling capital to these formations until we see a sustained meaningful improvement in the natural gas price environment. As of December 31, 2014, approximately 69% of our acreage in our East Texas region is held by production.
Other (Colorado)
We hold approximately 16,100 gross (11,200 net) acres in the DJ Basin in Colorado (mostly in Adams and Weld counties). There has been sporadic activity since 2011 in the vicinity of our Colorado acreage in pursuit of the Niobrara Shale oil formation. Recent industry activity in the area has established that the application of horizontal drilling technology for oil in the shallower Niobrara Shale may provide attractive return possibilities; however, the prospect for full-scale economic development of this play is still uncertain due to the limited activity in the area and the current commodity price environment. Substantially all of our acreage in the DJ Basin is held by production. We plan to monitor the 2015 industry activity and results of our peers in the Niobrara Shale to determine our future strategy for maximizing the value of our position in the area.
Other (Tuscaloosa Marine Shale “TMS”)
We own a 25% non-operated working interest in the Crosby 12H-1 well in Wilkinson County, Mississippi, and an average non-operated working interest of less than 2.0% in three other wells in Mississippi, all targeting the TMS, an oil-focused shale play in central Louisiana and Mississippi. The Crosby 12H-1well is operated by Goodrich Petroleum Company LLC ("Goodrich”).
In addition, as of December 31, 2014, we have approximately 40,800 gross (29,000 net) undeveloped acres under lease in the TMS. To date, we have elected to participate in three non-operated wells (excluding the Crosby 12H-1 discussed above) where our acreage has been pooled into units: (i) the Goodrich-operated CMR Foster Creek 20-7H #1 well, where we own less than a 1% working interest; (ii) the Goodrich-operated Huff 18-7H #1 well, where we own approximately a 3% working interest; and (iii) the Goodrich-operated CMR Foster Creek 24-13H #1 well, where we own less than a 2% working interest. Due to the poor economics we have experienced in the area related to high drilling and completion costs and the current low oil price environment, we do not expect to drill TMS wells in the near future. Given the low likelihood that we will devote any capital to this area prior to lease expirations in 2015 and 2016, we recognized impairment of certain unproved properties in the third and fourth quarters of 2014. We plan to continue to evaluate participation in third-party operated wells with a small working interest as a means to obtain data from these wells to assist us in evaluating, and maximizing value, from our TMS acreage.
Other
As of December 31, 2014, we held approximately 3,300 gross (620 net) acres in small non-operated working interests in the Fenton field area of Calcasieu Parish, Louisiana and a minor operated crude oil property in Mississippi.
6
Kaybob Duvernay – Alberta, Canada
In 2011, we invested in Alta Resources Investments, LLC (“Alta”). On August 1, 2013, Alta sold its interest in the liquids-rich Kaybob Duvernay Play in Alberta, Canada, where we had invested approximately $15.2 million, for approximately $30.5 million net to us. Of this amount, we have received $28.5 million, and we expect to receive the remaining $2.0 million within the next twelve months.
Jonah Field – Sublette County, Wyoming
In April 2012, we, through our wholly-owned subsidiary, Contaro Company (“Contaro”), entered into a Limited Liability Company Agreement (as amended, the “LLC Agreement”) in connection with the formation of Exaro. Pursuant to the LLC Agreement, we have committed to invest up to $67.5 million in cash in Exaro for a 37% ownership interest. As of December 31, 2014, we had invested approximately $46.9 million in Exaro. We account for Contaro’s ownership in Exaro using the equity method of accounting, and therefore, do not include its share of individual operating results, reserves or production in those reported for our consolidated results.
As of December 31, 2014, Exaro had 625 wells on production over its 1,040 net acres, with a working interest between 14.4% and 32.5%. These wells were producing at a rate of approximately 41 Mmcfed, net to Exaro, plus an additional four wells that are either in the completion or fracture stimulation phase. The operator expects to have two drilling rigs running on this project during 2015. For the year ended December 31, 2014, the Company recognized a net investment gain of approximately $6.9 million, net of tax expense of $3.8 million, as a result of its investment in Exaro. As of December 31, 2014, reserves attributable to our investment in Exaro were 70.2 Bcfe. We do not anticipate making any additional equity contributions during 2015 as Exaro estimates that drilling capital will be funded through internally generated cash flow and borrowings under its revolving credit facility. See Note 11 to our Financial Statements - “Investment in Exaro Energy III LLC” for additional details related to this investment.
As a result of the dramatic downturn in crude oil, natural gas and natural gas liquids pricing in late 2014 and early in 2015, the negative impact of those price declines on the economics of most domestic resource plays, and the continuing uncertainty as to when, or how much, the price environment might improve, our capital expenditure program for 2015 will be focused on: (i) the preservation of our strong and flexible financial position, including limiting our 2015 capital expenditure budget to no more than internally generated cash flow; (ii) focusing drilling expenditures on strategic projects; (iii) identification of opportunities for cost efficiencies in all areas of our operations; and (iv) continuing to identify new resource potential opportunities, internally and through acquisition. Our current capital budget for 2015 should allow us to meet our contractual requirements, remain in position to preserve our term acreage where appropriate and maintain our strong financial profile. We will continuously monitor the commodity price environment, stability and forecast, and if warranted, make adjustments to that strategy as the year progresses. Our capital expenditure budget is currently forecasted at approximately $50.6 million; a decrease of over 73% compared to our 2014 capital expenditures, and is expected to be funded from internally generated cash flow. Primary drilling activity is currently planned as follows:
|
· |
Woodbine – We forecast capital expenditures of approximately $21.3 million in Madison and Grimes counties to complete six gross wells (3.9 net) in our Chalktown area that we began drilling in 2014, and to drill an additional four gross wells (2.8 net). |
|
· |
South Texas - We forecast capital expenditures of approximately $5.5 million in Fayette and Gonzales counties to complete a well that was in progress at year-end and to drill one additional gross well (0.5 net). |
|
· |
Wyoming – We forecast capital expenditures of approximately $10.7 million to drill and complete two gross wells (1.4 net) in Natrona and Weston counties, targeting the Mowry Shale and Muddy Sandstone Formation, respectively. |
From time to time, we are involved in legal proceedings relating to claims associated with ownership interests in our properties. We believe we have satisfactory title to all of our producing properties in accordance with standards generally accepted in the oil and gas industry. Our properties are subject to customary royalty interests, liens incident to operating agreements, and liens for current taxes and other burdens, which we believe do not materially interfere with the use of or affect the value of such properties. As
7
is customary in the industry in the case of undeveloped properties, little investigation of record title is made at the time of acquisition (other than a preliminary review of local records). Detailed investigations, including a title opinion rendered by a licensed independent third party attorney, are typically made before commencement of drilling operations.
We have granted mortgage liens on substantially all of our natural gas and crude oil properties to secure our senior secured revolving credit facility. These mortgages and the related credit agreement contain substantial restrictions and operating covenants that are customarily found in credit agreements of this type. See Note 13 to our Financial Statements ‑ “Long-Term Debt” for further information.
We derive our revenue principally from the sale of natural gas and oil. As a result, our revenues are determined, to a large degree, by prevailing natural gas and oil prices. We sell a portion of our natural gas production to purchasers pursuant to sales agreements which contain a primary term of up to three years and crude oil and condensate production to purchasers under sales agreements with primary terms of up to one year. The sales prices for natural gas are tied to industry standard published index prices, subject to negotiated price adjustments, while the sale prices for crude oil are tied to industry standard posted prices subject to negotiated price adjustments.
We typically utilize commodity price hedge instruments to minimize exposure to declining prices on our crude oil, natural gas and natural gas liquids production, by using a series of swaps and costless collars. As of December 31, 2014, however, we had no commodity price hedges in place. Unrealized gains or losses vary period to period, and will be a function of hedges in place, the strike prices of those hedges and the forward curve pricing for the commodities and interest rates being hedged.
Price decreases would adversely affect our revenues, profits and the value of our proved reserves. Historically, the prices received for natural gas and oil have fluctuated widely. Among the factors that can cause these fluctuations are:
|
· |
The domestic and foreign supply of natural gas and oil. |
|
· |
Overall economic conditions. |
|
· |
The level of consumer product demand. |
|
· |
Adverse weather conditions and natural disasters. |
|
· |
The price and availability of competitive fuels such as heating oil and coal. |
|
· |
Political conditions in the Middle East and other natural gas and oil producing regions. |
|
· |
The level of LNG imports/exports. |
|
· |
Domestic and foreign governmental regulations. |
|
· |
Special taxes on production. |
|
· |
The loss of tax credits and deductions. |
Historically, we have been dependent upon a few purchasers for a significant portion of our revenue. Major purchasers of our natural gas, oil and natural gas liquids for the year ended December 31, 2014, calculated on an equivalent basis, were ConocoPhillips Company (31%), Sunoco Inc. (27%), Shell Trading US Company (10%), Exxon Mobil Oil Corporation (7%), and Enterprise Products Operating LLC (5%). This concentration of purchasers may increase our overall exposure to credit risk, and our purchasers will likely be similarly affected by changes in economic and industry conditions. Our financial condition and results of operations could be materially adversely affected if one or more of our significant purchasers fails to pay us or ceases to acquire our production on terms that are favorable to us. However, we believe our current purchasers could be replaced by other purchasers under contracts with similar terms and conditions.
The oil and gas industry is highly competitive and we compete with numerous other companies. Our competitors in the exploration, development, acquisition and production business include major integrated oil and gas companies as well as numerous independent companies, including many that have significantly greater financial resources.
8
The primary areas in which we encounter substantial competition are in locating and acquiring desirable leasehold acreage for our drilling and development operations, locating and acquiring attractive producing oil and gas properties, and obtaining purchasers and transporters for the natural gas and crude oil we produce. There is also competition between producers of natural gas and crude oil and other industries producing alternative energy and fuel. Furthermore, competitive conditions may be substantially affected by various forms of energy legislation and/or regulation considered from time to time by federal, state and local governments; however, it is not possible to predict the nature of any such legislation or regulation that may ultimately be adopted or its effects upon our future operations. Such laws and regulations may, however, substantially increase the costs of exploring for, developing or producing natural gas and crude oil and may prevent or delay the commencement or continuation of a given operation. The effect of these risks cannot be accurately predicted.
Governmental Regulations and Industry Matters
Federal Income Tax
Federal income tax laws significantly affect our operations. The principal provisions affecting us are those that permit us, subject to certain limitations, to deduct as incurred, rather than to capitalize and amortize, its domestic “intangible drilling and development costs” and to claim depletion on a portion of our domestic natural gas and oil properties and to claim a manufacturing deduction based on qualified production activities.
Industry Regulations
The availability of a ready market for crude oil, natural gas and natural gas liquids production depends upon numerous factors beyond our control. These factors include regulation of crude oil, natural gas, and natural gas liquids production, federal, state and local regulations governing environmental quality and pollution control, state limits on allowable rates of production by well or proration unit, the amount of crude oil, natural gas and natural gas liquids available for sale, the availability of adequate pipeline and other transportation and processing facilities, and the marketing of competitive fuels. For example, a productive natural gas well may be “shut-in” because of an oversupply of natural gas or lack of an available natural gas pipeline in the area in which the well is located. State and federal regulations generally are intended to prevent waste of crude oil, natural gas, and natural gas liquids, protect rights to produce crude oil, natural gas and natural gas liquids between owners in a common reservoir, control the amount of crude oil, natural gas and natural gas liquids produced by assigning allowable rates of production, and protect the environment. Pipelines are subject to the jurisdiction of various federal, state and local agencies. We are also subject to changing and extensive tax laws, the effects of which cannot be predicted.
The following discussion summarizes the regulation of the U.S. oil and gas industry. We believe that we are in substantial compliance with the various statutes, rules, regulations and governmental orders to which our operations may be subject, although there can be no assurance that this is or will remain the case. Moreover, such statutes, rules, regulations and government orders may be changed or reinterpreted from time to time in response to economic or political conditions, and there can be no assurance that such changes or reinterpretations will not materially adversely affect our results of operations and financial condition. The following discussion is not intended to constitute a complete discussion of the various statutes, rules, regulations and governmental orders to which our operations may be subject.
Regulation of Crude Oil, Natural Gas and Natural Gas Liquids Exploration and Production
Our operations are subject to various types of regulation at the federal, state and local levels. Such regulation includes requiring permits for the drilling of wells, maintaining bonding requirements in order to drill or operate wells and regulating the location of wells, the method of drilling and casing wells, the surface use and restoration of properties upon which wells are drilled, the plugging and abandoning of wells and the disposal of fluids used in connection with operations. Our operations are also subject to various conservation laws and regulations. These include the regulation of the size of drilling and spacing units or proration units and the density of wells that may be drilled in and the unitization or pooling of crude oil and natural gas properties. In this regard, some states allow the forced pooling or integration of tracts to facilitate exploration while other states rely primarily or exclusively on voluntary pooling of lands and leases. In areas where pooling is voluntary, it may be more difficult to form units, and therefore more difficult to develop a project, if the operator owns less than 100% of the leasehold. In addition, state conservation laws, which establish maximum rates of production from crude oil and natural gas wells, generally prohibit the venting or flaring of natural gas and
9
impose certain requirements regarding the ratability of production. The effect of these regulations may limit the amount of crude oil, natural gas and natural gas liquids we can produce from our wells and may limit the number of wells or the locations at which we can drill. The regulatory burden on the oil and gas industry increases our costs of doing business and, consequently, affects our profitability. Inasmuch as such laws and regulations are frequently expanded, amended and interpreted, we are unable to predict the future cost or impact of complying with such regulations.
Regulation of Sales and Transportation of Natural Gas
Federal legislation and regulatory controls have historically affected the price of natural gas produced by us, and the manner in which such production is transported and marketed. Under the Natural Gas Act of 1938 (the “NGA”), the Federal Energy Regulatory Commission (the “FERC”) regulates the interstate transportation and the sale in interstate commerce for resale of natural gas. Effective January 1, 1993, the Natural Gas Wellhead Decontrol Act (the “Decontrol Act”) deregulated natural gas prices for all “first sales” of natural gas, including all sales by us of our own production. As a result, all of our domestically produced natural gas may now be sold at market prices, subject to the terms of any private contracts that may be in effect. However, the Decontrol Act did not affect the FERC’s jurisdiction over natural gas transportation.
Under the provisions of the Energy Policy Act of 2005 (the “2005 Act”), the NGA has been amended to prohibit market manipulation by any person, including marketers, in connection with the purchase or sale of natural gas, and the FERC has issued regulations to implement this prohibition. The Commodity Futures Trading Commission (the “CFTC”) also holds authority to monitor certain segments of the physical and futures energy commodities market including oil and natural gas. With regard to physical purchases and sales of natural gas and other energy commodities, and any related hedging activities that we undertake, we are thus required to observe anti-market manipulation laws and related regulations enforced by FERC and/or the CFTC. These agencies hold substantial enforcement authority, including the ability to assess civil penalties of up to $1 million per day per violation.
Under the 2005 Act, the FERC has also established regulations that are intended to increase natural gas pricing transparency through, among other things, new reporting requirements and expanded dissemination of information about the availability and prices of gas sold. For example, on December 26, 2007, FERC issued a final rule on the annual natural gas transaction reporting requirements, as amended by subsequent orders on rehearing, or Order No. 704. Order No. 704 requires buyers and sellers of natural gas above a de minimis level, including entities not otherwise subject to FERC jurisdiction, to submit on May 1 of each year an annual report to FERC describing their aggregate volumes of natural gas purchased or sold at wholesale in the prior calendar year to the extent such transactions utilize, contribute to or may contribute to the formation of price indices. Order No. 704 also requires market participants to indicate whether they report prices to any index publishers and, if so, whether their reporting complies with FERC’s policy statement on price reporting. It is the responsibility of the reporting entity to determine which individual transactions should be reported based on the guidance of Order No. 704 as clarified in orders on clarification and rehearing. In addition, to the extent that we enter into transportation contracts with interstate pipelines that are subject to FERC regulation, we are subject to FERC requirements related to use of such interstate capacity. Any failure on our part to comply with the FERC’s regulations could result in the imposition of civil and criminal penalties.
Our natural gas sales are affected by intrastate and interstate gas transportation regulation. Following the Congressional passage of the Natural Gas Policy Act of 1978 (the “NGPA”), the FERC adopted a series of regulatory changes that have significantly altered the transportation and marketing of natural gas. Beginning with the adoption of Order No. 436, issued in October 1985, the FERC has implemented a series of major restructuring orders that have required interstate pipelines, among other things, to perform “open access” transportation of gas for others, “unbundle” their sales and transportation functions, and allow shippers to release their unneeded capacity temporarily and permanently to other shippers. As a result of these changes, sellers and buyers of gas have gained direct access to the particular interstate pipeline services they need and are better able to conduct business with a larger number of counterparties. We believe these changes generally have improved our access to markets while, at the same time, substantially increasing competition in the natural gas marketplace. It remains to be seen, however, what effect the FERC’s other activities will have on access to markets, the fostering of competition and the cost of doing business. We cannot predict what new or different regulations the FERC and other regulatory agencies may adopt, or what effect subsequent regulations may have on our activities. We do not believe that we will be affected by any such new or different regulations materially differently than any other seller of natural gas with which we compete.
10
In the past, Congress has been very active in the area of gas regulation. However, as discussed above, the more recent trend has been in favor of deregulation, or “lighter handed” regulation, and the promotion of competition in the gas industry. There regularly are other legislative proposals pending in the federal and state legislatures that, if enacted, would significantly affect the petroleum industry. At the present time, it is impossible to predict what proposals, if any, might actually be enacted by Congress or the various state legislatures and what effect, if any, such proposals might have on us. Similarly, and despite the trend toward federal deregulation of the natural gas industry, we cannot predict whether or to what extent that trend will continue, or what the ultimate effect will be on our sales of gas. Again, we do not believe that we will be affected by any such new legislative proposals materially differently than any other seller of natural gas with which we compete.
Oil Price Controls and Transportation Rates
Sales prices of crude oil, condensate and gas liquids by us are not currently regulated and are made at market prices. Our sales of these commodities are, however, subject to laws and to regulations issued by the Federal Trade Commission (the “FTC”) prohibiting manipulative or fraudulent conduct in the wholesale petroleum market. The FTC holds substantial enforcement authority under these regulations, including the ability to assess civil penalties of up to $1 million per day per violation. Our sales of these commodities, and any related hedging activities, are also subject to CFTC oversight as discussed above.
The price we receive from the sale of these products may be affected by the cost of transporting the products to market. Much of the transportation is through interstate common carrier pipelines. Effective as of January 1, 1995, the FERC implemented regulations generally grandfathering all previously approved interstate transportation rates and establishing an indexing system for those rates by which adjustments are made annually based on the rate of inflation, subject to certain conditions and limitations. The FERC’s regulation of crude oil and natural gas liquids transportation rates may tend to increase the cost of transporting crude oil and natural gas liquids by interstate pipelines, although the annual adjustments may result in decreased rates in a given year. Every five years, the FERC must examine the relationship between the annual change in the applicable index and the actual cost changes experienced in the oil pipeline industry. We are not able at this time to predict the effects of these regulations or FERC proceedings, if any, on the transportation costs associated with crude oil production from our crude oil producing operations.
Environmental and Occupational Health and Safety Matters
Our crude oil and natural gas exploration, development and production operations are subject to stringent federal, regional, state and local laws and regulations governing occupational health and safety aspects of our operations, the discharge of materials into the environment, or otherwise relating to environmental protection. Numerous governmental authorities, including the U.S. Environmental Protection Agency (the “EPA”) and analogous state agencies, have the power to enforce compliance with these laws and regulations and the permits issued under them, often requiring difficult and costly actions. These laws and regulations may require the acquisition of a permit to conduct drilling and other regulated activities, restrict the types, quantities and concentration of various substances that may be released into the environment in connection with drilling and production activities, limit or prohibit drilling activities on certain lands within wilderness, wetlands and other protected areas, require remedial measures to mitigate pollution from current or former operations; impose specific health and safety criteria addressing worker protection; and impose substantial liabilities for pollution resulting from production and drilling operations. Failure to comply with these laws and regulations may result in the assessment of administrative, civil and criminal penalties, the imposition of remedial obligations, and the issuance of orders enjoining some or all of our operations in affected areas. Public interest in the protection of the environment has increased dramatically in recent years. The trend of more expansive and stringent environmental legislation and regulations applied to the crude oil and natural gas industry could continue in the future, resulting in increased costs of doing business and consequently affecting profitability. To the extent laws are enacted or other governmental actions are taken that result in more stringent and costly well drilling, construction, completion, water management activities, waste handling, storage, transport, disposal or remediation requirements, our business and prospects could be materially and adversely affected.
Our domestic natural gas and oil operations, including those involving federal and state leases in the U.S. Gulf of Mexico, are subject to extensive federal and state regulation and imposition of environmental liabilities or possible interruption or termination of leasing activities by governmental authorities. The Comprehensive Environmental Response, Compensation and Liability Act, as amended, (“CERCLA”), also known as the “Superfund Law”, and similar state laws, impose liability, without regard to fault or the legality of the original conduct, on certain classes of potentially responsible persons that are considered to have contributed to the release of a “hazardous substance” into the environment. These potentially responsible persons include the current or past owner or
11
operator of the disposal site or sites where the release occurred and companies that disposed or arranged for the disposal of the hazardous substances released at the site. Persons who are or were responsible for releases of hazardous substances under CERCLA may be subject to joint and several liability for the costs of cleaning up the hazardous substances that have been released into the environment, for damages to natural resources and for the costs of certain health studies, and it is not uncommon for neighboring landowners and other third parties to file claims for personal injury and property damage allegedly caused by the hazardous substances released into the environment. We generate materials in the course of our operations that may be regulated as hazardous substances.
We also generate wastes that are subject to the federal Resource Conservation and Recovery Act, as amended (the “RCRA”), and comparable state statutes. The RCRA imposes strict requirements on the generation, storage, treatment, transportation and disposal of nonhazardous and hazardous wastes, and the EPA and analogous state agencies stringently enforce the approved methods of management and disposal of these wastes. While the RCRA currently exempts certain drilling fluids, produced waters, and other wastes associated with exploration, development and production of crude oil and natural gas from regulation as hazardous wastes, we can provide no assurance that this exemption will be preserved in the future. Repeal or modification of this exclusion or similar exemptions under federal or state law could increase the amount of waste we are required to manage and dispose of as hazardous waste rather than non-hazardous waste, and could cause us to incur increased operating costs, which could have a significant impact on us as well as the natural gas and oil industry in general. In any event, these excluded wastes are subject to regulation as nonhazardous wastes.
We currently own, lease or operate numerous properties that for many years have been used for the exploration and production of crude oil and natural gas. Although we believe that we have used good operating and waste disposal practices that were standard in the industry at the time, petroleum hydrocarbons or wastes may have been disposed of or released on or under the properties owned or leased by us or on or under locations where such wastes have been taken for recycling or disposal. In addition, many of these properties have been operated by third parties whose treatment and disposal or release of petroleum hydrocarbons or wastes was not under our control. These properties and the petroleum hydrocarbons or wastes disposed thereon may be subject to the CERCLA, RCRA and analogous state laws as well as state laws governing the management of crude oil and natural gas wastes. Under such laws, which may impose strict, joint and several liability, we could be required to remove or remediate previously disposed wastes (including wastes disposed of or released by prior owners or operators) or property contamination (including groundwater contamination) or to perform remedial plugging operations to prevent future contamination.
The Clean Air Act, as amended (the “CAA”), and comparable state laws and regulations restrict the emission of air pollutants from many sources and also impose various monitoring and reporting requirements. These laws and regulations may require us to obtain pre-approval for the construction or modification of certain projects or facilities expected to produce or significantly increase air emissions, obtain and strictly comply with stringent air permit requirements or utilize specific equipment or technologies to control emissions. Obtaining permits has the potential to delay the development of crude oil and natural gas projects. Over the next several years, we may be required to incur certain capital expenditures for air pollution control equipment or other air emissions-related issues. For example, in December 2014, the EPA published a proposed rulemaking that it expects to finalize by October 1, 2015, which rulemaking proposes to revise the National Ambient Air Quality Standard for ozone between 65 to 70 parts per billion (“ppb”) for both the 8-hour primary and secondary standards. Compliance with this or other regulatory initiatives could directly impact us by requiring installation of new emission controls on some of our equipment, resulting in longer permitting timelines and significantly increasing our capital expenditures and operation costs, which could adversely impact our business.
Based on findings made by the EPA that emissions of carbon dioxide, methane and other greenhouse gases (“GHGs”) present an endangerment to public health and the environment, the EPA adopted regulations under existing provisions of the CAA that, among other things, establish Prevention of Significant Deterioration (“PSD”) construction and Title V operating permit reviews for GHG emissions from certain large stationary sources that already are potential major sources of certain principal, or criteria, pollutant emissions. Facilities required to obtain PSD permits for their GHG emissions will also be required to meet “best available control technology” standards that will be established by the states or, in some cases, by the EPA on a case-by-case basis. These EPA rulemakings could adversely affect our operations and restrict or delay our ability to obtain air permits for new or modified sources, should such sources exceed threshold emission levels. In addition, the EPA has adopted rules requiring the monitoring and reporting of GHG emissions from specified sources in the United States on an annual basis, which include the majority of our operations. We are monitoring GHG emissions from our operations in accordance with the GHG emissions reporting rule and believe that our monitoring activities are in substantial compliance with applicable reporting obligations.
12
While Congress has, from time to time considered legislation to reduce emissions of GHGs, there has not been significant activity in the form of adopted legislation to reduce GHG emissions at the federal level in recent years. In the absence of such federal climate legislation, a number of state and regional efforts have emerged that are aimed at tracking and/or reducing GHG emissions by means of cap and trade programs that typically require major sources of GHG emissions to acquire and surrender emission allowances in return for emitting those GHGs. Although it is not possible at this time to predict how legislation or new regulations that may be adopted to address GHG emissions would impact our business, any such future federal laws or regulations that impose reporting obligations on us with respect to, or require the elimination of GHG emissions from, our equipment or operations could require us to incur increased operating costs and could adversely affect demand for the oil and natural gas we produce. For example, on January 14, 2015, the Obama Administration announced that the EPA is expected to propose in the summer of 2015 and finalize in 2016 new regulations that will set methane emission standards for new and modified oil and gas production and natural gas processing and transmission facilities as part of the Administration’s efforts to reduce methane emissions from the oil and gas sector by up to 45 percent from 2012 levels by 2025. Finally, it should be noted that some scientists have concluded that increasing concentrations of greenhouse gases in the Earth’s atmosphere may produce climate changes that have significant physical effects, such as increased frequency and severity of storms, droughts, and floods and other climatic events. If any such effects were to occur, they could have an adverse effect on our assets and operations.
The Federal Water Pollution Control Act, as amended (the “Clean Water Act”) and analogous state laws impose restrictions and strict controls regarding the discharge of pollutants into state waters and waters of the United States. Any such discharge of pollutants into regulated waters is prohibited except in accordance with the terms of a permit issued by the EPA or the analogous state agency. Spill prevention, control and countermeasure plan requirements under federal law require appropriate containment berms and similar structures to help prevent the contamination of navigable waters in the event of a petroleum hydrocarbon tank spill, rupture or leak. In addition, the Clean Water Act and analogous state laws require individual permits or coverage under general permits for discharges of storm water runoff from certain types of facilities. The Clean Water Act also prohibits the discharge of dredge and fill material in regulated waters, including wetlands, unless authorized by permit. Federal and state regulatory agencies can impose administrative, civil and criminal penalties for noncompliance with discharge permits or other requirements of the Clean Water Act and analogous state laws and regulations.
Our oil and natural gas exploration and production operations generate produced water, drilling muds, and other waste streams, some of which may be disposed via injection in underground wells situated in non-producing subsurface formations. The disposal of oil and natural gas wastes into underground injection wells are subject to the Safe Drinking Water Act, as amended, or SDWA, and analogous state laws. The Underground Injection Well Program under the SDWA requires that we obtain permits from the EPA or analogous state agencies for our disposal wells, establishes minimum standards for injection well operations, restricts the types and quantities that may be injected, and prohibits the migration of fluid containing any contaminants into underground sources of drinking water. Any leakage from the subsurface portions of the injection wells may cause degradation of freshwater, potentially resulting in cancellation of operations of a well, issuance of fines and penalties from governmental agencies, incurrence of expenditures for remediation of the affected resource, and imposition of liability by third parties for alternative water supplies, property damages and personal injuries. While we believe that we have obtained the necessary permits from the applicable regulatory agencies for our underground injection wells and that we are in substantial compliance with applicable permit conditions and federal and state rules, a change in disposal well regulations or the inability to obtain permits for new disposal wells in the future may affect our ability to dispose of salt water and ultimately increase the cost of our operations. For example, there exists a growing concern that the injection of saltwater and other fluids into belowground disposal wells triggers seismic activity in certain areas, including Texas, where we operate. In response to these concerns, in October 2014, the Texas Railroad Commission (“TRC”) published a final rule governing permitting or re-permitting of disposal wells that would require, among other things, the submission of information on seismic events occurring within a specified radius of the disposal well location, as well as logs, geologic cross sections and structure maps relating to the disposal area in question. If the permittee or an applicant of a disposal well fails to demonstrate that the injected fluids are confined to the disposal zone or if scientific data indicates such a disposal well is likely to be or determined to be contributing to seismic activity, then the TRC may deny, modify, suspend or terminate the permit application or existing operating permit for that well. These new seismic permitting requirements applicable to disposal wells impose more stringent permitting requirements and likely to result in added costs to comply or, perhaps, may require alternative methods of disposing of salt water and other fluids, which could delay production schedules and also result in increased costs..
13
The Oil Pollution Act of 1990 (the “OPA”) and regulations thereunder impose a variety of regulations on “responsible parties” related to the prevention of oil spills and liability for damages resulting from such spills in U.S. waters. The OPA applies to vessels, onshore facilities, and offshore facilities, including exploration and production facilities that may affect waters of the United States. Under OPA, responsible parties including owners and operators of onshore facilities and lessees and permittees of offshore leases may be held strictly liable for oil cleanup costs and natural resource damages as well as a variety of public and private damages that may result from oil spills. In December 2014, the Bureau of Ocean Energy Management (the “BOEM”) issued a final rule, effective January 12, 2015, which raises OPA’s damages liability cap from $75 million to $133.65 million. While liability limits apply in some circumstances, a party cannot take advantage of liability limits if the spill was caused by gross negligence or willful misconduct or resulted from violation of federal safety, construction or operating regulations. Few defenses exist to the liability imposed by the OPA. In addition, to the extent the Company’s offshore lease operations affect state waters, the Company may be subject to additional state and local clean-up requirements or incur liability under state and local laws. The OPA also imposes ongoing requirements on responsible parties, including preparation of oil spill response plans for responding to a worst-case discharge of oil into waters of the U.S., and proof of financial responsibility to cover at least some costs in a potential spill. The Company believes that it currently has established adequate proof of financial responsibility in the form of a Certificate of Financial Responsibility ("COFR") for its offshore facilities. However, the Company cannot predict whether significantly higher COFR amounts under any future OPA amendments will result in the imposition of substantial additional annual costs to the Company in the future or otherwise materially adversely affect the Company. The impact, however, should not be any more adverse to the Company than it will be to other similarly situated or less capitalized owners or operators in the Gulf of Mexico.
Hydraulic fracturing is an important and common practice that is used to stimulate production of natural gas and/or crude oil from dense subsurface rock formations. The hydraulic fracturing process involves the injection of water, sand and chemical additives under pressure into targeted subsurface formations to stimulate production. We routinely use hydraulic fracturing techniques in many of our completion programs. Hydraulic fracturing typically is regulated by state oil and gas commissions, or other similar state agencies, but several federal agencies have asserted regulatory authority over certain aspects of the process. For example, the EPA has issued final Clean Air Act regulations governing performance standards, including standards for the capture of air emissions released during hydraulic fracturing; announced its intent to propose in the first half of 2015 effluent limit guidelines that wastewater from shale gas extraction operations must meet before discharging to a treatment plant; and issued in May 2014 a prepublication of its Advance Notice of Proposed Rulemaking regarding Toxic Substances Control Act reporting of the chemical substances and mixtures used in hydraulic fracturing. Also, the federal Bureau of Land Management (“BLM”) issued a revised proposed rule containing disclosure requirements and other mandates for hydraulic fracturing on federal lands and the agency is now analyzing comments to the proposed rulemaking and is expected to promulgate a final rule in the first half of 2015.
In addition, Congress has from time to time considered legislation to provide for federal regulation of hydraulic fracturing and to require disclosure of the chemicals used in the hydraulic fracturing process. At the state level, several states, including Texas, where we operate, have adopted, and other states are considering adopting legal requirements that could impose more stringent permitting, public disclosure, or well construction requirements on hydraulic fracturing activities. States could elect to prohibit hydraulic fracturing altogether, such as the State of New York announced in December 2014. Local government may also seek to adopt ordinances within their jurisdictions regulating the time, place and manner of drilling activities in general or hydraulic fracturing activities in particular. We believe that we follow applicable standard industry practices and legal requirements for groundwater protection in our hydraulic fracturing activities. Nonetheless, if new or more stringent federal, state, or local legal restrictions relating to the hydraulic fracturing process are adopted in areas where we operate, we could incur potentially significant added costs to comply with such requirements, experience delays or curtailment in the pursuit of exploration, development, or production activities, and perhaps even be precluded from drilling or completing wells.
In addition, certain governmental reviews are underway that focus on environmental aspects of hydraulic fracturing practices. The White House Council on Environmental Quality is coordinating an administration-wide review of hydraulic fracturing practices. The EPA has commenced a study of the potential environmental effects of hydraulic fracturing on drinking water and groundwater, with a draft report drawing conclusions about the potential impacts of hydraulic fracturing on drinking water resources expected to be available for public comment and peer review the first half of 2015. These ongoing or any future studies, depending on their degree of pursuit and any meaningful results obtained, could spur initiatives to further regulate hydraulic fracturing.
14
To our knowledge, there have been no citations, suits, or contamination of potable drinking water arising from our hydraulic fracturing operations. We do not have insurance policies in effect that are intended to provide coverage for losses solely related to hydraulic fracturing operations; however, we believe our general liability and excess liability insurance policies would cover third-party pollution claims in accordance with, and subject to the terms of such policies.
Oil and natural gas exploration, development and production activities on federal lands, including Indian lands and lands administered by the BLM, are subject to the National Environmental Policy Act, as amended (“NEPA”). NEPA requires federal agencies, including the BLM, to evaluate major agency actions having the potential to significantly impact the environment. In the course of such evaluations, an agency will prepare an Environmental Assessment that assesses the potential direct, indirect and cumulative impacts of a proposed project and, if necessary, will prepare a more detailed Environmental Impact Statement that may be made available for public review and comment. Currently, we have minimal exploration and production activities on federal lands. However, for those current activities as well as for future or proposed exploration and development plans on federal lands, governmental permits or authorizations that are subject to the requirements of NEPA are required. This process has the potential to delay, limit or increase the cost of developing oil and natural gas projects. Authorizations under NEPA are also subject to protest, appeal or litigation, any or all of which may delay or halt projects.
Environmental laws such as the Endangered Species Act, as amended (“ESA”), may impact exploration, development and production activities on public or private lands. The ESA provides broad protection for species of fish, wildlife and plants that are listed as threatened or endangered in the United States, and prohibits taking of endangered species. Similar protections are offered to migratory birds under the Migratory Bird Treaty Act. Federal agencies are required to ensure that any action authorized, funded or carried out by them is not likely to jeopardize the continued existence of listed species or modify their critical habitat. While some of our facilities may be located in areas that are designated as habitat for endangered or threatened species, we believe that we are in substantial compliance with the ESA. If endangered species are located in areas of the underlying properties where we wish to conduct seismic surveys, development activities or abandonment operations, such work could be prohibited or delayed or expensive mitigation may be required. Moreover, as a result of a settlement approved by the U.S. District Court for the District of Columbia in September 2011, the U.S. Fish and Wildlife Service (the “FWS”) is required to make a determination on listing of numerous species as endangered or threatened under the ESA by no later than completion of the agency’s 2017 fiscal year. For example, in March 2014, the FWS announced the listing of the lesser prairie chicken, whose habitat is over a five-state region, including Texas, where we conduct operations, as a threatened species under the ESA. However, the FWS also announced a final rule that will limit regulatory impacts on landowners and businesses from the listing if those landowners and businesses have entered into certain range-wide conservation planning agreements, such as those developed by the Western Association of Fish and Wildlife Agencies, pursuant to which such parties agreed to take steps to protect the lesser prairie chicken’s habitat and to pay a mitigation fee if its actions harm the lesser prairie chicken’s habitat. The designation of previously unprotected species as threatened or endangered in areas where underlying property operations are conducted could cause us to incur increased costs arising from species protection measures, time delays or limitations on our drilling program activities, which costs delays or limitation could have an adverse impact on our ability to develop and produce reserves.
We are subject to the requirements of the federal Occupational Safety and Health Act, as amended (“OSHA”), and comparable state statutes, whose purpose is to protect the health and safety of workers. In addition, the OSHA hazard communication standard, the EPA community right-to-know regulations under Title III of the federal Superfund Amendment and Reauthorization Act and comparable state statutes require that information be maintained concerning hazardous materials used or produced in our operations and that this information be provided to employees, state and local government authorities and citizens. We believe that we are in substantial compliance with all applicable laws and regulations relating to worker health and safety.
In response to the Deepwater Horizon drilling rig explosive incident and resulting oil spill in the United States Gulf of Mexico in 2010, the BOEM and the Bureau of Safety and Environmental Enforcement (the “BSEE”), each agencies of the U.S. Department of the Interior, have imposed new and more stringent permitting procedures and regulatory safety and performance requirements for new wells to be drilled in federal waters. These governmental agencies have implemented and enforced new rules, Notices to Lessees and Operators and temporary drilling moratoria that imposed safety and operational performance measures on exploration, development and production operators in the Gulf of Mexico or otherwise resulted in a temporary cessation of drilling activities. In addition, states may adopt and implement similar or more stringent legal requirements applicable to exploration and production activities in state waters. Compliance with these added and more stringent regulatory restrictions, in addition to any
15
uncertainties or inconsistencies in current decisions and rulings by governmental agencies and delays in the processing and approval of drilling permits and exploration, development and oil spill-response plans could adversely affect or delay new drilling and ongoing development efforts, which could have a material adverse impact on our business. Moreover, these governmental agencies are continuing to evaluate aspects of safety and operational performance in the Gulf of Mexico and, as a result, developing and implementing new, more restrictive requirements. One example is the 2013 amendments to the federal Workplace Safety Rule regarding the utilization of a more comprehensive safety and environmental management system (“SEMS”), which amended rule is sometimes referred to as SEMS II. A second, and more recent, example is the August 2014 Advanced Notice of Proposed Rulemaking that ultimately seeks to bolster the offshore financial assurance and bonding program. Among other adverse impacts, these additional measures could delay or disrupt our operations, increase the risk of expired leases due to the time required to develop new technology, result in increased supplemental bonding requirements and incurrence of associated added costs, limit operational activities in certain areas, or cause us to incur penalties, fines, or shut-in production. If material spill incidents similar to the Deepwater Horizon incident were to occur in the future, the United States could elect to again issue directives to temporarily cease drilling activities and, in any event, may from time to time issue further safety and environmental laws and regulations regarding offshore oil and natural gas exploration and development, any of which developments could have a material adverse effect on our business.
Other Laws and Regulations
Various laws and regulations often require permits for drilling wells and also cover spacing of wells, the prevention of waste of natural gas and oil including maintenance of certain gas/oil ratios, rates of production and other matters. The effect of these laws and regulations, as well as other regulations that could be promulgated by the jurisdictions in which the Company has production, could be to limit the number of wells that could be drilled on the Company’s properties and to limit the allowable production from the successful wells completed on the Company’s properties, thereby limiting the Company’s revenues.
The BOEM administers the natural gas and oil leases held by the Company on federal onshore lands and offshore tracts in the Outer Continental Shelf. The BOEM holds a royalty interest in these federal leases on behalf of the federal government. While the royalty interest percentage is fixed at the time that the lease is entered into, from time to time the BOEM changes or reinterprets the applicable regulations governing its royalty interests, and such action can indirectly affect the actual royalty obligation that the Company is required to pay. However, the Company believes that the regulations generally do not impact the Company to any greater extent than other similarly situated producers. At the end of lease operations, oil and gas lessees must plug and abandon wells, remove platforms and other facilities, and clear the lease site sea floor. The BOEM requires companies operating on the Outer Continental Shelf to obtain surety bonds to ensure performance of these obligations. As an operator, the Company is required to obtain surety bonds of $200,000 per lease for exploration and $500,000 per lease for developmental activities. However, in August 2014, BOEM published an Advance Notice of Proposed Rulemaking, pursuant to which it seeks to bolster its current bonding requirements for offshore oil and gas operations.
In accordance with industry practice, we maintain insurance against many, but not all, potential perils confronting our operations and in coverage amounts and deductible levels that we believe to be economic. Consistent with that profile, our insurance program is structured to provide us financial protection from significant losses resulting from damages to, or the loss of, physical assets or loss of human life, and liability claims of third parties, including such occurrences as well blowouts and weather events that result in oil spills and damage to our wells and/or platforms. Our goal is to balance the cost of insurance with our assessment of the potential risk of an adverse event. We maintain insurance at levels that we believe are appropriate and consistent with industry practice and we regularly review our risks of loss and the cost and availability of insurance and revise our insurance program accordingly.
We continuously monitor regulatory changes and regulatory responses and their impact on the insurance market and our overall risk profile, and adjust our risk and insurance program to provide protection at a level that we can afford considering the cost of insurance, against the potential and magnitude of disruption to our operations and cash flows. Changes in laws and regulations regarding exploration and production activities in the Gulf of Mexico could lead to tighter underwriting standards, limitations on scope and amount of coverage, and higher premiums, including possible increases in liability caps for claims of damages from oil spills.
16
We maintain significant insurance coverage attributable to our net share of any potential financial losses occurring as a result of potential perils, including well control coverage of $75 million, which covers control of well, pollution cleanup and consequential damages. We also maintain $150 million of general liability coverage, which covers pollution cleanup, consequential damages coverage, and third party personal injury and death, and $35 million of Oil Spill Financial Responsibility coverage, which covers additional pollution cleanup and third party claims coverage.
Health, Safety and Environmental Program
Our Health, Safety and Environmental (“HS&E”) Program is supervised by an operating committee of senior management to insure compliance with all state and federal regulations. In support of the operating committee, we have contracted with J. Connor Consulting (“JCC”) to coordinate the regulatory process relative to our offshore assets. JCC is a regulatory consulting firm specializing in the offshore Gulf of Mexico. They provide preparation of incident response plans, safety and environmental services and facilitation of comprehensive oil spill response training and drills on behalf of oil and gas companies and pipeline operators.
Additionally, in support of our Gulf of Mexico operations, we have established a Regional Oil Spill Plan which has been approved by the BOEM. Our response team is trained annually and is tested through in-house spill drills. We have also contracted with O’Brien’s Response Management (“O’Brien’s”), who maintains an incident command center on 24 hour alert in Slidell, LA. In the event of an oil spill, the Company’s response program is initiated by notifying O’Brien’s any incident while the Company response team is mobilized to focus on source control and containment of the spill. O’Brien’s would coordinate communications with state and federal agencies and would provide subject matter expertise in support of the response team.
We have also contracted with Clean Gulf Associates (“CGA”) to assist with equipment and personnel needs in the event of a spill. CGA specializes in onsite control and cleanup and is on 24 hour alert with equipment currently stored at six bases along the gulf coast (Ingleside and Galveston, TX; Lake Charles, Houma, and Venice, LA; and Pascagoula, MS). CGA is opening new sites in Leeville, Morgan City and Harvey, LA. The CGA equipment stockpile is available to serve member oil spill response needs and includes open seas skimmers, and shoreline protection boom, communications equipment, dispersants with application systems, wildlife rehabilitation and a forward command center. CGA has retainers with aerial dispersant and mechanical recovery equipment contractors for spill response.
In addition to our membership in CGA, the Company has contracted with Wild Well Control for source control at the wellhead, if required. Wild Well Control is one of the world’s leading providers of firefighting and well control services.
We also have a full time health, safety and environmental professional who supports our operations and oversees the implementation of our onshore HS&E policies.
Safety and Environmental Management System
We have developed and implemented a Safety and Environmental Management System (“SEMS”) to address oil and gas operations in the Outer Continental Shelf (“OCS”), as required by the BSEE. Our SEMS identifies and mitigates safety and environmental hazards and the impacts of these hazards on design, construction, start-up, operation, inspection, and maintenance of all new and existing facilities. The Company has established goals, performance measures, training and accountability for SEMS implementation. We also provide the necessary resources to maintain an effective SEMS and we review the adequacy and effectiveness of the SEMS program annually. Company facilities are designed, constructed, maintained, monitored, and operated in a manner compatible with industry codes, consensus standards, and all applicable governmental regulations. We have contracted with Island Technologies Inc. to coordinate our SEMS program and to track compliance for production operations.
The BSEE enforces the SEMS requirements through regular audits. Failure of an audit may result in an Incident of Non-Compliance and could ultimately require a shut-in our Gulf of Mexico operations if not resolved within the required time.
On December 31, 2014, we had 92 full time employees, of which 23 were field personnel. We have been able to attract and retain a talented team of industry professionals that have been successful in achieving significant growth and success in the past. As such, we are well-positioned to adequately manage and develop our existing assets and also to increase our proved reserves and
17
production through exploitation of our existing asset base, as well as the continuing identification, acquisition, and development of new growth opportunities. None of our employees are covered by collective bargaining agreements. We believe our relationship with our employees is good.
In addition to our employees, we use the services of independent consultants and contractors to perform various professional services. As a working interest owner, we rely on certain outside operators to drill, produce and market our natural gas and oil where we are a non-operator. In prospects where we are the operator, we rely on drilling contractors to drill and sometimes rely on independent contractors to produce and market our natural gas and oil. In addition, we frequently utilize the services of independent contractors to perform field and on-site drilling and production operation services and independent third party engineering firms to evaluate our reserves.
Directors and Executive Officers
See “Item 10. Directors, Executive Officers and Corporate Governance”, which information is incorporated herein by reference.
Effective October 1, 2013, we moved our corporate offices to 717 Texas Avenue in downtown Houston, Texas, under a lease that expires March 31, 2019. Rent, including parking, related to this office space for the year ended December 31, 2014 was approximately $2.1 million. We remain responsible for the rent at our previous corporate office at 3700 Buffalo Speedway in Houston, Texas, through February 29, 2016. Effective January 1, 2014, we subleased our previous corporate offices through February 29, 2016 and expect to recover the substantial majority of the rent we pay at that location.
We adopted a Code of Ethics for senior management in December 2002. In January 2014, our board of directors adopted a new Code of Business Conduct and Ethics ("Code of Conduct") that applies to all directors, officers and employees of the Company. Our Code of Conduct is available on the Company's website at www.contango.com. Any shareholder who so requests may obtain a copy of the Code of Conduct by submitting a request to the Company's corporate secretary at the address on the cover of this Form 10-K. Changes in and waivers to the Code of Conduct for the Company's directors, chief executive officer and certain senior financial officers will be posted on the Company's website within five business days and maintained for at least 12 months. Information on our website or any other website is not incorporated by reference into, and does not constitute a part of, this Report on Form 10-K.
You may read and copy all or any portion of this report on Form 10-K, our quarterly reports on Form 10-Q and current reports on Form 8-K, as well as any amendments and exhibits to those reports, without charge at the office of the Securities and Exchange Commission (the “SEC”) in Public Reference Room, 100 F Street NE, Washington, DC, 20549. Information regarding the operation of the public reference rooms may be obtained by calling the SEC at 1-800-SEC-0330. In addition, filings made with the SEC electronically are publicly available through the SEC's website at http://www.sec.gov, and at our website at http://www.contango.com. This report on Form 10-K, including all exhibits and amendments, has been filed electronically with the SEC.
The demand for oil and natural gas fluctuates depending on the time of year. Seasonal anomalies such as mild winters or hot summers sometimes lessen this fluctuation. In addition, pipelines, utilities, local distribution companies, and industrial end users utilize oil and natural gas storage facilities and purchase some of their anticipated winter requirements during the summer, which can also lessen seasonal demand.
In addition to the other information set forth elsewhere in this Form 10-K, you should carefully consider the following factors when evaluating the Company. An investment in the Company is subject to risks inherent in our business. The trading price of the
18
shares of the Company is affected by the performance of our business relative to, among other things, competition, market conditions and general economic and industry conditions. The value of an investment in the Company may decrease, resulting in a loss.
RISK FACTORS RELATING TO OUR BUSINESS
We have no ability to control the market price for natural gas and oil. Natural gas and oil prices fluctuate widely, and a substantial or extended decline in natural gas and oil prices would adversely affect our revenues, profitability and growth and could have a material adverse effect on the business, the results of operations and financial condition of the Company.
Our revenues, profitability and future growth depend significantly on natural gas and crude oil prices. The markets for these commodities are volatile and prices received affect the amount of future cash flow available for capital expenditures and repayment of indebtedness and our ability to raise additional capital. Lower prices may also affect the amount of natural gas and oil that we can economically produce. Factors that can cause price fluctuations include:
|
· |
Overall economic conditions, domestic and global. |
|
· |
The domestic and foreign supply of natural gas and oil. |
|
· |
The level of consumer product demand. |
|
· |
Adverse weather conditions and natural disasters. |
|
· |
The price and availability of competitive fuels such as LNG, heating oil and coal. |
|
· |
Political conditions in the Middle East and other natural gas and oil producing regions. |
|
· |
The level of LNG imports and any LNG exports. |
|
· |
Domestic and foreign governmental regulations. |
|
· |
Special taxes on production. |
|
· |
Access to pipelines and gas processing plants. |
|
· |
The loss of tax credits and deductions. |
A substantial or extended decline in natural gas and oil prices could have a material adverse effect on our access to capital and the quantities of natural gas and oil that may be economically produced by us. A significant decrease in price levels for an extended period would negatively affect us. The Company has, in the past, utilized financial derivative contracts, such as swaps, costless collars and puts on commodity prices, to reduce exposure to potential declines in commodity prices. We currently do not have derivative arrangements in place on any post-2014 production.
Part of our strategy involves drilling in new or emerging plays; therefore, our drilling results in these areas are not certain.
The results of our drilling in new or emerging plays, such as in our South Texas and Wyoming resource plays, are more uncertain than drilling results in areas that are more developed and with longer production history. Since new or emerging plays and new formations have limited production history, we are less able to use past drilling results in those areas to help predict our future drilling results. The ultimate success of these drilling and completion strategies and techniques in these formations will be better evaluated over time as more wells are drilled and production profiles are better established. Accordingly, our drilling results are subject to greater risks in these areas and could be unsuccessful. We may be unable to execute our expected drilling program in these areas because of disappointing drilling results, capital constraints, lease expirations, access to adequate gathering systems or pipeline take-away capacity, availability of drilling rigs and other services or otherwise, and/or crude oil, natural gas and natural gas liquids price declines. To the extent we are unable to execute our expected drilling program in these areas, our return on investment may not be as attractive as we anticipate and our common stock price may decrease. We could incur material write-downs of unevaluated properties, and the value of our undeveloped acreage could decline in the future if our drilling results are unsuccessful.
19
Initial production rates in shale plays tend to decline steeply in the first twelve months of production and are not necessarily indicative of sustained production rates.
Our future cash flows are subject to a number of variables, including the level of production from existing wells. Initial production rates in shale plays tend to decline steeply in the first twelve months of production and are not necessarily indicative of sustained production rates. As a result, we generally must locate and develop or acquire new crude oil or natural gas reserves to offset declines in these initial production rates. If we are unable to do so, these declines in initial production rates may result in a decrease in our overall production and revenue over time.
Our development and exploration operations require substantial capital, and we may be unable to obtain needed capital or financing on satisfactory terms, which could lead to a loss of undeveloped acreage and a decline in our crude oil, natural gas and natural gas liquids reserves.
The oil and gas industry is capital intensive. We make and expect to continue to make substantial capital expenditures in our business and operations for the exploration, development, production and acquisition of crude oil, natural gas and natural gas liquids reserves. We intend to finance our future capital expenditures primarily with cash flow from operations and borrowings under our senior secured revolving credit agreement. Our cash flow from operations and access to capital is subject to a number of variables, including:
|
· |
Our proved reserves. |
|
· |
The level of crude oil, natural gas and natural gas liquids we are able to produce from existing wells. |
|
· |
The prices at which crude oil, natural gas and natural gas liquids are sold. |
|
· |
Our ability to acquire, locate and produce new reserves. |
If our revenues decrease as a result of lower crude oil, natural gas and natural gas liquids prices, operating difficulties, declines in reserves or for any other reason, we may have limited ability to obtain the capital necessary to sustain our operations at current levels, to further develop and exploit our current properties, or to conduct exploratory activity. In order to fund our capital expenditures, we may need to seek additional financing. Our credit agreements contain covenants restricting our ability to incur additional indebtedness without the consent of the lenders. Our lenders may withhold this consent in their sole discretion. In addition, if our borrowing base redetermination results in a lower borrowing base under our senior secured revolving credit agreement, we may be unable to obtain financing otherwise available under our senior secured revolving credit agreement. Since the last regularly scheduled redetermination of our borrowing base, effective through May 1, 2015, commodity prices have continued to decline. The decline in prices will likely negatively impact the price decks utilized by banks in their calculation of the Company’s borrowing base at May 1, 2015. It is not possible to forecast what that adjustment to the borrowing base might be at that time, and because of that uncertainty, the Company has currently limited its planned 2015 capital expenditure budget to a level that can be funded by internally generated cash flows. See “Item 7. Management’s Discussion and Analysis of Financial Condition and Results of Operations - Capital Resources and Liquidity.”
Furthermore, we may not be able to obtain debt or equity financing on terms favorable to us, or at all. In particular, the cost of raising money in the debt and equity capital markets has increased substantially while the availability of funds from those markets generally has diminished significantly. Also, as a result of concerns about the stability of financial markets generally and the solvency of counterparties specifically, the cost of obtaining money from the credit markets generally has increased as many lenders and institutional investors have increased interest rates, enacted tighter lending standards, refused to refinance existing debt at maturity on terms that are similar to existing debt, and reduced, or in some cases ceased, to provide funding to borrowers. The failure to obtain additional financing could result in a curtailment of our operations relating to exploration and development of our prospects, which in turn could lead to a possible loss of properties and a decline in our crude oil, natural gas and natural gas liquids reserves.
We assume additional risk as operator in drilling high pressure and high temperature wells in the Gulf of Mexico.
We continue to drill and operate exploration wells in the Gulf of Mexico. Drilling activities are subject to numerous risks, including the significant risk that no commercially productive hydrocarbon reserves will be encountered. The cost of drilling, completing and operating wells and of installing production facilities and pipelines is often uncertain. Drilling costs could be significantly higher if we encounter difficulty in drilling offshore exploration wells. The Company’s drilling operations may be
20
curtailed, delayed, canceled or negatively impacted as a result of numerous factors, including title problems, weather conditions, compliance with governmental requirements and shortages or delays in the delivery or availability of material, equipment and fabrication yards. In periods of increased drilling activity resulting from high commodity prices, demand exceeds availability for drilling rigs, drilling vessels, supply boats and personnel experienced in the oil and gas industry in general, and the offshore oil and gas industry in particular. This may lead to difficulty and delays in consistently obtaining certain services and equipment from vendors, obtaining drilling rigs and other equipment at favorable rates and scheduling equipment fabrication at factories and fabrication yards. This, in turn, may lead to projects being delayed or experiencing increased costs. The cost of drilling, completing, and operating wells is often uncertain, and new wells may not be productive or we may not recover all or any of our investment. The risk of significant cost overruns, curtailments, delays, inability to reach our target reservoir and other factors detrimental to drilling and completion operations may be higher due to our inexperience as an operator.
We rely on third-party operators to operate and maintain some of our wells, production platforms, pipelines and processing facilities and, as a result, we have limited control over the operations of such facilities. The interests of an operator may differ from our interests.
We depend upon the services of third-party operators to operate some production platforms, pipelines, gas processing facilities and the infrastructure required to produce and market our natural gas, condensate and oil. We have limited influence over the conduct of operations by third-party operators. As a result, we have little control over how frequently and how long our production is shut-in when production problems, weather and other production shut-ins occur. Poor performance on the part of, or errors or accidents attributable to, the operator of a project in which we participate may have an adverse effect on our results of operations and financial condition. Also, the interest of an operator may differ from our interests.
Repeated offshore production shut-ins can possibly damage our well bores.
Our offshore well bores are required to be shut-in from time to time due to a variety of issues, including a combination of weather, mechanical problems, sand production, bottom sediment, water and paraffin associated with our condensate production, as well as downstream third-party facility and pipeline shut-ins. In addition, shut-ins are necessary from time to time to upgrade and improve the production handling capacity at related downstream platform, gas processing and pipeline infrastructure. In addition to negatively impacting our near term revenues and cash flow, repeated production shut-ins may damage our well bores if repeated excessively or not executed properly. The loss of a well bore due to damage could require us to drill additional wells.
Natural gas and oil reserves are depleting assets and the failure to replace our reserves would adversely affect our production and cash flows.
Our future natural gas and oil production depends on our success in finding or acquiring new reserves. If we fail to replace reserves, our level of production and cash flows will be adversely impacted. Production from natural gas and oil properties decline as reserves are depleted, with the rate of decline depending on reservoir characteristics. Our total proved reserves will decline as reserves are produced unless we conduct other successful exploration and development activities or acquire properties containing proved reserves, or both. Further, the majority of our reserves are proved developed producing. Accordingly, we do not have significant opportunities to increase our production from our existing proved reserves. Our ability to make the necessary capital investment to maintain or expand our asset base of natural gas and oil reserves would be impaired to the extent cash flow from operations is reduced and external sources of capital become limited or unavailable. We may not be successful in exploring for, developing or acquiring additional reserves. If we are not successful, our future production and revenues will be adversely affected.
Reserve estimates depend on many assumptions that may turn out to be inaccurate. Any material inaccuracies in these reserve estimates or underlying assumptions could materially affect the quantities of our reserves.
There are numerous uncertainties in estimating crude oil and natural gas reserves and their value, including many factors that are beyond our control. It requires interpretations of available technical data and various assumptions, including assumptions relating to economic factors. Any significant inaccuracies in these interpretations or assumptions could materially affect the estimated quantities of reserves shown in this report.
In order to prepare these estimates, our independent third-party petroleum engineers must project production rates and timing of development expenditures as well as analyze available geological, geophysical, production and engineering data, and the extent,
21
quality and reliability of this data can vary. The process also requires economic assumptions relating to matters such as natural gas and oil prices, drilling and operating expenses, capital expenditures, taxes and availability of funds.
Actual future production, natural gas and oil prices, revenues, taxes, development expenditures, operating expenses and quantities of recoverable natural gas and oil reserves most likely will vary from our estimates. Any significant variance could materially affect the estimated quantities and pre-tax net present value of reserves shown in a reserve report. In addition, estimates of our proved reserves may be adjusted to reflect production history, results of exploration and development, prevailing natural gas and oil prices and other factors, many of which are beyond our control and may prove to be incorrect over time. As a result, our estimates may require substantial upward or downward revisions if subsequent drilling, testing and production reveal different results. Furthermore, some of the producing wells included in our reserve report have produced for a relatively short period of time. Accordingly, some of our reserve estimates are not based on a multi-year production decline curve and are calculated using a reservoir simulation model together with volumetric analysis. Any downward adjustment could indicate lower future production and thus adversely affect our financial condition, future prospects and market value.
Approximately 24% of our total estimated proved reserves at December 31, 2014 were proved undeveloped reserves.
Recovery of proved undeveloped reserves requires significant capital expenditures and successful drilling operations. The reserve data included in the reserve engineer reports assumes that substantial capital expenditures are required to develop such reserves. Although cost and reserve estimates attributable to our crude oil, natural gas and natural gas liquids reserves have been prepared in accordance with industry standards, we cannot be sure that the estimated costs are accurate, that development will occur as scheduled or that the results of such development will be as estimated.
The present value of future net cash flows from our proved reserves will not necessarily be the same as the current market value of our estimated crude oil, natural gas and natural gas liquids reserves.
You should not assume that the present value of future net revenues from our proved reserves referred to in this report is the current market value of our estimated crude oil, natural gas and natural gas liquids reserves. In accordance with the requirements of the SEC, the estimated discounted future net cash flows from our proved reserves are based on prices and costs on the date of the estimate, held flat for the life of the properties. Actual future prices and costs may differ materially from those used in the present value estimate. The present value of future net revenues from our proved reserves as of December 31, 2014 was based on the 12-month unweighted arithmetic average of the first-day-of-the-month price for the period January through December 2014. For our condensate and natural gas liquids, the average West Texas Intermediate (Cushing) posted price was $94.99 per barrel for offshore volumes and the average West Texas Intermediate (Plains) posted price was $91.48 per barrel for onshore volumes. For our natural gas, the average Henry Hub spot price was $4.30 per MMBtu for offshore volumes and the average Henry Hub spot price was $4.35 per MMBtu for onshore volumes. The following sensitivity analyses for condensate, crude oil and natural gas do not include the volatility reducing effects of our derivative hedging instruments in place at December 31, 2014. If condensate and crude oil prices were $1.00 per Bbl lower than the prices used, our PV‑10 as of December 31, 2014 would have decreased from $796.9 million to $790.0 million. If natural gas prices were $0.10 per Mcf lower than the price used, our PV‑10 as of December 31, 2014, would have decreased from $796.9 million to $785.1 million. Any adjustments to the estimates of proved reserves or decreases in the price of crude oil or natural gas may decrease the value of our common stock. A reconciliation of our Standardized Measure to PV‑10 is provided under "Item 2. Properties - Proved Reserves".
Actual future net cash flows will also be affected by increases or decreases in consumption by oil and gas purchasers and changes in governmental regulations or taxation. The timing of both the production and the incurrence of expenses in connection with the development and production of oil and gas properties affects the timing of actual future net cash flows from proved reserves. The effective interest rate at various times and the risks associated with our business or the oil and gas industry in general will affect the accuracy of the 10% discount factor.
22
Our use of 2D and 3D seismic data is subject to interpretation and may not accurately identify the presence of crude oil, natural gas and natural gas liquids. In addition, the use of such technology requires greater predrilling expenditures, which could adversely affect the results of our drilling operations.
Our decisions to purchase, explore, develop and exploit prospects or properties depend in part on data obtained through geophysical and geological analyses, production data and engineering studies, the results of which are uncertain. For example, we have over 4,000 square miles of 3D data in the South Texas and Gulf Coast regions. However, even when used and properly interpreted, 3D seismic data and visualization techniques only assist geoscientists and geologists in identifying subsurface structures and hydrocarbon indicators. They do not allow the interpreter to know if hydrocarbons are present or producible economically. Other geologists and petroleum professionals, when studying the same seismic data, may have significantly different interpretations than our professionals.
In addition, the use of 3D seismic and other advanced technologies requires greater predrilling expenditures than traditional drilling strategies, and we could incur losses due to such expenditures. As a result, our drilling activities may not be geologically successful or economical, and our overall drilling success rate or our drilling success rate for activities in a particular area may not improve.
Drilling for and producing crude oil, natural gas and natural gas liquids are high risk activities with many uncertainties that could adversely affect our business, financial condition or results of operations.
Our drilling and operating activities are subject to many risks, including the risk that we will not discover commercially productive reservoirs. Drilling for crude oil, natural gas and natural gas liquids can be unprofitable, not only from dry holes, but from productive wells that do not produce sufficient revenues to return a profit. In addition, our drilling and producing operations may be curtailed, delayed or canceled as a result of other factors, including:
|
· |
unusual or unexpected geological formations and miscalculations; |
|
· |
pressures; |
|
· |
fires; |
|
· |
explosions and blowouts; |
|
· |
pipe or cement failures; |
|
· |
environmental hazards, such as natural gas leaks, oil spills, pipeline and tank ruptures, encountering naturally occurring radioactive materials, and unauthorized discharges of toxic gases, brine, well stimulation and completion fluids, or other pollutants into the surface and subsurface environment; |
|
· |
loss of drilling fluid circulation; |
|
· |
title problems; |
|
· |
facility or equipment malfunctions; |
|
· |
unexpected operational events; |
|
· |
shortages of skilled personnel; |
|
· |
shortages or delivery delays of equipment and services or of water used in hydraulic fracturing activities; |
|
· |
compliance with environmental and other regulatory requirements; |
|
· |
natural disasters; and |
|
· |
adverse weather conditions. |
Any of these risks can cause substantial losses, including personal injury or loss of life; severe damage to or destruction of property, natural resources and equipment, pollution, environmental contamination, clean-up responsibilities, loss of wells, repairs to resume operations; and regulatory fines or penalties.
23
Insurance against all operational risks is not available to us. Additionally, we may elect not to obtain insurance if we believe that the cost of available insurance is excessive relative to the perceived risks presented. We carry limited environmental insurance, thus, losses could occur for uninsurable or uninsured risks or in amounts in excess of existing insurance coverage. The occurrence of an event that is not covered in full or in part by insurance could have a material adverse impact on our business activities, financial condition and results of operations.
The potential lack of availability of, or high cost of, drilling rigs, equipment, supplies, personnel and crude oil field services could adversely affect our ability to execute on a timely basis our exploration and development plans within our budget.
When the prices of crude oil, natural gas and natural gas liquids increase, or the demand for equipment and services is greater than the supply in certain areas, we typically encounter an increase in the cost of securing drilling rigs, equipment and supplies. In addition, larger producers may be more likely to secure access to such equipment by offering more lucrative terms. If we are unable to acquire access to such resources, or can obtain access only at higher prices, our ability to convert our reserves into cash flow could be delayed and the cost of producing those reserves could increase significantly, which would adversely affect our results of operations and financial condition.
Our hedging activities could result in financial losses or reduce our income.
To achieve a more predictable cash flow and to reduce our exposure to adverse fluctuations in the prices of crude oil, natural gas and natural gas liquids, as well as interest rates, we have, and may in the future, enter into derivative arrangements for a portion of our crude oil, natural gas and/or natural gas liquids production and our debt that could result in both realized and unrealized hedging losses. We typically utilize financial instruments to hedge commodity price exposure to declining prices on our crude oil, natural gas and natural gas liquids production. We typically use a combination of puts, swaps and costless collars. We currently do not have derivative arrangements in place on any post-2014 production.
Our actual future production may be significantly higher or lower than we estimate at the time we enter into hedging transactions for such period. If the actual amount is higher than we estimate, we will have greater commodity price exposure than we intended. If the actual amount is lower than the nominal amount that is subject to our derivative financial instruments, we might be forced to satisfy all or a portion of our derivative transactions without the benefit of the cash flow from our sale or purchase of the underlying physical commodity, resulting in a substantial diminution of our liquidity. As a result of these factors, our hedging activities may not be as effective as we intend in reducing the volatility of our cash flows, and in certain circumstances may actually increase the volatility of our cash flows.
The enactment of derivatives legislation could have an adverse effect on our ability to use derivative instruments to reduce the effect of commodity price, interest rate, and other risks associated with our business.
The Dodd-Frank Wall Street Reform and Consumer Protection Act (Dodd-Frank Act) enacted in 2010, established federal oversight and regulation of the over-the-counter derivatives market and entities, such as us, that participate in that market. The Dodd-Frank Act requires the Commodities Futures Trading Commission (CFTC) and the SEC to promulgate rules and regulations implementing the Dodd-Frank Act. Although the CFTC has finalized certain regulations, others remain to be finalized or implemented and it is not possible at this time to predict when this will be accomplished.
In October 2011, the CFTC issued regulations to set position limits for certain futures and option contracts in the major energy markets and for swaps that are their economic equivalents. The initial position-limits rule was vacated by the U.S. District Court for the District of Columbia in September 2012. However, in November 2013, the CFTC proposed new rules that would place limits on positions in certain core futures and equivalent swaps contracts for or linked to certain physical commodities, subject to exceptions for certain bona fide hedging transactions. As these new position limit rules are not yet final, the impact of those provisions on us is uncertain at this time.
The CFTC has designated certain interest rate swaps and credit default swaps for mandatory clearing and the associated rules also will require us, in connection with covered derivative activities, to comply with clearing and trade-execution requirements or take steps to qualify for an exemption to such requirements. Although we expect to qualify for the end-user exception from the mandatory clearing requirements for swaps entered to hedge our commercial risks, the application of the mandatory clearing and trade execution requirements to other market participants, such as swap dealers, may change the cost and availability of the swaps that we use for
24
hedging. In addition, for uncleared swaps, the CFTC or federal banking regulators may require end-users to enter into credit support documentation and/or post initial and variation margin. Posting of collateral could impact liquidity and reduce cash available to us for capital expenditures, therefore reducing our ability to execute hedges to reduce risk and protect cash flows. The proposed margin rules are not yet final, and therefore the impact of those provisions on us is uncertain at this time. The Dodd-Frank Act and regulations may also require the counterparties to our derivative instruments to spin off some of their derivatives activities to separate entities, which may not be as creditworthy as the current counterparties.
The full impact of the Dodd-Frank Act and related regulatory requirements upon our business will not be known until the regulations are implemented and the market for derivatives contracts has adjusted. The Dodd-Frank Act and regulations could significantly increase the cost of derivative contracts, materially alter the terms of derivative contracts, reduce the availability of derivatives to protect against risks we encounter, reduce our ability to monetize or restructure our existing derivative contracts or increase our exposure to less creditworthy counterparties. If we reduce our use of derivatives as a result of the Dodd-Frank Act and regulations, our results of operations may become more volatile and our cash flows may be less predictable, which could adversely affect our ability to plan for and fund capital expenditures. Increased volatility may make us less attractive to certain types of investors.
Finally, the Dodd-Frank Act was intended, in part, to reduce the volatility of oil and natural gas prices, which some legislators attributed to speculative trading in derivatives and commodity instruments related to oil and natural gas. Our revenues could therefore be adversely affected if a consequence of the legislation and regulations is to lower commodity prices. Any of these consequences could have a material, adverse effect on us, our financial condition, and our results of operations.
We may incur substantial impairment of proved properties.
If management’s estimates of the recoverable proved reserves on a property are revised downward or if oil and/or natural gas prices decline as they have done in late 2014 and early 2015, and stay low for the remainder of 2015, we may be required to record non-cash impairment write-downs in the future, which would result in a negative impact to our financial results. Furthermore, any sustained decline in oil and/or natural gas prices may require us to make further impairments. We review our proved oil and gas properties for impairment on a depletable unit basis when circumstances suggest there is a need for such a review. To determine if a depletable unit is impaired, we compare the carrying value of the depletable unit to the undiscounted future net cash flows by applying management’s estimates of future oil and natural gas prices to the estimated future production of oil and gas reserves over the economic life of the property. Future net cash flows are based upon our independent reservoir engineers’ estimates of proved reserves. In addition, other factors such as probable and possible reserves are taken into consideration when justified by economic conditions. For each property determined to be impaired, we recognize an impairment loss equal to the difference between the estimated fair value and the carrying value of the property on a depletable unit basis.
Fair value is estimated to be the present value of expected future net cash flows. Any impairment charge incurred is recorded in accumulated depreciation, depletion, and amortization to reduce our recorded basis in the asset. Each part of this calculation is subject to a large degree of judgment, including the determination of the depletable units’ estimated reserves, future cash flows and fair value.
Management’s assumptions used in calculating oil and gas reserves or regarding the future cash flows or fair value of our properties are subject to change in the future. Any change could cause impairment expense to be recorded, impacting our net income or loss and our basis in the related asset. Any change in reserves directly impacts our estimate of future cash flows from the property, as well as the property’s fair value. Additionally, as management’s views related to future prices change, the change will affect the estimate of future net cash flows and the fair value estimates. Changes in either of these amounts will directly impact the calculation of impairment.
Production activities in the Gulf of Mexico increase our susceptibility to pollution and natural resource damage.
A blowout, rupture or spill of any magnitude would present serious operational and financial challenges. All of the Company’s operations in the Gulf of Mexico shelf are in water depths of less than 300 feet and less than 50 miles from the coast. Such proximity to the shore-line increases the probability of a biological impact or damaging the fragile eco-system in the event of released condensate.
25
Climate change legislation and regulatory initiatives restricting emissions of greenhouse gases (“GHGs”) could result in increased operating costs and reduced demand for the oil and natural gas that we produce.
In response to findings that emissions of GHGs present an endangerment to public health and the environment, the EPA has adopted regulations under existing provisions of the CAA that, among other things, establish Prevention of Significant Deterioration (“PSD”) and Title V permit reviews for GHG emissions from certain large stationary sources that already are potential major sources of certain principal, or criteria, pollutant emissions. Facilities required to obtain PSD permits for their GHG emissions also will be required to meet “best available control technology” standards that typically will be established by the states. The EPA has also adopted rules requiring the monitoring and reporting of GHG emissions from specified sources in the United States, including, among others, certain oil and natural gas production facilities on an annual basis, which includes certain of our operations.
While, Congress has from time to time considered legislation to reduce emissions of GHGs, there has not been significant activity in the form of adopted legislation to reduce GHG emissions at the federal level in recent years. In the absence of such federal climate legislation, a number of state and regional efforts have emerged that are aimed at tracking and/or reducing GHG emissions by means of cap and trade programs that typically require major sources of GHG emissions to acquire and surrender emission allowances in return for emitting those GHGs. Although it is not possible at this time to predict how legislation or new regulations that may be adopted to address GHG emissions would impact our business, any such future laws and regulations that require reporting of GHGs or otherwise limit emissions of GHGs from our equipment and operations could require us to incur costs to monitor and report on GHG emissions or reduce emissions of GHGs associated with our operations, and such requirements also could adversely affect demand for the oil and natural gas that we produce. For example, on January 14, 2015, the Obama Administration announced that the EPA is expected to propose in the summer of 2015 and finalize in 2016 new regulations that will set methane emission standards for new and modified oil and gas production and natural gas processing and transmission facilities as part of the Administration’s efforts to reduce methane emissions from the oil and gas sector by up to 45 percent from 2012 levels by 2025. Finally, it should be noted that some scientists have concluded that increasing concentrations of GHGs in the Earth’s atmosphere may produce climate changes that have significant physical effects, such as increased frequency and severity of storms, droughts and floods and other climatic events. If any such effects were to occur, they could have an adverse effect on our financial condition and results of operations.
The natural gas and oil business involves many operating risks that can cause substantial losses and our insurance coverage may not be sufficient to cover some liabilities or losses that we may incur.
The natural gas and oil business involves a variety of operating risks, including:
|
· |
Blowouts, fires and explosions. |
|
· |
Surface cratering. |
|
· |
Uncontrollable flows of underground natural gas, oil or formation water. |
|
· |
Natural disasters. |
|
· |
Pipe and cement failures. |
|
· |
Casing collapses. |
|
· |
Stuck drilling and service tools. |
|
· |
Reservoir compaction. |
|
· |
Abnormal pressure formations. |
|
· |
Environmental hazards such as natural gas leaks, oil spills, pipeline ruptures or unauthorized discharges of toxic gases. |
|
· |
Capacity constraints, equipment malfunctions and other problems at third-party operated platforms, pipelines and gas processing plants over which we have no control. |
|
· |
Repeated shut-ins of our well bores could significantly damage our well bores. |
|
· |
Required workovers of existing wells that may not be successful. |
If any of the above events occur, we could incur substantial losses as a result of:
|
· |
Injury or loss of life. |
26
|
· |
Reservoir damage. |
|
· |
Severe damage to and destruction of property or equipment. |
|
· |
Pollution and other environmental and natural resources damage. |
|
· |
Clean-up responsibilities. |
|
· |
Regulatory investigations and penalties. |
|
· |
Suspension of our operations or repairs necessary to resume operations. |
Offshore operations are subject to a variety of operating risks peculiar to the marine environment, such as capsizing and collisions. In addition, offshore operations, and in some instances operations along the Gulf Coast, are subject to damage or loss from hurricanes or other adverse weather conditions. These conditions can cause substantial damage to facilities and interrupt production. As a result, we could incur substantial liabilities that could reduce the funds available for exploration, development or leasehold acquisitions, or result in loss of properties.
If we were to experience any of these problems, it could affect well bores, platforms, gathering systems and processing facilities, any one of which could adversely affect our ability to conduct operations. In accordance with customary industry practices, we maintain insurance against some, but not all, of these risks. Losses could occur for uninsurable or uninsured risks or in amounts in excess of existing insurance coverage. We may not be able to maintain adequate insurance in the future at rates we consider reasonable, and particular types of coverage may not be available. An event that is not fully covered by insurance could have a material adverse effect on our financial position and results of operations.
Our ability to market our natural gas and oil may be impaired by capacity constraints and equipment malfunctions on the platforms, gathering systems, pipelines and gas plants that transport and process our natural gas and oil.
All of our natural gas and oil is transported through gathering systems, pipelines and processing plants. Transportation capacity on gathering system pipelines and platforms is occasionally limited and at times unavailable due to repairs or improvements being made to these facilities or due to capacity being utilized by other natural gas or oil shippers that may have priority transportation agreements. If the gathering systems, processing plants, platforms or our transportation capacity is materially restricted or is unavailable in the future, our ability to market our natural gas or oil could be impaired and cash flow from the affected properties could be reduced, which could have a material adverse effect on our financial condition and results of operations. Further, repeated shut-ins of our wells could result in damage to our well bores that would impair our ability to produce from these wells and could result in additional wells being required to produce our reserves.
If our access to sales markets is restricted, it could negatively impact our production, our income and ultimately our ability to retain our leases.
Market conditions or the unavailability of satisfactory crude oil, natural gas and natural gas liquids transportation arrangements may hinder our access to crude oil, natural gas and natural gas liquids markets or delay our production. The availability of a ready market for our crude oil, natural gas and natural gas liquids production depends on a number of factors, including the demand for and supply of crude oil, natural gas and natural gas liquids and the proximity of reserves to pipelines and terminal facilities. Our ability to market our production depends in substantial part on the availability and capacity of gathering systems, pipelines and processing facilities owned and operated by third parties. Our failure to obtain such services on acceptable terms could materially harm our business. Our productive properties may be located in areas with limited or no access to pipelines, thereby necessitating delivery by other means, such as trucking, or requiring compression facilities. Such restrictions on our ability to sell our crude oil, natural gas and natural gas liquids may have several adverse effects, including higher transportation costs, fewer potential purchasers (thereby potentially resulting in a lower selling price) or, in the event we were unable to market and sustain production from a particular lease for an extended time, possible loss of a lease due to lack of production.
We may not have title to our leased interests and if any lease is later rendered invalid, we may not be able to proceed with our exploration and development of the lease site.
Our practice in acquiring exploration leases or undivided interests in natural gas and oil leases is to not incur the expense of retaining title lawyers to examine the title to the mineral interest prior to executing the lease. Instead, we rely upon the judgment of
27
consultants and others to perform the field work in examining records in the appropriate governmental, county or parish clerk’s office before leasing a specific mineral interest. This practice is widely followed in the industry. Prior to the drilling of an exploration well the operator of the well will typically obtain a preliminary title review of the drillsite lease and/or spacing unit within which the proposed well is to be drilled to identify any obvious deficiencies in title to the well and, if there are deficiencies, to identify measures necessary to cure those defects to the extent reasonably possible. However, such deficiencies may not have been cured by the operator of such wells. It does happen, from time to time, that the examination made by title lawyers reveals that the lease or leases are invalid, having been purchased in error from a person who is not the rightful owner of the mineral interest desired. In these circumstances, we may not be able to proceed with our exploration and development of the lease site or may incur costs to remedy a defect. It may also happen, from time to time, that the operator may elect to proceed with a well despite defects to the title identified in the preliminary title opinion.
Competition in the natural gas and oil industry is intense, and we are smaller and have a more limited operating history than many of our competitors.
We compete with a broad range of natural gas and oil companies in our exploration and property acquisition activities. We also compete for the equipment and labor required to operate and to develop these properties. Many of our competitors have substantially greater financial resources than we do. These competitors may be able to pay more for exploratory prospects and productive natural gas and oil properties. Further, they may be able to evaluate, bid for and purchase a greater number of properties and prospects than we can. Our ability to explore for natural gas and oil and to acquire additional properties in the future depends on our ability to evaluate and select suitable properties and to consummate transactions in this highly competitive environment. In addition, many of our competitors have been operating for a much longer time than we have and have substantially larger staffs. We may not be able to compete effectively with these companies or in such a highly competitive environment.
Proposed U.S. federal budgets and pending legislation contain certain provisions that, if passed as originally submitted, will have an adverse effect on our financial position, results of operations, and cash flows.
The federal administration has released repeated budget proposals over the past few years which include numerous proposed tax changes. The proposed budgets and legislation would repeal many tax incentives and deductions that are currently used by oil and gas companies in the United States and impose new taxes. Among others, the provisions include: elimination of the ability to fully deduct intangible drilling costs in the year incurred; repeal of the percentage depletion deduction for oil and gas properties; repeal of the manufacturing tax deduction for oil and gas companies; increase in the geological and geophysical amortization period for independent producers; and implementation of a fee on non-producing leases located on federal lands. Should some or all of these provisions become law, taxes on the E&P industry would increase, which could have a negative impact on our results of operations and cash flows. Although these proposals initially were made in 2009, none have become law. It is still, however, the federal administration’s stated intention to enact legislation to repeal tax incentives and deductions and impose new taxes on oil and gas companies.
We are subject to stringent laws and regulations, including environmental requirements that can adversely affect the cost, manner or feasibility of doing business.
Our operations are subject to numerous federal, state and local laws and regulations governing the operation and maintenance of our facilities, the discharge of materials into the environment and environmental protection. Failure to comply with such rules and regulations could result in the assessment of substantial penalties, imposition of investigatory or remedial obligations, and the issuance of orders limiting or prohibiting some or all of our operations. These laws and regulations:
|
· |
Require that we obtain permits before commencing drilling or other regulated activities. |
|
· |
Restrict the substances that can be released into the environment in connection with drilling and production activities. |
|
· |
Limit or prohibit drilling activities on protected areas, such as wetlands or wilderness areas. |
|
· |
Require remedial measures to mitigate pollution from former operations, such as plugging abandoned wells. |
|
· |
Apply specific health and safety criteria addressing worker protection. |
28
Under these laws and regulations, we could be liable for personal injury and clean-up costs and other environmental and property damages, as well as administrative, civil and criminal penalties. We maintain only limited insurance coverage for sudden and accidental environmental damages. Accordingly, we may be subject to liability, or we may be required to cease production from properties in the event of environmental damages. These laws and regulations have been changed frequently in the past. In general, these changes have imposed more stringent requirements that increase operating costs or require capital expenditures in order to remain in compliance. It is also possible that unanticipated developments could cause us to make environmental expenditures that are significantly different from those we currently expect. Existing laws and regulations could be changed and any such changes could have an adverse effect on our business and results of operations. For example, in December 2014, the EPA published a proposed rulemaking that it expects to finalize by October 1, 2015, which rulemaking proposes to revise the National Ambient Air Quality Standard for ozone between 65 to 70 ppb for both the 8-hour primary and secondary standards.
Federal, state and local legislative and regulatory initiatives relating to hydraulic fracturing, as well as governmental reviews of such activities, could result in increased costs, additional operating restrictions or delays, and adversely affect our production.
Hydraulic fracturing is an important and common practice that is used to stimulate production of natural gas and/or oil from dense subsurface rock formations. The hydraulic fracturing process involves the injection of water, sand and chemicals under pressure into targeted subsurface formations to fracture the surrounding rock and stimulate production. We routinely use hydraulic fracturing techniques in many of our drilling and completion programs. Hydraulic fracturing typically is regulated by state oil and natural gas commissions, or other similar state agencies, but several federal agencies have asserted regulatory authority over certain aspects of the process. For example, the EPA has issued final Clean Air Act regulations governing performance standards, including standards for the capture of air emissions released during hydraulic fracturing; announced its intent to propose in the first half of 2015 effluent limit guidelines that wastewater from shale gas extraction operations must meet before discharging to a treatment plant; and issued in May 2014 a prepublication of its Advance Notice of Proposed Rulemaking regarding Toxic Substances Control Act reporting of the chemical substances and mixtures used in hydraulic fracturing. Also, the BLM issued a revised proposed rule containing disclosure requirements and other mandates for hydraulic fracturing on federal lands and the agency is now analyzing comments to the proposed rulemaking and is expected to promulgate a final rule in the first half of 2015. Moreover, from time to time, Congress has considered adopting legislation intended to provide for federal regulation of hydraulic fracturing and to require disclosure of the chemicals used in the hydraulic fracturing process. In addition to any actions by Congress, certain states, including Texas, where we conduct operations, have adopted and other states are considering adopting legal requirements that could impose new or more stringent permitting, public disclosure, and well construction requirements on hydraulic fracturing activities. States could elect to prohibit hydraulic fracturing altogether, such as the State of New York announced in December 2014. Local government also may seek to adopt ordinances within their jurisdictions regulating the time, place or manner of drilling activities in general or hydraulic fracturing activities in particular. In the event that new or more stringent federal, state, or local legal restrictions relating to the hydraulic fracturing process are adopted in areas where we currently or in the future plan to operate, we could incur potentially significant added costs to comply with such requirements, experience delays or curtailment in the pursuit of exploration, development, or production activities, and perhaps even be precluded from drilling wells.
In addition, certain governmental reviews are underway that focus on environmental aspects of hydraulic fracturing practices. The White House Council on Environmental Quality is coordinating an administration-wide review of hydraulic fracturing practices. The EPA has commenced a study of the potential environmental effects of hydraulic fracturing on drinking water and groundwater, with a report drawing conclusions about the potential impacts of hydraulic fracturing on drinking water resources expected to be available for public comment and peer review in the first half of 2015. These existing or any future studies, depending on their degree of pursuit and any meaningful results obtained, could spur initiatives to further regulate hydraulic fracturing.
Additional offshore drilling laws and regulations, delays in the processing and approval of drilling permits and exploration and oil spill-response plans, and other related restrictions in the Gulf of Mexico may have a material adverse effect on our business, financial condition, or results of operations.
In response to the Deepwater Horizon drilling rig explosive incident and resulting oil spill in the United States Gulf of Mexico in 2010, the BOEM and BSEE, have imposed new and more stringent permitting procedures and regulatory safety and performance requirements for new wells to be drilled in federal waters. These governmental agencies have implemented and enforced new rules, Notices to Lessees and Operators and temporary drilling moratoria that imposed safety and operational performance
29
measures on exploration, development and production operators in the Gulf of Mexico or otherwise resulted in a temporary cessation of drilling activities. In addition, states may adopt and implement similar or more stringent legal requirements applicable to exploration and production activities in state waters. Compliance with these added and more stringent regulatory restrictions, in addition to any uncertainties or inconsistencies in current decisions and rulings by governmental agencies and delays in the processing and approval of drilling permits and exploration, development and oil spill-response plans could adversely affect or delay new drilling and ongoing development efforts, which could have a material adverse impact on our business. Moreover, these governmental agencies are continuing to evaluate aspects of safety and operational performance in the Gulf of Mexico and, as a result, developing and implementing new, more restrictive requirements. One example is the 2013 amendments to the federal Workplace Safety Rule regarding the utilization of a more comprehensive SEMS program, which amended rule is sometimes referred to as SEMS II. This program requires operators to identify, address, and manage safety and environmental hazards during the design, construction, start-up, operation, inspection, and maintenance of all new and existing facilities. Facilities must be designed, constructed, maintained, monitored, and operated in a manner compatible with industry codes, consensus standards, and all applicable governmental regulations. Failure to comply with the SEMS program may force us to cease operations in the Gulf of Mexico. A second, and more recent, example is the August 2014 Advanced Notice of Proposed Rulemaking that ultimately seeks to bolster the offshore financial assurance and bonding program. Changes to the bonding program could result in the increased amounts of bonds to operate in the Gulf of Mexico. These additional measures could delay or disrupt our operations, increase the risk of expired leases due to the time required to develop new technology, result in increased supplemental bonding requirements and incurrence of associated added costs, limit operational activities in certain areas, or cause us to incur penalties, fines, or shut-in production. If material spill incidents similar to the Deepwater Horizon incident were to occur in the future, the United States could elect to again issue directives to temporarily cease drilling activities and, in any event, may from time to time issue further safety and environmental laws and regulations regarding offshore oil and natural gas exploration and development, any of which developments could have a material adverse effect on our business
The BSEE has implemented much more stringent controls and reporting requirements that if not followed, could result in significant monetary penalties or a shut-in of all or a portion of our Gulf of Mexico operations.
The BSEE is the federal agency responsible for overseeing the safe and environmentally responsible development of energy and mineral resources on the OCS. They are responsible for leading the most aggressive and comprehensive reforms to offshore oil and gas regulation and oversight in U.S. history. Their reforms have tightened requirements for everything from well design and workplace safety to corporate accountability.
Additionally, the OCS Lands Act authorizes and requires the BSEE to provide for both an annual scheduled inspection and a periodic unscheduled (unannounced) inspection of all oil and gas operations on the OCS. In addition to examining all safety equipment designed to prevent blowouts, fires, spills, or other major accidents, the inspections focus on pollution, drilling operations, completions, workovers, production, and pipeline safety. Upon detecting a violation, the inspector issues an Incident of Noncompliance ("INC") to the operator and uses one of two main enforcement actions (warning or shut-in), depending on the severity of the violation. If the violation is not severe or threatening, a warning INC is issued. The warning INC must be corrected within a reasonable amount of time specified on the INC. The shut-in INC may be for a single component (a portion of the facility) or the entire facility. The violation must be corrected before the operator is allowed to resume the activity in question.
In addition to the enforcement actions specified above, the BSEE can assess a civil penalty of up to $40,000 per violation per day if: (i) the operator fails to correct the violation in the reasonable amount of time specified on the INC; or (ii) the violation resulted in a threat of serious harm or damage to human life or the environment. Operators with excessive INCs may be required to cease operations in the Gulf of Mexico.
We are highly dependent on our senior management team, our exploration partners, third-party consultants and engineers, and other key personnel and any failure to retain the services of such parties could adversely affect our ability to effectively manage our overall operations or successfully execute current or future business strategies.
The successful implementation of our business strategy and handling of other issues integral to the fulfillment of our business strategy is highly dependent on our management team, as well as certain key geoscientists, geologists, engineers and other professionals engaged by us. The loss of key members of our management team or other highly qualified technical professionals could adversely affect our ability to effectively manage our overall operations or successfully execute current or future business strategies
30
which may have a material adverse effect on our business, financial condition and operating results. Our ability to manage our growth, if any, will require us to continue to train, motivate and manage our employees and to attract, motivate and retain additional qualified personnel. Competition for these types of personnel is intense and we may not be successful in attracting, assimilating and retaining the personnel required to grow and operate our business profitably.
Acquisition prospects are difficult to assess and may pose additional risks to our operations.
We expect to evaluate and, where appropriate, pursue acquisition opportunities on terms our management considers favorable. The successful acquisition of natural gas and oil properties requires an assessment of:
|
· |
Recoverable reserves. |
|
· |
Exploration potential. |
|
· |
Future natural gas and oil prices. |
|
· |
Operating costs. |
|
· |
Potential environmental and other liabilities and other factors. |
|
· |
Permitting and other environmental authorizations required for our operations. |
In connection with such an assessment, we would expect to perform a review of the subject properties that we believe to be generally consistent with industry practices. Nonetheless, the resulting conclusions are necessarily inexact and their accuracy inherently uncertain and such an assessment may not reveal all existing or potential problems, nor will it necessarily permit a buyer to become sufficiently familiar with the properties to fully assess their merits and deficiencies. Inspections may not always be performed on every platform or well, and structural and environmental problems are not necessarily observable even when an inspection is undertaken. Future acquisitions could pose additional risks to our operations and financial results, including:
|
· |
Problems integrating the purchased operations, personnel or technologies. |
|
· |
Unanticipated costs. |
|
· |
Diversion of resources and management attention from our exploration business. |
|
· |
Entry into regions or markets in which we have limited or no prior experience. |
|
· |
Potential loss of key employees of the acquired organization. |
We may be unable to successfully integrate the properties and assets we acquire with our existing operations.
Integration of the properties and assets we acquire may be a complex, time consuming and costly process. Failure to timely and successfully integrate these assets and properties with our operations may have a material adverse effect on our business, financial condition and result of operations. The difficulties of integrating these assets and properties present numerous risks, including:
|
· |
Acquisitions may prove unprofitable and fail to generate anticipated cash flows. |
|
· |
We may need to (i) recruit additional personnel and we cannot be certain that any of our recruiting efforts will succeed and (ii) expand corporate infrastructure to facilitate the integration of our operations with those associated with the acquired properties, and failure to do so may lead to disruptions in our ongoing businesses or distract our management. |
|
· |
Our management’s attention may be diverted from other business concerns. |
We are also exposed to risks that are commonly associated with acquisitions of this type, such as unanticipated liabilities and costs, some of which may be material. As a result, the anticipated benefits of acquiring assets and properties may not be fully realized, if at all.
When we acquire properties, in most cases, we are not entitled to contractual indemnification for pre-closing liabilities, including environmental liabilities.
We generally acquire interests in properties on an “as is” basis with limited remedies for breaches of representations and warranties, and in these situations we cannot assure you that we will identify all areas of existing or potential exposure. In those
31
circumstances in which we have contractual indemnification rights for pre-closing liabilities, we cannot assure you that the seller will be able to fulfill its contractual obligations. In addition, the competition to acquire producing crude oil, natural gas and natural gas liquids properties is intense and many of our larger competitors have financial and other resources substantially greater than ours. We cannot assure you that we will be able to acquire producing crude oil, natural gas and natural gas liquids properties that have economically recoverable reserves for acceptable prices.
RISK FACTORS RELATED TO AN INVESTMENT IN OUR COMMON STOCK
The price of our common stock may fluctuate significantly, and you could lose all or part of your investment.
Volatility in the market price of our common stock may prevent you from being able to sell your common stock at or above the price you paid for your common stock. The market price for our common stock could fluctuate significantly for various reasons, including:
|
· |
our operating and financial performance and prospects; |
|
· |
our quarterly or annual earnings or those of other companies in our industry; |
|
· |
conditions that impact demand for crude oil, natural gas and natural gas liquids, domestically and globally; |
|
· |
future announcements concerning our business; |
|
· |
changes in financial estimates and recommendations by securities analysts; |
|
· |
actions of competitors; |
|
· |
market and industry perception of our success, or lack thereof, in pursuing our growth strategy; |
|
· |
strategic actions by us or our competitors, such as acquisitions or restructurings; |
|
· |
changes in government and environmental regulation; |
|
· |
general market, economic and political conditions, domestically and globally; |
|
· |
changes in accounting standards, policies, guidance, interpretations or principles; |
|
· |
sales of common stock by us, our significant stockholders or members of our management team; and |
|
· |
natural disasters, terrorist attacks and acts of war. |
In addition, in recent years, the stock market has experienced significant price and volume fluctuations. This volatility has had a significant impact on the market price of securities issued by many companies, including companies in our industry. The changes frequently appear to occur without regard to the operating performance of the affected companies. Hence, the price of our common stock could fluctuate based upon factors that have little or nothing to do with our company, and these fluctuations could materially reduce our share price.
We have no plans to pay regular dividends on our common stock, so you may not receive funds without selling your common stock.
Our board of directors presently intends to retain all of our earnings for the expansion of our business; therefore, we have no plans to pay regular dividends on our common stock. Any payment of future dividends will be at the discretion of our board of directors and will depend on, among other things, our earnings, financial condition, capital requirements, level of indebtedness, statutory and contractual restrictions applying to the payment of dividends, and other considerations that our board of directors deems relevant. Also, the provisions of our senior secured revolving credit agreement and second lien credit agreement restrict the payment of dividends. Accordingly, you may have to sell some or all of your common stock in order to generate cash flow from your investment.
32
Future sales or the possibility of future sales of a substantial amount of our common stock may depress the price of shares of our common stock.
Future sales or the availability for sale of substantial amounts of our common stock in the public market could adversely affect the prevailing market price of our common stock and could impair our ability to raise capital through future sales of equity securities.
We may issue shares of our common stock or other securities from time to time as consideration for future acquisitions and investments. If any such acquisition or investment is significant, the number of shares of our common stock, or the number or aggregate principal amount, as the case may be, of other securities that we may issue may in turn be substantial. We may also grant registration rights covering those shares of our common stock or other securities in connection with any such acquisitions and investments.
As of December 31, 2014, we had 129,934 options to purchase shares of our common stock outstanding, all of which were fully vested.
We cannot predict the size of future issuances of our common stock or the effect, if any, that future issuances and sales of our common stock will have on the market price of our common stock. Sales of substantial amounts of our common stock (including shares of our common stock issued in connection with an acquisition), or the perception that such sales could occur, may adversely affect prevailing market prices for our common stock.
Our organizational documents may impede or discourage a takeover, which could deprive our investors of the opportunity to receive a premium for their shares.
Provisions of our certificate of incorporation and bylaws may make it more difficult for, or prevent a third party from, acquiring control of us without the approval of our board of directors. These provisions:
|
· |
permit us to issue, without any further vote or action by the stockholders, shares of preferred stock in one or more series and, with respect to each such series, to fix the number of shares constituting the series and the designation of the series, the voting powers (if any) of the shares of the series, and the preferences and relative, participating, optional, and other special rights, if any, and any qualification, limitations or restrictions of the shares of such series; |
|
· |
require special meetings of the stockholders to be called by the Chairman of the Board, the Chief Executive Officer, the President, or by resolution of a majority of the board of directors; |
|
· |
require business at special meetings to be limited to the stated purpose or purposes of that meeting; |
|
· |
require that stockholder action be taken at a meeting rather than by written consent, unless approved by our board of directors; |
|
· |
require that stockholders follow certain procedures, including advance notice procedures, to bring certain matters before an annual meeting or to nominate a director for election; and |
|
· |
permit directors to fill vacancies in our board of directors. |
We are subject to the Delaware business combination law.
We are subject to the provisions of Section 203 of the Delaware General Corporation Law. In general, Section 203 prohibits a publicly held Delaware corporation from engaging in a “business combination” with an “interested stockholder” for a period of three years after the date of the transaction in which the person became an interested stockholder, unless the business combination is approved in a prescribed manner.
Section 203 defines a “business combination” as a merger, asset sale or other transaction resulting in a financial benefit to the interested stockholders. Section 203 defines an “interested stockholder” as a person who, together with affiliates and associates, owns, or, in some cases, within three years prior, did own, 15% or more of the corporation’s voting stock. Under Section 203, a business combination between us and an interested stockholder is prohibited unless:
33
|
· |
our board of directors approved either the business combination or the transaction that resulted in the stockholders becoming an interested stockholder prior to the date the person attained the status; |
|
· |
upon consummation of the transaction that resulted in the stockholder becoming an interested stockholder, the interested stockholder owned at least 85% of our voting stock outstanding at the time the transaction commenced, excluding, for purposes of determining the number of shares outstanding, shares owned by persons who are directors and also officers and issued employee stock plans, under which employee participants do not have the right to determine confidentially whether shares held under the plan will be tendered in a tender or exchange offer; or |
|
· |
the business combination is approved by our board of directors on or subsequent to the date the person became an interested stockholder and authorized at an annual or special meeting of the stockholders by the affirmative vote of the holders of at least 66 2/3% of the outstanding voting stock that is not owned by the interested stockholder. |
This provision has an anti-takeover effect with respect to transactions not approved in advance by our board of directors, including discouraging takeover attempts that might result in a premium over the market price for the shares of our common stock. With approval of our stockholders, we could amend our certificate of incorporation in the future to elect not to be governed by the anti-takeover law.
Our business could be negatively affected by security threats, including cybersecurity threats and other disruptions.
As an oil and gas producer, we face various security threats, including cybersecurity threats to gain unauthorized access to sensitive information or to render data or systems unusable; threats to the security of our facilities and infrastructure or third party facilities and infrastructure, such as processing plants and pipelines; and threats from terrorist acts. The potential for such security threats has subjected our operations to increased risks that could have a material adverse effect on our business. In particular, our implementation of various procedures and controls to monitor and mitigate security threats and to increase security for our information facilities and infrastructure may result in increased capital and operating costs. Moreover, there can be no assurance that such procedures and controls will be sufficient to prevent security breaches from occurring. If any of these security breaches were to occur, they could lead to losses of sensitive information, critical infrastructure or capabilities essential to our operations and could have a material adverse effect on our reputation, financial position, results of operations or cash flows. Cybersecurity attacks in particular are becoming more sophisticated and include, but are not limited to, malicious software, attempts to gain unauthorized access to data and systems and other electronic security breaches that could lead to disruptions in critical systems, unauthorized release of confidential or otherwise protected information, and corruption of data. These events could lead to financial losses from remedial actions, loss of business or potential liability.
Item 1B. Unresolved Staff Comments
None
34
As of December 31, 2014, we operated all of our offshore wells, with an average working interest of 61%, and operated 56% of our onshore wells with an average working interest of 74%. As of December 31, 2014, our properties were located in the following regions: Offshore Gulf of Mexico, Southeast Texas, South Texas and Other.
Development, Exploration and Acquisition Expenditures
The following table presents information regarding our net costs incurred in the purchase of proved and unproved properties and in exploration and development activities for the periods indicated (in thousands):
|
Year Ended December 31, |
|||||||||
|
2014 |
2013 |
2012 |
|||||||
|
Property acquisition costs: |
|||||||||
|
Unproved |
$ |
22,087 |
$ |
8,134 |
$ |
19,982 | |||
|
Proved |
— |
428,925 | 280 | ||||||
|
Exploration costs |
49,680 | 15,551 | 41,265 | ||||||
|
Development costs |
120,630 | 35,363 | 16,090 | ||||||
|
Total costs |
$ |
192,397 |
$ |
487,973 |
$ |
77,617 | |||
Included in unproved property acquisition costs for the year ended December 31, 2014, is $7.0 million related to the acquisition of the right to earn acreage in Natrona and Weston counties, Wyoming. Included in the exploration costs for the year ended December 31, 2014, is $28.0 million related to drilling our offshore Ship Shoal 255 well.
Included in proved property acquisition costs for the year ended December 31, 2013, is $413.9 million related to the acquisition of Crimson properties as a result of the Merger. Also included is $15 million related to exercising a preferential right and purchasing an additional 7.84% working interest and 6.53% net revenue interest in the five Company-operated Dutch wells from an independent oil and gas company for $18.8 million; adjustments reduced the purchase price to a total of $14.7 million, net to us during 2014.
Included in the exploration costs for the year ended December 31, 2013, is $10.6 million related to drilling our offshore South Timbalier 17 and Ship Shoal 255 wells.
The following table presents information regarding our share of the net costs incurred by Exaro in the purchase of proved and unproved properties and in exploration and development activities for the periods indicated (in thousands):
|
Year Ended December 31, |
|||||||||
|
2014 |
2013 |
2012 |
|||||||
|
Property acquisition costs |
$ |
— |
$ |
— |
$ |
— |
|||
|
Exploration costs |
— |
— |
— |
||||||
|
Development costs |
30,288 | 51,014 | 20,528 | ||||||
|
Total costs incurred |
$ |
30,288 |
$ |
51,014 |
$ |
20,528 | |||
On December 31, 2013, we sold to an independent oil and gas company approximately 7.1% of our interest in all developed and undeveloped properties in Madison and Grimes counties for approximately $20.3 million. Metrics for the sale were approximately $91,007 per flowing barrel of equivalent daily production and $47.32 per equivalent barrel of proved reserves. A loss of approximately $0.2 million and a gain of approximately $6.6 million related to this sale were recognized in the years ended December 31, 2014 and 2013, respectively. See Note 5 to our Financial Statements - "Acquisitions, Dispositions and Gains from Affiliates" for a detailed description of this disposition.
As of December 31, 2014, we had 11 wells in various stages of drilling and completing, whose results are not included below. The following tables show our exploratory and developmental drilling activity for the periods indicated. In the tables, “gross”
35
wells refer to wells in which we have a working interest, and “net” wells refer to gross wells multiplied by our working interest in such wells.
|
Year Ended December 31, |
||||||||||||
|
2014 |
2013 |
2012 |
||||||||||
|
Gross |
Net |
Gross |
Net |
Gross |
Net |
|||||||
|
Exploratory Wells: |
||||||||||||
|
Productive (onshore) |
3 | 1.3 | 3 | 0.3 |
— |
— |
||||||
|
Productive (offshore) |
— |
— |
1 | 0.8 |
— |
— |
||||||
|
Non-productive (onshore) |
1 | 0.6 |
— |
— |
— |
— |
||||||
|
Non-productive (offshore) |
1 | 1.0 |
— |
— |
2 | 2.0 | ||||||
|
Total |
5 | 2.9 | 4 | 1.1 | 2 | 2.0 | ||||||
For the year ended December 31, 2014, included in productive (onshore) exploratory wells is one well drilled on our Buda acreage and two wells drilled in Fayette and Gonzales counties, Texas. Included in non-productive (offshore) exploratory wells is our unsuccessful well at Ship Shoal 255.
|
Year Ended December 31, |
||||||||||||
|
2014 |
2013 |
2012 |
||||||||||
|
Gross |
Net |
Gross |
Net |
Gross |
Net |
|||||||
|
Development Wells: |
||||||||||||
|
Productive (onshore) |
24 | 13.1 | 5 | 3.2 |
— |
— |
||||||
|
Productive (offshore) |
— |
— |
— |
— |
— |
— |
||||||
|
Non-productive (onshore) |
1 | 0.7 |
— |
— |
— |
— |
||||||
|
Non-productive (offshore) |
— |
— |
— |
— |
— |
— |
||||||
|
Total |
25 | 13.8 | 5 | 3.2 |
— |
— |
||||||
Exploration and Development Acreage
Developed acreage is acreage spaced or assigned to productive wells. Undeveloped acreage is acreage on which wells have not been drilled or completed to a point that would form the basis to determine whether the property is capable of production of commercial quantities of crude oil, natural gas and natural gas liquids. Gross acres are the total acres in which we own a working interest. Net acres are the sum of the fractional working interests we own in gross acres. The following table shows the approximate developed and undeveloped acreage that we have an interest in, by region, at December 31, 2014.
|
Developed Acreage (1)(2) |
Undeveloped Acreage (1)(3) |
|||||||
|
Gross (4) |
Net (5) |
Gross (4) |
Net (5) |
|||||
|
Offshore GOM |
14,618 | 11,828 | 34,692 | 34,692 | ||||
|
Southeast Texas |
26,164 | 15,092 | 13,710 | 7,915 | ||||
|
South Texas |
95,367 | 46,797 | 70,472 | 36,376 | ||||
|
Other (6) |
16,609 | 8,706 | 56,482 | 40,922 | ||||
|
Total |
152,758 | 82,423 | 175,356 | 119,905 | ||||
|
(1) |
Excludes any interest in acreage in which we have no working interest before payout or before initial production. |
|
(2) |
Developed acreage consists of acres spaced or assignable to productive wells. |
|
(3) |
Undeveloped acreage is considered to be those leased acres on which wells have not been drilled or completed to a point that would permit the production of commercial quantities of oil and gas, regardless of whether or not such acreage contains proved reserves. |
|
(4) |
Gross acres refer to the number of acres in which we own a working interest. |
|
(5) |
Net acres represent the number of acres attributable to our proportionate working interest in a lease (e.g., a 50% working interest in a lease covering 320 acres is equivalent to 160 net acres). |
|
(6) |
Other includes acreage in Louisiana, Colorado, Mississippi, Wyoming, and East Texas |
Included in the Offshore GOM acres in the table above are the beneficial interests we have in the offshore acreage owned by Republic Exploration LLC (“REX”). The above table includes our 32.3% interest in REX’s 625 net developed acres.
36
Some of our offshore and onshore leases will expire over the next three years as follows, unless we establish production or take action to extend the terms of these leases:
|
Year ending December 31, |
||||||||||||
|
2015 |
2016 |
2017 |
||||||||||
|
Gross Acres |
Net Acres |
Gross Acres |
Net Acres |
Gross Acres |
Net Acres |
|||||||
|
Offshore GOM |
— |
— |
— |
— |
20,000 | 20,000 | ||||||
|
Southeast Texas |
2,700 | 1,320 | 2,871 | 1,982 | 358 | 270 | ||||||
|
South Texas |
— |
— |
5,039 | 2,833 | 36,259 | 18,239 | ||||||
|
Other (1) |
30,608 | 24,351 | 10,373 | 5,065 | 115 | 48 | ||||||
|
Total |
33,308 | 25,671 | 18,283 | 9,880 | 56,732 | 38,557 | ||||||
|
(1) |
Relates primarily to Louisiana and Mississippi. |
Production, Price and Cost History
See “Item 7. Management’s Discussion and Analysis of Financial Condition and Results of Operations.”
Productive wells are producing wells and wells capable of producing commercial quantities. Completed but marginally producing wells are not considered here as a “productive” well. The following table sets forth the number of gross and net productive natural gas and oil wells in which we owned an interest as of December 31, 2014:
|
Natural Gas Wells |
Oil Wells |
|||||||
|
Gross Wells (1) |
Net Wells (2) |
Gross Wells (1) |
Net Wells (2) |
|||||
|
Offshore GOM |
12 | 7.3 |
— |
— |
||||
|
Southeast Texas |
48 | 26.6 | 43 | 24.1 | ||||
|
South Texas |
227 | 121.5 | 46 | 21.9 | ||||
|
Other |
54 | 26.2 | 9 | 2.6 | ||||
|
Total |
341 | 181.6 | 98 | 48.6 | ||||
|
(1) |
A gross well is a well in which we own an interest. |
|
(2) |
The number of net wells is the sum of our fractional working interests owned in gross wells. |
Estimates of proved reserves and future net revenue as of December 31, 2014 and 2013 were prepared by NSAI and Cobb, our independent petroleum engineering firms. Approximately 52% and 48% of the proved reserves estimates shown herein at December 31, 2014 have been independently prepared by Cobb and NSAI, respectively. Cobb prepared the proved reserves estimates as of December 31, 2014 and 2013 for all of our offshore properties and NSAI prepared the proved reserves estimates as of December 31, 2014 and 2013 for all of our onshore properties.
Estimates of proved reserves and future net revenue as of December 31, 2012 were prepared by Cobb, all in accordance with the definitions and regulations of the SEC. The scope and results of their procedures are summarized in their reports, which are included as exhibits to this Form 10-K. The technical persons responsible for preparing the reserve estimates are independent petroleum engineers and geoscientists that meet the requirements regarding qualifications, independence, objectivity, and confidentiality set forth in the Standards Pertaining to the Estimating and Auditing of Oil and Gas Reserves Information promulgated by the Society of Petroleum Engineers.
The estimates of proved reserves and future net revenue as of December 31, 2014 and 2013 were reviewed by our corporate reservoir engineering department that is independent of the operations department. The corporate reservoir engineering department interacts with geoscience, operating, accounting, and marketing departments to review the integrity, accuracy and timeliness of the data, methods, and assumptions used in the preparation of the reserves estimates. All relevant data is compiled in a computer database application to which only authorized personnel are given access rights. Our Senior Vice President - Engineering is the person primarily responsible for overseeing the preparation of our internal reserve estimates and for reviewing any reserves estimates prepared by an independent petroleum engineering firm. Our Senior Vice President - Engineering has a Bachelor of Science degree in
37
Petroleum Engineering from the University of Texas and over 35 years of industry experience with positions of increasing responsibility. He reports directly to our President and Chief Executive Officer. Reserves are also reviewed internally with senior management and presented to our Board of Directors in summary form on a quarterly basis.
The estimates of proved reserves and future net revenues as of December 31, 2012 were the responsibility of our management, and members of our management met regularly with our independent third-party engineers to review these reserve estimates. Mr. Joseph J. Romano, the Company’s then-Chief Executive Officer, had primary responsibility for the preparation of the reserve report. Mr. Romano has been in the energy industry for over 35 years, but also relied on others with technical backgrounds in a collaborative effort, all of whom provided input to the independent third-party engineers. Mr. Brad Juneau, one of the Company’s directors at the time, monitored production and pressure data daily and provided the majority of the input. Mr. Juneau holds a BS degree in Petroleum Engineering from Louisiana State University. Mr. Juneau has over 30 years of experience in the oil and gas industry and was a former registered petroleum engineer in the State of Texas. Other executives in accounting and production have advanced degrees and specialty licenses and also provided input to the independent third-party engineers and assisted in reviewing the reports.
We maintain adequate and effective internal controls over the underlying data upon which reserves estimates are based. The primary inputs to the reserve estimation process are comprised of technical information, financial data, ownership interests and production data. All field and reservoir technical information, which is communicated to our reservoir engineers quarterly, is confirmed when our third-party reservoir engineers hold technical meetings with geologists, operations and land personnel to discuss field performance and to validate future development plans. Current revenue and expense information is obtained from our accounting records, which are subject to external quarterly reviews, annual audits and our own set of internal controls over financial reporting. Internal controls over financial reporting are assessed for effectiveness annually using criteria set forth in Internal Controls - Integrated Framework issued by the Committee of Sponsoring Organizations of the Treadway Commission. All data such as commodity prices, lease operating expenses, production taxes, field level commodity price differentials, ownership percentages, and well production data are updated in the reserve database by our third-party reservoir engineers and then analyzed by management to ensure that they have been entered accurately and that all updates are complete. Once the reserve database has been entirely updated with current information, and all relevant technical support material has been assembled, our independent engineering firms prepare their independent reserve estimates and final report.
38
The following table reflects our estimated proved reserves as of the dates indicated:
|
December 31, |
||||||||||||
|
2014 |
2013 |
2012 |
||||||||||
|
Crude Oil and Condensate (MBbl) (1) |
||||||||||||
|
Developed |
4,114 | 5,223 | 2,514 | |||||||||
|
Undeveloped |
4,301 | 4,475 |
— |
|||||||||
|
Total |
8,415 | 9,698 | 2,514 | |||||||||
|
Natural Gas (MMcf) (1) |
||||||||||||
|
Developed |
150,235 | 185,535 | 166,307 | |||||||||
|
Undeveloped |
29,416 | 22,395 | 7,725 | |||||||||
|
Total |
179,651 | 207,930 | 174,032 | |||||||||
|
Natural Gas Liquids (MBbl) (1) |
||||||||||||
|
Developed |
5,637 | 6,453 | 5,103 | |||||||||
|
Undeveloped |
1,872 | 1,505 | 227 | |||||||||
|
Total |
7,509 | 7,958 | 5,330 | |||||||||
|
Total MMcfe |
||||||||||||
|
Developed |
208,734 | 255,591 | 212,009 | |||||||||
|
Undeveloped |
66,459 | 58,275 | 9,087 | |||||||||
|
Total (2) |
275,193 | 313,866 | 221,096 | |||||||||
|
Proved developed reserves percentage |
76 |
% |
81 |
% |
96 |
% |
||||||
|
Prices utilized in estimates (3): |
||||||||||||
|
Crude oil ($/Bbl) |
$ |
92.89 |
$ |
106.80 |
$ |
114.24 | ||||||
|
Natural gas ($/MMBtu) |
$ |
4.38 |
$ |
3.73 |
$ |
2.85 | ||||||
|
Natural gas liquids ($/Bbl) |
$ |
33.45 |
$ |
35.92 |
$ |
58.39 | ||||||
|
(1) |
Excludes reserves attributable to our 37% interest in Exaro. |
|
(2) |
During the year ended December 31, 2014, proved reserves decreased by approximately 38.7 Bcfe primarily due to a 22.4 Bcfe negative revision of proved developed producing reserves at our Eugene Island 11 field and normal depletion. The negative revision at Eugene Island 11 was due to a change in forecasted condensate yield and ultimate field abandonment pressure, as determined by our third party engineers taking into account recent field performance. |
|
(3) |
Under SEC rules, prices used in determining our proved reserves are based upon an unweighted 12-month first day of the month average price per MMBtu (Henry Hub spot) of natural gas and per barrel of oil (West Texas Intermediate posted). Prices for natural gas liquids in the table represent average prices for natural gas liquids used in the proved reserve estimates, calculated in accordance with applicable SEC rules. All prices were adjusted for quality, energy content, transportation fees and regional price differentials in determining proved reserves. |
PV-10 at year-end is a non-GAAP financial measure and represents the present value, discounted at 10% per year, of estimated future cash inflows from proved natural gas and crude oil reserves, less future development and production costs using pricing assumptions in effect at the end of the period. PV-10 differs from Standardized Measure of Discounted Net Cash Flows because it does not include the effects of income taxes on future net revenues. Neither PV-10 nor Standardized Measure of Discounted Net Cash Flows represents an estimate of fair market value of our natural gas and crude oil properties. PV-10 is used by the industry and by our management as an arbitrary reserve asset value measure to compare against past reserve bases and the reserve bases of other business entities that are not dependent on the taxpaying status of the entity.
The following table provides a reconciliation of our Standardized Measure to PV‑10 (in thousands):
|
December 31, |
||||||
|
2014 |
2013 |
|||||
|
Pre-tax net present value, discounted at 10% |
$ |
796,871 |
$ |
987,213 | ||
|
Future income taxes, discounted at 10% |
(148,855) | (215,770) | ||||
|
Standardized measure of discounted future net cash flows |
$ |
648,016 |
$ |
771,443 | ||
39
The following table reflects our estimated proved reserves by category as of December 31, 2014 (dollars in thousands):
|
Crude Oil and Condensate (MBbl) |
Natural Gas (MMcf) |
Natural Gas Liquids (MBbl) |
Total (MMcfe) |
% of Total Proved |
PV - 10 |
|||||||||
|
Proved developed producing |
3,896 | 140,423 | 5,073 | 194,231 | 71 |
% |
$ |
626,562 | ||||||
|
Proved developed non-producing |
218 | 9,812 | 564 | 14,503 | 5 |
% |
31,427 | |||||||
|
Proved undeveloped |
4,301 | 29,416 | 1,872 | 66,459 | 24 |
% |
138,882 | |||||||
|
Total |
8,415 | 179,651 | 7,509 | 275,193 | 100 |
% |
$ |
796,871 | ||||||
Our estimated net proved reserves as of December 31, 2014 were approximately 18% crude oil and condensate, 65% natural gas and 17% natural gas liquids.
Total proved developed reserves decreased from 255.6 Bcfe at December 31, 2013 to 208.7 Bcfe at December 31, 2014 primarily as a result of normal production.
The Company annually reviews any proved undeveloped reserves (“PUDs”) to ensure their development within five years from the date of originally booking the reserves. As of December 31, 2014, the Company had approximately 66.5 Bcfe of PUDs related to its onshore activities. Development costs related to these PUDs are projected to be approximately $197 million over the next five years. Our financial resources are expected to be sufficient and within our budget to drill all of the remaining 66.5 Bcfe of proved undeveloped reserves within the five year period.
The following table presents the changes in our total proved undeveloped reserves for the year ended December 31, 2014:
|
Proved Undeveloped Reserves (Mmcfe) |
||
|
Proved undeveloped reserves at December 31 2013 |
58,275 | |
|
Revisions of previous estimates (1) |
(17,174) | |
|
Extensions, discoveries and other additions (2) |
26,997 | |
|
Purchase of minerals in place |
— |
|
|
Disposition of reserves in place |
— |
|
|
Conversion to proved developed |
(1,639) | |
|
Proved undeveloped reserves at December 31 2014 |
66,459 |
|
(1) |
Includes previously planned rate acceleration well in our Dutch and Mary Rose field that will no longer be drilled as well as revisions of previous estimates due to a revised type curve for our Force Area of our Madison/Grimes acreage and lower commodity prices. |
|
(2) |
Attributable to our onshore drilling program during the year ended December 31, 2014. |
40
Summary proved reserve information for our properties as of December 31, 2014, by region, is provided below (excluding reserves attributable to our investment in Exaro) (dollars in thousands):
|
Proved Reserves |
|||||||||||
|
Regions |
Crude Oil (MBbl) |
Natural Gas (MMcf) |
Natural Gas Liquids (MBbl) |
Total (Mmcfe) |
PV - 10 (1) |
||||||
|
Offshore GOM |
1,071 | 115,609 | 3,621 | 143,758 |
$ |
450,115 | |||||
|
Southeast Texas |
4,603 | 23,174 | 2,172 | 63,824 | 204,200 | ||||||
|
South Texas |
2,084 | 32,853 | 1,573 | 54,796 | 126,134 | ||||||
|
Other |
657 | 8,015 | 143 | 12,815 | 16,422 | ||||||
|
Total |
8,415 | 179,651 | 7,509 | 275,193 |
$ |
796,871 | |||||
|
(1) |
Under SEC rules, prices used in determining our proved reserves are based upon an unweighted 12-month first day of the month average price per MMBtu (Henry Hub spot) of natural gas and per barrel of oil (West Texas Intermediate posted). Prices for natural gas liquids in the table represent average prices for natural gas liquids used in the proved reserve estimates, calculated in accordance with applicable SEC rules. All prices, using SEC rules, are adjusted for quality, energy content, transportation fees and regional price differentials in determining proved reserves. |
While we are reasonably certain of recovering our calculated reserves, the process of estimating natural gas and oil reserves is complex. It requires various assumptions, including natural gas and oil prices, drilling and operating expenses, capital expenditures, taxes and availability of funds. Our third party engineers must project production rates, estimate timing and amount of development expenditures, analyze available geological, geophysical, production and engineering data, and the extent, quality and reliability of all of this data may vary. Actual future production, natural gas and oil prices, revenues, taxes, development expenditures, operating expenses and quantities of recoverable natural gas and oil reserves most likely will vary from estimates. Any significant variance could materially affect the estimated quantities and net present value of reserves. In addition, estimates of proved reserves may be adjusted to reflect production history, results of exploration and development, prevailing natural gas and oil prices and other factors, many of which are beyond our control.
Reserves Attributable to our Investment in Exaro
Estimates of proved reserves and future net revenue as of December 31, 2014 and 2013 associated with our investment in Exaro, which we account for using the equity method, were prepared by W.D. Von Gonten and Associates (“Von Gonten”) in accordance with the definitions and regulations of the SEC. The technical persons responsible for preparing the reserve estimates are independent petroleum engineers and geoscientists that meet the requirements regarding qualifications, independence, objectivity, and confidentiality set forth in the Standards Pertaining to the Estimating and Auditing of Oil and Gas Reserves Information promulgated by the Society of Petroleum Engineers.
Reserves as of December 31, 2014 and 2013 were reviewed by our corporate reservoir engineering department as described above. The technical individual at Von Gonten responsible for overseeing the preparation of our reserve estimates as of December 31, 2014 and December 31, 2013 has over 14 years of practical experience in the estimation and evaluation of reserves; is a registered professional engineer in the state of Texas; holds a Bachelor of Science Degree in Petroleum Engineering for Texas A&M University; and is a member in good standing of the Society of Petroleum Engineers.
41
The following table reflects the estimated proved reserves attributable to our Investment in Exaro:
|
December 31 2014 |
December 31 2013 |
December 31 2012 (3) |
||||||||||
|
Crude Oil (MBbl) |
||||||||||||
|
Developed |
529 | 439 | 133 | |||||||||
|
Undeveloped |
262 |
— |
— |
|||||||||
|
Total |
791 | 439 | 133 | |||||||||
|
Natural Gas (MMcf) |
||||||||||||
|
Developed |
45,127 | 39,068 | 11,055 | |||||||||
|
Undeveloped |
20,285 |
— |
— |
|||||||||
|
Total |
65,412 | 39,068 | 11,056 | |||||||||
|
Total MMcfe |
||||||||||||
|
Developed |
48,301 | 41,702 | 11,854 | |||||||||
|
Undeveloped |
21,857 |
— |
— |
|||||||||
|
Total |
70,158 | 41,702 | 11,854 | |||||||||
|
Proved developed reserves percentage |
69 |
% |
100 |
% |
100 |
% |
||||||
|
Standardized measure (1) |
$ |
100,607 |
$ |
63,906 |
$ |
13,661 | ||||||
|
Prices utilized in estimates (2) |
||||||||||||
|
Crude oil ($/Bbl) |
$ |
85.46 |
$ |
87.89 |
$ |
85.71 | ||||||
|
Natural gas ($/MMBtu) |
$ |
4.96 |
$ |
4.04 |
$ |
2.78 | ||||||
|
(1) |
The Company's share of the standardized measure of discounted future net cash flows attributable to our investment in Exaro does not include the effect of income taxes because Exaro is treated a partnership for tax purposes. Exaro allocates any income or expense for tax purposes to its partners. |
|
(2) |
Under SEC rules, prices used in determining our proved reserves are based upon an unweighted 12-month first day of the month average price per MMBtu (Henry Hub spot) of natural gas and per barrel of oil (West Texas Intermediate posted). Prices for natural gas liquids in the table represent average prices for natural gas liquids used in the proved reserve estimates, calculated in accordance with applicable SEC rules. All prices are adjusted for quality, energy content, transportation fees and regional price differentials in determining proved reserves. |
|
(3) |
Reserve amounts and standardized measure as of December 31, 2012 revised by immaterial amount compared to amounts previously stated in the Annual Report on Form 10-K/A for the year ended December 31, 2013. |
Prior Year Reserves
Our estimated net proved natural gas, oil and natural gas liquids reserves as of December 31, 2013, 2012 and 2011 are disclosed in “Item 8. Financial Statements and Supplementary Data – Supplemental Oil and Gas Disclosures (Unaudited)”. Reserves as of December 31, 2013 were based on reserve reports generated by NSAI and Cobb. Reserves as of December 31, 2012 and 2011 were based on reserve reports generated by Cobb, while the reserves associated with our 37% investment in Exaro were prepared by Von Gonten.
From time to time, we are involved in legal proceedings relating to claims associated with our properties, operations or business or arising from disputes with vendors in the normal course of business, including the material matters discussed below.
Mineral interest owners in South Louisiana filed suit against a subsidiary of the Company and several co-defendants in June 2009 in the 31st Judicial District Court situated in Jefferson Davis Parish, Louisiana alleging failure to act as a reasonably prudent operator, failure to explore, waste, breach of contract, etc. in connection with two wells located in Jefferson Davis Parish. Many of the alleged improprieties occurred prior to our ownership of an interest in the wells at issue, although we may have assumed liability otherwise attributable to our predecessors-in-interest through the acquisition documents relating to the acquisition of our interest in these wells. We and our co-defendants obtained a favorable judgment from the trial court following a bench trial. On October 1, 2014, the Louisiana Third Circuit Court of Appeals issued an opinion reversing the trial court’s rulings and rendering judgment in favor of the plaintiffs for approximately $13.4 million. The decision by the court of appeals did not allocate liability among the defendants although we would likely be responsible for at least one-half, and possibly as much as two-thirds, of the judgment if it stands. We and our co-defendants have filed an application for a writ of certiorari to the Louisiana Supreme Court seeking review of this case by the state’s highest court. While there is uncertainty whether the Louisiana Supreme Court will accept our application and, if accepted, rule in our favor, we believe that the decision by the court of appeals presents issues that will resonate with the Louisiana Supreme Court
42
and are of precedential significance sufficient to warrant review by that court. We and our co-defendants are vigorously defending this lawsuit and believe that we have a meritorious position. A companion case involving the same set of facts was filed in the same trial court on April 19, 2013 on behalf of additional mineral interest owners but has been inactive pending the appeal of the original case. Our potential exposure in this companion case is expected to be affected by the outcome of our appeal of the original case.
In November 2010, a subsidiary of the Company, several predecessor operators and several product purchasers were named in a lawsuit filed in the District Court for Lavaca County in Texas by an entity alleging that it owns a working interest in two wells that has not been recognized by us or by predecessor operators to which we have granted indemnification rights. In dispute is whether ownership rights were transferred through a number of decade-old poorly documented transactions. Based on prior summary judgments, the trial court recently entered a final judgment in the case in favor of the plaintiffs for approximately $5.3 million, plus post-judgment interest. We are vigorously defending this lawsuit, believe that we have meritorious defenses and are appealing the trial court’s decision to the applicable state Court of Appeals.
In September 2012, a subsidiary of the Company was named as defendant in a lawsuit filed in district court for Harris County in Texas involving a title dispute over a 1/16th mineral interest in the producing intervals of certain wells operated by us in the Catherine Henderson “A” Unit in Liberty County in Texas. This case was subsequently transferred to the district court for Liberty County, Texas and combined with a suit filed by other parties against the plaintiff claiming ownership of the disputed interest. The plaintiff has alleged that, based on its interpretation of a series of 1972 deeds, it owns an additional 1/16th unleased mineral interest in the producing intervals of these wells on which it has not been paid (this claimed interest is in addition to a 1/16th unleased mineral interest on which it has been paid). We have made royalty payments with respect to the disputed interest in reliance, in part, upon leases obtained from successors to the grantors under the aforementioned deeds, who claim to have retained the disputed mineral interests thereunder. The plaintiff previously alleged damages of approximately $10.7 million although the plaintiff’s claim increases as additional hydrocarbons are produced from the subject wells. We are vigorously defending this lawsuit and believe that we have meritorious defenses. We believe if this matter were to be determined adversely, amounts owed to the plaintiff could be partially offset by recoupment rights we may have against other working interest and/or royalty interest owners in the unit.
In connection with our Merger, several class action lawsuits were brought by Crimson stockholders in Delaware and Texas seeking damages and injunctive relief. Each of these merger-related cases has now been dismissed by the respective court without liability to the Company.
In February 2011, a subsidiary of the Company and certain of its working interest partners and insurance carriers brought suit against a marine construction, dredging and tunneling company and an instrumentality of the United States of America in the U.S. District Court for the Southern District of Texas – Houston Division seeking monetary damages for damage to an offshore pipeline which was struck by a dredge. Following a bench trial in December 2013, the Company and its co-defendants obtained a favorable judgment from the trial court. The defendants are appealing the trial court’s judgment to the U.S. Court of Appeals for the 5th Circuit.
While many of these matters involve inherent uncertainty and we are unable at the date of this filing to estimate an amount of possible loss with respect to certain of these matters, we believe that the amount of the liability, if any, ultimately incurred with respect to these proceedings or claims will not have a material adverse effect on our consolidated financial position as a whole or on our liquidity, capital resources or future annual results of operations. We maintain various insurance policies that may provide coverage when certain types of legal proceedings are determined adversely.
Item 4. Mine Safety Disclosures
Not applicable.
43
PART II
Item 5. Market for Registrant’s Common Equity, Related Stockholder Matters and Issuer Purchases of Equity Securities.
Our common stock was listed on the NYSE MKT (previously the American Stock Exchange) in January 2001 under the symbol “MCF”. The table below shows the high and low sales prices per share of our common stock for the periods indicated.
|
High |
Low |
|||||
|
Year Ended December 31, 2014: |
||||||
|
Quarter Ended March 31, 2014 |
$ |
50.44 |
$ |
40.09 | ||
|
Quarter Ended June 30, 2014 |
$ |
49.28 |
$ |
39.08 | ||
|
Quarter Ended September 30, 2014 |
$ |
42.98 |
$ |
32.80 | ||
|
Quarter Ended December 31, 2014 |
$ |
38.96 |
$ |
28.07 | ||
|
Year Ended December 31, 2013: |
||||||
|
Quarter Ended March 31, 2013 |
$ |
46.05 |
$ |
36.27 | ||
|
Quarter Ended June 30, 2013 |
$ |
40.49 |
$ |
33.50 | ||
|
Quarter Ended September 30, 2013 |
$ |
40.06 |
$ |
33.22 | ||
|
Quarter Ended December 31, 2013 |
$ |
48.80 |
$ |
36.46 | ||
From the period from January 1, 2015 to February 27, 2015, our common stock traded at prices between $23.17 and $33.17 per share.
The following descriptions are summaries of material terms of our common stock, preferred stock, certificate of incorporation and bylaws. This summary is qualified by reference to our certificate of incorporation, bylaws and the designations of our preferred stock, which are filed as exhibits to this report on Form 10-K, and by the provisions of applicable law.
Common Stock
We are authorized to issue up to 50 million shares of common stock. As of February 27, 2015, there were approximately 24.4 million shares of common stock issued and 19.2 million shares of common stock outstanding held by approximately 133 registered shareholders. Approximately 0.1 million shares are in reserve for outstanding stock options under our 2005 Stock Incentive Plan, which we adopted from Crimson in connection with the Merger.
Holders of common stock are entitled to one vote for each share held of record on each matter submitted to a vote of stockholders and, in the event of liquidation, to share ratably in the distribution of assets remaining after payment of liabilities (including preferential distribution and dividend rights of holders of preferred stock). Holders of common stock have no cumulative rights. The holders of a plurality of the outstanding shares of the common stock have the ability to elect all of the directors.
Holders of common stock have no preemptive or other rights to subscribe for shares. Holders of common stock are entitled to such dividends as may be declared by the board of directors out of funds legally available therefor. The Company paid a special one-time dividend of $30.5 million, or $2 per share during the year ended December 31, 2012. Any decision to pay future dividends on our common stock will be at the discretion of our board and will depend upon our financial condition, results of operations, capital requirements, and other factors our board may deem relevant. We do not anticipate paying any cash dividends on our common stock in the foreseeable future, as we currently intend to retain all future earnings to fund the development and growth of our business. Our credit facility with Royal Bank of Canada and other lenders currently restricts our ability to pay cash dividends on our common stock, and we may also enter into credit agreements or other borrowing arrangements in the future that restrict or limit our ability to pay cash dividends on our common stock.
44
Preferred Stock
Our board of directors is authorized, without further stockholder action, to issue preferred stock in one or more series and to designate the dividend rate, voting rights and other rights, preferences and restrictions of each such series. We are authorized to issue up to five million shares of preferred stock. No preferred stock was outstanding at December 31, 2014.
Share-Based Compensation
The following table sets forth information about our equity compensation plans at December 31, 2014:
|
Number of |
|||||||
|
securities to be issued upon |
Weighted-average |
Number of securities remaining |
|||||
|
exercise of outstanding |
exercise price of |
available for future issuance |
|||||
|
Plan Category |
options |
outstanding options |
under equity compensation plans |
||||
|
2009 Equity Compensation Plan - approved by security holders |
— |
$ |
— |
1,143,006 | |||
|
2005 Stock Incentive Plan (“Crimson Plan”) |
129,934 |
$ |
53.85 |
7,030 | |||
Amended and Restated 2009 Incentive Compensation Plan
On September 15, 2009, the Company’s Board of Directors (the “Board”) adopted the Contango Oil & Gas Company Equity Compensation Plan (the “Original 2009 Plan”), which was approved by shareholders on November 19, 2009. On April 10, 2014, the Board amended and restated the Original 2009 Plan through the adoption of the Contango Oil & Gas Company Amended and Restated 2009 Incentive Compensation Plan (the “2009 Plan”), which was approved by shareholders on May 20, 2014. The 2009 Plan provides for both cash awards and equity awards (such as restricted stock and options) to officers, directors, employees or consultants of the Company. Awards made under the 2009 Plan are subject to such restrictions, terms and conditions, including forfeitures, if any, as may be determined by the Board.
Under the terms of the 2009 Plan, up to 1,500,000 shares of the Company’s common stock may be issued for plan awards. Stock options issued under the 2009 Plan must have an exercise price of each option equal to or greater than the market price of the Company’s common stock on the date of grant. The Company may grant officers and employees both incentive stock options intended to qualify under Section 422 of the Internal Revenue Code of 1986, as amended, and stock options that are not qualified as incentive stock options. Stock option grants to non-employees, such as directors and consultants, can only be stock options that are not qualified as incentive stock options. Options granted generally expire after five or ten years. The vesting schedule varies, and can vest over a two, three or four-year period.
During the year ended December 31, 2014, the Company granted 26,386 restricted stock awards under the 2009 Plan to officers, employees and directors of the Company. Additionally, 7,230 restricted shares that were previously issued were canceled due to employee terminations and are available to be reissued. During the year ended December 31, 2013, 312,838 restricted stock awards were granted under the 2009 Plan to officers, employees and directors of the Company. Of this amount, 63,667 shares were fully vested, of which 17,459 shares were withheld by the Company to satisfy certain officer's tax liability resulting from the vesting of these shares, as provided in the restricted stock agreement, with the vested balance released to the officers. No shares of restricted stock or stock options were issued during the year ended December 31, 2012, and as of December 31, 2012, there were no options or restricted shares of common stock outstanding under the 2009 Plan.
Effective January 1, 2014, the Company implemented performance-based long-term bonus plans under the 2009 Plan for the benefit of all employees through a Cash Incentive Bonus Plan (“CIBP”) and the Long-Term Incentive Plan (“LTIP”). The specific targeted performance measures under theses sub-plans are approved by the Compensation Committee and/or the Board. Upon achieving the performance levels established each year, bonus awards under the CIBP and LTIP will be calculated as a percentage of base salary of each employee for the plan year. The CIBP and LTIP plan awards for each year are expected to be disbursed in the first quarter of the following year. Employees must be employed by the Company at the time that awards are disbursed to be eligible.
The CIBP awards will be paid in cash while the LTIP awards will consist of restricted common stock and/or stock options. The stock and/or option awards are expected to vest 25% per year, over the first through fourth anniversaries from the date of grant.
45
The number of shares of restricted common stock and the number of shares underlying the stock options granted will be determined based upon the fair market value of the common stock on the date of the grant.
The 2005 Plan was adopted by the Company's Board in conjunction with the Merger with Crimson. Under the 2005 Plan, the Board may grant incentive stock options, nonstatutory stock options, restricted awards, unrestricted awards, performance awards, stock appreciation rights and dividend equivalent rights to officers, directors, employees or consultants of the Company and its affiliates. Awards made under the 2005 Plan are subject to such terms and conditions, without limitation, as may be determined by the Board. Options granted generally expire after ten years. The vesting schedule varies but generally vests over a one or four-year period. Upon adoption of the 2005 Plan at the Merger closing date, a total of 135,898 stock option awards and 136,428 shares of restricted stock (as converted, which all fully vested upon the Merger) were already issued and outstanding, leaving a balance of 43,472 shares of common stock or stock options available to be granted to Company employees and directors.
During the year ended December 31, 2014, the Company did not issue any shares of restricted common stock under the 2005 Plan, but 4,165 stock options previously issued under the 2005 Plan were exercised, leaving 129,934 stock options vested and exercisable at December 31, 2014. The exercise price for such options range from $25.70 to $60.33 per share, with an average remaining contractual life of six years. As of December 31, 2014, there were 7,030 shares of common stock or stock options available to be granted under the 2005 Plan. On February 24, 2015, the Company granted 7,030 restricted stock awards under the 2005 Plan to a new employee. This plan expired on February 25, 2015.
During the year ended December 31, 2013, the Company issued 43,461 shares of restricted common stock to Company employees under the 2005 Plan. These shares vest 25% each year over the four years following the date of the grant. Additionally, 791 stock options were exercised. No shares of restricted stock or stock options were issued during the year ended December 31, 2012.
Shortly after completion of the Merger, certain officers and employees sold 34,911 Contango shares with the total value of $1.3 million back to the Company to satisfy the employees’ tax liability resulting from the vesting of their restricted shares on October 1, 2013. These shares were recognized in the Company balance sheet in Treasury Shares.
In September 2011, the Company’s board of directors approved a $50 million share repurchase program. All shares are to be purchased in the open market from time to time by the Company or through privately negotiated transactions. The purchases are subject to market conditions and certain volume, pricing and timing restrictions to minimize the impact of the purchases upon the market. For the years ended December 31, 2014, 2013 and 2012, we purchased the following shares under the $50 million share repurchase program:
|
Total Number of Shares |
Approximate Dollar Value |
|||||||||
|
Total Number of Shares |
Average Price Paid |
Purchased as Part of |
of Shares that may yet |
|||||||
|
Period |
Purchased |
Per Share |
Publicly Announced Program |
be Purchased Under Program |
||||||
|
May 2012 |
36,098 |
$ |
53.56 | 71,761 |
$ |
45.7 million |
||||
|
June 2012 |
28,620 |
$ |
51.92 | 100,381 |
$ |
44.2 million |
||||
|
October 2012 |
97,496 |
$ |
50.82 | 197,877 |
$ |
39.2 million |
||||
|
November 2014 |
205,457 |
$ |
35.89 | 403,334 |
$ |
31.8 million |
||||
Additionally, in February 2012, the Company net-settled 45,000 stock options from two officers. In October 2014, the Company amended its revolving credit facility with Royal Bank of Canada to, among other things, allow for share repurchases under certain circumstances.
46
The following graph compares the yearly percentage change from June 30, 2009 until December 31, 2014 in the cumulative total stockholder return on our common stock to the cumulative total return on the S&P Smallcap 600 Index and a peer group of companies consisting of Petroquest Energy, Inc., Swift Energy Company, Callon Petroleum, Energy XXI (Bermuda) Limited and W&T Offshore, Inc.
Our common stock began trading on the NYSE MKT (previously American Stock Exchange) on January 19, 2001 and before that had traded on the Nasdaq over-the-counter Bulletin Board. The graph assumes that a $100 investment was made in our common stock and each index on December 31, 2009, adjusted for stock splits and dividends. The stock performance for our common stock is not necessarily indicative of future performance.
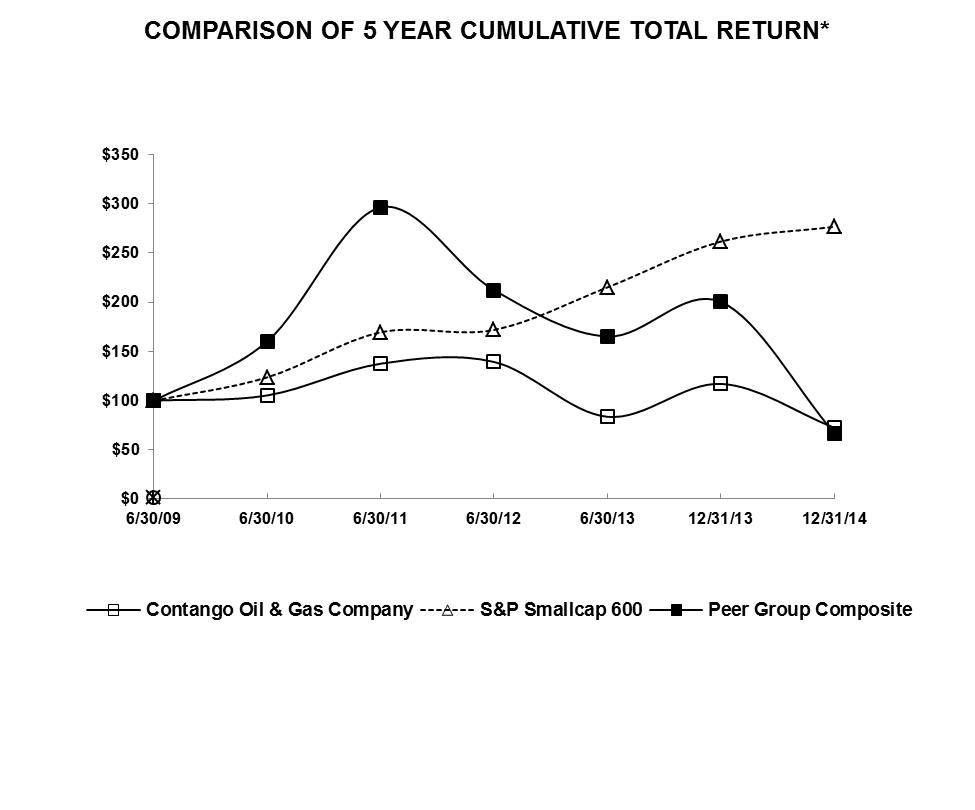
|
6/30/2009 |
6/30/2010 |
6/30/2011 |
6/30/2012 |
6/30/2013 |
12/31/2013 |
12/31/2014 |
||||||||
|
Contango Oil & Gas Company |
100.00 | 105.32 | 137.54 | 139.33 | 83.59 | 117.05 | 72.42 | |||||||
|
S&P Smallcap 600 |
100.00 | 123.64 | 169.41 | 171.84 | 215.10 | 261.60 | 276.66 | |||||||
|
Peer Group Composite |
100.00 | 160.19 | 296.29 | 212.23 | 165.17 | 200.29 | 66.85 |
47
Item 6. Selected Financial Data
On October 1, 2013 the Company's board of directors approved a change in fiscal year end from June 30 to December 31. Unless otherwise noted, all references to "years" in this report refer to the twelve-month period which ends on December 31 of each year. The following selected financial data for the year ended December 31, 2014 has been derived from the audited consolidated financial statements of Contango contained in this Form 10-K. The following selected financial data for the years ended December 31, 2013, 2012 and 2011 have been derived from the audited consolidated financial statements of Contango contained in our Form 10-K/A for the applicable fiscal year. The selected financial data for the year ended December 31, 2010 has not been audited. The selected consolidated financial data (not including proved reserve information) set forth below is for continuing operations and should be read in conjunction with Item 7. “Management’s Discussion and Analysis of Financial Condition and Results of Operations” and with the consolidated financial statements and notes to those consolidated financial statements included elsewhere in this Form 10-K.
Selected financial data for the year ended December 31, 2014 and 2013 includes results of operations and cash flows of Crimson starting from October 1, 2013, the date of the Merger. Consolidated balance sheet and reserves information as of December 31, 2014 and 2013 include the balance sheet and reserves information of Crimson and its subsidiaries adjusted in accordance with the acquisition method of accounting, which requires that assets acquired and liabilities assumed in the Merger be recorded at their fair value at the date of acquisition with the difference between the purchase price and value of assets and liabilities be recorded as goodwill. No goodwill was recognized as a result of the Merger between Contango and Crimson.
Selected financial information for the five years ended December 31, 2014 is as follows (dollars in thousands, except per share amounts):
|
Year Ended December 31, |
|||||||||||||||
|
2014 |
2013 |
2012 |
2011 |
2010 |
|||||||||||
|
(unaudited) |
|||||||||||||||
|
Natural gas and oil sales (1) |
$ |
276,458 |
$ |
164,121 |
$ |
145,868 |
$ |
198,498 |
$ |
180,331 | |||||
|
Income (loss) from continuing operations (2) |
$ |
(21,874) |
$ |
41,362 |
$ |
(907) |
$ |
69,909 |
$ |
46,831 | |||||
|
Discontinued operations, net of income taxes |
— |
— |
(29) | (1,204) | 983 | ||||||||||
|
Net income (loss) attributable to common stock |
$ |
(21,874) |
$ |
41,362 |
$ |
(936) |
$ |
68,705 |
$ |
47,814 | |||||
|
Net income (loss) per share: |
|||||||||||||||
|
Basic |
|||||||||||||||
|
Continuing operations |
$ |
(1.15) |
$ |
2.56 |
$ |
(0.06) |
$ |
4.49 |
$ |
2.97 | |||||
|
Discontinued operations |
— |
— |
(0.00) | (0.08) | 0.06 | ||||||||||
|
Total |
$ |
(1.15) |
$ |
2.56 |
$ |
(0.06) |
$ |
4.41 |
$ |
3.03 | |||||
|
Diluted |
|||||||||||||||
|
Continuing operations |
$ |
(1.15) |
$ |
2.56 |
$ |
(0.06) |
$ |
4.49 |
$ |
2.93 | |||||
|
Discontinued operations |
— |
— |
(0.00) | (0.08) | 0.06 | ||||||||||
|
Total |
$ |
(1.15) |
$ |
2.56 |
$ |
(0.06) |
$ |
4.41 |
$ |
2.99 | |||||
|
Weighted average shares outstanding: |
|||||||||||||||
|
Basic |
19,059 | 16,156 | 15,295 | 15,582 | 15,747 | ||||||||||
|
Diluted |
19,059 | 16,158 | 15,295 | 15,585 | 15,957 | ||||||||||
48
|
Year Ended December 31, |
|||||||||||||||
|
2014 |
2013 |
2012 |
2011 |
2010 |
|||||||||||
|
(unaudited) |
|||||||||||||||
|
Working capital (deficit) (3) |
$ |
(65,975) |
$ |
(33,162) |
$ |
100,901 |
$ |
163,245 |
$ |
61,716 | |||||
|
Capital expenditures |
$ |
188,529 |
$ |
62,552 |
$ |
78,549 |
$ |
40,330 |
$ |
132,413 | |||||
|
Cash dividends (4) |
$ |
— |
$ |
— |
$ |
30,510 |
$ |
— |
$ |
6 | |||||
|
Long term debt (5) |
$ |
63,359 |
$ |
90,000 |
$ |
— |
$ |
— |
$ |
— |
|||||
|
Shareholders’ equity |
$ |
567,466 |
$ |
593,050 |
$ |
403,929 |
$ |
444,003 |
$ |
392,298 | |||||
|
Total assets |
$ |
843,415 |
$ |
910,304 |
$ |
561,106 |
$ |
621,817 |
$ |
579,075 | |||||
|
Proved Reserve Data: |
|||||||||||||||
|
Total proved reserves (Mmcfe) (6) |
275,193 | 313,866 | 221,096 | 261,201 | 297,791 | ||||||||||
|
Pre-tax net present value (discounted 10%) |
$ |
796,871 |
$ |
987,213 |
$ |
594,397 |
$ |
909,675 | 912,066 | ||||||
|
Standardized measure (6) |
$ |
648,016 |
$ |
771,443 |
$ |
388,012 |
$ |
591,833 | 603,408 | ||||||
|
(1) |
The increase in natural gas and oil sales for the years ended December 31, 2014 and 2013 are attributable to the merger with Crimson. |
|
(2) |
During the year ended December 31, 2014, we reached a total depth on our Ship Shoal 255 well, and no hydrocarbons were found. As a result, we recognized $31.5 million in exploration expense for the cost of drilling the well and $15.6 million in impairment expense, including $3.5 million related to leasehold costs and $12.1 million related to the platform located in Ship Shoal 263 block which was expected to be used by the Ship Shoal 255 had it been successful. Additionally, during the year ended December 31, 2014, we revised estimated proved reserves for South Timbalier 17 and our Tuscaloosa Marine Shale properties, resulting in non-cash impairment expenses of approximately $11.4 million. During the year ended December 31, 2014, we also recognized impairment expense of approximately $20.1 million related to full or partial impairment of certain unproved properties due to expiring leases and leases not likely to be drilled. |
During the year ended December 31, 2013 we completed a workover on our Vermilion 170 well at a cost of approximately $12.0 million. During the year ended December 31, 2012, we drilled two unsuccessful exploratory wells resulting in exploration expenses of approximately $50.0 million, including leasehold costs. Also during the year ended December 31, 2012, we revised estimated proved reserves at Ship Shoal 263, resulting in non-cash impairment expenses of approximately $12.0 million.
|
(3) |
The increase in the working capital deficit for the year ended December 31, 2014 is primarily attributable to the decrease in trade receivable associated with the decline in commodity prices during the fourth quarter of 2014. The decrease in working capital for the year ended December 31, 2013 is attributable to using all of our cash reserves to pay down Crimson debt at the time of the Merger. |
|
(4) |
On November 29, 2012, the board of directors declared a one-time special dividend of $2.00 per share of common stock which was paid on December 17, 2012. |
|
(5) |
On October 1, 2013, in connection with the Merger, we entered into a revolving credit facility with Royal Bank of Canada and other lenders. The borrowing base was reaffirmed on October 28, 2014. As of December 31, 2014, we had approximately $63.4 million outstanding under such facility. |
|
(6) |
During the year ended December 31, 2014, our proved reserves decreased by approximately 38.7 Bcfe and our standardized measure decreased by approximately $0.1 million. This decrease is primarily attributable to a 22.4 Bcfe negative revision of proved developed producing reserves at our Eugene Island 11 field and normal production. The negative revision at Eugene Island 11 was due to a change in forecasted condensate yield and ultimate field abandonment pressure, as determined by our third party engineers related to recent field performance. |
During the year ended December 31, 2013, our proved reserves increased by approximately 92.8 Bcfe and our standardized measure increased by approximately $383.4 million, primarily as a result of our merger with Crimson. Also contributing to the increase was the exercise of our preferential right to purchase approximately 17.0 Bcfe related to our five Contango-operated Dutch wells, slightly offset by 28.2 Bcfe of production, a 19.2 Bcfe decrease in our Dutch and Mary Rose reserve estimates based upon additional pressure data, and a 2.5 Bcfe decrease in our Vermilion 170 reserve estimates, as determined by our reservoir engineer.
During the year ended December 31, 2012, our proved reserves decreased by approximately 40.1 Bcfe and our standardized measure decreased by approximately $203.8 million. The major contributors to this decrease include normal production of 28.8 Bcfe during the year, a 9.2 Bcfe decrease in our Ship Shoal 263 reserve estimates, and an 11.5 Bcfe decrease in our Vermilion 170 reserve estimates, slightly offset by an increase in our Dutch and Mary Rose reserve estimates, all as determined by our reservoir engineer.
Item 7. Management’s Discussion and Analysis of Financial Condition and Results of Operations
The following discussion and analysis of our financial condition and results of operations should be read in conjunction with the financial statements and the related notes and other information included elsewhere in this report. On October 1, 2013 the Company's Board of Directors approved a change in fiscal year end from June 30 to December 31. Unless otherwise noted, all
49
references to "years" in this report refer to the twelve-month period which ends on December 31 of each year. This Form 10-K covers the three year period ended December 31, 2014.
We are a Houston, Texas based independent energy company engaged in the acquisition, exploration, development, exploitation and production of crude oil and natural gas properties offshore in the shallow waters of the Gulf of Mexico (“GOM”) and in the onshore Texas Gulf Coast and Rocky Mountain regions of the United States.
On October 1, 2013, we completed a merger with Crimson in an all-stock transaction pursuant to which Crimson became a wholly-owned subsidiary of Contango. The merger with Crimson gave us access to high rate of return onshore prospects in known, prolific producing areas as well as long-life resource plays. In 2014, our drilling activity focused primarily on the Woodbine oil and liquids-rich play in Madison and Grimes counties, Texas (our Southeast Texas Region), on the Buda Limestone oil and liquids-rich play in Zavala and Dimmit counties, Texas (our South Texas Region), in the Cretaceous Sands in Fayette and Gonzales counties, Texas (also in our South Texas Region) and the late 2014/early 2015 commencement of drilling on our new acreage position in Wyoming where we are targeting the Mowry Shale and the Muddy Sandstone formations. We believe these areas provide long-term growth potential from multiple formations that we believe to be productive for oil and natural gas.
Additionally, we have (i) a 37% equity investment in Exaro Energy III LLC (“Exaro”) that is primarily focused on the development of proved natural gas reserves in the Jonah Field in Wyoming; (ii) leasehold positions and minor non-operated producing properties in Louisiana and Mississippi targeting the Tuscaloosa Marine Shale (“TMS”); (iii) operated properties producing from various conventional formations in various counties along the Texas Gulf Coast; (iv) operated producing properties in the Denver Julesburg Basin (“DJ Basin”) in Weld and Adams counties in Colorado, which we believe may also be prospective in the Niobrara Shale oil play; (v) operated producing properties in the Haynesville Shale, Mid Bossier and James Lime formations in East Texas; and (vi) six exploratory prospects in the shallow waters of the GOM.
Our production for the year ended December 31, 2014 was approximately 40.3 Bcfe (or 110.5 Mmcfed) and was 61% offshore and 39% onshore. Our production for the three months ended December 31, 2014 was approximately 9.8 Bcfe (or 106.2 Mmcfed) and was 64% offshore and 36% onshore. As of December 31, 2014, our proved reserves were approximately 52% offshore and 48% onshore and were 76% proved developed, which were approximately 69% offshore and 31% onshore.
Revenues and Profitability
Our revenues, profitability and future growth depend substantially on our ability to find, develop and acquire natural gas and oil reserves that are economically recoverable, as well as prevailing prices for natural gas and oil.
Reserve Replacement
Generally, producing properties offshore in the Gulf of Mexico have high initial production rates, followed by steep declines. Likewise, initial production rates on new wells in the onshore resource plays start out at a relatively high rate with a decline curve which results in 60% to 70% of the ultimate recovery of present value occurring in the first eighteen months of the well’s life. We must locate and develop, or acquire, new natural gas and oil reserves to replace those being depleted by production. Substantial capital expenditures are required to find, develop and/or acquire natural gas and oil reserves. The Merger with Crimson allowed the Company to add significant proved developed and undeveloped reserves (see “Item 2. Properties”, for details of reserves acquired) and provided the Company with access to several onshore resource plays which have substantial reserve growth potential, including in oil and liquids rich plays that position us to move to a more balanced oil/gas profile.
Use of Estimates
The preparation of our financial statements requires the use of estimates and assumptions that affect the reported amounts of assets and liabilities and disclosure of contingent assets and liabilities at the date of the financial statements, and the reported amounts of revenues and expenses during the reporting periods. Actual results could differ from those estimates. Significant estimates with regard to these financial statements include estimates of remaining proved natural gas and oil reserves, the timing and costs of our future drilling, development and abandonment activities, and income taxes.
50
Related Party Transactions
The Company has historically relied on Juneau Exploration L.P. (“JEX”) and REX to generate its offshore and onshore domestic natural gas and oil prospects. In addition to generating new prospects, JEX occasionally evaluated offshore and onshore exploration prospects generated by third-party independent companies for us to purchase. With the merger with Crimson, and the technical team obtained in the merger, the Company will be more active in identifying drilling opportunities through efforts of its own personnel. See Note 17 to our Financial Statements - "Related Party Transactions" for a detailed description of our transactions with JEX and REX.
See “Risk Factors” on page 18 for a more detailed discussion of a number of other factors that affect our business, financial condition and results of operations.
The table below sets forth our average net daily production data in Mmcfed from our fields for each of the periods indicated:
|
Three Months Ended |
||||||||||||||||
|
March 31, 2013 |
June 30, 2013 |
September 30, 2013 |
December 31, 2013 |
March 31, 2014 |
June 30, 2014 |
September 30, 2014 |
December 31, 2014 |
|||||||||
|
Offshore GOM |
||||||||||||||||
|
Dutch and Mary Rose |
59.5 | 57.2 | 61.7 | 59.1 | 66.7 | 60.9 | 42.3 | 55.9 | ||||||||
|
Vermilion 170 |
3.6 | 4.0 | 9.6 | 9.6 | 9.0 | 7.2 | 8.0 | 5.7 | ||||||||
|
Other offshore (1) |
1.5 | 1.0 | 0.7 | 0.8 | 0.4 | 0.6 | 5.2 | 6.5 | ||||||||
|
Southeast Texas (2) |
— |
— |
— |
24.3 | 26.4 | 27.1 | 26.6 | 23.6 | ||||||||
|
South Texas (2) |
— |
— |
— |
14.7 | 12.6 | 16.0 | 17.4 | 12.2 | ||||||||
|
Other (2)(3) |
— |
— |
— |
1.7 | 2.4 | 4.2 | 2.8 | 2.3 | ||||||||
| 64.6 | 62.2 | 72.0 | 110.2 | 117.5 | 116.0 | 102.3 | 106.2 | |||||||||
|
(1) |
The “Other offshore” line includes Ship Shoal 263 and South Timbalier 17. |
|
(2) |
“Southeast Texas”, “South Texas” and “Other” production are not included in the table above for periods prior to quarter ended December 31, 2013, as a result of acquiring these producing properties effective October 1, 2013 through the Merger. |
|
(3) |
The “Other” line includes onshore wells in East Texas, Louisiana, Mississippi and Colorado for periods after the quarter ended September 30, 2013. |
The table below sets forth our pro forma average net daily production data in Mmcfed from our fields for each of the periods indicated as if the Merger took place on January 1, 2013:
|
Three Months Ended |
||||||||||||||||
|
March 31, 2013 |
June 30, 2013 |
September 30, 2013 |
December 31, 2013 |
March 31, 2014 |
June 30, 2014 |
September 30, 2014 |
December 31, 2014 |
|||||||||
|
Offshore GOM |
||||||||||||||||
|
Dutch and Mary Rose |
59.5 | 57.2 | 61.7 | 59.1 | 66.7 | 60.9 | 42.3 | 55.9 | ||||||||
|
Vermilion 170 |
3.6 | 4.0 | 9.6 | 9.6 | 9.0 | 7.2 | 8.0 | 5.7 | ||||||||
|
Other offshore (1) |
1.5 | 1.0 | 0.7 | 0.8 | 0.4 | 0.6 | 5.2 | 6.5 | ||||||||
|
Southeast Texas |
19.7 | 27.9 | 25.4 | 24.3 | 26.4 | 27.1 | 26.6 | 23.6 | ||||||||
|
South Texas |
13.9 | 14.2 | 13.0 | 14.7 | 12.6 | 16.0 | 17.4 | 12.2 | ||||||||
|
Other (2) |
2.3 | 2.1 | 1.9 | 1.7 | 2.4 | 4.2 | 2.8 | 2.3 | ||||||||
| 100.5 | 106.4 | 112.3 | 110.2 | 117.5 | 116.0 | 102.3 | 106.2 | |||||||||
|
(1) |
The “Other offshore” line includes Ship Shoal 263 and South Timbalier 17. |
|
(2) |
The “Other” line includes onshore wells in East Texas, Louisiana, Mississippi and Colorado. |
51
Vermilion 170 Well
In January 2013, we identified sustained casing pressure between the production tubing and the production casing at our Vermilion 170 well. Diagnostic tests revealed that the production tubing had parted downhole requiring a workover of the well. Well production was shut-in and the original tubing and completion assembly were successfully removed. Operations were conducted to replace the tubing and restore the well, which resumed production in June 2013. During December 2014, our Vermilion 170 well production was shut-in for fourteen days due to issues with the Sea Robin Pipeline, our third-party transporter.
Other Offshore
For all of the periods presented, Other offshore includes our Ship Shoal 263 well for all periods presented and South Timbalier 17 for the quarters ended September 30, 2014 and December 31, 2014, as it commenced production in July 2014. Production at Ship Shoal 263 has been negatively impacted since 2011 by overheating, scaling problems, and water production. The well has also been shut-in several times for production logging and chemical treatment.
Southeast Texas
For the quarter ended December 31, 2013, Southeast Texas production averaged approximately 24.3 Mmcfed. Crimson, and subsequently Contango, actively developed this area during 2013, focusing on the horizontal development of the Woodbine formation in Madison and Grimes counties. During 2013, Crimson, and then Contango, drilled 12 gross (eight net) wells on acreage targeting the Woodbine formation. During 2014, Contango drilled 18 gross (11.6 net) wells on acreage targeting the Woodbine formation.
South Texas
For the quarter ended December 31, 2013, South Texas production averaged approximately 14.7 Mmcfed. During 2013, Crimson, and then Contango drilled six gross operated wells (three net) and one gross non-operated well (0.25 net) in the Buda formation in Zavala and Dimmit counties. During 2014, Contango drilled 14 gross operated wells (6.8 net) in the Buda formation, which are all on production. We drilled one additional well during the fourth quarter of 2014 as a vertical pilot well to test the viability of the Eagle Ford and other formations in Zavala and Dimmit counties. We are evaluating the recovered cores before deciding on a rig and development strategy for these areas.
52
Year Ended December 31, 2014 Compared to Year Ended December 31, 2013; and Year Ended December 31, 2013 Compared to Year Ended December 31, 2012
The table below sets forth revenue, production data, average sales prices and average production costs associated with our sales of natural gas, oil and natural gas liquids ("NGLs") from continuing operations for the years ended December 31, 2014, 2013 and 2012. Oil, condensate and NGLs are compared with natural gas in terms of cubic feet of natural gas equivalents. One barrel of oil, condensate or NGL is the energy equivalent of six Mcf of natural gas. Reported lease operating expenses include production taxes, such as ad valorem and severance. Information for the year ended December 31, 2013 includes twelve months of Contango activity (January - December) and three months of post-merger Crimson activity (October - December).
|
Year Ended December 31, |
Year Ended December 31, |
|||||||||||||||||
|
2014 |
2013 |
% |
2013 |
2012 |
% |
|||||||||||||
|
Revenues: |
(thousands) |
(thousands) |
||||||||||||||||
|
Oil and condensate sales |
$ |
130,238 |
$ |
59,608 | 118 |
% |
$ |
59,608 |
$ |
56,237 | 6 |
% |
||||||
|
Natural gas sales |
112,695 | 79,289 | 42 |
% |
79,289 | 60,691 | 31 |
% |
||||||||||
|
NGL sales |
33,525 | 25,224 | 33 |
% |
25,224 | 28,940 | (13) |
% |
||||||||||
|
Total revenues |
$ |
276,458 |
$ |
164,121 | 68 |
% |
$ |
164,121 |
$ |
145,868 | 13 |
% |
||||||
|
Production: |
||||||||||||||||||
|
Oil and condensate (thousand barrels) |
||||||||||||||||||
|
Dutch and Mary Rose |
220 | 262 | (16) |
% |
262 | 302 | (13) |
% |
||||||||||
|
Vermilion 170 |
37 | 38 | (3) |
% |
38 | 110 | (65) |
% |
||||||||||
|
Southeast Texas |
734 | 160 | 359 |
% |
160 |
— |
100 |
% |
||||||||||
|
South Texas |
337 | 95 | 255 |
% |
95 |
— |
100 |
% |
||||||||||
|
Other |
73 | 34 | 115 |
% |
34 | 95 | (64) |
% |
||||||||||
|
Total oil and condensate |
1,401 | 589 | 138 |
% |
589 | 507 | 16 |
% |
||||||||||
|
Natural gas (million cubic feet) |
||||||||||||||||||
|
Dutch and Mary Rose |
16,257 | 17,018 | (4) |
% |
17,018 | 16,954 |
* |
|||||||||||
|
Vermilion 170 |
2,108 | 1,823 | 16 |
% |
1,823 | 3,449 | (47) |
% |
||||||||||
|
Southeast Texas |
3,234 | 875 | 270 |
% |
875 |
— |
100 |
% |
||||||||||
|
South Texas |
2,541 | 623 | 308 |
% |
623 |
— |
100 |
% |
||||||||||
|
Other |
1,735 | 285 | 509 |
% |
285 | 1,347 | (79) |
% |
||||||||||
|
Total natural gas |
25,875 | 20,624 | 25 |
% |
20,624 | 21,750 | (5) |
% |
||||||||||
|
Natural gas liquids (thousand barrels) |
||||||||||||||||||
|
Dutch and Mary Rose |
501 | 514 | (3) |
% |
514 | 503 | 2 |
% |
||||||||||
|
Vermilion 170 |
68 | 68 |
— |
% |
68 | 141 | (52) |
% |
||||||||||
|
Southeast Texas |
304 | 66 | 361 |
% |
66 |
— |
100 |
% |
||||||||||
|
South Texas |
124 | 26 | 377 |
% |
26 |
— |
100 |
% |
||||||||||
|
Other |
11 | 3 | 267 |
% |
3 | 16 | (81) |
% |
||||||||||
|
Total natural gas liquids |
1,008 | 677 | 49 |
% |
677 | 660 | 3 |
% |
||||||||||
|
Total (million cubic feet equivalent) |
||||||||||||||||||
|
Dutch and Mary Rose |
20,578 | 21,674 | (5) |
% |
21,674 | 21,784 | (1) |
% |
||||||||||
|
Vermilion 170 |
2,738 | 2,459 | 11 |
% |
2,459 | 4,955 | (50) |
% |
||||||||||
|
Southeast Texas |
9,461 | 2,231 | 324 |
% |
2,231 |
— |
100 |
% |
||||||||||
|
South Texas |
5,309 | 1,349 | 294 |
% |
1,349 |
— |
100 |
% |
||||||||||
|
Other |
2,237 | 507 | 341 |
% |
507 | 2,013 | (75) |
% |
||||||||||
|
Total production |
40,323 | 28,220 | 43 |
% |
28,220 | 28,752 | (2) |
% |
||||||||||
53
|
Year Ended December 31, |
Year Ended December 31, |
|||||||||||||||||
|
2014 |
2013 |
% |
2013 |
2012 |
% |
|||||||||||||
|
Daily Production: |
||||||||||||||||||
|
Oil and condensate (thousand barrels per day) |
||||||||||||||||||
|
Dutch and Mary Rose |
0.6 | 0.7 | (14) |
% |
0.7 | 0.8 | (13) |
% |
||||||||||
|
Vermilion 170 |
0.1 | 0.1 |
— |
% |
0.1 | 0.3 | (67) |
% |
||||||||||
|
Southeast Texas |
2.0 | 1.7 | 18 |
% |
1.7 |
— |
100 |
% |
||||||||||
|
South Texas |
0.9 | 1.0 | (10) |
% |
1.0 |
— |
100 |
% |
||||||||||
|
Other |
0.2 | 0.1 | 100 |
% |
0.1 | 0.3 | (67) |
% |
||||||||||
|
Total oil and condensate |
3.8 | 3.6 | 6 |
% |
3.6 | 1.4 | 157 |
% |
||||||||||
|
Natural gas (million cubic feet per day) |
||||||||||||||||||
|
Dutch and Mary Rose |
44.5 | 46.6 | (5) |
% |
46.6 | 46.4 |
* |
|||||||||||
|
Vermilion 170 |
5.8 | 5.0 | 16 |
% |
5.0 | 9.4 | (47) |
% |
||||||||||
|
Southeast Texas |
8.9 | 9.5 | (6) |
% |
9.5 |
— |
100 |
% |
||||||||||
|
South Texas |
7.0 | 6.8 | 3 |
% |
6.8 |
— |
100 |
% |
||||||||||
|
Other |
4.7 | 1.8 | 161 |
% |
1.8 | 3.7 | (51) |
% |
||||||||||
|
Total natural gas |
70.9 | 69.7 | 2 |
% |
69.7 | 59.5 | 17 |
% |
||||||||||
|
Natural gas liquids (thousand barrels per day) |
||||||||||||||||||
|
Dutch and Mary Rose |
1.4 | 1.4 |
— |
% |
1.4 | 1.4 |
— |
% |
||||||||||
|
Vermilion 170 |
0.2 | 0.2 |
— |
% |
0.2 | 0.4 | (50) |
% |
||||||||||
|
Southeast Texas |
0.8 | 0.7 | 14 |
% |
0.7 |
— |
100 |
% |
||||||||||
|
South Texas |
0.3 | 0.3 |
— |
% |
0.3 |
— |
100 |
% |
||||||||||
|
Other |
0.1 |
— |
100 |
% |
— |
— |
— |
% |
||||||||||
|
Total natural gas liquids |
2.8 | 2.6 | 8 |
% |
2.6 | 1.8 | 44 |
% |
||||||||||
|
Total (million cubic feet equivalent per day) |
||||||||||||||||||
|
Dutch and Mary Rose |
56.4 | 59.4 | (5) |
% |
59.4 | 59.7 | (1) |
% |
||||||||||
|
Vermilion 170 |
7.5 | 6.7 | 12 |
% |
6.7 | 13.6 | (51) |
% |
||||||||||
|
Southeast Texas |
25.9 | 24.3 | 7 |
% |
24.3 |
— |
100 |
% |
||||||||||
|
South Texas |
14.5 | 14.7 | (1) |
% |
14.7 |
— |
100 |
% |
||||||||||
|
Other |
6.2 | 2.7 | 130 |
% |
2.7 | 5.5 | (51) |
% |
||||||||||
|
Total production |
110.5 | 107.8 | 2 |
% |
107.8 | 78.8 | 37 |
% |
||||||||||
|
Average Sales Price: |
||||||||||||||||||
|
Oil and condensate (per barrel) |
$ |
92.98 |
$ |
101.21 | (8) |
% |
$ |
101.21 |
$ |
110.92 | (9) |
% |
||||||
|
Natural gas (per thousand cubic feet) |
$ |
4.36 |
$ |
3.84 | 13 |
% |
$ |
3.84 |
$ |
2.79 | 38 |
% |
||||||
|
Natural gas liquids (per barrel) |
$ |
33.27 |
$ |
37.26 | (11) |
% |
$ |
37.26 |
$ |
43.85 | (15) |
% |
||||||
|
Total (per thousand cubic feet equivalent) |
$ |
6.86 |
$ |
5.82 | 18 |
% |
$ |
5.82 |
$ |
5.07 | 15 |
% |
||||||
|
Expenses (thousands): |
||||||||||||||||||
|
Operating expenses |
$ |
47,236 |
$ |
36,784 | 28 |
% |
$ |
36,784 |
$ |
23,720 | 55 |
% |
||||||
|
Exploration expenses |
$ |
33,387 |
$ |
1,811 |
** |
$ |
1,811 |
$ |
51,903 | (97) |
% |
|||||||
|
Depreciation, depletion and amortization |
$ |
156,117 |
$ |
65,529 | 138 |
% |
$ |
65,529 |
$ |
44,896 | 46 |
% |
||||||
|
Impairment and abandonment of oil and gas properties |
$ |
47,693 |
$ |
776 |
** |
$ |
776 |
$ |
14,079 | (94) |
% |
|||||||
|
General and administrative expenses |
$ |
34,045 |
$ |
26,512 | 28 |
% |
$ |
26,512 |
$ |
11,265 | 135 |
% |
||||||
|
Gain from investment in affiliates (net of taxes) |
$ |
6,923 |
$ |
2,310 | 200 |
% |
$ |
2,310 |
$ |
60 |
** |
|||||||
|
Loss (gain) from sale of assets and other expense (income) |
$ |
(2,687) |
$ |
(29,482) | (91) |
% |
$ |
(29,482) |
$ |
367 |
** |
|||||||
54
|
Year Ended December 31, |
Year Ended December 31, |
|||||||||||||||||
|
2014 |
2013 |
% |
2013 |
2012 |
% |
|||||||||||||
|
Selected data per Mcfe: |
||||||||||||||||||
|
Operating expenses |
$ |
1.17 |
$ |
1.30 | (10) |
% |
$ |
1.30 |
$ |
0.82 | 59 |
% |
||||||
|
General and administrative expenses |
$ |
0.84 |
$ |
0.94 | (10) |
% |
$ |
0.94 |
$ |
0.39 | 141 |
% |
||||||
|
Depreciation, depletion and amortization |
$ |
3.87 |
$ |
2.32 | 67 |
% |
$ |
2.32 |
$ |
1.56 | 49 |
% |
||||||
* Less than 1%
** Greater than 1,000%
Natural Gas, Oil and NGL Sales and Production
All of our revenues are from the sale of our natural gas, oil and natural gas liquids production. Our revenues may vary significantly from year to year depending on changes in commodity prices, which fluctuate widely, and production volumes. Our production volumes are subject to wide swings as a result of new discoveries, weather and mechanical related problems. In addition, the production rate associated with our oil and gas properties declines over time as we produce our reserves.
We reported revenues of approximately $276.5 million for the year ended December 31, 2014, compared to revenues of approximately $164.1 million for the year ended December 31, 2013. This increase in revenues was primarily attributable to our merger with Crimson, to additional interests purchased in our Dutch wells in December 2013, to production from our South Timbalier 17 discovery which began producing in July 2014, and to new natural gas, oil, condensate and NGL production from our 2014 drilling program, partially offset by lower oil, condensate and NGL prices. Revenue for 2013 was also negatively impacted by our Vermilion 170 well shut-in for approximately half of 2013 for workover.
Our net natural gas production for the year ended December 31, 2014 was approximately 70.9 Mmcfd, up from approximately 69.7 Mmcfd for the year ended December 31, 2013. Additionally, net oil production increased from 3,600 barrels per day to 3,800 barrels per day, while NGL production increased from approximately 2,600 barrels per day to 2,800 barrels per day. In total, equivalent production increased from 107.8 Mmcfed to 110.5 Mmcfed. This increase in natural gas, oil and NGL production was primarily attributable to our merger with Crimson, our 2014 drilling program, the resumption of production at Vermillion 170 and the additional interests in our Dutch well discussed above. This increase was partially offset by a decrease in production attributable to the shut-in for approximately three weeks and subsequent ramp up during the third quarter 2014 to install compression for the Dutch and Mary Rose wells.
We reported revenues of approximately $164.1 million for the year ended December 31, 2013, compared to revenues of approximately $145.9 million for the year ended December 31, 2012. This increase in revenues was primarily attributable to increased natural gas, oil, condensate and NGL production due to our merger with Crimson, offset by decreased production from our Vermilion 170 well, which was shut-in for approximately half of 2013, further aided by a higher average equivalent sales price received for the period.
Our net natural gas production for the year ended December 31, 2013 was approximately 69.7 Mmcfd, up from approximately 59.5 Mmcfd for the year ended December 31, 2012. Additionally, net oil production increased from 1,400 barrels per day to 3,600 barrels per day, while NGL production increased from approximately 1,800 barrels per day to 2,600 barrels per day. In total, equivalent production increased from 78.8 Mmcfed to 107.8 Mmcfed. This increase in natural gas, oil and NGL production was attributable to our merger with Crimson.
Average Sales Prices
For the year ended December 31, 2014, the price of natural gas was $4.36 per Mcf while the price for oil and NGLs was $92.98 per barrel and $33.27 per barrel, respectively. For the year ended December 31, 2013, the price of natural gas was $3.84 per Mcf while the prices for oil and NGLs were $101.21 per barrel and $37.26 per barrel, respectively. For the year ended December 31,
55
2012, the price of natural gas was $2.79 per Mcf while the prices for oil and NGLs were $110.92 per barrel and $43.85 per barrel, respectively.
Operating Expenses (including production taxes)
Operating expenses for the year ended December 31, 2014 were approximately $47.2 million, which included approximately $27.3 million of lease operating expenses, $11.5 million of production and ad valorem taxes, $5.8 million related to transportation and processing costs and $2.6 million of workover costs. Recurring lease operating expenses are higher than 2013 due to the increased operational activity as a result of our merger with Crimson.
Operating expenses for the year ended December 31, 2013 were approximately $36.8 million, which included approximately $15.8 million of lease operating expenses, $4.7 million of production and severance taxes, $4.3 million related to transportation and processing costs and $12.0 million in workover costs for Vermilion 170. Recurring lease operating expenses are higher than 2012 due to the increased operational activity as a result of our merger with Crimson.
Operating expenses for the year ended December 31, 2012 were approximately $23.7 million, which included approximately $14.2 million of lease operating expense, $3.6 million of production and severance taxes, $4.1 million related to transportation and processing costs and $1.8 million in workover costs.
Exploration Expenses
We reported approximately $33.4 million of exploration expenses for the year ended December 31, 2014, compared to $1.8 million for the year ended December 31, 2013. The higher costs incurred in 2014 include $31.5 million related to our dry hole at Ship Shoal 255 and $1.9 million for geological and geophysical activities, seismic data and delay rentals.
We reported approximately $1.8 million of exploration expenses for the year ended December 31, 2013, compared to $51.9 million for the year ended December 31, 2012. The costs incurred in 2012 included $50.0 million for dry holes at Ship Shoal 134 and South Timbalier 75, $1.4 million related to an unsuccessful drilling program in Jim Hogg County, Texas and $0.3 million for geological and geophysical activities, seismic data and delay rentals.
Depreciation, Depletion and Amortization
Depreciation, depletion and amortization for the fiscal year ended December 31, 2014 was approximately $156.1 million. This compares to approximately $65.5 million for the year ended December 31, 2013, an increase primarily attributable to the expanded asset base subsequent to our merger with Crimson, which contributed $105.8 million to this expense for the twelve month period ended December 31, 2014.
Depreciation, depletion and amortization for the fiscal year ended December 31, 2013 was approximately $65.5 million. This compares to approximately $44.9 million for the year ended December 31, 2012. The increase in depreciation, depletion and amortization was primarily attributable to increased production as a result of our merger with Crimson.
Impairment of Natural Gas and Oil Properties
Impairment expenses for the year ended December 31, 2014 included producing property impairments of $7.7 million for South Timbalier 17 and $3.7 million for TMS proved properties due to performance and commodity price declines in 2014, $3.5 million impairment of unproved leasehold cost related to the dry hole on our Ship Shoal 255 block and $12.1 million for impairment of an existing platform which was expected to be used by the Ship Shoal 255 well if it had been successful. Impairment expenses for the year ended December 31, 2014 also included a $20.1 million impairment charge for certain unproved prospects due to expiring leases and leases not likely to be drilled, primarily related to GOM leases and unproved TMS leases.
For the year ended December 31, 2013, the Company recorded impairment expense of approximately $0.8 million, related to leasehold costs on our Ship Shoal 83 prospect which we relinquished in August 2013, and leasehold costs on our Brazos Area 543 prospect.
56
For the year ended December 31, 2012, the Company recorded impairment expense of approximately $14.1 million. Of this amount, approximately $12.0 million related to our Ship Shoal 263 well and $2.1 million related to the Eugene Island 24 platform and other properties.
General and Administrative Expenses
General and administrative expenses for the year ended December 31, 2014 were approximately $34.0 million, compared to $26.5 million for the year ended December 31, 2013. Major components of general and administrative expenses for the year ended December 31, 2014 included approximately $20.3 million in salaries and benefits ($4.5 million of which was non-cash stock based compensation) and $5.5 million in accounting, legal, tax and professional services.
General and administrative expenses for the year ended December 31, 2013 were approximately $26.5 million, compared to $11.3 million for the year ended December 31, 2012. Major components of general and administrative expenses for the year ended December 31, 2013 included approximately $12.1 million in salaries and benefits ($3.2 million of which was non-cash stock based compensation), $6.3 million in accounting, legal, tax and professional services and $3.9 million attributable to the merger with Crimson.
General and administrative expenses for the year ended December 31, 2012 were approximately $11.3 million. Major components of general and administrative expenses for the year ended December 31, 2012 included approximately $5.6 million in salaries and benefits and $3.3 million in accounting, legal, tax and professional services.
Gain from Affiliates
For the year ended December 31, 2014, the Company recorded a gain from affiliates of approximately $6.9 million, net of taxes of $3.8 million, related to our investment in Exaro.
For the year ended December 31, 2013, the Company recorded a gain from affiliates of approximately $2.3 million, net of taxes of $1.2 million, related to our investment in Exaro.
Loss (gain) from sale of assets and other expense (income)
A loss from the sale of assets and other expenses for the year ended December 31, 2014 was approximately $2.7 million, which is primarily related to interest expense.
A gain from the sale of assets and other expenses for the year ended December 31, 2013 was approximately $29.5 million, which consisted of $15.3 million gain related to our equity investment in Alta Resources, Inc., a $6.6 million gain related to the disposition of a minority interest in all developed and undeveloped properties in Madison and Grimes counties, and included the proceeds of a $10 million life insurance policy for the Company's former Chairman, President and Chief Executive Officer, Mr. Kenneth Peak, who passed away on April 19, 2013.
Capital Resources and Liquidity
Our primary cash requirements are for capital expenditures, working capital, operating expenses, acquisitions and principal and interest payments on indebtedness. Our primary sources of liquidity are cash generated by operations, net of the realized effect of our hedging agreements, and amounts available to be drawn under our credit facility.
57
The table below summarizes certain measures of liquidity and capital expenditures, as well as our sources of capital from internal and external sources, for the periods indicated, in thousands.
|
Year ended December 31, |
|||||||||
|
2014 |
2013 |
2012 |
|||||||
|
Net cash provided by operating activities |
$ |
209,960 |
$ |
105,037 |
$ |
90,122 | |||
|
Net cash used in investing activities |
$ |
(175,057) |
$ |
(34,795) |
$ |
(123,945) | |||
|
Net cash used in financing activities |
$ |
(34,903) |
$ |
(149,729) |
$ |
(38,630) | |||
|
Cash and cash equivalents at the end of the period |
$ |
— |
$ |
— |
$ |
79,487 | |||
Cash flow from operating activities provided approximately $210.0 million in cash for the year ended December 31, 2014 compared to $105.0 million for the year ended December 31, 2013. This increase in cash provided by operating activities was primarily attributable to our merger with Crimson.
Cash flow from operating activities provided approximately $105.0 million in cash for the year ended December 31, 2013 compared to $90.1 million for the year ended December 31, 2012. This increase in cash provided by operating activities was primarily attributable to our merger with Crimson, as well as not having any taxes due for the year ended December 31, 2013.
Cash used in investing activities was approximately $175.1 million in cash for the year ended December 31, 2014, which included approximately $180.4 million for capital expenditures, partially offset by approximately $5.4 million related to the sale of assets and distributions from affiliates.
Cash used in investing activities was approximately $34.8 million in cash for the year ended December 31, 2013, which included approximately $62.6 million for capital expenditures and approximately $15.4 million for investments in affiliates, partially offset by approximately $43.2 million related to the sale of assets and distributions from affiliates.
Cash used in investing activities was approximately $123.9 million in cash for the year ended December 31, 2012, which included approximately $78.5 million for capital expenditures, approximately $54.8 million for investments in affiliates, partially offset by $9.0 million related to sale of assets and distributions from affiliates.
Cash used in financing activities was approximately $34.9 million for the year ended December 31, 2014 compared to $149.7 million used in financing activities in 2013. This decrease in cash used in financing activities was primarily attributable to the payment of Crimson's existing debt upon closing of the Merger, partially offset by borrowings under our RBC Credit Facility (defined below).
Cash used in financing activities was approximately $149.7 million for the year ended December 31, 2013 compared to $38.6 million used in financing activities in 2012. This increase in cash used in financing activities was primarily attributable to the payment of Crimson's existing debt upon closing of the Merger, partially offset by borrowings under our RBC Credit Facility (defined below).
Credit Facility
In connection with the Merger, the Company assumed and immediately repaid Crimson’s $175.0 million second lien term loan with Barclays Bank PLC ("Barclays") and other lenders, and Crimson’s $58.6 million senior secured revolving credit facility with Wells Fargo and other lenders, which included $1.8 million in accrued interest and prepayment premiums. In order to refinance the assumed debt, the Company entered into a $500 million four-year revolving credit facility with Royal Bank of Canada and other lenders (the “RBC Credit Facility”) with an initial hydrocarbon-supported borrowing base of $275 million, which was reaffirmed on October 28, 2014 and is effective through May 1, 2015. The borrowing base under our RBC Credit Facility is redetermined each November 1 and May 1. The RBC Credit Facility replaced the Company's $40 million facility with Amegy Bank. The Company incurred $2.2 million of arrangement and upfront fees in connection with the RBC Credit Facility. Proceeds of the RBC Credit Facility were, or may be used (i) to finance working capital and for general corporate purposes, (ii) for permitted acquisitions, and (iii) to finance transaction expenses in connection with the RBC Credit Facility and the Merger. The RBC Credit Facility is collateralized by substantially all of the assets of the Company and its subsidiaries. Borrowings under the RBC Credit Facility bear interest at a rate that is dependent upon LIBOR or the U.S. prime rate of interest, plus a margin dependent upon the amount outstanding.
58
On October 1, 2013, the $235.4 million of assumed debt, accrued interest, the prepayment premium and $2.2 million of arrangement and upfront fees under the RBC Credit Facility were paid with the Company's existing cash of $127.6 million and drawings under our RBC Credit Facility of $110.0 million.
On October 28, 2014, the Company entered into a second amendment to the RBC Credit Facility, which reduces the effective interest rate on borrowings and provides for the repurchase by the Company of common shares under its 2011 Share Repurchase Plan, subject to certain limitations. As of December 31, 2014, we had $63.4 million outstanding under the RBC Credit Facility. As of February 27, 2015, we had $86.0 million outstanding under the RBC Credit Facility.
The RBC Credit Facility requires us to maintain compliance with specified financial ratios. Our compliance with these covenants is tested each quarter. At December 31, 2014, we were in compliance with the covenants under the RBC Credit Facility. See Note 13 to our Financial Statements -“Long-Term Debt” for a more detailed description of terms and provisions of our credit agreement.
Future Capital Requirements
Our future crude oil, natural gas and natural gas liquids reserves and production, and therefore our cash flow and results of operations, are highly dependent on our success in efficiently developing and exploiting our current reserves and economically finding or acquiring additional recoverable reserves. We intend to grow our reserves and production by further exploiting our existing property base through drilling opportunities in our resource plays and in our conventional onshore inventory in the Texas Gulf Coast, with activity in any particular area to be a function of market and field economics. We anticipate that acquisitions, including those of undeveloped leasehold interests, will continue to play a role in our business strategy as those opportunities arise from time to time. There can be no assurance that we will invest, or that any investment entered into will be successful. These potential acquisitions are not part of our current capital budget and would require additional capital. Natural gas and oil prices continue to be volatile and our financial resources may be insufficient to fund any of these opportunities. While there are currently no unannounced agreements for the acquisition of any material businesses or assets, such transactions can be effected quickly and could occur at any time.
We believe that our internally generated cash flow, combined with availability under our RBC Credit Facility will be sufficient to meet the liquidity requirements necessary to fund our daily operations and planned capital development and to meet our debt service requirements for the next twelve months. We currently plan to limit our 2015 capital expenditures to a level within our forecasted cash flow from operations for the year; however, we do possess the capacity, through forecasted excess cash flow and through our RBC Credit Facility, to increase and/or accelerate drilling on any particular area should we determine that market and project economics so warrant. Our ability to execute on our growth strategy will be determined, in large part, by our cash flow and the availability of debt and equity capital at that time. Any decision regarding a financing transaction, and our ability to complete such a transaction, will depend on prevailing market conditions and other factors.
Our 2015 capital budget is currently forecasted to be approximately $50.6 million, exclusive of acquisitions, if any, and due to the current commodity price environment will be focused primarily on: (i) the preservation of our strong and flexible financial position, including limiting our overall capital expenditure budget to no more than internally generated cash flow; (ii) focusing drilling expenditures on strategic projects; (iii) identification of opportunities for cost efficiencies in all areas of our operations; and (iv) continuing to identify and, when appropriate, pursue new resource potential opportunities, internally and through acquisition. Our current capital budget for 2015 should allow us to meet our contractual requirements, remain in position to preserve our term acreage where appropriate and maintain our already strong financial profile. We will continuously monitor the commodity price environment, stability and forecast, and if warranted, make adjustments to our investment strategy as the year progresses.
Inflation and Changes in Prices
While the general level of inflation affects certain costs associated with the energy industry, factors unique to the industry result in independent price fluctuations. Such price changes have had, and will continue to have, a material effect on our operations; however, we cannot predict these fluctuations.
59
Income Taxes
During the years ended December 31, 2014, 2013 and 2012, we paid approximately $0.2 million, $0.3 million and $24.3 million, respectively, in federal and state income taxes, net of cash refunds received.
The following table summarizes our known contractual obligations as of December 31, 2014:
|
Payment due by period (thousands) |
|||||||||||||||
|
Less than |
More than |
||||||||||||||
|
Total |
1 year |
1 - 3 years |
3 - 5 years |
5 years |
|||||||||||
|
Long term debt and interest (1) |
$ |
66,770 |
$ |
1,241 |
$ |
65,529 |
$ |
— |
$ |
— |
|||||
|
Delay rentals |
589 | 243 | 346 |
— |
— |
||||||||||
|
Asset retirement obligations |
25,746 | 4,123 | 2,875 | 1,405 | 17,343 | ||||||||||
|
Employment agreements |
4,017 | 2,570 | 1,447 |
— |
— |
||||||||||
|
Operating leases (2) |
9,494 | 3,624 | 3,760 | 2,110 |
— |
||||||||||
|
Drilling Rig (3) |
6,624 | 6,624 |
— |
— |
— |
||||||||||
|
Uncertain income tax positions (4) |
518 |
— |
— |
— |
518 | ||||||||||
|
Total |
$ |
113,758 |
$ |
18,425 |
$ |
73,957 |
$ |
3,515 |
$ |
17,861 | |||||
|
(1) |
Estimated interest is based on the outstanding debt at December 31, 2014 using the interest rate in effect at that time. |
|
(2) |
Operating leases include contracts related to office space, compressors, vehicles, office equipment and other. Operating lease commitments from our previous office space are expected to be substantially recovered by the subleases that we have entered into for the remainder of our lease term. |
|
(3) |
Relates to a contract for an active drilling rig. |
|
(4) |
We cannot predict at this time when, or if, this obligation may be required to be paid. |
In addition to the above, we have also committed to invest up to an additional $20.6 million in Exaro.
Application of Critical Accounting Policies and Management’s Estimates
The discussion and analysis of the Company’s financial condition and results of operations is based upon the consolidated financial statements, which have been prepared in accordance with accounting principles generally accepted in the United States. The preparation of these consolidated financial statements requires the Company to make estimates and judgments that affect the reported amounts of assets, liabilities, revenues and expenses. The Company’s significant accounting policies are described in Note 2 of Notes to Consolidated Financial Statements included as part of this Form 10-K. We have identified below the policies that are of particular importance to the portrayal of our financial position and results of operations and which require the application of significant judgment by management. The Company analyzes its estimates, including those related to natural gas and oil reserve estimates, on a periodic basis and bases its estimates on historical experience, independent third party reservoir engineers and various other assumptions that management believes to be reasonable under the circumstances. Actual results may differ from these estimates under different assumptions or conditions. The Company believes the following critical accounting policies affect its more significant judgments and estimates used in the preparation of the Company’s consolidated financial statements:
Oil and Gas Properties - Successful Efforts
Our application of the successful efforts method of accounting for our natural gas and oil exploration and production activities requires judgments as to whether particular wells are developmental or exploratory, since exploratory costs and the costs related to exploratory wells that are determined to not have proved reserves must be expensed whereas developmental costs are capitalized. The results from a drilling operation can take considerable time to analyze, and the determination that commercial reserves have been discovered requires both judgment and application of industry experience. Wells may be completed that are assumed to be productive and actually deliver natural gas and oil in quantities insufficient to be economic, which may result in the abandonment of the wells at a later date. On occasion, wells are drilled which have targeted geologic structures that are both developmental and exploratory in nature, and in such instances an allocation of costs is required to properly account for the results.
60
Delineation seismic costs incurred to select development locations within a productive natural gas and oil field are typically treated as development costs and capitalized, but often these seismic programs extend beyond the proved reserve areas and therefore management must estimate the portion of seismic costs to expense as exploratory. The evaluation of natural gas and oil leasehold acquisition costs included in unproved properties requires management's judgment of exploratory costs related to drilling activity in a given area. Drilling activities in an area by other companies may also effectively condemn leasehold positions.
Reserve Estimates
While we are reasonably certain of recovering our reported reserves, the Company’s estimates of natural gas and oil reserves are, by necessity, projections based on geologic and engineering data, and there are uncertainties inherent in the interpretation of such data as well as the projection of future rates of production and the timing of development expenditures. Reserve engineering is a subjective process of estimating underground accumulations of natural gas and oil that are difficult to measure. The accuracy of any reserve estimate is a function of the quality of available data, engineering and geological interpretation and judgment. Estimates of economically recoverable natural gas and oil reserves and future net cash flows necessarily depend upon a number of variable factors and assumptions, such as historical production from the area compared with production from other producing areas, the assumed effect of regulations by governmental agencies, and assumptions governing future natural gas and oil prices, future operating costs, severance taxes, development costs and workover costs, all of which may in fact vary considerably from actual results. The future development costs associated with reserves assigned to proved undeveloped locations may ultimately increase to the extent that these reserves are later determined to be uneconomic. For these reasons, estimates of the economically recoverable quantities of expected natural gas and oil attributable to any particular group of properties, classifications of such reserves based on risk of recovery, and estimates of the future net cash flows may vary substantially. Any significant variance in the assumptions could materially affect the estimated quantity and value of the reserves, which could affect the carrying value of the Company’s natural gas and oil properties and/or the rate of depletion of such natural gas and oil properties.
Actual production, revenues and expenditures with respect to the Company’s reserves will likely vary from estimates, and such variances may be material. Holding all other factors constant, a reduction in the Company’s proved reserve estimate at December 31, 2014 of 5%, 10% and 15% would affect depreciation, depletion and amortization expense by approximately $2.2 million, $4.6 million and $7.3 million, respectively.
Impairment of Natural Gas and Oil Properties
The Company reviews its proved natural gas and oil properties for impairment whenever events and circumstances indicate a potential decline in the recoverability of their carrying value. The Company compares expected undiscounted future net cash flows from each field to the unamortized capitalized cost of the asset. If the future undiscounted net cash flows, based on the Company’s estimate of future natural gas and oil prices and operating costs and anticipated production from proved reserves, are lower than the unamortized capitalized cost, then the capitalized cost is reduced to fair market value. The factors used to determine fair value include, but are not limited to, estimates of reserves, future commodity pricing, future production estimates, and anticipated capital expenditures. Unproved properties are reviewed quarterly to determine if there has been impairment of the carrying value, with any such impairment charged to expense in the period. Drilling activities in an area by other companies may also effectively impair leasehold positions. Given the complexities associated with natural gas and oil reserve estimates and the history of price volatility in the natural gas and oil markets, events may arise that will require the Company to record an impairment of its natural gas and oil properties and there can be no assurance that such impairments will not be required in the future nor that they will not be material.
Derivative Instruments
At the end of each reporting period we record on our balance sheet the mark-to-market valuation of our derivative instruments. The estimated change in fair value of the derivatives, along with the realized gain or loss for settled derivatives, is reported in Other Income (Expense) as Gain (loss) on derivatives, net.
Income Taxes
Income taxes are provided for the tax effects of transactions reported in the financial statements and consists of taxes currently payable plus deferred income taxes related to certain income and expenses recognized in different periods for financial and income tax reporting purposes. Deferred income taxes are measured by applying currently enacted tax rates to the differences between
61
financial statements and income tax reporting. Numerous judgments and assumptions are inherent in the determination of deferred income tax assets and liabilities as well as income taxes payable in the current period. We are subject to taxation in several jurisdictions, and the calculation of our tax liabilities involves dealing with uncertainties in the application of complex tax laws and regulations in various taxing jurisdictions.
Accounting for uncertainty in income taxes prescribes a recognition threshold and a measurement attribute for the financial statement recognition and measurement of income tax positions taken or expected to be taken in an income tax return. For those benefits to be recognized, an income tax position must be more-likely-than-not to be sustained upon examination by taxing authorities.
In assessing the realizability of deferred tax assets, we consider whether it is more likely than not that some portion or all of the deferred tax assets will not be realized. Deferred tax assets are reduced by a valuation allowance when, in the opinion of management, it is more likely than not that some portion or all of the deferred tax assets will not be realized. Estimating the amount of the valuation allowance is dependent on estimates of future taxable income, alternative minimum taxable income and changes in stockholder ownership that limit the use of net operating losses under the Internal Revenue Code Section 382 (“Section 382”).
Our federal and state income tax returns are generally not filed before the consolidated financial statements are prepared. Therefore, we estimate the tax basis of our assets and liabilities at the end of each period as well as the effects of tax rate changes, tax credits and net operating and capital loss carryforwards and carrybacks. Adjustments related to differences between the estimates we used and actual amounts we reported are recorded in the period in which we file our income tax returns.
We have a significant deferred tax asset associated with the net tax operating losses acquired in the Merger. The amount of the deferred tax assets considered realizable could be reduced in the future if estimates of future taxable income during the carryforward period are reduced. We expect we will be able to utilize all deferred tax assets despite the limitations of Internal Revenue Code Section 382, except those for which a valuation allowance has been provided. We will continue to assess the need for a valuation allowance against deferred tax assets considering all available evidence obtained in future reporting periods. Any adjustments or changes in our estimates of asset recovery could have an impact on our results of operations. See Note 16 - "Income Taxes” to our consolidated financial statements.
Business Combinations
Accounting for business combinations requires that the various assets acquired and liabilities assumed in a business combination be recorded at their respective acquisition date fair values. The most significant estimates to us typically relate to the value assigned to future recoverable oil and gas reserves and unproved properties. Deferred taxes are recorded for any differences between fair value and tax basis of assets acquired and liabilities assumed. To the extent the purchase price plus the liabilities assumed (including deferred income taxes recorded in connection with the transaction) exceeds the fair value of the net assets acquired, we are required to record the excess as goodwill. As the fair value of assets acquired and liabilities assumed is subject to significant estimates and subjective judgments, the accuracy of this assessment is inherently uncertain. The value assigned to recoverable oil and gas reserves is subject to the impairment test when facts or circumstances indicate that the value of the properties may be impaired, and the value assigned to unproved properties is assessed at least annually to ascertain whether impairment has occurred. If the initial accounting for the business combination is not complete, the amounts recognized for assets acquired and liabilities assumed in the financial statements may be adjusted during the measurement period of up to one year as specified by Accounting Standards Codification (“ASC”) 805, Business Combinations.
Recent Accounting Pronouncements
In January 2015, the Financial Accounting Standards Board (“FASB”) issued Accounting Standards Update No. 2015-01: Income Statement – Extraordinary and Unusual Items (Subtopic 225-20): Simplifying Income Statement Presentation by Eliminating the Concept of Extraordinary Items (ASU 2015-01). ASU 2015-01 is part of an initiative to reduce complexity in accounting standards. This update eliminates from generally accepted accounting principles the concept of extraordinary items, which eliminates the requirements for reporting entities to consider whether an underlying event or transaction is extraordinary. However, this will not result in a loss of information as the presentation and disclosure guidance for items that are unusual in nature or occur infrequently will be retained. ASU 2015-01 is effective for fiscal years, and interim periods within those fiscal years, beginning after December 15,
62
2015; early application is permitted. The provisions of this accounting update are not expected to have a material impact on our financial position or results of operations.
In November 2014, the FASB issued Accounting Standards Update No. 2014-17: Business Combinations (Topic 805): Pushdown Accounting (ASU 2014-17). ASU 2014-17 addresses the limited guidance available for determining whether and at what threshold pushdown accounting should be established in an acquired entity’s separate financial statements. Thus, the amendments in this update provide an acquired entity with an option to apply pushdown accounting upon occurrence of an event in which an acquirer obtains control of the acquired entity. Furthermore, the amendments in this update provide specific guidance on pushdown accounting for all entities, and the threshold for pushdown accounting is consistent with the threshold for change-in-control events in Topic 805, Business Combinations, and Topic 810, Consolidation. ASU 2014-17 became effective on November 18, 2014. The provisions of this accounting update are not expected to have a material impact on our financial position or results of operations.
In August 2014, the FASB issued Accounting Standards Update No. 2014-15: Presentation of Financial Statements – Going Concern (Subtopic 205-40): Disclosure of Uncertainties about an Entity’s Ability to Continue as a Going Concern (ASU 2014-15). ASU 2014-15 asserts that management should evaluate whether there are relevant condition or events that are known and reasonably knowable that raise substantial doubt about the entity’s ability to continue as a going concern within one year after the date the financial statements are issued or are available to be issued when applicable. If conditions or events at the date the financial statements are issued raise substantial doubt about an entity’s ability to continue as a going concern, disclosures are required which will enable users of the financial statements to understand the conditions or events as well as management’s evaluation and plan. ASU 2014-15 is effective for the annual period ending after December 15, 2016, and for annual and interim periods thereafter; early application is permitted. The provisions of this accounting update are not expected to have a material impact on our financial position or results of operations.
In May 2014, the FASB and the International Accounting Standards Board (“IASB”) jointly issued new accounting guidance for recognition of revenue Accounting Standards Update No. 2014-09: Revenue from Contracts with Customers (Topic 606) (ASU 2014-09). This new guidance replaces virtually all existing US GAAP and IFRS guidance on revenue recognition. ASU 2014-09 is effective for fiscal years beginning after December 15, 2016. This new guidance applies to all periods presented. Therefore, when the Company issues its financial statements on Forms 10-Q and 10-K for periods included in its year ended December 31, 2017, its comparative periods that are presented from the years ended December 31, 2015 and 2016, must be retrospectively presented in compliance with this new guidance. Early adoption is not allowed for US GAAP. The new guidance requires companies to make more estimates and use more judgment than under current accounting guidance. The Company does not anticipate that this new guidance will have a material impact on the Company’s consolidated financial position or results of operations for the periods presented.
In April 2014, the FASB issued Accounting Standards Update No. 2014-08: Presentation of Financial Statements (Topic 205) and Property, Plant, and Equipment (Topic 360): Reporting Discontinued Operations and Disclosures of Disposals of Components of an Entity (ASU 2014-08). ASU 2014-08 changes the criteria for reporting discontinued operations while enhancing disclosures in this area. The amended guidance requires that a disposal representing a strategic shift that has (or will have) a major effect on an entity’s financial results or a business activity classified as held for sale should be reported as discontinued operations. The amendments also expand the disclosure requirements for discontinued operations and add new disclosures for individually significant dispositions that do not qualify as discontinued operations. ASU 2014-08 is effective for annual and interim periods beginning after December 15, 2014 (early adoption is permitted only for disposals that have not been previously reported). The implementation of the amended guidance of ASU 2014-08 is not expected to have a material impact on the Company’s consolidated financial position or results of operations.
In May 2013, the Committee of Sponsoring Organizations of the Treadway Commission ("COSO"), revised its criteria related to internal controls over financial reporting from the originally established 1992 Internal Control - Integrated Framework with 2013 Internal Control - Integrated Framework. The modified framework provides enhanced guidance that ties control objectives to the related risk, enhancement of governance concepts, increased emphasis on globalization of markets and operations, increased recognition of use and reliance on information technology, increased discussion of fraud as it relates to internal control, changes of control deficiency descriptions, and that internal reporting is included in both financial and nonfinancial objectives. The revised framework is effective for interim and annual periods beginning after December 15, 2013, with early adoption being permitted. We implemented the changes required by the new COSO framework during the year ended December 31, 2014. We will continue to assess the impact, if any, it may have on our internal control structure.
63
In February 2013, the FASB issued Accounting Standards Update No. 2013-04 Liabilities (Topic 405): Obligations Resulting from Joint and Several Liability Arrangements for Which the Total Amount of the Obligation is Fixed at the Reporting Date (ASU 2013-04). ASU 2013-04 provides guidance for the recognition, measurement, and disclosure of obligations resulting from joint and several liability arrangements for which the total amount of the obligation within the scope of this guidance is fixed at the reporting date, except for obligations addressed within existing guidance in U.S. GAAP. Examples of obligations within the scope of this update include debt arrangements, other contractual obligations, and settled litigation and judicial rulings. U.S. GAAP does not include specific guidance on accounting for such obligations with joint and several liability, which has resulted in diversity in practice. The accounting update is effective for interim and annual periods beginning after December 15, 2013. We evaluated the provisions of this accounting update and do not believe that it has a material impact on our financial position and results of operations.
Off Balance Sheet Arrangements
We may enter into off-balance sheet arrangements that can give rise to off-balance sheet obligations. As of December 31, 2014, the primary off-balance sheet arrangements that we have entered into included short-term drilling rig contracts and operating lease agreements, all of which are customary in the oil and gas industry. Other than the off-balance sheet arrangements shown under operating leases and drilling rig in the commitments and contingencies table, we have no other arrangements that are reasonably likely to materially affect our liquidity or availability of or requirements for capital resources.
Item 7A. Quantitative and Qualitative Disclosure about Market Risk
Commodity Risk
We are exposed to various risks including energy commodity price risk for our oil, natural gas and natural gas liquids production. When oil, natural gas, and natural gas liquids prices decline significantly our ability to finance our capital budget and operations may be adversely impacted. Our major commodity price risk exposure is to the prices received. Realized commodity prices received for our production are tied to the spot prices applicable to natural gas and crude oil at the applicable delivery points. Prices received for oil, natural gas and natural gas liquids are volatile and unpredictable. For the year ended December 31, 2014, a 10% fluctuation in the prices received for oil, natural gas and natural gas liquids production would have had an approximately $28.0 million impact on our revenues.
Derivative Instruments and Hedging Activity
We expect commodity prices to remain volatile and unpredictable, therefore we have designed a risk management strategy which provides for the use of derivative instruments to provide partial protection against declines in oil and natural gas prices by reducing the risk of price volatility and the affect it could have on our operations. The types of derivative instruments that we typically utilize include swaps and costless collars. The total volumes which we have historically hedged through the use of our derivative instruments varied from period to period, however, generally our objective has been to potentially hedge approximately 40% to 50% of our current and anticipated production for the next 12 to 18 months, excluding offshore production during hurricane season. As of December 31, 2014, we did not have any commodity price hedges in place. Our hedge strategy and objectives may change significantly as our operational profile changes and/or commodities prices change.
We were exposed to market risk on our previously open derivative contracts related to potential non-performance by our counterparties. It is our policy to enter into derivative contracts, including interest rate swaps, only with counterparties that are creditworthy financial institutions deemed by management as competent and competitive market makers. The counterparties to the Company's previous derivative contracts were large financial institutions and also lenders or affiliates of lenders in our RBC Credit Facility. We did not post collateral under any of these contracts as they are secured under our RBC Credit Facility. See Note 7 to our Financial Statements - "Derivative Instruments" for additional information.
We have also been exposed to interest rate risk on our variable interest rate debt. If interest rates increase, our interest expense would increase and our available cash flow would decrease. As of December 31, 2014, we have not entered into any derivative contracts to reduce the exposure to market rate fluctuations. We continue to monitor our risk exposure as we incur future indebtedness at variable interest rates and will look to continue our risk management policy as situations present themselves.
64
We account for our derivative activities under the provisions of ASC 815, Derivatives and Hedging, (ASC 815). ASC 815 establishes accounting and reporting that every derivative instrument be recorded on the balance sheet as either an asset or liability measured at fair value. The estimated fair values for financial instruments under ASC 825, Financial Instruments (ASC 825) are determined at discrete points in time based on relevant market information. These estimates involve uncertainties and cannot be determined with precision. The estimated fair value of cash, cash equivalents, accounts receivable and accounts payable approximates their carrying value due to their short-term nature. See Note 7 to our Financial Statements - "Derivative Instruments" for more details.
Interest Rate Sensitivity
We are exposed to market risk related to adverse changes in interest rates. Our interest rate risk exposure results primarily from fluctuations in short-term rates, which are LIBOR and the U.S. prime rate based and may result in reductions of earnings or cash flows due to increases in the interest rates we pay on these obligations.
As of December 31, 2014, our total long-term debt was $63.4 million, which bears interest at a floating or market interest rate that is tied to the prime rate or LIBOR. Fluctuations in market interest rates will cause our annual interest costs to fluctuate. During the year ended December 31, 2014 our effective rate fluctuated between 1.7 percent and 4.3 percent, depending on the term of the specific debt drawdowns. At December 31, 2014, we did not have any outstanding interest rate swap agreements. As of December 31, 2014, the weighted average interest rate on our variable rate debt was 2.0% per year. Assuming our current level of borrowings, a 100 basis point increase in the interest rates we pay under our RBC Credit Facility would result in an increase of our interest expense by $0.6 million for a twelve month period.
Other Financial Instruments
As of December 31, 2014, we had no cash or cash equivalents. Investments in fixed-rate, interest-earning instruments carry a degree of interest rate and credit rating risk. Fixed-rate securities may have their fair market value adversely impacted because of changes in interest rates and credit ratings. Additionally, the value of our investments may be impaired temporarily or permanently. Due in part to these factors, our investment income may decline and we may suffer losses in principal. Currently, we do not use any derivative or other financial instruments or derivative commodity instruments to hedge any market risks, including changes in interest rates or credit ratings, and we do not plan to employ these instruments in the future. Because of the nature of the issuers of the securities that we may invest in, we do not believe that we have any cash flow exposure arising from changes in credit ratings. Based on a sensitivity analysis performed on the financial instruments held as of December 31, 2014, an immediate 10% change in interest rates is not expected to have a material effect on our near-term financial condition or results of operations.
Item 8. Financial Statements and Supplementary Data
The financial statements and supplemental information required to be filed under Item 8 of Form 10-K are presented on pages F-1 through F-44 of this Form 10-K.
Item 9. Changes in and Disagreements with Accountants on Accounting and Financial Disclosure
None.
Item 9A. Controls and Procedures
Evaluation of Disclosure Controls and Procedures
An evaluation was performed under the supervision and with the participation of the Company’s senior management of the effectiveness of the Company’s disclosure controls and procedures (as defined in Rule 13a-15(e) under the Securities Exchange Act of 1934 (the “Exchange Act”)) as of December 31, 2014, the end of the period covered by this report. Based on that evaluation, the Company’s management, including the President and Chief Executive Officer and the Chief Financial Officer, concluded that the Company’s disclosure controls and procedures were effective as of such date to ensure that information required to be disclosed in the reports that the Company files under the Exchange Act is (i) recorded, processed, summarized and reported within the time periods specified in the SEC’s rules and forms, and (ii) accumulated and communicated to the Company’s management, including the President and Chief Executive Officer and the Chief Financial Officer, as appropriate, to allow timely decisions regarding required disclosures.
65
Changes in Internal Control Over Financial Reporting
There was no change in our internal controls over financial reporting during the fiscal quarter ended December 31, 2014 that materially affected, or is reasonably likely to materially affect, our internal control over financial reporting.
Management’s Report on Internal Control Over Financial Reporting
The Company’s management is responsible for establishing and maintaining adequate internal control over financial reporting, as such term is defined in Exchange Act Rule 13a-15(f). Under the supervision and with the participation of the Company’s management, including the President and Chief Executive Officer and Chief Financial Officer, the Company conducted an evaluation of the effectiveness of its internal control over financial reporting based on the framework in 2013 Internal Control-Integrated Framework issued by the Committee of Sponsoring Organizations of the Treadway Commission. Based on the Company’s evaluation under the framework in 2013 Internal Control-Integrated Framework, the Company’s management concluded that its internal control over financial reporting was effective as of December 31, 2014.
Grant Thornton LLP, the independent registered public accounting firm that audited our consolidated financial statements included in this Form 10-K, has audited the effectiveness of our internal control over financial reporting as of December 31, 2014, as stated in their report which is included herein.
66
REPORT OF INDEPENDENT REGISTERED PUBLIC ACCOUNTING FIRM
Board of Directors and Shareholders
Contango Oil & Gas Company
We have audited the internal control over financial reporting of Contango Oil & Gas Company (a Delaware corporation) and subsidiaries (the “Company”) as of December 31, 2014, based on criteria established in the 2013 Internal Control—Integrated Framework issued by the Committee of Sponsoring Organizations of the Treadway Commission (COSO). The Company’s management is responsible for maintaining effective internal control over financial reporting and for its assessment of the effectiveness of internal control over financial reporting, included in the accompanying Management’s Report on Internal Control Over Financial Reporting. Our responsibility is to express an opinion on the Company’s internal control over financial reporting based on our audit.
We conducted our audit in accordance with the standards of the Public Company Accounting Oversight Board (United States). Those standards require that we plan and perform the audit to obtain reasonable assurance about whether effective internal control over financial reporting was maintained in all material respects. Our audit included obtaining an understanding of internal control over financial reporting, assessing the risk that a material weakness exists, testing and evaluating the design and operating effectiveness of internal control based on the assessed risk, and performing such other procedures as we considered necessary in the circumstances. We believe that our audit provides a reasonable basis for our opinion.
A company’s internal control over financial reporting is a process designed to provide reasonable assurance regarding the reliability of financial reporting and the preparation of financial statements for external purposes in accordance with generally accepted accounting principles. A company’s internal control over financial reporting includes those policies and procedures that (1) pertain to the maintenance of records that, in reasonable detail, accurately and fairly reflect the transactions and dispositions of the assets of the company; (2) provide reasonable assurance that transactions are recorded as necessary to permit preparation of financial statements in accordance with generally accepted accounting principles, and that receipts and expenditures of the company are being made only in accordance with authorizations of management and directors of the company; and (3) provide reasonable assurance regarding prevention or timely detection of unauthorized acquisition, use, or disposition of the company’s assets that could have a material effect on the financial statements.
Because of its inherent limitations, internal control over financial reporting may not prevent or detect misstatements. Also, projections of any evaluation of effectiveness to future periods are subject to the risk that controls may become inadequate because of changes in conditions, or that the degree of compliance with the policies or procedures may deteriorate.
In our opinion, the Company maintained, in all material respects, effective internal control over financial reporting as of December 31, 2014, based on criteria established in the 2013 Internal Control—Integrated Framework issued by COSO.
We also have audited, in accordance with the standards of the Public Company Accounting Oversight Board (United States), the consolidated financial statements of the Company as of and for the year ended December 31, 2014, and our report dated March 2, 2015 expressed an unqualified opinion on those financial statements.
/s/ GRANT THORNTON LLP
Houston, Texas
March 2, 2015
67
Amendment to Bylaws
On February 25, 2015, the Board of Directors (the “Board”) of the Company adopted the Third Amended and Restated Bylaws (the “Bylaws”) of the Company. The amendment and restatement of the Bylaws was effective immediately and includes, among other things, the following changes:
|
· |
Providing for additional disclosure requirements for notices of director nominations and stockholder proposals. |
|
· |
Modifying the time period during which notice of director nominations and stockholder proposals may be given. |
|
· |
Clarifying the procedures relating to the appointment of the chairman of a meeting of stockholders and the powers of the chairman of a meeting to conduct such a meeting. |
|
· |
Clarifying that the Board has the power to fix the record date, meeting date, time and place for each special meeting of stockholders. |
|
· |
Removing certain obsolete provisions arising from and relating to our merger with Crimson Exploration Inc. |
|
· |
Clarifying the requirements for removal of a director for cause by stockholders of the Company. |
|
· |
Designating the Court of Chancery of the State of Delaware as the sole and exclusive forum for certain legal action, unless the Company consents in writing to the selection of an alternative forum. |
The foregoing description of the Bylaws is not complete and is qualified in its entirety by reference to the complete text of the Bylaws, a copy of which is filed as Exhibit 3.2 to this Annual Report on Form 10-K and incorporated by reference herein.
PART III
Item 10. Directors, Executive Officers and Corporate Governance
The information regarding directors, executive officers, promoters and control persons required under Item 10 of Form 10-K will be contained in our Definitive Proxy Statement for our 2015 Annual Meeting of Stockholders (the “Proxy Statement”) under the headings “Proposal 1: Election of Directors”, “Executive Compensation”, “Section 16(a) Beneficial Ownership Reporting Compliance” and “Corporate Governance and our Board” and is incorporated herein by reference. The Proxy Statement will be filed with the SEC pursuant to Regulation 14A of the Exchange Act, not later than 120 days after December 31, 2014.
Item 11. Executive Compensation
The information required under Item 11 of Form 10-K will be contained in the Proxy Statement under the heading “Executive Compensation” and is incorporated herein by reference.
Item 12. Security Ownership of Certain Beneficial Owners and Management and Related Stockholder Matters
The information required under Item 12 of Form 10-K will be contained in the Proxy Statement under the heading “Security Ownership of Certain Other Beneficial Owners and Management” and is incorporated herein by reference.
Item 13. Certain Relationships and Related Transactions, and Director Independence
The information required under Item 13 of Form 10-K will be contained in the Proxy Statement under the headings “Corporate Governance and our Board”, “Transactions with Related Persons” and “Executive Compensation” and is incorporated herein by reference.
68
Item 14. Principal Accountant Fees and Services
The information required under Item 14 of Form 10-K will be contained in the Proxy Statement under the subheading “Principal Accountant Fees and Services” and is incorporated herein by reference.
69
GLOSSARY OF SELECTED TERMS
The following is a description of the meanings of some of the oil and gas industry terms used in this report.
2D seismic or 3D seismic. Geophysical data that depict the subsurface strata in two dimensions or three dimensions, respectively. 3-D seismic typically provides a more detailed and accurate interpretation of the subsurface strata than 2-D seismic.
Bbl. One stock tank barrel, or 42 U.S. gallons liquid volume, in reference to crude oil or other liquid hydrocarbons.
Bcf. Billion cubic feet of natural gas.
Bcfe. Billion cubic feet equivalent, determined using the ratio of six Mcf of natural gas to one Bbl of crude oil, condensate or natural gas liquids.
Boe. Barrel of oil equivalent per day determined using the ratio of six Mcf of natural gas to one Bbl of crude oil, condensate or natural gas liquids.
Boe/d. Boe per day.
Btu or British thermal unit. The quantity of heat required to raise the temperature of one pound of water by one degree Fahrenheit.
Completion. The process of treating a drilled well followed by the installation of permanent equipment for the production of natural gas or oil, or in the case of a dry hole, the reporting of abandonment to the appropriate agency.
Condensate. Liquid hydrocarbons associated with the production of a primarily natural gas reserve.
Developed acreage. The number of acres that are allocated or assignable to productive wells or wells capable of production.
Development well. A well drilled into a proved natural gas or oil reservoir to the depth of a stratigraphic horizon known to be productive.
Dry hole. A well found to be incapable of producing hydrocarbons in sufficient quantities such that proceeds from the sale of such production exceed production expenses and taxes.
Exploratory well. A well drilled to find a new field or to find a new reservoir in a field previously found to be productive of natural gas or crude oil in another reservoir.
Field. An area consisting of either a single reservoir or multiple reservoirs all grouped on or related to the same individual geological structural feature and/or stratigraphic condition.
Gross acres or gross wells. The total acres or wells, as the case may be, in which a working interest is owned.
MBbls. Thousand barrels of crude oil or other liquid hydrocarbons.
Mcf. Thousand cubic feet of natural gas.
Mcfe. Thousand cubic feet equivalent, determined using the ratio of six Mcf of natural gas to one Bbl of crude oil, condensate or natural gas liquids.
MMBbls. million barrels of crude oil or other liquid hydrocarbons.
MMBtu. million British Thermal Units. One MMBtu equates to one Mcf.
MMcf. million cubic feet of natural gas.
MMcfe. million cubic feet equivalent, determined using the ratio of six Mcf of natural gas to one Bbl of crude oil, condensate or natural gas liquids.
70
MMcfe/d. Mmcfe per day.
Net acres or net wells. The sum of the fractional working interest owned in gross acres or gross wells, as the case may be.
Plugging and abandonment. Refers to the sealing off of fluids in the strata penetrated by a well so that the fluids from one stratum will not escape into another or to the surface. Regulations of all states require plugging of abandoned wells.
Productive well. A well that is found to be capable of producing hydrocarbons in sufficient quantities such that proceeds from the sale of the production exceed production expenses and taxes.
Prospect. A specific geographic area which, based on supporting geological, geophysical or other data and also preliminary economic analysis using reasonably anticipated prices and costs, is deemed to have potential for the discovery of commercial hydrocarbons.
Proved developed producing reserves. Proved developed oil and gas reserves are reserves that can be expected to be recovered through existing wells with existing equipment and operating methods.
Proved developed reserves. Has the meaning given to such term in Rule 4-10(a)(3) of Regulation S-X, which defines proved developed reserves as reserves that can be expected to be recovered through existing wells with existing equipment and operating methods. Additional oil and gas expected to be obtained through the application of fluid injection or other improved recovery techniques for supplementing the natural forces and mechanisms of primary recovery should be included as proved developed reserves only after testing by a pilot project or after the operation of an installed program has confirmed through production response that increased recovery will be achieved.
Proved reserves. Has the meaning given to such term in Rule 4-10(a)(2) of Regulation S-X, which defines proved reserves as the estimated quantities of crude oil, natural gas, and natural gas liquids which geological and engineering data demonstrate with reasonable certainty to be recoverable in future years from known reservoirs under existing economic and operating conditions, i.e., prices and costs as of the date the estimate is made. Prices include consideration of changes in existing prices provided only by contractual arrangements, but not on escalations based upon future conditions.
Reservoirs are considered proved if economic producibility is supported by either actual production or conclusive formation test. The area of a reservoir considered proved includes (A) that portion delineated by drilling and defined by gas-oil and/or oil-water contacts, if any, and (B) the immediately adjoining portions not yet drilled, but which can be reasonably judged as economically productive on the basis of available geological and engineering data. In the absence of information on fluid contacts, the lowest known structural occurrence of hydrocarbons controls the lower proved limit of the reservoir.
Reserves which can be produced economically through application of improved recovery techniques (such as fluid injection) are included in the proved classification when successful testing by a pilot project, or the operation of an installed program in the reservoir, provides support for the engineering analysis on which the project or program was based.
Estimates of proved reserves do not include the following: (A) oil that may become available from known reservoirs but is classified separately as indicated additional reserves; (B) crude oil, natural gas, and natural gas liquids, the recovery of which is subject to reasonable doubt because of uncertainty as to geology, reservoir characteristics, or economic factors; (C) crude oil, natural gas, and natural gas liquids, that may occur in undrilled prospects; and (D) crude oil, natural gas, and natural gas liquids, that may be recovered from oil shales, coal, gilsonite and other such sources.
Proved undeveloped reserves. Has the meaning given to such term in Rule 4-10(a)(4) of Regulation S-X, which defines proved undeveloped reserves as reserves that are expected to be recovered from new wells on undrilled acreage, or from existing wells where a relatively major expenditure is required for recompletion. Reserves on undrilled acreage shall be limited to those drilling units offsetting productive units that are reasonably certain of production when drilled. Proved reserves for other undrilled units can be claimed only where it can be demonstrated with certainty that there is continuity of production from the existing productive formation. Under no circumstances should estimates for proved undeveloped reserves be attributable to any acreage for which an application of fluid injection or other improved recovery technique is contemplated, unless such techniques have been proved effective by actual tests in the area and in the same reservoir.
71
PV-10. A non-GAAP financial measure that represents the present value, discounted at 10% per year, of estimated future cash inflows from proved natural gas and crude oil reserves, less future development and production costs using pricing assumptions in effect at the end of the period. PV-10 differs from Standardized Measure of Discounted Net Cash Flows because it does not include the effects of income taxes or non-property related expenses such as general and administrative expenses and debt service or depreciation, depletion and amortization on future net revenues. Neither PV-10 nor Standardized Measure of Discounted Net Cash Flows represents an estimate of fair market value of natural gas and crude oil properties. PV-10 is used by the industry as an arbitrary reserve asset value measure to compare against past reserve bases and the reserve bases of other business entities that are not dependent on the taxpaying status of the entity.
Reservoir. A porous and permeable underground formation containing a natural accumulation of producible natural gas and/or oil that is confined by impermeable rock or water barriers and is individual and separate from other reservoirs.
Trucking. The provision of trucks to move our drilling rigs from one well location to another and to deliver water and equipment to the field.
Undeveloped acreage. Lease acreage on which wells have not been drilled or completed to a point that would permit the production of commercial quantities of natural gas and oil regardless of whether such acreage contains proved reserves.
Working interest. The operating interest that gives the owner the right to drill, produce and conduct operating activities on the property and receive a share of production and requires the owner to pay a share of the costs of drilling and production operations.
72
PART IV
Item 15. Exhibits and Financial Statement Schedules
(a) Financial Statements and Schedules:
The financial statements are set forth in pages F-1 to F-37 of this Form 10-K. Financial statement schedules have been omitted since they are either not required, not applicable, or the information is otherwise included.
(b) Exhibits:
The following is a list of exhibits filed as part of this Form 10-K. Where so indicated by a footnote, exhibits, which were previously filed, are incorporated herein by reference.
|
|
|
|
|
|||
|
|
||||||
|
|
|
|
|
|||
|
|
|
|
||||
|
Exhibit Number |
|
Description |
||||
| 2.1 |
|
|
Agreement and Plan of Merger, among Contango Oil & Gas Company, Contango Acquisition, Inc. and Crimson Exploration Inc., dated as of April 29, 2013. (24) |
|||
| 3.1 |
|
|
Certificate of Incorporation of Contango Oil & Gas Company. (5) |
|||
| 3.2 |
|
|
Third Amended and Restated Bylaws of Contango Oil & Gas Company. † |
|||
| 3.3 |
|
|
Amendment to the Certificate of Incorporation of Contango Oil & Gas Company. (8) |
|||
| 4.1 |
|
|
Facsimile of common stock certificate of Contango Oil & Gas Company. (1) |
|||
| 4.2 |
|
|
Registration Rights Agreement, dated as of April 29, 2013, among Contango Oil & Gas Company, OCM Crimson Holdings, LLC and OCM GW Holdings, LLC. (24) |
|||
| 10.1 |
|
|
Agreement, dated effective as of September 1, 1999, between Contango Oil & Gas Company and Juneau Exploration, L.L.C. (2) |
|||
| 10.2 |
|
|
Amendment dated August 14, 2000 to agreement between Contango Oil & Gas Company and Juneau Exploration Company, LLC. dated effective as of September 1, 1999. (4) |
|||
| 10.3 |
|
|
Asset Purchase Agreement by and among Juneau Exploration, L.P. and Contango Oil & Gas Company dated January 4, 2002. (6) |
|||
| 10.4 |
|
|
Asset Purchase Agreement by and among Mark A. Stephens, John Miller, The Hunter Revocable Trust, Linda G. Ferszt, Scott Archer and the Archer Revocable Trust and Contango Oil & Gas Company dated January 9, 2002. (7) |
|||
| 10.5 |
Second Amended and Restated Credit Agreement dated as of October 1, 2010 among Contango Oil & Gas Company, Contango Operators, Inc. and Amegy Bank National Association, as Administrative Agent and Letter of Credit Issuer, together with First Amendment to Second Amended and Restated Credit Agreement dated October 20, 2010 among Contango Oil & Gas Company, Contango Operators, Inc. and Amegy Bank National Association. (18) |
|||||
| 10.6 |
Purchase and Sale Agreement between Juneau Exploration, L.P. and Contango Operators, Inc. dated October 1, 2010. (19) |
|||||
| 10.7 |
|
|
Purchase and Sale Agreement between Conterra Company as Seller, and Patara Oil & Gas LLC as Purchaser, dated April 22, 2011. (20) |
|||
| 10.8 |
|
|
Limited Liability Company Agreement of Republic Exploration LLC dated August 24, 2000. (10) |
|||
| 10.9 |
|
|
Amendment to Limited Liability Company Agreement and Additional Agreements of Republic Exploration LLC dated as of September 1, 2005. (10) |
|||
| 10.10 |
|
|
Limited Liability Company Agreement of Contango Offshore Exploration LLC dated November 1, 2000. (10) |
|||
| 10.11 |
|
|
First Amendment to Limited Liability Company Agreement and Additional Agreements of Contango Offshore Exploration LLC dated as of September 1, 2005. (10) |
|||
| 10.12 |
|
|
Assignment of Operating Rights Interest between CGM, LP and Contango Operators, Inc., dated as of January 3, 2008. (13) |
|||
| 10.13 |
|
|
Partial Assignment of Oil and Gas Leases between CGM, LP and Contango Operators, Inc., dated as of January 3, 2008. (13) |
|||
| 10.14 |
|
|
Assignment of Operating Rights Interest between CGM, LP and Contango Operators, Inc., dated as of January 3, 2008. (13) |
|||
73
| 10.15 |
|
|
Assignment of Operating Rights Interest between Olympic Energy Partners, LLC and Contango Operators, Inc., dated as of January 3, 2008. (13) |
|||
| 10.16 |
|
|
Partial Assignment of Oil and Gas Leases between Olympic Energy Partners, LLC and Contango Operators, Inc. dated as of January 3, 2008. (13) |
|||
| 10.17 |
|
|
Assignment of Operating Rights Interest between Olympic Energy Partners, LLC and Contango Operators, Inc., dated as of January 3, 2008. (13) |
|||
| 10.18 |
|
|
Assignment of Operating Rights Interest between Juneau Exploration, LP and Contango Operators, Inc., dated as of January 3, 2008. (13) |
|||
| 10.19 |
|
|
Partial Assignment of Oil and Gas Leases between Juneau Exploration, LP and Contango Operators, Inc., dated as of January 3, 2008. (13) |
|||
| 10.20 |
|
|
Assignment of Operating Rights Interest between Juneau Exploration, LP and Contango Operators, Inc., dated as of January 3, 2008. (13) |
|||
| 10.21 |
|
|
Assignment of Operating Rights Interest between Juneau Exploration, LP and Contango Operators, Inc., dated as of April 3, 2008. (14) |
|||
| 10.22 |
|
|
Partial Assignment of Oil and Gas Leases between Juneau Exploration, LP and Contango Operators, Inc., dated as of April 3, 2008. (14) |
|||
| 10.23 |
|
|
Assignment of Operating Rights Interest between Juneau Exploration, LP and Contango Operators, Inc., dated as of April 3, 2008. (14) |
|||
| 10.24 |
|
|
Assignment of Operating Rights Interest between Olympic Energy Partners, LLC and Contango Operators, Inc., dated as of April 3, 2008. (14) |
|||
| 10.25 |
|
|
Partial Assignment of Oil and Gas Leases between Olympic Energy Partners, LLC and Contango Operators, Inc. dated as of April 3, 2008. (14) |
|||
| 10.26 |
|
|
Assignment of Operating Rights Interest between Olympic Energy Partners, LLC and Contango Operators, Inc., dated as of April 3, 2008. (14) |
|||
| 10.27 |
|
|
Assignment of Overriding Royalty Interest between Dutch Royalty Investments, Land and Leasing, LP and Contango Operators, Inc., dated as of February 8, 2008. (15) |
|||
| 10.28 |
|
|
Assignment of Overriding Royalty Interest between Dutch Royalty Investments, Land and Leasing, LP and Contango Operators, Inc., dated as of February 8, 2008. (15) |
|||
| 10.29 |
|
|
Assignment of Overriding Royalty Interest between Dutch Royalty Investments, Land and Leasing, LP and Contango Operators, Inc., dated as of February 8, 2008. (15) |
|||
| 10.30 |
|
|
Assignment of Overriding Royalty Interest between Dutch Royalty Investments, Land and Leasing, LP and Contango Operators, Inc., dated as of February 8, 2008. (15) |
|||
| 10.31 |
|
|
Assignment of Overriding Royalty Interest between Dutch Royalty Investments, Land and Leasing, LP and Contango Operators, Inc., dated as of February 8, 2008. (15) |
|||
| 10.32 |
|
|
Assignment of Overriding Royalty Interest between Dutch Royalty Investments, Land and Leasing, LP and Contango Operators, Inc., dated as of February 8, 2008. (15) |
|||
| 10.33 |
|
|
Assignment of Overriding Royalty Interest between Dutch Royalty Investments, Land and Leasing, LP and Contango Operators, Inc., dated as of February 8, 2008. (15) |
|||
| 10.34 |
Amended and Restated Limited Liability Company Agreement of Republic Exploration LLC, dated April 1, 2008. (14) |
|||||
| 10.35 |
|
|
Amended and Restated Limited Liability Company Agreement of Contango Offshore Exploration LLC, dated April 1, 2008. (15) |
|||
| 10.36 |
|
* |
Amended and Restated 2005 Stock Incentive Plan (28) |
|||
| 10.37 |
|
* |
Contango Oil & Gas Company Amended and Restated 2009 Incentive Compensation Plan. (11) |
|||
| 10.38 |
|
|
Conterra Joint Venture Development Agreement effective October 1, 2009 between Conterra Company and Patara Oil & Gas LLC. (12) |
|||
| 10.39 |
|
|
First Amended and Restated Limited Liability Company Agreement dated as of March 31, 2012. (21) |
|||
| 10.40 |
|
|
Participation Agreement covering OCS-G 27927, Ship Shoal Block 263, South Addition, dated as of October 9, 2008 between Contango Offshore Exploration LLC and Contango Operators, Inc. (23) |
|||
| 10.41 |
|
|
Amendment to Participation Agreement covering OCS-G 27927, Ship Shoal Block 263, South Addition, dated as of October 7, 2009 between Contango Offshore Exploration LLC and Contango Operators, Inc. (23) |
|||
| 10.42 |
|
|
Amendment to Participation Agreement covering OCS-G 27927, Ship Shoal Block 263, South Addition, dated as of January 29, 2010 between Contango Offshore Exploration LLC and Contango Operators, Inc. (23) |
|||
| 10.43 |
|
|
Participation Agreement covering OCS-G 33596, Vermilion 170, dated as of July 1, 2010 between Republic Exploration LLC and Contango Operators, Inc. (23) |
|||
74
| 10.44 |
|
|
Participation Agreement covering OCS-G 33640, Ship Shoal 121; OCS-G 33641, Ship Shoal 122; and OCS-G 22701, Ship Shoal 134, dated as of July 1, 2010 between Republic Exploration LLC and Contango Operators, Inc. (23) |
|||
| 10.45 |
|
|
Amendment to Participation Agreement covering OCS-G 33640, Ship Shoal 121; OCS-G 33641, Ship Shoal 122; and OCS-G 22701, Ship Shoal 134, dated as of June 30, 2012 between Republic Exploration LLC and Contango Operators, Inc. (23) |
|||
| 10.46 |
|
|
Participation Agreement covering OCS-G 22738, South Timbalier 75, dated as of July 26, 2011 between Republic Exploration LLC and Contango Operators, Inc. (23) |
|||
| 10.47 |
|
|
Amendment to Participation Agreement covering OCS-G 22738, South Timbalier 75, dated as of August 21, 2012 between Republic Exploration LLC and Contango Operators, Inc. (23) |
|||
| 10.48 |
|
|
Participation Agreement covering Tuscaloosa Marine Shale, dated as of August 27, 2012 between Juneau Exploration LP and Contango Operators, Inc. (23) |
|||
| 10.49 |
|
|
Letter Agreement dated as of June 8, 2012 between Juneau Exploration LP and Contango Operators, Inc. (23) |
|||
| 10.50 |
|
|
Participation Agreement covering Central Gulf of Mexico Lease Sale 216/222, dated as of August 27, 2012 between Republic Exploration LLC and Contango Operators, Inc. (23) |
|||
| 10.51 |
|
|
Participation Agreement covering Central Gulf of Mexico Lease Sale 216/222, dated as of August 27, 2012 between Juneau Exploration LP and Contango Operators, Inc. (23) |
|||
| 10.52 |
|
|
Agreement to Purchase Overriding Royalty Interest, dated March 1, 2010 between Contango Offshore Exploration LLC and Juneau Exploration LP. (23) |
|||
| 10.53 |
|
|
Employment Agreement, dated as of April 29, 2013, among Contango Oil & Gas Company and Allan D. Keel. (24) |
|||
| 10.54 |
|
|
Employment Agreement, dated as of April 29, 2013, among Contango Oil & Gas Company and E. Joseph Grady. (24) |
|||
| 10.55 |
|
|
First Right of Refusal Agreement between Contango Oil & Gas Company and Juneau Exploration, L.P., entered into as of January 1, 2013. (25) |
|||
| 10.56 |
|
|
Advisory Agreement between Contaro Company and Juneau Exploration, L.P., entered into as of January 1, 2013. (25) |
|||
| 10.57 |
|
|
Employment Agreement, dated as of June 10, 2013, among Contango Oil & Gas Company and Jeffrey A. Sikora. (26) |
|||
| 10.58 |
|
|
Employment Agreement, dated as of June 7, 2013, among Contango Oil & Gas Company and A. Carl Isaac. (26) |
|||
| 10.59 |
|
|
Employment Agreement, dated as of June 7, 2013, among Contango Oil & Gas Company and John A. Thomas. (26) |
|||
| 10.60 |
|
|
Employment Agreement, dated as of June 7, 2013, among Contango Oil & Gas Company and Jay S. Mengle. (26) |
|||
| 10.61 |
|
|
Employment Agreement, dated as of June 7, 2013, among Contango Oil & Gas Company and Thomas H. Atkins. (26) |
|||
| 10.62 |
Transition Agreement, dated as of June 10, 2013, between Contango Oil & Gas Company and Marc Duncan. (27) |
|||||
| 10.63 |
Participation Agreement covering Central Gulf of Mexico Lease Sale 227, dated as of March 21, 2013 between Republic Exploration LLC and Contango Operators, Inc. (22) |
|||||
| 10.64 |
Participation Agreement covering Timbalier Island Prospect, South Timbalier Area Block 17, S.L. 21906, dated April 3, 2013 between Republic Exploration LLC, Juneau Exploration, L.P. and Contango Operators, Inc. (22) |
|||||
| 10.65 |
Credit Agreement among Contango Oil & Gas Company, as Borrower, Royal Bank of Canada, as Administrative Agent, and the Lenders Signatory Hereto dated October 1, 2013. (28) |
|||||
| 10.66 |
First Amendment to Credit Agreement among Contango Oil & Gas Company, as Borrower, Royal Bank of Canada, as Administrative Agent, and the Lenders Signatory Hereto. (30) |
|||||
| 10.67 |
Second Amendment to Credit Agreement among Contango Oil & Gas company, as Borrower, Royal Bank of Canada, as Administrative Agent, and the Lenders Signatory Hereto. (31) |
|||||
| 10.68 |
Termination Agreement between Juneau Exploration LP and Contaro Company, dated July 15, 2014. (32) |
|||||
| 10.69 |
* |
Contango Oil & Gas Company Director Compensation Plan. (33) |
||||
| 14.1 |
Code of Ethics. (29) |
|||||
| 21.1 |
List of Subsidiaries. † |
|||||
| 21.2 |
Organizational Chart. † |
|||||
| 23.1 |
Consent of William M. Cobb & Associates, Inc. † |
|||||
| 23.2 |
Consent of Netherland, Sewell & Associates, Inc. † |
|||||
| 23.3 |
Consent of W.D. Von Gonten & Co. † |
|||||
| 23.4 |
Consent of Grant Thornton LLP. † |
|||||
| 31.1 |
Certification of Chief Executive Officer required by Rules 13a-14 and 15d-14 under the Securities Exchange Act of 1934. † |
|||||
| 31.2 |
Certification of Chief Financial Officer required by Rules 13a-14 and 15d-14 under the Securities Exchange Act of 1934. † |
|||||
75
| 32.1 |
Certification of Chief Executive Officer pursuant to 18 U.S.C. 1350, as adopted pursuant to Section 906 of the Sarbanes-Oxley Act of 2002. † |
|||||
| 32.2 |
Certification of Chief Financial Officer pursuant to 18 U.S.C. 1350, as adopted pursuant to Section 906 of the Sarbanes-Oxley Act of 2002. † |
|||||
| 99.1 |
Report of William M. Cobb & Associates, Inc. † |
|||||
| 99.2 |
Report of Netherland, Sewell & Associates. † |
|||||
| 99.3 |
Report of W.D. Von Gonten and Company † |
|||||
* Indicates a management contract or compensatory plan or arrangement.
† Filed herewith
|
|
|
|
|||
|
|
|||||
|
|
|
|
|||
|
1. |
|
Filed as an exhibit to the Company’s Form 10-SB Registration Statement, as filed with the Securities and Exchange Commission on October 16, 1998. |
|||
|
2. |
|
Filed as an exhibit to the Company’s report on Form 10-QSB for the quarter ended September 30, 1999, as filed with the Securities and Exchange Commission on November 11, 1999. |
|||
|
3. |
|
Reserved |
|||
|
4. |
|
Filed as an exhibit to the Company’s annual report on Form 10-KSB for the fiscal year ended June 30, 2000, as filed with the Securities and Exchange Commission on September 27, 2000. |
|||
|
5. |
|
Filed as an exhibit to the Company’s report on Form 8-K, dated December 1, 2000, as filed with the Securities and Exchange Commission on December 15, 2000. |
|||
|
6. |
|
Filed as an exhibit to the Company’s report on Form 8-K, dated January 4, 2002, as filed with the Securities and Exchange Commission on January 8, 2002. |
|||
|
7. |
|
Filed as an exhibit to the Company’s report on Form 10-QSB for the quarter ended March 31, 2002, as filed with the Securities and Exchange Commission on February 14, 2002. |
|||
|
8. |
|
Filed as an exhibit to the Company’s report on Form 10-QSB for the quarter ended December 31, 2002, dated November 14, 2002, as filed with the Securities and Exchange Commission. |
|||
|
9. |
|
Reserved |
|||
|
10. |
|
Filed as an exhibit to the Company’s report on Form 8-K, dated September 2, 2005, as filed with the Securities and Exchange Commission on September 8, 2005. |
|||
|
11. |
|
Filed as an exhibit to the Company’s Schedule 14A on Definitive Proxy Statement for 2014, as filed with the Securities and Exchange Commission on April 11, 2014 |
|||
|
12. |
|
Filed as an exhibit to the Company’s report on Form 8-K, dated October 22, 2009, as filed with the Securities and Exchange Commission on October 28, 2009. |
|||
|
13. |
|
Filed as an exhibit to the Company’s report on Form 8-K, dated January 3, 2008, as filed with the Securities and Exchange Commission on January 9, 2008. |
|||
|
14. |
|
Filed as an exhibit to the Company’s report on Form 8-K, dated April 3, 2008, as filed with the Securities and Exchange Commission on April 9, 2008. |
|||
|
15. |
|
Filed as an exhibit to the Company’s report on Form 10-K for the fiscal year ended June 30, 2008, as filed with the Securities and Exchange Commission on August 29, 2008. |
|||
|
16. |
|
Reserved |
|||
|
17. |
|
Reserved |
|||
|
18. |
|
Filed as an exhibit to the Company’s report on Form 8-K, dated October 20, 2010 as filed with the Securities and Exchange Commission on October 25, 2010. |
|||
|
19. |
|
Filed as an exhibit to the Company’s report on Form 10-Q for the quarter ended September 30, 2010, as filed with the Securities and Exchange Commission on November 9, 2010. |
|||
|
20. |
|
Filed as an exhibit to the Company’s report on Form 8-K, dated May 13, 2011 as filed with the Securities and Exchange Commission on May 18, 2011. |
|||
|
21. |
|
Filed as an exhibit to the Company’s report on Form 8-K, dated as of March 31, 2012, as filed with the Securities and Exchange Commission on April 5, 2012. |
|||
|
22. |
|
Filed as an exhibit to the Company’s report on Form 10-K for the fiscal year ended June 30, 2013, as filed with the Securities and Exchange Commission on August 29, 2013. |
|||
76
|
23. |
|
Filed as an exhibit to the Company’s report on Form 10-K for the fiscal year ended June 30, 2012, as filed with the Securities and Exchange Commission on August 29, 2012. |
|||
|
24. |
|
Filed as an exhibit to the Company’s report on Form 8-K, dated as of April 29, 2013, as filed with the Securities and Exchange Commission on May 1, 2013. |
|||
|
25. |
|
Filed as an exhibit to the Company's report on Form 10-Q for the quarter ended December 31, 2012, as filed with the Securities and Exchange Commission on February 11, 2013. |
|||
|
26. |
|
Filed as an exhibit to the Company's Registration Statement on Form S-4, as filed with the Securities and Exchange Commission on June 13, 2013. |
|||
|
27. |
|
Filed as an exhibit to the Company’s report on Form 8-K, dated as of June 7, 2013, as filed with the Securities and Exchange Commission on June 14, 2013. |
|||
|
28. |
|
Filed as an exhibit to the Company’s Current Report on Form 8-K dated as of October 1, 2013, as filed with the Securities and Exchange Commission on October 2, 2013. |
|||
|
29. |
|
Filed as an exhibit to the Company’s report on Form 8-K dated as of January 30, 2014, as filed with the Securities and Exchange Commission on January 30, 2014 |
|||
|
30. |
|
Filed as an exhibit to the Company’s report on Form 8-K dated as of April 11, 2014, as filed with the Securities and Exchange Commission on April 15, 2014. |
|||
|
31. |
|
Filed as an exhibit to the Company’s report on Form 8-K dated as of October 28, 2014, as filed with the Securities and Exchange Commission on October 31, 2014. |
|||
|
32. |
|
Filed as an exhibit to the Company’s report on Form 10-Q for the quarter ended June 30, 2014, as filed with the Securities and Exchange Commission on August 11, 2014. |
|||
|
33. |
|
Filed as an exhibit to the Company’s Transition Report on Form 10-KT for the six months ended December 31, 2013, as filed with the Securities and Exchange Commission on March 28, 2014. |
|||
77
SIGNATURES
In accordance with Section 13 or 15(d) of the Exchange Act, the registrant has duly caused this report to be signed on its behalf by the undersigned, thereunto duly authorized.
CONTANGO OIL & GAS COMPANY
|
|
|||||||
|
|
|
|
|
|
|||
|
Signature |
|
Title |
|
Date |
|||
|
|
|
|
|
|
|||
|
/s/ ALLAN D. KEEL Allan D. Keel |
|
Chief Executive Officer (principal executive officer) |
|
March 3, 2015 |
|||
|
|
|
|
|
|
|||
|
/s/ E. JOSEPH GRADY E. Joseph Grady |
|
Chief Financial Officer (principal financial officer and principal accounting officer) |
|
March 3, 2015 |
|||
POWER OF ATTORNEY
Know all men by these presents, that the undersigned constitutes and appoints Allan D. Keel as his true and lawful attorneys-in-fact and agent, with full power of substitution for him and in his name, place and stead, in any and all capacities to sign any and all amendments or supplements to this Annual Report on Form 10-K, and to file the same, and with all exhibits thereto and other documents in connection therewith, with the Securities and Exchange Commission, granting unto said attorney-in-fact and agent full power and authority to do and perform each and every act and thing requisite and necessary to be done as fully to all intents and purposes as he might or could do in person, hereby ratifying and confirming all that said attorney-in-fact and agent or his substitute or substitutes, may lawfully do or cause to be done by virtue hereof.
In accordance with the Exchange Act, this report has been signed below by the following persons on behalf of the registrant and in the capacities and on the dates indicated.
|
|
|||||||
|
|
|
|
|
|
|||
|
Signature |
|
Title |
|
Date |
|||
|
|
|
|
|
|
|||
|
/s/ALLAN D. KEEL Allan D. Keel |
|
Chief Executive Officer (principal executive officer) and Director |
|
March 3, 2015 |
|||
|
|
|
|
|
|
|||
|
/s/ JOSEPH J. ROMANO Joseph J. Romano |
|
Director |
|
March 3, 2015 |
|||
|
|
|
|
|
|
|||
|
/s/ B.A. BERILGEN B. A. Berilgen |
|
Director |
|
March 3, 2015 |
|||
|
|
|
|
|
|
|||
|
/s/ B. JAMES FORD B. James Ford |
|
Director |
|
March 3, 2015 |
|||
|
|
|
|
|
|
|||
|
/s/ ELLIS L. MCCAIN Ellis L. McCain |
|
Director |
|
March 3, 2015 |
|||
|
|
|
|
|
|
|||
|
/s/ CHARLES M. REIMER Charles M. Reimer |
|
Director |
|
March 3, 2015 |
|||
|
|
|
|
|
|
|||
|
/s/ STEVEN L. SCHOONOVER Steven L. Schoonover |
Director |
March 3, 2015 |
|||||
78
CONTANGO OIL & GAS COMPANY AND SUBSIDIARIES
INDEX TO CONSOLIDATED FINANCIAL STATEMENTS
|
|
||||
|
|
|
|
||
|
|
|
Page |
||
|
|
||||
|
|
||||
|
|
||||
|
|
||||
|
|
||||
|
|
||||
|
|
F-38 |
|||
|
|
||||
F-1
REPORT OF INDEPENDENT REGISTERED PUBLIC ACCOUNTING FIRM
Board of Directors and Shareholders
Contango Oil & Gas Company
We have audited the accompanying consolidated balance sheets of Contango Oil & Gas Company (a Delaware corporation) and subsidiaries (the “Company”) as of December 31, 2014 and 2013, and the related consolidated statements of operations, shareholders’ equity, and cash flows for each of the three years in the period ended December 31, 2014. These financial statements are the responsibility of the Company’s management. Our responsibility is to express an opinion on these financial statements based on our audits.
We conducted our audits in accordance with the standards of the Public Company Accounting Oversight Board (United States). Those standards require that we plan and perform the audit to obtain reasonable assurance about whether the financial statements are free of material misstatement. An audit includes examining, on a test basis, evidence supporting the amounts and disclosures in the financial statements. An audit also includes assessing the accounting principles used and significant estimates made by management, as well as evaluating the overall financial statement presentation. We believe that our audits provide a reasonable basis for our opinion.
In our opinion, the consolidated financial statements referred to above present fairly, in all material respects, the financial position of Contango Oil & Gas Company and subsidiaries as of December 31, 2014 and 2013, and the results of their operations and their cash flows for each of the three years in the period ended December 31, 2014 in conformity with accounting principles generally accepted in the United States of America.
We also have audited, in accordance with the standards of the Public Company Accounting Oversight Board (United States), the Company’s internal control over financial reporting as of December 31, 2014, based on criteria established in the 2013 Internal Control—Integrated Framework issued by the Committee of Sponsoring Organizations of the Treadway Commission (COSO), and our report dated March 2, 2015 expressed an unqualified opinion.
/s/ GRANT THORNTON LLP
Houston, Texas
March 2, 2015
F-2
CONTANGO OIL & GAS COMPANY AND SUBSIDIARIES
CONSOLIDATED BALANCE SHEETS
(in thousands, except shares)
|
December 31, |
December 31, |
|||||
|
2014 |
2013 |
|||||
|
CURRENT ASSETS: |
||||||
|
Cash and cash equivalents |
$ |
— |
$ |
— |
||
|
Accounts receivable, net |
25,309 | 60,613 | ||||
|
Prepaid expenses and other |
1,941 | 2,031 | ||||
|
Inventory |
2,166 | 2,147 | ||||
|
Current deferred tax asset |
1,624 | 1,326 | ||||
|
Total current assets |
31,040 | 66,117 | ||||
|
PROPERTY, PLANT AND EQUIPMENT: |
||||||
|
Natural gas and oil properties, successful efforts method of accounting: |
||||||
|
Proved properties |
1,138,054 | 1,001,361 | ||||
|
Unproved properties |
35,783 | 49,443 | ||||
|
Other property and equipment |
1,084 | 900 | ||||
|
Accumulated depreciation, depletion and amortization |
(426,298) | (260,681) | ||||
|
Total property, plant and equipment, net |
748,623 | 791,023 | ||||
|
OTHER NON-CURRENT ASSETS: |
||||||
|
Investments in affiliates |
62,085 | 50,901 | ||||
|
Other |
1,667 | 2,263 | ||||
|
Total other non-current assets |
63,752 | 53,164 | ||||
|
TOTAL ASSETS |
$ |
843,415 |
$ |
910,304 | ||
|
CURRENT LIABILITIES: |
||||||
|
Accounts payable and accrued liabilities |
$ |
92,892 |
$ |
96,833 | ||
|
Current derivative liability |
— |
1,131 | ||||
|
Current asset retirement obligations |
4,123 | 1,315 | ||||
|
Total current liabilities |
97,015 | 99,279 | ||||
|
NON-CURRENT LIABILITIES: |
||||||
|
Long-term debt |
63,359 | 90,000 | ||||
|
Deferred tax liability |
93,952 | 105,956 | ||||
|
Asset retirement obligations |
21,623 | 22,019 | ||||
|
Total non-current liabilities |
178,934 | 217,975 | ||||
|
Total liabilities |
275,949 | 317,254 | ||||
|
COMMITMENTS AND CONTINGENCIES (NOTE 14) |
||||||
|
SHAREHOLDERS’ EQUITY: |
||||||
|
Common stock, $0.04 par value, 50 million shares authorized, 24,372,538 shares issued and 19,148,000 shares outstanding at December 31, 2014, 24,356,236 shares issued and 19,363,711 shares outstanding at December 31, 2013 |
963 | 962 | ||||
|
Additional paid-in capital |
233,278 | 228,644 | ||||
|
Treasury shares at cost (5,224,538 shares at December 31, 2014 and 4,992,525 shares at December 31, 2013) |
(127,525) | (119,180) | ||||
|
Retained earnings |
460,750 | 482,624 | ||||
|
Total shareholders’ equity |
567,466 | 593,050 | ||||
|
TOTAL LIABILITIES AND SHAREHOLDERS’ EQUITY |
$ |
843,415 |
$ |
910,304 | ||
The accompanying notes are an integral part of these consolidated financial statements.
F-3
CONTANGO OIL & GAS COMPANY AND SUBSIDIARIES
CONSOLIDATED STATEMENTS OF OPERATIONS
(in thousands, except per share amounts)
|
Year Ended December 31 |
|||||||||
|
2014 |
2013 |
2012 |
|||||||
|
REVENUES: |
|||||||||
|
Oil and condensate sales |
$ |
130,238 |
$ |
59,608 |
$ |
56,237 | |||
|
Natural gas sales |
112,695 | 79,289 | 60,691 | ||||||
|
Natural gas liquids sales |
33,525 | 25,224 | 28,940 | ||||||
|
Total revenues |
276,458 | 164,121 | 145,868 | ||||||
|
EXPENSES: |
|||||||||
|
Operating expenses |
47,236 | 36,784 | 23,720 | ||||||
|
Exploration expenses |
33,387 | 1,811 | 51,903 | ||||||
|
Depreciation, depletion and amortization |
156,117 | 65,529 | 44,896 | ||||||
|
Impairment and abandonment of oil and gas properties |
47,693 | 776 | 14,079 | ||||||
|
General and administrative expenses |
34,045 | 26,512 | 11,265 | ||||||
|
Total expenses |
318,478 | 131,412 | 145,863 | ||||||
|
OTHER INCOME (EXPENSE): |
|||||||||
|
Gain from investment in affiliates (net of income taxes) |
6,923 | 2,310 | 60 | ||||||
|
Interest income (expense) |
(2,658) | (1,171) | 96 | ||||||
|
Loss on derivatives, net |
(153) | (1,132) |
— |
||||||
|
Other income (expense) |
124 | 31,785 | (463) | ||||||
|
Total other income (expense) |
4,236 | 31,792 | (307) | ||||||
|
NET INCOME (LOSS) FROM CONTINUING OPERATIONS BEFORE INCOME TAXES |
(37,784) | 64,501 | (302) | ||||||
|
Income tax benefit (provision) |
15,910 | (23,139) | (605) | ||||||
|
NET INCOME (LOSS) FROM CONTINUING OPERATIONS |
(21,874) | 41,362 | (907) | ||||||
|
DISCONTINUED OPERATIONS, NET OF INCOME TAX |
— |
— |
(29) | ||||||
|
NET INCOME (LOSS) ATTRIBUTABLE TO COMMON STOCK |
$ |
(21,874) |
$ |
41,362 |
$ |
(936) | |||
|
NET INCOME (LOSS) PER SHARE: |
|||||||||
|
Basic |
|||||||||
|
Continuing operations |
$ |
(1.15) |
$ |
2.56 |
$ |
(0.06) | |||
|
Discontinued operations |
— |
— |
(0.00) | ||||||
|
Total |
$ |
(1.15) |
$ |
2.56 |
$ |
(0.06) | |||
|
Diluted |
|||||||||
|
Continuing operations |
$ |
(1.15) |
$ |
2.56 |
$ |
(0.06) | |||
|
Discontinued operations |
— |
— |
(0.00) | ||||||
|
Total |
$ |
(1.15) |
$ |
2.56 |
$ |
(0.06) | |||
|
WEIGHTED AVERAGE COMMON SHARES OUTSTANDING: |
|||||||||
|
Basic |
19,059 | 16,156 | 15,295 | ||||||
|
Diluted |
19,059 | 16,158 | 15,295 | ||||||
The accompanying notes are an integral part of these consolidated financial statements.
F-4
CONTANGO OIL & GAS COMPANY AND SUBSIDIARIES
CONSOLIDATED STATEMENTS OF CASH FLOWS
(in thousands)
|
Year Ended December 31, |
|||||||||
|
2014 |
2013 |
2012 |
|||||||
|
CASH FLOWS FROM OPERATING ACTIVITIES: |
|||||||||
|
Income (loss) from continuing operations |
$ |
(21,874) |
$ |
41,362 |
$ |
(907) | |||
|
Income (loss) from discontinued operations, net of taxes |
— |
— |
(29) | ||||||
|
Net income (loss) |
(21,874) | 41,362 | (936) | ||||||
|
Adjustments to reconcile net income (loss) to net cash provided by operating activities: |
|||||||||
|
Depreciation, depletion and amortization |
156,117 | 65,529 | 44,896 | ||||||
|
Impairment of natural gas and oil properties |
47,075 | 767 | 14,078 | ||||||
|
Exploration expenses |
31,488 | (9) | 51,379 | ||||||
|
Deferred income taxes |
(12,284) | 13,159 | (8,569) | ||||||
|
Gain on sale of assets |
— |
(21,961) |
— |
||||||
|
Gain from investment in affiliates |
(10,651) | (3,554) | (92) | ||||||
|
Stock-based compensation |
4,515 | 3,180 | (154) | ||||||
|
Excess tax benefit from exercise of stock options |
— |
— |
(254) | ||||||
|
Unrealized loss (gain) on derivative instruments |
(1,131) | 1,410 |
— |
||||||
|
Changes in operating assets and liabilities: |
|||||||||
|
Decrease (increase) in accounts receivable and other |
28,942 | (6,285) | 19,894 | ||||||
|
Decrease (increase) in prepaid expenses |
(19) | 30 | (347) | ||||||
|
Decrease in accounts payable and advances from joint owners |
(8,322) | (4,720) | (10,918) | ||||||
|
Increase (decrease) in other accrued liabilities |
(4,236) | 3,569 | (877) | ||||||
|
Increase (decrease) in income taxes payable, net |
884 | 11,778 | (15,117) | ||||||
|
Other |
(544) | 782 | (2,861) | ||||||
|
Net cash provided by operating activities |
$ |
209,960 |
$ |
105,037 |
$ |
90,122 | |||
|
CASH FLOWS FROM INVESTING ACTIVITIES: |
|||||||||
|
Natural gas and oil exploration and development expenditures |
$ |
(180,422) |
$ |
(62,552) |
$ |
(78,549) | |||
|
Sale of oil and gas properties |
— |
20,000 |
— |
||||||
|
Advance under note receivable |
— |
— |
(500) | ||||||
|
Repayment of note receivable |
— |
— |
900 | ||||||
|
Investment in affiliates |
— |
(15,397) | (54,765) | ||||||
|
Distributions from affiliates |
5,365 | 23,154 | 8,969 | ||||||
|
Net cash used in investing activities |
$ |
(175,057) |
$ |
(34,795) |
$ |
(123,945) | |||
|
CASH FLOWS FROM FINANCING ACTIVITIES: |
|||||||||
|
Borrowings under credit facility |
$ |
491,257 |
$ |
180,394 |
$ |
— |
|||
|
Repayments under credit facility |
(517,898) | (90,394) |
— |
||||||
|
Payment of long-term debt |
— |
(235,373) |
— |
||||||
|
Cash dividends paid |
— |
— |
(30,510) | ||||||
|
Purchase of common stock |
(8,344) | (2,017) | (8,374) | ||||||
|
Proceeds from exercised options |
120 | 31 |
— |
||||||
|
Excess tax benefit from exercise/cancellation of stock options |
— |
— |
254 | ||||||
|
Debt issuance costs |
(38) | (2,370) |
— |
||||||
|
Net cash used in financing activities |
$ |
(34,903) |
$ |
(149,729) |
$ |
(38,630) | |||
|
NET DECREASE IN CASH AND CASH EQUIVALENTS |
$ |
— |
$ |
(79,487) |
$ |
(72,453) | |||
|
CASH AND CASH EQUIVALENTS, BEGINNING OF PERIOD |
— |
79,487 | 151,940 | ||||||
|
CASH AND CASH EQUIVALENTS, END OF PERIOD |
$ |
— |
$ |
— |
$ |
79,487 | |||
The accompanying notes are an integral part of these consolidated financial statements.
F-5
CONTANGO OIL & GAS COMPANY AND SUBSIDIARIES
CONSOLIDATED STATEMENT OF SHAREHOLDERS’ EQUITY
(in thousands, expect per share amounts)
|
Additional |
Total |
||||||||||||||||
|
Common Stock |
Paid-in |
Treasury |
Retained |
Shareholders’ |
|||||||||||||
|
Shares |
Amount |
Capital |
Stock |
Earnings |
Equity |
||||||||||||
|
Balance at December 31, 2011 |
15,357,166 |
$ |
805 |
$ |
79,279 |
$ |
(108,789) |
$ |
472,708 |
$ |
444,003 | ||||||
|
Tax benefit from exercise of stock options |
— |
— |
(254) |
— |
— |
(254) | |||||||||||
|
Treasury shares at cost |
(162,214) |
— |
— |
(8,374) |
— |
(8,374) | |||||||||||
|
Dividends |
— |
— |
— |
— |
(30,510) | (30,510) | |||||||||||
|
Net loss |
— |
— |
— |
— |
(936) | (936) | |||||||||||
|
Balance at December 31, 2012 |
15,194,952 |
$ |
805 |
$ |
79,025 |
$ |
(117,163) |
$ |
441,262 |
$ |
403,929 | ||||||
|
Acquisition of Crimson |
3,864,039 | 154 | 146,414 |
— |
— |
146,568 | |||||||||||
|
Exercise of stock options |
791 | 3 | 26 |
— |
— |
29 | |||||||||||
|
Treasury shares at cost |
(52,370) |
— |
— |
(2,017) |
— |
(2,017) | |||||||||||
|
Stock-based compensation |
356,299 |
— |
3,179 |
— |
— |
3,179 | |||||||||||
|
Net income |
— |
— |
— |
— |
41,362 | 41,362 | |||||||||||
|
Balance at December 31, 2013 |
19,363,711 |
$ |
962 |
$ |
228,644 |
$ |
(119,180) |
$ |
482,624 |
$ |
593,050 | ||||||
|
Exercise of stock options |
4,165 |
— |
120 |
— |
— |
120 | |||||||||||
|
Treasury shares at cost |
(232,013) |
— |
— |
(8,345) |
— |
(8,345) | |||||||||||
|
Restricted shares activity |
12,137 | 1 | (1) |
— |
— |
— |
|||||||||||
|
Stock-based compensation |
— |
— |
4,515 |
— |
— |
4,515 | |||||||||||
|
Net loss |
— |
— |
— |
— |
(21,874) | (21,874) | |||||||||||
|
Balance at December 31, 2014 |
19,148,000 |
$ |
963 |
$ |
233,278 |
$ |
(127,525) |
$ |
460,750 |
$ |
567,466 | ||||||
The accompanying notes are an integral part of these consolidated financial statements.
F-6
CONTANGO OIL & GAS COMPANY AND SUBSIDIARIES
NOTES TO CONSOLIDATED FINANCIAL STATEMENTS
Contango Oil & Gas Company (collectively with its subsidiaries, “Contango” or the “Company”) is a Houston, Texas based, independent oil and natural gas company. The Company’s business is to explore, develop, exploit, produce and acquire crude oil and natural gas properties in the shallow waters of the Gulf of Mexico ("GOM") and in the onshore Texas Gulf Coast and Rocky Mountain regions of the United States.
On October 1, 2013, the Company completed a merger with Crimson Exploration Inc. ("Crimson"), in an all-stock transaction pursuant to which Crimson became a wholly-owned subsidiary of Contango (the "Merger"). As a result of the Merger, the Company issued approximately 3.9 million shares of common stock in exchange for all of Crimson's outstanding capital stock. See Note 4 - "Merger with Crimson Exploration, Inc." for additional information.
The Company has historically focused operations in the GOM, but the Merger has given the Company access to lower risk, long life resource plays. In 2014, the Company’s drilling activity focused primarily on the Woodbine oil and liquids-rich play in Madison and Grimes counties, Texas (the Southeast Texas Region), on the Buda Limestone oil and liquids-rich play in Zavala and Dimmit counties, Texas (the South Texas Region), in the Cretaceous Sands in Fayette and Gonzales counties, Texas (also the South Texas Region) and the late 2014 commencement of drilling in Wyoming where the Company is targeting multiple formations. The Company believes these plays provide long-term growth potential from multiple formations that it believes to be productive for oil and natural gas.
Additionally, the Company has (i) a 37% equity investment in Exaro Energy III LLC (“Exaro”) that is primarily focused on the development of proved natural gas reserves in the Jonah Field in Wyoming; (ii) leasehold positions and minor non-operated producing properties in Louisiana and Mississippi targeting the Tuscaloosa Marine Shale (“TMS”); (iii) operated properties producing from various conventional formations in various counties along the Texas Gulf Coast; (iv) operated producing properties in the Denver Julesburg Basin (“DJ Basin”) in Weld and Adams counties in Colorado, which the Company believes may also be prospective in the Niobrara Shale oil play; (v) operated producing properties in the Haynesville Shale, Mid Bossier and James Lime formations in East Texas; and (vi) six exploratory prospects in the shallow waters of the GOM.
2. Summary of Significant Accounting Policies
Basis of Presentation
The Company’s consolidated financial statements have been prepared in accordance with accounting principles generally accepted in the United States of America and include the accounts of Contango Oil & Gas Company and its subsidiaries, after elimination of all material intercompany balances and transactions. All wholly-owned subsidiaries are consolidated. Oil and gas exploration and development affiliates which are not controlled by the Company, such as REX, are proportionately consolidated. Financial statements as of December 31, 2014 and 2013 and for the three years ended December 31, 2014 contained herein, include consolidated results of operations of both Contango Oil & Gas Company and Crimson for the period from the closing date of the Merger to December 31, 2014 and only consolidated financial statements of Contango for all other the periods presented herein.
Change of Year-End
On October 1, 2013 the Company's board of directors approved a change in fiscal year end from June 30 to December 31, commencing with the twelve-month period beginning on January 1, 2014. Unless otherwise noted, all references to "years" in this report refer to the twelve-month period which ends on December 31 of each year.
Other Investments
Contango’s 19.5% ownership of Moblize Inc. (“Moblize”) and 2.0% indirect ownership of Alta Energy Canada Partnership, LLC ("Alta") are accounted for using the cost method. Under the cost method, Contango records an investment at cost, and recognizes
F-7
CONTANGO OIL & GAS COMPANY AND SUBSIDIARIES
NOTES TO CONSOLIDATED FINANCIAL STATEMENTS - (continued)
dividends or distributions received as income. Dividends received in excess of earnings subsequent to the date of investment are considered a return of investment and are recorded as reductions of cost of the investment. During the year ended December 31, 2013, the Company had a significant distribution from Alta in excess of its original investment. The gain in excess of the original investment is included in the Other income (expense) line item in the Company's statement of operations and in the investing cash flows in the Company's statement of cash flow for the year ended December 31, 2013.
The Company has two seats on the board of directors of Exaro and has significant influence, but not control, over the company. As a result, the Company's 37% ownership in Exaro is accounted for using the equity method. Under the equity method, the Company's proportionate share of Exaro's net income increases the balance of its investment in Exaro, while a net loss or payment of dividends decreases its investment. In the consolidated statement of operations, the Company’s proportionate share of Exaro's net income or loss is reported as a single line-item in Gain from investment in affiliates (net of income taxes).
Use of Estimates
The preparation of financial statements in conformity with accounting principles generally accepted in the United States of America requires management to make estimates and assumptions that affect the reported amounts of assets and liabilities and disclosure of contingent assets and liabilities at the date of the financial statements and the reported amounts of revenues and expenses during the reporting periods. The most significant estimates include oil and gas revenues, income taxes, stock-based compensation, reserve estimates, impairment of natural gas and oil properties, valuation of derivatives, and accrued liabilities. Actual results could differ from those estimates.
Revenue Recognition
Revenues from the sale of natural gas and oil produced are recognized upon the passage of title, net of royalties. Revenues from natural gas production are recorded using the sales method. When sales volumes exceed the Company’s entitled share, production imbalance occurs. If production imbalance exceeds the Company’s share of the remaining estimated proved natural gas reserves for a given property, the Company records a liability. As of December 31, 2014, 2013 and 2012, the Company had no significant imbalances.
Cash Equivalents
Cash equivalents are considered to be highly liquid investment grade debt investments having an original maturity of 90 days or less. As of December 31, 2014, the Company had no cash and cash equivalents. Under the Company’s cash management system, checks issued but not presented to banks frequently result in book overdraft balances for accounting purposes and are classified in accounts payable in the consolidated balance sheets. At December 31, 2014, accounts payable included $12.1 million representing outstanding checks that had not been presented for payment net of cash balance in the bank as of December 31, 2014. At December 31, 2013, accounts payable included $5.9 million representing outstanding checks that had not been presented for payment net of cash balance in the bank as of December 31, 2013.
Accounts Receivable
The Company sells natural gas and crude oil to a limited number of customers. In addition, the Company participates with other parties in the operation of natural gas and crude oil wells. Substantially all of the Company’s accounts receivables are due from either purchasers of natural gas and crude oil or participants in natural gas and crude oil wells for which the Company serves as the operator. Generally, operators of natural gas and crude oil properties have the right to offset future revenues against unpaid charges related to operated wells.
The allowance for doubtful accounts is an estimate of the losses in the Company’s accounts receivable. The Company periodically reviews the accounts receivable from customers for any collectability issues. An allowance for doubtful accounts is established based on reviews of individual customer accounts, recent loss experience, current economic conditions, and other pertinent factors. Amounts deemed uncollectible are charged to the allowance.
F-8
CONTANGO OIL & GAS COMPANY AND SUBSIDIARIES
NOTES TO CONSOLIDATED FINANCIAL STATEMENTS - (continued)
Accounts receivable allowance for bad debt was $0.6 million, as of December 31, 2014 and 2013, respectively. At December 31, 2014 and 2013 the carrying value of the Company’s accounts receivable approximated fair value.
Oil and Gas Properties - Successful Efforts
The Company follows the successful efforts method of accounting for its natural gas and oil activities. Under the successful efforts method, lease acquisition costs and all development costs are capitalized. Exploratory drilling costs are capitalized until the results are determined. If proved reserves are not discovered, the exploratory drilling costs are expensed. Other exploratory costs, such as seismic costs and other geological and geophysical expenses, are expensed as incurred. Depreciation, depletion and amortization is calculated on a field by field basis using the unit of production method, with lease acquisition costs amortized over total proved reserves and other capitalized costs amortized over proved developed reserves.
Depreciation, depletion and amortization ("DD&A") of capitalized drilling and development costs of producing natural gas and crude oil properties, including related support equipment and facilities net of salvage value, are computed using the unit-of-production method on a field basis based on total estimated proved developed natural gas and crude oil reserves. Amortization of producing leaseholds is based on the unit-of-production method using total estimated proved reserves. Upon sale or retirement of properties, the cost and related accumulated depreciation, depletion, and amortization are eliminated from the accounts and the resulting gain or loss, if any, is recognized. Unit-of-production rates are revised whenever there is an indication of a need, but at least annually. Revisions are accounted for prospectively as changes in accounting estimates.
Other property and equipment are depreciated using the straight-line method over their estimated useful lives which range between three and 13 years.
Impairment of Oil and Gas Properties
When circumstances indicate that proved properties may be impaired, the Company compares expected undiscounted future cash flows on a field by field basis to the unamortized capitalized cost of the asset. If the estimated future undiscounted cash flows, based on the Company’s estimate of future reserves, natural gas and oil prices, operating costs and production levels from oil and natural gas reserves, are lower than the unamortized capitalized cost, then the capitalized cost is reduced to its fair value. For the year ended December 31, 2014, the Company recorded an impairment expense of approximately $11.4 million related to proved properties. Of this amount, $7.7 million related to South Timbalier 17 and $3.7 million related to TMS. No impairment of proved properties was recognized during the year ended December 31, 2013. For the year ended December 31, 2012, the Company recorded an impairment expense of approximately $14.1 million related to proved properties. Of this amount, approximately $12.0 million related to the Ship Shoal 263 well and $2.1 million related to the Eugene Island 24 platform and other properties. Despite the write-down of Ship Shoal 263, this well reached payout during the year ended December 31, 2012.
Unproved properties are reviewed quarterly to determine if there has been an impairment of the carrying value, and any such impairment is charged to expense in the period.
On April 29, 2014, the Company reached total depth on its Ship Shoal 255 well, and no commercial hydrocarbons were found. As a result, for the year ended December 31, 2014, the Company recognized $31.5 million in exploration expense for the cost of drilling the well and $15.6 million in impairment expense, including $3.5 million related to leasehold costs and $12.1 million related to the platform located in Ship Shoal 263 block which was expected to be used by the Ship Shoal 255 well had it been successful.
During the year ended December 31, 2014, the Company also recognized impairment expense of approximately $20.1 million related to impairment and partial impairment of certain unproved properties due to expiring leases and leases not likely to be drilled. Of this amount, approximately $9.7 million relates to undrilled offshore leases and approximately $9.7 million relates to undeveloped TMS acreage.
For the year ended December 31, 2013, the Company recorded an impairment expense on unproved properties of $0.6 million related to leasehold costs on the Ship Shoal 83 prospect which it relinquished in August 2013, and $0.2 million related to
F-9
CONTANGO OIL & GAS COMPANY AND SUBSIDIARIES
NOTES TO CONSOLIDATED FINANCIAL STATEMENTS - (continued)
leasehold costs on the Brazos Area 543 prospect. The Company did not recognize any impairment of unproved properties for the year ended December 31, 2012.
Asset Retirement Obligations
ASC 410, Asset Retirement and Environmental Obligations (ASC 410) requires that the fair value of an asset retirement cost, and corresponding liability, should be recorded as part of the cost of the related long-lived asset and subsequently allocated to expense using a systematic and rational method. The Company records asset retirement obligations to reflect the Company's legal obligations related to future plugging and abandonment of its oil and natural gas wells, platforms and associated pipelines and equipment. The Company estimates the expected cash flows associated with the obligation and discounts the amounts using a credit-adjusted, risk-free interest rate. At least annually, the Company reassesses the obligation to determine whether a change in the estimated obligation is necessary. The Company evaluates whether there are indicators that suggest the estimated cash flows underlying the obligation have materially changed. Should these indicators suggest the estimated obligation may have materially changed on an interim basis (quarterly), the Company will accordingly update its assessment. Additional retirement obligations increase the liability associated with new oil and natural gas wells, platforms, and associated pipelines and equipment as these obligations are incurred. The liability is accreted to its present value each period and the capitalized cost is depleted over the useful life of the related asset. The accretion expense is included in depreciation, depletion and amortization expense.
The estimated liability is based on historical experience in plugging and abandoning wells. The estimated remaining lives of the wells is based on reserve life estimates and federal and state regulatory requirements. The liability is discounted using an assumed credit-adjusted risk-free rate.
Revisions to the liability could occur due to changes in estimates of plugging and abandonment costs, changes in the risk-free rate or changes in the remaining lives of the wells, or if federal or state regulators enact new plugging and abandonment requirements. At the time of abandonment, the Company recognizes a gain or loss on abandonment to the extent that actual costs do not equal the estimated costs. This gain or loss on abandonment is included in impairment and abandonment of oil and gas properties expense. See Note 12 - "Asset Retirement Obligations" for additional information.
Income Taxes
The Company follows the liability method of accounting for income taxes under which deferred tax assets and liabilities are recognized for the future tax consequences of (i) temporary differences between the tax basis of assets and liabilities and their reported amounts in the financial statements and (ii) operating loss and tax credit carryforwards for tax purposes. Deferred tax assets are reduced by a valuation allowance when, based upon management’s estimates, it is more likely than not that a portion of the deferred tax assets will not be realized in a future period. The Company reviews its tax positions quarterly for tax uncertainties. The Company did not have significant uncertain tax positions as of December 31, 2014. The amount of unrecognized tax benefits did not materially change from December 31, 2013. The amount of unrecognized tax benefits may change in the next twelve months; however, the Company does not expect the change to have a significant impact on its financial position or results of operations. The Company includes interest and penalties in interest income and general and administrative expenses, respectively, in its statement of operations.
The Company files income tax returns in the United States and various state jurisdictions. The Company’s federal tax returns for 1998 – 2014, and state tax returns for 2009 – 2014, remain open for examination by the taxing authorities in the respective jurisdictions where those returns were filed.
Concentration of Credit Risk
Substantially all of the Company’s accounts receivable result from natural gas and oil sales or joint interest billings to a limited number of third parties in the natural gas and oil industry. This concentration of customers and joint interest owners may impact the Company’s overall credit risk in that these entities may be similarly affected by changes in economic and other conditions. See Note 3 - "Concentration of Credit Risk" for additional information.
F-10
CONTANGO OIL & GAS COMPANY AND SUBSIDIARIES
NOTES TO CONSOLIDATED FINANCIAL STATEMENTS - (continued)
Debt Issuance Costs
Debt issuance costs incurred are capitalized and subsequently amortized over the term of the related debt. During the year ended December 31, 2013 the Company incurred $2.2 million of debt issuance costs in relation to the new RBC credit facility entered into in conjunction with the Merger with Crimson. The debt issuance costs will be amortized over the original four year term of the credit line with amortization expense included in Depreciation, Depletion and Amortization line item in the Company's income statement for the years ended December 31, 2014 and 2013.
Stock-Based Compensation
The Company applies the fair value based method to account for stock based compensation. Under this method, compensation cost is measured at the grant date based on the fair value of the award and is recognized over the requisite service period, which generally aligns with the award vesting period. The Company classifies the benefits of tax deductions in excess of the compensation cost recognized for the options (excess tax benefit) as financing cash flows. The fair value of each award is estimated as of the date of grant using the Black-Scholes option-pricing model.
Inventory
Inventory primarily consists of casing and tubing which will be used for drilling or completion of wells. Also, included in inventory are items for the repair and maintenance of equipment used on wells and facilities that the Company operates. Inventory is recorded at the lower of cost or market using specific identification method.
Derivative Instruments and Hedging Activities
The Company accounts for its derivative activities under the provisions of ASC 815, Derivatives and Hedging (ASC 815). ASC 815 establishes accounting and reporting that every derivative instrument be recorded on the balance sheet as either an asset or liability measured at fair value. As of December 31, 2014, the Company has not entered into any derivative contracts to reduce exposure to interest rate risk. However, from time to time, the Company may hedge a portion of its forecasted oil and natural gas production. Derivative contracts entered into by the Company have consisted of transactions in which the Company hedges the variability of cash flow related to a forecasted transactions using variable to fixed swaps and collars. The Company elected to not designate any of its derivative positions for hedge accounting. Accordingly, the net change in the mark-to-market valuation of these positions as well as all payments and receipts on settled derivative contracts are recognized in "Loss on derivatives, net" on the consolidated statements of operations for the years ended December 31, 2014 and 2013. The Company did not have any derivative instruments or hedging activities for the year ending December 31, 2012. Derivative instruments with settlement date within one year are included in current assets or liabilities, whereas derivative instruments with settlement dates exceeding one year are included in non-current assets or liabilities. The Company calculates a net asset or liability for current and non-current derivative instruments for each counterparty based on the settlement dates within the respective contracts. As of December 31, 2014, there were no commodity hedges in place.
Reclassifications
Certain reclassifications have been made to the presentation of certain balance sheet, income statement and cash flow items in the respective statements for the year ended December 31, 2012 in order to conform to the presentation for the years ended December 31, 2014 and 2013. These reclassifications were not material.
Subsidiary Guarantees
Contango Oil & Gas Company, as the parent company (the “Parent Company”), filed a registration statement on Form S-3 with the SEC to register, among other securities, debt securities that the Parent Company may issue from time to time. Crimson Exploration Inc., Crimson Exploration Operating, Inc., Contango Energy Company, Contango Operators, Inc., Contango Mining Company, Conterra Company, Contaro Company, Contango Alta Investments, Inc., Contango Venture Capital Corporation and any other of the Company’s future subsidiaries specified in the prospectus supplement (each a “Subsidiary Guarantor”) are Co-Registrants with the Parent Company under the registration statement, and the registration statement also registered guarantees of debt securities
F-11
CONTANGO OIL & GAS COMPANY AND SUBSIDIARIES
NOTES TO CONSOLIDATED FINANCIAL STATEMENTS - (continued)
by the Subsidiary Guarantors. The Subsidiary Guarantors are wholly-owned by the Parent Company, either directly or indirectly, and any guarantee by the Subsidiary Guarantors will be full and unconditional. The Parent Company has no assets or operations independent of the Subsidiary Guarantors, and there are no significant restrictions upon the ability of the Subsidiary Guarantors to distribute funds to the Parent Company. The Parent Company has one other wholly-owned subsidiary that is inactive. Finally, the Parent Company’s wholly-owned subsidiaries do not have restricted assets that exceed 25% of net assets as of the most recent fiscal year end that may not be transferred to the Parent Company in the form of loans, advances or cash dividends by such subsidiary without the consent of a third party.
Recent Accounting Pronouncements
In January 2015, the Financial Accounting Standards Board (“FASB”) issued Accounting Standards Update No. 2015-01: Income Statement – Extraordinary and Unusual Items (Subtopic 225-20): Simplifying Income Statement Presentation by Eliminating the Concept of Extraordinary Items (ASU 2015-01). ASU 2015-01 is part of an initiative to reduce complexity in accounting standards. This update eliminates from generally accepted accounting principles the concept of extraordinary items, which eliminates the requirements for reporting entities to consider whether an underlying event or transaction is extraordinary. However, this will not result in a loss of information as the presentation and disclosure guidance for items that are unusual in nature or occur infrequently will be retained. ASU 2015-01 is effective for fiscal years, and interim periods within those fiscal years, beginning after December 15, 2015; early application is permitted. The provisions of this accounting update are not expected to have a material impact on the Company’s financial position or results of operations.
In November 2014, the FASB issued Accounting Standards Update No. 2014-17: Business Combinations (Topic 805): Pushdown Accounting (ASU 2014-17). ASU 2014-17 addresses the limited guidance available for determining whether and at what threshold pushdown accounting should be established in an acquired entity’s separate financial statements. Thus, the amendments in this update provide an acquired entity with an option to apply pushdown accounting upon occurrence of an event in which an acquirer obtains control of the acquired entity. Furthermore, the amendments in this update provide specific guidance on pushdown accounting for all entities, and the threshold for pushdown accounting is consistent with the threshold for change-in-control events in Topic 805, Business Combinations, and Topic 810, Consolidation. ASU 2014-17 became effective on November 18, 2014. The provisions of this accounting update are not expected to have a material impact on the Company’s financial position or results of operations.
In August 2014, the FASB issued Accounting Standards Update No. 2014-15: Presentation of Financial Statements – Going Concern (Subtopic 205-40): Disclosure of Uncertainties about an Entity’s Ability to Continue as a Going Concern (ASU 2014-15). ASU 2014-15 asserts that management should evaluate whether there are relevant condition or events that are known and reasonably knowable that raise substantial doubt about the entity’s ability to continue as a going concern within one year after the date the financial statements are issued or are available to be issued when applicable. If conditions or events at the date the financial statements are issued raise substantial doubt about an entity’s ability to continue as a going concern, disclosures are required which will enable users of the financial statements to understand the conditions or events as well as management’s evaluation and plan. ASU 2014-15 is effective for the annual period ending after December 15, 2016, and for annual and interim periods thereafter; early application is permitted. The provisions of this accounting update are not expected to have a material impact on the Company’s financial position or results of operations.
In May 2014, the FASB and the International Accounting Standards Board (“IASB”) jointly issued new accounting guidance for recognition of revenue Accounting Standards Update No. 2014-09: Revenue from Contracts with Customers (Topic 606) (ASU 2014-09). This new guidance replaces virtually all existing US GAAP and IFRS guidance on revenue recognition. ASU 2014-09 is effective for fiscal years beginning after December 15, 2016. This new guidance applies to all periods presented. Therefore, when the Company issues its financial statements on Forms 10-Q and 10-K for periods included in its year ended December 31, 2017, its comparative periods that are presented from the years ended December 31, 2015 and 2016, must be retrospectively presented in compliance with this new guidance. Early adoption is not allowed for US GAAP. The new guidance requires companies to make more estimates and use more judgment than under current accounting guidance. The Company does not anticipate that this new guidance will have a material impact on the Company’s consolidated financial position or results of operations for the periods presented.
F-12
CONTANGO OIL & GAS COMPANY AND SUBSIDIARIES
NOTES TO CONSOLIDATED FINANCIAL STATEMENTS - (continued)
In April 2014, the FASB issued Accounting Standards Update No. 2014-08: Presentation of Financial Statements (Topic 205) and Property, Plant, and Equipment (Topic 360): Reporting Discontinued Operations and Disclosures of Disposals of Components of an Entity (ASU 2014-08). ASU 2014-08 changes the criteria for reporting discontinued operations while enhancing disclosures in this area. The amended guidance requires that a disposal representing a strategic shift that has (or will have) a major effect on an entity’s financial results or a business activity classified as held for sale should be reported as discontinued operations. The amendments also expand the disclosure requirements for discontinued operations and add new disclosures for individually significant dispositions that do not qualify as discontinued operations. ASU 2014-08 is effective for annual and interim periods beginning after December 15, 2014 (early adoption is permitted only for disposals that have not been previously reported). The implementation of the amended guidance of ASU 2014-08 is not expected to have a material impact on the Company’s consolidated financial position or results of operations.
In May 2013, the Committee of Sponsoring Organizations of the Treadway Commission ("COSO"), revised its criteria related to internal controls over financial reporting from the originally established 1992 Internal Control - Integrated Framework with 2013 Internal Control - Integrated Framework. The modified framework provides enhanced guidance that ties control objectives to the related risk, enhancement of governance concepts, increased emphasis on globalization of markets and operations, increased recognition of use and reliance on information technology, increased discussion of fraud as it relates to internal control, changes of control deficiency descriptions, and that internal reporting is included in both financial and nonfinancial objectives. The revised framework is effective for interim and annual periods beginning after December 15, 2013, with early adoption being permitted. The Company implemented the changes required by the new COSO framework during the year ended December 31, 2014. The Company will continue to assess the impact, if any, it may have on its internal control structure.
In February 2013, the FASB issued Accounting Standards Update No. 2013-04 Liabilities (Topic 405): Obligations Resulting from Joint and Several Liability Arrangements for Which the Total Amount of the Obligation is Fixed at the Reporting Date (ASU 2013-04). ASU 2013-04 provides guidance for the recognition, measurement, and disclosure of obligations resulting from joint and several liability arrangements for which the total amount of the obligation within the scope of this guidance is fixed at the reporting date, except for obligations addressed within existing guidance in U.S. GAAP. Examples of obligations within the scope of this update include debt arrangements, other contractual obligations, and settled litigation and judicial rulings. U.S. GAAP does not include specific guidance on accounting for such obligations with joint and several liability, which has resulted in diversity in practice. The accounting update is effective for interim and annual periods beginning after December 15, 2013. The Company evaluated the provisions of this accounting update and does not believe it has a material impact on its financial position and results of operations.
Further, management is closely monitoring the joint standard-setting efforts of the FASB and the International Accounting Standards Board. There are a large number of pending accounting standards that are being targeted for completion in 2015 and beyond, including, but not limited to, accounting for leases, fair value measurements, accounting for financial instruments, disclosure of loss contingencies and financial statement presentation. Because these pending standards have not yet been finalized, management is not able to determine the potential future impact that these standards will have, if any, on the Company's financial position, results of operations, or cash flows.
3. Concentration of Credit Risk
The customer base for the Company is concentrated in the natural gas and oil industry. Major purchasers of the Company’s natural gas, oil and natural gas liquids for the year ended December 31, 2014 were ConocoPhillips Company (31%), Sunoco Inc. (27%), Shell Trading US Company (10%), ExxonMobil Oil Corp. (7%) and Enterprise Products Operating LLC (5%). The Company’s sales to these companies are not secured with letters of credit and in the event of non-payment, the Company could lose up to two months of revenues. The loss of two months of revenues would have a material adverse effect on the Company’s financial position. There are numerous other potential purchasers of the Company’s production.
4. Merger with Crimson Exploration Inc.
On October 1, 2013, the Company completed the Merger with Crimson. The Merger was effected pursuant to an Agreement and Plan of Merger, dated as of April 29, 2013, by and among Contango, Crimson and certain subsidiaries (the “Merger Agreement”).
F-13
CONTANGO OIL & GAS COMPANY AND SUBSIDIARIES
NOTES TO CONSOLIDATED FINANCIAL STATEMENTS - (continued)
As a result of the Merger, each share of Crimson common stock was converted into 0.08288 shares of common stock of Contango, and the Company issued approximately 3.9 million shares of common stock in exchange for all of Crimson's outstanding capital stock, resulting in Crimson stockholders owning 20.3% of the post-merger Contango.
The Merger qualified as a tax-free reorganization for U.S. federal income tax purposes, so that none of the Company, Crimson, or any of its stockholders recognized any gain or loss in the Merger, except that Crimson's stockholders may have recognized gain or loss with respect to cash received in lieu of fractional shares of Company common stock.
The Merger was accounted for as a business combination in accordance with ASC 805 which, among other things, requires assets acquired and liabilities assumed to be measured at their acquisition date fair values. Crimson's results of operations are reflected in the Company's consolidated statement of operations, beginning October 1, 2013.
The following table summarizes the consideration transferred and the fair value of assets acquired, and liabilities assumed as of the date of the Merger (in thousands, except for number of shares and share price):
|
Consideration transferred: |
||
|
Crimson common stock to be acquired by the Company |
46,624,721 | |
|
Exchange ratio of the Company common shares for each Crimson common share |
0.08288 | |
|
The Company common stock to be issued to Crimson stockholders |
3,864,101 | |
|
Closing price of the Company common stock on October 1, 2013 |
$ |
37.75 |
|
Fair value of common stock issued |
$ |
145,870 |
|
Cash paid for partial shares |
6 | |
|
Fair value of stock options issued |
698 | |
|
Total estimated consideration transferred |
$ |
146,574 |
|
Fair value of other liabilities assumed: |
||
|
Current liabilities |
$ |
60,124 |
|
Long-term debt |
235,373 | |
|
Asset retirement obligations and other non-current liabilities |
12,967 | |
|
Amount attributable to liabilities assumed |
308,464 | |
|
Total consideration including liabilities assumed |
$ |
455,038 |
|
Fair value of assets acquired: |
||
|
Current assets |
$ |
13,492 |
|
Current and non-current deferred tax asset, net |
24,905 | |
|
Natural gas and oil properties, net |
416,433 | |
|
Other non-current assets |
208 | |
|
Amount attributable to net assets acquired |
$ |
455,038 |
|
Goodwill |
$ |
— |
As of December 31, 2013, estimates of the fair value of assets acquired and liabilities assumed were preliminary and based on information available at that time. The fair value estimate of certain of Crimson's assets and liabilities, including asset retirement obligations and current and deferred tax balances, could not be finalized at December 31, 2013 due to information not being available to the Company. During the quarter ended June 30, 2014, the Company completed an analysis of Crimson’s asset retirement obligations as of the acquisition date. Based on this analysis, the Company recorded a measurement period adjustment of $2.5 million to increase the asset retirement obligations liability. As of September 30, 2014, the Company had finalized the purchase price allocation for the Merger.
F-14
CONTANGO OIL & GAS COMPANY AND SUBSIDIARIES
NOTES TO CONSOLIDATED FINANCIAL STATEMENTS - (continued)
Consideration paid by the Company consisted of approximately 3.9 million shares of Contango’s common stock issued in exchange for 46.6 million of Crimson’s shares outstanding as of September 30, 2013, including restricted stock vesting at the Transaction date and approximately 136,000 of vested Contango stock options issued to Crimson’s employees in exchange for all Crimson stock options issued and outstanding as of September 30, 2013. The number of options granted and the strike price of the options was adjusted using the same conversion ratio as for the exchange of common stock. All of Crimson’s restricted shares and stock options vested immediately prior to the merger.
The purchase price was calculated assuming fair value of the Company’s stock of $37.75 per share based upon the closing price of the Company’s common stock as of October 1, 2013.
Fair value of the Company’s options issued in exchange for Crimson’s stock options was calculated using the Black-Scholes Model by applying the following weighted-average assumptions: (a) risk-free interest rate of 0.62% to 1.35%; (b) expected life of 2.70 to 4.79 years; (c) expected volatility of 29.3% to 38.6%; and (d) expected dividend yield of 0%. The weighted average fair value per share for the options was estimated to be $5.14.
Immediately subsequent to the closing of the Merger, the Company assumed and immediately repaid Crimson’s $175.0 million term loan with Barclays Bank PLC ("Barclays") and other lenders, its $58.6 million in loans outstanding under its senior revolving credit facility with Wells Fargo and other lenders, and $1.8 million in accrued interest and prepayment premiums.
In order to finance the assumed debt, the Company entered into a $500 million four-year revolving credit facility with Royal Bank of Canada and other lenders (the “RBC Credit Facility”) with an initial hydrocarbon supported borrowing base of $275 million. The RBC Credit Facility replaced the Company's $40 million revolving credit facility with Amegy Bank. The Company incurred $2.2 million of arrangement and upfront fees in connection with the RBC Credit Facility. Borrowings under the RBC Credit Facility bear interest at a rate that is dependent upon LIBOR or the U.S. prime rate of interest, plus a margin dependent upon the amount outstanding. On October 1, 2013, the $235.4 million of assumed debt, accrued interest, and prepayment premium and $2.2 million of arrangement and upfront fees under the RBC Credit Facility were paid with the Company's existing cash of $127.6 million and drawings under the Company’s RBC Credit Facility of $110.0 million. For the period from October 1, 2013 through December 31, 2013, the effective interest rate on the facility was 2.2%.
Fair value of the deferred tax liabilities was calculated giving the tax effect of step-up adjustment for oil and gas properties. Contango received carryover tax basis in Crimson’s assets and liabilities because the merger is not a taxable transaction under the United States Internal Revenue Code. Based upon the purchase price allocation, a step-up in financial reporting carrying value related to the property to be acquired from Crimson resulted in an additional deferred tax liability of approximately $42.8 million assuming a 37% expected effective tax rate of the combined company.
Additionally, fair value of the deferred tax assets was increased by approximately $10.2 million due to elimination of a valuation allowance included in the historical financial statements of Crimson. This adjustment is based on the expectation that it is more likely than not that the majority of $110 million of Crimson’s accumulated Net Operating Losses ("NOLs") will be realized by the combined company in the foreseeable future. The fair value of Crimson’s oil and gas properties acquired was determined by using commodity prices based on future expected prices for oil, natural gas and NGLs, after adjustment for transportation fees and regional price differentials.
There is no goodwill attributable to the Merger as the consideration transferred did not exceed the fair value of Crimson's net assets acquired on October 1, 2013.
F-15
CONTANGO OIL & GAS COMPANY AND SUBSIDIARIES
NOTES TO CONSOLIDATED FINANCIAL STATEMENTS - (continued)
Crimson contributed revenues of $143.4 million and pre-tax income of $4.9 million to the Company for the year ended December 31, 2014. Crimson contributed revenues of $33.4 million and a loss of $0.7 million to the Company for the period from October 1, 2013 to December 31, 2013. The following unaudited pro forma summary presents consolidated information of the Company as if the Merger had occurred on January 1, 2012 (in thousands):
|
Year Ended December 31 |
||||||
|
2013 |
2012 |
|||||
|
(Unaudited) |
||||||
|
Revenue |
$ |
256,594 |
$ |
261,772 | ||
|
Net income (loss) |
$ |
40,166 |
$ |
(83,912) | ||
The unaudited pro forma amounts have been calculated after applying the Company's accounting policies and adjusting the results of Crimson to reflect the additional depletion that would have been charged assuming the fair value adjustment to oil and gas properties had been applied from January 1, 2012, together with the consequential tax effects. The pro forma depletion for each period presented was calculated based on the value of the oil and gas properties acquired giving effect to the fair value adjustments as a result of acquisition accounting and estimated DD&A rate for each period. This depletion rate was calculated by dividing production for the period by the beginning of the period proved reserves (calculated by adding back production to the ending proved reserves as of December 31, 2013). The combined historical depreciation, depletion and amortization expenses for the year ended December 31, 2013 and 2012 were increased by $1.9 million and $7.5 million, respectively, including $0.6 million and $0.4 million related to amortization of debt issuance costs for a new credit facility.
The pro forma interest expense for each period presented was adjusted to reflect the results of the repayment of the $175 million principal balance of the Second Lien Loan using cash available at the Merger date and total borrowings of $110.0 million under the new RBC Credit Facility, as if such repayment had occurred on January 1, 2012, which reduced total combined interest expenses for the years ended December 31, 2013 and 2012 by $16.0 million and $21.3 million, respectively. The expense related to the amortization of the original issue discount on the Second Lien Loan was also eliminated for each period. The reduction in interest expense is offset by amortization of the debt issuance costs related to the debt refinancing which took take place at the Merger date, net of amortization related to the debt issuance costs for the historical Crimson First and Second Lien agreement that was refinanced upon closing of the Merger.
The pro forma net income was not adjusted for combined historical impairment charges of $2.9 million and $132.0 million for the years ended December 31, 2013 and 2012, respectively.
Historical financial statements of Contango for the year ended December 31, 2013 include approximately $6.8 million of Merger related costs, including bankers success fees of $2.8 million and an accrued expense of $1.3 million related to bonus payable to Mr. Joseph J. Romano as a result of successfully completing the Merger. These expenses are included in general and administrative expense in the Company's consolidated statements of income for the respective periods.
Pro forma net income for the year ended December 31, 2013 does not include $5.7 million of stock based compensation expenses related to vesting of Crimson stock options on October 1, 2013 as a result of the Merger, amortization of debt issuance cost of $0.8 million, amortization of the remaining balance of debt discount of $3.7 million for Crimson debt as of the date of the Merger, and other Merger related costs, including $2.8 million bankers success fees, which were recognized in Crimson's results of operations for the period October 1, 2013, which is not included in consolidated financial statements of the Company. Pro forma net income also does not include benefit related to release of valuation allowance of $10.2 million in relation with the Merger. Although such expenses relate to the Merger, they do not represent recurring expenses and, therefore, are not included in the pro forma results of operations.
F-16
CONTANGO OIL & GAS COMPANY AND SUBSIDIARIES
NOTES TO CONSOLIDATED FINANCIAL STATEMENTS - (continued)
5. Acquisitions, Dispositions and Gains from Affiliates
Acquisition of Additional Interest in Dutch
In December 2013, the Company exercised a preferential right and purchased an additional 7.84% working interest and 6.53% net revenue interest in the five Contango-operated Dutch wells from an independent oil and gas company for $18.8 million, subject to a purchase price adjustment, based on production and operating expenses between the effective date of July 1, 2013 and the closing date of December 12, 2013. During 2014, a purchase price adjustment of approximately $4.1 million reduced the purchase price to a total of $14.7 million, net to the Company.
Southeast Texas Disposition
On December 31, 2013, the Company sold to an independent oil and gas company approximately 7.1% of its interest in all developed and undeveloped properties in Madison and Grimes Counties for $20 million, subject to a purchase price adjustment, based on production and operating expenses between the effective date of July 1, 2013 and the closing date of December 31, 2013. A preliminary estimated adjustment to the sales price of approximately $0.4 million to increase the purchase price was recorded in 2013, and an adjustment of approximately $0.1 million to reduce the purchase price was recorded in 2014 resulting in final proceeds of $20.3 million. A loss of approximately $0.2 million and a gain of approximately $6.6 million related to this sale were recognized in the years ended December 31, 2014 and 2013, respectively.
Proceeds from Alta
In August 2013, Alta sold its interest in the liquids-rich Kaybob Duvernay, which closed in October 2013 for approximately $30.5 million, net to Contango. Contango has a 2% interest in Alta and a 5% interest in the Kaybob Duvernay project. The total distribution received from Alta during the year ended December 31, 2013 was approximately $23.1 million. An additional $5.4 million was received during 2014. The Company expects to receive the remaining $2.0 million within the next twelve months. The total distributions from Alta are expected to exceed the Company’s original investment by $15.3 million.
6. Fair Value Measurements
Pursuant to ASC 820, Fair Value Measurements and Disclosures (ASC 820), the Company's determination of fair value incorporates not only the credit standing of the counterparties involved in transactions with the Company resulting in receivables on the Company's consolidated balance sheets, but also the impact of the Company's nonperformance risk on its own liabilities. ASC 820 defines fair value as the price that would be received to sell an asset or paid to transfer a liability in an orderly transaction between market participants at the measurement date (exit price). ASC 820 establishes a fair value hierarchy that prioritizes the inputs to valuation techniques used to measure fair value. The hierarchy assigns the highest priority to unadjusted quoted prices in active markets for identical assets or liabilities (Level 1) and the lowest priority to unobservable inputs (Level 3). Level 2 measurements are inputs that are observable for assets or liabilities, either directly or indirectly, other than quoted prices included within Level 1. The Company utilizes market data or assumptions that market participants would use in pricing the asset or liability, including assumptions about risk and the risks inherent in the inputs to the valuation technique. These inputs can be readily observable, market corroborated, or generally unobservable. The Company classifies fair value balances based on the observability of those inputs.
The following table sets forth by level within the fair value hierarchy the Company's financial assets and liabilities that were accounted for at fair value as of December 31, 2013. As required by ASC 820, a financial instrument's level within the fair value hierarchy is based on the lowest level of input that is significant to the fair value measurement. The Company's assessment of the significance of a particular input to the fair value measurement requires judgment, and may affect the valuation of fair value assets and liabilities and their placement within the fair value hierarchy levels. There have been no transfers between Level 1, Level 2 or Level 3.
F-17
CONTANGO OIL & GAS COMPANY AND SUBSIDIARIES
NOTES TO CONSOLIDATED FINANCIAL STATEMENTS - (continued)
Fair value information for financial assets and (liabilities) was as follows at December 31, 2013 (in thousands):
|
Total |
Fair Value Measurements Using |
|||||||||||
|
Carrying Value |
Level 1 |
Level 2 |
Level 3 |
|||||||||
|
Derivatives |
||||||||||||
|
Commodity price contracts - assets |
$ |
76 |
$ |
— |
$ |
76 |
$ |
— |
||||
|
Commodity price contracts - liabilities |
$ |
(1,207) |
$ |
— |
$ |
(1,207) |
$ |
— |
||||
The Company did not have any outstanding commodity price contracts as of December 31, 2014.
Derivatives listed above include swaps and collars that are carried at fair value. The Company records the net change in the fair value of these positions in "Gain (loss) on derivatives, net" in the Company's consolidated statements of operations. The Company is able to value the assets and liabilities based on observable market data for similar instruments, which resulted in the Company reporting its derivatives as Level 2. This observable data includes the forward curves for commodity prices based on quoted markets prices and implied volatility factors related to changes in the forward curves. See Note 7 - "Derivative Instruments" for additional discussion of derivatives.
As of December 31, 2013, the Company's derivative contracts were with major financial institutions with investment grade credit ratings which are believed to have a minimal credit risk. As such, the Company is exposed to credit risk to the extent of nonperformance by the counterparties in the derivative contracts discussed above; however, the Company does not anticipate such nonperformance. Some of the counterparties to the Company's current derivative contracts are lenders in the Company's RBC Credit Facility. The Company did not post collateral under any of these contracts as they are secured under the RBC Credit Facility.
Estimates of the fair value of financial instruments are made in accordance with the requirements of ASC 825, Financial Instruments. The estimated fair value amounts have been determined at discrete points in time based on relevant market information. These estimates involve uncertainties and cannot be determined with precision. The estimated fair value of cash, accounts receivable and accounts payable approximates their carrying value due to their short-term nature. The estimated fair value of the Company's RBC Credit Facility approximates carrying value because the interest rate approximates current market rates and are re-set at least every three months. See Note 13 - "Long-Term Debt" for further information.
Fair value estimates used for non-financial assets are evaluated at fair value on a non-recurring basis include oil and gas properties evaluated for impairment when facts and circumstances indicate that there may be an impairment. If the unamortized cost of properties exceeds the undiscounted cash flows related to the properties, the value of the properties is compared to the fair value estimated as discounted cash flows related to the risk-adjusted proved, probable and possible reserves related to the properties. Fair value measurements based on these inputs are classified as Level 3.
Impairments
Contango tests proved oil and gas properties for impairment when events and circumstances indicate a decline in the recoverability of the carrying value of such properties, such as a downward revision of the reserve estimates or lower commodity prices. The Company estimates the undiscounted future cash flows expected in connection with the oil and gas properties on a field by field basis and compares such future cash flows to the unamortized capitalized costs of the properties. If the estimated future undiscounted cash flows are lower than the unamortized capitalized cost, the capitalized cost is reduced to its fair value. The factors used to determine fair value include, but are not limited to, estimates of proved and probable reserves, future commodity prices, the timing of future production and capital expenditures and a discount rate commensurate with the risk reflective of the lives remaining for the respective oil and gas properties. Additionally, the Company may use appropriate market data to determine fair value. Because these significant fair value inputs are typically not observable, impairments of long-lived assets are classified as a Level 3 fair value measure.
F-18
CONTANGO OIL & GAS COMPANY AND SUBSIDIARIES
NOTES TO CONSOLIDATED FINANCIAL STATEMENTS - (continued)
Asset Retirement Obligations
The initial measurement of ARO at fair value is calculated using discounted cash flow techniques and based on internal estimates of future retirement costs associated with oil and gas properties. The factors used to determine fair value include, but are not limited to, estimated future plugging and abandonment costs and expected lives of the related reserves.
7. Derivative Instruments
The Company is exposed to certain risks relating to its ongoing business operations, such as commodity price risk. Derivative contracts are utilized to hedge the Company's exposure to price fluctuations and reduce the variability in the Company's cash flows associated with anticipated sales of future oil and natural gas production. Recently, the Company had hedged a substantial, but varying, portion of anticipated oil and natural gas production for future periods. The Company believes that these derivative arrangements, although not free of risk, allowed us to achieve a more predictable cash flow and to reduce exposure to commodity price fluctuations. However, derivative arrangements limit the benefit of increases in the prices of crude oil, natural gas and natural gas liquids sales. Moreover, the Company’s derivative arrangements applied only to a portion of its production and provided only partial protection against declines in commodity prices. Such arrangements may expose us to risk of financial loss in certain circumstances. The Company continuously reevaluates its hedging programs in light of changes in production, market conditions, and commodity price forecasts.
As of December 31, 2014, the Company did not have any outstanding derivative positions. Swaps are designed so that the Company receives or makes payments based on a differential between fixed and variable prices for crude oil and natural gas. A costless collar consists of a sold call, which establishes a maximum price the Company will receive for the volumes under contract and a purchased put that establishes a minimum price. A sold put option limits the exposure of the counterparty's risk should the price fall below the strike price. Sold put options limit the effectiveness of purchased put options at the low end of the put/call collars to market prices in excess of the strike price of the put option sold.
It is the Company's policy to enter into derivative contracts only with counterparties that are creditworthy financial institutions deemed by management as competent and competitive market makers. The counterparties to the Company's previous derivative contracts were lenders or affiliates of lenders in the RBC Credit Facility. The Company did not post collateral under any of these contracts as they are secured under the RBC Credit Facility.
The Company has elected not to designate any of its derivative contracts for hedge accounting. Accordingly, derivatives are carried at fair value on the consolidated balance sheets as assets or liabilities, with the changes in the fair value included in the consolidated statements of operations for the period in which the change occurs. The Company records the net change in the mark-to-market valuation of these derivative contracts, as well as all payments and receipts on settled derivative contracts, in "Gain (loss) on derivatives, net" on the consolidated statements of operations. See Note 6 – “Fair Value Measurements” for additional information.
There was no activity or outstanding derivative contracts during the year ended December 31, 2012.
The following summarizes the fair value of commodity derivatives outstanding on a gross and net basis as of December 31, 2013 (in thousands):
|
Gross |
Netting (1) |
Total |
|||||||
|
Assets |
$ |
76 |
$ |
(76) |
$ |
— |
|||
|
Liabilities |
$ |
(1,207) |
$ |
76 |
$ |
(1,131) | |||
|
(1) |
Represents counterparty netting under agreements governing such derivatives |
F-19
CONTANGO OIL & GAS COMPANY AND SUBSIDIARIES
NOTES TO CONSOLIDATED FINANCIAL STATEMENTS - (continued)
The following table summarizes the effect of derivative contracts on the Consolidated Statements of Operations for the years ended December 31, 2014 and 2013 (in thousands):
|
Year ended December 31, |
|||||||
|
Contract Type |
2014 |
2013 |
|||||
|
Crude oil contracts |
$ |
276 |
$ |
180 | |||
|
Natural gas contracts |
(1,560) | 98 | |||||
|
Realized gain (loss) |
$ |
(1,284) |
$ |
278 | |||
|
Crude oil contracts |
$ |
1,183 |
$ |
(1,179) | |||
|
Natural gas contracts |
(52) | (231) | |||||
|
Unrealized gain (loss) |
$ |
1,131 |
$ |
(1,410) | |||
|
Gain (loss) on derivatives, net |
$ |
(153) |
$ |
(1,132) | |||
There were no gains or losses related to derivative instruments for the year ended December 31, 2012.
8. Stock Based Compensation
As of December 31, 2014, the Company had in place a share-based compensation program which allows for stock options and/or restricted stock to be awarded to officers, directors and employees as a performance-based award or granted upon initial employment as part of their overall compensation package. This program includes (i) the Company's Amended and Restated 2009 Incentive Compensation Plan (the “2009 Plan”); and (ii) the Crimson 2005 Stock Incentive Plan (the “2005 Plan” or "Crimson Plan") adopted in conjunction with the Merger.
Amended and Restated 2009 Incentive Compensation Plan
On September 15, 2009, the Company’s Board of Directors (the “Board”) adopted the Contango Oil & Gas Company Equity Compensation Plan (the “Original 2009 Plan”). On April 10, 2014, the Board amended and restated the Original 2009 Plan thorugh the adoption of the Contango Oil & Gas Company Amended and Restated 2009 Incentive Compensation Plan. The 2009 Plan provides for both cash awards and equity awards (such as restricted stock and options) to officers, directors, employees or consultants of the Company. Awards made under the 2009 Plan are subject to such restrictions, terms and conditions, including forfeitures, if any, as may be determined by the Board.
Under the terms of the 2009 Plan, up to 1,500,000 shares of the Company’s common stock may be issued for plan awards. Stock options under the 2009 Plan must have an exercise price of each option equal to or greater than the market price of the Company’s common stock on the date of grant. The Company may grant officers and employees both incentive stock options intended to qualify under Section 422 of the Internal Revenue Code of 1986, as amended, and stock options that are not qualified as incentive stock options. Stock option grants to non-employees, such as directors and consultants, can only be stock options that are not qualified as incentive stock options. Options granted generally expire after five or ten years. The vesting schedule varies, and can vest over a two, three or four-year period.
As of December 31, 2014, the Company had approximately 1.1 million shares of common stock and stock options available for future grant under the 2009 Plan. On February 24, 2014, the Company granted 1,103 restricted stock awards under the 2009 Plan.
Effective January 1, 2014, the Company implemented performance-based long-term bonus plans under the 2009 Plan for the benefit of all employees through a Cash Incentive Bonus Plan (“CIBP”) and a Long-Term Incentive Plan (“LTIP”). The specific targeted performance measures under these sub-plans are approved by the Compensation Committee and/or the Board. Upon achieving the performance levels established each year, bonus awards under the CIBP and LTIP will be calculated as a percentage of base salary of each employee for the plan year. The CIBP and LTIP plan awards for each year are expected to be disbursed in the first quarter of the following year. Employees must be employed by the Company at the time that awards are disbursed to be eligible.
F-20
CONTANGO OIL & GAS COMPANY AND SUBSIDIARIES
NOTES TO CONSOLIDATED FINANCIAL STATEMENTS - (continued)
The CIBP awards will be paid in cash while LTIP awards will consist of restricted common stock and/or stock options. The stock and/or option awards are expected to vest 25% per year, over the first through fourth anniversaries from the date of grant. The number of shares of restricted common stock and the number of shares underlying the stock options granted will be determined based upon the fair market value of the common stock on the date of the grant.
2005 Stock Incentive Plan
The 2005 Plan was adopted by the Company's Board in conjunction with the Merger with Crimson. Under the 2005 Plan, the Board may grant incentive stock options, nonstatutory stock options, restricted awards, unrestricted awards, performance awards, stock appreciation rights and dividend equivalent rights to eligible officers, directors, employees or consultants of the Company and its affiliates. Awards made under the 2005 Plan are subject to such terms and conditions, without limitation, as may be determined by the Board. Options granted generally expire after ten years. The vesting schedule varies but generally vests over a one or four-year period. Upon adoption of the 2005 Plan at the Merger closing date, a total of 135,898 stock option awards and 136,428 shares of restricted stock (as converted, which all fully vested upon the Merger) were already issued and outstanding, leaving a balance of 43,472 shares of common stock or stock options available to be granted to Company employees and directors.
As of December 31, 2014, there were 7,030 shares of common stock and stock options available to be granted under the 2005 Plan. On February 24, 2015, the Company granted 7,030 restricted stock awards under the 2005 Plan to a new employee. This plan expired on February 25, 2015.
1999 Stock Incentive Plan
The Company’s 1999 Stock Incentive Plan (the “1999 Plan”) expired in August 2009. The final 45,000 outstanding options issued under the 1999 Plan were exercised and sold to the Company in February 2012.
Stock Options
During the year ended December 31, 2014, the Company did not issue any stock options. However, 4,165 stock options that were previously issued were exercised and the resulting shares of common stock were sold in the open market, leaving 129,934 stock options vested and exercisable at December 31, 2014, with exercise prices ranging from $25.70 to $60.33 per share, with an average remaining contractual life of six years.
During the year ended December 31, 2013, employees exercised 791 stock options to purchase shares of the Company’s common stock that were sold in the open market.
F-21
CONTANGO OIL & GAS COMPANY AND SUBSIDIARIES
NOTES TO CONSOLIDATED FINANCIAL STATEMENTS - (continued)
A summary of the stock options granted under the 1999 Plan, 2009 Plan, and 2005 Plan as of and for the years ended December 31, 2014, 2013, and 2012 is presented in the table below (dollars in thousands, except per share data):
|
Year Ended December 31, |
|||||||||||||||||
|
2014 |
2013 |
2012 |
|||||||||||||||
|
Weighted |
Weighted |
Weighted |
|||||||||||||||
|
Shares |
Average |
Shares |
Average |
Shares |
Average |
||||||||||||
|
Under |
Exercise |
Under |
Exercise |
Under |
Exercise |
||||||||||||
|
Options |
Price |
Options |
Price |
Options |
Price |
||||||||||||
|
Outstanding, beginning of the period |
135,107 |
$ |
53.00 |
— |
$ |
— |
45,000 |
$ |
54.21 | ||||||||
|
Options assumed due to Merger |
— |
$ |
— |
135,898 |
$ |
52.90 |
— |
$ |
— |
||||||||
|
Exercised |
(4,165) |
$ |
28.93 | (791) |
$ |
36.16 |
— |
$ |
— |
||||||||
|
Canceled / Forfeited (1) |
(1,008) |
$ |
42.39 |
— |
$ |
— |
(45,000) |
$ |
54.21 | ||||||||
|
Outstanding, end of year |
129,934 |
$ |
53.85 | 135,107 |
$ |
53.00 |
— |
$ |
— |
||||||||
|
Aggregate intrinsic value |
$ |
4 |
$ |
459 |
$ |
— |
|||||||||||
|
Exercisable, end of year |
129,934 |
$ |
53.85 | 135,107 |
$ |
53.00 |
— |
$ |
— |
||||||||
|
Aggregate intrinsic value |
$ |
4 |
$ |
459 |
$ |
— |
|||||||||||
|
Available for grant, end of the period |
1,143,006 | 1,162,173 | 1,475,000 | ||||||||||||||
|
Weighted average fair value of options granted during the period |
$ |
— |
$ |
— |
$ |
— |
|||||||||||
|
(1) |
For the year ended December 31, 2012, forfeited options consist of options that were net-settled for cash with the Company. |
Under the fair value method of accounting for stock options, cash flows from the exercise of stock options resulting from tax benefits in excess of recognized cumulative compensation cost (excess tax benefits) are classified as financing cash flows. For the year ended December 31, 2014, there was an insignificant excess tax benefit recognized. For the year ended December 31, 2013, there was no excess tax benefits recognized. For the year ended December 31, 2012, approximately $0.3 million of such excess tax benefits were classified as financing cash flows, respectively. See Note 2 – "Summary of Significant Accounting Policies".
Compensation expense related to employee stock option grants are recognized over the stock option’s vesting period based on the fair value at the date the options are granted. The fair value of each option is estimated as of the date of grant using the Black-Scholes options-pricing model.
During the years ended December 31, 2014 and 2013, the Company did not recognize any stock option expense. During the year ended December 31, 2012, the Company recognized a stock option gain of approximately $154,000 due to evaluating the market price of options on a quarterly basis. The aggregate intrinsic value of stock options exercised/forfeited during the years ended December 31, 2014, 2013 and 2012 was approximately $59,009, $7,721 and $0.5 million, respectively.
Restricted Stock
During the year ended December 31, 2014, the Company issued 10,714 restricted stock awards to new and existing employees, which vest over four years, plus an additional 15,672 restricted stock awards to the board of directors which vest on the one-year anniversary of the date of grant. The weighted average fair value of the restricted shares granted during the year, was $40.83 with a total fair value of approximately $1.1 million after adjustment for estimated weighted average forfeiture rate of 2.2%.
In November 2013, the Company issued 254,677 shares of restricted common stock to senior officers and certain other vice presidents, of which 25 percent vested immediately and the remaining balance vests over a three-year period. Also in November 2013, the Company issued 1,802 shares of restricted common stock to newly hired employees as part of their compensation package, which vest over a four-year period. In December 2013, the Company issued 88,466 shares of restricted common stock to Company employees which vest over a four-year period, plus an additional 11,354 shares of restricted common stock to the board of directors as
F-22
CONTANGO OIL & GAS COMPANY AND SUBSIDIARIES
NOTES TO CONSOLIDATED FINANCIAL STATEMENTS - (continued)
compensation pursuant to the Company’s new director compensation plan which vest on the one-year anniversary of the date of grant. The weighted average fair value of the restricted shares granted during the fourth quarter of 2013, was $44.10 with a total fair value of approximately $8.1 million after adjustment for estimated weighted average forfeiture rate of 5.7%.
The Company did not grant any shares of restricted stock for the year ended December 31, 2012 and did not have any restricted shares outstanding as of December 31, 2012.
Restricted stock activity as of December 31, 2014 and 2013 and for the years then ended is presented in the table below (dollars in thousands, except per share data):
|
2014 |
2013 |
||||||||||||||||
|
Weighted |
Weighted |
||||||||||||||||
|
Restricted |
Average |
Aggregate |
Restricted |
Average |
Aggregate |
||||||||||||
|
Shares |
Fair Value |
Intrinsic Value |
Shares |
Fair Value |
Intrinsic Value |
||||||||||||
|
Outstanding, beginning of the period |
292,632 |
$ |
44.38 |
$ |
13,830 |
— |
$ |
— |
$ |
— |
|||||||
|
Granted |
26,386 | 40.83 | 1,073 | 356,299 | 44.10 | 15,723 | |||||||||||
|
Vested |
(94,807) | 44.11 | 3,454 | (63,667) | 42.80 | 2,725 | |||||||||||
|
Canceled / Forfeited |
(14,249) | 47.30 | 579 |
— |
— |
— |
|||||||||||
|
Not vested, end of the period |
209,962 | 43.86 | 6,139 | 292,632 | 44.38 | 13,830 | |||||||||||
|
Vested, end of the period |
— |
— |
— |
— |
— |
— |
|||||||||||
|
Expected to vest, end of the period |
192,570 | 43.84 | 5,631 | 260,359 | 44.36 | 12,305 | |||||||||||
During the year ended December 31, 2014, the Company recognized approximately $4.5 million in stock compensation expense. During the quarter ended December 31, 2013, the Company recognized approximately $3.2 million in stock compensation expense for restricted shares granted to its officers, employees and directors. An additional $7.7 million of compensation expense will be recognized over the remaining vesting period.
9. Share Repurchase Program
In September 2011, the Company’s board of directors approved a $50 million share repurchase program. All shares are to be purchased in the open market or through privately negotiated transactions. Purchases are made subject to market conditions and certain volume, pricing and timing restrictions to minimize the impact of the purchases upon the market, and when the Company believes its stock price to be undervalued. Repurchased shares of common stock became authorized but unissued shares, and may be issued in the future for general corporate and other purposes. During the year ended December 31, 2014, the Company purchased 205,457 shares at an average price of $35.89 per share, for a total of approximately $7.4 million. No shares were purchased during the year ended December 31, 2013. During the year ended December 31, 2012, the Company purchased 162,214 shares at an average price of $51.62 per share, for a total of approximately $8.4 million, plus it net-settled 45,000 stock options from two employees for a total of $465,000.
As of December 31, 2014, the Company had invested $18.2 million in this share repurchase program to purchase 403,334 shares and net-settled 45,000 stock options from two officers, leaving $31.8 million available for future purchases.
In October 2014, the Company amended its revolving credit facility with Royal Bank of Canada to, among other things, allow for share repurchases subject to certain conditions. The Company is currently in compliance with these additional restrictions.
F-23
CONTANGO OIL & GAS COMPANY AND SUBSIDIARIES
NOTES TO CONSOLIDATED FINANCIAL STATEMENTS - (continued)
10. Other Financial Information
The following table provides additional detail for accounts receivable, prepaids, and accounts payable and accrued liabilities which are presented on the consolidated balance sheets (in thousands):
|
December 31, |
December 31, |
|||||
|
2014 |
2013 |
|||||
|
Accounts receivable: |
||||||
|
Trade receivable |
$ |
13,926 |
$ |
42,196 | ||
|
Receivable for Alta Resources distribution |
1,993 | 7,358 | ||||
|
Joint interest billing |
4,096 | 5,172 | ||||
|
Income taxes receivable |
3,274 | 4,293 | ||||
|
Other receivables |
2,610 | 2,172 | ||||
|
Allowance for doubtful accounts |
(590) | (578) | ||||
|
Total accounts receivable |
$ |
25,309 |
$ |
60,613 | ||
|
Prepaid expenses and other: |
||||||
|
Prepaid insurance |
$ |
1,242 |
$ |
1,113 | ||
|
Other |
699 | 918 | ||||
|
Total prepaid expenses and other |
$ |
1,941 |
$ |
2,031 | ||
|
Accounts payable and accrued liabilities: |
||||||
|
Royalties and revenue payable |
$ |
31,653 |
$ |
44,933 | ||
|
Accrued exploration and development |
26,538 | 17,803 | ||||
|
Trade payable |
17,282 | 11,589 | ||||
|
Advances from partners |
8,334 | 6,538 | ||||
|
Accrued general and administrative expenses |
6,258 | 10,872 | ||||
|
Other accounts payable and accrued liabilities |
2,827 | 5,098 | ||||
|
Total accounts payable and accrued liabilities |
$ |
92,892 |
$ |
96,833 | ||
Included in the table below is supplemental information about non-cash transactions during the years ended December 31, 2014, 2013 and 2012, in thousands:
|
Year Ended December 31, |
|||||||||
|
2014 |
2013 |
2012 |
|||||||
|
Cash payments: |
|||||||||
|
Interest payments |
$ |
2,786 |
$ |
1,056 |
$ |
71 | |||
|
Income tax payments, net of cash refunds |
241 | 341 | 24,307 | ||||||
|
Non-cash items excluded from investing activities in the consolidated statements of cash flows: |
|||||||||
|
Increase in accrued capital expenditures |
8,735 | 7,004 | 1,192 | ||||||
|
Assets acquired & liabilities assumed in the Merger: |
|||||||||
|
Accounts receivable |
— |
12,955 |
— |
||||||
|
Prepaids |
— |
639 |
— |
||||||
|
Proved natural gas and oil properties |
2,517 | 413,916 |
— |
||||||
|
Deferred tax asset and other |
— |
24,940 |
— |
||||||
|
Accounts payable and accrued liabilities |
— |
(60,110) |
— |
||||||
|
Other non-current liabilities |
— |
(256) |
— |
||||||
|
Long-term debt |
— |
(235,373) |
— |
||||||
|
Asset retirement obligations |
(2,517) | (11,183) |
— |
||||||
|
Non-cash items excluded from financing activities in the consolidated statements of cash flows: |
|||||||||
|
Issuance of common stock in connection with the merger |
— |
145,870 |
— |
||||||
F-24
CONTANGO OIL & GAS COMPANY AND SUBSIDIARIES
NOTES TO CONSOLIDATED FINANCIAL STATEMENTS - (continued)
11. Investment in Exaro Energy III LLC
In April 2012, the Company entered into a Limited Liability Company Agreement (the “LLC Agreement”) in connection with the formation of Exaro. Pursuant to the LLC Agreement, as amended, the Company has committed to invest up to $67.5 million in Exaro for an ownership interest of approximately 37%. The aggregate commitment of all the Exaro investors was approximately $183 million. The Company did not make any contributions during the year ended December 31, 2014. As of December 31, 2014, the Company had invested approximately $46.9 million.
The following table presents condensed balance sheet data for Exaro as of December 31, 2014 and December 31, 2013. The balance sheet data was derived from the Exaro balance sheet as of December 31, 2014 and December 31, 2013 and was not adjusted to represent Contango’s percentage of ownership interest in Exaro. Contango’s share in the equity of Exaro at December 31, 2014 was approximately $61.2 million.
|
December 31, |
December 31, |
|||||
|
2014 |
2013 |
|||||
|
Current assets |
$ |
35,013 |
$ |
30,284 | ||
|
Non-current assets: |
||||||
|
Net property and equipment |
233,997 | 182,226 | ||||
|
Restricted cash escrow account |
577 | 8,732 | ||||
|
Other non-current assets |
1,779 | 1,103 | ||||
|
Total non-current assets |
236,353 | 192,061 | ||||
|
Total assets |
$ |
271,366 |
$ |
222,345 | ||
|
Current liabilities |
$ |
9,405 |
$ |
13,717 | ||
|
Non-current liabilities: |
||||||
|
Long-term debt |
94,500 | 70,000 | ||||
|
Other non-current liabilities |
1,084 | 923 | ||||
|
Total non-current liabilities |
95,584 | 70,923 | ||||
|
Members' equity |
166,377 | 137,705 | ||||
|
Total liabilities & members' equity |
$ |
271,366 |
$ |
222,345 | ||
The following table presents the condensed results of operations for Exaro for the years ended December 31, 2014 and 2013 and for the period from the inception of Exaro, March 19, 2012, to December 31, 2012. The results of operations for the years ended December 31, 2014 and 2013 and the period from inception of Exaro, March 19, 2012, to December 31, 2012 were derived from Exaro's financial statements for the respective periods. The income statement data below was not adjusted to represent Contango’s ownership interest but rather reflects the results of Exaro as a Company. The Company's share in Exaro's results of operations recognized for the years ended December 31, 2014, 2013 and 2012 was a gain of $6.9 million, net of tax expense of $3.8 million; a gain of $2.3 million, net of tax expense of $1.2 million; and a gain of $60 thousand, net of tax expense of $32 thousand, respectively.
|
Year Ended December 31, |
Period from inception to December 31, |
||||||||
|
2014 |
2013 |
2012 |
|||||||
|
Oil and natural gas sales |
$ |
79,536 |
$ |
52,698 |
$ |
7,514 | |||
|
Other gain (loss) |
5,069 | (544) | (3,269) | ||||||
|
Less: |
|||||||||
|
Lease operating expenses |
22,452 | 16,136 | 2,035 | ||||||
|
Depreciation, depletion, amortization & accretion |
26,036 | 16,058 | 2,350 | ||||||
|
General & administrative expense |
3,484 | 3,294 | 2,872 | ||||||
|
Income (loss) from continuing operations |
32,633 | 16,666 | (3,012) | ||||||
|
Net interest income (expense) |
(3,861) | (3,536) | 25 | ||||||
|
Net income (loss) |
$ |
28,772 |
$ |
13,130 |
$ |
(2,987) | |||
F-25
CONTANGO OIL & GAS COMPANY AND SUBSIDIARIES
NOTES TO CONSOLIDATED FINANCIAL STATEMENTS - (continued)
Included in Other losses are realized and unrealized losses attributable to derivatives, whose value is likely to change based on future oil and gas prices. Exaro's results of operations do not include income taxes, because Exaro is treated as a partnership for tax purposes.
12. Asset Retirement Obligation
The Company accounts for its retirement obligation of long lived assets by recording the net present value of a liability for an asset retirement obligation (“ARO”) in the period in which it is incurred. When the liability is initially recorded, a company increases the carrying amount of the related long-lived asset. Over time, the liability is accreted to its present value each period, and the capitalized cost is depreciated over the useful life of the related asset. Upon settlement of the liability, an entity either settles the obligation for its recorded amount or incurs a gain or loss upon settlement. Activities related to the Company’s ARO during the year ended December 31, 2014 and 2013 were as follows (in thousands):
|
Year ended December 31, |
|||||
|
2014 |
2013 |
||||
|
Balance as of the beginning of the period |
$ |
23,334 |
$ |
8,678 | |
|
Liabilities incurred during period |
3,123 | 14,145 | |||
|
Liabilities settled during period |
(1,963) | (207) | |||
|
Accretion |
1,303 | 660 | |||
|
Sales |
(69) |
— |
|||
|
Change in estimate |
18 | 58 | |||
|
Balance as of the end of the period |
$ |
25,746 |
$ |
23,334 | |
Of the total liabilities incurred during the year ended December 31, 2014, $2.5 million was due to a purchase price adjustment for the merger with Crimson and $0.6 million related to new wells drilled during the period. All of the total liabilities settled during the year ended December 31, 2014 related to wells plugged and abandoned during the period.
Of the total liabilities incurred during the year ended December 31, 2013, $11.2 million were assumed in conjunction with the merger with Crimson and $2.9 million related to new wells drilled during the period. Of the total liabilities settled during the year ended December 31, 2013, approximately $137,000 related to wells plugged and abandoned during the period and approximately $70,000 related to the sale of assets in Madison and Grimes County to a third party. See Note 5 - "Acquisitions, Dispositions and Gains from Affiliates."
13. Long-Term Debt
RBC Credit Facility
In connection with the Merger during 2013, the Company assumed and immediately repaid $235.4 million of Crimson debt, including Crimson’s $175.0 million second lien term loan with Barclays Bank PLC ("Barclays") and other lenders, Crimson’s $58.6 million senior secured revolving credit facility with Wells Fargo Bank and other lenders, and a $1.8 million prepayment premium for the second lien term loan and accrued interest. Of the amount repaid, $127.6 million was made from existing cash with the remainder financed through new borrowing arrangements.
In order to finance the assumed debt, the Company entered into a $500 million four-year secured revolving credit facility with Royal Bank of Canada and other lenders (the “RBC Credit Facility”) on October 1, 2013, with an initial hydrocarbon-supported borrowing base of $275 million, which was reaffirmed on October 28, 2014 and is effective through May 1, 2015. The borrowing base under the RBC Credit Facility is redetermined each November 1 and May 1. The Company incurred $2.2 million of arrangement and upfront fees in connection with the RBC Credit Facility which will be amortized over the original four-year term of the RBC Credit Facility. Proceeds of the RBC Credit Facility were, or may be used (i) to finance working capital and for general corporate purposes,
F-26
CONTANGO OIL & GAS COMPANY AND SUBSIDIARIES
NOTES TO CONSOLIDATED FINANCIAL STATEMENTS - (continued)
(ii) for permitted acquisitions, and (iii) to finance transaction expenses in connection with the RBC Credit Facility and the Merger. The total amount borrowed on October 1, 2013 was $110.0 million.
As of December 31, 2014, the Company had $63.4 million outstanding under the RBC Credit Facility, which is due by October 1, 2017, and $1.9 million in outstanding letters of credit. As of December 31, 2013, the Company had $90.0 million outstanding under the RBC Credit Facility and $1.9 million in outstanding letters of credit. As of December 31, 2014 borrowing availability under the RBC Credit Facility was $209.7 million.
The RBC Credit Facility is collateralized by a lien on substantially all the assets of the Company and its subsidiaries, including a security interest in the stock of Contango’s subsidiaries and a security interest in the Company’s oil and gas properties.
Borrowings under the RBC Credit Facility bear interest at a rate that is dependent upon LIBOR, the U.S. prime rate, or the federal funds rate, plus a margin dependent upon the amount outstanding. Additionally, the Company must pay a commitment fee on the amount of the facility that remains unused, which varies from .375% to .5%, depending on the amount of the credit facility that is unused. Total interest expense under the RBC Credit Facility, including commitment fees, for the years ended December 31, 2014 and 2013 was approximately $2.7 million and $1.2 million, respectively.
The RBC Credit Facility contains restrictive covenants which, among other things, restrict the declaration or payment of dividends by Contango and require the maintenance of a minimum current ratio and a maximum leverage ratio. As of December 31, 2014, the Company was in compliance with all covenants under the RBC Credit Facility. The RBC Credit Facility also contains events of default that may accelerate repayment of any borrowings and/or termination of the facility. Events of default include, but are not limited to, payment defaults, breach of certain covenants, bankruptcy, insolvency or change of control events.
Amegy Bank Credit Facility
The RBC Credit Facility replaced the Company's $40 million credit facility with Amegy Bank. On October 22, 2010, the Company completed the arrangement of a secured revolving credit agreement with Amegy Bank (the “Amegy Credit Agreement”) to replace its expiring credit agreement with BBVA Compass Bank. The Amegy Credit Agreement had a $40 million hydrocarbon borrowing base and was available to fund the Company’s exploration and development activities, as well as repurchase shares of common stock, pay dividends, and fund working capital as needed. The Amegy Credit Agreement was secured by substantially all of the assets of the Company. Borrowings under the Amegy Credit Agreement would bear interest at LIBOR plus 2.5%, subject to a LIBOR floor of 0.75%. The principal was due October 1, 2014, and could be prepaid at any time with no prepayment penalty. An arrangement fee of $300,000 was paid in connection with the facility and a commitment fee of 0.125% was owed on unused borrowing capacity. The Amegy Credit Agreement contained customary covenants including limitations on the Compnay’s current ratio and additional indebtedness. Upon termination of the Amegy Credit Agreement, the Company was in compliance with all covenants and had no amounts outstanding. No early termination penalty was incurred as a result of the termination of the Amegy Credit Agreement. Interest expense under the Amegy Credit Agreement for the years ended December 31, 2013 and 2012 was approximately $37,000 and $50,000, respectively.
14. Commitments and Contingencies
Contango pays delay rentals on its offshore leases and leases its office space and certain other equipment. Effective October 1, 2013, the Company moved its corporate offices to 717 Texas Avenue in downtown Houston, Texas, under a lease that expires March 31, 2019. The Company remains responsible for the rent at its previous corporate office at 3700 Buffalo Speedway in Houston, Texas, through February 29, 2016; however, effective January 1, 2014, it subleased the previous corporate offices through February 29, 2016 and expects to recover the substantial majority of the rent it pays at that location.
F-27
CONTANGO OIL & GAS COMPANY AND SUBSIDIARIES
NOTES TO CONSOLIDATED FINANCIAL STATEMENTS - (continued)
As of December 31, 2014, minimum future lease payments for delay rentals and operating leases for Contango’s fiscal years are as follows (in thousands):
|
Fiscal years ending December 31, |
||
|
2015 |
$ |
3,867 |
|
2016 |
2,158 | |
|
2017 |
1,948 | |
|
2018 |
1,694 | |
|
2019 |
416 | |
|
2020 and thereafter |
— |
|
|
Total |
$ |
10,083 |
The amount incurred under operating leases and delay rentals during the years ended December 31, 2014, 2013, and 2012 were approximately $6.0 million, $1.0 million and $0.5 million, respectively. As of December 31, 2014, the Company’s commitment for potential future equity contributions with Exaro Energy III, LLC to develop onshore natural gas assets, was $20.6 million.
In July 2012, the Company granted year-end bonuses to employees and certain consultants to incentivize the individuals to remain with the Company. The final portion of these bonuses were paid on June 30, 2014.
In conjunction with the merger with Crimson (See Note 4 - "Merger with Crimson Exploration Inc."), certain employees did not remain with the Company. The Company entered into agreements with these individuals and paid approximately $0.4 million in severance payments during 2013.
Legal Proceedings
From time to time, the Company is involved in legal proceedings relating to claims associated with its properties, operations or business or arising from disputes with vendors in the normal course of business, including the material matters discussed below.
Mineral interest owners in South Louisiana filed suit against a subsidiary of the Company and several co-defendants in June 2009 in the 31st Judicial District Court situated in Jefferson Davis Parish, Louisiana alleging failure to act as a reasonably prudent operator, failure to explore, waste, breach of contract, etc. in connection with two wells located in Jefferson Davis Parish. Many of the alleged improprieties occurred prior to the Company’s ownership of an interest in the wells at issue, although the Company may have assumed liability otherwise attributable to its predecessors-in-interest through the acquisition documents relating to the acquisition of the Company’s interest in these wells. The Company and its co-defendants obtained a favorable judgment from the trial court following a bench trial. On October 1, 2014, the Louisiana Third Circuit Court of Appeals issued an opinion reversing the trial court’s rulings and rendering judgment in favor of the plaintiffs for approximately $13.4 million. The decision by the court of appeals did not allocate liability among the defendants although the Company would likely be responsible for at least one-half, and possibly as much as two-thirds, of the judgment if it stands. The Company and its co-defendants have filed an application for a writ of certiorari to the Louisiana Supreme Court seeking review of this case by the state’s highest court. While there is uncertainty whether the Louisiana Supreme Court will accept the Company’s application and, if accepted, rule in its favor, the Company believes that the decision by the court of appeals presents issues that will resonate with the Louisiana Supreme Court and are of precedential significance sufficient to warrant review by that court. The Company and its co-defendants are vigorously defending this lawsuit and believe that they have a meritorious position. A companion case involving the same set of facts was filed in the same trial court on April 19, 2013 on behalf of additional mineral interest owners but has been inactive pending the appeal of the original case. The Company’s potential exposure in this companion case is expected to be affected by the outcome of the Company’s appeal of the original case.
In November 2010, a subsidiary of the Company, several predecessor operators and several product purchasers were named in a lawsuit filed in the District Court for Lavaca County in Texas by an entity alleging that it owns a working interest in two wells that has not been recognized by us or by predecessor operators to which the Company had granted indemnification rights. In dispute is whether ownership rights were transferred through a number of decade-old poorly documented transactions. Based on prior summary judgments, the trial court recently entered a final judgment in the case in favor of the plaintiffs for approximately $5.3 million, plus
F-28
CONTANGO OIL & GAS COMPANY AND SUBSIDIARIES
NOTES TO CONSOLIDATED FINANCIAL STATEMENTS - (continued)
post-judgment interest. The Company is vigorously defending this lawsuit, believes that it has meritorious defenses and is appealing the trial court’s decision to the applicable state Court of Appeals.
In September 2012, a subsidiary of the Company was named as defendant in a lawsuit filed in district court for Harris County in Texas involving a title dispute over a 1/16th mineral interest in the producing intervals of certain wells operated by us in the Catherine Henderson “A” Unit in Liberty County in Texas. This case was subsequently transferred to the district court for Liberty County, Texas and combined with a suit filed by other parties against the plaintiff claiming ownership of the disputed interest. The plaintiff has alleged that, based on its interpretation of a series of 1972 deeds, it owns an additional 1/16th unleased mineral interest in the producing intervals of these wells on which it has not been paid (this claimed interest is in addition to a 1/16th unleased mineral interest on which it has been paid). The Company has made royalty payments with respect to the disputed interest in reliance, in part, upon leases obtained from successors to the grantors under the aforementioned deeds, who claim to have retained the disputed mineral interests thereunder. The plaintiff previously alleged damages of approximately $10.7 million although the plaintiff’s claim increases as additional hydrocarbons are produced from the subject wells. The Company is vigorously defending this lawsuit and believes that it has meritorious defenses. The Company believes if this matter were to be determined adversely, amounts owed to the plaintiff could be partially offset by recoupment rights the Company may have against other working interest and/or royalty interest owners in the unit.
In connection with the Merger, several class action lawsuits were brought by Crimson stockholders in Delaware and Texas seeking damages and injunctive relief. Each of these merger-related cases has now been dismissed by the respective court without liability to the Company.
In February 2011, a subsidiary of the Company and certain of its working interest partners and insurance carriers brought suit against a marine construction, dredging and tunneling company and an instrumentality of the United States of America in the U.S. District Court for the Southern District of Texas – Houston Division seeking monetary damages for damage to an offshore pipeline which was struck by a dredge. Following a bench trial in December 2013, the Company and its co-defendants obtained a favorable judgment from the trial court. The defendants are appealing the trial court’s judgment to the U.S. Court of Appeals for the 5th Circuit.
While many of these matters involve inherent uncertainty and the Company is unable at the date of this filing to estimate an amount of possible loss with respect to certain of these matters, the Company believes that the amount of the liability, if any, ultimately incurred with respect to these proceedings or claims will not have a material adverse effect on its consolidated financial position as a whole or on its liquidity, capital resources or future annual results of operations. The Company maintains various insurance policies that may provide coverage when certain types of legal proceedings are determined adversely.
Employment Agreements
As a result of successfully completing the Merger, Mr. Joseph J. Romano, the Company's Chairman and former Chief Executive Officer received a $4.0 million bonus payment in July 2014.
In connection with the Merger, Contango entered into employment agreements with each of Allan D. Keel, E. Joseph Grady, A. Carl Isaac, Jay S. Mengle and Thomas H. Atkins, which all became effective on October 1, 2013. The employment agreements provide for a term of three years with automatic two-year extensions of the initial term, unless Contango or the executive provides prior notice of intention not to extend the agreement. The employment agreements replaced the June 29, 2011 employment agreements between Crimson and Messrs. Keel, Grady, Mengle and Atkins, and the April 18, 2012 employment agreement between Crimson and Mr. Isaac, except as described below.
Under the new employment agreements, Mr. Keel is entitled to a base salary of $600,000, Mr. Grady is entitled to a base salary of $400,000, Mr. Isaac is entitled to a base salary of $320,000, Mr. Mengle is entitled to a base salary of $300,000 and Mr. Atkins is entitled to a base salary of $310,000. Each executive shall participate in the CIBP and the LTIP. With respect to the CIBP, these employee agreements provide that the executives are eligible to receive a cash bonus based upon minimum, target and maximum award levels of not less than 50%, 100% and 150% for Mr. Keel; 50%, 90% and 130% for Mr. Grady; and 50%, 80% and 120% for Messrs. Isaac, Mengle and Atkins, respectively, of such executive’s base salary. With respect to the LTIP, these employee agreements provide that the executives are eligible to receive stock option awards, restricted stock awards or a combination of both upon
F-29
CONTANGO OIL & GAS COMPANY AND SUBSIDIARIES
NOTES TO CONSOLIDATED FINANCIAL STATEMENTS - (continued)
minimum, target and maximum award levels of not less than 75%, 350% and 450% for Mr. Keel; 75%, 250% and 450% for Mr. Grady; and 75%, 250% and 350% for Messrs. Isaac, Mengle and Atkins, respectively, of such executive’s base salary.
15. Net Income (Loss) Per Common Share
A reconciliation of the components of basic and diluted net income per common share for the years ended December 31, 2014, 2013 and 2012 is presented below (in thousands):
|
Year Ended December 31, 2014 |
|||||||
|
Net Loss |
Shares |
Per Share |
|||||
|
Basic Earnings per Share: |
|||||||
|
Net loss attributable to common stock |
$ |
(21,874) | 19,059 |
$ |
(1.15) | ||
|
Diluted Earnings per Share: |
|||||||
|
Effect of potential dilutive securities: |
|||||||
|
Stock options, weighted average of incremental shares |
— |
— |
— |
||||
|
Net loss attributable to common stock |
$ |
(21,874) | 19,059 |
$ |
(1.15) | ||
|
Year Ended December 31, 2013 |
|||||||
|
Net Income |
Shares |
Per Share |
|||||
|
Basic Earnings per Share: |
|||||||
|
Net income attributable to common stock |
$ |
41,362 | 16,156 |
$ |
2.56 | ||
|
Diluted Earnings per Share: |
|||||||
|
Effect of potential dilutive securities: |
|||||||
|
Stock options, weighted average of incremental shares |
— |
2 |
— |
||||
|
Net income attributable to common stock |
$ |
41,362 | 16,158 |
$ |
2.56 | ||
|
Year Ended December 31, 2012 |
|||||||
|
Net Loss |
Shares |
Per Share |
|||||
|
Basic Earnings per Share: |
|||||||
|
Loss from continuing operations |
$ |
(907) | 15,295 |
$ |
(0.06) | ||
|
Discontinued operations, net of income taxes |
(29) | 15,295 |
— |
||||
|
Net loss attributable to common stock |
$ |
(936) | 15,295 |
$ |
(0.06) | ||
|
Diluted Earnings per Share: |
|||||||
|
Loss from continuing operations |
$ |
(907) | 15,295 |
$ |
(0.06) | ||
|
Discontinued operations, net of income taxes |
(29) | 15,295 |
— |
||||
|
Net loss attributable to common stock |
$ |
(936) | 15,295 |
$ |
(0.06) | ||
The numerator for basic earnings per share is net income (loss) attributable to common stockholders. The numerator for diluted earnings per share is net income unless there is a loss and then is (loss) available to common stockholders, due to antidilution.
Potential dilutive securities (stock options, stock warrants and convertible preferred stock) have not been considered when their effect would be antidilutive. The potentially dilutive shares, including both stock options and restricted shares, would have been 339,896 shares for the year ended December 31, 2014. The potentially dilutive shares would have been 187,302 shares for the year ended December 31, 2013. The Company had no potentially dilutive securities for the year ended December 31, 2012.
F-30
CONTANGO OIL & GAS COMPANY AND SUBSIDIARIES
NOTES TO CONSOLIDATED FINANCIAL STATEMENTS - (continued)
16. Income Taxes
Actual income tax expense from continuing operations differs from income tax expense from continuing operations computed by applying the U.S. federal statutory corporate rate of 35 percent to pretax income as follows (dollars in thousands):
|
Year Ended December 31, |
|||||||||||||||||
|
2014 |
2013 |
2012 |
|||||||||||||||
|
Provision/(benefit) at statutory tax rate |
$ |
(11,920) | 35.00 |
% |
$ |
23,011 | 35.00 |
% |
$ |
(94) | 35.00 |
% |
|||||
|
State income tax provision, net of federal benefit |
1,028 | (3.00) |
% |
2,928 | 4.45 |
% |
654 | (241.84) |
% |
||||||||
|
Permanent differences |
202 | (0.60) |
% |
(1,559) | (2.37) |
% |
450 | (166.34) |
% |
||||||||
|
State depletion deductions |
(1,723) | 5.10 |
% |
— |
— |
% |
— |
— |
% |
||||||||
|
Other |
230 | (0.70) |
% |
4 | 0.01 |
% |
(373) | 137.65 |
% |
||||||||
|
Income tax provision /(benefit) |
$ |
(12,183) | 35.80 |
% |
$ |
24,384 | 37.09 |
% |
$ |
637 | (235.53) |
% |
|||||
The effective tax rate for December 31, 2014 varies from the statutory rate primarily due to the effect of state income tax expenses. During 2014, the Company reassessed depletion deductions for Louisiana income tax purposes for all tax years open under the Louisiana statute of limitations. These additional deductions allowed under the Louisiana state statutes resulted in a reduction of cash taxes of $1.7 million. The effective tax rate for December 31, 2013 varied from the statutory rate due to the effect of state income taxes and a benefit for tax exempt life insurance proceeds of $10 million offset by non-deductible merger related expenses of $3.0 million and non-deductible compensation expenses of $1.4 million.
The provision (benefit) for income taxes from continuing operations for the periods indicated are comprised of the following (in thousands):
|
Year Ended December 31, |
|||||||||
|
2014 |
2013 |
2012 |
|||||||
|
Current tax provision (benefit): |
|||||||||
|
Federal |
$ |
(392) |
$ |
8,739 |
$ |
7,038 | |||
|
State |
478 | 3,857 | 2,168 | ||||||
|
Total |
$ |
86 |
$ |
12,596 |
$ |
9,206 | |||
|
Deferred tax provision (benefit): |
|||||||||
|
Federal |
$ |
(11,518) |
$ |
11,361 |
$ |
(8,343) | |||
|
State |
(751) | 427 | (226) | ||||||
|
Total |
$ |
(12,269) |
$ |
11,788 |
$ |
(8,569) | |||
|
Total tax provision (benefit): |
|||||||||
|
Federal |
$ |
(11,910) |
$ |
20,100 |
$ |
(1,305) | |||
|
State |
(273) | 4,284 | 1,942 | ||||||
|
Total |
$ |
(12,183) |
$ |
24,384 |
$ |
637 | |||
|
Included in gain from investment in affiliates |
$ |
3,727 |
$ |
1,245 |
$ |
32 | |||
|
Total income tax provision (benefit) |
$ |
(15,910) |
$ |
23,139 |
$ |
605 | |||
F-31
CONTANGO OIL & GAS COMPANY AND SUBSIDIARIES
NOTES TO CONSOLIDATED FINANCIAL STATEMENTS - (continued)
The net deferred tax liability is comprised of the following (in thousands):
|
December 31, |
||||||
|
2014 |
2013 |
|||||
|
Deferred tax assets: |
||||||
|
Net operating loss carryforward |
$ |
39,085 |
$ |
49,204 | ||
|
Income tax credits |
661 | 2,676 | ||||
|
Derivative instruments |
165 | 564 | ||||
|
Deferred compensation |
465 | 406 | ||||
|
Other |
1,953 | 1,165 | ||||
|
Total deferred tax assets before valuation allowance |
$ |
42,329 |
$ |
54,015 | ||
|
Valuation allowance |
(2,161) | (2,552) | ||||
|
Net deferred tax assets |
$ |
40,168 |
$ |
51,463 | ||
|
Deferred tax liability: |
||||||
|
Oil and gas properties |
$ |
(104,209) |
$ |
(133,894) | ||
|
Investment in affiliates |
(28,287) | (21,681) | ||||
|
Other |
— |
(518) | ||||
|
Deferred tax liability |
$ |
(132,496) |
$ |
(156,093) | ||
|
Total net deferred tax liability |
$ |
(92,328) |
$ |
(104,630) | ||
In assessing the realizability of deferred tax assets, the Company considers whether it is more likely than not that some portion or all of the deferred tax assets will not be realized. The ultimate realization of deferred tax assets is dependent upon the generation of future taxable income during the periods in which those temporary differences become deductible. The Company considers the scheduled reversal of deferred tax liabilities, projected future taxable income and tax planning strategies in making this assessment. Based upon the amount of deferred tax liabilities, level of historical taxable income and projections for future taxable income over the periods in which the deferred tax assets are deductible, the Company believes it is more likely than not that it will realize the benefits of these deductible differences of a $6.2 million valuation allowance.
As of December 31, 2014, the Company had federal net operating loss (“NOL") carryforwards of approximately $112.3 million and state NOLs of $10.2 million. All NOL carryforwards were acquired in a Merger with Crimson. These NOLs are available to reduce future taxable income and the related income tax liability of the combined company. At the date of the Merger, Crimson had a valuation allowance of approximately $36.4 million, or $12.8 million tax-adjusted. As part of acquisition accounting for the Merger, the Company released valuation allowances of approximately $29.2 million, or $10.2 million tax-adjusted. The remaining valuation allowance of $7.3 million, or $2.6 million tax-adjusted, was due to Internal Revenue Code Section 382 (“Section 382”) limitations on utilization of NOLs acquired by Crimson in previous acquisitions. As of December 31, 2014 the remaining valuation allowance decreased to $6.2 million, or $2.2 million tax-adjusted, due to an adjustment to reflect expired NOLs of $1.1 million. The utilization of NOL carryforwards acquired in the Merger with Crimson is limited by Section 382 as discussed below.
Federal NOL carryforwards of $112.3 million expire at various dates beginning in 2018 and ending in 2034. NOL carryforwards of $6.2 million impacted by Crimson's Section 382 limitations, which are not expected to be realized, will expire in 2018 through 2020. Federal NOL carryforwards of $106.1 million, associated with Crimson's losses incurred in recent years, which are also impacted by Section 382 limitations and expected to be realized, will expire at various dates beginning in 2029 and ending in 2033. The Company believes that it will be able to utilize all of the NOL carryforwards, as discussed above, before they expire.
ASC 740, Income Taxes ("ASC 740") prescribes a recognition threshold and a measurement attribute for the financial statement recognition and measurement of income tax positions taken or expected to be taken in an income tax return. For those benefits to be recognized, an income tax position must be more-likely-than-not to be sustained upon examination by taxing authorities. As a result of the Merger, the Company acquired certain tax positions taken by Crimson in prior years. These positions are
F-32
CONTANGO OIL & GAS COMPANY AND SUBSIDIARIES
NOTES TO CONSOLIDATED FINANCIAL STATEMENTS - (continued)
not expected to have a material impact on results of operations, financial position or cash flows. A reconciliation of the beginning and ending amount of unrecognized income tax benefits is as follows (in thousands):
|
Unrecognized Tax Benefits |
|||
|
Balance at December 31, 2013 |
$ |
518 | |
|
Additions based on tax positions related to the current year |
— |
||
|
Additions based on tax positions related to prior years |
— |
||
|
Additions due to acquisitions |
— |
||
|
Reductions due to a lapse of the applicable statute of limitations |
— |
||
|
Balance at December 31, 2014 |
$ |
518 | |
The Company's policy is to recognize interest and penalties related to uncertain tax positions as income tax benefit (expense) in the Company’s Consolidated Statements of Operations. The Company had no interest or penalties related to unrecognized tax benefits for the year ended December 31, 2014 or any prior years. The total amount of unrecognized tax benefit if recognized that would affect the effective tax rate was zero.
The Company's tax returns are subject to periodic audits by the various jurisdictions in which the Company operates. These audits can result in adjustments of taxes due or adjustments of the NOL carryforwards that are available to offset future taxable income. The Company does not anticipate that the total unrecognized tax benefits will significantly change due to the settlement of audits and the expiration of statute of limitations prior to December 31, 2014.
Generally, the Company's income tax years of 1998 through the current year remain open and subject to examination by Federal tax authorities, and the tax years of 2009 through current remain open and subject to examination by the tax authorities in Texas and Louisiana which are the jurisdictions where the Company carries its principal operations.
17. Related Party Transactions
Juneau Exploration L.P.
In April 2012, the Company announced that Mr. Brad Juneau, the sole manager of the general partner of JEX, had joined the Company’s board of directors and that the Company had entered into an advisory agreement with JEX (the "Advisory Agreement"), whereby in addition to generating and evaluating exploration prospects for the Company, JEX would direct Contango’s staff on operational matters including drilling, completions and production. Pursuant to the Advisory Agreement, JEX was to be paid an annual fee of $2.0 million.
In August 2012, the Company's founder, Chairman and Chief Executive Officer, Mr. Kenneth R. Peak, took a medical leave of absence and the board of directors of the Company appointed Mr. Juneau as President and Acting Chief Executive Officer of the Company, which he held until December 2012.
Effective January 1, 2013, the Advisory Agreement was terminated, and the Company and JEX entered into a First Right of Refusal Agreement (the "First Right Agreement"). Under the First Right Agreement, JEX granted a first right of refusal to Contango to purchase any exploration prospects generated and recommended by JEX. Pursuant to the First Right Agreement, JEX was to be paid an annual fee of $0.5 million. The First Right Agreement was terminated effective as of March 31, 2013.
Effective January 1, 2013, Contaro Company, a wholly-owned subsidiary of the Company, entered into an advisory agreement with JEX (the "Contaro Advisory Agreement"). Under the Contaro Advisory Agreement, JEX provided advisory services to Contaro in connection with Contaro's investment in Exaro, and Mr. Juneau served on the Board of Managers of Exaro and performed such duties as described in the limited liability company operating agreement of Exaro. Pursuant to the Contaro Advisory Agreement, JEX was paid a monthly fee of $10,000 and was entitled to receive a one percent (1%) fee of the cash profit earned by Contaro.
F-33
CONTANGO OIL & GAS COMPANY AND SUBSIDIARIES
NOTES TO CONSOLIDATED FINANCIAL STATEMENTS - (continued)
On March 19, 2014, Mr. Juneau resigned from the board of directors and no longer provides services under the Contaro Advisory Agreement. As a result, the Contaro Advisory Agreement was terminated effective as of March 19, 2014.
Olympic Energy Partners
In December 2012, Mr. Joseph J. Romano was elected President and Chief Executive Officer of the Company. Mr. Peak passed away on April 19, 2013 and Mr. Romano was named Chairman of the Company. Upon the Merger with Crimson on October 1, 2013, Mr. Romano resigned as President and Chief Executive Officer, but continued as Chairman. Mr. Romano is also the President and Chief Executive Officer of Olympic Energy Partners LLC ("Olympic").
JEX, affiliates of JEX, and Olympic have historically participated with the Company in the drilling and development of certain prospects through participation agreements and joint operating agreements, which specify each participant’s working interest ("WI"), net revenue interest ("NRI"), and describe when such interests are earned, as well as allocate an overriding royalty interest ("ORRI") of up to 3.33% to benefit the employees of JEX, excluding Mr. Juneau, except where otherwise noted. Olympic last participated with the Company in the drilling of wells in March 2010, and its ownership in Company-operated wells is limited to its Dutch and Mary Rose wells.
Republic Exploration LLC
In his capacity as sole manager of the general partner of JEX, Mr. Juneau also controls the activities of Republic Exploration LLC ("REX"), an entity owned 34.4% by JEX, 32.3% by Contango, and 33.3% by a third party which contributed other assets to REX. REX generates and evaluates offshore exploration prospects and has historically participated with the Company in the drilling and development of certain prospects through participation agreements and joint operating agreements, which specify each participant’s working interest, net revenue interest, and describe when such interests are earned, as well as allocate an overriding royalty interest of up to 3.33% to benefit the employees of JEX. The Company proportionately consolidates the results of REX in its consolidated financial statements.
As of December 31, 2014, Contango, Olympic, JEX, REX and JEX employees owned the following interests in the Company's offshore wells.
|
Olympic |
JEX |
REX |
JEX Employees |
||||||||
|
WI |
NRI |
WI |
NRI |
WI |
NRI |
ORRI |
|||||
|
Dutch #1 - #5 |
3.53% | 2.84% | 1.88% | 1.51% |
—% |
—% |
2.02% |
||||
|
Mary Rose #1 |
3.61% | 2.70% | 2.01% | 1.51% |
—% |
—% |
2.79% |
||||
|
Mary Rose #2 - #3 |
3.61% | 2.58% | 2.01% | 1.44% |
—% |
—% |
2.79% |
||||
|
Mary Rose #4 |
2.34% | 1.70% | 1.31% | 0.95% |
—% |
—% |
1.82% |
||||
|
Mary Rose #5 |
2.56% | 1.87% | 1.43% | 1.04% |
—% |
—% |
1.54% |
||||
|
Ship Shoal 263 |
—% |
—% |
—% |
—% |
—% |
—% |
3.33% |
||||
|
Vermilion 170 |
—% |
—% |
4.30% | 3.35% | 12.50% | 9.74% |
3.33% |
||||
Prior to December 2013, Contango, Olympic, and JEX had the following lower WI and NRI in Dutch #1-#5, as a result of exercising a preferential right in December 2013:
|
Olympic |
JEX |
|||||
|
WI |
NRI |
WI |
NRI |
|||
|
Dutch #1 - #5 |
3.02% |
2.42% |
1.61% |
1.29% |
||
During the year ended December 31, 2014, Mr. Romano earned $105 thousand and Mr. Juneau earned $12 thousand in cash, for their service as a director of the Company. In April 2014, the board of directors accelerated the vesting of Mr. Juneau’s 1,622 shares which would have otherwise been forfeited upon his resignation in March 2014. The Company recognized compensation
F-34
CONTANGO OIL & GAS COMPANY AND SUBSIDIARIES
NOTES TO CONSOLIDATED FINANCIAL STATEMENTS - (continued)
expense of approximately $71 thousand related to the shares granted to Mr. Juneau for the three months ended March 31, 2014. Additionally, during the year ended December 31, 2014, Mr. Romano received 2,612 shares of restricted stock, which vest 100% on the one-year anniversary of the date of grant, as part of his board of director compensation. Below is a summary of transactions between the Company, Olympic, JEX, and REX during the years ended December 31, 2014, 2013 and 2012.
|
· |
In February 2011 the Company spud Vermilion 170 which was owned 100% by the Company. Under the terms of the applicable participation agreement, Contango had a 100% working interest through casing point. Once casing point was reached, JEX and REX each exercised their option to back-in for a 2.6% and 7.5% working interest, respectively. Once production began, JEX and REX each received their carried working interest of 1.7% and 5.0%, respectively, resulting in JEX having a final working interest of 4.3% and REX having a final working interest of 12.5%. The Company owns the remaining working interests in this well. The Company paid JEX a prospect fee of $250,000 for generating this prospect. |
|
· |
In July 2011, the Company recompleted its Eloise South well uphole in the Cib-Op sands as its Dutch #5 well. Under the terms of the applicable joint operating agreement, all Dutch #5 well owners were required to purchase the Eloise South well bore from the Eloise South owners (the "Dutch Well Cost Adjustment"). All Eloise South and Dutch #5 well owners paid and/or received their proportionate share of the Dutch Well Cost Adjustment based on their ownership percentage in each well. At the time of the Dutch Well Cost Adjustment, JEX had a 1.6% working interest in Dutch #5; Olympic had a 3.02% working interest in Dutch #5 and a 3.33% working interest in Eloise South; REX had a 9.6% working interest in Eloise South; and Contango had a 47.05% working interest in Dutch #5 and a 23.8% working interest in Eloise South. |
|
· |
In December 2011, the Company purchased an additional working interest in Mary Rose #5 (see below) from an existing partner. The Company then sold to Olympic and JEX its proportionate share of the existing partner's interest, based on Olympic and JEX's ownership percentage in the well. |
|
· |
In January 2012, the Company recompleted its Eloise North well uphole in the Cib-Op sands as its Mary Rose #5 well. Under the terms of the applicable joint operating agreement, all Mary Rose #5 well owners were required to purchase the Eloise North well bore from the Eloise North owners. (the "Mary Rose Well Cost Adjustment"). All Eloise North and Mary Rose #5 well owners paid and/or received their proportionate share of the Mary Rose Well Cost Adjustment based on their ownership percentage in each well. JEX had a 1.4% working interest in Mary Rose #5 and a 0.1% working interest in Eloise North; Olympic had a 2.56% working interest in Mary Rose #5 and a 4.79% working interest in Eloise North; REX had a 13.2% working interest in Eloise North; and the Company had a 37.8% working interest in Mary Rose #5 and a 35.8% working interest in Eloise North. |
|
· |
In July 2012 the Company spud the Ship Shoal 134 prospect which was owned 100% by the Company. The Company paid 100% of the costs to drill, plug and abandon this well. The Company paid JEX a prospect fee of $250,000 for generating this prospect. |
|
· |
In July 2012 the Company spud the South Timbalier 75 prospect which was farmed-in 100% by the Company and REX. Under the terms of the applicable participation agreement, the Company paid 100% of the costs to drill, plug and abandon this well. The Company paid JEX a prospect fee of $250,000 for generating this prospect. |
|
· |
For the five REX-generated lease blocks that the Company purchased at the June 20, 2012 lease sale, the Company will have a 100% working interest through first production. At first production (if successful), REX will receive a carried working interest of 10%. Once payout of post casing point costs has been reached, REX will have an option to back-in for up to 12.5% working interest, resulting in REX having a final working interest of up to 22.5% (17.5% net revenue interest) and the Company owning the remaining working interests. JEX employees will receive an ORRI of 3.33% in these prospects. The Company will pay JEX a prospect fee of $250,000 for each prospect the Company drills. Should the Company not drill these prospects within 48 months of the effective date of each lease, the Company shall assign such lease to REX. |
|
· |
For the one JEX-generated lease block that the Company purchased at the June 20, 2012 lease sale, the Company will carry JEX for 10% through first production and JEX employees will receive an ORRI of 3.33%. The Company paid JEX a prospect fee of $250,000 in December 2013 upon spudding this prospect. |
F-35
CONTANGO OIL & GAS COMPANY AND SUBSIDIARIES
NOTES TO CONSOLIDATED FINANCIAL STATEMENTS - (continued)
|
· |
For the three REX-generated lease blocks that the Company purchased at the March 20, 2013 lease sale, the Company will have a 100% working interest through first production. At first production (if successful), REX will receive a carried working interest of 10%. Once payout of post casing point costs has been reached, REX will have an option to back-in for up to 12.5% working interest, resulting in REX having a final working interest of up to 22.5% (17.5% net revenue interest) and the Company owning the remaining working interests. JEX employees will receive an ORRI of 3.33% in these prospects. The Company paid JEX two prospect fees of $250,000 each, for evaluating these two prospects located on three leases. Should the Company not drill these prospects within 48 months of the effective date of each lease, the Company shall assign such lease to REX. |
|
· |
In June 2013, the Company purchased South Timbalier 17 from an independent oil and gas company. Under the terms of the applicable participation agreement, the Company will have a 75% working interest in this well, with several other owners owning the remainder, until payout of all costs is reached. Once payout of all costs has been reached, REX will have an option to back-in for up to a 9.4% working interest, (6.7% net revenue interest), resulting in the Company owning a 56.3% working interest (39.9% net revenue interest). The Company paid JEX a prospect fee of $250,000 for evaluating this prospect. There are no JEX employee ORRIs on this prospect. |
|
· |
In the Tuscaloosa Marine Shale ("TMS"), a shale play in central Louisiana and Mississippi, the Company has a 100% working interest through first production. JEX will receive a carried working interest of 10% in certain of the Company’s TMS wells, and JEX employees will receive an ORRI of 2%, of which Mr. Juneau receives 0.75%, to reimburse Mr. Juneau for out-of-pocket costs incurred in order for Contango to participate in the prospect. An additional 2% ORRI was granted to the geologist who generated the TMS prospect for us. The geologist has subsequently been employed by Contango. |
|
· |
Effective January 1, 2014, the Company subleased to JEX a portion of its previous office space at 3700 Buffalo Speedway, Houston, Texas for approximately $0.1 million per year, which approximates its rental liability for that space. |
Below is a summary of payments the Company received from (paid to) Olympic, JEX, and REX in the ordinary course of business in its capacity as operator of the wells and platforms for the periods indicated. The Company made and received similar types of payments with other well owners (in thousands):
|
Year ended December 31, |
|||||||||||||||||||||||||||
|
2014 |
2013 |
2012 |
|||||||||||||||||||||||||
|
Olympic |
JEX |
REX |
Olympic |
JEX |
REX |
Olympic |
JEX |
REX |
|||||||||||||||||||
|
Revenue payments as well owners |
$ |
(7,349) |
$ |
(4,882) |
$ |
(2,270) |
$ |
(6,859) |
$ |
(4,628) |
$ |
(1,932) |
$ |
(6,888) |
$ |
(5,230) |
$ |
(4,308) | |||||||||
|
Joint interest billing receipts |
673 | 521 | 322 | 945 | 1,201 | 2,090 | 1,081 | 724 | 885 | ||||||||||||||||||
|
Mary Rose well cost adjustment |
— |
— |
— |
— |
— |
— |
(201) | 118 | (1,185) | ||||||||||||||||||
Below is a summary of payments the Company received from (paid to) Olympic, JEX and REX as a result of specific transactions between the Company, Olympic, JEX and REX. While these payments are in the ordinary course of business, the Company did not have similar transactions with other well owners (in thousands):
|
Year ended December 31, |
|||||||||||||||||||||||||||
|
2014 |
2013 |
2012 |
|||||||||||||||||||||||||
|
Olympic |
JEX |
REX |
Olympic |
JEX |
REX |
Olympic |
JEX |
REX |
|||||||||||||||||||
|
Reimbursement of certain costs |
$ |
(54) |
$ |
(29) |
$ |
— |
$ |
— |
$ |
(115) |
$ |
(4) |
$ |
— |
$ |
(496) |
$ |
(9) | |||||||||
|
Rent received for sublease |
— |
142 |
— |
— |
— |
— |
— |
— |
— |
||||||||||||||||||
|
Prospect fees |
— |
— |
— |
— |
(1,000) |
— |
— |
— |
— |
||||||||||||||||||
|
Advisory Agreements |
— |
— |
— |
— |
(361) |
— |
— |
(1,530) |
— |
||||||||||||||||||
|
REX distribution to members |
— |
— |
— |
— |
— |
(197) |
— |
— |
1,469 | ||||||||||||||||||
F-36
CONTANGO OIL & GAS COMPANY AND SUBSIDIARIES
NOTES TO CONSOLIDATED FINANCIAL STATEMENTS - (continued)
As of December 31, 2014 and 2013, the Company's consolidated balance sheets reflected the following balances (in thousands):
|
December 31, 2014 |
December 31, 2013 |
|||||||||||||||||
|
Olympic |
JEX |
REX |
Olympic |
JEX |
REX |
|||||||||||||
|
Accounts receivable: |
||||||||||||||||||
|
Joint interest billing |
48 | 42 | 12 | 34 | 87 | 116 | ||||||||||||
|
Accounts payable: |
||||||||||||||||||
|
Royalties and revenue payable |
(1,006) | (620) | (175) | (1,293) | (877) | (466) | ||||||||||||
Oaktree Capital Management L.P.
Oaktree Capital Management L.P. ("Oaktree"), through various funds, owns approximately 6.7% of the Company's stock. On October 1, 2013 following the closing of the Merger, Mr. James Ford, a Manging Director and Portfolio Manager within Oaktree, was elected to the Company's board of directors. Mr. Ford was previously a member of Crimson's board of directors from February 2005 until the closing of the Merger.
As part of Mr. Ford's director compensation, all cash and equity awards payable to Mr. Ford, are instead granted to an affiliate of Oaktree. During the year ended December 31, 2014, an affiliate of Oaktree earned $64 thousand in cash and 2,612 shares of restricted common stock as a result of Mr. Ford's board participation. These shares vest one year from the date of grant.
Prior to the Merger, Crimson maintained a second lien credit agreement with Barclays Bank Plc, as agent, and other parties, including an affiliate of Oaktree, which was Crimson's largest stockholder at the time (the “Second Lien Credit Agreement”). The Second Lien Credit Agreement provided for a term loan, made to Crimson in a single draw, in an aggregate principal amount of $175.0 million. In connection with the Merger, the Company assumed and immediately repaid Crimson’s $175.0 million loan under the Second Lien Credit Agreement, plus $1.8 million in interest and prepayment premiums.
Contango ORE, Inc.
In November 2011, the Company executed a $1.0 million Revolving Line of Credit Promissory Note to lend money to Contango ORE, Inc. (the “CORE Note”). The Company and Contango ORE, Inc. (“CORE”) shared executive officers at that time. The CORE Note contained covenants limiting CORE’s ability to enter into additional indebtedness and prohibiting liens on any of its assets or properties. Borrowings under the CORE Note bore interest at 10% per annum. On March 30, 2012 the Company received repayment of the $500,000 it had advanced under the CORE Note, plus accrued interest of approximately $15,000. The CORE Note was terminated on December 31, 2012.
Equity Compensation
In February 2012, the Company net-settled 45,000 stock options from two employees for a total of approximately $465,000. All settlements were approved by the Company’s board of directors and were completed at the closing price of the Company’s common stock on the date of settlement.
18. Subsequent Events
The Company has evaluated subsequent events through the date the financial statements were available to be issued. Nothing that would require recognition or disclosure in the financial statements was identified in addition to the items disclosed in the financial statements.
F-37
CONTANGO OIL & GAS COMPANY AND SUBSIDIARIES
SUPPLEMENTAL OIL AND GAS DISCLOSURES (Unaudited)
In accordance with U.S. GAAP for disclosures regarding oil and gas producing activities, and SEC rules for oil and gas reporting disclosures, we are making the following disclosures regarding our natural gas and oil reserves and exploration and production activities.
Capitalized Costs Related to Oil and Gas Producing Activities
The following table presents information regarding our net capitalized costs related to oil and gas producing activities as of the date indicated (in thousands):
|
December 31, |
||||||
|
2014 |
2013 |
|||||
|
Proved oil and gas properties |
$ |
1,138,054 |
$ |
1,001,361 | ||
|
Unproved oil and gas properties |
35,783 | 49,443 | ||||
| 1,173,837 | 1,050,804 | |||||
|
Less accumulated depreciation, depletion, amortization and impairment |
(425,890) | (260,438) | ||||
|
Net capitalized costs |
$ |
747,947 |
$ |
790,366 | ||
Costs Incurred
The following table presents information regarding our net costs incurred in the purchase of proved and unproved properties and in exploration and development activities for the periods indicated (in thousands):
|
Year Ended December 31, |
|||||||||
|
2014 |
2013 |
2012 |
|||||||
|
Property acquisition costs: |
|||||||||
|
Unproved |
$ |
22,087 |
$ |
8,134 |
$ |
19,982 | |||
|
Proved |
— |
428,925 | 280 | ||||||
|
Exploration costs |
49,680 | 15,551 | 41,265 | ||||||
|
Development costs |
120,630 | 35,363 | 16,090 | ||||||
|
Total costs incurred |
$ |
192,397 |
$ |
487,973 |
$ |
77,617 | |||
The following table presents information regarding our share of the net costs incurred by Exaro in the purchase of proved and unproved properties and in exploration and development activities for the periods indicated (in thousands):
|
Year Ended December 31, |
|||||||||
|
2014 |
2013 |
2012 |
|||||||
|
Property acquisition costs |
$ |
— |
$ |
— |
$ |
— |
|||
|
Exploration costs |
— |
— |
— |
||||||
|
Development costs |
30,288 | 51,014 | 20,528 | ||||||
|
Total costs incurred |
$ |
30,288 |
$ |
51,014 |
$ |
20,528 | |||
Natural Gas and Oil Reserves
Proved reserves are the estimated quantities of natural gas, oil and natural gas liquids which geological and engineering data demonstrate with reasonable certainty to be recoverable in future years from known reservoirs under existing economic and operating conditions and current regulatory practices. Proved developed reserves are proved reserves which are expected to be produced from existing completion intervals with existing equipment and operating methods.
Proved natural gas and oil reserve quantities at December 31, 2012 and 2011, and the related discounted future net cash flows before income taxes are based on estimates prepared by William M. Cobb & Associates, Inc. Proved natural gas and oil reserve
F-38
CONTANGO OIL & GAS COMPANY AND SUBSIDIARIES
SUPPLEMENTAL OIL AND GAS DISCLOSURES (Unaudited)
quantities at December 31, 2014 and 2013, and the related discounted future net cash flows before income taxes are based on estimates prepared by William M. Cobb & Associates, Inc. and Netherland, Sewell & Associates, Inc. All estimates have been prepared in accordance with guidelines established by the Securities and Exchange Commission.
The below table summarizes the Company’s net ownership interests in estimated quantities of proved natural gas, oil and natural gas liquids (“NGLs”) reserves and changes in net proved reserves as of December 31, 2014, 2013, 2012 and 2011, all of which are located in the continental United States.
|
Oil and |
Natural |
|||||||
|
Condensate |
NGLs |
Gas |
Total |
|||||
|
(MBbls) |
(MBbls) |
(MMcf) |
(MMcfe) |
|||||
|
Proved Developed and Undeveloped Reserves as of: |
||||||||
|
December 31, 2011 |
3,493 | 4,570 | 212,823 | 261,201 | ||||
|
Revisions of previous estimates |
(472) | 1,420 | (17,041) | (11,353) | ||||
|
Production |
(507) | (660) | (21,750) | (28,752) | ||||
|
December 31, 2012 |
2,514 | 5,330 | 174,032 | 221,096 | ||||
|
Sale of minerals in place |
(323) | (49) | (356) | (2,588) | ||||
|
Extensions and discoveries |
2,199 | 436 | 5,431 | 21,241 | ||||
|
Purchases of minerals in place |
6,839 | 3,151 | 65,186 | 125,126 | ||||
|
Revisions of previous estimates |
(942) | (233) | (15,739) | (22,789) | ||||
|
Production |
(589) | (677) | (20,624) | (28,220) | ||||
|
December 31, 2013 |
9,698 | 7,958 | 207,930 | 313,866 | ||||
|
Sale of minerals in place |
(1) |
— |
(161) | (164) | ||||
|
Extensions and discoveries |
2,940 | 932 | 12,899 | 36,130 | ||||
|
Revisions of previous estimates |
(2,821) | (373) | (15,142) | (34,316) | ||||
|
Production |
(1,401) | (1,008) | (25,875) | (40,323) | ||||
|
December 31, 2014 |
8,415 | 7,509 | 179,651 | 275,193 | ||||
|
Proved Developed Reserves as of: |
||||||||
|
December 31, 2011 |
3,539 | 4,343 | 209,903 | 257,195 | ||||
|
December 31, 2012 |
2,514 | 5,103 | 166,307 | 212,009 | ||||
|
December 31, 2013 |
5,223 | 6,453 | 185,535 | 255,591 | ||||
|
December 31, 2014 |
4,114 | 5,637 | 150,235 | 208,734 | ||||
|
Proved Undeveloped Reserves as of: |
||||||||
|
December 31, 2011 |
(46) | 227 | 2,920 | 4,006 | ||||
|
December 31, 2012 |
— |
227 | 7,725 | 9,087 | ||||
|
December 31, 2013 |
4,475 | 1,505 | 22,395 | 58,275 | ||||
|
December 31, 2014 |
4,301 | 1,872 | 29,416 | 66,459 |
During the year ended December 31, 2014, our proved reserves decreased by approximately 38.7 Bcfe. This decrease is primarily attributable to a 22.4 Bcfe negative revision of proved developed producing reserves at our Eugene Island 11 field and normal production declines. The negative revision at Eugene Island 11 was due to a change in forecasted condensate yield and ultimate field abandonment pressure, as determined by our third party engineers related to recent field performance.
During the year ended December 31, 2013, our proved reserves increased by approximately 92.8 Bcfe. This increase is primarily attributable to our merger with Crimson, offset by normal production of 28.2 Bcfe during the year, a 19.2 Bcfe decrease in our Dutch and Mary Rose reserve estimates based upon additional pressure data, and a 2.5 Bcfe decrease in our Vermilion 170 reserve estimates, as determined by our reservoir engineer.
F-39
CONTANGO OIL & GAS COMPANY AND SUBSIDIARIES
SUPPLEMENTAL OIL AND GAS DISCLOSURES (Unaudited)
During the year ended December 31, 2012, our proved reserves decreased by approximately 40.1 Bcfe. The major contributors to this decrease include normal production of 28.8 Bcfe during the year, a 9.2 Bcfe decrease in our Ship Shoal 263 reserve estimates, and an 11.5 Bcfe decrease in our Vermilion 170 reserve estimates, as determined by our reservoir engineer.
The below table summarizes the Company’s net ownership interests in estimated quantities of proved natural gas, oil and natural gas liquids (“NGLs”) reserves and changes in net proved reserves as of December 31, 2014, 2013 and 2012 attributable to its Investment in Exaro.
|
Oil and |
Natural |
|||||||
|
Condensate |
NGLs |
Gas |
Total |
|||||
|
(MBbls) |
(MBbls) |
(MMcf) |
(MMcfe) |
|||||
|
Proved Developed and Undeveloped Reserves as of: |
||||||||
|
December 31, 2011 |
— |
— |
— |
— |
||||
|
Extensions and discoveries |
142 |
— |
11,583 | 12,434 | ||||
|
Production |
(9) |
— |
(527) | (580) | ||||
|
December 31, 2012 |
133 |
— |
11,056 | 11,854 | ||||
|
Sale of minerals in place |
— |
— |
— |
— |
||||
|
Extensions and discoveries |
66 |
— |
4,282 | 4,675 | ||||
|
Purchases of minerals in place |
— |
— |
— |
— |
||||
|
Revisions of previous estimates |
288 |
— |
27,339 | 29,066 | ||||
|
Production |
(48) |
— |
(3,609) | (3,893) | ||||
|
December 31, 2013 |
439 |
— |
39,068 | 41,702 | ||||
|
Sale of minerals in place |
— |
— |
— |
— |
||||
|
Extensions and discoveries |
329 |
— |
26,173 | 28,147 | ||||
|
Revisions of previous estimates |
86 |
— |
5,102 | 5,617 | ||||
|
Production |
(63) |
— |
(4,931) | (5,308) | ||||
|
Decenber 31, 2014 |
791 |
— |
65,412 | 70,158 | ||||
|
Proved Developed Reserves as of: |
||||||||
|
December 31, 2012 |
133 |
— |
11,056 | 11,854 | ||||
|
December 31, 2013 |
439 |
— |
39,068 | 41,702 | ||||
|
December 31, 2014 |
529 |
— |
45,127 | 48,301 | ||||
|
Proved Undeveloped Reserves as of: |
||||||||
|
December 31, 2012 |
— |
— |
— |
— |
||||
|
December 31, 2013 |
— |
— |
— |
— |
||||
|
December 31, 2014 |
262 |
— |
20,285 | 21,857 |
F-40
CONTANGO OIL & GAS COMPANY AND SUBSIDIARIES
SUPPLEMENTAL OIL AND GAS DISCLOSURES (Unaudited)
Standardized Measure
The standardized measure of discounted future net cash flows relating to the Company’s ownership interests in proved natural gas and oil reserves as of December 31, 2014, 2013 and 2012 are shown below (in thousands):
|
As of December 31, |
||||||||
|
2014 |
2013 |
2012 |
||||||
|
Future cash inflows |
$ |
1,820,954 |
$ |
2,098,788 |
$ |
1,094,986 | ||
|
Future production costs |
(412,607) | (473,801) | (212,732) | |||||
|
Future development costs |
(219,598) | (183,329) | (24,610) | |||||
|
Future income tax expenses |
(232,648) | (323,210) | (301,862) | |||||
|
Future net cash flows |
956,101 | 1,118,448 | 555,782 | |||||
|
10% annual discount for estimated timing of cash flows |
(308,085) | (347,005) | (167,770) | |||||
|
Standardized measure of discounted future net cash flows |
$ |
648,016 |
$ |
771,443 |
$ |
388,012 | ||
Future cash inflows represent expected revenues from production and are computed by applying certain prices of natural gas and oil to estimated quantities of proved natural gas and oil reserves. Prices are based on the first-day-of-the-month prices for the previous 12 months. As of December 31, 2014, future cash inflows were based on unadjusted prices of $4.32 per MMbtu of natural gas, $93.32 per barrel of oil, and $33.45 per barrel of NGLs. As of December 31, 2013, future cash inflows were based on unadjusted prices of $3.66 per MMbtu of natural gas, $97.33 per barrel of oil, and $37.39 per barrel of NGLs. As of December 31, 2012, future cash inflows were based on unadjusted prices of $2.75 per MMBtu of natural gas, $95.05 per barrel of oil, and $58.39 per barrel of natural gas liquids.
The standardized measure of discounted future net cash flows relating to the Company’s ownership interests in proved natural gas and oil reserves as of December 31, 2014, 2013 and 2012 attributable to its Investment in Exaro are shown below (in thousands):
|
As of December 31, |
||||||||
|
2014 |
2013 |
2012 |
||||||
|
Future cash inflows |
$ |
392,238 |
$ |
196,515 |
$ |
41,424 | ||
|
Future production costs |
(147,473) | (82,071) | (19,021) | |||||
|
Future development costs |
(39,523) | (2,466) | (508) | |||||
|
Future income tax expenses |
— |
— |
— |
|||||
|
Future net cash flows |
205,242 | 111,978 | 21,895 | |||||
|
10% annual discount for estimated timing of cash flows |
(104,635) | (48,072) | (8,234) | |||||
|
Standardized measure of discounted future net cash flows |
$ |
100,607 |
$ |
63,906 |
$ |
13,661 | ||
Realized Prices
The average realized prices for the year ended December 31, 2014 production were $4.36 per MCF of gas, $92.98 per barrel of oil, and $33.27 per barrel of NGL. Sales are based on market prices and do not include the effects of realized derivative hedging losses of $1.3 million for the year ended December 31, 2014.
Future production and development costs are estimated expenditures to be incurred in developing and producing the Company’s proved natural gas and oil reserves based on historical costs and assuming continuation of existing economic conditions. Future development costs relate to compression charges at our platforms, abandonment costs, recompletion costs, and additional development costs for new facilities.
F-41
CONTANGO OIL & GAS COMPANY AND SUBSIDIARIES
SUPPLEMENTAL OIL AND GAS DISCLOSURES (Unaudited)
Future income taxes are based on year-end statutory rates, adjusted for tax basis and applicable tax credits. A discount factor of 10 percent was used to reflect the timing of future net cash flows. The standardized measure of discounted future net cash flows is not intended to represent the replacement cost or fair value of the Company’s natural gas and oil properties. An estimate of fair value would also take into account, among other things, the recovery of reserves not presently classified as proved, anticipated future changes in prices and costs, and a discount factor more representative of the time value of money and the risks inherent in reserve estimates of natural gas and oil producing operations.
The Company's share of the standardized measure of discounted future net cash flows attributable to our investment in Exaro does not include the effect of income taxes because Exaro is treated a partnership for tax purposes. Exaro allocates any income or expense for tax purposes to its partners.
Change in Standardized Measure
Changes in the standardized measure of future net cash flows relating to proved natural gas and oil reserves are summarized below (in thousands):
|
Year Ended December 31, |
|||||||||
|
2014 |
2013 |
2012 |
|||||||
|
Changes in standardized measure due to current year operation: |
|||||||||
|
Sales of natural gas and oil produced during the period, net of production expenses |
$ |
(229,222) |
$ |
(86,939) |
$ |
(122,149) | |||
|
Extensions and discoveries |
102,024 | 120,709 |
— |
||||||
|
Net change in prices and production costs |
(43,214) | (11,469) | (182,879) | ||||||
|
Changes in estimated future development costs |
7,064 | 20,282 | 5,665 | ||||||
|
Revisions in quantity estimates |
(107,934) | (3,627) | (46,304) | ||||||
|
Purchase of reserves |
— |
408,990 |
— |
||||||
|
Sale of reserves |
(195) | (15,555) |
— |
||||||
|
Accretion of discount |
98,721 | 37,099 | 90,968 | ||||||
|
Changes in income taxes |
66,918 | (22,952) | 111,458 | ||||||
|
Change in the timing of production rates and other |
(17,588) | (32,613) | (60,580) | ||||||
|
Net change |
(123,426) | 413,925 | (203,821) | ||||||
|
Beginning of year |
771,442 | 357,517 | 591,833 | ||||||
|
End of year |
$ |
648,016 |
$ |
771,442 |
$ |
388,012 | |||
During the year ended December 31, 2014, our proved reserves decreased by approximately 38.7 Bcfe and our standardized measure decreased by approximately $0.1 million. This decrease is primarily attributable to a 22.4 Bcfe negative revision of proved developed producing reserves at our Eugene Island 11 field and normal production declines. The negative revision at Eugene Island 11 was due to a change in forecasted condensate yield and ultimate field abandonment pressure, as determined by our third party engineers related to recent field performance.
During the year ended December 31, 2013, our proved reserves increased by approximately 92.8 Bcfe and our standardized measure increased by approximately $383.4 million. This increase is primarily attributable to our merger with Crimson as well as the acquisition of additional interests in our operated Dutch offshore reserves, offset by normal production of 28.2 Bcfe during the year, a 19.2 Bcfe decrease in our Dutch and Mary Rose reserve estimates based upon additional pressure data, and a 2.5 Bcfe decrease in our Vermilion 170 reserve estimates, as determined by our reservoir engineer. The "Sale of reserves" line includes the sale of a partial interest in the Company's properties located in Madison and Grimes Counties.
During the year ended December 31, 2012, our proved reserves decreased by approximately 40.1 Bcfe and our standardized measure decreased by approximately $203.8 million. The major contributors to this decrease include normal production of 28.8 Bcfe
F-42
CONTANGO OIL & GAS COMPANY AND SUBSIDIARIES
SUPPLEMENTAL OIL AND GAS DISCLOSURES (Unaudited)
during the year, a 9.2 Bcfe decrease in our Ship Shoal 263 reserve estimates, and an 11.5 Bcfe decrease in our Vermilion 170 reserve estimates, as determined by our reservoir engineer.
Changes in the standardized measure of future net cash flows relating to proved natural gas and oil reserves attributable to the Company’s Investment in Exaro are summarized below (in thousands):
|
Year Ended December 31, |
|||||||||
|
2014 |
2013 |
2012 |
|||||||
|
Changes in standardized measure due to current year operation: |
|||||||||
|
Sales of natural gas and oil produced during the period, net of production expenses |
$ |
(21,356) |
$ |
(13,509) |
$ |
(1,868) | |||
|
Extensions and discoveries |
26,241 | 8,039 | 15,529 | ||||||
|
Net change in prices and production costs |
18,040 | 10,131 |
— |
||||||
|
Changes in estimated future development costs |
354 | (433) |
— |
||||||
|
Revisions in quantity estimates |
9,379 | 44,544 |
— |
||||||
|
Purchase of reserves |
— |
— |
— |
||||||
|
Sale of reserves |
— |
— |
— |
||||||
|
Accretion of discount |
6,391 | 1,366 |
— |
||||||
|
Changes in income taxes |
— |
— |
— |
||||||
|
Change in the timing of production rates and other |
(2,348) | 107 |
— |
||||||
|
Net change |
36,701 | 50,245 | 13,661 | ||||||
|
Beginning of year |
63,906 | 13,661 |
— |
||||||
|
End of year |
$ |
100,607 |
$ |
63,906 |
$ |
13,661 | |||
.
F-43
CONTANGO OIL & GAS COMPANY AND SUBSIDIARIES
QUARTERLY RESULTS OF OPERATIONS (Unaudited)
Quarterly Results of Operations
The following table sets forth the results of operations by quarter for the fiscal years ended December 31, 2014 and 2013, (in thousands, except per share amounts):
|
Quarter Ended |
||||||||||||
|
March 31 |
June 30 |
September 30 |
December 31 |
|||||||||
|
Year ended December 31, 2014: |
||||||||||||
|
Revenues from continuing operations |
$ |
80,257 |
$ |
78,419 |
$ |
67,552 |
$ |
50,230 | ||||
|
Net income (loss) from continuing operations (1) |
$ |
(10,193) |
$ |
4,581 |
$ |
3,664 |
$ |
(19,926) | ||||
|
Net income (loss) attributable to common stock |
$ |
(10,193) |
$ |
4,581 |
$ |
3,664 |
$ |
(19,926) | ||||
|
Net income (loss) per share (2): |
||||||||||||
|
Basic: |
$ |
(0.53) |
$ |
0.24 |
$ |
0.19 |
$ |
(1.05) | ||||
|
Diluted: |
$ |
(0.53) |
$ |
0.24 |
$ |
0.19 |
$ |
(1.05) | ||||
|
Year ended December 31, 2013: |
||||||||||||
|
Revenues from continuing operations |
$ |
31,787 |
$ |
30,709 |
$ |
34,722 |
$ |
66,903 | ||||
|
Net income from continuing operations (1) |
3,869 | 11,356 | 19,740 | 6,396 | ||||||||
|
Net income attributable to common stock |
3,869 | 11,356 | 19,740 | 6,396 | ||||||||
|
Net income per share (2): |
||||||||||||
|
Basic: |
$ |
0.25 |
$ |
0.75 |
$ |
1.30 |
$ |
0.34 | ||||
|
Diluted:. |
$ |
0.25 |
$ |
0.75 |
$ |
1.30 |
$ |
0.34 | ||||
|
(1) |
Represents natural gas and oil sales, less operating expenses, exploration expenses, depreciation, depletion and amortization, lease expirations and relinquishments, impairment of natural gas and oil properties, general and administrative expense, and other income and expense before income taxes. |
|
(2) |
The sum of the individual quarterly earnings per share may not agree with year-to-date earnings per share as each quarterly computation is based on the income for that quarter and the weighted average number of common shares outstanding during that quarter. |
F-44