Attached files
| file | filename |
|---|---|
| EX-31.2 - EX-31.2 - Demandware Inc | d838302dex312.htm |
| EX-21.1 - EX-21.1 - Demandware Inc | d838302dex211.htm |
| EX-23.1 - EX-23.1 - Demandware Inc | d838302dex231.htm |
| EX-32.2 - EX-32.2 - Demandware Inc | d838302dex322.htm |
| EX-32.1 - EX-32.1 - Demandware Inc | d838302dex321.htm |
| EX-10.17 - EX-10.17 - Demandware Inc | d838302dex1017.htm |
| EXCEL - IDEA: XBRL DOCUMENT - Demandware Inc | Financial_Report.xls |
| EX-31.1 - EX-31.1 - Demandware Inc | d838302dex311.htm |
| EX-10.4 - EX-10.4 - Demandware Inc | d838302dex104.htm |
UNITED STATES
SECURITIES AND EXCHANGE COMMISSION
WASHINGTON, D. C. 20549
FORM 10-K
(Mark One)
| x | ANNUAL REPORT PURSUANT TO SECTION 13 OR 15(d) OF THE SECURITIES EXCHANGE ACT OF 1934 |
For the Fiscal Year Ended: December 31, 2014
OR
| ¨ | TRANSITION REPORT PURSUANT TO SECTION 13 OR 15(d) OF THE SECURITIES EXCHANGE ACT OF 1934 |
Commission File Number: 001-35450
DEMANDWARE, INC.
(Exact name of registrant as specified in its charter)
| Delaware | 20-0982939 | |
| (State or other jurisdiction of incorporation or organization) |
(I.R.S. Employer Identification No.) | |
| 5 Wall Street, Burlington, MA | 01803 | |
| (Address of principal executive offices) | (Zip Code) | |
Registrant’s telephone number, including area code: (888) 553-9216
Securities registered pursuant to Section 12(b) of the Act:
| Title of each class |
Name of each exchange on which registered | |
| Common Stock, $0.01 par value per share | The New York Stock Exchange (NYSE) |
Securities registered pursuant to Section 12(g) of the Act: None
Indicate by check mark if the Registrant is a well-known seasoned issuer, as defined in Rule 405 of the Securities Act: Yes x No ¨
Indicate by check mark if the Registrant is not required to file reports pursuant to Section 13 or Section 15(d) of the Act: Yes ¨ No x
Indicate by check mark whether the Registrant (1) has filed all reports required to be filed by Section 13 or 15(d) of the Securities Exchange Act of 1934 during the preceding 12 months (or for such shorter period that the Registrant was required to file such reports), and (2) has been subject to such filing requirements for the past 90 days. Yes x No ¨
Indicate by check mark whether the registrant has submitted electronically and posted on its corporate Web site, if any, every Interactive Data File required to be submitted and posted pursuant to Rule 405 of Regulation S-T (§ 232.405 of this chapter) during the preceding 12 months (or for such shorter period that the registrant was required to submit and post such files). Yes x No ¨
Indicate by check mark if disclosure of delinquent filers pursuant to Item 405 of Regulation S-K (§ 229.405) is not contained herein, and will not be contained, to the best of Registrant’s knowledge, in definitive proxy or information statements incorporated by reference in Part III of this Form 10-K or any amendment to this Form 10-K. x
Indicate by check mark whether the registrant is a large accelerated filer, an accelerated filer, a non-accelerated filer or a smaller reporting company. See the definitions of “large accelerated filer,” “accelerated filer” and “smaller reporting company” in Rule 12b-2 of the Exchange Act (Check one):
| Large accelerated filer | x | Accelerated filer | ¨ | |||
| Non-accelerated filer | ¨ (Do not check if a smaller reporting company) | Smaller reporting company | ¨ | |||
Indicate by check mark whether the registrant is a shell company (as defined in Rule 12b-2 of the Exchange Act). Yes ¨ No x
As of June 30, 2014, the aggregate market value of the Registrant’s voting common stock held by non-affiliates of the Registrant was approximately $2.2 billion (based on the last reported sale price of the Registrant’s common stock at the close of business on June 30, 2014).
The number of shares outstanding of the Registrant’s Common Stock as of February 23, 2015 was 36,498,602 shares.
Documents Incorporated by Reference
Portions of the Registrant’s definitive proxy statement for its annual meeting of stockholders, which the Registrant intends to file pursuant to Regulation 14A with the Securities and Exchange Commission not later than 120 days after the Registrant’s fiscal year end of December 31, 2014, are incorporated by reference into Part III of this Form 10-K.
DEMANDWARE, INC.
2014 FORM 10-K ANNUAL REPORT
TABLE OF CONTENTS
2
SPECIAL NOTE REGARDING FORWARD-LOOKING STATEMENTS
This Annual Report on Form 10-K contains forward-looking statements within the meaning of Section 27A of the Securities Act of 1933, as amended, and Section 21E of the Securities Exchange Act of 1934, as amended, or the Exchange Act. All statements other than statements relating to historical matters should be considered forward-looking statements. In addition, forward-looking statements may consist of statements including such words as “may,” “believe,” “could,” “anticipate,” “would,” “might,” “plan,” “expect,” and similar expressions or the negative of such terms or other comparable terminology. These forward-looking statements speak only as of the date of this Annual Report on Form 10-K and are subject to business and economic risks, among others. These statements are not guarantees of future performance and involve certain risks, uncertainties, and assumptions that are difficult to predict, and you should not place undue reliance on our forward-looking statements. Our actual results could differ materially from those set forth in the forward-looking statements as a result of a number of important factors, including the factors set forth in Part I, Item 1A, “Risk Factors,” and elsewhere in this Annual Report on Form 10-K and in our other reports filed with the Securities and Exchange Commission, or SEC. We expressly disclaim any obligation to update the forward-looking statements to reflect events or circumstances that arise after the date hereof.
| ITEM 1. | BUSINESS |
Overview
We are a leading provider of enterprise-class cloud digital commerce solutions, which includes ecommerce, order management and predictive intelligence applications, for retailers and branded manufacturers. Our solution, Demandware Commerce, is a combination of our cloud platform, community and related services that enables customers to establish and execute complex digital commerce strategies. These strategies include global expansion, multi-brand, multi-site rollouts, omni-channel and in-store operations as well as single platform, or unified commerce platform, strategies. The foundation of our solution is our technology platform, the Demandware Commerce Cloud. Through our highly scalable, secure and open Demandware Commerce Cloud, our customers create seamless brand experiences to reach their consumers across all digital touch points globally, including ecommerce sites, mobile applications, in-store solutions and point of sale. We provide customers with easy-to-use applications to manage and personalize the consumer experience. By simplifying access to the complex digital commerce functionality, by offering open commerce application program interfaces, or APIs, and by providing increased visibility into enterprise commerce operations including inventory, we provide our customers with increased control over their digital commerce. Customers can more easily launch, manage and integrate multiple digital commerce sites across geographies, channels and brands, initiate marketing campaigns more quickly, manage product merchandising and view customer and product information, as well as create highly customized consumer experiences, all of which can lead to increased revenue. As a result, our customers on average have grown their ecommerce revenue faster than industry benchmarks calculated by comScore.
Our cloud platform increases processing capacity of our customers’ digital commerce sites to meet surges in demand, minimize page load times and maximize uptime. Our cloud platform also offers the high reliability and security required by customers to implement their digital commerce strategies, and we have achieved 99.99% average platform availability (excluding planned downtime) since 2005. In addition, distributed order management capabilities enable retailers to provide “buy anywhere, fulfill anywhere, service anywhere” experiences. With multiple seamless upgrades to our cloud platform per year, our customers run the latest version of our software and have access to a steady stream of new and innovative digital commerce functionality as soon as it becomes available.
By using our solution, our customers avoid the need for a large upfront investment in on-premise hardware infrastructure and in customized software that is difficult and expensive to implement, upgrade and maintain. They also avoid the limitations of generic vendor-created digital commerce solutions that typically do not offer
3
the flexibility and functionality necessary for brands and retailers to create, manage and control their own customized online brand presence. Through our cloud, multi-tenant delivery model, we combine the functionality, flexibility and customization capabilities of in-house solutions with the lower costs, speed of implementation and other operational benefits of outsourcing.
A component of our solution is our ecosystem of trusted partners called Demandware LINK that complements and optimizes the Demandware Commerce Cloud. Demandware LINK is comprised of technology, solution and end-to end partners. LINK Technology Partners provide customers with access to innovative technologies that complement the Demandware Commerce Cloud through pre-built integrations which lowers the cost, complexity and time to deploy the technology when compared to custom built integrations. LINK Solution Partners specialize in strategy, design and implementation services of complex digital commerce operations. LINK End-to-End Partners combine the power of our solution with a host of complementary business and technology capabilities to provide a comprehensive solution for digital commerce.
Our customers include multinational corporations, large retailers and branded manufacturers, such as adidas, Barneys New York, Bestseller, Carter’s, Columbia, Crocs, Deckers, Guthy-Renker, House of Fraser, Kate Spade, L’Oreal, Motorola Mobility, mothercare, s.Oliver, and Tory Burch. We sell our solutions domestically and internationally through both direct and indirect channels. We have direct sales teams throughout North America, Europe and Asia and reseller relationships with our LINK End-to-End Partners that combine our Demandware Commerce Cloud with their services and technologies, such as logistics and warehousing, to provide comprehensive end-to-end digital commerce solutions in various geographic regions. See Note 2 to the consolidated financial statements included elsewhere in this Annual Report on Form 10-K for information on our operations in different geographic regions.
We derive our subscription revenue from fees paid to us by our customers for their access to the Demandware Commerce Cloud for a specified period of time, which includes our ecommerce, order management and predictive intelligence subscriptions. We have structured our contracts to align our interests with those of our ecommerce customers by participating in a share of their gross revenue processed on our platform. Our fees are generally based on a percentage of the total gross revenue our ecommerce customers process through their digital commerce sites operating on our platform, and include a committed level of annual gross revenue from which a minimum subscription fee is derived. If an ecommerce customer exceeds that baseline subscription amount, we are paid a percentage of the gross revenue processed by that customer on our platform in excess of its committed minimum subscription. Our ecommerce customer contract terms average approximately three years and range up to seven years. Our order management and predictive intelligence subscriptions are typically based on a per transaction or volume fee, which is common pricing for those solutions.
4
Since our inception, we have expanded our offerings and customer base through organic growth and by adding incremental functionality such as order management, predictive intelligence and point of sale through acquisitions. The following chart shows the aggregate number of ecommerce customers using the Demandware Commerce Cloud and the aggregate number of their sites operating on our platform from March 31, 2011 to December 31, 2014.
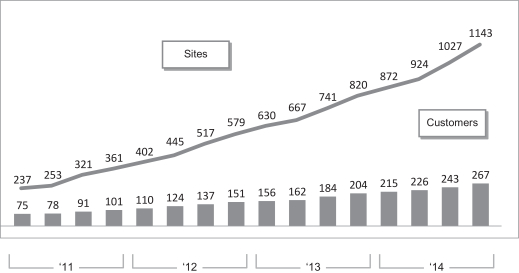
We generated revenue of $83.3 million, $106.6 million and $160.6 million in 2012, 2013 and 2014, respectively. We had net losses of $4.3 million, $18.0 million, and $27.1 million in 2012, 2013 and 2014, respectively.
Industry Overview
Digital Commerce is a Key Driver of Growth for the Retail Industry
We believe our total addressable market is at the center of three large and growing sectors: retail, digital commerce and cloud computing. The double-digit growth of the ecommerce market is being driven by several factors, including widespread broadband internet connectivity across an increasing number of devices such as smart phones and tablets, growing consumer preference for online shopping, online shopping channels such as social networks, group buying and flash sales and the convergence of the digital and traditional brick and mortar retail channels. The proliferation of mobile devices has helped accelerate the growth of digital commerce as the consumer is more connected and mobile has become a more conventional mode of shopping. In addition, digital and physical channels are converging. Retailers need to provide consumers with a more relevant, personalized shopping experience that appropriately reflects the brand’s identity across channels. In addition, with the convergence of the physical and digital channels, retailers are increasingly looking to improve efficiency, reduce complexity and lower costs by automating processes, optimizing inventory and centralizing all key product and consumer information. The combination of an increasingly connected consumer and the flexibility and intelligence of the digital channel is increasing the demand for omni-channel experiences that optimize the retail experience regardless of channel or device.
The increase in the number of manufacturers seeking to market their brands directly to consumers through their own digital commerce sites has also been a major contributor to this growth. In addition, traditional retailers are facing increasing competition from online marketplaces and as a result are focusing on the digital channel as a more strategic growth vehicle.
5
Increasing Complexity of Digital Commerce
While the digital commerce market is expanding, it is also becoming more complex, particularly for global multi-channel retailers and branded manufacturers trying to reach consumers with consistent brand experiences across multiple channels, geographies and digital touch points as well as in brick and mortar stores. Several trends are driving this increased complexity:
| • | Convergence of Physical Store and Digital Commerce. The digital and physical retail channels are converging and retailers are increasingly looking for a unified commerce platform to manage all consumer engagement. Businesses are extending the power of digital commerce into the physical store to leverage comprehensive customer, product and inventory data to provide consumers with a higher level of service when shopping across channels. Enterprises increasingly require omni-channel capabilities that leverage information about the consumer to create a more personalized shopping experience, which can lead to increased customer loyalty and revenue. In addition, retailers are looking to optimize inventory and reduce operational complexity by centralizing all key product and consumer information. Companies are investing in technologies and solutions that will simplify the management and execution of complex commerce strategies across channels. |
| • | Rapid Pace of Innovation. Technology to facilitate digital commerce is rapidly evolving. For example, new internet-enabled devices are continually developed, updated and made available to consumers at low cost. As the switching costs for consumers adopting the newest technologies remain low, new shopping models evolve and shopping channels converge, the pressure for companies to keep up with the pace of innovation increases. Companies must invest in and implement new innovative technologies quickly and cost-effectively to be able to reach consumers through new devices or channels, or risk losing them. |
| • | Need to Maintain Scale and Global Presence. Companies that are unable to maintain the quality and functionality of their digital commerce sites as they grow risk losing both existing and prospective consumers. Significant infrastructure can be required to provide a reliable online presence that can be quickly and easily scaled to meet growing worldwide consumer demands. |
| • | Increasing Consumer Demand for Compelling Content and Commerce. As the speed, functionality and sophistication of internet applications continue to improve, consumers increasingly expect a rich, interactive and personalized digital commerce experience, with features such as active merchandising, social commerce and dynamic product imaging. In order for businesses to remain competitive, they must be able to dynamically update and personalize their product offerings to stay current with emerging consumer trends and rising consumer expectations. |
| • | Proliferation of Retail Channels. Digital commerce is expanding beyond traditional web storefronts viewed on a personal computer or laptop due to the rapid proliferation of internet-enabled devices, including smart phones, tablets, endless aisle applications and other devices, allowing consumers to access information and shop through an increasing number of digital retail channels. Consumers increasingly expect a consistent, high-quality and relevant experience across all digital retail channels. |
| • | Integration of Systems and Business Processes. Businesses have dramatically recast their online presence from static digital commerce sites focused mainly on presentation of basic product information or simple purchasing to dynamic, interactive hubs for consumer marketing, transactions, communications and services. Businesses require robust, scalable and global digital commerce solutions that can integrate with other enterprise solutions, such as enterprise resource planning, or ERP, point of sale, customer relationship management, order management, call centers, supply chain management and business intelligence systems. |
Limitations of Traditional Digital Commerce Solutions
Traditionally, there have been two common solutions for the creation and management of a digital commerce business: on-premise enterprise software, which is built, customized and maintained by the merchant
6
itself, and outsourcing, where the digital commerce platform for a retailer or branded manufacturer is outsourced to a third party provider. While traditional on-premise enterprise software solutions offer the benefits of in-house control and differentiation through custom development, they typically have the following disadvantages:
| • | Higher Upfront Cost. On-premise software implementations are typically architected to be deployed with large information technology, or IT, teams and require significant upfront investments. These solutions can be ineffective for today’s retailers and branded manufacturers, who prefer to focus on their core competencies, such as managing their brands and merchandising their products, rather than maintaining IT infrastructure and digital commerce performance. |
| • | Difficult to Maintain, Upgrade and Scale. Maintenance of traditional on-premise solutions requires ongoing software implementations and on-premise customizations that necessitate significant IT investment before, during and after the upgrade. These internal customizations make it time-consuming and expensive to enhance functionality and also make it difficult for retailers and branded manufacturers to easily upgrade to the newest release from a software provider. It is also challenging and expensive to scale the required infrastructure, particularly to meet surges in demand. |
| • | Challenge of Sharing Information. Traditional on-premise consumer facing solutions have been siloed making it challenging to share information across channels. Retailers need to leverage valuable IT resources to consolidate and manage key data elements, business rules, and functionality across multiple systems. These traditional systems make it challenging for retailers to access the information necessary or the work flow processes to provide consumers with a consistent shopping experience across channels and devices. |
While outsourcing a digital commerce operation offers the benefits of minimal required resources for internal infrastructure management and ongoing support, it has the following disadvantages:
| • | Limited Customization and Functionality. Vendor-created outsourced solutions offer limited platform flexibility, making it difficult to change functionality or to control merchandising. This may be unacceptable for retailers and branded manufacturers, who prefer to proactively manage and control their online brand presence given the critical nature of brand as a key differentiator in today’s retail environment. |
| • | Lack of Integration with Business Processes. The online presence of many retailers and branded manufacturers has evolved from a simple website to a cross-channel hub for marketing, transactions, communications and services. The lack of innovation and extendibility of a fully outsourced solution, in addition to the lack of integration with business processes, can limit a retailer’s or branded manufacturer’s ability to effectively manage their brands across multiple channels. |
Opportunity for Cloud Digital Commerce Solutions
A cloud delivery model combines the lower costs, speed of implementation and other operational benefits of outsourcing with the functionality, flexibility and customization capabilities of on-premise enterprise software solutions. As a result, the adoption of cloud solutions across industries including salesforce management, ERP, human resource management, and marketing solutions has grown significantly and outpaced the growth of traditional on-premise enterprise software product delivery.
Digital commerce is a critical component of growth strategies for a significant number of branded manufacturers and retailers worldwide. In the digital commerce market, we believe there is a significant opportunity for a company that can offer a comprehensive cloud solution designed to address the increasingly complex requirements of retailers and brands seeking to attract and satisfy consumers in the digital world.
7
Our Solution
Demandware Commerce combines a cloud multi-tenant enterprise-class platform, digital commerce capabilities and functionality with access to a broad community and services. Our cloud solutions enable our customers to more easily launch, manage and integrate multiple digital commerce sites across brands, geographies and channels, initiate marketing campaigns more quickly, manage product merchandising, view product, customer and product information, and create highly customized consumer experiences, all of which can lead to increased revenue. We offer leading data science technology to personalize the products, promotions and content presented to each individual shopper. Our order management functionality provides customers increased control over retail operations by providing a single view of orders, customers, inventory, products and promotions as well as ship from anywhere capabilities. We believe that our cloud solutions provide the following benefits to our customers:
| • | Continual Innovation. Consumers increasingly expect greater functionality and relevance from their shopping experience across channels both online and in the store. Through our cloud solution, we are able to provide a steady stream of new and innovative functionality through multiple product upgrades each year, which provides our customers with access to the latest technologies for their digital commerce business. Our customization and integration changes are implemented through automatic releases with minimal or no effort required by our customers so they can avoid the time and expense associated with repeatedly upgrading to new versions with traditional providers. When we enhance our enterprise-class platform, our entire ecommerce customer community benefits from our latest innovations by being on the same release cycle. In addition to our internal product development, we work collaboratively with our customers on an ongoing basis to enhance and improve our solutions based on their specific functional requests. |
| • | Ease of Deployment and Reduced Time To Market. The Demandware Commerce Cloud enables customers to easily expand digital commerce operations without the need to install or integrate their own hardware and software infrastructure. In addition, customers can leverage our solution to quickly and easily add new sites across geographies and channels without the need to expand their own infrastructure. Our solution, Demandware Commerce, includes Demandware LINK, our ecosystem of trusted partners, which gives customers access to the services of our Technology Partners, Solution Partners and End-to-End Partners to complement and optimize the Demandware Commerce Cloud with technology innovations, implementation services or a comprehensive suite of capabilities for digital commerce. These services enable our customers to accelerate their time-to-market for new sites, quickly implement new functionality and explore emerging technologies. In addition, we believe that our implementation cycle, which is on average six months for new customers, is shorter than the period generally required for the development and deployment of comparable on-premise digital commerce software solutions. |
| • | Broad Marketing and Merchandising Functionality. Our solutions use a web-based interface to provide one central location for our customers to control and manage their digital commerce operation—from products to pricing to placement to content. A robust set of sophisticated, yet easy-to-use marketing and merchandising tools, including catalog and inventory management, customer profiling, pricing, promotions and digital commerce search, provides customers with enhanced functionality and increased control to help optimize the efficiency, growth and profitability of their digital commerce business. Our solutions are able to easily categorize, price, and display products, while efficiently presenting multiple cross-channel promotions, enabling merchandisers to optimize the digital shopping experience of their consumers while driving greater revenue. Our functionality also helps retailers and brands strengthen consumer loyalty by delivering tailored user experiences across all digital channels. |
| • | High Reliability and Security. We provide high uptime, robust security and disaster recovery through a network of state-of-the-art data centers. We have provided 99.99% average platform availability (excluding planned downtime) since 2005. Our flexible cloud platform allows us to quickly and seamlessly increase the processing capacity of our customers’ digital commerce operations to meet |
8
| surges in demand. We operate systems in 21 data centers around the globe for our ecommerce customers and we provide 24/7 monitoring of the environment in which our customers’ digital commerce sites operate, measuring for performance and availability of content delivery. Our digital commerce platform is supported by a dynamic cloud architecture and complies with the Payment Card Industry Data Security Standard, which is generally referred to as PCI-DSS, as well as the requirements for the Service Organization Controls, or SOC, 2 Type II. Our digital commerce platform has been benchmarked to handle at least 1,400 dynamic page views per second. |
| • | Customizable Digital Commerce Sites across Channels. The Demandware Commerce Cloud allows our customers to quickly and easily customize and deliver highly flexible digital commerce applications across channels and geographies, using our powerful and intuitive tools based on procedural programming languages such as JavaScript. This gives our customers the flexibility and control of a custom development environment with the convenience, scalability and security of on-demand, multi-tenant delivery. Our open development environment allows our customers’ developers to easily create and quickly change highly branded consumer shopping experiences across channels and geographies while leveraging our multi-tenant cloud digital commerce platform. As a result, developers and IT professionals can focus their efforts and resources on innovation rather than infrastructure. |
| • | Access to Community. The foundation of Demandware Commerce is our multi-tenant cloud platform, which allows our customers to benefit from a highly collaborative community that share experiences, best practices and insights. Demandware LINK, Collaboration Center and regular communication among partners, developers, and employees provide customers with access to trends, knowledge, technology and services to help them execute complex commerce strategies. |
| • | Lower Total Cost of Ownership. With our transparent pricing model and our cloud platform, retailers and branded manufactures benefit from a lower total cost of ownership compared to traditional on-premise software license models. With on-premise license models, retailers and branded manufacturers incur costs and require investments for software licenses, annual maintenance and upgrades, hardware, hosting, redundancy and security. We provide customers with a transparent pricing model that is directly aligned with the growth of their digital commerce business. |
Our Strategy
Our strategy is to extend our position as a leading provider of cloud digital commerce solutions by providing retailers and branded manufacturers with a single, unified platform to orchestrate all transactions and manage the consumer experience and engagement across all channels and digital touch points globally. Key elements of our strategy include:
Retaining and Expanding Business with Existing Customers. As our solutions become increasingly integral to the success of our customers’ digital commerce operations, we expect to maintain our strong retention rates by providing our customers with high levels of service and support as well as new solutions and enhanced functionality. We have structured our contracts to align our interests with those of our customers by generally participating in a share of our ecommerce customers’ gross revenue processed on our platform. We believe we have the following opportunities to grow our business with our customers:
| • | Increasing Customers’ Gross Revenue. Because we generally share in the gross revenue processed by ecommerce customers on our platform, we also share an interest in optimizing the effectiveness, engagement and performance of our customers’ digital commerce sites. Our predictive intelligence functionality and data science expertise can be leveraged to help customers personalize the shopping experience and accelerate revenue growth for the customer. Early in the site implementation process, we assign a customer success manager to engage with our customers to enable them to meet their goals. Once our customers’ sites are operating on our platform, the assigned customer success manager works hand-in-hand with our customers’ digital commerce teams to help grow their revenue by taking full advantage of Demandware Commerce. |
9
| • | Increasing the Number of Customers’ Digital Commerce Sites. We intend to expand the adoption of Demandware Commerce within our existing customers’ operations. After initial deployments, many of our customers seek to expand their digital commerce presence by launching additional distinct revenue-generating sites for different geographies, brands and channels on our cloud platform. Our cloud platform allows our customers to launch sites for multiple brands and in multiple geographies cost-effectively and with minimal involvement from their internal IT staff. |
| • | Extending the Platform across Channels and into New Offerings. The digital and physical channels are converging and digital commerce is beginning to act as a central hub for our customers’ broader digital commerce strategies, including order management and in-store technologies. We have and will continue to extend the Demandware Commerce Cloud to support multiple channels to reach more consumers, including through smart phones, tablets, social networks, and in-store solutions, including point of sale. A significant part of our strategy includes keeping up-to-date on and identifying emerging trends in how consumers shop and making sure we have the functionality on our solution to enable our customers to reach, engage and capture the consumer. |
Growing Our Customer Base. A significant component of our strategy is winning new customers. We believe that managing a successful digital commerce operation across channels is more demanding and complex than ever and companies will increasingly migrate to cloud solutions like ours. We believe the continued growth of digital commerce as a strategic and differentiated sales channel, as well as the convergence of the digital and physical channels, provides us with a significant opportunity to acquire new customers by:
| • | Investing in Direct Sales. A significant portion of our market includes companies that are currently using on-premise or outsourced platforms for digital commerce that were not designed for advanced merchandising, marketing and customer experience innovation and that do not offer the benefits of a cloud solution. There are also companies that have an online presence but do not facilitate digital commerce transactions. As a result, we plan to grow our direct sales team to win more of these customers in the United States and internationally. |
| • | Targeting Large Enterprise Accounts. We are targeting strategic large enterprise accounts processing more than $150 million in gross merchandise value per year through the digital channel. We have developed an offering that combines the services, technology and benefits that meet the needs of large-scale omni-channel retailers. |
| • | Enhancing Brand Awareness. We are investing in marketing and building brand awareness of our cloud solutions, particularly in Europe and Asia and with large enterprise accounts. |
| • | Significantly Growing our European and Asia Pacific Operations. We believe a substantial opportunity exists to continue to grow sales of our solutions internationally, particularly in Europe and Asia. We plan to continue to extend and enhance the Demandware Commerce Cloud to optimize the content and application delivery in international markets. We intend to continue to grow our European and Asian operations by further investing in direct sales, strategic alliances, services and support in those regions. In 2014, we entered into a strategic partnership with SunBridge Corporation, and we will continue to invest in the success of the joint venture we established with SunBridge Corporation in Japan. |
Extend Our Solution to Become a Unified Commerce Platform. The digital and physical retail channels are converging and retailers are increasingly looking for a unified commerce platform to manage all consumer engagement. A unified platform consolidates and manages key data elements, business rules, and functionality that traditionally were housed in the build and run model in multiple disparate consumer facing and back office systems. A unified commerce platform also simplifies technology operations, enables seamless consumer engagement and provides retailers with high levels of control and information about the retail enterprise and the consumer, which leads to increased margin and revenue. We intend to invest in three primary areas to enable us to deliver on a unified commerce platform:
| • | Operations. Extend omni-channel capabilities across all consumer touch points. We will invest in enhancing our order management and orchestration functionality. In addition, we will focus our efforts |
10
| on consolidating data, business rules and functionality—focused on product, price, inventory, order, and customer—from the ecommerce channel through to the store with point of sale. |
| • | Intelligence. Leverage data across the platform to operationalize and benchmark insights. We will invest in building technology applications that provide our clients with predictive and actionable business intelligence through sophisticated machine learning. |
| • | Experience. Orchestrate dynamic content, products, pricing, and promotions to personalize interactions across all channels. We will continue to invest in digital engagement and merchandising capabilities that empower brands and retailers to efficiently deliver a consistent brand experience across channels globally. |
Continuing to Innovate, Add New Functionality and Speed the Time to Implement our Solution. We believe we have developed a deep understanding of the digital commerce challenges faced by our customers. We continually collaborate with our customers to build extensive product functionality that addresses the rapidly changing digital commerce environment, including technology requirements, shifts in consumer preferences, changes in social networks, the introduction of new channels as well as the convergence of in-store and online shopping. We plan to use our expertise in digital commerce to develop new applications, features and functionality that will enhance our solutions and expand our addressable market. We also plan to add incremental functionality to our solutions opportunistically through acquisitions, as we did with order management, predictive intelligence and point of sale.
Expanding and Strengthening Our Partner Ecosystem. We intend to continue to grow our partner ecosystem, Demandware LINK, to speed our customers’ implementations, extend our platform with innovative technologies and provide customers with access to comprehensive services. LINK Solution partners provide customers with high quality implementations and ongoing solution support as well as ongoing strategy, design, and marketing services. We also have strategic relationships with LINK End-to-End Partners such as Accenture, arvato, PFSweb and TradeGlobal that provide full-service end-to-end digital commerce solutions by combining the Demandware Commerce Cloud with a host of complementary services and technologies, such as logistics and warehousing.
Products and Services
Demandware Commerce
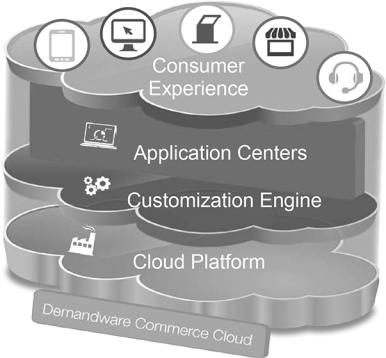
Through our solution, Demandware Commerce, we offer a comprehensive cloud digital commerce platform, the Demandware Commerce Cloud, related services, and a community that extends the value of the platform, and a business model designed for sustained customer revenue growth. We deliver our solutions on-demand to our customers who can access and manage their digital commerce businesses over the internet using a standard web browser. The foundation of our solution is our technology platform, the Demandware Commerce Cloud. Our customers leverage the Customization Engine and Application Centers in the Demandware Commerce Cloud to create compelling consumer interactions through ecommerce and in-store; to deliver omni-channel experiences and to leverage machine learning technology to turn data into actionable business intelligence. Application Centers include Engagement Center, Order Center, Intelligence Center, Development Center and Collaboration Center.
11
The following diagram illustrates the key components of our platform, the Demandware Commerce Cloud:
Omni-channel Consumer Experiences. Through Demandware Commerce, our customers can manage consumer interactions across all digital touch points globally, enabling a seamless and consistent brand experience on any channel. Our platform is built to support digital commerce best practices and can be customized to individual needs, with full access to a sophisticated omni-channel marketing and merchandising engine and open development environment. By leveraging the power of the Demandware Commerce Cloud, customers can create omni-channel consumer experiences that include:
| • | Web Storefronts. With Demandware Commerce Cloud, a customer can build a new web storefront from scratch or leverage our pre-built storefront, called SiteGenesis, to gain quicker time to market. The SiteGenesis storefront provides merchandisers with best practice examples for managing promotions, dynamic search tools, synonym dictionaries and price books. It also includes a multi-site blueprint for technical architects. |
| • | In-store. Our customers can create in-store consumer experiences on the Demandware Commerce Cloud. Our Digital Store Solution brings the power of the Demandware Commerce Cloud into the physical store and enables customers to capture sales that may otherwise have been lost. Customers can extend the platform to create kiosks, endless aisle applications and other in-store applications that provide consumers with compelling, personalized experiences that leverage the information collected across other digital channels through the Demandware Commerce Cloud. |
| • | Mobile & Tablet. Customers can build compelling shopping experiences for consumers on all mobile devices including smartphones and tablets. The Demandware Commerce Cloud provides a unified development environment between the mobile storefront and our customers’ other digital commerce sites for ease of customization and site management. The Demandware Commerce Cloud includes Responsive Web Design, which allows for dynamic formatting of consumer experiences for various devices, including desktop computers, tablets and smartphones. The Demandware Commerce Cloud creates mobile experiences in all major browsers and with popular smartphones, such as the iPhone and Android, and tablets including iPad, Galaxy and Chrome-based tablets. |
12
| • | Call Center. By using the Demandware Commerce Cloud to facilitate consumer experiences in the call center, our customers’ call center agents can quickly access order, consumer and product information through a single web-based interface, enabling a more efficient and engaging experience for the consumer. Agents are able to easily search for products using advanced search techniques and guided navigation. In addition to providing improved customer service, agents can use this software to gain a single view into a consumer’s entire order history and recommend products using rules established by our merchandising tools. |
Demandware Commerce Cloud. Our platform, the Demandware Commerce Cloud, is the foundation of our solution. Web traffic is global and not linked to brick and mortar store operational hours. Consumers expect online stores to be open and functional at all times, even when they are serving millions of consumers during the busiest shopping season. With legacy in-house systems, retailers and branded manufacturers have to plan for demand, buy resources for the peak season and create a disaster recovery back-up strategy. Our cloud platform ensures that our customers’ commerce operations are up and running and have access to the relevant data to create compelling consumer interactions.
The Demandware Commerce Cloud enables omni-channel consumer interactions through the web, mobile devices, social media, stores and other emerging channels. The cloud platform enables our customers to offer a reliable, high-performance, secure online shopping environment that is PCI-DSS and SOC 2 Type II-compliant. Our cloud platform allows us to quickly and seamlessly increase the processing capacity of the environment in which our customers’ digital commerce sites operate to meet surges in demand. We also provide high uptime, robust security and disaster recovery.
Demandware ensures technical operations run smoothly and reliably, allowing customers to focus on more strategic retail initiatives. The platform includes the analytical data model used to help customers gain insights from their own data to improve business results. We seamlessly deploy new features and enhancements multiple times a year. Each global release includes innovations that are available to every customer with limited disruption to the commerce environment. Through the cloud platform, customers quickly build and deploy customer applications as well as external applications, through RESTful APIs, to integrate with the Demandware Commerce Cloud.
Customization Engine and Applications Centers. Each customer’s unique configuration is captured in the Customization Engine, which leverages the information gathered through the extensive data model and open commerce APIs available in the cloud platform. Application Centers are where customers manage their daily business. Whether merchants, marketers, developers or operations teams, users have access to the tools they need to execute their specific function. Examples of the Application Centers are:
| • | Engagement Center. Engagement Center is a centralized and unified application for control and management of all consumer digital commerce experiences across multiple geographies, branded sites and channels. Unlike traditional work environments that require multiple interfaces to manage processes across products, marketing, merchandising, consumers, orders and sites, Engagement Center provides one central access point. In addition, users are able to create customized dashboards to display the most commonly used activities and thus increase their efficiency and enhance their ability to manage and change consumer experiences. |
| • | Order Center. Order Center is an order management application that enables users to access order information and processes throughout the consumer’s lifecycle including order placement, modification, payment, returns and reporting. Order Center simplifies order orchestration between online and in-store shopping processes; optimizes store and web inventory; and alleviates out-of-stock issues with a single, enterprise-wide view of inventory including real-time inventory counts that tracks products on order or in transit. |
| • | Intelligence Center. Intelligence Center includes Demandware’s predictive intelligence capabilities, which apply leading-edge data science to the full picture of the shopper journey, leveraging online and |
13
| offline customer and product data to personalize the products, promotions and content presented to each individual shopper. In addition, the Demandware Commerce Cloud collects, aggregates and anonymizes data providing customers the power to benchmark their performance in order to optimize their business results. |
| • | Development Center. Demandware Commerce Cloud offers the flexibility and control of a development environment based on a procedural language with the convenience, scalability and security of cloud, multi-tenant delivery. With Development Center, developers and IT professionals can focus on innovation rather than infrastructure. Developers can build, customize, test, debug, deploy, integrate and extend their digital commerce sites, all through the cloud. Our Development Center includes access to an extensive library of pre-built business processes and contains all the necessary tools to edit them. |
| • | Collaboration Center. We also leverage our Demandware Collaboration Center user community across our customer, partner ecosystem and employee base to help optimize the digital commerce environment and create a virtual community to collaborate on product design, release management and best practices. |
LINK Technology Integrations. Through LINK Technology partners, merchants and developers have access to an extensive library of integrations to third party applications. These applications include email marketing, campaign management, payment management, personalization, social commerce, tax applications and ratings and reviews. We support our partners in the development of their integrations and undertake an approval process to evaluate quality and compatibility before the integration is made available for downloading through Demandware LINK.
Retail Practice
We have developed a comprehensive customer success program as a key component of our engagement model, which is designed to enable our customers to achieve sustained customer revenue growth and is delivered within the context of a shared success business relationship. In this program, we assign to customers a customer success manager who works hand-in-hand with our customers’ executives to maximize the value of their investment. These customer success managers are focused on growing our customers’ revenue by taking full advantage of the marketing and merchandising features and functionality of Demandware Commerce Cloud and providing our customers with a deep understanding of industry practices in site design, merchandising, analytics, interactive marketing, personalization and multi-channel integration. In addition, these customer success managers work with our customers to implement complex digital commerce strategies including global expansion, multi-brand businesses and omni-channel operations.
We monitor customer satisfaction internally as part of formalized programs and at regular intervals during the customer lifecycle, including during the transition from sales to implementation, at the completion of an implementation project and on an on-going basis based on interactions with the account services team.
Client and Enablement Services
Our customer enablement methodology includes templates and processes to help project teams focus on the key tactical and strategic areas to maximize returns on our customers’ online investments and minimize business risk. Our customer enablement methodology guides our tactical process to successfully build and deploy a digital commerce site utilizing our Demandware Commerce Cloud. Our services include:
| • | Enablement services: Our services professionals work with customers to clearly define the goals of the project. We conduct a series of in-depth enablement sessions to educate our customers on our model, technology, methodology and approach to organizational planning. The enablement services include targeted education services and consulting programs to prepare customers with the tools and training needed to successfully execute their digital commerce strategy. |
| • | Partner alignment services: The substantial majority of our ecommerce implementations are led by LINK Solution Partners. We work with each of our customers to align the customer’s implementation |
14
| needs with the expertise in our growing LINK ecosystem of partners across technology, solutions and end-to-end solutions. We have programs for partner enablement and developer certification that support scaling the capacity to deliver quality implementations of our platform through our partner ecosystem. |
| • | Ongoing training services: We offer a broad range of training classes to educate individuals—digital commerce managers, web developers, application developers and IT professionals—who are part of our customers’ implementation, maintenance and optimization teams. |
| • | Support services: We offer support in multiple languages and through multiple channels, including global support coverage available 24 hours a day, seven days a week. |
We also offer customer support engineers who are experts in our products, industry technologies and platforms, making them a trusted resource for timely issue assessment and resolution. Periodic system maintenance and continual feature additions are also included in product support coverage, which is included in the subscription fee.
Customers
We have a wide variety of customers across several industries and geographies. As of December 31, 2014, we had 267 revenue generating ecommerce customers on the Demandware Commerce Cloud, up from 151 and 204 as of December 31, 2012 and 2013, respectively. Some of our customers have multiple sites reflecting several geographies and brands. As of December 31, 2014, there were 1,143 revenue generating sites on our platform, up from 579 and 820 as of December 31, 2012 and 2013, respectively.
Some of our significant customers for the year ended December 31, 2014 include the following, arranged alphabetically by category:
| Apparel and Footwear | Health & Beauty | |
| adidas Barneys New York Bestseller Brooks Brothers Carter’s Columbia Crocs Deckers House of Fraser Hugo Boss Kate Spade Lands’ End Limited Stores s.Oliver Saks Tory Burch
Home & Garden CPO Commerce Lumens Michael’s Stores Pier 1 Imports
General Merchandise ASDA Karstadt Procter & Gamble |
1-800 CONTACTS Bare Escentuals Guthy-Renker L’Oreal
Other Beats Electronics GODIVA Hallmark Hanover Direct Jewelry Television Jo-Ann Stores mothercare Motorola Mobility Otterbox Starbucks
Sporting Goods american golf Brooks Sports Burton Snowboards Pure Fishing |
15
Revenue from customers in apparel and footwear represented approximately 57% of our total revenue for the year ended December 31, 2014.
Sales and Marketing
We sell our cloud solutions primarily through our direct sales force, which includes field sales representatives, sales engineers, sales management, strategic sales executives, our retail practice customer success managers and account development representatives. Our direct sales force is organized by geographic region with an overlay sales team targeting large enterprise accounts. Our direct sales force targets primarily enterprise customers, larger retailers and branded manufacturers that seek to implement large or more advanced digital commerce merchandising platforms across multiple channels and geographies. Our sales cycle can vary substantially from customer to customer, but typically requires six to nine months depending on the size and complexity of the opportunity. It takes on average six months to implement and launch an initial digital commerce site for a new customer. In 2014, a substantial majority of our implementations were done by third party LINK Solution partners including companies like Accenture, Amblique, Be Excellent, BORN, Fluid, Itelios, Javelin, LiveAreaLabs, Lyons Group, MediaHive, MobizCorp, MODA Com and Sapient Nitro.
We also sell through selected LINK End-to-End partners, such as Accenture, arvato PFSweb and TradeGlobal, that combine our Demandware Commerce Cloud with a host of complementary services and technologies, such as logistics and warehousing, to provide a comprehensive suite of capabilities for digital commerce.
Our marketing efforts and lead generation activities consist primarily of customer referrals, internet advertising, telemarketing, e-mail marketing, social marketing, trade shows, industry events and press releases. Our marketing programs target our prospective customers’ digital commerce executives, senior business leaders and c-suite executives. We also host frequent conferences in which customers participate, including an annual global customer conference, and we present a variety of programs with our Demandware LINK ecosystem of partners designed to help accelerate cross-channel digital commerce success with our integrated platform.
Technology, Operations and Research and Development
Technology
Since inception, we have designed our solutions in a cloud architecture, which our customers can access through a standard web browser. Our technology platform has several key design elements:
| • | Scalability. The cloud architecture of the Demandware Commerce Cloud handles sudden spikes in traffic by allocating capacity. We proactively deliver updates and feature upgrades so our customers’ sites operate at peak efficiency. The Demandware Commerce Cloud allocates computing power to each digital commerce site as needed to minimize page load times. Our platform has been benchmarked to handle at least 1,400 dynamic page views per second. |
| • | Reliability. State-of-the-art data centers in North America, Europe and Asia ensure high performance and redundancy for our customer base. We support large transaction volumes and seasonal peaks in site traffic and have provided 99.99% average platform availability (excluding planned down time) since 2005. |
| • | Security. Our platform secures millions of transactions per year and has met the PCI-DSS Level 1 Service Provider set of comprehensive requirements for enhancing payment account data security. The PCI-DSS is a multi-faceted security standard that includes requirements for security management, policies, procedures, network architecture, software design and other critical protective measures. Our platform has been PCI-DSS-compliant since June 2007 and undergoes an annual assessment conducted by a PCI Council Qualified Security Assessor. In addition, we comply with SOC 2 Type II requirements and obtain a compliance report annually. |
16
| • | Ease of Deployment. Our customers run on a shared infrastructure, creating scalability and redundancy not possible with typical single-tenant providers. In a typical single-tenant environment, every new stack must be separately purchased, provisioned, managed, scaled and backed-up. In our multi-tenant architecture, we can quickly and easily create new environments for development, testing, staging, and production, thus delivering significant cost and time savings for our customers. |
| • | Flexibility. Our standards-based open framework allows our customers to develop, build, and integrate third party technologies. Our customers can innovate their site experience using the Eclipse-based open development environment and our UX Studio application to create a unique and relevant branded experience. Using a standards-based server-side scripting language, users can quickly create new logic to business processes, new custom objects, web services calls, integrations to back-end systems and XML data processing. In addition, our scalable open commerce APIs allow external web applications and enterprise software to interface with shopping functionality, which enables developers to create highly customized consumer experiences. |
| • | Extendibility. Our platform consists of multiprocessor nodes with large amounts of memory and network capacity, as well as digital commerce databases. The processor nodes are provisioned as web, application or database servers with dynamic isolated network connectivity only to other members in the particular merchant’s environment. In this way, a logical cluster is assembled with a variable number of processor nodes for web, application and database processing. Each merchant environment is logically isolated from all other merchant environments through multiple levels of security for network, port, processor, database and storage systems. Databases can hold product, consumer and order information. Our current data model can be extended by a configuration task performed through a web user interface and does not need a database administrator to manipulate the data model directly. |
Operations
We physically host our cloud infrastructure for our ecommerce customers in secure data center facilities located in North America, Europe and Asia. We contract for use of these data center facilities primarily from Equinix Operating Co., Sungard Availability Service, LP and NaviSite, Inc. We engineer and architect the actual computer, storage and network systems upon which our platform operates, which we call our grid computing points of delivery, or PODs, and deploy them to the data center facilities, which provide physical security, including staffed security, 24 hours a day, 365 days a year. We operate systems in 21 data centers around the globe for our ecommerce customers. The data center facilities also have biometric access controls, redundant power and environmental controls. We provide system security, including firewalls and encryption technology, and we conduct regular system tests and vulnerability assessments. In the event of a failure, we have engineered our computing grid with back-up and redundancy capabilities designed to provide for business continuity.
Research and Development
Our research and development organization is focused on developing new solutions and enhancing existing solutions, conducting software and quality assurance testing and improving our core technology. We continually enhance our existing software platform and develop new applications to meet our customers’ digital commerce needs. Our research and development organization is located primarily in our Burlington, Massachusetts headquarters. We also employ a team of engineers in our Jena, Germany; Cambridge, Massachusetts; Deerfield Beach, Florida and Salt Lake City, Utah offices.
Our development methodology, in combination with our on-demand delivery model, allows us to release new and enhanced software features multiple times a year. We patch our software on a regular basis. Based on feedback from our customers and prospects, we continually develop new merchandising functionality while enhancing and maintaining our existing solutions. We do not need to maintain multiple engineering teams to support different versions of the code because all of our ecommerce customers are running on the current version of our solutions.
17
Competition
The market for digital commerce software, services and solutions is intensely competitive, subject to rapid technological change and significantly affected by new product introductions and other market activities. We expect competition to persist and intensify in the future. Our primary sources of competition include:
| • | in-house development efforts by potential customers or their web consultants; |
| • | licensed application vendors, such as IBM, Oracle/ATG, eBay/Magento and SAP/hybris; |
| • | full-service ecommerce business process outsourcers, such as Digital River and eBay/GSI Commerce; and |
| • | providers of hosted on-demand subscription and SaaS services, such as MarketLive and Venda. |
We compete primarily on the basis of our robust set of merchandising capabilities and features, the reliability and scalability of our solutions, our speed of deployment, the customization of our platform, our continual innovation, our omni-channel capabilities, the extendibility of our Demandware Commerce Cloud and our strategy to deliver a unified commerce platform.
Our current and potential competitors may have significantly greater financial, technical, marketing and other resources than we do, and there is no assurance we will be able to continue to compete effectively.
Intellectual Property and Proprietary Rights
Our intellectual property and proprietary rights are important to our business. To safeguard them, we rely on a combination of patent, copyright, trade secret, trademark and other rights in the United States and other jurisdictions, as well as confidentiality procedures and contractual provisions to protect our proprietary technology, processes and other intellectual property. We have four issued U.S. patents. We have confidentiality and license agreements with employees, contractors, customers, resellers and other third parties, which limit access to and use of our proprietary information and software. Though we rely in part upon these legal and contractual protections, we believe that factors such as the skills and ingenuity of our employees and the functionality and frequent enhancements to our solutions are larger contributors to our success in the marketplace.
Despite our efforts to preserve and protect our intellectual property and proprietary rights, unauthorized third parties may attempt to copy, reverse engineer, or otherwise obtain portions of our solutions. Competitors may attempt to develop similar products that could compete in the same market as our products. Unauthorized disclosure of our confidential information by our employees or third parties could occur. Laws of other jurisdictions may not protect our intellectual property and proprietary rights from unauthorized use or disclosure in the same manner as the United States. The risk of unauthorized use of our proprietary and intellectual property rights may increase as our company continues to expand outside of the United States.
Third party infringement claims are also possible in our industry, especially as software functionality and features expand, evolve, and overlap with other industry segments. Third parties, including non-practicing patent holders, have from time to time claimed, and could claim in the future, that our customers’ sites infringe patents they now hold or might obtain or be issued in the future, and, in most cases, we have agreed to indemnify our customers against claims that our products infringe the intellectual property rights of third parties. We have also received direct claims from such third party entities alleging infringement. See “Risk Factors—We could incur substantial costs as a result of any claim of infringement of another party’s intellectual property rights.”
Seasonality
Our subscription revenue fluctuates as a result of seasonal variations in our business, principally due to our customers’ revenue peaks during the holiday season, which correspondingly results in higher subscription
18
revenue in the fourth quarter than in other quarters. As a result, we have historically had higher subscription revenue in our fourth quarter than other quarters in a given year. Revenue for the fourth quarter represented 32.2%, 34.3%, and 32.7% of our total revenue in 2012, 2013 and 2014, respectively.
Business Segment and Geographical Information
We operate in a single operating segment. For geographical financial information, see Note 2 to our consolidated financial statements, which are incorporated herein by reference.
Employees
At December 31, 2014, we had 590 employees, including 208 in sales and marketing and 159 in research and development. Except in France, none of our employees is represented by a labor union or covered by a collective bargaining agreement. We have never experienced a strike or similar work stoppage, and we believe that our relations with our employees are good. In January 2015, we acquired Tomax Corporation, or Tomax, which had a total of 175 employees as of January 12, 2015.
Recent Acquisition
On January 12, 2015, we acquired Tomax, an enterprise software company that provides an integrated solution for retail point of sale and store operations. Tomax provides enterprise retailers with a broad suite of solutions, including point of sale, retail back office and workforce management, and services, ranging from custom development, consulting, and implementation through application management and hosting. Tomax provides the core point of sale elements of an enterprise solution, including configurable business rules, robust and complex transaction management, returns, store inventory and store operations. Tomax also offers a next generation mobile point of sale and mobile store solution. In the near term, we are focused on the cloud point of sale technology and continuing to support and maintain existing Tomax customers. In addition, we are investing in developing and delivering a unified commerce platform that combines Tomax cloud point of sale with the Demandware Commerce Cloud.
Corporate Information
We were incorporated in Delaware in February 2004 as SSE Holding, Inc. and changed our name to Demandware, Inc. in August 2004. Our principal executive office is located at 5 Wall Street, Burlington, Massachusetts 01803 and our telephone number is (888) 553-9216.
Information Available on the Internet
We maintain an internet website at www.demandware.com. The information on our website is not incorporated by reference into this Annual Report on Form 10-K and should not be considered to be a part of this Annual Report on Form 10-K. Our website address is included in this Annual Report on Form 10-K as an inactive technical reference only. Our reports filed or furnished pursuant to Section 13(a) or 15(d) of the Exchange Act, including our Annual Reports on Form 10-K, our Quarterly Reports on Form 10-Q and our Current Reports on Form 8-K, and amendments to those reports, are accessible through our website, free of charge, as soon as reasonably practicable after these reports are filed electronically with, or otherwise furnished to, the SEC. We also make available on our website the charters of our audit committee, compensation committee and nominating and corporate governance committee, as well as our corporate governance guidelines and our code of business conduct and ethics. In addition, we intend to disclose on our website any amendments to, or waivers from, our code of business conduct and ethics that are required to be disclosed pursuant to the SEC rules.
19
| ITEM 1A. | RISK FACTORS |
The following risk factors could materially affect our business, consolidated financial condition and results of operations. The risks and uncertainties described below are those that we have identified as material, but are not the only risks and uncertainties we face. Our business is also subject to general risks and uncertainties that affect many other companies, including overall economic and industry conditions. Additional risks and uncertainties not currently known to us or that we currently believe are not material also may impair our business, consolidated financial condition and results of operations.
Risks Related to Our Business and Our Industry
We have had a history of losses, and we may be unable to achieve or sustain profitability.
We have experienced net losses in each year since our inception, except for the year ended December 31, 2010. We experienced net losses of $27.1 million, $18.0 million, and $4.3 million in 2014, 2013 and 2012, respectively. At December 31, 2014, our accumulated deficit was $112.5 million and total stockholders’ equity was $279.2 million. We expect to incur operating losses as a result of expenses associated with the continued development and expansion of our business. Our expenses include sales and marketing, research and development and other costs relating to the development, marketing and sale of our solutions and consulting services that may not generate revenue until later periods, if at all. Any failure to increase revenue or manage our cost structure as we implement initiatives to grow our business could prevent us from achieving or sustaining profitability. In addition, our ability to achieve profitability is subject to a number of the risks and uncertainties discussed below, many of which are beyond our control. We cannot be certain that we will be able to achieve or sustain profitability on a quarterly or annual basis.
Our limited operating history makes it difficult to evaluate our current business and future prospects.
We have been in existence since 2004, and much of our growth has occurred in recent periods. Our limited operating history may make it difficult for our stockholders to evaluate our current business and our future prospects. We have encountered and will continue to encounter risks and difficulties frequently experienced by growing companies in rapidly changing industries, including increasing and unforeseen expenses as we continue to grow our business. If we do not manage these risks successfully, our business will be harmed.
We depend on a limited number of customers for a substantial portion of our revenue. The loss of a key customer or the significant reduction of business from one of our largest customers could significantly reduce our revenue.
We have derived, and we believe that we will continue to derive, a substantial portion of our revenue from a limited number of customers. For example, for the year ended December 31, 2014, our ten largest customers by revenue accounted for an aggregate of approximately 24% of our revenue. If we were to lose one or more of our key customers, there is no assurance that we would be able to replace such customers with new customers that generate comparable revenue, which would materially adversely affect our financial condition and results of operations. Our operating results for the foreseeable future will continue to depend on our ability to sell our digital commerce solutions to a limited number of prospective customers. Any revenue growth will depend on our success in growing our customers’ revenue processed on our Demandware Commerce Cloud, increasing sales and usage of our other solutions and expanding our customer base to include additional customers.
Our business is subject to security risks, including security breaches.
Our business involves the storage and transmission of our customers’ and our customers’ consumers’ proprietary information, including financial information, such as payment card information, and other personally identifiable information. Certain prominent retail companies have disclosed breaches of their security resulting from sophisticated and highly targeted attacks on portions of their websites or in-store infrastructure. Because the
20
techniques used to obtain unauthorized access, disable, deny, disrupt, destroy or degrade services or systems change frequently and often are not recognized until launched against a target, we may be unable to anticipate these techniques or to implement adequate preventative measures. Our systems are vulnerable to computer viruses or other malware, physical or electronic break-ins and similar disruptions, and certain of our customers have experienced “denial-of-service” type attacks that have, in certain instances, made all or portions of such customers’ websites unavailable for periods of time. In addition, consumers have been and will continue to be targeted by parties using fraudulent “spoof” and “phishing” emails that may lead to the misappropriation of user names, passwords, payment card numbers, or other sensitive information or to the introduction of computer viruses or other malware to users’ computers. Credentials stolen through such means can provide hackers with access to our or our customers’ network or point of sale devices. Data security breaches may also result from non-technical means, such as, malicious actions by a disgruntled employee or former employee or contractor.
We rely on encryption and authentication technology from third parties to provide the security and authentication to effectively secure transmission of confidential information, including consumer payment card numbers. Such technology may not be sufficient to protect the transmission of such confidential information or these technologies may have material defects that may compromise the confidentiality or integrity of the transmitted data. In addition, advances in computer capabilities, new discoveries in the field of cryptography or other developments may result in the technology used by us to protect transaction data being breached or compromised. A party that is able to circumvent our security measures or the security measures of our third party vendors could misappropriate our, our customers’ or our customers’ consumers’ proprietary and financial information, cause interruption in our operations, damage our computers or those of our customers or our customers’ consumers, alter sensitive information or system configurations, or otherwise damage our reputation.
Security breaches and related malicious acts could cause us to incur substantial costs and liability claims from our customers and encounter loss of customer confidence, which could materially adversely affect our reputation and results of operations or cause material harm to our business. If an actual or perceived breach of our security occurs, public perception of the effectiveness of our security measures could be harmed resulting in damage to our reputation and loss of current or prospective customers. There may be vulnerabilities in our systems that result in significant threats that we cannot mitigate. Such vulnerabilities may lead to sustained heightened exposure to breach or may require us to disable services for an extended period of time. Also any compromise of our security could result in a violation of applicable privacy and other laws, trigger disclosure obligations, and expose us to significant legal and financial exposure. Further, we may need to expend significant resources to protect against security breaches or to address problems caused by breaches. These issues may become more difficult and costly and the risks associated with security breaches may become more significant as we continue to expand our operations into brick and mortar stores with, for example, our point of sale solutions, and the services and features that we provide to our customers. Our insurance policies coverage limits may not be adequate to reimburse us for losses caused by security breaches.
If we fail to manage our cloud network infrastructure capacity, our existing customers may experience service outages and our new customers may experience delays in the deployment of our digital commerce solutions.
We have experienced significant growth in the number of users, transactions and data that our cloud network infrastructure supports. We seek to maintain sufficient excess capacity in our cloud network infrastructure to meet the needs of all of our customers. We also seek to maintain excess capacity to facilitate the rapid provision of new customer deployments and the expansion of existing customer deployments, as well as redundancy for customer deployments. However, the provision of new cloud network infrastructure requires significant lead time. If we do not accurately predict our infrastructure capacity requirements, particularly for the fourth quarter when we might experience significant increases in traffic on our customers’ digital commerce sites, our customers could experience service outages that may subject us to financial penalties and financial liabilities and result in customer losses. If our cloud network infrastructure capacity fails to keep pace with increased sales and customer expansion, customers may experience delays as we seek to obtain additional capacity, which could harm our reputation and adversely affect our revenue growth.
21
We use a limited number of data centers to deliver our services. Any disruption of service at these facilities could harm our business.
We manage our services and serve our customers from a limited number of third party data center facilities. While we engineer and architect the actual computer and storage systems upon which our platform runs, which we call our grid computing points of delivery, or PODs, and deploy them to the data center facilities, we do not control the operation of these data center facilities.
The owners of the data facilities have no obligation to renew their agreements with us on commercially reasonable terms, or at all. If we are unable to renew these agreements on commercially reasonable terms, we may be required to transfer to new data center facilities, and we may incur significant costs and possible service interruption in connection with doing so.
Any changes in third party service levels at the data centers or any security breaches, errors, defects, disruptions or other performance problems with our services could harm our reputation and may damage our customers’ businesses. Interruptions in our services might reduce our revenue, cause us to issue credits to customers, subject us to potential liability, and cause customers to terminate their subscriptions or harm our renewal rates.
The data centers are vulnerable to damage or interruption from human error, intentional bad acts, earthquakes, hurricanes, floods, fires, war, terrorist attacks, labor strikes, health epidemic, power losses, hardware failures, systems failures, telecommunications failures and similar events. At least one of the data facilities is located in an area known for seismic activity, increasing our susceptibility to the risk that an earthquake could significantly harm the operations of these facilities. The occurrence of a natural disaster or an act of terrorism, vandalism or other misconduct, a decision to close the facilities without adequate notice or other unanticipated problems could result in lengthy interruptions in our services.
We recognize ecommerce revenue from customer subscriptions over the term of the subscription agreement and, therefore, a significant downturn in our business may not be immediately reflected in our operating results.
We recognize ecommerce revenue from our customers’ subscription agreements monthly over the terms of these agreements, which is typically three years. As a result, a significant portion of the revenue we report in each quarter is generated from customer agreements entered into during previous periods. Consequently, a decline in new or renewed subscriptions in any one quarter may not impact our financial performance in that quarter, but might negatively affect our ecommerce revenue in future quarters. If a number of contracts expire and are not renewed in the same quarter, our revenue may decline significantly in that quarter and subsequent quarters. In addition, we may be unable to adjust our fixed costs in response to reduced revenue. Accordingly, the effect of significant declines in sales or renewals and market acceptance of our solutions may not be reflected in our short-term results of operations.
Our business is substantially dependent upon the continued growth of the market for cloud software solutions.
We derive, and expect to continue to derive, substantially all of our revenue from the sale of our cloud digital commerce solutions. As a result, widespread acceptance and use of the cloud business model, including in our expansion of our operations into brick and mortar stores with, for example, our point of sale solutions, is critical to our future growth and success. Under the perpetual or periodic license model for software procurement, users of the software would typically run the applications on their hardware. Because many companies are generally predisposed to maintaining control of their IT systems and infrastructure, there may be resistance to the concept of accessing software functionality as a service provided by a third party. In addition, the market for cloud software solutions is still evolving, and competitive dynamics may cause pricing levels to change, as the market matures and as existing and new market participants introduce new types of solutions and
22
different approaches to enable organizations to address their digital commerce needs. As a result, we may be forced to reduce the prices we charge for our solutions and may be unable to renew existing customer agreements or enter into new customer agreements at the same prices and upon the same terms as we have historically. If the market for cloud software solutions fails to grow, grows more slowly than we currently anticipate or evolves and forces us to reduce the prices we charge for our solutions, demand for our solutions and our revenue, gross margin and other operating results could be materially adversely affected.
We rely on a variable pricing model for ecommerce customers and any change in that model could adversely affect our financial results.
We have adopted a variable pricing model by which we generally participate in a share of our ecommerce customers’ gross revenue processed on our platform. This pricing model aligns our interests with those of our ecommerce customers and requires us to expand our processing and support infrastructure as activity on our customers’ digital commerce sites increases. If ecommerce customers were to demand a fixed pricing model that did not provide for variability based on their level of usage of our Demandware Commerce Cloud, our financial results could be adversely affected.
Our lengthy sales and implementation cycles make it difficult to predict our future revenue and causes variability in our operating results.
Our sales cycle can vary substantially from customer to customer, but typically requires six to nine months depending on the size and complexity of the opportunity. It takes on average six months to implement and launch an initial digital commerce site for a new customer. A number of factors influence the length and variability of our sales and implementation cycles, including, for example:
| • | the need to educate potential customers about the uses and benefits of our solutions; |
| • | the relatively long duration of the commitment customers make in their agreements with us; |
| • | the discretionary nature of potential customers’ purchasing and budget cycles and decisions; |
| • | the competitive nature of potential customers’ evaluation and purchasing processes; |
| • | evolving digital commerce needs and functionality demands of potential customers; |
| • | announcements or planned introductions of new products by us or our competitors; |
| • | lengthy purchasing approval processes of potential customers; |
| • | the complexity of the implementations and integrations with customer and third party systems; and |
| • | implementation by system integrators of the substantial majority of our new customers. |
In addition, as we target more sales efforts at larger enterprise customers, we may face greater costs, longer sales cycles and less predictability in completing some of our sales. The customer’s decision to use our service may be an enterprise-wide decision and, if so, these types of sales would require us to provide greater levels of education regarding the use and benefits of our solutions.
Lengthy sales and implementation cycles make it difficult to predict the quarter in which revenue from a new customer may first be recognized. Further, our potential customers frequently need to obtain approvals from multiple decision makers before making purchase decisions. Delays in our sales or implementation cycles could cause significant variability in our revenue and operating results for any particular period.
23
If we are unable to retain our existing customers, our revenue and results of operations would be adversely affected.
We recognize ecommerce revenue from our customers’ subscription agreements monthly over the terms of these agreements, which is typically three years. Our customers have no obligation to renew their subscriptions after their subscription period expires, and these subscriptions may not be renewed on the same or on more profitable terms. As a result, our ability to grow depends in part on subscription renewals. We may not be able to accurately predict future trends in customer renewals, and our customers’ renewal rates may decline or fluctuate because of several factors, including their dissatisfaction with our services, the cost of our services and the cost of services offered by our competitors and reductions in our customers’ spending levels. If our customers do not renew their subscriptions for our services or renew on less favorable terms, our revenue may grow more slowly than expected or decline, and our profitability and gross margins may be harmed.
Our business and operations have experienced rapid growth and organizational change in recent periods, which has placed, and may continue to place, significant demands on our management and infrastructure. If we fail to manage our growth effectively, we may be unable to execute our business plan, maintain high levels of service or address competitive challenges adequately.
Our growth, both organic and by acquisition, has placed, and may continue to place, a significant strain on our managerial, administrative, operational, financial and other resources. We intend to further expand our overall business, customer base, headcount and operations both domestically and internationally, with no assurance that our business or revenue will continue to grow. Creating a global organization, integrating acquired businesses and solutions and managing a geographically dispersed workforce requires substantial management effort, the allocation of valuable management resources and significant additional investment in our infrastructure. We are required to continue to improve our operational, financial and management controls and our reporting procedures and we may not be able to do so effectively. As such, we may be unable to manage our expenses effectively in the future, which may negatively impact our gross margins or operating expenses in any particular quarter. If we fail to manage our growth and change in a manner that preserves the key aspects of our corporate culture, the quality of our solutions may suffer, which could negatively affect our brand and reputation and harm our ability to retain and attract customers.
Failure to effectively maintain and expand our direct sales and customer management teams and develop and expand our sales channels for all of our solutions will impede our growth.
We will need to continue to expand our sales and marketing infrastructure in order to grow our customer base and our business and to renew and expand with existing customers across all of our solutions, some of which we have little experience in selling. Identifying, recruiting and training these sales and marketing personnel will require significant time, expense and attention. Our business will be seriously harmed and our financial resources will be wasted if our efforts to expand our sales channels do not generate a corresponding increase in revenue. In particular, if we are unable to hire, develop and retain talented sales personnel or if our new direct sales personnel are unable to achieve expected productivity levels in a reasonable period of time, we may not be able to significantly increase our revenue and grow our business.
The seasonality of our business creates variance in our quarterly revenue.
Our customers are retailers and branded manufacturers that typically realize a significant portion of their sales in the fourth quarter of each calendar year, specifically during the holiday season. As a result of this seasonal variation, our ecommerce subscription revenue fluctuates, with additional fees in excess of committed annual levels, called overage fees, being higher in the fourth quarter than in other quarters and with revenue generally declining in the first quarter sequentially from the fourth quarter.
24
We are dependent upon consumers’ willingness to use the internet for commerce.
Our success depends upon the general public’s continued willingness to use the internet, whether through a computer, smart phone, tablet or other internet-enabled device, as a means to purchase goods, communicate, and conduct and research commercial transactions. If consumers became unwilling or less willing to use the internet for commerce for any reason, including lack of access to high-speed communications equipment, congestion of traffic on the internet, internet outages or delays, disruptions or other damage to users’ computers, smart phones, tablets or other internet enabled-devices, increases in the cost of accessing the internet and security and privacy risks or the perception of such risks, our business could be materially adversely affected.
Even if demand for digital commerce solutions increases generally, demand for cloud solutions like ours may not increase to a corresponding degree.
For our customers and potential customers to be willing to invest in our digital commerce solutions, the internet must continue to be accepted and widely used for commerce and communication and physical and digital commerce must continue to converge. If digital commerce does not grow or grows more slowly than expected, then our future revenue and profits may not meet our expectations or those of analysts. The widespread adoption of our solutions depends not only on strong demand for digital commerce products and services generally, but also for products and services delivered via a cloud business model in particular. Many companies continue to rely primarily or exclusively on traditional means of commerce that are not internet-based and may be reluctant to change their patterns of commerce. Even if such companies do adopt digital commerce solutions, it is unclear whether they will desire digital commerce solutions like ours. As a result, we cannot assure our stockholders that our cloud digital commerce solutions will achieve and sustain the high level of market acceptance that is critical for the future success of our business.
If we fail to develop our brand cost effectively, our business may suffer.
We believe that developing and maintaining awareness of our brand in a cost-effective manner is critical to achieving widespread acceptance of our existing and future solutions and is an important element in attracting new customers. Furthermore, we believe that the importance of brand recognition will increase as competition in our market increases. Successful promotion of our brand will depend largely on the effectiveness of our marketing efforts and on our ability to provide reliable and useful services at competitive prices. In the past, our efforts to build our brand have involved significant expenses. Brand promotion activities may not yield increased revenue, and even if they do, any increased revenue may not offset the expenses we incurred in building our brand. If we fail to successfully promote and maintain our brand, or incur substantial expenses in an unsuccessful attempt to promote and maintain our brand, we may fail to attract enough new customers or retain our existing customers to the extent necessary to realize a sufficient return on our brand-building efforts, and our business could suffer.
We may not be able to compete successfully against current and future competitors.
We face intense competition in the market for digital commerce applications and services, and we expect competition to intensify in the future. We have competitors with longer operating histories, larger customer bases and greater financial, technical, marketing and other resources than we do. Increased competition may result in reduced pricing for our solutions, longer sales cycles or a decrease of our market share, any of which could negatively affect our revenue and future operating results and our ability to grow our business.
A number of competitive factors could cause us to lose potential sales or to sell our solutions at lower prices or at reduced margins, including, among others:
| • | current and potential customers may choose to develop digital commerce applications in-house, rather than paying for our solutions; |
25
| • | some of our current and potential competitors have greater financial, marketing and technical resources than we do, allowing them to leverage a larger installed customer base and distribution network, adopt more aggressive pricing policies and offer more attractive sales terms, adapt more quickly to new technologies and changes in customer requirements, and devote greater resources to the promotion and sale of their products and services than we can; |
| • | current and potential competitors have established or may establish cooperative relationships among themselves or with third parties to enhance their products and expand their markets, and consolidation in our industry is likely to intensify. Accordingly, new competitors or alliances among competitors may emerge and rapidly acquire significant market share; |
| • | current and potential competitors may offer software that addresses one, or a limited number, of digital commerce functions at a lower price point or with greater depth than our solutions; and |
| • | software vendors could bundle digital commerce solutions or offer such products at a lower price as part of a larger product sale. |
We cannot ensure that we will be able to compete successfully against current and future competitors. In addition, competition may intensify as our competitors enter into business combinations or alliances or raise additional capital and established companies in other market segments or geographic markets expand into our market segments or geographic markets. If we cannot compete successfully against our competitors, our business, results of operations and financial condition could be negatively impacted.
Mergers of or other strategic transactions by our competitors or our customers could weaken our competitive position or reduce our revenue.
If one or more of our competitors were to merge or partner with another of our competitors, the change in the competitive landscape could adversely affect our ability to compete effectively. Our competitors may also establish or strengthen cooperative relationships with our current or future strategic resellers, systems integrators, third party consulting firms or other parties with whom we or our customers or prospects have relationships, thereby limiting our ability to promote our solutions and limiting the number of consultants available to implement our solutions. In addition, we have lost and may continue to lose customers that merge with or are acquired by companies using a competitor’s or an internally developed solution. Disruptions in our business caused by these events could reduce our revenue.
Our growth depends in part on the success of our strategic relationships with third parties.
We anticipate that we will continue to depend on various third party relationships in order to grow our business. We intend to pursue additional relationships with other third parties, such as technology and content providers and implementation consultants. Identifying, negotiating and documenting relationships with third parties require significant time and resources as does integrating third party content and technology. Some of the third parties that sell our solutions have the direct contractual relationships with our ultimate end-user customers, and therefore we risk the loss of such customers if the third parties fail to perform their obligations. If the performance of our third party partners is not well received by our customers, our brand and reputation could be negatively affected. Our agreements with resellers and providers of technology, content and consulting services are typically non-exclusive, do not prohibit them from working with our competitors or from offering competing services and may not have minimum purchase commitments. Our competitors may be effective in providing incentives to third parties to favor their products or services or to prevent or reduce subscriptions to our solutions. In addition, these resellers and providers may not perform as expected under our agreements, and we have had, and may in the future have, disagreements or disputes with such resellers and providers, which could negatively affect our brand and reputation. A global economic slowdown could also adversely affect the businesses of our resellers, and it is possible that they may not be able to devote the resources we expect to the relationship.
26
If we are unsuccessful in establishing or maintaining our relationships with certain of these third parties, our ability to compete in the marketplace or to grow our revenue could be impaired and our operating results would suffer. Even if we are successful, we cannot assure our stockholders that these relationships will result in improved operating results.
We could incur substantial costs as a result of any claim of infringement of another party’s intellectual property rights.
In recent years, there has been significant litigation in the United States involving patents and other intellectual property rights. Companies providing digital commerce solutions and services are increasingly bringing and becoming subject to suits alleging infringement of proprietary rights, particularly patent rights. These risks have been amplified by the increase in third parties, which we refer to as non-practicing entities, whose sole primary business is to assert such claims. We could incur substantial costs in prosecuting or defending any intellectual property litigation. If we sue to enforce our rights or are sued by a third party that claims that our technology infringes its rights, the litigation could be expensive and could divert our management resources.
We have received direct demands from, or been sued by, certain non-practicing entities claiming infringement of patents owned by them. In addition, in most instances, we have agreed to indemnify our customers against certain claims that our products infringe the intellectual property rights of third parties. We have received indemnification requests from many customers that have received letters from, or been sued by, non-practicing entities claiming infringement of patents owned by them. Many of those underlying claims, and the extent, if any, of our indemnification obligations, have not yet been resolved. Some of these patents are the subject of pending legal proceedings between the patent owners and one or more major companies engaged in digital commerce, and the outcome of those proceedings could affect the extent to which the patent owners seek to prosecute claims against us or our customers. Also, because the patent owners have asserted the same patents against multiple customers, an adverse resolution in the case of one customer could lead to adverse resolutions in the cases of other customers and such claims could potentially lead to greater exposure for us than for any single customer. Our business could be adversely affected by any significant disputes between us and our customers as to the applicability or scope of our indemnification obligations to them. The results of any intellectual property litigation to which we are or might become a party, or for which we are required to provide indemnification, may require us to do one or more of the following:
| • | cease selling, providing or using products or services that incorporate the challenged intellectual property; |
| • | make substantial payments for legal fees, settlement payments or other costs or damages; |
| • | obtain a license, which may not be available on reasonable terms, to sell, provide or use the relevant technology; or |
| • | redesign those products or services to avoid infringement. |
If we are required to make substantial payments or undertake any of the other actions noted above as a result of any intellectual property infringement claims against us or any obligation to indemnify our customers for such claims, such payments or costs could have a material adverse effect upon our business and financial results.
We could incur substantial costs in protecting our intellectual property from infringement, and any failure to protect our intellectual property could impair our business.
We seek to protect the source code for our proprietary software under a combination of patent, copyright and trade secrets laws. However, because we make portions of the source code available to some customers, subcontractors and partners, third parties may be more likely to misappropriate it. Our policy is to enter into confidentiality agreements with our employees, partners, consultants, vendors and customers and to control
27
access to our software, documentation and other proprietary information. Despite these precautions, it may be possible for someone to copy our software or other proprietary information without authorization or to develop similar software independently.
Despite our efforts to protect our proprietary rights, unauthorized parties may attempt to copy aspects of our products or to obtain and use information that we regard as proprietary. Policing unauthorized use of our products is difficult, and while we are unable to determine the extent to which piracy of our software exists, we expect software piracy to be a persistent problem. Litigation may be necessary in the future to enforce our intellectual property rights, to protect our trade secrets, to determine the validity and scope of the proprietary rights of others or to defend against claims of infringement or invalidity. Such litigation could be costly, time-consuming and distracting to management, result in a diversion of resources, the impairment or loss of portions of our intellectual property and have a material adverse effect on our business, operating results and financial condition. Furthermore, our efforts to enforce our intellectual property rights may be met with defenses, counterclaims and countersuits attacking the validity and enforceability of our intellectual property rights. These steps may be inadequate to protect our intellectual property. We will not be able to protect our intellectual property if we are unable to enforce our rights or if we do not detect unauthorized use of our intellectual property. Despite our precautions, it may be possible for unauthorized third parties to copy our products and use information that we regard as proprietary to create products and services that compete with ours. Some license provisions protecting against unauthorized use, copying, transfer and disclosure of our licensed products may be unenforceable under the laws of certain jurisdictions and foreign countries. Further, the laws of some countries do not protect proprietary rights to the same extent as the laws of the United States. To the extent we expand our international activities, our exposure to unauthorized copying and use of our products and proprietary information may increase.
There can be no assurance that our means of protecting our proprietary rights will be adequate or that our competitors will not independently develop similar technology. If we fail to meaningfully protect our intellectual property, then our business, brand, operating results and financial condition could be materially harmed.
If our software products contain serious errors or defects, then we may lose revenue and market acceptance and may incur costs to defend or settle product liability or contract claims.
Complex software applications such as ours often contain errors or defects, particularly when first introduced or when new versions or enhancements are released. Despite internal testing and testing by our customers and partners, our current and future products may contain serious defects, which could result in lost revenue or a delay in market acceptance.
Since our customers use our products for critical business applications, namely ecommerce, order management, predictive intelligence and point of sale, errors, defects or other performance problems could result in damage to our customers. They could seek significant compensation from us for the losses they suffer. Although our customer agreements typically contain provisions designed to limit our exposure to product liability claims, existing or future laws or unfavorable judicial decisions could negate these limitations. Even if not successful, a product liability claim brought against us would likely be time-consuming and costly and could seriously damage our reputation in the marketplace, making it harder for us to sell our products and to renew our contracts with customers.
Government and industry regulation of the internet is evolving and could directly restrict our business or indirectly affect our business by limiting the growth of digital commerce. Unfavorable changes in government regulation or our failure to comply with regulations could harm our business and operating results.
As digital commerce evolves, federal, state and foreign agencies have adopted and could in the future adopt regulations covering issues such as user privacy, content, data protection and breach notification and taxation of products and services. Government regulations could limit the market for our products and services or impose
28
burdensome requirements that render our business unprofitable. Our digital commerce solutions enable our customers to collect, manage and store a wide range of consumer data. The United States and various state governments have adopted or proposed limitations on the collection, distribution and use of personal information. Several foreign jurisdictions, including member states of the European Union, have adopted legislation (including directives or regulations) that increase or change the requirements governing data collection and storage in these jurisdictions. If our privacy or data security measures fail to comply with current or future laws and regulations, we may be subject to litigation, regulatory investigations or other liabilities, or our customers may terminate their relationships with us.
In addition, although many regulations might not apply to our business directly, we expect that laws regulating the solicitation, collection or processing of personal and consumer information could affect our customers’ ability to use and share data, potentially reducing demand for our services. The Telecommunications Act of 1996 prohibits certain types of information and content from being transmitted over the internet. In addition, although substantial portions of the Communications Decency Act of 1996 were held to be unconstitutional, we cannot be certain that similar legislation will not be enacted and upheld in the future. It is possible that legislation could expose companies involved in digital commerce to liability, which could limit the growth of digital commerce generally. Legislation like the Telecommunications Act and the Communications Decency Act could dampen the growth in web usage and decrease its acceptance as a medium of communications and commerce. Moreover, if future laws and regulations limit our customers’ ability to use and share consumer data or our ability to store, process and share data with our customers over the internet, demand for our solutions could decrease, our costs could increase, and our results of operations and financial condition could be harmed.
In addition, taxation of services provided over the internet or other charges imposed by government agencies or by private organizations for accessing the internet may also be imposed. Any regulation imposing greater fees for internet use or restricting information exchange over the internet could result in a decline in the use of the internet and the viability of internet-based services, which could harm our business and operating results.
We may not be able to respond to rapid technological changes with new solutions, which could have a material adverse effect on our sales and profitability.
The digital commerce market is characterized by rapid technological change, frequent new product and service introductions and evolving industry standards. Our ability to attract new customers and increase revenue from existing customers will depend in large part on our ability to enhance and improve our existing solutions and those we acquire, introduce new solutions and sell into new markets. To achieve market acceptance for our solutions, we must effectively anticipate and offer solutions that meet changing customer demands in a timely manner. Customers may require features and capabilities that our current solutions do not have. If we fail to develop solutions that satisfy customer preferences in a timely and cost-effective manner, our ability to renew our contracts with existing customers and our ability to create or increase demand for our solutions will be harmed.
We may experience difficulties with software development, industry standards, design, manufacturing or marketing that could delay or prevent our development, introduction or implementation of new solutions and enhancements. The introduction of new solutions by competitors, the emergence of new industry standards or the development of entirely new technologies to replace existing offerings could render our existing or future solutions obsolete.
If we are unable to successfully develop or acquire new digital commerce capabilities and functionality, enhance our existing solutions to anticipate and meet customer preferences or sell our solutions into new markets, our revenue and results of operations would be adversely affected.
29
Our long-term success depends, in part, on our ability to expand the sales of our digital commerce solutions to customers located outside of the United States, and thus our business is susceptible to risks associated with international sales and operations.
Outside of the United States, we currently maintain offices and/or have sales personnel in Australia, Austria, Canada, China, Denmark, France, Germany, Hong Kong, India, Japan, the Netherlands, South Korea and the United Kingdom, and we intend to expand our international operations. In addition, we own 75% of a joint venture in Japan. Any international expansion efforts that we may undertake may not be successful. In addition, conducting international operations in new markets subjects us to new risks that we have not generally faced in the United States. These risks include:
| • | localization of our solutions, including translation into foreign languages and adaptation for regulatory requirements and local practices, such as the local practice in China for consumers to purchase through discount channels like TMall.com rather than directly from the retailer, which could limit our revenue growth in that market; |
| • | lack of familiarity with and burdens of complying with foreign laws and legal practices, such as privacy, data protection and indemnification laws, legal standards, contracting processes, regulatory requirements, tariffs, and other barriers; |
| • | unexpected changes in regulatory requirements, taxes, trade laws, tariffs, export quotas, custom duties or other trade restrictions; |
| • | difficulties in managing systems integrators and technology partners; |
| • | differing technology standards; |
| • | longer accounts receivable payment cycles and difficulties in collecting accounts receivable; |
| • | difficulties in managing and staffing international operations and differing employer/employee relationships; |
| • | fluctuations in exchange rates that may increase the volatility of our foreign based revenue; |
| • | potentially adverse tax consequences, including the complexities of foreign value added tax (or other tax) systems and restrictions on the repatriation of earnings; |
| • | the greater potential for corruption and bribery; |
| • | uncertain political and economic climates; and |
| • | reduced or varied protection for intellectual property rights in some countries. |
These factors may cause our international costs of doing business to exceed our comparable domestic costs. Operating in international markets also requires significant management attention and financial resources. Any negative impact from our international business efforts could negatively impact our business, results of operations and financial condition as a whole.
We are subject to governmental export and import controls that could impair our ability to compete in international markets due to licensing requirements and subject us to liability if we are not in full compliance with applicable laws.
Our solutions are subject to export controls, including the Commerce Department’s Export Administration Regulations and various economic and trade sanctions regulations established by the Treasury Department’s Office of Foreign Assets Control, and exports of our solutions must be made in compliance with these laws. If we fail to comply with these U.S. export control laws and import laws, including U.S. Customs regulations, we and certain of our employees could be subject to substantial civil or criminal penalties, including the possible loss of export or import privileges; fines, which may be imposed on us and responsible employees or managers; and, in
30
extreme cases, the incarceration of responsible employees or managers. In addition, if our resellers fail to obtain appropriate import, export or re-export licenses or authorizations, we may also be adversely affected through reputational harm and penalties. Obtaining the necessary authorizations, including any required license, for a particular sale may be time-consuming, is not guaranteed and may result in the delay or loss of sales opportunities. Furthermore, the U.S. export control laws and economic sanctions laws prohibit the shipment of certain products and services to U.S. embargoed or sanctioned countries, governments and persons. Even though we take precautions to prevent our solutions from being shipped or provided to U.S. sanctions targets, our solutions and services could be shipped to those targets or provided by our resellers despite such precautions. Any such shipment could have negative consequences, including government investigations, penalties and reputational harm. In addition, various countries regulate the import of certain encryption technology, including through import permitting/licensing requirements, and have enacted laws that could limit our ability to distribute our solutions or could limit our customers’ ability to implement our solutions in those countries. Changes in our solutions or changes in export and import regulations may create delays in the introduction and sale of our solutions in international markets, prevent our customers with international operations from deploying our solutions or, in some cases, prevent the export or import of our solutions to certain countries, governments or persons altogether. Any change in export or import regulations, economic sanctions or related laws, shift in the enforcement or scope of existing regulations, or change in the countries, governments, persons or technologies targeted by such regulations, could result in decreased use of our solutions, or in our decreased ability to export or sell our solutions to existing or potential customers with international operations. Any decreased use of our solutions or limitation on our ability to export or sell our solutions would likely adversely affect our business, financial condition and results of operations.
Our use of “open source” software could negatively affect our ability to sell our services and subject us to possible litigation.
A portion of the technologies licensed by us incorporate so-called “open source” software, and we may incorporate open source software in the future. Such open source software is generally licensed by its authors or other third parties under open source licenses. If we fail to comply with these licenses, we may be subject to certain conditions, including requirements that we offer our solutions that incorporate the open source software for no cost, that we make available source code for modifications or derivative works we create based upon, incorporating or using the open source software and/or that we license such modifications or derivative works under the terms of the particular open source license. If an author or other third party that distributes such open source software were to allege that we had not complied with the conditions of one or more of these licenses, we could be required to incur significant legal expenses defending against such allegations and could be subject to significant damages, enjoined from the sale of our solutions that contain the open source software and required to comply with the conditions described above, which could disrupt the distribution and sale of some of our solutions. In addition, there have been claims challenging the ownership of open source software against companies that incorporate open source software into their products. As a result, we could be subject to suits by parties claiming ownership of what we believe to be open source software. Litigation could be costly for us to defend, have a negative effect on our operating results and financial condition or require us to devote additional research and development resources to change our products.
We rely on third party software, including server software and licenses from third parties to use patented intellectual property that is required for the delivery of our solutions, which may be difficult to obtain or which could cause errors or failures of our solutions.
We rely on software licensed from or hosted by third parties to offer our solutions. In addition, we may need to obtain future licenses from third parties to use intellectual property associated with the development of our solutions, which might not be available to us on acceptable terms, or at all. Any loss of the right to use any software required for the development and maintenance of our solutions could result in delays in the provision of our solutions until equivalent technology is either developed by us, or, if available, is identified, obtained and integrated, which could harm our business. Any errors or defects in third party software could result in errors or a failure of our solutions which could harm our business.
31
We have identified a material weakness in our internal control over financial reporting.
In connection with a reevaluation of our revenue recognition policy for implementation services, and as discussed in Item 9A, “Controls and Procedures,” of this Annual Report on Form 10-K, we have identified a control deficiency relating to the application of generally accepted accounting principles to revenue recognition of implementation services. Management has concluded that this control deficiency constituted a material weakness in internal control over financial reporting as of December 31, 2014. A “material weakness in internal control over financial reporting” is one or more deficiencies in process that create a reasonable possibility that a material misstatement of a company’s annual or interim financial statements will not be prevented or detected on a timely basis. The deficiency in the application of our controls relating to our revenue recognition policy for implementation services resulted in a reasonable possibility that a material misstatement of our financial statements would not have been prevented or detected by us in the normal course of our financial statement close process.
We have discussed the identified control deficiency in our financial reporting and the remediation of such deficiency with the audit committee of our board of directors and will continue to do so as necessary. While we have taken steps to remediate this deficiency, we cannot be certain that the remedial measures that we have taken will ensure that we maintain adequate controls over our financial reporting in the future and, accordingly, additional material weaknesses could occur or be identified. Any future deficiencies could materially and adversely affect our ability to provide timely and accurate financial information, and the current and future deficiencies may impact investors’ confidence in our internal controls and our company, which could cause our stock price to decline.
We have expanded, and may expand in the future, by acquiring or investing in other companies, which may divert our management’s attention, result in additional dilution to our stockholders and consume resources that are necessary to sustain our business.
Our business strategy has included, and may include in the future, acquiring complementary services, solutions, technologies or businesses. We also have entered into, and may enter into in the future, relationships with other businesses to expand our service offerings or our ability to provide service in foreign jurisdictions, which could involve preferred or exclusive licenses, additional channels of distribution, discount pricing or investments in other companies. Negotiating these transactions can be time-consuming, difficult and expensive, and our ability to close these transactions may often be subject to conditions or approvals that are beyond our control. Consequently, these transactions, even if undertaken and announced, may not close.
Current or future acquisitions, investments or new business relationships, such as our joint venture in Japan, may result in unforeseen operating difficulties and expenditures. In particular, we may encounter difficulties assimilating or integrating the businesses, technologies, products, personnel or operations of the acquired companies, particularly if the key personnel of the acquired company choose not to work for us, the company’s software is not easily adapted to work with ours or we have difficulty retaining the customers or partners of any acquired business due to changes in management or otherwise. With the three companies that we acquired in 2014 and early 2015, we are spending significant time and attention in transitioning to a company with multiple products with varied pricing, contracting and technology models, which may divert our sales and marketing resources. Acquisitions may also disrupt our business, divert our resources and require significant management attention that would otherwise be available for development of our business. Moreover, the anticipated benefits of any acquisition, investment or business relationship may not be realized or we may be exposed to unknown liabilities. In the future, for one or more of those transactions, we may:
| • | issue additional equity securities that would dilute our stockholders; |
| • | use cash that we may need in the future to operate our business; |
| • | incur debt on terms unfavorable to us or that we are unable to repay; |
32
| • | incur large charges or substantial liabilities, including potential write-offs of acquired assets or investments; |
| • | encounter difficulties retaining key employees of the acquired company or integrating diverse software codes or business cultures; |
| • | encounter difficulties implementing controls, procedures and policies at the acquired company; and |
| • | become subject to adverse tax consequences, substantial depreciation or deferred compensation charges. |
Any of these risks could harm our business and operating results.
The loss of key personnel or an inability to attract and retain highly skilled personnel may impair our ability to grow our business.
We are highly dependent upon the continued service and performance of our senior management team and key technical and sales personnel, such as our president and chief executive officer, our chief financial officer, our chief operating officer, our chief technology officer and our chief legal officer. These and other key employees may terminate employment with us at any time with no advance notice. The replacement of any key employee likely would involve significant time and costs, and the loss of any key employee may significantly delay or prevent the achievement of our business objectives.
We face intense competition for qualified individuals from numerous technology and software companies. For example, our competitors may be able to attract and retain a more qualified engineering team by offering more competitive compensation packages. If we are unable to attract new engineers and retain our current engineers, we may not be able to develop and maintain our services at the same levels as our competitors and we may, therefore, lose potential and existing customers and sales penetration in certain markets. Our failure to attract and retain suitably qualified individuals could have an adverse effect on our ability to implement our business plan and, as a result, our ability to compete would decrease, our operating results would suffer and our revenue would decrease. In addition, if any of our key employees joins a competitor or decides to otherwise compete with us, we may experience a material disruption of our operations and development plans, which may cause us to lose customers or increase operating expenses as the attention of our remaining senior managers is diverted to recruit replacements for the departed key employees.
Fluctuations in the exchange rate of foreign currencies could result in currency transactions losses.
We currently have foreign sales denominated in Euros, British Pounds Sterling, Chinese Yuan Renminbi and Australian and Canadian dollars and may, in the future, have sales denominated in other foreign currencies. In addition, we incur a portion of our operating expenses in Euros, British Pounds Sterling and, to a lesser extent, other foreign currencies. Any fluctuation in the exchange rate of these foreign currencies may negatively impact our business, financial condition and operating results. Starting in December 2014, we began entering into foreign currency forward contracts to hedge against foreign currency fluctuations on the value of our monetary assets and liabilities denominated in Euros and British Pounds Sterling. These foreign currency forward contracts have maturities of approximately one month. We use these contracts to reduce our risk associated with exchange rate movements, as the gains or losses on these contracts are intended to offset any exchange rate losses or gains on the hedged transaction. These foreign currency forward contracts may not be able to hedge effectively due to lack of experience, unreasonable costs or illiquid markets and are not expected to fully mitigate the potential currency transaction losses resulted from foreign currency exchange rate fluctuations.
33
Conditions in the global economy, the markets we serve and the financial markets may adversely affect our business and financial statements.
Our business is sensitive to general economic conditions and since 2008 the effects of the global financial crisis have adversely impacted the global economy. Slower global economic growth, the credit market crisis and European debt crisis, uncertainty relating to the Euro, high levels of unemployment globally, reduced levels of capital expenditures, changes in government fiscal and monetary policies, government deficit reduction and budget negotiation dynamics, sequestration, other austerity measures and other challenges affecting the global economy adversely affect us and our customers, including having the effect of:
| • | reducing demand for our products and services, limiting the financing available to our customers, and resulting in longer sales cycles and slower adoption of new technologies; |
| • | increasing the difficulty in collecting accounts receivable; |
| • | increasing price competition in our served markets; |
| • | increasing the risk that we could be required to record charges relating to restructuring costs or the impairment of assets; and |
| • | increasing the risk that counterparties to our contractual arrangements will become insolvent or otherwise unable to fulfill their contractual obligations which, in addition to increasing the risks identified above, could result in preference actions against us. |
Improvement in the global economy remains uneven and uncertain. If slower growth in the global economy or in any of the markets we serve continues for a significant period, if there is significant deterioration in the global economy or such markets or if improvements in the global economy do not benefit the markets we serve, our business and financial statements could be adversely affected.
Our investment portfolio may become impaired by deterioration of the capital markets.
Our cash equivalent and short-term investment portfolio as of December 31, 2014 consisted primarily of money market funds, certificates of deposit, municipal securities, U.S. government agency bonds and corporate bonds. We follow an established investment policy and set of guidelines to monitor and help mitigate our exposure to interest rate and credit risk. The policy sets forth credit quality standards and limits our exposure to any one issuer, as well as our maximum exposure to various asset classes. Should financial market conditions worsen in the future, investments in some financial instruments may pose risks arising from market liquidity and credit concerns. In addition, any deterioration of the capital markets could cause our other income and expense to vary from expectations. As of December 31, 2014, we had no material impairment charges associated with our short-term investment portfolio, and although we believe our current investment portfolio has little risk of material impairment, we cannot predict future market conditions or market liquidity, or credit availability, and can provide no assurance that our investment portfolio will remain materially unimpaired.
If the accounting estimates we make, and the assumptions on which we rely, in preparing our financial statements prove inaccurate, our actual results may be adversely affected.
Our financial statements have been prepared in accordance with accounting principles generally accepted in the United States of America. The preparation of these financial statements requires us to make estimates and judgments about, among other things, taxes, revenue recognition, stock-based compensation costs, investments, contingent obligations, allowance for doubtful accounts, intangible assets and restructuring charges. These estimates and judgments affect the reported amounts of our assets, liabilities, revenues and expenses, the amounts of charges accrued by us, and related disclosure of contingent assets and liabilities. We base our estimates on historical experience and on various other assumptions that we believe to be reasonable under the circumstances and at the time they are made. If our estimates or the assumptions underlying them are not correct, actual results may differ materially from our estimates and we may need to, among other things, accrue additional charges that
34
could adversely affect our results of operations, which in turn could adversely affect our stock price. In addition, new accounting pronouncements and interpretations of accounting pronouncements have occurred and may occur in the future that could adversely affect our reported financial results.
Risks Related to Tax Matters
We are a multinational organization faced with increasingly complex tax issues in many jurisdictions, and we could be obligated to pay additional taxes in various jurisdictions.
As a multinational organization, we are subject to taxation in several jurisdictions around the world with increasingly complex tax laws, the application of which can be uncertain. The amount of taxes we pay in these jurisdictions could increase substantially as a result of changes in the applicable tax laws, including increased tax rates or revised interpretations of existing tax laws and precedents, which could have a material adverse effect on our liquidity and results of operations. In addition, the authorities in these jurisdictions could review our tax returns and impose additional tax, interest and penalties, and the authorities could claim that various withholding requirements apply to us or our subsidiaries or assert that benefits of tax treaties are not available to us or our subsidiaries, any of which could have a material impact on us and the results of our operations.
Taxing authorities could reallocate our taxable income among our subsidiaries, which could increase our consolidated tax liability.
We conduct global operations through subsidiaries in various tax jurisdictions pursuant to transfer pricing arrangements among our affiliated entities. If two or more affiliated companies are located in different countries, the tax laws or regulations of each country generally require that transfer prices be the same as those between unrelated companies dealing at arms’ length and that contemporaneous documentation is maintained to support the transfer prices. While we believe that we operate in compliance with applicable transfer pricing laws and intend to continue to do so, our transfer pricing procedures are not binding on applicable tax authorities. If tax authorities in any of these countries were to successfully challenge our transfer prices as not reflecting arms’ length transactions, they could require us to adjust our transfer prices and thereby reallocate our income to reflect these revised transfer prices, which could result in a higher tax liability to us. In addition, if the country from which the income is reallocated does not agree with the reallocation, both countries could tax the same income, resulting in double taxation. If tax authorities were to allocate income to a higher tax jurisdiction, subject our income to double taxation or assess interest and penalties, it would increase our consolidated tax liability, which could adversely affect our financial condition, results of operations and cash flows.
Our ability to use net operating loss carryforwards to reduce future tax payments may be limited if we experience a change in ownership, or if taxable income does not reach sufficient levels.
Under Section 382 of the Internal Revenue Code of 1986, as amended, if a corporation undergoes an “ownership change” (generally defined as a greater than 50% change (by value) in its equity ownership over a three year period), the corporation’s ability to use its pre-change net operating loss carryforwards and other pre-change tax attributes (such as research tax credits) to offset its post-change income may be limited. We may experience ownership changes in the future and subsequent shifts in our stock ownership. As a result, we may be limited in the portion of net operating loss carryforwards that we can use in the future to offset taxable income for U.S. Federal income tax purposes.
Risks Related To Our Common Stock
The trading price of our common stock may be volatile.
The trading price of our common stock has at times been volatile and could continue to be subject to significant fluctuations in response to various factors, some of which are beyond our control. In addition, the stock market in general, and the market for technology companies in particular, has experienced extreme price
35
and volume fluctuations that have often been unrelated or disproportionate to the operating performance of the companies operating in such markets. The market price of our common stock may be similarly volatile, and investors in our common stock may experience a decrease in the value of their shares, including as a result of factors unrelated to our operating performance and prospects. The price of our common stock could be subject to wide fluctuations in response to a number of factors, including:
| • | our operating performance and the performance of other similar companies; |
| • | the overall performance of the equity markets; |
| • | developments with respect to intellectual property rights; |
| • | publication of unfavorable research reports about us or our industry or withdrawal of research coverage by securities analysts; |
| • | speculation in the press or investment community; |
| • | the size of our public float; |
| • | natural disasters or terrorist acts; |
| • | announcements by us or our competitors of significant contracts, new technologies, acquisitions, commercial relationships, joint ventures or capital commitments; and |
| • | global economic, legal and regulatory factors unrelated to our performance. |
If securities or industry analysts cease publishing research or reports about us, our business or our market, or if they publish negative evaluations of our stock, the price of our stock and trading volume could decline.
The trading market for our common stock depends in part on the research and reports that securities or industry analysts publish about us or our business. If one or more of the analysts who covers us downgrades our stock or publishes incorrect or unfavorable research about our business, our stock price would likely decline. In addition, if one or more of these analysts ceases coverage of our company or fails to publish reports on us regularly, demand for our stock could decrease, which could cause our stock price or trading volume to decline.
The issuance of additional stock in connection with acquisitions, our stock incentive plans or otherwise will dilute all other stockholdings.
Our certificate of incorporation authorizes us to issue up to 240,000,000 shares of common stock and up to 10,000,000 shares of preferred stock with such rights and preferences as may be determined by our board of directors. Subject to compliance with applicable rules and regulations, we may issue all of these shares that are not already outstanding without any action or approval by our stockholders. We intend to continue to evaluate strategic acquisitions in the future. We may pay for such acquisitions, partly or in full, through the issuance of additional equity. Any issuance of shares in connection with our acquisitions, the exercise of stock options, the vesting of restricted stock or restricted stock units or otherwise would dilute the percentage ownership held by existing investors.
We do not expect to declare any dividends in the foreseeable future.
We do not anticipate declaring any cash dividends to holders of our common stock in the foreseeable future. In addition, any future financing agreements may prohibit us from paying any type of dividends. Consequently, investors may need to sell all or part of their holdings of our common stock after price appreciation, which may never occur, as the only way to realize any future gains on their investment. Investors seeking cash dividends should not purchase our common stock.
36
Anti-takeover provisions in our charter documents and Delaware law may delay or prevent an acquisition of our company.
Our certificate of incorporation, bylaws and Delaware law contain provisions that may have the effect of delaying or preventing a change in control of us or changes in our management. Our certificate of incorporation and bylaws include provisions that:
| • | establish a classified board of directors with staggered three-year terms so that not all members of our board are elected at one time; |
| • | provide that directors may be removed by stockholders only for cause; |
| • | limit the ability of our stockholders to call and bring business before special meetings and to take action by written consent in lieu of a meeting; |
| • | require advance notice of stockholder proposals for business to be conducted at meetings of our stockholders and for nominations of candidates for election to our board of directors; |
| • | authorize blank check preferred stock, which could be issued with voting, liquidation, dividend and other rights superior to our common stock; and |
| • | limit the liability of, and providing indemnification to, our directors and officers. |
As a Delaware corporation, we are also subject to provisions of Delaware law, including Section 203 of the Delaware General Corporation Law, which prevents some stockholders holding more than 15% of our outstanding common stock from engaging in certain business combinations without approval of the holders of substantially all of our outstanding common stock. Any provision of our amended and restated certificate of incorporation or amended and restated by-laws or Delaware law that has the effect of delaying or deterring a change in control could limit the opportunity for our stockholders to receive a premium for their shares of our common stock, and could also affect the price that some investors are willing to pay for our common stock.
The existence of the foregoing provisions and anti-takeover measures could limit the price that investors might be willing to pay in the future for shares of our common stock. They could also deter potential acquirers of our company, thereby reducing the likelihood that our stockholders could receive a premium for their common stock in an acquisition.
37
| ITEM 1B. | UNRESOLVED STAFF COMMENTS |
Not applicable.
| ITEM 2. | PROPERTIES |
Our principal offices are located in Burlington, Massachusetts where we occupy approximately 116,650 square feet of office space under three operating leases, one of which covers approximately 32,000 square feet of office space and expires in July 2017, one of which covers approximately 75,000 square feet of office space and expires in October 2019 and the other of which covers approximately 9,650 square feet of office space and expires in October 2019. In addition, we have offices in Deerfield Beach, Florida; Cambridge, Massachusetts and Salt Lake City, Utah. We also have offices in Berlin, Jena and Munich, Germany; London, England; Amsterdam, Netherlands; Lyngby, Denmark; Paris, France; Sydney, Australia; Shanghai, China; Hong Kong; Seoul, South Korea; Tokyo, Japan and Bangalore, India to support our operations. We believe that our facilities are adequate for our current needs and that suitable additional or substitute space will be available as needed to accommodate planned expansion of our operations.
| ITEM 3. | LEGAL PROCEEDINGS |
From time to time, we are subject to various legal proceedings that arise in the normal course of our business activities. In addition, from time to time, third parties may assert intellectual property infringement claims against us or our customers in the form of lawsuits, letters and other forms of communication. As of the date of this Annual Report on Form 10-K, we are not a party to any litigation the outcome of which, if determined adversely to us, would individually or in the aggregate be reasonably expected to have a material adverse effect on our results of operations, prospects, cash flows, financial position or brand.
| ITEM 4. | MINE SAFETY DISCLOSURES |
Not applicable.
38
| ITEM 5. | MARKET FOR REGISTRANT’S COMMON EQUITY, RELATED STOCKHOLDER MATTERS, AND ISSUER PURCHASES OF EQUITY SECURITIES |
Market for Our Common Stock and Related Stockholder Matters
Our common stock is traded on the New York Stock Exchange under the symbol “DWRE”. The following table sets forth for the periods indicated the high and low sales prices for our common stock as reported on the New York Stock Exchange.
| Fiscal 2013 | Fiscal 2014 | |||||||||||||||
| High | Low | High | Low | |||||||||||||
| First Quarter |
$ | 33.89 | $ | 23.90 | $ | 82.23 | $ | 58.96 | ||||||||
| Second Quarter |
42.49 | 24.64 | 70.68 | 44.39 | ||||||||||||
| Third Quarter |
49.11 | 41.22 | 71.61 | 49.36 | ||||||||||||
| Fourth Quarter |
65.17 | 43.99 | 64.86 | 47.30 | ||||||||||||
Holders of Record
As of January 31, 2015 there were 214 stockholders of record of our common stock. Because many of our shares of common stock are held of record by brokers and other institutions on behalf of stockholders, we are unable to estimate the total number of stockholders represented by such record holders.
Dividend Policy
We have never declared or paid, and do not anticipate declaring or paying, any cash dividends on our common stock. Any future determination as to the declaration and payment of dividends will be at the discretion of our board of directors and will depend on then-existing conditions, including our financial condition, operating results, contractual restrictions, capital requirements, business prospects and other factors our board of directors may deem relevant.
39
STOCK PRICE PERFORMANCE GRAPH
The following performance graph and related information shall not be deemed “soliciting material” or “filed” for purposes of Section 18 of the Securities Exchange Act of 1934, as amended, or the Exchange Act, or incorporated by reference into any filing of Demandware, Inc. under the Securities Act of 1933, as amended, or the Exchange Act, except to the extent we specifically incorporate it by reference in such filing.
The following comparative stock performance graph compares the cumulative total stockholder return on our common stock from March 15, 2012 through December 31, 2014 with the cumulative total return of the Russell 2000 Index and the NASDAQ Computer Index over the same period, assuming the investment of $100 in our common stock and in both of the other indices on March 15, 2012 and the reinvestment of all dividends, if any.
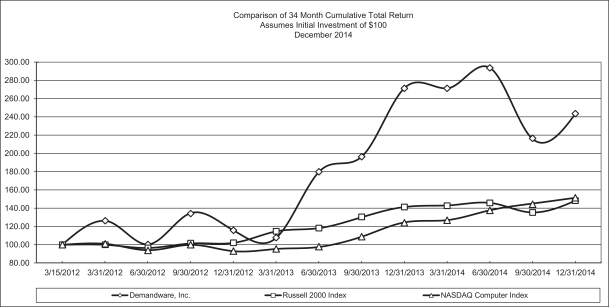
| 3/15/2012 | 3/31/2012 | 6/30/2012 | 9/30/2012 | 12/31/2012 | 3/31/2013 | 6/30/2013 | 9/30/2013 | 12/31/2013 | 3/31/2014 | 6/30/2014 | 9/30/2014 | 12/31/2014 | ||||||||||||||||||||||||||||||||||||||||
| Demandware, Inc. |
$ | 100.00 | $ | 126.32 | $ | 100.42 | $ | 134.59 | $ | 115.81 | $ | 107.46 | $ | 179.78 | $ | 196.40 | $ | 271.81 | $ | 271.56 | $ | 294.07 | $ | 215.85 | $ | 243.92 | ||||||||||||||||||||||||||
| Russell 2000 Index |
$ | 100.00 | $ | 99.95 | $ | 96.48 | $ | 101.55 | $ | 101.97 | $ | 114.61 | $ | 118.14 | $ | 130.20 | $ | 141.56 | $ | 143.15 | $ | 146.08 | $ | 135.33 | $ | 148.49 | ||||||||||||||||||||||||||
| NASDAQ Computer Index |
$ | 100.00 | $ | 101.06 | $ | 93.96 | $ | 99.98 | $ | 92.97 | $ | 95.40 | $ | 97.59 | $ | 108.85 | $ | 124.66 | $ | 127.06 | $ | 137.89 | $ | 145.22 | $ | 151.71 | ||||||||||||||||||||||||||
The comparisons shown in the graph are based upon historical data. The stock price performance reflected on the graph below is not necessarily indicative of future price performance. See the disclosure in Part I, Item 1A. “Risk Factors.”
Recent Sales of Unregistered Securities
None.
Use of Proceeds
In March 2012, we completed our initial public offering, or IPO, pursuant to a registration statement on Form S-1 (File No. 333-175595), which the SEC declared effective on March 14, 2012. In the IPO, we issued and sold 6,325,000 shares of common stock, including 825,000 shares of common stock sold pursuant to the underwriters’ option to purchase additional shares, at a public offering price of $16.00 per share, for aggregate
40
gross proceeds to us of $101.2 million. The net offering proceeds to us, after deducting underwriting discounts and offering expenses, were approximately $90.8 million. No offering expenses were paid directly or indirectly to any of our directors or officers (or their associates) or persons owning ten percent or more of any class of our equity securities or to any other affiliates.
In November 2013, we completed a follow-on offering in which we sold 3,310,098 shares of our common stock, including shares of certain shareholders who sold 810,098 shares of our common stock, at a price of $57.00 per share. In December 2013, we sold an additional 496,515 shares of our common stock pursuant to the underwriters’ option to purchase additional shares, at a price of $57.00 per share. We received proceeds from the public offering of $163.1 million net of underwriting discounts and commissions, but before offering expenses of $0.5 million. We received no proceeds from the sale of our common stock by the selling shareholders.
From the effective date of the registration statement through December 31, 2014, we have spent approximately $40.9 million of the net proceeds from the IPO, which have been used in part to fund the acquisitions of Mainstreet Commerce LC and CQuotient, Inc. No offering expenses or net proceeds were paid directly or indirectly to any of our directors or officers (or their associates) or persons owning ten percent or more of any class of our equity securities or to any other affiliates.
Issuer Purchases of Equity Securities
During the three months ended December 31, 2014, we did not repurchase any equity securities, other than withholding of an aggregate of 2,454 shares of common stock at an average price paid per share of $56.00 from employees to satisfy minimum tax withholding obligations relating to the vesting of restricted stock awards. These shares were not withheld pursuant to a publicly announced plan or program to repurchase stock.
| ITEM 6. | SELECTED FINANCIAL DATA |
The consolidated statements of operations data for the years ended December 31, 2014, 2013 and 2012 and the consolidated balance sheet data at December 31, 2014 and 2013 are derived from our audited consolidated financial statements appearing elsewhere in this Annual Report on Form 10-K. The consolidated statements of operations data for the years ended December 31, 2011 and 2010 and the consolidated balance sheet data at December 31, 2012, 2011 and 2010 are derived from our audited consolidated financial statements that are not included in this Annual Report on Form 10-K.
Prior period amounts have been revised to reflect corrections of immaterial errors due to a revision of our revenue recognition policy for implementation services. See Note 1 to the notes to our consolidated financial
41
statements included elsewhere in this Annual Report on Form 10-K for a description of these items and the impact of the corrections on our financial statements for the prior periods.
| Year Ended December 31, | ||||||||||||||||||||
| 2014 | 2013 | 2012 | 2011 | 2010 | ||||||||||||||||
| (As revised) | (As revised) | (As revised) | ||||||||||||||||||
| (in thousands, except per share data) | ||||||||||||||||||||
| Consolidated Statements of Operations Data: |
||||||||||||||||||||
| Revenue: |
||||||||||||||||||||
| Subscription |
$ | 145,879 | $ | 95,733 | $ | 67,930 | $ | 47,219 | $ | 28,714 | ||||||||||
| Services |
14,674 | 10,881 | 15,347 | 14,731 | 7,976 | |||||||||||||||
|
|
|
|
|
|
|
|
|
|
|
|||||||||||
| Total revenue |
160,553 | 106,614 | 83,277 | 61,950 | 36,690 | |||||||||||||||
| Cost of revenue: |
||||||||||||||||||||
| Subscription |
26,933 | 17,157 | 13,015 | 9,511 | 6,222 | |||||||||||||||
| Services |
15,115 | 10,860 | 11,326 | 10,196 | 8,282 | |||||||||||||||
|
|
|
|
|
|
|
|
|
|
|
|||||||||||
| Total cost of revenue |
42,048 | 28,017 | 24,341 | 19,707 | 14,504 | |||||||||||||||
|
|
|
|
|
|
|
|
|
|
|
|||||||||||
| Gross profit |
118,505 | 78,597 | 58,936 | 42,243 | 22,186 | |||||||||||||||
| Operating expenses: |
||||||||||||||||||||
| Sales and marketing |
74,432 | 52,384 | 33,496 | 19,847 | 10,883 | |||||||||||||||
| Research and development |
34,983 | 20,787 | 15,085 | 11,182 | 6,091 | |||||||||||||||
| General and administrative |
36,882 | 23,337 | 13,712 | 6,567 | 4,179 | |||||||||||||||
|
|
|
|
|
|
|
|
|
|
|
|||||||||||
| Total operating expenses |
146,297 | 96,508 | 62,293 | 37,596 | 21,153 | |||||||||||||||
|
|
|
|
|
|
|
|
|
|
|
|||||||||||
| (Loss) income from operations |
(27,792 | ) | (17,911 | ) | (3,357 | ) | 4,647 | 1,033 | ||||||||||||
| Other (expense) income, net |
(1,318 | ) | 483 | (544 | ) | (443 | ) | (582 | ) | |||||||||||
|
|
|
|
|
|
|
|
|
|
|
|||||||||||
| (Loss) income before provision for income taxes |
(29,110 | ) | (17,428 | ) | (3,901 | ) | 4,204 | 451 | ||||||||||||
| Income taxes (benefit) expense |
(2,050 | ) | 574 | 421 | 212 | 142 | ||||||||||||||
|
|
|
|
|
|
|
|
|
|
|
|||||||||||
| Net (loss) income |
$ | (27,060 | ) | $ | (18,002 | ) | $ | (4,322 | ) | $ | 3,992 | $ | 309 | |||||||
| Net loss attributable to noncontrolling interest |
7 | — | — | — | — | |||||||||||||||
| Net (loss) income attributable to Demandware |
$ | (27,053 | ) | $ | (18,002 | ) | $ | (4,322 | ) | $ | 3,992 | $ | 309 | |||||||
| Accretion on redeemable preferred stock |
— | — | (1,172 | ) | (5,274 | ) | (5,106 | ) | ||||||||||||
|
|
|
|
|
|
|
|
|
|
|
|||||||||||
| Net loss attributable to Demandware common stockholders |
$ | (27,053 | ) | $ | (18,002 | ) | $ | (5,494 | ) | $ | (1,282 | ) | $ | (4,797 | ) | |||||
|
|
|
|
|
|
|
|
|
|
|
|||||||||||
| Net loss per share attributable to common stockholders, basic and diluted |
$ | (0.78 | ) | $ | (0.58 | ) | $ | (0.23 | ) | $ | (0.34 | ) | $ | (2.44 | ) | |||||
|
|
|
|
|
|
|
|
|
|
|
|||||||||||
| Weighted average common shares outstanding, basic and diluted |
34,806 | 30,795 | 24,063 | 3,823 | 1,967 | |||||||||||||||
|
|
|
|
|
|
|
|
|
|
|
|||||||||||
| As of December 31, | ||||||||||||||||||||
| 2014 | 2013 | 2012 | 2011 | 2010 | ||||||||||||||||
| (As revised) | (As revised) | (As revised) | ||||||||||||||||||
| (in thousands) | ||||||||||||||||||||
| Consolidated Balance Sheet Data: |
||||||||||||||||||||
| Cash and cash equivalents |
$ | 158,827 | $ | 242,425 | $ | 58,877 | $ | 14,939 | $ | 17,148 | ||||||||||
| Working capital |
243,179 | 270,548 | 104,933 | 9,077 | 7,516 | |||||||||||||||
| Total assets |
345,170 | 323,931 | 139,328 | 42,886 | 37,028 | |||||||||||||||
| Notes payable |
— | 1,524 | 2,353 | 1,882 | 1,821 | |||||||||||||||
| Deferred revenue |
12,168 | 8,108 | 7,350 | 7,158 | 10,851 | |||||||||||||||
| Redeemable noncontrolling interests |
823 | — | — | — | — | |||||||||||||||
| Total preferred stock |
— | — | — | 87,603 | 82,329 | |||||||||||||||
| Total stockholders’ equity (deficit) |
279,222 | 271,688 | 103,795 | (79,217 | ) | (81,114 | ) | |||||||||||||
42
| ITEM 7. | MANAGEMENT’S DISCUSSION AND ANALYSIS OF FINANCIAL CONDITION AND RESULTS OF OPERATIONS |
The following discussion of our financial condition and results of operations should be read together with the financial statements and the related notes set forth in Item 8. “Financial Statements and Supplementary Data.” The following discussion also contains forward-looking statements that involve a number of risks and uncertainties. See Part I, “Special Note Regarding Forward-Looking Statements” for a discussion of the forward-looking statements contained below and Part I, Item 1A. “Risk Factors” for a discussion of certain risks that could cause our actual results to differ materially from the results anticipated in such forward-looking statements.
Overview
We are a leading provider of enterprise-class cloud digital commerce solutions, which includes ecommerce, order management and predictive intelligence applications, for retailers and branded manufacturers. Our solution, Demandware Commerce, is a combination of our cloud platform, community and related services that enables customers to establish and execute complex digital commerce strategies. These strategies include global expansion, multi-brand, multi-site rollouts, omni-channel and in-store operations as well as single platform, or unified commerce platform, strategies. The foundation of our solution is our technology platform, the Demandware Commerce Cloud. Through our highly scalable, secure and open Demandware Commerce Cloud, our customers create seamless brand experiences to reach their consumers across all digital touch points globally, including ecommerce sites, mobile applications, in-store solutions and point of sale.
We sell subscriptions to our cloud software and related services through both a direct sales force and indirect channels. Our current customers consist of retailers and branded manufacturers that operate principally in the following vertical markets: apparel and footwear, health and beauty, home and garden, sporting goods, general merchandise and other categories.
We were incorporated in 2004, and initially focused on building our cloud architecture and merchandising applications to allow us to service our customers. The market opportunity for our solutions has increased significantly in the last several years, due both to increased acceptance of software as a service, or SaaS, or cloud solutions across large enterprises and to greater recognition of the benefits of our solutions, which include enhanced merchandising functionality, high reliability, safety and security, ease of deployment, reduced time-to-market, flexible site customization, omni-channel distribution capabilities and availability of continual software innovation. From December 31, 2010 to December 31, 2014, the number of ecommerce customers using the Demandware Commerce Cloud increased from 69 to 267, a 40.3% compound annual growth rate, or CAGR, and the number of sites operating on our platform increased from 215 to 1,143, a 51.8% CAGR.
We derive most of our revenue from subscriptions to our platform, which includes ecommerce, order management and predictive intelligence subscriptions, and related services for our offerings. Subscription fees for our ecommerce customers are generally based on a revenue share pricing model, in which our customers pay us a percentage of their total gross revenue that is processed on our platform. As part of their subscription fee for our ecommerce offering, our customers commit to a minimum level of gross revenue to be processed on our platform, from which a monthly, quarterly or annual, non-refundable minimum subscription fee is derived. If a customer processes more gross revenue than its committed minimum level, then the customer is required to pay us additional fees, called overage fees, which are calculated as a percentage of the incremental revenue generated above the committed revenue. While we typically record overage fees each quarter, a significant portion of these fees is recorded in the fourth quarter. No refunds or credits are given if a customer processes less gross revenue than the contracted level. Ecommerce customer contracts are generally non-cancellable for a minimum term that is approximately three years and range up to seven years. Our order management and predictive intelligence subscriptions are typically based on a per transaction or volume fee, which is common pricing for those solutions.
43
Subscription revenue accounted for 81.6%, 89.8%, and 90.9% of our total revenue during the years ended December 31, 2012, 2013 and 2014, respectively. Subscription revenue is driven primarily by the number of ecommerce customers we have, the number of ecommerce sites they operate on our platform, the contracted minimum value of their subscription agreements and the gross revenue generated from our ecommerce customers in excess of their committed minimum levels. To date, revenue generated by our customers’ ecommerce sites has been the primary driver of our subscription revenue. However, we believe that our omni-channel capabilities, including mobile, in-store, social, order management, predictive intelligence, point of sale and other digital channels, have been and will continue to be important factors in our new customers’ purchasing decisions and existing customer renewals. In addition, we have plans to deliver a unified commerce platform in the cloud that combines point of sale and ecommerce functionalities.
Our revenue growth has been driven by an increased number of customers, as well as an increase in our average subscription revenue per customer. We have increased the number of ecommerce customers operating on our platform from 69 as of December 31, 2010 to 267 as of December 31, 2014. In addition, our average revenue per customer has continued to increase as our customers grow their online revenue processed on our platform through organic revenue growth of existing sites and the launching of new sites in new geographies for new brands or new channels. The number of sites that our customers operate on our platform increased from 215 as of December 31, 2010 to 1,143 as of December 31, 2014.
Our subscription revenue fluctuates as a result of seasonal variations in our business, principally due to our customers’ revenue peaks during the holiday season, which correspondingly result in higher overage fees in the fourth quarter than in other quarters. As a result, revenue in the first quarter generally declines sequentially from the fourth quarter. For the quarter ended March 31, 2014, subscription revenue was 10.6% lower than subscription revenue for the quarter ended December 31, 2013.
We derive our services revenue from the implementation of our customers’ digital commerce sites, which includes the integration of complementary technologies and adaptation to back-end systems and/or business processes and the configuration and deployment of the site. We also provide training services for individuals who are part of the implementation, maintenance and optimization teams of our customers. In general, it takes on average six months to implement a new customer site on our platform. Incremental sites for a customer, including for additional brands or geographies, can be implemented in less than one month.
Deferred revenue primarily consists of the unearned portion of billed subscription and services fees. Once a customer’s subscription period has commenced, we typically invoice the customer on a monthly or quarterly basis. In addition, we often invoice all or a portion of the first year subscription fee in advance upon customer contract execution as an initiation payment. Initiation payments are included in deferred revenue upon payment. For these reasons, our deferred revenue balance does not serve as a reliable indicator of our future subscription revenue.
Our cost of revenue and operating expenses have increased in absolute dollars over the last year due to our need to increase bandwidth and capacity to support customer revenue growth on our platform. We expect that our cost of revenue and operating expenses will continue to increase in absolute dollars as we continue to invest in our growth.
We believe the large and growing market for cloud digital commerce solutions will provide us with significant growth opportunities. As digital commerce transactions continue to account for a greater proportion of all retail sales and the brick and mortar store and ecommerce channels continue to converge, we believe that retailers and branded manufacturers will continue to enhance the performance and functionality of their digital commerce sites, increase their number of sites and expand their online presence to encompass multiple digital channels such as in-store digital solutions or will increasingly adopt a unified commerce strategy for a single platform. Just as companies have increasingly chosen cloud solutions as an attractive alternative to costly and inflexible on-premise solutions for their enterprise-wide applications, we believe that retailers and branded manufacturers will increasingly adopt cloud solutions for their digital commerce needs.
44
We are focused on growing our business by pursuing the significant market opportunity for cloud digital commerce solutions. We plan to grow our revenue by adding new customers and helping our existing customers increase their revenue processed on our platform by taking full advantage of the functionality of Demandware Commerce, by increasing the number of sites deployed by them and by extending their online presence across multiple channels, including mobile applications, social networks, call centers and in-store applications, including point of sale, as well as for a unified commerce platform. We also plan to expand our customer base to include industry sectors, customer segments and geographic regions beyond those which we currently serve.
During 2014, we completed the acquisitions of Mainstreet Commerce LC, or Mainstreet, and CQuotient, Inc., or CQuotient. The acquisitions were not material, individually or in the aggregate, to our consolidated financial results. On January 12, 2015, we acquired Tomax Corporation, or Tomax, an enterprise software company that provides an integrated solution for retail point of sale and store operations. Tomax provides enterprise retailers with a broad suite of solutions, including point of sale, retail back office and workforce management, and services, ranging from custom development, consulting, and implementation through application management and hosting. Tomax provides the core point of sale elements of an enterprise solution, including configurable business rules, robust and complex transaction management, returns, store inventory and store operations. Tomax also has a next generation mobile point of sale and mobile store solution. In the near term, we are focused on the cloud point of sale technology and continuing to support and maintain existing Tomax customers. In addition, we are investing in developing and delivering a unified commerce platform that combines Tomax cloud point of sale with Demandware’s Commerce Cloud.
Key Metrics
We regularly review a number of metrics to evaluate growth trends, measure our performance, formulate financial projections and make strategic decisions. We discuss revenue, gross margin, and the components of operating income and margin below under “Basis of Presentation” in Note 1 to our consolidated financial statements included elsewhere in this Annual Report on Form 10-K, and we discuss other key metrics below.
Number of Customers
We believe that our ability to expand our customer base is an indicator of our market penetration and growth of our business as we continue to invest in our direct sales force, our indirect sales channels and marketing initiatives. We define our number of customers at the end of a particular quarter as the number of ecommerce customers generating subscription revenue during the period, and who have a committed minimum level of gross revenue to be processed on our platform, from which a minimum monthly, quarterly or annual, non-refundable subscription fee is derived. As of December 31, 2014, 2013, and 2012, we had 267, 204 and 151 customers, respectively. For more information about our customers, see “Business—Customers” in Part I, Item 1 of this Annual Report on Form 10-K.
Number of Customer Sites
Since our ecommerce customers generally operate more than one site across various geographies, channels and brands and pay us fees based on the total gross revenue they process on our platform, we believe the total number of ecommerce customer sites using our solutions in a given quarter is an indicator of the growth of our business. As of December 31, 2014, 2013 and 2012, our ecommerce customers were operating 1,143, 820 and 579 sites on our platform, respectively.
Subscription Dollar Retention Rate
We believe that our ability to retain our customers and expand their digital commerce revenue growth on our software platform over time is an indicator of the stability of our revenue base and the long-term value of our customer relationships. We assess our performance in this area using a metric we refer to as our subscription
45
dollar retention rate. We calculate the subscription dollar retention rate by dividing the retained average ecommerce contract value of subscription revenue by the previous average ecommerce contract value of subscription revenue. We define retained average ecommerce contract value of subscription revenue as the average annual ecommerce contract value from committed subscription fees for all ecommerce contracts that renew in a given period. We define previous average ecommerce contract value of subscription revenue as the average annual ecommerce contract value from committed subscription fees for all ecommerce contracts that expire in that same period. Since our ecommerce customer contracts are typically three years, we have a limited history of quantifying our subscription dollar retention rate. However, although we have lost individual customers from time to time, our customers that have renewed their subscriptions have tended to increase their subscription commitment level to align with their increasing gross revenue volumes. As a result, our subscription dollar retention rate has been above 100% in 2012, 2013 and 2014.
Total Contract Value Backlog
As of December 31, 2014, we had contract backlog, which consists of total committed minimum subscription fees under ecommerce contracts, plus our deferred revenue, of approximately $461.7 million compared with contract backlog of approximately $336.5 million as of December 31, 2013, due largely to the increase in number of new ecommerce customers and the increase in the amount of the total committed minimum subscription fees of new customers signed during 2014. Revenue for any period is a function of revenue recognized from deferred revenue, committed minimum subscription fees, and overage fees as well as contract renewals and new ecommerce customers on the platform during the period. Contract backlog does not include any anticipated overage fees and does not reflect an assumption for subscription dollar retention rates, and does not reflect an assumption for customer renewals on a customer count basis. In 2014 and in 2013, overage fees represented 27% and 33% of subscription revenue, respectively. As discussed above, our subscription dollar retention rates were greater than 100% in 2012, 2013 and 2014. As a result, for multi-year subscription contracts, the portion of the committed minimum subscription included in backlog will be higher at the beginning of the multi-year ecommerce contract than at the end of the contract and will typically increase when the contract is renewed. As a result, backlog at the beginning of any period is not necessarily indicative of future performance.
Unbilled contract backlog that we do not reasonably expect to be recognized as revenue within the year ended December 31, 2015 was $322.9 million, and unbilled contract backlog that we did not reasonably expect to be recognized as revenue within the year ended December 31, 2014 was $249.4 million. The unbilled contract backlog that we do not reasonably expect to be recognized as revenue during the current fiscal year does not include any anticipated overage fees, does not make an assumption for contract renewal rates and does not make an assumption for customer churn. In addition, the unbilled contract backlog reflects an assumption as to when customers will launch digital commerce sites on our platform. As a result, unbilled contract backlog that we do not reasonably expect to be recognized within the current fiscal year ended December 31, 2015 is not necessarily indicative of our performance in 2015 or in any future periods. Our presentation of backlog may differ from other companies in our industry.
Key Components of Our Results of Operations
Revenue
Subscription Revenue
We derive our subscription revenue from fees paid to us by our customers for their access to our cloud digital commerce solutions, which include ecommerce, order management and predictive intelligence subscriptions, for a specified period of time. Fees are generally based on a revenue share of the total gross revenue our ecommerce customers process through their sites operating on our platform, and include a committed level of gross revenue from which a minimum monthly, quarterly or annual, subscription fee is derived. Ecommerce customer contracts are generally non-cancellable for a minimum period that is typically three years and range up to seven years. If ecommerce customers process more than their committed gross
46
revenue, then we bill overage fees for the difference between the resulting revenue share and their committed minimum fee at the rates applicable in their contracts for the actual volume of revenue achieved. Overage fees represented 32.7%, 33.2% and 27.0% of subscription revenue for the years ended December 31, 2012, 2013 and 2014, respectively. The trend in the mix shift toward base subscription revenues versus subscription overage fees has been primarily driven by larger customers who have more visibility into the growth trajectory of their digital commerce businesses and therefore are comfortable committing to higher base fees and, to a lesser extent, customers with escalating subscription minimums during their three year contracts. In 2015, we expect the base subscription revenues versus subscription overage fees mix on an annual basis to be similar to 2014. If ecommerce customers process less than their committed gross revenue, no credits or refunds are given. Our order management and predictive intelligence subscriptions are typically based on a per transaction or volume fee, which is common pricing for those solutions.
Subscriptions generally include fees derived from contractually committed minimum levels of gross revenue processed by ecommerce customers on our cloud digital commerce platform, and fees derived from such customers’ gross revenue processed above the minimum contracted levels. Customers do not have the contractual right to take possession of our cloud software. The consideration allocated to the subscription for the aggregate minimum subscription fee is recognized on a straight-line basis over the subscription term once a customer’s subscription period has commenced. Should an ecommerce customer exceed the specified minimum levels of gross revenue processed, fees for customer gross revenue processed in excess of the committed minimum level are billed for the excess volume. We recognize revenue from the fees we receive for our customers’ gross revenue processed in excess of the committed minimum level in the period in which such gross revenue is processed and earned. Revenue from overage fees is recognized in the period in which that volume is processed and earned. We also derive revenue from annual solution support fees when the services are first activated. The annual solution support fees are recorded as deferred revenue and recognized as revenue ratably on a straight-line basis over the related subscription term. Activation fees paid by customers in connection with subscription services are deferred and recognized ratably over the longer of the term of the subscription agreement or the estimated expected life of the customer relationship. As we gain more experience with customer renewals, we continue to evaluate the estimated life of our customers. At December 31, 2014, we confirmed the estimated expected life of our customers, which remains just over six years.
Services Revenue
Services revenue consists primarily of implementation services, consulting services to support our customers once they are live on our solution and training. Our service arrangements are billed on a fixed fee or time and materials basis. Our customers may also elect to use unrelated third parties to perform these services. Other than our site readiness assessment offering, our professional services have standalone value and are recognized as revenue using the proportional performance method. Our typical service arrangement provides for payment to us within 30 to 60 days of invoice. We expect services revenue to increase in 2015 compared to 2014 primarily driven by our recent acquisition of Tomax. Prior period amounts have been revised to reflect corrections of immaterial errors due to a revision of our revenue recognition policy for implementation services. See Note 1 to the notes to our consolidated financial statements included elsewhere in this Annual Report on Form 10-K for a description of these items and the impact of the corrections on our financial statements for the prior periods.
Cost of Revenue
Cost of Subscription Revenue
Cost of subscription revenue primarily consists of hosting costs, data communications expenses, depreciation expenses associated with computer equipment, personnel and related costs, including salaries, bonuses, payroll taxes, recruiting fees and stock compensation, software license fees and amortization expenses associated with capitalized software and acquired technology from acquisitions. In addition, we allocate a portion of overhead, such as rent, information technology, or IT, costs, depreciation and amortization and employee
47
benefits costs, to cost of revenue based on headcount. Expenses related to the depreciation associated with computer equipment, hosting and data communications are affected by the number of customers using our cloud software, the complexity of their sites and the volume of transactions processed. We plan to continue to significantly expand our capacity to support our growth, which will result in higher cost of subscription revenue in absolute dollars.
Cost of Services Revenue
Cost of services revenue primarily consists of personnel and related costs, third party contractors and allocated overhead. Our cost of services revenue is expensed as the costs are incurred. Our cost associated with providing services has been significantly higher as a percentage of revenue than our cost of subscription revenue.
When we perform our services, we often supplement our internal resources with third party contractors. We also work with a variety of system integrators who frequently lead implementation efforts. Finally, we have strategic relationships with companies who provide a full-service, comprehensive, end-to-end solution by combining our Demandware Commerce Cloud with a host of complementary services and technologies, such as logistics and warehousing, and who also lead implementation efforts as part of this comprehensive service. The cost of these services will fluctuate from quarter to quarter based on the number of customers that are in the process of implementation, and also based on the extent to which the services are implemented by us or a third party.
Operating Expenses
Sales and Marketing
Sales and marketing expenses consist primarily of personnel and related expenses for our sales and marketing staff, including salaries, benefits, bonuses, stock-based compensation and commissions; costs of marketing and promotional events, corporate communications, online marketing, product marketing and other brand-building activities; and allocated overhead. We expense sales commissions when the customer contract is signed because our obligation to pay a sales commission arises at that time.
We intend to continue to invest in sales and marketing and expect spending in these areas to increase in absolute dollars as we continue to expand our business both domestically and internationally. We expect sales and marketing expenses to continue to be among the most significant components of our operating expenses.
Research and Development
Research and development expenses consist primarily of personnel and related expenses for our research and development staff, including salaries, benefits, bonuses and stock-based compensation; the cost of certain third party contractors; and allocated overhead. Research and development costs, other than software development expenses qualifying for capitalization, are expensed as incurred.
We have focused our research and development efforts on continuously improving our platform, including feature innovation as well as platform extension. We expect research and development expenses to increase in absolute dollars as we add new functionality on the platform, extend our reach into store applications and expand our platform scalability.
General and Administrative
General and administrative expenses consist primarily of personnel and related expenses for administrative, finance, corporate development, IT, legal and human resource staffs, including salaries, benefits, bonuses and stock-based compensation; professional fees; insurance premiums; other corporate expenses; and allocated overhead.
48
We expect our general and administrative expenses to increase as we continue to expand our operations, hire additional personnel and incur costs as a growing public company. We expect to incur additional expenses related to increased outside legal counsel assistance, accounting and auditing activities, compliance with Securities and Exchange Commission, or SEC, requirements and enhancing our internal control environment through the adoption and administration of new corporate policies.
Other Income (Expense)
Interest Income
Interest income consists of interest income and realized gains and realized losses on our cash equivalents, and investments in marketable securities.
Interest Expense
Interest expense consists primarily of interest expense from our equipment notes payable and amortization of debt issuance costs.
Other (Expense) Income
Other (expense) income, net consists of income and expense associated with fluctuations in foreign currency exchange rates and changes in fair value of foreign currency forward contracts and preferred stock warrant liabilities. We expect other (expense) income to vary depending on the movement in foreign currency exchange rates and the related impact on our foreign exchange gain (loss).
Income Taxes (Benefit) Provision
Income taxes (benefit) provision is related to certain foreign and state income taxes. As we have incurred operating losses in most periods to date and recorded a full valuation allowance against our U.S. federal and state net deferred tax assets, we have not historically recorded a provision for federal and state income taxes.
Critical Accounting Policies and Estimates
Our financial statements and the related notes included elsewhere in this Annual Report on Form 10-K are prepared in accordance with generally accepted accounting principles in the United States. The preparation of these financial statements requires us to make estimates and assumptions that affect the reported amounts of assets, liabilities, revenue, cost of revenue, operating expenses, other income and expenses, provision for income taxes and related disclosures. We base our estimates on historical experience and on various other assumptions that we believe to be reasonable under the circumstances. Changes in accounting estimates are reasonably likely to occur from period to period. Accordingly, actual results could differ significantly from our estimates. We evaluate our estimates and assumptions on an ongoing basis. To the extent that there are material differences between our estimates and our actual results, our future financial statement presentation, financial condition, results of operations and cash flows will be affected.
We believe the assumptions and estimates associated with the following accounting policies have the greatest potential impact on our financial statements: revenue recognition and deferred revenue; accounting for stock-based compensation; accounting for business combinations and goodwill and purchased intangible assets.
Revenue Recognition and Deferred Revenue
We generate revenue from sales of our digital commerce solutions that leverage our proprietary technology, which are represented by subscription fees for our ecommerce, order management and predictive intelligence
49
solutions, activation fees and related professional services. Professional services include implementation services, consulting services to support our customers once they are live on our solution and training.
We recognize revenue when persuasive evidence of an arrangement exists, delivery to customers has occurred or services have been rendered, the fee is fixed or determinable, and collectability is reasonably assured. We do not recognize revenue in excess of the amounts for which we have the right to invoice in an annual subscription year.
In most instances, revenue from new customer acquisition is generated under sales agreements with multiple elements, comprised of subscription fees, related activation fees that allow customers to access the solutions, and professional services. We evaluate each element in a multiple-element arrangement to determine whether it represents a separate unit of accounting. An element constitutes a separate unit of accounting when the delivered item has standalone value and delivery of the undelivered element is probable and within our control. Subscriptions have standalone value because they are routinely sold separately by us.
Other than our site readiness assessment offering, our professional services have standalone value because we have sold professional services separately or there are third party vendors that routinely provide similar professional services to our customers on a standalone basis. There is not standalone value for site readiness assessments because they are not sold on a standalone basis and can only be provided by us.
Activation fees provide access to our digital environment through production launch and are billed during the implementation phase and recorded as deferred revenue until a customer’s subscription period has commenced. Activation fees do not have standalone value because they are only sold in conjunction with a subscription to our ecommerce solutions, they are only sold by us, a customer could not resell it, and they do not represent the culmination of a separate earnings process.
We allocate revenue to each element in an arrangement based on a selling price hierarchy. The selling price for a deliverable is based on its vendor-specific objective evidence, or VSOE, if available, third party evidence, or TPE, if VSOE is not available, or best estimated selling price, or BESP, if neither VSOE nor TPE is available. As we have been unable to establish VSOE or TPE for the elements of our arrangements, we establish the BESP for each element primarily by considering the weighted average of actual sales prices of professional services sold on a standalone basis and subscriptions including various add-on modules when sold together without professional services, and other factors such as gross margin objectives, pricing practices and growth strategy.
Subscriptions include fees derived from contractually committed minimum levels of gross revenue processed by ecommerce customers on our cloud digital commerce platform, and fees derived from such customers’ gross revenue processed above the minimum contracted levels. Customers do not have the contractual right to take possession of our cloud software. The consideration allocated to the subscription for the aggregate minimum subscription fee is recognized on a straight-line basis over the subscription term once a customer’s subscription period has commenced. Should an ecommerce customer exceed the specified minimum levels of gross revenue processed, fees for customer gross revenue processed in excess of the committed minimum level are billed for the excess volume. We recognize revenue from the fees we receive for our customers’ gross revenue processed in excess of the committed minimum level in the period in which such gross revenue is processed and earned.
Activation fees and site readiness assessments without standalone value are recognized ratably over the longer of the life of the agreement or the expected customer life, which is currently estimated to be just over six years. We evaluate the length of the amortization period based on our experience with customer contract renewals and consideration of the period over which those customers will benefit from the related offerings.
The consideration allocated to professional services with standalone value is recognized as revenue using the proportional performance method.
50
Deferred revenue primarily consists of the unearned portion of billed subscription and services fees. Once a customer’s subscription period has commenced, we typically invoice customers on a monthly or quarterly basis. In addition, we often invoice the first year subscription fee in advance upon customer contract execution as an initiation payment. Initiation payments are included in deferred revenue upon payment.
Reimbursable costs received for out-of-pocket expenses are recorded as revenue and cost of revenue in the consolidated statements of operations and comprehensive loss. Sales taxes collected from customers and remitted to government authorities are excluded from revenue.
Accounting for Stock-Based Compensation
We account for stock-based awards granted to employees and directors by recording compensation expense based on the awards’ estimated fair values. We expect that our expense related to stock-based compensation will increase over time.
We estimate the fair value of our stock option awards as of the date of grant using the Black-Scholes option-pricing model. Determining the fair value of stock-based awards under this model requires judgment, including estimating the value per share of our common stock, volatility, expected term of the awards, estimated dividend yield and the risk-free interest rate. The assumptions used in calculating the fair value of stock-based awards represent our best estimates, based on management’s judgment and subjective future expectations. These estimates involve inherent uncertainties. If any of the assumptions used in the model change significantly, stock-based compensation recorded for future awards may differ materially from that recorded for awards granted previously.
In determining the fair value of our stock option awards, we base the majority of our estimates of expected volatility using volatility data from comparable public companies in similar industries and markets because there is currently limited public market history for our common stock, and therefore, a lack of market-based company-specific historical and implied volatility information. The risk-free interest rate assumption was based on the U.S. Treasury zero-coupon bonds with maturities similar to those of the expected term of the award being valued. The assumed dividend yield is based on our expectation of not paying dividends in the foreseeable future. The weighted-average expected life for employee options reflects the application of the simplified method, which represents the average of the contractual term of the options and the weighted-average vesting period for all option tranches. The simplified method has been used since we do not have sufficient historical exercise data to provide a reasonable basis upon which to estimate expected term due to a limited period of our life.
Once we have determined the estimated fair value of our stock-based awards, we recognize the portion of that value that corresponds to the portion of the award that is ultimately expected to vest, taking estimated forfeitures into account. This amount is recognized as an expense over the vesting period of the award using the straight-line method. We estimate forfeitures based upon our historical experience and, at each period, review the estimated forfeiture rate and make changes as factors affecting the forfeiture rate calculations and assumptions change.
Stock-based compensation expense is expected to increase in 2015 compared to 2014 as a result of our existing unrecognized stock-based compensation and as we issue additional stock-based awards to continue to attract and retain employees.
Accounting for Business Combinations
The results of businesses acquired in a business combination are included in our consolidated financial statements from the date of the acquisition. Purchase accounting results in assets and liabilities of an acquired business being recorded at their estimated fair values on the acquisition date. Any excess consideration over the fair value of assets acquired and liabilities assumed is recognized as goodwill.
51
We perform valuations of assets acquired and liabilities assumed for an acquisition and allocate the purchase price to its respective net tangible and intangible assets. Determining the fair value of assets acquired and liabilities assumed requires management to use significant judgment and estimates including the selection of valuation methodologies, estimates of future revenues and cash flows, discount rates and selection of comparable companies. We engage the assistance of valuation specialists in determining our fair value measurements of assets acquired and liabilities assumed in a business combination.
Transaction costs associated with business combinations are expensed as incurred.
Goodwill and Purchased Intangible Assets
We record goodwill when consideration paid in a purchase acquisition exceeds the fair value of the net tangible assets and the identified intangible assets acquired. Goodwill is not amortized, but rather is tested for impairment annually or more frequently if facts and circumstances warrant a review. We have determined that there is a single reporting unit for the purpose of goodwill impairment tests. For purposes of assessing the impairment of goodwill, we annually estimate the fair value of the reporting unit and compare this amount to the carrying value of the reporting unit. If we determine that the carrying value of the reporting unit exceeds its fair value, the implied fair value of goodwill is compared with the carrying value of goodwill. If the carrying value of goodwill exceeds its implied fair value, an impairment charge is recognized in the amount equal to that excess. We completed our annual impairment test of goodwill as of November 30, 2014.
Purchased intangible assets consist of developed technology, customer relationships and trademarks acquired in connection with business acquisitions, and are amortized over their estimated useful lives based on the pattern of economic benefit expected from each asset. We concluded for certain purchased intangible assets that the pattern of economic benefit approximated the straight-line method. The use of the straight-line method was appropriate as the majority of the cash flows will be recognized ratably over the estimated useful lives and there is no degradation of the cash flows over time. Amortization expense related to developed technology is included in cost of subscription revenue while amortization expense related to customer relationships and trademarks is included in sales and marketing expense. We evaluate our intangible assets for impairment whenever events or changes in circumstances indicate that the carrying amount of such assets may not be recoverable. Impairment is assessed by comparing the undiscounted cash flows expected to be generated by the intangible asset to its carrying value. If impairment exists, we calculate the impairment by comparing the carrying value of the intangible asset to its fair value as determined by discounted expected cash flows.
52
Results of Operations
All financial results and other information set forth below reflect the revisions made to our historical financial statements to correct immaterial errors resulting from a revision to our revenue recognition policy for implementation services.
The following table sets forth our consolidated statements of operations data for each of the periods indicated as a percentage of revenue. The period-to-period comparison of financial results is not necessarily indicative of future results.
| Year Ended December 31, | ||||||||||||
| 2014 | 2013 | 2012 | ||||||||||
| (As revised) | (As revised) | |||||||||||
| Consolidated Statements of Operations Data: |
||||||||||||
| Revenue: |
||||||||||||
| Subscription |
90.9 | % | 89.8 | % | 81.6 | % | ||||||
| Services |
9.1 | 10.2 | 18.4 | |||||||||
|
|
|
|
|
|
|
|||||||
| Total revenue |
100.0 | 100.0 | 100.0 | |||||||||
| Cost of revenue: |
||||||||||||
| Subscription |
16.8 | 16.1 | 15.6 | |||||||||
| Services |
9.4 | 10.2 | 13.6 | |||||||||
|
|
|
|
|
|
|
|||||||
| Total cost of revenue |
26.2 | 26.3 | 29.2 | |||||||||
|
|
|
|
|
|
|
|||||||
| Gross profit |
73.8 | 73.7 | 70.8 | |||||||||
| Operating expenses: |
||||||||||||
| Sales and marketing |
46.3 | 49.1 | 40.2 | |||||||||
| Research and development |
21.8 | 19.5 | 18.1 | |||||||||
| General and administrative |
23.0 | 21.9 | 16.5 | |||||||||
|
|
|
|
|
|
|
|||||||
| Total operating expenses |
91.1 | 90.5 | 74.8 | |||||||||
|
|
|
|
|
|
|
|||||||
| Loss from operations |
(17.3 | ) | (16.8 | ) | (4.0 | ) | ||||||
| Other (expense) income, net |
(0.8 | ) | 0.5 | (0.7 | ) | |||||||
|
|
|
|
|
|
|
|||||||
| Loss before income taxes |
(18.1 | ) | (16.3 | ) | (4.7 | ) | ||||||
| Income taxes (benefit) provision |
(1.3 | ) | 0.6 | 0.5 | ||||||||
|
|
|
|
|
|
|
|||||||
| Net loss |
(16.8 | ) | (16.9 | ) | (5.2 | ) | ||||||
| Net loss attributable to noncontrolling interest |
0.0 | 0.0 | 0.0 | |||||||||
|
|
|
|
|
|
|
|||||||
| Net loss attributable to Demandware common stockholders |
(16.8 | ) | (16.9 | ) | (5.2 | ) | ||||||
|
|
|
|
|
|
|
|||||||
Comparison of Years Ended December 31, 2014, 2013 and 2012
Revenue
| Year Ended December 31, | Change from 2013 to 2014 |
Change from 2012 to 2013 |
||||||||||||||||||||||||||
| 2014 | 2013 | 2012 | $ | % | $ | % | ||||||||||||||||||||||
| (As revised) | (As revised) | |||||||||||||||||||||||||||
| (dollars in thousands) | ||||||||||||||||||||||||||||
| Subscription revenue |
$ | 145,879 | $ | 95,733 | $ | 67,930 | $ | 50,146 | 52.4 | % | $ | 27,803 | 40.9 | % | ||||||||||||||
| Percentage of total revenue |
90.9 | % | 89.8 | % | 81.6 | % | ||||||||||||||||||||||
| Services revenue |
$ | 14,674 | $ | 10,881 | $ | 15,347 | $ | 3,793 | 34.9 | % | $ | (4,466 | ) | (29.1 | )% | |||||||||||||
| Percentage of total revenue |
9.1 | % | 10.2 | % | 18.4 | % | ||||||||||||||||||||||
53
Subscription revenue. Subscription revenue increased by $50.1 million, or 52.4%, from 2013 to 2014. The increase was driven by an increase of $25.5 million in revenue from new customers as well as an increase of $24.6 million in revenue from existing customers in the 2014 period. We had 267 ecommerce customers and 1,143 sites operating on our platform as of December 31, 2014, an increase from 204 ecommerce customers and 820 sites operating on our platform as of December 31, 2013. The increase in revenue from existing customers resulted from both growth in revenues from existing sites and the launch of additional sites in the year ended December 31, 2014. Revenue realized from overage fees from both new and existing customers increased from $31.8 million to $39.4 million, and represented 33.2% and 27.0% of subscription revenue for the years ended December 31, 2013 and 2014, respectively.
Subscription revenue increased by $27.8 million, or 40.9%, from 2012 to 2013. The increase was driven primarily by an increase of $19.1 million in revenue from new customers. We had 204 customers and 820 sites operating on our platform as of December 31, 2013, an increase from 151 customers and 579 sites operating on our platform as of December 31, 2012. In addition, revenue from existing customers net of revenue declines from customer terminations grew $8.7 million from 2012 to 2013. The increase in revenue from existing customers resulted from both organic site growth and the launch of additional sites in 2013. Our customers launched 241 net new sites in 2013, an increase of 10.6% from 218 net new sites in 2012. Revenue realized from overage fees from both new and existing customers increased from $22.2 million to $31.8 million, and represented 32.9% and 33.2% of subscription revenue for the years ended December 31, 2012 and 2013, respectively.
Services revenue. Services revenue increased by $3.8 million, or 34.9%, for the year ended December 31, 2014 compared to the year ended December 31, 2013. Revenue recognized from implementation services increased $0.2 million during the year ended December 31, 2014 compared to the year ended December 31, 2013 due to an increase in the number of customers implementing onto our platform during the year. We also recognized an increase of $2.3 million of service and training revenues performed after our customers launched their sites on our platform during the year ended December 31, 2014 compared to the period in 2013. Additionally, fees received from our network of partners increased $0.8 million during the year ended December 31, 2014 as compared to the same 2013 period as we continued to grow our LINK program. Finally, fees received from sponsors of and participants attending our global customer conferences increased $0.5 million during the same period of 2014 over 2013.
Services revenue decreased by $4.5 million, or (29.1)%, for the year ended December 31, 2013 compared to the year ended December 31, 2012. Revenue from implementation services declined $4.8 million for the year ended December 31, 2013 compared to the year ended December 31, 2012 as more of our customers signed implementation statements of work with our expanding partner network, and $2.5 million of the decrease was due to our realizing the remaining portion of the deferred services revenue balance in the fourth quarter of 2012 from one large customer, as a result of the insolvency filing by that customer, and the cessation of that relationship. Additionally, the decrease was driven by a decrease of $0.7 million less in services performed after our customers launched their sites on our platform compared to the 2012 period. These decreases in services revenue were partially offset by an increase of $0.7 million in fees received from our network of partners during the year ended December 31, 2013 as compared to the same 2012 period. Additionally, fees received from sponsors of and participants attending our global customer conference increased $0.5 million during the same period of 2013 over 2012.
54
Cost of Revenue
| Year Ended December 31, | Change from 2013 to 2014 |
Change from 2012 to 2013 |
||||||||||||||||||||||||||
| 2014 | 2013 | 2012 | $ | % | $ | % | ||||||||||||||||||||||
| (dollars in thousands) | ||||||||||||||||||||||||||||
| Cost of subscription revenue |
$ | 26,933 | $ | 17,157 | $ | 13,015 | $ | 9,776 | 57.0 | % | $ | 4,142 | 31.8 | % | ||||||||||||||
| Percentage of subscription revenue |
18.5 | % | 17.9 | % | 19.2 | % | ||||||||||||||||||||||
| Gross margin |
81.5 | % | 82.1 | % | 80.8 | % | ||||||||||||||||||||||
| Cost of services revenue |
$ | 15,115 | $ | 10,860 | $ | 11,326 | $ | 4,255 | 39.2 | % | $ | (466 | ) | (4.1 | )% | |||||||||||||
| Percentage of services revenue |
103.0 | % | 99.8 | % | 73.8 | % | ||||||||||||||||||||||
| Gross margin |
(3.0 | )% | 0.2 | % | 26.2 | % | ||||||||||||||||||||||
Cost of subscription revenue. Cost of subscription revenue increased $9.8 million, or 57.0%, from 2013 to 2014. The increase was primarily attributable to $1.9 million of increased depreciation, maintenance, and equipment and software support expenses associated with equipment for our data centers and $3.2 million of increased hosting and bandwidth expenses due to an expansion of our capacity to accommodate the growth during the 2014 period. In addition, we increased our headcount in our support and technical operations teams throughout 2014 and as a result, our personnel and related expenses, such as salaries, bonuses, payroll taxes, recruiting fees and stock compensation, increased $3.4 million in 2014. Finally, we incurred a $1.2 million expense due to the amortization of intangibles related to our acquisitions of Mainstreet and CQuotient in 2014.
Cost of subscription revenue increased $4.1 million, or 31.8%, from 2012 to 2013. The increase was primarily attributable to $0.9 million of increased depreciation, maintenance, and equipment and software support expenses associated with equipment for our data centers and $2.0 million of increased hosting and bandwidth expenses due to an expansion of our capacity to accommodate the growth during the 2013 period. In addition, we increased our headcount in our support and technical operations teams throughout 2013 and as a result, our personnel and related expenses, such as salaries, bonuses, payroll taxes, recruiting fees and stock compensation, increased $1.3 million in 2013.
Cost of services revenue. Cost of services revenue increased $4.3 million, or 39.2%, from 2013 to 2014. The increase was primarily attributable to $3.6 million of increased personnel and related expenses, of which $0.8 million related to stock compensation expense. We also incurred $0.2 million of increased travel and entertainment expenses and $0.4 million of increased costs, such as rent and IT costs, as a direct result of the increase in headcount.
Cost of services revenue decreased $0.5 million, or (4.1)%, from 2012 to 2013. The decrease was primarily attributable to $1.9 million of decreased outside consulting expenses resulting from a decreased use of third party contractors to assist our direct services implementation teams, offset by $1.1 million of increased personnel and related expenses, of which $0.5 million related to stock compensation expense. While we experienced an increase in the number of customers in the implementation phase during the year ended December 31, 2013, because more of our implementations were led by third party integrators, the number of implementations performed directly and solely by our client service team decreased by 73% as compared to the year ended December 31, 2012. Our increased use of third party integration partners to service our customer implementations has allowed us to enable more customers to launch sites on our platform while minimizing the additional headcount required by us to perform the implementation, which has enabled us to control our internal costs.
Operating Expenses
Sales and Marketing
| Year Ended December 31, | Change from 2013 to 2014 |
Change from 2012 to 2013 |
||||||||||||||||||||||||||
| 2014 | 2013 | 2012 | $ | % | $ | % | ||||||||||||||||||||||
| (dollars in thousands) | ||||||||||||||||||||||||||||
| Sales and marketing |
$ | 74,432 | $ | 52,384 | $ | 33,496 | $ | 22,048 | 42.1 | % | $ | 18,888 | 56.4 | % | ||||||||||||||
| Percentage of total revenue |
46.4 | % | 49.1 | % | 40.2 | % | ||||||||||||||||||||||
55
Sales and marketing expenses for the year ended December 31, 2014 increased by $22.0 million, or 42.1%, compared to the year ended December 31, 2013. The increase was attributable to the continued expansion to address increased opportunities in new and existing markets. We have continued to add employees within our direct sales, retail practice and marketing organizations in North America, Europe, and Asia Pacific, which contributed to $17.6 million of increased personnel and related expenses, of which $3.0 million was related to stock compensation expense. Additionally, we incurred $1.3 million of increased travel and entertainment expenses and $1.0 million of increased costs such as rent, IT costs and depreciation and amortization expenses as a result of our growth. Additionally, marketing program expenses increased $2.5 million in 2014 as we increased the size of our annual global customer conferences and also increased the level of spending to enhance our global brand. These increases in expenses were partially offset by a decrease of $0.5 million of business and corporate development expenses in 2014.
Sales and marketing expenses for the year ended December 31, 2013 increased by $18.9 million, or 56.4%, compared to the year ended December 31, 2012. The increase was attributable to the continued expansion of our sales force to address increased opportunities in new and existing markets. Throughout 2013, we added employees within our direct sales, retail practice and marketing organizations in North America, Europe, and Asia Pacific, which contributed to $7.7 million of increased personnel and related expenses, of which $2.5 million related to stock compensation expense. In addition, commissions and sales bonuses increased by $6.2 million, or 102.7%, in 2013 as a result of an increase in new customers acquired during 2013. Additionally, we incurred $1.4 million of increased travel and entertainment expenses and $0.9 million of increased costs such as rent, IT costs and depreciation and amortization expenses incurred as a result of our growth. Additionally, marketing program expenses increased $2.2 million in 2013 as we increased the size of our annual global customer conference and also increased the level of spending to enhance our global brand. Finally, we incurred $0.5 million of increased business and corporate development expenses in 2013.
Research and Development
| Year Ended December 31, | Change from 2013 to 2014 |
Change from 2012 to 2013 |
||||||||||||||||||||||||||
| 2014 | 2013 | 2012 | $ | % | $ | % | ||||||||||||||||||||||
| (dollars in thousands) | ||||||||||||||||||||||||||||
| Research and development |
$ | 34,983 | $ | 20,787 | $ | 15,085 | $ | 14,196 | 68.3 | % | $ | 5,702 | 37.8 | % | ||||||||||||||
| Percentage of total revenue |
21.8 | % | 19.5 | % | 18.1 | % | ||||||||||||||||||||||
Research and development expenses for the year ended December 31, 2014 increased by $14.2 million, or 68.3%, compared to the year ended December 31, 2013. The increase was attributable to investments made to enhance and improve the functionality of our digital commerce platform. Throughout the 2014 period, we increased our engineering headcount, which contributed to increased personnel and related expenses of $12.1 million, of which $3.9 million related to stock compensation expense. Additionally, we incurred increased contractor costs of $0.2 million in 2014. We also incurred $0.5 million of increased travel and entertainment expenses and $1.4 million of increased allocated overhead costs such as rent, IT costs and depreciation and amortization to support our continued growth.
Research and development expenses for the year ended December 31, 2013 increased by $5.7 million, or 37.8%, compared to the year ended December 31, 2012. The increase was attributable to investments made to enhance and improve the functionality of our digital commerce platform. Throughout 2013, we increased our engineering headcount, which contributed to increased personnel and related expenses of $6.7 million, of which $2.1 million related to stock compensation expense. As a direct result of our increased engineering headcounts, we decreased contractor costs $1.9 million in 2013. We also incurred increased expenses of $0.9 as a result of our growth, which includes $0.4 million of increased allocated overhead costs, such as rent, IT costs and depreciation expenses, $0.2 million of increased costs from monitoring the security and compliance of our digital commerce platform, $0.2 million of increased software and support fees, and $0.1 million of increased travel expenses.
56
General and Administrative
| Year Ended December 31, | Change from 2013 to 2014 |
Change from 2012 to 2013 |
||||||||||||||||||||||||||
| 2014 | 2013 | 2012 | $ | % | $ | % | ||||||||||||||||||||||
| (dollars in thousands) | ||||||||||||||||||||||||||||
| General and administrative |
$ | 36,882 | $ | 23,337 | $ | 13,712 | $ | 13,545 | 58.0 | % | $ | 9,625 | 70.2 | % | ||||||||||||||
| Percentage of total revenue |
23.0 | % | 21.9 | % | 16.5 | % | ||||||||||||||||||||||
General and administrative expenses for the year ended December 31, 2014 increased by $13.5 million, or 58.0%, compared to the year ended December 31, 2013. The increase was attributable to increased employee-related costs and professional fees to support our growing business. We incurred increased personnel and related costs of $9.7 million, of which $3.9 million related to stock compensation expense. We also incurred increased professional fees of $0.3 million for legal services to support the expansion and growth of our business as well as increased audit and tax services of $0.5 million in 2014. Additionally, in the year ended December 31, 2014 we incurred $0.2 million of increased travel and entertainment expenses and $1.5 million of increased allocated overhead costs, such as rent, IT costs and depreciation and amortization expenses as a result of our growth compared to the year ended December 31, 2013. We also incurred an increase of $0.2 million of bad debt expense and $1.6 million of increased corporate development and related professional fees in the current period. These increases were partially offset by a decrease in other tax expense of $0.6 million due to the rejection of value added tax refund applications in 2013 for our PODs that were shipped to Europe in prior years.
General and administrative expenses for the year ended December 31, 2013 increased by $9.6 million, or 70.2%, compared to the year ended December 31, 2012. The increase was attributable to increased employee-related costs and professional fees to support our growing business. We incurred increased personnel and related costs of $6.5 million, of which $2.5 million related to stock compensation expense. We also incurred increased professional fees of $0.2 million for accounting and legal services and $0.3 million of investor relations expenses to support the expansion and growth of our business as well as increased audit and tax services of $0.3 million in 2013. Additionally, in the year ended December 31, 2013 we incurred $0.2 million of increased travel and entertainment expenses, $0.5 million of increased allocated overhead costs, such as rent, IT costs and depreciation and amortization expenses, and $0.3 million of software and support costs as a result of our growth compared to the year ended December 31, 2012. We also incurred an increase in miscellaneous state taxes of $0.2 million as a result of expanding into new states in the United States and $0.7 million of other tax expense due to the rejection of value added tax refund applications for our PODs that were shipped to Europe in prior years. Finally, we incurred $0.5 million of bad debt expense in the current period primarily due to a reseller that commenced preliminary insolvency proceedings and we have fully reserved for all accounts receivable owed from this reseller prior to their filing.
Other (Expense) Income
| Year Ended December 31, | Change from 2013 to 2014 |
Change from 2012 to 2013 |
||||||||||||||||||||||||||
| 2014 | 2013 | 2012 | $ | % | $ | % | ||||||||||||||||||||||
| (dollars in thousands) | ||||||||||||||||||||||||||||
| Other (expense) income, net |
$ | (1,318 | ) | $ | 483 | $ | (544 | ) | $ | (1,801 | ) | (372.9 | )% | $ | 1,027 | 188.8 | % | |||||||||||
| Percentage of total revenue |
(0.8 | )% | 0.5 | % | (0.7 | )% | ||||||||||||||||||||||
Other (expense) income, net for the year ended December 31, 2014 decreased $1.8 million, or 372.9%, from other income, net of $0.5 million for the year ended December 31, 2013. The decrease was attributed to a $2.0 million decrease in foreign exchange losses related to fluctuations in the British Pounds Sterling and Euro in relation to the U.S. Dollar during the year ended December 31, 2014 compared to the year ended December 31, 2013, partially offset by an increase of $0.1 million in investment income and a decrease of $0.1 million in interest expense during the 2014 period.
57
Other income (expense), net for the year ended December 31, 2013 increased $1.0 million, or 188.8%, from other expense, net of $0.5 million for the year ended December 31, 2012. The increase was attributed to a $0.5 million increase in foreign exchange gains related to fluctuations in the British Pounds Sterling and Euro in relation to the U.S. Dollar in the year ended December 31, 2013 compared to the year ended December 31, 2012. Additionally, during 2012, we incurred $0.4 million in other expense due to the increase in the fair value of our warrant which was no longer outstanding in 2013. Finally, in June 2013, we amended our loan and security agreement to increase our available borrowings for equipment and negotiated an interest rate of 3.75% on all new and existing loans outstanding from interest rates ranging from 5.3% to 7.25%. This lower interest rate lowered interest expense on loans outstanding in the year ended December 31, 2013 by $0.1 million as compared to the year ended December 31, 2012.
(Benefit) Provision for Income Taxes
| Year Ended December 31, | Change from 2013 to 2014 |
Change from 2012 to 2013 |
||||||||||||||||||||||||||
| 2014 | 2013 | 2012 | $ | % | $ | % | ||||||||||||||||||||||
| (dollars in thousands) | ||||||||||||||||||||||||||||
| Income tax (benefit) provision |
$ | (2,050 | ) | $ | 574 | $ | 421 | $ | (2,624 | ) | (457.1 | )% | $ | 153 | 36.3 | % | ||||||||||||
| Effective tax rate |
7.0 | % | (3.3 | )% | (10.8 | )% | ||||||||||||||||||||||
The effective income tax rate for 2014 was 7.0% compared to (3.3)% for 2013. The effective tax rate for 2014 was primarily the result of the release of $3.0 million of valuation allowance resulting from the recognition of the deferred tax liabilities in the CQuotient acquisition, which provided evidence to support the recoverability of the deferred tax asset. This benefit was partially offset by the loss from our domestic operations where we are unable to record a tax benefit and have recorded a full valuation allowance. The effective tax rate is partially offset by research and development tax credits, and income from our foreign subsidiaries in Germany, France, the United Kingdom, Australia, Hong Kong and China, which are subject to local income taxes. Such earnings are planned to be reinvested indefinitely outside the United States and therefore, no domestic tax liabilities have been recorded.
The effective income tax rate for 2013 was (3.3)% compared to (10.8)% for 2012. The negative effective tax rate for 2013 was primarily the result of losses from our domestic operations where we are unable to record a tax benefit and have recorded a full valuation allowance. The negative effective tax rate is partially offset by research and development tax credits, and income from our foreign subsidiaries in Germany, France, the United Kingdom, Australia, Hong Kong and China, which are subject to local income taxes. Such earnings are planned to be reinvested indefinitely outside the United States and therefore, no domestic tax liabilities have been recorded.
Liquidity and Capital Resources
| Year Ended December 31, | ||||||||||||
| 2014 | 2013 | 2012 | ||||||||||
| (As revised) | (As revised) |
|||||||||||
| (in thousands) | ||||||||||||
| Net cash provided by operating activities |
$ | 3,619 | $ | 9,047 | $ | 3,077 | ||||||
| Net cash (used in) provided by investing activities |
(91,003 | ) | 4,812 | (52,614 | ) | |||||||
| Net cash provided by financing activities |
4,821 | 169,422 | 93,406 | |||||||||
| Effect of exchange rates on cash and cash equivalents |
(1,035 | ) | 267 | 69 | ||||||||
| (Decrease) increase in cash and cash equivalents |
(83,598 | ) | 183,548 | 43,938 | ||||||||
To date, we have financed our operations primarily through cash from operations and the sale of equity securities, including net cash proceeds from our IPO and follow-on offering. In March 2012, we closed our initial public offering of 6,325,000 shares of common stock, including 825,000 shares sold pursuant to the underwriters’ option to purchase additional shares, at a public offering price of $16.00 per share. We raised approximately $94.1 million from our IPO, net of our underwriting discounts and commissions but before offering expenses of $3.3 million.
58
In November 2013, we closed a follow-on offering of 3,310,098 shares of our common stock, including shares of certain shareholders who sold 810,098 shares of our common stock, at a price of $57.00 per share. In December 2013, we sold an additional 496,515 shares of our common stock pursuant to the underwriters’ option to purchase additional shares, at a price of $57.00 per share. We raised approximately $163.1 million from the public offering, net of our underwriting discounts and commissions but before offering expenses of $0.5 million. We received no proceeds from the sale of our common stock by the selling shareholders.
Our cash, cash equivalents and short-term investments totaled $243.7 million at December 31, 2014. Our cash equivalents and short-term investments are comprised primarily of money market funds, certificates of deposit, municipal securities, U.S. government agency bonds and corporate bonds.
At December 31, 2014, our principal sources of liquidity were $158.8 million of cash and cash equivalents.
We intend to use our cash for general corporate purposes, including potential future acquisitions or other transactions. In January 2015, we acquired Tomax, an enterprise software company that provides an integrated solution for retail point of sale and store operations, for total cash consideration of approximately $60 million. Additional consideration of up to $15 million, payable in cash or shares of our common stock at our option, is payable to the Tomax equityholders in 1.5 to 2 years contingent upon the continued post-closing employment of certain key employees of Tomax. Further, we expect to incur additional expenses in connection with our continued international expansion. We believe that our cash and cash equivalents are adequate to fund those potential or anticipated activities.
Based on our current level of operations and anticipated growth, we believe our future cash flows from operating activities and existing cash and cash equivalents will provide adequate funds for our ongoing operations for at least the next 12 months. Our future capital requirements will depend on many factors, including our rate of revenue, billings growth and collections, the level of our sales and marketing efforts, the timing and extent of spending to support product development efforts and expansion into new territories, the timing of general and administrative expenses as we grow our administrative infrastructure, the continuing market acceptance of our solutions, and potential acquisitions of complementary businesses, services or technologies. To the extent that existing cash and cash from operations are not sufficient to fund our future activities, we may need to raise additional funds. If we make acquisitions of complementary businesses, services or technologies, we could be required to seek additional equity financing or utilize our cash resources.
Depending on certain growth opportunities, we may choose to accelerate investments in sales and marketing and research and development, which may require the use of proceeds from our IPO and follow-on offering for such additional expansion and expenditures.
Net cash provided by operating activities. Cash provided by operating activities is significantly influenced by the amount of cash we invest in personnel and infrastructure to support the growth of our business, the increase in the number of customers using our cloud software and services and the amount and timing of customer payments. Cash provided by operations has historically resulted from net losses driven by sales of subscriptions to our cloud software and services and adjusted for non-cash expense items such as depreciation and amortization of property and equipment, stock-based compensation, bad debt expense and deferred income taxes. Our cash flows from operating activities are affected by the seasonality of our business, which results in variations in the timing of, our invoicing of, and our receipt of payments from, our customers. We have generally experienced increased invoicing in the fourth quarter of each year mainly due to billings associated with revenue realized from subscription overage fees. As a result, we have also experienced increased levels of customer payments during the first quarter of each year, related to the customer receipts from fourth quarter invoices. We expect this seasonality and resulting trends in cash flows from operating activities to continue.
Cash provided by operating activities of $3.6 million during 2014 was a result of significant increased revenue due to the growth of our business, although we have continued to make significant investments in headcount, including costs associated with public company reporting and corporate governance requirements,
59
and other expenses incurred to grow our business. During 2014, $32.7 million, or 121%, of our net loss of $27.1 million consisted of non-cash items, including $26.6 million in stock-based compensation, $6.6 million of depreciation and amortization, $0.7 million of bad debt expense, $2.8 million of deferred income taxes, and $0.8 million of amortization of premiums on marketable securities.
Cash provided by operating activities during 2014 also included an $8.0 million increase in accrued expenses attributable to increased expenses associated with the growth of the company as well as an increase in commissions due to the success the company has had with new customer acquisition. Additionally, cash provided by operating activities included an $8.0 million increase in deferred revenue as the number of new customers increased which resulted in higher monthly, quarterly and annual billings in 2014. Cash provided by operating activities was partially offset by cash used in operating activities resulting from a $13.9 million increase in accounts receivable attributable to higher billings in the fourth quarter of 2014 due to the growth in our customer base and fourth quarter revenue seasonality, a $4.2 million increase in prepaid and other current assets, which is primarily due to the remaining deposit of $3.7 million in an escrow account to fund payments to key Mainstreet employees for post-combination employment services related to the acquisition of Mainstreet.
Cash provided by operating activities of $9.0 million during 2013 was a result of significant increased revenue due to the growth of our business although we have continued to make significant investments in headcount, including costs associated with public company reporting and corporate governance requirements, and other expenses incurred to grow our business. During 2013, $20.8 million, or 116%, of our net loss of $18.0 million consisted of non-cash items, including $14.7 million in stock-based compensation, $4.4 million of depreciation and amortization, $0.5 million of bad debt expense, a $0.7 million write-off of an other current asset, and $0.6 million amortization of premiums on marketable securities.
Cash provided by operating activities during 2013 also included a $8.8 million increase in accrued expenses attributable to increased expenses associated with the growth of the company as well as an increase in commissions due to the success the company has had with new customer acquisition. Additionally, cash provided by operating activities included an $8.8 million increase in deferred revenue as the number of new customers increased which resulted in higher monthly, quarterly and annual billings in 2013. Cash provided by operating activities was partially offset by cash used in operating activities resulting from a $9.7 million increase in accounts receivable attributable to higher billings in the fourth quarter of 2013 due to the growth in our customer base and fourth quarter revenue seasonality, a $1.0 million increase in prepaid and other current assets due to an increase in business activity associated with the growth of our business and the timing of payments to vendors.
Cash provided by operating activities of $3.1 million during 2012 was a result of significant increased sales due to the growth of our business although we have continued to make significant investments in headcount, including costs associated with public company reporting and corporate governance requirements, and other expenses incurred to grow our business. During 2012, $11.5 million, or 267%, of our net loss of $4.3 million consisted of non-cash items, including $7.0 million in stock-based compensation, $3.4 million of depreciation and amortization, $0.4 million of the re-measurement of our preferred stock warrant liability and $0.4 million of deferred rent expense. Cash provided by operating activities during 2012 also included a $1.2 million increase in accrued expenses and a $1.0 million increase in accounts payable, both attributable to increased expenses associated with the growth of the company. Cash provided by operating activities was partially offset by cash used in operating activities resulting from a $2.3 million increase in accounts receivable attributable to higher billings in the fourth quarter of 2012 due to the growth in our customer base and fourth quarter revenue seasonality, a $1.0 million increase in prepaid and other current assets due to an increase in business activity associated with the growth of our business and the timing of payments to vendors, and a $3.2 million decrease in deferred revenue.
Net cash (used in) provided by investing activities. Our primary investing activities have consisted of purchases, offset by maturities of investments, purchases of computer equipment and furniture and fixtures in support of expanding our infrastructure and workforce, as well as funding acquisitions. As our business grows, we expect our capital expenditures, acquisitions and our investment activity to continue to increase.
60
For the year ended December 31, 2014, cash used in investing activities consisted of $91.0 million, comprised of $132.8 million for purchases of marketable securities and $9.2 million for purchases of property and equipment. Additionally, cash used in investing activities increased due to a total of $33.3 million in cash payments, net of cash acquired, for the acquisitions of Mainstreet and CQuotient. These cash outflows were partially offset by the sales and maturity of $84.2 million of marketable securities during 2014. In general, our purchases of property and equipment were primarily for data center equipment and network infrastructure to support our customer base, as well as equipment for supporting our increasing employee headcount.
For the year ended December 31, 2013, cash provided by investing activities consisted of $4.8 million, comprised primarily of $67.5 million of marketable securities maturing in 2013, which were partially offset by $56.9 million for purchases of marketable securities and $5.6 million for purchases of property and equipment. In general, our purchases of property and equipment were primarily for data center equipment and network infrastructure to support our customer base, as well as equipment for supporting our increasing employee headcount.
For the year ended December 31, 2012, cash used in investing activities consisted of $52.6 million, comprised primarily of $63.2 million for purchases of marketable securities and $3.8 million for purchases of property and equipment. These cash outflows were partially offset by the maturity of $14.8 million of marketable securities in 2012. In general, our purchases of property and equipment were primarily for data center equipment and network infrastructure to support our customer base, as well as equipment for supporting our increasing employee headcount.
Net cash provided by financing activities. Our primary financing activities have consisted of capital raised to fund our operations, contributions received from a noncontrolling interest, as well as proceeds from and payments on equipment debt obligations entered into to finance our property and equipment, primarily equipment used in our third party provided data centers.
For the year ended December 31, 2014, cash provided by financing activities of $4.8 million consisted of $6.8 million in proceeds from the exercise of stock options, $0.8 million in a contribution from a noncontrolling interest and $1.4 million in proceeds from shares purchased under our employee stock purchase plan, partially offset by $4.1 million in payments in connection with our equipment debt and software financing obligations.
For the year ended December 31, 2013, cash provided by financing activities of $169.4 million primarily consisted of $162.6 million of proceeds from our follow-on public offering, net of underwriting discounts and commissions but before offering expenses. In addition, cash provided by financing activities consisted of $7.9 million in proceeds from the exercise of stock options and $2.0 million in proceeds from a note payable in connection with the financing of property and equipment, partially offset by $3.7 million in payments in connection with our equipment debt and software financing obligations.
For the year ended December 31, 2012, cash provided by financing activities primarily consisted of $94.1 million of proceeds from our IPO, net of underwriting discounts and commissions but before offering expenses. In addition, cash provided by financing activities consisted of $1.3 million in proceeds from the exercise of stock options and $2.8 million in proceeds from a note payable in connection with the financing of property and equipment, partially offset by $3.1 million in payments in connection with our equipment debt and software financing obligations as well as $1.6 million in legal and audit fees associated with filing our registration statement.
61
Contractual Obligations and Commitments
Our principal commitments consist of obligations under our outstanding debt facilities, leases for our office space, computer equipment, furniture and fixtures, and contractual commitments for hosting and other support services. The following table summarizes these contractual obligations at December 31, 2014:
| Payment Due by Period | ||||||||||||||||||||
| Total | Less than
1 year |
1-3 years |
3-5 years |
More than
5 years |
||||||||||||||||
| (in thousands) | ||||||||||||||||||||
| Operating lease obligations |
$ | 18,941 | $ | 4,169 | $ | 7,937 | $ | 5,594 | $ | 1,241 | ||||||||||
| Hosting agreements |
6,122 | 4,377 | 1,745 | — | — | |||||||||||||||
|
|
|
|
|
|
|
|
|
|
|
|||||||||||
| $ | 25,063 | $ | 8,546 | $ | 9,682 | $ | 5,594 | $ | 1,241 | |||||||||||
|
|
|
|
|
|
|
|
|
|
|
|||||||||||
At December 31, 2014, liabilities for unrecognized tax benefits of $1.5 million which are attributable to research credits and interest and penalties, are not included in the table above because, due to their nature, there is a high degree of uncertainty regarding the timing of future cash outflows and other events that extinguish these liabilities.
Off-Balance Sheet Arrangements
During the periods presented, we did not have any relationships with unconsolidated entities or financial partnerships, such as entities often referred to as structured finance or special purpose entities, which would have been established for the purpose of facilitating off-balance sheet arrangements or other contractually narrow or limited purposes.
ITEM 7A. QUANTITATIVE AND QUALITATIVE DISCLOSURES ABOUT MARKET RISK
We have operations both within the United States and internationally, and we are exposed to market risks in the ordinary course of our business. These risks primarily include interest rate, foreign exchange and inflation risks, as well as risks relating to changes in the general economic conditions in the countries where we conduct business. To reduce certain of these risks, we monitor the financial condition of our large customers and limit credit exposure by collecting fees in advance and setting credit limits as we deem appropriate. In addition, our investment strategy currently has been to invest in financial instruments that are highly liquid and readily convertible into cash. We have invested $142.6 million in money market funds, certificates of deposit, and municipal securities with an average maturity of 44 days, classified as cash equivalents, and have invested $84.9 million in corporate bonds, municipal securities, certificates of deposit, and U.S. government agency bonds, classified as available-for-sale securities, with maturities ranging between four and 12 months as of December 31, 2014.
Interest Rate Risk
We are exposed to market risk related to changes in interest rates. Our investments are considered cash equivalents and primarily consist of money market funds backed by United States Treasury Bills and certificates of deposit. At December 31, 2014, we had cash and cash equivalents of $158.8 million. The carrying amount of our cash equivalents reasonably approximates fair value, due to the short maturities of these instruments. The primary objectives of our investment activities are the preservation of capital, the fulfillment of liquidity needs and the fiduciary control of cash and investments. We do not enter into investments for trading or speculative purposes. Our investments are exposed to market risk due to a fluctuation in interest rates, which may affect our interest income and the fair market value of our investments. Due to the short-term nature of our investment portfolio, however, we do not believe an immediate 10% increase or decrease in interest rates would have a material effect on the fair market value of our portfolio. We therefore do not expect our operating results or cash flows to be materially affected by a sudden change in market interest rates.
62
We do not believe our cash equivalents have significant risk of default or illiquidity. While we believe our cash equivalents do not contain excessive risk, we cannot provide absolute assurance that in the future our investments will not be subject to adverse changes in market value. In addition, we maintain significant amounts of cash and cash equivalents at one or more financial institutions that are in excess of federally insured limits. We cannot be assured that we will not experience losses on these deposits.
Foreign Currency Exchange Risk
We have foreign currency risks related to our revenue and operating expenses denominated in currencies other than the U.S. dollar. Our customer contracts are generally denominated in the currencies of the countries in which the customer is located. Our revenue has been denominated in U.S. dollars, Euros, British Pounds Sterling, Chinese Yuan Renminbi, Canadian dollars and Australian dollars. An immediate 10% adverse change in foreign exchange rates on foreign-denominated accounts receivable at December 31, 2014 would have a $1.5 million adverse impact on our total accounts receivable balance at December 31, 2014. Our operating expenses are generally denominated in the currencies of the countries in which our operations are located, primarily the United States and, to a lesser extent, Germany, the United Kingdom and France. More than one quarter of our employees are employed outside of the United States. Increases and decreases in our foreign denominated revenue from movements in foreign exchange rates are partially offset by the corresponding decreases or increases in our foreign-denominated operating expenses.
As our international operations grow, our risks associated with fluctuation in currency rates will become greater. In addition, currency fluctuations or a weakening U.S. Dollar can increase the costs of our international expansion. We will continue to reassess our approach to managing this risk. We do not enter into financial instruments for trading or speculative purposes.
Beginning in December 2014, we began to enter into short-term foreign currency forward contracts to offset foreign exchange gains and losses generated by the re-measurement of certain assets and liabilities recorded in non-functional currencies. Changes in the fair value of these derivatives, as well as re-measurement gains and losses, are recognized in other (expense) income, net. Foreign exchange rate fluctuations may adversely impact our consolidated financial position as the assets and liabilities of our foreign operations are translated into U.S. dollars in preparing our consolidated balance sheet. These gains or losses are recognized as an adjustment to stockholders’ equity which is reflected in our balance sheet under accumulated other comprehensive (loss) income.
Inflation Risk
We do not believe that inflation has had a material effect on our business, financial condition or results of operations. Nonetheless, if our costs were to become subject to significant inflationary pressures, we may not be able to fully offset such higher costs through price increases. Our inability or failure to do so could harm our business, financial condition and results of operations.
63
| ITEM 8. | FINANCIAL STATEMENTS AND SUPPLEMENTARY DATA |
INDEX TO CONSOLIDATED FINANCIAL STATEMENTS
| Page | ||||
| 65 | ||||
| FINANCIAL STATEMENTS |
||||
| 66 | ||||
| 67 | ||||
| 68 | ||||
| Consolidated Statements of Cash Flows—For the Years Ended December 31, 2014, 2013 and 2012 |
69 | |||
| 70 | ||||
64
REPORT OF INDEPENDENT REGISTERED PUBLIC ACCOUNTING FIRM
To the Board of Directors and Stockholders of
Demandware, Inc.
Burlington, Massachusetts
We have audited the accompanying consolidated balance sheets of Demandware, Inc. and subsidiaries (the “Company”) as of December 31, 2014 and 2013, and the related consolidated statements of operations and comprehensive loss, stockholders’ equity (deficit), and cash flows for each of the three years in the period ended December 31, 2014. These financial statements are the responsibility of the Company’s management. Our responsibility is to express an opinion on these financial statements based on our audits.
We conducted our audits in accordance with the standards of the Public Company Accounting Oversight Board (United States). Those standards require that we plan and perform the audit to obtain reasonable assurance about whether the financial statements are free of material misstatement. An audit includes examining, on a test basis, evidence supporting the amounts and disclosures in the financial statements. An audit also includes assessing the accounting principles used and significant estimates made by management, as well as evaluating the overall financial statement presentation. We believe that our audits provide a reasonable basis for our opinion.
In our opinion, such consolidated financial statements present fairly, in all material respects, the financial position of Demandware, Inc. and subsidiaries as of December 31, 2014 and 2013, and the results of their operations and their cash flows for each of the three years in the period ended December 31, 2014, in conformity with accounting principles generally accepted in the United States of America.
We have also audited, in accordance with the standards of the Public Company Accounting Oversight Board (United States), the Company’s internal control over financial reporting as of December 31, 2014, based on the criteria established in Internal Control—Integrated Framework (2013) issued by the Committee of Sponsoring Organizations of the Treadway Commission and our report dated March 2, 2015 expressed an adverse opinion on the Company’s internal control over financial reporting because of a material weakness.
/s/ DELOITTE & TOUCHE LLP
Boston, Massachusetts
March 2, 2015
65
DEMANDWARE, INC.
(in thousands, except per share data)
| December 31, 2014 |
December 31, 2013 |
|||||||
| (As revised) | ||||||||
| ASSETS |
||||||||
| Current assets: |
||||||||
| Cash and cash equivalents |
$ | 158,827 | $ | 242,425 | ||||
| Short-term investments |
84,880 | 37,133 | ||||||
| Accounts receivable—net of allowance for doubtful accounts of $525 and $459 at December 31, 2014 and 2013, respectively |
42,441 | 28,402 | ||||||
| Prepaid expenses and other current assets |
8,564 | 4,315 | ||||||
|
|
|
|
|
|||||
| Total current assets |
294,712 | 312,275 | ||||||
| Property and equipment, net |
14,028 | 9,790 | ||||||
| Goodwill |
24,379 | — | ||||||
| Intangible assets, net |
10,266 | — | ||||||
| Other assets |
1,785 | 1,866 | ||||||
|
|
|
|
|
|||||
| Total assets |
$ | 345,170 | $ | 323,931 | ||||
|
|
|
|
|
|||||
| LIABILITIES, REDEEMABLE NONCONTROLLING INTEREST AND STOCKHOLDERS’ EQUITY |
||||||||
| Current liabilities: |
||||||||
| Current portion of notes payable |
$ | — | $ | 2,727 | ||||
| Accounts payable |
3,581 | 3,174 | ||||||
| Accrued expenses |
24,871 | 17,362 | ||||||
| Deferred revenue |
22,799 | 18,280 | ||||||
| Other current liabilities |
282 | 184 | ||||||
|
|
|
|
|
|||||
| Total current liabilities |
51,533 | 41,727 | ||||||
|
|
|
|
|
|||||
| Long-term liabilities: |
||||||||
| Deferred revenue |
12,168 | 8,108 | ||||||
| Notes payable |
— | 1,524 | ||||||
| Other long-term liabilities |
1,424 | 884 | ||||||
|
|
|
|
|
|||||
| Total liabilities |
65,125 | 52,243 | ||||||
|
|
|
|
|
|||||
| Commitments and contingencies (Note 12) |
||||||||
| Redeemable noncontrolling interests |
823 | — | ||||||
|
|
|
|
|
|||||
| Stockholders’ equity: |
||||||||
| Preferred stock, $0.01 par value per share—10,000 shares authorized |
— | — | ||||||
| Common stock, $0.01 par value per share—240,000 shares authorized; 35,281 and 34,268 shares issued and 35,279 and 34,268 shares outstanding at December 31, 2014 and 2013, respectively |
353 | 343 | ||||||
| Additional paid-in capital |
391,896 | 356,766 | ||||||
| Treasury stock, at cost (2 shares at December 31, 2014) |
(137 | ) | — | |||||
| Accumulated other comprehensive (loss) income |
(352 | ) | 64 | |||||
| Accumulated deficit |
(112,538 | ) | (85,485 | ) | ||||
|
|
|
|
|
|||||
| Total stockholders’ equity |
279,222 | 271,688 | ||||||
|
|
|
|
|
|||||
| Total liabilities, redeemable noncontrolling interest and stockholders’ equity |
$ | 345,170 | $ | 323,931 | ||||
|
|
|
|
|
|||||
The accompanying notes are an integral part of these consolidated financial statements.
66
DEMANDWARE, INC.
CONSOLIDATED STATEMENTS OF OPERATIONS AND COMPREHENSIVE LOSS
(in thousands, except per share data)
| Year Ended December 31, | ||||||||||||
| 2014 | 2013 | 2012 | ||||||||||
| (As revised) | (As revised) | |||||||||||
| Revenue: |
||||||||||||
| Subscription |
$ | 145,879 | $ | 95,733 | $ | 67,930 | ||||||
| Services |
14,674 | 10,881 | 15,347 | |||||||||
|
|
|
|
|
|
|
|||||||
| Total revenue |
160,553 | 106,614 | 83,277 | |||||||||
| Cost of revenue: |
||||||||||||
| Subscription |
26,933 | 17,157 | 13,015 | |||||||||
| Services |
15,115 | 10,860 | 11,326 | |||||||||
|
|
|
|
|
|
|
|||||||
| Total cost of revenue |
42,048 | 28,017 | 24,341 | |||||||||
|
|
|
|
|
|
|
|||||||
| Gross profit |
118,505 | 78,597 | 58,936 | |||||||||
| Operating expenses: |
||||||||||||
| Sales and marketing |
74,432 | 52,384 | 33,496 | |||||||||
| Research and development |
34,983 | 20,787 | 15,085 | |||||||||
| General and administrative |
36,882 | 23,337 | 13,712 | |||||||||
|
|
|
|
|
|
|
|||||||
| Total operating expenses |
146,297 | 96,508 | 62,293 | |||||||||
|
|
|
|
|
|
|
|||||||
| Loss from operations |
(27,792 | ) | (17,911 | ) | (3,357 | ) | ||||||
| Other (expense) income: |
||||||||||||
| Interest income |
312 | 210 | 162 | |||||||||
| Interest expense |
(108 | ) | (255 | ) | (355 | ) | ||||||
| Other (expense) income |
(1,522 | ) | 528 | (351 | ) | |||||||
|
|
|
|
|
|
|
|||||||
| Other (expense) income, net |
(1,318 | ) | 483 | (544 | ) | |||||||
|
|
|
|
|
|
|
|||||||
| Loss before income taxes |
(29,110 | ) | (17,428 | ) | (3,901 | ) | ||||||
| Income tax (benefit) provision |
(2,050 | ) | 574 | 421 | ||||||||
|
|
|
|
|
|
|
|||||||
| Net loss |
(27,060 | ) | (18,002 | ) | (4,322 | ) | ||||||
| Net loss attributable to noncontrolling interest |
7 | — | — | |||||||||
|
|
|
|
|
|
|
|||||||
| Net loss attributable to Demandware |
(27,053 | ) | (18,002 | ) | (4,322 | ) | ||||||
| Accretion of redeemable preferred stock |
— | — | (1,172 | ) | ||||||||
|
|
|
|
|
|
|
|||||||
| Net loss attributable to Demandware common stockholders |
$ | (27,053 | ) | $ | (18,002 | ) | $ | (5,494 | ) | |||
|
|
|
|
|
|
|
|||||||
| Net loss per share attributable to Demandware common stockholders, basic and diluted |
$ | (0.78 | ) | $ | (0.58 | ) | $ | (0.23 | ) | |||
|
|
|
|
|
|
|
|||||||
| Weighted average number of common shares outstanding, basic and diluted |
34,806 | 30,795 | 24,063 | |||||||||
|
|
|
|
|
|
|
|||||||
| Other comprehensive (loss) income: |
||||||||||||
| Foreign currency translation adjustments |
(405 | ) | 93 | 22 | ||||||||
| Unrealized (loss) gain on marketable securities, net of tax |
(11 | ) | (12 | ) | 14 | |||||||
|
|
|
|
|
|
|
|||||||
| Total comprehensive loss |
(27,476 | ) | (17,921 | ) | (4,286 | ) | ||||||
| Total comprehensive loss attributable to noncontrolling interest |
7 | — | — | |||||||||
|
|
|
|
|
|
|
|||||||
| Total comprehensive loss attributable to Demandware |
$ | (27,469 | ) | $ | (17,921 | ) | $ | (4,286 | ) | |||
|
|
|
|
|
|
|
|||||||
The accompanying notes are an integral part of these consolidated financial statements.
67
DEMANDWARE, INC.
CONSOLIDATED STATEMENTS OF STOCKHOLDERS’ EQUITY (DEFICIT)
(in thousands)
| Common Stock $0.01 par value |
Treasury Stock | Additional Paid-In Capital |
Accumulated Other Comprehensive (Loss) Income |
Accumulated Deficit |
Total Stockholders’ Equity (Deficit) |
|||||||||||||||||||||||||||
| Shares | Amount | Shares | Amount | |||||||||||||||||||||||||||||
| (as revised) | (as revised) | |||||||||||||||||||||||||||||||
| BALANCE— January 1, 2012 as previously reported |
4,469 | $ 45 | $ | — | $ (53) | $ (84,612) | $ (84,620) | |||||||||||||||||||||||||
| Prior period revision |
5,403 | 5,403 | ||||||||||||||||||||||||||||||
|
|
|
|
|
|
|
|
|
|
|
|
|
|
|
|
|
|||||||||||||||||
| BALANCE— January 1, 2012 as revised |
4,469 | 45 | — | — | — | (53) | (79,209) | (79,217) | ||||||||||||||||||||||||
| Stock-based compensation |
7,043 | 7,043 | ||||||||||||||||||||||||||||||
| Exercise of common stock options |
913 | 9 | 1,273 | 1,282 | ||||||||||||||||||||||||||||
| Accretion of preferred stock to redemption value |
(17,220 | ) | 16,048 | (1,172 | ) | |||||||||||||||||||||||||||
| Vesting of restricted stock |
86 | 1 | (1 | ) | — | |||||||||||||||||||||||||||
| Exercise of common stock warrant |
20 | |||||||||||||||||||||||||||||||
| Issuance of common stock in connection with initial public offering, net of issuance costs of $3,279 |
6,325 | 63 | 90,774 | 90,837 | ||||||||||||||||||||||||||||
| Conversion of redeemable convertible preferred stock into common stock |
18,029 | 180 | 88,595 | 88,775 | ||||||||||||||||||||||||||||
| Reclassification of a warrant to purchase shares of redeemable convertible preferred stock into a warrant to purchase common stock |
533 | 533 | ||||||||||||||||||||||||||||||
| Net loss |
(4,322 | ) | (4,322 | ) | ||||||||||||||||||||||||||||
| Other comprehensive income |
36 | 36 | ||||||||||||||||||||||||||||||
|
|
|
|
|
|
|
|
|
|
|
|
|
|
|
|
|
|||||||||||||||||
| BALANCE—December 31, 2012 |
29,842 | 298 | — | — | 170,997 | (17 | ) | (67,483 | ) | 103,795 | ||||||||||||||||||||||
| Stock-based compensation |
14,688 | 14,688 | ||||||||||||||||||||||||||||||
| Exercise of common stock options |
1,247 | 13 | 7,935 | 7,948 | ||||||||||||||||||||||||||||
| Vesting of restricted stock |
167 | 2 | (2 | ) | — | |||||||||||||||||||||||||||
| Issuance of common stock through employee stock purchase program |
15 | 544 | 544 | |||||||||||||||||||||||||||||
| Issuance of common stock in connection with public offering, net of issuance costs of $482 |
2,997 | 30 | 162,604 | 162,634 | ||||||||||||||||||||||||||||
| Net loss |
(18,002 | ) | (18,002 | ) | ||||||||||||||||||||||||||||
| Other comprehensive income |
81 | 81 | ||||||||||||||||||||||||||||||
|
|
|
|
|
|
|
|
|
|
|
|
|
|
|
|
|
|||||||||||||||||
| BALANCE—December 31, 2013 |
34,268 | 343 | — | — | 356,766 | 64 | (85,485 | ) | 271,688 | |||||||||||||||||||||||
| Stock-based compensation |
26,348 | 26,348 | ||||||||||||||||||||||||||||||
| Nonemployee stock-based compensation |
553 | 553 | ||||||||||||||||||||||||||||||
| Exercise of common stock options |
572 | 6 | 6,842 | 6,848 | ||||||||||||||||||||||||||||
| Vesting of restricted stock |
414 | 4 | (4 | ) | — | |||||||||||||||||||||||||||
| Issuance of common stock through employee stock purchase program |
27 | 1,391 | 1,391 | |||||||||||||||||||||||||||||
| Treasury stock activity |
2 | (137 | ) | (137 | ) | |||||||||||||||||||||||||||
| Net loss attributable to Demandware |
(27,053 | ) | (27,053 | ) | ||||||||||||||||||||||||||||
| Other comprehensive loss |
(416 | ) | (416 | ) | ||||||||||||||||||||||||||||
|
|
|
|
|
|
|
|
|
|
|
|
|
|
|
|
|
|||||||||||||||||
| BALANCE—December 31, 2014 |
35,281 | $ 353 | 2 | $ | (137 | ) | $ | 391,896 | $ (352) | $ (112,538) | $ 279,222 | |||||||||||||||||||||
|
|
|
|
|
|
|
|
|
|
|
|
|
|
|
|
|
|||||||||||||||||
The accompanying notes are an integral part of these consolidated financial statements.
68
DEMANDWARE, INC.
CONSOLIDATED STATEMENTS OF CASH FLOWS
(in thousands)
| Year Ended December 31, | ||||||||||||
| 2014 | 2013 | 2012 | ||||||||||
| (As revised) | (As revised) | |||||||||||
| CASH FLOWS FROM OPERATING ACTIVITIES: |
||||||||||||
| Net loss |
$ | (27,060 | ) | $ | (18,002 | ) | $ | (4,322 | ) | |||
| Adjustments to reconcile net loss to net cash provided by operating activities: |
||||||||||||
| Depreciation and amortization |
6,601 | 4,385 | 3,439 | |||||||||
| Consulting expense settled with a restricted stock unit award |
553 | — | — | |||||||||
| Re-measurement of preferred stock warrant liability |
— | — | 426 | |||||||||
| Bad debt expense |
671 | 497 | — | |||||||||
| Stock-based compensation |
26,630 | 14,688 | 7,043 | |||||||||
| Deferred income taxes |
(2,798 | ) | — | — | ||||||||
| Amortization of premium on marketable securities |
802 | 564 | 174 | |||||||||
| Deferred rent expense |
141 | (33 | ) | 357 | ||||||||
| Write-off of other current asset |
— | 698 | — | |||||||||
| Other non-cash reconciling items |
126 | 22 | 35 | |||||||||
| Changes in operating assets and liabilities: |
||||||||||||
| Accounts receivable |
(13,856 | ) | (9,684 | ) | (2,285 | ) | ||||||
| Prepaid expenses and other current assets |
(4,207 | ) | (973 | ) | (1,011 | ) | ||||||
| Other long-term assets |
(399 | ) | (525 | ) | 203 | |||||||
| Accounts payable |
399 | (274 | ) | 1,016 | ||||||||
| Accrued expenses |
7,971 | 8,843 | 1,224 | |||||||||
| Deferred revenue |
8,045 | 8,841 | (3,219 | ) | ||||||||
|
|
|
|
|
|
|
|||||||
| Net cash provided by operating activities |
3,619 | 9,047 | 3,077 | |||||||||
|
|
|
|
|
|
|
|||||||
| CASH FLOWS FROM INVESTING ACTIVITIES: |
||||||||||||
| Purchase of property and equipment |
(9,162 | ) | (5,560 | ) | (3,846 | ) | ||||||
| Purchase of marketable securities |
(132,750 | ) | (56,921 | ) | (63,239 | ) | ||||||
| Sale and maturity of marketable securities |
84,191 | 67,464 | 14,828 | |||||||||
| Acquisition, net of cash acquired |
(33,264 | ) | — | — | ||||||||
| Increase in restricted cash and other assets |
(18 | ) | (171 | ) | (357 | ) | ||||||
|
|
|
|
|
|
|
|||||||
| Net cash (used in) provided by investing activities |
(91,003 | ) | 4,812 | (52,614 | ) | |||||||
|
|
|
|
|
|
|
|||||||
| CASH FLOWS FROM FINANCING ACTIVITIES: |
||||||||||||
| Proceeds from initial public offering, net of underwriting discounts and commissions |
— | — | 94,116 | |||||||||
| Proceeds from follow-on public offering, net of underwriting discounts and commissions |
— | 162,634 | — | |||||||||
| Proceeds from shares purchased under Employee Stock Purchase Plan |
1,391 | 544 | — | |||||||||
| Proceeds from exercise of stock options |
6,848 | 7,948 | 1,282 | |||||||||
| Deferred offering costs |
— | — | (1,604 | ) | ||||||||
| Proceeds from issuance of notes payable |
— | 1,997 | 2,757 | |||||||||
| Payments of equipment notes |
(3,345 | ) | (2,757 | ) | (2,674 | ) | ||||||
| Contribution from redeemable noncontrolling interests |
830 | — | — | |||||||||
| Treasury stock repurchase |
(137 | ) | — | — | ||||||||
| Payments of software financing agreement |
(766 | ) | (944 | ) | (471 | ) | ||||||
|
|
|
|
|
|
|
|||||||
| Net cash provided by financing activities |
4,821 | 169,422 | 93,406 | |||||||||
|
|
|
|
|
|
|
|||||||
| EFFECT OF EXCHANGE RATES ON CASH AND CASH EQUIVALENTS |
(1,035 | ) | 267 | 69 | ||||||||
|
|
|
|
|
|
|
|||||||
| (DECREASE) INCREASE IN CASH AND CASH EQUIVALENTS |
(83,598 | ) | 183,548 | 43,938 | ||||||||
| CASH AND CASH EQUIVALENTS—Beginning of year |
242,425 | 58,877 | 14,939 | |||||||||
|
|
|
|
|
|
|
|||||||
| CASH AND CASH EQUIVALENTS—End of year |
$ | 158,827 | $ | 242,425 | $ | 58,877 | ||||||
|
|
|
|
|
|
|
|||||||
| SUPPLEMENTARY INFORMATION: |
||||||||||||
| Interest paid |
$ | 101 | $ | 242 | $ | 282 | ||||||
|
|
|
|
|
|
|
|||||||
| Income taxes paid |
$ | 759 | $ | 297 | $ | 200 | ||||||
|
|
|
|
|
|
|
|||||||
| NONCASH INVESTING AND FINANCING ACTIVITIES: |
||||||||||||
| Conversion of redeemable convertible preferred stock to common stock |
$ | — | $ | — | $ | 88,775 | ||||||
| Conversion of preferred stock warrant to common stock warrant |
— | — | 533 | |||||||||
| Purchase of property and equipment included in accounts payable and accrued expenses |
669 | 554 | 350 | |||||||||
| Software license acquired by assuming directly related liabilities |
— | — | 1,212 | |||||||||
| Software license technical support acquired by assuming directly related liabilities |
— | 561 | 549 | |||||||||
|
|
|
|
|
|
|
|||||||
The accompanying notes are an integral part of these consolidated financial statements.
69
DEMANDWARE, INC.
NOTES TO CONSOLIDATED FINANCIAL STATEMENTS
1. ORGANIZATION AND BASIS OF PRESENTATION
Company Overview— Demandware, Inc. (the “Company”) provides enterprise-class cloud digital commerce solutions, which includes ecommerce, order management and predictive intelligence applications, for retailers and branded manufacturers. The Company’s solution, Demandware Commerce, is a combination of the Company’s cloud platform, community and related services that enables customers to establish and execute complex digital commerce strategies. These strategies include global expansion, multi-brand, multi-site rollouts, omni-channel and in-store operations as well as single platform, or unified commerce platform, strategies. The foundation of the Company’s solution is the Company’s technology platform, the Demandware Commerce Cloud. Through the Company’s highly scalable, secure and open Demandware Commerce Cloud, the Company’s customers create seamless brand experiences to reach their consumers across all digital touch points globally, including ecommerce sites, mobile applications, in-store solutions and point of sale.
The Company sells subscriptions to its cloud software and related services through both a direct sales force and indirect channels. The Company’s current customers consist of retailers and branded manufacturers that operate principally in the following vertical markets: apparel and footwear, health and beauty, home and garden, sporting goods, general merchandise and other categories.
The Company conducts its domestic operations through its headquarters in Burlington, Massachusetts and conducts its international operations through its direct and indirect subsidiaries in Germany, the United Kingdom, France, Sweden, Australia, China and Hong Kong and its joint venture in Japan.
Basis of Presentation and Consolidation—The consolidated financial statements include the accounts of the Company and those entities in which it has a controlling interest. All intercompany transactions have been eliminated in consolidation.
Changes in Presentation—Changes have been made to the presentation of deferred rent within the current and long-term liabilities of the consolidated balance sheets as these amounts are now included in other current liabilities and other long-term liabilities, respectively. Additionally, amortization of premium on marketable securities in the consolidated statement of cash flows previously included in other non-cash reconciling items is now presented as a separate line item in the current year presentation.
Correction of Immaterial Errors—In the fourth quarter of 2014, the Company conducted a reevaluation of its revenue recognition policy for implementation services. The Company determined that certain implementation services have standalone value and therefore it is appropriate to recognize revenue for these implementation services as the services are delivered, assuming all other revenue recognition criteria have been met. The Company has concluded that the revenue recognition policy previously applied beginning in 2011 for these implementation services, which deferred recognition of the related revenue ratably over the longer of the term of the subscription agreement or estimated expected life of the customer relationship, was inappropriate. Accordingly, the Company has corrected its accounting policy for service revenue recognition. The Company has concluded that the correction of the errors was not material to any of the previously issued annual or interim financial statements. However, to facilitate period-over-period comparisons, the Company has revised its previously issued financial statements contained in this Annual Report on Form 10-K to reflect the corrections of these immaterial errors for the corresponding periods.
70
The following table presents the impact of these corrections on its consolidated statements of operations and comprehensive loss for the years ended December 31, 2013 and 2012 (in thousands, except per share data):
| For the Year Ended December 31, 2013 | For the Year Ended December 31, 2012 | |||||||||||||||||||||||
| As Previously Reported |
Adjustment | As Revised | As Previously Reported |
Adjustment | As Revised | |||||||||||||||||||
| Revenue: |
||||||||||||||||||||||||
| Services |
$ | 8,003 | $ | 2,878 | $ | 10,881 | $ | 11,545 | $ | 3,802 | $ | 15,347 | ||||||||||||
|
|
|
|
|
|
|
|
|
|
|
|
|
|||||||||||||
| Total revenue |
103,736 | 2,878 | 106,614 | 79,475 | 3,802 | 83,277 | ||||||||||||||||||
|
|
|
|
|
|
|
|
|
|
|
|
|
|||||||||||||
| Gross profit |
75,719 | 2,878 | 78,597 | 55,134 | 3,802 | 58,936 | ||||||||||||||||||
|
|
|
|
|
|
|
|
|
|
|
|
|
|||||||||||||
| Net loss |
$ | (20,880 | ) | $ | 2,878 | $ | (18,002 | ) | $ | (8,124 | ) | $ | 3,802 | $ | (4,322 | ) | ||||||||
|
|
|
|
|
|
|
|
|
|
|
|
|
|||||||||||||
| Net loss attributable to common stockholders |
$ | (20,880 | ) | $ | 2,878 | $ | (18,002 | ) | $ | (9,296 | ) | $ | 3,802 | $ | (5,494 | ) | ||||||||
|
|
|
|
|
|
|
|
|
|
|
|
|
|||||||||||||
| Net loss per share attributable to common stockholders, basic and diluted |
$ | (0.68 | ) | $ | 0.10 | $ | (0.58 | ) | $ | (0.39 | ) | $ | 0.16 | $ | (0.23 | ) | ||||||||
|
|
|
|
|
|
|
|
|
|
|
|
|
|||||||||||||
| Comprehensive loss |
$ | (20,799 | ) | $ | 2,878 | $ | (17,921 | ) | $ | (8,088 | ) | $ | 3,802 | $ | (4,286 | ) | ||||||||
|
|
|
|
|
|
|
|
|
|
|
|
|
|||||||||||||
The following table presents the impact of these corrections on its consolidated balance sheet items as of December 31, 2013 (in thousands):
| For the Year Ended December 31, 2013 | ||||||||||||
| As
Previously Reported |
Adjustment | As Revised | ||||||||||
| Current liabilities: |
||||||||||||
| Deferred revenue |
$ | 19,609 | $ | (1,329 | ) | $ | 18,280 | |||||
|
|
|
|
|
|
|
|||||||
| Total current liabilities |
$ | 43,056 | $ | (1,329 | ) | $ | 41,727 | |||||
|
|
|
|
|
|
|
|||||||
| Long-term liabilities: |
||||||||||||
| Deferred revenue |
$ | 18,862 | $ | (10,754 | ) | $ | 8,108 | |||||
|
|
|
|
|
|
|
|||||||
| Total liabilities: |
$ | 64,326 | $ | (12,083 | ) | $ | 52,243 | |||||
|
|
|
|
|
|
|
|||||||
| Stockholders’ equity: |
||||||||||||
| Accumulated deficit |
$ | (97,568 | ) | $ | 12,083 | $ | (85,485 | ) | ||||
|
|
|
|
|
|
|
|||||||
| Total stockholders’ equity: |
$ | 259,605 | $ | 12,083 | $ | 271,688 | ||||||
|
|
|
|
|
|
|
|||||||
| Total liabilities and stockholders’ equity: |
$ | 323,931 | $ | — | $ | 323,931 | ||||||
|
|
|
|
|
|
|
|||||||
The impact of these corrections on its consolidated statements of cash flows for the years ended December 31, 2013 and 2012 were decreases to the Company’s net losses and decreases in the change of deferred revenue by $2.9 million and $3.8 million, respectively, within cash flows from operating activities. There was no change to the total net cash provided by operating activities for the years ended December 31, 2013 and 2012.
The effect of the error in the statement of operations for the year ended December 31, 2011 was an increase to service revenue and total revenue of $5.4 million and a change from a net loss of $6.7 million to a net loss of $1.3 million. Net loss per share attributable to common stockholders, basic and diluted, decreased from $1.75 per share to $0.34 per share for the year ended December 31, 2011. Total deferred revenue and accumulated deficit decreased by $9.2 million and $5.4 million at December 31, 2012 and 2011, respectively. Working capital increased by $0.9 million and $0.4 million at December 31, 2012 and 2011, respectively.
71
2. SUMMARY OF SIGNIFICANT ACCOUNTING POLICIES
Use of Estimates—The preparation of consolidated financial statements in conformity with accounting principles generally accepted in the United States of America (“GAAP”) requires management to make estimates and assumptions that affect the reported amounts of assets and liabilities and disclosure of contingent assets and liabilities at the date of the financial statements and the reported amounts of revenue, cost of revenue, and expenses during the reporting period. Actual results could differ from those estimates.
Foreign Currency Translation—The functional currency of the Company’s foreign subsidiaries is the local currency. All assets and liabilities denominated in a foreign currency are translated into U.S. dollars at the exchange rate on the balance sheet date. Revenue and expenses are translated at the average exchange rate during the period. Translation gains or losses are included as a component of accumulated other comprehensive (loss) income in stockholders’ equity (deficit). Transaction gains or losses that arise from exchange rate fluctuations on transactions denominated in a currency other than the functional currency are included in other income (expense) in the accompanying consolidated results of operations as incurred. For the years ended December 31, 2014, 2013 and 2012, foreign currency transaction (losses) gains of ($1.7) million, $0.6 million, and $0.1 million, respectively, are included in other expenses in the accompanying consolidated statements of operations and comprehensive loss.
Business Combination—The Company allocates the purchase price to the assets acquired and the liabilities assumed at their estimated fair values as of the date of the acquisition with any excess of the purchase price paid over the estimated fair value of net assets acquired recorded as goodwill. The fair value of the assets acquired and liabilities assumed is typically determined by using either estimates of replacement costs or multiple period excess earnings methods. Contingent payments that are dependent upon post-combination services, if any, are considered separate transactions outside of the business combination and therefore included in the post-combination operating results. Transaction costs in connection with the acquisition are recorded as operating expenses.
Cash Equivalents and Short-Term Investments—The Company considers all highly liquid investments maturing within 90 days from the date of purchase to be the equivalent of cash for the purpose of balance sheet and statement of cash flows presentation. As of December 31, 2014, $140.1 million of the Company’s cash equivalents were invested in money market funds, and $2.5 million in marketable securities. As of December 31, 2013, $226.1 million of the Company’s cash equivalents were invested in money market funds and $3.0 million in marketable securities.
Short-term investments in marketable securities are classified as available-for-sale and mature within 12 months from the date of purchase. The Company’s investments in marketable securities are recorded at fair value, with any unrealized gains and losses, net of taxes, reported as a component of stockholders’ equity until realized or until a determination is made that an other-than-temporary decline in market value has occurred. When the Company determines that an other-than-temporary decline has occurred for debt securities that the Company does not then intend to sell, the Company recognizes the credit loss component of an other-than-temporary impairment in other income (expense) and the remaining portion in other comprehensive loss. The credit loss component is identified as the amount of the present value of cash flows not expected to be received over the remaining term of the security, based on cash flow projections. In determining whether an other-than-temporary impairment exists, the Company considers: (i) the length of time and the extent to which the fair value has been less than cost; (ii) the financial condition and near-term prospects of the issuer of the securities; and (iii) the Company’s intent and ability to retain the security for a period of time sufficient to allow for any anticipated recovery in fair value. The cost of marketable securities sold is determined based on the specific identification method and any realized gains or losses on the sale of investments are reflected as a component of interest income or expense.
72
Accounts Receivable—Accounts receivable represent trade receivables from customers when the Company has invoiced for software subscriptions and/or services and it has not yet received payment. The Company maintains an allowance for doubtful accounts for the estimated probable losses on uncollectible accounts receivable, and presents accounts receivable net of this allowance. The allowance is based upon a number of factors including the credit worthiness of customers, the Company’s historical experience with customers, the age of the receivable and current market and economic conditions. Such factors are reviewed and updated by the Company on a quarterly basis. Account balances are written off against the allowance after all means of collection have been exhausted and the potential for recovery is considered remote.
Activity within the allowance for doubtful accounts is as follows, (in thousands):
| Years Ended December 31, | ||||||||||||
| 2014 | 2013 | 2012 | ||||||||||
| Balance at beginning of year |
$ | 459 | $ | — | $ | — | ||||||
| Charges |
671 | 497 | — | |||||||||
| Write-offs |
(605 | ) | (38 | ) | — | |||||||
|
|
|
|
|
|
|
|||||||
| Balance at end of year |
$ | 525 | $ | 459 | $ | — | ||||||
|
|
|
|
|
|
|
|||||||
Derivative Instruments—The Company is exposed to foreign currency exchange rate risk relating to its ongoing business operations. Forward contracts on various foreign currencies are entered into to manage the foreign currency exchange rate risk and are intended to offset economic exposures of the Company. The Company does not use derivative financial instruments for trading or speculative purposes. The Company does not designate these forward contracts as hedging instruments and these contracts are carried at fair value with changes in value recorded in operations. Cash flows from these forward contracts are reported in the consolidated statement of cash flows under cash flows from operating activities. See Note 6 for further discussion.
Concentrations of Credit Risk and Significant Customers—Financial instruments that potentially expose the Company to concentrations of credit risk include cash, cash equivalents, marketable securities, foreign currency forward contracts and accounts receivable. The Company maintains substantially all of its cash, cash equivalents, marketable securities and foreign currency forward contracts with financial institutions that management believes have high credit standings. To manage credit risk related to accounts receivable, the Company evaluates the allowances for potential credit losses. To date, losses resulting from uncollected receivables have not exceeded management’s expectations.
As of December 31, 2014, no single customer comprised more than 10% of accounts receivable. As of December 31, 2013, the Company had one reseller representing 12% of accounts receivable. During the years ended December 31, 2014, 2013, and 2012, no single customer comprised more than 10% of the Company’s revenue.
Property and Equipment—Property and equipment are recorded at cost and depreciated using the straight-line method over the estimated useful lives of the related assets, which ranges from three to five years. Leasehold improvements are amortized over the lesser of the term of the lease or the useful life of the asset. When assets are retired or disposed of, the assets and related accumulated depreciation are eliminated from the accounts and any resulting gain or loss is included in the determination of net income or loss. Maintenance and repair expenditures are charged to expense as incurred.
Research and Development and Internal Use Software—Research and development expenses consist primarily of personnel and related expenses for the Company’s research and development staff, including salaries, benefits, bonuses and stock-based compensation and the cost of certain third party contractor costs. Expenditures for research and development, other than internal use software costs, are expensed as incurred.
73
Software development costs associated with internal use software are capitalized when the preliminary project stage is completed, management has decided to make the project a part of its future offering, and the software will be used to perform the function intended. These capitalized costs include external direct costs of services consumed in developing or obtaining internal-use software, personnel and related expenses for employees who are directly associated with and who devote time to internal-use software projects. Capitalization of these costs cease once the project is substantially complete and the software is ready for its intended purpose. Post-configuration training and maintenance costs are expensed as incurred. Capitalized internal use software costs are amortized to cost of revenue using a straight-line method over its estimated useful life of four years, commencing when the software is ready for its intended use.
During the years ended December 31, 2014 and 2013, no internal use software development cost was capitalized. During the year ended December 31, 2012, $0.2 million of internal use software development cost was capitalized. Capitalized internal use software is included in property and equipment.
Amortization expense related to internal use software totaled $0.2 million, $0.2 million and $0.1 during the years ended December 31, 2014, 2013 and 2012, respectively. The net book value of capitalized internal use software at December 31, 2014 and 2013 was $0.4 million and $0.6 million, respectively.
Segment and Geographic Information—Operating segments are defined as components of an enterprise for which discrete financial information is available that is evaluated on a regular basis by the chief operating decision maker, or decision making group, in deciding how to allocate resources and assess performance. The Company’s chief operating decision maker (“CODM”) is the Chief Executive Officer. The CODM reviews consolidated operating results to make decisions about allocating resources and assessing performance for the entire Company. The CODM views the Company’s operations and manages its business as one operating segment.
Information about the Company’s operations in different geographic regions is presented in the tables below (in thousands):
| Year Ended December 31, | ||||||||||||
| 2014 | 2013 | 2012 | ||||||||||
| (As revised) | (As revised) | |||||||||||
| Revenue: |
||||||||||||
| United States |
$ | 99,085 | $ | 63,155 | $ | 47,147 | ||||||
| Germany |
22,218 | 16,521 | 20,578 | |||||||||
| United Kingdom |
18,328 | 13,130 | 9,100 | |||||||||
| All other international |
20,922 | 13,808 | 6,452 | |||||||||
|
|
|
|
|
|
|
|||||||
| Total revenue |
$ | 160,553 | $ | 106,614 | $ | 83,277 | ||||||
|
|
|
|
|
|
|
|||||||
| Long-lived assets (at year end): |
||||||||||||
| United States |
23,214 | 8,814 | 7,976 | |||||||||
| Germany |
455 | 362 | 303 | |||||||||
| United Kingdom |
429 | 554 | 15 | |||||||||
| All other international |
196 | 60 | 83 | |||||||||
|
|
|
|
|
|
|
|||||||
| Total long-lived assets |
$ | 24,294 | $ | 9,790 | $ | 8,377 | ||||||
|
|
|
|
|
|
|
|||||||
Goodwill and Purchased Intangible Assets—Goodwill represents the excess of the purchase price in a business combination over the fair value of net tangible and intangible assets acquired. Goodwill is reviewed for impairment at least annually or whenever events or changes in circumstances indicate that the carrying value of the goodwill may not be recoverable. The Company’s annual impairment assessment date is November 30 of each fiscal year. The Company has determined that there is a single reporting unit for the purpose of goodwill impairment tests. The Company utilizes the two-step impairment test when testing goodwill for impairment.
74
Under the first step of this test, the Company compares the fair value of the entity to its carrying value. If the carrying value exceeds the fair value, the Company conducts the second step of this test, in which the implied fair value of the goodwill is compared to its carrying amount. If the carrying amount of goodwill exceeds its implied fair value, an impairment loss would be recognized for the amount of the excess. During the year ended December 31, 2014, no potential impairment was identified under the first step of the test as the fair value of the entity was in excess of its carrying value. There was no goodwill at December 31, 2013.
Purchased intangible assets represent those acquired from business combinations and are deemed to have a definite life. They are amortized over their useful lives, generally ranging from three to five years. The Company evaluates intangible assets for impairment whenever events or changes in circumstances indicate the carrying value of an asset or asset group may not be recoverable. During the year ended December 31, 2014, no such impairment indicator was identified. There were no purchased intangible assets at December 31, 2013.
Revenue Recognition—The Company generates revenue from sales of its digital commerce solutions that leverage its proprietary technology, which are represented by subscription fees for its ecommerce, order management and predictive intelligence solutions, activation fees and related professional services. Professional services include implementation services, consulting services to support its customers once they are live on the Company’s solution and training.
The Company recognizes revenue when persuasive evidence of an arrangement exists, delivery to customers has occurred or services have been rendered, the fee is fixed or determinable, and collectability is reasonably assured. The Company does not recognize revenue in excess of the amounts for which it has the right to invoice in an annual subscription year.
In most instances, revenue from new customer acquisition is generated under sales agreements with multiple elements, comprised of subscription fees, related activation fees that allow customers to access the solutions, and professional services. The Company evaluates each element in a multiple-element arrangement to determine whether it represents a separate unit of accounting. An element constitutes a separate unit of accounting when the delivered item has standalone value and delivery of the undelivered element is probable and within the Company’s control. Subscriptions have standalone value because they are routinely sold separately by the Company.
Other than the Company’s site readiness assessment offering, the Company’s professional services have standalone value because the Company has sold professional services separately or there are third party vendors that routinely provide similar professional services to its customers on a standalone basis. The Company does not have evidence of standalone value for site readiness assessments because they are not sold on a standalone basis and can only be provided by the Company.
Activation fees provide access to the Company’s digital environment through production launch and are billed during the implementation phase and recorded as deferred revenue until a customer’s subscription period has commenced. Activation fees do not have standalone value because they are only sold in conjunction with a subscription to our ecommerce solutions, they are only sold by the Company, a customer could not resell it, and they do not represent the culmination of a separate earnings process.
The Company allocates revenue to each element in an arrangement based on a selling price hierarchy. The selling price for a deliverable is based on its vendor-specific objective evidence (“VSOE”), if available, third party evidence (“TPE”), if VSOE is not available, or best estimated selling price (“BESP”), if neither VSOE nor TPE is available. As the Company has been unable to establish VSOE or TPE for the elements of its arrangements, the Company establishes the BESP for each element primarily by considering the weighted average of actual sales prices of professional services sold on a standalone basis and subscriptions including various add-on modules when sold together without professional services, and other factors such as gross margin objectives, pricing practices and growth strategy.
75
Subscriptions include fees derived from contractually committed minimum levels of gross revenue processed by ecommerce customers on the Company’s cloud digital commerce platform, and fees derived from such customers’ gross revenue processed above the minimum contracted levels. Customers do not have the contractual right to take possession of the Company’s cloud software. The consideration allocated to the subscription for the aggregate minimum subscription fee is recognized on a straight-line basis over the subscription term once a customer’s subscription period has commenced. Should an ecommerce customer exceed the specified minimum levels of gross revenue processed, fees for customer gross revenue processed in excess of the committed minimum level are billed for the excess volume. The Company recognizes revenue from the fees it receives for its customers’ gross revenue processed in excess of the committed minimum level in the period in which such gross revenue is processed and earned.
Activation fees and site readiness assessments without standalone value are recognized ratably over the longer of the life of the agreement or the expected customer life, which is currently estimated to be just over six years. The Company evaluates the length of the amortization period based on our experience with customer contract renewals and consideration of the period over which those customers will benefit from the related offerings.
The consideration allocated to professional services with standalone value is recognized as revenue using the proportional performance method.
Deferred revenue primarily consists of the unearned portion of billed subscription and services fees. Once a customer’s subscription period has commenced, the Company typically invoices customers on a monthly or quarterly basis. In addition, the Company often invoices the first year subscription fee in advance upon customer contract execution as an initiation payment. Initiation payments are included in deferred revenue upon payment.
Reimbursable costs received for out-of-pocket expenses are recorded as revenue and cost of revenue in the consolidated statements of operations and comprehensive loss. Sales taxes collected from customers and remitted to government authorities are excluded from revenue.
Cost of Revenue—Cost of subscription revenue primarily consists of hosting costs, data communications expenses, depreciation expenses associated with computer equipment, personnel and related costs, including salaries, bonuses, payroll taxes, recruiting fees and stock compensation, software license fees and amortization expenses associated with capitalized software. In addition, the Company allocates a portion of overhead, such as rent, IT costs, depreciation and amortization and employee benefits costs, to cost of revenue based on headcount.
Cost of services revenue primarily consists of personnel and related costs, third party contractors and allocated overhead. The Company’s cost of services revenue is expensed as the costs are incurred.
Impairment of Long-Lived Assets—The Company considers whether indicators of impairment of its long-lived assets are present. If such indicators are present, the Company determines whether the sum of the estimated undiscounted future cash flows attributable to such assets is less than their carrying amount, and if so, the Company recognizes an impairment loss based on the excess of the carrying amount of the assets over their fair value. To date, no such impairment has occurred.
Advertising—Advertising costs are charged to operations as incurred and include direct marketing, events, public relations, sales collateral materials and partner programs. Advertising expense was approximately $8.4 million, $6.2 million and $4.0 million for the years ended December 31, 2014, 2013 and 2012, respectively.
Income Taxes—Deferred tax assets and liabilities are recognized based on temporary differences between the financial reporting and income tax bases of assets and liabilities using rates anticipated to be in effect when such temporary differences reverse. A valuation allowance against deferred tax assets is recorded, based upon the available evidence, if it is more likely than not that some or all of the deferred tax assets will not be realized. The
76
Company assesses its income tax positions and records tax benefits based upon management’s evaluation of the facts, circumstances, and information available at the reporting date. For those tax positions where it is more likely than not that a tax benefit will be sustained, the Company records the largest amount of tax benefit with a greater than 50 percent likelihood of being realized upon ultimate settlement with a taxing authority having full knowledge of all relevant information. For those income tax positions where it is not more likely than not that a tax benefit will be sustained, no tax benefit is recognized in the financial statements. The unrecognized tax benefits are currently presented as a reduction to the deferred tax assets in the financial statements, unless the uncertainty is expected to be resolved within one year. Potential interest and penalties associated with such uncertain tax positions are recorded as a component of income tax expense.
Stock-Based Compensation—The Company accounts for all stock options granted to employees and nonemployees using a fair value method. The Black-Scholes option pricing model is used to determine the fair value of the award, which is then recognized on a straight-line basis over the requisite services period, which is the vesting period of the award. The measurement date for employee awards is the date of the grant, and the measurement date for nonemployee awards is the date the performance or services are completed.
Other Comprehensive (Loss) Income—Other comprehensive (loss) income consists of foreign currency translation adjustments and unrealized gains or losses on marketable securities.
Warranties—The Company includes service level commitments to its customers warranting certain levels of uptime reliability and performance and permitting those customers to receive credits in the event that the Company fails to meet those levels. To date, the Company has not incurred any material costs as a result of such commitments.
Commissions—The Company recognizes commission expense related to subscriptions in the period in which the contract is signed.
Recent Accounting Pronouncements—In May 2014, the Financial Accounting Standards Board issued Accounting Standards Update (“ASU”) No. 2014-09, “Revenue from Contracts with Customers”. The comprehensive new standard will supersede existing revenue recognition guidance and require revenue to be recognized when promised goods or services are transferred to customers in amounts that reflect the consideration to which the Company expects to be entitled in exchange for those goods or services. The guidance will also require that certain contract costs incurred to obtain or fulfill a contract, such as sales commissions, be capitalized as an asset and amortized as revenue is recognized. Adoption of the new rules could affect the timing of both revenue recognition and the recognition of contract costs for certain transactions. The guidance permits two implementation approaches, one requiring retrospective application of the new standard with restatement of prior years and one requiring prospective application of the new standard with disclosure of results under old standards. For the Company, the new standard will be effective January 1, 2017. The Company is currently evaluating the impact of adoption and the implementation approach to be used.
77
3. NET LOSS PER SHARE ATTRIBUTABLE TO COMMON SHAREHOLDERS
The Company calculates basic and diluted net loss per common share by dividing the net loss by the weighted average number of common shares outstanding during the period. The Company has excluded all potentially dilutive shares, which include outstanding common stock options and unvested restricted stock, from the weighted average number of common shares outstanding as their inclusion in the computation for all periods would be anti-dilutive due to net losses. The Company’s unvested restricted stock awards are not considered participating securities under the authoritative guidance since any dividends earned on unvested restricted shares are required to be returned if unvested shares are forfeited. The following common stock equivalents were excluded from the computation of diluted net loss per share attributable to common stockholders because they had an antidilutive impact (in thousands):
| Year Ended December 31, | ||||||||||||
| 2014 | 2013 | 2012 | ||||||||||
| Options to purchase common stock |
2,586 | 3,652 | 4,421 | |||||||||
| Nonvested restricted stock |
1,194 | 880 | 341 | |||||||||
4. BUSINESS COMBINATION
Mainstreet Commerce LC—On January 22, 2014, the Company acquired 100% of the equity of Mainstreet Commerce LC (“Mainstreet”), a provider of cloud-based distributed order management solutions, for total cash consideration of $19.4 million, of which $10.0 million was held in escrow and is being released ratably in quarterly payments through January 2016. $7.0 million of the amount in escrow is reserved for payments to key Mainstreet employees for post-combination employment services, and therefore is recorded as a prepayment in the Company’s consolidated balance sheet, and will be recognized in the Company’s post-combination financial statements as compensation expense over the employment period. The remaining $3.0 million in escrow is being withheld following the close of the transaction as protection against certain losses the Company may incur in the event of certain breaches of representations, warranties and covenants and other specified claims set forth in the purchase agreement, and therefore is included in the purchase price of $12.4 million. For the year ended December 31, 2014, the Company incurred transaction costs in connection with the acquisition of $0.1 million, which are included in general and administrative expenses.
Under the acquisition method of accounting, the Company allocated the purchase price to the identifiable assets and liabilities based on their estimated fair value, which was determined by management using the information available as of the date of the acquisition (Level 3 inputs). The allocation of the Mainstreet purchase consideration to the assets acquired and liabilities assumed was as follows (in thousands):
| Cash |
$ | 261 | ||
| Accounts receivable |
511 | |||
| Developed technology |
2,500 | |||
| Customer relationships |
300 | |||
| Trademarks |
10 | |||
| Goodwill |
8,966 | |||
| Other assets / liabilities, net |
(151 | ) | ||
|
|
|
|||
| Total purchase consideration |
$ | 12,397 | ||
|
|
|
Methodologies used in valuing the intangible assets include, but are not limited to, the replacement cost method for customer relationships, relief from royalty for trademarks and multiple period excess earnings method for developed technology. The excess of the purchase price over the total net identifiable assets has been recorded as goodwill, which includes synergies expected from the expanded service capabilities and the value of the assembled work force in accordance with GAAP. For federal income tax purposes, the transaction is treated as an asset acquisition. The goodwill resulting from this transaction is expected to be deductible for tax purposes.
78
CQuotient, Inc.—On October 9, 2014, the Company acquired 100% of the equity of CQuotient, Inc. (“CQuotient”), a cloud personalization provider, for cash consideration of approximately $21.5 million, of which $3.2 million was held in escrow to secure certain indemnification and other obligations of the sellers and is going to be released 18 months from the acquisition date. Additional consideration of up to $3.4 million, payable in cash or shares of the Company’s common stock at the option of the Company, is payable to certain employees in 2 to 3 years contingent upon their continued employment. This consideration will be recognized in the Company’s post-combination financial statements as compensation expense over the employment period. For the year ended December 31, 2014, the Company incurred transaction costs in connection with the acquisition of $0.4 million, which are included in general and administrative expenses.
Under the acquisition method of accounting, the Company allocated the purchase price to the identifiable assets and liabilities based on their estimated fair value, which was determined by management using the information available as of the date of the acquisition (Level 3 inputs). The allocation of the CQuotient purchase consideration to the assets acquired and liabilities assumed was as follows (in thousands):
| Cash |
$ | 353 | ||
| Accounts receivable |
343 | |||
| Developed technology |
8,500 | |||
| Customer relationships |
300 | |||
| Deferred revenue |
(366 | ) | ||
| Deferred tax liabilities |
(3,020 | ) | ||
| Goodwill |
15,413 | |||
| Other assets / liabilities, net |
(42 | ) | ||
|
|
|
|||
| Total purchase consideration |
$ | 21,481 | ||
|
|
|
Methodologies used in valuing the intangible assets include, but are not limited to, the replacement cost method for customer relationships and multiple period excess earnings method for developed technology. The excess of the purchase price over the total net identifiable assets has been recorded as goodwill, which includes synergies expected from the expanded service capabilities and the value of the assembled work force in accordance with GAAP. For federal income tax purposes, the transaction is treated as a stock acquisition. The goodwill resulting from this transaction is not expected to be deductible for tax purposes.
The Company has not furnished pro forma financial information related to these acquisitions because they are not material, individually or in the aggregate, to the Company’s consolidated results of operations. The Company has not disclosed the amounts of revenue and earnings of these acquirees included in the consolidated statement of operations for the year ended December 31, 2014 since the acquisition date because they are not material, individually and in the aggregate, to the Company’s consolidated results of operations.
79
5. CASH EQUIVALENTS AND SHORT-TERM INVESTMENTS
A summary of the Company’s cash equivalents and short-term investments at December 31, 2014 is as follows (in thousands):
| Amortized Cost | Unrealized Gains | Unrealized Losses | Fair Value | |||||||||||||
| Cash Equivalents: |
||||||||||||||||
| Money market funds |
$ | 140,107 | $ | — | $ | — | $ | 140,107 | ||||||||
| Certificates of deposit |
498 | — | — | 498 | ||||||||||||
| Municipal securities |
2,015 | — | — | 2,015 | ||||||||||||
|
|
|
|
|
|
|
|
|
|||||||||
| $ | 142,620 | $ | — | $ | — | $ | 142,620 | |||||||||
|
|
|
|
|
|
|
|
|
|||||||||
| Short-Term Investments: |
||||||||||||||||
| U.S. government agency bonds |
$ | 21,304 | $ | 1 | $ | (2 | ) | $ | 21,303 | |||||||
| Corporate bonds |
6,895 | — | (3 | ) | 6,892 | |||||||||||
| Municipal securities |
29,383 | 2 | (7 | ) | 29,378 | |||||||||||
| Certificates of deposit |
27,307 | — | — | 27,307 | ||||||||||||
|
|
|
|
|
|
|
|
|
|||||||||
| $ | 84,889 | $ | 3 | $ | (12 | ) | $ | 84,880 | ||||||||
|
|
|
|
|
|
|
|
|
|||||||||
A summary of the Company’s cash equivalents and short-term investments at December 31, 2013 is as follows (in thousands):
| Amortized Cost | Unrealized Gains | Unrealized Losses | Fair Value | |||||||||||||
| Cash Equivalents: |
||||||||||||||||
| Money market funds |
$ | 226,130 | $ | — | $ | — | $ | 226,130 | ||||||||
| Certificates of deposit |
998 | — | — | 998 | ||||||||||||
| Municipal securities |
2,000 | — | — | 2,000 | ||||||||||||
|
|
|
|
|
|
|
|
|
|||||||||
| $ | 229,128 | $ | — | $ | — | $ | 229,128 | |||||||||
|
|
|
|
|
|
|
|
|
|||||||||
| Short-Term Investments: |
||||||||||||||||
| U.S. government agency bonds |
$ | 4,500 | $ | 1 | $ | — | $ | 4,501 | ||||||||
| Corporate bonds and commercial paper |
3,318 | — | (1 | ) | 3,317 | |||||||||||
| Municipal securities |
19,701 | 4 | (2 | ) | 19,703 | |||||||||||
| Certificates of deposit |
9,612 | 1 | (1 | ) | 9,612 | |||||||||||
|
|
|
|
|
|
|
|
|
|||||||||
| $ | 37,131 | $ | 6 | $ | (4 | ) | $ | 37,133 | ||||||||
|
|
|
|
|
|
|
|
|
|||||||||
The contractual maturity dates for the Company’s available-for-sale investments that are classified as short-term investments in the consolidated balance sheets are one year or less from the respective balance sheet dates.
6. DERIVATIVE INSTRUMENTS
The Company conducts business in a number of foreign countries and transacts business in various foreign currencies. Foreign currency exposures typically arise from transactions denominated in a currency other than the functional currency. The Company utilizes foreign currency forward contracts to offset the risks associated with the effect of certain foreign currency exposures. These contracts are entered into so that increases or decreases in the Company’s foreign currency exposures are offset by gains or losses on the forward contracts in order to
80
mitigate the risks and volatility associated with the Company’s foreign currency transactions. The Company had the following outstanding foreign currency forward contracts as of December 31, 2014 and 2013 (in thousands):
| December 31, 2014 | December 31, 2013 | |||||||||||||||
| Currency |
Notional Value |
USD Equivalent |
Notional Value |
USD Equivalent |
||||||||||||
| Euro |
6,500 | $ | 7,901 | — | $ | — | ||||||||||
| British Pounds Sterling |
3,000 | $ | 4,660 | — | $ | — | ||||||||||
The Company has not designated these forward contracts as hedging instruments pursuant to ASC 815, Derivatives and Hedging, and accordingly, the Company recorded the fair value of these contracts at the end of each reporting period in our consolidated balance sheet, with changes in the fair value recorded in earnings as other income (expense), net in the Company’s consolidated statements of operations and comprehensive loss. The fair value of the forward contracts at December 31, 2014 was $69,000 and was recorded in prepaid expenses and other current assets on the balance sheet. The unrealized gain from the forward contracts recognized for the year ended December 31, 2014 was $69,000 and was recorded in other (expense) income on the statement of operations and comprehensive loss. There was no outstanding forward contract at December 31, 2013 and no unrealized gain or loss was recognized related to forward contracts for the years ended December 31, 2013 and 2012.
7. FAIR VALUE MEASUREMENTS
Financial instruments, including cash equivalents, accounts receivable, accounts payable, and accrued expenses are carried in the consolidated financial statements at amounts that approximate fair value at December 31, 2014 and 2013. Fair values are based on market prices and assumptions concerning the amount and timing of estimated future cash flows and assumed discount rates, reflecting varying degrees of perceived risk. Management believes that the Company’s debt obligations bear interest at rates which approximate prevailing market rates for instruments with similar characteristics and, accordingly, the carrying values for these instruments approximate fair value.
GAAP defines fair value as the exchange price that would be received for an asset or paid to transfer a liability (an exit price) in the principal or most advantageous market for the asset or liability in an orderly transaction between market participants at the measurement date. Additionally, the inputs used to measure fair value are prioritized based on a three-level hierarchy. This hierarchy requires entities to maximize the use of observable inputs and minimize the use of unobservable inputs. The three levels of inputs used to measure fair value are as follows:
| • | Level 1—Quoted prices in active markets for identical assets or liabilities. |
| • | Level 2—Other inputs that are observable directly or indirectly, such as quoted prices for similar assets and liabilities or market corroborated inputs. |
| • | Level 3—Unobservable inputs are used when little or no market data is available, which requires the Company to develop its own assumptions about how market participants would value the assets or liabilities. |
81
The following table details the fair value measurements within the fair value hierarchy of the Company’s financial assets and liabilities at December 31, 2014 and 2013 (in thousands):
| Fair Value Measurements Using | ||||||||||||||||
| Amounts at Fair Value |
Quoted Prices in Active Markets for Identical Assets (Level 1) |
Significant Other Observable Inputs (Level 2) |
Significant Unobservable Inputs (Level 3) |
|||||||||||||
| At December 31, 2014 |
||||||||||||||||
| Assets—Cash Equivalents: |
||||||||||||||||
| Money market funds |
$ | 140,107 | $ | 140,107 | $ | — | $ | — | ||||||||
| Certificates of deposit |
498 | — | 498 | — | ||||||||||||
| Municipal securities |
2,015 | — | 2,015 | — | ||||||||||||
| Assets—Short-Term Investments: |
||||||||||||||||
| U.S. government agency bonds |
$ | 21,303 | $ | — | $ | 21,303 | $ | — | ||||||||
| Corporate bonds |
6,892 | — | 6,892 | — | ||||||||||||
| Municipal securities |
29,378 | — | 29,378 | — | ||||||||||||
| Certificates of deposit |
27,307 | — | 27,307 | — | ||||||||||||
| Assets—Derivative Instruments: |
||||||||||||||||
| Foreign currency forward contracts |
$ | 69 | $ | — | $ | 69 | $ | — | ||||||||
| At December 31, 2013 |
||||||||||||||||
| Assets—Cash Equivalents: |
||||||||||||||||
| Money market funds |
$ | 226,130 | $ | 226,130 | $ | — | $ | — | ||||||||
| Certificates of deposit |
998 | — | 998 | — | ||||||||||||
| Municipal securities |
2,000 | — | 2,000 | — | ||||||||||||
| Assets—Short-Term Investments: |
||||||||||||||||
| U.S. government agency bonds |
$ | 4,501 | $ | — | $ | 4,501 | $ |
— |
| |||||||
| Corporate bonds and commercial paper |
3,317 | — | 3,317 | — | ||||||||||||
| Municipal securities |
19,703 | — | 19,703 | — | ||||||||||||
| Certificates of deposit |
9,612 | — | 9,612 | — | ||||||||||||
When developing fair value estimates, the Company maximizes the use of observable inputs and minimizes the use of unobservable inputs. When available, the Company uses quoted market prices to measure fair value. If market prices are not available, the fair value measurement is based on models that use primarily market based parameters including yield curves, volatilities, credit ratings and currency rates. In certain cases where market rate assumptions are not available, the Company is required to make judgments about assumptions market participants would use to estimate the fair value of a financial instrument.
The valuation technique used to measure fair value for the Company’s Level 1 and Level 2 assets and liabilities is a market approach that uses prices and other relevant information generated by market transactions involving identical or comparable assets. There were no Level 3 financial assets or liabilities at December 31, 2014 and 2013.
82
8. PROPERTY AND EQUIPMENT
Property and equipment as of December 31, 2014 and 2013 consist of the following (in thousands):
| December 31, | ||||||||
| 2014 | 2013 | |||||||
| Computer equipment |
$ | 24,700 | $ | 18,976 | ||||
| Purchased software, including internal use software |
6,742 | 4,134 | ||||||
| Leasehold improvements |
1,078 | 893 | ||||||
| Office furniture |
1,352 | 1,177 | ||||||
|
|
|
|
|
|||||
| Property and equipment—at cost |
33,872 | 25,180 | ||||||
| Less: accumulated depreciation and amortization |
(19,844 | ) | (15,390 | ) | ||||
|
|
|
|
|
|||||
| Property and equipment—net |
$ | 14,028 | $ | 9,790 | ||||
|
|
|
|
|
|||||
Depreciation and amortization expense for the years ended December 31, 2014, 2013 and 2012, was $5.3 million, $4.4 million and $3.4 million, respectively.
9. GOODWILL AND PURCHASED INTANGIBLE ASSETS
Goodwill—Changes in the carrying amount of goodwill in the year ended December 31, 2014 are as follows (in thousands):
| Balance, December 31, 2013 |
$ | — | ||
| Additions |
24,379 | |||
|
|
|
|||
| Balance, December 31, 2014 |
$ | 24,379 | ||
|
|
|
The addition to goodwill during fiscal year 2014 is related to the acquisition of Mainstreet in January 2014 and CQuotient in October 2014 (see Note 4).
Purchased Intangible Assets—Intangible assets acquired as of December 31, 2014 are as follows (in thousands):
| As of December 31, 2014 | ||||||||||||||||
| Weighted Average Life (Years) |
Gross Carrying Amount |
Accumulated Amortization |
Net Book Value | |||||||||||||
| Developed technology |
5.0 | $ | 11,000 | $ | 1,242 | $ | 9,758 | |||||||||
| Customer relationships |
4.0 | 600 | 92 | 508 | ||||||||||||
| Trademarks |
1.0 | 10 | 10 | — | ||||||||||||
|
|
|
|
|
|
|
|
|
|||||||||
| Total |
4.9 | $ | 11,610 | $ | 1,344 | $ | 10,266 | |||||||||
|
|
|
|
|
|
|
|
|
|||||||||
The Company had no acquired intangible assets as of December 31, 2013.
Amortization expense related to acquired intangible assets was $1.3 million for the fiscal year ended December 31, 2014. The Company incurred no amortization expense related to acquired intangible assets for the year ended December 31, 2013.
83
Future estimated amortization expense for acquired intangible assets as of December 31, 2014 is as follows (in thousands):
| 2015 |
$ | 2,474 | ||
| 2016 |
2,277 | |||
| 2017 |
2,179 | |||
| 2018 |
2,002 | |||
| 2019 |
1,334 | |||
|
|
|
|||
| Total |
$ | 10,266 | ||
|
|
|
10. DEBT
Line of Credit—The Company’s loan and security agreement (the “2008 Loan Agreement”) provided a secured revolving credit facility of up to $5.0 million (the “Revolving Credit Facility”). Under the terms of the agreement, borrowing availability varied based upon eligible accounts receivable. Borrowings were collateralized by substantially all of the assets of the Company and bore interest at a variable rate of 0.75% above prime rate. The Revolving Credit Facility was terminated by the Company in June 2012 at the Company’s request pursuant to the terms of the 2008 Loan Agreement. At December 31, 2014, there was no borrowing availability under the Revolving Credit Facility.
In connection with the Company’s entry into the 2008 Loan Agreement, the Company issued a warrant to purchase 23,092 shares of its Series C Preferred Stock, which, at the closing of the IPO, automatically converted into a warrant to purchase shares of the Company’s common stock at an exercise price of $3.90 per share. The warrant was net exercised in September 2012 resulting in the issuance of 20,186 shares of common stock (see Note 14).
Equipment Notes Payable—The Company’s loan and security agreement included an equipment line of credit (the “Loan”). Borrowings under the Loan could be made for eligible equipment purchases. Each advance under the Loan was payable in 36 equal monthly payments of principal plus accrued interest, at an annual rate of 3.75%. In September 2014, the Company paid the outstanding balance in full.
As of December 31, 2014 and 2013, the outstanding balance under the Loan was zero and $3.3 million, respectively. The carrying value of the Loan at December 31, 2013 approximated fair value. At December 31, 2014, there was no borrowing availability under the equipment line of credit.
Software Financing—In May 2012, the Company entered into a $1.8 million agreement to finance the purchase of a perpetual software license and the related first year technical support (the “Software Finance Agreement”). The Software Finance Agreement was secured by the financed assets. In May 2013, the Company renewed the related technical support for a second year, increasing the financed amount by $0.6 million. In February 2014, the Company paid the outstanding balance under the Software Finance Agreement in full. As of December 31, 2014 and 2013, the outstanding balance under the Software Finance Agreement was zero and $0.9 million, respectively.
11. NONCONTROLLING INTEREST
On September 30, 2014, the Company signed an agreement to establish a joint venture, Demandware K.K., in Japan. As of December 31, 2014, the Company contributed approximately $2.5 million to the joint venture in cash in exchange for 75% of its outstanding shares of common stock, and another investor contributed $0.8 million to the joint venture in cash in exchange for the remaining 25% of its outstanding shares of common stock.
84
All shares of the common stock held by the noncontrolling investor are callable by the Company or puttable by the noncontrolling investor upon certain contingent events such as a change of control or a deadlock. Should the call or put options be exercised, the redemption value would be determined based on a prescribed formula derived from i) the relative revenues of Demandware K.K. and the Company and ii) Demandware’s average market capitalization over a pre-defined period (“Formula Redemption Price”). Certain call or put options contingent upon a change of control may be settled at the Company’s discretion with Company stock or cash. During an exit period commencing on January 1, 2018 through January 1, 2020, all shares of the common stock held by the noncontrolling investor are callable by the Company or puttable by the noncontrolling investor. If the Company call option is exercised on or before July 1, 2018, the redemption value would be the greater of the Formula Redemption Price or three times the capital investment the noncontrolling investor has made in Demandware K.K. If the Company call option is exercised after July 1, 2018 or if the the noncontrolling investor put option is exercised at any time during the exit period, the redemption value would equal the Formula Redemption Price.
The redeemable noncontrolling interests in Demandware K.K. is classified outside of permanent equity in the Company’s consolidated balance sheet as of December 31, 2014, primarily due to the put right available to the redeemable noncontrolling interest holders in the future which may be settled in cash or common stock of the Company. The balance of the redeemable noncontrolling interests is reported at the greater of the initial carrying amount adjusted for the redeemable noncontrolling interest’s share of earnings, or its estimated redemption value. The resulting changes in the estimated redemption amount (increases or decreases) are recorded with corresponding adjustments against additional paid-in capital. The estimated redemption value of the redeemable noncontrolling interests was not material at December 31, 2014.
The changes in the redeemable noncontrolling interests classified as temporary equity in the balance sheet for the year ended December 31, 2014 are as follows (in thousands):
| Balance, December 31, 2013 |
$ | — | ||
| Contribution from noncontrolling interests |
830 | |||
| Net loss attributable to noncontrolling interests |
(7 | ) | ||
|
|
|
|||
| Balance, December 31, 2014 |
$ | 823 | ||
|
|
|
12. COMMITMENTS AND CONTINGENCIES
Operating Leases—The Company has several operating leases for its office space that expire on various dates through 2023. Minimum rent payments under operating leases are recognized on a straight-line basis over the term of the lease including any periods of free rent and rent concessions. During the years ended December 31, 2014, 2013 and 2012, rent expense was $3.4 million, $2.6 million, and $2.1 million, respectively.
The Company’s obligation for lease payments is as follows at December 31, 2014 (in thousands):
| Years Ending December 31 |
||||
| 2015 |
$ | 4,169 | ||
| 2016 |
4,195 | |||
| 2017 |
3,742 | |||
| 2018 |
3,085 | |||
| 2019 |
2,509 | |||
| Thereafter |
1,241 | |||
|
|
|
|||
| Total minimum lease payments |
$ | 18,941 | ||
|
|
|
|||
85
Co-location Services—The Company has agreements with third parties to provide co-location services for hosting operations, which typically have a term of 24 months and expire by January 2016. The agreements require payment of a minimum amount per month for a fixed period of time in return for which the co-location service provider provides certain guarantees of network availability.
The Company recorded co-location service expenses of $5.3 million, $3.2 million, and $2.5 million during the years ended December 31, 2014, 2013, and 2012, respectively. Future minimum payments as of December 31, 2014 under these arrangements are $4.4 million in 2015 and $1.7 million in 2016.
Patent Infringement—The Company has received both direct claims from non-practicing entities claiming infringement of patents owned by them and indemnification requests from customers that have received letters from or been sued by such entities. Many of those underlying claims have not yet been resolved, and the extent, if any, of the Company’s indemnification obligations has not been determined. Certain of these matters include speculative claims for substantial or indeterminate amounts of damages. In addition, some of the patents at issue are the subject of pending legal proceedings between the patent owners and one or more leading digital commerce companies, and the outcome of those proceedings could affect the extent to which the patent owners seek to prosecute claims against the Company or its customers. The Company’s business could be materially adversely affected by any significant disputes between the Company and its customers as to intellectual property litigation to which the Company might become a party or for which the Company may be required to provide indemnification. Adverse results in these matters may include awards of substantial monetary damages, costly licensing agreements, or orders preventing the Company from offering certain features, functionalities, products, or services, and may also cause the Company to change its business practices, and require development of non-infringing products or technologies, which could result in a loss of revenues and otherwise harm the Company’s business. As of December 31, 2014, the Company has not made an accrual related to these matters.
The Company records a liability when it believes that a loss is both probable and reasonably estimable. On a quarterly basis, the Company reviews each of its legal proceedings to determine whether it is probable, reasonably possible or remote that a liability has been incurred and, if it is at least reasonably possible, whether a range of loss can be reasonably estimated. Significant judgment is required to determine both the likelihood of there being a loss and the estimated amount of such loss. Until the final resolution of such matters, there may be an exposure to loss in excess of the amount recorded, and such amounts could be material. The Company expenses legal fees in the period in which they are incurred.
In all of the Company’s outstanding legal matters for which it has not made an accrual, the Company is unable to estimate a range of reasonably possible loss due to various factors, including, among others, the early stage and uncertain outcome of the pending lawsuits to which the Company is not a party; and the significant factual issues to be resolved regarding the extent, if any, of the Company’s indemnification obligations. Given the significant uncertainties involved in these matters, the Company cannot predict the timing or extent of their impact, if any, on its business, consolidated financial position, results of operations or cash flows, which could be material, particularly in any fiscal quarter in which it may accrue a related liability.
13. CAPITALIZATION
As of December 31, 2014, the Company’s authorized stock consists of 240,000,000 shares of common stock, par value of $0.01 per share, and 10,000,000 shares of preferred stock, par value of $0.01 per share. No shares of preferred stock are issued or outstanding at December 31, 2014.
On March 20, 2012, upon the closing of the IPO, all outstanding shares of redeemable convertible preferred stock were automatically converted into 18,028,763 shares of common stock.
86
14. WARRANTS
In July 2008, in connection with the Company’s entry into the 2008 Loan Agreement (see Note 10), the Company issued a warrant to purchase shares of its Series C Preferred Stock, which, at the closing of the IPO, automatically converted into a warrant to purchase 23,092 shares of the Company’s common stock at an exercise price of $3.90 per share. The warrant was exercisable at any time through its expiration in July 2018. So long as the warrant remained outstanding and exercisable for redeemable convertible preferred stock, the warrant liability was recorded at fair value at each balance sheet date with any change in fair value included as a component of other (expense) income. At the time of conversion of the warrant upon the closing of the IPO, the fair value of the warrant was $0.5 million, which was reclassified as a component of additional paid-in capital. The warrant was net exercised in September 2012 resulting in the issuance of 20,186 shares of common stock. For the years ended December 31, 2012, the Company recognized $0.4 million of loss for the change in the fair value of the warrant.
15. STOCK-BASED COMPENSATION
The following table presents stock-based compensation expense included in the Company’s consolidated statements of operations and comprehensive loss (in thousands):
| Year Ended December 31, | ||||||||||||
| 2014 | 2013 | 2012 | ||||||||||
| Cost of subscription revenue |
$ | 701 | $ | 391 | $ | 175 | ||||||
| Cost of service revenue |
1,967 | 1,179 | 722 | |||||||||
| Sales and marketing |
7,474 | 4,296 | 1,842 | |||||||||
| Research and development |
7,513 | 3,574 | 1,509 | |||||||||
| General and administrative |
8,975 | 5,248 | 2,795 | |||||||||
|
|
|
|
|
|
|
|||||||
| $ | 26,630 | $ | 14,688 | $ | 7,043 | |||||||
|
|
|
|
|
|
|
|||||||
Stock-based compensation cost for the year ended December 31, 2014 includes $19.5 million related to restricted stock awards, $6.4 million related to stock options, $0.4 million related to the Company’s Employee Stock Purchase Plan (“ESPP”) and $0.3 million related to employee compensation contracts payable in cash or Company shares. Stock-based compensation cost for the year ended December 31, 2013 includes $8.4 million related to restricted stock awards, $6.1 million related to stock options and $0.2 million related to the ESPP. Stock-based compensation cost for the year ended December 31, 2012 includes $2.8 million related to restricted stock awards and $4.2 million related to stock options.
As of December 31, 2014, the Company had two stock-based compensation plans, the 2004 Stock Option and Grant Plan (the “2004 Plan”), and the 2012 Stock Incentive Plan (the “2012 Plan”). The 2012 Plan provides for the grant of incentive stock options to the Company’s employees and the grant of non-statutory stock options, restricted stock, restricted stock units, stock appreciation rights, performance units and performance shares to the Company’s employees, directors and consultants. Upon the effectiveness of the 2012 Plan, the Company ceased granting awards under the 2004 Plan. However, the 2004 Plan will continue to govern the terms and conditions of the outstanding awards previously granted thereunder.
Under the 2012 Plan, the Company may issue up to 8,126,768 shares of common stock pursuant to stock options and stock awards, which include shares of common stock reserved for issuance under the 2004 Plan that remained available for issuance immediately prior to the inception of the 2012 Plan. As of December 31, 2014, the Company has authorized 240,000,000 shares of common stock and 4,846,670 shares of common stock remain available under the 2012 Stock Incentive Plan.
Stock Options—Under the 2012 Plan, stock options may be granted at an exercise price not less than the fair market value of the Company’s common stock on the date of grant. Substantially all stock options and restricted stock awards currently outstanding under both plans vest over a period of four years.
87
The Company uses the Black-Scholes option-pricing model to estimate the fair value of stock options awards and determine the related compensation expense. The fair value of the stock options granted was calculated using the following key assumptions:
| Year Ended December 31, | ||||||||||||
| 2014 | 2013 | 2012 | ||||||||||
| Risk-free interest rate |
1.8 | % | 2.1 | % | 1.3 | % | ||||||
| Expected dividend yield |
— | — | — | |||||||||
| Expected term (in years) |
6 | 6 | 6 | |||||||||
| Weighted average expected volatility |
49.2 | % | 50.4 | % | 57.0 | % | ||||||
The risk-free interest rate assumption was based on the U.S. Treasury zero-coupon bonds with maturities similar to those of the expected term of the award being valued. The assumed dividend yield was based on the Company’s expectation of not paying dividends in the foreseeable future. The weighted-average expected life for employee options reflects the application of the simplified method, which represents the average of the contractual term of the options and the weighted-average vesting period for all option tranches. The simplified method has been used since the Company does not have sufficient historical exercise data to provide a reasonable basis upon which to estimate the expected term due to a limited period of the Company’s life. The expected life of options granted to nonemployees is equal to the remaining contractual term as of the measurement date. The Company bases the majority of its estimate of expected volatility using volatility data from comparable public companies in similar industries and markets because there is currently limited public market history for the Company’s common stock, and therefore, a lack of market-based company-specific historical and implied volatility information.
The summary of stock option activity for the year ended December 31, 2014 is as follows (in thousands, except per share and term information):
| Shares | Weighted- Average Exercise Price |
Weighted- Average Remaining Contractual Life (in Years) |
Aggregate Intrinsic Value |
|||||||||||||
| Outstanding—January 1, 2014 |
2,994 | $ | 12.39 | |||||||||||||
| Granted |
194 | 64.31 | ||||||||||||||
| Forfeited |
(28 | ) | 30.34 | |||||||||||||
| Expired or cancelled |
(2 | ) | 12.49 | |||||||||||||
| Exercised |
(572 | ) | 11.97 | |||||||||||||
|
|
|
|||||||||||||||
| Outstanding—December 31, 2014 |
2,586 | $ | 16.18 | 6.25 | $ | 108,329 | ||||||||||
|
|
|
|||||||||||||||
| Exercisable—December 31, 2014 |
1,928 | $ | 7.91 | 5.63 | $ | 95,709 | ||||||||||
|
|
|
|||||||||||||||
| Options vested and expected to vest— December 31, 2014 |
2,553 | $ | 15.80 | 6.22 | $ | 107,849 | ||||||||||
|
|
|
|||||||||||||||
The following table summarizes information relating to stock options granted and exercised (in thousands, except per share data):
| Year Ended December 31, | ||||||||||||
| 2014 | 2013 | 2012 | ||||||||||
| Weighted average grant date fair value per share |
$ | 31.79 | $ | 16.87 | $ | 16.49 | ||||||
| Aggregate intrinsic value of options exercised |
29,363 | 42,099 | 21,402 | |||||||||
| Cash proceeds received upon exercise of options |
6,848 | 7,948 | 1,282 | |||||||||
88
The aggregate intrinsic value represents the difference between the estimated fair value at exercise and the exercise price paid by the employee. The amount of aggregate intrinsic value will change based on the fair market value of the common stock.
As of December 31, 2014, total compensation cost not yet recognized related to stock option awards was $11.7 million, which is expected to be recognized over a weighted-average period of 2.3 years.
Restricted Stock Awards—The Company’s restricted stock awards generally vest over a two- or four-year period and upon vesting, the restrictions on the shares are released. In December 2013, the Company granted a 25,000 share performance-based restricted stock award, and the restriction on the shares will be released when the recipient achieves operational metrics as defined in the agreement. In December 2014, the operating metrics were achieved and the entire 25,000 shares of performance-based restricted stock were vested.
The summary of restricted stock awards activity is as follows (in thousands, except per share data):
| Number of Shares |
Weighted- Average Grant Date Fair Value |
|||||||
| Nonvested at December 31, 2013 |
961 | $ | 32.51 | |||||
| Granted |
686 | 66.18 | ||||||
| Vested |
(414 | ) | 32.42 | |||||
| Forfeited |
(39 | ) | 46.98 | |||||
|
|
|
|||||||
| Nonvested at December 31, 2014 |
1,194 | $ | 51.40 | |||||
|
|
|
|||||||
The following table summarizes information relating to restricted stock granted and vested (in thousands, except per share data):
| Year Ended December 31, | ||||||||||||
| 2014 | 2013 | 2012 | ||||||||||
| Weighted average grant date fair value per share |
$ | 66.18 | $ | 33.13 | $ | 30.92 | ||||||
| Total fair value of restricted stock vested |
25,801 | 6,418 | 2,350 | |||||||||
Total compensation cost not yet recognized related to restricted stock awards was $50.4 million, which is expected to be recognized over a weighted-average period of 2.9 years.
Employee Stock Purchase Plan—The ESPP and its foreign corollaries permit eligible employees to purchase up to a maximum of 400,000 shares of our common stock through accumulated payroll deductions. Each offering is a six month period (a “Plan Period”), and the purchase price of the stock is equal to 85% of the lesser of the market value of such shares at the first or last business day of a Plan Period. Individual employee contributions to the ESPP may not exceed $12,500 in each Plan Period. During the 2014 and 2013 Plan Periods, employee contributions were accumulated to purchase 27,088 and 14,934 shares, respectively, at weighted average prices per share of $51.34 and $36.47, respectively. No share was purchased under the ESPP for the year ended December 31, 2012. The fair value of the ESPP shares purchased is estimated on the Plan Period commencement date using a Black-Scholes pricing model with the expense recognized over the expected life, which is the six month offering period. The weighted average fair value per share of ESPP shares purchased during the year ended December 31, 2014 and 2013 was $16.43 and $9.62, respectively. At December 31, 2014, 357,978 shares remain available for future issuance under the ESPP.
Employee Compensation Contracts Payable in Cash or Shares—As part of the CQuotient acquisition, the Company agreed to pay certain selling shareholders total additional consideration of $3.4 million contingent upon their continued employment with the Company for a specified period of time. These contingent payments
89
are payable in cash or shares of the Company’s common stock at the option of the Company (see Note 4). The Company recognized the contingent payments over the respective required period of employment. During the year ended December 31, 2014, the Company recorded $0.3 million of compensation expense related to these contingent payments. No such expense was recorded during the years ended December 31, 2013 and 2012.
Restricted Stock Units—On June 6, 2014, the Company granted restricted stock units for 16,875 shares of common stock to the Company’s former Chief Financial Officer with a grant date fair value of $60.08 per share, as outlined in the Transition and Separation Letter Agreement dated February 10, 2014 between the Company and the former Chief Financial Officer (the “Transition and Separation Letter Agreement”). The restricted stock units will be paid out in shares one year from the grant date, provided that the former Chief Financial Officer substantially complies with the Post-Employment Assistance undertakings and with the Restrictive Covenants Agreements, each as defined in the Transition and Separation Letter Agreement. If the former Chief Financial Officer does not substantially comply, the restricted stock units will be forfeited as of the date of noncompliance. These restricted stock units granted to the former Chief Financial Officer are remeasured at fair value at each reporting date until the award vests. During the year ended December 31, 2014, the Company recorded $0.6 million of consulting expense for this restricted stock unit award, and no such expense was recorded during the year ended December 31, 2013.
16. INCOME TAXES
The provision for income taxes for the years ended December 31, 2014, 2013 and 2012 consists of the following (in thousands):
| December 31, | ||||||||||||
| 2014 | 2013 | 2012 | ||||||||||
| Loss before income taxes: |
||||||||||||
| Domestic |
$ | (31,431 | ) | $ | (19,062 | ) | $ | (5,050 | ) | |||
| International |
2,321 | 1,634 | 1,129 | |||||||||
|
|
|
|
|
|
|
|||||||
| $ | (29,110 | ) | $ | (17,428 | ) | $ | (3,901 | ) | ||||
|
|
|
|
|
|
|
|||||||
| December 31, | ||||||||||||
| 2014 | 2013 | 2012 | ||||||||||
| Current income tax provision: |
||||||||||||
| Federal |
$ | — | $ | — | $ | — | ||||||
| State |
72 | 52 | 56 | |||||||||
| Foreign |
776 | 457 | 368 | |||||||||
|
|
|
|
|
|
|
|||||||
| Total current income tax provision |
848 | 509 | 424 | |||||||||
| Deferred income tax (benefit) provision: |
||||||||||||
| Federal |
(2,795 | ) | — | — | ||||||||
| State |
(3 | ) | — | — | ||||||||
| Foreign |
(100 | ) | 65 | (3 | ) | |||||||
|
|
|
|
|
|
|
|||||||
| Total deferred income tax (benefit) provision |
(2,898 | ) | 65 | (3 | ) | |||||||
|
|
|
|
|
|
|
|||||||
| Total income tax (benefit) provision |
$ | (2,050 | ) | $ | 574 | $ | 421 | |||||
|
|
|
|
|
|
|
|||||||
The 2014 income tax benefit includes the release of $3.0 million of valuation allowance that resulted from the recognition of the deferred tax liabilities in the CQuotient acquisition, which provided evidence to support the recoverability of the deferred tax asset totaling $3.0 million.
90
The differences in total provision for income taxes that would result from applying the 34% federal statutory rate to (loss) income before provision for income taxes and the reported provision for income taxes are as follows:
| Years Ended December 31, | ||||||||||||
| 2014 | 2013 | 2012 | ||||||||||
| (As revised) | (As revised) | |||||||||||
| U.S. Federal tax expense at statutory rates |
34 | % | 34 | % | 34 | % | ||||||
| State income taxes, net of federal tax benefit |
2 | % | 0.5 | % | (1 | )% | ||||||
| Foreign rate differential |
1 | % | 0.5 | % | 1 | % | ||||||
| Permanent differences |
6 | % | (4 | )% | (5 | )% | ||||||
| Stock-based compensation |
(6 | )% | (3 | )% | (6 | )% | ||||||
| Uncertain tax provisions |
(1 | )% | (1 | )% | (2 | )% | ||||||
| Valuation allowance |
(29 | )% | (30 | )% | (32 | )% | ||||||
|
|
|
|
|
|
|
|||||||
| 7 | % | (3 | )% | (11 | )% | |||||||
|
|
|
|
|
|
|
|||||||
Components of the net deferred tax assets as of December 31, 2014 and 2013 are as follows (in thousands):
| December 31, | ||||||||
| 2014 | 2013 | |||||||
| (As revised) | ||||||||
| Operating loss carryforwards |
$ | 17,804 | $ | 12,948 | ||||
| Capitalized research and development costs |
4,226 | 8,433 | ||||||
| Accrued expenses |
7,411 | 5,630 | ||||||
| Research and development credits |
3,738 | 1,160 | ||||||
| Deferred revenue |
1,578 | (311 | ) | |||||
| Stock compensation |
5,367 | 2,850 | ||||||
| Depreciation |
167 | 296 | ||||||
| Other |
24 | 3 | ||||||
|
|
|
|
|
|||||
| Total deferred tax assets |
40,315 | 31,009 | ||||||
| Valuation allowance for deferred tax assets |
(40,493 | ) | (31,074 | ) | ||||
|
|
|
|
|
|||||
| Net deferred tax liability |
$ | (178 | ) | $ | (65 | ) | ||
|
|
|
|
|
|||||
The Company has historically incurred operating losses, and given the cumulative losses and limited history of profits, the Company has recorded a full valuation allowance against its deferred tax assets for all periods to date with the exception of the deferred tax asset related to Demandware E-Commerce (Shanghai) Limited, Demandware UK Limited, and Demandware Australia Pty Limited.
In general, it is the practice and intention of the Company to reinvest the earnings of its non-U.S. subsidiaries in those operations. As of December 31, 2014, the Company has not made a provision for U.S. or additional foreign withholding taxes of the excess of the amount for financial reporting over the tax basis of investments in foreign subsidiaries that are essentially permanent in duration. Generally, such amounts become subject to U.S. taxation upon the remittance of dividends and under certain other circumstances. It is not practicable to estimate the amount of deferred tax liability related to investments in these foreign subsidiaries.
During the year ended December 31, 2014, the valuation allowance increased by $9.4 million due to the increase in deferred tax asset associated with the research and development costs and accrued expenses and the full valuation allowance against that asset. During the year ended December 31, 2013, the valuation allowance increased by $5.2 million due to the increase in deferred tax asset associated with the net operating loss and the full valuation allowance against that asset.
91
At December 31, 2014, the Company had federal and state net operating loss carryforwards of approximately $138.8 million and $69.6 million, respectively. At December 31, 2014, the Company also had federal and state research and development tax credit carryforwards of $5.0 million and $3.3 million, respectively. The net operating loss carryforwards and tax credits expire at various dates through 2034. Because of the change of ownership provisions of the Tax Reform Act of 1986, use of a portion of the Company’s domestic NOL and tax credit carryforwards may be limited in future periods. Further, a portion of the carryforwards may expire before being applied to reduce future income tax liabilities.
As a result of certain realization requirements of share-based payment accounting guidance, the table of deferred tax assets and liabilities shown above does not include certain deferred tax assets as of December 31, 2014 and 2013 that arose directly from tax deductions related to equity compensation in excess of compensation recognized for financial reporting. Equity will be increased by $35.5 million if and when such deferred tax assets are ultimately realized. The Company uses ASC 740 ordering when determining when excess tax benefits have been realized.
The following table indicates the changes to the Company’s unrecognized tax benefits for the years ended December 31 (in thousands):
| 2014 | 2013 | 2012 | ||||||||||
| Beginning balance |
$ | 1,418 | $ | 1,061 | $ | 805 | ||||||
| Decrease related to current tax year |
(409 | ) | — | — | ||||||||
| Increase related to current tax year |
497 | 357 | 256 | |||||||||
|
|
|
|
|
|
|
|||||||
| Ending balance |
$ | 1,506 | $ | 1,418 | $ | 1,061 | ||||||
|
|
|
|
|
|
|
|||||||
The liability for unrecognized tax benefits includes no accrued interest and penalties. The Company expects none of the unrecognized tax benefits will decrease within the next 12 months related to expired statutes or settlement with the taxing authorities. Under the Company’s accounting policies, the unrecognized tax benefits disclosed above are presented in the financial statements as a reduction to a deferred tax asset.
The Company files federal, state, and foreign income tax returns in jurisdictions with varying statutes of limitations. With few exceptions, all tax years 2004 through 2014 remain subject to examination by federal and most state tax authorities due to the Company’s net operating loss carryforwards. In the Company’s foreign jurisdictions, all tax years remain subject to examination.
17. EMPLOYEE BENEFITS
The Company has a 401(k) defined contribution plan (the “401(k) Plan”) for employees. The 401(k) Plan includes substantially all United States full-time employees. Under the terms of the plan, participants may contribute up to the lower of 20% of their salary or the statutorily prescribed limit to the plan. At the election of its Board of Directors, the Company may make matching employee contributions, though it has not done so to date.
18. SELECTED QUARTERLY INFORMATION (UNAUDITED)
For reasons discussed in greater detail within “Correction of Immaterial Errors” in Note 1, Organization and Basis of Presentation, the Company has revised its previously issued consolidated financial statements contained in the quarterly periods ended March 31, 2014, June 30, 2014, September 30, 2014 and each of the quarterly periods in the year ended December 31, 2013. The revisions resulted from a correction of immaterial errors due to the change in the Company’s revenue recognition policy for implementation services.
92
The following tables summarize the effects of the revisions on our previously issued unaudited condensed consolidated financial statements:
| 2014 | ||||||||||||||||||||||||||||||||||||||||
| 1st Quarter | 2nd Quarter | 3rd Quarter | 4th Quarter |
|||||||||||||||||||||||||||||||||||||
| As Previously Reported |
Adjustment | As Revised | As Previously Reported |
Adjustment | As Revised | As Previously Reported |
Adjustment | As Revised |
|
|||||||||||||||||||||||||||||||
| (in thousands, except per share amounts) | ||||||||||||||||||||||||||||||||||||||||
| Revenue |
$ | 32,178 | $ | 396 | $ | 32,574 | $ | 36,085 | $ | 661 | $ | 36,746 | $ | 38,227 | $ | 504 | $ | 38,731 | $ | 52,502 | ||||||||||||||||||||
| Gross profit |
23,270 | 396 | 23,666 | 26,080 | 661 | 26,741 | 27,442 | 504 | 27,946 | 40,152 | ||||||||||||||||||||||||||||||
| Loss from operations |
(8,496 | ) | 396 | (8,100 | ) | (9,025 | ) | 661 | (8,364 | ) | (5,651 | ) | 504 | (5,147 | ) | (6,181 | ) | |||||||||||||||||||||||
| Loss before provision for income taxes |
(8,494 | ) | 396 | (8,098 | ) | (8,958 | ) | 661 | (8,297 | ) | (6,654 | ) | 504 | (6,150 | ) | (6,565 | ) | |||||||||||||||||||||||
| Net loss |
(8,759 | ) | 396 | (8,363 | ) | (9,185 | ) | 661 | (8,524 | ) | (6,853 | ) | 504 | (6,349 | ) | (3,824 | ) | |||||||||||||||||||||||
| Net loss attributable to noncontrolling interest |
— | — | — | — | — | — | — | — | — | 7 | ||||||||||||||||||||||||||||||
| Net loss attributable to Demandware |
(8,759 | ) | 396 | (8,363 | ) | (9,185 | ) | 661 | (8,524 | ) | (6,853 | ) | 504 | (6,349 | ) | (3,817 | ) | |||||||||||||||||||||||
| Basic net loss per share attributable to Demandware |
$ | (0.25 | ) | $ | 0.01 | $ | (0.24 | ) | $ | (0.27 | ) | $ | 0.02 | $ | (0.25 | ) | $ | (0.20 | ) | $ | 0.02 | $ | (0.18 | ) | $ | (0.11 | ) | |||||||||||||
|
|
|
|
|
|
|
|
|
|
|
|
|
|
|
|
|
|
|
|
|
|||||||||||||||||||||
| Diluted net loss per share attributable to Demandware |
$ | (0.25 | ) | $ | 0.01 | $ | (0.24 | ) | $ | (0.27 | ) | $ | 0.02 | $ | (0.25 | ) | $ | (0.20 | ) | $ | 0.02 | $ | (0.18 | ) | $ | (0.11 | ) | |||||||||||||
|
|
|
|
|
|
|
|
|
|
|
|
|
|
|
|
|
|
|
|
|
|||||||||||||||||||||
| 2013 | ||||||||||||||||||||||||||||||||||||||||||||||||
| 1st Quarter | 2nd Quarter | 3rd Quarter | 4th Quarter | |||||||||||||||||||||||||||||||||||||||||||||
| As Previously Reported |
Adjustment | As Revised |
As Previously Reported |
Adjustment | As Revised |
As Previously Reported |
Adjustment | As Revised |
As Previously Reported |
Adjustment | As Revised |
|||||||||||||||||||||||||||||||||||||
| (in thousands, except per share amounts) | ||||||||||||||||||||||||||||||||||||||||||||||||
| Revenue |
$ | 20,514 | $ | 290 | $ | 20,804 | $ | 23,207 | $ | 342 | $ | 23,549 | $ | 24,479 | $ | 1,162 | $ | 25,641 | $ | 35,536 | $ | 1,084 | $ | 36,620 | ||||||||||||||||||||||||
| Gross profit |
14,032 | 290 | 14,322 | 16,665 | 342 | 17,007 | 17,428 | 1,162 | 18,590 | 27,594 | 1,084 | 28,678 | ||||||||||||||||||||||||||||||||||||
| (Loss) income from operations |
(7,317 | ) | 290 | (7,027 | ) | (8,413 | ) | 342 | (8,071 | ) | (6,769 | ) | 1,162 | (5,607 | ) | 1,710 | 1,084 | 2,794 | ||||||||||||||||||||||||||||||
| (Loss) income before provision for income taxes |
(7,753 | ) | 290 | (7,463 | ) | (8,310 | ) | 342 | (7,968 | ) | (6,147 | ) | 1,162 | (4,985 | ) | 1,904 | 1,084 | 2,988 | ||||||||||||||||||||||||||||||
| Net (loss) income |
(7,972 | ) | 290 | (7,682 | ) | (8,455 | ) | 342 | (8,113 | ) | (6,257 | ) | 1,162 | (5,095 | ) | 1,804 | 1,084 | 2,888 | ||||||||||||||||||||||||||||||
| Basic net (loss) income per share attributable to Demandware |
$ | (0.27 | ) | $ | 0.01 | $ | (0.26 | ) | $ | (0.28 | ) | $ | 0.01 | $ | (0.27 | ) | $ | (0.20 | ) | $ | 0.03 | $ | (0.17 | ) | $ | 0.06 | $ | 0.03 | $ | 0.09 | ||||||||||||||||||
|
|
|
|
|
|
|
|
|
|
|
|
|
|
|
|
|
|
|
|
|
|
|
|
|
|||||||||||||||||||||||||
| Diluted net (loss) income per share attributable to Demandware |
$ | (0.27 | ) | $ | 0.01 | $ | (0.26 | ) | $ | (0.28 | ) | $ | 0.01 | $ | (0.27 | ) | $ | (0.20 | ) | $ | 0.03 | $ | (0.17 | ) | $ | 0.05 | $ | 0.03 | $ | 0.08 | ||||||||||||||||||
|
|
|
|
|
|
|
|
|
|
|
|
|
|
|
|
|
|
|
|
|
|
|
|
|
|||||||||||||||||||||||||
19. SUBSEQUENT EVENTS
Tomax Acquisition—On January 12, 2015, the Company acquired 100% of the equity of Tomax Corporation (“Tomax”), an enterprise software company that provides an integrated solution for retail point of sale and store operations, for total cash consideration of approximately $60 million, of which $12 million was held in escrow to secure certain indemnification and other obligations of the sellers. An additional consideration of up to $15 million, payable in cash or shares of the Company’s common stock at the option of the Company, is payable to the Tomax equityholders in 1.5 to 2 years contingent upon the continued post-closing employment of certain key employees of Tomax. This consideration will be recognized in the Company’s post-combination financial statements as compensation expense over the employment period. The initial purchase accounting of the business combination is incomplete as of the issuance date of these financial statements. Therefore, the Company is unable to disclose the fair value of the equity interest in Tomax immediately before the acquisition date, the valuation techniques and related inputs used to measure the acquisition date fair value and the pro forma financial information. During fiscal year ended December 31, 2014, $0.9 million of acquisition-related costs were incurred to effect the Tomax acquisition, which is included in the Company’s general and administrative expense.
93
| ITEM 9. | CHANGES IN AND DISAGREEMENTS WITH ACCOUNTANTS ON ACCOUNTING AND FINANCIAL DISCLOSURE |
None.
| ITEM 9A. | CONTROLS AND PROCEDURES |
(a) Disclosure Controls and Procedures
Our management, including our Chief Executive Officer and Chief Financial Officer, evaluated the effectiveness of our disclosure controls and procedures (as defined in Rules 13a-15(e) and 15d-15(e) under the Securities Exchange Act of 1934, as amended, or the Exchange Act), as of December 31, 2014, the end of the fiscal period covered by this Annual Report on Form 10-K. The Securities and Exchange Commission, or SEC, rules define the term “disclosure controls and procedures” to mean a company’s controls and other procedures that are designed to ensure that information required to be disclosed in the reports it files or submits under the Exchange Act is recorded, processed, summarized and reported within the time period specified in the SEC’s rules and forms. Disclosure controls and procedures include, without limitation, controls and procedures designed to ensure that information required to be disclosed by a company in its reports filed under the Exchange Act is accumulated and communicated to the company’s management, including its principal executive and principal financial officers, or persons performing similar functions, as appropriate to allow timely decisions regarding required disclosure.
Based on this evaluation, our Chief Executive Officer and Chief Financial Officer concluded that our disclosure controls and procedures were not effective as of December 31, 2014, due to the material weakness in our internal control over financial reporting as discussed below.
(b) Management’s Annual Report on Internal Control over Financial Reporting
Management is responsible for establishing and maintaining an adequate system of internal control over financial reporting of our company. This system of internal financial reporting controls is designed to provide reasonable assurance that assets are safeguarded and transactions are properly recorded and executed in accordance with management’s authorization. The design, monitoring and revision of the system of internal financial reporting controls involves, among other things, management’s judgments with respect to the relative cost and expected benefits of specific control measures. The effectiveness of the control system is supported by the selection, retention and training of qualified personnel and an organizational structure that provides an appropriate division of responsibility and formalized procedures. The system of internal accounting controls is periodically reviewed and modified in response to changing conditions. Designated company employees regularly monitor the adequacy and effectiveness of internal accounting controls.
Because of its inherent limitations, a system of internal control over financial reporting can provide only reasonable assurance and may not prevent or detect misstatements. Further, because of changes in conditions, the effectiveness of internal controls over financial reporting may vary over time. Our system contains control-monitoring mechanisms, and actions are taken to correct deficiencies as they are identified.
Management conducted an evaluation of the effectiveness of the system of internal control over financial reporting based on the framework in Internal Control—Integrated Framework (2013) issued by the Committee of Sponsoring Organizations of the Treadway Commission and identified a material weakness in internal control over financial reporting as of December 31, 2014. A material weakness is a deficiency, or combination of deficiencies, in internal control over financial reporting, such that there is a reasonable possibility that a material misstatement of the Company’s annual or interim financial statements will not be prevented or detected on a timely basis. Because of the material weakness described below, management concluded that our system of internal control over financial reporting was not effective as of December 31, 2014.
94
Based upon management’s evaluation, we concluded that we did not maintain adequate and effective internal control in the area of technical accounting relating to the application of applicable accounting literature related to revenue recognition for implementation services. Specifically, the control deficiency related to our interpretation of Accounting Standards Codification, or ASC, 605-25-25-5 and whether our implementation services met the criteria for standalone value. This was determined in response to comments from the staff of the SEC regarding a review of our Annual Report on Form 10-K for the year ended December 31, 2013, following which management concluded that the execution of certain internal control activities had not been adequate. Specifically, we believe that, in the context of the rapid growth of our business, we did not have sufficient staffing and technical expertise in the area of revenue recognition accounting to provide adequate review and control with respect to accounting for implementation services revenue. The material weakness led to a correction of immaterial errors in prior period financial statements, which have been reflected in the financial statements for the three years ended December 31, 2014.
Our Independent Registered Public Accounting Firm, Deloitte & Touche LLP, has issued a report on our internal control over financial reporting, which is included below.
(c) Changes in Internal Control over Financial Reporting
Other than as described below, there was no change in our internal control over financial reporting that occurred during the fiscal quarter ended December 31, 2014 that has materially affected, or is reasonably likely to materially affect, our internal control over financial reporting.
Remediation of Material Weakness—Technical Accounting Related to Revenue Recognition for Implementation Services
In connection with our response to comments from the staff of the SEC regarding a review of our Annual Report on Form 10-K for the year ended December 31, 2013, we conducted a reevaluation of our revenue recognition policy for implementation services. Following the review, we, under the direction of our Audit Committee, determined that certain implementation services have standalone value and determined it was appropriate to recognize revenue for these implementation services as they are rendered assuming all other revenue recognition criteria have been met. We have concluded that our prior revenue recognition policy for these implementation services was inappropriate in certain prior periods. We have revised our revenue recognition policy for implementation services and analyzed the impact of the change in revenue recognition policy on our previously issued financial statements. Following the analysis, we have concluded that the errors were not material to any of our previously issued annual or interim financial statements. However, the correction of the immaterial errors of prior period financial statements has been reflected in the financial statements for the three years ended December 31, 2014 in this Annual Report on Form 10-K. See Note 1 of the Notes to our Consolidated Financial Statement in Part II, Item 8.
In connection with such review, we also identified a control deficiency relating to the application of applicable accounting literature related to revenue recognition for implementation services. Specifically, the control deficiency related to our interpretation of ASC 605-25-25-5 and whether our implementation services met the criteria for standalone value.
Management, with the input, oversight and support of the Audit Committee, has identified and taken the following steps, which management believes has corrected the material weakness described above subsequent to December 31, 2014:
| • | We created and filled two new positions, Manager of Revenue Recognition and Senior Manager of Technical Accounting, with finance personnel knowledgeable about revenue recognition matters and other technical accounting issues to supplement the experience and depth of the team responsible for designing, implementing, monitoring and executing internal control over financial reporting. |
95
| • | We recently established an internal audit department and will be hiring additional auditors in 2015 who will test the effectiveness of our controls including those involving revenue recognition. |
| • | We have begun applying additional processes and controls during the first quarter of 2015 to the evaluation of multiple deliverable arrangements so that revenue is recognized and accounted for in accordance with GAAP. |
96
REPORT OF INDEPENDENT REGISTERED PUBLIC ACCOUNTING FIRM
To the Board of Directors and Stockholders of
Demandware, Inc.
Burlington, Massachusetts
We have audited Demandware, Inc. and subsidiaries’ (the “Company’s”) internal control over financial reporting as of December 31, 2014 based on criteria established in Internal Control—Integrated Framework (2013) issued by the Committee of Sponsoring Organizations of the Treadway Commission. The Company’s management is responsible for maintaining effective internal control over financial reporting and for its assessment of the effectiveness of internal control over financial reporting, included in the accompanying Management’s Report on Internal Control over Financial Reporting. Our responsibility is to express an opinion on the Company’s internal control over financial reporting based on our audit.
We conducted our audit in accordance with the standards of the Public Company Accounting Oversight Board (United States). Those standards require that we plan and perform the audit to obtain reasonable assurance about whether effective internal control over financial reporting was maintained in all material respects. Our audit included obtaining an understanding of internal control over financial reporting, assessing the risk that a material weakness exists, testing and evaluating the design and operating effectiveness of internal control based on that risk, and performing such other procedures as we considered necessary in the circumstances. We believe that our audit provides a reasonable basis for our opinion.
A company’s internal control over financial reporting is a process designed by, or under the supervision of, the company’s principal executive and principal financial officers, or persons performing similar functions, and effected by the company’s board of directors, management, and other personnel to provide reasonable assurance regarding the reliability of financial reporting and the preparation of financial statements for external purposes in accordance with generally accepted accounting principles. A company’s internal control over financial reporting includes those policies and procedures that (1) pertain to the maintenance of records that, in reasonable detail, accurately and fairly reflect the transactions and dispositions of the assets of the company; (2) provide reasonable assurance that transactions are recorded as necessary to permit preparation of financial statements in accordance with generally accepted accounting principles, and that receipts and expenditures of the company are being made only in accordance with authorizations of management and directors of the company; and (3) provide reasonable assurance regarding prevention or timely detection of unauthorized acquisition, use, or disposition of the company’s assets that could have a material effect on the financial statements.
Because of the inherent limitations of internal control over financial reporting, including the possibility of collusion or improper management override of controls, material misstatements due to error or fraud may not be prevented or detected on a timely basis. Also, projections of any evaluation of the effectiveness of the internal control over financial reporting to future periods are subject to the risk that the controls may become inadequate because of changes in conditions, or that the degree of compliance with the policies or procedures may deteriorate.
A material weakness is a deficiency, or a combination of deficiencies, in internal control over financial reporting, such that there is a reasonable possibility that a material misstatement of the company’s annual or interim financial statements will not be prevented or detected on a timely basis. The following material weakness has been identified and included in management’s assessment: management did not maintain adequate and effective internal control over the application of technical accounting literature related to revenue recognition for implementation services. This material weakness was considered in determining the nature, timing, and extent of audit tests applied in our audit of the consolidated financial statements as of and for the year ended December 31, 2014, of the Company and this report does not affect our report on such financial statements.
97
In our opinion, because of the effect of the material weakness identified above on the achievement of the objectives of the control criteria, the Company has not maintained effective internal control over financial reporting as of December 31, 2014, based on the criteria established in Internal Control—Integrated Framework (2013) issued by the Committee of Sponsoring Organizations of the Treadway Commission.
We have also audited, in accordance with the standards of the Public Company Accounting Oversight Board (United States), the consolidated financial statements as of and for the year ended December 31, 2014, of the Company and our report dated March 2, 2015 expressed an unqualified opinion on those financial statements.
/s/ DELOITTE & TOUCHE LLP
Boston, Massachusetts
March 2, 2015
98
| ITEM 9B. | OTHER INFORMATION |
Not applicable.
99
| ITEM 10. | DIRECTORS, EXECUTIVE OFFICERS AND CORPORATE GOVERNANCE |
The information required by this item is incorporated by reference to the information disclosed under the captions “Board of Directors and Management” and “Ownership of Our Common Stock” in our Proxy Statement for the 2015 Annual Meeting of Stockholders, which we intend to file with the SEC within 120 days of the end of the fiscal year to which this report relates.
| ITEM 11. | EXECUTIVE COMPENSATION |
The information required by this item is incorporated by reference to the information disclosed under the captions “Executive and Director Compensation and Related Matters” and “Board of Directors and Management” in our Proxy Statement for the 2015 Annual Meeting of Stockholders, which we intend to file with the SEC within 120 days of the end of the fiscal year to which this report relates.
| ITEM 12. | SECURITY OWNERSHIP OF CERTAIN BENEFICIAL OWNERS AND MANAGEMENT AND RELATED STOCKHOLDER MATTERS |
The information required by this item is incorporated by reference to the information disclosed under the captions “Ownership of our Common Stock” and “Executive and Director Compensation and Related Matters” in our Proxy Statement for the 2015 Annual Meeting of Stockholders, which we intend to file with the SEC within 120 days of the end of the fiscal year to which this report relates.
| ITEM 13. | CERTAIN RELATIONSHIPS AND RELATED TRANSACTIONS, AND DIRECTOR INDEPENDENCE |
The information required by this item is incorporated by reference to the information disclosed under the caption “Board of Directors and Management” in our Proxy Statement for the 2015 Annual Meeting of Stockholders, which we intend to file with the SEC within 120 days of the end of the fiscal year to which this report relates.
| ITEM 14. | PRINCIPAL ACCOUNTANT FEES AND SERVICES |
The information required by this item is incorporated by reference to the information disclosed under the caption “Proposal 3 Ratification of Appointment of Independent Registered Public Accounting Firm” in our Proxy Statement for the 2015 Annual Meeting of Stockholders, which we intend to file with the SEC within 120 days of the end of the fiscal year to which this report relates.
100
| ITEM 15. | EXHIBITS AND FINANCIAL STATEMENT SCHEDULES |
Financial Statements: See the Index to Consolidated Financial Statements under Item 8 of this Annual Report on Form 10-K.
Financial Statement Schedules: All schedules are omitted as information required is inapplicable or the information is presented in the consolidated financial statements and the related notes.
Exhibits: See the Exhibit Index immediately following the signature page of this Annual Report on Form 10-K.
101
Pursuant to the requirements of Section 13 or 15(d) of the Securities Exchange Act of 1934, the Registrant has duly caused this Annual Report on Form 10-K to be signed on its behalf by the undersigned, thereunto duly authorized, on March 2, 2015.
| DEMANDWARE, INC. | ||
| By: | /s/ Thomas D. Ebling | |
| Name: | Thomas D. Ebling | |
| Title: | President and Chief Executive Officer (Principal Executive Officer) | |
POWER OF ATTORNEY
KNOW ALL PERSONS BY THESE PRESENTS, that each person whose signature appears below constitutes and appoints Thomas D. Ebling and Timothy M. Adams, jointly and severally, his attorney-in-fact, with the power of substitution, for him in any and all capacities, to sign any amendments to this Annual Report on Form 10-K and to file the same, with exhibits thereto and other documents in connection therewith, with the Securities and Exchange Commission, hereby ratifying and confirming all that each of said attorneys-in-fact, or his substitute or substitutes, may do or cause to be done by virtue hereof.
Pursuant to the requirements of the Securities Exchange Act of 1934, this report has been signed below by the following persons on behalf of the Company and in the capacities and on the dates indicated:
| Signature |
Title |
Date | ||
| /s/ Thomas D. Ebling Thomas D. Ebling |
President, Chief Executive Officer and Chairman of the Board (Principal Executive Officer) | March 2, 2015 | ||
| /s/ Timothy M. Adams Timothy M. Adams |
Executive Vice President and Chief Financial Officer (Principal Financial and Accounting Officer) | March 2, 2015 | ||
| /s/ Jeffrey G. Barnett Jeffrey G. Barnett |
Director | March 2, 2015 | ||
| /s/ Lawrence S. Bohn Lawrence S. Bohn |
Director | March 2, 2015 | ||
| /s/ Jill Granoff Jill Granoff |
Director | March 2, 2015 | ||
| /s/ Charles F. Kane Charles F. Kane |
Director | March 2, 2015 | ||
| /s/ Jitendra Saxena Jitendra Saxena |
Director | March 2, 2015 | ||
102
| Signature |
Title |
Date | ||
| /s/ Stephan Schambach Stephan Schambach |
Director | March 2, 2015 | ||
| /s/ Leonard Schlesinger Leonard Schlesinger |
Director | March 2, 2015 | ||
| /s/ Michael J. Skok Michael J. Skok |
Director | March 2, 2015 | ||
103
| 2.1 | Agreement and Plan of Merger, dated January 9, 2015, by and among Demandware, Inc., Augusta AC Corp., Tomax Corporation and William Kennedy as the Company Equityholder Representative. The exhibits and schedules to the Agreement and Plan of Merger have been omitted pursuant to Item 601(b)(2) of Regulation S-K. The Registrant will supplementally furnish copies of any of such exhibits or schedules to the U.S. Securities and Exchange Commission upon request (filed as Exhibit 2.1 to the Registrant’s Current Report on Form 8-K (File No. 001-35450) on January 12, 2015 and incorporated herein by reference) | |
| 3.1 | Amended and Restated Certificate of Incorporation of the Registrant, (filed as Exhibit 3.1 to the Registrant’s Current Report on Form 8-K (File No. 001-35450) on March 20, 2012 and incorporated herein by reference) | |
| 3.2 | By-laws of the Registrant (filed as Exhibit 3.2 to the Registrant’s Current Report on Form 8-K (File No. 001-35450) on March 20, 2012 and incorporated herein by reference) | |
| 10.1* | 2004 Stock Option and Grant Plan, as amended (filed as Exhibit 10.1 to the Registrant’s Form S-1 (File No. 333-17595) and incorporated herein by reference) | |
| 10.2* | Form of Non-Qualified Stock Option Agreement under the 2004 Stock Option and Grant Plan (filed as Exhibit 10.2 to the Registrant’s Form S-1 (File No. 333-17595) and incorporated herein by reference) | |
| 10.3* | 2012 Stock Incentive Plan (filed as Exhibit 10.3 to the Registrant’s Form S-1 (File No. 333-17595) and incorporated herein by reference) | |
| 10.4* | Forms of equity award agreements under 2012 Stock Incentive Plan | |
| 10.5* | Letter Agreement, dated February 11, 2010, between the Registrant and Thomas D. Ebling (filed as Exhibit 10.8 to the Registrant’s Form S-1 (File No. 333-17595) and incorporated herein by reference) | |
| 10.6* | Incentive Stock Option Agreement, dated February 11, 2010, between the Registrant and Thomas D. Ebling (filed as Exhibit 10.9 to the Registrant’s Form S-1 (File No. 333-17595) and incorporated herein by reference) | |
| 10.7* | Transition and Separation Letter Agreement, dated February 10, 2014, between the Registrant and Scott J. Dussault (filed as Exhibit 10.7 to the Registrant’s Annual Report on Form 10-K (File No. 001-35450) on March 3, 2014 and incorporated herein by reference) | |
| 10.8* | Restricted Stock Agreement, dated May 6, 2005, between the Registrant and Wayne R. Whitcomb (filed as Exhibit 10.12 to the Registrant’s Form S-1 (File No. 333-17595) and incorporated herein by reference) | |
| 10.9* | Letter Agreement between the Registrant and Wayne R. Whitcomb related to Mr. Whitcomb’s services to the Registrant (filed as Exhibit 10.13 to the Registrant’s Form S-1 (File No. 333-17595) and incorporated herein by reference) | |
| 10.10* | Letter Agreements between the Registrant and Jeffrey G. Barnett related to Mr. Barnett’s services to the Registrant (filed as Exhibit 10.16 to the Registrant’s Form S-1 (File No. 333-17595) and incorporated herein by reference) | |
| 10.11* | Letter Agreement between the Registrant and Timothy M. Adams related to Mr. Adams’ services to the Registrant (filed as Exhibit 10.1 to the Registrant’s Quarterly Report on Form 10-Q (File No. 001-35450) on August 5, 2014 and incorporated herein by reference) | |
| 10.12* | Letter Agreement between the Registrant and Sheila M. Flaherty related to Ms. Flaherty’ services to the Registrant (filed as Exhibit 10.1 to the Registrant’s Quarterly Report on Form 10-Q (File No. 001-35450) on November 4, 2014 and incorporated herein by reference) | |
104
| 10.13 | Form of indemnification agreement entered into by the Registrant with each of its directors and executive officers in February 2012 (filed as Exhibit 10.17 to the Registrant’s Form S-1 (File No. 333-17595) and incorporated herein by reference) | |||||
| 10.14 | Loan and Security Agreement, dated July 18, 2008, between the Registrant and Silicon Valley Bank, as amended on December 23, 2008, June 26, 2009, March 2, 2010, April 28, 2010, June 23, 2011, August 12, 2011, and June 27, 2012 (filed as Exhibit 10.18 to the Registrant’s Form S-1 (File No. 333-17595) and incorporated herein by reference) | |||||
| 10.15 | Lease Agreement, dated May 28, 2010, between Registrant and Burlington Office Park V Limited Partnership (filed as Exhibit 10.19 to the Registrant’s Form S-1 (File No. 333-17595) and incorporated herein by reference) | |||||
| 10.16 | Sublease, dated January 25, 2012, between the Registrant and Conversent Communications of Massachusetts, Inc., as amended (filed as Exhibit 10.2 to the Registrant’s Quarterly Report on Form 10-Q (File No. 001-35450) on August 5, 2014 and incorporated herein by reference) | |||||
| 10.17 | Sublease Agreement, dated December 30, 2014, between the Registrant and Ascend Learning LLC | |||||
| 21.1 | Subsidiaries of the Registrant | |||||
| 23.1 | Consent of Deloitte & Touche LLP, Independent Registered Public Accounting Firm | |||||
| 24.1 | Power of Attorney (included on the signatures page to the Annual Report on Form 10-K) | |||||
| 31.1 | Certification pursuant to Section 302 of the Sarbanes-Oxley Act of 2002, Rule 13a-14(a)/15d-14(a), by principal executive officer | |||||
| 31.2 | Certification pursuant to Section 302 of the Sarbanes-Oxley Act of 2002, Rule 13a-14(a)/15d-14(a), by principal financial officer | |||||
| 32.1 | Certification pursuant to 18 U.S.C. Section 1350, as adopted pursuant to Section 906 of the Sarbanes-Oxley Act of 2002, by principal executive officer | |||||
| 32.2 | Certification pursuant to 18 U.S.C. Section 1350, as adopted pursuant to Section 906 of the Sarbanes-Oxley Act of 2002, by principal financial officer | |||||
| 101 | 101.INS** | XBRL Instance Document. | ||||
| 101.SCH** | XBRL Taxonomy Extension Schema Document. | |||||
| 101.CAL** | XBRL Taxonomy Calculation Linkbase Document. | |||||
| 101.DEF** | XBRL Taxonomy Extension Definition Linkbase Document. | |||||
| 101.LAB** | XBRL Taxonomy Label Linkbase Document. | |||||
| 101.PRE** | XBRL Taxonomy Presentation Linkbase Document. | |||||
| * | Management Contracts or compensatory plans or arrangements required to be filed as exhibits hereto pursuant to Item 15(a) of Form 10-K. |
| ** | Attached as Exhibit 101 to this report are the following formatted in XBRL (Extensible Business Reporting Language): (i) Consolidated Balance Sheets at December 31, 2014 and December 31, 2013, (ii) Consolidated Statements of Operations and Comprehensive Loss for the years ended December 31, 2014, December 31, 2013 and December 31, 2012, (iii) Consolidated Statements of Stockholders’ Equity (Deficit) for the years ended December 31, 2014, December 31, 2013 and December 31, 2012, (iv) Consolidated Statements of Cash Flows for the years ended December 31, 2014, December 31, 2013 and December 31, 2012, and (v) Notes to Consolidated Financial Statements. |
105