Attached files
| file | filename |
|---|---|
| EX-31.1 - CERTIFICATION PURSUANT TO RULE 13A-14(A)/15D-14(A) - YELP INC | exhibit31-1.htm |
| EX-21.1 - SUBSIDIARIES OF YELP INC. - YELP INC | exhibit21-1.htm |
| EX-31.2 - CERTIFICATION PURSUANT TO RULE 13A-14(A)/15D-14(A) - YELP INC | exhibit31-2.htm |
| EX-23.1 - CONSENT OF INDEPENDENT REGISTERED PUBLIC ACCOUNTING FIRM - YELP INC | exhibit23-1.htm |
| EXCEL - IDEA: XBRL DOCUMENT - YELP INC | Financial_Report.xls |
| EX-32.1 - CERTIFICATIONS OF CHIEF EXECUTIVE OFFICER AND CHIEF FINANCIAL OFFICER - YELP INC | exhibit32-1.htm |
UNITED STATES
SECURITIES AND EXCHANGE COMMISSION
Washington, D.C. 20549
|
Form 10-K |
| ☒ |
ANNUAL REPORT PURSUANT TO SECTION 13 OR 15(d) OF THE SECURITIES EXCHANGE ACT OF 1934 | |
|
For the Fiscal Year Ended December 31, 2014 |
OR
| ☐ |
TRANSITION REPORT PURSUANT TO SECTION 13 OR 15(d) OF THE SECURITIES EXCHANGE ACT OF 1934 | ||
| For the Transition period from | to | ||
Commission file number: 001-35444
|
YELP
INC. |
| Delaware | 20-1854266 |
| (State or other jurisdiction of incorporation or organization) | (I.R.S. Employer Identification No.) |
140 New Montgomery
Street, 9th Floor
San Francisco,
California 94105
(Address
of principal executive offices) (Zip Code)
Registrant’s telephone number, including area code: (415) 908-3801
Securities registered pursuant to Section 12(b) of the Act:
| Title of Each Class | Name of Each Exchange on Which Registered | |
| Class A Common Stock, par value $0.000001 per share | New York Stock Exchange LLC |
Securities registered
pursuant to Section 12(g) of the Act:
None
Indicate by check mark if the registrant is a well-known seasoned issuer, as defined in Rule 405 of the Securities Act. YES ☒ NO ☐
Indicate by check mark if the registrant is not required to file reports pursuant to Section 13 or Section 15(d) of the Act. YES ☐ NO ☒
Indicate by check mark whether the registrant (1) has filed all reports required to be filed by Section 13 or 15(d) of the Securities Exchange Act of 1934 during the preceding 12 months (or for such shorter period that the registrant was required to file such reports), and (2) has been subject to such filing requirements for the past 90 days. YES ☒ NO ☐
Indicate by check mark whether the registrant has submitted electronically and posted on its corporate Website, if any, every Interactive Data File required to be submitted and posted pursuant to Rule 405 of Regulation S-T during the preceding 12 months (or for such shorter period that the registrant was required to submit and post such files). YES ☒ NO ☐
Indicate by check mark if disclosure of delinquent filers pursuant to Item 405 of Regulation S-K is not contained herein, and will not be contained, to the best of registrant’s knowledge, in definitive proxy or information statements incorporated by reference in Part III of this Form 10-K or any amendment to this Form 10-K. ☐
Indicate by check mark whether the registrant is a large accelerated filer, an accelerated filer, a non-accelerated filer, or a smaller reporting company. See the definitions of “large accelerated filer,” “accelerated filer” and “smaller reporting company” in Rule 12b-2 of the Exchange Act.
| Large accelerated filer ☒ | Accelerated filer ☐ |
| Non-accelerated filer (Do not check if a smaller reporting company) ☐ | Smaller reporting company ☐ |
Indicate by check mark whether the registrant is a shell company (as defined in Rule 12b-2 of the Act). YES ☐ NO ☒
The aggregate market value of the voting and non-voting common equity held by non-affiliates of the registrant was approximately $4,716,654,432 as of June 30, 2014, the last day of the registrant’s most recently completed second fiscal quarter, based upon the closing sale price of the registrant's Class A common stock on the New York Stock Exchange LLC reported for June 30, 2014. Excludes an aggregate of 195,660 shares of the registrant’s Class A common stock and an aggregate of 10,288,701 shares of the registrant’s Class B common stock held by officers, directors, affiliated stockholders and The Yelp Foundation. For purposes of determining whether a stockholder was an affiliate of the registrant at June 30, 2014, the registrant assumed that a stockholder was an affiliate of the registrant if such stockholder (i) beneficially owned 10% or more of the registrant’s capital stock, as determined based on public filings, and/or (ii) was an executive officer or director, or was affiliated with an executive officer or director, of the registrant at June 30, 2014. Exclusion of such shares should not be construed to indicate that any such person possesses the power, direct or indirect, to direct or cause the direction of the management or policies of the registrant or that such person is controlled by or under common control with the registrant.
As of February 20, 2015, there were 64,890,244 shares of registrant’s Class A Common Stock, par value $0.000001 per share, issued and outstanding and 9,592,748 shares of registrant’s Class B Common Stock, par value $0.000001 per share, issued and outstanding.
DOCUMENTS INCORPORATED BY REFERENCE
Portions of the registrant’s definitive Proxy Statement for the 2015 Annual Meeting of Stockholders to be filed with the U.S. Securities and Exchange Commission pursuant to Regulation 14A not later than 120 days after the end of the fiscal year covered by this Annual Report on Form 10-K are incorporated by reference in Part III, Items 10-14 of this Annual Report on Form 10-K.
2014 ANNUAL REPORT ON FORM 10-K
____________________
Unless the context suggests otherwise, references in this Annual Report on Form 10-K, or Annual Report, to “Yelp,” the “Company,” “we,” “us,” and “our” refer to Yelp Inc. and, where appropriate, its subsidiaries.
Yelp, Yelp Inc., the Yelp logo, Eat24, SeatMe and other trade names, trademarks or service marks of Yelp appearing in this Annual Report are the property of Yelp. Trade names, trademarks and service marks of other companies appearing in this Annual Report are the property of their respective holders.
Unless the content otherwise indicates, where we refer in this Annual Report to our “mobile application” or “mobile app,” we refer to all of our applications for mobile-enabled devices; references to our “mobile platform” refer to both our mobile app and the versions of our website dedicated to mobile-based browsers. Similarly, references to our “website” refer to both the U.S. and international versions of our website, as well as the versions of our website dedicated to mobile-based browsers.
i
SPECIAL NOTE REGARDING FORWARD-LOOKING STATEMENTS
This Annual Report contains forward-looking statements that involve risks and uncertainties, as well as assumptions that, if they never materialize or prove incorrect, could cause our results to differ materially from those expressed or implied by such forward-looking statements. The statements contained in this Annual Report that are not purely historical are forward-looking statements within the meaning of Section 27A of the Securities Act of 1933, as amended, or the Securities Act, and Section 21E of the Securities Exchange Act of 1934, as amended, or the Exchange Act. Forward-looking statements are often identified by the use of words such as, but not limited to, “anticipate,” “believe,” “can,” “continue,” “could,” “estimate,” “expect,” “intend,” “may,” “might,” “plan,” “project,” “seek,” “should,” “target,” “will,” “would” and similar expressions or variations intended to identify forward-looking statements. These statements are based on the beliefs and assumptions of our management based on information currently available to management. Such forward-looking statements are subject to risks, uncertainties and other important factors that could cause actual results and the timing of certain events to differ materially from future results expressed or implied by such forward-looking statements. Factors that could cause or contribute to such differences include, but are not limited to, those discussed in the section titled “Risk Factors” included under Part I, Item 1A below. Furthermore, such forward-looking statements speak only as of the date of this report. Except as required by law, we undertake no obligation to update any forward-looking statements to reflect events or circumstances after the date of such statements.
ii
PART I
Company Overview
Yelp connects people with great local businesses by bringing “word of mouth” online and providing a platform for businesses and consumers to engage and transact. With a total of approximately 71.2 million cumulative reviews of almost every type of local business in 29 countries as of December 31, 2014, we are one of the world’s leading local business review sites.
Our platform provides value to consumers and businesses alike by connecting consumers with great local businesses at the critical moment when they are deciding where to spend their money. The key strengths of our platform include:
At the heart of our business are the vibrant communities of contributors across the world that contribute the content on our platform. These contributors provide rich, firsthand information about local businesses in the form of reviews and ratings, tips, photos and videos. Each review, tip, photo and video expands the breadth and depth of the content on our platform, which drives a powerful network effect: the expanded content draws in more consumers and more prospective contributors. This increase in content and consumer traffic in turn improves our value proposition to local businesses as they seek easy-to-use and effective advertising solutions. For this reason, we foster and support communities of contributors and make the consumer experience our highest priority.
Of the approximately 71.2 million cumulative reviews our contributors had submitted through December 31, 2014, approximately 50.0 million were recommended and available on business profile pages; approximately 16.3 million were not recommended and available on secondary pages; and approximately 4.9 million had been removed from our platform. Although they do not factor into a business’s overall star rating, we provide access to reviews that are not recommended because they provide additional perspectives and information on reviewed businesses, as well as transparency of the efficacy of our automated recommendation software.
1
The reviews contributed to our platform cover a wide set of local business categories, including restaurants, shopping, beauty and fitness, arts, entertainment and events, home and local services, health, nightlife, travel and hotel, auto and other categories. We highlight below the breakdown by industry of local businesses that have received reviews on our platform and the breakdown by industry of reviews contributed to our platform through December 31, 2014.
|
Reviewed Businesses*
Reviews*
|
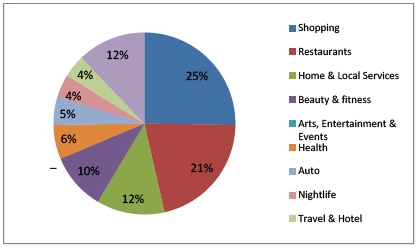
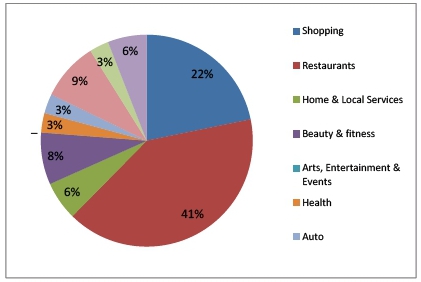
| * | The charts above include information based upon all contributed reviews and include some businesses that have only received reviews that are not recommended or have been removed. |
We believe that the concentration of reviews in the restaurant and shopping categories in particular is primarily due to the frequency with which individuals visit specific businesses or engage in certain activities versus others. For example, an individual may eat at a restaurant three times in one week or go shopping once a week, but the same individual is unlikely to visit a mechanic, get a haircut or use a home or local service with the same frequency.The top five industry categories accounted for an aggregate of 76% of our local advertising revenue for the quarter ended December 31, 2014, broken down as follows: Home & Local Services, 26%; Restaurants, 15%; Beauty & Fitness, 13%; Health, 11%; and Shopping, 11%.
2
Our Products
Local Advertising
We provide both free and paid business listing products to businesses of all sizes. In addition, we enable businesses to deliver targeted search advertising to large local audiences through our website and mobile app. We recognize revenue from these products as local advertising revenue.
|
Free Online Business Account |
We enable businesses to create a free online business account and claim the page for each of their business locations. With their free business accounts, businesses can view trends (e.g. statistics and charts of the performance of their pages on our platform), use the Revenue Estimator tool (e.g. to quantify the revenue opportunity Yelp provides), message customers (e.g. to reply to reviews either publicly or privately), update information (e.g. address, hours of operation) and offer Yelp Deals and Gift Certificates (as described below). | |
|
Enhanced Profile |
Our enhanced profile solution eliminates search advertising from a business’s profile page and allows the business to incorporate a video clip or photo slide show on the page. Businesses can also promote a desired transaction of their choosing — such as scheduling an appointment or printing a coupon — directly on their business listing pages with our Call to Action feature. This feature takes consumers directly from a business’s listing page to the business’s own website to complete the action. | |
Branded Profile |
For businesses with ten or more locations, our branded profile solution offers the ability to incorporate a video clip or photo slide show, as well as a Call to Action Button, on each location’s business listing page. | |
|
Search and Other Ads |
We allow businesses to promote themselves as a sponsored search result on our platform and on the listing pages of related businesses. We sell ads on either a per-impression or per-click basis. | |
|
Online Reservations |
We provide restaurants, nightlife and certain other venues with the ability to offer online reservations directly from their Yelp business listing pages through our SeatMe feature, which also offers front-of-house management tools. We also offer Yelp Reservations, a free tool with basic reservation functionality for businesses in the restaurant and nightlife categories. |
Brand Advertising
We offer advertising solutions for national brands that want to improve their local presence in the form of display advertisements and brand sponsorships. Our national advertisers include leading brands in the food and restaurant, automobile, financial services, logistics, consumer goods and health and fitness industries. We recognize revenue from these products as brand advertising revenue.
|
Traditional Display Advertising |
We offer both graphic and text display advertisements on our website and mobile app. We typically sell these ads on a per-impression basis. We offer businesses display advertising opportunities on our mobile app through display ads that are optimized for the mobile experience, on our home page and on individual web pages. |
3
|
Brand Sponsorships |
Our fixed-price brand sponsorships provide businesses with exclusivity over a section or advertisement placement on Yelp for a fixed period of time. Brand sponsorships are generally associated with a particular platform — desktop, mobile web or mobile app — and are short in duration. |
Other Services
In addition to our business listing and advertising products, we also offer several features and consumer-interactive tools to facilitate transactions between consumers and the local businesses they find on Yelp. We recognize revenue from these sources as other services revenue.
|
Yelp Platform |
The Yelp Platform allows consumers to transact directly on Yelp. Through partnerships with companies including Eat24 (which we acquired in February 2015), Booker, Hipmunk and CellarPass, consumers are currently able to complete food delivery transactions, book spa and salon appointments, and make hotel bookings and winery reservations, all without leaving Yelp. | |
|
Yelp Deals |
Our Yelp Deals product allows local business owners to create promotional discounted deals for their products and services, which are marketed to consumers through our platform. Yelp Deals typically have a fee structure based solely on transaction volume with no upfront costs, and we typically earn a fee based on the discounted price of each deal sold. We process all customer payments and remit to the business the revenue share of any Yelp Deal purchased. | |
|
Gift Certificates |
Our Gift Certificates product allows local business owners to sell full-price gift certificates directly to customers through their business profile pages. The business chooses the price point to offer (from $10 to $500), and the buyer may purchase Gift Certificates denominated in such amounts. We earn a fee based on the amount of the Gift Card sold. We process all consumer payments and remit to the business the revenue share of any Gift Certificate purchased. |
The following table provides a breakdown of our revenue by product for the years indicated:
| Year Ended December 31, | |||||||||
| 2014 | 2013 | 2012 | |||||||
| Percentage of total net revenue by product: | |||||||||
| Local advertising | 85 | % | 83 | % | 79 | % | |||
| Brand advertising | 9 | 12 | 15 | ||||||
| Other services | 6 | 5 | 6 | ||||||
| Total | 100 | % | 100 | % | 100 | % | |||
Our Strategy
Our mission is to connect people with great local businesses. We focus on the following key strategies to grow our business, audience of consumers and advertiser base:
4
Accelerate Network Effect
| ● |
Expand Content. We believe that as the amount of content on
our platform grows, our platform will become more widely known and
relevant to broader audiences, thus attracting new consumers to use our
service. Accordingly, we will continue to explore ways to expand our
content and further enable contributors to share their local experiences
through detailed reviews, photos, tips and other forms of content
contribution across our platform. For example, in the fourth quarter of
2014, we acquired Restaurant Kritik, a German review website, and Cityvox,
a French review website. We plan to migrate the content from those sites
to the Yelp platform in 2015, thereby increasing the depth and breadth of
our European content. In 2014, we also entered into a strategic
partnership with YP – the company formerly
known as Yellow Pages – pursuant to which YP business
owner profile data will appear on our platform. |
| ● |
Increase
Traffic. As we continue to grow our contributor and consumer footprint within Yelp communities,
we expect to benefit from accelerating network effect dynamics, further driving the growth of reviews,
consumers and local business activity. In the first quarter of 2014, we entered into a partnership with
Yahoo! to use Yelp content to power Yahoo Search in the United States, which we believe will increase our
brand recognition and enable us to reach a larger audience. In addition, we expect to redirect traffic from
the Restaurant Kritik and Cityvox websites following our planned migration of the content from those sites
in 2015. We also plan to continue to invest in the development of our mobile platform to take advantage of
the growing number of consumers accessing Yelp through their mobile devices. |
| ● |
Increase Engagement. By continuing to expand our community engagement efforts and providing a more feature-rich experience, we believe we can increase the number of visits and searches per user. In 2014, we added a number of new features aimed at increasing user engagement, including mobile review translations, our “Message the Business” feature, which allows consumers to contact local businesses directly, and the ability for consumers to upload short videos. In 2014, we also introduced Community Ambassadors — a part-time position similar to Community Managers — to foster and support contributors in certain of our smaller communities. |
Enhance Monetization
| ● |
Attract More Businesses. As of December 31, 2014, we were
recognizing revenue from approximately 93.7 thousand local businesses
accounts; with approximately 62.4 million local businesses on our platform
as of that date, we believe there is significant opportunity to increase
the number of local businesses advertising on Yelp. In particular, we
believe that the continued expansion of the Yelp Platform, new business
owner products and comprehensive tools to measure the effectiveness of our
products will encourage businesses to advertise on our platform. For
example, in 2014, we launched a Yelp for Business Owners app, designed to make it easier for
business owners to engage consumers, and Yelp Reservations, a free tool
that allows businesses in the restaurant and nightlife categories to start
taking online reservations. |
| ● |
Expand Our Sales
Efforts. We plan to continue to grow our sales force and explore sales partnerships so
we can reach more businesses. During 2014, we continued to invest aggressively in sales resources. We
believe this ongoing investment in our sales force will drive an increase in local businesses advertising on
Yelp. In addition, we will continue to explore partnerships, such as our YP partnership, for the sale of our
products. |
| ● |
Expand Our
Portfolio of Revenue-Generating Products. We plan to continue to grow and develop
advertising and e-commerce products and partner arrangements that provide incremental value to our
advertisers and business partners to encourage them to increase their advertising budgets allocated towards
our platform. In 2014, we continued to expand the Yelp Platform to provide consumers with a continuous
experience from discovery to completion of transactions across new verticals. For example, we added the
ability for consumers to book spa and salon appointments through Booker, make hotel bookings through Hipmunk and make winery reservations through CellarPass. However, as we explore opportunities to
monetize our products, we remain dedicated to adhering to high standards of user experience. We will not
incorporate advertising or other products or solutions that we believe may excessively degrade the user
experience and potentially alienate users, even if they might result in increased short-term monetization. |
| ● |
Expand Our Reach. We also plan to continue to innovate and introduce our content and solutions on new platforms and distribution channels such as automobile navigation systems, web-enabled televisions and voice-enabled mobile devices. For example, in 2014, we brought Yelp content to wearable devices, such as Intel’s MICA intelligent bracelet. In addition, we continue to have relationships with several companies such as Microsoft Corporation and Apple Inc., under which we make our content and solutions available on their website and consumer devices, respectively. |
5
Marketing
Community Management
We have a team of Community Managers and Community Ambassadors based across the United States and in 28 countries internationally, whose primary goals are to support and grow their local communities of contributors, raise brand awareness and engage with their surrounding communities through:
| ● |
planning and
executing fun and engaging events for the community, such as parties,
outings and activities at restaurants, museums, hotels and other local
places of interest; |
| ● |
getting to know
community members and helping them get to know one another as a way to
foster an offline community experience that can be transferred
online; |
| ● |
promoting Yelp,
including guest appearances on local television and radio, and at local
events such as concerts and street fairs; and |
| ● |
writing weekly e-mail newsletters to share information with the community about local businesses, events and activities. |
Through these activities, we believe our community management team helps us increase awareness of our platform and grow avid communities who are willing to contribute content to our platform. These active contributors to our platform may be invited to attend sponsored social events, but do not receive compensation for their contributions. This community growth drives the network effect whereby contributed reviews expand the breadth and depth of our content base. This expansion draws an increasing number of consumers to access the content on our platform, thus inspiring new and existing contributors to create additional reviews that can be shared with this growing audience.
There are currently active Yelp communities in Argentina, Australia, Austria, Belgium, Brazil, Canada, Chile, the Czech Republic, Denmark, Finland, France, Germany, Hong Kong, Ireland, Italy, Japan, Mexico, The Netherlands, New Zealand, Norway, Poland, Portugal, Singapore, Spain, Sweden, Switzerland, Turkey, the United Kingdom and the United States.
Community Development
The Yelp communities that we have established to date have generally followed a similar development path: a pre-launch content development phase, followed by the hiring of a Community Manager, leading to review growth and consumer activity, which, at scale, supports our sales efforts to local businesses.
We select new locations based on a number of different location-specific criteria, including, but not limited to, population size, local gross domestic product, pre-existing base of reviews on our platform, Internet and wireless penetration, proximity to existing markets, number of local businesses and local ad market growth.
Before launching in any country, we license business listing information from third-party data providers and create individual pages for each business location in the entire country. During this pre-launch preparation phase, we sometimes hire temporary local employees, called “scouts,” to provide additional rich content, such as reviews, photos and hours of operation. To bolster the integrity of the content they provide, we closely monitor their contributions to the platform, prohibit them from reviewing businesses with which they have a conflict of interest and identify them in their public profiles as paid contributors. At launch, consumers can read and write reviews about any business on our platform and contribute information about businesses that are not already listed.
6
After launch, we focus on attracting a community of contributors, consumers and local businesses to our platform by hiring a Community Manager to raise brand awareness and foster local engagement as described above. At scale, our platform reaches a critical mass of reviews, consumers and claimed local business accounts, and we begin an active sales effort with local businesses. Thereafter, our largest expense is related to sales efforts to attract local business advertising customers. In Yelp communities that have attained this level of development, we expect to achieve economies of scale and operating cost leverage.
To further illustrate the development of Yelp communities as they scale, we highlight below our review and revenue metrics for three cohorts of Yelp communities in the United States: the Yelp communities that we launched in 2005-2006; the Yelp communities that we launched in 2007-2008; and the Yelp communities that we launched in 2009-2010.
| U.S. Market Cohort | Number of Yelp Communities(1) |
Average Cumulative Reviews as of December 31, 2014(2) |
Year-Over- Year Growth in Average Cumulative Reviews(3) |
Average Local Advertising Revenue in Q4 2014(4) |
Year-Over- Year Growth in Average Local Advertising Revenue(5) | ||||||||
| 2005 – 2006 Cohort | 6 | 4,728 | 31 | % | $ | 6,532 | 52 | % | |||||
| 2007 – 2008 Cohort | 14 | 1,026 | 34 | % | $ | 1,802 | 63 | % | |||||
| 2009 – 2010 Cohort | 18 | 344 | 43 | % | $ | 470 | 78 | % | |||||
| (1) | A Yelp community, which we previously referred to as a Yelp market, is defined as a city or region in which we have hired a Community Manager. | |
| (2) | Average cumulative reviews is defined as the total cumulative reviews of the cohort as of December 31, 2014 (in thousands), including the reviews that were not recommended or had been removed from our platform, divided by the number of Yelp communities in the cohort. | |
| (3) | Year-over-year growth in average cumulative reviews compares the average cumulative reviews as of December 31, 2014 with the average cumulative reviews as of December 31, 2013. | |
| (4) | Average local advertising revenue is defined as the total local advertising revenue from businesses in the cohort for the quarter ended December 31, 2014 (in thousands), divided by the number of Yelp communities in the cohort. | |
| (5) | Year-over-year growth in average local advertising revenue compares local advertising revenue for the quarter ended December 31, 2014 with local advertising revenue for the quarter ended December 31, 2013. | |
In general, the Yelp communities in our earlier U.S. community cohorts are more populous than those in later cohorts, and we have already entered many of the largest cities in the United States. For these and other reasons, launching additional communities in the United States may not yield results similar to those of our existing U.S. communities.
Advertising
We have not historically spent significantly on marketing programs, but have focused instead on organic and viral growth driven by our community development efforts as described above. However, we believe there may be significant opportunity to increase our traffic and brand awareness through targeted advertising programs and we began selectively testing advertising to consumers through various online and offline channels in the second half of 2014. We plan to continue our selective advertising efforts in 2015. Our marketing expenses may increase if we significantly expand these efforts to attract additional consumers.
7
Sales
We sell our products directly through our sales force, indirectly through partners and online through our website. Our sales force consisted of 1,547 employees as of December 31, 2014 and is located in San Francisco, California; Scottsdale, Arizona; New York, New York; Dublin, Ireland; and Hamburg, Germany. A new sales office in Chicago, Illinois is expected to open in the first quarter of 2015.
Direct Sales. A large majority of our sales force is dedicated to selling our local advertising products. A smaller component of our sales force is responsible for selling display advertisements and brand sponsorships to national advertisers. Local sales representatives are primarily responsible for generating qualified sales leads by identifying and contacting local businesses through direct engagement, direct marketing campaigns and weekly e-mails to claimed local businesses. Although we see opportunity to deepen our relationships with existing customers, to date our sales force has focused on increasing revenue by adding new local advertising accounts. Sales representatives are typically compensated on the basis of revenue booked over a given period.
Sales Partnerships. In 2014, we entered into a partnership with YP under which YP sells certain of our local advertising products as part of a package with its own advertising products to its advertiser base. The products covered by this arrangement include our enhanced profile and Call to Action products. We continue to explore additional partnerships for the sale or bundling of our products.
Self-Service Ads. Our online, or self-service, sales channel allows businesses to purchase local advertising solutions directly from our website. Businesses can purchase performance-based cost-per-click sponsored search advertising directly through this channel.
Technology
Product development and innovation are core pillars of our strategy. We aim to delight our users and business partners with our products. We provide our web-based and mobile services using a combination of in-house and third-party technology solutions and products.
| ● |
Search and Ranking
Technology. We leverage the
data stored on our platform and our proprietary indexing and ranking
techniques to provide our users with contextual, relevant and up-to-date
results to their search queries. For example, a consumer desiring
environmentally friendly carpet cleaners does not have to call individual
cleaners to inquire about their use of chemical-based cleaning solutions.
Instead, the consumer can
search for “environmentally-friendly carpet
cleaners” on Yelp and discover cleaners with the best service and “green”
cleaning products that serve a specific neighborhood. |
| ● |
Recommendation
Software. We employ our
proprietary automated recommendation software to analyze and screen all
reviews submitted to our platform. We believe our recommendation
technology is one of the key contributors to the quality and integrity of
the reviews on our platform and the success of our service. See “—Consumer
Protection Efforts” below
for additional details regarding our recommendation
software. |
| ● |
Mobile Solutions. As mobile device usage has grown over the past several years, we have invested significant resources into the development of a comprehensive mobile platform for consumers supporting the major smartphone operating systems available today, including iOS, Android and Windows Mobile. Over time, we have enhanced the functionality of our mobile platform, such that it provides similar and, in some areas, greater functionality than our website. Some of the innovations we introduced through our mobile platform include “check-ins,” “tips,” “comments,” “Nearby” and “Monocle,” our augmented reality feature. Mobile devices accounted for approximately 65% of all searches on our platform in the quarter ended December 31, 2014, and approximately 43% of our unique visitors in the quarter ended December 31, 2014 were to our mobile website. In December 2014, we also launched a mobile app for business owners, designed to make it easier for them to engage with their customers and manage their Yelp profiles. The Yelp for Business Owners app is currently available for iOS and Android. |
8
| ● |
Advertising Technologies. We use proprietary ad targeting and delivery technologies designed to provide
relevant local advertisements. Our proprietary ad delivery system leverages our unique repository of data
to provide useful ads to users and high value leads to advertisers. |
| ● |
Infrastructure. Our web and mobile platforms are currently hosted from multiple locations. The primary
and secondary locations are within shared data center environments in California and Virginia. We also
host parts of our infrastructure through Amazon Web Services, as well as with third-party leased server
providers. Our web and mobile platforms are designed to have high availability, from the Internet
connectivity providers we choose, to the servers, databases and networking hardware that we deploy. We
design our systems such that the failure of any individual component is not expected to affect the overall
availability of our platform. We also leverage other third-party Internet-based (cloud) services such as
rich-content storage, map-related services, ad serving and bulk processing. |
| ● |
Network Security. Computer viruses, malware, phishing attacks, denial-of-service and other attacks and similar disruptions from unauthorized use of computer systems have become more prevalent in our industry, have occurred on our systems in the past, and we expect them to occur periodically on our systems in the future. For this reason, our platform includes a host of encryption, antivirus, firewall and patch-management technologies designed to help protect and maintain the systems located at data centers as well as other systems and computers across our business. |
Consumer Protection Efforts
Our success depends on our ability to maintain consumer trust in our solutions and in the quality and integrity of the user content and other information found on our platform. We dedicate significant resources to the goal of maintaining and enhancing the quality, authenticity and integrity of the reviews on our platform, primarily through the following methods:
Automated Recommendation Software. We use proprietary software to analyze the reliability and utility of each review submitted to our platform. The software applies the same objective standards to each review based on a wide range of data associated with each review and reviewer — regardless of the business being reviewed. The results of this analysis can change over time as the software factors in new information, which may result in reviews that were previously recommended becoming not recommended, and reviews that were previously not recommended being restored to recommended status. Reviews that the software deems to be the most useful and reliable are published directly on business listing pages, though neither we nor the software purport to establish whether or not any individual review is authentic. As of December 31, 2014, our software was recommending approximately 70% of the reviews submitted to our platform. Reviews that are not recommended are published on secondary pages and do not factor into a business’s overall star rating. As of December 31, 2014, 23% of the reviews submitted to our platform were not recommended but still accessible on our platform.
Sting Operations. We routinely conduct sting operations to identify businesses and individuals who offer or receive cash, discounts or other benefits in exchange for reviews. For example, we may respond to advertisements offering to pay for reviews that are posted on Craigslist, Facebook and other platforms. We also receive and investigate tips from our users about potential paid reviews. If we identify or confirm any such issues through our investigations and operations, we typically pursue one or more of the courses of action described below (each of which we may also employ on a stand-alone basis).
Consumer Alerts Program. We issue consumer alert warnings on business listing pages from time to time when we encounter suspicious activity that we believe is indicative of attempts to deceive or mislead consumers. For example, we may issue a consumer alert if we encounter a business attempting to purchase favorable reviews or a large number of favorable reviews submitted from the same Internet Protocol address. Consumer alerts generally remain in effect for 90 days, or longer if the deceptive practices continue.
9
Coordination with Law Enforcement. We regularly cooperate with law enforcement and consumer protection agencies to investigate and identify businesses and individuals who may be engaged in false advertising or deceptive business practices relating to reviews. For example, in 2013, we assisted the New York Attorney General with “Operation Clean Turf,” an undercover investigation targeting review manipulation that resulted in 19 companies agreeing to pay more than $350,000 in fines to the State of New York.
Legal Action. Our terms of service prohibit the buying and selling of reviews, as well as writing fake reviews. In egregious cases, we take legal action against businesses we believe to be engaged in deceptive practices based on these prohibitions.
Removal of Reviews. We regularly remove reviews from our platform that we believe violate our terms of service, including, without limitation: fake or defamatory reviews; content that has been bought, sold or traded; threatening, harassing or lewd content, as well as hate speech and other displays of bigotry; and content that violates the rights of any third party or any applicable law. Users can access information about reviews that we have removed for a particular business by clicking on a link on the business’s listing page. As of December 31, 2014, 7% of the reviews submitted to our platform had been removed.
Intellectual Property
We rely on federal, state, common law and international rights, as well as contractual restrictions, to protect our intellectual property. We control access to our proprietary technology and algorithms by entering into confidentiality and invention assignment agreements with our employees and contractors, as well as confidentiality agreements with third parties.
In addition to these contractual arrangements, we also rely on a combination of trade secrets, copyrights, trademarks, service marks and domain names to protect our intellectual property. We pursue the registration of our copyrights, trademarks, service marks and domain names in the United States and in certain locations internationally. Our registration efforts have focused on gaining protection of our trademarks for Yelp and the Yelp burst logo, among others. These marks are material to our business and essential to our brand identity as they enable others to easily identify us as the source of the services offered under these marks.
Circumstances outside our control could pose a threat to our intellectual property rights. For example, effective intellectual property protection may not be available in the United States or other countries in which we operate. Also, the efforts we have taken to protect our proprietary rights may not be sufficient or effective. Any significant impairment of our intellectual property rights could harm our business or our ability to compete. Protecting our intellectual property rights is also costly and time-consuming. Any unauthorized disclosure or use of our intellectual property could make it more expensive to do business and harm our operating results.
Companies in the Internet, technology and media industries own large numbers of patents and other intellectual property rights, and frequently request license agreements, or threaten or enter into litigation based on allegations of infringement or other violations of such rights. We do not own any patents and, therefore, may be unable to deter competitors or others from pursuing patent or other intellectual property infringement claims against us. From time to time, we receive notice letters from patent holders alleging that certain of our products and services infringe their patent rights. We are also currently subject to, and expect to face in the future, allegations that we have infringed the trademarks, copyrights, patents and other intellectual property rights of third parties, including our competitors and non-practicing entities. As we face increasing competition and as our business grows, we will likely face more claims of infringement.
10
Competition
The market for information regarding local businesses and advertising is intensely competitive and rapidly changing. We compete for consumer traffic with traditional, offline local business guides and directories as well as other online providers of local and web search. We also compete for a share of local businesses’ overall advertising budgets with traditional, offline media companies and other Internet marketing providers. Our competitors include the following types of businesses:
| ● |
Offline. Competitors include offline media companies
and service providers, many of which have existing relationships with
local businesses. Services provided by competitors range from yellow pages
listings to direct mail campaigns to advertising and listing services in
local newspapers, magazines, television and
radio. |
| ● |
Online. Competitors also include Internet search engines, such as Google, Yahoo! and Bing, review and social media websites as well as various other online service providers. These include regional websites that may have strong positions in particular markets. |
Our competitors may enjoy competitive advantages, such as greater name recognition, longer operating histories, substantially greater market share, established marketing relationships with, and access to, large existing user bases and substantially greater financial, technical and other resources. These companies may use these advantages to offer products similar to ours at a lower price, develop different products to compete with our current solutions and respond more quickly and effectively than we do to new or changing opportunities, technologies, standards or client requirements. Certain competitors could also use strong or dominant positions in one or more markets to gain competitive advantage against us in markets in which we operate.
We compete on the basis of a number of factors. We compete for consumer traffic on the basis of factors including: the reliability of our content; the breadth, depth and timeliness of information; and the strength and recognition of our brand. We compete for local businesses’ advertising budgets on the basis of factors including: the size of our consumer audience; the effectiveness of our advertising solutions; our pricing structure; and recognition of our brand.
Government Regulation
As a company conducting business on the Internet, we are subject to a variety of laws in the United States and abroad that involve matters central to our business, including laws regarding privacy and data retention, distribution of user-generated content, consumer protection and data protection, among others. For example:
| ● |
Privacy. Because we receive, store and process
personal information and other user data, including credit card
information in certain cases, we are subject to numerous federal, state
and local laws around the world regarding privacy and the storing,
sharing, use, processing, disclosure and protection of personal
information and other user data. |
| ● |
Liability for Third-Party Action.
We rely on laws limiting
the liability of providers of online services for activities of their
users and other third parties. |
| ● |
Advertising. We are subject to a variety of laws,
regulations and guidelines that regulate the way we distinguish paid
search results and other types of advertising from unpaid search
results. |
| ● |
Information Security and Data Protection. The laws in several states require companies to implement specific information security controls to protect certain types of information. Likewise, all but a few states have laws in place requiring companies to notify users if there is a security breach that compromises certain categories of their information. |
11
Many of these laws and regulations are still evolving and could be interpreted in ways that harm our business. The application and interpretation of these laws and regulations are often uncertain, particularly in the new and rapidly evolving industry in which we operate. They may be interpreted and applied inconsistently from country to country and inconsistently with our current policies and practices. For example, regulatory frameworks for privacy issues are currently in flux worldwide, and are likely to remain so for the foreseeable future. Similarly, laws providing immunity to websites that publish user-generated content are currently being tested by a number of claims, including actions based on invasion of privacy and other torts, unfair competition, copyright and trademark infringement and other theories based on the nature and content of the materials searched, the ads posted or the content provided by users. Changes in existing laws or regulations or their interpretations, as well as new legislation or regulations, could increase our administrative costs and make it more difficult for consumers to use our platform, resulting in less traffic and revenue. Such changes could also make it more difficult for us to provide effective advertising tools to businesses on our platform, resulting in fewer advertisers and less revenue.
As our business grows and evolves and our solutions are used in a greater number of countries, we will also become subject to laws and regulations in additional jurisdictions. Foreign data protection, privacy and other laws and regulations can be more restrictive than those in the United States. Any failure on our part to comply with these laws may subject us to significant liabilities.
Our Culture and Employees
We take great pride in our company culture and consider it to be one of our competitive strengths. Our culture is at the foundation of our success, and it continues to help drive our business forward as a pivotal part of our everyday operations. It allows us to attract and retain a talented group of employees, create an energetic work environment and continue to innovate in a highly competitive market. As of December 31, 2014, we had 2,711 full-time employees globally.
Our culture extends beyond our offices and into the local communities in which people use Yelp. Our community management team’s responsibilities include supporting the sharing of experiences by consumers in the local markets that they serve and increasing brand awareness. We organize events several times a year to recognize our most important contributors, facilitating face-to-face interactions, building the Yelp brand and fostering the sense of true community in which we believe so strongly. We also engage with small businesses. For example, in 2010, we created the Yelp Small Business Advisory Council as a way to interact with and get feedback from our core community of local business owners. We have also worked with the U.S. Small Business Administration and other partners to educate small business owners across the United States on best practices for online marketing.
In addition, The Yelp Foundation, a non-profit organization established by our board of directors in November 2011, or the Foundation, directly supports consumers and local businesses in the communities in which we operate. In the quarter ended December 31, 2011, our board of directors approved the contribution and issuance to the Foundation of 520,000 shares of our common stock, of which the Foundation had sold 100,000 shares as of December 31, 2014. The Foundation uses the proceeds from the sale of its shares of our common stock to make grants to local non-profit organizations that are actively engaged in supporting community and small business growth. At December 31, 2014, the foundation held 420,000 shares of Class B common stock, representing less than 1% of our outstanding capital stock.
Information About Segment and Geographic Revenue
Information about segment and geographic revenue is set forth in Note 16 of the Notes to Consolidated Financial Statements included elsewhere in this Annual Report.
Seasonality
Our business is affected both by cyclicality in business activity and by seasonal fluctuations in Internet usage and advertising spending. We believe our rapid growth has masked most of the cyclicality and seasonality of our business. As our revenue growth rate slows, we expect that the cyclicality and seasonality in our business may become more pronounced, causing our operating results to fluctuate. In particular, we expect traffic numbers to be weakest in the fourth quarter of the year.
12
Corporate and Available Information
We were incorporated in Delaware on September 3, 2004 under the name Yelp, Inc. We changed our name to Yelp! Inc. in late September 2004 and to Yelp Inc. in February 2012. Our principal executive offices are located at 140 New Montgomery Street, San Francisco, California 94105, and our telephone number is (415) 908-3801. Our website is located at www.yelp.com, and our investor relations website is located at www.yelp-ir.com.
We file or furnish electronically with the U.S. Securities and Exchange Commission, or SEC, our annual reports on Form 10-K, quarterly reports on Form 10-Q, current reports on Form 8-K and amendments to those reports filed or furnished pursuant to Section 13(a) or 15(d) of the Exchange Act. We make copies of these reports available free of charge through our investor relations website as soon as reasonably practicable after we file or furnish them with the SEC.
We webcast our earnings calls and certain events we participate in or host with members of the investment community on our investor relations website. Additionally, we provide notifications of news or announcements regarding our financial performance, including filings with the SEC, investor events, press and earnings releases, and blogs as part of our investor relations website. Investors and others can receive notifications of new information posted on our investor relations website in real time by signing up for email alerts and RSS feeds.
Information contained on or accessible through our websites is not incorporated into, and does not form part of, this Annual Report or any other report or document we file with the SEC, and any references to our websites are intended to be inactive textual references only.
Our operations and financial results are subject to various risks and uncertainties, including those described below, which could adversely affect our business, financial condition, results of operations, cash flows and the trading price of our Class A common stock. You should carefully consider the risks and uncertainties described below before making an investment decision. Additional risks not presently known to us or that we currently believe are immaterial may also significantly impair our business operations.
Risks Related to Our Business and Industry
If we are unable to increase traffic to our website and mobile app, or user engagement on our platform declines, our revenue, business and operating results may be harmed.
We derive substantially all of our revenue from the sale of advertising, primarily through impression- and click-based advertising. Because traffic to our platform determines the number of ads we are able to show, affects the value of those ads to businesses and influences the content creation that drives further traffic, slower growth rates may harm our business and financial results. As a result, our ability to grow our business depends on our ability to increase traffic to and user engagement on our platform. Our traffic could be adversely affected by factors including:
| ● | Reliance on Internet Search Engines. As discussed in greater detail below, we rely on Internet search engines to drive traffic to our platform. However, the display, including rankings, of unpaid search results can be affected by a number of factors, many of which are not in our direct control, and may change frequently. For example, a search engine may change its ranking algorithms, methodologies or design layouts. As a result, links to our website may not be prominent enough to drive traffic to our website, and we may not be in a position to influence the results. Although Internet search engine results have allowed us to attract a large audience with minimal organic traffic acquisition costs to date, if they fail to drive sufficient traffic to our platform in the future, we may need to increase our marketing expenses, which could harm our operating results. |
| ● | Increasing Competition. The market for information regarding local businesses is intensely competitive and rapidly changing. If the popularity, usefulness, ease of use, performance and reliability of our products and services do not compare favorably to those of our competitors, traffic may decline. |
| ● | Review Concentration. Our restaurant and shopping categories together accounted for approximately 42% of the businesses that had been reviewed on our platform and approximately 58% of the cumulative reviews through December 31, 2014. If the high concentration of reviews in these categories generates a perception that our platform is primarily limited to these categories, traffic may not increase or may decline. |
13
| ● |
Our Recommendation
Software. If our automated
software does not recommend helpful content or recommends unhelpful
content, consumers may reduce or stop their use of our platform. While we
have designed our technology to avoid recommending content that we believe
to be unreliable or otherwise unhelpful, we cannot guarantee that our
efforts will be successful. |
| ● |
Content Scraping. From time to time, other companies copy
information from our platform, through website scraping, robots or other
means, and publish or aggregate it with other information for their own
benefit. This may make them more competitive and may decrease the likelihood
that consumers will visit our platform to find the local businesses and information they seek. Though we strive to detect and prevent
this third-party conduct, we may not be able to detect it in a timely manner
and, even if we could, may not be able to prevent it. In some cases,
particularly in the case of websites operating outside of the United
States, our available remedies may be inadequate to protect us against
such conduct. |
| ● |
Internet Access. The adoption of any laws or regulations that
adversely affect the growth, popularity or use of the Internet, including
laws impacting Internet neutrality, could decrease the demand for our
services. Similarly, any
actions by companies that provide Internet access that degrade, disrupt or
increase the cost of user access to our platform could
undermine our operations and result in the loss of
users. |
| ● |
Macroeconomic Conditions. Consumer purchases of discretionary items generally decline during recessions and other periods in which disposable income is adversely affected. As a result, adverse economic conditions may impact consumer spending, particularly with respect to local businesses, which in turn could adversely impact the number of consumers visiting our platform. |
We also anticipate that our traffic growth rate will continue to slow over time, and potentially decrease in certain periods, as our business matures and we achieve higher penetration rates. In particular, the number of major geographic markets, especially within the United States, we have not yet entered is declining; further expansion in smaller markets may not yield similar results or sustain our growth. That our traffic growth has slowed in recent quarters even as we have expanded our international presence is a reflection of this trend. As our traffic growth rate slows, our success will become increasingly dependent on our ability to increase levels of user engagement on our platform. This dependence may increase as the portion of our revenue derived from performance-based advertising increases. A number of factors may negatively affect our user engagement, including if:
| ● |
users engage with
other products, services or activities as an alternative to our
platform; |
| ● |
there is a decrease
in the perceived quality of the content contributed by our
users; |
| ● |
we fail to introduce
new and improved products or features, or we introduce new products or
features that do not effectively address consumer needs or otherwise alienate consumers; |
| ● |
technical or other
problems negatively impact the availability and reliability of our
platform or otherwise affect the user
experience; |
| ● |
users have difficulty
installing, updating or otherwise accessing our platform as a result of
actions by us or third parties that we rely on to distribute our
products; |
| ● |
users believe that
their experience is diminished as a result of the decisions we make with
respect to the frequency, relevance and prominence of the advertising we
display; and |
| ● |
we do not maintain our brand image or our reputation is damaged. |
14
We rely on Internet search engines and application marketplaces to drive traffic to our platform, certain providers of which offer products and services that compete directly with our solutions. If links to our website and applications are not displayed prominently, traffic to our platform could decline and our business would be adversely affected.
Our success depends in part on our ability to attract users through unpaid Internet search results on search engines like Google and Bing. The number of users we attract from search engines to our website (including our mobile website) is due in large part to how and where information from and links to our website are displayed on search engine result pages. The display, including rankings, of unpaid search results can be affected by a number of factors, many of which are not in our direct control, and may change frequently. For example, a search engine may change its ranking algorithms, methodologies or design layouts. As a result, links to our website may not be prominent enough to drive traffic to our website, and we may not know how or otherwise be in a position to influence the results. Beginning in the second quarter of 2014, for example, Google made changes to its algorithms and methodologies that may be contributing to the recent slowing of our traffic growth rate and decline in traffic in the fourth quarter of 2014. We cannot predict the long-term impact of these changes. Although traffic to our mobile app is less reliant on search results than traffic to our website, growth in mobile device usage may not decrease our overall reliance on search results if mobile users use our mobile website rather than our mobile app. In fact, growth in mobile device usage may exacerbate the risks associated with how and where our website is displayed in search results because mobile device screens are smaller than personal computer screens and therefore display fewer search results.
We also rely on application marketplaces, such as Apple’s App Store and Google’s Play, to drive downloads of our applications. In the future, Apple, Google or other marketplace operators may make changes to their marketplaces that make access to our products more difficult. For example, our applications may receive unfavorable treatment compared to the promotion and placement of competing applications, such as the order in which they appear within marketplaces. Similarly, if problems arise in our relationships with providers of application marketplaces, our user growth could be harmed.
In some instances, search engine companies and application marketplaces may change their displays or rankings in order to promote their own competing products or services or the products or services of one or more of our competitors. For example, Google has integrated its local product offering, Google + Local, with certain of its products, including search. The resulting promotion of Google’s own competing products in its web search results has negatively impacted the search ranking of our website. Because Google in particular is the most significant source of traffic to our website, accounting for more than half of the visits to our website from Internet searches during the three months ended December 31, 2014, our success depends on our ability to maintain a prominent presence in search results for queries regarding local businesses on Google. As a result, Google’s promotion of its own competing products or similar actions by Google in the future that have the effect of reducing our prominence or ranking on its search results could have a substantial negative effect on our business and results of operations.
Consumers are increasingly using mobile devices to access online services. If our mobile platform and mobile advertising products are not compelling, or if we are unable to operate effectively on mobile devices, our business could be adversely affected.
The number of people who access information about local businesses through mobile devices, including smartphones, tablets and handheld computers, has increased dramatically over the past few years and is expected to continue to increase. Although many consumers access our platform both on their mobile devices and through personal computers, we have seen substantial growth in mobile usage as we have developed our mobile solutions. We anticipate that growth in use of our mobile platform will be the driver of our growth for the foreseeable future and that usage through personal computers may continue to decline worldwide. As a result, we must continue to drive adoption of and user engagement on our mobile platform, and our mobile app in particular. If we are unable to drive continued adoption of and engagement on our mobile app, our business may be harmed and we may be unable to decrease our reliance on traffic from Google and other search engines.
In order to attract and retain engaged users of our mobile platform, the mobile products and services we introduce must be compelling. However, the ways in which users engage with our platform and consume content has changed over time, and we expect it will continue to do so as users increasingly engage via mobile. This may make it more difficult to develop mobile products that consumers find useful or provide them with the information they seek, and may also negatively affect our content if users do not continue to contribute high quality content on their mobile devices. In addition, building an engaged base of mobile users may also be complicated by the frequency with which users change or upgrade their mobile services. In the event users choose mobile devices that do not already include or support our mobile app or do not install our mobile app when they change or upgrade their devices, our traffic and user engagement may be harmed.
15
Our success is also dependent on the interoperability of our mobile products with a range of mobile technologies, systems, networks and standards that we do not control, such as mobile operating systems like Android and iOS. We may not be successful in developing products that operate effectively with these technologies, systems, networks and standards or in creating, maintaining and developing relationships with key participants in the mobile industry, some of which may be our competitors. Any changes that degrade the functionality of our mobile products, give preferential treatment to competitive products or prevent us from delivering advertising could adversely affect mobile usage and monetization. As new mobile devices and platforms are released, it is difficult to predict the problems we may encounter in developing products for these alternative devices and platforms, and we may need to devote significant resources to the creation, support and maintenance of such products. If we experience difficulties in the future integrating our mobile app into mobile devices, or we face increased costs to distribute our mobile app, our user growth and operating results could be harmed.
In addition, if our mobile advertising products prove ineffective, our advertisers may stop or reduce their advertising with us. Although we currently deliver advertising on our mobile app and mobile website, the mobile advertising market remains a new and evolving market; as new devices and platforms are released, users may begin consuming content in a manner that is more difficult to monetize. Given our limited experience in monetizing our mobile products, we may not be able to generate meaningful revenue from our mobile products despite the expected growth in mobile usage. For example, we may be unable to attract new advertisers if our mobile advertising products are not compelling or we fail to continue to innovate and introduce enhanced mobile solutions. Similarly, if we incur excessive expenses in these efforts or our products are insufficiently profitable, our ability to grow revenue would be negatively affected. However, if our mobile solutions alienate our user base our business may also suffer. Accordingly, we must also balance these considerations against our commitment to prioritizing the quality of user experience over short-term monetization, which we may not do effectively.
If our users fail to contribute high quality content or their contributions are not valuable to other users, our traffic and revenue could be negatively affected.
Our success in attracting users depends on our ability to provide consumers with the information they seek, which in turn depends on the quantity and quality of the content contributed by our users. We believe that as the depth and breadth of the content on our platform grow, our platform will become more widely known and relevant to broader audiences, thereby attracting new consumers to our service. However, if we are unable to provide consumers with the information they seek, they may stop or reduce their use of our platform, and traffic to our website and on our mobile app will decline. If our user traffic declines, our advertisers may stop or reduce the amount of advertising on our platform and our business could be harmed. Our ability to provide consumers with valuable content may be harmed:
| ● | if our users do not contribute content that is helpful or reliable; |
| ● | if our users remove content they previously submitted; |
| ● | as a result of user concerns that they may be harassed or sued by the businesses they review, instances of which have occurred in the past and may occur again in the future; and |
| ● | as users increasingly contribute content through our mobile platform, because content contributed through mobile devices tends to be shorter than desktop contributions. |
Similarly, if our platform does not provide current information about local businesses or users do not perceive reviews on our platform as relevant, our brand and business could be harmed. For example, we do not phase out or remove dated reviews, and consumers may view older reviews as less relevant, helpful or reliable than more recent reviews.
16
If we fail to maintain and expand our base of advertisers, our revenue and our business will be harmed.
Our ability to grow our business depends on our ability to maintain and expand our advertiser base. To do so, we must convince existing and prospective advertisers alike that our advertising products offer a material benefit and can generate a competitive return relative to other alternatives. Our ability to do so depends on factors including:
| ● | Acceptance of Online Advertising. We believe that the continued growth and acceptance of our online advertising products will depend on the perceived effectiveness and the acceptance of online advertising models generally, which is outside of our control. Many advertisers still have limited experience with online advertising and, as a result, may continue to devote significant portions of their advertising budgets to traditional, offline advertising media, such as newspapers or print yellow pages directories. |
| ● | Competitiveness of Our Products. We must deliver ads in an effective manner and provide accurate analytics and measurement solutions that demonstrate the value of our advertising products compared to those of our competitors. Similarly, if the pricing of our advertising products does not compare favorably to those of our competitors, advertisers may reduce their advertising with us or choose not to advertise with us at all. |
| ● | Traffic Quality. The success of our advertising program depends on delivering positive results to our advertising customers. Low-quality or invalid traffic, such as robots, spiders and the mechanical automation of clicking, may be detrimental to our relationships with advertisers and could adversely affect our advertising pricing and revenue. If we fail to detect and prevent click fraud or other invalid clicks on ads, the affected advertisers may experience or perceive a reduced return on their investments, which could lead to dissatisfaction with our products, refusals to pay, refund demands or withdrawal of future business. |
| ● | Perception of Our Platform. Our ability to compete effectively for advertiser budgets depends on our reputation and perceptions regarding our platform. For example, we may face challenges expanding our advertiser base in businesses outside the restaurant and shopping categories if businesses believe that consumers perceive the utility of our platform to be limited to finding businesses in these categories. The ratings and reviews that businesses receive from our users may also affect their advertising decisions. Favorable ratings and reviews, on the one hand, could be perceived as obviating the need to advertise. Unfavorable ratings and reviews, on the other, could discourage businesses from advertising to an audience that they perceive as hostile or cause them to form a negative opinion of our products and user base. |
| ● | Macroeconomic Conditions. Adverse macroeconomic conditions can have a negative impact on the demand for advertising, particularly with respect to online advertising products. We rely heavily on small and medium-sized businesses, which often have limited advertising budgets and may be disproportionately affected by economic downturns. In addition, such business may view online advertising as lower priority than offline advertising. |
As is typical in our industry, our advertisers generally do not have long-term obligations to purchase our products. Their decisions to renew depend on the degree of satisfaction with our products as well as a number of factors that are outside of our control, including their ability to continue their operations and spending levels. Small and medium-sized local businesses in particular have historically experienced high failure rates. As a result, we may experience attrition in our advertisers in the ordinary course of business resulting from several factors, including losses to competitors, declining advertising budgets, closures and bankruptcies. To grow our business, we must continually add new advertisers to replace advertisers who choose not to renew their advertising, or who go out of business or otherwise fail to fulfill their advertising contracts with us, which we may not be able to do.
If we fail to expand our operations effectively, including in international markets where we have limited operating experience and may be subject to increased risks, our revenue and business will be harmed.
We intend to expand our operations into new markets, both domestically and abroad. Our expansion into new markets places us in competitive environments with which we are unfamiliar and involves various challenges, such as expanding our sales force and community management personnel to reach those new markets, and encountering different and potentially lower levels of user engagement or advertiser demand in some or all of these markets. Our current and future expansion plans will require significant resources and management attention, and the returns on such investments may not be achieved for several years, or at all.
17
Because we have already entered many of the largest markets in the United States and further expansion in smaller markets may not yield similar results, our continued growth depends on our ability to expand effectively in international markets. We have a limited operating history in international markets, which makes it difficult to evaluate our future prospects and may increase the risk that we will not be successful. If the markets we have targeted for international expansion do not develop as we expect, or if we fail to address the needs of those markets, our business will be harmed. Expanding internationally may also subject us to risks that we have not faced before or that increase our exposure to risks that we currently face, including risks associated with:
| ● | operating a rapidly growing business in an environment of multiple languages, cultures, customs, legal systems, regulatory systems and commercial infrastructures; |
| ● | recruiting and retaining qualified, multi-lingual employees, including sales personnel; |
| ● | increased competition from local websites and guides, and potential preferences by local populations for local providers; |
| ● | our ability to achieve prominent display of our content in unpaid search results, which may be more difficult in newer markets where we may have less content and more competitors than in more established markets; |
| ● | providing solutions in different languages for different cultures, which may require that we modify our solutions and features to ensure that they are culturally relevant in different countries; |
| ● | compliance with applicable foreign laws and regulations, including different privacy, censorship and liability standards; |
| ● | the enforceability of our intellectual property rights; |
| ● | credit risk and higher levels of payment fraud; |
| ● | currency exchange rate fluctuations; |
| ● | compliance with anti-bribery laws, including but not limited to the Foreign Corrupt Practices Act and the U.K. Bribery Act; |
| ● | foreign exchange controls that might prevent us from repatriating cash earned outside the United States; |
| ● | political and economic instability in some countries; |
| ● | double taxation of our international earnings and potential adverse tax consequences due to changes in the tax laws of the United States or foreign jurisdictions in which we operate; and |
| ● | higher costs of doing business internationally. |
We may acquire other companies or technologies, which could divert our management’s attention, result in additional dilution to our stockholders and otherwise disrupt our operations and harm our operating results. We may also be unable to realize the expected benefits and synergies of any acquisitions.
Our success will depend, in part, on our ability to expand our product offerings and grow our business in response to changing technologies, user and advertiser demands and competitive pressures. In some circumstances, we may determine to do so through the acquisition of complementary businesses or technologies rather than through internal development. For example, in February 2015, we acquired Eat24 to obtain an online food ordering solution. We have limited experience as a company in the complex process of acquiring other businesses and technologies. The pursuit of potential future acquisitions may divert the attention of management and cause us to incur expenses in identifying, investigating and pursuing acquisitions, whether or not they are consummated.
18
Acquisitions that are consummated could result in dilutive issuances of equity securities or the incurrence of debt, which could adversely affect our results of operations or our ability to maintain profitability. The incurrence of debt in particular could result in increased fixed obligations or include covenants or other restrictions that would impede our ability to manage our operations. In addition, any acquisitions we announce could be viewed negatively by users, businesses or investors. We may also discover liabilities or deficiencies associated with the companies or assets we acquire that we did not identify in advance, which may result in significant unanticipated costs. The effectiveness of our due diligence review and our ability to evaluate the results of such due diligence are dependent upon the accuracy and completeness of statements and disclosures made by the companies we acquire or their representatives, as well as the limited amount of time in which acquisitions are executed. We may also fail to accurately forecast the financial impact of an acquisition transaction, including tax and accounting charges.
In order to realize the expected benefits and synergies of any acquisition that is consummated, we must meet a number of significant challenges that may create unforeseen operating difficulties and expenditures, including:
| ● | integrating operations, strategies, services, sites and technologies of the acquired company; |
| ● | managing the combined business effectively; |
| ● | retaining and assimilating the employees of the acquired company; |
| ● | retaining existing customers and strategic partners and minimizing disruption to existing relationships as a result of any integration of new personnel; |
| ● | difficulties in the assimilation of corporate cultures; |
| ● | implementing and retaining uniform standards, controls, procedures, policies and information systems; and |
| ● | addressing risks related to the business of the acquired company that may continue to impact the business following the acquisition. |
Any inability to integrate services, sites and technologies, operations or personnel in an efficient and timely manner could harm our results of operations. Transition activities are complex and require significant time and resources, and we may not manage the process successfully, particularly if we are managing multiple integrations concurrently. Our ability to integrate complex acquisitions is unproven, particularly with respect to companies that have significant operations or that develop products with which we do not have prior experience. For example, Eat24 is larger and more complex than previous companies we have acquired. In addition, Eat24 operates a business that is new to us, and we do not currently have significant experience or structure in place to support this business. We plan to invest resources to support this and any future acquisitions, which will result in ongoing operating expenses and may divert resources and management attention from other areas of our business. We cannot assure you that these investments will be successful. Even if we are able to integrate the operations of any acquired company successfully, these integrations may not result in the realization of the full benefits of synergies, cost savings, innovation and operational efficiencies that may be possible from the combination of the businesses, or we may not achieve these benefits within a reasonable period of time.
We rely on third-party service providers and strategic partners for many aspects of our business, and any failure to maintain these relationships could harm our business.
We rely on relationships with various third parties to grow our business, including strategic partners and technology and content providers. For example, we rely on third parties for data about local businesses, mapping functionality and administrative software solutions. We also rely on partners for various transactions available through the Yelp Platform, including Booker for spa and salon appointments, Locu for menu data and Hipmunk for hotel bookings, among others. Identifying, negotiating and maintaining relationships with third parties require significant time and resources, as does integrating their data, services and technologies onto our platform. It is possible that these third parties may not be able to devote the resources we expect to the relationships. We may also have competing interests and obligations with respect to our partners in particular, which may make it difficult to maintain, grow or maximize the benefit for each partnership. Our focus on integrating additional partners to expand the Yelp Platform may exacerbate this risk.
19
If our relationships with our partners and providers deteriorate, we could suffer increased costs and delays in our ability to provide consumers and advertisers with content or similar services. We have had, and may in the future have, disagreements or disputes with our partners about our respective contractual obligations, which could result in legal proceedings or negatively affect our brand and reputation. In addition, we exercise limited control over our third-party partners and vendors, which makes us vulnerable to any errors, interruptions or delays in their operations. If these third parties experience any service disruptions, financial distress or other business disruption, or difficulties meeting our requirements or standards, it could make it difficult for us to operate some aspects of our business. Similarly, upon expiration or termination of any of our agreements with third-party providers, we may not be able to replace the services provided to us in a timely manner or on terms that are favorable to us, if at all, and a transition from one partner or provider to another could subject us to operational delays and inefficiencies.
We face competition for both local business directory traffic and advertiser spending, and expect competition to increase in the future.
The market for information regarding local businesses and advertising is intensely competitive and rapidly changing. With the emergence of new technologies and market entrants, competition is likely to intensify in the future. We compete for consumer traffic with traditional, offline local business guides and directories, Internet search engines, such as Google and Bing, review and social media websites and various other online service providers. These competitors may include regional review websites that may have strong positions in particular countries. We also compete with these companies for the content of contributors, and may experience decreases in both traffic and user engagement if our competitors offer more compelling environments.
Although advertisers are allocating an increasing amount of their overall marketing budgets to online advertising, such spending lags behind growth in Internet and mobile usage generally, making the market for online advertising intensely competitive. We compete for a share of local businesses’ overall advertising budgets with traditional, offline media companies and service providers, as well as Internet marketing providers. Many of these companies have established marketing relationships with local businesses, and certain of our online competitors have substantial proprietary advertising inventory and web traffic that may provide a significant competitive advantage.
Certain competitors could use strong or dominant positions in one or more markets to gain competitive advantage against us in areas in which we operate, including by: integrating review platforms or features into products they control, such as search engines, web browsers or mobile device operating systems; making acquisitions; changing their unpaid search result rankings to promote their products; refusing to enter into or renew licenses on which we depend; limiting or denying our access to advertising measurement or delivery systems; limiting our ability to target or measure the effectiveness of ads; or making access to our platform more difficult. This risk may be exacerbated by the trend in recent years toward consolidation among online media companies, potentially allowing our larger competitors to offer bundled or integrated products that feature alternatives to our platform.
Our competitors may also enjoy competitive advantages, such as greater name recognition, longer operating histories, substantially greater market share, large existing user bases and substantially greater financial, technical and other resources. Traditional television and print media companies, for example, have large established audiences and more traditional and widely accepted advertising products. These companies may use these advantages to offer products similar to ours at a lower price, develop different products to compete with our current solutions and respond more quickly and effectively than we do to new or changing opportunities, technologies, standards or client requirements. In particular, major Internet companies, such as Google, Facebook, Yahoo! and Microsoft, may be more successful than us in developing and marketing online advertising offerings directly to local businesses, and may leverage their relationships based on other products or services to gain additional share of advertising budgets.
20
To compete effectively, we must continue to invest significant resources in product development to enhance user experience and engagement, as well as sales and marketing to expand our base of advertisers. However, there can be no assurance that we will be able to compete successfully for users and advertisers against existing or new competitors, and failure to do so could result in loss of existing users, reduced revenue, increased marketing expenses or diminished brand strength, any of which could harm our business.
Our business depends on a strong brand, and any failure to maintain, protect and enhance our brand would hurt our ability to retain and expand our base of users and advertisers, as well as our ability to increase the frequency with which they use our products.
We have developed a strong brand that we believe has contributed significantly to the success of our business. Maintaining, protecting and enhancing the “Yelp” brand are critical to expanding our base of users and advertisers and increasing the frequency with which they use our solutions. Our ability to do so will depend largely on our ability to maintain consumer trust in our solutions and in the quality and integrity of the user content and other information found on our platform, which we may not do successfully. We dedicate significant resources to these goals, primarily through our automated recommendation software, sting operations targeting the buying and selling of reviews, our consumer alerts program, coordination with consumer protection agencies and law enforcement, and, in certain egregious cases, taking legal action against business we believe to be engaged in deceptive activities. We also endeavor to remove content from our platform that violates our terms of service.
Despite these efforts, we cannot guarantee that each of the 71.2 million reviews on our platform that have been recommended and that have not been removed as of December 31, 2014 is useful or reliable, or that consumers will trust the integrity of our content. For example, if our recommendation software does not recommend helpful content or recommends unhelpful content, consumers and businesses alike may stop or reduce their use of our platform and products. Some consumers and businesses have alternately expressed concern that our technology either recommends too many reviews, thereby recommending some reviews that may not be legitimate, or too few reviews, thereby not recommending some reviews that may be legitimate. If consumers do not believe our recommended reviews to be useful and reliable, they may seek other services to obtain the information for which they are looking, and may not return to our platform as often in the future, or at all. This would negatively impact our ability to retain and attract users and advertisers and the frequency with which they use our platform.
Consumers may also believe that the reviews, photos and other user content contributed by our Community Managers or other employees are influenced by our advertising relationships or are otherwise biased. Although we take steps to prevent this from occurring by, for example, identifying Community Managers as Yelp employees on their account profile pages and explaining their role on our platform, the designation does not appear on the page for each review contributed by the Community Manager and we may not be successful in our efforts to maintain consumer trust. Similarly, the actions of our partners may affect our brand if users do not have a positive experience on the Yelp Platform. If others misuse our brand or pass themselves off as being endorsed or affiliated with us, it could harm our reputation and our business could suffer. Our website and mobile app also serve as a platform for expression by our users, and third parties or the public at large may also attribute the political or other sentiments expressed by users on our platform to us, which could harm our reputation.
21
In addition, negative publicity about our company, including our technology, sales practices, personnel, customer service, litigation or political activities could diminish confidence in our brand and the use of our products. Certain media outlets have previously reported allegations that we manipulate our reviews, rankings and ratings in favor of our advertisers and against non-advertisers. In order to demonstrate that our automated recommendation software applies in a nondiscriminatory manner to both advertisers and non-advertisers, we allow users to access reviews that are both recommended and not recommended by our software. We have also allowed businesses to comment publicly on reviews so that they can provide a response. Nevertheless, our reputation and brand, the traffic to our website and mobile app and our business may suffer if negative publicity about our company persists or if users otherwise perceive that our content is manipulated or biased. Allegations and complaints regarding our business practices, and any resulting negative publicity, may also result in increased regulatory scrutiny of our company. In addition to requiring management time and attention, any regulatory inquiry or investigation could itself result in further negative publicity regardless of its merit or outcome.
Maintaining and enhancing our brand may also require us to make substantial investments, and these investments may not be successful. For example, our trademarks are an important element of our brand. We have faced in the past, and may face in the future, oppositions from third parties to our applications to register key trademarks in foreign jurisdictions in which we expect to expand our presence. If we are unsuccessful in defending against these oppositions, our trademark applications may be denied. Whether or not our trademark applications are denied, third parties may claim that our trademarks infringe their rights. As a result, we could be forced to pay significant settlement costs or cease the use of these trademarks and associated elements of our brand in certain jurisdictions. Doing so could harm our brand recognition and adversely affect our business. If we fail to maintain and enhance our brand successfully, or if we incur excessive expenses in this effort, our business and financial results may be adversely affected.
If we fail to manage our growth effectively, our brand, results of operations and business could be harmed.
We have experienced rapid growth in our headcount and operations, including through our acquisitions of other businesses, such as SeatMe in 2013 and Eat24 in February 2015, which places substantial demands on management and our operational infrastructure. Most of our employees have been with us for fewer than two years; to manage the expected growth of our operations, we will need to continue to increase the productivity of our current employees and hire, train and manage new employees. In particular, we intend to continue to make substantial investments in our engineering, sales and marketing and community management organizations. As a result, we must effectively integrate, develop and motivate a large number of new employees, including employees in international markets and from any acquired businesses, while maintaining the beneficial aspects of our company culture.
To manage this growth, we may need to improve our operational, financial and management systems and processes, which may require significant capital expenditures and allocation of valuable management and employee resources, as well as subject us to the risk of over-expanding our operating infrastructure. However, if we fail to scale our operations successfully and increase productivity, the quality of our platform and efficiency of our operations could suffer, which could harm our brand, results of operations and business.
We make the consumer experience our highest priority. Our dedication to making decisions based primarily on the best interests of consumers may cause us to forgo short-term gains and advertising revenue.
We base many of our decisions on the best interests of the consumers who use our platform. In the past, we have forgone, and we may in the future forgo, certain expansion or revenue opportunities that we do not believe are in the best interests of consumers, even if such decisions negatively impact our results of operations in the short term. Our approach of putting consumers first may negatively impact our relationship with existing or prospective advertisers. For example, unless we believe that a review violates our terms of service, such as reviews that contain hate speech or bigotry, we will allow the review to remain on our platform, even if the business disputes its accuracy. Certain advertisers may therefore perceive us as an impediment to their success as a result of negative reviews and ratings. This practice could result in a loss of advertisers, which in turn could harm our results of operations. However, we believe that this approach has been essential to our success in attracting users and increasing the frequency with which they use our platform. As a result, we believe this approach has served the long-term interests of our company and our stockholders and will continue to do so in the future.
22
We rely on the performance of highly skilled personnel, and if we are unable to attract, retain and motivate well-qualified employees, our business could be harmed.
We believe our success has depended, and continues to depend, on the efforts and talents of our employees, including our senior management team, software engineers, marketing professionals and advertising sales staff. The loss of any of our senior management or key employees could materially adversely affect our ability to execute our business plan, and we may not be able to find adequate replacements. All of our officers and other U.S. employees are at-will employees, which means they may terminate their employment relationship with us at any time, and their knowledge of our business and industry would be extremely difficult to replace.
Our future depends on our continuing ability to attract, develop, motivate and retain highly qualified and skilled employees. Qualified individuals are in high demand, and we may incur significant costs to attract them before we can validate their productivity. The significant increase in the price of our Class A common stock since we became a public company in 2012 may make it more difficult or costly in the future to use equity compensation to motivate, incentivize and retain our employees. If we do not succeed in attracting well-qualified employees or retaining and motivating existing employees, our business could be harmed.
Risks Related to Our Technology
Our business is dependent on the uninterrupted and proper operation of our technology and network infrastructure. Any significant disruption in our service could damage our reputation, result in a potential loss of users and engagement and adversely affect our results of operations.
It is important to our success that users in all geographies be able to access our platform at all times. We have previously experienced, and may experience in the future, service disruptions, outages and other performance problems. Such performance problems may be due to a variety of factors, including infrastructure changes, human or software errors and capacity constraints due to an overwhelming number of users accessing our platform simultaneously. Our products and services are highly technical and complex, and may contain errors or vulnerabilities that could result in unanticipated downtime for our platform and harm to our reputation and business. Users may also use our products in unanticipated ways that may cause a disruption in service for other users attempting to access our platform. We may encounter such difficulties more frequently as we acquire companies and incorporate their technologies into our service. It may also become increasingly difficult to maintain and improve the availability of our platform, especially during peak usage times, as our solutions become more complex and our user traffic increases.
In some instances, we may not be able to identify the cause or causes of these performance problems within an acceptable period of time. If our platform is unavailable when users attempt to access it or it does not load as quickly as they expect, users may seek other services to obtain the information for which they are looking, and may not return to our platform as often in the future, or at all. This would negatively impact our ability to attract users and advertisers and increase the frequency with which they user our platform. We expect to continue to make significant investments to maintain and improve the availability of our platform and to enable rapid releases of new features and products. To the extent that we do not effectively address capacity constraints, upgrade our systems as needed and continually develop our technology and network architecture to accommodate actual and anticipated changes in technology, our business and operating results may be harmed.
23
Our systems are also vulnerable to damage or interruption from catastrophic occurrences such as earthquakes, fires, floods, power losses, telecommunications failures, terrorist attacks and similar events. Our U.S. corporate offices and one of the facilities we lease to house our computer and telecommunications equipment are located in the San Francisco Bay Area, a region known for seismic activity. In addition, acts of terrorism, which may be targeted at metropolitan areas that have higher population densities than rural areas, could cause disruptions in our or our local business advertisers’ businesses or the economy as a whole. We may not have sufficient protection or recovery plans in certain circumstances, such as natural disasters affecting the San Francisco Bay Area, and our business interruption insurance may be insufficient to compensate us for losses that may occur. Our disaster recovery program contemplates transitioning our platform and data to a backup center in the event of a catastrophe. Although this program is functional, if our primary data center shuts down, there will be a period of time that our services will remain shut down while the transition to the back-up data center takes place. During this time, our platform may be unavailable in whole or in part to our users.
If our security measures are compromised, or if our platform is subject to attacks that degrade or deny the ability of users to access our content, users may curtail or stop use of our platform.
Our platform involves the storage and transmission of user and business information, some of which may be private, and security breaches could expose us to a risk of loss of this information, which could result in potential liability and litigation. Computer viruses, break-ins, malware, phishing attacks, attempts to overload servers with denial-of-service or other attacks and similar disruptions from unauthorized use of computer systems have become more prevalent in our industry, have occurred on our systems in the past and are expected to occur periodically on our systems in the future. We may be a particularly compelling target for such attacks as a result of our brand recognition. User and business owner accounts and profile pages could be hacked, hijacked, altered or otherwise claimed or controlled by unauthorized persons. For example, we enable businesses to create free online accounts and claim the business profile pages for each of their business locations. Although we take steps to confirm that the person setting up the account is affiliated with the business, our verification systems could fail to confirm that such person is an authorized representative of the business, or mistakenly allow an unauthorized person to claim the business’s profile page. In addition, we face risks associated with security breaches affecting our third-party partners and service providers. A security breach at any such third party could be perceived by consumers as a security breach of our systems and result in negative publicity, damage to our reputation and expose us to other losses.
Although none of the disruptions we have experienced to date have had a material effect on our business, any future disruptions could lead to interruptions, delays or website shutdowns, causing loss of critical data or the unauthorized disclosure or use of personally identifiable or other confidential information. Even if we experience no significant shutdown or no critical data is lost, obtained or misused in connection with an attack, the occurrence of such attack or the perception that we are vulnerable to such attacks may harm our reputation, our ability to retain existing users and our ability to attract new users. Although we have developed systems and processes that are designed to protect our data and prevent data loss and other security breaches, the techniques used to obtain unauthorized access, disable or degrade service or sabotage systems change frequently, often are not recognized until launched against a target and may originate from less regulated and more remote areas around the world. As a result, these preventative measures may not be adequate and we cannot assure you that they will provide absolute security.
Any or all of these issues could negatively impact our ability to attract new users, deter current users from returning to our platform, cause existing or potential advertisers to cancel their contracts or subject us to third-party lawsuits or other liabilities. For example, we work with third-party vendors to process credit card payments by users and businesses, and are subject to payment card association operating rules. If our security measures fail to protect payment information adequately as a result of employee error, malfeasance or otherwise, or we fail to comply with the applicable operating rules, we could be liable to the users and businesses for their losses, as well as the vendors under our agreements with them, and be subject to fines and higher transaction fees. In addition, government authorities could also initiate legal or regulatory actions against us in connection with such incidents, which could cause us to incur significant expense and liability or result in orders or consent decrees forcing us to modify our business practices.
24
Some of our products contain open source software, which may pose particular risks to our proprietary software and solutions.
We use open source software in our products and will use open source software in the future. From time to time, we may face claims from third parties claiming ownership of, or demanding release of, the open source software or derivative works that we developed using such software (which could include our proprietary source code), or otherwise seeking to enforce the terms of the applicable open source license. These claims could result in litigation and could require us to purchase a costly license or cease offering the implicated solutions unless and until we can re-engineer them to avoid infringement. This re-engineering process could require significant additional research and development resources. In addition to risks related to license requirements, use of certain open source software can lead to greater risks than use of third-party commercial software because open source licensors generally do not provide warranties or controls on the origin of the software. Any of these risks could be difficult to eliminate or manage and, if not addressed, could have a negative effect on our business and operating results.
Failure to protect or enforce our intellectual property rights could harm our business and results of operations.
We regard the protection of our trade secrets, copyrights, trademarks and domain names as critical to our success. In particular, we must maintain, protect and enhance the “Yelp” brand. We pursue the registration of our domain names, trademarks and service marks in the United States and in certain jurisdictions abroad. We strive to protect our intellectual property rights by relying on federal, state and common law rights, as well as contractual restrictions. We typically enter into confidentiality and invention assignment agreements with our employees and contractors, as well as confidentiality agreements with parties with whom we conduct business in order to limit access to, and disclosure and use of, our proprietary information. However, these contractual arrangements and the other steps we have taken to protect our intellectual property may not prevent the misappropriation or disclosure of our proprietary information nor deter independent development of similar technologies by others.
Effective trade secret, copyright, trademark and domain name protection is expensive to develop and maintain, both in terms of initial and ongoing registration requirements and expenses and the costs of defending our rights. We are seeking to protect our intellectual property, including trademarks and domain names, in an increasing number of jurisdictions, a process that is expensive and may not be successful, but have not done so in every location in which we operate. Litigation may become necessary to enforce our intellectual property rights, protect our respective trade secrets or determine the validity and scope of proprietary rights claimed by others. For example, we may incur significant costs in enforcing our trademarks against those who attempt to imitate our “Yelp” brand. Any litigation of this nature, regardless of outcome or merit, could result in substantial costs and diversion of management and technical resources, any of which could adversely affect our business and operating results.
We may be unable to continue to use the domain names that we use in our business, or prevent third parties from acquiring and using domain names that infringe on, are similar to, or otherwise decrease the value of our brand or our trademarks or service marks.
We have registered domain names for the websites that we use in our business, such as Yelp.com. If we lose the ability to use a domain name, whether due to trademark claims, failure to renew the applicable registration or any other cause, we may be forced to market our products under a new domain name, which could cause us substantial harm or cause us to incur significant expense in order to purchase rights to the domain name in question. In addition, our competitors and others could attempt to capitalize on our brand recognition by using domain names similar to ours. Domain names similar to ours have been registered by others in the United States and elsewhere. We may be unable to prevent third parties from acquiring and using domain names that infringe on, are similar to or otherwise decrease the value of our brand or our trademarks or service marks. Protecting and enforcing our rights in our domain names may require litigation, which could result in substantial costs and diversion of management’s attention.
25
Risks Related to Our Financial Statements and Tax Structure
We have a limited operating history in an evolving industry, which makes it difficult to evaluate our future prospects and may increase the risk that we will not be successful. We also expect our operating results to fluctuate on a quarterly and annual basis, which increases the difficulty in predicting our future performance.
We have a limited operating history in an evolving industry that may not develop as expected, if at all. As a result, our historical operating results may not be indicative of our future operating results, making it difficult to assess our future prospects. You should consider our business and prospects in light of the risks and difficulties we may encounter in this rapidly evolving industry, which we may not be able to address successfully. These risks and difficulties include our ability to, among other things:
| ● |
increase the number of users of our website and mobile app and the number of reviews and other content on our platform; |
| ● |
attract and retain new advertising clients, many of which may have limited or no online advertising experience; |
| ● |
forecast revenue and adjusted EBITDA accurately, which may be more difficult as we sell more performance-based advertising, as well as appropriately estimate and plan our expenses; |
| ● |
continue to earn and preserve a reputation for providing meaningful and reliable reviews of local businesses; |
| ● |
effectively monetize our mobile products as usage continues to migrate toward mobile devices; |
| ● |
successfully compete with existing and future providers of other forms of offline and online advertising; |
| ● |
successfully compete with other companies that are currently in, or may in the future enter, the business of providing information regarding local businesses; |
| ● |
expand successfully in existing markets, enter new markets and manage our international expansion; |
| ● |
successfully develop and deploy new features and products; |
| ● |
manage and integrate successfully any acquisitions of businesses, solutions or technologies, such as Eat24; |
| ● |
avoid interruptions or disruptions in our service or slower than expected load times; |
| ● |
develop a scalable, high-performance technology infrastructure that can efficiently and reliably handle increased usage globally, as well as the deployment of new features and products; |
| ● |
hire, integrate and retain talented sales and other personnel; |
| ● |
effectively manage rapid growth in our sales force, other personnel and operations; and |
| ● |
effectively identify, engage and manage third-party partners and service providers. |
If the demand for information regarding local businesses does not develop as we expect, or if we fail to address the needs of this demand, our business will be harmed. We may not be able to address successfully these risks and difficulties or others, including those described elsewhere in these risk factors. Failure to address these risks and difficulties adequately could harm our business and cause our operating results to suffer.
26
We expect a number of factors to cause our operating results to fluctuate on a quarterly and annual basis, which may make it difficult to predict our future performance.
Our operating results could vary significantly from period to period as a result of a variety of factors, , many of which may be outside of our control. This volatility increases the difficulty in predicting our future performance and means comparing our operating results on a period-to-period basis may not be meaningful. In addition to the other risk factors discussed in this section, factors that may contribute to the volatility of our operating results include:
| ● |
changes in our pricing policies and terms of contracts, whether initiated by us or as a result of competition; |
| ● |
cyclicality and seasonality, which may become more pronounced as our growth rate slows; |
| ● |
the effects of changes in search engine placement and prominence; |
| ● |
the adoption of any laws or regulations that adversely affect the growth, popularity or use of the Internet, such as laws impacting Internet neutrality; |
| ● |
the success of our sales and marketing efforts; |
| ● |
costs associated with defending intellectual property infringement and other claims and related judgments or settlements; |
| ● |
interruptions in service and any related impact on our reputation; |
| ● |
the impact of fluctuations in currency exchange rates; |
| ● | changes in advertiser budgets or the market acceptance of online advertising solutions; |
| ● |
changes in consumer behavior with respect to local businesses; |
| ● |
changes in our tax rates or exposure to additional tax liabilities; |
| ● |
the impact of worldwide economic conditions, including the resulting effect on consumer spending at local businesses and the level of advertising spending by local businesses; and |
| ● |
the effects of natural or man-made catastrophic events. |
We have incurred significant operating losses in the past, and we may not be able to generate sufficient revenue to maintain profitability. Our recent growth rate will likely not be sustainable, and a failure to maintain an adequate growth rate will adversely affect our business and results of operations.
Since our inception, we have incurred significant operating losses and, as of December 31, 2014, we had an accumulated deficit of approximately $34.0 million. Although our revenues have grown rapidly in the last several years, increasing from $12.1 million in 2008 to $377.5 million in 2014, we expect that our revenue growth rate will decline as a result of a variety of factors, including the maturation of our business and the gradual decline in the number of major geographic markets, especially within the United States, to which we have not already expanded. As a result, you should not rely on revenue growth of any prior quarterly or annual period as an indication of our future performance. In addition, historically, our costs have increased each year and we expect our costs to increase in future periods as we continue to expend substantial financial resources on:
| ● |
sales and marketing; |
| ● |
domestic and international expansion efforts; |
| ● |
product and feature development; |
| ● |
our technology infrastructure; |
| ● |
strategic opportunities, including commercial relationships and acquisitions; and |
| ● |
general administration, including legal and accounting expenses related to being a public company. |
These investments may not result in increased revenue or growth in our business. Our costs may also increase as we hire additional employees, particularly as a result of the significant competition that we face to attract and retain technical talent. Our expenses may grow faster than our revenue and may be greater than we anticipate in a particular period or over time. If we are unable to maintain adequate revenue growth and to manage our expenses, we may continue to incur significant losses in the future and may not be able to maintain profitability.
27
Because we recognize most of the revenue from our advertising products over the term of an agreement, a significant downturn in our business may not be immediately reflected in our results of operations.
We recognize revenue from sales of our advertising products over the terms of the applicable agreements, which are generally three, six or 12 months. As a result, a significant portion of the revenue we report in each quarter is generated from agreements entered into during previous quarters. Consequently, a decline in new or renewed agreements in any one quarter may not significantly impact our revenue in that quarter but will negatively affect our revenue in future quarters. In addition, we may be unable to adjust our fixed costs in response to reduced revenue. Accordingly, the effect of significant declines in advertising sales may not be reflected in our short-term results of operations.
If our goodwill or intangible assets become impaired, we may be required to record a significant charge to earnings.
We have recorded a significant amount of goodwill related to our acquisitions to date, and a significant portion of the purchase price of any companies we acquire in the future may be allocated to acquired goodwill and other intangible assets. Under GAAP, we review our intangible assets for impairment when events or changes in circumstances indicate the carrying value of our goodwill and other intangible assets may not be recoverable. Goodwill is required to be tested for impairment at least annually. Factors that may be considered include declines in our stock price, market capitalization and future cash flow projections. If our acquisitions do not yield expected returns, our stock price declines or any other adverse change in market conditions occurs, a change to the estimation of fair value could result. Any such change could result in an impairment charge to our goodwill and intangible assets, particularly if such change impacts on of our critical assumptions or estimates, and may have a negative impact on our financial position and operating results.
We may require additional capital to support business growth, and such capital might not be available on acceptable terms, if at all.
We intend to continue to invest in our business and may require or otherwise seek additional funds to respond to business challenges, including the need to develop new features and products, enhance our existing services, improve our operating infrastructure and acquire complementary businesses and technologies. As a result, we may need to engage in equity or debt financings to secure additional funds. If we raise additional funds through future issuances of equity or convertible debt securities, our existing stockholders could suffer significant dilution, and any new equity securities we issue could have rights, preferences and privileges superior to those of our Class A common stock. Any future debt financing we secure could involve restrictive covenants relating to our capital raising activities and other financial and operational matters, which may make it more difficult for us to obtain additional capital and to pursue business opportunities, including potential acquisitions. We may not be able to obtain additional financing on terms favorable to us, if at all. If we are unable to obtain adequate financing or financing on terms satisfactory to us when we require it, our ability to continue to support our business growth and respond to business challenges could be significantly impaired, and our business may be harmed.
Our corporate structure and intercompany arrangements, including the manner in which we develop and use our intellectual property and the transfer pricing of intercompany transactions, are intended to reduce our worldwide effective tax rate. For example, our corporate structure includes legal entities located in jurisdictions with income tax rates lower than the U.S. statutory tax rate. Our intercompany arrangements allocate income to such entities in accordance with arm’s-length principles and commensurate with functions performed, risks assumed and ownership of valuable corporate assets. We believe that income taxed in certain foreign jurisdictions at a lower rate relative to the U.S. statutory rate will have a beneficial impact on our worldwide effective tax rate.
28
However, significant judgment is required in evaluating our tax positions and determining our provision for income taxes. During the ordinary course of business, there are many transactions and calculations for which the ultimate tax determination is uncertain. For example, our effective tax rates could be adversely affected by earnings being lower than anticipated in countries where we have lower statutory rates and higher than anticipated in countries where we have higher statutory rates, by changes in foreign currency exchange rates or by changes in the relevant tax, accounting and other laws, regulations, principles and interpretations.
In addition, the application of the tax laws of various jurisdictions, including the United States, to our international business activities is subject to interpretation and depends on our ability to operate our business in a manner consistent with our corporate structure and intercompany arrangements. The taxing authorities of jurisdictions in which we operate may challenge our methodologies for valuing developed technology or intercompany arrangements, including our transfer pricing, or determine that the manner in which we operate our business does not achieve the intended tax consequences, which could increase our worldwide effective tax rate and harm our financial position and results of operations. As we operate in numerous taxing jurisdictions, the application of tax laws can also be subject to diverging and sometimes conflicting interpretations by tax authorities of these jurisdictions. It is not uncommon for taxing authorities in different countries to have conflicting views, for instance, with respect to, among other things, the manner in which the arm’s length standard is applied for transfer pricing purposes, or with respect to the valuation of intellectual property.
Changes in tax laws or tax rulings could materially affect our financial position and results of operations.
Tax laws are dynamic and subject to change as new laws are passed and new interpretations of the law are issued or applied. Our existing corporate structure and intercompany arrangements have been implemented in a manner we believe is in compliance with current prevailing tax laws. However, the tax benefits that we intend to eventually derive could be undermined due to changing tax laws. In particular, the current U.S. administration and key members of Congress have made public statements indicating that tax reform is a priority, resulting in uncertainty not only with respect to the future corporate tax rate, but also the U.S. tax consequences of income derived from income related to intellectual property earned overseas in low tax jurisdictions. Certain changes to U.S. tax laws, including limitations on the ability to defer U.S. taxation on earnings outside of the United States until those earnings are repatriated to the United States, as well as changes to U.S. tax laws that may be enacted in the future, could affect the tax treatment of our foreign earnings. In addition, many countries in the European Union, as well as a number of other countries and organizations such as the Organization for Economic Cooperation and Development, are actively considering changes to existing tax laws that, if enacted, could increase our tax obligations in many countries where we do business. Due to the expanding scale of our international business activities, any changes in the taxation of such activities may increase our worldwide effective tax rate and harm our financial position and results of operations.
We rely on data from third parties to calculate certain of our key metrics. Real or perceived inaccuracies in such metrics may harm our reputation and negatively affect our business.
Certain of our key metrics — the number of our unique visitors and mobile unique visitors — are calculated relying on data from third parties. While these numbers are based on what we believe to be reasonable calculations for the applicable periods of measurement, there are inherent challenges in measuring usage across our large user base around the world. For example, because these metrics are based on users with unique cookies, an individual who accesses our website from multiple devices with different cookies may be counted as multiple unique visitors, and multiple individuals who access our website from a shared device with a single cookie may be counted as a single unique visitor. As a result, the calculations of our unique visitors and mobile unique visitors may not accurately reflect the number of people actually using our platform. In addition, our measures of traffic and other key metrics may differ from estimates published by third parties (other than those whose data we use to calculate our key metrics) or from similar metrics of our competitors. We are continually seeking to improve our ability to measure these key metrics, and regularly review our processes to assess potential improvements to their accuracy. If our users, advertisers, partners and stockholders do not perceive our metrics to be accurate representations, or if we discover material inaccuracies in our metrics, our reputation may be harmed.
29
Risks Related to Regulatory Compliance and Legal Matters
We are, and may be in the future, subject to disputes and assertions by third parties that we violate their rights. These disputes may be costly to defend and could harm our business and operating results.
We currently face, and we expect to face from time to time in the future, allegations that we have violated the rights of third parties, including patent, trademark, copyright and other intellectual property rights, and the rights of current and former employees, users and business owners. For example, various businesses have sued us alleging that we manipulate Yelp reviews in order to coerce them and other businesses to pay for Yelp advertising. The nature of our business also exposes us to claims relating to the information that we publish on our platform, including claims for defamation, libel, negligence and copyright or trademark infringement, among others. Businesses have in the past claimed, and may in the future claim, that we are responsible for the defamatory reviews posted by our users. We expect claims like these to continue, and potentially increase in proportion to the amount of content on our platform. In some instances, we may elect or be compelled to remove the content that is the subject of such claims, or may be forced to pay substantial damages if we are unsuccessful in our efforts to defend against these claims. If we elect or are compelled to remove content from our platform, our products and services may become less useful to consumers and our traffic may decline, which would have a negative impact on our business.
We are also regularly exposed to claims based on allegations of infringement or other violations of intellectual property rights. Companies in the Internet, technology and media industries own large numbers of patent and other intellectual property rights, and frequently enter into litigation. Various “non-practicing entities” that own patents and other intellectual property rights also often aggressively attempt to assert their rights in order to extract value from technology companies. From time to time, we receive notice letters from patent holders alleging that certain of our products and services infringe their patent rights, and we are presently involved in numerous patent lawsuits. Each of our ongoing patent lawsuits involves plaintiffs targeting multiple defendants in the same or similar suits. We do not own any patents, and may be unable to deter competitors or others from pursuing intellectual property infringement claims against us.
We expect other claims to be made against us in the future, and as we face increasing competition and gain an increasingly high profile, we expect the number of claims against us to accelerate. The results of litigation and claims to which we may be subject cannot be predicted with any certainty. Even if the claims are without merit, the costs associated with defending against them may be substantial in terms of time, money and management distraction. In particular, patent and other intellectual property litigation may be protracted and expensive, and the results may require us to stop offering certain features, purchase licenses or modify our products and features while we develop non-infringing substitutes, or otherwise involve significant settlement costs. The development of alternative non-infringing technology or practices could require significant effort and expense or may not be feasible. Even if claims do not result in litigation or are resolved in our favor without significant cash settlements, such matters, and the time and resources necessary to resolve them, could harm our business, results of operations and reputation.
30
Our business is subject to complex and evolving U.S. and foreign regulations and other legal obligations related to privacy, data protection and other matters. Our actual or perceived failure to comply with such regulations and obligations could harm our business.
We are subject to a variety of laws in the United States and abroad that involve matters central to our business, including laws regarding privacy, data retention, distribution of user-generated content and consumer protection, among others. For example, because we receive, store and process personal information and other user data, including credit card information, we are subject to numerous federal, state and local laws around the world regarding privacy and the storing, sharing, use, processing, disclosure and protection of personal information and other user data. We are also subject to a variety of laws, regulations and guidelines that regulate the way we distinguish paid search results and other types of advertising from unpaid search results.
The application and interpretation of these laws and regulations are often uncertain, particularly in the new and rapidly evolving industry in which we operate. For example, we rely on laws limiting the liability of providers of online services for activities of their users and other third parties. These laws are currently being tested by a number of claims, including actions based on invasion of privacy and other torts, unfair competition, copyright and trademark infringement and other theories based on the nature and content of the materials searched, the ads posted or the content provided by users. It is difficult to predict how existing laws will be applied to our business, and if our business grows and evolves and our solutions are used in a greater number of countries, we will also become subject to laws and regulations in additional jurisdictions, which may be inconsistent with the laws of the jurisdictions to which we are currently subject. For example, the risk related to liability for third-party actions may be greater in certain jurisdictions outside the United States where our protection from such liability may be unclear.
It is also possible that the interpretation and application of various laws and regulations may conflict with other rules or our practices, such as industry standards to which we adhere, our privacy policies and our privacy-related obligations to third parties (including, in certain instances, voluntary third-party certification bodies such as TRUSTe). Similarly, our business could be adversely affected if new legislation or regulations are adopted that require us to change our current practices or the design of our platform, products or features. For example, regulatory frameworks for privacy issues are currently in flux worldwide, and are likely to remain so for the foreseeable future due to increased public scrutiny of the practices of companies offering online services with respect to personal information of their users. The U.S. government, including the White House, the Federal Trade Commission, the Department of Commerce and many state governments are reviewing the need for greater regulation of the collection, processing, storage and use of information about consumer behavior on the Internet, including regulation aimed at restricting certain targeted advertising practices. The European Commission is also in the process of promulgating a new general data protection regulation, which may result in significantly greater compliance burdens for companies such as us with users and operations in Europe. Changes like these could increase our administrative costs and make it more difficult for consumers to use our platform, resulting in less traffic and revenue. Such changes could also make it more difficult for us to provide effective advertising tools to businesses on our platform, resulting in fewer advertisers and less revenue.
We believe that our policies and practices comply with applicable laws and regulations. However, if our belief proves incorrect, if these guidelines, laws or regulations or their interpretations change or new legislation or regulations are enacted, or if the third parties with whom we share user information fail to comply with such guidelines, laws, regulations or their contractual obligations to us, we may be forced to implement new measures to reduce our legal exposure. This may require us to expend substantial resources, delay development of new products or discontinue certain products or features, which would negatively impact our business. For example, if we fail to comply with our privacy-related obligations to users or third parties, or any compromise of security that results in the unauthorized release or transfer of personally identifiable information or other user data, we may be compelled to provide additional disclosures to our users, obtain additional consents from our users before collecting or using their information or implement new safeguards to help our users manage our use of their information, among other changes. We may also face litigation, governmental enforcement actions or negative publicity, which could cause our users and advertisers to lose trust in us and have an adverse effect on our business. For example, from time to time we receive inquiries from government agencies regarding our business practices. Although the internal resources expended and expenses incurred in connection with such inquiries and their resolutions have not been material to date, any resulting negative publicity could adversely affect our reputation and brand. Responding to and resolving any future litigation, investigations, settlements or other regulatory actions may require significant time and resources, and could diminish confidence in and the use of our products.
31
Domestic and foreign laws may be interpreted and enforced in ways that impose new obligations on us with respect to Yelp Deals, which may harm our business and results of operations.
Our Yelp Deals products may be deemed gift certificates, store gift cards, general-use prepaid cards or other vouchers, or “gift cards,” subject to, among other laws, the federal Credit Card Accountability Responsibility and Disclosure Act of 2009 (the “Credit CARD Act”) and similar state and foreign laws. Many of these laws include specific disclosure requirements and prohibitions or limitations on the use of expiration dates and the imposition of certain fees. Various companies that provide deal products similar to ours have been subject to allegations that their deal products are subject to and violate the Credit CARD Act and various state laws governing gift cards. Lawsuits have also been filed in other locations in which we sell or plan to sell our Yelp Deals, such as the Canadian province of Ontario, alleging similar violations of provincial legislation governing gift cards.
The application of various other laws and regulations to our products, and particularly our Yelp Deals and Gift Certificates, is uncertain. These include laws and regulations pertaining to unclaimed and abandoned property, partial redemption, refunds, revenue-sharing restrictions on certain trade groups and professions, sales and other local taxes and the sale of alcoholic beverages. In addition, we may become, or be determined to be, subject to federal, state or foreign laws regulating money transmitters or aimed at preventing money laundering or terrorist financing, including the Bank Secrecy Act, the USA PATRIOT Act and other similar future laws or regulations.
If we become subject to claims or are required to alter our business practices as a result of current or future laws and regulations, our revenue could decrease, our costs could increase and our business could otherwise be harmed. In addition, the costs and expenses associated with defending any actions related to such additional laws and regulations and any payments of related penalties, fines, judgments or settlements could harm our business.
The requirements of being a public company may strain our resources, divert management’s attention and affect our ability to attract and retain qualified board members.
As a public company, we are subject to the reporting requirements of the Exchange Act, the Sarbanes-Oxley Act, the Dodd-Frank Act, the listing requirements of the New York Stock Exchange and other applicable securities rules and regulations. Compliance with these rules and regulations has increased, and will likely continue to increase, our legal and financial compliance costs, make some activities more difficult, time-consuming or costly, and place significant strain on our personnel, systems and resources. In addition, changing laws, regulations and standards relating to corporate governance and public disclosure are creating uncertainty for public companies, increasing legal and financial compliance costs and making some activities more time consuming. These laws, regulations and standards are subject to varying interpretations, in many cases due to their lack of specificity, and, as a result, their application in practice may evolve over time. This could result in continuing uncertainty regarding compliance matters, higher administrative expenses and a diversion of management’s time and attention. Further, if our compliance efforts differ from the activities intended by regulatory or governing bodies due to ambiguities related to practice, regulatory authorities may initiate legal proceedings against us and our business may be harmed. Being a public company that is subject to these rules and regulations also makes it more expensive for us to obtain and retain director and officer liability insurance, and we may in the future be required to accept reduced coverage or incur substantially higher costs to obtain or retain adequate coverage. These factors could also make it more difficult for us to attract and retain qualified members of our board of directors and qualified executive officers.
32
Risks Related to Ownership of Our Class A Common Stock
The dual class structure of our common stock has the effect of concentrating voting control with those stockholders who held our stock prior to our initial public offering, including our founders, directors, executive officers and employees and their affiliates, and limiting our other stockholders’ ability to influence corporate matters.
Our Class B common stock has 10 votes per share and our Class A common stock has one vote per share. As a result, the holders of our Class B common stock collectively will continue to control a majority of the combined voting power of our common stock even when the shares of Class B common stock represent a small minority of all outstanding shares of our capital stock. The current holders of our Class B common stock collectively are able to control all matters submitted to our stockholders for approval even though their stock holdings represent less than 50% of the outstanding shares of our common stock. As of December 31, 2014, stockholders who held shares of Class B common stock, including our founders, directors, executive officers, employees and their affiliates, together beneficially owned shares representing approximately 61% of the voting power of our outstanding capital stock. Future transfers by holders of Class B common stock will generally result in those shares converting to Class A common stock, which will have the effect, over time, of increasing the relative voting power of those holders of Class B common stock who retain their shares, which may include existing founders, officers, directors and their affiliates. This concentrated control will limit our other stockholders’ ability to influence corporate matters for the foreseeable future and, as a result, the market price of our Class A common stock could be adversely affected.
Our share price has been and will likely continue to be volatile.
The trading price of our Class A common stock has been, and is likely to continue to be, highly volatile and could be subject to wide fluctuations in response to various factors, some of which are beyond our control. During 2014, our Class A common stock’s daily closing price ranged from $50.04 to $98.04. In addition the factors discussed in this “Risk Factors” section and elsewhere in this Annual Report, factors that may cause volatility in our share price include:
| ● |
actual or anticipated fluctuations in our financial condition and operating results; |
| ● |
changes in projected operating and financial results; |
| ● |
actual or anticipated changes in our growth rate relative to our competitors; |
| ● |
announcements of technological innovations or new offerings by us or our competitors; |
| ● |
announcements by us or our competitors of significant acquisitions, strategic partnerships, joint ventures or capital-raising activities or commitments; |
| ● |
additions or departures of key personnel; |
| ● |
actions of securities analysts who cover our company, such as publishing research or forecasts about our business (and our performance against such forecasts), changing in the rating of our Class A common stock or ceasing coverage of our company; |
| ● |
investor sentiment with respect to our competitors, business partners and industry in general; |
| ● |
reporting on our business by the financial media, including television, radio and press reports and blogs; |
| ● |
fluctuations in the value of companies perceived by investors to be comparable to us; |
| ● |
changes in the way we measure our key metrics; |
| ● |
sales of our Class A or Class B common stock; |
| ● |
changes in laws or regulations applicable to our solutions; |
| ● |
share price and volume fluctuations attributable to inconsistent trading volume levels of our shares; and |
| ● |
general economic and market conditions such as recessions, interest rate changes or international currency fluctuations. |
33
Furthermore, the stock markets have recently experienced extreme price and volume fluctuations that have affected and continue to affect the market prices of equity securities of many companies. These fluctuations often have been unrelated or disproportionate to the operating performance of those companies. In the past, companies that have experienced volatility in the market price of their stock have been subject to securities class action litigation. For example, in August 2014, we and certain of our officers were sued in two similar putative class action lawsuits alleging violations of the federal securities laws for allegedly making materially false and misleading statements. We may be the target of additional litigation of this type in the future as well. Securities litigation against us could result in substantial costs and divert our management’s time and attention from other business concerns, which could harm our business.
We do not intend to pay dividends for the foreseeable future, and as a result, our stockholders’ ability to achieve a return on their investment will depend on appreciation in the price of our Class A common stock.
We have never declared or paid any cash dividends on our common stock and do not intend to pay any cash dividends in the foreseeable future. We anticipate that we will retain all of our future earnings for use in the development of our business and for general corporate purposes. Any determination to pay dividends in the future will be at the discretion of our board of directors. Accordingly, investors must rely on sales of their Class A common stock after price appreciation, which may never occur, as the only way to realize future gains on their investments.
Anti-takeover provisions in our charter documents and under Delaware law could make an acquisition of us more difficult, limit attempts by our stockholders to replace or remove our current management and limit the market price of our Class A common stock.
Provisions in our certificate of incorporation and bylaws may have the effect of delaying or preventing a change in control or changes in our management. Our amended and restated certificate of incorporation and amended and restated bylaws include provisions that:
| ● |
authorize our board of directors to issue, without further action by the stockholders, up to 10,000,000 shares of undesignated preferred stock; |
| ● |
require that any action to be taken by our stockholders be effected at a duly called annual or special meeting and not by written consent; |
| ● |
specify that special meetings of our stockholders can be called only by our board of directors, the Chair of our board of directors or our Chief Executive Officer; |
| ● |
establish an advance notice procedure for stockholder proposals to be brought before an annual meeting, including proposed nominations of persons for election to our board of directors; |
| ● |
establish that our board of directors is divided into three classes, with directors in each class serving three-year staggered terms; |
| ● |
prohibit cumulative voting in the election of directors; |
| ● |
provide that vacancies on our board of directors may be filled only by a majority of directors then in office, even though less than a quorum; |
| ● |
require the approval of our board of directors or the holders of a supermajority of our outstanding shares of capital stock to amend our bylaws and certain provisions of our certificate of incorporation; and |
| ● |
reflect two classes of common stock, as discussed above. |
34
These provisions may frustrate or prevent any attempts by our stockholders to replace or remove our current management by making it more difficult for stockholders to replace members of our board of directors, which is responsible for appointment the members of our management. In addition, because we are incorporated in Delaware, we are governed by the provisions of Section 203 of the Delaware General Corporation Law, which generally prohibits a Delaware corporation from engaging in any of a broad range of business combinations with any “interested” stockholder for a period of three years following the date on which the stockholder became an “interested” stockholder.
Future sales of our Class A common stock in the public market could cause our share price to decline.
Sales of a substantial number of shares of our Class A common stock in the public market, particularly sales by our directors, officers, employees and significant stockholders, or the perception that these sales might occur, could depress the market price of our Class A common stock and could impair our ability to raise capital through the sale of additional equity securities. As of December 31, 2014, we had 63,062,071 shares of Class A common stock and 9,858,511 shares of Class B common stock outstanding. Although a public market exists for our Class A common stock only, shares of our Class B common stock are generally convertible into an equivalent number of shares of Class A common stock at the option of the holder or upon transfer (subject to certain exceptions).
Item 1B. Unresolved Staff Comments.
None.
Our principal executive offices in North America are currently located at 140 New Montgomery Street, San Francisco, California, where we lease office space pursuant to a lease agreement that expires in 2021. We lease additional office space in Palo Alto, California; San Francisco, California; Scottsdale, Arizona; Chicago, Illinois; and New York, New York; and currently our international offices are located in Dublin, Ireland; London, England; and Hamburg, Germany. We believe that our properties are generally suitable to meet our needs for the foreseeable future. In addition, to the extent we require additional space in the future, we believe that it would be readily available on commercially reasonable terms.
In February and March 2010, we were sued in two putative class actions on behalf of local businesses asserting various causes of action based on claims that we manipulated the ratings and reviews on our platform to coerce local businesses to buy our advertising products. These cases were subsequently consolidated in an action asserting claims for violation of the California Business and Professions Code, extortion and attempted extortion based on the conduct they allege and seeking monetary relief in an unspecified amount and injunctive relief. In October 2011, the court dismissed this consolidated action with prejudice. The plaintiffs appealed to the U.S. Court of Appeals for the Ninth Circuit, which affirmed the dismissal of the consolidated action. The plaintiffs submitted a petition to the Ninth Circuit for a rehearing, which was denied on October 28, 2014.
In August 2014, two putative class action lawsuits alleging violations of federal securities laws were filed in the U.S. District Court for the Northern District of California, naming as defendants us and certain of our officers. The lawsuits allege violations of the Exchange Act by us and our officers for allegedly making materially false and misleading statements regarding our business and operations between October 29, 2013 and April 3, 2014. These cases were subsequently consolidated and, in January 2015, plaintiffs filed a consolidated complaint seeking unspecified monetary damages and other relief. On February 6, 2015, we and the other named defendants filed a motion to dismiss the consolidated complaint, and the court is currently scheduled to have a hearing on the motion on April 16, 2015.
In addition, we are subject to legal proceedings arising in the ordinary course of business. Although the results of litigation and claims cannot be predicted with certainty, we currently do not believe that the final outcome of any of these matters will have a material adverse effect on our business, financial position, results of operations or cash flows.
Item 4. Mine Safety Disclosures.
Not applicable.
35
PART II
Item 5. Market for Registrant’s Common Equity, Related Stockholder Matters and Issuer Purchases of Equity Securities.
Market Information
Our Class A common stock, par value $0.000001 per share, has been listed on the New York Stock Exchange LLC, or NYSE, under the symbol “YELP” since March 2, 2012. Prior to that date, there was no public trading market for our Class A common stock. There is no public trading market for our Class B common stock. The following table sets forth on a per share basis the high and low intraday sales prices of our Class A common stock, as reported by the NYSE for the periods indicated:
| 2014 | 2013 | |||||||||||
| High | Low | High | Low | |||||||||
| First Quarter | $ | 101.75 | $ | 66.47 | $ | 25.46 | $ | 19.13 | ||||
| Second Quarter | $ | 81.40 | $ | 49.11 | $ | 36.14 | $ | 22.48 | ||||
| Third Quarter | $ | 86.88 | $ | 64.70 | $ | 71.50 | $ | 33.93 | ||||
| Fourth Quarter | $ | 73.41 | $ | 49.17 | $ | 75.37 | $ | 56.65 | ||||
On February 20, 2015, the last reported sale price of our Class A common stock was $47.79.
Stockholders
As of the close of business on February 20, 2015, there were 53 stockholders of record of our Class A common stock and 23 stockholders of record of our Class B common stock. The actual number of holders of our common stock is greater than this number of record holders, and includes stockholders who are beneficial owners, but whose shares are held in street name by brokers and other nominees. This number of holders of record also does not include stockholders whose shares may be held in trust by other entities.
Dividend Policy
We have never declared or paid, and do not anticipate declaring or paying, any cash dividends on our capital stock. Any future determination as to the declaration and payment of dividends, if any, will be at the discretion of our board of directors and will depend on then-existing conditions, including our financial condition, operating results, contractual restrictions, capital requirements, business prospects and other factors that our board of directors may deem relevant.
Performance Graph
We have presented below the cumulative total return to our stockholders during the period from March 2, 2012 (the date our Class A common stock commenced trading on the NYSE) through December 31, 2014 in comparison to the NYSE Composite Index and NYSE Arca Tech 100 Index. All values assume a $100 initial investment and data for the NYSE Composite Index and NYSE Arca Tech 100 Index assume reinvestment of dividends. The comparisons are based on historical data and are not indicative of, nor intended to forecast, the future performance of our Class A common stock.
36
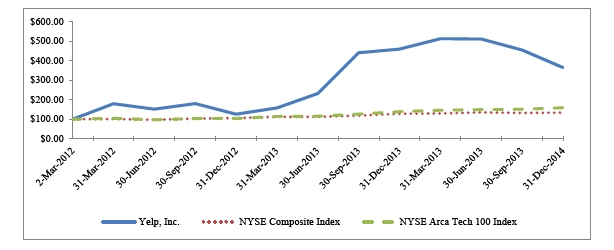
| Index | 3/2/12 | 3/31/12 | 6/30/12 | 9/30/12 | 12/31/12 | 3/31/13 | 6/30/13 | 9/30/13 | 12/31/13 | 3/31/14 | 6/30/14 | 9/30/14 | 12/31/14 | |||||||||||||
| Yelp Inc. | 100 | 179.27 | 151.53 | 180.33 | 125.67 | 158.07 | 231.80 | 441.20 | 459.67 | 512.87 | 511.20 | 455.00 | 364.87 | |||||||||||||
| NYSE | ||||||||||||||||||||||||||
| Composite | 100 | 101.18 | 96.52 | 102.91 | 105.63 | 112.28 | 112.35 | 118.62 | 128.22 | 129.79 | 135.36 | 131.95 | 133.63 | |||||||||||||
| Index | ||||||||||||||||||||||||||
| NYSE | ||||||||||||||||||||||||||
| Arca Tech | 100 | 104.53 | 97.23 | 103.22 | 103.53 | 114.19 | 115.53 | 125.95 | 138.98 | 145.78 | 149.17 | 151.22 | 158.73 | |||||||||||||
| 100 Index |
Use of Proceeds from Public Offering of Common Stock
On March 2, 2012, we closed our initial public offering, in which we sold 8,172,500 shares of Class A common stock at a price to the public of $15.00 per share. The aggregate offering price for shares sold in the offering was approximately $122.6 million. The offer and sale of all of the shares in the initial public offering were registered under the Securities Act pursuant to a registration statement on Form S-1 (File No. 333-178030), which was declared effective by the SEC on February 16, 2012. Goldman, Sachs & Co. acted as the lead bookrunning manager and representative of the underwriters for the initial public offering. Citigroup Global Markets Inc. and Jefferies & Company, Inc. acted as joint bookrunning managers and Allen & Company LLC and Oppenheimer & Co. Inc. acted as co-managers for the initial public offering.
Our use of proceeds to date has been as described in our final prospectus, or the Prospectus, filed with the SEC pursuant to Rule 424(b) under the Securities Act on March 2, 2012, and has included the majority of the approximately $116.8 million cash portion of the aggregate purchase price of our acquisitions to date.
Issuer Purchases of Equity Securities
The table below provides information with respect to repurchases of shares of our Class B common stock. No shares of our Class A common stock were repurchased during this period.
37
| Total | Maximum | ||||||||
| Number of | Number of | ||||||||
| Shares | Shares that | ||||||||
| Purchased as | May Yet | ||||||||
| Part of | Be | ||||||||
| Total | Weighted | Publicly | Purchased | ||||||
| Number of | Average | Announced | Under the | ||||||
| Shares | Price Paid | Plans or | Plans or | ||||||
| Period | Purchased | per Share | Programs | Programs | |||||
| October 1 – October 31, 2014 | — | — | — | — | |||||
| November 1 – November 30, 2014(1) | 4,892 | $ | 57.88 | — | — | ||||
| December 1 – December 31, 2014 | — | — | — | — | |||||
| Total | 4,892 | $ | 57.88 | — | — | ||||
| (1) | Represents shares withheld to satisfy tax withholding obligations in connection with the vesting of employee restricted stock awards under our 2012 Equity Incentive Plan, as amended. |
38
Item 6. Selected Consolidated Financial and Other Data.
The following selected consolidated financial and other data should be read in conjunction with, and are qualified by reference to, “Management’s Discussion and Analysis of Financial Condition and Results of Operations,” and our audited consolidated financial statements and the accompanying notes included elsewhere in this Annual Report. The consolidated statements of operations data for the years ended December 31, 2014, 2013 and 2012 and the consolidated balance sheet data as of December 31, 2014 and 2013 are derived from the audited consolidated financial statements that are included elsewhere in this Annual Report. We have included, in our opinion, all adjustments, consisting only of normal recurring adjustments, that we consider necessary for a fair presentation of the financial information set forth in those statements. The consolidated statements of operations data for the years ended December 31, 2011 and 2010, as well as the consolidated balance sheet data as of December 31, 2012, 2011 and 2010, are derived from audited consolidated financial statements that are not included in this Annual Report. Our historical results are not necessarily indicative of the results to be expected in any period in the future.
| Consolidated Statements of Operations Data: | Year Ended December 31, | ||||||||||||||||||
| 2014 | 2013 | 2012 | 2011 | 2010 | |||||||||||||||
| (in thousands, except per share amounts) | |||||||||||||||||||
| Net revenue | $ | 377,536 | $ | 232,988 | $ | 137,567 | $ | 83,285 | $ | 47,731 | |||||||||
| Costs and expenses: | |||||||||||||||||||
| Cost of revenue (exclusive of depreciation and amortization | |||||||||||||||||||
| shown separately below)(1) | 24,382 | 16,561 | 9,928 | 5,931 | 3,137 | ||||||||||||||
| Sales and marketing(1) | 201,050 | 131,970 | 85,915 | 54,539 | 33,919 | ||||||||||||||
| Product development(1) | 65,181 | 38,243 | 20,473 | 11,586 | 6,560 | ||||||||||||||
| General and administrative(1) | 58,274 | 42,907 | 31,531 | 17,234 | 11,287 | ||||||||||||||
| Depreciation and amortization(1) | 17,590 | 11,455 | 7,223 | 4,238 | 2,334 | ||||||||||||||
| Restructuring and integration(1) | — | 675 | 1,262 | — | — | ||||||||||||||
| Contribution to The Yelp Foundation | — | — | — | 5,928 | — | ||||||||||||||
| Total costs and expenses | 366,477 | 241,811 | 156,332 | 99,456 | 57,237 | ||||||||||||||
| Income (loss) from operations | 11,059 | (8,823 | ) | (18,765 | ) | (16,171 | ) | (9,506 | ) | ||||||||||
| Other income (expense), net | 221 | (407 | ) | (226 | ) | (395 | ) | 15 | |||||||||||
| Income (loss) before income taxes | 11,280 | (9,230 | ) | (18,991 | ) | (16,566 | ) | (9,491 | ) | ||||||||||
| Benefit (provision) for income taxes | 25,193 | (838 | ) | (122 | ) | (102 | ) | (75 | ) | ||||||||||
| Net income (loss) | 36,473 | (10,068 | ) | (19,113 | ) | (16,668 | ) | (9,566 | ) | ||||||||||
| Accretion of redeemable convertible preferred stock | — | — | (32 | ) | (189 | ) | (175 | ) | |||||||||||
| Net income (loss) attributable to common stockholders (Class A | |||||||||||||||||||
| and B) | $ | 36,473 | $ | (10,068 | ) | $ | (19,145 | ) | $ | (16,857 | ) | $ | (9,741 | ) | |||||
| Net income (loss) per share attributable to common stockholders | |||||||||||||||||||
| (Class A and B): | |||||||||||||||||||
| Basic | $ | 0.51 | $ | (0.15 | ) | $ | (0.35 | ) | $ | (1.10 | ) | $ | (0.71 | ) | |||||
| Diluted | $ | 0.48 | $ | (0.15 | ) | $ | (0.35 | ) | $ | (1.10 | ) | $ | (0.71 | ) | |||||
| Weighted-average shares used to compute net income (loss) per | |||||||||||||||||||
| share attributable to common stockholders (Class A and B): | |||||||||||||||||||
| Basic | 71,936 | 65,665 | 54,149 | 15,291 | 13,774 | ||||||||||||||
| Diluted | 76,712 | 65,665 | 54,149 | 15,291 | 13,774 | ||||||||||||||
(1) Stock-based compensation included in the statements of operations data above was as follows:
| Year Ended December 31, | |||||||||||||||||
| 2014 | 2013 | 2012 | 2011 | 2010 | |||||||||||||
| (in thousands) | |||||||||||||||||
| Cost of revenue | $ | 729 | $ | 421 | $ | 122 | $ | 50 | $ | 26 | |||||||
| Sales and marketing | 15,083 | 10,131 | 4,917 | 1,607 | 662 | ||||||||||||
| Product development | 14,804 | 6,270 | 1,705 | 721 | 260 | ||||||||||||
| General and administrative | 11,657 | 9,300 | 8,134 | 2,499 | 483 | ||||||||||||
| Restructuring and integration | — | 555 | — | — | — | ||||||||||||
| Total stock-based compensation | $ | 42,273 | $ | 26,677 | $ | 14,878 | $ | 4,877 | $ | 1,431 | |||||||
| Consolidated Balance Sheet Data: | As of December 31, | ||||||||||||||||
| 2014 | 2013 | 2012 | 2011 | 2010 | |||||||||||||
| (in thousands) | |||||||||||||||||
| Cash and cash equivalents | $ | 247,312 | $ | 389,764 | $ | 95,124 | $ | 21,736 | $ | 27,074 | |||||||
| Property, equipment and software, net | 62,761 | 30,666 | 14,799 | 9,881 | 5,256 | ||||||||||||
| Working capital | 386,785 | 391,844 | 91,218 | 18,996 | 28,741 | ||||||||||||
| Total assets | 629,650 | 515,977 | 187,696 | 43,821 | 41,015 | ||||||||||||
| Redeemable convertible preferred stock | — | — | — | 55,435 | 55,246 | ||||||||||||
| Total stockholders’ equity (deficit) | 588,150 | 486,483 | 165,662 | (24,347 | ) | (20,889 | ) | ||||||||||
39
| Other Financial and Operational Data: | Year Ended December 31, | |||||||||||||||||
| 2014 | 2013 | 2012 | 2011 | 2010 | ||||||||||||||
| (in thousands) | ||||||||||||||||||
| Reviews(1) | 71,232 | 52,757 | 35,959 | 24,817 | 15,115 | |||||||||||||
| Unique Visitors(2) | 135,399 | 120,005 | 86,308 | 65,796 | 39,356 | |||||||||||||
| Mobile Unique Visitors(3) | 72,311 | 52,905 | 33,150 | 17,504 | 2,811 | |||||||||||||
| Claimed Local Business Locations(4) | 2,029 | 1,488 | 994 | 606 | 307 | |||||||||||||
| Active Local Business Accounts(5) | 94 | 67 | 40 | 24 | 11 | |||||||||||||
| Local Advertising Accounts(6) | 84 | 54 | 31 | 19 | 11 | |||||||||||||
| Adjusted EBITDA(7) | $ | 70,922 | $ | 29,429 | $ | 4,598 | $ | (1,128 | ) | $ | (5,741 | ) | ||||||
| Non-GAAP Net Income(8) | $ | 52,997 | $ | 18,314 | $ | (3,875 | ) | $ | (11,765 | ) | $ | (8,112 | ) | |||||
| (1) | Represents the cumulative number of reviews submitted to Yelp since inception, as of the period end, including reviews that were not recommended or that had been removed from our platform. We define a review as each individually written assessment submitted by a user who has registered by creating a public profile on our platform. For more information, including information regarding reviews that are not recommended and removed reviews, see “Management’s Discussion and Analysis of Financial Condition and Results of Operations—Key Metrics—Reviews.” |
| (2) | Represents the average number of monthly unique visitors for the last three months of the period. We define monthly unique visitors as the total number of unique visitors who have visited our website at least once in a given month, and we average the number of monthly unique visitors in each month of the three-month period to calculate average monthly unique visitors. For more information, see “Management’s Discussion and Analysis of Financial Condition and Results of Operations—Key Metrics—Unique Visitors.” |
| (3) | Represents the average number of mobile unique visitors for the last three months of the period. We define mobile unique visitors as the sum of (i) the average monthly unique visitors who have visited our mobile website during that period (measured as described above) and (ii) unique mobile devices using our mobile app on a monthly average basis over that period. For more information, see “Management’s Discussion and Analysis of Financial Condition and Results of Operations—Key Metrics—Mobile Unique Visitors.” |
| (4) | Represents the cumulative number of business locations that have been claimed on Yelp worldwide since 2008, as of the period end. We define a claimed local business location as each business address for which a business representative visits our website and claims the free business listing page for the business located at that address. For more information, see “Management’s Discussion and Analysis of Financial Condition and Results of Operations—Key Metrics—Claimed Local Business Locations.” |
| (5) | Represents the number of active local business accounts from which we recognized revenue during the last three months of the period. For more information, see “Management’s Discussion and Analysis of Financial Condition and Results of Operations—Key Metrics—Active Local Business Accounts.” |
| (6) |
Represents the number of local business accounts from which we recognized local advertising revenue during the last three months of the period. We began reporting this metric in the quarter ended December 31, 2014 and intend to provide this metric instead of active local business accounts in future periods. For more information, see “Management’s Discussion and Analysis of Financial Condition and Results of Operations—Key Metrics—Local Advertising Accounts.” |
| (7) | We define adjusted EBITDA as net income (loss), adjusted to exclude: provision (benefit) for income taxes, other income (expense), net, interest income, depreciation and amortization, stock-based compensation expense, restructuring and integration costs and contribution to the Yelp Foundation. See “—Non-GAAP Financial Measures” for more information and for a reconciliation of adjusted EBITDA to net income (loss), the most directly comparable financial measure calculated and presented in accordance with GAAP. |
| (8) | We define non-GAAP net income (loss) as net income (loss), adjusted to exclude: stock-based compensation expense, amortization of intangibles, and the release of valuation allowance. See “—Non-GAAP Financial Measures” for more information and for a reconciliation of non-GAAP net income (loss) to net income (loss), the most directly comparable financial measure calculated and presented in accordance with GAAP. |
Non-GAAP Financial Measures
To provide investors with additional information regarding our financial results, we have disclosed in the table above and elsewhere in this Annual Report adjusted EBITDA and non-GAAP net income (loss), which are non-GAAP financial measures. We have provided a reconciliation below of both adjusted EBITDA and non-GAAP net income (loss) to net income (loss), the most directly comparable GAAP financial measure in each case.
We have included adjusted EBITDA and non-GAAP net income (loss) because they are key measures used by our management and board of directors to understand and evaluate our operating performance and trends, to prepare and approve our annual budget and to develop short- and long-term operational plans. In particular, the exclusion of certain expenses in calculating adjusted EBITDA and non-GAAP net income (loss) can provide a useful measure for period-to-period comparisons of our core business. Accordingly, we believe that adjusted EBITDA and non-GAAP net income (loss) provide useful information to investors and others in understanding and evaluating our operating results in the same manner as our management and board of directors.
40
Adjusted EBITDA and non-GAAP net income (loss) have limitations as analytical tools, and you should not consider them in isolation or as substitutes for analysis of our results as reported under GAAP. Some of these limitations are:
| ● | although depreciation and amortization are non-cash charges, the assets being depreciated and amortized may have to be replaced in the future, and adjusted EBITDA and non-GAAP net income (loss) do not reflect cash capital expenditure requirements for such replacements or for new capital expenditure requirements; |
| ● | adjusted EBITDA does not reflect changes in, or cash requirements for, our working capital needs; |
| ● | adjusted EBITDA and non-GAAP net income (loss) do not consider the potentially dilutive impact of equity-based compensation; |
| ● | adjusted EBITDA does not reflect tax payments that may represent a reduction in cash available to us; |
| ● | adjusted EBITDA does not consider any dilutive impact of our contribution to the Yelp Foundation; |
| ● | adjusted EBITDA does not take into account any restructuring or integration costs associated with our acquisition of Qype; and |
| ● | other companies, including companies in our industry, may calculate adjusted EBITDA and non-GAAP net income (loss) differently, which reduces their usefulness as comparative measures. |
Because of these limitations, you should consider adjusted EBITDA and non-GAAP net income (loss) alongside other financial performance measures, including various cash flow metrics, net income (loss) and our other GAAP results. The tables below present reconciliations of adjusted EBITDA and non-GAAP net income (loss) to net income (loss) for each of the periods indicated:
Adjusted EBITDA
| Year Ended December 31, | ||||||||||||||||||||
| 2014 | 2013 | 2012 | 2011 | 2010 | ||||||||||||||||
| (in thousands) | ||||||||||||||||||||
| Reconciliation of Adjusted EBITDA: | ||||||||||||||||||||
| Net income (loss) | $ | 36,473 | $ | (10,068 | ) | $ | (19,113 | ) | $ | (16,668 | ) | $ | (9,566 | ) | ||||||
| (Benefit) provision for income taxes | (25,193 | ) | 838 | 122 | 102 | 75 | ||||||||||||||
| Other (income) expense, net | (221 | ) | 407 | 226 | 395 | (15 | ) | |||||||||||||
| Depreciation and amortization | 17,590 | 11,455 | 7,223 | 4,238 | 2,334 | |||||||||||||||
| Stock-based compensation | 42,273 | 26,122 | 14,878 | 4,877 | 1,431 | |||||||||||||||
| Restructuring and integration (1) | — | 675 | 1,262 | — | — | |||||||||||||||
| Contribution to The Yelp Foundation | — | — | — | 5,928 | — | |||||||||||||||
| Adjusted EBITDA | $ | 70,922 | $ | 29,429 | $ | 4,598 | $ | (1,128 | ) | $ | (5,741 | ) | ||||||||
| (1) | Restructuring and integration includes $0.6 million in stock-based compensation expense for the year ended December 31, 2013. |
Non-GAAP Net Income (Loss)
| Year Ended December 31, | ||||||||||||||||||||
| 2014 | 2013 | 2012 | 2011 | 2010 | ||||||||||||||||
| (in thousands) | ||||||||||||||||||||
| Reconciliation of Non-GAAP Net Income (Loss): | ||||||||||||||||||||
| Net income (loss) | $ | 36,473 | $ | (10,068 | ) | $ | (19,113 | ) | $ | (16,668 | ) | $ | (9,566 | ) | ||||||
| Stock-based compensation | 42,273 | 26,122 | 14,878 | 4,877 | 1,431 | |||||||||||||||
| Amortization of intangible assets | 2,448 | 2,260 | 360 | 26 | 23 | |||||||||||||||
| Valuation allowance release | (28,197 | ) | — | — | — | — | ||||||||||||||
| Non-GAAP net income (loss) | $ | 52,997 | $ | 18,314 | $ | (3,875 | ) | $ | (11,765 | ) | $ | (8,112 | ) | |||||||
41
Item 7. Management’s Discussion and Analysis of Financial Condition and Results of Operations.
The following discussion and analysis of our financial condition and results of operations should be read in conjunction with our consolidated financial statements and related notes appearing elsewhere in this Annual Report. This discussion contains forward-looking statements that reflect our plans, estimates and beliefs, and involve risks and uncertainties. Our actual results and the timing of certain events could differ materially from those anticipated in these forward-looking statements as a result of several factors, including those discussed in the section titled “Risk Factors” included under Part I, Item 1A and elsewhere in this Annual Report. See “Special Note Regarding Forward-Looking Statements” in this Annual Report.
Overview
Yelp connects people with great local businesses by bringing “word of mouth” online and providing a platform for businesses and consumers to engage and transact. Our platform provides value to consumers and businesses alike by connecting consumers with great local businesses at the critical moment when they are deciding where to spend their money. Each day, millions of consumers use our platform to find and interact with local businesses, which in turn use our free and paid services to help them engage with consumers. The Yelp Platform, which allows consumers and businesses to transact directly on Yelp, provides consumers with a continuous experience from discovery to completion of transactions and local businesses with an additional point of consumer engagement.
We derive substantially all of our revenue from the sale of advertising products. In the year ended December 31, 2014, our net revenue was $377.5 million, which represented an increase of 62% from the year ended December 31, 2013, and we generated a net profit of $36.5 million and adjusted EBITDA of $70.9 million. In the year ended December 31, 2013, our net revenue was $233.0 million, which represented an increase of 69% from the year ended December 31, 2012, and we generated a net loss of $10.1 million and adjusted EBITDA of $29.4 million.
Our success is primarily the result of significant investment in our communities, employees, content, brand and technology. We believe that continued investment in our business provides our largest opportunity for future growth and plan to continue to invest for long-term growth in our key strategies:
| ● |
Accelerate Network Effect. We plan to invest in marketing and product development aimed at both attracting more, and increasing the usage and contributions of, consumers as we look to leverage our brand and benefit from accelerating network dynamics in Yelp communities. We believe that expanding our content will also attract new consumers as well as increase the number of visits and searches per user, and so will continue to expand our community engagement efforts and explore new ways to enable contributors to share content. For example, we plan to continue to invest in the development of our mobile platform to take advantage of the growing number of consumers accessing Yelp through their mobile devices. |
| ● |
Enhance Monetization. While our core local advertising business in the United States has a significant and growing base of revenue, we have invested, and will continue to invest, in several initiatives to enhance our monetization opportunities. One such initiative has been, and will continue to be, to aggressively grow our sales force in order to reach more businesses. We will also continue expanding the Yelp Platform, business owner tools and other partnerships to encourage businesses to advertise on our platform. |
We expect to invest approximately $25 million in capital expenditures in 2015 to support the growth of our business. We expect to use the majority of this amount to increase our office space, upgrade our technology and infrastructure to improve the ability of our platform to handle the projected increase in usage, and enable the release of new features and solutions. As a result of this investment philosophy, we expect that our operating expenses will continue to increase for the foreseeable future.
Factors Affecting Our Performance
Traffic and User Engagement. Changes in consumer traffic, as well as the quality and quantity of contributed content, will affect our revenue and financial performance. Traffic to our platform determines the number of ads we are able to show, affects the value of those ads to businesses and influences the content creation that drives further traffic; as a result, our ability to grow our business depends on our ability to increase traffic on our platform. Because we rely on Internet search engines to drive traffic to our platform, a significant portion of our traffic can be affected by a number of factors, many of which are not in our direct control. Changes in a search engine‘s ranking algorithms, methodologies or design layouts may result in links to our website not being prominent enough to drive traffic to our website. For example, in the second quarter of 2014, Google made changes to its algorithms and methodologies that may be contributing to the recent slowing of our traffic growth rate and decline in traffic in the fourth quarter of 2014. We cannot predict the long-term impact of these changes.
42
We also anticipate that our traffic growth will continue to slow over time, and potentially decrease in certain periods, due to the gradual decline in the number of major geographic markets, especially within the United States, to which we have not already expanded. Further expansion in smaller markets may not yield similar results or sustain our growth. As our traffic growth rate slows, our success will become increasingly dependent on our ability to increase levels of user engagement on our platform. This dependence may increase as the portion of our revenue derived from performance-based advertising increases. If user engagement decreases, our advertisers may stop or reduce the amount of advertising on our platform and our results of operations would be harmed. In addition, we also expect the cyclicality and seasonality in our business to become more pronounced as our growth rate slows, including weaker traffic numbers in the fourth quarter of the year.
Increasing Mobile Usage. Although we believe use of our mobile platform is complementary to use of our website on personal computers, we anticipate that growth in traffic to our mobile platform will drive our growth for the foreseeable future and traffic through personal computers may continue to decline. Although we currently deliver advertising on our mobile platform, the mobile advertising market remains a new and evolving market. Given our limited experience in monetizing mobile products and commitment to prioritizing the quality of user experience over short-term monetization, we may not be able to generate meaningful revenue from our mobile products despite the expected growth in mobile usage. If consumers continue to access our mobile platform as substitute for access through personal computers, and if our mobile advertising solutions prove ineffective or insufficiently profitable, this trend could adversely impact our financial performance.
Ability to Attract and Retain Local Businesses. Our revenue growth is driven by our ability to attract and retain local business advertisers that purchase our advertising solutions. Our largest sales and marketing expenses consist of the costs associated with acquiring local business advertisers. We spent a majority of our sales and marketing expense for 2014 on initiatives related to local business advertiser acquisition and expect to continue to expend significant amounts to attract additional local business advertisers. At the same time, our local advertising agreements increasingly provide for performance-based cost-per-click payment terms, which make it more difficult to forecast local advertising revenue accurately. In addition, our advertisers typically do not have long-term obligations to purchase our products, and their decisions to renew depend on the degree of satisfaction with our products as well as a number of factors that are outside of our control, including their ability to continue their operations and spending levels. The small and medium-sized businesses on which we heavily rely often have limited advertising budgets and may be disproportionately affected by economic downturns. As a result, a worsening economic outlook would likely cause businesses to decrease investments in advertising, which would adversely affect our revenue.
Investment in Growth. We have invested aggressively in the growth of our platform and intend to continue to invest to support this growth as we expand our platform, grow our communities and local business base, hire additional employees and further develop our technology. We also plan to invest in product development as we continue to innovate and introduce new advertising and e-commerce products, explore new platforms and distribution channels and develop partner arrangements that provide incremental value to our advertisers and business partners to encourage them to increase their advertising budgets allocated towards our platform. We expect that these investments will increase our operating expenses, and that any increase in revenue resulting from product innovations will likely trail the increase in expenses. For example, although we have not historically spent significantly on marketing programs, we began testing advertising to consumers through various online and offline channels in the second half of 2014 and plan to continue to do so in 2015; further expansion of these programs could significantly increase our marketing expenses.
Community Development. Our long-term growth depends on our ability to successfully develop new and existing Yelp communities. It can take years for our platform to achieve a critical mass of consumers and reviews to drive meaningful traction of our advertising solutions and begin to generate revenue in a particular community. As a result, we may continue to generate losses in new communities for an extended period, and different communities can be expected to grow at different rates and generate varying levels of revenue. As with most businesses, we expect our revenue growth to slow as our business matures over time. Local advertising revenue for the oldest cohort of Yelp communities in the United States, which launched in 2005-2006, grew at 52% in 2014 compared to 2013. This is lower than the growth rate of local advertising revenue for the 2007-2008 cohort, which grew 63% over the same period, and the 2009-2010 cohort, which grew 78% over the same period. We believe this is indicative of continued revenue growth, but slowing revenue growth for more mature communities.
43
Acquisitions. As part of our business strategy, we may determine to expand our product offerings and grow our business through the acquisition of complementary businesses or technologies. For example, in October 2014, we acquired Restaurant Kritik and Cityvox to accelerate our international expansion. In addition, in February 2015, we acquired Eat24Hours.com, Inc., a leading web and app-based food ordering service, to drive daily engagement in our restaurant vertical and provide the opportunity to expand Eat24’s services to all the restaurants listed on our platform. Our acquisitions will affect our future financial results due to factors such as the amortization of acquired intangible assets and may also result in potential charges such as restructuring costs or impairment expense.
Key Metrics
We regularly review a number of metrics, including the following key metrics, to evaluate our business, measure our performance, identify trends in our business, prepare financial projections and make strategic decisions.
Reviews
Number of reviews represents the cumulative number of reviews submitted to Yelp since inception, as of the period end, including reviews that are not recommended or that have been removed from our platform. In addition to the text of the review, each review includes a rating of one to five stars. We include reviews that are not recommended and that have been removed because all of them are either currently accessible on our platform or were accessible at some point in time, providing information that may be useful for users to evaluate businesses and individual reviewers. Because our automated recommendation software continually reassesses which reviews to recommend based on new information, the “recommended” or “not recommended” status of reviews may change over time. Reviews that are not recommended or that have been removed do not factor in to a business’s overall star rating. By clicking on a link on a reviewed business’s page on our website, users can access the reviews that are not recommended for the business, as well as the star rating and other information about reviews that were removed for violation of our terms of service.
As of December 31, 2014, approximately 66.3 million reviews were available on business profile pages, including approximately 16.3 million reviews that were not recommended, after accounting for 4.9 million reviews that had been removed from our platform, either by us for violation of our terms of service or by the users who contributed them. The following table presents the number of cumulative reviews as of the dates presented:
| As of December 31, | ||||||
| 2014 | 2013 | 2012 | ||||
| (in thousands) | ||||||
| Reviews | 71,232 | 52,757 | 35,959 | |||
Unique Visitors
Unique visitors represent the average number of monthly unique visitors over a given three-month period. We define monthly unique visitors as the total number of unique visitors who have visited our website at least once in a given month, and we average the number of monthly unique visitors in each month of a given three-month period to calculate average monthly unique visitors. We calculate unique visitors as the number of “users” measured by Google Analytics, a product from Google Inc. that provides digital marketing intelligence, based on the use of unique cookie identifiers. Unique visitors do not include users who access our platform solely through our mobile app. Because the number of unique visitors is based on users with unique cookies, an individual who accesses our website from multiple devices with different cookies may be counted as multiple unique visitors, and multiple individuals who access our website from a shared device with a single cookie may be counted as a single unique visitor.
44
The following table presents the average monthly number of unique visitors during the periods presented:
| Three months ended December 31, | ||||||
| 2014 | 2013 | 2012 | ||||
| (in thousands) | ||||||
| Unique Visitors | 135,399 | 120,005 | 86,308 | |||
Of the average monthly unique visitors in the quarter ended December 31, 2014, approximately 77.6 million accessed our website through personal computers, compared to 77.7 million and 62.3 million in the quarters ended December 31, 2013 and 2012, respectively. We anticipate that growth in use of our mobile platform will be the driver of our growth for the foreseeable future and that usage through personal computers may continue to decline worldwide.
Mobile Unique Visitors
We define mobile unique visitors for a given three-month period to be the sum of (i) the average monthly unique visitors who have visited our mobile website during that period (measured as described above) and (ii) unique mobile devices using our mobile app on a monthly average basis over that period. Under this method of calculation, an individual who accesses both our mobile website and our mobile app, or accesses either our mobile website or our mobile app from multiple mobile devices, will be counted as multiple mobile unique visitors. Multiple individuals who access either our mobile website or mobile app from a shared device will be counted as a single mobile unique visitor. The following table presents the average monthly number of mobile unique visitors during the periods presented:
| Three months ended December 31, | ||||||
| 2014 | 2013 | 2012 | ||||
| (in thousands) | ||||||
| Mobile Unique Visitors | 72,311 | 52,905 | 33,150 | |||
Claimed Local Business Locations
The number of claimed local business locations represents the cumulative number of business locations that have been claimed on Yelp worldwide since 2008, as of a given date. We define a claimed local business location as each business address for which a business representative visits our website and claims the free business listing page for the business located at that address. The following table presents the number of cumulative claimed local business locations as of the dates presented.
| As of December 31, | ||||||
| 2014 | 2013 | 2012 | ||||
| (in thousands) | ||||||
| Claimed Local Business Locations | 2,029 | 1,488 | 994 | |||
Active Local Business Accounts and Local Advertising Accounts
The number of active local business accounts represents the number of local business accounts from which we recognized revenue in a given three-month period. We treat business accounts that have the same payment and/or user information as a single business account. The following table presents the number of active local business accounts in the three-month periods presented:
| Three months ended December 31, | ||||||
| 2014 | 2013 | 2012 | ||||
| (in thousands) | ||||||
| Active Local Business Accounts | 94 | 67 | 40 | |||
Local advertising accounts comprise all local business accounts from which we recognize revenue in a given three-month period, excluding local business accounts from which we recognize Yelp Deals revenue only. We began reporting this metric in the quarter ended December 31, 2014, and intend to provide this metric instead of active local business accounts in future periods, because we believe it more accurately reflects our core advertising business than active local business accounts. The following table presents the number of local advertising accounts in the three-month periods presented:
| Three months ended December 31, | ||||||
| 2014 | 2013 | 2012 | ||||
| (in thousands) | ||||||
| Local Advertising Accounts | 84 | 54 | 31 | |||
Adjusted EBITDA and Non-GAAP Net Income (Loss)
Adjusted EBITDA is a non-GAAP financial measure that we calculate as net income (loss), adjusted to exclude: provision (benefit) for income taxes; other (income) expense, net; depreciation and amortization; stock-based compensation expense; restructuring and integration costs; and our contribution to The Yelp Foundation in the quarter ended December 31, 2011. Non-GAAP net income (loss) is a non-GAAP financial measure that we calculate as net income (loss), adjusted to exclude: stock-based compensation expense, amortization of intangibles and the release of valuation allowance.
We believe that adjusted EBITDA and non-GAAP net income (loss) provide useful information to investors in understanding and evaluating our operating results in the same manner as our management and our board of directors. This non-GAAP information is not necessarily comparable to non-GAAP information of other companies. Non-GAAP information should not be viewed as a substitute for, or superior to, net income (loss) prepared in accordance with GAAP as a measure of our profitability or liquidity. Users of this financial information should consider the types of events and transactions for which adjustments have been made. For more information about adjusted EBITDA and a reconciliation of adjusted EBITDA to net income (loss), see “Selected Consolidated Financial and Other Data—Non-GAAP Financial Measures.” For more information about non-GAAP net income (loss) and a reconciliation of non-GAAP net income (loss)to net income (loss), see “Selected Consolidated Financial and Other Data—Non-GAAP Financial Measures.”
45
Results of Operations
The following tables set forth our results of operations for the periods presented as a percentage of net revenue for those periods (certain items may not foot due to rounding). The period-to-period comparison of financial results is not necessarily indicative of future results.
| Year Ended December 31, | |||||||
| 2014 | 2013 | 2012 | |||||
| (as a percentage of net revenue) | |||||||
| Consolidated Statements of Operations | |||||||
| Data: | |||||||
| Net revenue by product | |||||||
| Local advertising | 85 | % | 83 | % | 79 | % | |
| Brand advertising | 9 | 12 | 15 | ||||
| Other services | 6 | 5 | 6 | ||||
| Total net revenue | 100 | % | 100 | % | 100 | % | |
| Costs and expenses: | |||||||
| Cost of revenue (exclusive of | |||||||
| depreciation and amortization shown | |||||||
| separately below) | 6 | % | 7 | % | 7 | % | |
| Sales and marketing | 53 | 57 | 62 | ||||
| Product development | 17 | 16 | 15 | ||||
| General and administrative | 15 | 18 | 23 | ||||
| Depreciation and amortization | 5 | 5 | 5 | ||||
| Restructuring and integration | — | — | 1 | ||||
| Total costs and expenses | 97 | 104 | 113 | ||||
| Income (loss) from operations | 3 | (4 | ) | (14 | ) | ||
| Other income (expense), net | — | — | — | ||||
| Income (loss) before income taxes | 3 | (4 | ) | (14 | ) | ||
| Benefit (provision) for income taxes | 7 | — | — | ||||
| Net income (loss) | 10 | % | (4 | )% | (14 | )% | |
46
Years Ended December 31, 2014, 2013 and 2012
Net Revenue
We generate revenue from local advertising, brand advertising and other services. The following table provides a breakdown of our net revenue for the periods indicated.
| 2013 to | 2012 to | |||||||||||||
| 2014 % | 2013 % | |||||||||||||
| Year Ended December 31, | Change | Change | ||||||||||||
| 2014 | 2013 | 2012 | ||||||||||||
| (dollars in thousands) | ||||||||||||||
| Net revenue by product: | ||||||||||||||
| Local advertising | $ | 319,137 | $ | 192,983 | $ | 109,159 | 65 | % | 77 | % | ||||
| Brand advertising | 34,482 | 27,960 | 20,579 | 23 | 36 | |||||||||
| Other services | 23,917 | 12,045 | 7,829 | 99 | 54 | |||||||||
| Total net revenue | $ | 377,536 | $ | 232,988 | $ | 137,567 | 62 | % | 69 | % | ||||
| Percentage of total net revenue by product: | ||||||||||||||
| Local advertising | 85 | % | 83 | % | 79 | % | ||||||||
| Brand advertising | 9 | 12 | 15 | |||||||||||
| Other services | 6 | 5 | 6 | |||||||||||
| Total net revenue | 100 | % | 100 | % | 100 | % | ||||||||
During 2014, 2013 and 2012, we focused on revenue growth related to our local advertiser customer base as well as the development of relationships with brand advertising agencies. Total net revenue increased $144.5 million, or 62%, in 2014 compared to 2013, and $95.4 million, or 69%, in 2013 compared to 2012.
Local Advertising. We generate revenue from local advertising programs, including enhanced profile pages and performance and impression-based advertising in search results and elsewhere on our website and mobile app. Our local advertising revenue increased $126.2 million, or 65%, in 2014 compared to 2013, and $83.8 million, or 77%, in 2013 compared to 2012. The increase in both years was primarily due to a significant increase in the number of customers purchasing local advertising plans as we expanded our sales force to reach more local businesses.
Brand Advertising. We generate revenue from brand advertising through the sale of advertising solutions for national brands that want to improve their local presence in the form of display advertisements and brand sponsorships. Our national advertisers include leading brands in the automobile, financial services, logistics, consumer goods and health and fitness industries. Our brand advertising revenue increased $6.5 million, or 23%, in 2014 compared to 2013, and $7.4 million, or 36%, in 2013 compared to 2012. The increase in both years was primarily due to an increase in the average spend per brand advertiser, driven largely by increased advertising impressions per brand advertiser.
Other Services. We generate other revenue through partner arrangements, the sale of Yelp Deals and Gift Certificates, and monetization of remnant advertising inventory through third-party ad networks. Our revenue-sharing partner arrangements provide consumers with the ability to complete food delivery transactions and make online reservations through third parties directly on Yelp. Our fixed-fee partner arrangements include allowing third-party data providers to update business listing information on behalf of businesses. Yelp Deals allow merchants to promote themselves and offer discounted goods and services on a real-time basis to consumers directly on our website and mobile app. We earn a fee on Yelp Deals for acting as an agent in these transactions, which we record on a net basis and include in revenue upon a consumer’s purchase of a deal. Gift Certificates allow merchants to sell full-priced gift certificates directly to consumers through their business profile pages. We earn a fee based on the amount of the Gift Certificate sold, which we record on a net basis and include in revenue upon a consumer’s purchase of the Gift Certificate.
Our other services revenue increased $11.9 million, or 99%, in 2014 compared to 2013, and $4.2 million, or 54%, in 2013 compared to 2012. The increase in both years was primarily due to an increase in revenue from added partnership arrangements, as well as the sale of Yelp Deals and remnant advertising inventory.
47
Cost of Revenue
Our cost of revenue consists primarily of network costs, credit card processing fees and web hosting, as well as salaries, benefits and stock-based compensation for our infrastructure teams related to operating our website. It also includes video production expenses and creative design for brand advertising.
| 2013 to | 2012 to | |||||||||||||
| 2014 % | 2013 % | |||||||||||||
| Year Ended December 31, | Change | Change | ||||||||||||
| 2014 | 2013 | 2012 | ||||||||||||
| (dollars in thousands) | ||||||||||||||
| Cost of revenue | $ | 24,382 | $ | 16,561 | $ | 9,928 | 47 | % | 67 | % | ||||
| Percentage of net revenue | 6 | % | 7 | % | 7 | % | ||||||||
Cost of revenue increased $7.8 million, or 47%, in 2014 compared to 2013, and $6.6 million, or 67%, in 2013 compared to 2012. The increases in 2014 and 2013 were primarily attributable to increases of $4.3 million and $1.7 million, respectively, in outside hosting and Internet service fees, which are necessary to support the increase in visitors to our website and transactions completed on our website. In addition, set up costs, including video production, for active local business pages increased by $0.4 million and $1.3 million in 2014 and 2013, respectively, due to increased demand by local businesses for video on their business pages. Expenses related to creative design for brand and local advertising customers also increased by $0.7 million and $0.2 million in 2014 and 2013, respectively. In addition, merchant fees related to credit card transactions for local advertising increased $2.0 million and $1.8 million in 2014 and 2013, respectively, and we added personnel to support our website infrastructure resulting in increases of $0.4 million and $1.6 million in 2014 and 2013, respectively.
Sales and Marketing
Our sales and marketing expenses primarily consist of salaries, benefits, stock-based compensation expense, travel expense and incentive compensation expense for our sales and marketing employees. In addition, sales and marketing expenses include business acquisition marketing, community management, branding and advertising costs, as well as allocated facilities and other supporting overhead costs. Our focus to date has been on organic and viral growth driven by the community development efforts of our community management team, which is responsible for growing and fostering local communities, as well as coordinating events to raise awareness of our brand. As a result, we have incurred minimal sales and marketing expenses to acquire organic traffic to our platform. However, we have begun selectively testing advertising to consumers through various channels and plan to continue to do so in 2015.
We expect our community management costs to increase as we continue to expand to new markets and within existing markets. We expect our sales and marketing expenses to increase as we expand our domestic and international footprint, increase the number of local advertising accounts and continue to build our brand. The substantial majority of these expenses will be related to hiring sales employees and Community Managers. We expect sales and marketing expenses to increase and to be our largest expense for the foreseeable future.
| 2013 to | 2012 to | |||||||||||||
| 2014 % | 2013 % | |||||||||||||
| Year Ended December 31, | Change | Change | ||||||||||||
| 2014 | 2013 | 2012 | ||||||||||||
| (dollars in thousands) | ||||||||||||||
| Sales and marketing | $ | 201,050 | $ | 131,970 | $ | 85,915 | 52 | % | 54 | % | ||||
| Percentage of net revenue | 53 | % | 57 | % | 62 | % | ||||||||
Sales and marketing expenses increased $69.1 million, or 52%, in 2014 compared to 2013, and $46.1 million, or 54%, in 2013 compared to 2012. The increases in 2014 and 2013 were primarily attributable to increases in headcount and related expenses of $42.9 million and $30.2 million, respectively, including increases in stock-based compensation expense of $5.0 million and $5.2 million, respectively, as we expanded our sales organization to take advantage of the market opportunity created by increased recognition of the value of our platform and increased use of our free online business accounts. In addition, we experienced increases in facilities and related allocations of $11.8 million and $6.4 million in 2014 and 2013, respectively. As a result of new marketing campaigns, domestic and international marketing and advertising costs increased by $9.2 million and $0.1 million in 2014 and 2013, respectively. As a result of our increase in net revenue for 2014 compared to 2013, and 2013 compared to 2012, our commission expenses increased $5.2 million and $9.4 million in 2014 and 2013, respectively.
48
Product Development
Our product development expenses primarily consist of salaries, benefits and stock-based compensation expense for our engineers, product management and information technology personnel. Product development expenses also include outside services and consulting, allocated facilities and other supporting overhead costs. We believe that continued investment in features, software development tools and code modification is important to attaining our strategic objectives and, as a result, we expect product development expense to increase for the foreseeable future.
| 2013 to | 2012 to | |||||||||||||
| 2014 % | 2013 % | |||||||||||||
| Year Ended December 31, | Change | Change | ||||||||||||
| 2014 | 2013 | 2012 | ||||||||||||
| (dollars in thousands) | ||||||||||||||
| Product development | $ | 65,181 | $ | 38,243 | $ | 20,473 | 70 | % | 87 | % | ||||
| Percentage of net revenue | 17 | % | 16 | % | 15 | % | ||||||||
Product development expenses increased $26.9 million, or 70%, in 2014 compared to 2013, and $17.8 million, or 87%, in 2013 compared to 2012. These increases were primarily attributable to increases in headcount and related expenses of $24.9 million and $15.3 million in 2014 and 2013, respectively, including increases in stock-based compensation expense of $8.5 million and $4.6 million, respectively. In addition, we experienced increases in facilities and related expenses of $2.5 million and $1.3 million in 2014 and 2013, respectively, as a result of the increases in headcount. In 2014, use of outside consultants decreased by $0.5 million. In 2013, use of outside consultants increased by $1.2 million as we continued to invest in adding features and functionality to our website and mobile app.
General and Administrative
Our general and administrative expenses primarily consist of salaries, benefits and stock-based compensation for our executive, finance, user operations, legal, human resources and other administrative employees. Our general and administrative expenses also include outside consulting, legal and accounting services, as well as facilities and other supporting overhead costs not allocated to other departments. We expect our general and administrative expenses to increase for the foreseeable future as we continue to expand our business.
| 2013 to | 2012 to | |||||||||||||
| 2014 % | 2013 % | |||||||||||||
| Year Ended December 31, | Change | Change | ||||||||||||
| 2014 | 2013 | 2012 | ||||||||||||
| (dollars in thousands) | ||||||||||||||
| General and administrative | $ | 58,274 | $ | 42,907 | $ | 31,531 | 36 | % | 36 | % | ||||
| Percentage of net revenue | 15 | % | 18 | % | 23 | % | ||||||||
General and administrative expenses increased $15.4 million, or 36%, in 2014 compared to 2013, and $11.4 million, or 36%, in 2013 compared to 2012. The increases in 2014 and 2013 were primarily attributable to increases in headcount and related expenses of $8.3 million and $6.5 million, respectively, including increases in stock-based compensation expense of $2.3 million and $1.2 million, respectively. Additionally, we invested in our systems and support for the growth of the business through the use of outside consultants, which contributed to the increases by $2.4 million in both years. We also experienced increases in facilities and related expenses of $1.6 million and $1.7 million in 2014 and 2013, respectively, and increases in bad debt expense of $3.1 million and $1.3 million in 2014 and 2013, respectively. In 2013, the increase was offset by a decrease in legal costs of $0.5 million due to court decisions in prior litigation claims.
49
Depreciation and Amortization
Depreciation and amortization expenses primarily consist of depreciation on computer equipment, software, leasehold improvements, capitalized website and software development costs and amortization of purchased intangibles. We expect depreciation and amortization expenses to increase for the foreseeable future as we continue to expand our technology infrastructure.
| 2013 to | 2012 to | |||||||||||||
| 2014 % | 2013 % | |||||||||||||
| Year Ended December 31, | Change | Change | ||||||||||||
| 2014 | 2013 | 2012 | ||||||||||||
| (dollars in thousands) | ||||||||||||||
| Depreciation and amortization | $ | 17,590 | $ | 11,455 | $ | 7,223 | 54 | % | 59 | % | ||||
| Percentage of net revenue | 5 | % | 5 | % | 5 | % | ||||||||
Depreciation and amortization expense increased $6.1 million, or 54%, in 2014 compared to 2013, and $4.2 million, or 59%, in 2013 compared to 2012. These increases were primarily the result of our investments in expanding our technology infrastructure and capital assets to support our increase in headcount across the organization. Depreciation and amortization related to our fixed assets and capitalized website and software development costs increased $5.9 million and $2.3 million in 2014 and 2013, respectively. In addition, amortization related to our intangibles increased by $0.2 million and $1.9 million in 2014 and 2013, respectively, primarily due to the intangibles acquired in acquisitions in such years.
Restructuring and Integration
| Year Ended December 31, | |||||||||
| 2014 | 2013 | 2012 | |||||||
| (in thousands) | |||||||||
| Restructuring and integration | $ | — | $ | 675 | $ | 1,262 | |||
In 2014, we incurred zero restructuring and integration costs compared to $0.7 million in 2013 and $1.3 million in 2012.
In 2012, following the acquisition of Qype, we announced our plan to reduce the size of the Qype workforce and to terminate several of Qype’s leases. In 2013, we announced our plan to further reduce the size of the Qype workforce. These actions were made in order to reduce our cost structure, enhance operating efficiencies and strengthen our business to achieve long-term profitable growth. We incurred restructuring charges of $0.7 million in 2013 and $1.3 million in 2012 as a result of these plans. The restructuring was completed during 2013.
Other Income (Expense), Net
Other income (expense), net consists primarily of the interest income earned on our cash and cash equivalents and marketable securities, gains and losses on the disposal of assets, and foreign exchange gains and losses.
| Year Ended December 31, | ||||||||||
| 2014 | 2013 | 2012 | ||||||||
| (in thousands) | ||||||||||
| Interest income | $ | 727 | $ | 62 | $ | 51 | ||||
| Transaction gains (losses) on foreign exchange | (121 | ) | (251 | ) | (259 | ) | ||||
| Other non-operating loss, net | (385 | ) | (218 | ) | (18 | ) | ||||
| Total other income (expense), net | $ | 221 | $ | (407 | ) | $ | (226 | ) | ||
50
In 2014, other income (expense), net increased by $0.6 million, driven primarily by an increase in interest income related to marketable securities. In addition, there was a decrease in foreign exchange losses due to favorable foreign currency exchange rates during 2014.
In 2013, other income (expense), net decreased $0.2 million compared to 2012. The decrease was largely driven by a loss on the disposal of assets.
Benefit (Provision) for Income Taxes
Benefit (provision) for income taxes consists of federal and state income taxes in the United States and income taxes in certain foreign jurisdictions, deferred income taxes reflecting the net tax effects of temporary differences between the carrying amounts of assets and liabilities for financial reporting purposes and the amounts used for income tax purposes, and the realization of net operating loss carryforwards.
| Year Ended December 31, | ||||||||||
| 2014 | 2013 | 2012 | ||||||||
| (in thousands) | ||||||||||
| Benefit (provision) for income taxes | $ | 25,193 | $ | (838 | ) | $ | (122 | ) | ||
Income tax expense decreased $26.0 million in 2014 compared to 2013 primarily due to the release of the valuation allowance previously recorded against certain deferred tax assets. Income tax expense increased $0.7 million in 2013 compared to 2012 as a result of taxes due in foreign jurisdictions and state taxes.
Quarterly Results of Operations and Other Data
The following tables set forth our unaudited quarterly consolidated statements of operations data and our consolidated statements of operations data as a percentage of net revenue for each of the eight quarters in the period ended December 31, 2014 (for which certain items may not foot due to rounding). We also present other financial and operational data and a reconciliation of net income (loss) to adjusted EBITDA. We have prepared this quarterly data on a consistent basis with the audited consolidated financial statements included in this Annual Report. In the opinion of management, the quarterly financial information reflects all necessary adjustments, consisting only of normal recurring adjustments, necessary for a fair presentation of this data. This information should be read in conjunction with the audited financial statements and related notes included elsewhere in this Annual Report. The results of historical periods are not necessarily indicative of the results of operations for any future period.
| Quarter Ended | |||||||||||||||||||||||||
| Dec 31, | Sep 30, | Jun 30, | Mar 31, | Dec 31, | Sep 30, | Jun 30, | Mar 31, | ||||||||||||||||||
| 2014 | 2014 | 2014 | 2014 | 2013 | 2013 | 2013 | 2013 | ||||||||||||||||||
| (dollars in thousands, except per share data) | |||||||||||||||||||||||||
| Consolidated Statements of Operations | |||||||||||||||||||||||||
| Data: | |||||||||||||||||||||||||
| Net revenue by product | |||||||||||||||||||||||||
| Local advertising | $ | 93,125 | $ | 85,132 | $ | 75,685 | $ | 65,195 | $ | 58,052 | $ | 51,167 | $ | 44,797 | $ | 38,967 | |||||||||
| Brand advertising | 8,653 | 9,318 | 9,055 | 7,455 | 9,244 | 6,910 | 7,048 | 4,758 | |||||||||||||||||
| Other services | 8,109 | 8,005 | 4,047 | 3,757 | 3,355 | 3,104 | 3,178 | 2,408 | |||||||||||||||||
| Total net revenue | 109,887 | 102,455 | 88,787 | 76,407 | 70,651 | 61,181 | 55,023 | 46,133 | |||||||||||||||||
| Costs and expenses: | |||||||||||||||||||||||||
| Cost of revenue (exclusive of depreciation | |||||||||||||||||||||||||
| and amortization shown separately | |||||||||||||||||||||||||
| below)(1) | 7,286 | 6,174 | 5,845 | 5,077 | 4,926 | 4,277 | 4,018 | 3,340 | |||||||||||||||||
| Sales and marketing(1) | 53,580 | 54,551 | 47,798 | 45,121 | 38,847 | 34,126 | 30,803 | 28,194 | |||||||||||||||||
| Product development(1) | 19,076 | 17,397 | 14,726 | 13,982 | 11,802 | 11,208 | 7,997 | 7,236 | |||||||||||||||||
| General and administrative(1) | 16,662 | 15,185 | 13,257 | 13,170 | 13,460 | 10,535 | 10,148 | 8,764 | |||||||||||||||||
| Depreciation and amortization | 5,291 | 4,604 | 4,034 | 3,661 | 3,524 | 2,816 | 2,637 | 2,478 | |||||||||||||||||
| Restructuring and integration(1) | — | — | — | — | — | — | — | 675 | |||||||||||||||||
| Total costs and expenses | 101,895 | 97,911 | 85,660 | 81,011 | 72,559 | 62,962 | 55,603 | 50,687 | |||||||||||||||||
| Income (loss) from operations | 7,992 | 4,544 | 3,127 | (4,604 | ) | (1,908 | ) | (1,781 | ) | (580 | ) | (4,554 | ) | ||||||||||||
| Other income (expense), net | 38 | 200 | (15 | ) | (2 | ) | (109 | ) | (31 | ) | (66 | ) | (201 | ) | |||||||||||
| Income (loss) before income taxes | 8,030 | 4,744 | 3,112 | (4,606 | ) | (2,017 | ) | (1,812 | ) | (646 | ) | (4,755 | ) | ||||||||||||
| Benefit (provision) for income taxes | 24,698 | (1,107 | ) | (369 | ) | 1,971 | (52 | ) | (510 | ) | (232 | ) | (44 | ) | |||||||||||
| Net income (loss) attributable to common | |||||||||||||||||||||||||
| stockholders (Class A and B) | $ | 32,728 | $ | 3,637 | $ | 2,743 | $ | (2,635 | ) | $ | (2,069 | ) | $ | (2,322 | ) | $ | (878 | ) | $ | (4,799 | ) | ||||
| Net income (loss) per share attributable to | |||||||||||||||||||||||||
| common stockholders (Class A and B): | |||||||||||||||||||||||||
| Basic | $ | 0.45 | $ | 0.05 | $ | 0.04 | $ | (0.04 | ) | $ | (0.03 | ) | $ | (0.04 | ) | $ | (0.01 | ) | $ | (0.08 | ) | ||||
| Diluted | $ | 0.42 | $ | 0.05 | $ | 0.04 | $ | (0.04 | ) | $ | (0.03 | ) | $ | (0.04 | ) | $ | (0.01 | ) | $ | (0.08 | ) | ||||
| Weighted-average shares used to compute | |||||||||||||||||||||||||
| net income (loss) per share attributable | |||||||||||||||||||||||||
| to common stockholders (Class A and | |||||||||||||||||||||||||
| B): | |||||||||||||||||||||||||
| Basic | 72,645 | 72,195 | 71,714 | 71,171 | 68,847 | 65,530 | 64,576 | 63,733 | |||||||||||||||||
| Diluted | 77,211 | 77,296 | 77,056 | 71,171 | 68,847 | 65,530 | 64,576 | 63,733 | |||||||||||||||||
(1) Includes non-cash stock-based compensation expense as follows: |
|||||||||||||||||||||||||
| Stock-based compensation | |||||||||||||||||||||||||
| Cost of revenue | $ | 207 | $ | 253 | $ | 119 | $ | 150 | $ | 140 | $ | 104 | $ | 105 | $ | 72 | |||||||||
| Sales and marketing | 4,038 | 3,911 | 3,737 | 3,397 | 3,201 | 2,660 | 2,282 | 1,988 | |||||||||||||||||
| Product development | 4,508 | 3,807 | 3,447 | 3,042 | 2,705 | 1,709 | 1,040 | 816 | |||||||||||||||||
| General and administrative | 3,063 | 2,947 | 2,780 | 2,867 | 2,743 | 2,542 | 2,286 | 1,729 | |||||||||||||||||
| Restructuring and integration | — | — | — | — | — | — | — | 555 | |||||||||||||||||
| Total stock-based compensation | $ | 11,816 | $ | 10,918 | $ | 10,083 | $ | 9,456 | $ | 8,789 | $ | 7,015 | $ | 5,713 | $ | 5,160 | |||||||||
51
| Quarter Ended | |||||||||||||||||
| Dec 31, | Sep 30, | Jun 30, | Mar 31, | Dec 31, | Sep 30, | Jun 30, | Mar 31, | ||||||||||
| 2014 | 2014 | 2014 | 2014 | 2013 | 2013 | 2013 | 2013 | ||||||||||
| (as a percentage of net revenue) | |||||||||||||||||
| Consolidated Statements of | |||||||||||||||||
| Operations Data: | |||||||||||||||||
| Net revenue by product | |||||||||||||||||
| Local advertising | 85 | % | 83 | % | 85 | % | 85 | % | 82 | % | 84 | % | 81 | % | 85 | % | |
| Brand advertising | 8 | 9 | 10 | 10 | 13 | 11 | 13 | 10 | |||||||||
| Other services | 7 | 8 | 5 | 5 | 5 | 5 | 6 | 5 | |||||||||
| Total net revenue | 100 | % | 100 | % | 100 | % | 100 | % | 100 | % | 100 | % | 100 | % | 100 | % | |
| Costs and expenses: | |||||||||||||||||
| Cost of revenue (exclusive of | |||||||||||||||||
| depreciation and amortization shown | |||||||||||||||||
| separately below) | 7 | 6 | 7 | 7 | 7 | 7 | 7 | 7 | |||||||||
| Sales and marketing | 49 | 53 | 54 | 59 | 55 | 56 | 56 | 61 | |||||||||
| Product development | 17 | 17 | 17 | 18 | 17 | 18 | 15 | 16 | |||||||||
| General and administrative | 15 | 15 | 15 | 17 | 19 | 17 | 18 | 19 | |||||||||
| Depreciation and amortization | 5 | 4 | 5 | 5 | 5 | 5 | 5 | 5 | |||||||||
| Restructuring and integration | — | — | — | — | — | — | — | 1 | |||||||||
| Total costs and expenses | 93 | 96 | 96 | 106 | 103 | 103 | 101 | 109 | |||||||||
| Income (loss) from operations | 7 | 4 | 4 | (6 | ) | (3 | ) | (3 | ) | (1 | ) | (10 | ) | ||||
| Other income (expense), net | — | — | — | — | — | — | — | — | |||||||||
| Income (loss) before income taxes | 7 | 5 | 4 | (6 | ) | (3 | ) | (3 | ) | (1 | ) | (10 | ) | ||||
| Benefit (provision) for income taxes | 22 | (1 | ) | — | 3 | — | (1 | ) | — | — | |||||||
| Net income (loss) | 30 | % | 4 | % | 3 | % | (3 | )% | (3 | )% | (4 | )% | (1 | )% | (10 | )% | |
52
| Quarter Ended | ||||||||||||||||||||||||
| Dec 31, | Sep 30, | Jun 30, | Mar 31, | Dec 31, | Sep 30, | Jun 30, | Mar 31, | |||||||||||||||||
| 2014 | 2014 | 2014 | 2014 | 2013 | 2013 | 2013 | 2013 | |||||||||||||||||
| (in thousands) | ||||||||||||||||||||||||
| Other Financial and Operational | ||||||||||||||||||||||||
| Data(1): | ||||||||||||||||||||||||
| Reviews | 71,232 | 66,592 | 61,342 | 56,905 | 52,757 | 47,322 | 42,526 | 39,103 | ||||||||||||||||
| Unique Visitors | 135,399 | 139,418 | 137,761 | 132,460 | 120,005 | 117,447 | 108,058 | 102,065 | ||||||||||||||||
| Mobile Unique Visitors | 72,311 | 73,440 | 67,886 | 61,190 | 52,905 | 50,455 | 45,064 | 40,168 | ||||||||||||||||
| Claimed Local Business Locations | 2,029 | 1,886 | 1,751 | 1,623 | 1,488 | 1,344 | 1,222 | 1,103 | ||||||||||||||||
| Active Local Business Accounts | 94 | 86 | 80 | 74 | 67 | 57 | 51 | 45 | ||||||||||||||||
| Local Advertising Accounts | 84 | 77 | 69 | 63 | 54 | 46 | 40 | 35 | ||||||||||||||||
| Adjusted EBITDA | $ | 25,099 | $ | 20,066 | $ | 17,244 | $ | 8,513 | $ | 10,405 | $ | 8,050 | $ | 7,770 | $ | 3,204 | ||||||||
| Non-GAAP Net Income (Loss) | $ | 18,897 | $ | 15,198 | $ | 13,455 | $ | 7,447 | $ | 7,340 | $ | 5,278 | $ | 5,358 | $ | 338 | ||||||||
(1) For information on how we define these operational and other metrics, see “—Key Metrics. ”
The following table presents a reconciliation of adjusted EBITDA to net income (loss).
| Quarter Ended | |||||||||||||||||||||||||
| Dec 31, | Sep 30, | Jun 30, | Mar 31, | Dec 31, | Sep 30, | Jun 30, | Mar 31, | ||||||||||||||||||
| 2014 | 2014 | 2014 | 2014 | 2013 | 2013 | 2013 | 2013 | ||||||||||||||||||
| (in thousands) | |||||||||||||||||||||||||
| Reconciliation of adjusted | |||||||||||||||||||||||||
| EBITDA: | |||||||||||||||||||||||||
| Net income (loss) | $ | 32,728 | $ | 3,637 | $ | 2,743 | $ | (2,635 | ) | $ | (2,069 | ) | $ | (2,322 | ) | $ | (878 | ) | $ | (4,799 | ) | ||||
| (Benefit) provision for income taxes | (24,698 | ) | 1,107 | 369 | (1,971 | ) | 52 | 510 | 232 | 44 | |||||||||||||||
| Other (income) expense, net | (38 | ) | (200 | ) | 15 | 2 | 109 | 31 | 66 | 201 | |||||||||||||||
| Depreciation and amortization | 5,291 | 4,604 | 4,034 | 3,661 | 3,524 | 2,816 | 2,637 | 2,478 | |||||||||||||||||
| Stock-based compensation | 11,816 | 10,918 | 10,083 | 9,456 | 8,789 | 7,015 | 5,713 | 4,605 | |||||||||||||||||
| Restructuring and integration | — | — | — | — | — | — | — | 675 | |||||||||||||||||
| Adjusted EBITDA | $ | 25,099 | $ | 20,066 | $ | 17,244 | $ | 8,513 | $ | 10,405 | $ | 8,050 | $ | 7,770 | $ | 3,204 | |||||||||
The following table presents a reconciliation of non-GAAP net income (loss) to net income (loss).
| Quarter Ended | |||||||||||||||||||||||||
| Dec 31, | Sep 30, | Jun 30, | Mar 31, | Dec 31, | Sep 30, | Jun 30, | Mar 31, | ||||||||||||||||||
| 2014 | 2014 | 2014 | 2014 | 2013 | 2013 | 2013 | 2013 | ||||||||||||||||||
| (in thousands) | |||||||||||||||||||||||||
| Reconciliation of adjusted non- | |||||||||||||||||||||||||
| GAAP net income (loss): | |||||||||||||||||||||||||
| Net income (loss) | $ | 32,728 | $ | 3,637 | $ | 2,743 | $ | (2,635 | ) | $ | (2,069 | ) | $ | (2,322 | ) | $ | (878 | ) | $ | (4,799 | ) | ||||
| Stock-based compensation | 11,816 | 10,918 | 10,083 | 9,456 | 8,789 | 7,015 | 5,713 | 4,605 | |||||||||||||||||
| Amortization of intangible assets | 550 | 643 | 629 | 626 | 620 | 585 | 523 | 532 | |||||||||||||||||
| Valuation allowance release | (26,197 | ) | — | — | — | — | — | — | — | ||||||||||||||||
| Non-GAAP net income (loss) | $ | 18,897 | $ | 15,198 | $ | 13,455 | $ | 7,447 | $ | 7,340 | $ | 5,278 | $ | 5,358 | $ | 338 | |||||||||
Liquidity and Capital Resources
As of December 31, 2014, we had cash and cash equivalents of $247.3 million. Cash and cash equivalents consist of both cash and money market funds. Our cash held internationally as of December 31, 2014 was $8.4 million. We did not have any outstanding bank loans or credit facilities in place as of December 31, 2014. Our investment portfolio is comprised of highly-rated marketable securities, and our investment policy limits the amount of credit exposure to any one issuer. The policy generally requires securities to be investment grade (i.e. rated ‘A’ or higher by bond rating firms) with the objective of minimizing the potential risk of principal loss. To date, we have been able to finance our operations and our acquisitions through proceeds from private and public financings, including our initial public offering in March 2012, our follow-on offering in October 2013, cash generated from operations and, to a lesser extent, cash provided by the exercise of employee stock options and purchases under our 2012 Employee Stock Purchase Plan, or ESPP.
Our future capital requirements and the adequacy of available funds will depend on many factors, including those set forth under “Risk Factors” in this Annual Report. We believe that our existing cash and cash equivalents, together with any cash generated from operations, will be sufficient to meet our working capital requirements and anticipated purchases of property and equipment for at least the next 12 months. However, this estimate is based on a number of assumptions that may prove to be wrong and we could exhaust our available cash and cash equivalents earlier than presently anticipated. We may require or otherwise seek additional funds in the next 12 months to respond to business challenges, including the need to develop new features and products or enhance existing services, improve our operating infrastructure or acquire complementary businesses and technologies, and, accordingly, we may need to engage in equity or debt financings to secure additional funds.
53
Amounts deposited with third-party financial institutions exceed the Federal Deposit Insurance Corporation and Securities Investor Protection Corporation insurance limits, as applicable. These cash and cash equivalents could be impacted if the underlying financial institutions fail or are subjected to other adverse conditions in the financial markets. To date, we have experienced no loss or lack of access to our cash and cash equivalents; however, we can provide no assurances that access to our invested cash and cash equivalents will not be impacted by adverse conditions in the financial markets.
Cash Flows
The following table summarizes our cash flows for the periods presented:
| Year Ended December 31, | ||||||||||||
| 2014 | 2013 | 2012 | ||||||||||
| (in thousands) | ||||||||||||
| Consolidated Statements of Cash Flows Data: | ||||||||||||
| Purchases of property and equipment | $ | 29,054 | $ | 16,243 | $ | 7,524 | ||||||
| Depreciation and amortization | 17,590 | 11,455 | 7,223 | |||||||||
| Cash provided by (used in) operating activities | 57,932 | 21,432 | (99 | ) | ||||||||
| Cash used in investing activities | (228,674 | ) | (18,827 | ) | (40,592 | ) | ||||||
| Cash provided by financing activities | 29,549 | 291,720 | 114,173 | |||||||||
Operating Activities. We generated $57.9 million of cash in operating activities in the year ended December 31, 2014, primarily resulting from our net income of $36.5 million, which included non-cash depreciation and amortization of $17.6 million, non-cash stock-based compensation of $42.3 million, non-cash provision for doubtful accounts of $7.2 million and $28.2 million increase related to our release of valuation allowance previously recorded against certain domestic and foreign deferred tax assets. In addition, significant changes in our operating assets and liabilities resulted from the following:
| ● | increase in accounts receivable of $21.3 million due to an increase
in billings for local advertising plans and brand advertising campaigns,
as well as the timing of payments from these customers; |
| ● |
increase in accounts
payable, accrued expenses and other liabilities of $8.9 million relating
to the growth in our business and the increase in accrued vacation and
employee-related expenses, accrued cost of sales, deferred rent for new
facilities, and timing of invoices and payments to vendors; and
|
| ● |
increase in prepaids and other assets of $4.0 million relating to the increase in prepaid payroll bonuses, prepaid cost of sales and amounts due from others. |
We generated $21.4 million of cash from operating activities in the year ended December 31, 2013, primarily resulting from our net loss of $10.1 million, offset by non-cash stock-based compensation of $26.7 million, non-cash depreciation and amortization of $11.5 million, an increase in excess tax benefit from the exercise of stock-based award activity of $0.4 million, which is reclassified as a financing activity, and non-cash provision for doubtful accounts of $3.3 million. In addition, significant changes in our operating assets and liabilities resulted from the following:
| ● |
increase in accounts
receivable of $12.8 million due to an increase in billings for local
advertising plans and brand advertising campaigns, as well as timing of
payments from these customers; |
| ● |
increase in accounts
payable, accrued expenses and other liabilities of $5.0 million relating
to the growth in the business and, more specifically, the increase in
accrued vacation and employee-related expenses, deferred rent for new
facilities, as well as timing of invoices and payments to vendors; and
|
| ● |
increase in prepaids and other assets of $1.6 million relating to the increase in value added tax due from taxing authorities, an increase in deferred tax assets, prepaid business data and prepaid rent for our facilities. |
54
We used $0.1 million of cash from operating activities during the year ended December 31, 2012, primarily resulting from our net loss of $19.1 million, non-cash stock-based compensation of $14.9 million, provision for doubtful accounts of $1.9 million and non-cash depreciation and amortization of $7.2 million. In addition, significant changes in our operating assets and liabilities resulted from the following:
| ● |
increase in accounts
receivable of $4.1 million due to an increase in billings for local
advertising plans and brand advertising campaigns, as well as timing of
payments from these customers; |
| ● |
increase in prepaids
and other assets of $2.6 million relating to the increase in value added
tax due from taxing authorities, prepaid business data and prepaid rent
for our facilities; and |
| ● |
increase in accounts payable, accrued expenses, and other liabilities of $2.0 million relating to the growth in the business and, more specifically, the increase in accrued bonus and commissions, increase in accrued vacation and employee related expenses, and deferred rent for new facilities. |
Investing Activities. Our primary investing activities in the year ended December 31, 2014 consisted of purchases of marketable securities, acquisitions, as well as the continued purchases of property and equipment to support the build out of our data centers, leasehold improvements for our headquarters in San Francisco and other locations, the purchase of technology hardware to support our growth in headcount and software to support website and mobile app development, website operations and our corporate infrastructure. Purchases of property and equipment, as well as leasehold improvements, may vary from period to period due to the timing of the expansion of our offices, operations and website and internal-use software and development. We expect to continue to invest in property and equipment, leaseholds and the development of software in 2015.
We used $228.7 million of cash in investing activities during the year ended December 31, 2014, including $14.3 million net of cash received related to acquisitions during the year. Other cash used in investing activities primarily related to purchases of marketable securities of $210.5 million, as well as an increase in expenditures related to website and internally developed software of $11.3 million, purchases of perpetual data licenses of $1.7 million and purchases of property, equipment, software and leasehold improvements of $29.1 million to support the growth in our business and an increase in restricted cash of $14.8 million associated with letters of credit in connection with leased office space. Cash used in investing was offset by $53.0 million of maturities of investment securities held to maturity.
We used $18.8 million in investing activities during the year ended December 31, 2013, including $2.1 million net of cash received related to the acquisition of SeatMe. In addition, we used $16.2 million for purchases of property, equipment and software and incurred expenditures of $4.9 million for capitalized website and software development costs. Cash used in investing was offset by $1.2 million of cash released from escrow related to the Qype acquisition, recorded as a measurement period adjustment to the initial fair value of the acquired assets and liabilities. Cash used in investing was also offset by a decrease in the required amount of letters of credit in connection with the lease for our San Francisco headquarters, which resulted in a decrease of $3.2 million in restricted cash.
We used $40.6 million in investing activities during the year ended December 31, 2012, including $24.1 million net of cash received for the acquisition of Qype. In addition, we used $7.5 million for purchases of property, equipment and software and incurred expenditures of $2.9 million for capitalized website and software development costs. We also entered into new lease agreements for office space in San Francisco and London. In connection with entry into such leases, we were obligated to deliver letters of credit in the aggregate amount of $6.0 million, which resulted in an increase of $6.0 million in restricted cash.
55
Financing Activities. During the year ended December 31, 2014, we generated $29.5 million in financing activities, primarily due to net proceeds of $20.2 million from the issuance of common stock upon the exercise of stock options and $8.9 million in net proceeds from the sale of stock under our ESPP.
We generated $291.7 million of cash from financing activities during the year ended December 31, 2013. We received $276.5 million in proceeds from our follow-on offering, net of $12.4 million in total offering expenses, including underwriter commission and discounts associated with the transaction. We also generated $13.5 million in net proceeds from the issuance of common stock related to the exercise of stock options, an increase of $0.4 million in excess tax benefits from the exercise of stock options and $2.0 million in net proceeds from the sale of stock under our ESPP.
We generated $114.2 million of cash from financing activities during the year ended December 31, 2012. We received $111.8 million in proceeds from our initial public offering, or IPO, net of $10.8 million in offering expenses, including underwriter commission and discounts associated with the transaction. With the exception of the IPO, our financing activities during the year ended December 31, 2012 consisted primarily of net proceeds from the issuance of common stock related to the exercise of stock options.
Off Balance Sheet Arrangements
We did not have any off balance sheet arrangements in 2014, 2013 or 2012.
Contractual Obligations
We lease various office facilities, including our corporate headquarters in San Francisco, California, under operating lease agreements that expire from 2015 to 2026. The terms of the lease agreements provide for rental payments on a graduated basis. We recognize rent expense on a straight-line basis over the lease periods. We do not have any debt or material capital lease obligations, and all of our property, equipment and software have been purchased with cash. As of December 31, 2014, we had no material long-term purchase obligations outstanding with any vendors or third parties. As of December 31, 2014, the following table summarizes our future minimum payments under non-cancelable operating leases for equipment and office facilities:
| Payments Due by Period | |||||||||||||||
| Total | Less Than 1 Year | 1 – 3 Years | 3 – 5 Years | More Than 5 Years | |||||||||||
| (in thousands) | |||||||||||||||
| Operating lease obligations | $ | 343,409 | $ | 25,617 | $ | 109,050 | $ | 75,849 | $ | 132,893 | |||||
The contractual commitment amounts in the table above are associated with agreements that are enforceable and legally binding. Obligations under contracts that we can cancel without a significant penalty are not included in the table above. As of December 31, 2014, our total liability for uncertain tax positions was $3.3 million. We are not reasonably able to estimate the timing of future cash flow related to this liability. As a result, this amount is not included in the contractual obligations table above.
56
Item 7A. Quantitative and Qualitative Disclosures About Market Risk.
We have operations both within the United States and internationally, and we are exposed to market risks in the ordinary course of business. These risks include primarily interest rate, foreign exchange risks and inflation.
Interest Rate Fluctuation
The primary objective of our investment activities is to preserve principal while maximizing income without significantly increasing risk.
Our cash and cash equivalents consist of cash and money market funds. We do not have any long-term borrowings. Because our cash and cash equivalents have a relatively short maturity, their fair value is relatively insensitive to interest rate changes. We believe a hypothetical 10% increase in the interest rates as of December 31, 2014 would not have a material impact on our cash and cash equivalents portfolio.
Our marketable securities are comprised of fixed-rate debt securities issued by U.S. corporations, U.S. government agencies and the U.S. Treasury; as such, their fair value may be affected by fluctuations in interest rates in the broader economy. As we have both the ability and intent to hold these securities to maturity, such fluctuations would have no impact on our results of operations.
Foreign Currency Exchange Risk
We have foreign currency risks related to our revenue and operating expenses denominated in currencies other than the U.S. dollar, principally the British pound sterling and the Euro. The volatility of exchange rates depends on many factors that we cannot forecast with reliable accuracy. Although we have experienced and will continue to experience fluctuations in net income (loss) as a result of transaction gains (losses), net related to revaluing certain cash balances, trade accounts receivable balances and intercompany balances that are denominated in currencies other than the U.S. dollar, we believe a hypothetical 10% strengthening/(weakening) of the U.S. dollar against the British pound sterling, either alone or in combination with a hypothetical 10% strengthening/(weakening) of the U.S. dollar against the Euro, would not have a material impact on our results of operations. In the event our foreign sales and expenses increase as a proportion of our overall sales and expenses, our operating results may be more greatly affected by fluctuations in the exchange rates of the currencies in which we do business. At this time we do not, but we may in the future, enter into derivatives or other financial instruments in an attempt to hedge our foreign currency exchange risk. It is difficult to predict the impact hedging activities would have on our results of operations.
Inflation Risk
We do not believe that inflation has had a material effect on our business, financial condition or results of operations. If our costs were to become subject to significant inflationary pressures, we may not be able to fully offset such higher costs through price increases. Our inability or failure to do so could harm our business, financial condition or results of operations.
Item 8. Financial Statements and Supplementary Data.
Our financial statements and the report of our independent registered public accounting firm are included in this Annual Report beginning on page F-1. The index to our financial statements is included in Part IV, Item 15 below.
Item 9. Changes in and Disagreements with Accountants on Accounting and Financial Disclosure.
None.
57
Item 9A. Controls and Procedures.
Evaluation of Disclosure Controls and Procedures
We maintain “disclosure controls and procedures,” as defined in Rules 13a-15(e) and 15d-15(e) under the Exchange Act, that are designed to ensure that information required to be disclosed by a company in the reports that it files or submits under the Exchange Act is recorded, processed, summarized and reported within the time periods specified in the SEC’s rules and forms. Disclosure controls and procedures include, without limitation, controls and procedures designed to ensure that information required to be disclosed by a company in the reports that it files or submits under the Exchange Act is accumulated and communicated to the company’s management, including its principal executive and principal financial officers, as appropriate to allow timely decisions regarding required disclosure.
Our management, with the participation of our Chief Executive Officer and our Chief Financial Officer, evaluated the effectiveness of our disclosure controls and procedures as of December 31, 2014. Based on the evaluation of our disclosure controls and procedures as of December 31, 2014, our Chief Executive Officer and our Chief Financial Officer concluded that, as of such date, our disclosure controls and procedures were effective at the reasonable assurance level.
Management’s Annual Report on Internal Control Over Financial Reporting
Our management is responsible for establishing and maintaining adequate internal control over financial reporting, as such term is defined in Exchange Act Rules 13a-15(f) and 15d-15(f). Under the supervision and with the participation of our Chief Executive Officer and our Chief Financial Officer, our management evaluated the effectiveness of our internal control over financial reporting based on the framework set forth in “Internal Control—Integrated Framework (2013)” issued by the Committee of Sponsoring Organizations of the Treadway Commission. The scope of management’s assessment of the effectiveness of our internal control over financial reporting included all of our consolidated operations except for the operations of Restaurant Kritik and Cityvox, which we acquired on October 24, 2014 and October 28, 2014, respectively. This exclusion is in accordance with the SEC’s general guidance that an assessment of a recently acquired business may be omitted from the scope of our evaluation in the year of acquisition. Each of Restaurant Kritik and Cityvox account for less than one percent of the total assets and less than one percent of total revenues of the consolidated financial statements of the Company as of and for the fiscal year ended December 31, 2014. Based on this evaluation, our management concluded that our internal control over financial reporting was effective as of December 31, 2014. Our management reviewed the results of this evaluation with the audit committee of our board of directors.
Deloitte &Touche LLP, an independent registered public accounting firm, has audited the consolidated financial statements included in this Annual Report and, as part of the audit, has issued a report on the effectiveness of our internal control over financial reporting as of December 31, 2014, which is included below.
Changes in Internal Control Over Financial Reporting
There was no change in our internal control over financial reporting identified in connection with the evaluation required by Rule 13a-15(d) and 15d-15(d) of the Exchange Act that occurred during the three months ended December 31, 2014 that has materially affected, or is reasonably likely to materially affect, our internal control over financial reporting.
58
Inherent Limitations on Effectiveness of Controls
Our management, including our Chief Executive Officer and our Chief Financial Officer, believes that our disclosure controls and procedures and internal control over financial reporting are designed to provide reasonable assurance of achieving their objectives and are effective at the reasonable assurance level. However, our management does not expect that our disclosure controls and procedures or our internal control over financial reporting will prevent all errors and all fraud. A control system, no matter how well conceived and operated, can provide only reasonable, not absolute, assurance that the objectives of the control system are met. Further, the design of a control system must reflect the fact that there are resource constraints, and the benefits of controls must be considered relative to their costs. Because of the inherent limitations in all control systems, no evaluation of controls can provide absolute assurance that all control issues and instances of fraud, if any, have been detected. These inherent limitations include the realities that judgments in decision making can be faulty, and that breakdowns can occur because of a simple error or mistake. Additionally, controls can be circumvented by the individual acts of some persons, by the collusion of two or more people or by management override of controls. The design of any system of controls also is based in part upon certain assumptions about the likelihood of future events, and there can be no assurance that any design will succeed in achieving its stated goals under all potential future conditions; over time, controls may become inadequate because of changes in conditions, or the degree of compliance with policies or procedures may deteriorate. Because of the inherent limitations in a cost-effective control system, misstatements due to error or fraud may occur and not be detected.
REPORT OF INDEPENDENT REGISTERED PUBLIC ACCOUNTING FIRM
To the Board of Directors and Stockholders of Yelp Inc.
San Francisco, California
We have audited the internal control over financial reporting of Yelp Inc. and subsidiaries (the "Company") as of December 31, 2014, based on criteria established in Internal Control — Integrated Framework (2013) issued by the Committee of Sponsoring Organizations of the Treadway Commission. As described in Management’s Annual Report on Internal Control Over Financial Reporting, management excluded from its assessment the internal control over financial reporting of Restaurant-Kritik and Cityvox, which were both acquired in October 2014 and whose financial statements constitute less than 1% of the total assets and less than 1% of total revenue of the consolidated financial statement amounts as of and for the year ended December 31, 2014. Accordingly, our audit did not include the internal control over financial reporting at Restaurant-Kritik and Cityvox. The Company's management is responsible for maintaining effective internal control over financial reporting and for its assessment of the effectiveness of internal control over financial reporting, included in the accompanying Management's Annual Report on Internal Control Over Financial Reporting. Our responsibility is to express an opinion on the Company's internal control over financial reporting based on our audit.
We conducted our audit in accordance with the standards of the Public Company Accounting Oversight Board (United States). Those standards require that we plan and perform the audit to obtain reasonable assurance about whether effective internal control over financial reporting was maintained in all material respects. Our audit included obtaining an understanding of internal control over financial reporting, assessing the risk that a material weakness exists, testing and evaluating the design and operating effectiveness of internal control based on the assessed risk, and performing such other procedures as we considered necessary in the circumstances. We believe that our audit provides a reasonable basis for our opinion.
A company's internal control over financial reporting is a process designed by, or under the supervision of, the company's principal executive and principal financial officers, or persons performing similar functions, and effected by the company's board of directors, management, and other personnel to provide reasonable assurance regarding their liability of financial reporting and the preparation of financial statements for external purposes in accordance with generally accepted accounting principles. A company's internal control over financial reporting includes those policies and procedures that (1) pertain to the maintenance of records that, in reasonable detail, accurately and fairly reflect the transactions and dispositions of the assets of the company; (2) provide reasonable assurance that transactions are recorded as necessary to permit preparation of financial statements in accordance with generally accepted accounting principles, and that receipts and expenditures of the company are being made only in accordance with authorizations of management and directors of the company; and (3) provide reasonable assurance regarding prevention or timely detection of unauthorized acquisition, use, or disposition of the company's assets that could have a material effect on the financial statements.
Because of the inherent limitations of internal control over financial reporting, including the possibility of collusion or improper management override of controls, material misstatements due to error or fraud may not be prevented or detected on a timely basis. Also, projections of any evaluation of the effectiveness of the internal control over financial reporting to future periods are subject to the risk that the controls may become inadequate because of changes in conditions, or that the degree of compliance with the policies or procedures may deteriorate.
In our opinion, the Company maintained, in all material respects, effective internal control over financial reporting as of December 31, 2014,based on the criteria established in Internal Control — Integrated Framework (2013) issued by the Committee of Sponsoring Organizations of the Treadway Commission.
We have also audited, in accordance with the standards of the Public Company Accounting Oversight Board (United States), the consolidated financial statements as of and for the year ended December 31, 2014 of the Company and our report dated February 27, 2015 expressed an unqualified opinion on those financial statements.
/s/ DELOITTE & TOUCHE LLP
San Francisco, California
February 27, 2015
None.
59
PART III
Item 10. Directors, Executive Officers and Corporate Governance.
Information required by this item regarding directors and director nominees, executive officers, the board of directors and its committees, and certain corporate governance matters is incorporated by reference to the information set forth under the captions “Proposal No. 1—Election of Directors,” “Information Regarding Board of Directors and Corporate Governance” and “Executive Officers” in the definitive proxy statement for our 2015 Annual Meeting of Stockholders, or the 2015 Proxy Statement. Information required by this item regarding compliance with Section 16(a) of the Exchange Act is incorporated by reference to the information set forth under the caption “Section 16(a) Beneficial Ownership Reporting Compliance” in our 2015 Proxy Statement.
We have adopted a written code of business conduct and ethics that applies to all of our employees, officers and directors, including our principal executive officer, principal financial officer and principal accounting officer. The code of business conduct and ethics is available on our corporate website at www.yelp-ir.com under the section entitled “Corporate Governance”. If we make any substantive amendments to our code of business conduct and ethics or grant any of our directors or executive officers any waiver, including any implicit waiver, from a provision of our code of business conduct and ethics, we will disclose the nature of the amendment or waiver on our website or in a Current Report on Form 8-K.
Item 11. Executive Compensation.
Information required by this item regarding executive compensation is incorporated by reference to the information set forth under the captions “Executive Compensation,” “Director Compensation” and “Information Regarding the Board of Directors and Corporate Governance” in our 2015 Proxy Statement.
| Item 12. | Security Ownership of Certain Beneficial Owners and Management and Related Stockholder Matters. |
Information required by this item regarding security ownership of certain beneficial owners and management is incorporated by reference to the information set forth under the caption “Security Ownership of Certain Beneficial Owners and Management” in our 2015 Proxy Statement. Information required by this item regarding securities authorized for issuance under our equity compensation plans is incorporated by reference to the information set forth under the caption “Equity Compensation Plan Information” in our 2015 Proxy Statement.
Item 13. Certain Relationships and Related Transactions, and Director Independence.
Information required by this item regarding certain relationships and related transactions is incorporated by reference to the information set forth under the captions “Transactions with Related Persons” in our 2015 Proxy Statement. Information required by this item regarding director independence is incorporated by reference to the information set forth under the caption “Information Regarding the Board of Directors and Corporate Governance” in our 2015 Proxy Statement.
Item 14. Principal Accounting Fees and Services.
Information required by this item regarding principal accounting fees and services is incorporated by reference to the information set forth under the caption “Proposal No. 2—Ratification of Selection of Independent Registered Public Accounting Firm” in our 2015 Proxy Statement.
60
PART IV
Item 15. Exhibits, Financial Statement Schedules.
(a) The following documents are filed as part of this Annual Report:
| 1. |
Financial Statements. Our consolidated financial statements and the Report of Independent Registered Public Accounting Firm are included herein on the pages indicated: | ||||
| Report of Independent Registered Public Accounting Firm | F-1 | ||||
| Consolidated Balance Sheets | F-2 | ||||
| Consolidated Statements of Operations | F-3 | ||||
| Consolidated Statements of Comprehensive Income (Loss) | F-4 | ||||
| Consolidated Statements of Redeemable Convertible Preferred Stock and Stockholders’ Equity | F-5 | ||||
| (Deficit) | |||||
| Consolidated Statements of Cash Flows | F-6 | ||||
| Notes to Consolidated Financial Statements | F-7 | ||||
| 2. | Financial Statement Schedules. None. All financial statement schedules are omitted because they are not applicable, not required under the instructions, or the requested information is included in the consolidated financial statements or notes thereto. | ||||
| 3. | Exhibits. A list of exhibits filed with this report or incorporated herein by reference is found in the Exhibit Index immediately following the signature page of this Annual Report. | ||||
61
Pursuant to the requirements of Section 13 or 15(d) of the Securities Exchange Act of 1934, the registrant has duly caused this report to be signed on its behalf by the undersigned, thereunto duly authorized.
Date: February 27, 2015
| YELP INC. | ||
| /s/ Rob Krolik | ||
| Rob Krolik | ||
| Chief Financial Officer | ||
| (Principal Financial and Accounting Officer) | ||
POWER OF ATTORNEY
KNOW ALL PERSONS BY THESE PRESENTS, that each person whose signature appears below constitutes and appoints Rob Krolik and Laurence Wilson, and each of them, as his or her true and lawful attorneys-in-fact and agents, with full power of substitution for him or her, and in his or her name in any and all capacities, to sign any and all amendments to this Annual Report on Form 10-K, and to file the same, with exhibits thereto and other documents in connection therewith, with the U.S. Securities and Exchange Commission, granting unto said attorneys-in-fact and agents, and each of them, full power and authority to do and perform each and every act and thing requisite and necessary to be done therewith, as fully to all intents and purposes as he or she might or could do in person, hereby ratifying and confirming all that said attorneys-in-fact and agents, and either of them, his or her substitute or substitutes, may lawfully do or cause to be done by virtue hereof.
Pursuant to the requirements of the Securities Exchange Act of 1934, as amended, this report has been signed below by the following persons on behalf of the registrant and in the capacities and on the dates indicated.
| Signature | Title | Date | ||
| /s/ Jeremy Stoppelman | Chief Executive Officer and Director | February 27, 2015 | ||
| JEREMY STOPPELMAN | (Principal Executive Officer) | |||
| /s/ Geoff Donaker | Chief Operating Officer and Director | February 27, 2015 | ||
| GEOFF DONAKER | ||||
| /s/ Rob Krolik | Chief Financial Officer | February 27, 2015 | ||
| ROB KROLIK | (Principal Financial and Accounting Officer) | |||
| /s/ Max Levchin | Chairman | February 27, 2015 | ||
| MAX LEVCHIN | ||||
| /s/ Fred Anderson | Director | February 27, 2015 | ||
| FRED ANDERSON | ||||
| /s/ Peter Fenton | Director | February 27, 2015 | ||
| PETER FENTON | ||||
| /s/ Robert Gibbs | Director | February 27, 2015 | ||
| ROBERT GIBBS | ||||
| /s/ Diane Irvine | Director | February 27, 2015 | ||
| DIANE IRVINE | ||||
| /s/ Jeremy Levine | Director | February 27, 2015 | ||
| JEREMY LEVINE | ||||
| /s/ Mariam Naficy | Director | February 27, 2015 | ||
| MARIAM NAFICY | ||||
62
REPORT OF INDEPENDENT REGISTERED PUBLIC ACCOUNTING FIRM
To the Board of Directors and Stockholders of Yelp Inc.
San Francisco, California
We have audited the accompanying consolidated balance sheets of Yelp Inc. and subsidiaries (the “Company”) as of December 31, 2014 and 2013, and the related consolidated statements of operations, comprehensive income (loss), redeemable convertible preferred stock and stockholders’ equity (deficit), and cash flows for each of the three years in the period ended December 31, 2014. These consolidated financial statements are the responsibility of the Company’s management. Our responsibility is to express an opinion on these financial statements based on our audits.
We conducted our audits in accordance with the standards of the Public Company Accounting Oversight Board (United States). Those standards require that we plan and perform the audit to obtain reasonable assurance about whether the financial statements are free of material misstatement. An audit includes examining, on a test basis, evidence supporting the amounts and disclosures in the financial statements. An audit also includes assessing the accounting principles used and significant estimates made by management, as well as evaluating the overall financial statement presentation. We believe that our audits provide a reasonable basis for our opinion.
In our opinion, such financial statements present fairly, in all material respects, the consolidated financial position of Yelp Inc. and subsidiaries as of December 31, 2014 and 2013, and the results of their operations and their cash flows for each of the three years in the period ended December 31, 2014, in conformity with accounting principles generally accepted in the United States of America.
We have also audited, in accordance with the standards of the Public Company Accounting Oversight Board (United States), the Company's internal control over financial reporting as of December 31, 2014, based on the criteria established in Internal Control— Integrated Framework (2013) issued by the Committee of Sponsoring Organizations of the Treadway Commission and our report dated February 27, 2015 expressed an unqualified opinion on the Company's internal control over financial reporting.
/s/ DELOITTE & TOUCHE LLP
San Francisco, California
February 27, 2015
F-1
Yelp Inc.
CONSOLIDATED BALANCE
SHEETS
(In thousands, except share data)
| December 31, | |||||||
| 2014 | 2013 | ||||||
| Assets | |||||||
| Current assets: | |||||||
| Cash and cash equivalents | $ | 247,312 | $ | 389,764 | |||
| Short-term marketable securities | 118,498 | — | |||||
| Accounts receivable (net of allowance for doubtful accounts of $1,627 and $810 at December 31, | |||||||
| 2014 and 2013, respectively) | 35,593 | 21,317 | |||||
| Prepaid expenses and other current assets | 19,355 | 5,752 | |||||
| Total current assets | 420,758 | 416,833 | |||||
| Long-term marketable securities | 38,612 | — | |||||
| Property, equipment and software, net | 62,761 | 30,666 | |||||
| Goodwill | 67,307 | 59,690 | |||||
| Intangibles, net | 5,786 | 5,235 | |||||
| Restricted cash | 17,943 | 3,247 | |||||
| Other assets | 16,483 | 306 | |||||
| Total Assets | $ | 629,650 | $ | 515,977 | |||
| Liabilities and Stockholder’s Equity | |||||||
| Current liabilities: | |||||||
| Accounts payable | $ | 1,398 | $ | 3,364 | |||
| Accrued liabilities | 29,581 | 19,004 | |||||
| Deferred revenue | 2,994 | 2,621 | |||||
| Total current liabilities | 33,973 | 24,989 | |||||
| Long-term liabilities | 7,527 | 4,505 | |||||
| Total liabilities | 41,500 | 29,494 | |||||
| Commitments and contingencies (Note 11) | |||||||
| Stockholders’ Equity | |||||||
| Common stock, $0.000001 par value—500,000,000 shares authorized; 72,920,582 and 70,874,493 | |||||||
| shares issued and outstanding at December 31, 2014 and 2013, respectively | — | — | |||||
| Additional paid-in capital | 627,742 | 553,753 | |||||
| Accumulated other comprehensive income | (5,609 | ) | 3,186 | ||||
| Accumulated deficit | (33,983 | ) | (70,456 | ) | |||
| Total stockholders’ equity | 588,150 | 486,483 | |||||
| Total liabilities and stockholders’ equity | $ | 629,650 | $ | 515,977 | |||
See notes to consolidated financial statements.
F-2
Yelp Inc.
CONSOLIDATED STATEMENTS OF
OPERATIONS
(In thousands, except per share data)
| Year Ended December 31, | ||||||||||
| 2014 | 2013 | 2012 | ||||||||
| Net revenue | $ | 377,536 | $ | 232,988 | $ | 137,567 | ||||
| Costs and expenses: | ||||||||||
| Cost of revenue (exclusive of depreciation and amortization shown separately below) | 24,382 | 16,561 | 9,928 | |||||||
| Sales and marketing | 201,050 | 131,970 | 85,915 | |||||||
| Product development | 65,181 | 38,243 | 20,473 | |||||||
| General and administrative | 58,274 | 42,907 | 31,531 | |||||||
| Depreciation and amortization | 17,590 | 11,455 | 7,223 | |||||||
| Restructuring and integration | — | 675 | 1,262 | |||||||
| Total costs and expenses | 366,477 | 241,811 | 156,332 | |||||||
| Income (Loss) from operations | 11,059 | (8,823 | ) | (18,765 | ) | |||||
| Other income (expense), net | 221 | (407 | ) | (226 | ) | |||||
| Income (Loss) before income taxes | 11,280 | (9,230 | ) | (18,991 | ) | |||||
| Benefit (Provision) for income taxes | 25,193 | (838 | ) | (122 | ) | |||||
| Net income (loss) | 36,473 | (10,068 | ) | (19,113 | ) | |||||
| Accretion of redeemable convertible preferred stock | — | — | (32 | ) | ||||||
| Net income (loss) attributable to common stockholders (Class A and B) | $ | 36,473 | $ | (10,068 | ) | $ | (19,145 | ) | ||
| Net income (loss) per share attributable to common stockholders (Class A and B) | ||||||||||
| Basic | $ | 0.51 | $ | (0.15 | ) | $ | (0.35 | ) | ||
| Diluted | $ | 0.48 | $ | (0.15 | ) | $ | (0.35 | ) | ||
| Weighted-average shares used to compute net income (loss) per share attributable to | ||||||||||
| common stockholders (Class A and B) | ||||||||||
| Basic | 71,936 | 65,665 | 54,149 | |||||||
| Diluted | 76,712 | 65,665 | 54,149 | |||||||
See notes to consolidated financial statements.
F-3
Yelp Inc.
CONSOLIDATED STATEMENTS OF
COMPREHENSIVE INCOME (LOSS)
(In thousands)
| Year Ended December 31, | |||||||||||
| 2014 | 2013 | 2012 | |||||||||
| Net income (loss) | $ | 36,473 | $ | (10,068 | ) | $ | (19,113 | ) | |||
| Other comprehensive income (loss): | |||||||||||
| Foreign currency translation adjustments | (8,795 | ) | 2,381 | 534 | |||||||
| Other comprehensive income (loss) | (8,795 | ) | 2,381 | 534 | |||||||
| Comprehensive income (loss) | $ | 27,678 | $ | (7,687 | ) | $ | (18,579 | ) | |||
See notes to consolidated financial statements.
F-4
Yelp Inc.
CONSOLIDATED STATEMENTS OF
REDEEMABLE CONVERTIBLE PREFERRED STOCK AND STOCKHOLDERS’ EQUITY
(DEFICIT)
FOR THE YEARS ENDED DECEMBER 31, 2012, 2013 AND
2014
(In thousands, except shares)
| Redeemable | Accumulated | ||||||||||||||||||||||||||||
| Convertible | Additional | Other | Total | ||||||||||||||||||||||||||
| Preferred Stock | Common Stock | Paid-In | Comprehensive | Accumulated | Stockholders’ | ||||||||||||||||||||||||
| Shares | Amount | Shares | Amount | Capital | Income (Loss) | Deficit | Equity (Deficit) | ||||||||||||||||||||||
| Balance—December 31, 2011 | 143,267,115 | $ | 55,435 | 16,956,409 | $ | — | $ | 16,625 | $ | 271 | $ | (41,243 | ) | $ | (24,347 | ) | |||||||||||||
| Issuance of common stock upon | |||||||||||||||||||||||||||||
| exercises of employee stock | |||||||||||||||||||||||||||||
| options | — | — | 1,606,612 | — | 3,736 | — | — | 3,736 | |||||||||||||||||||||
| Issuance of restricted stock | — | — | 1,250 | — | — | — | — | — | |||||||||||||||||||||
| Stock-based compensation | — | — | — | — | 15,147 | — | — | 15,147 | |||||||||||||||||||||
| Accretion of redeemable convertible | |||||||||||||||||||||||||||||
| preferred stock | — | 32 | — | — | — | — | (32 | ) | (32 | ) | |||||||||||||||||||
| Conversion of preferred stock to | |||||||||||||||||||||||||||||
| common stock in connection with | |||||||||||||||||||||||||||||
| initial public offering | (143,267,115 | ) | (55,467 | ) | 35,816,772 | — | 55,466 | — | — | 55,466 | |||||||||||||||||||
| Issuance of common stock in | |||||||||||||||||||||||||||||
| connection with initial public | |||||||||||||||||||||||||||||
| offering, net of offering costs. | — | — | 8,172,500 | — | 111,350 | — | — | 111,350 | |||||||||||||||||||||
| Repurchase of common stock from | |||||||||||||||||||||||||||||
| employees | — | — | (17,193 | ) | (333 | ) | — | — | (333 | ) | |||||||||||||||||||
| Issuance of common stock in | |||||||||||||||||||||||||||||
| connection with acquisition of | |||||||||||||||||||||||||||||
| Qype GmbH | — | — | 968,919 | — | 23,254 | — | — | 23,254 | |||||||||||||||||||||
| Foreign currency translation | |||||||||||||||||||||||||||||
| adjustment | — | — | — | — | — | 534 | — | 534 | |||||||||||||||||||||
| Net loss | — | — | — | — | — | — | (19,113 | ) | (19,113 | ) | |||||||||||||||||||
| Balance—December 31, 2012 | — | — | 63,505,269 | — | 225,245 | 805 | (60,388 | ) | 165,662 | ||||||||||||||||||||
| Issuance of common stock upon | |||||||||||||||||||||||||||||
| exercises of employee stock | |||||||||||||||||||||||||||||
| options | — | — | 2,648,121 | — | 13,554 | — | — | 13,554 | |||||||||||||||||||||
| Issuance of common stock upon | |||||||||||||||||||||||||||||
| release of restricted stock units | |||||||||||||||||||||||||||||
| (RSUs) | — | — | 98,033 | — | — | — | — | — | |||||||||||||||||||||
| Issuance of common stock for | |||||||||||||||||||||||||||||
| employee stock purchase plan | — | — | 81,900 | — | 1,960 | — | — | 1,960 | |||||||||||||||||||||
| Stock-based compensation | — | — | — | — | 27,170 | — | — | 27,170 | |||||||||||||||||||||
| Issuance of common stock in | |||||||||||||||||||||||||||||
| connection with follow-on public | |||||||||||||||||||||||||||||
| offering, net of offering costs | — | — | 4,312,500 | — | 276,527 | — | — | 276,527 | |||||||||||||||||||||
| Repurchase of common stock from | |||||||||||||||||||||||||||||
| employees | — | — | (15,850 | ) | — | (674 | ) | — | — | (674 | ) | ||||||||||||||||||
| Issuance of common stock in | |||||||||||||||||||||||||||||
| connection with acquisition of | |||||||||||||||||||||||||||||
| SeatMe, Inc. | — | — | 244,520 | — | 9,666 | — | — | 9,666 | |||||||||||||||||||||
| Excess tax benefit from share-based | |||||||||||||||||||||||||||||
| award activity | — | — | — | — | 305 | — | — | 305 | |||||||||||||||||||||
| Foreign currency translation | |||||||||||||||||||||||||||||
| adjustment | — | — | — | — | — | 2,381 | — | 2,381 | |||||||||||||||||||||
| Net loss | — | — | — | — | — | — | (10,068 | ) | (10,068 | ) | |||||||||||||||||||
| Balance—December 31, 2013 | — | — | 70,874,493 | — | $ | 553,753 | 3,186 | (70,456 | ) | 486,483 | |||||||||||||||||||
| Issuance of common stock upon | |||||||||||||||||||||||||||||
| exercises of employee stock | |||||||||||||||||||||||||||||
| options | — | — | 1,679,654 | — | 20,164 | — | — | 20,164 | |||||||||||||||||||||
| Issuance of common stock upon | |||||||||||||||||||||||||||||
| release of restricted stock units | |||||||||||||||||||||||||||||
| (RSUs) | — | — | 90,656 | — | — | — | — | ||||||||||||||||||||||
| Issuance of common stock for | |||||||||||||||||||||||||||||
| employee stock purchase plan | — | — | 279,538 | — | 8,869 | — | — | 8,869 | |||||||||||||||||||||
| Stock-based compensation | — | — | — | — | 44,520 | — | — | 44,520 | |||||||||||||||||||||
| Repurchase of common stock from | |||||||||||||||||||||||||||||
| employees | — | — | (18,628 | ) | — | (1,318 | ) | — | — | (1,318 | ) | ||||||||||||||||||
| Issuance of common stock in | |||||||||||||||||||||||||||||
| connection with acquisition of | |||||||||||||||||||||||||||||
| SeatMe, Inc. | — | — | 14,869 | — | — | — | — | — | |||||||||||||||||||||
| Excess tax benefit from share-based | |||||||||||||||||||||||||||||
| award activity | — | — | — | — | 1,754 | — | — | 1,754 | |||||||||||||||||||||
| Foreign currency
translation adjustment |
— | — | — | — | — | (8,795 | ) | — | (8,795 | ) | |||||||||||||||||||
| Net income | — | — | — | — | — | 36,473 | 36,473 | ||||||||||||||||||||||
| Balance—December 31, 2014 | — | — | $ | 72,920,582 | $ | — | $ | 627,742 | $ | (5,609 | ) | $ | (33,983 | ) | $ | 588,150 | |||||||||||||
See notes to consolidated financial statements.
F-5
Yelp Inc.
CONSOLIDATED STATEMENTS OF
CASH FLOWS
(In thousands)
| Year Ended December 31, | |||||||||||
| 2014 | 2013 | 2012 | |||||||||
| OPERATING ACTIVITIES: | |||||||||||
| Net income (loss) | $ | 36,473 | $ | (10,068 | ) | $ | (19,113 | ) | |||
| Adjustments to reconcile net income (loss) to net cash provided by (used in) operating activities: | |||||||||||
| Depreciation and amortization | 17,590 | 11,455 | 7,223 | ||||||||
| Provision for doubtful accounts and sales returns | 7,238 | 3,304 | 1,913 | ||||||||
| Stock-based compensation | 42,273 | 26,677 | 14,878 | ||||||||
| Release of valuation allowance | (28,197 | ) | — | — | |||||||
| (Gain) loss on disposal of assets and web-site development costs | 4 | 159 | 64 | ||||||||
| Premium amortization, net, on securities held-to-maturity | 349 | — | — | ||||||||
| Excess tax benefit from share-based award activity | (1,834 | ) | (353 | ) | — | ||||||
| Changes in operating assets and liabilities: | |||||||||||
| Accounts receivable | (21,291 | ) | (12,843 | ) | (4,118 | ) | |||||
| Prepaid expenses and other assets | (4,011 | ) | (1,572 | ) | (2,552 | ) | |||||
| Accounts payable, accrued expenses and other liabilities | 8,927 | 4,971 | 2,049 | ||||||||
| Deferred revenue | 411 | (298 | ) | (443 | ) | ||||||
| Net cash provided by (used in) operating activities | 57,932 | 21,432 | (99 | ) | |||||||
| INVESTING ACTIVITIES: | |||||||||||
| Acquisitions, net of cash received | (14,340 | ) | (2,057 | ) | (24,125 | ) | |||||
| Purchases of property, equipment, and software | (29,054 | ) | (16,243 | ) | (7,524 | ) | |||||
| Capitalized website and software development costs | (11,349 | ) | (4,856 | ) | (2,930 | ) | |||||
| Change in restricted cash | (14,764 | ) | 3,176 | (6,013 | ) | ||||||
| Purchases of intangibles | (1,724 | ) | — | — | |||||||
| Proceeds from sale of property and equipment | 14 | — | — | ||||||||
| Goodwill measurement period adjustment | — | 1,153 | — | ||||||||
| Purchases of marketable securities | (210,459 | ) | — | — | |||||||
| Maturities of marketable securities | 53,002 | — | — | ||||||||
| Net cash used in investing activities | (228,674 | ) | (18,827 | ) | (40,592 | ) | |||||
| FINANCING ACTIVITIES: | |||||||||||
| Proceeds from initial public offering, net of underwriter fees | — | — | 114,006 | ||||||||
| Proceeds from follow-on offering, net of offering costs | — | 276,527 | — | ||||||||
| Payments for deferred offering costs | — | — | (2,200 | ) | |||||||
| Proceeds from issuance of common stock from share-based awards | 20,164 | 13,554 | 3,675 | ||||||||
| Proceeds from issuance of common stock for Employee Stock Purchase Plan | 8,869 | 1,960 | — | ||||||||
| Repurchase of common stock | (1,318 | ) | (674 | ) | — | ||||||
| Excess tax benefit from share-based award activity | 1,834 | 353 | — | ||||||||
| Repayment of acquired debt | — | — | (1,308 | ) | |||||||
| Net cash provided by financing activities | 29,549 | 291,720 | 114,173 | ||||||||
| EFFECT OF EXCHANGE RATE CHANGES ON CASH AND CASH EQUIVALENTS | (1,259 | ) | 315 | (94 | ) | ||||||
| CHANGE IN CASH AND CASH EQUIVALENTS | (142,452 | ) | 294,640 | 73,388 | |||||||
| CASH AND CASH EQUIVALENTS—Beginning of period | 389,764 | 95,124 | 21,736 | ||||||||
| CASH AND CASH EQUIVALENTS—End of period | $ | 247,312 | $ | 389,764 | $ | 95,124 | |||||
| SUPPLEMENTAL DISCLOSURES OF OTHER CASH FLOW INFORMATION: | |||||||||||
| Cash paid for income taxes | $ | 1,972 | $ | 291 | $ | 110 | |||||
| SUPPLEMENTAL DISCLOSURES OF NONCASH INVESTING AND FINANCING ACTIVITIES: | |||||||||||
| Purchases of property and equipment recorded in accounts payable and accruals | $ | 6,374 | $ | 2,685 | $ | 549 | |||||
| Capitalized website and software development costs recorded in accounts payable and accruals | $ | 169 | $ | 17 | $ | 4 | |||||
| Contingent consideration related to acquisitions | $ | 835 | $ | — | $ | — | |||||
| Accretion of redeemable convertible preferred stock | $ | — | $ | — | $ | 32 | |||||
| Vesting of early exercised options | $ | — | $ | — | $ | 61 | |||||
See notes to consolidated financial statements.
F-6
Yelp Inc.
NOTES TO CONSOLIDATED
FINANCIAL STATEMENTS
YEARS ENDED DECEMBER 31, 2014, 2013 AND 2012
1. ORGANIZATION AND DESCRIPTION OF BUSINESS
Yelp Inc. was incorporated in Delaware on September 3, 2004. Except where specifically noted or the context otherwise requires, the use of terms such as the “Company” and “Yelp” in these Notes to Consolidated Financial Statements refers to Yelp Inc. and its subsidiaries.
Yelp connects people with great local businesses by bringing “word of mouth” online and providing a platform for businesses and consumers to engage and transact. Yelp’s platform is transforming the way people discover local businesses; every day, millions of consumers visit its website or use its mobile app to find great local businesses to meet their everyday needs. Businesses of all sizes use the Yelp platform to engage with consumers at the critical moment when they are deciding where to spend their money.
The Company consists of Yelp Inc. and 18 wholly-owned entities. Yelp UK Ltd was incorporated on December 1, 2008, Yelp Canada Inc. was incorporated on February 24, 2009, Yelp Ireland Limited was incorporated on May 31, 2010, Yelp Deutschland GmbH was incorporated on June 7, 2010, Yelp Ireland Holding Company Limited was incorporated on June 16, 2010, Yelp France SAS was incorporated on July 8, 2010, Yelp Italia S.r.l. was incorporated on June 27, 2011, Yelp Australia Pty. Ltd was incorporated on August 9, 2011, Yelp Spain, S.L. was incorporated on May 4, 2012, Yelp Singapore PTE Ltd was incorporated on June 15, 2012, Yelp Brazil Serviços de Marketing Ltda. was incorporated on May 29, 2013, and Yelp Japan, G.K. was incorporated on September 20, 2013. Qype GmbH, Qype Ltd., Qype SARL and Qype SL (collectively, “Qype”) were acquired on October 23, 2012, SeatMe, Inc. was acquired on July 24, 2013 and Cityvox SAS (“Cityvox”) was acquired on October 27, 2014 (see Note 5). The financial results of these subsidiaries are included within the consolidated financial statements of the Company presented herein.
Basis of Presentation—The consolidated financial statements have been prepared in accordance with accounting principles generally accepted in the United States of America (“GAAP”). All intercompany balances and transactions have been eliminated in consolidation.
Certain Significant Risks and Uncertainties—The Company operates in a dynamic industry and, accordingly, can be affected by a variety of factors. For example, the Company’s management believes that changes in any of the following areas could have a significant negative effect on the Company in terms of its future financial position, results of operations or cash flows: rates of revenue growth; traffic to the Company’s websites and mobile applications and the number of reviews and advertisers they attract; reliance on search engines and the placement and prominence in results rankings; the quality and reliability of reviews; scaling and adaptation of existing technology and network infrastructure; management of the Company’s growth; new markets and international expansion; protection of the Company’s brand, reputation and intellectual property; competition in the Company’s market; qualified employees and key personnel; intellectual property infringement and other claims; and changes in government regulation affecting the Company’s business, among other things.
2. SUMMARY OF SIGNIFICANT ACCOUNTING POLICIES
Use of Estimates—The preparation of the Company’s consolidated financial statements in conformity with GAAP requires management to make estimates and assumptions that affect the reported amounts of assets and liabilities and disclosure of contingent assets and liabilities at the date of the consolidated financial statements and the reported amounts of income and expenses during the reporting period. These estimates are based on information available as of the date of the consolidated financial statements; therefore, actual results could differ from management’s estimates.
F-7
Foreign Currency Translation—The consolidated financial statements of the Company’s foreign subsidiaries are measured using the local currency as the functional currency. Assets and liabilities of foreign subsidiaries are translated at exchange rates in effect as of the balance sheet date. Revenues and expenses are translated at average exchanges rates in effect during the year. Translation adjustments are recorded within accumulated other comprehensive loss, a separate component of stockholders’ equity (deficit).
Cash and Cash Equivalents—The Company considers all highly liquid investments, such as treasury bills, commercial paper, certificates of deposit and money market instruments with maturities of three months or less at the time of acquisition to be cash equivalents. Cash and cash equivalents primarily consist of amounts held in interest-bearing money market funds that were readily convertible to cash. The fair value of cash and cash equivalents approximates their carrying value.
Marketable Securities—The Company determines the classification of its marketable securities at the time of purchase and re-evaluates these determinations at each balance sheet date. Debt securities are classified as held-to-maturity when the Company has the positive intent and ability to hold the securities to maturity. Held-to-maturity securities are stated at amortized cost and are periodically assessed for other-than-temporary impairment. Amortized cost of debt securities is adjusted for amortization of premiums and accretion of discounts to maturity, and is included in interest income. Held-to-maturity securities with less than one year to maturity are included in short-term marketable securities. All other held-to-maturity securities are classified as long-term.
Concentrations of Credit Risk—Financial instruments that potentially subject the Company to concentration of credit risk consist primarily of cash and cash equivalents and accounts receivable. The Company places its cash and cash equivalents with major financial institutions, which management assesses to be of high credit quality, in order to limit the exposure of each investment.
Credit risk with respect to accounts receivable is dispersed due to the large number of customers. In addition, the Company’s credit risk is mitigated by the relatively short collection period. Collateral is not required for accounts receivable. The Company maintains an allowance for doubtful accounts receivable balances. The allowance is based upon historical loss patterns, the number of days that billings are past due and an evaluation of the potential risk of loss associated with delinquent accounts. When new information becomes available to indicate that the estimate provided as the allowance was incorrect, an adjustment, which is considered a change in estimate, is made. The fair value of accounts receivable approximates their carrying value.
As of December 31, 2014 and 2013, there were no customers that accounted for more than 10% of total accounts receivable.
The following table presents the changes in the allowance for doubtful accounts (in thousands):
| Year Ended December 31, | |||||||||||
| 2014 | 2013 | 2012 | |||||||||
| Allowance for doubtful accounts: | |||||||||||
| Balance, beginning of period | $ | 810 | $ | 384 | $ | 210 | |||||
| Add: bad debt expense | 6,369 | 3,210 | 1,913 | ||||||||
| Less: write-offs, net of recoveries | (5,552 | ) | (2,784 | ) | (1,739 | ) | |||||
| Balance, end of period | $ | 1,627 | $ | 810 | $ | 384 | |||||
Property, Equipment and Software—Property, equipment and software are stated at cost less accumulated depreciation and amortization. Depreciation is computed using the straight-line method over the estimated useful lives of the assets, which are approximately three to five years. Leasehold improvements are amortized over the lease term.
Website and Internal-Use Software Development Costs—Costs related to website and internal-use software are primarily related to the Company’s website, including support systems. The Company capitalizes its costs to develop software when preliminary development efforts are successfully completed, management has authorized and committed project funding and it is probable that the project will be completed and the software will be used as intended. Such costs are amortized on a straight-line basis over the estimated useful life of the related asset, which approximates three years. Costs incurred prior to meeting these criteria, together with costs incurred for training and maintenance, are expensed as incurred. Costs incurred for enhancements that are expected to result in additional material functionality are capitalized and amortized over the estimated useful life of the upgrades.
F-8
The Company capitalized $13.9 million, $5.4 million and $3.2 million in website and internal-use software costs during the years ended December 31, 2014, 2013 and 2012, respectively, which are included in property, equipment and software, net on the consolidated balance sheets. Amortization expense related to website and internal-use software was $4.6 million, $2.6 million and $1.9 million for the years ended December 31, 2014, 2013 and 2012, respectively.
The Company wrote off an immaterial amount, $0.1 million and $0.2 million of website and internal-use software costs during the years ended December 31, 2014, 2013 and 2012, respectively. The retirements were related to obsolete projects no longer supported by the Company. The loss on disposition of the projects has been included in depreciation and amortization expense in the Company’s consolidated statements of operations.
Business Combinations—The Company accounts for acquisitions of entities that include inputs and processes and have the ability to create outputs as business combinations. The Company allocates the purchase price of the acquisition to the tangible assets, liabilities and identifiable intangible assets acquired based on their estimated fair values. The excess of the purchase price over those fair values is recorded as goodwill. Acquisition-related expenses and integration costs are expensed as incurred. During the measurement period, the Company records adjustments to the assets acquired and liabilities assumed with the corresponding offset to goodwill. After the measurement period, which could be up to one year after the transaction date, subsequent adjustments are recorded to the Company’s consolidated statements of operations.
Goodwill—Goodwill represents the excess of the purchase price in a business combination over the fair value of net tangible and intangible assets acquired. The carrying amount of goodwill is reviewed at least annually or more frequently if events or changes in circumstances indicate that the carrying value of goodwill may not be recoverable. We have the option to first assess qualitative factors to determine whether it is more likely than not that the fair value of our single reporting operating unit is less than its carrying amount as a basis for determining whether it is necessary to perform the two-step goodwill impairment under the authoritative guidance issued by the Financial Accounting Standards Board (“FASB”). If we determine that it is more likely than not that its fair value is less than its carrying amount, or opt to not perform a qualitative assessment, then the two-step goodwill impairment test will be performed. The first step, identifying a potential impairment, compares the fair value of the reporting unit with its carrying amount. If the carrying amount exceeds its fair value, the second step will be performed; otherwise, no further step is required. The second step, measuring the impairment loss, compares the implied fair value of the goodwill with the carrying amount of the goodwill. Any excess of the goodwill carrying amount over the applied fair value is recognized as an impairment loss, and the carrying value of goodwill is written down to fair value. No impairment charges have been recorded to date.
Intangible Assets—Intangible assets include acquired intangible assets identified through business combinations, which are carried at fair value less accumulated amortization, and purchased intangible assets, which are carried at cost less accumulated amortization. Amortization is recorded over the estimated useful lives of the assets, generally 24 to 84 months. The Company reviews amortizable intangible assets to be held and used for impairment whenever events or changes in circumstance indicate that the carrying value of the assets may not be recoverable. Determination of recoverability is based on the lowest level of identifiable estimated undiscounted cash flows resulting from the use of the asset and its eventual disposition. Measurement of any impairment loss is based on the excess of the carrying value of the asset over its fair value. No impairment charges have been recorded to date.
Impairment of Long-Lived Assets and Long-Lived Assets to be Disposed of—The Company evaluates its long-lived assets for impairment whenever events or changes in circumstances indicate that the carrying amount of such assets may not be recoverable. Recoverability of assets to be held and used is measured by a comparison of the carrying amount of an asset to future undiscounted net cash flows expected to be generated by the asset. If such assets are considered to be impaired, the impairment to be recognized is measured as the amount by which the carrying amount of the assets exceeds the fair value of the assets. Assets to be disposed of are reported at the lower of the carrying amount or fair value less costs to sell.
F-9
Revenue Recognition—The Company generates revenue from local advertising, brand advertising and other services. The Company recognizes revenue when all of the following conditions are met: there is persuasive evidence of an arrangement, service has been provided to the customer, collection of the fees is reasonably assured and the amount of fees to be paid by the customer are fixed or determinable. Payments received in advance of services being rendered are recorded as deferred revenue and recognized over the requisite service period.
Local Advertising—Local advertising revenue is generated primarily through fixed monthly fee advertising plans with local businesses for advertising placements on the Company’s website and mobile app. Revenue is recognized ratably over the service period, net of customer discounts. The arrangements are evidenced by written and/or electronic acceptance of the Company’s agreement that stipulates the volume of advertising to be delivered and the pricing.
Brand Advertising—The Company generates brand advertising revenue through the sale of display advertisements (both graphic and text) on its website, including advertisements from leading national brands in the food and restaurant, automobile, financial services, logistics, consumer goods and health and fitness industries. The Company recognizes revenue from the sale of impression-based advertisements on its online network in the period in which the advertisements (“impressions”) are delivered, net of customer discounts. The Company also has brand revenue from fixed-price brand sponsorships that are recognized ratably over the service period. The arrangements are evidenced by insertion orders or contracts that stipulate the types of advertising to be delivered and the pricing.
Other Services—Other service revenue includes the sale of vouchers through the Company’s “Yelp Deals” and “Gift Certificates,” revenue-sharing partner arrangements, partner reseller arrangements and the monetization of remnant advertising inventory through third-party ad networks. Yelp Deals allow merchants to promote themselves and offer discounted goods and services on a real-time basis to consumers directly on the Company’s website and mobile app and, until the quarter ended December 31, 2011, via email. The Company earns a fee on Yelp Deals for acting as an agent in these transactions, which are recorded on a net basis and included in revenue upon sale of the deal. The Company records a sales allowance for potential Yelp Deal refunds based on the Company’s estimate of future refunds. Gift Certificates allow merchants to sell full-priced gift certificates directly to customers through their business profile page. The Company earns a fee based on the amount of the Gift Certificate sold, which it records on a net basis and include in revenue upon a consumer’s purchase of the Gift Certificate. Revenue-sharing partner arrangements provide consumers with the ability to complete food delivery transactions and make online reservations through third parties directly on Yelp. The Company also generates revenue through fixed-fee reseller agreements that allow partners to sell Yelp Branded Profiles to their clients and transaction-based arrangements allowing third-party data providers to update business listing information on behalf of businesses.
Multiple-Element Arrangements. The Company enters into arrangements with customers to sell advertising packages that include different media placements or ad services that are delivered at the same time, or within close proximity of one another.
The Company allocates arrangement consideration in multiple-deliverable revenue arrangements at the inception of an arrangement to all deliverables or those packages in which all components of the package are delivered at the same time, based on the relative selling price method in accordance with the selling price hierarchy, which includes: (1) vendor-specific objective evidence (“VSOE”) if available; (2) third-party evidence (“TPE”) if VSOE is not available; and (3) best estimate of selling price (“BESP”) if neither VSOE nor TPE is available.
VSOE. The Company determines VSOE based on its historical pricing and discounting practices for the specific product or service when sold separately. In determining VSOE, the Company requires that a substantial majority of the standalone selling prices for these services fall within a reasonably narrow pricing range. The Company has not historically sold a large volume of transactions on a standalone basis. As a result, the Company has not been able to establish VSOE for any of its advertising products.
F-10
TPE. When VSOE cannot be established for deliverables in multiple element arrangements, the Company applies judgment with respect to whether it can establish a selling price based on TPE. TPE is determined based on competitor prices for similar deliverables when sold separately. Generally, the Company’s go-to-market strategy differs from that of its peers and its offerings contain a significant level of differentiation such that the comparable pricing of services cannot be obtained. Furthermore, the Company is unable to reliably determine what similar competitor services’ selling prices are on a standalone basis. As a result, the Company has not been able to establish selling price based on TPE.
BESP. When it is unable to establish selling price using VSOE or TPE, the Company uses BESP in its allocation of arrangement consideration. The objective of BESP is to determine the price at which the Company would transact a sale if the service were sold on a standalone basis. BESP is generally used to allocate the selling price to deliverables in the Company’s multiple element arrangements. The Company determines BESP for deliverables by considering multiple factors including, but not limited to, prices it charges for similar offerings, market conditions, competitive landscape and pricing practices. The Company limits the amount of allocable arrangement consideration to amounts that are fixed or determinable and that are not contingent on future performance or future deliverables. The Company will regularly review BESP. Changes in assumptions or judgments or changes to the elements in the arrangement could cause a material increase or decrease in the amount of revenue that the Company reports in a particular period.
The Company recognizes the relative fair value of the media placements or ad services as they are delivered assuming all other revenue recognition criteria are met.
Cost of Revenue—The Company’s cost of revenue primarily consists of credit card processing fees, web hosting, Internet service costs and salaries, benefits and stock-based compensation for its infrastructure teams related to operating the Company’s website as well as creative design for brand advertising and video production expenses.
Stock-Based Compensation—We account for share-based employee compensation plans under the fair value recognition and measurement provisions in accordance with applicable accounting standards, which require all share-based payments to employees, including grants of stock options, restricted stock awards (“RSAs”), restricted stock units (“RSUs”) and our 2012 Employee Stock Purchase Plan (“ESPP”) to be measured based on the grant-date fair value of the awards.
Share-based compensation expense is recorded net of estimated forfeitures in the Company’s consolidated statements of income and, accordingly, is recorded for only those share-based awards that the Company expects to vest. The Company estimates the forfeiture rate based on historical forfeitures of equity awards and adjusts the rate to reflect changes in facts and circumstances, if any. The Company will revise its estimated forfeiture rate if actual forfeitures differ from its initial estimates.
Advertising Expenses—Advertising expenses are expensed as incurred. Total advertising expenses incurred were $8.1 million, $1.3 million and $0.7 million for the years ended December 31, 2014, 2013 and 2012, respectively.
Comprehensive income (loss)—The Company reports by major components and, as a single total, the change in its net assets during the period from non-owner sources. Comprehensive income (loss) consists of net income (loss) and accumulated other comprehensive income (loss), which includes certain changes in equity that are excluded from net income (loss). Specifically, it includes foreign currency translation adjustments.
Income Taxes—The Company records income taxes using the asset and liability method, which requires the recognition of deferred tax assets and liabilities for the expected future tax consequences of events that have been recognized in the Company’s financial statements or tax returns. In estimating future tax consequences, generally all expected future events other than enactments or changes in the tax law or rates are considered. Valuation allowances are provided to reduce deferred tax assets to the amount that is more likely than not to be realized.
F-11
The Company operates in various tax jurisdictions and is subject to audit by various tax authorities. The Company provides for tax contingencies whenever it is deemed probable that a tax asset has been impaired or a tax liability has been incurred for events such as tax claims or changes in tax laws. Tax contingencies are based upon their technical merits, relative tax law and the specific facts and circumstances as of each reporting period. Changes in facts and circumstances could result in material changes to the amounts recorded for such tax contingencies.
The Company recognizes the tax benefit from an uncertain tax position only if it is more likely than not that the tax position will be sustained on examination by the taxing authorities based on the technical merits of the position. The tax benefits recognized in the financial statements from such a position are then measured based on the largest benefit that has a greater than 50% likelihood of being realized upon ultimate settlement.
Stock Split—On January 25, 2012, the Company’s board of directors approved a 1-for-4 reverse stock split of the Company’s common stock. The reverse stock split became effective on February 2, 2012. Upon the effectiveness of the reverse stock split, (i) every four shares of outstanding common stock was decreased to one share of common stock, (ii) the number of shares of common stock into which each outstanding warrant or option to purchase common stock is exercisable was proportionally decreased on a 1-for-4 basis, (iii) the exercise price of each outstanding warrant or option to purchase common stock was proportionately increased on a 1-for-4 basis and (iv) the conversion ratio for each share of preferred stock outstanding was proportionately reduced on a 1-for-4 basis. All of the share numbers, share prices and exercise prices have been adjusted within these financial statements, on a retroactive basis, to reflect this 1-for-4 reverse stock split.
Employee Benefit Plan—The Company sponsors a qualified 401(k) defined contribution plan covering eligible employees. Participants may contribute a portion of their annual compensation limited to a maximum annual amount set by the Internal Revenue Service. Employer contributions under this plan were $1.9 million, zero and zero for the years ended December 31, 2014, 2013 and 2012, respectively.
Recent Accounting Pronouncements Not Yet Effective—In May 2014, FASB issued Accounting Standards Update 2014-09, “Revenue from Contracts with Customers” (“ASU 2014-09”), which amended the existing accounting standards for revenue recognition. ASU 2014-09 establishes principles for recognizing revenue upon the transfer of promised goods or services to customers, in an amount that reflects the consideration expected to be received in exchange for those goods or services. The updated standard will replace most existing GAAP revenue recognition guidance when it becomes effective, and permits the use of either the retrospective or cumulative effect transition method. Early adoption of this accounting standard is not permitted. ASU 2014-09 will become effective for the Company in the first quarter of the year ending December 31, 2017. The Company has not yet selected a transition method and is currently evaluating the effect that ASU 2014-09 will have on its consolidated financial statements and related disclosures.
In August 2014, FASB issued Accounting Standards Update 2014-15, “Presentation of Financial Statements — Going Concern (Subtopic 205-40).” The new guidance addresses management’s responsibility to evaluate whether there is substantial doubt about an entity’s ability to continue as a going concern and to provide related footnote disclosures. Management’s evaluation should be based on relevant conditions and events that are known and reasonably knowable at the date that the financial statements are issued. The standard will be effective for the first interim period within annual reporting periods beginning after December 15, 2016. Early adoption is permitted. The Company does not expect to early adopt this guidance and does not believe that the adoption of this guidance will have a material impact on its consolidated financial statements.
3. FAIR VALUE OF FINANCIAL INSTRUMENTS
The Company’s investments in money market accounts are recorded at fair value in the consolidated financial statements. All other financial instruments are classified as held-to-maturity investments and accordingly are recorded at amortized cost; however, the Company is required to determine the fair value of these investments on a recurring basis to identify any potential impairment. The accounting guidance for fair value measurements prioritizes the inputs used in measuring fair value in the following hierarchy:
Level 1—Observable inputs, such as quoted prices in active markets,
Level 2—Inputs other than the quoted prices in active markets that are observable either directly or indirectly, or
Level 3—Unobservable inputs in which there is little or no market data, which requires the Company to develop its own assumptions.
F-12
This hierarchy requires the Company to use observable market data, when available, and to minimize the use of unobservable inputs when determining fair value. The Company’s money market funds and U.S. government bonds are classified within Level 1 of the fair value hierarchy because they are valued using quoted prices in active markets. The Company’s commercial paper, corporate bonds and agency bonds are classified within Level 2 of the fair value hierarchy because they have been valued using inputs other than quoted prices in active markets that are observable directly or indirectly.
The Company classifies the contingent consideration liability, related to the acquisition of Restaurant Kritik, within Level 3, because it was estimated using a discounted cash flow technique with significant inputs that are not observable in the market. The significant inputs not observable in the market in the Level 3 measurement included our probability assessments of completion, appropriately discounted considering the uncertainties associated with the obligation, and were calculated in accordance with the terms of the asset purchase agreement. Refer to Note 5 regarding the effects of the acquisition on the Company’s consolidated financial statements.
The following table represents the Company’s financial instruments measured at fair value as of December 31, 2014 and 2013 (in thousands):
| December 31, 2014 | December 31, 2013 | |||||||||||||||||||||||
| Level 1 | Level 2 | Level 3 | Total | Level 1 | Level 2 | Level 3 | Total | |||||||||||||||||
| Cash Equivalents: | ||||||||||||||||||||||||
| Money market funds | $ | 208,593 | $ | — | $ | — | $ | 208,593 | $ | 360,690 | $ | — | $ | — | $ | 360,690 | ||||||||
| Marketable Securities: | ||||||||||||||||||||||||
| U.S. government bonds | 5,005 | — | — | 5,005 | — | — | — | — | ||||||||||||||||
| Commercial paper | — | 31,965 | — | 31,965 | — | — | — | — | ||||||||||||||||
| Corporate bonds | — | 29,486 | — | 29,486 | — | — | — | — | ||||||||||||||||
| Agency bonds | — | 90,575 | — | 90,575 | — | — | — | — | ||||||||||||||||
| Total cash equivalents and | ||||||||||||||||||||||||
| marketable securities | $ | 213,598 | $ | 152,026 | $ | — | $ | 365,624 | $ | 360,690 | $ | — | $ | — | $ | 360,690 | ||||||||
| Current liabilities: | ||||||||||||||||||||||||
| Contingent consideration liability | $ | — | $ | — | $ | 835 | $ | 835 | $ | — | $ | — | $ | — | $ | — | ||||||||
4. MARKETABLE SECURITIES
The amortized cost, gross unrealized gains and losses, and fair value of securities held-to-maturity, all of which mature within two years, as of December 31, 2014 are as follows (in thousands):
| As of December 31, 2014 | |||||||||||||
| Gross | Gross | ||||||||||||
| Unrealized | Unrealized | ||||||||||||
| Amortized Cost | Gains | Losses | Fair Value | ||||||||||
| Short-term marketable | |||||||||||||
| securities: | |||||||||||||
| Commercial paper | $ | 31,964 | $ | — | $ | — | $ | 31,964 | |||||
| Corporate bonds | 24,397 | 1 | (31 | ) | 24,367 | ||||||||
| Agency bonds | 57,130 | 1 | (26 | ) | 57,105 | ||||||||
| U.S. government bonds | 5,007 | — | (2 | ) | 5,005 | ||||||||
| $ | 118,498 | $ | 2 | $ | (59 | ) | $ | 118,441 | |||||
| Long-term marketable | |||||||||||||
| securities: | |||||||||||||
| Corporate bonds | $ | 5,120 | $ | — | $ | (1 | ) | $ | 5,119 | ||||
| Agency bonds | 33,492 | — | (22 | ) | 33,470 | ||||||||
| $ | 38,612 | $ | — | $ | (23 | ) | $ | 38,589 | |||||
| Total marketable securities | $ | 157,111 | $ | 2 | $ | (82 | ) | $ | 157,031 | ||||
F-13
The following table presents gross unrealized losses and fair values for those securities that were in an unrealized loss position as of December 31, 2014, aggregated by investment category and the length of time that the individual securities have been in a continuous loss position (in thousands):
| As of December 31, 2014 | ||||||||||||||||||||
| Less Than 12 Months | 12 Months or Greater | Total | ||||||||||||||||||
| Fair Value | Unrealized Loss | Fair Value | Unrealized Loss | Fair Value | Unrealized Loss | |||||||||||||||
| Corporate bonds | $ | 24,439 | $ | (32 | ) | $ | — | $ | — | $ | 24,439 | $ | (32 | ) | ||||||
| Agency bonds | 79,564 | (48 | ) | — | — | 79,564 | (48 | ) | ||||||||||||
| U.S. government bonds | 5,005 | (2 | ) | — | — | 5,005 | (2 | ) | ||||||||||||
| Total | $ | 109,008 | $ | (82 | ) | $ | — | $ | — | $ | 109,008 | $ | (82 | ) | ||||||
The Company periodically reviews its investment portfolio for other-than-temporary impairment. The Company considers such factors as the duration, severity and reason for the decline in value, and the potential recovery period. The Company also considers whether it is more likely than not that it will be required to sell the securities before recovery of their amortized cost basis, and whether the amortized cost basis cannot be recovered as a result of credit losses. During the three months and year ended December 31, 2014, the Company did not recognize any other-than-temporary impairment loss. The Company had no investments in marketable securities outside of money market funds prior to April 1, 2014.
5. ACQUISITIONS
2014 Acquisitions
In 2014, the Company, through its wholly-owned subsidiary, Yelp Ireland Ltd., completed the acquisition of all the outstanding equity interests in Cityvox SAS. The Company, through its wholly-owned subsidiaries Yelp Ireland Ltd. and Qype GmbH, also acquired the assets comprising the business conducted under the name Restaurant Kritik (“Restaurant Kritik”) from Kabukiman Ltd. The aggregate purchase price of these businesses was $15.3 million, net of $0.1 million cash acquired; the purchase price did not include stock in either transaction. Each of these acquisitions has been accounted for as a business combination in accordance with Accounting Standards Codification Topic 805, “Business Combinations” (“ASC 805”), under the acquisition method. Accordingly, the aggregate purchase price is allocated to the tangible and intangible assets acquired and the liabilities assumed based on their respective fair values on the acquisition dates, and is subject to adjustment based on purchase price adjustment provisions contained in the acquisition agreements. The results of operations of the acquired companies have been included in the Company’s consolidated financial statements from the respective acquisition dates. Net revenues, earnings since the acquisition and pro forma results of operations for these acquisitions have not been presented because they are not material to the consolidated results of operations, either individually or in aggregate. During the quarter ended December 31, 2014, the Company recorded acquisition-related transaction costs of $0.6 million, which were included in general and administrative expense.
Under the Restaurant Kritik asset purchase agreement, the Company agreed to pay an additional $0.9 million in consideration if the migration of Restaurant Kritik's content to Yelp is completed within one year of the acquisition date. The estimated fair value of the contingent consideration was approximately $0.8 million as of the acquisition date and is included in current liabilities on our consolidated balance sheet.
F-14
The following table presents the aggregate purchase price allocations recorded in the Company's consolidated balance sheets as of the acquisition dates (in thousands):
| Net tangible assets | $ | (277 | ) |
| Goodwill | 13,995 | ||
| Intangible assets | 1,546 | ||
| Total purchase price (excluding contingent consideration) | 15,264 | ||
| Contingent consideration | 826 | ||
| Total purchase price | $ | 16,090 |
Estimated useful lives as of the acquisition dates of the intangible assets acquired are shown below:
| Intangible Type | Useful Life |
| Content | 5 years |
| Developed technology | 0.5 years |
| Trade name | 2 years |
| Weighted average | 4.3 years |
The intangible assets are being amortized on a straight-line basis, which reflects the pattern in which the economic benefits of the intangible assets are being utilized. The goodwill represents the excess value over both tangible and intangible assets acquired. The goodwill in these transactions is primarily attributable to traffic and the opportunity for expansion. None of the goodwill is expected to be deductible for tax purposes.
2013 Acquisition
On July 24, 2013, the Company acquired SeatMe, Inc. (“SeatMe”). In connection with the acquisition, all of the outstanding capital stock and options to purchase capital stock of SeatMe were converted into the right to receive an aggregate of approximately $2.2 million in cash and 260,901 shares of Yelp Class A common stock with an aggregate fair value of approximately $9.7 million, as determined on the basis of the closing market price of the Company’s Class A common stock on the acquisition date. Of the total consideration paid in connection with the acquisition, $0.1 million in cash and 31,236 shares of Yelp Class A common stock were initially held in escrow to secure indemnification obligations. The key factor underlying the acquisition was securing the technology to provide online reservations directly through the Company’s website with minimal product and engineering work.
F-15
The acquisition was accounted for as a business combination in accordance with ASC 805, with the results of SeatMe’s operations included in the consolidated financial statements starting on July 24, 2013. The following table summarizes the consideration paid for SeatMe and the allocation of the purchase price, based on the estimated fair value of the assets acquired and liabilities assumed at the acquisition date (in thousands):
| July 24, 2013 | ||
| Fair value of purchase consideration: | ||
| Cash: | ||
| Distributed to SeatMe equity holders | $ | 2,057 |
| Held in escrow account | 56 | |
| Class A common stock: | ||
| Distributed to SeatMe equity holders | 8,420 | |
| Held in escrow account | 1,246 | |
| Total purchase consideration | $ | 11,779 |
| Fair value of net assets acquired: | ||
| Cash and cash equivalents | $ | 56 |
| Property and equipment | 47 | |
| Intangibles | 1,440 | |
| Goodwill | 10,279 | |
| Other assets | 117 | |
| Total assets acquired | 11,939 | |
| Total liabilities assumed | 160 | |
| Net assets acquired | $ | 11,779 |
Estimated useful lives as of the acquisition date of the intangible assets acquired are shown below:
| Intangible Type | Useful Life |
| Developed technology | 6 years |
| Customer relationships | 2 years |
| Trade name | 2 years |
| Weighted average | 5.6 years |
The intangible assets are being amortized on a straight-line basis, which reflects the pattern in which the economic benefits of the intangible assets are being utilized. The goodwill results from the Company’s opportunity to offer its customers and leverage the SeatMe web- and app-based reservation solution. None of the goodwill is deductible for tax purposes.
For the year ended December 31, 2013, the Company recorded acquisition-related transaction costs of approximately $0.2 million, which were included in general and administrative expense in the accompanying consolidated statement of operations. Net revenues, earnings since the acquisition and pro forma results of operations for this acquisition have not been presented because they are not material to the consolidated results of operations, either individually or in aggregate.
2012 Acquisition
On October 23, 2012, the Company, through Yelp Ireland Ltd., completed the acquisition of all the outstanding equity interests of Qype for approximately $24.3 million in cash and Yelp Class A common stock with an approximate fair value of $23.3 million. Of the total consideration paid in connection with the acquisition, $10.3 million is held in the form of cash in escrow to secure indemnification obligations. The balance remaining in the escrow fund relating to this acquisition was approximately $7.5 million as of December 31, 2014.
F-16
The acquisition was accounted for as a business combination in accordance with ASC 805, with the results of Qype’s operations included in the consolidated financial statements starting on October 23, 2012. The key factors underlying the acquisition were to secure an established European market presence, obtain Qype’s content and traffic and the opportunity for expansion. The following table summarizes the consideration paid for Qype and the allocation of the purchase price, based on the estimated fair value of the assets acquired and liabilities assumed at the acquisition date (in thousands):
| October 23, 2012 | ||
| Fair value of purchase consideration: | ||
| Cash consideration | $ | 14,020 |
| Cash in escrow account | 10,276 | |
| Fair value of Class A common stock | 23,254 | |
| Total purchase consideration | $ | 47,550 |
| Fair value of net assets acquired: | ||
| Cash | $ | 172 |
| Accounts receivable | 1,237 | |
| Other current assets | 1,239 | |
| Property and equipment | 233 | |
| Intangibles | 6,134 | |
| Goodwill | 48,056 | |
| Total assets acquired | 57,071 | |
| Accounts payable | 2,169 | |
| Accrued liabilities | 4,858 | |
| Deferred revenue | 1,190 | |
| Debt | 1,304 | |
| Total liabilities assumed | 9,521 | |
| Net assets acquired | $ | 47,550 |
The fair value of the 968,919 shares of Class A common stock issued as part of the consideration paid for Qype was determined on the basis of the closing market price of the Company’s Class A common stock on the acquisition date.
Estimated useful lives as of the acquisition date of the intangible assets acquired are shown below:
| Intangible Type | Useful Life |
| Content | 5 years |
| Advertiser relationships | 2 years |
| Developed technology | 2 years |
| Trade name | 2 years |
| Weighted average | 3.6 years |
The intangible assets are being amortized on a straight-line basis, which reflects the pattern in which the economic benefits of the intangible assets are being utilized. The goodwill results from the Company’s opportunity to expand its geographic footprint in Europe, the future revenue opportunities that the Company expects to achieve from leveraging Qype’s content to attract more traffic and users to its website and ultimately to acquire more advertisers. None of the goodwill is deductible for tax purposes.
For the year ended December 31, 2012, the Company recorded acquisition-related transaction costs of approximately $1.0 million, which were included in general and administrative expense in the accompanying consolidated statement of operations.
Refer to Note 14 regarding the tax effect of the acquisition on the Company’s consolidated financial statements.
F-17
The unaudited pro forma financial information in the table below summarizes the combined results of operations for the Company and Qype, and includes the accounting effects resulting from the acquisition, including transaction, restructuring and integration costs, amortization charges from acquired intangible assets, and changes in depreciation due to differing asset values and depreciation lives as though the companies were combined as of January 1, 2012. The unaudited pro forma financial information, as presented below, is for informational purposes only and is not necessarily indicative of the results of operations that would have been achieved if the acquisition had taken place as of January 1, 2012 (in thousands, except per share data):
| Pro Forma for the | |||
| Year Ended | |||
| December 31, | |||
| 2012 | |||
| Revenue | $ | 146,265 | |
| Net income (loss) | (23,186 | ) | |
| Basic and diluted net loss per share attributable to common stockholders | $ | (0.42 | ) |
In October 2012, following the acquisition of Qype, the Company announced its plan to reduce the size of the Qype workforce and terminate several of Qype’s leases. These actions were taken in order to reduce the Company’s cost structure, enhance operating efficiencies and strengthen the Company’s business to achieve long-term profitable growth. As a result of this plan, the Company incurred restructuring charges during the fourth quarter of 2012 and the first quarter of 2013, which were included in the restructuring and integration costs in the accompanying consolidated statements of operations for such periods. The Company’s restructuring plan was substantially completed during the year ended December 31, 2013 and the remaining restructuring liability was zero as of December 31, 2014. The Company has recorded restructuring charges of $1.9 million through December 31, 2013. The following table summarizes the changes in the Company’s restructuring liabilities (in thousands):
| Balance as of December 31, 2012 | $ | 685 | |
| Provision | 935 | ||
| Adjustment to provision | (261 | ) | |
| Payments | (1,308 | ) | |
| Balance as of December 31, 2013 | $ | 51 | |
| Payments | (51 | ) | |
| Balance as of December 31, 2014 | $ | — |
6. CASH AND CASH EQUIVALENTS
Cash and cash equivalents as of December 31, 2014 and 2013 consist of the following (in thousands):
| December 31, | ||||||
| 2014 | 2013 | |||||
| Cash and cash equivalents | ||||||
| Cash | $ | 38,719 | $ | 29,074 | ||
| Money market funds | 208,593 | 360,690 | ||||
| Total cash and cash equivalents | $ | 247,312 | $ | 389,764 | ||
The lease agreements for certain of the Company’s offices require the Company to maintain letters of credit issued to the landlords of each facility. Each letter of credit is subject to renewal annually until the applicable lease expires and is collateralized by restricted cash. As of December 31, 2014 and December 31, 2013, the Company had letters of credit totaling $17.9 million and $3.2 million, respectively, related to such leases.
7. PROPERTY, EQUIPMENT AND SOFTWARE, NET
Property, equipment and software, net as of December 31, 2014 and 2013 consist of the following (in thousands):
| December 31, | |||||||
| 2014 | 2013 | ||||||
| Computer equipment | $ | 19,111 | $ | 13,348 | |||
| Software | 802 | 541 | |||||
| Capitalized website and software development costs | 27,602 | 13,878 | |||||
| Furniture and fixtures | 6,621 | 4,388 | |||||
| Leasehold improvements | 36,991 | 13,984 | |||||
| Telecommunication | 2,610 | 2,179 | |||||
| Total | 93,737 | 48,318 | |||||
| Less accumulated depreciation | (30,976 | ) | (17,652 | ) | |||
| Net property, equipment and software | $ | 62,761 | $ | 30,666 | |||
F-18
Depreciation expense for the years ended December 31, 2014, 2013 and 2012 was approximately $14.3 million, $7.9 million and $5.9 million, respectively.
8. GOODWILL AND INTANGIBLE ASSETS
Goodwill as of December 31, 2014 and 2013 and changes in the carrying amount of goodwill during the years ended December 31, 2014 and 2013 are as follows (in thousands):
| Balance as of December 31, 2012 | $ | 48,605 | ||
| Goodwill acquired | 10,279 | |||
| Measurement period adjustment | (1,153 | ) | ||
| Effect of currency translation | 1,959 | |||
| Balance as of December 31, 2013 | $ | 59,690 | ||
| Goodwill acquired | 13,995 | |||
| Effect of currency translation | (6,378 | ) | ||
| Balance as of December 31, 2014 | $ | 67,307 |
Under the terms of the share purchase agreement by and among the Company, its wholly-owned subsidiary Yelp Ireland Ltd., Qype and its shareholders, the Qype purchase price was subject to a post-closing adjustment based on Qype’s net working capital as of the acquisition date. On April 15, 2013, Yelp and the former Qype shareholders agreed to an adjustment of the purchase price in favor of Yelp in the amount of €0.9 million (approximately $1.2 million as of April 15, 2013) based on Qype’s net working capital as of the acquisition date. As this agreement occurred during the measurement period of the acquisition, as defined by ASC 805, the impact of this adjustment was recorded as an increase to cash and a decrease to goodwill. The related funds were released to the Company from the escrow fund during the year ended December 31, 2013.
The intangible assets detail at December 31, 2014 and 2013 consist of the following (in thousands):
| Gross Carrying Amount |
Accumulated Amortization |
Net Carrying Amount |
Weighted Average Remaining Life | ||||||||
| December 31, 2014: | |||||||||||
| Content | $ | 4,299 | $ | (1,393 | ) | $ | 2,906 | 3.6 years | |||
| Developed technology | 1,963 | (861 | ) | 1,102 | 4.2 years | ||||||
| Advertiser relationships | 1,853 | (1,853 | ) | — | 0.0 years | ||||||
| Data licenses | 1,724 | (138 | ) | 1,586 | 4.5 years | ||||||
| Trade name and other | 596 | (469 | ) | 127 | 1.4 years | ||||||
| Domains | 253 | (188 | ) | 65 | 3.5 years | ||||||
| $ | 10,688 | $ | (4,902 | ) | $ | 5,786 | |||||
| Gross Carrying Amount |
Accumulated Amortization |
Net Carrying Amount |
Weighted Average Remaining Life | ||||||||
| December 31, 2013: | |||||||||||
| Content | $ | 3,413 | $ | (811 | ) | $ | 2,602 | 3.8 years | |||
| Advertiser relationships | 2,045 | (1,214 | ) | 831 | 0.8 years | ||||||
| Developed technology | 1,851 | (422 | ) | 1,429 | 4.8 years | ||||||
| Trade name and other | 553 | (276 | ) | 277 | 1.1 years | ||||||
| Domains | 250 | (154 | ) | 96 | 3.9 years | ||||||
| $ | 8,112 | $ | (2,877 | ) | $ | 5,235 | |||||
F-19
Amortization expense for the years ended December 31, 2014, 2013 and 2012 was approximately $2.4 million, $2.3 million and $0.4 million, respectively.
Estimated future amortization of purchased intangible assets at December 31, 2014 was as follows (in thousands):
| Year ending December 31, | Amount | |||
| 2015 | $ | 1,694 | ||
| 2016 | 1,461 | |||
| 2017 | 1,299 | |||
| 2018 | 794 | |||
| 2019 and thereafter | 538 | |||
| Total amortization | $ | 5,786 | ||
9. ACCRUED LIABILITIES
Accrued liabilities as of December 31, 2014 and 2013 consist of the following (in thousands):
| December 31, | ||||||
| 2014 | 2013 | |||||
| Fixed asset purchase commitments | $ | 6,329 | $ | 2,247 | ||
| Accrued commissions | 4,198 | 3,707 | ||||
| Accrued vacation | 3,972 | 2,950 | ||||
| Accrued employee related expenses | 2,116 | 1,784 | ||||
| Accrued cost of sales | 2,052 | 624 | ||||
| Accrued income, withholding, and business taxes | 1,354 | 1,837 | ||||
| Accrued payroll tax | 1,251 | 1,508 | ||||
| Deferred rent | 1,229 | 298 | ||||
| Merchant revenue share liability | 1,218 | 932 | ||||
| Other accrued expenses | 5,862 | 3,117 | ||||
| Total | $ | 29,581 | $ | 19,004 | ||
10. OTHER INCOME (EXPENSE), NET
Other income (expense), net for the years ended December 31, 2014, 2013 and 2012 consist of the following (in thousands):
| Year Ended December 31, | ||||||||||
| 2014 | 2013 | 2012 | ||||||||
| Interest income | $ | 727 | $ | 62 | $ | 51 | ||||
| Transaction gain (loss) on foreign exchange | (121 | ) | (251 | ) | (259 | ) | ||||
| Other non-operating income (loss), net | (385 | ) | (218 | ) | (18 | ) | ||||
| Other income (expense), net | $ | 221 | $ | (407 | ) | $ | (226 | ) | ||
11. COMMITMENTS AND CONTINGENCIES
Office Facility Leases—The Company leases its office facilities under operating lease agreements that expire from 2015 to 2026. Certain lease agreements provide for rental payments on a graduated basis. The Company recognizes rent expense on a straight-line basis over the lease period.
Rental expense was $14.6 million, $8.7 million and $4.8 million for the years ended December 31, 2014, 2013 and 2012, respectively.
F-20
Aggregate Future Lease Commitments—The Company’s minimum payments under noncancelable operating leases for equipment and office space having initial terms in excess of one year are as follows at December 31, 2014 (in thousands):
| Year Ending December 31, | Operating Leases | ||
| 2015 | $ | 25,617 | |
| 2016 | 34,720 | ||
| 2017 | 36,944 | ||
| 2018 | 37,386 | ||
| 2019 | 37,309 | ||
| Thereafter | 171,433 | ||
| Total minimum lease payments | $ | 343,409 | |
Legal Proceedings—The Company is subject to legal proceedings arising in the ordinary course of business. Although the results of litigation and claims cannot be predicted with certainty, the Company currently does not believe that the final outcome of any of these matters will have a material adverse effect on the Company’s business, financial position, results of operations or cash flows.
In February and March 2010, the Company was sued in two putative class actions on behalf of local businesses asserting various causes of action based on claims that the Company manipulated the ratings and reviews on its platform to coerce local businesses to buy its advertising products. These cases were subsequently consolidated in an action asserting claims for violation of the California Business and Professions Code, extortion and attempted extortion based on the conduct they allege and seeking monetary relief in an unspecified amount and injunctive relief. In October 2011, the court dismissed this consolidated action with prejudice. The plaintiffs have appealed to the U.S. Court of Appeals for the Ninth Circuit, which affirmed the dismissal of the consolidated action. The plaintiffs submitted a petition to the Ninth Circuit for a rehearing, which was denied on October 28, 2014.
In August 2014, two putative class action lawsuits alleging violations of federal securities laws were filed in the U.S. District Court for the Northern District of California, naming as defendants the Company and certain of its officers. The lawsuits allege violations of the Exchange Act by the Company and its officers for allegedly making materially false and misleading statements regarding our business and operations between October 29, 2013 and April 3, 2014. These cases were subsequently consolidated and, in January 2015, plaintiffs filed a consolidated complaint seeking unspecified monetary damages and other relief. On February 6, 2015, the Company and the other named defendants filed a motion to dismiss the consolidated complaint, and the court is currently scheduled to have a hearing on the motion on April 16, 2015.
In addition, we are subject to legal proceedings arising in the ordinary course of business. Although the results of litigation and claims cannot be predicted with certainty, we currently do not believe that the final outcome of any of these matters will have a material adverse effect on our business, financial position, results of operations or cash flows.
Indemnification Agreements—In the ordinary course of business, the Company may provide indemnifications of varying scope and terms to customers, vendors, lessors, business partners and other parties with respect to certain matters, including, but not limited to, losses arising out of breach of such agreements, services to be provided by the Company or from intellectual property infringement claims made by third parties. In addition, the Company has entered into indemnification agreements with directors and certain officers and employees that will require the Company, among other things, to indemnify them against certain liabilities that may arise by reason of their status or service as directors, officers or employees.
While the outcome of these matters cannot be predicted with certainty, the Company does not believe that the outcome of any claims under indemnification arrangements will have a material effect on the Company’s financial position, results of operations or cash flows.
F-21
12. STOCKHOLDERS’ EQUITY (DEFICIT)
Initial Public Offering
In March 2012, the Company completed its initial public offering (“IPO”), whereby 8,172,500 shares of Class A common stock were sold by the Company (inclusive of 1,072,500 shares of Class A common stock from the full exercise of the overallotment option of shares granted to the underwriters) and 50,000 shares of Class A common stock were sold by a selling stockholder, The Yelp Foundation. The public offering price of the shares sold in the offering was $15.00 per share. The Company did not receive any proceeds from the sales of shares by the selling stockholder. The total gross proceeds from the offering to the Company were $122.6 million. After deducting underwriters’ discounts and commissions and offering expenses, the aggregate net proceeds received by the Company totaled approximately $111.4 million. Immediately prior to the closing of the IPO, all shares of the Company’s outstanding redeemable convertible preferred stock automatically converted into 35,816,772 shares of Class B common stock. As a result, following the IPO, the Company has two classes of authorized common stock outstanding: Class A common stock (one vote per share) and Class B common stock (ten votes per share).
In November 2011, the board of directors of the Company approved the establishment of The Yelp Foundation (the “Foundation”), a non-profit organization designed to support consumers and businesses in the communities in which the Company operates. The Foundation’s officers include several of the Company’s current officers. The Company’s board of directors approved a contribution and issuance of 520,000 shares of the Company’s common stock to the Foundation, of which the Foundation has sold 100,000 shares, including 50,000 shares in the IPO. The Company recorded an expense in the amount of $5.9 million for the contribution based on the fair value of the common stock on the date the shares were issued to the Foundation. The Company recorded the expense as a charitable contribution expense as it constituted an unconditional transfer of assets to an entity in a voluntary nonreciprocal transfer.
The Company has not consolidated the Foundation as (1) the Company does not have a financial interest in the Foundation, (2) the Company does not have voting rights and (3) the Foundation meets the definition of a non-profit organization under ASC 810-20, Consolidation – Control of Partnerships and Similar Entities as it is organized exclusively for charitable, scientific, literary and educational purposes within the meaning of Section 501(c)(3) of the Internal Revenue Code of 1986 and is governed by Section 5211(b) of the California Nonprofit Public Benefit Corporation Law.
Follow-on Offering
In October 2013, the Company closed its follow-on offering of 4,312,500 shares of its Class A common stock (inclusive of 562,500 shares of Class A common stock from the full exercise of the overallotment option of shares granted to the underwriters). The public offering price of the shares sold in the offering was $67.00 per share. The total gross proceeds from the offering to the Company were $288.9 million. After deducting underwriting discounts and commissions and offering expenses payable by the Company, the aggregate net proceeds received by the Company totaled approximately $276.5 million.
The following table presents the shares authorized and issued and outstanding as of the periods presented:
| December 31, 2014 | December 31, 2013 | |||||||
| Shares Authorized |
Shares Issued and Outstanding |
Shares Authorized |
Shares Issued and Outstanding | |||||
| Stockholders’ equity: | ||||||||
| Class A common stock, $0.000001 par value | 200,000,000 | 63,062,071 | 200,000,000 | 59,163,134 | ||||
| Class B common stock, $0.000001 par value | 100,000,000 | 9,858,511 | 100,000,000 | 11,711,359 | ||||
| Common stock, $0.000001 par value | 200,000,000 | — | 200,000,000 | — | ||||
| Undesignated Preferred Stock | 10,000,000 | — | 10,000,000 | — | ||||
F-22
Common Stock Reserved for Future Issuance
As of December 31, 2014, the Company had reserved shares of Class A and Class B common stock for future issuances in connection with the following:
| Options outstanding | 9,037,935 | |
| Restricted stock units and awards outstanding | 1,131,849 | |
| Available for future stock option and restricted stock units and awards grants | 5,010,212 | |
| Available for future ESPP options | 1,958,667 | |
| Total reserved for future issuance | 17,138,663 |
Equity Incentive Plans
The Company has outstanding awards under three equity incentive plans: the Amended and Restated 2005 Equity Incentive Plan (the “2005 Plan”), the 2011 Equity Incentive Plan (the “2011 Plan”) and the 2012 Equity Incentive Plan, as amended (the “2012 Plan”). In July 2011, the Company terminated the 2005 Plan and provided that no further stock awards were to be granted under the 2005 Plan. All outstanding stock awards under the 2005 Plan continue to be governed by their existing terms. Upon the effectiveness of the underwriting agreement in connection with the IPO, all shares that were reserved under the 2011 Plan but not issued were assumed by the 2012 Plan. No further awards will be granted pursuant to the 2011 Plan. All outstanding stock awards under the 2011 Plan continue to be governed by their existing terms. Under the 2012 Plan, the Company has the ability to issue incentive stock options, non-statutory stock options, stock appreciation rights, RSUs, RSAs, performance units and performance shares. Additionally, the 2012 Plan provides for the grant of performance cash awards to employees, directors and consultants.
Stock Options
Stock options granted under the 2012 Plan are granted at a price per share not less than the fair value at date of grant. Options granted to date generally vest either over a four-year period with 25% vesting at the end of one year and the remaining vesting monthly thereafter or over a four-year period with 10% vesting over the first year, 20% vesting over the second year, 30% vesting over the third year and 40% vesting over the fourth year. Options granted generally are exercisable for up to 10 years.
A summary of stock option activity for the year ended December 31, 2014 is as follows:
| Options Outstanding | Weighted- Average Remaining Contractual Term (in years) |
Aggregate Intrinsic Value (in thousands) | ||||||||
| Number
of Shares |
Weighted- Average Exercise Price |
|||||||||
| Options outstanding—December 31, 2013 | 11,101,166 | $ | 18.24 | 8.17 | $ | 562,855 | ||||
| Granted | 209,700 | 75.58 | ||||||||
| Exercised | (1,679,654 | ) | 11.99 | |||||||
| Canceled | (593,277 | ) | 35.05 | |||||||
| Options outstanding—December 31, 2014 | 9,037,935 | $ | 19.64 | 7.26 | $ | 324,160 | ||||
| Options vested and expected to vest as of December 31, 2014 |
8,717,559 | $ | 19.21 | 7.20 | $ | 315,938 | ||||
| Options vested and exercisable as
of December 31, 2014 |
4,658,770 | $ | 13.48 | 6.63 | $ | 193,221 | ||||
F-23
Aggregate intrinsic value represents the difference between the fair value of the Company’s common stock and the exercise price of outstanding, in-the-money options. The total intrinsic value of options exercised was approximately $108.7 million, $90.7 million and $31.3 million for the years ended December 31, 2014, 2013 and 2012, respectively.
The weighted-average grant date fair value of options granted was $41.84, $16.75 and $0.72 for the years ended December 31, 2014, 2013 and 2012, respectively.
As of December 31, 2014, total unrecognized compensation costs, adjusted for estimated forfeitures, related to unvested stock options was approximately $54.7 million, which is expected to be recognized over a weighted-average time period of 2.03 years.
The following table summarizes information about outstanding and vested stock options as of December 31, 2014:
| Options Outstanding | Options
Vested and Exercisable | |||||||||||
| Exercise Price Range |
Number of Options Outstanding |
Weighted Average Remaining Life (Years) |
Weighted Average Exercise Price |
Number of Options |
Weighted Average Exercise Price | |||||||
| $1.00 - $6.92 | 181,177 | 4.81 | $ | 4.54 | 177,010 | $ | 4.52 | |||||
| $7.16 | 3,014,841 | 6.00 | 7.16 | 2,578,444 | 7.16 | |||||||
| $8.16 - $18.85 | 1,178,719 | 7.15 | 14.16 | 577,297 | 12.58 | |||||||
| $18.91 - $21.13 | 262,158 | 8.17 | 20.28 | 87,572 | 20.12 | |||||||
| $21.18 | 1,817,455 | 8.10 | 21.18 | 566,786 | 21.18 | |||||||
| $21.24 - $26.03 | 1,133,496 | 7.92 | 24.86 | 330,909 | 24.41 | |||||||
| $26.89 - $51.98 | 961,006 | 8.30 | 33.95 | 251,284 | 33.79 | |||||||
| $58.32 - $78.18 | 463,658 | 8.91 | 67.73 | 89,468 | 66.17 | |||||||
| $82.42 | 1,875 | 9.66 | 82.42 | — | — | |||||||
| $94.42 | 23,550 | 9.16 | 94.42 | — | — | |||||||
| Total | 9,037,935 | 7.26 | $ | 19.64 | 4,658,770 | $ | 13.48 | |||||
RSUs and RSAs
The cost of RSUs and RSAs are determined using the fair value of the Company’s common stock on the date of grant. RSUs and RSAs generally vest either over a four-year period with 25% vesting at the end of one year and the remaining vesting quarterly or annually thereafter, or over a four-year period with 10% vesting over the first year, 20% vesting over the second year, 30% vesting over the third year and 40% vesting over the fourth year.
A summary of RSU and RSA activity for the year ended December 31, 2014 is as follows:
| Restricted Stock Units | Restricted Stock Awards | |||||||||
| Number of Shares |
Weighted- Average Grant Date Fair Value |
Number of Shares |
Weighted- Average Grant Date Fair Value | |||||||
| Unvested—December 31, 2013 | 443,603 | $ | 44.66 | 73,470 | $ | 9.41 | ||||
| Granted | 905,839 | 71.76 | — | — | ||||||
| Released | (101,872 | ) | 39.69 | (42,500 | ) | 9.36 | ||||
| Canceled | (115,721 | ) | 62.57 | — | — | |||||
| Unvested—December 31, 2014 | 1,131,849 | $ | 64.96 | 30,970 | $ | 9.48 | ||||
F-24
As of December 31, 2014, the Company had approximately $61.6 million of unrecognized stock-based compensation expense, net of estimated forfeitures, related to RSUs and RSAs, which will be recognized over the remaining weighted-average vesting period of approximately 3.32 years.
Employee Stock Purchase Plan
Concurrent with the effectiveness of the underwriting agreement in connection with the IPO on March 1, 2012, the ESPP became effective. The ESPP allows eligible employees to purchase shares of the Company’s Class A common stock at a discount through payroll deductions of up to 15% of their eligible compensation, subject to any plan limitations during designated offering periods. At the end of each offering period that began prior to December 1, 2014, employees are able to purchase shares at 85% of the lower of the fair market value of the Company’s Class A common stock on the first trading day of the offering period or on the last day of the offering period. At the end of each offering period that began December 1, 2014 or later, employees are able to purchase shares at 85% of the fair market value of the Company’s Class A common stock on the last day of the offering period. There were 279,538 shares purchased by employees under the ESPP at weighted-average purchase price of $31.73 per share during the year ended December 31, 2014. The Company recognized $4.5 million of stock-based compensation related to the ESPP during the year ended December 31, 2014.
Stock-Based Compensation Expense
The fair value of options granted to employees is estimated on the grant date using the Black-Scholes-Merton option valuation model. This valuation model for stock-based compensation expense requires the Company to make assumptions and judgments about the variables used in the calculation, including the expected term (weighted-average period of time that the options granted are expected to be outstanding), the volatility in the fair market value of the Company’s Class A common stock, a risk-free interest rate, expected dividends and the estimated forfeitures of unvested stock options. To the extent actual results differ from the estimates, the difference will be recorded as a cumulative adjustment in the period estimates are revised. No compensation cost is recorded for options that do not vest. The Company uses the simplified calculation of expected life and volatility is based on an average of the historical volatilities of the common stock of several entities with characteristics similar to those of the Company. The risk-free rate is based on the U.S. Treasury yield curve in effect at the time of grant for periods corresponding with the expected life of the option. Expected forfeitures are based on the Company’s historical experience.
The Company uses the straight-line method for expense attribution. For the years ended December 31, 2014, 2013 and 2012, the weighted-average assumptions are as follows:
| Year Ended December 31, | |||||||
| 2014 | 2013 | 2012 | |||||
| Dividend yield | — | — | — | ||||
| Annual risk-free rate | 2.07 | % | 1.25 | % | 1.01 | % | |
| Expected volatility | 57.56 | % | 60.83 | % | 62.76 | % | |
| Expected term (years) | 6.17 | 6.17 | 6.18 | ||||
The following table presents the weighted-average assumptions used to estimate the fair value of the ESPP for the year ended December 31, 2014 and 2013. There were no offering periods prior to 2013.
| Year Ended December 31, | |||||
| 2014 | 2013 | ||||
| Dividend yield | — | — | |||
| Annual risk-free rate | 0.18 | % | 0.19 | % | |
| Expected volatility | 47.14 | % | 56.30 | % | |
| Expected term (years) | 1.09 | 1.25 | |||
F-25
The following table summarizes the effects of stock-based compensation related to stock-based awards to employees and non-employees on the Company’s consolidated statements of operations as of December 31, 2014, 2013 and 2012, is as follows (in thousands):
| Year Ended December 31, | |||||||||
| 2014 | 2013 | 2012 | |||||||
| Cost of revenue | $ | 729 | $ | 421 | $ | 122 | |||
| Sales and marketing | 15,083 | 10,131 | 4,917 | ||||||
| Product development | 14,804 | 6,270 | 1,705 | ||||||
| General and administrative | 11,657 | 9,300 | 8,134 | ||||||
| Restructuring and integration | — | 555 | — | ||||||
| Total
stock-based compensation in income (loss) before income taxes |
$ | 42,273 | $ | 26,677 | $ | 14,878 | |||
| Benefit from income taxes | (15,064 | ) | — | — | |||||
| Total stock-based compensation effects in income (loss) | 27,209 | 26,677 | 14,878 | ||||||
During the years ended December 31, 2014, 2013 and 2012, the Company capitalized $2.3 million, $0.5 million and $0.3 million, respectively, of stock-based compensation as website development costs.
13. NET INCOME (LOSS) PER SHARE
Basic and diluted net income (loss) per share attributable to common stockholders are presented in conformity with the “two-class method” required for participating securities. Immediately prior to the consummation of the IPO in March 2012, all outstanding shares of preferred stock and common stock were converted to Class B common stock. As a result, Class A and Class B common stock are the only outstanding equity in the Company. The rights of the holders of Class A and Class B common stock are identical, except with respect to voting and conversion. Each share of Class A common stock is entitled to one vote per share and each class of Class B common stock is entitled to 10 votes per share. Shares of Class B common stock may be converted into Class A common stock at any time at the option of the stockholder, and are automatically converted upon sale or transfer to Class A common stock, subject to certain limited exceptions, and in connection with certain other conversion events.
Basic net income (loss) per share is computed using the weighted-average number of shares of common stock outstanding during the period. Diluted net income per share is computed using the weighted-average number of shares of common stock and, if dilutive, potential shares of common stock outstanding during the period. The Company’s potential shares of common stock consist of the incremental shares of common stock issuable upon the exercise of stock options and, to a lesser extent, shares issuable upon the vesting of RSUs, RSAs and purchases related to the ESPP. The dilutive effect of these potential shares of common stock is reflected in diluted earnings per share by application of the treasury stock method. The computation of the diluted net income (loss) per share of Class A common stock assumes the conversion of Class B common stock, while the diluted net income (loss) per share of Class B common stock does not assume the conversion of Class B common stock.
The undistributed earnings are allocated based on the contractual participation rights of the Class A and Class B common stock as if the earnings for the year have been distributed. As the liquidation and dividend rights are identical, the undistributed earnings are allocated on a proportionate basis. Further, as the conversion of Class B common stock is assumed in the computation of the diluted net income (loss) per share of Class A common stock, the undistributed earnings are equal to net income (loss) for that computation.
F-26
The following table presents the calculation of basic and diluted net income (loss) per share (in thousands, except per share data):
| Year Ended December 31, | |||||||||||||||||||
| 2014 | 2013 | 2012 | |||||||||||||||||
| Class A | Class B | Class A | Class B | Class A | Class B | ||||||||||||||
| Basic net income (loss) per
share attributable to common stockholders: |
|||||||||||||||||||
| Numerator: | |||||||||||||||||||
| Net income (loss) | $ | 31,178 | $ | 5,295 | $ | (6,291 | ) | $ | (3,777 | ) | $ | (3,464 | ) | $ | (15,649 | ) | |||
| Accretion
of redeemable convertible preferred stock |
— | — | — | — | (6 | ) | (26 | ) | |||||||||||
| Allocation of undistributed earnings | $ | 31,178 | $ | 5,295 | $ | (6,291 | ) | $ | (3,777 | ) | $ | (3,470 | ) | $ | (15,675 | ) | |||
| Denominator: | |||||||||||||||||||
| Weighted-average
shares outstanding |
61,492 | 10,444 | 41,033 | 24,632 | 9,815 | 44,333 | |||||||||||||
| Basic net income (loss) per share attributable to common stockholders |
$ | 0.51 | $ | 0.51 | $ | (0.15 | ) | $ | (0.15 | ) | $ | (0.35 | ) | $ | (0.35 | ) | |||
| Diluted net income (loss) per
share attributable to common stockholders: |
|||||||||||||||||||
| Numerator: | |||||||||||||||||||
| Allocation
of undistributed earnings for basic calculation |
$ | 31,178 | $ | 5,295 | $ | (6,291 | ) | $ | (3,777 | ) | $ | (3,470 | ) | $ | (15,675 | ) | |||
| Reallocation
of undistributed earnings as a result of conversion from Class B to Class A shares |
5,295 | — | — | — | — | — | |||||||||||||
| Reallocation
of undistributed earnings to Class B shares |
— | 911 | — | — | — | — | |||||||||||||
| Allocation
of undistributed earnings |
$ | 36,473 | $ | 6,206 | $ | (6,291 | ) | $ | (3,777 | ) | $ | (3,470 | ) | $ | (15,675 | ) | |||
| Denominator: | |||||||||||||||||||
| Number
of shares used in basic calculation |
61,492 | 10,444 | 41,033 | 24,632 | 9,815 | 44,333 | |||||||||||||
| Weighted-average
effect of dilutive securities |
|||||||||||||||||||
| Conversion
of Class B to Class A common shares outstanding |
10,444 | — | — | — | — | — | |||||||||||||
| Stock options | 4,377 | 2,584 | — | — | — | — | |||||||||||||
| Other dilutive securities | 399 | 25 | — | — | — | — | |||||||||||||
| Number
of shares used in diluted calculation |
76,712 | 13,053 | 41,033 | 24,632 | 9,815 | 44,333 | |||||||||||||
| Diluted net income (loss) per share attributable to common stockholders |
$ | 0.48 | $ | 0.48 | $ | (0.15 | ) | $ | (0.15 | ) | $ | (0.35 | ) | $ | (0.35 | ) | |||
The following weighted-average stock-based instruments were excluded from the calculation of diluted net income (loss) per share attributable to common stockholders because their effect would have been anti-dilutive for the periods presented (in thousands):
| Year Ended December 31, | ||||||
| 2014 | 2013 | 2012 | ||||
| Stock options | 71 | 11,101 | 10,113 | |||
| Restricted stock units | — | 444 | 284 | |||
| Restricted stock awards | — | 73 | 116 | |||
| Employee stock purchase plan | — | 20 | — | |||
F-27
14. INCOME TAXES
The Company accounts for income taxes in accordance with authoritative guidance, which requires the use of the asset and liability method. Under this method, deferred income tax assets and liabilities are determined based upon the difference between the consolidated financial statement carrying amounts and the tax basis of assets and liabilities and are measured using the enacted tax rate expected to apply to taxable income in the years in which the differences are expected to be reversed.
The following table presents domestic and foreign components of income (loss) before income taxes for the periods presented (in thousands):
| 2014 | 2013 | 2012 | ||||||||
| United States | $ | 13,083 | $ | (6,184 | ) | $ | (12,624 | ) | ||
| Foreign | (1,803 | ) | (3,046 | ) | (6,367 | ) | ||||
| Total | $ | 11,280 | $ | (9,230 | ) | $ | (18,991 | ) | ||
The income tax provision is composed of the following (in thousands):
| 2014 | 2013 | 2012 | ||||||||
| Current: | ||||||||||
| Federal | $ | — | $ | — | $ | — | ||||
| State | 704 | 145 | 3 | |||||||
| Foreign | 1,322 | 1,189 | 136 | |||||||
| 2,026 | 1,334 | 139 | ||||||||
| Deferred: | ||||||||||
| Federal | $ | (14,806 | ) | $ | — | $ | — | |||
| State | (7,613 | ) | — | — | ||||||
| Foreign | (4,800 | ) | (496 | ) | (17 | ) | ||||
| (27,219 | ) | (496 | ) | (17 | ) | |||||
| Total (benefit) provision for income taxes | $ | (25,193 | ) | $ | 838 | $ | 122 | |||
The following table presents a reconciliation of the statutory federal rate and the Company’s effective tax rate for the periods presented:
| 2014 | 2013 | 2012 | |||||
| Tax benefit at federal statutory rate | 35.00 | % | (34.00 | )% | (34.00 | )% | |
| State—net of federal effect | 3.63 | (4.71 | ) | (5.84 | ) | ||
| Foreign rate differential | (2.17 | ) | 33.11 | (38.74 | ) | ||
| Stock-based compensation | 12.76 | 1.21 | 7.96 | ||||
| Acquisition costs | — | 0.51 | 2.39 | ||||
| Meals & Entertainment | 3.75 | 3.74 | 3.05 | ||||
| Tax credits | (23.37 | ) | (39.77 | ) | (5.22 | ) | |
| Change in valuation allowance | (248.14 | ) | 45.02 | 70.13 | |||
| Change in tax rate | (4.72 | ) | — | — | |||
| Other | (0.08 | ) | 3.95 | 0.91 | |||
| Effective tax rate | (223.34 | )% | 9.06 | % | 0.64 | % |
F-28
The effective tax rate in 2014 reflects a $28.2 million benefit associated with the release of valuation allowance previously recorded against certain domestic and foreign deferred tax assets. In assessing the realization of deferred tax assets, management considers whether it is more likely than not that some portion or all of deferred tax assets will not be realized. The ultimate realization of the deferred tax assets is dependent upon the generation of future taxable income during the periods in which those temporary differences become deductible.
At the end of 2013, the Company could not assert, at the required more-likely-than-not level of certainty, that its domestic and foreign operations would generate sufficient taxable income to realize all of our deferred tax assets after considering the duration and severity of losses in prior years, investments in domestic and international markets, and investments in employees, content, brand and technology.
During 2014, after consideration of the relative impact of all evidence, positive and negative, the Company determined, at the required more-likely-than-not level of certainty, that certain domestic and foreign deferred tax assets would be realized. In determining the need for a valuation allowance, the weight given to positive and negative evidence is commensurate with the extent to which the evidence may be objectively verified. Consideration was given to negative evidence that was also present in 2013. However, after considering the profit achieved in 2014 and expectations of continued profitability on an ongoing basis, we concluded that it was more-likely-than-not that the Company would have future taxable income sufficient to realize the benefit associated with certain domestic and foreign deferred tax assets.
F-29
Deferred income taxes reflect the net tax effects of temporary differences between the carrying amounts of assets and liabilities for financial reporting purposes and the amounts used for income tax purposes. The following table presents the significant components of the Company’s deferred tax assets and liabilities for the periods presented (in thousands):
| 2014 | 2013 | |||||||
| Deferred tax assets: | ||||||||
| Reserves and others | $ | 6,584 | $ | 4,285 | ||||
| Accrued legal | — | 12 | ||||||
| Stock-based compensation | 17,933 | 10,416 | ||||||
| Contribution carryforward | 1,889 | 2,070 | ||||||
| Net operating loss carryforward | 10,611 | 17,335 | ||||||
| Tax credit carryforward | 4,957 | 4,671 | ||||||
| Gross deferred tax assets | 41,974 | 38,789 | ||||||
| Valuation allowance | (4,159 | ) | (31,166 | ) | ||||
| Total deferred tax assets | 37,815 | 7,623 | ||||||
| Deferred tax liabilities: | ||||||||
| Depreciation and amortization | (10,738 | ) | (7,095 | ) | ||||
| Total deferred tax liabilities | (10,738 | ) | (7,095 | ) | ||||
| Net deferred tax assets | $ | 27,077 | $ | 528 | ||||
At December 31, 2014, the Company has federal and state net operating loss carryforwards of approximately $166.7 million and $146.5 million respectively, expiring beginning in 2024 and 2015, respectively. Further, the Company has trading losses in Ireland of $11.5 million. The Ireland trading losses may be carried forward indefinitely against Ireland profits. The Company has losses of $9.6 million and $13.4 million in Germany and France, respectively, which may be carried forward indefinitely against profits in the respective jurisdictions as a result of the acquisitions of Qype and Cityvox. At December 31, 2014, the Company has federal research credit carryforwards of approximately $4.1 million that expire beginning in 2024, and California research credit carryforwards of approximately $3.8 million which do not expire. At December 31, 2014, the Company also has $4.5 million of California Enterprise Zone credit, expiring beginning in 2023.
Utilization of the net operating loss carryforwards and credits may be subject to a substantial annual limitation due to the ownership change limitations provided by the Internal Revenue Code of 1986, as amended, and similar state provisions. The annual limitation may result in the expiration of net operating losses and credits before utilization. The Company does not expect any previous ownership changes, as defined under Section 382 and 383 of the Internal Revenue Code, to result in a limitation that will reduce the total amount of net operating loss carryforwards and credits that can be utilized. Further, Qype and Cityvox loss carryforwards may be subject to limitations under the applicable laws of the taxing jurisdictions due to ownership change limitations.
As a result of certain realization requirements of the accounting guidance for stock-based compensation, the table of deferred tax assets and liabilities shown above does not include certain deferred tax assets at December 31, 2014 and 2013 that arose directly from (or the use of which was postponed by) tax deductions related to equity compensation in excess of compensation recognized for financial reporting. Approximately $163.5 million of federal net operating losses, $138.3 million of state net operating losses, $1.7 million of Ireland net operating losses, $2.5 million of federal research and development tax credits and $0.1 million of state Enterprise Zone credits are related to tax stock option deductions in excess of book deductions. The Company uses the accounting guidance for income taxes for purposes of determining when excess tax benefits have been realized. This amount will be credited to stockholders’ equity when it is realized on the tax return.
It is the intention of the Company to reinvest the earnings from Yelp Canada Inc., Yelp UK Ltd., and Yelp Ireland Holding Company Limited and its subsidiaries. The Company does not provide for U.S. income taxes on the earnings of foreign subsidiaries as such earnings are to be reinvested indefinitely. As of December 31, 2014, the Company estimates $2.1 million of cumulative amount of earnings upon which U.S. income taxes have not been provided. The income tax liability would be insignificant if these earnings were to be repatriated.
F-30
As of December 31, 2014, 2013 and 2012 the Company has $3.3 million, $1.8 million and $0.6 million, respectively, of unrecognized tax benefits. A reconciliation of the beginning and ending amount of unrecognized benefits is as follows (in thousands):
| 2014 | 2013 | 2012 | |||||||
| Balance at the beginning of the year | $ | 1,774 | $ | 611 | $ | 1 | |||
| Increase based on tax positions related to the prior year | 69 | 3 | 495 | ||||||
| Increase based on tax positions related to the current year | 1,433 | 1,160 | 115 | ||||||
| Balance at the end of the year | $ | 3,276 | $ | 1,774 | $ | 611 | |||
As of December 31, 2014, the Company has $3.2 million unrecognized tax benefits that, if recognized, would affect the effective tax rate. The Company’s policy is to record interest and penalties related to unrecognized tax benefits as income tax expense. During the years ended December 31, 2014, 2013, and 2012, the Company had immaterial amounts related to the accrual of interest and penalties.
The Company does not have any tax positions for which it is reasonably possible the total amount of gross unrecognized tax benefits will increase or decrease within 12 months of the year ended December 31, 2014.
The Company is subject to taxation in the U.S. and various states and foreign jurisdictions. Due to the Company’s net losses, substantially all of its federal, state and foreign income tax returns since inception are still subject to audit.
15. RELATED-PARTY TRANSACTIONS
The Company does not have any significant related party transactions, other than contributions made to The Foundation (see Note 12).
16. INFORMATION ABOUT REVENUE AND GEOGRAPHIC AREAS
The Company considers operating segments to be components of the Company in which separate financial information is available that is evaluated regularly by the Company’s chief operating decision maker in deciding how to allocate resources and in assessing performance. The chief operating decision maker for the Company is the Chief Executive Officer. The Chief Executive Officer reviews financial information presented on a consolidated basis, accompanied by information about revenue by product line and geographic region for purposes of allocating resources and evaluating financial performance. The Company has one business activity and there are no segment managers who are held accountable for operations, operating results or plans for levels or components below the consolidated unit level. Accordingly, the Company has determined that it has a single operating and reporting segment.
The following tables present the Company’s revenue by product line for the periods presented (in thousands):
| Year Ended December 31, | |||||||||
| 2014 | 2013 | 2012 | |||||||
| Net revenue by product: | |||||||||
| Local advertising | $ | 319,137 | $ | 192,983 | $ | 109,159 | |||
| Brand advertising | 34,482 | 27,960 | 20,579 | ||||||
| Other services | 23,917 | 12,045 | 7,829 | ||||||
| Total | $ | 377,536 | $ | 232,988 | $ | 137,567 | |||
For the years ended December 31, 2014, 2013 and 2012, revenue generated internationally was 2.9%, 4.6% and 2.2%, respectively. Revenue by geography is based on the billing address of the customer. No individual customer accounted for 10% or more of consolidated net revenue in any of such periods.
F-31
The following tables present the Company’s long-lived assets by geographic region for the periods presented (in thousands):
| December 31, | |||||||||
| Long-Lived Assets | 2014 | 2013 | 2012 | ||||||
| United States | $ | 73,344 | $ | 29,186 | $ | 14,275 | |||
| All Other Countries | 5,900 | 1,786 | 702 | ||||||
| Total | $ | 79,244 | $ | 30,972 | $ | 14,977 | |||
17. SUBSEQUENT EVENTS
On February 9, 2015, the Company acquired Eat24Hours.com, Inc. (“Eat24”), a leading web and app-based food ordering service, for an aggregate purchase price of $134 million, consisting of approximately 1.4 million shares of Yelp Class A common stock and $75 million cash, less certain transaction expenses and subject to customary working capital adjustments. The Company expects the acquisition to drive daily engagement in the key restaurant vertical and provide it with the opportunity to expand Eat24’s offering to the approximately 1 million U.S. restaurants listed on the Company’s platform. The company is currently in the process of valuing the assets acquired and liabilities assumed in the transaction.
F-32
EXHIBIT INDEX
| Filed | ||||||||||||
| Incorporated by Reference | Herewith | |||||||||||
| Exhibit | ||||||||||||
| Number | Exhibit Description | Form | File No. | Exhibit | Filing Date | |||||||
| 2.1 | Share Purchase Agreement, dated October 23, 2012, by and among Yelp Inc., Yelp Ireland Ltd., Qype GmbH and the shareholders of Qype GmbH. | 8-K | 001-35444 | 99.1 | 10/24/2012 | |||||||
| 2.2 | Agreement and Plan of Merger, dated July 18, 2013, by and among Yelp Inc., Ranger Merger Corp., Ranger Merger LLC, SeatMe, Inc. and Alexander Kvamme, as Stockholders’ Agent. | 8-K | 001-35444 | 99.1 | 7/24/2013 | |||||||
| 3.1 | Amended and Restated Certificate of Incorporation of Yelp Inc. | 8-K | 001-35444 | 3.1 | 3/9/2012 | |||||||
| 3.2 | Amended and Restated Bylaws of Yelp Inc. | S-1/A | 333-178030 | 3.4 | 2/3/2012 | |||||||
| 4.1 | Reference is made to Exhibits 3.1 and 3.2. | |||||||||||
| 4.2 | Form of Class A Common Stock Certificate. | S-1/A | 333-178030 | 4.1 | 2/3/2012 | |||||||
| 4.3 | Form of Class B Common Stock Certificate. | S-1/A | 333-178030 | 4.2 | 2/3/2012 | |||||||
| 10.1* | Amended and Restated 2005 Equity Incentive Plan. | S-1 | 333-178030 | 10.2 | 11/17/2011 | |||||||
| 10.2* | Form of Option Agreement and Option Grant Notice under Amended and Restated 2005 Equity Incentive Plan. | S-1 | 333-178030 | 10.3 | 11/17/2011 | |||||||
| 10.3* | 2011 Equity Incentive Plan. | S-1/A | 333-178030 | 10.4 | 2/3/2012 | |||||||
| 10.4* | Forms of Option Agreement and Option Grant Notice under 2011 Equity Incentive Plan. | S-1/A | 333-178030 | 10.5 | 2/3/2012 | |||||||
| 10.5* | Form of Indemnification Agreement made by and between Yelp Inc. and each of its directors and executive officers. | S-1/A | 333-178030 | 10.6 | 2/3/2012 | |||||||
| 10.6* | Amended and Restated Offer Letter, by and between Yelp Inc. and Geoff Donaker, dated February 3, 2012. | S-1/A | 333-178030 | 10.7 | 2/3/2012 | |||||||
| 10.7* | Amended and Restated Offer Letter, by and between Yelp Inc. and Rob Krolik, dated February 3, 2012. | S-1/A | 333-178030 | 10.8 | 2/3/2012 | |||||||
| 10.8* | Amended and Restated Offer Letter, by and between Yelp Inc. and Jed Nachman, dated February 3, 2012. | S-1/A | 333-178030 | 10.9 | 2/3/2012 | |||||||
| 10.9* | Amended and Restated Offer Letter, by and between Yelp Inc. and Laurence Wilson, dated February 3, 2012. | S-1/A | 333-178030 | 10.10 | 2/3/2012 | |||||||
| 10.10 | Amended and Restated Office Lease, by and between Yelp Inc. and 706 Mission Street Co. LLC, effective October 1, 2009. | S-1/A | 333-178030 | 10.12 | 2/3/2012 | |||||||
| 10.11 | Galleria Corporate Center Lease between Yelp Inc. and JEMB SCOTTSDALE LLC, dated January 20, 2010; First Amendment to Lease, dated January 4, 2011; Second Amendment to Lease, dated August 8, 2011. | S-1/A | 333-178030 | 10.13 | 2/3/2012 | |||||||
| 10.12 | License Agreement between Harrison 160, LLC, as Licensor, and MRL Ventures Inc., as Licensee, dated as of April 16, 2004; Addendums through November 10, 2011. | S-1/A | 333-178030 | 10.14 | 2/3/2012 | |||||||
| 10.13* | Offer Letter, by and between Yelp Inc. and Jeremy Stoppelman, dated February 3, 2012. | S-1/A | 333-178030 | 10.15 | 2/3/2012 | |||||||
| 10.14* | 2012 Equity Incentive Plan, as amended. | 8-K | 001-35444 | 10.1 | 6/11/2013 | |||||||
| 10.15* | Form of Option Agreement and Grant Notice and RSU Award Agreement and Grant Notice under 2012 Equity Incentive Plan. | S-1/A | 333-178030 | 10.17 | 2/3/2012 | |||||||
| Filed | ||||||||||||
| Incorporated by Reference | Herewith | |||||||||||
| Exhibit | ||||||||||||
| Number | Exhibit Description | Form | File No. | Exhibit | Filing Date | |||||||
| 10.16* | 2012 Employee Stock Purchase Plan. | S-1/A | 333-178030 | 10.18 | 2/3/2012 | |||||||
| 10.17* | Executive Severance Benefit Plan. | S-1/A | 333-178030 | 10.19 | 2/3/2012 | |||||||
| 10.18* | Secondment Agreement, dated April 25, 2012, by and between Yelp Inc. and Jed Nachman. | 8-K | 001-35444 | 99.1 | 4/27/2012 | |||||||
| 10.19 | Lease Agreement, by and between Yelp UK Limited and Knight Frank LLP, dated March 1, 2012. | 10-Q | 001-35444 | 10.11 | 5/4/2012 | |||||||
| 10.20 | Office Lease, dated May 9, 2012, by and between Yelp Inc. and Stockbridge 138 New Montgomery LLC. | 8-K | 001-35444 | 10.1 | 5/10/2012 | |||||||
| 10.21* | Compensation Information for Registrant’s Executive Officers. | 8-K | 001-35444 | 2/8/2013 | ||||||||
| 10.22* | Letter Agreement, dated May 22, 2014, by and between Joseph Nachman and Yelp Inc. | 8-K | 001-35444 | 99.1 | 5/28/2014 | |||||||
| 10.23 | Lease, dated July 31, 2014, by and between Yelp Inc. and 11 Madison Avenue LLC. | 8-K | 001-35444 | 10.1 | 8/6/2014 | |||||||
| 21.1 | Subsidiaries of Yelp Inc. | X | ||||||||||
| 23.1 | Consent of Independent Registered Public Accounting Firm. | X | ||||||||||
| 24.1 | Power of Attorney (included on signature page). | X | ||||||||||
| 31.1 | Certification pursuant to Rule 13a-14(a)/15d-14(a). | X | ||||||||||
| 31.2 | Certification pursuant to Rule 13a-14(a)/15d-14(a). | X | ||||||||||
| 32.1† | Certifications of Chief Executive Officer and Chief Financial Officer. | X | ||||||||||
| 101.INS | XBRL Instance Document. | X | ||||||||||
| 101.SCH | XBRL Taxonomy Extension Schema Document. | X | ||||||||||
| 101.CAL | XBRL Taxonomy Extension Calculation Linkbase Document. | X | ||||||||||
| 101.DEF | XBRL Taxonomy Extension Definition Linkbase Document. | X | ||||||||||
| 101.LAB | XBRL Taxonomy Extension Labels Linkbase Document. | X | ||||||||||
| 101.PRE | XBRL Taxonomy Extension Presentation Linkbase Document. | X | ||||||||||
| * | Indicates management contract or compensatory plan or arrangement. | |
| † | The certifications attached as Exhibit 32.1 accompany this Annual Report, are not deemed filed with the Securities and Exchange Commission and are not to be incorporated by reference into any filing of Yelp Inc. under the Securities Act of 1933, as amended, or the Securities Exchange Act of 1934, as amended, whether made before or after the date of this Annual Report, irrespective of any general incorporation language contained in such filing. | |