Attached files
| file | filename |
|---|---|
| EX-32 - EX-32 - ALTABA INC. | d826131dex32.htm |
| EX-31.1 - EX-31.1 - ALTABA INC. | d826131dex311.htm |
| EX-23.1 - EX-23.1 - ALTABA INC. | d826131dex231.htm |
| EX-31.2 - EX-31.2 - ALTABA INC. | d826131dex312.htm |
| EX-10.4(C) - EX-10.4(C) - ALTABA INC. | d826131dex104c.htm |
| EX-10.4(B) - EX-10.4(B) - ALTABA INC. | d826131dex104b.htm |
| EX-21.1 - EX-21.1 - ALTABA INC. | d826131dex211.htm |
| EXCEL - IDEA: XBRL DOCUMENT - ALTABA INC. | Financial_Report.xls |
| EX-10.3(A) - EX-10.3(A) - ALTABA INC. | d826131dex103a.htm |
Table of Contents
UNITED STATES
SECURITIES AND EXCHANGE COMMISSION
Washington, D.C. 20549
Form 10-K
| þ | ANNUAL REPORT PURSUANT TO SECTION 13 OR 15(d) OF THE SECURITIES EXCHANGE ACT OF 1934 |
For the fiscal year ended December 31, 2014
OR
| ¨ | TRANSITION REPORT PURSUANT TO SECTION 13 OR 15(d) OF THE SECURITIES EXCHANGE ACT OF 1934 |
For the transition period from to
Commission File Number 000-28018
Yahoo! Inc.
(Exact name of Registrant as specified in its charter)
| Delaware | 77-0398689 | |
| (State or other jurisdiction of incorporation or organization) | (I.R.S. Employer Identification No.) |
701 First Avenue
Sunnyvale, California 94089
(Address of principal executive offices, including zip code)
Registrant’s telephone number, including area code: (408) 349-3300
Securities registered pursuant to Section 12(b) of the Act:
| Title of Each Class |
Name of Each Exchange on Which Registered | |
| Common stock, $.001 par value | The NASDAQ Stock Market LLC (NASDAQ Global Select Market) |
Securities registered pursuant to Section 12(g) of the Act: None
(Title of Class)
Indicate by check mark if the Registrant is a well-known seasoned issuer, as defined in Rule 405 of the Securities Act. Yes þ No ¨
Indicate by check mark if the Registrant is not required to file reports pursuant to Section 13 or Section 15(d) of the Act. Yes ¨ No þ
Indicate by check mark whether the Registrant (1) has filed all reports required to be filed by Section 13 or 15(d) of the Securities Exchange Act of 1934 during the preceding 12 months (or for such shorter period that the Registrant was required to file such reports), and (2) has been subject to such filing requirements for the past 90 days. Yes þ No ¨
Indicate by check mark whether the Registrant has submitted electronically and posted on its corporate Web site, if any, every Interactive Data File required to be submitted and posted pursuant to Rule 405 of Regulation S-T (§232.405 of this chapter) during the preceding 12 months (or for such shorter period that the registrant was required to submit and post such files). Yes þ No ¨
Indicate by check mark if disclosure of delinquent filers pursuant to Item 405 of Regulation S-K (§229.405 of this chapter) is not contained herein, and will not be contained, to the best of Registrant’s knowledge, in definitive proxy or information statements incorporated by reference in Part III of this Form 10-K or any amendment to this Form 10-K. þ
Indicate by check mark whether the Registrant is a large accelerated filer, an accelerated filer, a non-accelerated filer, or a smaller reporting company. See definitions of “large accelerated filer,” “accelerated filer,” and “smaller reporting company” in Rule 12b-2 of the Exchange Act.
| Large accelerated filer þ |
Accelerated filer ¨ | |
|
Non-accelerated filer ¨ (Do not check if a smaller reporting company) |
Smaller reporting company ¨ |
Indicate by check mark whether the Registrant is a shell company (as defined by Rule 12b-2 of the Exchange Act). Yes ¨ No þ
As of June 30, 2014, the last business day of the Registrant’s most recently completed second fiscal quarter, the aggregate market value of voting stock held by non-affiliates of the Registrant, based upon the closing sales price for the Registrant’s common stock, as reported on the NASDAQ Global Select Market was $32,432,060,475. Shares of common stock held by each officer and director and by each person who owns 10 percent or more of the outstanding common stock have been excluded in that such persons may be deemed to be affiliates. This determination of affiliate status is not necessarily a conclusive determination for any other purpose.
The number of shares of the Registrant’s common stock outstanding as of February 13, 2015 was 936,120,954.
DOCUMENTS INCORPORATED BY REFERENCE
The following documents (or parts thereof) are incorporated by reference into the following parts of this Form 10-K:
Proxy Statement for the 2015 Annual Meeting of Shareholders—Part III Items 10, 11, 12, 13, and 14.
Table of Contents
YAHOO! INC.
Form 10-K
Fiscal Year Ended December 31, 2014
The trademarks and/or registered trademarks of Yahoo! Inc. and its subsidiaries referred to herein include, but are not limited to, Yahoo!, Flickr, Tumblr, Yahoo Tech, Yahoo Food, Yahoo Travel, Yahoo Beauty, Yahoo Style, Yahoo Health, Yahoo Makers, Yahoo Parenting, Yahoo Music, Yahoo Movies, Yahoo TV, Yahoo Screen, Aviate, Yahoo News, Yahoo News Digest, Yahoo Mail, Yahoo Answers, Yahoo Search, Yahoo Messenger, Yahoo Games Network, Yahoo Finance, Yahoo Weather, Yahoo Sports, Yahoo Gemini, Yahoo Premium Ads, Yahoo Ad Manager Plus, Yahoo Smart TV, Yahoo Recommends, Yahoo Groups, Flurry, BrightRoll, Rivals and their respective logos. Other names are trademarks and/or registered trademarks of their respective owners.
2
Table of Contents
PART I
Overview
Yahoo! Inc., together with its consolidated subsidiaries (“Yahoo,” the “Company,” “we,” or “us”), is a guide focused on making users’ digital habits inspiring and entertaining. By creating highly personalized experiences for our users, we keep people connected to what matters most to them, across devices and around the world. This focus is driven by our commitment to creating highly personalized experiences that reach our users wherever they might be—on their mobile phone, tablet or PC.
We create value for advertisers with a streamlined, simplified advertising technology stack that leverages Yahoo’s data, reach and analytics to connect advertisers with their target audiences. For advertisers, the opportunity to be a part of users’ digital habits across products and platforms is a powerful tool to engage audiences and build brand loyalty.
Advertisers can build their businesses through advertising to targeted audiences on our online properties and services (“Yahoo Properties”) and a distribution network of third party entities (“Affiliates”) who integrate our advertising offerings into their Websites or other offerings (“Affiliate sites”; together with Yahoo Properties, the “Yahoo Network”). Our revenue is generated principally from display and search advertising.
We are proud of our storied history that has evolved with the Internet, beginning in 1994 when our founders, Jerry Yang and David Filo, then graduate students at Stanford University, created Jerry and Dave’s Guide to the World Wide Web, a simple directory of websites to help people navigate the Internet. Yahoo was incorporated in 1995 and is a Delaware corporation. We completed our initial public offering on April 12, 1996, and our stock is listed on the NASDAQ Global Select Market under the symbol “YHOO.” Yahoo is a global company headquartered in Sunnyvale, California.
Executive Leadership
The executive management team includes:
| • | Marissa Mayer—President and Chief Executive Officer; |
| • | David Filo—Co-Founder and Chief Yahoo; |
| • | Ken Goldman—Chief Financial Officer; |
| • | Ron Bell—General Counsel and Secretary; |
| • | Jacqueline Reses—Chief Development Officer; |
| • | Kathy Savitt—Chief Marketing Officer; |
| • | Adam Cahan—Senior Vice President, Mobile and Emerging Products; |
| • | Mike Kerns—Senior Vice President, Homepage and Verticals; |
| • | Laurence Mann—Senior Vice President, Search Products; |
| • | Jeff Bonforte—Senior Vice President, Communication Products; |
3
Table of Contents
| • | Prashant Fuloria—Senior Vice President, Advertising Products; |
| • | Jay Rossiter—Senior Vice President, Platforms; |
| • | Dawn Airey—Senior Vice President, Europe, Middle East, and Africa; |
| • | Rose Tsou—Senior Vice President, Asia Pacific; and |
| • | Lisa Utzschneider—Senior Vice President, Sales, Americas. |
Our Board of Directors is composed of:
| • | Marissa Mayer, our President and CEO; Maynard Webb, our Chairman of the Board; David Filo; Susan James; Max Levchin; Thomas McInerney; Charles Schwab; H. Lee Scott; and Jane Shaw, Ph.D. |
2014 Business Highlights: People, Products, Traffic & Revenue
For the past two years, we have focused our attention on triggering a chain reaction of growth, which starts with hiring the best people who will build beautiful, engaging products. Those products drive increased traffic. The increased traffic generates greater advertiser interest, which ultimately results in revenue growth. Throughout 2014, we continued to invest in mobile, video, native, and social (“Mavens”). Our mobile first strategy has yielded significant results for our users and our Company and generated mobile revenue for the fourth quarter and full year of 2014 of approximately $254 million and $768 million, respectively. Our investments and energy in 2014 were dedicated to our forward-looking Mavens offerings, and we remain committed to that approach in 2015.
People:
We remain committed to hiring the best possible people and we recruited impressive talent across the Company in 2014. Our stockholders also elected several new board members in 2014.
| • | We hired Lisa Utzschneider as Senior Vice President, Sales, Americas, responsible for our advertising business across the Americas. We also hired Alex Stamos as our new Chief Information Security Officer to further our efforts to protect our users’ security. Finally, we added important technical talent to the team with Mike Kail joining as Chief Information Officer and Senior Vice President, Infrastructure to lead IT and data center operations for the Company. |
| • | We launched ten digital magazines and hired world class editorial voices to lead each one. Yahoo Tech is led by Editor-in-Chief David Pogue; Yahoo Food is led by Editor-in-Chief Kerry Diamond; Yahoo Travel is led by Editor-in-Chief Paula Froelich; Yahoo Movies (U.S. & U.K.) is led by Executive Editor of Entertainment, Josh Wolk; Yahoo Beauty is led by Editor-in-Chief Bobbi Brown; Yahoo Style is led by Editor-in-Chief Joe Zee; Yahoo Health is led by Editor-in-Chief Michele Promaulayko; Yahoo Makers is led by Editor-in-Chief Katie Brown; Yahoo Parenting is led by Editorial Director Lindsay Powers; and Yahoo Music is led by Executive Editor of Entertainment Josh Wolk. In addition, we hired Yahoo TV Editor-in-Chief Kristen Baldwin; and announced José Mourinho as exclusive Global Football Ambassador for 2014 in the lead up to the World Cup. |
4
Table of Contents
Products:
In 2014, we accelerated the pace of innovation, launching more than three dozen new product experiences to strengthen and expand our core products. We also continued our investment in original content.
| • | Search: |
| • | We entered into a five-year global partnership with Mozilla to make Yahoo the default search experience on Mozilla’s Firefox browser across mobile and PC. The agreement also provides a framework for exploring future product integrations and distribution opportunities to other markets. We announced a partnership with Yelp to showcase user reviews, business information, and star ratings; and we also made Yahoo Search more personal by introducing results for your upcoming, flights, events, packages, and more directly on the search results page when you’re logged in. |
| • | We launched Yahoo Aviate, an intelligent homescreen that simplifies your Android phone. We also added two Spaces - the Listening Space and Moving Space - our auto-categorization and contextual feature that surfaces information to your homescreen the moment it’s useful. Aviate is localized across nine languages and, in the U.S., we also launched Search on Aviate, connecting users to their apps, contacts and the Web. |
| • | Communications: |
| • | We launched a new version of Yahoo Mail for iPhone, iPad and Android; and added a personalized news experience plus travel and event notifications on the Yahoo Mail app. We also launched Paperless Post stationery designs for Yahoo Mail. |
| • | Additional launches included new navigation for Yahoo Answers; Yahoo Games Network; we added local news, commenting and other functions on the Yahoo App on Android and iOS in the U.S.; and added animated local weather conditions to Yahoo Weather on Android. |
| • | Digital Content: |
| • | We launched Yahoo News Digest for iPhone, iPad, iPod touch and Android, and rolled out international and Canadian editions. Notably, Yahoo News Digest won the Apple Design Award 2014. |
| • | We launched Yahoo Tech, Yahoo Food, Yahoo Health, Yahoo Style, Yahoo Travel, Yahoo Beauty, Yahoo Movies (U.S. & U.K.), Yahoo Music, Yahoo Makers, and Yahoo Parenting; and announced support for Digital Magazines for Android and iOS. |
| • | Yahoo was the technology provider for the Quicken Loans Billion Dollar Bracket Challenge with Yahoo Sports; launched a new version of Yahoo Sports optimized for iOS 7; we launched Fantasy Football for iOS and Android leveraging original content from both Yahoo Sports Fantasy experts and NFL writers; Yahoo Sports World Football Pick‘em launched as the World Cup 2014 kicked off; announced a partnership with Samsung Smart TV to provide viewers with the Yahoo Fantasy Football TV experience; and we launched NFL Now on Yahoo across devices including PC, iPhone and iPad. |
| • | We invested in the first two original comedies in our new lineup of long-form shows: “Other Space” and “Sin City Saints;” announced that Season Six of “Community” would be coming to Yahoo Screen, as well as the new Live Nation Channel on Yahoo Screen. Both Taylor Swift and Prince provided exclusive content to Yahoo in advance of their album releases. Yahoo Screen launched an integration with Roku and app for Android. Finally, along with The Weinstein Company, we announced that following a successful ten-day pre-theatrical release, the film “One Chance” would be extended on Yahoo Screen. |
5
Table of Contents
| • | We introduced Yahoo Finance Contributors with a roster of new high-profile industry experts including the Najarian brothers; and announced the new Yahoo Finance app. |
| • | Flickr: We launched Flickr for iPhone, iPod Touch, iPad and Android and a new Flickr experience on Apple TV. |
| • | Tumblr: Tumblr continued introducing new experiences and functionality for its users over 2014. Audience grew 14 percent year-over-year and the number of registered blogs grew 33 percent. Mobile monthly users for the mobile app grew by 32 percent. Finally, Tumblr took significant steps to increase revenue by introducing sponsored posts in 2014 and expanding its sales team. |
Traffic:
We saw user growth over 2014. Today we have over one billion monthly active users, including Tumblr. Over 575 million (including Tumblr) of those monthly users come to us via mobile.
Revenue:
We made important progress over 2014 in delivering value to our advertisers and publishers through our new areas of investment: mobile, video, native and social. Our significant investments in mobile in particular paid off, as we are now seeing an increase in revenue. The Mavens offerings generated more than $380 million and $1.1 billion of revenue for the fourth quarter and full year of 2014, respectively.
| • | We introduced Yahoo Advertising—a comprehensive suite of search, video, native and display ad products across Web and mobile. We also launched Yahoo Gemini, a unified marketplace for mobile search and native advertising, and Tumblr Sponsored Posts Powered by Yahoo Advertising. |
| • | We introduced image-rich native ads designed to be mobile-first, seamlessly integrated with content, and targeted to the right consumer to drive results. We also extended native ads globally. We also launched Yahoo Recommends, which brings Yahoo’s content personalization technology and native ads to publishers across the Web, including high-quality publisher sites CBSi, VOX Media and Hearst. |
| • | We closed the acquisition of Flurry, a mobile data analytics company that optimizes mobile experiences for developers, marketers, and consumers. |
| • | We closed the acquisition of BrightRoll, which will help us strengthen our video advertising platform. |
| • | We announced that U.S. advertisers with managed accounts can use Yahoo Gemini to promote their apps across the Yahoo Properties and Affiliate sites. Yahoo also expanded the cross-screen capabilities of video advertising for advertisers by integrating in-app inventory from Flurry’s Marketplace. |
Our Business
User Offerings
With hundreds of Search partners, a world-class mail platform, three industry-leading verticals (News, Sports and Finance), a growing video content offering, the photo resources of Flickr and the social reach of Tumblr, we play an important role in the digital lives of our more than 1 billion monthly users on Yahoo Properties.
6
Table of Contents
Our user offerings include:
Search
Yahoo Search serves as a starting point to navigate the Internet and discover information that matters to users, offering rich search results ranked and organized based on their relevance to the query. Our Search continues to evolve to help users find the right information at the right time.
Under our Search and Advertising Services and Sales Agreement (“Search Agreement”) with Microsoft Corporation (“Microsoft”), Microsoft is the exclusive algorithmic and paid search advertising services provider on Yahoo Properties on desktop computers and non-exclusive provider of such services on Affiliates sites and for mobile devices. Yahoo continues to develop and launch features around the results to enhance the search experience for our users, whether on mobile phone, tablet, or PC. These features include rich results, contextual search results, personalized results, related topic suggestions and more.
Yahoo Answers enables users to seek, discover and share knowledge and opinions across mobile phones, tablets and PC.
Yahoo Aviate is a launcher application built for Android phones that helps users organize their phone applications and access the information that is most useful to them at the moment they need it.
Communications
Yahoo Mail connects users to the people and things that are most important to them across mobile phones, tablets and PC. In addition to mail, we offer users integrated contacts, calendar and messaging products, all outfitted with one terabyte of storage and beautiful photo themes, and our mobile apps bring our users personalized news streams and updates from our other content verticals like Sports, Finance, and Weather.
Yahoo Messenger is an instant messaging service that provides an interactive and personalized way for users to connect, communicate and share experiences on a real-time basis. Similar to mail, we connect users across mobile phones, tablets and PC.
Yahoo Groups allows users to join groups based on shared interests and involvements, providing access to messages, event calendars, polls and other shared information.
Digital Content
Yahoo.com brings together current and relevant news and information—including Yahoo original content and partner content—curated by editors from across the Web. Our homepage is optimized to deliver a consistent experience across mobile phones, tablets and PC.
Visitors on the Yahoo Homepage can see a preview of their mail inbox, local weather, stock quotes, sports scores, comics, and more. Our Yahoo Properties, generate revenue from display and search advertising, as well as from fee-based services. Many of our Yahoo Properties are also available in mobile-optimized versions for display on mobile phones and tablets and as native applications across different operating platforms for iOS and Android phones and tablets.
Yahoo Sports serves one of the largest audiences of digital sports enthusiasts in the world. Yahoo Sports is anchored by Fantasy Sports, editorial reporting, real-time scores, statistics and breaking news, coverage of the biggest global sports events, and premium college sports coverage through
7
Table of Contents
our Rivals publisher network. With award-winning writers, a leading fantasy platform and live game tracking, Yahoo Sports delivers experiences for every fan, every day. During 2014, we delivered new enhancements to our experiences, including:
| • | Fantasy Sports: Increased mobile offerings, such as push notifications and a unified app for all of our games. We maintained our status as the official fantasy game for the NBA, NHL, and MLB. |
| • | Mobile: Yahoo Sports app expanded into six additional countries and incorporated video highlights from our relationships with the NFL, NBA and NHL. |
| • | Global events: Launched dedicated mobile and PC sites to cover the Winter Olympics in Sochi and the FIFA World Cup in Brazil, featuring original and partner content, fantasy games, and live scores. |
Yahoo Finance provides a comprehensive set of financial data, information, and tools that help users make informed financial decisions. Yahoo Finance features a robust content offering that is a mix of original editorial and syndicated news via relationships with several third-party providers and is available on mobile phones, tablets and PC.
Yahoo Weather provides users with real-time weather conditions and information for their favorite cities and locations and is available internationally on mobile phones, tablets, and PC. In 2014, we brought animated weather effects and daily push notifications into our mobile apps to further bring users’ weather to life.
Yahoo News, Entertainment and Lifestyles are a collection of digital magazines focused on emerging trends and subject matter that our users are most passionate about. Digital magazines available include: Yahoo Tech, Yahoo Food, Yahoo Health, Yahoo Style, Yahoo Travel, Yahoo Beauty, Yahoo Movies (U.S. & U.K.), Yahoo Music, Yahoo Makers, and Yahoo Parenting. Each magazine features content from industry leading editors, premium partners, and select user generated content. The digital magazine designs provide experiences around a specific content topic and passion area packaged together with pictures and video that capture user’s attention across all devices. Features include visually driven content streams; trusted editorial voices; social sharing capabilities; entertaining and inspiring brand content; and elegant display across all devices. The digital magazines also include engaging native ads that are part of the experience, designed to be as engaging as the editorial content. In addition to digital magazines, the Yahoo News Digest app brings users twice-daily summaries of top new stories and breaking events on iOS and Android phones.
Yahoo Screen is a video destination site and application where users can easily flip through their favorite channels to stay informed and entertained. Users are also alerted to featured live events, such as concerts and breaking news. Screen is currently available on PC, iOS and Android mobile devices, and TV-based platforms such as Apple TV and Roku. We also added new channel partners such as LiveNation (which features a live concert every day for a year), Vevo, and NFL.
Flickr
Flickr is a web and mobile photo management and sharing service that makes it easy for users to upload, store, organize, and share their photos. Flickr offers all members one terabyte of free storage. Members also have the ability to purchase printed photo merchandise.
Tumblr
Tumblr offers a web platform and mobile applications (particularly on the iOS and Android platforms) that allow users to create, share, and curate content of all kinds—including images, video, audio, and
8
Table of Contents
text, and to consume media around their interests and passions in the Tumblr Dashboard stream. Tumblr’s primary form of monetization is native brand advertising to users, primarily through a variety of ad products based on Tumblr Sponsored Posts (company-sponsored blogs that are reblogged and shared across Tumblr users.) In addition, Tumblr generates revenue by enabling a marketplace for the sale of third-party developed blog themes and licensing its real-time feed of user-generated content.
Advertiser Offerings
As one of the Web’s largest publishers and the owner of leading properties across multiple content categories, Yahoo provides a canvas of personalized experiences where advertisers can connect with users in a meaningful way. Yahoo is a digital publisher and advertising technology provider that enables advertisers to reach their business objectives, from high-impact branding campaigns that generate awareness among consumers to tactical campaigns that drive specific audiences to action. We provide a unified approach to digital advertising across search, native, audience, premium display, and video advertising—across platforms and devices, including mobile and PC. These products are supported by Yahoo’s technology platform, data and analytical tools, with insights into the digital habits of more than 1 billion people worldwide.
Search Advertising
The Yahoo Bing Network connects advertisers with an audience of hundreds of millions of users, with the support of strategic account teams, reporting, analytics, and extensive campaign controls. Yahoo continues to focus on developing new search ad formats to engage users across devices, including personalized search retargeting, click-to-call functionality in search ads, sitelink extensions, location extensions, product ads and more.
Display Advertising
Native Advertising. Enables advertisers to engage their audience across devices and formats on Yahoo’s network of consumer products and exclusive publishing partners. Yahoo’s native advertising offerings include Yahoo Stream Ads served within content streams across our media properties and in Yahoo Mail and within Yahoo Recommends, a personalized content recommendations and native advertising experience, as well as HD-quality image-rich ads served within native image environments and slideshows; and Tumblr Sponsored Posts—all powered by Yahoo’s advertising platforms and user data. Because native ads are a seamless part of a user’s experience, they allow advertisers to connect with users in a compelling and impactful way, driving awareness and performance.
Audience Targeting. Yahoo Audience Ads allow advertisers to benefit from the deep consumer relationships Yahoo has with over 1 billion users and connect with their desired audience across display, video and mobile ads. Yahoo Audience Ads deliver the right messages to the right users across Yahoo, exclusive publishing partners, and public exchange-traded sites with the scale and targeting precision of real-time programmatic buying. Yahoo Audience Ads offer data-driven ad buying, optimized with enhanced analytics. Combining Yahoo’s proprietary user data with advertiser’s own data and third-party data enables Yahoo to leverage a comprehensive audience data set and provides a compelling audience buying solution.
Premium Advertising. Yahoo Premium Ads offer a digital advertising canvas for brand and performance advertisers on the Web. We offer high-impact advertising opportunities on the Yahoo Homepage; Yahoo’s leading vertical content properties; Yahoo Mail; program sponsorships of major events; and premium video placements—all with custom integrations, personalization and targeting that unite advertisers’ brands with consumers’ digital habits.
9
Table of Contents
Video Advertising. Yahoo Video provides brands with a full set of solutions for reaching their target audience at scale with digital video ads across both Yahoo and leading ad exchanges. Anchored by Yahoo’s award-winning original programming and world-class partner content, Yahoo Video connects brands to their target audience at scale through a complete set of advertising opportunities including video channels, video programs, audience targeting, branded entertainment, and live events with ad placements that occur before, during, and after a video rolls. Additionally, Yahoo connects programmatically to all of the leading exchanges, offering advertisers additional scale and reach.
AD Platforms
Yahoo Gemini (formerly known as Yahoo Ad Manager) is a simplified powerful marketplace that gives advertisers direct, hands-on access to Yahoo’s advertising products. Yahoo mobile search ads and native ads are available through Yahoo Gemini, with a simple user interface that helps advertisers get ads online in a matter of minutes, with insights and analytics built in.
Yahoo Ad Manager Plus enables larger advertisers to plan, execute and optimize complex display ad campaigns directly, giving them greater control over the performance of their ads on Yahoo and third-party programmatic inventory. Yahoo offers managed services through Yahoo Ad Manager Plus for advertisers who want custom audience definition, richer campaign measurement and insights, access to exclusive inventory, varied pricing options, and full-service campaign optimization.
APT is an internal ad management platform that handles our owned and operated premium inventory, sold in a direct, guaranteed fashion.
BrightRoll offers a video demand side platform, ad network and publisher marketplace, enabling the buying and selling of video inventory across the digital advertising ecosystem.
Flurry offers both sell and buy side platforms, focused in native advertising and mobile application publishers.
Yahoo Ad Exchange is a platform that enables advertisers to easily target global audiences across Yahoo Properties, Affiliate sites and other publisher sites on mobile and the Web.
Product Development
Yahoo continually launches, improves, and scales products and features to meet evolving user, advertiser, and publisher needs. Most of our software products and features are developed internally by our employees. In some instances, however, we might purchase technology and license intellectual property rights if the opportunity is strategically aligned, operationally compatible, and economically advantageous. While it may be necessary in the future to seek or renew licenses relating to various aspects of our products, we believe based on past experience and industry practice that such licenses generally could be obtained on commercially-reasonable terms. We believe our continuing innovation and product development are not materially dependent upon any single license or other agreement with a third party relating to the development of our products.
Yahoo’s product teams include a broad array of engineering and product talent and support a large portion of the Yahoo product portfolio and technology infrastructure. Our product teams have expertise in consumer applications (Web/Mobile), scalable software platforms, information retrieval, machine learning and science, editorial, networking/communications technologies, and presentation layer frameworks.
10
Table of Contents
Our engineering and production teams are primarily located in our Sunnyvale, California, headquarters, Bangalore, India, and Beijing, China. Product development expenses for 2012, 2013, and 2014 totaled approximately $886 million, $1 billion, and $1.2 billion, respectively, which included stock-based compensation expense of $74 million, $83 million, and $139 million, respectively.
M&A Activity
As part of our overall strategy, we focused on acquisitions in 2014 that help us achieve three different goals. The first is to grow our technical talent base. Second, is to enhance our technology and core products offerings. Third, is to expand audience and engagement.
We expect to make additional acquisitions and strategic investments in the future.
Global Operations
We manage our business geographically. The primary areas of measurement and decision-making are Americas, EMEA (Europe, Middle East, and Africa), and Asia Pacific. Additional information required by this item is incorporated herein by reference to Note 18—“Segments” of the Notes to our consolidated financial statements, which appears in Part II, Item 8 of this Annual Report on Form 10-K.
We own a majority or 100 percent of all of these international operations (except in Australia, New Zealand and Japan where we have joint ventures and/or noncontrolling interests). We support these businesses through a network of offices worldwide.
Revenue is primarily attributed to individual countries according to the international online property that generated the revenue.
Information regarding risks involving our international operations is included in Part I, Item 1A “Risk Factors” of this Annual Report on Form 10-K and is incorporated herein by reference.
Sales
We sell our advertising services through three primary channels: field, mid-market, and reseller/small business. Our field advertising sales team sells display advertising in all markets and search advertising to premium advertisers under the Search Agreement with Microsoft. Our mid-market channel sells our advertising services to medium-sized businesses, while our reseller/small business channel allows us to sell advertising services to additional regional and small business advertisers. Our U.S. sales force is structured vertically, which allows us to offer customers integrated customer-centric solutions. We believe this approach allows us to provide the best solutions across all of our products based on a deeper understanding of our customers’ businesses.
In the U.S., we employ sales professionals in multiple locations, including Atlanta, Boston, Burbank, Chicago, Dallas, Detroit, Hillsboro, Los Angeles, Miami, New York, Omaha, San Francisco, and Sunnyvale. In international markets, we either have our own internal sales professionals or rely on our established sales agency relationships in more than 50 countries, regions, and territories.
No individual customer represented more than 10 percent of our revenue in 2012, 2013, or 2014. Revenue under the Search Agreement represented approximately 25 percent, 31 percent, and 35 percent of our revenue for the years ended December 31, 2012, 2013 and, 2014, respectively.
11
Table of Contents
Internet usage is subject to seasonal fluctuations, typically declining during customary summer vacation periods and increasing during the fourth quarter holiday period due to higher online retail activity. These seasonal patterns have affected, and we expect will continue to affect, our business and quarterly sequential revenue growth rates.
Marketing
Yahoo is one of the most recognized brands in the world. Our products, services, and content enable us to attract, retain, and engage users, advertisers, and publishers. Our marketing teams engage in each step of the development, deployment, and management of products and services, and in content design. Our marketing team will help shape our offerings to better market them to our potential and existing users.
Competition
We face significant competition from online search engines, sites offering integrated internet products and services, social media and networking sites, e-commerce sites, and broadcast and print media. We also compete with advertising networks, exchanges, demand side platforms and other platforms, such as Google AdSense, DoubleClick Ad Exchange, AOL’s Ad.com and Microsoft Media Network, as well as traditional media companies for a share of advertisers’ marketing budgets and in the development of the tools and systems for managing and optimizing advertising campaigns.
Our competitors include Google, Facebook, Microsoft, and AOL. Several of our competitors offer an integrated variety of Internet products, advertising services, technologies, online services and/or content in a manner similar to us that compete for the attention of our users, advertisers, developers and third-party Website publishers. We also compete with these companies to obtain agreements with third parties to promote or distribute our services. In addition, we compete with social media and networking sites which are attracting an increasing share of users, users’ online time and online advertising dollars.
In a number of international markets, especially those in Asia, Europe, the Middle East and Latin America, we face substantial competition from local Internet service providers and other entities that offer search, communications, and other commercial services and often have a competitive advantage due to dominant market share in their territories, greater local brand recognition, focus on a single market, familiarity with local tastes and preferences, or greater regulatory and operational flexibility.
Yahoo’s competitive advantage centers on the fact that we are a guide focused on making user’s digital habits inspiring and entertaining—this includes daily activities like communicating, searching, reading and sharing information. We believe our principal competitive strengths include the usefulness, accessibility, integration, and personalization of the online services that we offer; the quality, personalization, and presentation of our search results; and the overall user experience on our leading premium content properties and other Yahoo Properties. Our principal competitive strengths relating to attracting advertisers and publishers are the reach, effectiveness, and efficiency of our marketing services as well as the creativity of the marketing solutions that we offer. “Reach” is the size of the audience and/or demographic that can be accessed through the Yahoo Network. “Effectiveness” for advertisers is the achievement of marketing objectives, which we support by developing campaigns, measuring the performance of these campaigns against their objectives, and optimizing their objectives across the Yahoo Network. “Effectiveness” for publishers is the monetization of their online audiences. “Efficiency” is the simplicity and ease of use of the services we offer advertisers and publishers.
12
Table of Contents
Additional information regarding competition is included in Part I, Item 1A “Risk Factors” of this Annual Report on Form 10-K and is incorporated herein by reference.
Intellectual Property
We create, own, and maintain a wide array of intellectual property assets that we believe are among our most valuable assets. Our intellectual property assets include patents and patent applications related to our innovations, products and services; trademarks related to our brands, products and services; copyrights in software and creative content; trade secrets; and other intellectual property rights and licenses of various kinds. We seek to protect our intellectual property assets through patents, copyrights, trade secrets, trademarks and laws of the U.S. and other countries, and through contractual provisions. We enter into confidentiality and invention assignment agreements with our employees and contractors, and utilize non-disclosure agreements with third parties with whom we conduct business in order to secure and protect our proprietary rights and to limit access to, and disclosure of, our proprietary information. We consider the Yahoo! trademark and our many related company brands to be among our most valuable assets, and we have registered these trademarks in the U.S. and other countries throughout the world and actively seek to protect them. We have licensed in the past, and expect that we may license in the future, certain of our technology and proprietary rights, such as trademark, patent, copyright, and trade secret rights, to third parties.
Additional information regarding certain risks related to our intellectual property is included in Part I, Item 1A “Risk Factors” of this Annual Report on Form 10-K and is incorporated herein by reference.
Employees
As of December 31, 2014, we had approximately 12,500 full-time employees and fixed term contractors. Our future success is substantially dependent on the performance of our senior management and key technical personnel, as well as our continuing ability to attract, maintain the caliber of, and retain highly qualified technical, executive, and managerial personnel. Additional information regarding certain risks related to our employees is included in Part I, Item 1A “Risk Factors” of this Annual Report on Form 10-K and is incorporated herein by reference.
Available Information
Our Website is located at http://www.yahoo.com. Our investor relations Website is located at http://investor.yahoo.net. We make available free of charge on our investor relations Website under “Financial Info” our Annual Reports on Form 10-K, Quarterly Reports on Form 10-Q, Current Reports on Form 8-K, and any amendments to those reports as soon as reasonably practicable after we electronically file or furnish such materials to the U.S. Securities and Exchange Commission (“SEC”). The SEC maintains a Website that contains reports, proxy and information statements, and other information regarding our filings at http://www.sec.gov.
We face significant competition for users, advertisers, publishers, developers, and distributors.
We face significant competition from online search engines, sites offering integrated internet products and services, social media and networking sites, e-commerce sites, and broadcast and print media. In a number of international markets, especially those in Asia, Europe, the Middle East and Latin America, we face substantial competition from local Internet service providers and other entities that offer search, communications, and other commercial services.
13
Table of Contents
Several of our competitors offer an integrated variety of Internet products, advertising services, technologies, online services and content in a manner similar to Yahoo. We compete against these and other companies to attract and retain users, advertisers, developers, and third-party Website publishers as participants in our Affiliate network, and to obtain agreements with third parties to promote or distribute our services. We also compete with social media and networking sites which are increasingly used to communicate and share information, and which are attracting a substantial and increasing share of users, users’ online time, and online advertising dollars.
A key element of our strategy is focusing on mobile products and mobile advertising formats, as well as increasing our revenue from mobile. A number of our competitors have devoted significant resources to the development of products, services and apps for mobile devices. Several of our competitors have mobile revenue significantly greater than ours. If we are unable to develop products for mobile devices that users find engaging and that help us grow our mobile revenue, our competitive position, our financial condition and operating results could be harmed.
In addition, a number of competitors offer products, services and apps that directly compete for users with our offerings, including e-mail, search, video, social, sports, news, finance, micro-blogging, and messaging. Similarly, our competitors or other participants in the online advertising marketplace offer advertising exchanges, ad networks, demand side platforms, ad serving technologies, sponsored search offerings, and other services that directly compete for advertisers with our offerings. Additionally, as the use of programmatic advertising continues to increase, we compete with companies that have also invested in programmatic platform offerings. We also compete with traditional print and broadcast media companies to attract domestic and international advertising spending. Some of our existing competitors and possible entrants have greater brand recognition for certain products, services and apps, more expertise in particular market segments, and greater operational, strategic, technological, financial, personnel, or other resources than we do. Many of our competitors have access to considerable financial and technical resources with which to compete aggressively, including by funding future growth and expansion and investing in acquisitions, technologies, and research and development. Further, emerging start-ups may be able to innovate and provide new products, services and apps faster than we can. In addition, competitors may consolidate or collaborate with each other, and new competitors may enter the market. Some of our competitors in international markets have a substantial competitive advantage over us because they have dominant market share in their territories, have greater local brand recognition, are focused on a single market, are more familiar with local tastes and preferences, or have greater regulatory and operational flexibility due to the fact that we may be subject to both U.S. and foreign regulatory requirements.
If our competitors are more successful than we are in developing and deploying compelling products or in attracting and retaining users, advertisers, publishers, developers, or distributors, our revenue and growth rates could decline.
We generate the majority of our revenue from search and display advertising, and the reduction in spending by or loss of current or potential advertisers would cause our revenue and operating results to decline.
For the twelve months ended December 31, 2014, 79 percent of our total revenue came from search and display advertising. Our ability to retain and grow search and display revenue depends upon:
| • | maintaining and growing our user base and popularity as an Internet destination site; |
| • | maintaining the popularity of our existing products, introducing engaging new products and making our new and existing products popular and distributable on mobile and other alternative devices and platforms; |
14
Table of Contents
| • | maintaining and expanding our advertiser base on PCs and mobile devices; |
| • | achieving a better traffic mix from our Yahoo Properties and Affiliates and improving our monetization rates on such traffic; |
| • | broadening our relationships with advertisers to small- and medium-sized businesses; |
| • | successfully implementing changes and improvements to our advertising management platforms and formats and obtaining the acceptance of our advertising management platforms by advertisers, Website publishers, and online advertising networks; |
| • | successfully acquiring, investing in, and implementing new technologies and strategic partnerships; |
| • | successfully implementing changes in our sales force, sales development teams, and sales strategy; |
| • | continuing to innovate and improve the monetization capabilities of our display and native advertising and our mobile products; |
| • | effectively monetizing mobile and other search queries; |
| • | continuing to innovate and improve users’ search experiences; |
| • | maintaining and expanding our Affiliate program for search and display advertising services; and |
| • | deriving better demographic and other information about our users to enable us to offer better experiences to both our users and advertisers. |
In most cases, our agreements with advertisers have a term of one year or less, and may be terminated at any time by the advertiser or by us. Search marketing agreements often have payments dependent upon usage or click-through levels. Accordingly, it is difficult to forecast search and display revenue accurately. In addition, our expense levels are based in part on expectations of future revenue, including any guaranteed minimum payments to our Affiliates in connection with search and/or display advertising, and in some cases, the expenses could exceed the revenue that we generate. The state of the global economy, growth rate of the online advertising market, and availability of capital impacts the advertising spending patterns of our existing and potential advertisers. Any reduction in spending by, or loss of, existing or potential advertisers would negatively impact our revenue and operating results. Further, we may be unable to adjust our expenses and capital expenditures quickly enough to compensate for any unexpected revenue shortfall.
As more people access our products via mobile devices rather than PCs and mobile advertising continues to evolve, if we do not continue to grow our mobile users and revenue, our financial results will be adversely impacted.
The number of people who access the Internet through mobile devices rather than a PC, including mobile telephones, smartphones and tablets, is increasing and will likely continue to increase dramatically. Over 575 million (including Tumblr) of our monthly users are now joining us on mobile devices. In addition, search queries are increasingly being undertaken through mobile devices. As a result, our ability to grow advertising revenue is increasingly dependent on our ability to generate revenue from ads displayed on mobile devices.
A key element of our strategy is focusing on mobile devices and we expect to continue to devote significant resources to the creation and support of developing new and innovative mobile products, services and apps. However, if our new mobile products, services and apps, including new forms of Internet advertising for mobile devices, do not continue to attract and retain mobile users, advertisers
15
Table of Contents
and device manufacturers and to generate and grow mobile revenue, our operating and financial results will be adversely impacted. We are dependent on the interoperability of our products and services with mobile operating systems we do not control and we may not be successful in maintaining relationships with the key participants in the mobile industry that control such mobile operating systems. The manufacturer or access provider might promote a competitor’s or its own products and services, impair users’ access to our services by blocking access through their devices, make it hard for users to readily discover, install, update or access our products on their devices, or charge us for delivery of ads, or limit our ability to deliver ads or measure their effectiveness. If distributors impair access to or refuse to distribute our services or apps, or charge for or limit our ability to deliver ads or measure the effectiveness of our ads, then our user engagement and revenue could decline.
If we do not manage our operating expenses effectively, our profitability could decline.
We plan to continue to manage costs to better and more efficiently manage our business. However, our operating expenses might increase as we expand our operations in areas of desired growth, continue to develop and extend the Yahoo brand, fund product development, expand data centers, acquire additional office space, and acquire and integrate complementary businesses and technologies. If our expenses increase at a greater pace than our revenue, or if we fail to effectively manage costs, our profitability will decline.
If we are unable to provide innovative search experiences and other products and services that generate significant traffic to our Websites, our business could be harmed, causing our revenue to decline.
Internet search is characterized by rapidly changing technology, significant competition, evolving industry standards, and frequent product and service enhancements. Even though we have substantially completed the transition of paid search to Microsoft’s platform, we still need to continue to invest and innovate to improve our users’ search experience to continue to attract, retain, and expand our user base and paid search advertiser base. We also need to continue to invest in and innovate on the mobile search experience. Pursuant to the Search Agreement with Microsoft, we are also dependent on Microsoft to continue to invest and innovate to maintain and improve its algorithmic and paid search services.
We generate revenue through other online products, services and apps, and continue to innovate the products, services and apps that we offer. The research and development of new, technologically advanced products is a complex process that requires significant levels of innovation and investment, as well as accurate anticipation of technology, market and consumer trends. If we are unable to provide innovative products and services which gain user acceptance and generate significant traffic to our Websites, or if we are unable to effectively monetize the traffic from new products and services, our business could be harmed, causing our revenue to decline.
Risks associated with our Search Agreement with Microsoft may adversely affect our business and operating results.
Under our Search Agreement with Microsoft, Microsoft is the exclusive algorithmic and paid search services provider on Yahoo Properties on PCs and non-exclusive provider of such services on Affiliate sites and for mobile devices for the transitioned markets. Approximately 35 percent, 31 percent, and 25 percent of our revenue for 2014, 2013 and 2012, respectively, were attributable to the Search Agreement. Our business and operating results would be adversely affected by a significant decline in or loss of this revenue.
16
Table of Contents
Implementation of our Search Agreement with Microsoft commenced on February 23, 2010. We have completed the transition of our algorithmic search platform to Microsoft’s platform and have substantially completed transition of paid search. Pursuant to the Search Agreement with Microsoft, to maintain and grow search revenue, we are dependent on Microsoft continuing to invest and innovate to maintain and improve its algorithmic and paid search services and to be competitive with other search providers. If Microsoft fails to do this, our revenue and profitability could decline and our ability to maintain and expand our relationships with Affiliates for search and paid search advertising could be negatively impacted. Further, our competitors may continue to increase revenue, profitability, and market share at a higher rate than we do.
In addition to other termination rights, as of February 23, 2015 (the fifth anniversary of the commencement date of the Search Agreement), for a period of 30 days following such date, the Company has the right to terminate the Search Agreement if the trailing 12-month average of the Company’s revenue per search in the United States (the “U.S. RPS”) on Yahoo Properties is less than a specified percentage of Google’s trailing 12-month estimated average U.S. RPS, excluding, in each case, mobile devices. Termination of the Search Agreement, or disputes with Microsoft related to a termination of the Search Agreement, could have an adverse impact on our business, revenue and operating results.
Our proposed plan to spin off all of our remaining holdings in Alibaba Group is subject to certain conditions and there can be no assurance that the spin-off will be completed or that the expected benefits from the proposed spin-off to Yahoo and its stockholders will be realized.
We have announced a plan for a spin-off of all of our remaining holdings in Alibaba Group and a current operating business of Yahoo, Yahoo Small Business, into a newly formed independent registered investment company (referred to as “SpinCo”). The stock of SpinCo will be distributed pro rata to our stockholders, resulting in SpinCo becoming a separate publicly traded registered investment company.
The completion of the spin-off is subject to certain conditions, including final approval by our Board, receipt of a favorable ruling from the Internal Revenue Service with respect to certain aspects of the transaction and a legal opinion with respect to the tax-free treatment of the transaction under U.S. federal tax laws and regulations, the effectiveness of an applicable registration statement with the Securities and Exchange Commission, and compliance with the requirements under the Investment Company Act of 1940. Possible delays or the failure in satisfying the above-described conditions or other factors, including adverse regulatory developments or determinations or adverse changes in, or interpretations of, U.S. or foreign tax laws, rules or regulations, or required third party consents, could delay or prevent completion of the proposed spin-off or cause the terms of the proposed spin-off to be materially modified. In addition, we expect that the process of completing the proposed spin-off will involve dedication of significant resources and the incurrence of significant costs and expenses. Further, there can be no assurance that the expected benefits from the proposed spin-off to Yahoo and its stockholders will be realized.
If we are unable to license or acquire compelling content and services at reasonable cost, develop or commission compelling content of our own or receive compelling content from our users, the number of users of our services may not grow as anticipated, or may decline, or users’ level of engagement with our services may decline, all of which could harm our operating results.
Our future success depends in part on our ability to aggregate compelling content and deliver that content through our online properties. We license from third parties much of the content and services on our online properties, such as news, stock quotes, weather, video, and maps. In addition, our users also contribute content to us. We believe that users will increasingly demand high-quality content and services. We may need to make substantial payments to third parties from whom we
17
Table of Contents
license or acquire such content or services. Our ability to maintain and build relationships with such third-party providers is critical to our success. In addition, as users increasingly access the Internet via mobile and other alternative devices, we may need to enter into amended agreements with existing third-party providers to cover the new devices. We may be unable to enter into new, or preserve existing, relationships with the third-parties whose content or services we seek to obtain. In addition, as competition for compelling content increases both domestically and internationally, our third-party providers may increase the prices at which they offer their content and services to us, stop offering their content or services to us, or offer their content and services on terms that are not agreeable to us. An increase in the prices charged to us by third-party providers could harm our operating results and financial condition. Further, because many of our content and services licenses with third parties are non-exclusive, other media providers may be able to offer similar or identical content. This increases the importance of our ability to deliver compelling editorial content and personalization of this content for users in order to differentiate Yahoo from other businesses. If we are unable to license or acquire compelling content at reasonable cost, if other companies distribute content or services that are similar to or the same as that provided by us, if we do not develop or commission compelling editorial content (including personalized content), or if we do not receive compelling content from our users, the number of users of our services may not grow as anticipated, or may decline, or users’ level of engagement with our services may decline, all or any of which could harm our operating results.
Acquisitions and strategic investments could result in adverse impacts on our operations and in unanticipated liabilities.
We have acquired, and have made strategic investments in, a number of companies (including through joint ventures) in the past, and we expect to make additional acquisitions and strategic investments in the future. Such transactions may result in use of our cash resources, dilutive issuances of our equity securities, or incurrence of debt. Such transactions may also result in amortization expenses related to intangible assets. Our acquisitions and strategic investments to date were accompanied by a number of risks, including:
| • | the difficulty of integrating the operations, personnel, systems, and controls of acquired companies as a result of cultural, regulatory, systems, and operational differences; |
| • | the potential disruption of our ongoing business and distraction of management; |
| • | the incurrence of additional operating losses and operating expenses of the businesses we acquired or in which we invested; |
| • | the difficulty of integrating acquired technology and rights into our services and unanticipated expenses related to such integration; |
| • | the failure to successfully further develop an acquired business or technology and any resulting impairment of amounts currently capitalized as intangible assets; |
| • | the failure of strategic investments to perform as expected or to meet financial projections; |
| • | the potential for patent and trademark infringement and data privacy and security claims against the acquired companies, or companies in which we have invested; |
| • | litigation or other claims in connection with acquisitions, acquired companies, or companies in which we have invested; |
| • | the impairment or loss of relationships with customers and partners of the companies we acquired or in which we invested or with our customers and partners as a result of the integration of acquired operations; |
18
Table of Contents
| • | the impairment of relationships with, or failure to retain, employees of acquired companies or our existing employees as a result of integration of new personnel; |
| • | our lack of, or limitations on our, control over the operations of our joint venture companies; |
| • | in the case of foreign acquisitions and investments, the impact of particular economic, tax, currency, political, legal and regulatory risks associated with specific countries; and |
| • | the impact of known potential liabilities or liabilities that may be unknown, including as a result of inadequate internal controls, associated with the companies we acquired or in which we invested. |
We are likely to experience similar risks in connection with our future acquisitions and strategic investments. Our failure to be successful in addressing these risks or other problems encountered in connection with our past or future acquisitions and strategic investments could cause us to fail to realize the anticipated benefits of such acquisitions or investments, incur unanticipated liabilities, and harm our business generally.
We may be required to record a significant charge to earnings if our goodwill, amortizable intangible assets, investments in equity interests, or other investments become impaired.
We are required under generally accepted accounting principles to test goodwill for impairment at least annually and to review our amortizable intangible assets, investments in equity interests (including investments held by any equity method investee), and our other investments, for impairment when events or changes in circumstance indicate the carrying value may not be recoverable. Factors that could lead to impairment of goodwill, amortizable intangible assets (including goodwill or assets acquired via acquisitions) and other investments include significant adverse changes in the business climate and actual or projected operating results (affecting our company as a whole or affecting any particular reporting unit) and declines in the financial condition of our business. Factors that could lead to impairment of investments in equity interests include a prolonged period of decline in the stock price or operating performance of, or an announcement of adverse changes or events by, the companies in which we invested or the investments held by those companies. Factors that could lead to an impairment of U.S. government securities, which constitute a significant portion of our current assets, include any downgrade of U.S. government debt or concern about the creditworthiness of the U.S. government. We have recorded and may be required in the future to record additional charges to earnings if our goodwill, amortizable intangible assets, investments in equity interests, including investments held by any equity method investee, or other investments become impaired. Any such charge would adversely impact our financial results.
Our business depends on a strong brand, and failing to maintain or enhance the Yahoo brands in a cost-effective manner could harm our operating results.
Maintaining and enhancing our brands is an important aspect of our efforts to attract and expand our user, advertiser, and Affiliate base. We believe that the importance of brand recognition will increase due to the relatively low barriers to entry in certain portions of the Internet market. Maintaining and enhancing our brands will depend largely on our ability to provide high-quality, innovative products, and services, which we might not do successfully. We have spent and expect to spend considerable money and resources on the establishment and maintenance of our brands, as well as advertising, marketing, and other brand-building efforts to preserve and enhance consumer awareness of our brands. Our brands may be negatively impacted by a number of factors such as service outages, product malfunctions, data protection and security issues, exploitation of our trademarks by others without permission, and poor presentation or integration of our search marketing offerings by Affiliates on their sites or in their software and services.
19
Table of Contents
Further, while we attempt to ensure that the quality of our brands is maintained by our licensees, our licensees might take actions that could impair the value of our brands, our proprietary rights, or the reputation of our products and media properties. If we are unable to maintain or enhance our brands in a cost-effective manner, or if we incur excessive expenses in these efforts, our business, operating results and financial condition could be harmed.
We are regularly involved in claims, suits, government investigations, and other proceedings that may result in adverse outcomes.
We are regularly involved in claims, suits, government investigations, and proceedings arising from the ordinary course of our business, including actions with respect to intellectual property claims, privacy, consumer protection, information security, data protection or law enforcement matters, tax matters, labor and employment claims, commercial claims, as well as actions involving content generated by our users, stockholder derivative actions, purported class action lawsuits, and other matters. Such claims, suits, government investigations, and proceedings are inherently uncertain and their results cannot be predicted with certainty. Regardless of the outcome, such legal proceedings can have an adverse impact on us because of legal costs, diversion of management and other personnel, and other factors. In addition, it is possible that a resolution of one or more such proceedings could result in reputational harm, liability, penalties, or sanctions, as well as judgments, consent decrees, or orders preventing us from offering certain features, functionalities, products, or services, or requiring a change in our business practices, products or technologies, which could in the future materially and adversely affect our business, operating results, and financial condition. See Note 12—“Commitments and Contingencies” in the Notes to our consolidated financial statements.
On May 15, 2013, the Superior Court of Justice for the Federal District of Mexico reversed a judgment of U.S. $2.75 billion that had been entered against us and our subsidiary, Yahoo! Mexico, in a lawsuit brought by plaintiffs Worldwide Directories S.A. de C.V. and Ideas Interactivas, S.A. de C.V. On January 14, 2015, the plaintiffs’ appeal of that decision was denied. On February 16, 2015, the plaintiffs filed a petition for review by the Supreme Court of Mexico, where review is limited to constitutional questions under Mexican law. We believe there is no basis for such review in the matter; however, we cannot assure the ultimate outcome of the matter. If we are ultimately required to pay all or a significant portion of the judgment, together with any potential additional damages, interests and costs, it would have a material adverse effect on our financial condition, results of operations and cash flows. We will also be required to record an accrual for the judgment if we should determine in the future that it is probable that we will be required to pay the judgment.
Our intellectual property rights are valuable, and any failure or inability to sufficiently protect them could harm our business and our operating results.
We create, own, and maintain a wide array of copyrights, patents, trademarks, trade dress, trade secrets, rights to domain names and other intellectual property assets which we believe are collectively among our most valuable assets. We seek to protect our intellectual property assets through patent, copyright, trade secret, trademark, and other laws of the U.S. and other countries of the world, and through contractual provisions. However, the efforts we have taken to protect our intellectual property and proprietary rights might not be sufficient or effective at stopping unauthorized use of those rights. Protection of the distinctive elements of Yahoo might not always be available under copyright law or trademark law, or we might not discover or determine the full extent of any unauthorized use of our copyrights and trademarks in order to protect our rights. In addition, effective trademark, patent, copyright, and trade secret protection might not be available or cost-effective in every country in which our products and media properties are distributed or made available through the Internet. Changes in patent law, such as changes in the law regarding patentable subject matter, could also impact our ability to obtain patent protection for our
20
Table of Contents
innovations. In particular, recent amendments to the U.S. patent law may affect our ability to protect our innovations and defend against claims of patent infringement. Further, given the costs of obtaining patent protection, we might choose not to protect (or not to protect in some jurisdictions) certain innovations that later turn out to be important. There is also a risk that the scope of protection under our patents may not be sufficient in some cases or that existing patents may be deemed invalid or unenforceable. To help maintain our trade secrets, we have entered into confidentiality agreements with most of our employees and contractors, and confidentiality agreements with many of the parties with whom we conduct business, in order to limit access to and disclosure of our proprietary information. If these confidentiality agreements are breached it could compromise our trade secrets and cause us to lose any competitive advantage provided by those trade secrets.
If we are unable to protect our proprietary rights from unauthorized use, the value of our intellectual property assets may be reduced. In addition, protecting our intellectual property and other proprietary rights is expensive and time consuming. Any increase in the unauthorized use of our intellectual property could make it more expensive to do business and consequently harm our operating results.
We are, and may in the future be, subject to intellectual property infringement or other third-party claims, which are costly to defend, could result in significant damage awards, and could limit our ability to provide certain content or use certain technologies in the future.
Internet, technology, media, and patent holding companies often possess a significant number of patents. Further, many of these companies and other parties are actively developing or purchasing search, indexing, electronic commerce, and other Internet-related technologies, as well as a variety of online business models and methods.
We believe that these parties will continue to take steps such as seeking patent protection to protect these technologies. In addition, patent holding companies may continue to seek to monetize patents they have purchased or otherwise obtained. As a result, disputes regarding the ownership of technologies and rights associated with online businesses are likely to continue to arise in the future. From time to time, parties assert patent infringement claims against us. Currently, we are engaged in a number of lawsuits regarding patent issues and have been notified of a number of other potential disputes.
In addition to patent claims, third parties have asserted, and are likely in the future to assert, claims against us alleging infringement of copyrights, trademark rights, trade secret rights or other proprietary rights, or alleging unfair competition, violation of federal or state statutes or other claims, including alleged violation of international statutory and common law. In addition, third parties have made, and may continue to make, infringement and related claims against us over the display of content or search results triggered by search terms, including the display of advertising, that include trademark terms.
As we expand our business and develop new technologies, products and services, we may become increasingly subject to intellectual property infringement and other claims, including those that may arise under international laws. In the event that there is a determination that we have infringed third-party proprietary rights such as patents, copyrights, trademark rights, trade secret rights, or other third-party rights such as publicity and privacy rights, we could incur substantial monetary liability, or be required to enter into costly royalty or licensing agreements or be prevented from using such rights, which could require us to change our business practices in the future, hinder us from offering certain features, functionalities, products or services, require us to develop non-infringing products or technologies, and limit our ability to compete effectively. We may also incur substantial expenses in
21
Table of Contents
defending against third-party claims regardless of the merit of such claims. In addition, many of our agreements with our customers or Affiliates require us to indemnify them for some types of third-party intellectual property infringement claims, which could increase our costs in defending such claims and our damages. Furthermore, such customers and Affiliates may discontinue the use of our products, services, and technologies either as a result of injunctions or otherwise. The occurrence of any of these results could harm our brands or have an adverse effect on our business, financial position, operating results, and cash flows.
If our security measures are breached, our products and services may be perceived as not being secure, users and customers may curtail or stop using our products and services, and we may incur significant legal and financial exposure.
Our products and services involve the storage and transmission of Yahoo’s users’ and customers’ personal and proprietary information in our facilities and on our equipment, networks and corporate systems. Security breaches expose us to a risk of loss of this information, litigation, remediation costs, increased costs for security measures, loss of revenue, damage to our reputation, and potential liability. Outside parties may attempt to fraudulently induce employees, users, or customers to disclose sensitive information to gain access to our data or our users’ or customers’ data. In addition, hardware, software or applications we procure from third parties may contain defects in design or manufacture or other problems that could unexpectedly compromise network and data security. Security breaches or unauthorized access have resulted in and may in the future result in a combination of significant legal and financial exposure, increased remediation and other costs, damage to our reputation and a loss of confidence in the security of our products, services and networks that could have an adverse effect on our business. We take steps to prevent unauthorized access to our corporate systems, however, because the techniques used to obtain unauthorized access, disable or degrade service, or sabotage systems change frequently or may be designed to remain dormant until a triggering event, we may be unable to anticipate these techniques or implement adequate preventative measures. If an actual or perceived breach of our security occurs, the market perception of the effectiveness of our security measures could be harmed and we could lose users and customers.
Changes in regulations or user concerns regarding privacy and protection of user data, or any failure to comply with such laws, could adversely affect our business.
Federal, state, and international laws and regulations govern the collection, use, retention, disclosure, sharing and security of data that we receive from and about our users. The use of consumer data by online service providers and advertising networks is a topic of active interest among federal, state, and international regulatory bodies, and the regulatory environment is unsettled. Many states have passed laws requiring notification to users where there is a security breach for personal data, such as California’s Information Practices Act. We face similar risks in international markets where our products, services and apps are offered. Any failure, or perceived failure, by us to comply with or make effective modifications to our policies, or to comply with any federal, state, or international privacy, data-retention or data-protection-related laws, regulations, orders or industry self-regulatory principles could result in proceedings or actions against us by governmental entities or others, a loss of user confidence, damage to the Yahoo brands, and a loss of users, advertising partners, or Affiliates, any of which could potentially have an adverse effect on our business.
In addition, various federal, state and foreign legislative or regulatory bodies may enact new or additional laws and regulations concerning privacy, data-retention and data-protection issues, including laws or regulations mandating disclosure to domestic or international law enforcement bodies, which could adversely impact our business, our brand or our reputation with users. For example, some countries are considering laws mandating that user data regarding users in their
22
Table of Contents
country be maintained in their country. Having to maintain local data centers in individual countries could increase our operating costs significantly. The interpretation and application of privacy, data protection and data retention laws and regulations are often uncertain and in flux in the U.S. and internationally. These laws may be interpreted and applied inconsistently from country to country and inconsistently with our current policies and practices, complicating long-range business planning decisions. If privacy, data protection or data retention laws are interpreted and applied in a manner that is inconsistent with our current policies and practices we may be fined or ordered to change our business practices in a manner that adversely impacts our operating results. Complying with these varying international requirements could cause us to incur substantial costs or require us to change our business practices in a manner adverse to our business and operating results.
Interruptions, delays, or failures in the provision of our services could damage our reputation and harm our operating results.
Delays or disruptions to our service, or the loss or compromise of data, could result from a variety of causes, including the following:
| • | Our operations are susceptible to outages and interruptions due to fire, flood, earthquake, tsunami, other natural disasters, power loss, equipment or telecommunications failures, cyber attacks, terrorist attacks, political or social unrest, and other events over which we have little or no control. We do not have multiple site capacity for all of our services and some of our systems are not fully redundant in the event of delays or disruptions to service, so some data or systems may not be fully recoverable after such events. |
| • | The systems through which we provide our products and services are highly technical, complex, and interdependent. Design errors might exist in these systems, or might be introduced when we make modifications, which might cause service malfunctions or require services to be taken offline while corrective responses are developed. |
| • | Despite our implementation of network security measures, our servers are vulnerable to computer viruses, malware, worms, hacking, physical and electronic break-ins, router disruption, sabotage or espionage, and other disruptions from unauthorized access and tampering, as well as coordinated denial-of-service attacks. We may not be in a position to promptly address attacks or to implement adequate preventative measures if we are unable to immediately detect such attacks. Such events could result in large expenditures to investigate or remediate, to recover data, to repair or replace networks or information systems, including changes to security measures, to deploy additional personnel, to defend litigation or to protect against similar future events, and may cause damage to our reputation or loss of revenue. |
| • | We rely on third-party providers over which we have little or no control for our principal Internet connections and co-location of a significant portion of our data servers, as well as for our payment processing capabilities and key components or features of certain of our products and services. Any disruption of the services they provide us or any failure of these third-party providers to handle higher volumes of use could, in turn, cause delays or disruptions in our services and loss of revenue. In addition, if our agreements with these third-party providers are terminated for any reason, we might not have a readily available alternative. |
Prolonged delays or disruptions to our service could result in a loss of users, damage to our brands, legal costs or liability, and harm to our operating results.
23
Table of Contents
A variety of new and existing U.S. and foreign government laws and regulations could subject us to claims, judgments, monetary liabilities and other remedies, and to limitations on our business practices.
We are subject to numerous U.S. and foreign laws and regulations covering a wide variety of subject matters. New laws and regulations, changes in existing laws and regulations or the interpretation of them, our introduction of new products or forms of advertising (such as native advertising), or an extension of our business into new areas, could increase our future compliance costs, make our products and services less attractive to our users, or cause us to change or limit our business practices. We may incur substantial expenses to comply with laws and regulations or defend against a claim that we have not complied with them. Further, any failure on our part to comply with any relevant laws or regulations may subject us to significant civil or criminal liabilities, penalties, and negative publicity.
The application of existing domestic and international laws and regulations to us relating to issues such as user privacy and data protection, security, defamation, pricing, advertising, taxation, gambling, sweepstakes, promotions, billing, real estate, consumer protection, accessibility, content regulation, quality of services, law enforcement demands, telecommunications, mobile, television, and intellectual property ownership and infringement in many instances is unclear or unsettled. Further, the application to us or our subsidiaries of existing laws regulating or requiring licenses for certain businesses of our advertisers can be unclear. U.S. export control laws and regulations also impose requirements and restrictions on exports to certain nations and persons and on our business. Internationally, we may also be subject to laws regulating our activities in foreign countries and to foreign laws and regulations that are inconsistent from country to country.
The Digital Millennium Copyright Act (“DMCA”) is intended, in part, to limit the liability of eligible online service providers for caching, hosting, listing or linking to, third-party Websites or user content that include materials that give rise to copyright infringement. Portions of the Communications Decency Act (“CDA”) are intended to provide statutory protections to online service providers who distribute third-party content. We rely on the protections provided by both the DMCA and the CDA in conducting our business, and may be adversely impacted by future legislation and future judicial decisions altering these safe harbors or if international jurisdictions refuse to apply similar protections.
Various U.S. and international laws restrict the distribution of materials considered harmful to children and impose additional restrictions on the ability of online services to collect information from minors. These laws currently impose restrictions and requirements on our business, and future federal, state or international laws and legislative efforts designed to protect children on the Internet may impose additional requirements on us.
Fluctuations in foreign currency exchange rates may adversely affect our operating results and financial condition.
Revenue generated and expenses incurred by our international subsidiaries and any equity method investee are often denominated in the currencies of the local countries. As a result, our consolidated U.S. dollar financial statements are subject to fluctuations due to changes in exchange rates as the financial results of our international subsidiaries and any equity method investee are translated from local currencies into U.S. dollars. Our financial results are also subject to changes in exchange rates that impact the settlement of transactions in non-local currencies. The carrying values of our equity investments in any equity investee are also subject to fluctuations in the exchange rates of foreign currencies.
24
Table of Contents
We use derivative instruments, such as foreign currency forward contracts and options, to partially offset certain exposures to fluctuations in foreign currency exchange rates. The use of such instruments may not offset any, or more than a portion, of the adverse financial effects of unfavorable movements in foreign currency exchange rates. Any losses on these instruments that we experience may adversely impact our financial results, cash flows and financial condition. Further, we hedge a portion of our net investment in Yahoo Japan Corporation (“Yahoo Japan”) with currency forward contracts and option contracts. If the Japanese yen has appreciated at maturity beyond the contract execution rate, we would be required to settle the contract by making a cash payment which could be material and could adversely impact our cash flows and financial condition. See Part II, Item 7A—“Quantitative and Qualitative Disclosures About Market Risk” of this Annual Report.
Our international operations expose us to additional risks that could harm our business, operating results, and financial condition.
In addition to uncertainty about our ability to continue to generate revenue from our foreign operations and expand our international market position, there are additional risks inherent in doing business internationally (including through our international joint ventures), including:
| • | tariffs, trade barriers, customs classifications and changes in trade regulations; |
| • | difficulties in developing, staffing, and simultaneously managing a large number of varying foreign operations as a result of distance, language, and cultural differences; |
| • | stringent local labor laws and regulations; |
| • | longer payment cycles; |
| • | credit risk and higher levels of payment fraud; |
| • | profit repatriation restrictions and foreign currency exchange restrictions; |
| • | political or social unrest, economic instability, repression, or human rights issues; |
| • | geopolitical events, including natural disasters, acts of war and terrorism; |
| • | import or export regulations; |
| • | compliance with U.S. laws such as the Foreign Corrupt Practices Act, and local laws prohibiting bribery and corrupt payments to government officials; |
| • | antitrust and competition regulations; |
| • | potentially adverse tax developments; |
| • | seasonal volatility in business activity and local economic conditions; |
| • | economic uncertainties relating to volatility in emerging markets and global economic uncertainty; |
| • | laws, regulations, licensing requirements, and business practices that favor local competitors or prohibit foreign ownership or investments; |
| • | different, uncertain or more stringent user protection, content, data protection, privacy, intellectual property and other laws; and |
| • | risks related to other government regulation (including the potential for actions restricting access to our products), required compliance with local laws or lack of legal precedent. |
We are subject to numerous and sometimes conflicting U.S. and foreign laws and regulations which increase our cost of doing business. Violations of these complex laws and regulations that apply to
25
Table of Contents
our international operations could result in damage awards, fines, criminal actions, sanctions, or penalties against us, our officers or our employees, prohibitions on the conduct of our business and our ability to offer products and services, and damage to our reputation. Although we have implemented policies and procedures designed to promote compliance with these laws, there can be no assurance that our employees, contractors, or agents will not violate our policies. These risks inherent in our international operations and expansion increase our costs of doing business internationally and could result in harm to our business, operating results, and financial condition.
We may be subject to legal liability associated with providing online services or content.
We host and provide a wide variety of services and technology products that enable and encourage individuals and businesses to exchange information; upload or otherwise generate photos, videos, text, and other content; advertise products and services; conduct business; and engage in various online activities both domestically and internationally. The law relating to the liability of providers of online services and products for activities of their users is currently unsettled both within the U.S. and internationally. As a publisher and producer of original content, we may be subject to claims such as copyright, libel, defamation or improper use of publicity rights, as well as other infringement claims such as plagiarism. Claims have been threatened and brought against us for defamation, negligence, breaches of contract, plagiarism, copyright and trademark infringement, unfair competition, unlawful activity, tort, including personal injury, fraud, or other theories based on the nature and content of information which we publish or to which we provide links or that may be posted online or generated by us or by third parties, including our users. In addition, we have been and may again in the future be subject to domestic or international actions alleging that certain content we have generated or third-party content that we have made available within our services violates laws in domestic and international jurisdictions. We arrange for the distribution of third-party advertisements to third-party publishers and advertising networks, and we offer third-party products, services, or content, such as stock quotes and trading information, under the Yahoo brand or via distribution on Yahoo Properties. We may be subject to claims concerning these products, services, or content by virtue of our involvement in marketing, branding, broadcasting, or providing access to them, even if we do not ourselves host, operate, provide, or provide access to these products, services, or content. While our agreements with respect to these products, services, and content may provide that we will be indemnified against such liabilities, the ability to receive such indemnification may be disputed, could result in substantial costs to enforce or defend, and depends on the financial resources of the other party to the agreement, and any amounts received might not be adequate to cover our liabilities or the costs associated with defense of such proceedings. Defense of any such actions could be costly and involve significant time and attention of our management and other resources, may result in monetary liabilities or penalties, and may require us to change our business in an adverse manner.
It is also possible that if any information provided directly by us contains errors or is otherwise wrongfully provided to users, third parties could make claims against us. For example, we offer Web-based e-mail services, which expose us to potential risks, such as liabilities or claims, by our users and third parties, resulting from unsolicited e-mail, lost or misdirected messages, illegal or fraudulent use of e-mail, alleged violations of policies, property interests, or privacy protections, including civil or criminal laws, or interruptions or delays in e-mail service. We may also face purported consumer class actions or state actions relating to our online services, including our fee-based services (particularly in connection with any decision to discontinue a fee-based service). In addition, our customers, third parties, or government entities may assert claims or actions against us if our online services or technologies are used to spread or facilitate malicious or harmful code or applications.
Investigating and defending these types of claims are expensive, even if the claims are without merit or do not ultimately result in liability, and could subject us to significant monetary liability or cause a change in business practices that could negatively impact our ability to compete.
26
Table of Contents
If we are unable to recruit, hire, motivate, and retain key personnel, we may not be able to execute our business plan.
Our business is dependent on our ability to recruit, hire, motivate, and retain talented, highly skilled personnel. Achieving this objective may be difficult due to many factors, including the intense competition for such highly skilled personnel in the San Francisco Bay Area and other metropolitan areas where our offices are located; fluctuations in global economic and industry conditions; competitors’ hiring practices; and the effectiveness of our compensation programs. If we do not succeed in retaining and motivating our existing key employees, and in attracting new key personnel, we may be unable to meet our business plan and as a result, our revenue and profitability may decline.
If we are unable to attract, sustain, and renew distribution arrangements on favorable terms, our revenue may decline.
We enter into distribution arrangements with third parties such as operators of third-party Websites, online networks, software companies, electronics companies, computer manufacturers, Internet service providers and others to promote or supply our services to their users. For example:
| • | We maintain search and display advertising relationships with Affiliate sites, which integrate our advertising offerings into their Websites. |
| • | We enter into distribution alliances with Internet service providers (including providers of cable and broadband Internet access) and software distributors to promote our services to their users. |
| • | We enter into agreements with mobile phone, tablet, television, and other device manufacturers, electronics companies and carriers to promote our software and services on their devices. |
In some markets, we depend on a limited number of distribution arrangements for a significant percentage of our user activity. A failure by our distributors to attract or retain their user bases would negatively impact our user activity and, in turn, reduce our revenue. In some cases, device manufacturers may be unwilling to pay fees to Yahoo in order to distribute Yahoo services or may be unwilling to distribute Yahoo services.
In the future, as new methods for accessing the Internet and our services become available, including through alternative devices, we may need to enter into amended distribution agreements with existing access providers, distributors, and manufacturers to cover the new devices and new arrangements. We face a risk that existing and potential new access providers, distributors, and manufacturers may decide not to offer distribution of our services on reasonable terms, or at all.
Distribution agreements often involve revenue sharing. Competition to enter into distribution arrangements has caused and may in the future cause our traffic acquisition costs to increase. In some cases, we guarantee distributors a minimum level of revenue and, as a result, run a risk that the distributors’ performance (in terms of ad impressions, toolbar installations, etc.) might not be sufficient to otherwise earn their minimum payments, in which case our payments could exceed the revenue that we receive. In other cases, we agree that if the distributor does not realize specified minimum revenue we will adjust the distributor’s revenue-share percentage or provide make-whole arrangements.
Some of our distribution agreements are not exclusive, have a short term, are terminable at will, or are subject to early termination provisions. The loss of distributors, increased distribution costs, or the renewal of distribution agreements on significantly less favorable terms may cause our revenue to decline.
27
Table of Contents
Certain of our metrics are subject to inherent challenges in measurement, and real or perceived inaccuracies in such metrics may harm our reputation and negatively affect our business.
We present key metrics such as unique users, number of Ads Sold, number of Paid Clicks, Search click-driven revenue, Price-per-Click and Price-per-Ad that are calculated using internal company data. We periodically review, refine and update our methodologies for monitoring, gathering, and calculating these metrics.
While our metrics are based on what we believe to be reasonable measurements and methodologies, there are inherent challenges in deriving our metrics across large online and mobile populations around the world. In addition, our user metrics may differ from estimates published by third parties or from similar metrics of our competitors due to differences in methodology.
If advertisers or publishers do not perceive our metrics to be accurate, or if we discover material inaccuracies in our metrics, it could negatively affect our reputation, business and financial results.
Any failure to scale and adapt our existing technology architecture to manage expansion of user-facing services and to respond to rapid technological change could adversely affect our business.
As some of the most visited sites on the Internet, Yahoo Properties deliver a significant number of products, services, page views, and advertising impressions to users around the world. We expect our products and services to continue to expand and change significantly and rapidly in the future to accommodate new technologies, new devices, new Internet advertising solutions, and new means of content delivery.
In addition, widespread adoption of new Internet, networking or telecommunications technologies, or other technological or platform changes, could require substantial expenditures to modify or adapt our services or infrastructure. The technology architectures and platforms utilized for our services are highly complex and may not provide satisfactory security features or support in the future, as usage increases and products and services expand, change, and become more complex. In the future, we may make additional changes to our existing, or move to completely new, architectures, platforms and systems, such as the changes we have made in response to the increased use of mobile devices such as tablets and smartphones. Such changes may be technologically challenging to develop and implement, may take time to test and deploy, may cause us to incur substantial costs or data loss, and may cause changes, delays or interruptions in service. These changes, delays, or interruptions in our service may cause our users, Affiliates and other advertising platform participants to become dissatisfied with our service or to move to competing providers or seek remedial actions or compensation. Further, to the extent that demands for our services increase, we will need to expand our infrastructure, including the capacity of our hardware servers and the sophistication of our software. This expansion is likely to be expensive and complex and require additional technical expertise. As we acquire users who rely upon us for a wide variety of services, it becomes more technologically complex and costly to retrieve, store, and integrate data that will enable us to track each user’s preferences. Any difficulties experienced in adapting our architectures, platforms and infrastructure to accommodate increased traffic, to store user data, and track user preferences, together with the associated costs and potential loss of traffic, could harm our operating results, cash flows from operations, and financial condition.
28
Table of Contents
We rely on third parties to provide the technologies necessary to deliver content, advertising, and services to our users, and any change in the licensing terms, costs, availability, or acceptance of these formats and technologies could adversely affect our business.
We rely on third parties to provide the technologies that we use to deliver the majority of the content, advertising, and services to our users. There can be no assurance that these providers will continue to license their technologies or intellectual property to us on reasonable terms, or at all. Providers may change the fees they charge users or otherwise change their business model in a manner that slows the widespread acceptance of their technologies. In order for our services to be successful, there must be a large base of users of the technologies necessary to deliver our content, advertising, and services. We have limited or no control over the availability or acceptance of those technologies, and any change in the licensing terms, costs, availability, or user acceptance of these technologies could adversely affect our business.
Our business depends on continued and unimpeded access to the Internet by us and our users. Internet access providers may be able to block, degrade, or charge for access to certain of our products and services, which could lead to additional expenses and the loss of users and advertisers.
Our products and services depend on the ability of our users to access the Internet, and certain of our products require significant bandwidth to work effectively. Currently, this access is provided by companies that have significant market power in the broadband and internet access marketplace, including incumbent telephone companies, cable companies, mobile communications companies, and government-owned service providers. Some of these providers may take, or have stated that they may take, measures that could degrade, disrupt, or increase the cost of user access to certain of our products by restricting or prohibiting the use of their infrastructure to support or facilitate our offerings, or by charging increased fees to us or our users to provide our offerings. Such interference could result in a loss of existing users and advertisers, and increased costs, and could impair our ability to attract new users and advertisers, thereby harming our revenues and growth. The adoption of any laws or regulations that limit access to the Internet by blocking, degrading or charging access fees to us or our users for certain services could decrease the demand for, or the usage of, our products, services and apps, increase our cost of doing business and adversely affect our operating results.
Technologies, tools, software, and applications could block our advertisements, impair our ability to deliver interest-based advertising, or shift the location in which advertising appears, which could harm our operating results.
Technologies, tools, software, and applications (including new and enhanced Web browsers) have been developed and are likely to continue to be developed that can block or allow users to opt out of display, search, and interest-based advertising and content, delete or block the cookies used to deliver such advertising, or shift the location in which advertising appears on pages so that our advertisements do not show up in the most monetizable places on our pages or are obscured. Most of our revenue is derived from fees paid by advertisers in connection with the display of graphical and non-graphical advertisements or clicks on search advertisements on Web pages. As a result, the adoption of such technologies, tools, software, and applications could reduce the number of search and display advertisements that we are able to deliver and/or our ability to deliver interest-based advertising and this, in turn, could reduce our advertising revenue and operating results.
29
Table of Contents
Any failure to manage expansion and changes to our business could adversely affect our operating results.
If we are unable to effectively manage a large and geographically dispersed group of employees or to anticipate our future growth, our business may be adversely affected. As we change and expand our business, we must also expand and adapt our operational infrastructure. Our business relies on data systems, billing systems, and financial reporting and control systems, among others. All of these systems have become increasingly complex in the recent past due to the growing complexity of our business, acquisitions of new businesses with different systems, and increased regulation over controls and procedures. To manage our business in a cost-effective manner, we will need to continue to upgrade and improve our data systems, billing systems, and other operational and financial systems, procedures, and controls. In some cases, we are outsourcing administrative functions to lower-cost providers. These upgrades, improvements and outsourcing changes will require a dedication of resources and in some cases are likely to be complex. If we are unable to adapt our systems and put adequate controls in place in a timely manner, our business may be adversely affected. In particular, sustained failures of our billing systems to accommodate increasing numbers of transactions, to accurately bill users and advertisers, or to accurately compensate Affiliates could adversely affect the viability of our business model.
We have dedicated resources to provide a variety of premium enhancements to our products, services and apps, which might not prove to be successful in generating significant revenue for us.
We offer fee-based enhancements for many of our free services. The development cycles for these technologies are long and generally require investment by us. We have invested and will continue to invest in premium products, services and apps. Some of these premium products, services and apps might not generate anticipated revenue or might not meet anticipated user adoption rates. We have previously discontinued some non-profitable premium services and may discontinue others. General economic conditions as well as the rapidly evolving competitive landscape may affect users’ willingness to pay for such premium services. If we cannot generate revenue from our premium services that are greater than the cost of providing such services, our operating results could be harmed.
We may have exposure to additional tax liabilities which could negatively impact our income tax provision, net income, and cash flow.
We are subject to income taxes and other taxes in both the U.S. and the foreign jurisdictions in which we currently operate or have historically operated. The determination of our worldwide provision for income taxes and current and deferred tax assets and liabilities requires judgment and estimation. Our income taxes could be adversely affected by earnings being lower than anticipated in jurisdictions that have lower statutory tax rates and higher than anticipated in jurisdictions that have higher statutory tax rates, by changes in the valuation of our deferred tax assets and liabilities, or by changes in tax laws, regulations, or accounting principles.
In the ordinary course of our business, there are many transactions and calculations where the ultimate tax determination is uncertain. As a U.S. multinational corporation, we are subject to changing tax laws both within and outside of the U.S. We cannot predict the form or timing of potential legislative changes, but any newly enacted tax law could have a material adverse impact on our tax expense and cash flow. For example, several jurisdictions have sought to increase revenues by imposing new taxes on internet advertising or increasing general business taxes.
We earn a material amount of our income from outside the U.S. As of December 31, 2014, we had undistributed foreign earnings of approximately $2.9 billion, principally related to our equity method
30
Table of Contents
investment in Yahoo Japan. While we do not currently anticipate repatriating these earnings, any repatriation of funds in foreign jurisdictions to the U.S. could result in higher effective tax rates for us and subject us to significant additional U.S. income tax liabilities.
We are subject to regular review and audit by both domestic and foreign tax authorities as well as subject to the prospective and retrospective effects of changing tax regulations and legislation. Although we believe our tax estimates are reasonable, the ultimate tax outcome may materially differ from the tax amounts recorded in our consolidated financial statements and may materially affect our income tax provision, net income, or cash flows in the period or periods for which such determination and settlement is made.
Proprietary document formats may limit the effectiveness of our search technology by preventing our technology from accessing the content of documents in such formats, which could limit the effectiveness of our products and services.
A large amount of information on the Internet is provided in proprietary document formats. These proprietary document formats may limit the effectiveness of search technology by preventing the technology from accessing the content of such documents. The providers of the software applications used to create these documents could engineer the document format to prevent or interfere with the process of indexing the document contents with search technology. This would mean that the document contents would not be included in search results even if the contents were directly relevant to a search. The software providers may also seek to require us to pay them royalties in exchange for giving us the ability to search documents in their format. If the search platform technology we employ is unable to index proprietary format Web documents as effectively as our competitors’ technology, usage of our search services might decline, which could cause our revenue to fall.
Adverse macroeconomic conditions could cause decreases or delays in spending by our advertisers and could harm our ability to generate revenue and our results of operations.
Advertising expenditures tend to be cyclical, reflecting overall economic conditions and budgeting and buying patterns. Since we derive most of our revenue from advertising, adverse macroeconomic conditions have caused, and future adverse macroeconomic conditions could cause, decreases or delays in advertising spending and negatively impact our advertising revenue and short-term ability to grow our revenue. Further, any decreased collectability of accounts receivable or early termination of agreements, whether resulting from customer bankruptcies or otherwise due to adverse macroeconomic conditions, could negatively impact our results of operations.
Our stock price has been volatile historically and may continue to be volatile regardless of our operating performance.
The trading price of our common stock has been and may continue to be subject to broad fluctuations. During the twelve months ended December 31 2014, the closing sale price of our common stock on the NASDAQ Global Select Market ranged from $32.87 to $52.37 per share and the closing sale price on February 13, 2015 was $44.42 per share. Our stock price may fluctuate in response to a number of events and factors, such as variations in quarterly operating results or announcements of technological innovations, significant transactions, or new features, products or services by us or our competitors; changes in financial estimates and recommendations by securities analysts; the operating and stock price performance of, or other developments involving, other companies that investors may deem comparable to us; trends in our industry; general economic conditions; and the operating performance and market valuation of Alibaba Group and Yahoo Japan Corporation in which we have investments. The equity valuation of our investment in Yahoo Japan Corporation may be impacted due to fluctuations in foreign currency exchange rates. We present our
31
Table of Contents
investment in Alibaba Group on our consolidated balance sheet as an available-for-sale marketable security. Consequently, the carrying value of this investment on our consolidated balance sheet will vary over time and fluctuations in its valuation may cause our stock price to fluctuate.
In addition, the stock market in general, and the market prices for companies in our industry, have experienced volatility that often has been unrelated to operating performance. These broad market and industry fluctuations may adversely affect the price of our stock, regardless of our operating performance. A decrease in the market price of our common stock would likely adversely impact the trading price of the 0.00% Convertible Senior Notes due 2018 that we issued in November 2013 (the “Notes”). Volatility or a lack of positive performance in our stock price may also adversely affect our ability to retain key employees who have been granted stock options or other stock-based awards. A sustained decline in our stock price and market capitalization could lead to an impairment charge to our long-lived assets.
Delaware statutes and certain provisions in our charter documents could make it more difficult for a third-party to acquire us.
Our Board has the authority to issue up to 10 million shares of preferred stock and to determine the price, rights, preferences, privileges and restrictions, including voting rights, of those shares without any further vote or action by the stockholders. The rights of the holders of our common stock may be subject to, and may be adversely affected by, the rights of the holders of any preferred stock that may be issued in the future. The issuance of preferred stock may have the effect of delaying, deterring or preventing a change in control of Yahoo without further action by the stockholders and may adversely affect the voting and other rights of the holders of our common stock.
Some provisions of our charter documents, including provisions eliminating the ability of stockholders to take action by written consent and limiting the ability of stockholders to raise matters at a meeting of stockholders without giving advance notice, may have the effect of delaying or preventing changes in control or changes in our management, which could have an adverse effect on the market price of our stock and the value of the $1.4375 billion aggregate principal amount of the Notes we issued in November 2013. In addition, our charter documents do not permit cumulative voting, which may make it more difficult for a third-party to gain control of our Board. Further, we are subject to the anti-takeover provisions of Section 203 of the Delaware General Corporation Law, which will prohibit us from engaging in a “business combination” with an “interested stockholder” for a period of three years after the date of the transaction in which the person became an interested stockholder, even if such combination is favored by a majority of stockholders, unless the business combination is approved in a prescribed manner. The application of Section 203 also could have the effect of delaying or preventing a change in control of us.
Any of these provisions could, under certain circumstances, depress the market price of our common stock and the Notes.
Risks Relating to the Notes
The conditional conversion feature of the Notes, if triggered, may adversely affect our financial condition and operating results.
In the event the conditional conversion feature of the Notes is triggered, holders of Notes will be entitled to convert the Notes at any time during specified periods at their option. If one or more holders elect to convert their Notes, unless we elect to satisfy our conversion obligation by delivering solely shares of our common stock (other than paying cash in lieu of delivering any fractional share), we would be required to settle a portion or all of our conversion obligation through the payment of cash, which could adversely affect our liquidity. In addition, even if holders do not elect to convert
32
Table of Contents
their Notes, we could be required under applicable accounting rules to reclassify all or a portion of the outstanding principal of the Notes as a current rather than long-term liability, which would result in a material reduction of our net working capital.
We may not have the ability to raise the funds necessary to settle conversions of the Notes in cash or to repurchase the Notes upon a fundamental change, and our future debt may contain limitations on our ability to pay cash upon conversion or repurchase of the Notes.
Holders of the Notes will have the right to require us to repurchase all or a portion of their Notes upon the occurrence of a fundamental change at a repurchase price equal to 100% of the principal amount of the Notes to be repurchased, plus accrued and unpaid special interest, if any. We may not have enough available cash or be able to obtain financing at the time we are required to make repurchases of Notes surrendered therefore, or pay cash with respect to Notes being converted if we elect not to issue shares, which could harm our reputation and affect the trading price of our common stock.
The note hedge and warrant transactions may affect the value of the Notes and our common stock.
In connection with the pricing of the Notes, we entered into note hedge transactions with the option counterparties. The note hedge transactions are generally expected to reduce the potential dilution upon conversion of the Notes and/or offset any cash payments we are required to make in excess of the principal amount of converted Notes, as the case may be. We also entered into warrant transactions with the option counterparties. However, the warrant transactions could separately have a dilutive effect to the extent that the market price per share of our common stock exceeds the applicable strike price of the warrants.
In connection with establishing their initial hedge of the note hedge and warrant transactions, the option counterparties or their respective affiliates have purchased shares of our common stock and/or entered into various derivative transactions with respect to our common stock concurrently with or shortly after the pricing of the Notes. In addition, the option counterparties or their respective affiliates may modify their hedge positions by entering into or unwinding various derivatives with respect to our common stock and/or purchasing or selling our common stock or other securities of ours in secondary market transactions prior to the maturity of the Notes (and are likely to do so during any observation period related to a conversion of Notes or following any repurchase of Notes by us on any fundamental repurchase date or otherwise). This activity could cause or avoid an increase or a decrease in the market price of our common stock or the Notes.
Any adverse change in the rating of the Notes or the Company may cause their trading price to decline.
While we did not solicit a credit rating on the Company or on the Notes, one rating service has rated both the Notes and the Company. If that rating service announces its intention to put the Company or the Notes on credit watch or lowers its rating on the Company or the Notes below any rating initially assigned to the Company or the Notes, the trading price of the Notes could decline.
The accounting method for convertible debt securities that may be settled in cash, such as the Notes, could have a material effect on our reported financial results.
In May 2008, the Financial Accounting Standards Board (“FASB”) issued FASB Staff Position No. APB 14-1, Accounting for Convertible Debt Instruments That May Be Settled in Cash Upon Conversion (Including Partial Cash Settlement), which has subsequently been codified as Accounting Standards Codification (“ASC”) 470-20, Debt with Conversion and Other Options, which we refer to as ASC 470-20. Under ASC 470-20, an entity must separately account for the liability and equity components of the convertible debt instruments (such as the Notes) that may be settled entirely or
33
Table of Contents
partially in cash upon conversion in a manner that reflects the issuer’s economic interest cost. The effect of ASC 470-20 on the accounting for the Notes is that the equity component is required to be included in the additional paid-in capital section of stockholders’ equity on our consolidated balance sheet, and the value of the equity component would be treated as debt discount for purposes of accounting for the debt component of the Notes. As a result, we will be required to record a greater amount of non-cash interest expense in current periods presented as a result of the amortization of the discounted carrying value of the Notes to their face amount over the term of the Notes. We will report lower net income in our financial results because ASC 470-20 will require interest to include the current period’s amortization of the debt discount, which could adversely affect our reported or future financial results, the trading price of our common stock and the trading price of the Notes.
In addition, under certain circumstances, convertible debt instruments (such as the Notes) that may be settled entirely or partly in cash are currently accounted for utilizing the treasury stock method, the effect of which is that the shares issuable upon conversion of the Notes are not included in the calculation of diluted earnings per share except to the extent that the conversion value of the Notes exceeds their principal amount. Under the treasury stock method, for diluted earnings per share purposes, the transaction is accounted for as if the number of shares of common stock that would be necessary to settle such excess, if we elected to settle such excess in shares, are issued. We cannot be sure that the accounting standards in the future will continue to permit the use of the treasury stock method. If we are unable to use the treasury stock method in accounting for the shares issuable upon conversion of the Notes, then our diluted earnings per share would be adversely affected.
Item 1B. Unresolved Staff Comments
None.
Our headquarters is located in Sunnyvale, California and consists of owned space aggregating approximately one million square feet. We also lease office space in Argentina, Australia, Brazil, Canada, China, France, Germany, Hong Kong, Hungary, India, Ireland, Israel, Italy, Japan, Jordan, Mexico, New Zealand, Norway, the Philippines, Singapore, Spain, Switzerland, Taiwan, the United Arab Emirates, and the United Kingdom. In the United States, we lease offices in various locations, including Atlanta, Boston, Champaign, Chicago, Dallas, Detroit, Hillsboro, the Los Angeles Area, Miami, New York, Omaha, San Francisco, and Washington, D.C. Our data centers are operated in locations in the United States, Brazil, Europe, and Asia.
We believe that our existing facilities are adequate to meet current requirements, and that suitable additional or substitute space will be available as needed to accommodate any further physical expansion of operations and for any additional sales offices.
For a description of our material legal proceedings, see “Legal Contingencies” in Note 12—“Commitments and Contingencies” in the Notes to our consolidated financial statements, which is incorporated herein by reference.
Item 4. Mine Safety Disclosures
Not applicable.
34
Table of Contents
PART II
Item 5. Market for Registrant’s Common Equity, Related Stockholder Matters and Issuer Purchases of Equity Securities
Market Information for Common Stock
Yahoo! Inc. common stock is quoted on the NASDAQ Global Select Market under the symbol “YHOO.” The following table sets forth the range of high and low per share sales prices as reported for each period indicated:
| 2013 | 2014 | |||||||||||||||
| High | Low | High | Low | |||||||||||||
| First quarter | $ | 23.88 | $ | 18.89 | $ | 41.72 | $ | 34.45 | ||||||||
| Second quarter | $ | 27.68 | $ | 22.70 | $ | 37.30 | $ | 32.15 | ||||||||
| Third quarter | $ | 33.85 | $ | 24.82 | $ | 44.01 | $ | 32.93 | ||||||||
| Fourth quarter | $ | 41.05 | $ | 31.70 | $ | 52.62 | $ | 36.20 | ||||||||
Stockholders
We had 9,383 stockholders of record as of February 13, 2015.
Dividends
We have not declared or paid any cash dividends on our common stock. We presently do not have plans to pay any cash dividends in the near future.
35
Table of Contents
Issuer Repurchases of Equity Securities
Share repurchase activity during the three months ended December 31, 2014 was as follows:
| Period | Total Number of Shares Purchased(1) |
Average Price Paid per Share |
Total Number of Shares Purchased as Part of a Publicly Announced Program |
Approximate Dollar Value of Shares that May Yet be Purchased Under the Program (in 000s)(1) |
||||||||||||
| October 1—October 31, 2014: Open Market Purchases |
10,349,272 | $ | 41.24 | 10,349,272 | $ | 2,116,111 | ||||||||||
| October 1—October 31, 2014: September 2014 ASR(2) | 8,449,524 | (2) | 8,449,524 | $ | 2,283,317 | |||||||||||
| October 1—October 31, 2014: October 2014 ASR(3) | 14,712,644 | (3) | 14,712,644 | $ | 1,283,317 | |||||||||||
| November 1—November 30, 2014: Open Market Purchases |
4,829,338 | $ | 47.40 | 4,829,338 | $ | 1,054,413 | ||||||||||
| December 1—December 31, 2014: Open Market Purchases |
6,478,600 | $ | 50.09 | 6,478,600 | $ | 729,883 | ||||||||||
| December 1—December 31, 2014: October 2014 ASR(3) | 1,651,834 | (3) | 1,651,834 | $ | 929,883 | |||||||||||
|
|
|
|
|
|||||||||||||
| Total | 46,471,212 | $ | 45.26 | 46,471,212 | ||||||||||||
|
|
|
|
|
|||||||||||||
| (1) | The share repurchases in the three months ended December 31, 2014 were made under our stock repurchase program announced in November 2013, which authorizes the repurchase of up to $5 billion of our outstanding shares of common stock. This program, according to its terms, will expire in December 2016. Repurchases under the program may take place in the open market or in privately negotiated transactions, including derivative transactions, and may be made under a Rule 10b5-1 plan. |
| (2) | Final settlement of the ASR entered into in September 2014 occurred on October 17, 2014, resulting in the delivery to the Company of an additional 8.5 million shares of the Company’s common stock and a return of cash for the remaining amount not settled in shares of $167 million. In total, 23.5 million shares of common stock were repurchased under the September 2014 ASR for $933 million, including 15 million shares initially delivered to the Company in September 2014 and the 8.5 million shares included in the total number of purchased shares for the month of October 2014, resulting in an average price paid per share of $39.70 under the September 2014 ASR. |
| (3) | The Company entered into an ASR on October 27, 2014 under which approximately 15 million shares of common stock were initially delivered and a prepayment of $1 billion was made. Final settlement of the October 2014 ASR occurred on December 9, 2014, resulting in the delivery to the Company of an additional 1.7 million shares of the Company’s common stock and a return of cash for the remaining amount not settled in shares of $200 million. In total, approximately 16 million shares of common stock were repurchased under the October 2014 ASR for $800 million, resulting in an average price paid per share of $48.89 under the October 2014 ASR. |
See Part II, Item 7 “Management’s Discussion and Analysis of Financial Condition and Results of Operations” of this Annual Report on Form 10-K for additional information regarding share repurchases. See also Note 13—“Stockholders’ Equity” in the Notes to our consolidated financial statements for additional information.
36
Table of Contents
Performance Graph
This performance graph shall not be deemed “filed” for purposes of Section 18 of the Securities Exchange Act of 1934, as amended (the “Exchange Act”), or otherwise subject to the liabilities under that section and shall not be deemed to be incorporated by reference into any filing of Yahoo! Inc. under the Securities Act or the Exchange Act.
The following graph compares, for the five-year period ended December 31, 2014, the cumulative total stockholder return for Yahoo’s common stock, the NASDAQ 100 Index, the Standard & Poor’s North American Technology-Internet Index (the “S&P Internet”), and the Standard & Poor’s 500 Stock Index (the “S&P 500”). Measurement points are the last trading day of each of Yahoo’s fiscal years ended December 31, 2010, December 31, 2011, December 31, 2012, December 31, 2013, and December 31, 2014. The graph assumes that $100 was invested at the market close on December 31, 2009 in the common stock of Yahoo, the NASDAQ 100 Index, the S&P Internet, and the S&P 500 and assumes reinvestment of any dividends. The stock price performance on the following graph is not necessarily indicative of future stock price performance.
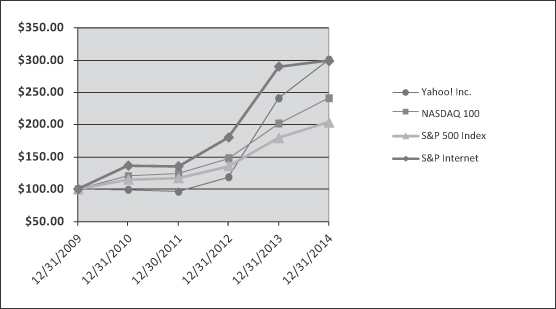
37
Table of Contents
Item 6. Selected Financial Data
The following selected consolidated financial data should be read in conjunction with the consolidated financial statements and notes thereto and “Management’s Discussion and Analysis of Financial Condition and Results of Operations” appearing elsewhere in this Annual Report on Form 10-K. The consolidated statements of income data and the consolidated balance sheets data for the years ended, and as of, December 31, 2010, 2011, 2012, 2013, and 2014 are derived from our audited consolidated financial statements.
Consolidated Statements of Income Data:
| Years Ended December 31, | ||||||||||||||||||||
| 2010(3) | 2011(4) | 2012(5) | 2013(6) | 2014(7) | ||||||||||||||||
| (in thousands, except per share amounts) | ||||||||||||||||||||
| Revenue | $ | 6,324,651 | $ | 4,984,199 | $ | 4,986,566 | $ | 4,680,380 | $ | 4,618,133 | ||||||||||
| Total operating expenses | $ | 5,552,127 | $ | 4,183,858 | $ | 4,420,198 | $ | 4,090,454 | $ | 4,475,191 | ||||||||||
| Income from operations(1) | $ | 772,524 | $ | 800,341 | $ | 566,368 | $ | 589,926 | $ | 142,942 | ||||||||||
| Other income, net(2) | $ | 297,869 | $ | 27,175 | $ | 4,647,839 | $ | 43,357 | $ | 10,369,439 | ||||||||||
| Provision for income taxes | $ | (221,523 | ) | $ | (241,767 | ) | $ | (1,940,043 | ) | $ | (153,392 | ) | $ | (4,038,102 | ) | |||||
| Earnings in equity interests | $ | 395,758 | $ | 476,920 | $ | 676,438 | $ | 896,675 | $ | 1,057,863 | ||||||||||
| Net income attributable to Yahoo! Inc. | $ | 1,231,663 | $ | 1,048,827 | $ | 3,945,479 | $ | 1,366,281 | $ | 7,521,731 | ||||||||||
|
|
|
|
|
|
|
|
|
|
|
|||||||||||
| Net income attributable to Yahoo! Inc. common stockholders per share—basic | $ | 0.91 | $ | 0.82 | $ | 3.31 | $ | 1.30 | $ | 7.61 | ||||||||||
|
|
|
|
|
|
|
|
|
|
|
|||||||||||
| Net income attributable to Yahoo! Inc. common stockholders per share—diluted | $ | 0.90 | $ | 0.82 | $ | 3.28 | $ | 1.26 | $ | 7.45 | ||||||||||
|
|
|
|
|
|
|
|
|
|
|
|||||||||||
| Shares used in per share calculation—basic | 1,354,118 | 1,274,240 | 1,192,775 | 1,052,705 | 987,819 | |||||||||||||||
|
|
|
|
|
|
|
|
|
|
|
|||||||||||
| Shares used in per share calculation—diluted | 1,364,612 | 1,282,282 | 1,202,906 | 1,070,811 | 1,004,108 | |||||||||||||||
|
|
|
|
|
|
|
|
|
|
|
|||||||||||
| (1) Includes: |
||||||||||||||||||||
| Stock-based compensation expense |
$ | 223,478 | $ | 203,958 | $ | 224,365 | $ | 278,220 | $ | 420,174 | ||||||||||
| Restructuring charges, net |
$ | 57,957 | $ | 24,420 | $ | 236,170 | $ | 3,766 | $ | 103,450 | ||||||||||
| (2) Includes: |
||||||||||||||||||||
| Gain on sale of Alibaba Group shares |
$ | — | $ | — | $ | 4,603,322 | $ | — | $ | — | ||||||||||
| Gain on sale of Alibaba Group ADSs |
$ | — | $ | — | $ | — | $ | — | $ | 10,319,437 | ||||||||||
| (3) | Our net income attributable to Yahoo! Inc. for the year ended December 31, 2010 included a pre-tax gain of $66 million in connection with the sale of Zimbra, Inc. and a pre-tax gain on the |
38
Table of Contents
| sale of HotJobs of $186 million. In addition, in the year ended December 31, 2010, we recorded net restructuring charges of $58 million related to our cost reduction initiatives. Apart from the Search Agreement, the tax impact of the items referred to above was a $10 million benefit, and in the aggregate, these items had a net positive impact of $204 million on net income attributable to Yahoo! Inc., or $0.15 per both basic and diluted share, for the year ended December 31, 2010. In addition, in the year ended December 31, 2010, we recorded $43 million pre-tax for the reimbursement of transition costs incurred in 2009 related to the Search Agreement. See Note 19—“Search Agreement with Microsoft Corporation” in the Notes to our consolidated financial statements for additional information. |
| (4) | Our revenue declined in 2011 due to the Search Agreement with Microsoft, which required a change in revenue presentation and a sharing of search revenue with Microsoft in transitioned markets beginning during the fourth quarter of 2010. Our net income attributable to Yahoo! Inc. for the year ended December 31, 2011 included a non-cash gain of $25 million, net of tax, related to the dilution of our ownership interest in Alibaba Group and a non-cash loss of $33 million related to impairments of assets held by Yahoo Japan. In addition, in the year ended December 31, 2011, we recorded net restructuring charges of $24 million related to our cost reduction initiatives. Apart from the Search Agreement, the tax impact of the items referred to above was an $8 million benefit, and these items had a net negative impact of $24 million on net income attributable to Yahoo! Inc., or $0.02 per both basic and diluted share, for the year ended December 31, 2011. |
| (5) | Our net income attributable to Yahoo! Inc. for the year ended December 31, 2012 included a pre-tax gain of approximately $4.6 billion and an after-tax gain of $2.8 billion related to our sale to Alibaba Group Holding Limited (“Alibaba Group”) of 523 million ordinary shares of Alibaba Group (“Alibaba Group shares”). See Note 8—“Investments in Equity Interests Accounted for Using the Equity Method of Accounting” in the Notes to our consolidated financial statements for additional information. In addition, in the year ended December 31, 2012, we recorded net restructuring charges of $236 million related to our cost reduction initiatives. In the aggregate, these items had a net positive impact of $2.6 billion on net income attributable to Yahoo! Inc., or $2.15 per basic share and $2.13 per diluted share, for the year ended December 31, 2012. |
| (6) | Our net income attributable to Yahoo! Inc. for the year ended December 31, 2013 included pre-tax gains of approximately $80 million related to sales of patents and a goodwill impairment charge of $64 million. In the year ended December 31, 2013, we recorded net restructuring charges of $4 million related to our cost reduction initiatives. The tax impact of the items referred to above was $22 million, and in the aggregate, these items had a net negative impact of $10 million on net income attributable to Yahoo! Inc., or $0.01 per both basic and diluted share, for the year ended December 31, 2013. |
| (7) | Our net income attributable to Yahoo! Inc. for the year ended December 31, 2014 included a pre-tax gain of approximately $10.3 billion and an after-tax gain of $6.3 billion related to our sale of American Depositary Shares (“ADSs”) of Alibaba Group in Alibaba Group’s initial public offering (“IPO”) in September 2014. See Note 8—“Investments in Equity Interests Accounted for Using the Equity Method of Accounting” in the Notes to our consolidated financial statements for additional information. In addition, in the year ended December 31, 2014, we recorded gains of approximately $98 million related to sales of patents, a gain on the Hortonworks warrants of $98 million, a goodwill impairment charge of $88 million, and net restructuring charges of $103 million related to our cost reduction initiatives. The tax impact of the items referred to above was $3.9 billion, and in the aggregate, these items had a net positive impact of $6.0 billion on net income attributable to Yahoo! Inc., or $6.04 per basic share and $5.94 per diluted share, for the year ended December 31, 2014. |
39
Table of Contents
Consolidated Balance Sheets Data:
| December 31, | ||||||||||||||||||||
| 2010 | 2011 | 2012(1) | 2013(2) | 2014(3) | ||||||||||||||||
| (In thousands) | ||||||||||||||||||||
| Cash and cash equivalents | $ | 1,526,427 | $ | 1,562,390 | $ | 2,667,778 | $ | 2,077,590 | $ | 2,667,916 | ||||||||||
| Marketable securities | $ | 2,102,255 | $ | 967,527 | $ | 3,354,600 | $ | 2,919,804 | $ | 7,558,304 | ||||||||||
| Alibaba Group equity securities | $ | — | $ | — | $ | — | $ | — | $ | 39,867,789 | ||||||||||
| Alibaba Group Preference Shares | $ | — | $ | — | $ | 816,261 | $ | — | $ | — | ||||||||||
| Working capital | $ | 2,719,676 | $ | 2,245,175 | $ | 4,362,481 | $ | 3,685,545 | $ | 5,170,526 | ||||||||||
| Investments in equity interests | $ | 4,011,889 | $ | 4,749,044 | $ | 2,840,157 | $ | 3,426,347 | $ | 2,489,578 | ||||||||||
| Total assets | $ | 14,928,104 | $ | 14,782,786 | $ | 17,103,253 | $ | 16,804,959 | $ | 61,960,344 | ||||||||||
| Income taxes payable related to the sale of Alibaba Group ADSs | $ | — | $ | — | $ | — | $ | — | $ | 3,282,293 | ||||||||||
| Long-term deferred tax liabilities related to Alibaba Group equity securities | $ | — | $ | — | $ | — | $ | — | $ | 16,154,906 | ||||||||||
| Long-term liabilities | $ | 705,822 | $ | 994,078 | $ | 1,207,418 | $ | 2,334,050 | $ | 2,491,265 | ||||||||||
| Total Yahoo! Inc. stockholders’ equity | $ | 12,558,129 | $ | 12,541,067 | $ | 14,560,200 | $ | 13,074,909 | $ | 38,785,592 | ||||||||||
| (1) | During the year ended December 31, 2012, we received $13.54 per Share, or approximately $7.1 billion in total consideration, for the 523 million Alibaba Group shares we sold back to Alibaba Group. Approximately $6.3 billion of the consideration was received in cash and $800 million was received in Alibaba Group Preference Shares. We paid cash taxes of $2.3 billion related to the transaction. See Note 8—“Investments in Equity Interests Accounted for Using the Equity Method of Accounting” in the Notes to our consolidated financial statements for additional information. |
| (2) | During the year ended December 31, 2013, we received net proceeds of $1.4 billion from the issuance of the $1.4375 billion of 0.00% Convertible Notes due 2018 (the “Notes”) issued in November 2013. See Note 11—“Convertible Notes” in the Notes to our consolidated financial statements for additional information. |
| (3) | During the year ended December 31, 2014, we received net proceeds of $9.4 billion from the sale of Alibaba Group ADSs in Alibaba Group’s IPO. As a result of the IPO, we no longer account for Alibaba Group using the equity method of accounting, and reflect our remaining investment as an equity security rather than in investments in equity interests. See Note 3—“Consolidated Financial Statement Details” and Note 8—“Investments in Equity Interests Accounted for Using the Equity Method of Accounting” in the Notes to our consolidated financial statements for additional information. |
40
Table of Contents
Item 7. Management’s Discussion and Analysis of Financial Condition and Results of Operations
Forward-Looking Statements
In addition to current and historical information, this Annual Report on Form 10-K contains forward-looking statements within the meaning of the Private Securities Litigation Reform Act of 1995. These statements relate to our future operations, prospects, potential products, services, developments, and business strategies. These statements can, in some cases, be identified by the use of terms such as “may,” “will,” “should,” “could,” “would,” “intend,” “expect,” “plan,” “anticipate,” “believe,” “estimate,” “predict,” “project,” “potential,” or “continue,” the negative of such terms, or other comparable terminology. This Annual Report on Form 10-K includes, among others, forward-looking statements regarding our:
| • | expectations regarding our proposed spin-off of our remaining holdings in Alibaba Group Holding Limited (“Alibaba Group”); |
| • | expectations about revenue, including display, search, and other revenue; |
| • | expectations about growth in users; |
| • | expectations about changes in our earnings in equity interests and net income; |
| • | expectations about changes in operating expenses; |
| • | anticipated capital expenditures; |
| • | expectations about our share repurchase activity; |
| • | expectations about the financial and operational impacts of our Search and Advertising Services and Sales Agreement (the “Search Agreement”) with Microsoft Corporation (“Microsoft”); |
| • | impact of recent acquisitions on our business and evaluation of, and expectations for, possible acquisitions of, or investments in, businesses, products, intangible assets and technologies; |
| • | expectations about the growth of, the opportunities for monetization in and revenue from, the mobile industry and mobile devices; |
| • | projections and estimates with respect to our restructuring activities and changes to our organizational structure; |
| • | expectations about the amount of unrecognized tax benefits, the outcome of tax assessment appeals, the adequacy of our existing tax reserves, future tax expenditures, and tax rates; |
| • | expectations about positive cash flow generation and existing cash, cash equivalents, and investments being sufficient to meet normal operating requirements; and |
| • | expectations regarding the future outcome of legal proceedings in which we are involved, including the outcome of our efforts to sustain the reversal of a judgment entered against us and one of our subsidiaries in a proceeding in Mexico. |
These statements involve certain known and unknown risks and uncertainties that could cause our actual results to differ materially from those expressed or implied in our forward-looking statements. You are urged to carefully review the disclosures made concerning risks and uncertainties that may affect our business or operating results, which include, among others, those listed in Part 1, Item 1A “Risk Factors” of this Annual Report on Form 10-K. We do not intend, and undertake no obligation, to update or revise any of our forward-looking statements after the date of this Annual Report on Form 10-K to reflect new information, actual results or future events or circumstances.
41
Table of Contents
Overview
Yahoo! Inc., together with its consolidated subsidiaries (“Yahoo,” the “Company,” “we,” or “us”), is a guide focused on making users’ digital habits inspiring and entertaining. By creating highly personalized experiences for our users, we keep people connected to what matters most to them, across devices and around the world. In turn, we create value for advertisers by connecting them with the audiences that build their businesses. For advertisers, the opportunity to be a part of users’ digital habits across products and platforms is a powerful tool to engage audiences and build brand loyalty. Advertisers can build their businesses by advertising to targeted audiences on our online properties and services (“Yahoo Properties”) or through a distribution network of third-party entities (“Affiliates”) who integrate our advertising offerings into their Websites or other offerings (“Affiliate sites”). Our revenue is generated principally from search and display advertising.
We continue to manage and measure our business geographically, principally in the Americas, EMEA (Europe, Middle East, and Africa), and Asia Pacific.
In the following Management’s Discussion and Analysis, we provide information regarding the following areas:
| • | Key Financial Metrics; |
| • | Non-GAAP Financial Measures; |
| • | Significant Transactions; |
| • | Results of Operations; |
| • | Liquidity and Capital Resources; |
| • | Critical Accounting Policies and Estimates; and |
| • | Recent Accounting Pronouncements. |
42
Table of Contents
Key Financial Metrics
The key financial metrics we use are as follows: revenue; revenue less traffic acquisition costs (“TAC”), or revenue ex-TAC; income from operations; adjusted EBITDA; net income attributable to Yahoo! Inc.; net cash provided by (used in) operating activities; and free cash flow. Revenue ex-TAC, adjusted EBITDA, and free cash flow are financial measures that are not defined in accordance with U.S. generally accepted accounting principles (“GAAP”). We use these non-GAAP financial measures for internal managerial purposes and to facilitate period-to-period comparisons. See “Non-GAAP Financial Measures” below for a description of, and limitations specific to, each of these non-GAAP financial measures.
| Years Ended December 31, | ||||||||||||
| 2012 | 2013 | 2014 | ||||||||||
| (dollars in thousands) | ||||||||||||
| Revenue | $ | 4,986,566 | $ | 4,680,380 | $ | 4,618,133 | ||||||
| Revenue ex-TAC | $ | 4,467,660 | $ | 4,425,938 | $ | 4,400,602 | ||||||
| Income from operations(1) | $ | 566,368 | $ | 589,926 | $ | 142,942 | ||||||
| Adjusted EBITDA | $ | 1,698,727 | $ | 1,564,245 | $ | 1,361,548 | ||||||
| Net income attributable to Yahoo! Inc. | $ | 3,945,479 | $ | 1,366,281 | $ | 7,521,731 | ||||||
| Net cash provided by (used in) operating activities | $ | (281,554 | ) | $ | 1,195,247 | $ | 896,700 | |||||
| Free cash flow(2) | $ | (834,865 | ) | $ | 786,465 | $ | 590,450 | |||||
| (1) Includes: |
||||||||||||
| Stock-based compensation expense |
$ | 224,365 | $ | 278,220 | $ | 420,174 | ||||||
| Restructuring charges, net |
$ | 236,170 | $ | 3,766 | $ | 103,450 | ||||||
| (2) | Excluding the impact of the cash taxes paid of $2.3 billion related to the initial repurchase by Alibaba Group of 523 million Alibaba Group ordinary shares (“Alibaba Group shares”) in September 2012 (the “Initial Repurchase”), free cash flow for the year ended December 31, 2012 would have been $1.4 billion. |
Revenue ex-TAC (a non-GAAP financial measure)
| Years Ended December 31, | 2012-2013 % Change |
2013-2014 % Change |
||||||||||||||||||
| 2012 | 2013 | 2014 | ||||||||||||||||||
| (dollars in thousands) | ||||||||||||||||||||
| Revenue | $ | 4,986,566 | $ | 4,680,380 | $ | 4,618,133 | (6 | )% | (1 | )% | ||||||||||
| Less: TAC | 518,906 | 254,442 | 217,531 | (51 | )% | (15 | )% | |||||||||||||
|
|
|
|
|
|
|
|||||||||||||||
| Revenue ex-TAC |
$ | 4,467,660 | $ | 4,425,938 | $ | 4,400,602 | (1 | )% | (1 | )% | ||||||||||
|
|
|
|
|
|
|
|||||||||||||||
For the year ended December 31, 2014, revenue ex-TAC decreased $25 million, or 1 percent, due to a decline in display revenue ex-TAC and other revenue ex-TAC, partially offset by an increase in search revenue ex-TAC. For the year ended December 31, 2013, revenue ex-TAC decreased $42 million, or 1 percent, due to a decrease in display revenue ex-TAC partially offset by an increase in search revenue ex-TAC and other revenue ex-TAC.
The decline in TAC for the year ended December 31, 2014 was primarily driven by the impact of the transition of paid search to Microsoft’s platform. The decline in TAC for the year ended December 31, 2013 was primarily driven by the impact of the closure of our Korea business and the transition of paid search to Microsoft’s platform.
43
Table of Contents
Adjusted EBITDA (a non-GAAP financial measure)
| Years Ended December 31, | 2012-2013 % Change |
2013-2014 % Change |
||||||||||||||||||
| 2012 | 2013 | 2014 | ||||||||||||||||||
| (dollars in thousands) | ||||||||||||||||||||
| Net income attributable to Yahoo! Inc. | $ | 3,945,479 | $ | 1,366,281 | $ | 7,521,731 | (65 | )% | N/M | |||||||||||
| Costs associated with the Korea business and its closure | 99,485 | — | — | (100 | )% | 0 | % | |||||||||||||
| Deal-related costs related to the sale of Alibaba Group shares | 6,500 | — | — | (100 | )% | 0 | % | |||||||||||||
| Depreciation and amortization | 649,267 | 628,778 | 606,568 | (3 | )% | (4 | )% | |||||||||||||
| Stock-based compensation expense | 224,365 | 278,220 | 420,174 | 24 | % | 51 | % | |||||||||||||
| Goodwill impairment charge | — | 63,555 | 88,414 | 100 | % | 39 | % | |||||||||||||
| Restructuring charges, net, as adjusted(1) | 152,742 | 3,766 | 103,450 | (98 | )% | N/M | ||||||||||||||
| Other income, net | (4,647,839 | ) | (43,357 | ) | (10,369,439 | ) | N/M | N/M | ||||||||||||
| Provision for income taxes | 1,940,043 | 153,392 | 4,038,102 | N/M | N/M | |||||||||||||||
| Earnings in equity interests | (676,438 | ) | (896,675 | ) | (1,057,863 | ) | 33 | % | 18 | % | ||||||||||
| Net income attributable to noncontrolling interests | 5,123 | 10,285 | 10,411 | 101 | % | 1 | % | |||||||||||||
|
|
|
|
|
|
|
|||||||||||||||
| Adjusted EBITDA |
$ | 1,698,727 | $ | 1,564,245 | $ | 1,361,548 | (8 | )% | (13 | )% | ||||||||||
|
|
|
|
|
|
|
|||||||||||||||
| Percentage of revenue ex-TAC(2)(3) |
38 | % | 35 | % | 31 | % | ||||||||||||||
|
|
|
|
|
|
|
|||||||||||||||
N/M = Not Meaningful
| (1) | For the year ended December 31, 2012, this amount excludes the restructuring charges of $83 million related to the Korea business and its closure, which charges are included in costs associated with the Korea business and its closure. |
| (2) | Revenue ex-TAC is calculated as GAAP revenue less TAC. |
| (3) | Net income attributable to Yahoo! Inc. as a percentage of GAAP revenue in 2012, 2013, and 2014 was 79 percent, 29 percent, and 163 percent, respectively. |
For the years ended December 31, 2014 and 2013, adjusted EBITDA decreased $203 million, or 13 percent, and $134 million, or 8 percent, compared to 2013 and 2012, respectively, mainly due to an increase in global operating costs to support our growth initiatives.
44
Table of Contents
Free Cash Flow (a non-GAAP financial measure)
| Years Ended December 31, | ||||||||||||
| 2012 | 2013 | 2014 | ||||||||||
| (dollars in thousands) | ||||||||||||
| Net cash provided by (used in) operating activities | $ | (281,554 | ) | $ | 1,195,247 | $ | 896,700 | |||||
| Acquisition of property and equipment, net |
(505,507 | ) | (338,131 | ) | (372,147 | ) | ||||||
| Dividends received from equity investees |
(83,648 | ) | (135,058 | ) | (83,685 | ) | ||||||
| Excess tax benefits from stock-based awards |
35,844 | 64,407 | 149,582 | |||||||||
|
|
|
|
|
|
|
|||||||
| Free cash flow(*) |
$ | (834,865 | ) | $ | 786,465 | $ | 590,450 | |||||
|
|
|
|
|
|
|
|||||||
| (*) | Excluding the impact of the cash taxes paid of $2.3 billion related to the Initial Repurchase, free cash flow for the year ended December 31, 2012 would have been $1.4 billion. |
For the year ended December 31, 2014, free cash flow decreased $196 million, compared to 2013, primarily due to a decline in adjusted EBITDA and an increase in the acquisition of property and equipment to support our growth initiatives.
For the year ended December 31, 2013, free cash flow increased $1.6 billion, compared to 2012. Excluding the impact of the cash taxes paid in 2012 of $2.3 billion related to the Initial Repurchase, free cash flow decreased $645 million in 2013, compared to 2012. The decline was primarily due to an upfront payment of $550 million we received in 2012 from Alibaba Group in satisfaction of certain future royalty payments under the existing technology and intellectual property license agreement with Alibaba Group (the “TIPLA”), for which there were no similar payments in 2013. This was partially offset by a decrease in capital expenditures.
Non-GAAP Financial Measures
Revenue ex-TAC. Revenue ex-TAC is a non-GAAP financial measure defined as GAAP revenue less TAC. TAC consists of payments made to Affiliates that have integrated our advertising offerings into their sites and payments made to companies that direct consumer and business traffic to Yahoo Properties. Based on the terms of the Search Agreement with Microsoft described in Note 19—“Search Agreement with Microsoft Corporation” in the Notes to our consolidated financial statements, Microsoft retains a revenue share of 12 percent of the net (after TAC) search revenue generated on Yahoo Properties and Affiliate sites in transitioned markets. We report the net revenue we receive under the Search Agreement as revenue and no longer present the associated TAC. Accordingly, for transitioned markets we report GAAP revenue associated with the Search Agreement on a net (after TAC) basis rather than a gross basis. For markets that had not yet transitioned, revenue continued to be recorded on a gross (before TAC) basis, and TAC is recorded as a part of operating expenses.
We present revenue ex-TAC to provide investors a metric used by us for evaluation and decision-making purposes during the Microsoft transition and to provide investors with comparable revenue numbers when comparing periods preceding, during and following the transition period. A limitation of revenue ex-TAC is that it is a measure which we have defined for internal and investor purposes that may be unique to us, and therefore it may not enhance the comparability of our results to other companies in our industry who have similar business arrangements but address the impact of TAC differently. Management compensates for these limitations by also relying on the comparable GAAP financial measures of revenue and total operating expenses, which include TAC in non-transitioned markets.
45
Table of Contents
Adjusted EBITDA. Adjusted EBITDA is a non-GAAP financial measure defined as net income attributable to Yahoo! Inc. before taxes, depreciation, amortization of intangible assets, stock-based compensation expense, other income, net (which includes interest), earnings in equity interests, net income attributable to noncontrolling interests, and certain gains, losses, and expenses that we do not believe are indicative of our ongoing results.
We present adjusted EBITDA because the exclusion of certain gains, losses, and expenses facilitates comparisons of the operating performance of our Company on a period to period basis. Adjusted EBITDA has limitations as an analytical tool and should not be considered in isolation or as a substitute for results reported under GAAP. These limitations include: adjusted EBITDA does not reflect tax payments and such payments reflect a reduction in cash available to us; adjusted EBITDA does not reflect the periodic costs of certain capitalized tangible and intangible assets used in generating revenues in our businesses; adjusted EBITDA does not include stock-based compensation expense related to our workforce; adjusted EBITDA also excludes other income, net (which includes interest), earnings in equity interests, net income attributable to noncontrolling interests and certain gains, losses, and expenses that we do not believe are indicative of our ongoing results, and these items may represent a reduction or increase in cash available to us. Adjusted EBITDA is a measure that may be unique to us, and therefore it may not enhance the comparability of our results to other companies in our industry. Management compensates for these limitations by also relying on the comparable GAAP financial measure of net income attributable to Yahoo! Inc., which includes taxes, depreciation, amortization, stock-based compensation expense, other income, net (which includes interest), earnings in equity interests, net income attributable to noncontrolling interests and the other gains, losses and expenses that are excluded from adjusted EBITDA.
Free Cash Flow. Free cash flow is a non-GAAP financial measure defined as net cash provided by (used in) operating activities (adjusted to include excess tax benefits from stock-based awards), less (i) acquisition of property and equipment, net and (ii) dividends received from equity investees.
We consider free cash flow to be a liquidity measure which provides useful information to management and investors about the amount of cash generated by the business after the acquisition of property and equipment, which can then be used for strategic opportunities including, among others, investing in our business, making strategic acquisitions, strengthening the balance sheet, and repurchasing stock. A limitation of free cash flow is that it does not represent the total increase or decrease in the cash balance for the period. Free cash flow is a measure that may be unique to us, and therefore it may not enhance the comparability of our results to other companies in our industry. Management compensates for the limitation of free cash flow by also relying on the net change in cash and cash equivalents as presented in our consolidated statements of cash flows prepared in accordance with GAAP which incorporates all cash movements during the period.
Significant Transactions
Acquisition of BrightRoll
On December 12, 2014, the Company completed the acquisition of BrightRoll, Inc. (“BrightRoll”), a leading programmatic video advertising platform, for $583 million. The transaction will combine Yahoo’s premium-desktop and mobile video advertising inventory with BrightRoll’s programmatic video platform and publisher relationships to bring substantial value to advertisers on both platforms.
See Note 4—“Acquisitions and Dispositions” in the Notes to our consolidated financial statements for additional information.
46
Table of Contents
Acquisition of Flurry
On August 25, 2014, we completed the acquisition of Flurry, Inc. (“Flurry”), a mobile data analytics company that optimizes mobile experiences for developers, marketers, and consumers, for $270 million. The combined scale of Yahoo and Flurry is expected to create more personalized and inspiring app experiences for users and enable more effective mobile advertising solutions for brands seeking to reach their audiences and gain cross-device insights.
See Note 4—“Acquisitions and Dispositions” in the Notes to our consolidated financial statements for additional information.
Alibaba Group Holding Limited Initial Public Offering
On September 24, 2014, Alibaba Group closed its initial public offering (“IPO”) of American Depositary Shares (“ADSs”). Each Alibaba Group ADS represents one ordinary share of Alibaba Group. Yahoo! Hong Kong Holdings Limited (“YHK”), our wholly owned subsidiary, sold 140,000,000 Alibaba Group ADSs in the IPO at an initial public offering price of $68.00 per ADS. We received $9.4 billion (net of underwriting discounts, commissions, and fees of approximately $115 million) in cash for the 140 million Alibaba Group ADSs sold. We recorded a pre-tax gain of $10.3 billion (including a $1.3 billion gain reflecting our proportionate share of the IPO proceeds) for the year ended December 31, 2014, which is included in other income, net on the consolidated statements of income. The after-tax gain was approximately $6.3 billion. Following completion of the sale in the IPO, we retained 383,565,416 ordinary shares of Alibaba Group, representing approximately 15 percent of Alibaba Group’s outstanding ordinary shares.
As a result of the IPO, we no longer account for our remaining investment in Alibaba Group using the equity method and no longer record our proportionate share of Alibaba Group’s financial results in the consolidated financial statements. We reflect our remaining investment in Alibaba Group as an available-for-sale equity security on the consolidated balance sheet and adjust the investment to fair value each quarterly reporting period with changes in fair value recorded within other comprehensive income (loss), net of tax. Also in connection with the IPO, each of Yahoo and YHK entered into a lock-up agreement with the underwriters restricting the sale of its remaining ordinary shares of Alibaba Group (“Alibaba Group shares”) for a period of one year, subject to certain exceptions.
As a result of the IPO, the Technology and Intellectual License Agreement (“TIPLA”) with Alibaba Group will terminate on September 18, 2015, the remaining initial TIPLA deferred revenue of $268 million is now being recognized ratably over the remaining term of the TIPLA, and Alibaba Group’s obligation to make royalty payments under the TIPLA ceased on September 24, 2014.
See Note 2—“Marketable Securities, Investments and Fair Value Disclosures,” Note 3—“Consolidated Financial Statement Details,” and Note 8—“Investments in Equity Interests Accounted for Using the Equity Method of Accounting” in the Notes to our consolidated financial statements for additional information.
Spin-Off of Remaining Holdings in Alibaba Group
On January 27, 2015, we announced a plan for a spin-off of all of our remaining holdings in Alibaba Group into a newly formed independent registered investment company (referred to as “SpinCo”). The stock of SpinCo will be distributed pro rata to our stockholders, resulting in SpinCo becoming a separate publicly traded registered investment company. Following the completion of the transaction, SpinCo will own all of Yahoo’s remaining 384 million Alibaba Group shares and Yahoo Small Business, a current operating business of Yahoo that will also be transferred to SpinCo as part of the transaction. SpinCo will not assume any debt as part of the transaction.
47
Table of Contents
The completion of the transaction is expected to occur in the fourth quarter of 2015 after the expiration of our one-year lock-up agreement relating to the Alibaba Group shares entered into in connection with the Alibaba Group IPO. The transaction is subject to certain conditions, including final approval by our Board, receipt of a favorable ruling from the Internal Revenue Service with respect to certain aspects of the transaction and a legal opinion with respect to the tax-free treatment of the transaction under U.S. federal tax laws and regulations, the effectiveness of an applicable registration statement with the Securities and Exchange Commission and compliance with the requirements under the Investment Company Act of 1940, and other customary conditions.
The composition of SpinCo’s independent board of directors and management team, and other details of the transaction, including the distribution ratio, will be determined prior to the closing of the transaction.
Upon closing of the transaction, which is subject to the conditions specified above, our consolidated financial position will be materially impacted as the Alibaba Group shares and related deferred tax liabilities will be removed from our consolidated balance sheet with a corresponding reduction of our stockholders’ equity balance. We would no longer hold any Alibaba Group shares and would no longer record changes in fair value within comprehensive income (loss).
Patent Sale and License Agreement
During the second quarter of 2014, we entered into a patent sale and license agreement for total cash consideration of $460 million. The total consideration was allocated based on the estimated relative fair value of each of the elements of the agreement: $61 million was allocated to the sale of patents (“Sold Patents”), $135 million to the license to existing patents (“Existing Patents”) and $264 million to the license of patents developed or acquired in the next five years (“Capture Period Patents”). We recorded $61 million as a gain on the Sold Patents during the year ended December 31, 2014. We recognized $43 million in revenue related to the Existing Patents and Capture Period Patents during the year ended December 31, 2014. The amounts allocated to the license of the Existing Patents will be recorded as revenue over the four year payment period when payments are due. The amounts allocated to the Capture Period Patents will be recorded as revenue over the five year capture period.
See “Operating Costs and Expenses—Gains on Sales of Patents” for additional information on gains recorded for the years ended December 31, 2013 and 2014.
Search Agreement with Microsoft Corporation
The term of the Search Agreement is 10 years from its commencement date, February 23, 2010, subject to earlier termination as provided in the Search Agreement. During the first five years of the term of the Search Agreement, in the transitioned markets, we were entitled to receive 88 percent of the revenue (the “Revenue Share Rate”) generated from Microsoft’s services on Yahoo Properties and from Microsoft’s services on Affiliate sites after deduction of the Affiliate’s share of revenue and certain Microsoft costs for new Affiliates and for all Affiliates (including existing Affiliates) after the first five years. As of February 23, 2015, the Revenue Share Rate increased to 90 percent pursuant to the terms of the Search Agreement.
For search revenue generated from Microsoft’s services on Yahoo Properties and Affiliate sites, we report as revenue our revenue share, as we are not the primary obligor in the arrangement with the advertisers and publishers, and the amounts paid to Affiliates are recorded on a net basis as a reduction of revenue. The underlying search advertising services are provided by Microsoft. Revenue under the Search Agreement represented approximately 25 percent, 31 percent, and 35 percent of our revenue for the years ended December 31, 2012, 2013, and 2014, respectively.
48
Table of Contents
Our results reflect search operating cost reimbursements from Microsoft under the Search Agreement of $67 million, $49 million, and less than $1 million for the years ended December 31, 2012, 2013, and 2014, respectively.
As of February 23, 2015, for a period of 30 days following such date, in addition to other termination rights, the Company has the right to terminate the Search Agreement if the trailing 12-month average of the Company’s revenue per search in the United States (the “U.S. RPS”) on Yahoo Properties is less than a specified percentage of Google’s trailing 12-month estimated average U.S. RPS, excluding, in each case, mobile devices.
See Note 19—“Search Agreement with Microsoft Corporation” in the Notes to our consolidated financial statements for additional information.
49
Table of Contents
Results of Operations
| Years Ended December 31, | 2012-2013 % Change |
2013-2014 % Change |
||||||||||||||||||
| 2012 | 2013 | 2014 | ||||||||||||||||||
| (dollars in thousands) | ||||||||||||||||||||
| Revenue for groups of similar services: | ||||||||||||||||||||
| Search | ||||||||||||||||||||
| Yahoo Properties |
$ | 1,206,209 | $ | 1,371,134 | $ | 1,518,035 | 14 | % | 11 | % | ||||||||||
| Affiliate sites |
679,651 | 370,657 | 274,826 | (45 | )% | (26 | )% | |||||||||||||
|
|
|
|
|
|
|
|||||||||||||||
| Total Search revenue |
$ | 1,885,860 | $ | 1,741,791 | $ | 1,792,861 | (8 | )% | 3 | % | ||||||||||
|
|
|
|
|
|
|
|||||||||||||||
| Display | ||||||||||||||||||||
| Yahoo Properties |
$ | 1,930,234 | $ | 1,744,130 | $ | 1,627,458 | (10 | )% | (7 | )% | ||||||||||
| Affiliate sites |
212,584 | 205,700 | 240,577 | (3 | )% | 17 | % | |||||||||||||
|
|
|
|
|
|
|
|||||||||||||||
| Total Display revenue |
$ | 2,142,818 | $ | 1,949,830 | $ | 1,868,035 | (9 | )% | (4 | )% | ||||||||||
|
|
|
|
|
|
|
|||||||||||||||
| Other | $ | 957,888 | $ | 988,759 | $ | 957,237 | 3 | % | (3 | )% | ||||||||||
|
|
|
|
|
|
|
|||||||||||||||
| Total revenue |
$ | 4,986,566 | $ | 4,680,380 | $ | 4,618,133 | (6 | )% | (1 | )% | ||||||||||
| Cost of revenue—TAC | 518,906 | 254,442 | 217,531 | (51 | )% | (15 | )% | |||||||||||||
| Cost of revenue—other | 1,101,660 | 1,094,938 | 1,080,783 | (1 | )% | (1 | )% | |||||||||||||
| Sales and marketing | 1,101,572 | 1,130,820 | 1,234,268 | 3 | % | 9 | % | |||||||||||||
| Product development | 885,824 | 1,008,487 | 1,207,146 | 14 | % | 20 | % | |||||||||||||
| General and administrative | 540,247 | 569,555 | 574,743 | 5 | % | 1 | % | |||||||||||||
| Amortization of intangibles | 35,819 | 44,841 | 66,750 | 25 | % | 49 | % | |||||||||||||
| Gains on sales of patents | — | (79,950 | ) | (97,894 | ) | 100 | % | 22 | % | |||||||||||
| Goodwill impairment charge | — | 63,555 | 88,414 | 100 | % | 39 | % | |||||||||||||
| Restructuring charges, net | 236,170 | 3,766 | 103,450 | (98 | )% | N/M | ||||||||||||||
|
|
|
|
|
|
|
|||||||||||||||
| Total operating expenses |
$ | 4,420,198 | $ | 4,090,454 | $ | 4,475,191 | (7 | )% | 9 | % | ||||||||||
|
|
|
|
|
|
|
|||||||||||||||
| Income from operations |
$ | 566,368 | $ | 589,926 | $ | 142,942 | 4 | % | (76 | )% | ||||||||||
|
|
|
|
|
|
|
|||||||||||||||
| Includes: |
||||||||||||||||||||
| Stock-based compensation expense |
$ | 224,365 | $ | 278,220 | $ | 420,174 | 24 | % | 51 | % | ||||||||||
| Costs associated with the Korea business and its closure |
$ | 99,485 | $ | — | $ | — | (100 | )% | 0 | % | ||||||||||
N/M = Not Meaningful
50
Table of Contents
The following table sets forth selected information concerning our results of operations as a percentage of revenue for the period indicated:
| Years Ended December 31, | ||||||||||||
| 2012 | 2013 | 2014 | ||||||||||
| (dollars in thousands) | ||||||||||||
| Revenue for groups of similar services: | ||||||||||||
| Search | ||||||||||||
| Yahoo Properties |
24 | % | 29 | % | 33 | % | ||||||
| Affiliate sites |
14 | % | 8 | % | 6 | % | ||||||
|
|
|
|
|
|
|
|||||||
| Total Search revenue |
38 | % | 37 | % | 39 | % | ||||||
|
|
|
|
|
|
|
|||||||
| Display | ||||||||||||
| Yahoo Properties |
39 | % | 37 | % | 35 | % | ||||||
| Affiliate sites |
4 | % | 5 | % | 5 | % | ||||||
|
|
|
|
|
|
|
|||||||
| Total Display revenue |
43 | % | 42 | % | 40 | % | ||||||
|
|
|
|
|
|
|
|||||||
| Other | 19 | % | 21 | % | 21 | % | ||||||
|
|
|
|
|
|
|
|||||||
| Total revenue |
100 | % | 100 | % | 100 | % | ||||||
| Cost of revenue—TAC | 10 | % | 6 | % | 5 | % | ||||||
| Cost of revenue—other | 22 | % | 23 | % | 23 | % | ||||||
| Sales and marketing | 22 | % | 24 | % | 27 | % | ||||||
| Product development | 18 | % | 22 | % | 26 | % | ||||||
| General and administrative | 11 | % | 12 | % | 12 | % | ||||||
| Amortization of intangibles | 1 | % | 1 | % | 2 | % | ||||||
| Gains on sales of patents | — | (2 | )% | (2 | )% | |||||||
| Goodwill impairment charge | — | 1 | % | 2 | % | |||||||
| Restructuring charges, net | 5 | % | — | 2 | % | |||||||
|
|
|
|
|
|
|
|||||||
| Total operating expenses |
89 | % | 87 | % | 97 | % | ||||||
|
|
|
|
|
|
|
|||||||
| Income from operations |
11 | % | 13 | % | 3 | % | ||||||
|
|
|
|
|
|
|
|||||||
| Includes: |
||||||||||||
| Stock-based compensation expense |
4 | % | 6 | % | 9 | % | ||||||
| Costs associated with the Korea business and its closure |
2 | % | — | — | ||||||||
51
Table of Contents
Management Reporting
We continue to manage our business geographically. The primary areas of measurement and decision making are currently the Americas, EMEA and Asia Pacific. Management relies on an internal reporting process that provides revenue ex-TAC, direct costs excluding TAC by segment, and consolidated income from operations for making decisions related to the evaluation of the financial performance of, and allocating resources to, our segments.
| Years Ended December 31, | 2012-2013 % Change |
2013-2014 % Change |
||||||||||||||||||
| 2012 | 2013 | 2014 | ||||||||||||||||||
| (dollars in thousands) | ||||||||||||||||||||
| Revenue by segment: | ||||||||||||||||||||
| Americas |
$ | 3,461,633 | $ | 3,481,502 | $ | 3,517,861 | 1 | % | 1 | % | ||||||||||
| EMEA |
472,061 | 385,186 | 374,833 | (18 | )% | (3 | )% | |||||||||||||
| Asia Pacific |
1,052,872 | 813,692 | 725,439 | (23 | )% | (11 | )% | |||||||||||||
|
|
|
|
|
|
|
|||||||||||||||
| Total revenue |
$ | 4,986,566 | $ | 4,680,380 | $ | 4,618,133 | (6 | )% | (1 | )% | ||||||||||
| TAC by segment: | ||||||||||||||||||||
| Americas |
$ | 182,511 | $ | 158,974 | $ | 166,545 | (13 | )% | 5 | % | ||||||||||
| EMEA |
114,230 | 42,915 | 36,867 | (62 | )% | (14 | )% | |||||||||||||
| Asia Pacific |
222,165 | 52,553 | 14,119 | (76 | )% | (73 | )% | |||||||||||||
|
|
|
|
|
|
|
|||||||||||||||
| Total TAC |
$ | 518,906 | $ | 254,442 | $ | 217,531 | (51 | )% | (15 | )% | ||||||||||
| Revenue ex-TAC by segment: | ||||||||||||||||||||
| Americas |
$ | 3,279,122 | $ | 3,322,528 | $ | 3,351,316 | 1 | % | 1 | % | ||||||||||
| EMEA |
357,831 | 342,271 | 337,966 | (4 | )% | (1 | )% | |||||||||||||
| Asia Pacific |
830,707 | 761,139 | 711,320 | (8 | )% | (7 | )% | |||||||||||||
|
|
|
|
|
|
|
|||||||||||||||
| Total revenue ex-TAC |
$ | 4,467,660 | $ | 4,425,938 | $ | 4,400,602 | (1 | )% | (1 | )% | ||||||||||
| Direct costs by segment(1): | ||||||||||||||||||||
| Americas |
300,004 | 194,394 | 199,612 | (35 | )% | 3 | % | |||||||||||||
| EMEA |
95,632 | 88,534 | 86,225 | (7 | )% | (3 | )% | |||||||||||||
| Asia Pacific |
181,632 | 196,832 | 198,806 | 8 | % | 1 | % | |||||||||||||
| Global operating costs(2)(3) | 2,214,222 | 2,461,883 | 2,652,305 | 11 | % | 8 | % | |||||||||||||
| Depreciation and amortization | 649,267 | 628,778 | 606,568 | (3 | )% | (4 | )% | |||||||||||||
| Stock-based compensation expense | 224,365 | 278,220 | 420,174 | 24 | % | 51 | % | |||||||||||||
| Gains on sales of patents | — | (79,950 | ) | (97,894 | ) | 100 | % | 22 | % | |||||||||||
| Goodwill impairment charge | — | 63,555 | 88,414 | 100 | % | 39 | % | |||||||||||||
| Restructuring charges, net | 236,170 | 3,766 | 103,450 | (98 | )% | N/M | ||||||||||||||
|
|
|
|
|
|
|
|||||||||||||||
| Income from operations |
$ | 566,368 | $ | 589,926 | $ | 142,942 | 4 | % | (76 | )% | ||||||||||
|
|
|
|
|
|
|
|||||||||||||||
N/M = Not Meaningful
| (1) | Direct costs for each segment include certain cost of revenue-other and costs associated with the local sales teams. Prior to the fourth quarter of 2014, marketing, media, costs associated with Yahoo Properties and ad operation costs were managed locally and included as direct costs for each segment. Prior period amounts have been revised to conform to the current presentation. |
52
Table of Contents
| (2) | Global operating costs include product development, marketing, real estate workplace, general and administrative, and other corporate expenses that are managed on a global basis and that are not directly attributable to any particular segment. Beginning in the fourth quarter of 2014, marketing, media, costs associated with Yahoo Properties and other ad operation costs are managed globally and included as global costs. Prior period amounts have been revised to conform to the current presentation. |
| (3) | The net cost reimbursements from Microsoft pursuant to the Search Agreement are primarily included in global operating costs. Operating costs and expenses consist of cost of revenue—TAC; cost of revenue—other; sales and marketing, product development; general and administrative; amortization of intangible assets; and restructuring charges, net. Cost of revenue—other consists of bandwidth costs and other expenses associated with the production and usage of Yahoo Properties, including amortization of acquired intellectual property rights and developed technology. |
Revenue
We generate revenue principally from search and display advertising on Yahoo Properties and Affiliate sites, with the majority of our revenue coming from advertising on Yahoo Properties. Our margins on revenue from advertising on Yahoo Properties are higher than our margins on revenue from advertising on Affiliate sites as we pay TAC to our Affiliates. Additionally, we generate revenue from other sources including listings-based services, facilitating commercial transactions, royalties, and consumer and business fee-based services.
Mobile Revenue
With the significant platform shift to mobile devices, including smartphones and tablets, we have increased our strategic focus on mobile products and mobile ad formats. We have hired engineering and technical talent to help us accelerate our efforts in mobile development, and introduced new mobile apps and refreshed the user experience on mobile across a number of Yahoo Properties, including News, Sports (including Fantasy Sports), Mail, Finance, Weather, and Screen. We are seeing an increase in the number of our daily and monthly mobile users as a result of these product improvements. During the year ended December 31, 2014, we reached more than 575 million monthly mobile users (including Tumblr).
Mobile revenue is generated in connection with user activity on mobile devices, including smartphones and tablets (a “device-based” approach), regardless of whether the device is accessing a mobile-optimized service. Mobile revenue is primarily generated by search and display advertising. Mobile search revenue is generated from clicks on text-based links to advertisers’ Websites that appear primarily on search results pages. Search revenue is recognized based on Paid Clicks. A Paid Click occurs when an end-user clicks on a sponsored listing on Yahoo Properties or Affiliate sites for which an advertiser pays on a per click basis. Mobile display revenue is generated from the display of graphical and non-graphical advertisements on mobile. The Company recognizes revenue from display advertising on Yahoo Properties and Affiliate sites as impressions of or clicks on display advertisements are delivered. Impressions are delivered when a sold advertisement appears in pages viewed by users. Clicks are delivered when a user clicks on a native advertisement.
Mobile revenue for the year ended December 31, 2014 was $768 million. Mobile revenue is included within Search, Display, and Other revenue that we have reported. In the latter half of 2014, we saw a significant increase in the contribution of mobile revenue to our total revenue. We expect this trend to continue in 2015.
53
Table of Contents
Search Revenue
Search revenue is generated from mobile and PC clicks on text-based links to advertisers’ Websites that appear primarily on search results pages (“search advertising”). We recognize revenue from search advertising on Yahoo Properties and Affiliate sites. Search revenue is recognized based on Paid Clicks. A Paid Click occurs when an end-user clicks on a sponsored listing on Yahoo Properties or Affiliate sites for which an advertiser pays on a per click basis. Under the Search Agreement with Microsoft, in transitioned markets we report as revenue our 88 percent revenue share as we are not the primary obligor in the arrangement with the advertisers and publishers, and the amounts paid to Affiliates are recorded as a reduction of revenue. Prior to transition, we paid Affiliates TAC for the revenue generated from the search advertisements on Affiliate sites. The revenue derived from these arrangements is reported on a gross basis (before deducting the TAC paid to Affiliates as cost of revenue—TAC), as we were the primary obligor to the advertisers in non-transitioned markets. The search revenue generated from mobile ads served through Yahoo Gemini that involve traffic supplied by Affiliates is reported gross of the TAC paid to Affiliates (reported as cost of revenue – TAC) as the Company performs the search service. Accordingly, the Company is considered the primary obligor to the advertisers who are the customers of the search advertising service. We also generate search revenue from a revenue sharing arrangement with Yahoo Japan for search technology and services as reported.
Search revenue for the year ended December 31, 2014 increased by 3 percent, compared to the same period of 2013, driven by revenue-per-search in the Americas region on Yahoo Properties and growth in advertising revenue from mobile, partially offset by the impact of the Microsoft transition in the Asia Pacific region. Search revenue increased for the year ended December 31, 2014, as compared to 2013, despite the expiration in March 2014 of Microsoft’s guarantee of Yahoo revenue-per-search under the Search Agreement (the “RPS Guarantee”) in the U.S. The increase in search revenue for the year ended December 31, 2014 was primarily attributable to an increase in advertising revenue on Yahoo Properties in the Americas, EMEA, and Asia Pacific regions of $94 million, $38 million, and $15 million, respectively, partially offset by a decline in advertising revenue on Affiliate sites in the Americas, EMEA, and Asia Pacific regions of $12 million, $8 million and $76 million, respectively. The decline in Affiliate search revenue in the Asia Pacific region was due to the required change in revenue presentation for transitioned markets from a gross (before TAC) to a net (after TAC) basis.
Search revenue for the year ended December 31, 2013 decreased by 8 percent, compared to 2012. Search revenue decreased primarily due to declines in Affiliate revenue in the Asia Pacific region resulting from the closure of our Korea business, and declines in Affiliate revenue in the EMEA region due to the required change in revenue presentation for transitioned markets from a gross (before TAC) to a net (after TAC) basis. This was partially offset by increased search revenue in the Americas region, which resulted from an increase in sponsored searches on Yahoo Properties and higher revenue per search due to improved ad formats.
Display Revenue
Display revenue is generated from the display of graphical and non-graphical advertisements (“display advertising”). We earn revenue from guaranteed or “premium” display advertising by delivering advertisements according to advertisers’ specified criteria, such as number of impressions during a fixed period on a specific placement. Also, we earn revenue from non-guaranteed or “non-premium” display advertising by delivering advertisements on a preemptible basis. Non-premium advertising also includes native advertising for which we recognize revenue when a user clicks on a native advertisement.
54
Table of Contents
We recognize revenue from display advertising on Yahoo Properties and Affiliate sites as impressions of or clicks on display advertisements are delivered. Impressions are delivered when a sold advertisement appears in pages viewed by users. Clicks are delivered when a user clicks on a native advertisement. Arrangements for these services generally have terms of up to one year. For display advertising on Affiliate sites, we pay TAC to Affiliates for the revenue generated from the display of these advertisements on the Affiliate sites. The display revenue derived from these arrangements that involve traffic supplied by Affiliates is reported on a gross basis (before deducting the TAC paid to Affiliates as cost of revenue—TAC) as we are the primary obligor to the advertisers who are the customers of the display advertising service.
Display revenue for the year ended December 31, 2014 decreased by 4 percent, compared to 2013, primarily due to a mix shift from premium ad units to lower monetizing native ad units. The decline for the year ended December 31, 2014 was primarily attributable to a decline in advertising revenue on Yahoo Properties in the Americas, EMEA, and Asia Pacific regions of $64 million, $15 million, and $38 million, respectively, and a decline in advertising revenue on Affiliate sites in the EMEA region of $8 million, partially offset by an increase in advertising revenue on Affiliate sites in the Americas and Asia Pacific regions of $29 million and $15 million, respectively. The growth in Affiliate revenue in the Americas region was primarily attributable to incremental revenue from acquisitions made during 2014.
Display revenue for the year ended December 31, 2013 decreased by 9 percent, compared to 2012. This decrease was primarily attributable to a decline in number of ads that we sold on a premium basis on Yahoo Properties in the Americas region.
Other Revenue
Other revenue includes listings-based services revenue, transaction revenue, royalties, and fees revenue. Listings-based services revenue is generated from a variety of consumer and business listings-based services, including classified advertising, such as Yahoo Local and other services. We recognize listings-based services revenue when the services are performed. Transaction revenue is generated from facilitating commercial transactions through Yahoo Properties, principally from Yahoo Small Business, Yahoo Travel, and Yahoo Shopping. We recognize transaction revenue when there is evidence that qualifying transactions have occurred. We also receive royalties from Yahoo Japan and Alibaba Group that are recognized when earned. See Note 8—“Investments in Equity Interests Accounted for Using the Equity Method of Accounting” in the Notes to our consolidated financial statements for additional information on revenue earned from Yahoo Japan and Alibaba Group. Fees revenue consists of revenue generated from a variety of consumer and business fee-based services as well as services for small businesses. We recognize fees revenue when the services are performed.
Other revenue for the year ended December 31, 2014 decreased by 3 percent, compared to 2013. The decrease for the year ended December 31, 2014 was primarily attributable to a decline in listings-based revenue in the Americas, EMEA and Asia Pacific regions of $47 million, $15 million, and $6 million, respectively, partially offset by an increase in fees revenue in the Americas region of $37 million. The increase in fees revenue in the Americas region for the year ended December 31, 2014 was primarily attributable to royalty revenue associated with the patent sale and license agreement that we entered into in the second quarter of 2014. See “Significant Transactions—Patent Sale and License Agreement” for additional information.
Other revenue for the year ended December 31, 2013 increased by 3 percent, compared to 2012. The increase was primarily due to increased royalty revenue resulting from the amended TIPLA agreement with Alibaba Group. This was partially offset by a decrease in listings-based revenue in the Americas region.
55
Table of Contents
Search and Display Metrics
We present information below regarding the number of “Paid Clicks” and “Price-per-Click” for search and the number of “Ads Sold” and “Price-per-Ad” for display. This information is derived from internal data.
“Paid Clicks” are defined as clicks by end-users on sponsored search listings (excluding native ad units) on Yahoo Properties and Affiliate sites. Advertisers generally pay for sponsored search listings on a per-click basis. “Search click-driven revenue” is gross search revenue (GAAP search revenue plus the related revenue share with third parties), excluding the Microsoft RPS Guarantee and search revenue from Yahoo Japan. “Price-per-Click” is defined as search click-driven revenue divided by our total number of Paid Clicks.
“Ads Sold” consist of display ad impressions for paying advertisers on Yahoo Properties. “Price-per-Ad” is defined as display revenue from Yahoo Properties divided by our total number of Ads Sold. Our price and volume metrics for display are based on display revenue which we report on a gross basis (before TAC), and include data for graphical, sponsorship, and native ad units on Yahoo Properties (including mobile). Our price and volume metrics for display exclude both the number of Ads Sold and the related revenue for certain regions and acquired companies where historical data was not retained in a manner that would support period-to-period comparison on these metrics. The countries and regions included in our display metrics are: the U.S., the United Kingdom, France, Germany, Spain, Italy, Taiwan, Hong Kong, Southeast Asia, and India.
We periodically review, refine and update our methodologies for monitoring, gathering, and counting number of Paid Clicks and Ads Sold and for calculating search click-driven revenue, Price-per-Click, and Price-per-Ad.
Tumblr, Inc. (“Tumblr”) data is included in our display metrics beginning in the first quarter of 2014. The Tumblr data that we included for the first and second quarter of 2014 consisted solely of native ad units. Also, commencing in the third quarter of 2013, we made three other updates to our methodologies. First, we have included the impressions and revenue associated with our native ad units, which are display ads that appear in the content streams viewed by users, in our display price and volume metrics (Ads Sold and Price-per-Ad). Second, to provide metrics that are more consistent with our historical revenue trends, the revenue and volume associated with other display advertisements sold on a price-per-click basis have been excluded from our search price and volume metrics (Paid Clicks and Price-per-Click) and they will continue to be excluded from our display price and volume metrics. Finally, the Microsoft RPS Guarantee has been excluded from the calculation of Price-per-Click. Due to the closure of the Korea business in the fourth quarter of 2012, “Ads Sold,” “Paid Clicks,” “Price-per-Ad,” and “Price-per-Click,” as presented below, exclude the Korea market for all periods presented. Prior period amounts have been updated to conform to the current presentation.
Search Metrics
For the year ended December 31, 2014, Paid Clicks increased 5 percent and Price-per-Click increased 11 percent, compared to 2013. The increase in Paid Clicks for the year ended December 31, 2014 was attributable to an increase in Paid Clicks on Yahoo Properties from distribution partners primarily in the Americas region, partially offset by a decline in Paid Clicks on Affiliate sites related to traffic quality initiatives across the regions. The increase in Price-per-Click for the year ended December 31, 2014 was primarily driven by a higher mix of traffic from the Americas region, which is higher monetizing as compared to other geographic regions, and improved Affiliate traffic quality across all regions resulting in higher Price-per-Click. Improvements in Price-per-Click resulted in year-over-year growth in search click-driven revenue for the year ended December 31, 2014 of 17 percent.
56
Table of Contents
For the year ended December 31, 2013, Paid Clicks increased 19 percent and Price-per-Click decreased 4 percent, compared to 2012. The increase in Paid Clicks was attributable to improved ad formats on Yahoo Search, increased mobile traffic, and increased Affiliate traffic in the Americas region. The increase in Affiliate traffic was driven by incremental traffic in Latin America. The decrease in Price-per-Click was primarily due to a higher mix of traffic in lower monetizing geographic regions and traffic quality improvement initiatives conducted by Yahoo, which lowered Price-per-Click.
Display Metrics
For the year ended December 31, 2014, number of Ads Sold increased 17 percent and Price-per-Ad decreased 18 percent, compared to 2013. The increase in number of Ads Sold for the year ended December 31, 2014 was attributable to an increase in native ad units sold, partially offset by a decline in premium Ads Sold. Native ad units were launched late in the second quarter of 2013. Native ad units represented approximately 37 percent of total Ads Sold for the year ended December 31, 2014, as compared to 7 percent of total Ads Sold for the year ended December 31, 2013. The decrease in Price-per-Ad for the year ended December 31, 2014 was due to a shift in the mix of Ads Sold toward lower monetizing native ad units.
For the year ended December 31, 2013, number of Ads Sold decreased 1 percent and Price-per-Ad decreased 5 percent, compared to 2012. The decrease in number of Ads Sold year-over-year was attributable to a decline in premium Ads Sold, which was partially offset by growth in non-premium advertising as a result of native ad units. The decrease in Price-per-Ad year-over-year was due to a shift in the mix of Ads Sold towards lower monetizing native ad units.
Revenue ex-TAC by Segment
Americas
Americas revenue ex-TAC for the year ended December 31, 2014 increased $29 million, or 1 percent, compared to 2013. The increase in Americas revenue ex-TAC for the year ended December 31, 2014 was attributable to an increase in search revenue ex-TAC of $78 million, partially offset by declines in display revenue ex-TAC and other revenue ex-TAC of $35 million and $14 million, respectively. Search revenue ex-TAC in the Americas region increased 6 percent for the year ended December 31, 2014, as compared to the same period of 2013, as Paid Clicks increased 14 percent and Price-per-Click increased 3 percent in the region. The increase in search revenue ex-TAC for the year ended December 31, 2014 was attributable to an increase in search revenue on Yahoo Properties driven by higher revenue-per-search from a change in the design of the search results page and an increase in search advertising from mobile devices. Search revenue ex-TAC increased despite the expiration of the RPS Guarantee in the U.S in March 2014. The increase in search revenue ex-TAC on Yahoo Properties was partially offset by a decline in Affiliate search revenue in the region. The decline in display revenue ex-TAC for the year ended December 31, 2014 was due to a decline in premium ads sold on Yahoo Properties, partially offset by an increase in native advertising and advertising on Affiliate sites. The decline in other revenue ex-TAC for the year ended December 31, 2014 was primarily attributable to a decline in listings-based revenue, partially offset by an increase in fees revenue, as a result of the patent license revenue.
Americas revenue ex-TAC for the year ended December 31, 2013 increased $43 million, or 1 percent, compared to 2012. The increase in Americas revenue ex-TAC was primarily attributable to an increase in search revenue ex-TAC of $148 million and fees revenue of $87 million. The increase in search revenue ex-TAC was attributable to an increase in sponsored searches on Yahoo Properties and higher revenue per search due to improved ad formats. The increase in fees revenue was primarily
57
Table of Contents
due to increased royalty revenue resulting from the amended TIPLA agreement with Alibaba Group. These increases were partially offset by a decline in display revenue ex-TAC of $142 million due to declines in the number of Ads Sold on a premium basis on Yahoo Properties, and a decline in listings-based revenue of $50 million.
Revenue ex-TAC in the Americas accounted for approximately 76 percent of total revenue ex-TAC for the year ended December 31, 2014, compared to 75 percent in 2013 and 73 percent in 2012.
EMEA
EMEA revenue ex-TAC for the year ended December 31, 2014 decreased $4 million, or 1 percent, compared to 2013. The decrease in EMEA revenue ex-TAC for the year ended December 31, 2014 was primarily attributable to declines in both display and other revenue ex-TAC of $17 million each, partially offset by an increase in search revenue ex-TAC of $30 million. Search revenue ex-TAC in the EMEA region increased 31 percent for the year ended December 31, 2014, as compared to the same period of 2013. The increase in search revenue ex-TAC for year ended December 31, 2014 was due to an increase in search advertising on Yahoo Properties driven by distribution deals that contributed to improved revenue-per-search. The decline in display revenue ex-TAC for the year ended December 31, 2014 was due to a decline in premium ads sold on Yahoo Properties, primarily Homepage, partially offset by an increase in non-premium advertising on Yahoo Properties, due to the launch of native advertising in the region in 2014. The decline in other revenue ex-TAC was primarily due to a decline in listings-based revenue.
EMEA revenue ex-TAC for the year ended December 31, 2013 decreased $16 million, or 4 percent, compared to 2012, due to declines in display revenue ex-TAC on Yahoo Properties driven by a decrease in premium advertising primarily related to Yahoo Mail.
Revenue ex-TAC in EMEA accounted for approximately 8 percent of total revenue ex-TAC for the years ended December 31, 2014, 2013, and 2012.
Asia Pacific
Asia Pacific revenue ex-TAC for the year ended December 31, 2014 decreased $50 million, or 7 percent, compared to 2013. The decline for the year ended December 31, 2014 was primarily attributable to declines in search and display revenue ex-TAC of $23 million and $22 million, respectively. The decline in search revenue ex-TAC for the year ended December 31, 2014 was primarily attributable to the revenue share with Microsoft associated with the Search Agreement. The decline in display revenue ex-TAC for the year ended December 31, 2014 was primarily attributable to a decline in premium advertising on Yahoo Properties due to a decline in supply. This decline was partially offset by an increase in non-premium advertising on Yahoo Properties due to the launch of native advertising in the region as well as an increase in display revenue from Affiliate sites. Revenue ex-TAC in the Asia Pacific region was also impacted by unfavorable foreign exchange fluctuations of $27 million for the year ended December 31, 2014.
Asia Pacific revenue ex-TAC for the year ended December 31, 2013 decreased $70 million, or 8 percent compared to 2012. The decline was primarily attributable to a decrease in revenue ex-TAC related to the closure of our Korea business of $63 million and unfavorable foreign exchange rate fluctuations.
Revenue ex-TAC in Asia Pacific accounted for approximately 16 percent of total revenue ex-TAC for the year ended December 31, 2014, compared to 17 percent in 2013 and 19 percent in 2012.
58
Table of Contents
Direct Costs by Segment
Starting in the fourth quarter of 2014, we adopted a revised methodology for allocating costs between our regions and global operations. The change reflects how management views our business today. The revised methodology reflects the following costs in global operations: marketing, media, costs associated with Yahoo Properties, and ad operations. These costs historically were managed by each segment and are now managed globally. Prior period amounts and commentary related to our direct costs have been revised to conform to the current presentation.
Americas
For the year ended December 31, 2014, direct costs attributable to the Americas segment increased $5 million, or 3 percent, compared to 2013. For the year ended December 31, 2014, the increase in direct costs was primarily due to increases in content and other costs of $9 million, partially offset by a decline in travel and entertainment expense and facilities and equipment expense of $4 million.
For the year ended December 31, 2013, direct costs attributable to the Americas segment decreased $106 million, or 35 percent, compared to 2012. The decrease in direct costs was primarily due to declines in compensation costs of $83 million, bandwidth and other cost of revenue of $7 million, content costs of $6 million, travel and entertainment expense of $5 million, and facilities and equipment and outside service provider expenses of $4 million.
Direct costs attributable to the Americas segment represented approximately 6 percent of Americas revenue ex-TAC for the year ended December 31, 2014, compared to 6 percent in 2013 and 9 percent in 2012.
EMEA
For the years ended December 31, 2014 and 2013, direct costs attributable to the EMEA segment decreased $2 million, or 3 percent, and $7 million, or 7 percent, compared to 2013 and 2012, respectively, primarily due to a decline in compensation costs, bandwidth and other cost of revenue, and content costs, partially offset by a decline in outside service provider expense.
Direct costs attributable to the EMEA segment represented approximately 26 percent of EMEA revenue ex-TAC for the year ended December 31, 2014, compared to 26 percent and 27 percent in 2013 and 2012, respectively.
Asia Pacific
For the year ended December 31, 2014, direct costs attributable to the Asia Pacific segment increased $2 million, or 1 percent, compared to 2013, primarily due to an increase in compensation costs.
For the year ended December 31, 2013, direct costs attributable to the Asia Pacific segment increased $15 million, or 8 percent, compared to 2012. The increase was primarily attributable to increases in bandwidth and other cost of revenue of $9 million, content costs of $8 million, and marketing and public relations expense of $5 million, partially offset by a decline in compensation costs, travel and entertainment expense and other costs of $7 million.
Direct costs attributable to the Asia Pacific segment represented approximately 28 percent of Asia Pacific revenue ex-TAC for the year ended December 31, 2014, compared to 26 percent in 2013 and 22 percent in 2012.
59
Table of Contents
Operating Costs and Expenses
Cost of Revenue—TAC
TAC consists of payments made to third-party entities that have integrated our advertising offerings into their Websites or other offerings and payments made to companies that direct consumer and business traffic to Yahoo Properties. We enter into agreements of varying duration that involve TAC. There are generally two economic structures of the Affiliate agreements: fixed payments with or without a guaranteed minimum amount of traffic delivered or variable payments based on a percentage of our revenue or based on a certain metric, such as number of searches or paid clicks. We expense TAC under two different methods. Agreements with fixed payments are expensed ratably over the term the fixed payment covers or as traffic is delivered. Agreements based on a percentage of revenue, number of searches, or other metrics are expensed based on the volume of the underlying activity or revenue multiplied by the agreed-upon price or rate.
TAC for the year ended December 31, 2014 decreased $37 million, or 15 percent, compared to 2013. The decrease for the year ended December 31, 2014, compared to 2013, was primarily attributable to declines in TAC in the Asia Pacific and EMEA regions of $38 million and $6 million, respectively, partially offset by an increase in TAC in the Americas region of $8 million related to an increase in search and listings-based TAC. The decline in the Asia Pacific region was primarily attributable to the required change in revenue presentation for transitioned markets from a gross (before TAC) basis to a net (after TAC).
TAC for the year ended December 31, 2013 decreased $264 million, or 51 percent, compared to 2012. The decrease for the year ended December 31, 2013, compared to 2012, was primarily attributable to declines in the Asia Pacific, EMEA and Americas regions of $170 million, $71 million and $23 million, respectively. The decline was due to (i) the closure of our Korea business in the Asia Pacific region, (ii) the required change in revenue presentation for additional transitioned markets from a gross (before TAC) to a net (after TAC) basis in the EMEA region, and (iii) a decline in display revenue in the Americas region.
TAC represented approximately 5 percent of GAAP revenue for the year ended December 31, 2014, compared to 6 percent and 10 percent in 2013 and 2012, respectively.
Cost of Revenue—Other
Cost of revenue—other consists of bandwidth costs, and other expenses associated with the production and usage of Yahoo Properties, including amortization of developed technology and patents. Cost of revenue—other also includes costs for Yahoo’s technology platforms and infrastructure, including depreciation expense and other operating costs, directly related to revenue generating activities.
Cost of revenue—other decreased $14 million, or 1 percent, for the year ended December 31, 2014, compared to 2013, due to declines in depreciation and amortization expense of $23 million, compensation costs of $10 million, and facilities and equipment expense of $4 million partially offset by increases in stock-based compensation expense of $18 million and credit card fees of $5 million.
Cost of revenue—other decreased $7 million, or 1 percent, for the year ended December 31, 2013, compared to 2012. The decrease for the year ended December 31, 2013, compared to 2012, was primarily due to a decline in amortization of developed technology and patents of $18 million partially offset by an increase in content costs of $11 million.
60
Table of Contents
Cost of revenue—other represented approximately 23 percent of GAAP revenue for the year ended December 31, 2014, compared to 23 percent and 22 percent in 2013 and 2012, respectively.
Sales and Marketing
Sales and marketing expenses consist primarily of advertising and other marketing-related expenses, compensation-related expenses (including stock-based compensation expense), sales commissions, and travel costs.
Sales and marketing expenses for the year ended December 31, 2014 increased $103 million, or 9 percent, as compared to 2013. For the year ended December 31, 2014, compensation costs increased $40 million, stock-based compensation expense increased $53 million, marketing and public relations expense increased $14 million, and facilities expense increased $14 million. These increases were partially offset by declines in travel and entertainment expense of $9 million and outside service provider expenses of $9 million. The increase in compensation costs for the year ended December 31, 2014 was attributable to increases in sales commissions and merit-based increases in salaries, as well as increases in benefits and incentive compensation. The increase in stock-based compensation expense for the year ended December 31, 2014 was attributable to an increase in the number of awards being expensed at a higher fair value. The increase in marketing and public relations expense for the year ended December 31, 2014 was primarily due to increased media advertising and spend on promotional event management.
Sales and marketing expenses for the year ended December 31, 2013 increased $29 million, or 3 percent, as compared to 2012. The year-over-year increase was primarily due to an increase in marketing expenses of $31 million and stock-based compensation expenses of $20 million. This was offset by a decline in other compensation costs of $25 million. The increase in marketing expenses was primarily due to advertising campaigns to generate additional traffic on Yahoo Shopping, Mail, Autos and Screen, as well as our On the Road with Yahoo marketing campaign and our Fantasy Football television advertising campaign, for which there were no similar campaigns in 2012. The increase in stock based compensation in the sales and marketing function was due to an increase in the number of awards granted at a higher fair value, including performance-based awards. The decline in other compensation costs in the sales and marketing function was primarily due to a decline in average headcount in the function year-over-year.
Sales and marketing expenses represented approximately 27 percent of GAAP revenue for the year ended December 31, 2014, compared to 24 percent and 22 percent in 2013 and 2012, respectively.
Product Development
Product development expenses consist primarily of compensation-related expenses (including stock-based compensation expense) incurred for the development of, enhancements to and maintenance of Yahoo Properties, classification and organization of listings within Yahoo Properties, research and development, and Yahoo’s technology platforms and infrastructure. Depreciation expense and other operating costs are also included in product development.
Product development expenses for the year ended December 31, 2014 increased $199 million, or 20 percent, as compared to 2013. For the year ended December 31, 2014, the increase was primarily attributable to increases in compensation costs of $131 million, stock-based compensation expense of $56 million, and a decline in capitalizable projects of $38 million, partially offset by declines in depreciation and amortization expense of $12 million, and outside service provider expense of $14 million. The increase in compensation costs for the year ended December 31, 2014 was primarily attributable to a 6 percent increase in headcount year-over-year, including incremental headcount for
61
Table of Contents
mobile and search as well as merit-based increases in salaries, increases in costs from a shift in location of employees, increases in benefits, increased headcount from acquisitions, and increases in incentive compensation. The increase in stock-based compensation expense for the year ended December 31, 2014 was attributable to an increase in the number of awards being expensed at a higher fair value and an increase in expense related to equity assumed and granted related to acquisitions.
Product development expenses for the year ended December 31, 2013 increased $123 million, or 14 percent, as compared to 2012. For the year ended December 31, 2013, the increase was primarily attributable to a decline in capitalizable projects of $65 million, as well as an increase in facilities and equipment expense of $24 million, stock based compensation expense of $9 million, compensation costs of $11 million due to an increase in headcount in the function, and travel and entertainment expense of $6 million. The increase in stock based compensation in the product development function was due to an increase in the number of awards granted at a higher fair value.
Product development expenses represented approximately 26 percent of GAAP revenue for the year ended December 31, 2014, compared to 22 percent and 18 percent in 2013 and 2012, respectively.
General and Administrative
General and administrative expenses consist primarily of compensation-related expenses (including stock-based compensation expense) related to other corporate departments and fees for professional services.
General and administrative expenses for the year ended December 31, 2014 increased $5 million, or 1 percent, as compared to 2013, due to increases in stock-based compensation expense of $16 million, outside service provider expense of $3 million, facilities and equipment expense of $3 million, and compensation costs of $2 million. These increases were partially offset by a decline in depreciation and amortization expense of $4 million, benefits related to net gains on disposal of assets of $9 million and business tax refunds received of $6 million. The increase in stock-based compensation expense for the year ended December 31, 2014 was attributable to an increase in the number of awards being expensed at a higher fair value.
General and administrative expenses for the year ended December 31, 2013 increased $29 million, or 5 percent, as compared to 2012. The increase in expenses in the general and administrative function was due to increases in facilities and equipment expense of $20 million due to investments in office space and our global employee experience, compensation costs of $13 million due to an increase in headcount in the function, and stock-based compensation expense of $20 million due to an increase in the number of awards granted at a higher fair value, including performance-based awards. This was partially offset by a decline of $20 million in legal costs.
General and administrative expenses represented approximately 12 percent of GAAP revenue for the year ended December 31, 2014, compared to 12 percent and 11 percent in 2013 and 2012, respectively.
Amortization of Intangibles
We have purchased, and expect to continue purchasing, assets and/or businesses, which may include the purchase of intangible assets. Intangible assets include customer, affiliate, and advertiser-related relationships and tradenames, trademarks and domain names. Amortization of developed technology and patents is included in the cost of revenue—other, and not in amortization of intangibles.
Amortization of intangibles for the year ended December 31, 2014 increased $22 million, or 49 percent, as compared to 2013, primarily driven by amortization of intangible assets related to Tumblr, which we acquired in the second quarter of 2013.
62
Table of Contents
Amortization of intangibles for the year ended December 31, 2013 increased $9 million, or 25 percent, as compared to 2012. The year-over-year increase in amortization of intangibles from 2012 to 2013 was primarily driven by incremental amortization from acquisitions completed in 2013, partially offset by a decrease in amortization of intangibles driven by fully amortized assets acquired in prior years.
Amortization of intangibles represented approximately 2 percent of GAAP revenue for the year ended December 31, 2014, compared to 1 percent in both 2013 and 2012.
Gains on Sales of Patents
For the year ended December 31, 2014, we sold certain patents and recorded gains on sales of patents of approximately $98 million. These gains on sales of patents include patents sold to a wholly-owned affiliate of Alibaba Group for a gain on sale of $24 million and patents sold to Yahoo Japan for a gain on sale of $12 million. See “Significant Transactions—Patent Sale and License Agreement” for additional information on significant patents sold during 2014.
For the year ended December 31, 2013, we sold certain patents and recorded gains on sales of patents of approximately $80 million. The gains on sales of patents were primarily related to a patent sale agreement with a wholly-owned affiliate of Alibaba Group entered into during 2013 for $70 million.
See Note 4—“Acquisitions and Dispositions” in the Notes to our consolidated financial statements for additional information.
Goodwill Impairment Charge
We conducted our annual goodwill impairment test as of October 31, 2014 and determined that the fair values of our reporting units, with the exception of (1) the Middle East and (2) India & Southeast Asia reporting units, exceeded their carrying values and therefore goodwill in those reporting units was not impaired. We concluded that the carrying value of each of the Middle East and India & Southeast Asia reporting units exceeded its fair value and recorded a goodwill impairment charge of approximately $79 million and $9 million, respectively. During 2013, we recorded a $64 million goodwill impairment charge for the Middle East reporting unit.
For the Europe reporting unit, the percentage by which the estimated fair value exceeded the carrying value as of October 31, 2014 was 12 percent and the amount of goodwill allocated to the Europe reporting unit was $465 million. The key assumptions used for the 2014 goodwill impairment test for Europe were 1) revenue ex-TAC cumulative average growth rate of approximately 5 percent over the next 5 year period, 2) adjusted EBITDA growth rate of 15 percent over the next five years, 3) discount rate of 11 percent, and 4) terminal value growth rate of 3 percent. Determining the fair value of a reporting unit is judgmental in nature and requires the use of estimates and key assumptions. It is reasonably possible that changes in judgments, assumptions and estimates we made in assessing the fair value of goodwill could cause us to consider some portion or all of the remaining goodwill of the Europe reporting unit to become impaired. In addition, a future decline in the overall European market conditions and/or changes in our market share in the European market could negatively impact the market comparables, estimated future cash flows and discount rates used in the market and income approaches to determine the fair value of the reporting unit and could result in an impairment charge in the foreseeable future.
See Note 5—“Goodwill” in the Notes to our consolidated financial statements for additional information.
63
Table of Contents
Restructuring Charges, Net
For the years ended December 31, 2012, 2013, and 2014, restructuring charges, net was comprised of the following (dollars in thousands):
| Year Ended December 31, | ||||||||||||
| 2012 | 2013 | 2014 | ||||||||||
| Employee severance pay and related costs | $ | 139,623 | $ | 12,337 | $ | 30,749 | ||||||
| Non-cancelable lease, contract termination, and other charges | 27,785 | 15,822 | 79,317 | |||||||||
| Non-cash reversals of stock-based compensation expense | (3,429 | ) | — | — | ||||||||
| Other non-cash charges (credits), net | 109,896 | 547 | (3,394 | ) | ||||||||
| Changes in estimates and reversals of previous charges | (37,705 | ) | (24,940 | ) | (3,222 | ) | ||||||
|
|
|
|
|
|
|
|||||||
| Restructuring charges, net |
$ | 236,170 | $ | 3,766 | $ | 103,450 | ||||||
|
|
|
|
|
|
|
|||||||
We have implemented various restructuring plans to reduce our cost structure, align resources with our product strategy and improve efficiency, which have resulted in workforce reductions and the consolidation of certain real estate facilities and data centers. During the year ended December 31, 2012, we recorded expense of $103 million, $45 million, and $88 million related to the Americas, EMEA, and Asia Pacific segments, respectively. For the year ended December 31, 2013, we recorded expense of $1 million, $3 million, and less than $1 million related to the Americas, EMEA, and Asia Pacific segments, respectively. For the year ended December 31, 2014, we recorded expense of $76 million, $25 million, and $2 million related to the Americas, EMEA, and Asia Pacific segments, respectively. The amounts recorded during the year ended December 31, 2014 were primarily related to the consolidation of a data center as we ceased use of that facility pursuant to a restructuring plan we initiated in 2011 and severance charges related to restructuring plans that we initiated in 2014 as part of our location strategy and to align resources.
The $84 million restructuring liability as of December 31, 2014 consists of $16 million for employee severance expenses, which we expect to pay out by the end of the third quarter of 2015, and $68 million related to non-cancelable lease costs, which we expect to pay over the terms of the related obligations through the fourth quarter of 2021, less estimated sublease income.
See Note 15—“Restructuring charges, net” in the Notes to our consolidated financial statements for additional information.
64
Table of Contents
Other Income, Net
Other income, net was as follows (dollars in thousands):
| Years Ended December 31, | 2012-2013 Dollar Change |
2013-2014 Dollar Change |
||||||||||||||||||
| 2012 | 2013 | 2014 | ||||||||||||||||||
| Interest, dividend, and investment income | $ | 41,673 | $ | 57,544 | $ | 26,309 | $ | 15,871 | $ | (31,235 | ) | |||||||||
| Interest expense | (9,297 | ) | (14,319 | ) | (68,851 | ) | (5,022 | ) | (54,532 | ) | ||||||||||
| Gain related to the sale of Alibaba Group shares | 4,603,322 | — | — | (4,603,322 | ) | — | ||||||||||||||
| Gain on sale of Alibaba Group ADSs | — | — | 10,319,437 | — | 10,319,437 | |||||||||||||||
| Gain on Hortonworks warrants | — | — | 98,062 | — | 98,062 | |||||||||||||||
| Other income (expense), net | 12,141 | 132 | (5,518 | ) | (12,009 | ) | (5,650 | ) | ||||||||||||
|
|
|
|
|
|
|
|
|
|
|
|||||||||||
| Total other income, net |
$ | 4,647,839 | $ | 43,357 | $ | 10,369,439 | $ | (4,604,482 | ) | $ | 10,326,082 | |||||||||
|
|
|
|
|
|
|
|
|
|
|
|||||||||||
Interest, dividend, and investment income consists of income earned from cash in bank accounts, investments made in marketable securities and money market funds, and dividend income on the Alibaba Group Preference Shares prior to the redemption of such shares in May 2013. Interest, dividend, and investment income increased $16 million and decreased $31 million for the years ended December 31, 2013 and 2014, respectively, compared to 2012 and 2013, respectively, primarily due to dividend income on the Alibaba Group Preference Shares received during the years ended December 31, 2012 and 2013, for which there was no similar income for the year ended December 31, 2014.
Interest expense is related to the $1.4375 billion of 0.00% Convertible Notes due 2018 (the “Notes”) we issued in November 2013, interest expense on notes payable related to building obligations and capital lease obligations for data centers. Interest expense increased $5 million and $54 million for the years ended December 31, 2013 and 2014, respectively, compared to 2012 and 2013, respectively, primarily due to the accreted non-cash interest expense related to the Notes.
For the year ended December 31, 2012, we recorded a pre-tax gain of approximately $4.6 billion related to the sale to Alibaba Group of the Alibaba Group shares. See Note 8—“Investments in Equity Interests Accounted for Using the Equity Method of Accounting” in the Notes to our consolidated financial statements for additional information.
For the year ended December 31, 2014, we recorded a pre-tax gain of approximately $10 billion related to the sale of Alibaba Group ADSs. See “Significant Transactions—Alibaba Group Holding Limited Initial Public Offering” above and Note 8—“Investments in Equity Interests Accounted for Using the Equity Method of Accounting” in the Notes to our consolidated financial statements for additional information.
We hold warrants that vested upon the December 12, 2014 initial public offering of Hortonworks Inc. (“Hortonworks”), which entitle us to purchase an aggregate of 3.7 million shares of Hortonworks common stock upon exercise of the warrants. We hold 6.5 million preferred warrants that are exercisable for 3.25 million shares of common stock at an exercise price of $0.01 per share, as well as 0.5 million common warrants that are exercisable for 0.5 million shares of common stock at an exercise price of $8.46 per share. We determined the estimated fair value of the warrants using the Black-Scholes model. During the year ended December 31, 2014, we recorded a gain of $57 million
65
Table of Contents
upon the initial public offering of Hortonworks and a $41 million gain related to the mark to market of the warrants held as of December 31, 2014, which were included within other income, net on the consolidated statements of income. Changes in the estimated fair value of the Hortonworks warrants will be recorded through other income, net in our consolidated statements of income.
Other income (expense), net consists of gains and losses from sales or impairments of marketable securities and/or investments in privately-held companies, foreign exchange gains and losses due to re-measurement of monetary assets and liabilities denominated in non-functional currencies, and unrealized and realized foreign currency transaction gains and losses, including gains and losses related to balance sheet hedges. Other income (expense), net decreased $12 million and $6 million for the years ended December 31, 2013 and 2014, respectively, compared to 2012 and 2013, respectively. The decline from 2012 to 2013 was primarily due to an investment sale in 2012, for which there were no similar transactions in 2013. The increase in expense from 2013 to 2014 was primarily due to foreign exchange losses.
Other income, net may fluctuate in future periods due to changes in our average investment balances, changes in interest and foreign exchange rates, changes in the fair value of foreign currency forward contracts, realized gains and losses on investments, and impairments of investments.
Income Taxes
The provision for income taxes for the year ended December 31, 2014 differs from the amount computed by applying the federal statutory income tax rate to income before provision for income taxes and earnings in equity interests as follows (dollars in thousands):
| Years Ended December 31, | ||||||||||||||||||||||||
| 2012 | (*) | 2013 | (*) | 2014 | (*) | |||||||||||||||||||
| Income tax at the U.S. federal statutory rate of 35 percent | $ | 1,824,973 | 35% | $ | 221,648 | 35% | $ | 3,679,333 | 35% | |||||||||||||||
| State income taxes, net of federal benefit | 237,637 | 5% | 23,000 | 4% | 400,824 | 4% | ||||||||||||||||||
| Stock-based compensation expense | 19,946 | — | 16,015 | 3% | 8,132 | — | ||||||||||||||||||
| Research tax credits | — | — | (18,036 | ) | (3)% | (23,775 | ) | — | ||||||||||||||||
| Effect of non-U.S. operations | (138,078 | ) | (3)% | (47,968 | ) | (8)% | (53,079 | ) | (1)% | |||||||||||||||
| Settlement with tax authorities | (4,711 | ) | — | (46,943 | ) | (7)% | (24,870 | ) | — | |||||||||||||||
| Remeasurement of prior year tax positions | — | — | (24,246 | ) | (4)% | — | — | |||||||||||||||||
| Acquisition related non-deductible expenses | 1,894 | — | 9,296 | 1% | 16,881 | — | ||||||||||||||||||
| Goodwill impairment charge | — | — | 22,244 | 3% | 30,945 | — | ||||||||||||||||||
| Other | (1,618 | ) | — | (1,618 | ) | — | 3,711 | — | ||||||||||||||||
|
|
|
|
|
|
|
|
|
|
|
|
|
|
|
| ||||||||||
| Provision for income taxes | $ | 1,940,043 | 37% | $ | 153,392 | 24% | $ | 4,038,102 | 38% | |||||||||||||||
|
|
|
|
|
|
|
|
|
|
|
|
|
|
|
| ||||||||||
| (*) | Percent of income before income taxes and earnings in equity interests. |
Significant variances year-over-year as shown above are further explained as follows:
| • | On January 2, 2013, the American Taxpayer Relief Act of 2012 was signed into law retroactively extending the federal research and development credit for amounts paid or incurred after December 31, 2011 and before January 1, 2014. As such, the provision for income taxes for the |
66
Table of Contents
| year ended December 31, 2013 reflects the benefit of both the 2012 and 2013 federal research and development tax credits. On December 19, 2014, the Tax Increase Prevention Act of 2014 was signed into law, extending this 2014 federal research and development credit. As such, the provision for income taxes for the year ended December 31, 2014 reflects the benefit of the 2014 federal research and development tax credit. |
| • | In 2012, in connection with a review of our cash position and anticipated cash needs for investment in our core business, including potential acquisitions, capital expenditures and stock repurchases, we made a one-time distribution of cash from certain of our consolidated foreign subsidiaries resulting in an overall net benefit for the year ended December 31, 2012 of approximately $117 million. The benefit is primarily due to excess foreign tax credits. Of the $117 million, $102 million is included above within “effect of non-U.S. operations.” In 2013, “effect of non-U.S. operations” includes an additional benefit of $36 million due to more excess foreign tax credits becoming available as certain tax matters were resolved with various tax authorities during the year. In 2014, a detriment of $8 million was included in “effect of non-U.S. operations” to account for the corresponding adjustments from the IRS on foreign earnings available at the time of 2012 repatriation. |
| • | In 2013, we settled the IRS income tax examination for the 2005 and 2006 returns resulting in a benefit of approximately $54 million. In 2014, we settled the IRS income tax examination for the 2007 through 2010 returns resulting in a benefit of approximately $25 million. |
| • | In 2014, YHK sold 140 million Alibaba Group ADSs in the IPO at an initial public offering price of $68.00 per ADS, which resulted in an increase in our provision for income taxes for 2014. |
As of December 31, 2014, we do not anticipate repatriating our undistributed foreign earnings of approximately $2.9 billion. Those earnings are principally related to our equity investment in Yahoo Japan Corporation (“Yahoo Japan”). If those earnings were to be repatriated in the future, we may be subject to additional U.S. income taxes (subject to an adjustment for foreign tax credits). It is not practicable to determine the income tax liability that might be incurred if these earnings were to be repatriated.
Our gross amount of unrecognized tax benefits as of December 31, 2014 was $1,024 million, of which $970 million is recorded on our consolidated balance sheets. The gross unrecognized tax benefits as of December 31, 2014 increased by $328 million from the recorded balance as of December 31, 2013 primarily related to tax reserves associated with the sale of the Alibaba Group ADSs and foreign tax credits.
We are in various stages of examination and appeal in connection with our taxes both in the U.S. and in foreign jurisdictions. Those audits generally span tax years 2005 through 2012. As of December 31, 2014, the IRS Appeals division has finalized our protest of the 2007 and 2008 audit results, and the IRS exam team has finalized the examination of our 2009 and 2010 U.S. federal income tax returns. We do not plan to appeal the results of the IRS examination of our 2009 and 2010 U.S. federal income tax returns. We have protested the proposed California Franchise Tax Board’s adjustments to the 2005 through 2008 returns, but no conclusions have been reached to date. While it is difficult to determine when the examinations will be settled or their final outcomes, we believe that we have adequately provided for any reasonably foreseeable adjustment and that any settlement will not have a material adverse effect on our consolidated financial position, results of operations, or cash flows.
We estimate that we will pay taxes of approximately $3.3 billion in the three months ended March 31, 2015 related to YHK’s sale of Alibaba Group ADSs in the IPO on September 24, 2014. As of December 31, 2014, we accrued deferred tax liabilities of $16.2 billion associated with the Alibaba Group shares that we retained. Such deferred tax liabilities will be subject to periodic adjustments due to changes in the fair value of the Alibaba Group shares.
67
Table of Contents
We may have additional tax liabilities in China related to the sale to Alibaba Group of 523 million Alibaba Group shares that took place during the year ended December 31, 2012 and related to the sale of 140 million Alibaba Group ADSs sold in the IPO that took place during the year ended December 31, 2014. Any taxes assessed and paid in China are expected to be ultimately offset and recovered in the U.S. through the use of foreign tax credits with respect to the sale in 2012. Any taxes assessed and paid in China are expected to be ultimately offset and recovered in the U.S. with respect to the sale in 2014 through the use of foreign tax credits to the extent there is sufficient foreign source income.
Tax authorities from the Brazilian State of Sao Paulo have assessed certain indirect taxes against our Brazilian subsidiary, Yahoo! do Brasil Internet Ltda., related to online advertising services. The assessment totaling approximately $120 million is for calendar years 2008 through 2011. We currently believe the assessment is without merit. We believe the risk of loss is remote and have not recorded an accrual for the assessment.
Earnings in Equity Interests
We record our share of the results of earnings in equity interests, including tax impacts, one quarter in arrears, within earnings in equity interests in the consolidated statements of income. Earnings in equity interests for the year ended December 31, 2014 were approximately $1,058 million, compared to $897 million and $676 million for 2013 and 2012, respectively. Earnings in equity interests increased during the years ended December 31, 2013 and 2014, compared to each of 2012 and 2013, respectively, primarily due to continued improved financial performance for Alibaba Group. For 2014, this increase was offset in part by a significant decline in earnings in equity interests during the fourth quarter of 2014 because, following Alibaba Group’s IPO in September 2014, we no longer account for our interest in Alibaba Group using the equity method. Since we no longer use the equity method to account for our interest in Alibaba Group, our earnings in equity interests and net income will also be materially lower in future periods.
See “Significant Transactions—Alibaba Group Holding Limited Initial Public Offering” above and Note 8—“Investments in Equity Interests Accounted for Using the Equity Method of Accounting” in the Notes to our consolidated financial statements for additional information.
Noncontrolling Interests
Noncontrolling interests represent the noncontrolling holders’ percentage share of income or losses from the subsidiaries in which we hold a majority, but less than 100 percent, ownership interest and the results of which are consolidated in our consolidated financial statements. Noncontrolling interests were approximately $10 million in 2014, compared to $10 million in 2013 and $5 million in 2012. Noncontrolling interests recorded in 2014, 2013, and 2012 were related to the Yahoo!7 venture in Australia and New Zealand.
68
Table of Contents
Liquidity and Capital Resources
As of and for each of the years ended December 31 (dollars in thousands):
| 2013 | 2014 | |||||||
| Cash and cash equivalents | $ | 2,077,590 | $ | 2,667,916 | ||||
| Short-term marketable securities | 1,330,304 | 5,327,412 | ||||||
| Long-term marketable securities | 1,589,500 | 2,230,892 | ||||||
|
|
|
|
|
|||||
| Total cash, cash equivalents, and marketable securities | $ | 4,997,394 | $ | 10,226,220 | ||||
|
|
|
|
|
|||||
| Percentage of total assets | 30% | 17% | ||||||
|
|
|
|
|
|||||
| Cash Flow Highlights | 2012 | 2013 | 2014 | |||||||||
| Net cash (used in) provided by operating activities | $ | (281,554 | ) | $ | 1,195,247 | $ | 896,700 | |||||
| Net cash provided by (used in) investing activities | $ | 3,362,044 | $ | (23,221 | ) | $ | 3,761,969 | |||||
| Net cash used in financing activities | $ | (1,979,457 | ) | $ | (1,743,884 | ) | $ | (4,022,466 | ) | |||
Our operating activities for 2012, 2013, and 2014 have generated adequate cash to meet our operating needs.
On September 24, 2014, Alibaba Group closed its IPO. We received cash proceeds of $9.4 billion (net of underwriting discounts, commissions, and fees of approximately $115 million) from YHK’s sale of 140 million Alibaba Group ADSs. As of February 26, 2015, we have substantially completed our commitment to return to our stockholders at least half of the after-tax proceeds (approximately $3.1 billion) we received from YHK’s sale of the Alibaba Group ADSs in the IPO. We estimate that we will pay taxes of approximately $3.3 billion in the three months ended March 31, 2015 related to YHK’s sale of Alibaba Group ADSs in the IPO.
As of December 31, 2014, we had cash, cash equivalents, and marketable securities (excluding Alibaba Group and Hortonworks equity securities) totaling $10.2 billion compared to $5.0 billion at December 31, 2013. The increase was due to the net cash proceeds of $9.4 billion received from the sale of 140 million Alibaba Group ADSs in the IPO. This was partially offset by the repurchase of approximately 102 million shares of our outstanding common stock for approximately $4.2 billion and $859 million used for acquisitions.
As of December 31, 2013, we had cash, cash equivalents, and marketable securities totaling $5 billion, compared to $6 billion as of December 31, 2012. During the year ended December 31, 2013, we received net proceeds of $1.4 billion from the issuance of the Notes and net proceeds of $290 million from the settlement of derivative hedge contracts. This was offset by the repurchase of approximately 129 million shares of our outstanding common stock for $3.3 billion during the year ended December 31, 2013.
Our foreign subsidiaries held $524 million of our total $10 billion of cash and cash equivalents and marketable securities (excluding Alibaba Group and Hortonworks equity securities) as of December 31, 2014. The cumulative earnings remaining in our consolidated foreign subsidiaries, if repatriated to the U.S., under current law, would be subject to U.S. income taxes with an adjustment for foreign tax credits. For the earnings that are considered indefinitely reinvested outside the U.S., principally related to our equity method investment in Yahoo Japan, we do not anticipate a need to repatriate these earnings for use in our U.S. operations.
69
Table of Contents
We have a credit agreement with Citibank, N.A., as Administrative Agent (as amended, the “Credit Agreement”) that provides for a $750 million unsecured revolving credit facility, subject to increase by up to $250 million in accordance with its terms. The Credit Agreement terminates on October 8, 2015, unless extended by the parties. As of December 31, 2014, we were in compliance with the financial covenants in the Credit Agreement and no amounts were outstanding.
We invest excess cash predominantly in marketable securities, money market funds, and time deposits that are liquid, highly rated, and our investment portfolio has an effective maturity of less than one year. Our marketable securities are classified as available-for-sale and are reported at fair value, with unrealized gains and losses, net of tax, recorded in accumulated other comprehensive income. Realized gains or losses and declines in value judged to be other-than-temporary, if any, on available-for-sale securities are reported in other income, net. The fair value for securities is determined based on quoted market prices of the historical underlying security or from readily available pricing sources for the identical underlying securities that may not be actively traded as of the valuation date. As of December 31, 2014, certain of our marketable securities had a fair value below cost due primarily to the changes in market rates of interest and yields on these securities. We evaluate these investments periodically for possible other-than-temporary impairment. We have no current requirement or intent to sell these securities. We expect to recover up to (or beyond) the initial cost of the investment.
We currently hedge a portion of our net investment in Yahoo Japan with forward and option contracts to reduce the risk that our investment in Yahoo Japan will be adversely affected by foreign currency translation exchange rate fluctuations. The forward contracts are required to be settled in cash and the amount of cash payment we receive or could be required to pay upon settlement could be material. The amount of cash paid or received on the option contracts would only be required if the exchange rate is outside a predetermined range.
We expect to continue to evaluate possible acquisitions of, or strategic investments in, businesses, products, and technologies that are complementary to our business, which acquisitions and investments may require the use of cash.
We expect to generate positive cash flows from operations in 2015. We use cash generated by operations as our primary source of liquidity, since we believe that internally generated cash flows are sufficient to support our business operations and capital expenditures. We believe that existing cash, cash equivalents, and investments in marketable securities, together with any cash generated from operations, and borrowings under the Credit Agreement, will be sufficient to meet normal operating requirements and capital expenditures for the next twelve months.
See Note 2—“Marketable Securities, Investments and Fair Value Disclosures” in the Notes to our consolidated financial statements for additional information.
Cash Flow Changes
Net cash provided by operating activities.
Cash provided by operating activities is driven by our net income, adjusted for non-cash items, working capital changes and dividends received from equity investees. Non-cash adjustments include depreciation, amortization of intangible assets, accretion of convertible notes discount, stock-based compensation expense, non-cash restructuring charges, non-cash goodwill impairment charges, tax benefits from stock-based awards, excess tax benefits from stock-based awards, deferred income taxes, earnings in equity interests, and gains from sales of patents.
70
Table of Contents
For the year ended December 31, 2014, operating activities provided $897 million in cash. Net income for the year ended December 31, 2014 was $7.5 billion, which was adjusted for the following increases related to non-cash items: depreciation, amortization of intangibles and accretion of Notes discount of $666 million, stock-based compensation expense of $420 million, tax benefits from stock-based awards of $146 million, deferred income tax expense of $466 million, goodwill impairment charge of $88 million and losses from sales of investments, assets and other of $35 million, offset by the gain on sale of Alibaba Group ADSs of $10.3 billion and other reductions for non-cash items including: earnings in equity interests of $1.1 billion, excess tax benefits from stock-based awards of $150 million, gains on sales of patents of $98 million, gain on Hortonworks warrants of $98 million, and restructuring reversals of $3 million. Additionally, we received dividends of $84 million from Yahoo Japan and working capital sources of cash of $3.5 billion, which were partially offset by working capital uses of cash of $274 million.
For the year ended December 31, 2013, operating activities provided $1.2 billion in cash. Net income for the year ended December 31, 2013 was $1.4 billion, which was adjusted for the following increases related to non-cash items: depreciation, amortization of intangibles and accretion of Notes discount of $634 million, stock-based compensation expense of $278 million, goodwill impairment charge of $64 million, tax benefits from stock-based awards of $49 million, and losses from sales of investments, assets and other of $22 million, offset by the following reductions for non-cash items including: earnings in equity interests of $897 million, excess tax benefits from stock-based awards of $64 million, deferred income tax benefit of $84 million, dividend income related to Alibaba Group Preference Shares of $36 million, and gains on sales of patents of $80 million. Additionally, we received dividends of $135 million from equity investees and working capital sources of cash of $54 million, which were offset by working capital uses of cash of $257 million.
For the year ended December 31, 2012, operating activities resulted in a net use of cash of $282 million. Net income for the year ended December 31, 2012 was $4 billion, which was adjusted for the following increases related to non-cash items: depreciation and amortization of intangibles of $655 million, stock-based compensation expense of $221 million, and restructuring charges of $110 million, offset by the gain on our sale of Alibaba Group shares in the Initial Repurchase of $4.6 billion and other reductions for non-cash items including: earnings in equity interests of $676 million, excess tax benefits from stock-based awards of $36 million, deferred income tax benefit of $769 million, dividend income related to Alibaba Group Preference Shares of $20 million, tax detriments from stock-based awards of $31 million, and gains from sales of investments, assets and other of $12 million. Additionally, we received dividends of $84 million from Yahoo Japan and working capital sources of cash of $847 million.
Net cash provided by (used in) investing activities.
Cash provided by (used in) investing activities is primarily attributable to sales and maturities of marketable securities, sales of our strategic investments or settlement of derivative hedge contracts, acquisitions, purchases of marketable securities, capital expenditures, and purchases of intangible assets.
During the year ended December 31, 2014, the $3.8 billion provided by investing activities was due to $9.4 billion in cash proceeds from the sale of Alibaba Group ADSs, net of underwriting discounts, fees and commissions, proceeds from sales and maturities of marketable securities of $3.2 billion, $254 million in proceeds received from settlement of derivative hedge contracts, and $86 million in proceeds from sales of patents, partially offset by $7.9 billion in purchases of marketable securities, $372 million used for capital expenditures, $859 million used for acquisitions, and $74 million used for additional equity investments.
71
Table of Contents
During the year ended December 31, 2013, the $23 million used in investing activities was due to purchases of marketable securities of $3.2 billion, $338 million used for capital expenditures, and $1.2 billion used for acquisitions, offset by net proceeds from sales and maturities of marketable securities of $3.6 billion, $800 million received from the redemption of the Alibaba Group Preference Shares, $80 million from sales of patents, and $290 million from the settlement of foreign exchange contracts (including the settlement of certain foreign exchange forward contracts designated as net investment hedges).
During the year ended December 31, 2012, the $3.4 billion provided by investing activities was due to cash proceeds, net of fees, of $6.2 billion received in connection with the Initial Repurchase and proceeds from the sale of investments and other investing activities of $26 million. This was offset by $2.4 billion utilized for net purchases of marketable securities and $506 million used from capital expenditures.
Net cash used in financing activities.
Cash used in financing activities is driven by stock repurchases offset by employee stock option exercises and employee stock purchases.
During the year ended December 31, 2014, the $4 billion used in financing activities was due to $4.2 billion used for the repurchase of shares of our common stock at an average price of $40.94 per share, $22 million used for distributions to noncontrolling interests, and $295 million used for tax withholding payments related to net share settlements of restricted stock units and other financing activities. This use of cash was partially offset by $308 million in cash proceeds received from employee stock option exercises and employee stock purchases made through our employee stock purchase plan, and an excess tax benefit from stock-based awards of $150 million.
During the year ended December 31, 2013, the $1.7 billion used in financing activities was due to $3.3 billion used for the repurchase of 129 million shares of common stock at an average price of $25.95 per share, $206 million used to purchase note hedges, and $149 million used for tax withholding payments related to net share settlements of restricted stock units and other financing activities. This use of cash was partially offset by $1.4 billion in cash proceeds from issuance of the Notes, $125 million in cash proceeds from the issuance of warrants, $353 million in cash proceeds received from employee stock option exercises and employee stock purchases made through our employee stock purchase plan, and an excess tax benefit from stock-based awards of $64 million.
During the year ended December 31, 2012, the $2 billion used in financing activities was due to $2.2 billion used for the repurchase of 126 million shares of our common stock at an average price of $17.20 per share, $61 million for tax withholding payments related to net share settlements of restricted stock units, and $5 million for other financing activities. This use of cash was partially offset by $218 million in cash proceeds from employee stock option exercises and employee stock purchases made through our employee stock purchase plan, and an excess tax benefit from stock-based awards of $36 million.
In 2014, 2013, and 2012, $150 million, $64 million, and $36 million, respectively, of excess tax benefits from stock-based awards for options exercised in current and prior periods were included as a source of cash flows from financing activities. These excess tax benefits represent the reduction in income taxes otherwise payable during the period, attributable to the actual gross tax benefits in excess of the expected tax benefits for options exercised in current and prior periods. We have accumulated excess tax deductions relating to stock options exercised prior to January 1, 2006 available to reduce income taxes otherwise payable. To the extent such deductions reduce income taxes payable in the current year, they are reported as financing activities in the consolidated statements of cash flows. See Note 14—“Employee Benefits” in the Notes to our consolidated financial statements for additional information.
72
Table of Contents
Stock Repurchases
In June 2010, the Board authorized a stock repurchase program allowing us to repurchase up to $3 billion of our outstanding shares of common stock. That repurchase program, which by its terms would have expired in June 2013, was exhausted during the third quarter of 2012. In May 2012, the Board authorized a stock repurchase program allowing us to repurchase up to an additional $5 billion of our outstanding shares of common stock. The May 2012 repurchase program, which by its terms would have expired in June 2015, was exhausted in the first quarter of 2014. In November 2013, the Board authorized a stock repurchase program allowing us to repurchase up to an additional $5 billion of our outstanding shares of common stock (this amount includes our commitment to return at least half of the after tax cash proceeds from the sale of the Alibaba Group ADSs in the IPO). The November 2013 repurchase program, according to its terms, will expire in December 2016. Repurchases under the repurchase programs may take place in the open market or in privately negotiated transactions, including derivative transactions, and may be made under a Rule 10b5-1 plan.
During the year ended December 31, 2014, we repurchased approximately 102 million shares of our common stock at an average price of $40.94 per share for a total of approximately $4.2 billion. This amount includes approximately 40 million shares of our common stock repurchased at an average price of $43.47 per share (for a total of approximately $1.7 billion) under an ASR entered into in each of September and October 2014. See “Significant Transactions—Accelerated Share Repurchase” above for additional information.
During the year ended December 31, 2013, we repurchased approximately 129 million shares of our common stock under the May 2012 stock repurchase program at an average price of $25.95 per share for a total of approximately $3.3 billion. These repurchases included the repurchase of 40 million shares of our common stock beneficially owned by Third Point LLC on July 25, 2013. These shares were repurchased pursuant to a Purchase Agreement entered into on July 22, 2013, prior to the market opening for trading in Yahoo stock, at $29.11 per share, which was the closing price of our common stock on July 19, 2013. The total purchase price for these shares was $1.2 billion. The repurchase transaction was funded primarily with cash as well as borrowings of $150 million under our Credit Agreement that have been repaid.
Repurchase Capacity under Approved Programs
| June 2010 Program |
May 2012 Program |
November 2013 Program |
Total | |||||||||||||
| (dollars in millions) | ||||||||||||||||
| January 1, 2012 | $ | 605 | $ | — | $ | — | $ | 605 | ||||||||
| Authorized Share Repurchase amount under May 2012 Program | — | 5,000 | — | 5,000 | ||||||||||||
| Total 2012 Repurchases | (605 | ) | (1,562 | ) | — | (2,167 | ) | |||||||||
|
|
|
|
|
|
|
|
|
|||||||||
| December 31, 2012 | $ | — | $ | 3,438 | $ | — | $ | 3,438 | ||||||||
|
|
|
|
|
|
|
|
|
|||||||||
| Authorized Share Repurchase amount under November 2013 Program | — | — | 5,000 | 5,000 | ||||||||||||
| Total 2013 Repurchases | — | (3,345 | ) | — | (3,345 | ) | ||||||||||
|
|
|
|
|
|
|
|
|
|||||||||
| December 31, 2013 | $ | — | $ | 93 | $ | 5,000 | $ | 5,093 | ||||||||
|
|
|
|
|
|
|
|
|
|||||||||
| Total 2014 Repurchases | — | (93 | ) | (4,070 | ) | (4,163 | ) | |||||||||
|
|
|
|
|
|
|
|
|
|||||||||
| December 31, 2014 | $ | — | $ | — | $ | 930 | $ | 930 | ||||||||
|
|
|
|
|
|
|
|
|
|||||||||
73
Table of Contents
Capital Expenditures
Capital expenditures are generally comprised of purchases of computer hardware, software, server equipment, furniture and fixtures, real estate, and capitalized software and labor for internal use software projects.
Capital expenditures, net were $372 million in 2014, $338 million in 2013, and $506 million in 2012. Capital expenditures increased $34 million in 2014, as compared to 2013, primarily due to incremental investment in hardware to support Company initiatives, facilities expansions and improvements, partially offset by a decline in capitalizable software projects. Capital expenditures declined $168 million in 2013, as compared to 2012, due to a decline in spending and capitalizable projects as well as purchases in late 2012 to fulfill certain purchasing needs for 2013, partially offset by incremental data center construction costs.
We expect capital expenditures, net to increase in 2015 from the amount recorded in 2014 as a result of increased investment initiatives.
Contractual Obligations and Commitments
The following table presents certain payments due under contractual obligations with minimum commitments as of December 31, 2014 (dollars in millions):
| Payments Due by Period | ||||||||||||||||||||
| Total | Due in 2015 |
Due in 2016-2017 |
Due in 2018-2019 |
Thereafter | ||||||||||||||||
| Convertible notes(1) | $ | 1,438 | $ | — | $ | — | $ | 1,438 | $ | — | ||||||||||
| Operating lease obligations(2) (3) (4) | 555 | 141 | 176 | 96 | 142 | |||||||||||||||
| Capital lease obligation | 58 | 19 | 25 | 14 | — | |||||||||||||||
| Affiliate commitments(5) | 2,087 | 505 | 801 | 750 | 31 | |||||||||||||||
| Non-cancelable obligations(6) | 255 | 148 | 94 | 13 | — | |||||||||||||||
| Intellectual property rights(7) | 21 | 6 | 9 | 2 | 4 | |||||||||||||||
| Uncertain tax positions, including interest and penalties(8) | 1,122 | 2 | — | — | 1,120 | |||||||||||||||
|
|
|
|
|
|
|
|
|
|
|
|||||||||||
| Total contractual obligations |
$ | 5,536 | $ | 821 | $ | 1,105 | $ | 2,313 | $ | 1,297 | ||||||||||
|
|
|
|
|
|
|
|
|
|
|
|||||||||||
| (1) | During the year end December 31, 2013, we completed an offering of the Notes, which are due in 2018. The amount above represents the principal balance to be repaid. See Note 11—“Convertible Notes” in the Notes to our consolidated financial statements for additional information. |
| (2) | We have entered into various non-cancelable operating lease agreements for our offices throughout the Americas, EMEA, and Asia Pacific regions with original lease periods up to 12 years, expiring between 2015 and 2025. See Note 12—“Commitments and Contingencies” in the Notes to our consolidated financial statements for additional information. |
| (3) | In May 2013, we entered into a 12 year operating lease agreement for four floors of the former New York Times building in New York City with a total expected minimum lease commitment of $125 million. We have the option to renew the lease for an additional five years. |
| (4) | In December 2014, the Company entered into a 10-year operating lease agreement for three partially completed buildings in Los Angeles, California with a total expected minimum lease |
74
Table of Contents
| commitment of $61 million. The Company has the option to renew the lease for two consecutive renewal terms of either five years or seven years each. |
| (5) | We are obligated to make minimum payments under contracts to provide sponsored search and/or display advertising services to our Affiliates, which represent TAC. |
| (6) | We are obligated to make payments under various arrangements with vendors and other business partners, principally for marketing, bandwidth, and content arrangements. |
| (7) | We are committed to make certain payments under various intellectual property arrangements. |
| (8) | As of December 31, 2014, unrecognized tax benefits and potential interest and penalties resulted in accrued liabilities of $1,122 million, classified as other accrued expenses and current liabilities and deferred and other long-term tax liabilities, net on our consolidated balance sheets. As of December 31, 2014, the settlement period for the $1,120 million income tax liabilities cannot be determined. See Note 16—“Income Taxes” in the Notes to our consolidated financial statements for additional information. |
Other Commitments. In the ordinary course of business, we may provide indemnifications of varying scope and terms to customers, vendors, lessors, joint ventures and business partners, purchasers of assets or subsidiaries and other parties with respect to certain matters, including, but not limited to, losses arising out of our breach of agreements or representations and warranties made by us, services to be provided by us, intellectual property infringement claims made by third parties or, with respect to the sale, lease, or assignment of assets or the sale of a subsidiary, matters related to our conduct of the business and tax matters prior to the sale, lease, or assignment of assets. In addition, we have entered into indemnification agreements with our directors and certain of our officers that will require us, among other things, to indemnify them against certain liabilities that may arise by reason of their status or service as directors or officers. We have also agreed to indemnify certain former officers, directors, and employees of acquired companies in connection with the acquisition of such companies. We maintain director and officer insurance, which may cover certain liabilities arising from our obligation to indemnify our current and former directors and officers, and former directors and officers of acquired companies, in certain circumstances. It is not possible to determine the aggregate maximum potential loss under these indemnification agreements due to the limited history of prior indemnification claims and the unique facts and circumstances involved in each particular agreement. Such indemnification agreements might not be subject to maximum loss clauses. Historically, we have not incurred material costs as a result of obligations under these agreements and we have not accrued any material liabilities related to such indemnification obligations in our consolidated financial statements.
Off Balance Sheet Arrangements
As of December 31, 2014, we did not have any relationships with unconsolidated entities or financial partnerships, such as entities often referred to as structured finance or special purpose entities, established for the purpose of facilitating off-balance sheet arrangements or other contractually narrow or limited purposes. Accordingly we are not exposed to any financing, liquidity, market, or credit risk that could arise if we had such relationships. In addition, we identified no variable interests currently held in entities for which we are the primary beneficiary. In addition, as of December 31, 2014, we had no off-balance sheet arrangements that have, or are reasonably likely to have, a current or future material effect on our consolidated financial condition, results of operations, liquidity, capital expenditures or capital resources.
75
Table of Contents
Critical Accounting Policies and Estimates
Our discussion and analysis of our financial condition and results of operations is based upon our consolidated financial statements, which have been prepared in accordance with GAAP. The preparation of these consolidated financial statements requires us to make estimates, judgments, and assumptions that affect the reported amounts of assets, liabilities, revenue and expenses, and the related disclosure of contingent assets and liabilities. We base our estimates on historical experience and on various other assumptions that we believe are reasonable under the circumstances, the results of which form the basis for making judgments about, among other things, the carrying values of assets and liabilities that are not readily apparent from other sources. Actual results may differ from these estimates.
An accounting policy is considered to be critical if it requires an accounting estimate to be made based on assumptions about matters that are highly uncertain at the time the estimate is made, and if different estimates that reasonably could have been used, or changes in the accounting estimate that are reasonably likely to occur, could materially impact the consolidated financial statements. We believe that the following critical accounting policies reflect the more significant estimates and assumptions used in the preparation of our consolidated financial statements.
Management has discussed the development and selection of these critical accounting estimates with the Audit and Finance Committee (the “Audit Committee”) of our Board, and the Audit Committee has reviewed the disclosure below. In addition, there are other items within our financial statements that require estimation, but are not deemed critical as defined above. Changes in estimates used in these and other items could have a material impact on our consolidated financial statements.
Revenue Recognition. Our revenue is generated from search and display advertising, and other sources. Display advertising revenue is generated from the display of graphical and non-graphical advertisements and search advertising revenue is generated from clicks on text-based links to advertisers’ Websites that appear primarily on search results pages, and from revenue sharing arrangements with partners for search technology and services. Other revenue consists of listings-based services revenue, transaction revenue, and fees revenue. While the majority of our revenue transactions contain standard business terms and conditions, there are certain transactions that contain contract-specific business terms and conditions. In addition, we enter into certain sales transactions that involve multiple elements (arrangements with more than one deliverable). We also enter into arrangements to purchase goods and/or services from certain customers. As a result, significant contract interpretation is sometimes required to determine the appropriate accounting for these transactions including: (1) whether an arrangement exists; (2) whether fees are fixed or determinable; (3) how the arrangement consideration should be allocated among potential multiple elements; (4) establishing selling prices for deliverables considering multiple factors; (5) when to recognize revenue on the deliverables; (6) whether all elements of the arrangement have been delivered; (7) whether the arrangement should be reported gross as a principal versus net as an agent; (8) whether we receive a separately identifiable benefit from the purchase arrangements with certain customers for which we can reasonably estimate fair value; and (9) whether the consideration received from a vendor should be characterized as revenue or a reimbursement of costs incurred. In addition, our revenue recognition policy requires an assessment as to whether collection is reasonably assured, which inherently requires us to evaluate the creditworthiness of our customers. Changes in judgments on these assumptions and estimates could materially impact the timing or amount of revenue recognition.
Income Taxes. Significant judgment is required in evaluating our uncertain tax positions and determining our provision for income taxes. See Note 16—“Income Taxes” in the Notes to our consolidated financial statements for additional information. We establish liabilities for tax-related
76
Table of Contents
uncertainties based on estimates of whether, and the extent to which, additional taxes will be due. These liabilities are established when we believe that certain positions might be challenged despite our belief that our tax return positions are in accordance with applicable tax laws. We adjust these liabilities in light of changing facts and circumstances, such as the closing of a tax audit, new tax legislation, developments in case law or interactions with the tax authorities. To the extent that the final tax outcome of these matters is different than the amounts recorded, such differences will affect the provision for income taxes in the period in which such determination is made. The provision for income taxes includes the effect of liability provisions and changes to reserves that are considered appropriate, as well as the related net interest and penalties.
We record a valuation allowance against certain of our deferred income tax assets if it is more likely than not that those assets will not be realized. In evaluating our ability to realize our deferred income tax assets we consider all available positive and negative evidence, including our operating results, ongoing tax planning, and forecasts of future taxable income on a jurisdiction by jurisdiction basis. In the event we were to determine that we would be able to realize these deferred income tax assets in the future, we would make an adjustment to the valuation allowance, which would reduce the provision for income taxes.
Goodwill. Goodwill is not amortized but is evaluated for impairment annually or whenever we identify certain triggering events or circumstances that would more likely than not reduce the estimated fair value of a reporting unit below its carrying amount. Events or circumstances that might indicate an interim evaluation is warranted include, among other things, unexpected adverse business conditions, regulatory changes, loss of key personnel and reporting unit and macro-economic factors. Goodwill is tested for impairment at the reporting unit level, which is one level below our operating segments.
We identified U.S. & Canada, Latin America, and Tumblr as the reporting units below the Americas operating segment; Europe and Middle East as the reporting units below the EMEA operating segment; and Taiwan, Hong Kong, Australia & New Zealand, India & Southeast Asia as the reporting units below the Asia Pacific operating segment. These operating segments are the same as our reportable segments.
We test for goodwill impairment annually as of October 31 each year or more frequently if there is a triggering event. To test for impairment, we use the two-step quantitative test. The first step of the quantitative test involves comparing the estimated fair value of our reporting units to their carrying values, including goodwill. If the carrying value of the reporting unit exceeds its fair value, the second step of the quantitative test is performed by comparing the carrying value of the goodwill in the reporting unit to its implied fair value. An impairment charge is recognized for the excess of the carrying value of goodwill over its implied fair value.
The estimated fair values of the U.S. & Canada, Latin America, Europe, Taiwan, Hong Kong, and Australia & New Zealand reporting units were estimated using an average of a market approach and an income approach as this combination is deemed to be the most indicative of our estimated fair value in an orderly transaction between market participants and is consistent with the methodology used for the goodwill impairment test in prior years. In addition, we ensure that the estimated fair values under these two approaches are comparable with each other. The fair value of the Tumblr reporting unit was estimated using the market approach and was deemed to be the most indicative of our estimated fair value in an orderly transaction between market participants. The estimated fair values of the Middle East and India & Southeast Asia reporting units were determined using the income approach as the market approach yielded a much higher fair value and was not comparable with the income approach. Under the market approach, we utilize publicly-traded comparable company information to determine revenue and earnings multiples that are used to value our reporting units adjusted for an estimated control premium. Under the income approach, we
77
Table of Contents
determine fair value based on estimated future cash flows of each reporting unit discounted by an estimated weighted-average cost of capital, reflecting the overall level of inherent risk of a reporting unit and the rate of return an outside investor would expect to earn. Determining the estimated fair value of a reporting unit is judgmental in nature and requires the use of significant estimates and assumptions, including selection of market comparables, estimated future cash flows, and discount rates.
These components are discussed below:
| • | Market comparables. We select comparable companies in the specific regions in which these reporting units operate based on similarity of type of business, primarily those involved in online advertising, relative size, financial profile, and other characteristics of those companies compared to these reporting units. Trailing and forward revenue and earnings multiples derived from these comparable companies are applied to financial metrics of these reporting units to determine their estimated fair values, adjusted for an estimated control premium. |
| • | Estimated future cash flows. We base cash flow projections for each reporting unit using a forecast of cash flows and a terminal value based on the Perpetuity Growth Model. The forecast and related assumptions were derived from the most recent annual financial forecast for which the planning process commenced in our fourth quarter. Key assumptions in estimating future cash flows include, among other items, revenue and operating expense growth rates, terminal value growth rate, and capital expenditure and working capital levels. |
| • | Discount rates. We employ a Weighted Average Cost of Capital approach to determine the discount rates used in our cash flow projections. The determination of the discount rates for each reporting unit includes factors such as the risk-free rate of return and the return an outside investor would expect to earn based on the overall level of inherent risk. The determination of expected returns includes consideration of the beta (a measure of volatility) of traded securities of comparable companies and risk premiums of reporting units based on international cost of capital methods. |
The components above require us to make assumptions about the timing and amount of future cash flows, growth rates and discount rates. Significant management judgment is involved in determining these estimates and assumptions, and actual results may differ from those used in valuations. Changes in these estimates and assumptions could materially affect the determination of fair value for each reporting unit which could trigger future impairment. To facilitate a better understanding of how these valuations are determined, a discussion of our significant assumptions is provided below.
Discount rate assumptions for these reporting units take into account our assessment of the risks inherent in the future cash flows of the respective reporting unit and our weighted-average cost of capital. We also review marketplace data to assess the reasonableness of our computation of our overall weighted average cost of capital and, when available, the discount rates utilized for each of these reporting units.
In determining the fair value of all of the reporting units, we used the following assumptions:
| • | Expected cash flows underlying our business plans for the periods 2015 through 2025. |
| • | Cash flows beyond 2025 are projected to grow at a perpetual growth rate. |
| • | In order to risk adjust the cash flow projections in determining fair value, we utilized discount rates of approximately 11 percent to 19 percent for each of these reporting units. |
See “Operating Costs and Expenses — Goodwill Impairment Charge” for additional goodwill impairment information for the years ended December 31, 2013 and 2014 and also Note 5—“Goodwill” in the Notes to our consolidated financial statements.
78
Table of Contents
Long-lived Assets. We amortize long-lived assets, including property and equipment and intangible assets, over their estimated useful lives. Identifiable long-lived assets are reviewed for impairment whenever events or changes in circumstances indicate that the carrying value may not be recoverable. Determination of recoverability is based on the lowest level of identifiable estimated undiscounted future cash flows resulting from use of the asset and its eventual disposition. Measurement of any impairment loss is based on the excess of the carrying value of the asset over its fair value. Fair value is determined based on the lowest level of identifiable estimated future cash flows using discount rates determined by our management to be commensurate with the risk inherent in our business model. Our estimates of future cash flows attributable to our long-lived assets require significant judgment based on our historical and anticipated results and are subject to many factors. Different assumptions and judgments could materially affect estimated future cash flows relating to our long-lived assets which could trigger impairment. No impairments of long-lived assets were identified during any of the periods presented.
Investments in Equity Interests. We account for investments in the common stock of entities in which we have the ability to exercise significant influence but do not own a majority equity interest or otherwise control using the equity method. In accounting for these investments we record our proportionate share of the entities’ net income or loss, one quarter in arrears.
We review our investments in equity interests for impairment whenever events or changes in business circumstances indicate that the carrying value of the investment may not be fully recoverable. Investments identified as having an indication of impairment are subject to further analysis to determine if the impairment is other-than-temporary and this analysis requires estimating the fair value of the investment. The determination of fair value of the investment involves considering factors such as the stock prices of public companies in which we have an equity investment, current economic and market conditions, the operating performance of the companies, including current earnings trends and forecasted cash flows, and other company and industry specific information. The fair value determination, particularly for investments in privately-held companies, requires significant judgment to determine appropriate estimates and assumptions. Changes in these estimates and assumptions could affect the calculation of the fair value of the investments and the determination of whether any identified impairment is other-than-temporary.
Stock-Based Compensation Expense. We recognize stock-based compensation expense net of an estimated forfeiture rate and therefore only recognize compensation expense for those shares expected to vest over the service period of the award. Calculating stock-based compensation expense requires the input of highly subjective assumptions, including the expected term of the stock-based options, stock price volatility, and the pre-vesting award forfeiture rate. We estimate the expected life of options granted based on historical exercise patterns, which we believe are representative of future behavior. We estimate the volatility of our common stock on the date of grant based on the implied volatility of publicly traded options on our common stock, with a term of one year or greater. We believe that implied volatility calculated based on actively traded options on our common stock is a better indicator of expected volatility and future stock price trends than historical volatility.
Therefore, expected volatility for the year ended December 31, 2014 was based on a market-based implied volatility. The assumptions used in calculating the fair value of stock-based awards represent our best estimates, but these estimates involve inherent uncertainties and the application of management judgment. As a result, if factors change and we use different assumptions, our stock-based compensation expense could be materially different in the future. In addition, we are required to estimate the expected pre-vesting award forfeiture rate, as well as the probability that performance conditions that affect the vesting of certain awards will be achieved, and recognize expense only for those shares expected to vest. Performance conditions are estimated and
79
Table of Contents
monitored throughout the year. We estimate this forfeiture rate based on historical experience of our stock-based awards that are granted and cancelled before vesting. If our actual forfeiture rate is materially different from our original estimates, the stock-based compensation expense could be significantly different from what we have recorded in the current period. Changes in the estimated forfeiture rate can have a significant effect on reported stock-based compensation expense, as the effect of adjusting the forfeiture rate for all current and previously recognized expense for unvested awards is recognized in the period the forfeiture estimate is changed. If the actual forfeiture rate is higher than the estimated forfeiture rate, then an adjustment will be made to increase the estimated forfeiture rate, which will result in a decrease to the expense recognized in our consolidated financial statements. If the actual forfeiture rate is lower than the estimated forfeiture rate, then an adjustment will be made to lower the estimated forfeiture rate, which will result in an increase to the expense recognized in our consolidated financial statements. See Note 14—“Employee Benefits” in the Notes to our consolidated financial statements for additional information.
Recent Accounting Pronouncements
See Note 1—“The Company and Summary of Significant Accounting Policies” in the Notes to our consolidated financial statements, which is incorporated herein by reference.
Item 7A. Quantitative and Qualitative Disclosures About Market Risk
We are exposed to financial market risks, including changes in currency exchange rates and interest rates and changes in the market values of our investments. We may use derivative financial instruments to mitigate certain risks in accordance with our investment and foreign exchange policies.
We enter into master netting arrangements, which are designed to reduce credit risk by permitting net settlement of transactions with the same counterparty. We present our derivative assets and liabilities at their gross fair values on the consolidated balance sheets.
Interest Rate Exposure
Our exposure to market risk for changes in interest rates impacts our costs associated with hedging, and primarily relates to our cash and marketable securities portfolio. We invest excess cash in money market funds, time deposits, and liquid debt instruments of the U.S. and foreign governments and their agencies, U.S. municipalities, and high-credit corporate issuers which are classified as marketable securities and cash equivalents.
In November 2013, we issued $1.4375 billion of the Notes. We carry the Notes at face value less unamortized discount on our consolidated balance sheets. The fair value of the Notes changes when the market price of our stock fluctuates.
Investments in fixed rate and floating rate interest earning instruments carry a degree of interest rate risk. Fixed rate securities may have their fair market value adversely impacted due to a rise in interest rates, while floating rate securities may produce less income than expected if interest rates fall. Due in part to these factors, our future investment income may fall short of expectations due to changes in interest rates or we may suffer losses in principal if forced to sell securities that have declined in market value due to changes in interest rates. A hypothetical 100 basis point increase in interest rates would result in a $31 million and $15 million decrease in the fair value of our available-for-sale debt securities as of December 31, 2014 and 2013, respectively.
80
Table of Contents
Foreign Currency Exposure
The objective of our foreign exchange risk management program is to identify material foreign currency exposures and identify methods to manage these exposures to minimize the potential effects of currency fluctuations on our reported consolidated cash flows and results of operations. All counterparties to our derivative contracts are major financial institutions. See Note 9 — “ Foreign Currency Derivative Financial Instruments” in the Notes to our consolidated financial statements for additional information on our hedging programs.
We transact business in various foreign currencies and have international revenue, as well as costs denominated in foreign currencies. This exposes us to the risk of fluctuations in foreign currency exchange rates.
We had net realized and unrealized foreign currency transaction losses of $15 million, $6 million, and $1 million for the years ended December 31, 2014, 2013 and 2012, respectively, which include the impact of balance sheet hedging and remeasurements of foreign denominated assets and liabilities on the balance sheets of the Company and our subsidiaries.
Translation Exposure. We are also exposed to foreign exchange rate fluctuations as we convert the financial statements of our foreign subsidiaries and our investments in equity interests into U.S. dollars in consolidation. If there is a change in foreign currency exchange rates, the conversion of the foreign subsidiaries’ financial statements into U.S. dollars results in a gain or loss which is recorded as a component of accumulated other comprehensive income which is part of stockholders’ equity.
A Value-at-Risk (“VaR”) sensitivity analysis was performed on all of our foreign currency derivative positions to assess the potential impact of fluctuations in exchange rates. The VaR model uses a Monte Carlo simulation to generate thousands of random price paths assuming normal market conditions. The VaR is the maximum expected one day loss in fair value, for a given statistical confidence level, to our foreign currency derivative positions due to adverse movements in rates. The VaR model is used as a risk management tool and is not intended to represent either actual or forecasted losses. Based on the results of the model using a 99 percent confidence interval, we estimate the maximum one-day loss in the net investment hedge portfolio was $22 million and $12 million at December 31, 2014 and 2013, respectively. The maximum one-day loss in the cash flow hedge portfolio was $3 million and less than $1 million at December 31, 2014 and 2013, respectively. The maximum one-day loss in the balance sheet hedge portfolio was $2 million at December 31, 2014 compared to a $2 million and $3 million loss at December 31, 2013 and 2012, respectively. Actual future gains and losses associated with our derivative positions may differ materially from the sensitivity analysis performed as of December 31, 2014 due to the inherent limitations associated with predicting the timing and amount of changes in foreign currency exchange rates and our actual exposures and positions. In addition, the VaR sensitivity analysis may not reflect the complex market reactions that may arise from the market shifts modeled within this VaR sensitivity analysis.
Revenue ex-TAC and related expenses generated from our international subsidiaries are generally denominated in the currencies of the local countries. Primary currencies include Australian dollars, British pounds, Euros, Japanese yen, and Taiwan dollars. The statements of income of our international operations are translated into U.S. dollars at exchange rates indicative of market rates during each applicable period. To the extent the U.S. dollar strengthens against foreign currencies, the translation of these foreign currency-denominated transactions results in reduced consolidated revenue and operating expenses. Conversely, our consolidated revenue and operating expenses will increase if the U.S. dollar weakens against foreign currencies. Using the foreign currency exchange rates from the year ended December 31, 2013, revenue ex-TAC for the Americas segment for the year ended December 31, 2014 would have been higher than we reported by $10 million; revenue ex-TAC
81
Table of Contents
for the EMEA segment would have been lower than we reported by $10 million; and revenue ex-TAC for the Asia Pacific segment would have been higher than we reported by $27 million. Using the foreign currency exchange rates from the year ended December 31, 2013, direct costs for the Americas segment for the year ended December 31, 2014 would have been higher than we reported by $2 million; direct costs for the EMEA segment would have been lower than we reported by $3 million; and direct costs for the Asia Pacific segment would have been higher than we reported by $6 million.
Investment Exposure
We are exposed to investment risk as it relates to changes in the market value of our investments. We have investments in marketable securities and equity instruments of public and private companies. As of the date of the Alibaba Group IPO, we no longer account for our remaining investment in Alibaba Group using the equity method and no longer record our proportionate share of Alibaba Group’s financial results in the consolidated financial statements. Instead, we now reflect our remaining investment in Alibaba Group as an available-for-sale equity security on the consolidated balance sheet and adjust the investment to fair value each quarterly reporting period with changes in fair value recorded within other comprehensive income (loss), net of tax. The change in the classification of our investment in Alibaba Group from an equity method investment to an available-for-sale marketable security exposes our investment portfolio to increased equity price risk. The fair value of the equity investment in Alibaba Group will vary over time and is subject to a variety of market risks including: company performance, macro-economic, regulatory, industry, and systemic risks of the equity markets overall.
Our cash and marketable securities investment policy and strategy attempts primarily to preserve capital and meet liquidity requirements. A large portion of our cash is managed by external managers within the guidelines of our investment policy. We protect and preserve invested funds by limiting default, market, and reinvestment risk. To achieve this objective, we maintain our portfolio of cash and cash equivalents and short-term and long-term investments in a variety of liquid fixed income securities, including both government and corporate obligations and money market funds. As of December 31, 2013, net unrealized gains and losses on these investments were not material. As of December 31, 2014, net unrealized losses on these investments were $5 million.
A sensitivity analysis was performed on our marketable equity security portfolio to assess the potential impact of fluctuations in stock price. Hypothetical declines in stock price of ten percent, twenty percent, and thirty percent were selected based on potential near-term changes in the stock price that could have an adverse effect on our marketable equity security portfolio. As of December 31, 2014, the fair value of our marketable equity security portfolio was approximately $40 billion. Declines in stock prices of ten percent, twenty percent and thirty percent would result in a $4 billion, $8 billion and $12 billion decline, respectively, in the total value of our marketable equity security portfolio.
We performed a separate sensitivity analysis on our Hortonworks warrants for which we estimate fair value using the Black-Scholes model. We have held all other inputs constant and determined the impact of hypothetical declines in stock price of ten percent, twenty percent, and thirty percent, based on potential near-term changes in the stock price that could have an adverse effect on the fair value of the warrants and result in a loss recorded to the consolidated statements of income. As of December 31, 2014, the fair value of the Hortonworks warrants was approximately $98 million. Declines in stock prices of ten percent, twenty percent and thirty percent would result in a $10 million, $20 million and $30 million decline, respectively, in the total value of the Hortonworks warrants.
82
Table of Contents
Item 8. Financial Statements and Supplementary Data
| Page | ||||
| Index to Consolidated Financial Statements | ||||
| Consolidated Financial Statements: | ||||
| 84 | ||||
| Consolidated Balance Sheets as of December 31, 2013 and 2014 |
85 | |||
| Consolidated Statements of Income for each of the three years in the period ended December 31, 2014 |
86 | |||
| 87 | ||||
| 88 | ||||
| 90 | ||||
| 92 | ||||
| Financial Statement Schedules: | ||||
| 152 | ||||
| All other schedules are omitted because they are not applicable or the required information is shown in the Consolidated Financial Statements or Notes thereto |
||||
| Supplementary Financial Data: | ||||
| Selected Quarterly Financial Data (unaudited) for the two years ended December 31, 2014 |
153 | |||
83
Table of Contents
Report of Independent Registered Public Accounting Firm
To the Board of Directors and Stockholders of Yahoo! Inc.:
In our opinion, the consolidated financial statements listed in the accompanying index present fairly, in all material respects, the financial position of Yahoo! Inc. and its subsidiaries at December 31, 2013 and December 31, 2014, and the results of their operations and their cash flows for each of the three years in the period ended December 31, 2014 in conformity with accounting principles generally accepted in the United States of America. In addition, in our opinion, the financial statement schedule listed in the accompanying index presents fairly, in all material respects, the information set forth therein when read in conjunction with the related consolidated financial statements. Also in our opinion, the Company maintained, in all material respects, effective internal control over financial reporting as of December 31, 2014, based on criteria established in Internal Control—Integrated Framework (2013) issued by the Committee of Sponsoring Organizations of the Treadway Commission (COSO). The Company’s management is responsible for these financial statements and financial statement schedule, for maintaining effective internal control over financial reporting and for its assessment of the effectiveness of internal control over financial reporting, included in Management’s Report on Internal Control Over Financial Reporting appearing under Item 9A. Our responsibility is to express opinions on these financial statements, on the financial statement schedule, and on the Company’s internal control over financial reporting based on our integrated audits. We conducted our audits in accordance with the standards of the Public Company Accounting Oversight Board (United States). Those standards require that we plan and perform the audits to obtain reasonable assurance about whether the financial statements are free of material misstatement and whether effective internal control over financial reporting was maintained in all material respects. Our audits of the financial statements included examining, on a test basis, evidence supporting the amounts and disclosures in the financial statements, assessing the accounting principles used and significant estimates made by management, and evaluating the overall financial statement presentation. Our audit of internal control over financial reporting included obtaining an understanding of internal control over financial reporting, assessing the risk that a material weakness exists, and testing and evaluating the design and operating effectiveness of internal control based on the assessed risk. Our audits also included performing such other procedures as we considered necessary in the circumstances. We believe that our audits provide a reasonable basis for our opinions.
A company’s internal control over financial reporting is a process designed to provide reasonable assurance regarding the reliability of financial reporting and the preparation of financial statements for external purposes in accordance with generally accepted accounting principles. A company’s internal control over financial reporting includes those policies and procedures that (i) pertain to the maintenance of records that, in reasonable detail, accurately and fairly reflect the transactions and dispositions of the assets of the company; (ii) provide reasonable assurance that transactions are recorded as necessary to permit preparation of financial statements in accordance with generally accepted accounting principles, and that receipts and expenditures of the company are being made only in accordance with authorizations of management and directors of the company; and (iii) provide reasonable assurance regarding prevention or timely detection of unauthorized acquisition, use, or disposition of the company’s assets that could have a material effect on the financial statements.
Because of its inherent limitations, internal control over financial reporting may not prevent or detect misstatements. Also, projections of any evaluation of effectiveness to future periods are subject to the risk that controls may become inadequate because of changes in conditions, or that the degree of compliance with the policies or procedures may deteriorate.
/s/ PricewaterhouseCoopers LLP
San Jose, California
February 26, 2015
84
Table of Contents
| December 31, | ||||||||
| 2013 | 2014 | |||||||
| (in thousands, except par values) | ||||||||
| ASSETS | ||||||||
| Current assets: | ||||||||
| Cash and cash equivalents |
$ | 2,077,590 | $ | 2,667,916 | ||||
| Short-term marketable securities |
1,330,304 | 5,327,412 | ||||||
| Accounts receivable, net of allowance of $35,549 and $39,799 as of December 31, 2013 and 2014, respectively |
979,559 | 1,032,704 | ||||||
| Prepaid expenses and other current assets |
638,404 | 671,075 | ||||||
|
|
|
|
|
|||||
| Total current assets |
5,025,857 | 9,699,107 | ||||||
| Long-term marketable securities | 1,589,500 | 2,230,892 | ||||||
| Property and equipment, net | 1,488,518 | 1,487,684 | ||||||
| Goodwill | 4,679,648 | 5,163,654 | ||||||
| Intangible assets, net | 417,808 | 470,842 | ||||||
| Other long-term assets and investments | 177,281 | 550,798 | ||||||
| Investment in Alibaba Group | — | 39,867,789 | ||||||
| Investments in equity interests | 3,426,347 | 2,489,578 | ||||||
|
|
|
|
|
|||||
| Total assets | $ | 16,804,959 | $ | 61,960,344 | ||||
|
|
|
|
|
|||||
| LIABILITIES AND EQUITY | ||||||||
| Current liabilities: | ||||||||
| Accounts payable |
$ | 138,031 | $ | 238,018 | ||||
| Income taxes payable related to sale of Alibaba Group ADSs |
— | 3,282,293 | ||||||
| Other accrued expenses and current liabilities |
907,782 | 671,307 | ||||||
| Deferred revenue |
294,499 | 336,963 | ||||||
|
|
|
|
|
|||||
| Total current liabilities |
1,340,312 | 4,528,581 | ||||||
| Convertible notes | 1,110,585 | 1,170,423 | ||||||
| Long-term deferred revenue | 258,904 | 20,774 | ||||||
| Other long-term liabilities | 116,605 | 143,095 | ||||||
| Deferred tax liabilities related to investment in Alibaba Group | — | 16,154,906 | ||||||
| Deferred and other long-term tax liabilities | 847,956 | 1,156,973 | ||||||
|
|
|
|
|
|||||
| Total liabilities | 3,674,362 | 23,174,752 | ||||||
|
|
|
|
|
|||||
| Commitments and contingencies (Note 12) | ||||||||
| Yahoo! Inc. stockholders’ equity: | ||||||||
| Preferred stock, $0.001 par value; 10,000 shares authorized; none issued or outstanding |
— | — | ||||||
| Common stock, $0.001 par value; 5,000,000 shares authorized; 1,019,812 shares issued and 1,014,338 shares outstanding as of December 31, 2013, and 949,771 shares issued and 936,838 shares outstanding as of December 31, 2014 |
1,015 | 945 | ||||||
| Additional paid-in capital |
8,688,304 | 8,496,683 | ||||||
| Treasury stock at cost, 5,474 shares as of December 31, 2013, and 12,933 shares as of December 31, 2014 |
(200,228 | ) | (712,455 | ) | ||||
| Retained earnings |
4,267,429 | 8,937,036 | ||||||
| Accumulated other comprehensive income |
318,389 | 22,019,628 | ||||||
|
|
|
|
|
|||||
| Total Yahoo! Inc. stockholders’ equity |
13,074,909 | 38,741,837 | ||||||
| Noncontrolling interests | 55,688 | 43,755 | ||||||
|
|
|
|
|
|||||
| Total equity | 13,130,597 | 38,785,592 | ||||||
|
|
|
|
|
|||||
| Total liabilities and equity | $ | 16,804,959 | $ | 61,960,344 | ||||
|
|
|
|
|
|||||
The accompanying notes are an integral part of these consolidated financial statements.
85
Table of Contents
Yahoo! Inc.
Consolidated Statements of Income
| Years Ended December 31, | ||||||||||||
| 2012 | 2013 | 2014 | ||||||||||
| (in thousands, except per share amounts) | ||||||||||||
| Revenue | $ | 4,986,566 | $ | 4,680,380 | $ | 4,618,133 | ||||||
|
|
|
|
|
|
|
|||||||
| Operating expenses: | ||||||||||||
| Cost of revenue—traffic acquisition costs |
518,906 | 254,442 | 217,531 | |||||||||
| Cost of revenue—other |
1,101,660 | 1,094,938 | 1,080,783 | |||||||||
| Sales and marketing |
1,101,572 | 1,130,820 | 1,234,268 | |||||||||
| Product development |
885,824 | 1,008,487 | 1,207,146 | |||||||||
| General and administrative |
540,247 | 569,555 | 574,743 | |||||||||
| Amortization of intangibles |
35,819 | 44,841 | 66,750 | |||||||||
| Gains on sales of patents |
— | (79,950 | ) | (97,894 | ) | |||||||
| Goodwill impairment charge |
— | 63,555 | 88,414 | |||||||||
| Restructuring charges, net |
236,170 | 3,766 | 103,450 | |||||||||
|
|
|
|
|
|
|
|||||||
| Total operating expenses |
4,420,198 | 4,090,454 | 4,475,191 | |||||||||
|
|
|
|
|
|
|
|||||||
| Income from operations | 566,368 | 589,926 | 142,942 | |||||||||
| Other income, net |
4,647,839 | 43,357 | 10,369,439 | |||||||||
|
|
|
|
|
|
|
|||||||
| Income before income taxes and earnings in equity interests | 5,214,207 | 633,283 | 10,512,381 | |||||||||
| Provision for income taxes | (1,940,043 | ) | (153,392 | ) | (4,038,102 | ) | ||||||
| Earnings in equity interests, net of tax | 676,438 | 896,675 | 1,057,863 | |||||||||
|
|
|
|
|
|
|
|||||||
| Net income | 3,950,602 | 1,376,566 | 7,532,142 | |||||||||
| Net income attributable to noncontrolling interests |
(5,123 | ) | (10,285 | ) | (10,411 | ) | ||||||
|
|
|
|
|
|
|
|||||||
| Net income attributable to Yahoo! Inc. | $ | 3,945,479 | $ | 1,366,281 | $ | 7,521,731 | ||||||
|
|
|
|
|
|
|
|||||||
| Net income attributable to Yahoo! Inc. common stockholders per share—basic | $ | 3.31 | $ | 1.30 | $ | 7.61 | ||||||
|
|
|
|
|
|
|
|||||||
| Net income attributable to Yahoo! Inc. common stockholders per share—diluted | $ | 3.28 | $ | 1.26 | $ | 7.45 | ||||||
|
|
|
|
|
|
|
|||||||
| Shares used in per share calculation—basic | 1,192,775 | 1,052,705 | 987,819 | |||||||||
|
|
|
|
|
|
|
|||||||
| Shares used in per share calculation—diluted | 1,202,906 | 1,070,811 | 1,004,108 | |||||||||
|
|
|
|
|
|
|
|||||||
| Stock-based compensation expense by function: | ||||||||||||
| Cost of revenue—other |
$ | 10,078 | $ | 15,545 | $ | 33,560 | ||||||
| Sales and marketing |
82,115 | 101,852 | 154,372 | |||||||||
| Product development |
74,284 | 83,396 | 139,056 | |||||||||
| General and administrative |
57,888 | 77,427 | 93,186 | |||||||||
| Restructuring reversals, net |
(3,429 | ) | — | — | ||||||||
The accompanying notes are an integral part of these consolidated financial statements.
86
Table of Contents
Yahoo! Inc.
Consolidated Statements of Comprehensive Income
| Years Ended December 31, | ||||||||||||
| 2012 | 2013 | 2014 | ||||||||||
| (in thousands) | ||||||||||||
| Comprehensive income | ||||||||||||
| Net income |
$ | 3,950,602 | $ | 1,376,566 | $ | 7,532,142 | ||||||
|
|
|
|
|
|
|
|||||||
| Available-for-sale securities: |
||||||||||||
| Unrealized gains (losses) on available-for-sale securities, net of taxes of ($86), ($1,724), and ($15,170,607) for 2012, 2013, and 2014, respectively |
7,571 | 6,776 | 22,072,073 | |||||||||
| Reclassification adjustment for realized (gains) losses on available–for-sale securities included in net income, net of taxes of ($5,197), $479, and $1,339 for 2012, 2013, and 2014, respectively |
9,088 | (796 | ) | (2,218 | ) | |||||||
|
|
|
|
|
|
|
|||||||
| Net change in unrealized gains (losses) on available-for-sale securities, net of tax |
16,659 | 5,980 | 22,069,855 | |||||||||
|
|
|
|
|
|
|
|||||||
| Foreign currency translation adjustments (“CTA”): |
||||||||||||
| Foreign CTA gains (losses), net of taxes of ($2,210), ($19,754), and $1,734 for 2012, 2013, and 2014, respectively |
(9,334 | ) | (577,711 | ) | (363,013 | ) | ||||||
| Net investment hedge CTA gains (losses), net of taxes of $0, ($192,369) and ($79,037) for 2012, 2013, and 2014 |
3,241 | 317,459 | 130,904 | |||||||||
| Reclassification adjustment for realized (gains) losses included in CTA, net of taxes of $68,130, $0, and $30,325 for 2012, 2013, and 2014 respectively |
(137,186 | ) | — | (50,301 | ) | |||||||
|
|
|
|
|
|
|
|||||||
| Net foreign CTA gains (losses), net of tax |
(143,279 | ) | (260,252 | ) | (282,410 | ) | ||||||
|
|
|
|
|
|
|
|||||||
| Cash flow hedges: |
||||||||||||
| Unrealized gains (losses) on cash flow hedges, net of taxes of $0, ($1,199), and ($3,044) for 2012, 2013, and 2014 |
— | 3,492 | 5,704 | |||||||||
| Reclassification adjustment for realized (gains) losses on cash flow hedges included in net income, net of taxes of $0, $575, and $2,771 for 2012, 2013, and 2014 |
— | (2,080 | ) | (5,259 | ) | |||||||
|
|
|
|
|
|
|
|||||||
| Net change in unrealized gains (losses) on cash flow hedges, net of tax |
— | 1,412 | 445 | |||||||||
|
|
|
|
|
|
|
|||||||
| Other comprehensive income (loss) |
(126,620 | ) | (252,860 | ) | 21,787,890 | |||||||
|
|
|
|
|
|
|
|||||||
| Comprehensive income |
3,823,982 | 1,123,706 | 29,320,032 | |||||||||
| Less: Comprehensive income attributable to noncontrolling interests |
(5,123 | ) | (10,285 | ) | (10,411 | ) | ||||||
|
|
|
|
|
|
|
|||||||
| Comprehensive income attributable to Yahoo! Inc. |
$ | 3,818,859 | $ | 1,113,421 | $ | 29,309,621 | ||||||
|
|
|
|
|
|
|
|||||||
The accompanying notes are an integral part of these consolidated financial statements.
87
Table of Contents
Yahoo! Inc.
Consolidated Statements of Stockholders’ Equity
| Years Ended December 31, | ||||||||||||
| 2012 | 2013 | 2014 | ||||||||||
| (in thousands) | ||||||||||||
| Common stock | ||||||||||||
| Balance, beginning of year |
$ | 1,242 | $ | 1,187 | $ | 1,015 | ||||||
| Common stock issued |
24 | 26 | 24 | |||||||||
| Common stock retired |
(79 | ) | (198 | ) | (94 | ) | ||||||
|
|
|
|
|
|
|
|||||||
| Balance, end of year |
1,187 | 1,015 | 945 | |||||||||
|
|
|
|
|
|
|
|||||||
| Additional paid-in capital | ||||||||||||
| Balance, beginning of year |
9,825,899 | 9,563,348 | 8,688,304 | |||||||||
| Common stock and stock-based awards issued |
218,349 | 353,241 | 303,816 | |||||||||
| Stock-based compensation expense |
244,653 | 294,408 | 432,614 | |||||||||
| Tax (detriments) benefits from stock-based awards |
(31,440 | ) | 49,061 | 145,711 | ||||||||
| Tax withholdings related to net share settlements of restricted stock awards |
(60,939 | ) | (139,815 | ) | (280,879 | ) | ||||||
| Retirement of treasury stock |
(630,639 | ) | (1,620,704 | ) | (794,596 | ) | ||||||
| Equity component of convertible senior notes, net |
— | 268,084 | — | |||||||||
| Purchase of note hedges |
— | (205,706 | ) | — | ||||||||
| Issuance of warrants |
— | 124,775 | — | |||||||||
| Other |
(2,535 | ) | 1,612 | 1,713 | ||||||||
|
|
|
|
|
|
|
|||||||
| Balance, end of year |
9,563,348 | 8,688,304 | 8,496,683 | |||||||||
|
|
|
|
|
|
|
|||||||
| Treasury stock | ||||||||||||
| Balance, beginning of year |
(416,237 | ) | (1,368,043 | ) | (200,228 | ) | ||||||
| Repurchases of common stock |
(2,167,841 | ) | (3,344,396 | ) | (2,426,247 | ) | ||||||
| Accelerated share repurchases |
— | — | (1,732,794 | ) | ||||||||
| Retirement of treasury stock |
1,216,035 | 4,512,211 | 3,646,814 | |||||||||
|
|
|
|
|
|
|
|||||||
| Balance, end of year |
(1,368,043 | ) | (200,228 | ) | (712,455 | ) | ||||||
|
|
|
|
|
|
|
|||||||
| Retained earnings | ||||||||||||
| Balance, beginning of year |
2,432,294 | 5,792,459 | 4,267,429 | |||||||||
| Net income attributable to Yahoo! Inc. |
3,945,479 | 1,366,281 | 7,521,731 | |||||||||
| Retirement of treasury stock |
(585,314 | ) | (2,891,311 | ) | (2,852,124 | ) | ||||||
|
|
|
|
|
|
|
|||||||
| Balance, end of year |
5,792,459 | 4,267,429 | 8,937,036 | |||||||||
|
|
|
|
|
|
|
|||||||
| Accumulated other comprehensive income | ||||||||||||
| Balance, beginning of year |
697,869 | 571,249 | 318,389 | |||||||||
| Net change in unrealized gains on available-for-sale securities, net of tax |
16,659 | 5,980 | 22,069,855 | |||||||||
| Net change in unrealized gains on cash flow hedges, net of tax |
— | 1,412 | 445 | |||||||||
| Foreign currency translation adjustments, net of tax |
(143,279 | ) | (260,252 | ) | (369,061 | ) | ||||||
|
|
|
|
|
|
|
|||||||
| Balance, end of year |
571,249 | 318,389 | 22,019,628 | |||||||||
|
|
|
|
|
|
|
|||||||
| Total Yahoo! Inc. stockholders’ equity | $ | 14,560,200 | $ | 13,074,909 | $ | 38,741,837 | ||||||
|
|
|
|
|
|
|
|||||||
The accompanying notes are an integral part of these consolidated financial statements.
88
Table of Contents
Yahoo! Inc.
Consolidated Statements of Stockholders’ Equity—(Continued)
| Years Ended December 31, | ||||||||||||
| 2012 | 2013 | 2014 | ||||||||||
| Number of Outstanding Shares | ||||||||||||
| (in thousands) | ||||||||||||
| Common stock | ||||||||||||
| Balance, beginning of year |
1,217,481 | 1,115,233 | 1,014,338 | |||||||||
| Common stock and restricted stock issued |
23,773 | 26,401 | 24,197 | |||||||||
| Restricted stock issued under compensation arrangements |
— | 1,567 | — | |||||||||
| Accelerated share repurchase |
— | — | (39,859 | ) | ||||||||
| Repurchases of common stock |
(126,021 | ) | (128,863 | ) | (61,838 | ) | ||||||
|
|
|
|
|
|
|
|||||||
| Balance, end of year |
1,115,233 | 1,014,338 | 936,838 | |||||||||
|
|
|
|
|
|
|
|||||||
The accompanying notes are an integral part of these consolidated financial statements.
89
Table of Contents
Yahoo! Inc.
Consolidated Statements of Cash Flows
| Years Ended December 31, | ||||||||||||
| 2012 | 2013 | 2014 | ||||||||||
| (in thousands) | ||||||||||||
| CASH FLOWS FROM OPERATING ACTIVITIES: | ||||||||||||
| Net income | $ | 3,950,602 | $ | 1,376,566 | $ | 7,532,142 | ||||||
| Adjustments to reconcile net income to net cash (used in) provided by operating activities: | ||||||||||||
| Depreciation |
549,235 | 532,485 | 475,031 | |||||||||
| Amortization of intangible assets |
105,366 | 96,518 | 131,537 | |||||||||
| Accretion of convertible notes discount |
— | 4,846 | 59,838 | |||||||||
| Stock-based compensation expense |
220,936 | 278,220 | 420,174 | |||||||||
| Non-cash restructuring charges (reversals) |
109,896 | 547 | (3,394 | ) | ||||||||
| (Gains) losses from sales of investments, assets, and other, net |
(11,840 | ) | 22,397 | 35,473 | ||||||||
| Gain on sale of Alibaba Group shares |
(4,603,322 | ) | — | — | ||||||||
| Gain on sale of Alibaba Group ADSs |
— | — | (10,319,437 | ) | ||||||||
| Gains on sales of patents |
— | (79,950 | ) | (97,894 | ) | |||||||
| Gain on Hortonworks warrants |
— | — | (98,062 | ) | ||||||||
| Goodwill impairment charge |
— | 63,555 | 88,414 | |||||||||
| Earnings in equity interests |
(676,438 | ) | (896,675 | ) | (1,057,863 | ) | ||||||
| Dividend income related to Alibaba Group Preference Shares |
(20,000 | ) | (35,726 | ) | — | |||||||
| Tax (detriments) benefits from stock-based awards |
(31,440 | ) | 49,061 | 145,711 | ||||||||
| Excess tax benefits from stock-based awards |
(35,844 | ) | (64,407 | ) | (149,582 | ) | ||||||
| Deferred income taxes |
(769,320 | ) | (84,302 | ) | 465,873 | |||||||
| Dividends received from equity investees |
83,648 | 135,058 | 83,685 | |||||||||
| Changes in assets and liabilities, net of effects of acquisitions: |
||||||||||||
| Accounts receivable |
34,752 | 26,199 | 29,278 | |||||||||
| Prepaid expenses and other |
78,529 | 27,401 | (78,601 | ) | ||||||||
| Accounts payable |
12,747 | (7,764 | ) | 14,165 | ||||||||
| Accrued expenses and other liabilities |
255,799 | (98,853 | ) | 132,839 | ||||||||
| Income taxes payable related to sale of Alibaba Group ADSs |
— | — | 3,282,293 | |||||||||
| Deferred revenue |
465,140 | (149,929 | ) | (194,920 | ) | |||||||
|
|
|
|
|
|
|
|||||||
| Net cash (used in) provided by operating activities |
(281,554 | ) | 1,195,247 | 896,700 | ||||||||
|
|
|
|
|
|
|
|||||||
The accompanying notes are an integral part of these consolidated financial statements.
90
Table of Contents
Yahoo! Inc.
Consolidated Statements of Cash Flows—(Continued)
| Years Ended December 31, | ||||||||||||
| 2012 | 2013 | 2014 | ||||||||||
| (in thousands) | ||||||||||||
| CASH FLOWS FROM INVESTING ACTIVITIES: | ||||||||||||
| Acquisition of property and equipment, net | (505,507 | ) | (338,131 | ) | (372,147 | ) | ||||||
| Purchases of marketable securities | (3,520,327 | ) | (3,223,190 | ) | (7,890,092 | ) | ||||||
| Proceeds from sales of marketable securities | 741,947 | 2,871,834 | 2,269,659 | |||||||||
| Proceeds from maturities of marketable securities | 381,403 | 748,915 | 945,696 | |||||||||
| Proceeds related to sale of Alibaba Group shares, net | 6,247,728 | — | — | |||||||||
| Proceeds from sale of Alibaba Group ADSs, net of underwriting discounts, commissions, and fees | — | — | 9,404,974 | |||||||||
| Proceeds related to the redemption of Alibaba Group Preference Shares | — | 800,000 | — | |||||||||
| Acquisitions, net of cash acquired | (5,716 | ) | (1,247,544 | ) | (859,036 | ) | ||||||
| Purchases of intangible assets | (3,799 | ) | (2,500 | ) | (2,658 | ) | ||||||
| Proceeds from settlement of derivative hedge contracts | 17,898 | 312,266 | 254,496 | |||||||||
| Payments for settlement of derivative hedge contracts | (11,141 | ) | (22,708 | ) | (5,454 | ) | ||||||
| Proceeds from the sale of investments | 26,132 | 181 | — | |||||||||
| Payments for equity investments in privately held companies | (7,799 | ) | (4,226 | ) | (74,399 | ) | ||||||
| Proceeds from sales of patents | — | 79,950 | 86,300 | |||||||||
| Other investing activities, net | 1,225 | 1,932 | 4,630 | |||||||||
|
|
|
|
|
|
|
|||||||
| Net cash provided by (used in) investing activities |
3,362,044 | (23,221 | ) | 3,761,969 | ||||||||
|
|
|
|
|
|
|
|||||||
| CASH FLOWS FROM FINANCING ACTIVITIES: | ||||||||||||
| Proceeds from issuance of common stock | 218,371 | 353,267 | 308,029 | |||||||||
| Repurchases of common stock | (2,167,841 | ) | (3,344,396 | ) | (4,163,227 | ) | ||||||
| Proceeds from issuance of convertible notes | — | 1,412,344 | — | |||||||||
| Payments for note hedges | — | (205,706 | ) | — | ||||||||
| Proceeds from issuance of warrants | — | 124,775 | — | |||||||||
| Excess tax benefits from stock-based awards | 35,844 | 64,407 | 149,582 | |||||||||
| Tax withholdings related to net share settlements of restricted stock units | (60,939 | ) | (139,815 | ) | (280,879 | ) | ||||||
| Distributions to noncontrolling interests | — | — | (22,344 | ) | ||||||||
| Proceeds from credit facility borrowings | — | 150,000 | — | |||||||||
| Repayment of credit facility borrowings | — | (150,000 | ) | — | ||||||||
| Other financing activities, net | (4,892 | ) | (8,760 | ) | (13,627 | ) | ||||||
|
|
|
|
|
|
|
|||||||
| Net cash used in financing activities |
(1,979,457 | ) | (1,743,884 | ) | (4,022,466 | ) | ||||||
|
|
|
|
|
|
|
|||||||
| Effect of exchange rate changes on cash and cash equivalents | 4,355 | (18,330 | ) | (45,877 | ) | |||||||
| Net change in cash and cash equivalents |
1,105,388 | (590,188 | ) | 590,326 | ||||||||
| Cash and cash equivalents at beginning of year | 1,562,390 | 2,667,778 | 2,077,590 | |||||||||
|
|
|
|
|
|
|
|||||||
| Cash and cash equivalents at end of year | $ | 2,667,778 | $ | 2,077,590 | $ | 2,667,916 | ||||||
|
|
|
|
|
|
|
|||||||
The accompanying notes are an integral part of these consolidated financial statements.
91
Table of Contents
Yahoo! Inc.
Notes to Consolidated Financial Statements
Note 1 The Company And Summary Of Significant Accounting Policies
The Company. Yahoo! Inc., together with its consolidated subsidiaries (“Yahoo” or the “Company”), is a guide focused on making users’ digital habits inspiring and entertaining. By creating highly personalized experiences for its users, the Company keeps people connected to what matters most to them, across devices and around the world. In turn, the Company creates value for advertisers by connecting them with the audiences that build their businesses. For advertisers, the opportunity to be a part of users’ digital habits across products and platforms is a powerful tool to engage audiences and build brand loyalty. Advertisers can build their businesses by advertising to targeted audiences on the Company’s online properties and services (“Yahoo Properties”) and through a distribution network of third-party entities (“Affiliates”) who integrate the Company’s advertising offerings into their Websites or other offerings (“Affiliate sites” and, together with Yahoo Properties, the “Yahoo Network”). The Company manages and measures its business geographically, principally in the Americas, EMEA (Europe, Middle East, and Africa) and Asia Pacific.
Basis of Presentation. The consolidated financial statements include the accounts of Yahoo! Inc. and its majority-owned or otherwise controlled subsidiaries. All significant intercompany accounts and transactions have been eliminated. Investments in entities in which the Company can exercise significant influence, but does not own a majority equity interest or otherwise control, are accounted for using the equity method and are included as investments in equity interests on the consolidated balance sheets. The Company has included the results of operations of acquired companies from the date of the acquisition. Certain prior period amounts have been reclassified to conform to the current period presentation.
The preparation of consolidated financial statements in conformity with generally accepted accounting principles (“GAAP”) in the United States (“U.S.”) requires management to make estimates, judgments, and assumptions that affect the reported amounts of assets, liabilities, revenue, and expenses and the related disclosure of contingent assets and liabilities. On an ongoing basis, the Company evaluates its estimates, including those related to revenue, the useful lives of long-lived assets including property and equipment and intangible assets, investment fair values, stock-based compensation, goodwill, income taxes, contingencies, and restructuring charges. Actual results may differ from these estimates.
Concentration of Risk. Financial instruments that potentially subject the Company to significant concentration of credit risk and equity price consist primarily of cash, cash equivalents, marketable securities (including Alibaba Group Holding Limited (“Alibaba Group”) and Hortonworks, Inc. (“Hortonworks”) equity securities), accounts receivable, and derivative financial instruments. The primary focus of the Company’s investment strategy is to preserve capital and meet liquidity requirements. A large portion of the Company’s cash is managed by external managers within the guidelines of the Company’s investment policy. The Company’s investment policy addresses the level of credit exposure by limiting the concentration in any one corporate issuer or sector and establishing a minimum allowable credit rating. To manage the risk exposure, the Company maintains its portfolio of cash and cash equivalents and short-term and long-term investments in marketable securities, including U.S. and foreign government, agency, municipal and highly rated corporate debt obligations and money market funds.
92
Table of Contents
The fair value of the equity investments in Alibaba Group and Hortonworks will vary over time and is subject to a variety of market risks including: company performance, macro-economic, regulatory, industry, and systemic risks of the equity markets overall. Consequently, the carrying value of the Company’s investment portfolio will vary over time as the value of the Company’s investments in marketable securities, including Alibaba Group and Hortonworks changes.
Accounts receivable are typically unsecured and are derived from revenue earned from customers. The Company performs ongoing credit evaluations of its customers and maintains allowances for potential credit losses. Historically, such losses have been within management’s expectations.
The Company’s derivative instruments, including the convertible note hedge transactions, expose the Company to credit risk to the extent that its derivative counterparties become unable to meet their financial obligations under the terms of the agreements. The Company seeks to mitigate this risk by limiting its derivative counterparties to major financial institutions and by spreading the risk across several major financial institutions. In addition, the potential risk of loss with any one counterparty resulting from this type of credit risk is monitored on an ongoing basis. See “Note 9—Foreign Currency Derivative Financial Instruments” for additional information related to the Company’s derivative instruments.
The Company also holds warrants in Hortonworks, which expose the Company to variability in fair value based on changes in the stock price as an input to the Black-Scholes model.
As of December 31, 2013 and 2014, no one customer accounted for 10 percent or more of the accounts receivable balance and no one customer accounted for 10 percent or more of the Company’s revenue for 2012, 2013, or 2014. See Note 19 “Search Agreement with Microsoft Corporation” for revenue under the Company’s Search and Advertising Services and Sales Agreement (the “Search Agreement”) with Microsoft Corporation (“Microsoft”).
Comprehensive Income. Comprehensive income consists of two components, net income and other comprehensive income. Other comprehensive income refers to revenue, expenses, and gains and losses that under GAAP are recorded as an element of stockholders’ equity but are excluded from net income. The Company’s other comprehensive income consists of foreign currency translation adjustments from those subsidiaries or equity method investments where the local currency is the functional currency, unrealized gains and losses on marketable securities classified as available-for-sale, unrealized gains and losses on cash flow hedges, net changes in fair value of derivative instruments related to our net investment hedges, as well as the Company’s share of its equity investees’ other comprehensive income.
Foreign Currency. The functional currency of the Company’s international subsidiaries is evaluated on a case-by-case basis and is often the local currency. The financial statements of these subsidiaries are translated into U.S. dollars using period-end rates of exchange for assets and liabilities, historical rates of exchange for equity, and average rates of exchange for the period for revenue and expenses. Translation gains (losses) are recorded in accumulated other comprehensive income (loss) as a component of stockholders’ equity. In addition, the Company records translation gains (losses) related to its foreign equity method investments in accumulated other comprehensive income (loss). The Company records foreign currency transaction gains and losses, realized and unrealized and foreign exchange gains and losses due to re-measurement of monetary assets and liabilities denominated in non-functional currencies in other income, net in the consolidated statements of income. The Company recorded $1 million, $6 million and $15 million of net losses in 2012, 2013 and 2014, respectively.
Cash and Cash Equivalents, Short- and Long-Term Marketable Securities. The Company invests its excess cash in money market funds, time deposits, and liquid debt securities of the U.S. and foreign
93
Table of Contents
governments and their agencies, U.S. municipalities, and high-credit corporate issuers which are classified as marketable securities and cash equivalents. All investments in debt securities with an original maturity of three months or less are considered cash equivalents. Investments in debt securities with remaining maturities of less than 12 months from the balance sheet date are classified as current assets, which are available for use to fund current operations. Investments with remaining maturities greater than 12 months from the balance sheet date are classified as long-term assets.
Operating cash deposits held with banks may exceed the amount of insurance provided on such deposits. Generally, these deposits may be redeemed upon demand and are maintained with financial institutions with reputable credit and therefore bear minimal credit risk. The Company seeks to mitigate its credit risk by spreading such risk across multiple counterparties and monitoring the risk profiles of these counterparties.
The Company’s marketable equity securities, including Alibaba Group and Hortonworks, are classified as available-for-sale and are reported at fair value, with unrealized gains and losses, net of tax, recorded in accumulated other comprehensive income (loss). The change in the classification of the Company’s investments in Alibaba Group and Hortonworks to available-for-sale marketable securities exposes our investment portfolio to increased equity price risk. The Company evaluates the marketable equity securities periodically for possible other-than-temporary impairment. A decline of fair value below cost basis is considered an other-than-temporary impairment if the Company has the intent to sell the security or it is more likely than not that the Company will be required to sell the security before recovery of the entire cost basis. In those instances, an impairment charge equal to the difference between the fair value and the cost basis is recognized in earnings. Regardless of the Company’s intent or requirement to sell the marketable equity securities, an impairment is considered other-than-temporary if the Company does not expect to recover the entire cost basis; in those instances, a loss equal to the difference between fair value and the cost basis of the marketable equity security is recognized in earnings.
Realized gains or losses and declines in value judged to be other-than-temporary, if any, on available-for-sale securities are reported in other income, net. The Company evaluates its marketable debt investments periodically for possible other-than-temporary impairment. A decline of fair value below amortized costs of debt securities is considered an other-than-temporary impairment if the Company has the intent to sell the security or it is more likely than not that the Company will be required to sell the security before recovery of the entire amortized cost basis. In those instances, an impairment charge equal to the difference between the fair value and the amortized cost basis is recognized in earnings. Regardless of the Company’s intent or requirement to sell a debt security, an impairment is considered other-than-temporary if the Company does not expect to recover the entire amortized cost basis; in those instances, a credit loss equal to the difference between the present value of the cash flows expected to be collected based on credit risk and the amortized cost basis of the debt security is recognized in earnings. The Company has no current requirement or intent to sell a material portion of debt securities as of December 31, 2014. The Company expects to recover up to (or beyond) the initial cost of investment for securities held. In computing realized gains and losses on available-for-sale securities, the Company determines cost based on amounts paid, including direct costs such as commissions to acquire the security, using the specific identification method. During the years ended December 31, 2012, 2013 and 2014, gross realized gains and losses on available-for-sale marketable debt and equity securities were not material.
Allowance for Doubtful Accounts. The Company records its allowance for doubtful accounts based upon its assessment of various factors. The Company considers historical experience, the age of the accounts receivable balances, the credit quality of its customers, current economic conditions, and other factors that may affect customers’ ability to pay to determine the level of allowance required.
94
Table of Contents
Foreign Currency Derivative Financial Instruments. The Company uses derivative financial instruments, primarily foreign currency forward contracts and option contracts, to mitigate certain foreign currency exposures. The Company hedges, on an after-tax basis, a portion of its net investment in Yahoo Japan Corporation (“Yahoo Japan”). The Company has designated these foreign currency forward and option contracts as net investment hedges. The effective portion of changes in fair value is recorded in accumulated other comprehensive income on the Company’s consolidated balance sheet and any ineffective portion is recorded in other income, net on the Company’s consolidated statements of income. The Company expects the net investment hedges to be effective, on an after-tax basis, and effectiveness will be assessed each quarter. Should any portion of the net investment hedge become ineffective, the ineffective portion will be reclassified to other income, net on the Company’s consolidated statements of income. The fair values of the net investment hedges are determined using quoted observable inputs. Gains and losses reported in accumulated other comprehensive income will not be reclassified into earnings until a sale of the Company’s underlying investment.
For derivatives designated as cash flow hedges, the effective portion of the unrealized gains or losses on these forward contracts is recorded in accumulated other comprehensive income on the Company’s consolidated balance sheets and reclassified into revenue in the consolidated statements of income when the underlying hedged revenue is recognized. If the cash flow hedges were to become ineffective, the ineffective portion would be immediately recorded in other income, net in the Company’s consolidated statements of income.
The Company hedges certain of its net recognized foreign currency assets and liabilities with foreign exchange forward contracts to reduce the risk that its earnings and cash flows will be adversely affected by changes in foreign currency exchange rates. These balance sheet hedges are used to partially offset the foreign currency exchange gains and losses generated by the re-measurement of certain assets and liabilities denominated in non-functional currency. Changes in the fair value of these derivatives are recorded in other income, net on the Company’s consolidated statements of income. The fair values of the balance sheet hedges are determined using quoted observable inputs.
The Company recognizes all derivative instruments as other assets or liabilities on the Company’s consolidated balance sheets at fair value. See Note 9—“Foreign Currency Derivative Financial Instruments” for a full description of the Company’s derivative financial instrument activities and related accounting.
Property and Equipment. Buildings are stated at cost and depreciated using the straight-line method over the estimated useful lives of 25 years. Leasehold improvements are amortized over the lesser of their expected useful lives and the remaining lease term. Computers and equipment and furniture and fixtures are stated at cost and depreciated using the straight-line method over the estimated useful lives of the assets, generally three to five years.
Property and equipment to be held and used are reviewed for impairment whenever events or changes in circumstances indicate that the carrying value of the assets may not be recoverable. Determination of recoverability is based on the lowest level of identifiable estimated undiscounted future cash flows resulting from the use of the asset and its eventual disposition. Measurement of any impairment loss for long-lived assets that management expects to hold and use is based on the excess of the carrying value of the asset over its fair value. No impairments of such assets were identified during any of the periods presented.
Capitalized Software and Labor. The Company capitalized certain software and labor costs totaling approximately $180 million, $130 million, and $85 million during 2012, 2013, and 2014, respectively. The estimated useful life of costs capitalized is evaluated for each specific project and ranges from
95
Table of Contents
one to three years. During 2012, 2013, and 2014, the amortization of capitalized costs totaled approximately $142 million, $175 million, and $161 million, respectively. Capitalized software and labor costs are included in property and equipment, net. Included in the capitalized amounts above are $24 million, $16 million, and $12 million, respectively, of stock-based compensation expense in the years ended December 31, 2012, 2013, and 2014.
Goodwill. Goodwill represents the excess of the purchase price over the fair value of the net tangible and intangible assets acquired in a business combination. Goodwill is not amortized, but is tested for impairment on an annual basis and more frequently if impairment indicators are present. The Company’s reporting units are one level below the operating segments level. The reporting unit’s carrying value is compared to its fair value. The estimated fair values of the reporting units are determined using either the market approach, income approach or a combination of the market and income approach. Goodwill is considered impaired if the carrying value of the reporting unit exceeds its estimated fair value. The income approach uses expected future operating results and failure to achieve these expected results may cause a future impairment of goodwill at the reporting unit. If the carrying value of the reporting unit exceeds its estimated fair value, the second step of the goodwill impairment test is performed by comparing the carrying value of the goodwill in the reporting unit to its implied fair value. An impairment charge is recognized for the excess of the carrying value of goodwill over its implied estimated fair value. The Company conducts its annual goodwill impairment test as of October 31, 2014. See Note 5—“Goodwill” for results of the goodwill impairment test.
Intangible Assets. Intangible assets are carried at cost and amortized over their estimated useful lives, generally on a straight-line basis over one to eight years as the pattern of use is ratable. The Company reviews identifiable amortizable intangible assets to be held and used for impairment whenever events or changes in circumstances indicate that the carrying value of the assets may not be recoverable. Determination of recoverability is based on the lowest level of identifiable estimated undiscounted cash flows resulting from use of the asset and its eventual disposition. Measurement of any impairment loss is based on the excess of the carrying value of the asset over its fair value.
Investments in Equity Interests. Investments in the common stock of entities in which the Company can exercise significant influence but does not own a majority equity interest or otherwise control are accounted for using the equity method and are included as investments in equity interests on the consolidated balance sheets. The Company records its share of the results of these companies one quarter in arrears within earnings in equity interests in the consolidated statements of income. Investments in privately held equity interests in which the Company cannot exercise significant influence are accounted for using the cost method of accounting.
The Company reviews its investments for other-than-temporary impairment whenever events or changes in business circumstances indicate that the carrying value of the investment may not be fully recoverable. Investments identified as having an indication of impairment are subject to further analysis to determine if the impairment is other-than-temporary and this analysis requires estimating the fair value of the investment. The determination of fair value of the investment involves considering factors such as the stock prices of public companies in which the Company has an equity investment, current economic and market conditions, the operating performance of the companies including current earnings trends and forecasted cash flows, and other company and industry specific information.
Operating and Capital Leases. The Company leases office space and data centers under operating leases and certain data center equipment under a capital lease agreement with original lease periods up to 12 years. Assets acquired under capital leases are amortized over the remaining lease term. Certain of the lease agreements contain rent holidays and rent escalation provisions. For purposes of recognizing these lease incentives on a straight-line basis over the term of the lease, the Company
96
Table of Contents
uses the date that the Company has the right to control the asset to begin amortization. Lease renewal periods are considered on a lease-by-lease basis and are generally not included in the period of straight-line recognition. For each of the years ended December 31, 2012, 2013 and 2014, the Company expensed $5 million of interest, which approximates the cash payments made for interest. As of December 31, 2013 and 2014, the Company had net lease obligations included in capital lease and other long-term liabilities on the consolidated balance sheets of $44 million and $47 million, respectively.
Income Taxes. Deferred income taxes are determined based on the differences between the financial reporting and tax bases of assets and liabilities and are measured using the currently enacted tax rates and laws. The Company records a valuation allowance against particular deferred income tax assets if it is more likely than not that those assets will not be realized. The provision for income taxes comprises the Company’s current tax liability and change in deferred income tax assets and liabilities.
Significant judgment is required in evaluating the Company’s uncertain tax positions and determining its provision for income taxes. The Company establishes liabilities for tax-related uncertainties based on estimates of whether, and the extent to which, additional taxes will be due. These liabilities are established when the Company believes that certain positions might be challenged despite its belief that its tax return positions are in accordance with applicable tax laws. The Company adjusts these liabilities in light of changing facts and circumstances, such as the closing of a tax audit, new tax legislation, developments in case law or interactions with the tax authorities. To the extent that the final tax outcome of these matters is different than the amounts recorded, such differences will affect the provision for income taxes in the period in which such determination is made. The provision for income taxes includes the effect of changes to liabilities for tax-related uncertainties that are considered appropriate, as well as the related net interest and penalties. Income taxes paid, net of refunds received, were $2.3 billion, $208 million, and $90 million in the years ended December 31, 2012, 2013, and 2014, respectively. Interest paid was not material in any of the years presented. See Note 16—“Income Taxes” for additional information.
Revenue Recognition. Revenue is generated from offerings, which include clicks on text-based links to advertisers’ Websites that appear primarily on search results pages (“search advertising”), the display of graphical and non-graphical advertisements (“display advertising”), and other sources. For revenue arrangements with multiple deliverables, the consideration is allocated based on the relative selling price for each deliverable. The selling price for each arrangement deliverable can be established based on vendor specific objective evidence (“VSOE”) or third-party evidence (“TPE”) if VSOE is not available. An estimate of selling price is used if neither VSOE nor TPE is available.
The Company recognizes revenue from search advertising on Yahoo Properties and Affiliate sites. Search revenue is recognized based on Paid Clicks. A Paid Click occurs when an end-user clicks on a sponsored listing on Yahoo Properties and Affiliate sites for which an advertiser pays on a per click basis. The Company’s Search Agreement with Microsoft provides for Microsoft to be the exclusive algorithmic and paid search services provider on Yahoo Properties on desktop computers and non-exclusive provider of such services on Affiliate sites and for mobile devices. In transitioned markets, the Company is entitled to receive 88 percent of the revenue generated from Microsoft’s services on Yahoo Properties (the “Revenue Share Rate”) and the Company is also entitled to receive 88 percent of the revenue generated from Microsoft’s services on Affiliate sites after the Affiliate’s share of revenue. As the Company is not the primary obligor in the arrangement with the advertisers and publishers, the amounts paid to Affiliates are recorded as a reduction of revenue. See Note 19—“Search Agreement with Microsoft Corporation” for a description of the Search Agreement with Microsoft.
97
Table of Contents
In non-transitioned markets during 2012 and 2013, the Company paid Affiliates TAC for the revenue generated from the search advertisements on the Affiliates’ Websites. The revenue derived from these arrangements was reported on a gross basis (before deducting the TAC paid to Affiliates, which is recorded as cost of revenue—TAC), as the Company continued to be the primary obligor to the advertisers.
The Company recognizes search revenue generated from mobile ads served through Yahoo Gemini from Yahoo Properties and Affiliate sites. The search revenue generated from mobile ads served through Yahoo Gemini that involve traffic supplied by Affiliates is reported gross of the TAC paid to Affiliates (reported as cost of revenue—TAC) as the Company performs the search service. Accordingly, the Company is considered the primary obligor to the advertisers who are the customers of the search advertising service. The Company also generates search revenue from a revenue sharing arrangement with Yahoo Japan for search technology and services and records the related revenue as reported.
The Company recognizes revenue from display advertising on Yahoo Properties and Affiliate sites as impressions of or clicks on display advertisements are delivered. Impressions are delivered when a sold advertisement appears in pages viewed by users. Clicks are delivered when a user clicks on a native advertisement. Arrangements for these services generally have terms of up to one year and in some cases the terms may be up to three years. For display advertising on Affiliate sites, the Company pays Affiliates for the revenue generated from the display of these advertisements on the Affiliate sites. Traffic acquisition costs (“TAC”) are payments made to third-party entities that have integrated the Company’s advertising offerings into their Websites or other offerings and payments made to companies that direct consumer and business traffic to Yahoo Properties. The display revenue derived from these arrangements that involve traffic supplied by Affiliates is reported gross of the TAC paid to Affiliates (reported as cost of revenue—TAC) when the Company is the primary obligor to the advertisers who are the customers of the display advertising service.
From time-to-time, the Company may offer customized display advertising solutions to advertisers. These customized display advertising solutions combine the Company’s standard display advertising with customized content, customer insights, and campaign analysis which are separate units of accounting. Due to the unique nature of these products, the Company may not be able to establish selling prices based on historical stand-alone sales or third-party evidence; therefore, the Company may use its best estimate to establish selling prices. The Company establishes best estimates within a range of selling prices considering multiple factors including, but not limited to, class of advertiser, size of transaction, seasonality, margin objectives, observed pricing trends, available online inventory, industry pricing strategies, and market conditions. The Company believes the use of the best estimates of selling price allows revenue recognition in a manner consistent with the underlying economics of the transaction.
Other revenue includes listings-based services revenue, transaction revenue, royalties, and fees revenue. Listings-based services revenue is generated from a variety of consumer and business listings-based services, including classified advertising such as Yahoo Local and other services. The Company recognizes listings-based services revenue when the services are performed. Transaction revenue is generated from facilitating commercial transactions through Yahoo Properties, principally from Yahoo Small Business, Yahoo Travel, and Yahoo Shopping. The Company recognizes transaction revenue when there is evidence that qualifying transactions have occurred. We also receive royalties from Yahoo Japan and Alibaba Group that are recognized when earned. Fees revenue consists of revenue generated from a variety of consumer and business fee-based services as well as services for small businesses. The Company recognizes fees revenue when the services are performed.
98
Table of Contents
In all cases, revenue is recognized only when the price is fixed or determinable, persuasive evidence of an arrangement exists, the service is performed, and collectability of the related fee is reasonably assured. The Company’s arrangements generally do not include a provision for cancellation, termination, or refunds that would significantly impact revenue recognition.
The Company accounts for cash consideration given to customers, for which it does not receive a separately identifiable benefit and cannot reasonably estimate fair value, as a reduction of revenue.
Current deferred revenue is comprised of contractual billings in excess of recognized revenue and payments received in advance of revenue recognition. Long-term deferred revenue includes amounts received for which revenue will not be earned within the next 12 months.
Cost of revenue—TAC. TAC consists of payments made to third parties that have integrated the Company’s advertising offerings into their Websites or other offerings and payments made to companies that direct consumer and business traffic to Yahoo Properties. TAC is either recorded as a reduction of revenue or cost of revenue. TAC recorded as a reduction of revenue is related to the Microsoft arrangement. TAC recorded as cost of revenue—TAC relates to the Company’s other offerings. The Company enters into Affiliate agreements of varying duration that involve TAC. There are generally two economic structures of the Affiliate agreements: fixed payments with or without a guaranteed minimum amount of traffic delivered or variable payments based on a percentage of the Company’s revenue or based on a certain metric, such as the number of searches or paid clicks. The Company expenses TAC under two different methods. Agreements with fixed payments are expensed ratably over the term the fixed payment covers or as the traffic is delivered. Agreements based on a percentage of revenue, number of searches, or other metrics are expensed based on the volume of the underlying activity or revenue multiplied by the agreed-upon price or rate.
Cost of revenue—other. Cost of revenue-other consists of bandwidth costs, stock-based compensation, content, and other expenses associated with the production and usage of Yahoo Properties, including amortization of developed technology and patents. Cost of revenue—other also includes costs for Yahoo’s technology platforms and infrastructure, including depreciation expense of facilities and other operating costs, directly related to revenue generating activities.
Amortization of Intangibles. Amortization of customer, affiliate, and advertiser-related relationships and tradenames, trademarks and domain names are classified within amortization of intangibles. Amortization of developed technology and patents is included in cost of revenue—other.
Product Development. Product development expenses consist primarily of compensation-related expenses (including stock-based compensation expense) incurred for research and development, the development of, enhancements to, and maintenance and operation of Yahoo Properties, advertising products, technology platforms, and infrastructure. Depreciation expense, third-party technology and development expense, and other operating costs are also included in product development.
Advertising Costs. Advertising production costs are recorded as expense the first time an advertisement appears. Costs of advertising are recorded as expense as advertising space or airtime is used. All other advertising costs are expensed as incurred. Advertising expense totaled approximately $103 million, $128 million, and $142 million for 2012, 2013, and 2014, respectively.
Restructuring Charges. The Company has developed and implemented restructuring initiatives to improve efficiencies across the organization, reduce operating expenses, and/or better align its resources to market conditions. As a result of these plans, the Company has recorded restructuring charges comprised principally of employee severance and associated termination costs related to the reduction of its workforce, the consolidation of certain real estate facilities and data centers, losses on subleases, and contract termination costs. The Company’s restructuring plans include one-time
99
Table of Contents
termination benefits as well as certain contractual termination benefits or employee terminations under ongoing benefit arrangements. One-time termination benefits are recognized as a liability at estimated fair value when the approved plan of termination has been communicated to employees, unless employees must provide future service, in which case the benefits are recognized ratably over the future service period. Ongoing termination benefits arrangements are recognized as a liability at estimated fair value when the amount of such benefits becomes estimable and payment is probable. Contract termination costs are recognized at estimated fair value when the entity terminates the contract in accordance with the contract terms
These restructuring initiatives require management to make estimates in several areas including: (i) expenses for severance and other employee separation costs; (ii) realizable values of assets made redundant, obsolete, or excessive; and (iii) the ability to generate sublease income and to terminate lease obligations at the estimated amounts.
Stock-Based Compensation Expense. The Company recognizes stock-based compensation expense, net of an estimated forfeiture rate and therefore only recognizes compensation costs for those shares expected to vest over the service period of the award. Stock-based awards are valued based on the grant date fair value of these awards; the Company records stock-based compensation expense on a straight-line basis over the requisite service period, generally one to four years.
Calculating stock-based compensation expense related to stock options requires the input of highly subjective assumptions, including the expected term of the stock options, stock price volatility, and the pre-vesting forfeiture rate of stock awards. The Company estimates the expected life of options granted based on historical exercise patterns, which the Company believes are representative of future behavior. The Company estimates the volatility of its common stock on the date of grant based on the implied volatility of publicly traded options on its common stock, with a term of one year or greater. The Company believes that implied volatility calculated based on actively traded options on its common stock is a better indicator of expected volatility and future stock price trends than historical volatility. The assumptions used in calculating the fair value of stock-based awards represent the Company’s best estimates, but these estimates involve inherent uncertainties and the application of management judgment. As a result, if factors change and the Company uses different assumptions, the Company’s stock-based compensation expense could be materially different in the future. In addition, the Company is required to estimate the expected pre-vesting award forfeiture rate, as well as the probability that performance conditions that affect the vesting of certain awards will be achieved, and only recognizes expense for those shares expected to vest. The Company estimates the forfeiture rate based on historical experience of the Company’s stock-based awards that are granted and cancelled before vesting. See Note 14—“Employee Benefits” for additional information.
The Company uses the “with and without” approach in determining the order in which tax attributes are utilized. As a result, the Company recognizes a tax benefit from stock-based awards in additional paid-in capital only if an incremental tax benefit is realized after all other tax attributes currently available to the Company have been utilized. When tax deductions from stock-based awards are less than the cumulative book compensation expense, the tax effect of the resulting difference (“shortfall”) is charged first to additional paid-in capital, to the extent of the Company’s pool of windfall tax benefits, with any remainder recognized in income tax expense. The Company determined that it had a sufficient windfall pool available through the end of 2014 to absorb any shortfalls. In addition, the Company accounts for the indirect effects of stock-based awards on other tax attributes, such as the research tax credit, through the consolidated statements of income.
Recent Accounting Pronouncements. In April 2014, the Financial Accounting Standards Board (“FASB”) issued Accounting Standard Update (“ASU”) 2014-08, “Reporting of Discontinued Operations and Disclosures of Disposals of Components of an Entity,” which provides a narrower
100
Table of Contents
definition of discontinued operations than under existing U.S. GAAP. ASU 2014-08 requires that only a disposal of a component of an entity, or a group of components of an entity, that represents a strategic shift that has, or will have, a major effect on the reporting entity’s operations and financial results should be reported in the financial statements as discontinued operations. ASU 2014-08 also provides guidance on the financial statement presentations and disclosures of discontinued operations. The amendments in ASU 2014-08 are effective for all disposals of components of an entity that occur within annual periods beginning on or after December 15, 2014, and interim periods within annual periods beginning on or after December 15, 2015, with early application permitted. The Company is currently evaluating the effects, if any, that the adoption of this guidance will have on the Company’s financial position, results of operations and cash flows.
In May 2014, the Financial Accounting Standards Board (“FASB”) issued Accounting Standard Update (“ASU”) 2014-09, “Revenue from Contracts with Customers,” which supersedes the revenue recognition requirements in Topic 605, “Revenue Recognition” and requires entities to recognize revenue in a way that depicts the transfer of promised goods or services to customers in an amount that reflects the consideration to which the entity expects to be entitled in exchange for those goods or services. The amendments in ASU 2014-09 are effective for annual reporting periods beginning after December 15, 2016, including interim periods within that reporting period, with early application not permitted. The Company is currently evaluating the effects, if any, that the adoption of this guidance will have on the Company’s financial position, results of operations and cash flows.
Note 2 Marketable Securities Investments And Fair Value Disclosures
The following tables summarize the available-for-sale securities (in thousands):
| December 31, 2013 | ||||||||||||||||
| Cost Basis |
Gross Unrealized Gains |
Gross Unrealized Losses |
Estimated Fair Value |
|||||||||||||
| Government and agency securities | $ | 538,397 | $ | 65 | $ | (101 | ) | $ | 538,361 | |||||||
| Corporate debt securities, commercial paper, and bank certificates of deposit | 2,380,134 | 2,525 | (1,216 | ) | 2,381,443 | |||||||||||
| Corporate equity securities | 230 | 153 | — | 383 | ||||||||||||
|
|
|
|
|
|
|
|
|
|||||||||
| Total available-for-sale marketable securities |
$ | 2,918,761 | $ | 2,743 | $ | (1,317 | ) | $ | 2,920,187 | |||||||
|
|
|
|
|
|
|
|
|
|||||||||
| December 31, 2014 | ||||||||||||||||
| Cost Basis |
Gross Unrealized Gains |
Gross Unrealized Losses |
Estimated Fair Value |
|||||||||||||
| Government and agency securities | $ | 850,712 | $ | 82 | $ | (792 | ) | $ | 850,002 | |||||||
| Corporate debt securities, commercial paper, time deposits, and bank certificates of deposit | 6,711,683 | 612 | (4,653 | ) | 6,707,642 | |||||||||||
| Alibaba Group equity securities | 2,713,484 | 37,154,305 | — | 39,867,789 | ||||||||||||
| Hortonworks equity securities | 26,246 | 77,783 | — | 104,029 | ||||||||||||
| Other corporate equity securities | 230 | 430 | — | 660 | ||||||||||||
|
|
|
|
|
|
|
|
|
|||||||||
| Total available-for-sale marketable securities |
$ | 10,302,355 | $ | 37,233,212 | $ | (5,445 | ) | $ | 47,530,122 | |||||||
|
|
|
|
|
|
|
|
|
|||||||||
101
Table of Contents
| December 31, | ||||||||
| 2013 | 2014 | |||||||
| Reported as: | ||||||||
| Short-term marketable securities |
$ | 1,330,304 | $ | 5,327,412 | ||||
| Long-term marketable securities |
1,589,500 | 2,230,892 | ||||||
| Investment in Alibaba Group |
— | 39,867,789 | ||||||
| Other long-term assets and investments |
383 | 104,029 | ||||||
|
|
|
|
|
|||||
| Total |
$ | 2,920,187 | $ | 47,530,122 | ||||
|
|
|
|
|
|||||
Short-term, highly liquid investments of $1.5 billion and $2.0 billion as of December 31, 2013 and 2014, respectively, included in cash and cash equivalents on the consolidated balance sheets are not included in the table above as the gross unrealized gains and losses were immaterial as the carrying value approximates fair value because of the short maturity of those instruments. Other than the pre-tax gain of $10.3 billion from the sale of 140 million American Depositary Shares (“ADSs”) of Alibaba Group in Alibaba Group’s initial public offering (“IPO”) on September 24, 2014, realized gains and losses from sales of available-for-sale marketable securities were not material for the years ended December 31, 2012, 2013 and 2014.
The remaining contractual maturities of available-for-sale marketable debt securities were as follows (in thousands):
| December 31, | ||||||||
| 2013 | 2014 | |||||||
| Due within one year | $ | 1,330,304 | $ | 5,327,412 | ||||
| Due after one year through three years | 1,589,500 | 2,230,892 | ||||||
|
|
|
|
|
|||||
| Total available-for-sale marketable securities |
$ | 2,919,804 | $ | 7,558,304 | ||||
|
|
|
|
|
|||||
The following tables show all available-for-sale marketable securities (excluding Alibaba Group and Hortonworks equity securities) in an unrealized loss position for which an other-than-temporary impairment has not been recognized and the related gross unrealized losses and fair value, aggregated by investment category and length of time that individual securities have been in a continuous unrealized loss position (in thousands):
| December 31, 2013 | ||||||||||||||||||||||||
| Less than 12 Months | 12 Months or Longer | Total | ||||||||||||||||||||||
| Fair Value |
Unrealized Loss |
Fair Value |
Unrealized Loss |
Fair Value |
Unrealized Loss |
|||||||||||||||||||
| Government and agency securities | $ | 263,514 | $ | (101 | ) | $ | — | $ | — | $ | 263,514 | $ | (101 | ) | ||||||||||
| Corporate debt securities, commercial paper, and bank certificates of deposit | 696,950 | (1,214 | ) | 3,833 | (2 | ) | 700,783 | (1,216 | ) | |||||||||||||||
|
|
|
|
|
|
|
|
|
|
|
|
|
|||||||||||||
| Total available-for-sale marketable securities |
$ | 960,464 | $ | (1,315 | ) | $ | 3,833 | $ | (2 | ) | $ | 964,297 | $ | (1,317 | ) | |||||||||
|
|
|
|
|
|
|
|
|
|
|
|
|
|||||||||||||
102
Table of Contents
| December 31, 2014 | ||||||||||||||||||||||||
| Less than 12 Months | 12 Months or Longer | Total | ||||||||||||||||||||||
| Fair Value |
Unrealized Loss |
Fair Value |
Unrealized Loss |
Fair Value |
Unrealized Loss |
|||||||||||||||||||
| Government and agency securities | $ | 744,948 | $ | (792 | ) | $ | — | $ | — | $ | 744,948 | $ | (792 | ) | ||||||||||
| Corporate debt securities, commercial paper, and bank certificates of deposit | 2,601,288 | (4,646 | ) | 3,234 | (7 | ) | 2,604,522 | (4,653 | ) | |||||||||||||||
|
|
|
|
|
|
|
|
|
|
|
|
|
|
||||||||||||
| Total available-for-sale marketable securities |
$ | 3,346,236 | $ | (5,438 | ) | $ | 3,234 | $ | (7 | ) | $ | 3,349,470 | $ | (5,445 | ) | |||||||||
|
|
|
|
|
|
|
|
|
|
|
|
|
|
||||||||||||
The Company’s investment portfolio includes equity securities, including Alibaba Group and Hortonworks, as well as liquid high-quality fixed income debt securities including government, agency and corporate debt, money market funds, and time deposits with financial institutions. The fair value of any equity investment will vary over time and is subject to a variety of market risks including: macro-economic, regulatory, industry, company performance, and systemic risks of the equity markets overall. Consequently, the carrying value of the Company’s investment portfolio will vary over time as the value of its investment changes. Investments in both fixed rate and floating rate interest earning instruments carry a degree of interest rate risk. Fixed rate securities may have their fair value adversely impacted due to a rise in interest rates, while floating rate securities may produce less income than expected if interest rates fall. Fixed income securities may have their fair value adversely impacted due to a deterioration of the credit quality of the issuer. The longer the term of the securities, the more susceptible they are to changes in market rates. Investments are reviewed periodically to identify possible other-than-temporary impairment. The Company has no current requirement or intent to sell the securities in an unrealized loss position. The Company expects to recover up to (or beyond) the initial cost of investment for securities held.
The following table sets forth the financial assets and liabilities, measured at fair value, by level within the fair value hierarchy as of December 31, 2013 (in thousands):
| Fair Value Measurements at Reporting Date Using | ||||||||||||
| Assets | Level 1 | Level 2 | Total | |||||||||
| Money market funds(1) | $ | 936,438 | $ | — | $ | 936,438 | ||||||
| Available-for-sale marketable securities: | ||||||||||||
| Government and agency securities(1) |
— | 876,197 | 876,197 | |||||||||
| Commercial paper and bank certificates of deposit(1) |
— | 472,080 | 472,080 | |||||||||
| Corporate debt securities(1) |
— | 2,059,159 | 2,059,159 | |||||||||
| Time deposits(1) |
— | 84,443 | 84,443 | |||||||||
| Corporate equity securities(2) |
383 | — | 383 | |||||||||
| Foreign currency derivative contracts(3) | — | 214,041 | 214,041 | |||||||||
|
|
|
|
|
|
|
|||||||
| Financial assets at fair value |
$ | 936,821 | $ | 3,705,920 | $ | 4,642,741 | ||||||
| Liabilities |
||||||||||||
| Foreign currency derivative contracts(3) | — | (1,401 | ) | (1,401 | ) | |||||||
|
|
|
|
|
|
|
|||||||
| Total financial assets and liabilities at fair value |
$ | 936,821 | $ | 3,704,519 | $ | 4,641,340 | ||||||
|
|
|
|
|
|
|
|||||||
103
Table of Contents
The following table sets forth the financial assets and liabilities, measured at fair value, by level within the fair value hierarchy as of December 31, 2014 (in thousands):
| Fair Value Measurements at Reporting Date Using | ||||||||||||||||
| Assets | Level 1 | Level 2 | Level 3 | Total | ||||||||||||
| Money market funds(1) | $ | 373,822 | $ | — | $ | — | $ | 373,822 | ||||||||
| Available-for-sale marketable debt securities: | ||||||||||||||||
| Government and agency securities(1) |
— | 850,002 | — | 850,002 | ||||||||||||
| Commercial paper and bank certificates of deposit(1) |
— | 3,602,321 | — | 3,602,321 | ||||||||||||
| Corporate debt securities(1) |
— | 3,327,017 | — | 3,327,017 | ||||||||||||
| Time deposits(1) |
— | 1,361,165 | — | 1,361,165 | ||||||||||||
| Available-for-sale equity securities: | ||||||||||||||||
| Other corporate equity securities |
660 | — | — | 660 | ||||||||||||
| Alibaba Group equity securities |
39,867,789 | — | — | 39,867,789 | ||||||||||||
| Hortonworks equity securities(2) |
104,029 | — | — | 104,029 | ||||||||||||
| Hortonworks warrants | — | — | 98,062 | 98,062 | ||||||||||||
| Foreign currency derivative contracts(3) | — | 202,928 | — | 202,928 | ||||||||||||
|
|
|
|
|
|
|
|
|
|||||||||
| Financial assets at fair value |
$ | 40,346,300 | $ | 9,343,433 | $ | 98,062 | $ | 49,787,795 | ||||||||
| Liabilities |
||||||||||||||||
| Foreign currency derivative contracts(3) | — | (6,157 | ) | — | (6,157 | ) | ||||||||||
|
|
|
|
|
|
|
|
|
|||||||||
| Total financial assets and liabilities at fair value |
$ | 40,346,300 | $ | 9,337,276 | $ | 98,062 | $ | 49,781,638 | ||||||||
|
|
|
|
|
|
|
|
|
|||||||||
| (1) | The money market funds, government and agency securities, commercial paper and bank certificates of deposit, corporate debt securities, and time deposits are classified as part of either cash and cash equivalents or short or long-term marketable securities on the consolidated balance sheets. |
| (2) | The Hortonworks equity securities are classified as part of the other long-term assets and investments on the consolidated balance sheets. |
| (3) | Foreign currency derivative contracts are classified as part of either current or noncurrent assets or liabilities on the consolidated balance sheets. The notional amounts of the foreign currency derivative contracts were $1.8 billion, including contracts designated as net investment hedges of $1.3 billion, as of December 31, 2013, and $2.1 billion, including contracts designated as net investment hedges of $1.6 billion, as of December 31, 2014. |
The amount of cash and cash equivalents as of December 31, 2013 and 2014 includes $569 million and $712 million, respectively, in cash deposits.
The fair values of the Company’s Level 1 financial assets and liabilities are based on quoted prices in active markets for identical assets or liabilities. The fair values of the Company’s Level 2 financial assets and liabilities are obtained using quoted prices for similar assets or liabilities in active markets; quoted prices for identical or similar assets in markets that are not active; and inputs other than quoted prices (e.g., interest rates and yield curves). The Company utilizes a pricing service to assist in obtaining fair value pricing for the marketable debt securities. The fair value for the Company’s Level 3 financial asset was obtained using a Black-Scholes model.
104
Table of Contents
Activity between Levels of the Fair Value Hierarchy
During the years ended December 31, 2013 and 2014, the Company did not make any transfers between Level 1, Level 2 and Level 3 assets or liabilities.
Hortonworks
Prior to the December 12, 2014 initial public offering of Hortonworks, the Company held an approximate 16 percent interest with an investment balance of $26 million, which was accounted for as a cost method investment. Subsequent to the initial public offering, the Company owns 3.8 million unregistered shares, which represent a 9 percent ownership interest. These shares are subject to a 6-month lock-up agreement. As of December 31, 2014, the remaining lock-up is approximately five and a half months. These shares are accounted for as an available-for-sale security and have a fair value of $104 million as of December 31, 2014.
The Company also holds warrants that vested upon the initial public offering of Hortonworks, which entitle the Company to purchase an aggregate of 3.7 million shares of Hortonworks common stock upon exercise of the warrants. The Company holds 6.5 million preferred warrants that are exercisable for 3.25 million shares of common stock at an exercise price of $0.01 per share, as well as 0.5 million common warrants that are exercisable for 0.5 million shares of common stock at an exercise price of $8.46 per share. The Company determined the estimated value of the warrants using the Black-Scholes model. During the year ended December 31, 2014, the Company recorded a gain of $57 million upon the initial public offering of Hortonworks and a $41 million gain related to the mark to market of the warrants as of December 31, 2014, which were included within other income, net in the consolidated statements of income. Changes in the estimated fair value of the Hortonworks warrants will be recorded through other income, net in the Company’s consolidated statements of income.
Assets and Liabilities Measured at Fair Value on a Nonrecurring Basis
Convertible Senior Notes
In 2013, the Company issued $1.4375 billion aggregate principal amount of 0.00% Convertible Senior Notes due 2018 (the “Notes”). The Notes are carried at their original issuance value, net of unamortized debt discount, and are not marked to market each period. The approximate estimated fair value of the Notes as of December 31, 2013 and December 31, 2014 was $1.1 billion and $1.2 billion, respectively. The estimated fair value of the Notes was determined on the basis of quoted market prices observable in the market and is considered Level 2 in the fair value hierarchy. See Note 11—“Convertible Notes” for additional information related to the Notes.
Goodwill
The inputs used to measure the estimated fair value of goodwill are classified as a Level 3 fair value measurement due to the significance of unobservable inputs using company-specific information. The valuation methodology used to estimate the fair value of goodwill is discussed in Note 1—“Goodwill”.
Other Investments
As of December 31, 2013 and 2014, the Company held approximately $25 million and $82 million, respectively, of investments in equity securities of privately-held companies that are accounted for using the cost method. These investments are included within other long-term assets and investments on the consolidated balance sheets. Such investments are reviewed periodically for impairment using fair value measurements.
105
Table of Contents
Note 3 Consolidated Financial Statement Details
Prepaid Expenses and Other Current Assets
As of December 31, prepaid expenses and other current assets consisted of the following (in thousands):
| 2013 | 2014 | |||||||
| Prepaid expenses | $ | 103,100 | $ | 132,306 | ||||
| Deferred income taxes | 218,486 | 253,297 | ||||||
| Foreign currency forward and option contract assets | 214,041 | 122,648 | ||||||
| Other receivables non-trade | 37,404 | 83,464 | ||||||
| Other | 65,373 | 79,360 | ||||||
|
|
|
|
|
|||||
| Total prepaid expenses and other current assets |
$ | 638,404 | $ | 671,075 | ||||
|
|
|
|
|
|||||
Property and Equipment, Net
As of December 31, property and equipment, net consisted of the following (in thousands):
| 2013 | 2014 | |||||||
| Land | $ | 213,838 | $ | 215,740 | ||||
| Buildings | 697,874 | 780,688 | ||||||
| Leasehold improvements | 279,052 | 210,876 | ||||||
| Computers and equipment(1) | 1,512,860 | 1,839,033 | ||||||
| Capitalized software and labor | 766,368 | 658,762 | ||||||
| Furniture and fixtures | 61,280 | 74,992 | ||||||
| Assets not yet in use | 80,830 | 125,555 | ||||||
|
|
|
|
|
|||||
| 3,612,102 | 3,905,646 | |||||||
| Less: accumulated depreciation and amortization(2) | (2,123,584 | ) | (2,417,962 | ) | ||||
|
|
|
|
|
|||||
| Total property and equipment, net |
$ | 1,488,518 | $ | 1,487,684 | ||||
|
|
|
|
|
|||||
| (1) | Includes data center equipment acquired under a capital lease of approximately $44 million and $47 million as of December 31, 2013 and 2014, respectively. |
| (2) | Includes $33 million and $50 million of accumulated depreciation, and $12 million and $28 million of accumulated amortization related to the capital lease as of December 31, 2013 and 2014, respectively. |
106
Table of Contents
Other Long-Term Assets and Investments
As of December 31, other long-term assets and investments consisted of the following (in thousands):
| 2013 | 2014 | |||||||
| Deferred income taxes | $ | 23,222 | $ | 26,179 | ||||
| Investments in privately-held companies | 25,077 | 82,354 | ||||||
| Hortonworks equity securities and warrants | — | 202,091 | ||||||
| Foreign currency forward and option contracts | — | 80,280 | ||||||
| Other | 128,982 | 159,894 | ||||||
|
|
|
|
|
|||||
| Total other long-term assets and investments |
$ | 177,281 | $ | 550,798 | ||||
|
|
|
|
|
|||||
Other Accrued Expenses and Current Liabilities
As of December 31, other accrued expenses and current liabilities consisted of the following (in thousands):
| 2013 | 2014 | |||||||
| Accrued content, connection, traffic acquisition, and other costs | $ | 119,431 | $ | 172,913 | ||||
| Deferred income taxes | (10 | ) | 8,119 | |||||
| Accrued compensation and related expenses | 343,392 | 373,749 | ||||||
| Income taxes payable(*) | 107,033 | (264,993 | ) | |||||
| Accrued professional service expenses | 69,869 | 49,651 | ||||||
| Accrued sales and marketing related expenses | 17,744 | 16,424 | ||||||
| Accrued restructuring costs | 21,764 | 47,356 | ||||||
| Current liability for uncertain tax contingencies | — | 2,179 | ||||||
| Other | 228,559 | 265,909 | ||||||
|
|
|
|
|
|||||
| Total other accrued expenses and current liabilities |
$ | 907,782 | $ | 671,307 | ||||
|
|
|
|
|
|||||
| (*) | Income taxes payable reflect amounts owed to taxing authorities, net of tax payments and other credits resulting from current period deductions. The December 31, 2014 balance excludes the income taxes payable related to the sale of Alibaba Group ADSs, which is separately presented on the consolidated balance sheet. |
Deferred and Other Long-Term Tax Liabilities
As of December 31, deferred and other long-term tax liabilities consisted of the following (in thousands):
| 2013 | 2014 | |||||||
| Deferred and other income tax liabilities | $ | 172,491 | $ | 37,248 | ||||
| Long-term liability for uncertain tax contingencies(*) | 675,465 | 1,119,725 | ||||||
|
|
|
|
|
|||||
| Total deferred and other long-term tax liabilities |
$ | 847,956 | $ | 1,156,973 | ||||
|
|
|
|
|
|||||
| (*) | Includes interest and penalties. |
107
Table of Contents
Accumulated Other Comprehensive Income
As of December 31, the components of accumulated other comprehensive income were as follows (in thousands):
| 2013 | 2014 | |||||||
| Unrealized gains on available-for-sale securities, net of tax | $ | 15,101 | $ | 22,086,371 | ||||
| Unrealized gains on cash flow hedges, net of tax | 1,412 | 445 | ||||||
| Foreign currency translation, net of tax(*) | 301,876 | (67,188 | ) | |||||
|
|
|
|
|
|||||
| Accumulated other comprehensive income |
$ | 318,389 | $ | 22,019,628 | ||||
|
|
|
|
|
|||||
| (*) | The tax amounts disclosed on the statements of comprehensive income for 2012 and 2013 of $2 million and $20 million, respectively, for the foreign currency translation adjustments have been revised from amounts previously reported, which was less than $1 million for both years to include the tax impact of equity method investments. |
Noncontrolling Interests
As of December 31, noncontrolling interests were as follows (in thousands):
| 2013 | 2014 | |||||||
| Beginning balance of noncontrolling interests | $ | 45,403 | $ | 55,688 | ||||
| Distributions to noncontrolling interests | — | (22,344 | ) | |||||
| Net income attributable to noncontrolling interests | 10,285 | 10,411 | ||||||
|
|
|
|
|
|||||
| Ending balance of noncontrolling interests |
$ | 55,688 | $ | 43,755 | ||||
|
|
|
|
|
|||||
Other Income, Net
Other income, net for 2012, 2013, and 2014 were as follows (in thousands):
| Years Ended December 31, | ||||||||||||
| 2012 | 2013 | 2014 | ||||||||||
| Interest, dividend, and investment income | $ | 41,673 | $ | 57,544 | $ | 26,309 | ||||||
| Interest expense | (9,297 | ) | (14,319 | ) | (68,851 | ) | ||||||
| Gain related to the sale of Alibaba Group shares | 4,603,322 | — | — | |||||||||
| Gain on sale of Alibaba Group ADSs | — | — | 10,319,437 | |||||||||
| Gain on Hortonworks warrants | — | — | 98,062 | |||||||||
| Other income (expense), net | 12,141 | 132 | (5,518 | ) | ||||||||
|
|
|
|
|
|
|
|||||||
| Total other income, net |
$ | 4,647,839 | $ | 43,357 | $ | 10,369,439 | ||||||
|
|
|
|
|
|
|
|||||||
Interest, dividend, and investment income consists of income earned from cash in bank accounts, investments made in marketable debt securities and money market funds, and dividend income on the Alibaba Group Preference Shares prior to the redemption of such shares in May 2013.
108
Table of Contents
Interest expense is related to the Notes, interest expense on notes payable related to building obligations and capital lease obligations for data centers.
The Company recorded a pre-tax gain of approximately $4.6 billion in 2012 related to the sale to Alibaba Group of Alibaba Group shares and in 2014 the Company recorded a pre-tax gain of approximately $10.3 billion related to the sale of Alibaba Group ADSs in the IPO. See Note 8—“Investments in Equity Interests Accounted for Using the Equity Method of Accounting” for additional information.
The Company holds warrants that vested upon the December 12, 2014 initial public offering of Hortonworks, which entitle the Company to purchase an aggregate of 3.7 million shares of Hortonworks common stock upon exercise of the warrants. The Company holds 6.5 million preferred warrants that are exercisable for 3.25 million shares of common stock at an exercise price of $0.01 per share, as well as 0.5 million common warrants that are exercisable for 0.5 million shares of common stock at an exercise price of $8.46 per share. The Company determined the estimated fair value of the warrants using the Black-Scholes model. During the year ended December 31, 2014, the Company recorded a gain of $57 million upon the initial public offering of Hortonworks and a $41 million gain related to the mark to market of the warrants held as of December 31, 2014, which were included within other income, net in the consolidated statements of income. Changes in the estimated fair value of the Hortonworks warrants will be recorded through other income, net in the consolidated statements of income. See Note 2—“Marketable Securities, Investments and Fair Value Disclosures” for additional information.
Other income (expense), net consists of gains and losses from sales or impairments of marketable securities and/or investments in privately-held companies, foreign exchange gains and losses due to re-measurement of monetary assets and liabilities denominated in non-functional currencies, and unrealized and realized foreign currency transaction gains and losses, including gains and losses related to balance sheet hedges.
Reclassifications Out of Accumulated Other Comprehensive Income
Reclassifications out of accumulated other comprehensive income for the period ended December 31, 2012 were as follows (in thousands):
| Amount Reclassified from Accumulated Other Comprehensive Income |
Affected Line Item in the Statement of Income | |||||
| Realized losses on available-for-sale securities, net of tax | $ | 9,088 | Yahoo!’s share of earnings in equity method investments and Other income, net | |||
|
|
|
|||||
| Foreign currency translation adjustments (“CTA”): | ||||||
| Korea business closure CTA reclassification |
$ | (16,208 | ) | Restructuring charges, net | ||
| Alibaba Group Initial Repurchase related CTA reclassification, net of $68,130 in tax |
(120,978 | ) | Other income, net | |||
|
|
|
|||||
| Total foreign currency translation adjustments, net of tax | $ | (137,186 | ) | |||
|
|
|
|||||
| Total reclassifications for the period | $ | (128,098 | ) | |||
|
|
|
|||||
109
Table of Contents
Reclassifications out of accumulated other comprehensive income for the period ended December 31, 2013 were as follows (in thousands):
| Amount Reclassified from Accumulated Other Comprehensive Income |
Affected Line Item in the Statement of Income | |||||
| Realized gains on cash flow hedges, net of tax | $ | (2,080 | ) | Revenue | ||
| Realized gains on available-for-sale securities, net of tax | (796 | ) | Other income, net | |||
|
|
|
|||||
| Total reclassifications for the period | $ | (2,876 | ) | |||
|
|
|
|||||
Reclassifications out of accumulated other comprehensive income for the period ended December 31, 2014 were as follows (in thousands):
| Amount Reclassified from Accumulated Other Comprehensive Income |
Affected Line Item in the Statement of Income | |||||
| Realized gains on cash flow hedges, net of tax | $ | (5,259 | ) | Revenue | ||
| Realized gains on available-for-sale securities, net of tax | (2,218 | ) | Other income, net | |||
| Foreign currency translation adjustments (“CTA”): | ||||||
| Disposal of a portion of the investment in Alibaba Group, net of $30 million in tax |
(50,301 | ) | Other income, net | |||
|
|
|
|||||
| Total reclassifications for the period | $ | (57,778 | ) | |||
|
|
|
|||||
Note 4 Acquisitions And Dispositions
The following table summarizes acquisitions (including business combinations and asset acquisitions) completed during the three years ended December 31, 2014 (in millions):
| Purchase Price |
Goodwill | Amortizable Intangibles |
||||||||||
| 2012 | ||||||||||||
| All acquisitions |
$ | 7 | $ | 5 | $ | — | ||||||
| 2013 | ||||||||||||
| Tumblr |
$ | 990 | $ | 749 | $ | 263 | ||||||
| Other acquisitions |
$ | 279 | $ | 170 | $ | 95 | ||||||
| 2014 | ||||||||||||
| Flurry |
$ | 270 | $ | 195 | $ | 55 | ||||||
| BrightRoll |
$ | 583 | $ | 423 | $ | 113 | ||||||
| Other acquisitions |
$ | 66 | $ | 43 | $ | 18 | ||||||
110
Table of Contents
Transactions completed in 2012
All Acquisitions—Business Combinations. During the year ended December 31, 2012, the Company acquired two companies, which were accounted for as business combinations. The total purchase price for these acquisitions was $7 million. The total cash consideration of $7 million less cash acquired of $1 million resulted in a net cash outlay of $6 million. Of the total purchase price, $5 million was allocated to goodwill, $1 million to tangible assets and $1 million to cash acquired. Goodwill represents the excess of the purchase price over the fair value of the net tangible and intangible assets acquired and is not deductible for tax purposes.
Transactions completed in 2013
Tumblr. On June 19, 2013, the Company completed the acquisition of Tumblr, Inc. (“Tumblr”), a blog-hosting Website that allows users to post their own content as well as follow or re-blog posts made by other users. The acquisition of Tumblr brought a community of new users to the Yahoo Network.
The purchase price exceeded the fair value of the net tangible and identifiable intangible assets acquired and, as a result, the Company recorded goodwill in connection with this transaction. Under the terms of the agreement, the Company acquired all of the equity interests (including all outstanding vested options) in Tumblr. Tumblr stockholders and vested optionholders were paid in cash, outstanding Tumblr unvested options and restricted stock units were assumed and converted into equivalent awards covering Yahoo common stock and a portion of the Tumblr shares held by its founder were exchanged for Yahoo common stock.
The total purchase price of approximately $990 million consisted mainly of cash consideration. The allocation of the purchase price of the assets acquired and liabilities assumed based on their fair values was as follows (in thousands):
| Cash and marketable securities acquired | $ | 16,587 | ||
| Other tangible assets acquired | 76,566 | |||
| Amortizable intangible assets: | ||||
| Developed technology |
23,700 | |||
| Customer contracts and related relationships |
182,400 | |||
| Trade name |
56,500 | |||
| Goodwill | 748,979 | |||
|
|
|
|||
| Total assets acquired |
1,104,732 | |||
| Liabilities assumed | (114,521 | ) | ||
|
|
|
|||
| Total |
$ | 990,211 | ||
|
|
|
|||
In connection with the acquisition, the Company is recognizing stock-based compensation expense of $70 million over a period of up to four years. This amount is comprised of assumed unvested stock options and restricted stock units (which had an aggregate fair value of $29 million at the acquisition date), and Yahoo common stock issued to Tumblr’s founder (which had a fair value of $41 million at the acquisition date). The Yahoo common stock issued to Tumblr’s founder is subject to holdback and will be released over four years provided he remains an employee of the Company. In addition, the transaction resulted in cash consideration of $40 million to be paid to Tumblr’s founder over four years, also provided that he remains an employee of the Company. Such cash payments are being recognized as compensation expense over the four-year service period.
111
Table of Contents
The amortizable intangible assets have useful lives not exceeding six years and a weighted average useful life of six years. No amounts have been allocated to in-process research and development and $749 million has been allocated to goodwill. Goodwill represents the excess of the purchase price over the fair value of the net tangible and identifiable intangible assets acquired and is not deductible for tax purposes. This acquisition brings a community of users to the Yahoo Network by deploying Yahoo’s personalization technology and search infrastructure to deliver relevant content to the Tumblr user base.
Other Acquisitions—Business Combinations. During the year ended December 31, 2013, the Company acquired 25 other companies, which were accounted for as business combinations. The total aggregate purchase price for these other acquisitions was $279 million. The total cash consideration of $279 million less cash acquired of $2 million resulted in a net cash outlay of $277 million. The allocation of the purchase price of the assets and liabilities assumed based on their estimated fair values was $95 million to amortizable intangible assets, $2 million to cash acquired, $44 million to other tangible assets, $34 million to assumed liabilities, and the remainder of $170 million to goodwill. Goodwill represents the excess of the purchase price over the fair value of the net tangible and intangible assets acquired and is not deductible for tax purposes.
Transactions completed in 2014
Flurry. On August 25, 2014, the Company completed the acquisition of Flurry, Inc. (“Flurry”), a mobile data analytics company that optimizes mobile experiences for developers, marketers, and consumers. The combined scale of Yahoo and Flurry is expected to create more personalized and inspiring app experiences for users and enable more effective mobile advertising solutions for brands seeking to reach their audiences and gain cross-device insights.
The purchase price of $270 million exceeded the estimated fair value of the net tangible and identifiable intangible assets and liabilities acquired and, as a result, the Company recorded goodwill of $195 million in connection with this transaction. Under the terms of the agreement, the Company acquired all of the equity interests (including all outstanding vested options) in Flurry and Flurry stockholders and vested option holders were paid in cash. Outstanding Flurry unvested options were assumed and converted into equivalent awards for Yahoo common stock valued at $4 million, which is being recognized as stock-based compensation expense as the options vest over periods of up to four years.
The total purchase price of approximately $270 million consisted of cash consideration. The preliminary allocation of the purchase price of the assets acquired and liabilities assumed based on their estimated fair values was as follows (in thousands):
| Cash acquired | $ | 12,100 | ||
| Other tangible assets acquired | 52,260 | |||
| Amortizable intangible assets: | ||||
| Developed technology |
7,100 | |||
| Customer contracts and related relationships |
47,600 | |||
| Other |
720 | |||
| Goodwill | 195,294 | |||
|
|
|
|||
| Total assets acquired |
315,074 | |||
| Liabilities assumed | (45,404 | ) | ||
|
|
|
|||
| Total |
$ | 269,670 | ||
|
|
|
|||
112
Table of Contents
In connection with the acquisition, the Company issued restricted stock units to employees valued at $23 million, which is being recognized as stock-based compensation expense as the restricted stock units vest over four years related to continuing employment.
The amortizable intangible assets have useful lives not exceeding five years and a weighted average useful life of five years. No amounts have been allocated to in-process research and development and $195 million has been preliminarily allocated to goodwill. Goodwill represents the excess of the purchase price over the estimated fair value of the net tangible and identifiable intangible assets acquired and is not deductible for tax purposes.
BrightRoll. On December 12, 2014, the Company completed the acquisition of BrightRoll, Inc. (“BrightRoll”), a leading programmatic video advertising platform. The transaction will combine Yahoo’s premium-desktop and mobile video advertising inventory with BrightRoll’s programmatic video platform and publisher relationships to bring substantial value to advertisers on both platforms.
The purchase price of $583 million exceeded the estimated fair value of the net tangible and identifiable intangible assets and liabilities acquired and, as a result, the Company recorded goodwill of $423 million in connection with this transaction. Under the terms of the agreement, the Company acquired all of the equity interests (including all outstanding vested options) in BrightRoll and BrightRoll stockholders and vested option holders were paid in cash. Outstanding BrightRoll unvested options were assumed and converted into equivalent awards for Yahoo common stock valued at $25 million, which is being recognized as stock-based compensation expense as the options vest over periods of up to four years.
The total purchase price of approximately $583 million consisted mainly of cash consideration. The preliminary allocation of the purchase price of the assets acquired and liabilities assumed based on their estimated fair values was as follows (in thousands):
| Cash acquired | $ | 41,899 | ||
| Accounts receivable, net | 99,330 | |||
| Other tangible assets acquired | 55,548 | |||
| Amortizable intangible assets: | ||||
| Developed technology |
19,400 | |||
| Customer contracts and related relationships |
85,600 | |||
| Other |
8,100 | |||
| Goodwill | 422,695 | |||
|
|
|
|||
| Total assets acquired |
732,572 | |||
| Liabilities assumed | (149,625 | ) | ||
|
|
|
|||
| Total |
$ | 582,947 | ||
|
|
|
|||
In connection with the acquisition, the Company issued restricted stock units to employees valued at $78 million, which is being recognized as stock-based compensation expense as the restricted stock units vest over four years related to continuing employment. In addition, the transaction resulted in cash consideration of $54 million to be paid to BrightRoll’s founder over three years, also provided that he remains an employee of the Company. Such cash payments are being recognized as compensation expense over the three-year service period.
113
Table of Contents
The amortizable intangible assets have useful lives not exceeding seven years and a weighted average useful life of five years. No amounts have been allocated to in-process research and development and $423 million has been preliminarily allocated to goodwill. Goodwill represents the excess of the purchase price over the estimated fair value of the net tangible and identifiable intangible assets acquired and is not deductible for tax purposes.
Other Acquisitions—Business Combinations. During the year ended December 31, 2014, the Company acquired nine other companies, all of which were accounted for as business combinations. The total purchase price for these acquisitions was $66 million less cash acquired of $4 million, which resulted in a net cash outlay of $62 million. The preliminary purchase price allocation of the assets acquired and liabilities assumed based on their estimated fair values was $43 million allocated to goodwill, $18 million to amortizable intangible assets, $4 million to cash acquired, $9 million to other tangible assets, and $8 million to assumed liabilities.
The Company’s business combinations completed during the years ended December 2012, 2013, and 2014 did not have a material impact on the Company’s consolidated financial statements, and therefore actual and pro forma disclosures have not been presented.
Patent Sale and License Agreement
During 2014, the Company entered into a patent sale and license agreement for total cash consideration of $460 million. The total consideration was allocated based on the estimated relative fair value of each of the elements of the agreement: $61 million was allocated to the sale of patents (“Sold Patents”), $135 million to the license to existing patents (“Existing Patents”) and $264 million to the license of patents developed or acquired in the next five years (“Capture Period Patents”). The Company recorded $61 million as a gain on the Sold Patents during 2014. The gain on sale of these patents is recorded as a part of gains on sales of patents in the consolidated statements of income.
The Company recognized $43 million in revenue related to the Existing Patents and the Capture Period Patents during the year ended December 31, 2014. The amounts allocated to the license of the Existing Patents is recorded as revenue over the four year period when payments are due. The amounts allocated to the Capture Period Patents is recorded as revenue over the five year capture period.
Patent Sale Agreements
During 2013 and 2014, the Company entered into patent sale agreements with a wholly-owned affiliate of Alibaba Group pursuant to which the Company sold certain patents for aggregate consideration of $70 million and $23.5 million, respectively. The gains on sales of these patents are recorded as a part of gains on sales of patents in the consolidated statements of income.
During 2014, the Company entered into a patent sale agreement with Yahoo Japan pursuant to which the Company sold certain patents for aggregate consideration of $18 million. The gain on sale of these patents of $12 million is recorded as a part of gains on sales of patents in the consolidated statements of income.
114
Table of Contents
Note 5 Goodwill
The changes in the carrying amount of goodwill for the years ended December 31, 2013 and 2014 were as follows (in thousands):
| Americas(1) | EMEA(2) | Asia Pacific(3) | Total | |||||||||||||
| Net balance as of January 1, 2013 | $ | 2,870,031 | $ | 593,613 | $ | 363,105 | $ | 3,826,749 | ||||||||
| Acquisitions | 934,135 | 1,567 | 1,921 | 937,623 | ||||||||||||
| Goodwill impairment charge | — | (63,555 | ) | — | (63,555 | ) | ||||||||||
| Foreign currency translation adjustments | (1,832 | ) | 15,231 | (34,568 | ) | (21,169 | ) | |||||||||
|
|
|
|
|
|
|
|
|
|||||||||
| Net balance as of December 31, 2013 |
$ | 3,802,334 | $ | 546,856 | $ | 330,458 | $ | 4,679,648 | ||||||||
| Acquisitions and other | 533,894 | 110,203 | (607 | ) | 643,490 | |||||||||||
| Goodwill impairment charge | — | (79,135 | ) | (9,279 | ) | (88,414 | ) | |||||||||
| Foreign currency translation adjustments | (2,271 | ) | (46,109 | ) | (22,690 | ) | (71,070 | ) | ||||||||
|
|
|
|
|
|
|
|
|
|||||||||
| Net balance as of December 31, 2014 |
$ | 4,333,957 | $ | 531,815 | $ | 297,882 | $ | 5,163,654 | ||||||||
|
|
|
|
|
|
|
|
|
|||||||||
| (1) | Gross goodwill balances for the Americas segment were $2.9 billion as of January 1, 2013 and $4.3 billion as of December 31, 2014. |
| (2) | Gross goodwill balances for the EMEA segment were $1.1 billion as of both January 1, 2013 and $1.2 billion as of December 31, 2014. The EMEA segment includes accumulated impairment losses of $551 million as of January 1, 2013, and $630 million as of December 31, 2014. |
| (3) | Gross goodwill balances for the Asia Pacific (“APAC”) segment were $513 million as of January 1, 2013 and $457 million as of December 31, 2014. The APAC segment includes accumulated impairment losses of $150 million as of January 1, 2013 and $159 million as of December 31, 2014. |
Goodwill Impairment Testing
The fair values of the U.S. & Canada, Latin America, Europe, Taiwan, Hong Kong, and Australia & New Zealand reporting units were estimated using an average of a market approach and an income approach as this combination was deemed to be the most indicative of the Company’s estimated fair value in an orderly transaction between market participants and is consistent with the methodology used for the goodwill impairment test in prior years. In addition, the Company ensures that the fair values estimated under these two approaches are comparable with each other. The estimated fair value of the Tumblr reporting unit was estimated using the market approach and was deemed to be the most indicative of our estimated fair value in an orderly transaction between market participants. The estimated fair values of the Middle East and India & Southeast Asia reporting units were estimated using the income approach as the market approach yielded a much higher fair value and was not comparable with the income approach. Under the market approach, the Company utilizes publicly-traded comparable company information to determine revenue and earnings multiples that are used to value its reporting units adjusted for an estimated control premium. Under the income approach, the Company determines fair value based on estimated future cash flows of each reporting unit discounted by an estimated weighted-average cost of capital, reflecting the overall level of inherent risk of a reporting unit and the rate of return an outside investor would expect to earn. Determining the estimated fair value of a reporting unit is judgmental in nature and requires the use of significant estimates and assumptions, including selection of market comparables, estimated future cash flows, and discount rates.
115
Table of Contents
In 2014, as a result of the annual goodwill impairment test, the Company concluded that the carrying value of the Middle East reporting unit, included in the EMEA reportable segment, and the carrying value of the India & Southeast Asia reporting unit included in the Asia Pacific reportable segment both exceeded their respective fair values. As required by the second step of the impairment test, the Company performed an allocation of the fair value to all the assets and liabilities of the reporting unit, including identifiable intangible assets, based on their estimated fair values, to determine the implied fair value of goodwill. Accordingly, the Company recorded a goodwill impairment charge related to the Middle East and India & Southeast Asia reporting units of $79 million and $9 million, respectively, during the quarter ended December 31, 2014 for the difference between the carrying value of the goodwill in the reporting unit and its implied fair value with no goodwill remaining in either reporting unit. The impairment resulted from a decline in business conditions in the Middle East and India & Southeast Asia during the latter half of 2014.
For the Europe reporting unit, the percentage by which the estimated fair value exceeded the carrying value as of October 31, 2014 was 12 percent and the amount of goodwill allocated to the Europe reporting unit was $465 million. The key assumptions used for the 2014 goodwill impairment test for Europe were 1) revenue ex-TAC cumulative average growth rate of approximately 5 percent over the next 5 years, 2) adjusted EBITDA growth rate of 15 percent over the next five years, 3) discount rate of 11 percent, and 4) terminal value growth rate of 3 percent. Determining the fair value of a reporting unit is judgmental in nature and requires the use of estimates and key assumptions. It is reasonably possible that changes in judgments, assumptions and estimates the Company made in assessing the fair value of goodwill could cause the Company to consider some portion or all of the remaining goodwill of the Europe reporting unit to become impaired. In addition, a future decline in the overall European market conditions and/or changes in the Company’s market share in the European market could negatively impact the market comparables, estimated future cash flows and discount rates used in the market and income approaches to determine the fair value of the reporting unit and could result in an impairment charge in the foreseeable future.
In 2013, as a result of the annual goodwill impairment test, the Company concluded that the carrying value of the Middle East reporting unit, included in the EMEA reportable segment, exceeded its fair value. The Company recorded a goodwill impairment charge of approximately $64 million during the quarter ended December 31, 2013 for the difference between the carrying value of the goodwill in the reporting unit and its implied fair value with goodwill remaining of $77 million. The impairment resulted from a decline in business conditions in the Middle East during the latter half of 2013.
The estimated fair values of the Company’s other reporting units exceeded their estimated carrying values and therefore goodwill in those reporting units was not impaired.
Note 6 Intangible Assets, Net
The following table summarizes the Company’s intangible assets, net (in thousands):
| December 31, 2013 | ||||||||||||
| Gross Carrying Amount |
Accumulated Amortization(*) |
Net | ||||||||||
| Customer, affiliate, and advertiser related relationships | $ | 293,612 | $ | (87,794 | ) | $ | 205,818 | |||||
| Developed technology and patents | 261,435 | (120,936 | ) | 140,499 | ||||||||
| Trade names, trademarks, and domain names | 107,381 | (35,890 | ) | 71,491 | ||||||||
|
|
|
|
|
|
|
|||||||
| Total intangible assets, net |
$ | 662,428 | $ | (244,620 | ) | $ | 417,808 | |||||
|
|
|
|
|
|
|
|||||||
116
Table of Contents
| December 31, 2014 | ||||||||||||
| Gross Carrying Amount |
Accumulated Amortization(*) |
Net | ||||||||||
| Customer, affiliate, and advertiser related relationships | $ | 369,914 | $ | (88,318 | ) | $ | 281,596 | |||||
| Developed technology and patents | 206,422 | (83,748 | ) | 122,674 | ||||||||
| Trade names, trademarks, and domain names | 107,841 | (41,269 | ) | 66,572 | ||||||||
|
|
|
|
|
|
|
|||||||
| Total intangible assets, net |
$ | 684,177 | $ | (213,335 | ) | $ | 470,842 | |||||
|
|
|
|
|
|
|
|||||||
| (*) | Cumulative foreign currency translation adjustments, reflecting movement in the currencies of the underlying entities increased total intangible assets by approximately $19 million and $18 million as of December 31, 2013 and 2014, respectively. |
The intangible assets have estimated useful lives as follows:
| • | Customer, affiliate, and advertiser related relationships—four to eight years; |
| • | Developed technology and patents—one year to eight years; and |
| • | Trade names, trademarks, and domain names—one year to an indefinite life. |
The Company recognized amortization expense for intangible assets of $105 million, $97 million, and $132 million for 2012, 2013, and 2014, respectively, including $70 million, $52 million, and $65 million, respectively, included in cost of revenue-other. Based on the current amount of intangibles subject to amortization, the estimated amortization expense for each of the succeeding years is as follows: 2015: $130 million; 2016: $106 million; 2017: $97 million; 2018: $79 million; 2019: $42 million; and cumulatively thereafter: $1 million.
Note 7 Basic And Diluted Net Income Attributable To Yahoo! Inc. Common Stockholders Per Share
Basic and diluted net income attributable to Yahoo! Inc. common stockholders per share is computed using the weighted average number of common shares outstanding during the period, excluding net income attributable to participating securities (restricted stock units granted under the Directors’ Stock Plan (the “Directors’ Plan”)). Diluted net income per share is computed using the weighted average number of common shares and, if dilutive, potential common shares outstanding during the period. Potential common shares are calculated using the treasury stock method and consist of unvested restricted stock and shares underlying unvested restricted stock units, the incremental common shares issuable upon the exercise of stock options, and shares to be purchased under the 1996 Employee Stock Purchase Plan (the “Employee Stock Purchase Plan”). The Company calculates potential tax windfalls and shortfalls by including the impact of pro forma deferred tax assets.
The Company takes into account the effect on consolidated net income per share of dilutive securities of entities in which the Company holds equity interests that are accounted for using the equity method.
For 2012, 2013, and 2014, potentially dilutive securities representing approximately 39 million, 10 million, and 3 million shares of common stock, respectively, were excluded from the computation of diluted earnings per share for these periods because their effect would have been anti-dilutive.
The Company has the option to pay cash, issue shares of common stock or any combination thereof for the aggregate amount due upon conversion of the Notes. The Company’s intent is to settle the
117
Table of Contents
principal amount of the Notes in cash upon conversion. As a result, upon conversion of the Notes, only the amounts payable in excess of the principal amounts of the Notes are considered in diluted earnings per share under the treasury stock method.
The denominator for diluted net income per share for 2014 also does not include any effect from the note hedges. In future periods, the denominator for diluted net income per share will exclude any effect of the note hedges, if their effect would be anti-dilutive. In the event an actual conversion of any or all of the Notes occurs, the shares that would be delivered to the Company under the note hedges are designed to neutralize the dilutive effect of the shares that the Company would issue under the Notes. See Note 11—”Convertible Notes” for additional information.
The following table sets forth the computation of basic and diluted net income per share (in thousands, except per share amounts):
| Years Ended December 31, | ||||||||||||
| 2012 | 2013 | 2014 | ||||||||||
| Basic: | ||||||||||||
| Numerator: | ||||||||||||
| Net income attributable to Yahoo! Inc. |
$ | 3,945,479 | $ | 1,366,281 | $ | 7,521,731 | ||||||
| Less: Net income allocated to participating securities |
(56 | ) | (28 | ) | (68 | ) | ||||||
|
|
|
|
|
|
|
|||||||
| Net income attributable to Yahoo! Inc. common stockholders—basic |
$ | 3,945,423 | $ | 1,366,253 | $ | 7,521,663 | ||||||
|
|
|
|
|
|
|
|||||||
| Denominator: | ||||||||||||
| Weighted average common shares |
1,192,775 | 1,052,705 | 987,819 | |||||||||
|
|
|
|
|
|
|
|||||||
| Net income attributable to Yahoo! Inc. common stockholders per share—basic |
$ | 3.31 | $ | 1.30 | $ | 7.61 | ||||||
|
|
|
|
|
|
|
|||||||
| Diluted: | ||||||||||||
| Numerator: | ||||||||||||
| Net income attributable to Yahoo! Inc. |
$ | 3,945,479 | $ | 1,366,281 | $ | 7,521,731 | ||||||
| Less: Net income allocated to participating securities |
(55 | ) | (28 | ) | (67 | ) | ||||||
| Less: Effect of dilutive securities issued by equity investees |
(4,920 | ) | (16,656 | ) | (43,689 | ) | ||||||
|
|
|
|
|
|
|
|||||||
| Net income attributable to Yahoo! Inc. common stockholders—diluted | $ | 3,940,504 | $ | 1,349,597 | $ | 7,477,975 | ||||||
|
|
|
|
|
|
|
|||||||
| Denominator: | ||||||||||||
| Denominator for basic calculation |
1,192,775 | 1,052,705 | 987,819 | |||||||||
| Weighted average effect of Yahoo! Inc. dilutive securities: |
||||||||||||
| Restricted stock units |
8,403 | 14,097 | 12,365 | |||||||||
| Stock options and employee stock purchase plan |
1,728 | 4,009 | 3,924 | |||||||||
|
|
|
|
|
|
|
|||||||
| Denominator for diluted calculation |
1,202,906 | 1,070,811 | 1,004,108 | |||||||||
|
|
|
|
|
|
|
|||||||
| Net income attributable to Yahoo! Inc. common stockholders per share—diluted |
$ | 3.28 | $ | 1.26 | $ | 7.45 | ||||||
|
|
|
|
|
|
|
|||||||
118
Table of Contents
Note 8 Investments In Equity Interests Accounted For Using The Equity Method Of Accounting
The following table summarizes the Company’s investments in equity interests as of December 31, 2013 (dollars in thousands):
| December 31, 2013 |
Percent Ownership |
|||||||
| Alibaba Group | $ | 1,018,126 | 24 | % | ||||
| Yahoo Japan | 2,399,590 | 35 | % | |||||
| Other | 8,631 | 19 | % | |||||
|
|
|
|||||||
| Total |
$ | 3,426,347 | ||||||
|
|
|
|||||||
The following table summarizes the Company’s investments in equity interests as of December 31, 2014 (dollars in thousands):
| December 31, 2014 |
Percent Ownership |
|||||||
| Yahoo Japan | $ | 2,482,660 | 35.5 | % | ||||
| Other | 6,918 | 20 | % | |||||
|
|
|
|||||||
| Total |
$ | 2,489,578 | ||||||
|
|
|
|||||||
Alibaba Group
Equity Investment in Alibaba Group. On October 23, 2005, the Company acquired approximately 46 percent of the outstanding ordinary shares of Alibaba Group in exchange for $1.0 billion in cash, the contribution of the Company’s China-based businesses (“Yahoo China”), and direct transaction costs of $8 million.
Prior to the initial public offering (“IPO”) by Alibaba Group of American Depositary Shares (“ADSs”), the Company’s investment in Alibaba Group was accounted for using the equity method, and the total investment, including net tangible assets, identifiable intangible assets and goodwill, was classified as part of investments in equity interests on the Company’s consolidated balance sheets. Prior to the IPO, the Company recorded its share of the results of Alibaba Group one quarter in arrears, within earnings in equity interests in the consolidated statements of income, including any related tax impacts related to the earnings in equity interest. As of December 31, 2013, the excess of carrying value of the Company’s investment in Alibaba Group and the Company’s proportionate share of the net assets of Alibaba Group was largely attributable to goodwill.
119
Table of Contents
The following table presents Alibaba Group’s U.S. GAAP financial information, as derived from the Alibaba Group financial statements (in thousands):
| Twelve Months Ended September 30, | ||||||||||||
| 2012 | 2013 | 2014(1) | ||||||||||
| Operating data: | ||||||||||||
| Revenue |
$ | 4,082,838 | $ | 6,734,978 | $ | 7,584,932 | ||||||
| Gross profit(2) |
$ | 2,764,314 | $ | 4,983,444 | $ | 5,592,862 | ||||||
| Income from operations(2) |
$ | 687,632 | $ | 3,236,733 | $ | 3,437,766 | ||||||
| Net income |
$ | 536,050 | $ | 2,847,139 | $ | 4,309,405 | ||||||
| Net income attributable to ordinary shareholders of Alibaba Group Holding Limited |
$ | 484,511 | $ | 2,809,429 | $ | 4,260,067 | ||||||
| September 30, 2013 |
June 30, 2014 |
|||||||
| Balance sheet data: | ||||||||
| Current assets |
$ | 7,994,731 | $ | 14,225,068 | ||||
| Long-term assets |
$ | 5,959,835 | $ | 11,973,248 | ||||
| Current liabilities |
$ | 4,838,510 | $ | 7,318,619 | ||||
| Long-term liabilities |
$ | 5,319,113 | $ | 8,828,663 | ||||
| Convertible preferred shares and other mezzanine equity |
$ | 1,688,889 | $ | 1,699,714 | ||||
| Noncontrolling interests |
$ | 92,127 | $ | 747,364 | ||||
| (1) | Data is for the nine months ended June 30, 2014. |
| (2) | For the twelve months ended September 30, 2013, certain amounts have been reclassified to conform to the current period presentation with no effect on previously reported net income or stockholders’ equity. |
From the date of its acquisition of its interest in Alibaba Group through the date of the Alibaba Group IPO, the Company has recorded, in retained earnings, cumulative earnings in equity interests, net of tax, of $1,078 million and $1,691 million as of December 31, 2013 and 2014, respectively.
Initial Repurchase by Alibaba Group. On September 18, 2012 (the “Repurchase Closing Date”), Alibaba Group repurchased 523 million of the 1,047 million ordinary shares of Alibaba Group (“Alibaba Group shares”) owned by the Company (the “Initial Repurchase”). The Initial Repurchase was made pursuant to the terms of the Share Repurchase and Preference Share Sale Agreement entered into by Yahoo! Inc., Alibaba Group and Yahoo! Hong Kong Holdings Limited (“YHK”), a wholly owned subsidiary of the Company, on May 20, 2012 (as amended on September 11, 2012, October 14, 2013 and July 14, 2014). Yahoo received $13.54 per Alibaba Group share, or approximately $7.1 billion in total consideration, for the 523 million Alibaba Group shares sold to Alibaba Group. Approximately $6.3 billion of the consideration was received in cash and $800 million was received in Alibaba Group Preference Shares, which Alibaba Group redeemed on May 16, 2013. During the six months ended June 30, 2013, the Company received cash dividends from Alibaba Group of $58 million related to the Alibaba Group Preference Shares. The Company recorded a pre-tax gain of approximately $4.6 billion for the year ended December 31, 2012.
On May 16, 2013, the Company received $846 million in cash from Alibaba Group to redeem the Alibaba Group Preference Shares. The cash received represented the redemption value, which
120
Table of Contents
included the stated value of $800 million plus accrued dividends of $46 million. Prior to their redemption, the Alibaba Group Preference Shares yielded semi-annual dividends at a rate per annum of up to 10 percent, with at least 3 percent payable in cash and the remainder accruing and increasing the liquidation preference.
Alibaba Group IPO. On September 24, 2014, Alibaba Group closed its IPO of ADSs. Each Alibaba Group ADS represents one ordinary share of Alibaba Group. YHK sold 140,000,000 Alibaba Group ADSs in the IPO at an initial public offering price of $68.00 per ADS. The Company received $9.4 billion (net of underwriting discounts, commissions, and fees of approximately $115 million) in cash for the 140 million Alibaba Group ADSs sold. The Company recorded a pre-tax gain of $10.3 billion (including a $1.3 billion gain reflecting the Company’s proportionate share of the proceeds from the IPO) for the year ended December 31, 2014, which is included in other income, net on the consolidated statements of income. The after-tax gain was approximately $6.3 billion. Following completion of the sale in the IPO, the Company retained 383,565,416 Alibaba Group ordinary shares, representing approximately 15 percent of Alibaba Group’s outstanding ordinary shares.
As of the date of the IPO, the Company no longer accounts for its remaining investment in Alibaba Group using the equity method and no longer records its proportionate share of Alibaba Group’s financial results in the consolidated financial statements. The Company reflects its remaining investment in Alibaba Group as an available-for-sale equity security on the consolidated balance sheet and adjusts the investment to fair value each quarterly reporting period with changes in fair value recorded within other comprehensive income (loss), net of tax. Also in connection with the IPO, each of Yahoo and YHK entered into a lock-up agreement with the underwriters restricting the sale of its remaining Alibaba Group shares for a period of one year, subject to certain exceptions. As of December 31, 2014, the remaining lock-up period is 8.5 months.
In connection with the IPO, Yahoo entered into a voting agreement with Alibaba Group, Jack Ma, Joe Tsai, SoftBank Corp., a Japanese corporation (“Softbank”) and certain other shareholders of Alibaba Group, pursuant to which Yahoo agreed to certain voting arrangements with respect to all of its Alibaba Group shares, including an agreement to vote for the director nominee of SoftBank and the director nominees of the Alibaba Partnership (a partnership comprised of members of management of Alibaba Group, one of its affiliates and/or certain companies with which Alibaba Group has a significant relationship). Yahoo also granted a proxy to Jack Ma and Joe Tsai, Alibaba Group’s executive chairman and executive vice chairman, respectively, to vote, subject to certain exceptions, 121.5 million of the Company’s Alibaba Group shares or, if less, the remaining Alibaba Group shares then owned by the Company.
See Note 2—“Marketable Securities, Investments and Fair Value Disclosures” for additional information.
Technology and Intellectual Property License Agreement (the “TIPLA”). On the Repurchase Closing Date, the Company and Alibaba Group entered into an amendment of the existing TIPLA pursuant to which Alibaba Group made an initial payment to the Company of $550 million in satisfaction of certain future royalty payments under the existing TIPLA. As a result of the IPO, the TIPLA will terminate on September 18, 2015 and Alibaba Group’s obligation to make royalty payments under the TIPLA ceased on September 24, 2014. The royalty revenue recognized was approximately $86 million, $122 million, and $106 million for the years ended December 31, 2012, 2013 and 2014, respectively. The remaining initial TIPLA deferred revenue of $199 million is now being recognized ratably over the remaining term of the TIPLA, through September 18, 2015. For the years ended December 31, 2012, 2013, and 2014, the Company recognized approximately $39 million, $137 million, and $175 million, respectively, of the TIPLA deferred revenue.
121
Table of Contents
Yahoo Japan
During April 1996, the Company signed a joint venture agreement with Softbank, as amended in September 1997, which formed Yahoo Japan. Yahoo Japan was formed to establish and manage a local version of Yahoo in Japan.
The investment in Yahoo Japan is being accounted for using the equity method and the total investment, including net tangible assets, identifiable intangible assets, and goodwill, is classified as part of the investments in equity interests balance on the Company’s consolidated balance sheets. The Company records its share of the results of Yahoo Japan and any related amortization expense, one quarter in arrears, within earnings in equity interests in the consolidated statements of income.
The Company makes adjustments to the earnings in equity interests line in the consolidated statements of income for any differences between U.S. GAAP and International Financial Reporting Standards (“IFRS”), the standards by which Yahoo Japan’s financial statements are prepared.
The fair value of the Company’s ownership interest in the common stock of Yahoo Japan, based on the quoted stock price, was approximately $7 billion as of December 31, 2014.
During the years ended December 31, 2012, 2013 and 2014, the Company received cash dividends from Yahoo Japan in the amounts of $84 million, $77 million, and $84 million, net of withholding taxes, respectively, which were recorded as reductions to the Company’s investment in Yahoo Japan.
During the year ended December 31, 2014, the Company sold data center assets and assigned a data center lease to Yahoo Japan for cash proceeds of $11 million and recorded a net gain of approximately $5 million within general and administrative operating expenses.
The following tables present summarized financial information derived from Yahoo Japan’s consolidated financial statements, which are prepared on the basis of IFRS. The Company has made adjustments to the Yahoo Japan financial information to address differences between IFRS and U.S. GAAP that materially impact the summarized financial information below. Due to these adjustments, the Yahoo Japan summarized financial information presented below is not materially different than such information presented on the basis of U.S. GAAP.
| Twelve Months Ended September 30, | ||||||||||||
| 2012 | 2013 | 2014 | ||||||||||
| Operating data: | ||||||||||||
| Revenue |
$ | 4,242,623 | $ | 4,296,522 | $ | 4,046,412 | ||||||
| Gross profit |
$ | 3,594,633 | $ | 3,577,001 | $ | 3,262,450 | ||||||
| Income from operations |
$ | 2,189,323 | $ | 2,150,644 | $ | 1,896,368 | ||||||
| Net income |
$ | 1,313,494 | $ | 1,365,443 | $ | 1,236,583 | ||||||
| Net income attributable to Yahoo Japan |
$ | 1,308,539 | $ | 1,355,457 | $ | 1,225,221 | ||||||
122
Table of Contents
| September 30, | ||||||||
| 2013 | 2014 | |||||||
| Balance sheet data: | ||||||||
| Current assets |
$ | 6,318,156 | $ | 6,161,126 | ||||
| Long-term assets |
$ | 1,728,912 | $ | 1,908,379 | ||||
| Current liabilities |
$ | 1,992,508 | $ | 1,948,540 | ||||
| Long-term liabilities |
$ | 56,762 | $ | 35,418 | ||||
| Noncontrolling interests |
$ | 74,754 | $ | 66,998 | ||||
Since acquiring its equity interest in Yahoo Japan, the Company has recorded cumulative earnings in equity interests, net of dividends received and related taxes on dividends, of $2.8 billion and $3.3 billion as of December 31, 2013 and 2014, respectively.
Under technology and trademark license and other commercial arrangements with Yahoo Japan, the Company records revenue from Yahoo Japan based on a percentage of advertising revenue earned by Yahoo Japan. The Company recorded revenue from Yahoo Japan of approximately $281 million, $264 million, and $253 million, respectively, for the years ended December 31, 2012, 2013, and 2014. As of December 31, 2013 and 2014, the Company had net receivable balances from Yahoo Japan of approximately $42 million and $47 million, respectively.
Note 9 Foreign Currency Derivative Financial Instruments
The Company uses derivative financial instruments, primarily forward contracts and option contracts, to mitigate risk associated with adverse movements in foreign currency exchange rates.
The Company records all derivatives in the consolidated balance sheets at fair value, with assets included in prepaid expenses and other current assets or other long-term assets, and liabilities included in accrued expenses and other current liabilities or other long-term liabilities. The Company’s accounting treatment for these instruments is based on whether or not the instruments are designated as a hedging instrument. The effective portions of net investment hedges are recorded in other comprehensive income as a part of the cumulative translation adjustment. The effective portions of cash flow hedges are recorded in accumulated other comprehensive income until the hedged item is recognized in revenue on the consolidated statements of income when the underlying hedged revenue is recognized. Any ineffective portions of net investment hedges and cash flow hedges are recorded in other income, net on the Company’s consolidated statements of income. For balance sheet hedges, changes in the fair value are recorded in other income, net on the Company’s consolidated statements of income.
The Company enters into master netting arrangements, which are designed to reduce credit risk by permitting net settlement of transactions with the same counterparty. The Company presents its derivative assets and liabilities at their gross fair values on the consolidated balance sheets. However, under the master netting arrangements with the respective counterparties of the foreign exchange contracts, subject to applicable requirements, the Company is allowed to net settle transactions. The Company is not required to pledge, and is not entitled to receive, cash collateral related to these derivative transactions.
Designated as Hedging Instruments
Net Investment Hedges. The Company hedges, on an after-tax basis, a portion of its net investment in Yahoo Japan with forward contracts and option contracts to reduce the risk that its investment in
123
Table of Contents
Yahoo Japan will be adversely affected by foreign currency exchange rate fluctuations. The total of the after-tax net investment hedge was less than the Yahoo Japan investment balance as of both December 31, 2013 and 2014. As such, the net investment hedge was considered to be effective.
Cash Flow Hedges. The Company entered into foreign currency forward contracts designated as cash flow hedges of varying maturities through December 31, 2015. The cash flow hedges were considered to be effective as of December 31, 2013 and 2014. All of the forward contracts designated as cash flow hedges that were settled were reclassified to revenue within fiscal years 2013 and 2014, and the Company recognized the hedge forecasted revenue related to these contacts as of December 31, 2013 and 2014. All current outstanding cash flow hedges are expected to be reclassified into revenue during 2015. The Company did not enter into any cash flow hedges in the year ended December 31, 2012. For the years ended December 31, 2013 and 2014, the amounts recorded in Other income (expense), net as a result of hedge ineffectiveness and the discontinuance of cash flow hedges because the forecasted transactions were no longer probable of occurring was not material.
Not Designated as Hedging Instruments
Balance Sheet Hedges. The Company hedges certain of its net recognized foreign currency assets and liabilities with foreign exchange forward contracts to reduce the risk that its earnings and cash flows will be adversely affected by changes in foreign currency exchange rates. These derivative instruments hedge assets and liabilities, including intercompany transactions, which are denominated in foreign currencies.
Notional amounts of the Company’s outstanding derivative contracts as of December 31, 2012, 2013 and 2014 (in millions) were as follows:
| December 31, | ||||||||||||
| 2012 | 2013 | 2014 | ||||||||||
| Derivatives designated as hedging instruments: | ||||||||||||
| Net investment hedge forward and option contracts |
$ | 2,997 | $ | 1,341 | $ | 1,647 | ||||||
| Cash flow hedge forwards |
$ | — | $ | 56 | $ | 222 | ||||||
| Derivatives not designated as hedging instruments: | ||||||||||||
| Balance sheet hedges |
$ | 356 | $ | 393 | $ | 243 | ||||||
124
Table of Contents
Foreign currency derivative activity for the year ended December 31, 2013 was as follows (in millions):
| Beginning fair value |
Settlement | Gain (loss) recorded in other income, net |
Gain (loss) recorded in other comprehensive income |
Gain (loss) recorded in revenue |
Ending fair value |
|||||||||||||||||||
| Derivatives designated as hedging instruments: | ||||||||||||||||||||||||
| Net investment hedges |
$ | 3 | $ | (304 | ) | $ | — | $ | 510 | (*) | $ | — | $ | 209 | ||||||||||
| Cash flow hedges |
— | (2 | ) | 1 | 2 | 3 | 4 | |||||||||||||||||
| Derivatives not designated as hedging instruments: | ||||||||||||||||||||||||
| Balance sheet hedges |
(5 | ) | 17 | (12 | ) | — | — | — | ||||||||||||||||
| (*) | This amount does not reflect the tax impact of $193 million recorded during the twelve months ended December 31, 2013. The $317 million after tax impact of the gain recorded under other comprehensive income was included in accumulated other comprehensive income on the Company’s consolidated balance sheets. |
Foreign currency derivative activity for the year ended December 31, 2014 was as follows (in millions):
| Beginning Fair Value |
Settlement Payment (Receipt) |
Gain (Loss) Recorded in Other Income, Net |
Gain (Loss) Recorded in Other Comprehensive Income |
Gain (Loss) Recorded in Revenue |
Ending Fair Value |
|||||||||||||||||||
| Derivatives designated as hedging instruments: | ||||||||||||||||||||||||
| Net investment hedges |
$ | 209 | $ | (234 | ) | $ | — | $ | 210 | (*) | $ | — | $ | 185 | ||||||||||
| Cash flow hedges |
4 | (4 | ) | (1 | ) | 1 | 8 | 8 | ||||||||||||||||
| Derivatives not designated as hedging instruments: | ||||||||||||||||||||||||
| Balance sheet hedges |
— | (12 | ) | 16 | — | — | 4 | |||||||||||||||||
| (*) | This amount does not reflect the tax impact of $79 million recorded during the twelve months ended December 31, 2014. The $131 million after tax impact of the gain recorded within other comprehensive income was included in accumulated other comprehensive income on the Company’s consolidated balance sheets as of December 31, 2014. |
125
Table of Contents
Foreign currency derivative contracts balance sheet location and ending fair value was as follows (in millions):
| Balance Sheet Location |
December 31, 2013 |
December 31, 2014 |
||||||||
| Derivatives designated as hedging instruments: | ||||||||||
| Net investment hedges |
Asset(1) | $ | 209 | $ | 190 | |||||
| Liability(2) | $ | — | $ | (5 | ) | |||||
| Cash flow hedges |
Asset(1) | $ | 4 | $ | 8 | |||||
| Liability(2) | $ | — | $ | — | ||||||
| Derivatives not designated as hedging instruments: | ||||||||||
| Balance sheet hedges |
Asset(1) | $ | 1 | $ | 5 | |||||
| Liability(2) | $ | (1 | ) | $ | (1 | ) | ||||
| (1) | Included in prepaid expenses and other current assets or other long-term assets on the consolidated balance sheets. |
| (2) | Included in accrued expenses and other current liabilities or other long-term liabilities on the consolidated balance sheets. |
See the Foreign Currency and Derivative Financial Instruments section within Note 1—“The Company and Summary of Significant Accounting Policies” for additional information.
Note 10 Credit Agreement
On October 19, 2012, the Company entered into a credit agreement (the “Credit Agreement”) with Citibank, N.A., as Administrative Agent, and the other lenders party thereto from time to time. On October 10, 2013, the Company entered into Amendment No. 1 to the Credit Agreement. Amendment No. 1 extended the termination date of the Credit Agreement from October 18, 2013 to October 9, 2014. On October 9, 2014, the Company entered into Amendment No. 2. Amendment No. 2 extends the termination date of the Credit Agreement from October 9, 2014 to October 8, 2015. The Credit Agreement, as amended, continues to provide for a $750 million unsecured revolving credit facility, subject to increase by up to $250 million in accordance with its terms.
Borrowings under the Credit Agreement, as amended, will continue to bear interest at a rate equal to, at the option of the Company, either (a) a customary London interbank offered rate (a “Eurodollar Rate”), or (b) a customary base rate (a “Base Rate”), in each case plus an applicable margin. The applicable margins for borrowings under the Credit Agreement, as amended, will be based upon the leverage ratio of the Company and range from 1.00 percent to 1.25 percent with respect to Eurodollar Rate borrowings and 0 percent to 0.25 percent with respect to Base Rate borrowings.
As of December 31, 2014, the Company was in compliance with the financial covenants in the Credit Agreement and no amounts were outstanding.
Note 11 Convertible Notes
0.00% Convertible Senior Notes
As of December 31, 2014, the Company had $1.2 billion principal amount of Notes outstanding. In 2013, the Company issued the Notes. The Notes were sold under a purchase agreement, dated
126
Table of Contents
November 20, 2013, with J.P. Morgan Securities LLC and Goldman, Sachs & Co., as representatives of the several initial purchasers named therein (collectively, the “Initial Purchasers”). The Notes were sold to the Initial Purchasers for resale to qualified institutional buyers pursuant to Rule 144A under the Securities Act of 1933, as amended.
In connection with the issuance of the Notes, the Company entered into an indenture (the “Indenture”) with respect to the Notes with The Bank of New York Mellon Trust Company, N.A., as trustee. Under the Indenture, the Notes are senior unsecured obligations of Yahoo, the Notes do not bear regular interest. The Notes mature on December 1, 2018, unless previously purchased or converted in accordance with their terms prior to such date. The Company may not redeem Notes prior to maturity. However, holders of the Notes may convert them at certain times and upon the occurrence of certain events in the future, as outlined in the Indenture. Holders of the Notes who convert in connection with a “make-whole fundamental change,” as defined in the Indenture, may require Yahoo to purchase for cash all or any portion of their Notes at a purchase price equal to 100 percent of the principal amount, plus accrued and unpaid special interest as defined in the Indenture, if any. The Notes are convertible, subject to certain conditions, into shares of Yahoo common stock at an initial conversion rate of 18.7161 shares per $1,000 principal amount of Notes (which is equivalent to an initial conversion price of approximately $53.43 per share), subject to adjustment upon the occurrence of certain events. Certain corporate events described in the Indenture may increase the conversion rate for holders who elect to convert their Notes in connection with such corporate event should they occur. Upon conversion of the Notes, holders will receive cash, shares of Yahoo’s common stock, or a combination thereof, at Yahoo’s election. The Company’s intent is to settle the principal amount of the Notes in cash upon conversion. If the conversion value exceeds the principal amount, the Company will deliver shares of its common stock in respect to the remainder of its conversion obligation in excess of the aggregate principal amount (conversion spread). The conversion spread will be included in the denominator for the computation of diluted net income per common share, using the treasury stock method. As of December 31, 2014, none of the conditions allowing holders of the Notes to convert had been met.
In accounting for the issuance of the Notes, the Company separated the Notes into liability and equity components. The carrying amount of the liability component was calculated by measuring the estimated fair value of a similar liability that does not have an associated convertible feature. The carrying amount of the equity component representing the conversion option was determined by deducting the fair value of the liability component from the face value of the Notes as a whole. The excess of the principal amount of the liability component over its carrying amount (“debt discount”) is amortized to interest expense over the term of the Notes using the effective interest method with an effective interest rate of 5.26 percent per annum. The equity component is not remeasured as long as it continues to meet the conditions for equity classification.
In accounting for the transaction costs related to the Note issuance, the Company allocated the total amount incurred to the liability and equity components based on their relative values. Issuance costs attributable to the $1.2 billion liability component are being amortized to expense over the term of the Notes, and issuance costs attributable to the $306 million equity component were included with the equity component in stockholders’ equity. Additionally, the Company recorded a deferred tax liability of $37 million on a portion of the equity component transaction costs which are deductible for tax purposes.
127
Table of Contents
The Notes consist of the following (in thousands):
| Years Ended December 31, |
||||||||
| 2013 | 2014 | |||||||
| Liability component: | ||||||||
| Principal |
$ | 1,437,500 | $ | 1,437,500 | ||||
| Less: note discount |
(326,915 | ) | (267,077 | ) | ||||
|
|
|
|
|
|||||
| Net carrying amount | $ | 1,110,585 | $ | 1,170,423 | ||||
|
|
|
|
|
|||||
| Equity component(*) | $ | 305,569 | $ | 305,569 | ||||
|
|
|
|
|
|||||
| (*) | Recorded on the consolidated balance sheet within additional paid-in capital. |
The following table sets forth total interest expense recognized related to the Notes (in thousands):
| Years Ended December 31, |
||||||||
| 2013 | 2014 | |||||||
| Accretion of convertible note discount | $ | 4,846 | $ | 59,838 | ||||
|
|
|
|
|
|||||
The fair value of the Notes, which was determined based on inputs that are observable in the market (Level 2), and the carrying value of debt instruments (the carrying value excludes the equity component of the Notes classified in equity) was as follows (in thousands):
| December 31, 2013 | December 31, 2014 | |||||||||||||||
| Fair Value | Carrying Value | Fair Value | Carrying Value | |||||||||||||
| Convertible senior notes | $ | 1,111,473 | $ | 1,110,585 | $ | 1,175,240 | $ | 1,170,423 | ||||||||
Note Hedge Transactions and Warrant Transactions
The Company entered into note hedge transactions with certain option counterparties (the “Option Counterparties”) to reduce the potential dilution with respect to Yahoo’s common stock upon conversion of the Notes or offset any cash payment the Company is required to make in excess of the principal amount of converted Notes. For the year ended December 31, 2013, the Company paid $206 million for the note hedge transactions. Separately, the Company also entered into privately negotiated warrant transactions with the Option Counterparties giving them the right to purchase common stock from the Company. The warrant transactions will have a dilutive effect with respect to Yahoo’s common stock to the extent that the market price per share of its common stock exceeds the strike price of $71.24 per share of the warrants on or prior to the expiration date of the warrants. The warrants begin to expire in March 2019. For the year ended December 31, 2013, the Company received $125 million in proceeds from the issuance of warrants. The note hedges and warrants are not marked to market. The value of the note hedges and warrants were initially recorded in stockholders’ equity and continue to be classified as stockholders’ equity.
128
Table of Contents
Note 12 Commitments And Contingencies
Lease Commitments. The Company leases office space and data centers under operating and capital lease agreements with original lease periods of up to 12 years which expire between 2015 and 2025.
In May 2013, the Company entered into a 12-year operating lease agreement for four floors of the former New York Times building in New York City with a total expected minimum lease commitment of $125 million. The Company has the option to renew the lease for an additional five years.
In December 2014, the Company entered into a 10-year operating lease agreement for three buildings in Los Angeles, California with a total expected minimum lease commitment of $61 million. The Company has the option to renew the lease for two consecutive renewal terms of either five years or seven years each.
Rent expense for all operating leases was approximately $76 million, $77 million, and $86 million for 2012, 2013, and 2014, respectively.
Many of the Company’s leases contain one or more of the following options which the Company can exercise at the end of the initial lease term: (i) renewal of the lease for a defined number of years at the then fair market rental rate or at a slight discount to the fair market rental rate; (ii) purchase of the property at the then fair market value; or (iii) right of first offer to lease additional space that becomes available.
A summary of gross and net lease commitments as of December 31, 2014 was as follows (in millions):
| Gross Operating Lease Commitments |
Sublease Income |
Net Operating Lease Commitments |
||||||||||
| Years ending December 31, | ||||||||||||
| 2015 | $ | 141 | $ | (18 | ) | $ | 123 | |||||
| 2016 | 102 | (11 | ) | 91 | ||||||||
| 2017 | 74 | (8 | ) | 66 | ||||||||
| 2018 | 53 | (6 | ) | 47 | ||||||||
| 2019 | 43 | (3 | ) | 40 | ||||||||
| Due after 5 years | 142 | (3 | ) | 139 | ||||||||
|
|
|
|
|
|
|
|||||||
| Total gross and net lease commitments | $ | 555 | $ | (49 | ) | $ | 506 | |||||
|
|
|
|
|
|
|
|||||||
129
Table of Contents
| Capital Lease Commitment |
||||
| Years ending December 31, | ||||
| 2015 | $ | 19 | ||
| 2016 | 15 | |||
| 2017 | 10 | |||
| 2018 | 9 | |||
| 2019 | 5 | |||
| Due after 5 years | — | |||
|
|
|
|||
| Gross lease commitment | $ | 58 | ||
|
|
|
|||
| Less: interest | (11 | ) | ||
|
|
|
|||
| Net lease commitment included in other long-term liabilities | $ | 47 | ||
|
|
|
|||
Affiliate Commitments. The Company is obligated to make payments, which represent TAC, to its Affiliates. As of December 31, 2014, these commitments totaled $2,087 million, of which $505 million will be payable in 2015, $401 million will be payable in 2016, $400 million will be payable in 2017, $375 million will be payable in 2018, and $375 million will be payable in 2019, and $31 million will be payable thereafter.
Non-cancelable Obligations. The Company is obligated to make payments under various non-cancelable arrangements with vendors and other business partners, principally for marketing, bandwidth, co-location, and content arrangements. As of December 31, 2014, these commitments totaled $255 million, of which $148 million will be payable in 2015, $76 million will be payable in 2016, $18 million will be payable in 2017, $11 million will be payable in 2018, and $2 million will be payable in 2019.
Intellectual Property Rights. The Company is committed to make certain payments under various intellectual property arrangements of up to $21 million through 2023.
Other Commitments. In the ordinary course of business, the Company may provide indemnifications of varying scope and terms to customers, vendors, lessors, joint ventures and business partners, purchasers of assets or subsidiaries and other parties with respect to certain matters, including, but not limited to, losses arising out of the Company’s breach of agreements or representations and warranties made by the Company, services to be provided by the Company, intellectual property infringement claims made by third parties or, with respect to the sale, lease, or assignment of assets, or the sale of a subsidiary, matters related to the Company’s conduct of the business and tax matters prior to the sale, lease or assignment. In addition, the Company has entered into indemnification agreements with its directors and certain of its officers that will require the Company, among other things, to indemnify them against certain liabilities that may arise by reason of their status or service as directors or officers. The Company has also agreed to indemnify certain former officers, directors, and employees of acquired companies in connection with the acquisition of such companies. The Company maintains director and officer insurance, which may cover certain liabilities arising from its obligation to indemnify its current and former directors and officers, and former directors and officers of acquired companies, in certain circumstances. It is not possible to determine the aggregate maximum potential loss under these indemnification agreements due to the limited history of prior indemnification claims and the unique facts and circumstances involved in each particular agreement. Such indemnification agreements might not be subject to maximum loss clauses.
130
Table of Contents
Historically, the Company has not incurred material costs as a result of obligations under these agreements and it has not accrued any material liabilities related to such indemnification obligations in the Company’s consolidated financial statements.
As of December 31, 2014, the Company did not have any relationships with unconsolidated entities or financial partnerships, such as entities often referred to as structured finance or special purpose entities, established for the purpose of facilitating off-balance sheet arrangements or other contractually narrow or limited purposes. Accordingly, the Company is not exposed to any financing, liquidity, market, or credit risk that could arise if the Company had such relationships. In addition, the Company identified no variable interests currently held in entities for which it is the primary beneficiary.
See Note 19—“Search Agreement with Microsoft Corporation” for a description of the Search Agreement and License Agreement with Microsoft.
Legal Contingencies
Intellectual Property and General Matters. From time to time, third parties assert patent infringement claims against the Company. Currently, the Company is engaged in lawsuits regarding patent issues and has been notified of other potential patent disputes. In addition, from time to time, the Company is subject to other legal proceedings and claims in the ordinary course of business, including claims of alleged infringement of trademarks, copyrights, trade secrets, and other intellectual property rights, claims related to employment matters, and a variety of other claims, including claims alleging defamation, invasion of privacy, or similar claims arising in connection with the Company’s e-mail, message boards, photo and video sites, auction sites, shopping services, and other communications and community features.
Stockholder and Securities Matters. Since May 31, 2011, several related stockholder derivative suits were filed in the Santa Clara County Superior Court (“California Derivative Litigation”) and the U.S. District Court for the Northern District of California (“Federal Derivative Litigation”) purportedly on behalf of the Company against certain officers and directors of the Company and third parties. The California Derivative Litigation was filed by plaintiffs Cinotto, Lassoff, Zucker, and Koo, and consolidated under the caption In re Yahoo! Inc. Derivative Shareholder Litigation on June 24, 2011 and September 12, 2011. The Federal Derivative Litigation was filed by plaintiffs Salzman, Tawila, and Iron Workers Mid-South Pension Fund and consolidated under the caption In re Yahoo! Inc. Shareholder Derivative Litigation on October 3, 2011. The plaintiffs allege breaches of fiduciary duties, corporate waste, mismanagement, abuse of control, unjust enrichment, misappropriation of corporate assets, or contribution, and seek damages, equitable relief, disgorgement, and corporate governance changes in connection with Alibaba Group’s restructuring of its subsidiary Alipay.com Co., Ltd. (“Alipay”) and related disclosures. On June 7, 2012, the courts approved stipulations staying the California Derivative Litigation pending resolution of the Federal Derivative Litigation, and deferring the Federal Derivative Litigation pending a ruling on the motion to dismiss filed by the defendants in the related stockholder class actions, which are discussed below. On December 16, 2013, the U.S. District Court for the Northern District of California granted the Company’s motion to stay the Federal Derivative Litigation pending resolution of the appeal filed by the plaintiffs in the related stockholder class actions.
Since June 6, 2011, two purported stockholder class actions were filed in the U.S. District Court for the Northern District of California against the Company and certain officers and directors of the Company by plaintiffs Bonato and the Twin Cities Pipe Trades Pension Trust. In October 2011, the District Court consolidated the two actions under the caption In re Yahoo! Inc. Securities Litigation and appointed the Pension Trust Fund for Operating Engineers as lead plaintiff. In a consolidated
131
Table of Contents
amended complaint filed December 15, 2011, the lead plaintiff purports to represent a class of investors who purchased the Company’s common stock between April 19, 2011 and July 29, 2011, and alleges that during that class period, defendants issued statements that were materially false or misleading because they did not disclose information relating to Alibaba Group’s restructuring of Alipay. The complaint purports to assert claims for relief for violation of Section 10(b) and 20(a) of the Securities Exchange Act of 1934, as amended, and for violation of Rule 10b-5 thereunder, and seeks unspecified damages, injunctive and equitable relief, fees, and costs. On August 10, 2012, the court granted defendants’ motion to dismiss the consolidated amended complaint. Plaintiffs have appealed.
On March 14, 2014, a stockholder derivative action captioned Hughes Trust v. de Castro, et al. was filed in the Delaware Court of Chancery purportedly on behalf of Yahoo against current and former members of the Board of Directors and our former chief operating officer, Henrique de Castro. The plaintiff alleged that the directors who approved Mr. de Castro’s employment agreement in 2012 wasted corporate assets and breached their fiduciary duties by failing to adequately inform themselves about how much compensation Mr. de Castro would be entitled to receive. The plaintiff further alleged that the directors failed to provide adequate disclosure regarding Mr. de Castro’s compensation. The plaintiff asserted a claim against Mr. de Castro for unjust enrichment. Plaintiff was seeking unspecified damages and restitution in favor of Yahoo, an order directing Yahoo to reform its corporate governance and internal procedures, and attorneys’ fees and costs. On February 10, 2015, the court entered an order granting the plaintiff’s request to voluntary dismiss the action without prejudice.
Mexico Matters. On November 16, 2011, plaintiffs Worldwide Directories, S.A. de C.V. (“WWD”), and Ideas Interactivas, S.A. de C.V. (“Ideas”) filed an action in the 49th Civil Court of Mexico against the Company, Yahoo! de Mexico, S.A. de C.V. (“Yahoo! Mexico”), Yahoo International Subsidiary Holdings, Inc., and Yahoo Hispanic Americas LLC. The complaint alleged claims of breach of contract, breach of promise, and lost profits in connection with various commercial contracts entered into among the parties between 2002 and 2004, relating to a business listings service, and alleged total damages of approximately $2.75 billion. On December 7, 2011, Yahoo! Mexico filed a counterclaim against WWD for payments of approximately $2.6 million owed to Yahoo! Mexico for services rendered. On April 10, 2012, plaintiffs withdrew their claim filed against Yahoo International Subsidiary Holdings, Inc. and Yahoo Hispanic Americas LLC.
On November 28, 2012, the 49th Civil Court of Mexico entered a non-final judgment against the Company and Yahoo! Mexico in the amount of USD $2.75 billion and a non-final judgment in favor of Yahoo! Mexico on its counterclaim against WWD in the amount of $2.6 million. The judgment against the Company and Yahoo! Mexico purported to leave open for determination in future proceedings certain other alleged damages that were not quantified in the judgment.
On December 12, 2012 and December 13, 2012, respectively, Yahoo! Mexico and the Company appealed the judgment to a three-magistrate panel of the Superior Court of Justice for the Federal District (the “Superior Court”). On May 15, 2013, the Superior Court reversed the judgment, overturned all monetary awards against the Company and reduced the monetary award against Yahoo! Mexico to $172,500. The Superior Court affirmed the award of $2.6 million in favor of Yahoo! Mexico on its counterclaim.
Plaintiffs appealed the Superior Court’s decision to the Mexican Federal Civil Collegiate Court for the First Circuit (“Civil Collegiate Court”). The Company appealed the Superior Court’s decision not to award it statutory costs in the underlying proceeding. Yahoo! Mexico appealed the Superior Court’s award of $172,500, the Superior Court’s decision not to award it additional moneys beyond the $2.6 million award on its counterclaims, and the Superior Court’s decision not to award it statutory costs. On January 14, 2015, the Civil Collegiate Court denied all of the appeals.
132
Table of Contents
On February 16, 2015, plaintiffs filed a petition for review by the Supreme Court of Mexico, where review is limited to constitutional questions under Mexican law. The Company believes there is no basis for such review in the matter.
On September 10, 2014, the same plaintiffs in the Mexico litigation described above filed an action in U.S. District Court for the Southern District of New York against Yahoo! Inc., Yahoo! Mexico, Baker & McKenzie, and Baker & McKenzie, S.C. Plaintiffs allege that defendants conspired to influence the Mexican courts and “illegally obtain a favorable judgment” in the above litigation. Plaintiffs advance claims for relief under the Racketeer Influenced and Corrupt Organizations Act of 1970 (“RICO”), which provides for treble damages in certain cases, conspiracy to violate RICO, common-law fraud, and civil conspiracy. The complaint seeks unspecified damages. The Company and Yahoo! Mexico have filed a motion to dismiss the complaint. The Company believes the plaintiffs’ claims in this action are without merit.
The Company has determined, based on current knowledge, that the amount or range of reasonably possible losses, including reasonably possible losses in excess of amounts already accrued, is not reasonably estimable with respect to certain matters described above. The Company has also determined, based on current knowledge, that the aggregate amount or range of losses that are estimable with respect to the Company’s legal proceedings, including the matters described above other than the Mexico matters, would not have a material adverse effect on the Company’s consolidated financial position, results of operations or cash flows. Amounts accrued as of December 31, 2014 were not material. The Company did not accrue for the judgment in Mexico, which was reversed as explained above. The ultimate outcome of legal proceedings involves judgments, estimates and inherent uncertainties, and cannot be predicted with certainty. In the event of a determination adverse to Yahoo, its subsidiaries, directors, or officers in these matters, the Company may incur substantial monetary liability, and be required to change its business practices. Either of these events could have a material adverse effect on the Company’s financial position, results of operations, or cash flows. The Company may also incur substantial legal fees, which are expensed as incurred, in defending against these claims.
Note 13 Stockholders’ Equity
The Board has the authority to issue up to 10 million shares of preferred stock and to determine the price, rights, preferences, privileges, and restrictions, including voting rights, of those shares without any further vote or action by the stockholders.
Stock Repurchases. In May 2012, the Board authorized a stock repurchase program allowing the Company to repurchase up to an additional $5 billion of its outstanding shares of common stock. That repurchase program was exhausted during the first quarter of 2014. In November 2013, the Board authorized an additional stock repurchase program with an authorized level of $5 billion. The November 2013 program, according to its terms, will expire in December 2016. The aggregate amount remaining under the November 2013 repurchase program was approximately $930 million at December 31, 2014. Repurchases under the repurchase programs may take place in the open market or in privately negotiated transactions, including derivative transactions such as accelerated share repurchase transactions, and may be made under a Rule 10b5-1 plan.
In September and October 2014, the Company entered into two unrelated accelerated share repurchase agreements (“ASR”) with a financial institution to repurchase shares of its common stock. Under the September 2014 agreement, the Company prepaid $1.1 billion and approximately 15 million shares were initially delivered to the Company on September 30, 2014 and are included in treasury stock. Final settlement occurred on October 17, 2014, resulting in a total of approximately 23.5 million shares, inclusive of shares initially delivered, repurchased for $933 million, all of which are included in
133
Table of Contents
treasury stock. The Company received a return of cash for the remaining amount not settled in shares of $167 million. Under the October 2014 agreement, the Company prepaid the maximum repurchase amount of $1.0 billion and approximately 15 million shares were initially delivered on October 30, 2014. Final settlement occurred on December 9, 2014, resulting in a total of approximately 16 million shares, inclusive of shares initially delivered, repurchased for $800 million, all of which are included in treasury stock. The Company received a return of cash for the remaining amount not settled in shares of $200 million. Both ASR agreements were entered into pursuant to the Company’s existing share repurchase program.
The Company accounted for the September 2014 ASR as two separate transactions: (i) approximately 15 million shares of common stock initially delivered to the Company, and $600 million was accounted for as a treasury stock transaction and (ii) the remaining $500 million unsettled portion of the contract was determined to be a forward contract indexed to the Company’s own common stock. The initial delivery of approximately 15 million shares resulted in an immediate reduction, on the delivery date, of the outstanding shares used to calculate the weighted-average common shares outstanding for basic and diluted net income per share. The Company has determined that the forward contract, indexed to its common stock, met all of the applicable criteria for equity classification. The Company recorded $600 million as treasury stock and recorded $500 million, the implied value of the forward contract, in additional paid-in capital on the consolidated balance sheets as of September 30, 2014. As the remainder of the shares were delivered to the Company, in the fourth quarter of 2014, the forward contract was reclassified from additional paid-in capital to treasury stock for the value of the additional shares received, and additional paid-in capital was debited for the cash returned for the remaining amount of shares not settled.
During the year ended December 31, 2013, the Company repurchased approximately 129 million shares of its common stock under the May 2012 stock repurchase programs at an average price of $25.95 per share for a total of $3.3 billion. These repurchases included the Company’s repurchase of 40 million shares of its common stock beneficially owned by Third Point LLC on July 25, 2013. These shares were repurchased pursuant to a purchase agreement entered into on July 22, 2013, prior to the market opening for trading in Yahoo stock, and at $29.11 per share, which was the closing price of the Company’s common stock on July 19, 2013. The total purchase price for these shares was $1.2 billion. The repurchase transaction was funded primarily with cash as well as borrowings of $150 million under the Company’s unsecured revolving credit facility that have been repaid.
During the year ended December 31, 2014, in addition to the repurchase under the ASR’s, the Company repurchased approximately 62 million shares of its common stock under its stock repurchase program at an average price of $39.30 per share for a total of approximately $2.4 billion. As of December 31, 2014, the November 2013 program had remaining authorized purchase capacity of $930 million.
During the year ended December 31, 2013, the Company retired 198 million shares, resulting in reductions of $198,000 in common stock, $1.6 billion in additional paid-in capital, and $2.9 billion in retained earnings. During the year ended December 31, 2014, the Company retired 94 million shares, resulting in reductions of $94,000 in common stock, $795 million in additional paid-in capital, and $2.9 billion in retained earnings.
Note 14 Employee Benefits
Benefit Plans. The Company maintains the Yahoo! Inc. 401(k) Plan (the “401(k) Plan”) for its full-time employees in the U.S. The 401(k) Plan allows employees of the Company to contribute up to the Internal Revenue Code prescribed maximum amount. Employees may elect to contribute from 1 to 50 percent of their annual compensation to the 401(k) Plan. The Company matches employee
134
Table of Contents
contributions at a rate of 25 percent, up to the IRS prescribed amount. Both employee and employer contributions vest immediately upon contribution. During 2012, 2013, and 2014, the Company’s contributions to the 401(k) Plan amounted to approximately $19 million, $18 million, and $19 million, respectively. The Company also contributed approximately $22 million, $17 million, and $16 million to its other defined contribution retirement benefit plans outside of the U.S. for 2012, 2013, and 2014, respectively.
Stock Plans. The Stock Plan provides for the issuance of stock-based awards to employees, including executive officers, and consultants. The Stock Plan permits the granting of incentive stock options, non-statutory stock options, restricted stock, restricted stock units, stock appreciation rights, and dividend equivalents.
Options granted under the Stock Plan before May 19, 2005 generally expire 10 years after the grant date, and options granted after May 19, 2005 generally expire seven years after the grant date. Options generally become exercisable over a four-year period based on continued employment and vest either monthly, quarterly, semi-annually, or annually.
The Stock Plan permits the granting of restricted stock and restricted stock units (collectively referred to as “restricted stock awards”). The restricted stock award vesting criteria are generally the passing of time, meeting certain performance-based objectives, or a combination of both, and continued employment through the vesting period (which varies but generally does not exceed four years). Restricted stock award grants are generally measured at fair value on the date of grant based on the number of shares granted and the quoted price of the Company’s common stock. Such value is recognized as an expense over the corresponding service period.
The Stock Plan provides for the issuance of a maximum of 784 million shares of which 87 million shares were still available for award grant purposes as of December 31, 2014. Each share of the Company’s common stock issued in settlement of “full-value awards” (which include all awards other than options and stock appreciation rights) granted on or after June 25, 2009 under the Stock Plan counted as 1.75 shares against the Stock Plan’s share limit. Each share of the Company’s common stock issued in settlement of “full-value awards” granted on or after June 25, 2014 under the Stock Plan is counted as 2.5 shares against the Stock Plan’s share limit.
The Directors’ Plan provides for the grant of nonqualified stock options and restricted stock units to non-employee directors of the Company. The Directors’ Plan provides for the issuance of up to 9 million shares of the Company’s common stock, of which approximately 5 million were still available for award grant purposes as of December 31, 2014. Each share of the Company’s common stock issued in settlement of restricted stock units granted after the Company’s 2006 annual meeting of shareholders under the Directors’ Plan is counted as 1.75 shares against the Directors’ Plan’s share limit.
Options granted under the Directors’ Plan before May 25, 2006 generally become exercisable, based on continued service as a director, for initial grants to new directors, in equal monthly installments over four years, and for annual grants, with 25 percent of such options vesting on the one year anniversary of the date of grant and the remaining options vesting in equal monthly installments over the remaining 36-month period thereafter. Such options generally expire seven to 10 years after the grant date. Options granted on or after May 25, 2006 become exercisable, based on continued service as a director, in equal quarterly installments over one year. Such options generally expire seven years after the grant date.
Restricted stock units granted under the Directors’ Plan generally vest in equal quarterly installments over a one-year period following the date of grant and, once vested, are generally payable in an
135
Table of Contents
equal number of shares of the Company’s common stock on the earlier of the end of the one-year vesting period or the date the director ceases to be a member of the Board (subject to any deferral election that may be made by the director).
Non-employee directors are also permitted to elect an award of restricted stock units or a stock option under the Directors’ Plan in lieu of a cash payment of their quarterly Board retainer and any cash fees for serving on committees of the Board. Such stock options or restricted stock unit awards granted in lieu of cash fees are fully vested on the grant date.
From time to time, the Company also assumes stock-based awards in connection with corporate mergers and acquisitions, which awards become payable in shares of the Company’s common stock.
Employee Stock Purchase Plan. The Employee Stock Purchase Plan allows employees to purchase shares of the Company’s common stock through payroll deductions of up to 15 percent of their compensation subject to certain Internal Revenue Code limitations. Prior to November 2012, the price of common stock purchased under the plan was equal to 85 percent of the lower of the fair market value of the common stock on the commencement date of each 24-month offering period or the specified purchase date. Beginning in November 2012, the Employee Stock Purchase Plan was modified to consist of three-month offering periods. The price of the common stock purchased under the plan after November 2012 will be equal to 90 percent of the lower of the fair market value of the common stock on the commencement date of each three-month offering period or the specified purchase date. Beginning in the first quarter of 2015, the Company will discontinue the offering of the Employee Stock Purchase Plan to its employees.
The Employee Stock Purchase Plan provides for the issuance of a maximum of 75 million shares of common stock, of which 12 million shares were available as of December 31, 2014. For the years ended December 31, 2012, 2013, and 2014, stock-based compensation expense related to the activity under the plan was $31 million, $16 million, and $12 million, respectively. As of December 31, 2014, there was $2 million of unamortized stock-based compensation expense related to the Company’s Employee Stock Purchase Plan, which will be recognized over a weighted average period of 0.1 years.
136
Table of Contents
Stock Options. The Company’s Stock Plan, the Directors’ Plan, other stock-based awards assumed through acquisitions (including stock-based commitments related to continued service of acquired employees, such as the holdback by Yahoo of shares of Yahoo common stock issued to Tumblr’s founder in connection with the Company’s acquisition of Tumblr in June 2013) are collectively referred to as the “Plans.” Stock option activity under the Company’s Plans for the year ended December 31, 2014 is summarized as follows (in thousands, except years and per share amounts):
| Shares | Weighted Average Exercise Price per Share |
Weighted Average Remaining Contractual Life (in years) |
Aggregate Intrinsic Value |
|||||||||||||
| Outstanding at December 31, 2013(1) | 20,968 | $ | 20.43 | 4.20 | $ | 428,414 | ||||||||||
| Options granted(2) | 38 | $ | 40.05 | |||||||||||||
| Options assumed in acquisitions | 1,079 | $ | 16.75 | |||||||||||||
| Options exercised(3) | (9,970 | ) | $ | 22.17 | ||||||||||||
| Options expired | (812 | ) | $ | 22.00 | ||||||||||||
| Options cancelled/forfeited | (2,078 | ) | $ | 18.20 | ||||||||||||
|
|
|
|||||||||||||||
| Outstanding at December 31, 2014(1) | 9,225 | $ | 18.57 | 4.33 | $ | 274,072 | ||||||||||
|
|
|
|
|
|
|
|
|
|||||||||
| Vested and expected to vest at December 31, 2014(4) | 7,940 | $ | 17.56 | 4.29 | $ | 261,608 | ||||||||||
|
|
|
|
|
|
|
|
|
|||||||||
| Exercisable at December 31, 2014 | 4,031 | $ | 17.27 | 3.54 | $ | 134,001 | ||||||||||
|
|
|
|
|
|
|
|
|
|||||||||
| (1) | Includes shares subject to performance-based stock options for which performance goals had not been set as of the date shown. |
| (2) | Excludes tranches of previously granted performance-based stock options for which performance goals were set during the year ended December 31, 2014. |
| (3) | The Company generally issues new shares to satisfy stock option exercises. |
| (4) | The expected to vest options are the result of applying the pre-vesting forfeiture rate assumptions to total outstanding options. |
The weighted average grant date fair values of all options granted and assumed in the years ended December 31, 2012, 2013, and 2014 were $4.36, $18.72, and $31.31 per share, respectively.
The aggregate intrinsic value in the table above represents the total pre-tax intrinsic value (the aggregate difference between the closing stock price of the Company’s common stock on December 31, 2014 and the exercise price for in-the-money options) that would have been received by the option holders if all in-the-money options had been exercised on December 31, 2014.
The total intrinsic values of options exercised in the years ended December 31, 2012, 2013, and 2014 were $45 million, $122 million, and $167 million, respectively.
As of December 31, 2014, there was $34 million of unamortized stock-based compensation expense related to unvested stock options, which is expected to be recognized over a weighted average period of 2.0 years.
Cash received from option exercises and purchases of shares under the Employee Stock Purchase Plan for the year ended December 31, 2014 was $308 million.
137
Table of Contents
The total net tax benefit attributable to stock options exercised in the year ended December 31, 2014 was $51 million.
The fair value of option grants is determined using the Black-Scholes option pricing model with the following weighted average assumptions:
| Stock Options | Purchase Plan(5) | |||||||||||||||||||||||
| Years Ended December 31, | Years Ended December 31, | |||||||||||||||||||||||
| 2012 | 2013 | 2014 | 2012 | 2013 | 2014 | |||||||||||||||||||
| Expected dividend yield(1) | 0 | % | 0 | % | 0 | % | 0 | % | 0 | % | 0 | % | ||||||||||||
| Risk-free interest rate(2) | 0.6 | % | 0.7 | % | 1.4 | % | 0.4 | % | 0.1 | % | 0 | % | ||||||||||||
| Expected volatility(3) | 31.9 | % | 33.3 | % | 34.5 | % | 33.7 | % | 31.7 | % | 36.8 | % | ||||||||||||
| Expected life (in years)(4) | 4.02 | 3.60 | 3.83 | 1.21 | 0.25 | 0.25 | ||||||||||||||||||
| (1) | The Company currently has no history or expectation of paying cash dividends on its common stock in the near future. |
| (2) | The risk-free interest rate is based on the U.S. Treasury yield for a term consistent with the expected term of the awards in effect at the time of grant. |
| (3) | The Company estimates the volatility of its common stock at the date of grant based on the implied volatility of publicly traded options on its common stock, with a term of one year or greater. |
| (4) | The expected life of stock options granted under the Plans is based on historical exercise patterns, which the Company believes are representative of future behavior. New grants issued by the Company had an expected life of 4.00 years in 2012, 4.00 years in 2013, and 4.00 years in 2014. Options assumed in acquisitions had expected lives of less than 3 years. |
| (5) | Assumptions for the Employee Stock Purchase Plan relate to the annual average of the enrollment periods. During the year ended December 31, 2012, enrollment was permitted in May and November of each year. Beginning in 2013, enrollment was permitted in February, May, August, and November of each year. |
Restricted Stock and Restricted Stock Units. Restricted stock and restricted stock unit activity under the Plans for the year ended December 31, 2014 is summarized as follows (in thousands, except per share amounts):
| Shares | Weighted Average Grant Date Fair Value Per Share |
|||||||
| Awarded and unvested at December 31, 2013(1) | 49,584 | $ | 24.20 | |||||
| Granted(2) | 17,005 | $ | 39.18 | |||||
| Assumed in acquisitions | 277 | $ | 40.85 | |||||
| Vested | (18,959 | ) | $ | 20.31 | ||||
| Forfeited | (7,230 | ) | $ | 24.20 | ||||
|
|
|
|||||||
| Awarded and unvested at December 31, 2014(1) | 40,677 | $ | 32.38 | |||||
|
|
|
|
|
|||||
| (1) | Includes the maximum number of shares issuable under the Company’s performance-based restricted stock unit awards (including future-year tranches for which performance goals had not been set) as of the date shown. |
138
Table of Contents
| (2) | Includes the maximum number of shares issuable under the performance-based restricted stock unit awards granted during the year ended December 31, 2014 (including future-year tranches for which performance goals had not been set during the period); excludes tranches of previously granted performance-based restricted stock units for which performance goals were set during the year ended December 31, 2014. |
As of December 31, 2014, there was $743 million of unamortized stock-based compensation expense related to unvested restricted stock and restricted stock units, which is expected to be recognized over a weighted average period of 2.4 years.
The total fair value of restricted stock awards vested during the years ended December 31, 2012, 2013, and 2014 was $171 million, $220 million, and $415 million, respectively.
During the year ended December 31, 2014, 19.0 million shares that were subject to previously granted restricted stock units vested. These vested restricted stock awards were net share settled. The Company withheld 7.1 million shares based upon the Company’s closing stock price on the vesting date, to satisfy the Company’s tax withholding obligation relating to the employees’ minimum statutory obligation for the applicable income and other employment taxes. The Company then remitted cash to the appropriate taxing authorities.
Total payments for the employees’ tax obligations to the relevant taxing authorities were $281 million for the year ended December 31, 2014 and are reflected as a financing activity within the consolidated statements of cash flows. The payments were used for tax withholdings related to the net share settlements of restricted stock units and tax withholding related to the reacquisition of shares of restricted stock. The payments had the effect of share repurchases by the Company as they reduced the number of shares that would have otherwise been issued on the vesting date and were recorded as a reduction of additional paid-in capital.
In 2012, 2013, and 2014, $36 million, $64 million, and $150 million, respectively, of excess tax benefits from stock-based awards for options exercised and restricted stock awards that vested in current and prior periods were included as a source of cash flows from financing activities. These excess tax benefits represent the reduction in income taxes otherwise payable during the period, attributable to the actual gross tax benefits in excess of the expected tax benefits for options exercised and restricted stock awards that vested in current and prior periods. The Company has accumulated excess tax deductions relating to stock options exercised and restricted stock awards that vested prior to January 1, 2006 available to reduce income taxes otherwise payable. To the extent such deductions reduce income taxes payable in the current year, they are reported as financing activities in the consolidated statements of cash flows.
Performance-Based Executive Incentive Equity Awards.
CEO 2012 Annual Equity Awards. Marissa A. Mayer, the Company’s Chief Executive Officer, received an equity award for 2012 that will vest over three years. A total of $6 million of the grant date fair value of this equity award was granted as restricted stock units on July 26, 2012 and will vest over three years. The remaining portion of this equity award (valued at $6 million per the offer letter) was granted in November 2012 as a performance-based stock option that will vest over the two and a half years after July 26, 2012, subject to satisfaction of performance criteria. See below for additional discussion of the performance-based stock options.
After 2012, Ms. Mayer is eligible to receive annual equity grants when such grants are made to senior executives. Subject to the discretion of the Compensation and Leadership Development Committee of the Board of Directors (the “Compensation Committee”), the Company contemplates that the target value of such awards will not be less than the target value of her 2012 annual grant.
139
Table of Contents
CEO One-Time Retention Award. Ms. Mayer received a one-time retention equity award that vests over five years. A total of $15 million of the grant date fair value of this equity award was granted as restricted stock units on July 26, 2012 and vests over five years. The remaining portion of this equity award (valued at $15 million per the offer letter) was granted in November 2012 as a performance-based stock option that vests over the four and a half years after July 26, 2012, subject to satisfaction of performance criteria. The number of performance options granted in November 2012 was determined based on the grant date fair value as of July 26, 2012. See below for additional discussion of the performance-based stock options.
CEO Make-Whole Restricted Stock Units. To partially compensate Ms. Mayer for forfeiture of compensation from her previous employer, on July 26, 2012 she was granted restricted stock units with a grant-date fair value of $14 million (the “Make-Whole RSUs”). Based on grant date fair values, $4 million of the Make-Whole RSUs vested in 2012, $7 million vested in 2013, and $3 million vested in 2014.
Performance Options. The financial performance stock options awarded by the Company in November 2012 to Ms. Mayer and Mr. Goldman include multiple performance periods. The number of stock options that ultimately vest for each performance period will range from 0 percent to 100 percent of the target amount for such period stated in each executive’s award agreement based on the Company’s performance relative to goals. The financial performance goals are established at the beginning of each performance period and the portion (or “tranche”) of the award related to each performance period is treated as a separate grant for accounting purposes. In February 2014, the Compensation Committee established performance goals under these stock options for the 2014 performance year. The 2014 financial performance metrics (and their weightings) under the performance stock options are GAAP revenue (70 percent) and adjusted EBITDA (30 percent). The grant date fair value of the 2014 tranche of the November 2012 financial performance stock options was $38 million, and is being recognized over the twelve-month service period. The Company began recording stock-based compensation expense for this tranche in February 2014, when the financial performance goals were established.
Performance RSUs. In February 2014, the Compensation Committee approved additional annual financial performance-based restricted stock unit (“RSU”) awards to Ms. Mayer and other senior officers, and established the 2014 annual performance goals for these awards as well as for the similar performance-based RSUs granted in February 2013. The 2013 and 2014 performance-based RSU awards are generally eligible to vest in equal annual target amounts over four years (three years for Ms. Mayer) based on the Company’s attainment of annual financial performance goals as well as the executive’s continued employment through each vesting date. The number of shares that ultimately vest each year will range from 0 percent to 200 percent of the annual target amount, based on the Company’s performance. Annual financial performance metrics and goals are established for these RSU awards at the beginning of each year and the tranche of each RSU award related to that year’s performance goal is treated as a separate annual grant for accounting purposes. The 2014 financial performance metrics (and their weightings) established for the performance RSUs are: GAAP revenue (70 percent) and adjusted EBITDA (30 percent). The grant date fair value of the first tranche of the February 2014 performance RSUs was $9 million, and the grant date fair value of the second tranche of the February 2013 performance RSUs was $17 million. These values are being recognized over the tranches’ twelve-month service periods. The Company began recording stock-based compensation expense for these tranches in February 2014, when the financial performance goals were established.
140
Table of Contents
Note 15 Restructuring Charges, Net
Restructuring charges, net consists of employee severance pay and related costs, reversals of stock-based compensation expense, facility restructuring costs, contract termination and other non-cash charges associated with the exit of facilities, as well as reversals of restructuring charges arising from changes in estimates.
For the years ended December 31, 2012, 2013, and 2014, restructuring charges, net was comprised of the following (in thousands):
| Year Ended December 31, | ||||||||||||
| 2012 | 2013 | 2014 | ||||||||||
| Employee severance pay and related costs | $ | 139,623 | $ | 12,337 | $ | 30,749 | ||||||
| Non-cancelable lease, contract termination, and other charges | 27,785 | 15,822 | 79,317 | |||||||||
| Non-cash reversals of stock-based compensation expense | (3,429 | ) | — | — | ||||||||
| Other non-cash charges (credits), net | 109,896 | 547 | (3,394 | ) | ||||||||
| Changes in estimates and reversals of previous charges | (37,705 | ) | (24,940 | ) | (3,222 | ) | ||||||
|
|
|
|
|
|
|
|||||||
| Restructuring charges, net |
$ | 236,170 | $ | 3,766 | $ | 103,450 | ||||||
|
|
|
|
|
|
|
|||||||
Although the Company does not allocate restructuring charges to its segments, the amounts of the restructuring charges relating to each segment are presented below. For the years ended December 31, 2012, 2013, and 2014, restructuring charges, net consists of the following (in thousands):
| Year Ended December 31, | ||||||||||||
| 2012 | 2013 | 2014 | ||||||||||
| Americas | $ | 102,623 | $ | 571 | $ | 76,134 | ||||||
| EMEA | 45,360 | 2,862 | 25,612 | |||||||||
| Asia Pacific | 88,187 | 333 | 1,704 | |||||||||
|
|
|
|
|
|
|
|||||||
| Restructuring charges, net |
$ | 236,170 | $ | 3,766 | $ | 103,450 | ||||||
|
|
|
|
|
|
|
|||||||
The Company has implemented various restructuring plans to reduce its cost structure, align resources with its product strategy and improve efficiency, which have resulted in workforce reductions and the consolidation of certain real estate facilities and data centers.
141
Table of Contents
The Company’s restructuring accrual activity for the years ended December 31, 2013 and 2014 is summarized as follows (in thousands):
| Total | ||||
| Accrual balance as of December 31, 2012 | $ | 72,867 | ||
| Restructuring charges | 3,766 | |||
| Cash paid | (46,006 | ) | ||
| Foreign currency translation and other adjustments | (531 | ) | ||
|
|
|
|||
| Accrual Balance as of December 31, 2013 | $ | 30,096 | ||
| Restructuring charges | 103,450 | |||
| Cash paid | (52,301 | ) | ||
| Foreign currency translation and other adjustments | 2,363 | |||
|
|
|
|||
| Accrual Balance as of December 31, 2014 | $ | 83,608 | ||
|
|
|
|||
The $84 million restructuring liability as of December 31, 2014 consists of $16 million for employee severance expenses, which the Company expects to pay out by the end of the third quarter of 2015, and $68 million related to non-cancelable lease costs, which the Company expects to pay over the terms of the related obligations through the fourth quarter of 2021, less estimated sublease income.
As of December 31, restructuring accruals were included on the Company’s consolidated balance sheets as follows (in thousands):
| 2013 | 2014 | |||||||
| Accrued expenses and other current liabilities | $ | 21,741 | $ | 47,356 | ||||
| Other long-term liabilities | 8,355 | 36,252 | ||||||
|
|
|
|
|
|||||
| Total restructuring accruals |
$ | 30,096 | $ | 83,608 | ||||
|
|
|
|
|
|||||
As of December 31, restructuring accruals by segment consisted of the following (in thousands):
| 2013 | 2014 | |||||||
| Americas | $ | 18,078 | $ | 65,949 | ||||
| EMEA | 11,284 | 16,797 | ||||||
| Asia Pacific | 734 | 862 | ||||||
|
|
|
|
|
|||||
| Total restructuring accruals |
$ | 30,096 | $ | 83,608 | ||||
|
|
|
|
|
|||||
142
Table of Contents
Note 16 Income Taxes
The components of income before income taxes and earnings in equity interests are as follows (in thousands):
| Years Ended December 31, | ||||||||||||
| 2012 | 2013 | 2014 | ||||||||||
| United States | $ | 5,056,643 | $ | 538,824 | $ | 10,572,290 | ||||||
| Foreign | 157,564 | 94,459 | (59,909 | ) | ||||||||
|
|
|
|
|
|
|
|||||||
| Income before income taxes and earnings in equity interests |
$ | 5,214,207 | $ | 633,283 | $ | 10,512,381 | ||||||
|
|
|
|
|
|
|
|||||||
The provision for income taxes is composed of the following (in thousands):
| Years Ended December 31, | ||||||||||||
| 2012 | 2013 | 2014 | ||||||||||
| Current: | ||||||||||||
| United States federal |
$ | 2,278,759 | $ | 138,032 | $ | 3,067,395 | ||||||
| State |
361,788 | 49,872 | 454,261 | |||||||||
| Foreign |
68,816 | 49,790 | 50,573 | |||||||||
|
|
|
|
|
|
|
|||||||
| Total current provision for income taxes |
2,709,363 | 237,694 | 3,572,229 | |||||||||
|
|
|
|
|
|
|
|||||||
| Deferred: | ||||||||||||
| United States federal |
(741,628 | ) | (63,166 | ) | 348,887 | |||||||
| State |
(29,470 | ) | (22,498 | ) | 120,938 | |||||||
| Foreign |
1,778 | 1,362 | (3,952 | ) | ||||||||
|
|
|
|
|
|
|
|||||||
| Total deferred (benefit) provision for income taxes |
(769,320 | ) | (84,302 | ) | 465,873 | |||||||
|
|
|
|
|
|
|
|||||||
| Provision for income taxes |
$ | 1,940,043 | $ | 153,392 | $ | 4,038,102 | ||||||
|
|
|
|
|
|
|
|||||||
The provision for income taxes differs from the amount computed by applying the federal statutory income tax rate to income before income taxes and earnings in equity interests as follows (in thousands):
| Years Ended December 31, | ||||||||||||
| 2012 | 2013 | 2014 | ||||||||||
| Income tax at the U.S. federal statutory rate of 35 percent | $ | 1,824,973 | $ | 221,648 | $ | 3,679,333 | ||||||
| State income taxes, net of federal benefit | 237,637 | 23,000 | 400,824 | |||||||||
| Stock-based compensation expense | 19,946 | 16,015 | 8,132 | |||||||||
| Research tax credits | — | (18,036 | ) | (23,775 | ) | |||||||
| Effect of non-U.S. operations | (138,078 | ) | (47,968 | ) | (53,079 | ) | ||||||
| Settlement with tax authorities | (4,711 | ) | (46,943 | ) | (24,870 | ) | ||||||
| Remeasurement of prior year tax positions | — | (24,246 | ) | — | ||||||||
| Acquisition related non-deductible expenses | 1,894 | 9,296 | 16,881 | |||||||||
| Goodwill impairment charge | — | 22,244 | 30,945 | |||||||||
| Other | (1,618 | ) | (1,618 | ) | 3,711 | |||||||
|
|
|
|
|
|
|
|||||||
| Provision for income taxes |
$ | 1,940,043 | $ | 153,392 | $ | 4,038,102 | ||||||
|
|
|
|
|
|
|
|||||||
143
Table of Contents
Deferred income taxes reflect the tax effects of temporary differences between the carrying amounts of assets and liabilities for financial reporting purposes and the amounts used for income tax purposes. The components of deferred income tax assets and liabilities are as follows (in thousands):
| December 31, | ||||||||
| 2013 | 2014 | |||||||
| Deferred income tax assets: | ||||||||
| Net operating loss and tax credit carryforwards |
$ | 148,060 | $ | 156,385 | ||||
| Stock-based compensation expense |
66,583 | 55,951 | ||||||
| Non-deductible accrued expenses |
52,902 | 118,457 | ||||||
| Deferred revenue |
164,264 | 90,023 | ||||||
| Fixed assets |
22,937 | 18,059 | ||||||
| Federal benefits relating to tax positions |
214,208 | 320,185 | ||||||
| Other |
10,642 | 8,104 | ||||||
|
|
|
|
|
|||||
| Gross deferred income tax assets |
679,596 | 767,164 | ||||||
| Valuation allowance |
(36,690 | ) | (23,853 | ) | ||||
|
|
|
|
|
|||||
| Deferred income tax assets |
$ | 642,906 | $ | 743,311 | ||||
|
|
|
|
|
|||||
| Deferred income tax liabilities: | ||||||||
| Purchased intangible assets |
$ | (156,435 | ) | $ | (200,569 | ) | ||
| Fixed assets |
(86,641 | ) | (174,196 | ) | ||||
| Alibaba unrealized gains |
— | (16,154,906 | ) | |||||
| Basis difference in investments |
(323,368 | ) | (75,368 | ) | ||||
| Restructuring liabilities |
(7,235 | ) | (8,224 | ) | ||||
| Other |
— | (3,271 | ) | |||||
|
|
|
|
|
|||||
| Deferred income tax liabilities |
$ | (573,679 | ) | $ | (16,616,534 | ) | ||
|
|
|
|
|
|||||
| Net deferred income tax assets (liabilities) |
$ | 69,227 | $ | (15,873,223 | ) | |||
|
|
|
|
|
|||||
As of December 31, 2014, the Company’s federal and state net operating loss carryforwards for income tax purposes were approximately $303 million and $207 million, respectively. The federal and state net operating loss carryforwards are subject to various limitations under Section 382 of the Internal Revenue Code and applicable state tax law. If not utilized, the federal and state net operating loss carryforwards will begin to expire in 2021.
The Company accrued deferred tax liabilities of $16.2 billion associated with the Alibaba Group shares that it retained. Such deferred tax liabilities are subject to periodic adjustments due to changes in the fair value of the Alibaba Group shares. The Company estimates that it will pay taxes of approximately $3.3 billion in the three months ended March 31, 2015 related to YHK’s sale of Alibaba Group ADSs in the IPO on September 24, 2014.
On December 19, 2014, the Tax Increase Prevention Act of 2014 was signed into law, extending 2014 federal research and development credit. As such, the provision for income taxes for the year ended December 31, 2014 reflects the benefit of the 2014 federal research and development tax credit. The Company’s state research tax credit carryforward for income tax purposes is approximately $135 million and it can be carried forward indefinitely. Tax credit carryforwards that result from the
144
Table of Contents
exercise of employee stock options are not recorded on the Company’s consolidated balance sheets and are accounted for as a credit to additional paid-in capital if and when realized through a reduction in income taxes payable.
The Company has a valuation allowance of approximately $24 million as of December 31, 2014 against certain deferred income tax assets that are not more likely than not to be realized in future periods. In evaluating the Company’s ability to realize its deferred income tax assets, the Company considers all available positive and negative evidence, including operating results, ongoing tax planning, and forecasts of future taxable income on a jurisdiction by jurisdiction basis. The valuation allowance as of December 31, 2014 relates to foreign net operating loss carryforwards that will reduce the provision for income taxes if and when recognized.
In 2012, the Company made a one-time distribution of foreign earnings resulting in an overall net benefit of $117 million. During 2013, the Company recorded an additional net benefit of $36 million related to this distribution. In 2014, the Company recorded a detriment of $8 million to account for the corresponding adjustments from the IRS on foreign earnings available at the time of the 2012 repatriation. As of December 31, 2014, the Company does not anticipate a repatriation of its undistributed foreign earnings of approximately $2.9 billion. Those earnings are principally related to Yahoo Japan. If these earnings were to be repatriated in the future, the Company may be subject to additional U.S. income taxes (subject to an adjustment for foreign tax credits). It is not practicable to determine the income tax liability that might be incurred if these earnings were to be repatriated.
The total amount of gross unrecognized tax benefits was $1,024 million as of December 31, 2014, of which up to $706 million would affect the Company’s effective tax rate if realized. A reconciliation of the beginning and ending amount of unrecognized tax benefits in 2013 and 2014 is as follows (in thousands):
| 2012 | 2013 | 2014 | ||||||||||
| Unrecognized tax benefits balance at January 1 | $ | 532,862 | $ | 727,367 | $ | 695,285 | ||||||
| Gross increase for tax positions of prior years | 9,441 | 69,188 | 65,606 | |||||||||
| Gross decrease for tax positions of prior years | (32,513 | ) | (40,298 | ) | (9,954 | ) | ||||||
| Gross increase for tax positions of current year | 231,525 | 34,556 | 358,434 | |||||||||
| Settlements | (10,520 | ) | (94,640 | ) | (84,942 | ) | ||||||
| Lapse of statute of limitations | (3,428 | ) | (888 | ) | (803 | ) | ||||||
|
|
|
|
|
|
|
|||||||
| Unrecognized tax benefits balance at December 31 | $ | 727,367 | $ | 695,285 | $ | 1,023,626 | ||||||
|
|
|
|
|
|
|
|||||||
The remaining balances are recorded on the Company’s consolidated balance sheets as follows (in thousands):
| December 31, | ||||||||
| 2013 | 2014 | |||||||
| Total unrecognized tax benefits balance | $ | 695,285 | $ | 1,023,626 | ||||
| Amounts netted against related deferred tax assets | (89,048 | ) | (53,500 | ) | ||||
|
|
|
|
|
|||||
| Unrecognized tax benefits recorded on consolidated balance sheets | $ | 606,237 | $ | 970,126 | ||||
|
|
|
|
|
|||||
| Amounts classified as accrued expenses and other current liabilities | $ | — | $ | 2,179 | ||||
| Amounts classified as deferred and other long-term tax liabilities, net | 606,237 | 967,947 | ||||||
|
|
|
|
|
|||||
| Unrecognized tax benefits recorded on consolidated balance sheets | $ | 606,237 | $ | 970,126 | ||||
|
|
|
|
|
|||||
145
Table of Contents
The Company’s gross amount of unrecognized tax benefits as of December 31, 2014 increased by $328 million from the recorded balance as of December 31, 2013 primarily related to tax reserves associated with the sale of the Alibaba Group ADSs and foreign tax credits. The Company recognizes interest and/or penalties related to uncertain tax positions in income tax expense. To the extent accrued interest and penalties do not ultimately become payable, amounts accrued will be reduced and reflected as a reduction of the overall income tax provision in the period that such determination is made. During 2012, 2013 and 2014, interest and penalties recorded in the consolidated statements of income were a charge of $37 million, $21 million (net of interest received of $4 million) and $83 million, respectively. The amounts of accrued interest and penalties recorded on the consolidated balance sheets as of December 31, 2013 and 2014 were approximately $76 million and $159 million, respectively.
The Company is in various stages of examination and appeal in connection with our taxes both in the U.S. and in foreign jurisdictions. Those audits generally span tax years 2005 through 2012. As of December 31, 2014, the IRS Appeals division has finalized our protest of the 2007 and 2008 audit results, and the IRS exam team has finalized the examination of our 2009 and 2010 U.S. federal income tax returns. The Company does not plan to appeal the results of the IRS examination of our 2009 and 2010 U.S. federal income tax returns. The Company has protested the proposed California Franchise Tax Board’s adjustments to the 2005 through 2008 returns, but no conclusions have been reached to date. While it is difficult to determine when the examinations will be settled or their final outcomes, the Company believes that it has adequately provided for any reasonably foreseeable adjustment and that any settlement will not have a material adverse effect on its consolidated financial position, results of operations, or cash flows.
The Company may have additional tax liabilities in China related to the sale to Alibaba Group of 523 million Alibaba Group shares that took place during the year ended December 31, 2012 and related to the sale of the 140 million Alibaba Group ADSs sold in the IPO that took place during the three months ended September 30, 2014. Any taxes assessed and paid in China are expected to be ultimately offset and recovered in the U.S. through the use of foreign tax credits with respect to the sale in 2012. Any taxes assessed and paid in China are expected to be ultimately offset and recovered in the U.S. with respect to the sale in 2014 through the use of foreign tax credits to the extent there is sufficient foreign source income.
Tax authorities from the Brazilian State of Sao Paulo have assessed certain indirect taxes against the Company’s Brazilian subsidiary, Yahoo! do Brasil Internet Ltda., related to online advertising services. The assessment totaling approximately $120 million is for calendar years 2008 through 2011. The Company currently believes the assessment is without merit. The Company believes the risk of loss is remote and has not recorded an accrual for the assessment.
Note 17 Transactions With Related Parties
Revenue from related parties, excluding Yahoo Japan and Alibaba Group, represented approximately 1 percent of total revenue for the years ended December 31, 2012, 2013, and 2014. Management believes that the terms of the agreements with these related parties are comparable to the terms obtained in arm’s-length transactions with unrelated similarly situated customers of the Company.
See Note 8—“Investments in Equity Interests Accounted for Using the Equity Method of Accounting” for additional information related to transactions involving Yahoo Japan and Alibaba Group (a related party through September 24, 2014).
146
Table of Contents
Note 18 Segments
The Company continues to manage its business geographically. The primary areas of measurement and decision-making are Americas, EMEA (Europe, Middle East and Africa) and Asia Pacific. Management relies on an internal reporting process that provides revenue ex-TAC, which is defined as revenue less TAC, direct costs excluding TAC by segment, and consolidated income from operations for making decisions related to the evaluation of the financial performance of, and allocating resources to, the Company’s segments.
The following tables present summarized information by segment (in thousands):
| Years Ended December 31, | ||||||||||||
| 2012 | 2013 | 2014 | ||||||||||
| Revenue by segment: | ||||||||||||
| Americas |
$ | 3,461,633 | $ | 3,481,502 | $ | 3,517,861 | ||||||
| EMEA |
472,061 | 385,186 | 374,833 | |||||||||
| Asia Pacific |
1,052,872 | 813,692 | 725,439 | |||||||||
|
|
|
|
|
|
|
|||||||
| Total Revenue |
4,986,566 | 4,680,380 | 4,618,133 | |||||||||
| TAC by segment: | ||||||||||||
| Americas |
182,511 | 158,974 | 166,545 | |||||||||
| EMEA |
114,230 | 42,915 | 36,867 | |||||||||
| Asia Pacific |
222,165 | 52,553 | 14,119 | |||||||||
|
|
|
|
|
|
|
|||||||
| Total TAC |
518,906 | 254,442 | 217,531 | |||||||||
| Revenue ex-TAC by segment: | ||||||||||||
| Americas |
3,279,122 | 3,322,528 | 3,351,316 | |||||||||
| EMEA |
357,831 | 342,271 | 337,966 | |||||||||
| Asia Pacific |
830,707 | 761,139 | 711,320 | |||||||||
|
|
|
|
|
|
|
|||||||
| Total Revenue ex-TAC |
4,467,660 | 4,425,938 | 4,400,602 | |||||||||
| Direct costs by segment(1): | ||||||||||||
| Americas |
300,004 | 194,394 | 199,612 | |||||||||
| EMEA |
95,632 | 88,534 | 86,225 | |||||||||
| Asia Pacific |
181,632 | 196,832 | 198,806 | |||||||||
| Global operating costs(2)(3) | 2,214,222 | 2,461,883 | 2,652,305 | |||||||||
| Depreciation and amortization | 649,267 | 628,778 | 606,568 | |||||||||
| Goodwill impairment charge | — | 63,555 | 88,414 | |||||||||
| Gains on sales of patents | — | (79,950 | ) | (97,894 | ) | |||||||
| Stock-based compensation expense | 224,365 | 278,220 | 420,174 | |||||||||
| Restructuring charges, net | 236,170 | 3,766 | 103,450 | |||||||||
|
|
|
|
|
|
|
|||||||
| Income from operations |
$ | 566,368 | $ | 589,926 | $ | 142,942 | ||||||
|
|
|
|
|
|
|
|||||||
| (1) | Direct costs for each segment include certain cost of revenue-other and costs associated with the local sales teams. Prior to the fourth quarter of 2014, marketing, media, costs associated |
147
Table of Contents
| with Yahoo Properties and ad operation costs were managed locally and included as direct costs for each segment. Such costs are now included in global operating costs. Prior period amounts have been revised to conform to the current presentation. |
| (2) | Global operating costs include product development, marketing, real estate workplace, general and administrative, and other corporate expenses that are managed on a global basis and that are not directly attributable to any particular segment. Beginning in the fourth quarter of 2014, marketing, media, costs associated with Yahoo Properties and other ad operation costs are managed globally and included as global costs. Prior period amounts have been revised to conform to the current presentation. |
| (3) | The net cost reimbursements from Microsoft pursuant to the Search Agreement are primarily included in global operating costs. |
| Years Ended December 31, | ||||||||||||
| 2012 | 2013 | 2014 | ||||||||||
| Capital expenditures, net: | ||||||||||||
| Americas |
$ | 437,978 | $ | 309,215 | $ | 334,044 | ||||||
| EMEA |
27,074 | 11,435 | 20,034 | |||||||||
| Asia Pacific |
40,455 | 17,481 | 18,069 | |||||||||
|
|
|
|
|
|
|
|||||||
| Total capital expenditures, net |
$ | 505,507 | $ | 338,131 | $ | 372,147 | ||||||
|
|
|
|
|
|
|
|||||||
| December 31, | ||||||||
| 2013 | 2014 | |||||||
| Property and equipment, net: | ||||||||
| Americas: |
||||||||
| U.S. |
$ | 1,346,889 | $ | 1,382,597 | ||||
| Other. |
1,183 | 787 | ||||||
|
|
|
|
|
|||||
| Total Americas |
$ | 1,348,072 | $ | 1,383,384 | ||||
|
|
|
|
|
|||||
| EMEA |
44,976 | 34,649 | ||||||
| Asia Pacific |
95,470 | 69,651 | ||||||
|
|
|
|
|
|||||
| Total property and equipment, net |
$ | 1,488,518 | $ | 1,487,684 | ||||
|
|
|
|
|
|||||
See also Note 5—“Goodwill” and Note 15—“Restructuring Charges, Net” for additional information regarding segments.
148
Table of Contents
Enterprise Wide Disclosures:
The following table presents revenue for groups of similar services (in thousands):
| Years Ended December 31, | ||||||||||||
| 2012 | 2013 | 2014 | ||||||||||
| Search | $ | 1,885,860 | $ | 1,741,791 | $ | 1,792,861 | ||||||
| Display | 2,142,818 | 1,949,830 | 1,868,035 | |||||||||
| Other | 957,888 | 988,759 | 957,237 | |||||||||
|
|
|
|
|
|
|
|||||||
| Total revenue |
$ | 4,986,566 | $ | 4,680,380 | $ | 4,618,133 | ||||||
|
|
|
|
|
|
|
|||||||
| Years Ended December 31, | ||||||||||||
| 2012 | 2013 | 2014 | ||||||||||
| Revenue: | ||||||||||||
| U.S. | $ | 3,294,206 | $ | 3,317,794 | $ | 3,380,310 | ||||||
| International | 1,692,360 | 1,362,586 | 1,237,823 | |||||||||
|
|
|
|
|
|
|
|||||||
| Total revenue |
$ | 4,986,566 | $ | 4,680,380 | $ | 4,618,133 | ||||||
|
|
|
|
|
|
|
|||||||
Revenue is attributed to individual countries according to the online property that generated the revenue. No single foreign country accounted for more than 10 percent of the Company’s revenue in 2012, 2013, and 2014, respectively.
Note 19 Search Agreement With Microsoft Corporation
On December 4, 2009, the Company entered into the Search Agreement with Microsoft, which provides for Microsoft to be the exclusive algorithmic and paid search services provider on Yahoo Properties on desktop computers and non-exclusive provider of such services on Affiliate sites and for mobile devices. The Company also entered into a License Agreement with Microsoft. Under the License Agreement, Microsoft acquired an exclusive 10-year license to the Company’s core search technology and has the ability to integrate this technology into its existing Web search platforms. On February 18, 2010, the Company received regulatory clearance from both the U.S. Department of Justice and the European Commission and on February 23, 2010 the Company commenced implementation of the Search Agreement on a market-by-market basis. Under the Search Agreement, the Company is the exclusive worldwide relationship sales force for both companies’ premium search advertisers for desktop computers, which include advertisers meeting certain spending or other criteria, advertising agencies that specialize in or offer search engine marketing services and their clients, and resellers and their clients seeking assistance with their paid search accounts. The term of the Search Agreement is 10 years from February 23, 2010, subject to earlier termination as provided in the Search Agreement. Approximately 25 percent, 31 percent, and 35 percent of the Company’s revenue for the years ended December 31, 2012, 2013 and, 2014, respectively, was attributable to the Search Agreement.
During the first five years of the term of the Search Agreement, in the transitioned markets, the Company was entitled to receive 88 percent of the revenue (the “Revenue Share Rate”) generated from Microsoft’s services on Yahoo Properties and from Microsoft’s services on Affiliate sites after deduction of the Affiliate’s share of revenue and certain Microsoft costs for new Affiliates and for all Affiliates (including existing Affiliates) after the first five years. As of February 23, 2015, the Revenue
149
Table of Contents
Share Rate increased to 90 percent pursuant to the terms of the Search Agreement. In the transitioned markets, the Company reports as revenue the revenue share it receives from Microsoft under the Search Agreement as the Company is not the primary obligor in the arrangement with the advertisers and publishers. The underlying search advertising services are provided by Microsoft.
Under the Search Agreement, Microsoft continues to be obligated to guarantee Yahoo’s revenue per search on Yahoo Properties in Taiwan and Hong Kong for 18 months after the transition of paid search services to Microsoft’s platform in those markets, which was completed during the fourth quarter of 2013.
The Company’s results reflect search operating cost reimbursements from Microsoft under the Search Agreement of $67 million, $49 million, and less than $1 million for the years ended December 31, 2012, 2013, and 2014, respectively. As of December 31, 2013 and 2014, the Company had collected total amounts of $21 million and $52 million, respectively, on behalf of Microsoft and Affiliates, which was included in cash and cash equivalents with a corresponding liability in accrued expenses and other current liabilities on the consolidated balance sheets. The Company’s uncollected 88 percent share in connection with the Search Agreement was $305 million and $330 million as of December 31, 2013 and 2014, respectively, which was included in accounts receivable, net on the consolidated balance sheets. The total reimbursements not yet received from Microsoft of $5 million were classified as part of prepaid expenses and other current assets on the Company’s consolidated balance sheets as of December 31, 2013. There were no amounts classified as a part of prepaid expenses and other current assets on the Company’s consolidated balance sheet as of December 31, 2014 related to reimbursements not yet received from Microsoft.
As of February 23, 2015, for a period of 30 days following such date, in addition to other termination rights, the Company has the right to terminate the Search Agreement if the trailing 12-month average of the Company’s revenue per search in the United States (the “U.S. RPS”) on Yahoo Properties is less than a specified percentage of Google’s trailing 12-month estimated average U.S. RPS, excluding, in each case, mobile devices.
Note 20 Subsequent Events
Stock Repurchase Transactions. From January 1, 2015 through February 26, 2015, the Company repurchased approximately 2 million shares of its common stock at an average price of $51.04 per share, for a total of $119 million.
Spin-Off of Remaining Holdings in Alibaba Group. On January 27, 2015, Yahoo announced a plan for a spin-off of all of the Company’s remaining holdings in Alibaba Group into a newly formed independent registered investment company (referred to as “SpinCo”). The stock of SpinCo will be distributed pro rata to Yahoo stockholders, resulting in SpinCo becoming a separate publicly traded registered investment company. Following the completion of the transaction, SpinCo will own all of Yahoo’s remaining 384 million Alibaba Group shares and Yahoo Small Business, a current operating business of Yahoo that will also be transferred to SpinCo as part of the transaction. SpinCo will not assume any debt as part of the transaction.
The completion of the transaction is expected to occur in the fourth quarter of 2015 after the expiration of the Company’s one-year lock-up agreement relating to the Alibaba Group shares entered into in connection with the Alibaba Group IPO. The transaction is subject to certain conditions, including final approval by our Board, receipt of a favorable ruling from the Internal Revenue Service with respect to certain aspects of the transaction and a legal opinion with respect to the tax-free treatment of the transaction, under U.S. federal tax laws and regulations, the
150
Table of Contents
effectiveness of an applicable registration statement with the Securities and Exchange Commission and compliance with the requirements under the Investment Company Act of 1940, and other customary conditions.
The composition of SpinCo’s independent board of directors and management team, and other details of the transaction, including the distribution ratio, will be determined prior to the closing of the transaction.
Upon closing of the transaction, which is subject to the conditions specified above, the Company’s consolidated financial position will be materially impacted as the Alibaba Group shares and related deferred tax liabilities will be removed from the Company’s consolidated balance sheet with a corresponding reduction of its stockholders’ equity balance. The Company would no longer hold any Alibaba Group shares and would no longer record changes in fair value within comprehensive income (loss).
151
Table of Contents
Schedule II—Valuation and Qualifying Accounts
Years Ended December 31, 2012, 2013, and 2014
| Balance at Beginning of Year |
Charged to Expenses |
Write-Offs Net of, Recoveries |
Balance at End of Year |
|||||||||||||
| (In thousands) | ||||||||||||||||
| Accounts receivable | ||||||||||||||||
| Allowance for doubtful accounts |
||||||||||||||||
| 2012 |
30,142 | 12,868 | (10,375 | ) | 32,635 | |||||||||||
| 2013 |
32,635 | 10,278 | (7,364 | ) | 35,549 | |||||||||||
| 2014 |
35,549 | 15,406 | (11,156 | ) | 39,799 | |||||||||||
| Balance at Beginning of Year |
Credited to Expenses |
Charged (Credited) to Other Accounts(*) |
Balance at End of Year |
|||||||||||||
| (In thousands) | ||||||||||||||||
| Deferred tax asset valuation allowance | ||||||||||||||||
| 2012 |
53,140 | (82 | ) | (1,555 | ) | 51,503 | ||||||||||
| 2013 |
51,503 | (4,595 | ) | (10,218 | ) | 36,690 | ||||||||||
| 2014 |
36,690 | (10,427 | ) | (2,410 | ) | 23,853 | ||||||||||
| (*) | Amounts not charged (credited) to expenses are charged (credited) to stockholders’ equity, deferred tax assets (liabilities), or goodwill. |
152
Table of Contents
Selected Quarterly Financial Data
(Unaudited)
| Quarters Ended | ||||||||||||||||||||||||||||||||
| March 31, 2013(1) |
June 30, 2013(2) |
September 30, 2013(3) |
December 31, 2013(4) |
March 31, 2014(5) |
June 30, 2014(6) |
September 30, 2014(7) |
December 31, 2014(8) |
|||||||||||||||||||||||||
| (In thousands, except per share amounts) | ||||||||||||||||||||||||||||||||
| Revenue | $ | 1,140,368 | $ | 1,135,244 | $ | 1,138,973 | $ | 1,265,795 | $ | 1,132,730 | $ | 1,084,191 | $ | 1,148,140 | $ | 1,253,072 | ||||||||||||||||
| Total operating expenses | $ | 954,398 | $ | 998,265 | $ | 1,046,214 | $ | 1,091,577 | $ | 1,102,551 | $ | 1,045,754 | $ | 1,105,968 | $ | 1,220,918 | ||||||||||||||||
| Income from operations | $ | 185,970 | $ | 136,979 | $ | 92,759 | $ | 174,218 | $ | 30,179 | $ | 38,437 | $ | 42,172 | $ | 32,154 | ||||||||||||||||
| Other income (expense), net | $ | 17,072 | $ | 23,606 | $ | 5,370 | $ | (2,691 | ) | $ | (13,453 | ) | $ | (13,589 | ) | $ | 10,308,931 | $ | 87,550 | |||||||||||||
| Provision for income taxes | $ | (29,736 | ) | $ | (50,267 | ) | $ | (31,891 | ) | $ | (41,498 | ) | $ | (4,217 | ) | $ | (8,143 | ) | $ | (3,973,402 | ) | $ | (52,340 | ) | ||||||||
| Earnings in equity interests | $ | 217,588 | $ | 224,690 | $ | 232,756 | $ | 221,641 | $ | 301,402 | $ | 255,852 | $ | 398,692 | $ | 101,917 | ||||||||||||||||
| Net income attributable to Yahoo! Inc. | $ | 390,285 | $ | 331,150 | $ | 296,656 | $ | 348,190 | $ | 311,578 | $ | 269,707 | $ | 6,774,102 | $ | 166,344 | ||||||||||||||||
|
|
|
|
|
|
|
|
|
|
|
|
|
|
|
|
|
|||||||||||||||||
| Net income attributable to Yahoo! Inc. common stockholders per share—basic | $ | 0.36 | $ | 0.31 | $ | 0.29 | $ | 0.34 | $ | 0.31 | $ | 0.27 | $ | 6.82 | $ | 0.18 | ||||||||||||||||
|
|
|
|
|
|
|
|
|
|
|
|
|
|
|
|
|
|||||||||||||||||
| Net income attributable to Yahoo! Inc. common stockholders per share—diluted | $ | 0.35 | $ | 0.30 | $ | 0.28 | $ | 0.33 | $ | 0.29 | $ | 0.26 | $ | 6.70 | $ | 0.17 | ||||||||||||||||
|
|
|
|
|
|
|
|
|
|
|
|
|
|
|
|
|
|||||||||||||||||
| Shares used in per share calculation— basic | 1,094,170 | 1,079,389 | 1,024,289 | 1,012,972 | 1,009,890 | 999,765 | 993,543 | 948,079 | ||||||||||||||||||||||||
|
|
|
|
|
|
|
|
|
|
|
|
|
|
|
|
|
|||||||||||||||||
| Shares used in per share calculation— diluted | 1,108,095 | 1,094,694 | 1,041,698 | 1,038,754 | 1,031,420 | 1,014,692 | 1,007,693 | 962,626 | ||||||||||||||||||||||||
|
|
|
|
|
|
|
|
|
|
|
|
|
|
|
|
|
|||||||||||||||||
| (1) | Net income attributable to Yahoo! Inc. for the quarter ended March 31, 2013 includes net restructuring reversals of $7 million. |
| (2) | Net income attributable to Yahoo! Inc. for the quarter ended June 30, 2013 includes a gain on sales of patents of $10 million and net restructuring charges of $4 million. |
| (3) | Net income attributable to Yahoo! Inc. for the quarter ended September 30, 2013 includes net restructuring reversals of less than $1 million. |
| (4) | Net income attributable to Yahoo! Inc. for the quarter ended December 31, 2013 includes a gain on sale of patents of $70 million, a goodwill impairment charge of $64 million, and net restructuring charges of $8 million. |
153
Table of Contents
| (5) | Net income attributable to Yahoo! Inc. for the quarter ended March 31, 2014 includes net restructuring charges of $9 million. |
| (6) | Net income attributable to Yahoo! Inc. for the quarter ended June 30, 2014 includes a gain on sale of patents of $62 million and net restructuring charges of $53 million. |
| (7) | Net income attributable to Yahoo! Inc. for the quarter ended September 30, 2014 includes a gain from sale of Alibaba Group shares of $6.3 billion, net of tax and net restructuring charges of $8 million. |
| (8) | Net income attributable to Yahoo! Inc. for the quarter ended December 31, 2014 includes a gain on sale of patents of $35 million, a gain on Hortonworks warrants of $98 million, a goodwill impairment charge of $88 million, and net restructuring charges of $33 million. |
Item 9. Changes in and Disagreements With Accountants on Accounting and Financial Disclosure
None.
Item 9A. Controls and Procedures
Evaluation of Disclosure Controls and Procedures
The Company’s management, with the participation of the Company’s principal executive officer and principal financial officer, has evaluated the effectiveness of the Company’s disclosure controls and procedures (as such term is defined in Rules 13a-15(e) and 15d-15(e) under the Exchange Act) as of the end of the period covered by this report. Based on such evaluation, the Company’s principal executive officer and principal financial officer have concluded that, as of the end of such period, the Company’s disclosure controls and procedures were effective.
Management’s Report on Internal Control Over Financial Reporting
The Company’s management is responsible for establishing and maintaining adequate internal control over financial reporting as defined in Rules 13a-15(f) and 15d-15(f) under the Exchange Act. Under the supervision and with the participation of the Company’s management, including its principal executive officer and principal financial officer, the Company conducted an evaluation of the effectiveness of its internal control over financial reporting based on criteria established in the framework in Internal Control—Integrated Framework issued by the Committee of Sponsoring Organizations of the Treadway Commission (2013 framework). Based on this evaluation, the Company’s management concluded that its internal control over financial reporting was effective as of December 31, 2014.
Because of its inherent limitations, internal control over financial reporting may not prevent or detect all misstatements. Also, projections of any evaluation of effectiveness to future periods are subject to the risk that controls may become inadequate because of changes in conditions, or that the degree of compliance with the policies or procedures may deteriorate.
154
Table of Contents
The Company’s independent registered public accounting firm has issued an attestation report regarding its assessment of the Company’s internal control over financial reporting as of December 31, 2014, which appears on page 84.
Changes in Internal Control Over Financial Reporting
There have been no changes in Yahoo’s internal control over financial reporting (as such term is defined in Rules 13a-15(f) and 15d-15(f) under the Exchange Act) during the quarter ended December 31, 2014 that have materially affected, or are reasonably likely to materially affect, internal control over financial reporting.
Not applicable.
155
Table of Contents
PART III
Item 10. Directors, Executive Officers and Corporate Governance
The information required by this item is incorporated by reference to Yahoo’s Proxy Statement for its 2015 Annual Meeting of Shareholders to be filed with the SEC within 120 days after the end of the fiscal year ended December 31, 2014.
In addition, the Board has adopted a code of ethics, which is posted on the Company’s Website at www.yahoo.com. The code of ethics may be found as follows: From our main Web page, first click on “About Yahoo” at the bottom right of the page, then on “More About Yahoo,” then on “Investor Relations” in the left column, then on “Corporate Governance” then on “Documents” and then click on “Yahoo Code of Ethics”.
The Company’s code of ethics applies to the Company’s directors and employees, including our Chief Executive Officer, Chief Financial Officer, Principal Accounting Officer and Global Controller, and to contractors of the Company. The code of ethics sets forth the fundamental principles and key policies and procedures that govern the conduct of the Company’s business. The Company’s employees receive training on the code of ethics. We intend to disclose any amendment to, or waiver from, the code of ethics for our directors and executive officers, including our Principal Executive Officer, Principal Financial Officer, Principal Accounting Officer or Global Controller or persons performing similar functions, to the extent disclosure is required by applicable rules of the SEC and NASDAQ Stock Market LLC by posting such information on our Website, at the address and location specified above.
Item 11. Executive Compensation
The information required by this item is incorporated by reference to Yahoo’s Proxy Statement for its 2015 Annual Meeting of Shareholders to be filed with the SEC within 120 days after the end of the fiscal year ended December 31, 2014.
Item 12. Security Ownership of Certain Beneficial Owners and Management and Related Stockholder Matters
The information required by this item is incorporated by reference to Yahoo’s Proxy Statement for its 2015 Annual Meeting of Shareholders to be filed with the SEC within 120 days after the end of the fiscal year ended December 31, 2014.
Item 13. Certain Relationships and Related Transactions, and Director Independence
The information required by this item is incorporated by reference to Yahoo’s Proxy Statement for its 2015 Annual Meeting of Shareholders to be filed with the SEC within 120 days after the end of the fiscal year ended December 31, 2014.
156
Table of Contents
Item 14. Principal Accounting Fees and Services
The information required by this item is incorporated by reference to Yahoo’s Proxy Statement for its 2015 Annual Meeting of Shareholders to be filed with the SEC within 120 days after the end of the fiscal year ended December 31, 2014.
PART IV
Item 15. Exhibits, Financial Statement Schedules
(a) The following documents are filed as part of this report:
1. Consolidated Financial Statements:
| Page | ||||
| Index To Consolidated Financial Statements | ||||
| Consolidated Financial Statements: | ||||
| 84 | ||||
| Consolidated Balance Sheets as of December 31, 2013 and 2014 |
85 | |||
| Consolidated Statements of Income for each of the three years in the period ended December 31, 2014 |
86 | |||
| 87 | ||||
| 88 | ||||
| 90 | ||||
| 92 | ||||
| 2. Financial Statement Schedules:
|
||||
| Financial Statement Schedules: | ||||
| 152 | ||||
| All other schedules are omitted because they are not applicable or the required information is shown in the Consolidated Financial Statements or Notes thereto |
||||
| Supplementary Financial Data: | ||||
| Selected Quarterly Financial Data (unaudited) for the two years ended December 31, 2014 |
153 | |||
| 3. | Exhibits: |
The exhibits listed in the Exhibit Index (following the signatures page of this report) are filed with, or incorporated by reference in, this report.
157
Table of Contents
Pursuant to the requirements of Section 13 or 15(d) of the Securities Exchange Act of 1934, the Registrant has duly caused this report to be signed on its behalf by the undersigned, thereunto duly authorized, on the 26th day of February 2015.
| YAHOO! INC. | ||
| By: |
/S/ KEN GOLDMAN | |
| Ken Goldman | ||
| Chief Financial Officer | ||
Power of Attorney
KNOW ALL PERSONS BY THESE PRESENTS, that each person whose signature appears below constitutes and appoints Ken Goldman and Ronald S. Bell, or either of them, his or her attorneys-in-fact, each with the power of substitution, for him or her in any and all capacities, to sign any amendments to this Annual Report on Form 10-K and to file the same, with Exhibits thereto and other documents in connection therewith with the Securities and Exchange Commission, hereby ratifying and confirming all that each of said attorneys-in-fact, or substitute or substitutes may do or cause to be done by virtue hereof.
Pursuant to the requirements of the Securities Exchange Act of 1934, this report has been signed below by the following persons on behalf of the Registrant and in the capacities and on the dates indicated:
| Signature |
Title |
Date | ||
| /S/ MARISSA A. MAYER Marissa A. Mayer |
Chief Executive Officer, President and Director (Principal Executive Officer) |
February 26, 2015 | ||
| /S/ KEN GOLDMAN Ken Goldman |
Chief Financial Officer (Principal Financial Officer) |
February 26, 2015 | ||
| /S/ AMAN S. KOTHARI Aman S. Kothari |
SVP, Global Controller and Chief Accounting Officer (Principal Accounting Officer) |
February 26, 2015 | ||
| /S/ MAYNARD G. WEBB, JR. Maynard G. Webb, Jr. |
Chairman of the Board | February 26, 2015 | ||
| /S/ DAVID FILO David Filo |
Director | February 26, 2015 | ||
| /S/ SUSAN M. JAMES Susan M. James |
Director | February 26, 2015 | ||
158
Table of Contents
| Signature |
Title |
Date | ||
| /S/ MAX R. LEVCHIN Max R. Levchin |
Director | February 26, 2015 | ||
| /S/ THOMAS J. MCINERNEY Thomas J. McInerney |
Director | February 26, 2015 | ||
| /S/ CHARLES R. SCHWAB Charles R. Schwab |
Director | February 26, 2015 | ||
| /S/ H. LEE SCOTT, JR. H. Lee Scott, Jr. |
Director | February 26, 2015 | ||
| /S/ JANE E. SHAW Jane E. Shaw |
Director | February 26, 2015 | ||
159
Table of Contents
EXHIBIT INDEX
The following exhibits are included, or incorporated by reference, in this Annual Report on Form 10-K (and are numbered in accordance with Item 601 of Regulation S-K). Pursuant to Item 601(a)(2) of Regulation S-K, this exhibit index immediately precedes the exhibits.
| Exhibit Number |
Description | |
| 2.1 | Share Repurchase and Preference Share Sale Agreement, by and between Alibaba Group Holding Limited, the Registrant, and Yahoo! Hong Kong Holdings Limited, dated as of May 20, 2012 (previously filed as Exhibit 2.1 to the Registrant’s Current Report on Form 8-K filed May 24, 2012 and incorporated herein by reference). | |
| 2.2 | First Amendment to Share Repurchase and Preference Share Sale Agreement, by and between Alibaba Group Holding Limited, the Registrant, and Yahoo! Hong Kong Holdings Limited, dated as of September 11, 2012 (previously filed as Exhibit 2.2 to the Registrant’s Current Report on Form 8-K filed September 19, 2012 and incorporated herein by reference). | |
| 2.3 | Second Amendment to Share Repurchase and Preference Share Sale Agreement, by and among Alibaba Group Holding Limited, the Registrant, and Yahoo! Hong Kong Holdings Limited, dated as of October 14, 2013 (previously filed as Exhibit 2.3 to the Registrant’s Current Report on Form 8-K filed October 15, 2013 and incorporated herein by reference). | |
| 2.4 | Third Amendment to Share Repurchase and Preference Share Sale Agreement, by and among Alibaba Group Holding Limited, Yahoo! Inc., and Yahoo! Hong Kong Holdings Limited, dated as of July 14, 2014 (previously filed as Exhibit 2.4 to the Registrant’s Current Report on Form 8-K filed July 15, 2014 and incorporated herein by reference). | |
| 3.1(A) | Amended and Restated Certificate of Incorporation of the Registrant (previously filed as Exhibit 3.1 to the Registrant’s Quarterly Report on Form 10-Q filed July 28, 2000 and incorporated herein by reference). | |
| 3.1(B) | Certificate of Designation, Preferences and Rights of Series A Junior Participating Preferred Stock of the Registrant (previously filed as Exhibit 4.8 to the Registrant’s Quarterly Report on Form 10-Q filed May 4, 2001 and incorporated herein by reference). | |
| 3.2 | Amended and Restated Bylaws of the Registrant (previously filed as Exhibit 3.2 to the Registrant’s Current Report on Form 8-K filed June 27, 2014 and incorporated herein by reference). | |
| 4.1 | Form of the Registrant’s Common Stock certificate (previously filed as Exhibit 4.1 to the Registrant’s Quarterly Report on Form 10-Q filed November 12, 2013 and incorporated herein by reference). | |
| 4.2 | Indenture (including form of Notes) with respect to Yahoo’s 0.00% Convertible Senior Notes due 2018, dated as of November 26, 2013, between Yahoo and The Bank of New York Mellon Trust Company, N.A., as trustee (previously filed as Exhibit 4.2 to the Registrant’s Annual Report on Form 10-K filed February 28, 2014 and incorporated herein by reference) (reflects minor corrections to Edgar conversion errors where a plus (+) was reflected as a minus (-) in certain conversion formulas in Section 14.04 of the indenture). | |
| 10.1+ | Form of Indemnification Agreement between the Registrant and each of its directors and executive officers (previously filed as Exhibit 10.1 to the Registrant’s Quarterly Report on Form 10-Q filed November 6, 2009 and incorporated herein by reference). | |
160
Table of Contents
| Exhibit Number |
Description | |
| 10.2(A)+ | Yahoo! Inc. Stock Plan, as amended and restated on April 8, 2014 (and effective June 25, 2014) (previously referred to as the “1995 Stock Plan” and filed as Exhibit 10.1 to the Registrant’s Current Report on Form 8-K filed June 27, 2014 and incorporated herein by reference). | |
| 10.2(B)+ | Form of Stock Option Agreement, including Notice of Stock Option Grant, under the Yahoo! Inc. Stock Plan (previously filed as Exhibit 10.2(B) to the Registrant’s Quarterly Report on Form 10-Q filed August 8, 2013 and incorporated herein by reference). | |
| 10.2(C)+ | Form of Stock Option Agreement for Executives, including Notice of Stock Option Grant to Executive, under the Yahoo! Inc. Stock Plan (previously filed as Exhibit 10.2(C) to the Registrant’s Quarterly Report on Form 10-Q filed August 8, 2013 and incorporated herein by reference). | |
| 10.2(D)+ | Form of Restricted Stock Unit Award Agreement, including Notice of Grant, under the Yahoo! Inc. Stock Plan (previously filed as Exhibit 10.2(D) to the Registrant’s Quarterly Report on Form 10-Q filed August 8, 2013 and incorporated herein by reference). | |
| 10.2(E)+ | Form of Restricted Stock Unit Award Agreement for Executives, including Notice of Grant, under the Yahoo! Inc. Stock Plan (previously filed as Exhibit 10.2(E) to the Registrant’s Quarterly Report on Form 10-Q filed August 8, 2013 and incorporated herein by reference). | |
| 10.2(F)+ | Form of Restricted Stock Unit Award Agreement for Executives (version 2) under the Yahoo! Inc. Stock Plan (previously filed as Exhibit 10.2(F) to the Registrant’s Annual Report on Form 10-K filed February 29, 2012 and incorporated herein by reference). | |
| 10.2(G)+ | Form of Restricted Stock Unit Award Agreement for Executives, including the Notice of Grant, under the Yahoo! Inc. Stock Plan (previously filed as Exhibit 10.2(R) to the Registrant’s Quarterly Report on Form 10-Q filed May 8, 2014 and incorporated herein by reference). | |
| 10.2(H)+ | Form of Restricted Stock Unit Award Agreement Letter Amendment between the Registrant and executives regarding tax withholding elections (previously filed as Exhibit 10.2(P) to the Registrant’s Quarterly Report on Form 10-Q filed November 12, 2013 and incorporated herein by reference). | |
| 10.2(I)+ | Form of Restricted Stock Award Agreement under the Yahoo! Stock Plan (previously filed as Exhibit 10.2(F) to the Registrant’s Quarterly Report on Form 10-Q filed November 6, 2009 and incorporated herein by reference). | |
| 10.2(J)+ | Form of Stock Appreciation Rights Award Agreement under the Yahoo! Inc. Stock Plan (previously filed as Exhibit 10.23(D) to the Registrant’s Quarterly Report on Form 10-Q filed August 8, 2007 and incorporated herein by reference). | |
| 10.2(K)+ | Form of Performance Restricted Stock Unit Award Agreement for Executives, including Notice of Grant, under the Yahoo! Inc. Stock Plan (previously filed as Exhibit 10.2 to the Registrant’s Current Report on Form 8-K filed March 6, 2013 and incorporated herein by reference). | |
| 10.2(L)+ | Form of Performance Restricted Stock Unit Award Agreement for Executives, including the Notice of Grant, under the Yahoo! Inc. Stock Plan (previously filed as Exhibit 10.2(S) to the Registrant’s Quarterly Report on Form 10-Q filed May 8, 2014 and incorporated herein by reference). | |
| 10.3(A)+* | Yahoo! Inc. 1996 Employee Stock Purchase Plan (as amended on October 15, 2014). | |
161
Table of Contents
| Exhibit Number |
Description | |
| 10.3(B)+ | Form of Enrollment Agreement under the Yahoo! Inc. 1996 Employee Stock Purchase Plan (previously filed as Exhibit 10.3(B) to the Registrant’s Quarterly Report on Form 10-Q filed November 8, 2012 and incorporated herein by reference). | |
| 10.4(A)+ | Yahoo! Inc. Directors’ Stock Plan, as amended and restated on October 16, 2014 (and effective January 1, 2015) (previously referred to as the “1996 Directors’ Stock Plan” and filed as Exhibit 10.4(A) to the Registrant’s Quarterly Report on Form 10-Q filed November 7, 2014 and incorporated herein by reference). | |
| 10.4(B)+* | Form of Director Nonstatutory Stock Option Agreement, including Notice of Grant, under the Yahoo! Inc. Directors’ Stock Plan. | |
| 10.4(C)+* | Form of Notice of Restricted Stock Unit Grant and Director Restricted Stock Unit Award Agreement under the Yahoo! Inc. Directors’ Stock Plan. | |
| 10.5 | Joint Venture Agreement dated April 1, 1996 by and between the Registrant and SOFTBANK Corporation (previously filed as Exhibit 10.7 to the Registrant’s Annual Report on Form 10-K filed March 21, 2003 and incorporated herein by reference). | |
| 10.6 | Amendment Agreement dated September 17, 1997 by and between Registrant and SOFTBANK Corporation (previously filed as Exhibit 10.11 to the Registrant’s Annual Report on Form 10-K filed March 21, 2003 and incorporated herein by reference). | |
| 10.7 | Yahoo Japan License Agreement dated April 1, 1996 by and between the Registrant and Yahoo Japan Corporation (previously filed as Exhibit 10.43 to Amendment No. 2 to the Registrant’s Registration Statement on Form S-3, Registration No. 333-100298, filed on December 23, 2002 and incorporated herein by reference). | |
| 10.8 | Amendment to Yahoo Japan License Agreement dated September 12, 1997 by and between the Registrant and Yahoo Japan Corporation (previously filed as Exhibit 10.40 to Amendment No. 1 of the Registrant’s Registration Statement on Form S-3, Registration No. 333-100298, filed on November 27, 2002 and incorporated herein by reference). | |
| 10.9 | Amendment No. 2 to Yahoo Japan License Agreement dated January 31, 2005 by and between the Registrant and Yahoo Japan Corporation (previously filed as Exhibit 10.30 to the Registrant’s Annual Report on Form 10-K filed March 11, 2005 and incorporated herein by reference). | |
| 10.10+ | Yahoo! Inc. Executive Incentive Plan for 2014 (previously filed as Exhibit 10.11 to the Registrant’s Quarterly Report on Form 10-Q filed May 8, 2014 and incorporated herein by reference). | |
| 10.11+ | Form of Severance Agreement (2013 version) (previously filed as Exhibit 10.6 to the Registrant’s Current Report on Form 8-K filed March 6, 2013 and incorporated herein by reference). | |
| 10.12+ | Yahoo! Inc. Change in Control Employee Severance Plan for Level I and Level II Employees, as amended on December 10, 2008 (previously filed as Exhibit 10.15 to the Registrant’s Annual Report on Form 10-K filed February 27, 2009 and incorporated herein by reference). | |
| 10.13(A)† | Letter Agreement, dated July 29, 2009, between the Registrant and Microsoft Corporation (previously filed as Exhibit 10.21(A) to the Registrant’s Quarterly Report on Form 10-Q filed November 6, 2009 and incorporated herein by reference). | |
162
Table of Contents
| Exhibit Number |
Description | |
| 10.13(B)† | Search and Advertising Services and Sales Agreement, dated December 4, 2009, between the Registrant and Microsoft Corporation (previously filed as Exhibit 10.18(B) to the Registrant’s Annual Report on Form 10-K filed February 26, 2010 and incorporated herein by reference). | |
| 10.13(C)† | License Agreement, dated December 4, 2009, between the Registrant and Microsoft Corporation (previously filed as Exhibit 10.18(C) to the Registrant’s Annual Report on Form 10-K filed February 26, 2010 and incorporated herein by reference). | |
| 10.13(D)† | First Amendment to Search and Advertising Services and Sales Agreement, dated as of July 14, 2010, by and between the Registrant and Microsoft Corporation (previously filed as Exhibit 10.18(D) to the Registrant’s Quarterly Report on Form 10-Q filed May 10, 2011 and incorporated herein by reference). | |
| 10.13(E)† | Second Amendment to Search and Advertising Services and Sales Agreement, dated as of October 10, 2010, by and between the Registrant and Microsoft Corporation (previously filed as Exhibit 10.18(E) to the Registrant’s Quarterly Report on Form 10-Q filed May 10, 2011 and incorporated herein by reference). | |
| 10.13(F)† | Third Amendment to Search and Advertising Services and Sales Agreement, dated as of March 31, 2011, by and between the Registrant and Microsoft Corporation (previously filed as Exhibit 10.18(F) to the Registrant’s Quarterly Report on Form 10-Q filed May 10, 2011 and incorporated herein by reference). | |
| 10.13(G)† | Amendment No. 1 to License Agreement, dated as of October 10, 2010, by and between the Registrant and Microsoft Corporation (previously filed as Exhibit 10.18(G) to the Registrant’s Quarterly Report on Form 10-Q filed May 10, 2011 and incorporated herein by reference). | |
| 10.13(H)† | Fourth Amendment to Search and Advertising Services and Sales Agreement, dated as of December 13, 2010, by and between the Registrant and Microsoft Corporation (previously filed as Exhibit 10.18(H) to Amendment No. 1 to the Registrant’s Quarterly Report on Form 10-Q filed December 2, 2011 and incorporated herein by reference). | |
| 10.13(I)† | Fifth Amendment to Search and Advertising Services and Sales Agreement, dated as of July 2, 2011, by and between the Registrant and Microsoft Corporation (previously filed as Exhibit 10.18(I) to Amendment No. 1 to the Registrant’s Quarterly Report on Form 10-Q filed December 2, 2011 and incorporated herein by reference). | |
| 10.13(J)† | Sixth Amendment to Search and Advertising Services and Sales Agreement, dated as of October 14, 2011, by and between the Registrant and Microsoft Corporation (previously filed as Exhibit 10.18(J) to the Registrant’s Quarterly Report on Form 10-Q filed November 7, 2011 and incorporated herein by reference). | |
| 10.13(K)† | Seventh Amendment to Search and Advertising Services and Sales Agreement, dated as of January 1, 2012, by and between the Registrant and Microsoft Corporation (previously filed as Exhibit 10.16(K) to the Registrant’s Quarterly Report on Form 10-Q filed August 9, 2012 and incorporated herein by reference). | |
| 10.13(L)† | Eighth Amendment to Search and Advertising Services and Sales Agreement, dated as of June 6, 2012, by and between the Registrant and Microsoft Corporation (previously filed as Exhibit 10.16(L) to the Registrant’s Quarterly Report on Form 10-Q filed August 9, 2012 and incorporated herein by reference). | |
163
Table of Contents
| Exhibit Number |
Description | |
| 10.13(M)† | Ninth Amendment to Search and Advertising Services and Sales Agreement, dated as of June 27, 2013, by and between the Registrant and Microsoft Corporation (previously filed as Exhibit 10.16(M) to the Registrant’s Quarterly Report on Form 10-Q filed August 8, 2013 and incorporated herein by reference). | |
| 10.14(A)† | Framework Agreement, dated as of July 29, 2011, by and among the Registrant, Alibaba Group Holding Limited, Softbank Corp., Alipay.com Co., Ltd., APN Ltd., Zhejiang Alibaba E-Commerce Co., Ltd., Jack Ma Yun, Joseph C. Tsai and certain joinder parties (previously filed as Exhibit 10.1 to Amendment No. 1 to the Registrant’s Current Report on Form 8-K filed August 12, 2011 and incorporated herein by reference). | |
| 10.14(B) | Amendment to Framework Agreement, dated as of November 15, 2012, by and among the Registrant, Alibaba Group Holding Limited, Softbank Corp., Alipay.com Co., Ltd., APN Ltd., Zhejiang Alibaba E-Commerce Co., Ltd., Jack Ma Yun, Joseph C. Tsai and certain joinder parties (previously filed as Exhibit 10.18 (B) to the Registrant’s Annual Report on Form 10-K filed March 1, 2013 and incorporated herein by reference). | |
| 10.14(C) | Waiver and Consent Agreement, dated January 23, 2014, by and among the Registrant, Alibaba Group Holding Limited, Softbank Corp., Alipay.com Co., Ltd., APN Ltd., Zhejiang Alibaba E-Commerce Co., Ltd., Jack Ma Yun, Joseph C. Tsai and certain joinder parties (previously filed as Exhibit 10.15(C) to the Registrant’s Quarterly Report filed May 8, 2014 and incorporated herein by reference). | |
| 10.14(D) | Second Amendment to the Alipay Framework Agreement, dated as of May 3, 2014, by and among the Registrant, Alibaba Group Holding Limited, Softbank Corp., Alipay.com Co., Ltd., APN Ltd., Zhejiang Alibaba E-Commerce Co., Ltd., Jack Ma Yun, Joseph C. Tsai and certain joinder parties (previously filed as Exhibit 10.15(D) to the Registrant’s Quarterly Report filed May 8, 2014 and incorporated herein by reference). | |
| 10.14(E) | Share and Asset Purchase Agreement, dated August 12, 2014, by and among the Registrant, Alibaba Group Holding Limited, Alipay.com Co., Ltd, Zhejiang Ant Small and Micro Financial Services Company, Ltd. (formerly known as Zhejiang Alibaba E-Commerce Co., Ltd.), SoftBank Corp., APN Ltd., Jack Ma Yun, Joseph Chung Tsai and certain of their affiliates (previously filed as Exhibit 10.15(D) to the Registrant’s Quarterly Report on Form 10-Q filed November 7, 2014 and incorporated herein by reference). | |
| 10.15(A)+ | Employment Offer Letter, dated July 16, 2012, between the Registrant and Marissa A. Mayer (previously filed as Exhibit 10.1 to the Registrant’s Current Report on Form 8-K filed July 19, 2012 and incorporated herein by reference). | |
| 10.15(B)+ | Restricted Stock Unit Award Agreement (CEO Make-Whole Grant), dated July 26, 2012, between the Registrant and Marissa A. Mayer (previously filed as Exhibit 10.22(B) to the Registrant’s Quarterly Report on Form 10-Q filed August 9, 2012 and incorporated herein by reference). | |
| 10.15(C)+ | Form of Restricted Stock Unit Award Agreement (CEO Retention and Annual Grants), between the Registrant and Marissa A. Mayer (previously filed as Exhibit 10.22(C) to the Registrant’s Quarterly Report on Form 10-Q filed August 9, 2012 and incorporated herein by reference). | |
| 10.15(D)+ | Performance Stock Option Agreement (Retention Grant), including Notice of Performance Stock Option Grant, dated November 29, 2012, between the Registrant and Marissa A. Mayer (previously filed as Exhibit 10.21(D) to the Registrant’s Annual Report on Form 10-K filed March 1, 2013 and incorporated herein by reference). | |
164
Table of Contents
| Exhibit Number |
Description | |
| 10.15(E)+ | Performance Stock Option Agreement (Annual Grant), including Notice of Performance Stock Option Grant, dated November 29, 2012, between the Registrant and Marissa A. Mayer (previously filed as Exhibit 10.21(E) to the Registrant’s Annual Report on Form 10-K filed March 1, 2013 and incorporated herein by reference). | |
| 10.15(F)+ | Form of Performance Restricted Stock Unit Award Agreement between the Registrant and Marissa A. Mayer, including Notice of Grant, under the Yahoo! Inc. Stock Plan (previously filed as Exhibit 10.3 to the Registrant’s Current Report on Form 8-K filed March 6, 2013 and incorporated herein by reference). | |
| 10.15(G)+ | Form of Restricted Stock Unit Award Agreement between the Registrant and Marissa A. Mayer, including Notice of Grant Plan, under the Yahoo! Inc. Stock Plan (previously filed as Exhibit 10.5 to the Registrant’s Current Report on Form 8-K filed March 6, 2013 and incorporated herein by reference). | |
| 10.15(H)+ | Form of Severance Agreement between the Registrant and Marissa A. Mayer (previously filed as Exhibit 10.7 to the Registrant’s Current Report on Form 8-K filed March 6, 2013 and incorporated herein by reference). | |
| 10.15(I)+ | Restricted Stock Unit Award Agreement, including the Notice of Grant, dated February 27, 2014, between the Registrant and Marissa A. Mayer (previously filed as Exhibit 10.17(I) to the Registrant’s Quarterly Report on Form 10-Q filed May 8, 2014 and incorporated herein by reference). | |
| 10.15(J)+ | Performance Restricted Stock Unit Award Agreement, including the Notice of Grant, dated February 27, 2014, between the Registrant and Marissa A. Mayer (previously filed as Exhibit 10.17(J) to the Registrant’s Quarterly Report on Form 10-Q filed May 8, 2014 and incorporated herein by reference). | |
| 10.15(K)+ | Letter Amendment, dated April 14, 2014, to Performance Stock Option Agreement (Retention Grant), between the Registrant and Marissa A. Mayer (previously filed as Exhibit 10.17(K) to the Registrant’s Quarterly Report on Form 10-Q filed May 8, 2014 and incorporated herein by reference). | |
| 10.15(L)+ | Letter Amendment, dated April 14, 2014, to Performance Stock Option Agreement (2012 Annual Grant), between the Registrant and Marissa A. Mayer (previously filed as Exhibit 10.17(L) to the Registrant’s Quarterly Report on Form 10-Q filed May 8, 2014 and incorporated herein by reference). | |
| 10.16(A)+ | Employment Offer Letter, dated September 23, 2012, between the Registrant and Ken Goldman (previously filed as Exhibit 10.1 to the Registrant’s Current Report on Form 8-K filed September 26, 2012 and incorporated herein by reference). | |
| 10.16(B)+ | Performance Stock Option Agreement, including Notice of Performance Stock Option Grant, dated November 29, 2012, between the Registrant and Ken Goldman (previously filed as Exhibit 10.22(B) to the Registrant’s Annual Report on Form 10-K filed March 1, 2013 and incorporated herein by reference). | |
| 10.16(C)+ | Letter Amendment, dated April 14, 2014, to Performance Stock Option Agreement, between the Registrant and Ken Goldman (previously filed as Exhibit 10.18(C) to the Registrant’s Quarterly Report on Form 10-Q filed May 8, 2014 and incorporated herein by reference). | |
| 10.17(A)+ | Employment Offer Letter, dated October 15, 2012, between the Registrant and Henrique de Castro (previously filed as Exhibit 10.1 to the Registrant’s Current Report on Form 8-K filed October 15, 2012 and incorporated herein by reference). | |
165
Table of Contents
| Exhibit Number |
Description | |
| 10.17(B)+ | Restricted Stock Unit Award Agreement (Make-Whole Grant), dated November 29, 2012, between the Registrant and Henrique de Castro (previously filed as Exhibit 10.23(B) to the Registrant’s Annual Report on Form 10-K filed March 1, 2013 and incorporated herein by reference). | |
| 10.17(C)+ | Restricted Stock Unit Award Agreement (Initial Grant), dated November 29, 2012, between the Registrant and Henrique de Castro (previously filed as Exhibit 10.23(C) to the Registrant’s Annual Report on Form 10-K filed March 1, 2013 and incorporated herein by reference). | |
| 10.17(D)+ | Performance Stock Option Agreement, including Notice of Performance Stock Option Grant, dated November 29, 2012, between the Registrant and Henrique de Castro (previously filed as Exhibit 10.23(D) to the Registrant’s Annual Report on Form 10-K filed March 1, 2013 and incorporated herein by reference). | |
| 10.17(E)+ | Form of Severance Agreement between the Registrant and Henrique de Castro (previously filed as Exhibit 10.23(E) to the Registrant’s Quarterly Report on Form 10-Q filed May 7, 2013 and incorporated herein by reference). | |
| 10.18(A) | Credit Agreement, dated as of October 19, 2012, by and among the Registrant, the initial lenders named therein, Citibank, N.A., as Administrative Agent, HSBC Bank USA, National Association as Syndication Agent and Citigroup Global Markets Inc. and HSBC Securities (USA) Inc., as Joint Lead Arrangers and Joint Bookrunners (previously filed as Exhibit 10.1 to the Registrant’s Current Report on Form 8-K filed October 22, 2012 and incorporated herein by reference). | |
| 10.18(B) | Amendment No. 1 to Credit Agreement, dated as of October 10, 2013, by and among the Registrant, the lenders named therein, and Citibank, N.A. as Administrative Agent (previously filed as Exhibit 10.1 to the Registrant’s Current Report on Form 8-K filed October 15, 2013 and incorporated herein by reference). | |
| 10.18(C) | Amendment No. 2 to Credit Agreement, dated as of October 10, 2014, by and among the Registrant, the lenders named therein, and Citibank, N.A. as Administrative Agent (previously filed as Exhibit 10.1 to the Registrant’s Current Report on Form 8-K filed October 15, 2014 and incorporated herein by reference). | |
| 10.19(A) | Purchase Agreement, dated July 22, 2013, among the Registrant, Third Point, LLC, Daniel S. Loeb, Third Point Partners L.P., Third Point Partners Qualified L.P., Third Point Offshore Master Fund L.P., Third Point Ultra Master Fund L.P. and Third Point Reinsurance Company, Ltd. (previously filed as Exhibit 99.1 to the Registrant’s Current Report on Form 8-K filed on July 25, 2013 and incorporated herein by reference). | |
| 10.19(B) | Amendment to Agreement, dated July 22, 2013, between the Registrant, Third Point, LLC and each of the other persons set forth on the signature pages thereto (previously filed as Exhibit 99.2 to the Registrant’s Current Report on Form 8-K filed on July 25, 2013 and incorporated herein by reference). | |
| 10.20 | Form of Call Option Confirmation between Yahoo and each Option Counterparty (previously filed as Exhibit 10.1 to the Registrant’s Current Report on Form 8-K filed November 26, 2013 and incorporated herein by reference). | |
| 10.21 | Form of Warrant Confirmation between Yahoo and each Option Counterparty (previously filed as Exhibit 10.2 to the Registrant’s Current Report on Form 8-K filed November 26, 2013 and incorporated herein by reference). | |
166
Table of Contents
| Exhibit Number |
Description | |
| 10.22+ | Employment Offer Letter, dated May 31, 1999, between the Registrant and Ronald S. Bell (previously filed as Exhibit 10.24 to the Registrant’s Quarterly Report on Form 10-Q filed May 8, 2014 and incorporated herein by reference). | |
| 10.23 | Underwriting Agreement, dated September 18, 2014, by and among Credit Suisse Securities (USA) LLC, Deutsche Bank Securities Inc., Goldman Sachs (Asia) L.L.C., J.P. Morgan Securities LLC, Morgan Stanley & Co. International plc, Citigroup Global Markets Inc., as representatives of the several underwriters named therein, Alibaba Group Holding Limited, Yahoo! Hong Kong Holdings Limited and the other selling shareholders listed therein (previously filed as Exhibit 10.1 to the Registrant’s Current Report on Form 8-K filed September 24, 2014 and incorporated herein by reference). | |
| 21.1* | List of Subsidiaries. | |
| 23.1* | Consent of Independent Registered Public Accounting Firm. | |
| 24.1 | Power of Attorney (see the signature page of this Annual Report on Form 10-K.) | |
| 31.1* | Certificate of Chief Executive Officer Pursuant to Securities Exchange Act Rules 13a-14(a) and 15d-14(a) as Adopted Pursuant to Section 302 of the Sarbanes-Oxley Act of 2002, dated February 26, 2015. | |
| 31.2* | Certificate of Chief Financial Officer Pursuant to Securities Exchange Act Rules 13a-14(a) and 15d-14(a) as Adopted Pursuant to Section 302 of the Sarbanes-Oxley Act of 2002, dated February 26, 2015. | |
| 32** | Certificate of Chief Executive Officer and Chief Financial Officer Pursuant to Securities Exchange Act Rules 13a-14(b) and 15d-14(b) and 18 U.S.C. Section 1350, as Adopted Pursuant to Section 906 of the Sarbanes-Oxley Act of 2002, dated February 26, 2015. | |
| 101.INS* | XBRL Instance | |
| 101.SCH* | XBRL Taxonomy Extension Schema | |
| 101.CAL* | XBRL Taxonomy Extension Calculation | |
| 101.DEF* | XBRL Taxonomy Extension Definition | |
| 101.LAB* | XBRL Taxonomy Extension Labels | |
| 101.PRE* | XBRL Taxonomy Extension Presentation | |
| * | Filed herewith. |
| ** | Furnished herewith. |
| + | Indicates a management contract or compensatory plan or arrangement. |
| † | Portions of this exhibit have been omitted and filed separately with the U.S. Securities and Exchange Commission pursuant to a request for confidential treatment. |
167