Attached files
| file | filename |
|---|---|
| 8-K - 8-K - VITESSE SEMICONDUCTOR CORP | a15-5321_18k.htm |
Exhibit 99.1
|
|
Annual Meeting of Stockholders Realization of Ethernet Everywhere Chris Gardner, CEO February 2015 |
|
|
This presentation contains forward-looking statements relating to Vitesse Semiconductor Corporation’s anticipated revenues, revenue growth, margins, operating expenses, market opportunity, and future financial performance. These forward-looking statements are based on our current expectations, estimates and projections about our business and industry, management’s beliefs, and certain assumptions made by us, all of which are subject to change. Forward-looking statements are not guarantees of future performance and the Company’s actual results may differ significantly as a result of a number of factors including general economic conditions, customer reaction to our new products, disruptions in our supply chain, success in meeting our delivery targets, our ability to appropriately manage inventory, and competitive market conditions. All information in this presentation is current as February 3, 2015 and Vitesse does not intend, and undertakes no duty, to update this information to reflect future results or circumstances. Other factors that might cause such differences include, but are not limited to, those referenced in the subsection entitled “Risk Factors” in our Annual Report on Form 10-K for the year ended September 30, 2014 filed with the U.S. Securities and Exchange Commission and available online at www.sec.gov. Safe Harbor Statement |
|
|
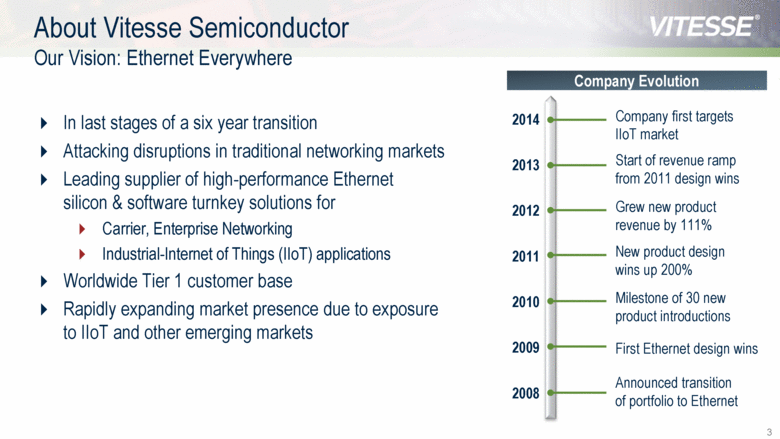
In last stages of a six year transition Attacking disruptions in traditional networking markets Leading supplier of high-performance Ethernet silicon & software turnkey solutions for Carrier, Enterprise Networking Industrial-Internet of Things (IIoT) applications Worldwide Tier 1 customer base Rapidly expanding market presence due to exposure to IIoT and other emerging markets About Vitesse Semiconductor Our Vision: Ethernet Everywhere Company Evolution Company first targets IIoT market Start of revenue ramp from 2011 design wins 2008 2013 2014 First Ethernet design wins 2009 Announced transition of portfolio to Ethernet 2012 2011 2010 Grew new product revenue by 111% New product design wins up 200% Milestone of 30 new product introductions |
|
|
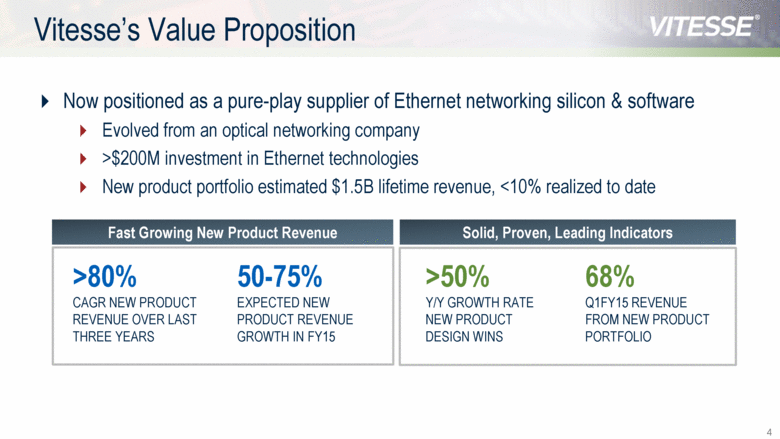
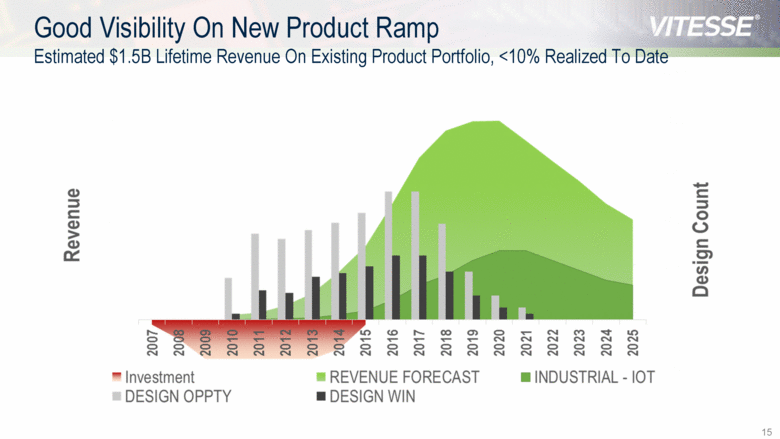
Now positioned as a pure-play supplier of Ethernet networking silicon & software Evolved from an optical networking company >$200M investment in Ethernet technologies New product portfolio estimated $1.5B lifetime revenue, <10% realized to date Vitesse’s Value Proposition >80% CAGR NEW PRODUCT REVENUE OVER LAST THREE YEARS >50% Y/Y GROWTH RATE NEW PRODUCT DESIGN WINS Fast Growing New Product Revenue 68% Q1FY15 REVENUE FROM NEW PRODUCT PORTFOLIO 50-75% EXPECTED NEW PRODUCT REVENUE GROWTH IN FY15 Solid, Proven, Leading Indicators |
|
|
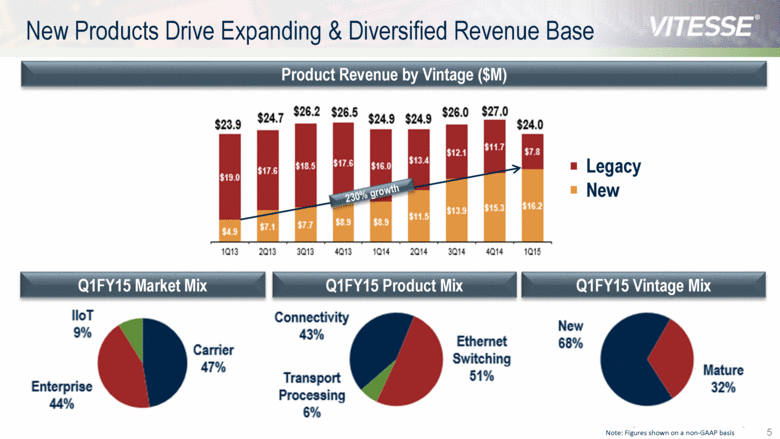
New Products Drive Expanding & Diversified Revenue Base Product Revenue by Vintage ($M) Q1FY15 Market Mix Q1FY15 Product Mix Q1FY15 Vintage Mix Note: Figures shown on a non-GAAP basis 230% growth Legacy New |
|
|
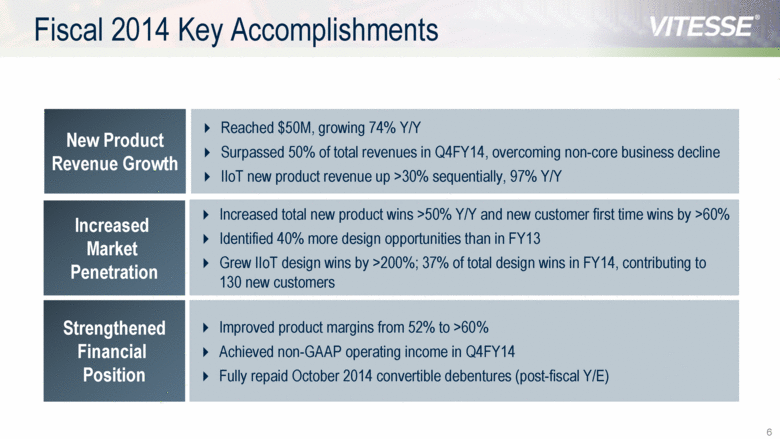
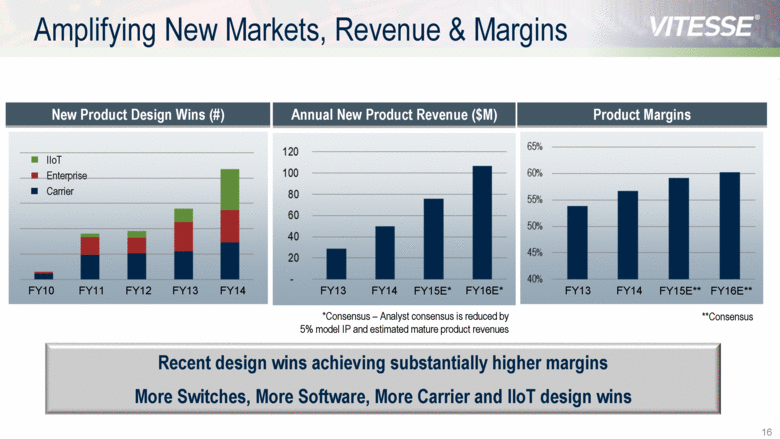
Fiscal 2014 Key Accomplishments New Product Revenue Growth Reached $50M, growing 74% Y/Y Surpassed 50% of total revenues in Q4FY14, overcoming non-core business decline IIoT new product revenue up >30% sequentially, 97% Y/Y Increased Market Penetration Increased total new product wins >50% Y/Y and new customer first time wins by >60% Identified 40% more design opportunities than in FY13 Grew IIoT design wins by >200%; 37% of total design wins in FY14, contributing to 130 new customers Improved product margins from 52% to >60% Achieved non-GAAP operating income in Q4FY14 Fully repaid October 2014 convertible debentures (post-fiscal Y/E) Strengthened Financial Position |
|
|
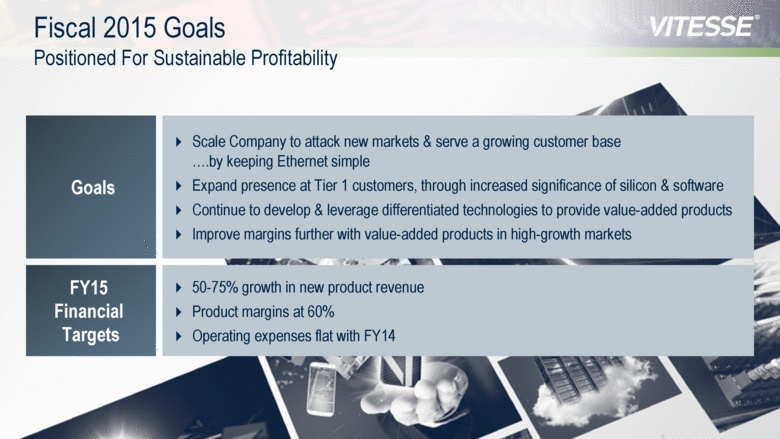
Fiscal 2015 Goals Positioned For Sustainable Profitability Goals Scale Company to attack new markets & serve a growing customer base .by keeping Ethernet simple Expand presence at Tier 1 customers, through increased significance of silicon & software Continue to develop & leverage differentiated technologies to provide value-added products Improve margins further with value-added products in high-growth markets FY15 Financial Targets 50-75% growth in new product revenue Product margins at 60% Operating expenses flat with FY14 |
|
|
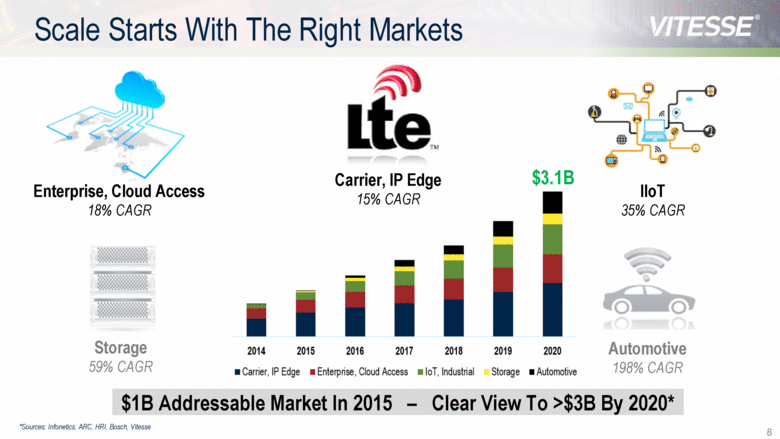
Scale Starts With The Right Markets $1B Addressable Market In 2015 – Clear View To >$3B By 2020* Enterprise, Cloud Access 18% CAGR IIoT 35% CAGR *Sources: Infonetics, ARC, HRI, Bosch, Vitesse Storage 59% CAGR Automotive 198% CAGR $3.1B Carrier, IP Edge 15% CAGR |
|
|
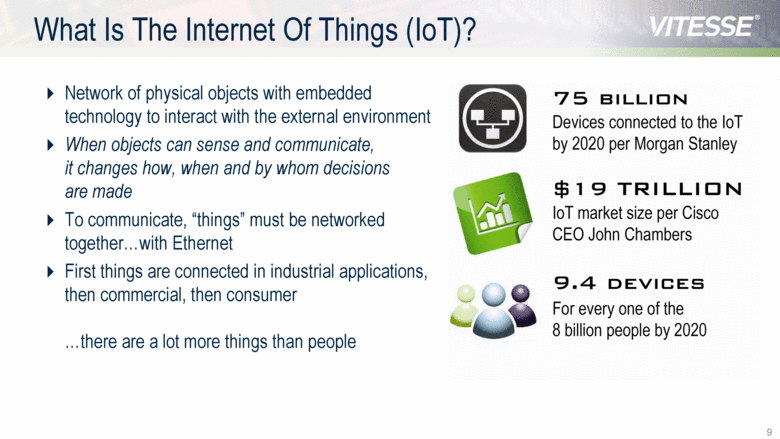
Network of physical objects with embedded technology to interact with the external environment When objects can sense and communicate, it changes how, when and by whom decisions are made To communicate, “things” must be networked togetherwith Ethernet First things are connected in industrial applications, then commercial, then consumer there are a lot more things than people What Is The Internet Of Things (IoT)? |
|
|
Changing world radically expands Vitesse’s market opportunities Exponentially more “things” being connected and Ethernet is the “language” connecting everything Vitesse is one of few proven competitors in the Ethernet market Complexity poses huge barriers to entry 900 man-years hardware development 400 man-years software development Our technology and products are particularly well suited to connect the IIoT IoT Means Ethernet Everywhere 52 trillion CONNECTIONS AVAILBLE PER PERSON WITH IPv6 >99% PERCENTAGE OF THINGS CURRENTLY UNCONNECTED 1.6 zettabytes MONTHLY GLOBAL IP TRAFFIC BY 2018 |
|
|
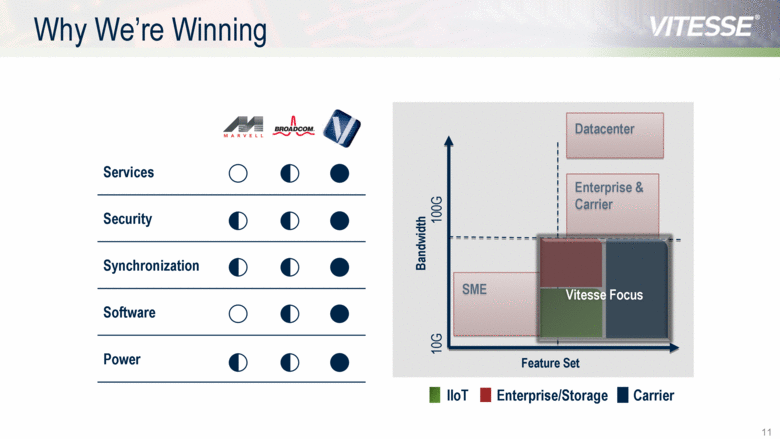
Services Security Synchronization Software Power Datacenter Enterprise & Carrier SME Why We’re Winning Enterprise/Storage Carrier IIoT Bandwidth Feature Set 10G 100G Vitesse Focus |
|
|
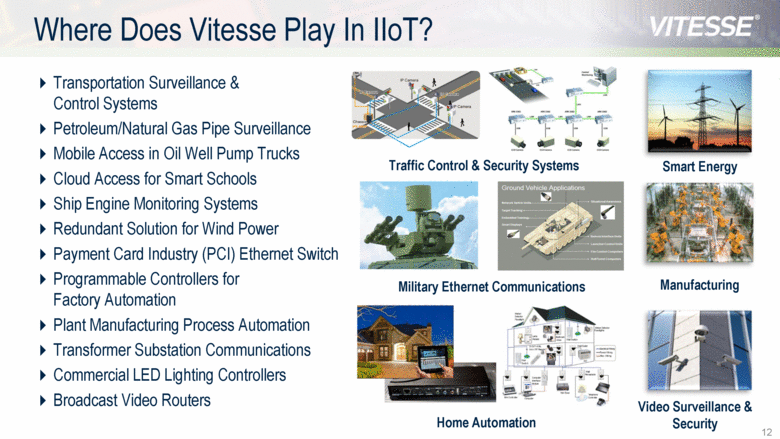
Transportation Surveillance & Control Systems Petroleum/Natural Gas Pipe Surveillance Mobile Access in Oil Well Pump Trucks Cloud Access for Smart Schools Ship Engine Monitoring Systems Redundant Solution for Wind Power Payment Card Industry (PCI) Ethernet Switch Programmable Controllers for Factory Automation Plant Manufacturing Process Automation Transformer Substation Communications Commercial LED Lighting Controllers Broadcast Video Routers Where Does Vitesse Play In IIoT? Traffic Control & Security Systems Military Ethernet Communications Home Automation Manufacturing Smart Energy Video Surveillance & Security |
|
|
Vitesse’s IIoT Business Is Just Starting Materially Reshaping Our Customer Base, >60% Win Rate For Opportunities We See 23% DESIGN WINS >90% OPPORTUNITIES 33 DESIGN WIN CUSTOMERS ADDED 36% DESIGN WINS >50% OPPORTUNITIES 61 DESIGN WIN CUSTOMERS ADDED All data trailing 4 quarters This Time Last Year And Today |
|
|
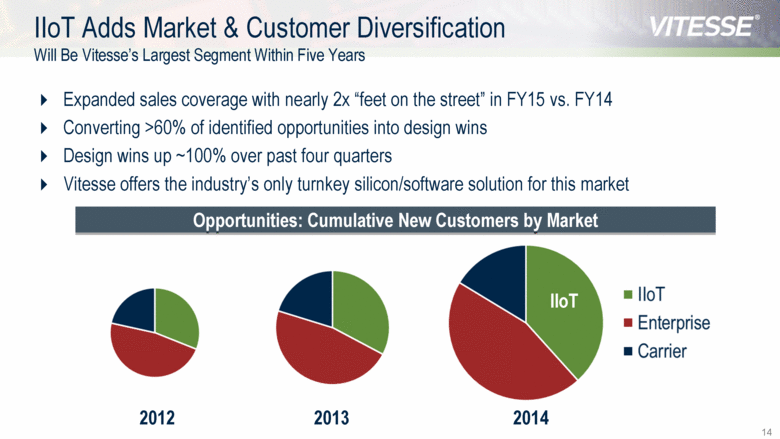
Expanded sales coverage with nearly 2x “feet on the street” in FY15 vs. FY14 Converting >60% of identified opportunities into design wins Design wins up ~100% over past four quarters Vitesse offers the industry’s only turnkey silicon/software solution for this market IIoT Adds Market & Customer Diversification Will Be Vitesse’s Largest Segment Within Five Years Opportunities: Cumulative New Customers by Market 2012 2013 2014 IIoT |
|
|
Good Visibility On New Product Ramp Estimated $1.5B Lifetime Revenue On Existing Product Portfolio, <10% Realized To Date |
|
|
FY10 FY11 FY12 FY13 FY14 Amplifying New Markets, Revenue & Margins Recent design wins achieving substantially higher margins More Switches, More Software, More Carrier and IIoT design wins New Product Design Wins (#) Product Margins Annual New Product Revenue ($M) FY13 FY14 FY15E** FY16E** **Consensus FY13 FY14 FY15E* FY16E* Carrier Enterprise IIoT *Consensus – Analyst consensus is reduced by 5% model IP and estimated mature product revenues |
|
|
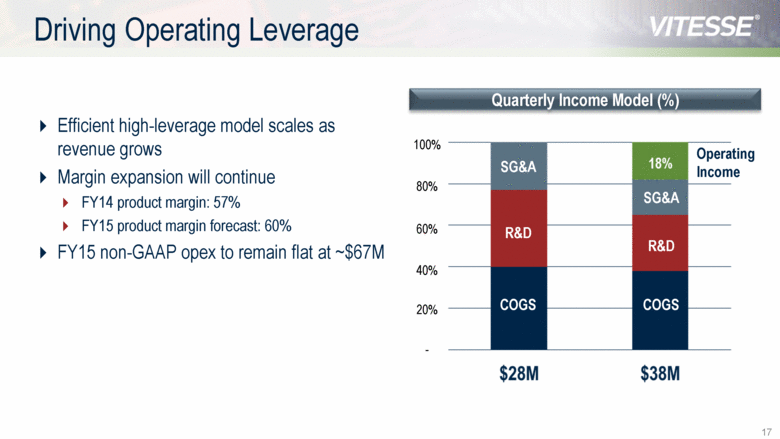
Efficient high-leverage model scales as revenue grows Margin expansion will continue FY14 product margin: 57% FY15 product margin forecast: 60% FY15 non-GAAP opex to remain flat at ~$67M Driving Operating Leverage Quarterly Income Model (%) 20% 40% 60% 80% 100% - COGS COGS R&D R&D SG&A SG&A Operating Income |
|
|
What’s Next From Vitesse? |
|
|
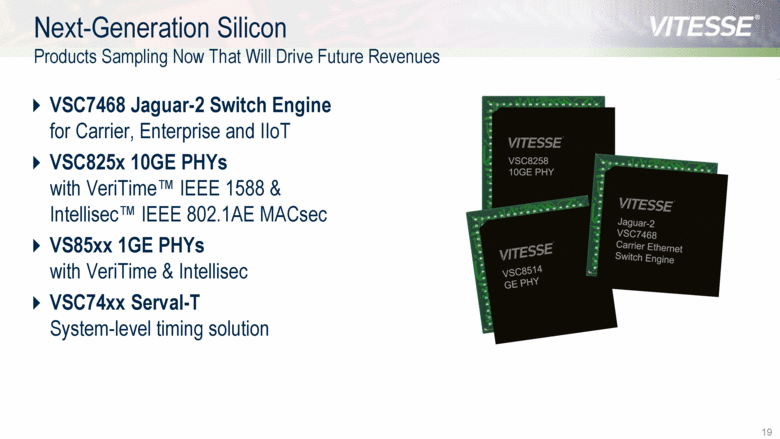
VSC7468 Jaguar-2 Switch Engine for Carrier, Enterprise and IIoT VSC825x 10GE PHYs with VeriTime™ IEEE 1588 & Intellisec™ IEEE 802.1AE MACsec VS85xx 1GE PHYs with VeriTime & Intellisec VSC74xx Serval-T System-level timing solution Next-Generation Silicon Products Sampling Now That Will Drive Future Revenues |
|
|
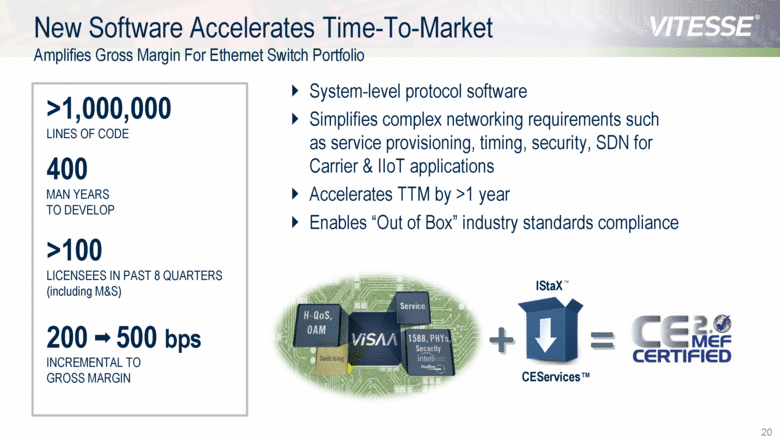
System-level protocol software Simplifies complex networking requirements such as service provisioning, timing, security, SDN for Carrier & IIoT applications Accelerates TTM by >1 year Enables “Out of Box” industry standards compliance New Software Accelerates Time-To-Market Amplifies Gross Margin For Ethernet Switch Portfolio >100 LICENSEES IN PAST 8 QUARTERS (including M&S) 400 MAN YEARS TO DEVELOP >1,000,000 LINES OF CODE + = 200 500 bps INCREMENTAL TO GROSS MARGIN CEServices™ TM IStaX |
|
|
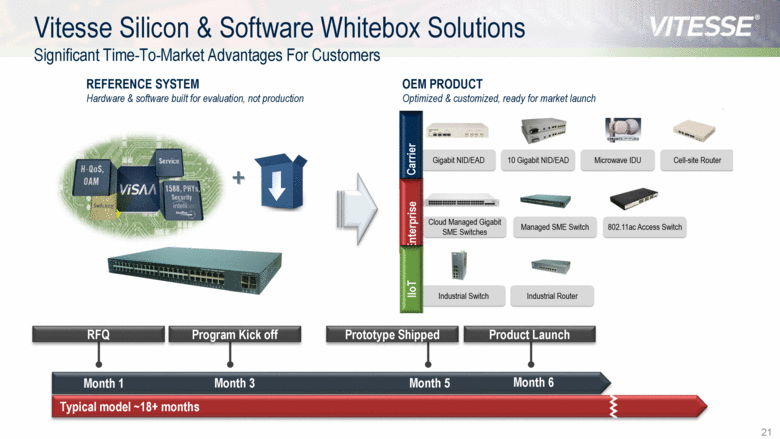
Vitesse Silicon & Software Whitebox Solutions Significant Time-To-Market Advantages For Customers Typical model ~18+ months Month 1 Month 3 Month 5 Month 6 REFERENCE SYSTEM Hardware & software built for evaluation, not production OEM PRODUCT Optimized & customized, ready for market launch Program Kick off Prototype Shipped Product Launch + Carrier Enterprise IIoT RFQ |
|
|
Market Disruptions Create Further Growth Opportunities Strategy Builds On Years Of R&D To Create Significant Leverage Automation of networks & service creation through software Vitesse software with open APIs will become even more valuable Shifting profit pool from OEMs by creating turnkey & whitebox solutions Software-Defined Network Revolution Ethernet object-based storage replaces SAS/SATA, FC, FCoE Take SAS/SATA expander market away from current market leaders and replace with Vitesse switching silicon on all storage racks Software-Defined Storage Ethernet replaces all legacy protocols & buses in vehicles Create innovations for deterministic Ethernet switches & PHYs as advanced driver assist, diagnostics & infotainment shift to Ethernet Automotive 2016+ 2016+ 2018+ |
|
|
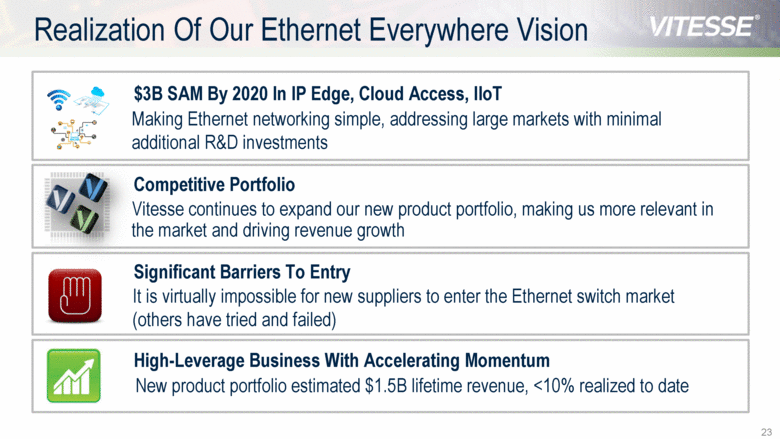
Realization Of Our Ethernet Everywhere Vision Making Ethernet networking simple, addressing large markets with minimal additional R&D investments $3B SAM By 2020 In IP Edge, Cloud Access, IIoT New product portfolio estimated $1.5B lifetime revenue, <10% realized to date High-Leverage Business With Accelerating Momentum Vitesse continues to expand our new product portfolio, making us more relevant in the market and driving revenue growth Competitive Portfolio It is virtually impossible for new suppliers to enter the Ethernet switch market (others have tried and failed) Significant Barriers To Entry |
|
|
Thank You Follow us on: www.vitesse.com |
|
|
Appendix |
|
|
$M Income Statement Q1FY2015 Q4FY2014 Revenue Product 24.0 27.0 IP 0.8 1.7 Total 24.8 28.7 Gross Margin % Product 58.1% 60.9% Total 59.4% 63.1% Non-GAAP Operating Expenses 17.2 17.3 Non-GAAP Operating Income (Loss) (2.2) 1.0 Non-GAAP Net Loss (3.1) (0.8) $M Balance Sheet Cash (including Restricted Cash) 33.4 72.7 Inventories 15.7 12.8 Short Term Debt - 32.7 Long Term Debt 16.5 16.4 Working Capital 37.5 40.5 Q1FY2015 Financial Summary $24.8M REVENUE $18.8M GAAP OPERATING EXPENSES Highlights 58.1% PRODUCT MARGIN Q2FY2015 GAAP Guidance $24.0M – $26.0M REVENUE $17.5M – $18.5M OPERATING EXPENSES 58% – 61% PRODUCT MARGIN |
|
|
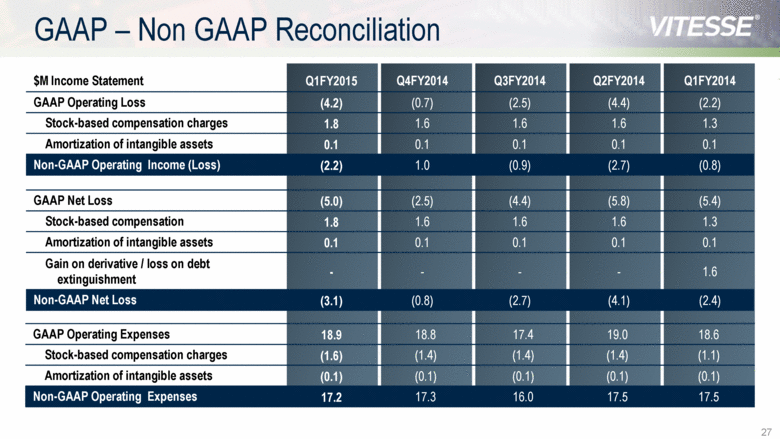
$M Income Statement Q1FY2015 Q4FY2014 Q3FY2014 Q2FY2014 Q1FY2014 GAAP Operating Loss (4.2) (0.7) (2.5) (4.4) (2.2) Stock-based compensation charges 1.8 1.6 1.6 1.6 1.3 Amortization of intangible assets 0.1 0.1 0.1 0.1 0.1 Non-GAAP Operating Income (Loss) (2.2) 1.0 (0.9) (2.7) (0.8) GAAP Net Loss (5.0) (2.5) (4.4) (5.8) (5.4) Stock-based compensation 1.8 1.6 1.6 1.6 1.3 Amortization of intangible assets 0.1 0.1 0.1 0.1 0.1 Gain on derivative / loss on debt extinguishment - - - - 1.6 Non-GAAP Net Loss (3.1) (0.8) (2.7) (4.1) (2.4) GAAP – Non GAAP Reconciliation GAAP Operating Expenses 18.9 18.8 17.4 19.0 18.6 Stock-based compensation charges (1.6) (1.4) (1.4) (1.4) (1.1) Amortization of intangible assets (0.1) (0.1) (0.1) (0.1) (0.1) Non-GAAP Operating Expenses 17.2 17.3 16.0 17.5 17.5 |

