Attached files
| file | filename |
|---|---|
| 8-K - FORM 8-K - Kennedy-Wilson Holdings, Inc. | a8-kkwereresultsye2014.htm |
| EX-99.1 - KENNEDY WILSON EUROPE REAL ESTATE PLC RESULTS FOR THE PERIOD ENDED DECEMBER 31, - Kennedy-Wilson Holdings, Inc. | kweq4resultsexhibit991.htm |

2014 Results for the period ended 31 December 2014 EXHIBIT 99.2

Kennedy Wilson Europe Real Estate Plc 2014 Results to 31 December 2014 Disclaimer This presentation is being provided to you for information purposes only. This presentation does not constitute an offering of securities or otherwise constitute an offer or invitation or inducement to any person to underwrite, subscribe for or otherwise acquire or dispose of securities in Kennedy Wilson Europe Real Estate Plc (“KWERE”, and together with its subsidiaries, the “PLC Group”). KWERE has not been, and will not be, registered under the US Investment Company Act of 1940, as amended. KWERE's assets are managed by KW Investment Management Ltd (the “Investment Manager”), an indirect wholly owned subsidiary of Kennedy-Wilson Holdings Inc. This presentation may not be reproduced in any form, further distributed or passed on, directly or indirectly, to any other person, or published, in whole or in part, for any purpose. Certain statements in this presentation are forward-looking statements which are based on the PLC Group's expectations, intentions and projections regarding its future performance, anticipated events or trends and other matters that are not historical facts. These statements are not guarantees of future performance and are subject to known and unknown risks, uncertainties and other factors that could cause actual results to differ materially from those expressed or implied by such forward-looking statements. Factors that would cause actual results or events to differ from current expectations, intentions or projections might include, amongst other things, changes in property prices, changes in equity markets, political risks, changes to regulations affecting the PLC Group's activities and delays in obtaining or failure to obtain any required regulatory approval. Given these risks and uncertainties, readers should not place undue reliance on forward-looking statements. Forward-looking statements speak only as of the date of such statements and, except as required by applicable law, no member of the PLC Group undertakes any obligation to update or revise publicly any forward-looking statements, whether as a result of new information, future events or otherwise. Past performance is no guide to future performance and persons needing advice should consult an independent financial adviser. Nothing in this presentation should be construed as a profit forecast. The information in this presentation, which does not purport to be comprehensive, has not been verified by the PLC Group or any other person. No representation or warranty, express or implied, is or will be given by any member of the PLC Group or its directors, officers, employees or advisers or any other person as to the accuracy or completeness of the presentation or any projections, targets, estimates, forecasts or opinions contained therein and, so far as permitted by law, no responsibility or liability is accepted for the accuracy or sufficiency thereof, or for any errors, omissions or miss-statements, negligent or otherwise, relating thereto. In particular, but without limitation, (subject as aforesaid) no representation or warranty, express or implied, is given as to the achievement or reasonableness of, and no reliance should be placed on any projections, targets, estimates or forecasts and nothing in this presentation is or should be relied on as a promise or representation as to the future. Accordingly, (subject as aforesaid), no member of the PLC Group, nor any of its directors, officers, employees or advisers, nor any other person, shall be liable for any direct, indirect or consequential loss or damage suffered by any person as a result of relying on any statement in or omission from the presentation or any other written or oral communication with the recipient or its advisers in connection with the presentation and (save in the case of fraudulent misrepresentation or wilful non-disclosure) any such liability is expressly disclaimed. The market data in the presentation has been sourced from third parties and has been so identified. In furnishing this presentation, the PLC Group does not undertake any obligation to provide any additional information or to update this presentation or to correct any inaccuracies that may become apparent.

Kennedy Wilson Europe Real Estate Plc 2014 Results to 31 December 2014 2 The KWE1 team Expert local presence Wider KWE Team Total employees: 74; Asset Management: 29; Investments: 11; Finance & Operations: 34 Notes: Kennedy Wilson Europe Real Estate Plc (LSE: KWE) 1 Peter Hewetson Head of UK Direct Real Estate Alison Rohan Ireland Portfolio & Asset Management Vern Power Finance & Accounting Cristina Perez Spain Origination Nicholas Judge UK Asset Management Gautam Doshi Financial Analysis & Deal Execution Juliana Weiss Dalton Investor Relations Peter Collins HEAD OF IRELAND Fiona D’Silva HEAD OF ORIGINATION Mary Ricks CEO

Kennedy Wilson Europe Real Estate Plc 2014 Results to 31 December 2014 Agenda 3 Overview Financials UK Ireland 2015 Strategic objectives Q&A

Kennedy Wilson Europe Real Estate Plc 2014 Results to 31 December 2014 OVERVIEW 4

Kennedy Wilson Europe Real Estate Plc 2014 Results to 31 December 2014 5 Our strategy Strong shareholder alignment through significant ownership stake Generate superior shareholder returns by unlocking value of under- resourced real estate SYNERGIES BETWEEN DEBT & EQUITY PROFESSIONALS REPEAT BUSINESS DEAL FLOW FROM FINANCIAL INSTITUTIONS & RELATIONSHIPS LOCAL TEAM EXPERT KNOWLEDGE AND PRESENCE STRONG RISK/RETURN PRICING DISCIPLINE EUROPEAN DELEVERAGING INFRASTRUCTURE TO EXECUTE LARGE PORTFOLIOS L O N G -T E R M P R E S E N C E M U LT I-S E C T O R R E C OV E R Y Appendix Financials Overview UK Ireland 2015 Objectives
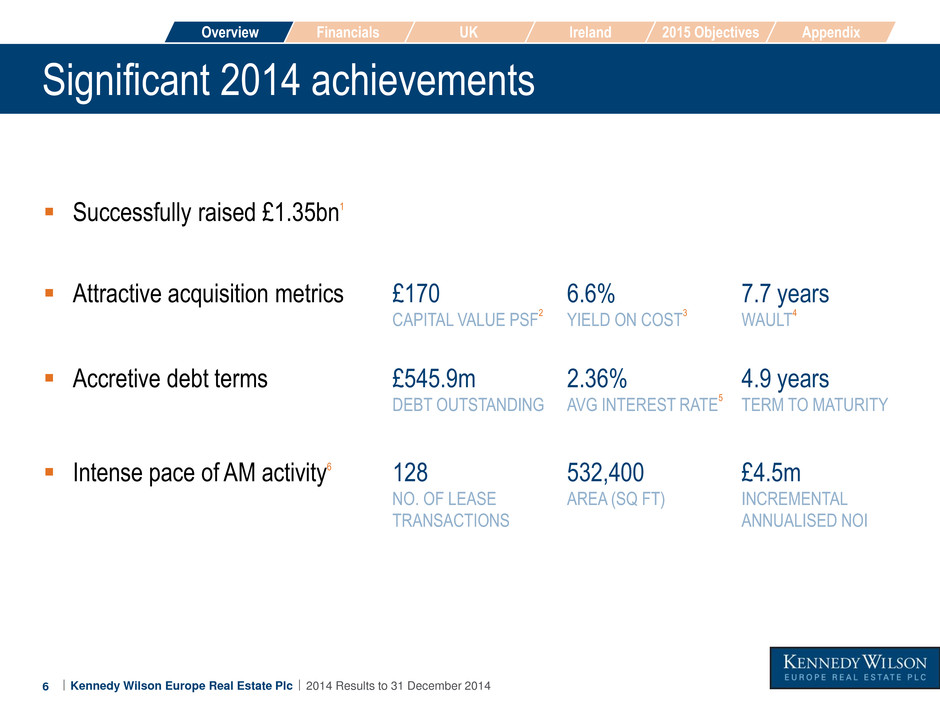
Kennedy Wilson Europe Real Estate Plc 2014 Results to 31 December 2014 6 Significant 2014 achievements Successfully raised £1.35bn1 Attractive acquisition metrics £170 CAPITAL VALUE PSF 2 6.6% YIELD ON COST 3 7.7 years WAULT 4 Accretive debt terms £545.9m DEBT OUTSTANDING 2.36% AVG INTEREST RATE 5 4.9 years TERM TO MATURITY Intense pace of AM activity6 128 NO. OF LEASE TRANSACTIONS 532,400 AREA (SQ FT) £4.5m INCREMENTAL ANNUALISED NOI Appendix Financials Overview UK Ireland 2015 Objectives

Kennedy Wilson Europe Real Estate Plc 2014 Results to 31 December 2014 8 Notes: Includes £351m raised from secondary offering in October 2014 Calculated on Commercial and Residential assets only and excludes Hotels, Loans and Development properties At the time of acquisition, based on actual purchaser’s cost Weighted average term to maturity is based expiries to first break, WAULT to expiry 8.9 years; calculated on commercial assets and excludes hotels, residential and development properties Weighted average interest rate at 31 December 2014 using LIBOR and EURIBOR at that date; Variable interest rates have been hedged using interest rate caps which at 31 December 2014 covered 67% (£373m) of variable rate of debt, capping EURIBOR at 1.5% and LIBOR at 3% 2 1 3 A Includes £2.7m uplift in rental income, £0.3m uplift in hotel EBITDA and £0.5m uplift in loan income Includes 80 residential lettings Includes £0.5m uplift in rental income, £0.3m uplift in residential rents, £0.1m uplift in hotel EBITDA and £0.1m uplift in loan income B C No. of lease transactions Commercial area (sq ft) Incremental annualised NOI (£m) UK 38 510,900 3.5 A Ireland 90 B 21,500 1.0 C Total 128 532,400 4.5 4 5 6

Kennedy Wilson Europe Real Estate Plc 2014 Results to 31 December 2014 7p per share 28p or 2.6% 7 Financial highlights1 Period ended 31 December 2014 PORTFOLIO VALUE £1,489.0m EPRA EARNINGS 25.9p per share EPRA NET ASSETS 1,021.8p per share LOAN TO VALUE (LTV) 7.0% PORTFOLIO VALUE £2,063.7m 4,5 LOAN TO VALUE (LTV) 31.3% 10 TOTAL DIVIDENDS PAID 2p + 4p per share QUARTERLY DIVIDEND ANNUALISED Today 3 2 4 9 5 DEBT OUTSTANDING, TTM, WAIR £545.9m, 4.9 years, 2.36% DEBT OUTSTANDING, TTM, WAIR £886.6m, 5.2 years, 2.58% 6 6 7 8 Appendix Financials Overview UK Ireland 2015 Objectives

Kennedy Wilson Europe Real Estate Plc 2014 Results to 31 December 2014 1 0 Notes: GBP equivalent based on €/GBP exchange rate of 0.7825 as at 31 December 2014 Dividends of 2p per share were paid on 29-Aug-14 over 100,225,215 shares (£2.0m) and 4p per share were paid on 28-Nov-14 over 135,283,293 shares (£5.4m) Dividend yield based on annualised dividend of 28p and share price of 1,094p as at 25-Feb-15 Portfolio value based on valuation by external valuers, CBRE (for direct property portfolio) and Duff & Phelps (for loan portfolios), as at 31-Dec-14 Pro forma post period acquisitions including the completion of the Aviva/Gatsby portfolio (30-Jan-15), the conversion of the Gardn0er House loan to direct real estate (11-Feb-15) and the completion of the Park Inn loan portfolio (16-Feb-15) Weighted average term to maturity of debt drawn Weighted average interest rate at 31 December 2014 Weighted average interest rate at 25 February 2015 LTV calculated as net debt over portfolio value (value of investment and development properties, loans secured by real estate and hotels). Pro forma post period end acquisitions gross debt = £886.6m, cash = £239.8 m and investment value = £2,063.7m 2 1 3 4 5 6 7 8 9 10
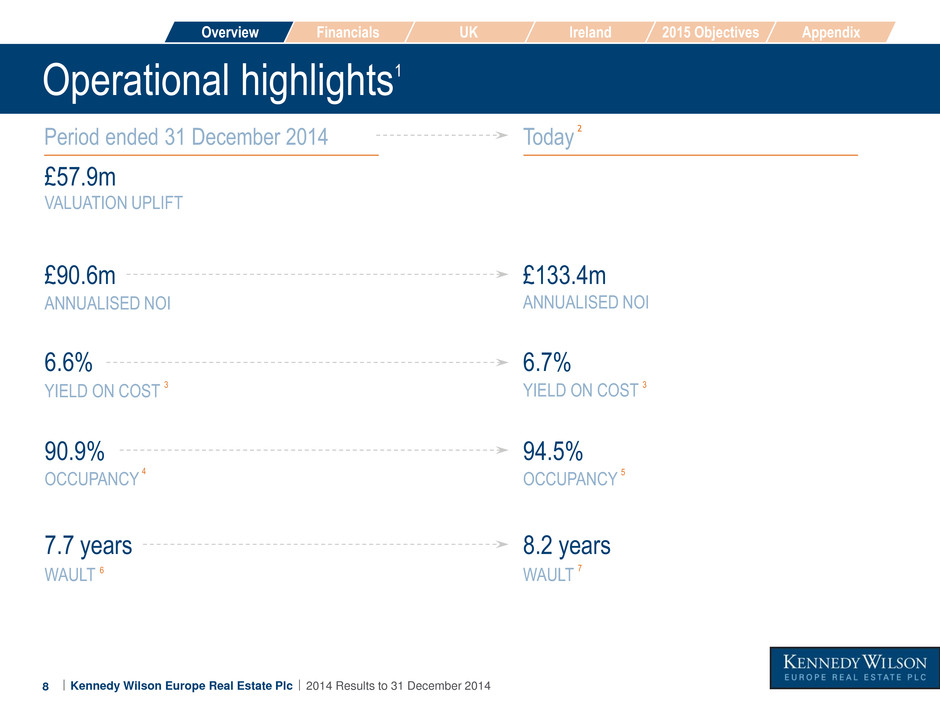
Kennedy Wilson Europe Real Estate Plc 2014 Results to 31 December 2014 £133.4m 8 Operational highlights1 Period ended 31 December 2014 ANNUALISED NOI £90.6m YIELD ON COST 6.6% 3 ANNUALISED NOI Today OCCUPANCY 90.9% 4 2 OCCUPANCY 94.5% 5 VALUATION UPLIFT £57.9m YIELD ON COST 6.7% WAULT 7.7 years 6 WAULT 8.2 years 7 3 Appendix Financials Overview UK Ireland 2015 Objectives

Kennedy Wilson Europe Real Estate Plc 2014 Results to 31 December 2014 1 2 Notes: 2 1 3 4 5 6 GBP equivalent based on €/GBP exchange rate of 0.7825 as at 31 December 2014 As at 25-Feb-15, pro forma post period end acquisitions including the completion of the Aviva/Gatsby portfolio (30-Jan-15), the conversion of the Gardner House loan to direct real estate (11-Feb-15) and the completion of the Park Inn loan portfolio (16-Feb-15) Yield on cost based at acquisition using actual purchaser’s cost EPRA Occupancy by ERV; occupancy by area is 89.6% Post period end pro forma EPRA Occupancy by ERV; occupancy by area is 94.8% Weighted average unexpired lease term to expiry 8.9 years Post period end pro forma weighted average unexpired lease term to expiry 9.5 years 7
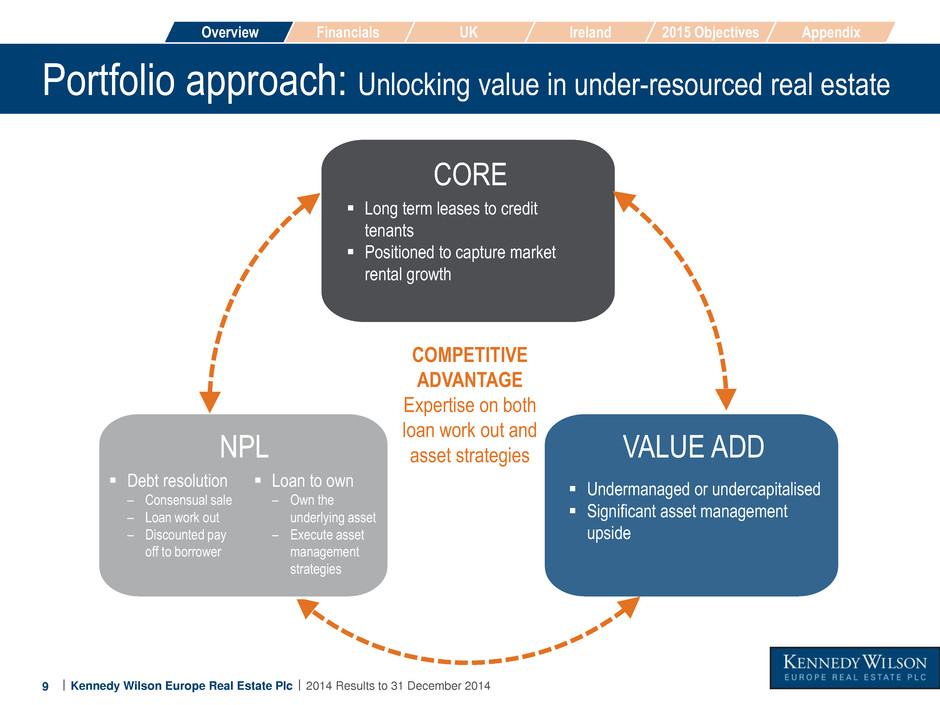
Kennedy Wilson Europe Real Estate Plc 2014 Results to 31 December 2014 9 Portfolio approach: Unlocking value in under-resourced real estate Long term leases to credit tenants Positioned to capture market rental growth CORE Undermanaged or undercapitalised Significant asset management upside VALUE ADD COMPETITIVE ADVANTAGE Expertise on both loan work out and asset strategies NPL Loan to own – Own the underlying asset – Execute asset management strategies Debt resolution – Consensual sale – Loan work out – Discounted pay off to borrower Appendix Financials Overview UK Ireland 2015 Objectives

Kennedy Wilson Europe Real Estate Plc 2014 Results to 31 December 2014 Notes: 1 4

Kennedy Wilson Europe Real Estate Plc 2014 Results to 31 December 2014 10 Portfolio assembly1 Investment programme delivered ahead of plan OPERA & THE MARSHES REFINANCING (IE) GARDNER HOUSE NPL (IE)5 TIGER & ARTEMIS FINANCING (UK) THE MARSHES SHOPPING CENTRE (IE) ELLIOTT LOAN PORTFOLIO (IE) FAIRMONT HOTEL (UK) PORTMARNOCK HOTEL (IE) JUPITER PORTFOLIO (UK)2 LIFFEY TRUST (IE) VANTAGE/CENTRAL PARK (IE) & OPERA PORTFOLIO (IE)4 AVON LOAN PORTFOLIO (UK) CORBO LOAN PORTFOLIO (UK)3 TIGER PORTFOLIO (UK) ARTEMIS PORTFOLIO (UK) 111 BUCKINGHAM PALACE ROAD (UK) 5 SANTISMA TRINIDAD STREET (ES)6 FORDGATE JUPITER B-NOTE (UK)2 CENTRAL PARK FINANCING (IE) £1.5bn of acquisitions across 16 deals £0.4bn of debt financing across 3 deals 400bps between yield and cost of finance FEB-14 MAR-14 APR-14 MAY-14 JUN-14 JUL-14 AUG-14 SEP-14 OCT-14 NOV-14 DEC-14 Appendix Financials Overview UK Ireland 2015 Objectives
Kennedy Wilson Europe Real Estate Plc 2014 Results to 31 December 2014 1 6 Notes: 2 1 3 Based on transaction date of completion On 23 April 2014, KWE acquired the Fordgate Jupiter B-note for £36.5m; on 26 June 2014 KWE purchased the property portfolio for £296.3m and the B-note was repaid Joint venture, KWE economic interest £17.8m The acquisitions of Opera and Central Park were related party transactions and as such a shareholder vote was held at an EGM on 12 June 2014 where the transactions were approved by independent shareholders. Both transactions completed on 24 June 2014 The Gardner House loan was acquired on 19 November 2014 for £34.7m; on 11 February 2015 the loan was transferred to direct real estate on a cashless basis. The stamp duty payable on the purchase of direct real estate was offset by the interest income received since acquisition Joint venture, KWE interest 90% 4 5 6

Kennedy Wilson Europe Real Estate Plc 2014 Results to 31 December 2014 11 Portfolio assembly (cont’d) JAN-15 FEB-15 PARK INN NPL PORTFOLIO (UK) GARDNER HOUSE LOAN CONVERSION TO DIRECT PROPERTY (IE)5 AVIVA/GATSBY PORTFOLIO (UK) AVIVA PORTFOLIO FINANCING (UK) Good pace continues into 2015 £800m+ invested since secondary offering Name Purch. price (£m) Capital value (£ psf) NOI (£m) YOC1 (%) WAULT2 (years) Occupancy3 (%) 111 BPR 207.5 913 10.6 5.1 5.6 100 ST5 4.0 - - - - - Aviva/Gatsby portfolio 503.0 145 36.2 6.9 9.6 98 Gardner House 34.7 460 2.4 6.9 4.0 100 Park Inn NPL portfolio 61.9 na 5.8 9.3 - Total 811.1 198 55.0 6.6 8.5 99 Notes: Yield on cost calculated using actual purchaser’s cost Weighted average unexpired lease term first break Occupancy is calculated based on ERV, on area the occupancy is 98% 1 2 3 STRONG PIPELINE VISIBILITY & SOURCING CAPABILITY AT THE TIME OF SECONDARY ISSUE PURCHASING METRICS Appendix Financials Overview UK Ireland 2015 Objectives

Kennedy Wilson Europe Real Estate Plc 2014 Results to 31 December 2014 Notes: 1 8

Kennedy Wilson Europe Real Estate Plc 2014 Results to 31 December 2014 12 KWE portfolio today1 60% of value across Dublin, London & the South East2 Geographic spread UK Ireland 73% 27% 0% Asset mix 88% Sector mix Office Real Estate loans 40% 12% 31% Retail 4% Industrial 8% Residential 3% 2% Other Spain Direct real estate Real estate loans Hotels 12% Notes: As at 25-Feb-15 including post period end acquisitions Based on direct real estate portfolio of £1,823.6m, excluding loans 1 £2,063.7m £2,063.7m £2,063.7m 2 Appendix Financials Overview UK Ireland 2015 Objectives

Kennedy Wilson Europe Real Estate Plc 2014 Results to 31 December 2014 FINANCIALS 13
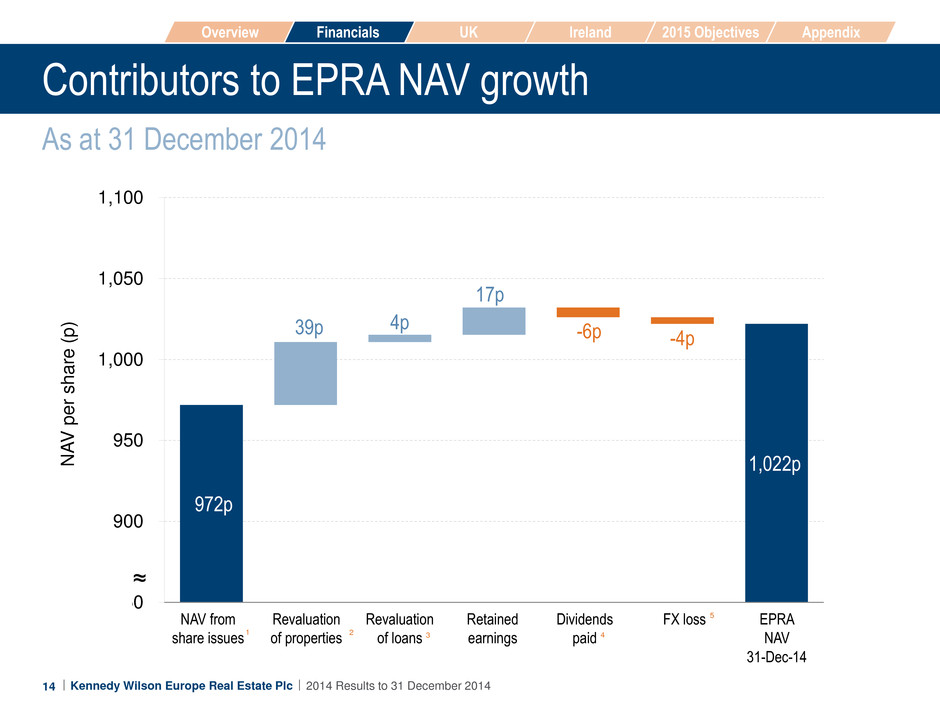
Kennedy Wilson Europe Real Estate Plc 2014 Results to 31 December 2014 972p 1,022p 39p 4p 17p -6p -4p 850 900 950 1,000 1,050 1,100 14 Contributors to EPRA NAV growth N A V per s hare (p ) NAV from share issues Revaluation of properties Revaluation of loans Retained earnings Dividends paid FX loss EPRA NAV 31-Dec-14 1 2 3 4 5 ≈ As at 31 December 2014 Appendix Financials Overview UK Ireland 2015 Objectives

Kennedy Wilson Europe Real Estate Plc 2014 Results to 31 December 2014 2 2 Notes: 2 1 3 Refer to slide 37 for details; represents the net equity proceeds from the IPO (Feb-14) and secondary offering (Oct-15) including shares issued to the Investment Manager in respect of 50% of its fees Net change in fair value of investment and development properties, land and buildings Net change in fair value of loans secured by real estate Interim dividend of 2p was paid on 29-Aug-14 and a further interim dividend of 4p was paid on 6-Nov-14 Foreign currency translation reserve 4 5

Kennedy Wilson Europe Real Estate Plc 2014 Results to 31 December 2014 15 EPRA NAV progression Quarterly EPRA NAV EP R A N A V per s hare (p ) £969.4m £992.9m £999.8m £1,382.4m 968.4p 991.8p 998.7p 1021.8p - 200 400 600 800 1,000 1,200 1,400 1,600 940 950 960 970 980 990 1,000 1,010 1,020 1,030 Q1-14 Q2-14 Q3-14 Q4-14 Net assets (RHS) NAV ps (LHS) EP R A ne t a s s e ts (£ m ) Appendix Financials Overview UK Ireland 2015 Objectives

Kennedy Wilson Europe Real Estate Plc 2014 Results to 31 December 2014 Notes: 2 4

Kennedy Wilson Europe Real Estate Plc 2014 Results to 31 December 2014 25.9p 7.4p -8.9p -9.4p -4.0p -4.4p - 10 20 30 40 50 60 16 Components of EPRA EPS Period to 31 December 2014 E a rn in g s p e r s h a re ( p ) Investment property NOI Loan NOI Office 27.6p Retail 8.8p 45.2p Industrial 6.6p Other 2.2p Net finance cost on borrowings Investment Manager’s fee Corporate expenses Other expenses EPRA EPS 31-Dec-14 1 2 3 4 Appendix Financials Overview UK Ireland 2015 Objectives

Kennedy Wilson Europe Real Estate Plc 2014 Results to 31 December 2014 2 6 Notes: 2 1 3 Investment and development property and hotel net operating income Interest income from loans secured by real estate Professional fees including audit, accounts, tax services and administrator and legal fees, etc Acquisition related expenses and other corporate overheads 4

Kennedy Wilson Europe Real Estate Plc 2014 Results to 31 December 2014 17 NOI growth Annualised NOI movements since IPO 94.2 90.6 133.4 3.2 -1.6 -2.9 -1.2 -1.1 42.0 1.3 -0.5 60 80 100 120 140 ≈ Acq’n NOI AM uplift Ann u a lis ed N O I (£m ) Tenant incentives Baggot Street NOI 31-Dec-14 NOI 25-Feb-15 Disposal AM uplift Disposals Actively managed income for value uplift Voids In the Period to 31 Dec Acq’n NOI Post period end to 25 Feb Vacant possession for redevelopment Appendix Financials Overview UK Ireland 2015 Objectives

Kennedy Wilson Europe Real Estate Plc 2014 Results to 31 December 2014 Notes: 2 8

Kennedy Wilson Europe Real Estate Plc 2014 Results to 31 December 2014 117 545 71 165 225 - 100 200 300 400 500 600 2015 2016 2017 2018 2019 2020 2021 2022 2023 18 Debt profile1 Weighted average interest rate 2.6%2 DEB T EXPI R Y (£m ) RCF – UNDRAWN – FLOATING SECURED – FLOATING SECURED – FIXED FACILITIES MARGIN TOTAL COST2 SECURED 80% 203bps 258bps RCF 20% 160bps3 Na Appendix Financials Overview UK Ireland 2015 Objectives

Kennedy Wilson Europe Real Estate Plc 2014 Results to 31 December 2014 3 0 Notes: 2 1 3 As at 25-Feb-15 including post period end acquisitions; Includes drawn and undrawn facilities. £897.4m of secured debt will be fully drawn on completion of the remaining conditional transfers of assets in the Aviva/Gatsby portfolio Weighted average interest rate at 25 February 2015 using LIBOR and EURIBOR at the latest reset date as per the facility agreements Variable interest rates have been hedged using interest rate caps which at 25 February 2015 covered 72% (£647m ) of total debt is hedged using caps or fixed interest rate capping EURIBOR at 1.5% and LIBOR at 3% Margin ranges between 160 – 260bps, depending on financial covenants at the time of draw down

Kennedy Wilson Europe Real Estate Plc 2014 Results to 31 December 2014 UK 19

Kennedy Wilson Europe Real Estate Plc 2014 Results to 31 December 2014 20 UK regional market rebounding 2004-14 SOUTH EAST & REGIONAL TAKE-UP 0% 2% 4% 6% 8% 10% 12% 14% 1989 1991 1993 1995 1997 1999 2001 2003 2005 2007 2009 2011 2013 2015 Source: Chatham Financials 1 0- Y E A R CON S T A N T M A T U R IT Y GI LT Y IE LD S Locked in Aviva/Gatsby portfolio with 5y & 8y gilt at historical lows – coupon 2.96% DEMAND STARTING TO RECOVER 90 110 130 150 170 190 1999 2004 2009 2014 2019 Excl internet sales 1999 = 100 All retail sales (excl fuels) U K R E T A IL S A LE S V OLU M E S 100 110 120 130 140 150 160 170 100 110 120 130 140 150 1999 2004 2009 2014 2019 NO N -OI L GD P O F F IC E -B A S E D E M P LOYM E N T 1999 = 100 Non-oil GDP Office based employment Source: Oxford Economics 0 1 2 3 4 5 6 7 2004 2005 2006 2007 2008 2009 2010 2011 2012 2013 2014 South East Regional Cities South East Average Regional Average M IL LION S Q F T Appendix Financials Overview UK Ireland 2015 Objectives Source: CBRE GILTS AT THEIR LOWEST POINT IN RECORDED HISTORY

Kennedy Wilson Europe Real Estate Plc 2014 Results to 31 December 2014 21 KWE UK portfolio At 31 December 2014 34% 30% 15% 6% Office Retail Industrial Real Estate Loans Other Central London Greater London South East South West Midlands Wales Scotland 10% 2% 3% Today 23% 19% 17% 6% 7% 0% 18% North 9% 61% 12% 11% 4% 12% 39% 12% 12% 33% 2% Hotel 2% 1 £818m DIRECT REAL ESTATE PORTFOLIO EXCLUDING LOANS1 £1,329m DIRECT REAL ESTATE PORTFOLIO EXCLUDING LOANS3 £933m TOTAL PORTFOLIO INCLUDING LOANS2 £1,506m TOTAL PORTFOLIO INCLUDING LOANS4 Appendix Financials Overview UK Ireland 2015 Objectives

Kennedy Wilson Europe Real Estate Plc 2014 Results to 31 December 2014 3 4 Notes: 2 1 Based on UK direct real estate portfolio excluding loans; portfolio market value based on the independent valuation by CBRE as at 31-Dec-14 Based on total UK portfolio including loans; portfolio market value based on the independent valuation by CBRE (for direct property portfolios) and Duff & Phelps (for loan portfolios) at 31-Dec-14 Based on UK direct real estate portfolio excluding loans and post period end acquisitions added to the independent valuation by CBRE Based on total UK portfolio including loans and post period end acquisitions added to the independent valuation by CBRE and Duff & Phelps 3 4
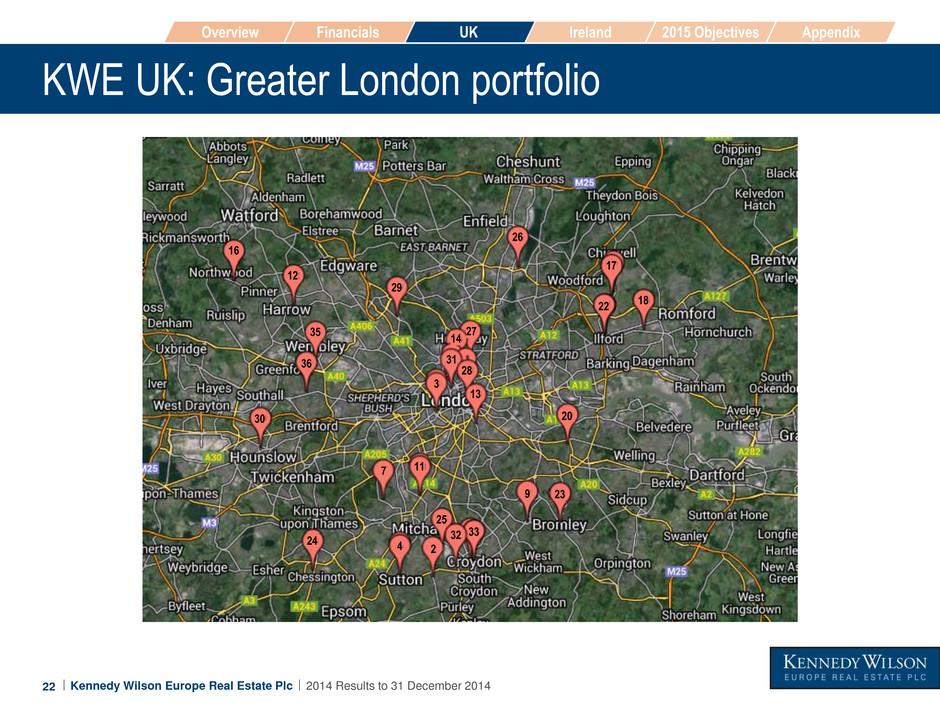
Kennedy Wilson Europe Real Estate Plc 2014 Results to 31 December 2014 22 KWE UK: Greater London portfolio Appendix Financials Overview UK Ireland 2015 Objectives 18 17 22 26 20 23 9 33 32 25 2 4 11 7 24 30 13 3 28 36 35 12 16 29 27 31 14

Kennedy Wilson Europe Real Estate Plc 2014 Results to 31 December 2014 3 6 Notes: 2 1 3 4 5 6 11 Bolt Court, Fleet Street, London, EC4A 110 Manor Road, Wallington, SM6 111 Buckingham Palace Road, Victoria, London, SW1 112/116 High Street, Sutton, SM1 115-131 High Street, Barkingside, IG1 116 High Road, Ilford, IG1 120 Wimbledon Hill Road, London, SW19 13 Grosvenor Gardens, London, SW1W 145/151 High Street, Beckenham, BR3 170/180 High Street, Sutton, SM1 24 A-C Mitcham Road, London, SW17 273 Station Road, Harrow, HA1 330-334 Walworth Road, London, SE17 356-364 Grays Inn Road, London, WC1X 50/51 Great Russell St, London, WC1B 53-55 Joel Street, Northwood Hills, HA6 60 High Road, Ilford, 1G6 713 Green Lane, Dagenham, RM8 North End, Croydon, CR0 79 Kidbrooke Park, London, SE3 9-19 Tooting High Street & 6-12 Totterdown Street, London, SW17 92/94 High Road, Ilford, IG1 156/160 High Street, Bromley, BR1 324 Hook Road, Chessington, KT9 Craig House, Uxbridge Road, West Ealing, W13 97-99 Beddington, Lane, Croydon, CR0 Eley Road, Angel Road Estate, London, N18 First Leisure Health Club, 27 Essex Road, N1 FriarsBridge Court, Blackfriars Road, London, SW1 36 Golders Green Road, London, NW11 Hounslow – Staines Road Retail Park, TW3 41/45 Neal Street, Covent Garden, London, WC2H Mill Lane Trading Estate, Croydon, CR0 Norfolk House, Wellesley Road, Croydon, CR0 40 Athlon Road, London, HAO 7 8 10 9 11 12 13 14 15 16 17 18 19 20 21 22 23 24 25 26 27 28 29 30 31 32 33 34 35

Kennedy Wilson Europe Real Estate Plc 2014 Results to 31 December 2014 23 Asset management achievements Significant level of occupier engagement leading to income growth Re-gear New lease Total No. of transactions 12 26 38 Area (000 sq ft) 252.5 258.4 510.9 NOI uplift (£m) Rental income 1.2 1.5 2.7 Hotel EBITDA 0.3 Loan income 0.5 Total NOI uplift 3.5 Activity to 31 December 2014 Re-gear (office) RUBISLAW HOUSE, ABERDEEN (JUPITER PORFOLIO) 101,700 sq ft building let entirely to Conoco Philips 15-year re-gear, no breaks, from Jan-15 5-yearly rent reviews, min 3% p.a. steps Re-based to market rent, uplift £1.1m +60% No tenant incentives New lease (industrial) LYDIARD FIELDS, SWINDON (TIGER PORTFOLIO) 66,900 sq ft let entirely to The Homebuilding Centre 15-year new lease, no breaks £5 psf + 5% minimum T/O, with 2% indexation Rental uplift £0.15m +50% No capital contribution 1 month rent free period TRIDENT PARK, RUNCORN (TIGER PORTFOLIO) TKMaxx re-gear Term certain increased by 9 years to 2025 Rental uplift £0.55m +50% Capital contribution £0.35m No rent free period Re-gear (retail) Appendix Financials Overview UK Ireland 2015 Objectives

Kennedy Wilson Europe Real Estate Plc 2014 Results to 31 December 2014 24 Case study: 111 Buckingham Palace Road Existing reception Acquired November 2014, 227k sq ft Acquisition for £207.5m; cap value £913 psf Current prime market rents in Victoria are £80 psf+ vs in place average rents at BPR £47 psf: o 89% of current rental income to be reviewed by 2017 with Telegraph (55% of income, 125k sq ft) up for review in Jun-16 o 11% of income expiring within 22 months Refurbish comprehensively + expand new reception ahead of 2016 rent review Rolling fit-out on vacated floors Capitalising on Victoria regeneration Proposed reception Telegraph’s office Proposed entrance Horseferry House, SW1 rent review +15% (Jun-13) “ “ Palmer Street, SW1 rent review +28% (Oct-14) “ “ 16 Palace St, SW1 letting at £68.50 psf (Oct-14) “ “ Appendix Financials Overview UK Ireland 2015 Objectives

Kennedy Wilson Europe Real Estate Plc 2014 Results to 31 December 2014 25 Convenience, 9% London & the SE 17 convenience stores let to Tesco, Sainsbury, M&S Simply Food, Waitrose and Budgens Significant competition for this format provides robust rental evidence Case study: Aviva/Gatsby portfolio1 London, Winchester, Chester & Edinburgh 47% of rents rebased from peak 2007/8 levels allowing for growth Low supply of new retail property and good evidence of increased consumer spending High Street, 36% Norfolk House, 7% Croydon, well connected South London transport Mixed use asset (hotel, office, retail) To benefit from Whitgift Centre £1bn regeneration Good connectivity with Central London & Gatwick Airport Notes: Completed on 30-Jan-15 163 properties with a value of £443.6 million and delayed conditional completion of 17 properties with a value of £59.4 million. 1 £503m purchase 180 mixed use properties across the UK 3.5m sq ft NOI £36.2m YOC 6.9% WAULT 9.6 years Occupancy 98% Stapled debt 2.96% Day 1 cash-on-cash 14.6% UNDER-RESOURCED SINCE FINANCIAL CRISIS Appendix Financials Overview UK Ireland 2015 Objectives

Kennedy Wilson Europe Real Estate Plc 2014 Results to 31 December 2014 IRELAND 26

Kennedy Wilson Europe Real Estate Plc 2014 Results to 31 December 2014 800 900 1,000 1,100 1,200 1,300 1,400 Sep-07 Feb-09 Jun-10 Nov-11 Mar-13 Jul-14 27 Irish economic recovery driving growth in key sectors 80 85 90 95 100 105 110 115 120 2005M01 2007M01 2009M01 2011M01 2013M01 12 CONSECUTIVE MONTHS OF RETAIL SALES IMPROVEMENTS RE T AI L S A LE S V O LU M E IN D E X Source: CSO 2006 2008 2010 2012 2014 Source: CBRE Source: CBRE CBRE expects Dublin office rents will grow 22% to €55 psf in 2015 DUBLIN APARTMENT RENTS GREW 7% LAST YEAR Source: PRTB Dublin apartment rents still 18% below previous peak Retail sales still 15% below peak 2005 = 100 - 400 800 1,200 1,600 2,000 1997 1999 2001 2003 2005 2007 2009 2011 2013 2015 Capital value €psf € / M O N T H R E N T DUBLIN OFFICES VALUES STILL BELOW PEAK € P S F PRIME DUBLIN OFFICE RENTS 2005 – 2015(F) - 10 20 30 40 50 60 70 2005 2007 2009 2011 2013 2015 € P S F (F) (F) Appendix Financials Overview UK Ireland 2015 Objectives

Kennedy Wilson Europe Real Estate Plc 2014 Results to 31 December 2014 Notes: 4 2

Kennedy Wilson Europe Real Estate Plc 2014 Results to 31 December 2014 38%1 17% 13% 26% 1% 28 KWE Ireland: Dublin CBD portfolio KWE Ireland 86% in Greater DublinA Dublin Dublin County Regions 51% 14% 35% £456m DIRECT REAL ESTATE PORTFOLIO EXCLUDING LOANSA Office Retail Residential Real Estate Loans £552m TOTAL PORTFOLIO INCLUDING LOANSB Development Hotel 4% Appendix Financials Overview UK Ireland 2015 Objectives Notes: Includes Baggot Street, Dublin 1 7 9 4 5 21 11 16 20 1 13 6 17 15 3

Kennedy Wilson Europe Real Estate Plc 2014 Results to 31 December 2014 4 4 Notes: 1 3 4 5 6 Based on Irish direct real estate portfolio excluding loans; portfolio market value based on the independent valuation by CBRE as at 31-Dec-14 Based on total Irish portfolio including loans; portfolio market value based on the independent valuation by CBRE and Duff & Phelps as at 31-Dec-14 Baggot Bulding, Dublin 4 Charlemont House, Charlemont Place, Dublin 2 3 College Green, Dublin 2 18 Fleet Street, Dublin Gardner House, Wilton Place, Dublin 2 35 Henry Street, Dublin 1 Irish Times Building, Tara Street, Dublin 2 Liffey Trust, Dublin 1 40/42 Mespil Road, Dublin 4 Russell Court, St Stephens Green, Dublin 2 Southbank House, Barrow Street, Dublin 4 41 St Stephens Green, Dublin 2 The Warehouse, Barrow Street, Dublin 2 16 Westmoreland Street, Dublin 2 7 9 11 13 15 A B 16 17 20 21

Kennedy Wilson Europe Real Estate Plc 2014 Results to 31 December 2014 29 Vantage Central Park Acquired June 2014 Prime rented apartment sector; Phase 1 (272 units) substantially complete; Phase 2 (166 units) at podium level Phase 1: 73 units refurbished; rents typically up 25% 31,000 sq ft of tenant amenities + commercial space; to completed Q2-15 Phase 2: construction commenced Jan-15; completion in Q3 2016 Ireland: Case studies Acquired September 2014 Off-market loan portfolio purchase secured on 17 assets, 3 of which account for 90% of value KWE plans to take control of main assets in 2015 with remainder being sold Significant asset management wins already achieved such as lease up of 11,300 sq ft unit in Times Building Elliot Portfolio ‘loan to own’ Gardner House ‘loan to own’ Acquired November 2014 1 Off-market loan purchase Attractive going-in yield of 6.7% for well located Dublin 2 office building (76,000 sq ft) let to PWC until Dec-18 Completed consensual asset acquisition within 90 days of acquiring the loan Significant asset management opportunities Notes: Acquired two NPLs on 19-Nov-14 and converted into direct real estate on 11-Feb-15 1 Acquired June 2014 90,000 sq ft 1970s building to be stripped back to frame and fully refurbished Planning permission (under appeal) for additional 30,000 sq ft Expected delivery Q2-16 Baggot Street Redevelopment Appendix Financials Overview UK Ireland 2015 Objectives

Kennedy Wilson Europe Real Estate Plc 2014 Results to 31 December 2014 30 Ireland: Development pipeline COMMITTED PIPELINE DEVELOPMENTS Block K, Central Park, Co. Dublin (single asset purchase) Baggot Building, Dublin 2 (Opera portfolio) Rented apartments Office Site 91,000 sq ft Onsite Pre-construction Build 166 resi units + 14,800 sq ft ground floor commercial space Extend by 31,000 sq ft + comprehensively refurbish entire building Start date: Jan-15 Est PC: Q3-16 Start date: Q1-15 Est PC: Q2-16 Notes: 1 Timing sets out earliest expected completion/delivery dates and is subject to planning approvals for Baggot Buildings O p p o rt u n it y Des cr ip ti o n T im in g 1 Appendix Financials Overview UK Ireland 2015 Objectives

Kennedy Wilson Europe Real Estate Plc 2014 Results to 31 December 2014 STRATEGIC OBJECTIVES OVER 2015 31

Kennedy Wilson Europe Real Estate Plc 2014 Results to 31 December 2014 32 Strategic objectives over 2015 Unlocking value of under-resourced real estate 1. Focus on delivering total returns for shareholders where a dividend forms an important component 2. Ensure efficient capital structure within the total debt and equity capital stack 3. Execute on value and asset management initiatives including progressing with significant developments in Ireland 4. Recycle capital to actively manage the portfolio Appendix Financials Overview UK Ireland 2015 Objectives

Kennedy Wilson Europe Real Estate Plc 2014 Results to 31 December 2014 QUESTIONS? 33

Kennedy Wilson Europe Real Estate Plc 2014 Results to 31 December 2014 APPENDIX 34

Kennedy Wilson Europe Real Estate Plc 2014 Results to 31 December 2014 35 Shareholder alignment KW3 c. 15% owner Majority of fees paid in stock Largest investment for KW3 KWE2 KW3 Growing SHAREHOLDING FROM FEES KW3 SENIOR MANAGEMENT 21.0% SHAREHOLDING 100% OF PERFORMANCE FEE PAID IN SHARES 50% OF MANAGEMENT FEE PAID IN SHARES c. 15% SHAREHOLDING 1 + Notes: 14.9% for KW as at 31 December 2014 Kennedy Wilson Europe Real Estate Plc (LSE: KWE) Kennedy-Wilson Holdings, Inc. (NYSE: KW) 2 1 3 Appendix Financials Overview UK Ireland 2015 Objectives
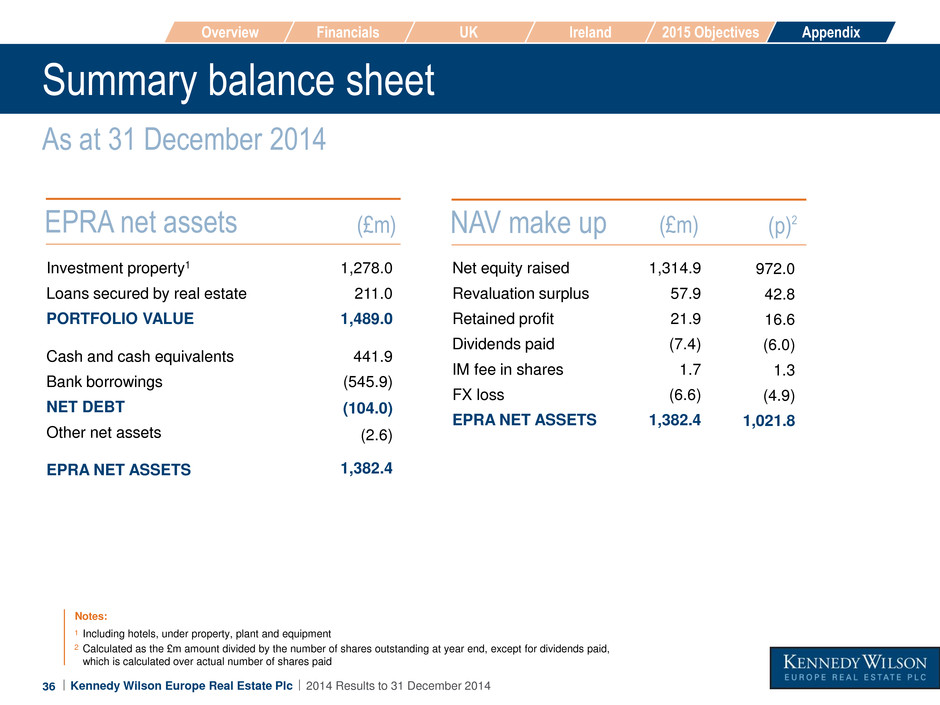
Kennedy Wilson Europe Real Estate Plc 2014 Results to 31 December 2014 36 Summary balance sheet EPRA net assets Investment property1 Loans secured by real estate PORTFOLIO VALUE Cash and cash equivalents Bank borrowings NET DEBT Other net assets EPRA NET ASSETS Notes: Including hotels, under property, plant and equipment Calculated as the £m amount divided by the number of shares outstanding at year end, except for dividends paid, which is calculated over actual number of shares paid 2 1 NAV make up Net equity raised Revaluation surplus Retained profit Dividends paid IM fee in shares FX loss EPRA NET ASSETS (£m) (p)2 (£m) 1,278.0 211.0 1,489.0 441.9 (545.9) (104.0) (2.6) 1,382.4 1,314.9 57.9 21.9 (7.4) 1.7 (6.6) 1,382.4 972.0 42.8 16.6 (6.0) 1.3 (4.9) 1,021.8 As at 31 December 2014 Appendix Financials Overview UK Ireland 2015 Objectives

Kennedy Wilson Europe Real Estate Plc 2014 Results to 31 December 2014 37 Shares issued At 31 December 2014 IPO1 Secondary offering2 Issue of shares for IM fee3 TOTAL No. of shares (m) Date Issue price (p) Gross proceeds (£m) Issue costs (£m) Net proceeds (£m) NAV per share (p) 28-Feb-14 08-Oct-14 100.1 34.9 0.3 135.3 1,000 1,006 1,056 1,001.0 351.5 2.6 1,355.1 32.0 8.2 nil 40.2 969.0 343.3 2.6 1,314.9 968 983 972 Notes: Includes green shoe Firm placing admission date 8 October 2014. Open offer admission date 23 October 2014 Shares are issued to the investment manager to satisfy 50% of the quarterly Investment Manager fee. Issue price is based on the average share price 20 days prior to the date of issue 2 1 3 Appendix Financials Overview UK Ireland 2015 Objectives

Kennedy Wilson Europe Real Estate Plc 2014 Results to 31 December 2014 38 Summary income statement EPRA EPS 25.9p, up from 4.3p in June 2014 Basic and diluted EPS Net change in fair value of: Investment properties Loans secured by real estate Hotels1 Loss on interest rate caps Gain on sale of investment property EPRA earnings 88.0 (55.3) (6.7) (2.1) 2.4 (0.4) 25.9 Period to 31 Dec 2014 Notes: Gain on purchase of business 1 (£m) (p) 78.5 (49.3) (6.0) (1.8) 2.1 (0.4) 23.1 Appendix Financials Overview UK Ireland 2015 Objectives

Kennedy Wilson Europe Real Estate Plc 2014 Results to 31 December 2014 39 KWE portfolio at 31 December Geographic spread UK Ireland 63% 37% 0% Asset mix 86% 14% Sector mix Office Real Estate loans 52% 14% 17% Retail 7% Industrial 5% Residential 4% 1% Other Spain Direct real estate Real estate loans Hotels £1,489.0m £1,489.0m £1,489.0m Appendix Financials Overview UK Ireland 2015 Objectives

Kennedy Wilson Europe Real Estate Plc 2014 Results to 31 December 2014 40 Economic indicators improving Economy in much better place than 12 months ago 0 1 2 3 Italy France Netherlands Germany Spain Ireland ANNUAL AVERAGE GDP GROWTH (%) 2015-19 Source: Oxford Economics 0 1 2 3 4 Russia Eurozone Nordics UK Central Europe Appendix Financials Overview UK Ireland 2015 Objectives

Kennedy Wilson Europe Real Estate Plc 2014 Results to 31 December 2014 41 Ireland: office fundamentals remain strong Office rents expected to grow 22% to €55 psf in 2015 Source: CBRE 11.8% 19.2% 7.9% 10.3% 6.9% 10.3% 14.6% 7.9% 16.4% 2.1% 3.7% 3.3% 5.1% 0% 5% 10% 15% 20% 25% Overall Grade A Dublin Dublin 1, 3, 7 Dublin 2, 4 Dublin 6, 8 IFSC City Centre Overall Suburbs South Suburbs VACANCY RATE BY DISTRICT, Q4 2014 Appendix Financials Overview UK Ireland 2015 Objectives

Kennedy Wilson Europe Real Estate Plc 2014 Results to 31 December 2014 42 European non-performing loan (NPL) market €21.7bn of live sales, and predictions are for €60-70bn of volume in 2015 2014 sales by geography UK Ireland Spain Germany Italy Other Europe CRE loans Residential loans REOs Corporate loans 70% 12% 17% €80.6bn 1% 37% 6% 20% 28% €80.6bn 9% <1% Source: Cushman & Wakefield 2015 live sales by geography Germany Ireland Spain UK 50% 18% 21% 6% €21.7bn Other Europe 5% 2015 planned sales by geography 31% 12% 20% €24.8bn 28% Source: Cushman & Wakefield Italy UK Ireland Rest of Europe Spain Other 4% 5% £24.8bn of planned sales o 83% in KWE target markets SAREB to be a big player in 2015, along with NAMA Pressure on other AMA’s to increase disposals on the back of strong investor demand Secondary sales continue to feature o Attractive off market strategy for KWE o KWE’s ‘loan to own’ strategy led to purchases of c. £390m Jupiter Elliot Gardner House 2014 sales by loan type Appendix Financials Overview UK Ireland 2015 Objectives

Kennedy Wilson Europe Real Estate Plc 2014 Results to 31 December 2014 43 Spain & Italy Spain Italy Positive reforms for real estate o New Italian REITs (SIIQ) o New Provisions on lease agreements o New rules on financing o Labour reforms New sources of capital from the Middle East and Asia Retail sector leading the recovery Growing risk appetite Investment market coming back New supply to come from o Italy fund expiries o Italian government 0.0 0.5 1.0 1.5 2.0 2.5 3.0 3.5 4.0 4.5 2007 2008 2009 2010 2011 2012 2013 2014 CROSS REGIONAL ITALIAN TRANSACTIONS (€M) Source: CBRE Consensus forecast 2.0% and 2.1% GDP growth in 2015/16 o Following in Ireland’s footsteps as one of the fastest growing economies in 2015 o GDP remains 6% below peak o Unemployment still very high but falling SAREB remains significant player o £52.5bn still left on its books at H1-15 o Entering third year of operation 200 300 400 500 600 700 800 900 8 9 10 11 1986 1991 1996 2001 2006 2011 2016 E M P LOYM E N T /S T OC K Source: CBRE, Oxford Economics €P S M 2 01 4Q3 P RIC E S Employment/stock ratio Real rents MADRID OFFICE OUTLOOK Appendix Financials Overview UK Ireland 2015 Objectives
