Attached files
UNITED STATES
SECURITIES AND EXCHANGE COMMISSION
Washington, D.C. 20549
Form 10-K
(Mark One)
x | ANNUAL REPORT PURSUANT TO SECTION 13 OR 15(d) OF THE SECURITIES EXCHANGE ACT OF 1934 |
For the fiscal year ended December 31, 2010
OR
o | TRANSITION REPORT PURSUANT TO SECTION 13 OR 15(d) OF THE SECURITIES EXCHANGE ACT OF 1934 |
For the transition period from to
Commission file number: 001-33824
Kennedy-Wilson Holdings, Inc.
(Exact Name of Registrant as Specified in Its Charter)
Delaware | 26-0508760 | |
(State or Other Jurisdiction of Incorporation or Organization) | (I.R.S. Employer Identification No.) | |
9701 Wilshire Blvd., Suite 700 Beverly Hills, CA | 90212 | |
(Address of Principal Executive Offices) | (Zip Code) | |
(310) 887-6400
(Registrant’s telephone number, including area code)
Securities registered pursuant to Section 12(b) of the Act:
______________________________________________________________________
Title of Each Class | Name of Each Exchange on which Registered | |
Common Stock, $.0001 par value | NYSE |
Securities registered pursuant to Section 12(g) of the Act: None
______________________________________________________________________
Indicate by check mark if the registrant is a well-known seasoned issuer, as defined in Rule 405 of the Securities Act. Yes o No x
Indicate by check mark if the registrant is not required to file reports pursuant to Section 13 or Section 15(d) of the Act. Yes o No x
Indicate by check mark whether the registrant: (1) has filed all reports required to be filed by Section 13 or 15(d) of the Securities Exchange Act of 1934 during the preceding 12 months (or for such shorter period that the registrant was required to file such reports), and (2) has been subject to such filing requirements for the past 90 days. Yes x No o
Indicate by check mark whether the registrant has submitted electronically and posted on its corporate Website, if any, every Interactive Data File required to be submitted and posted pursuant to Rule 405 of Regulation S-T during the preceding 12 months (or such shorter period that the registrant was required to submit and post such files). Yes o No o
Indicate by check mark if disclosure of delinquent filers pursuant to Item 405 of Regulation S-K is not contained herein, and will not be contained, to the best of registrant’s knowledge, in definitive proxy or information statements incorporated by reference in Part III of this Form 10-K or any amendment to this Form 10-K. o
Indicate by check mark whether the registrant is a large accelerated filer, an accelerated filer, a non-accelerated filer, or a smaller reporting company. See definition of “large accelerated filer,” “accelerated filer” and “smaller reporting company” in Rule 12b-2 of the Exchange Act:
Large accelerated filer | o | Accelerated filer | x | ||||
Non-accelerated filer | o | (Do not check if a smaller reporting company) | Smaller reporting company | o | |||
Indicate by check mark whether the registrant is a shell company (as defined in Rule 12b-2 of the Exchange Act). Yes o No x
Based on the last sale at the close of business on June 30, 2010, the aggregate market value of the registrant’s common stock held by non-affiliates of the registrant was approximately $154,130,736.90.
The number of shares of common stock outstanding as of March 1, 2011 was 40,179,906.
DOCUMENTS INCORPORATED BY REFERENCE
Part III of this report incorporates certain information by reference from the registrant’s proxy statement for the annual meeting of stockholders to be held on or around June 24, 2010, which proxy statement will be filed no later than 120 days after the close of the registrant’s fiscal year ended December 31, 2010.
TABLE OF CONTENTS
Page | ||||
PART I | ||||
Item 1. | ||||
Item 1A. | ||||
Item 1B. | ||||
Item 2. | ||||
Item 3. | ||||
Item 4. | ||||
PART II | ||||
Item 5. | ||||
Item 6. | ||||
Item 7. | ||||
Item 7A. | ||||
Item 8. | ||||
Item 9. | ||||
Item 9A. | ||||
Item 9B. | ||||
PART III | ||||
Item 10. | ||||
Item 11. | ||||
Item 12. | ||||
Item 13. | ||||
Item 14. | ||||
PART IV | ||||
Item 15. | ||||
FORWARD-LOOKING STATEMENTS
Statements made by us in this report and in other reports and statements released by us that are not historical facts constitute “forward-looking statements” within the meaning of Section 27A of the Securities Act of 1933, as amended (the “Securities Act”) and Section 21 of the Securities Exchange Act of 1934, as amended (the “Exchange Act”). These forward-looking statements are necessarily estimates reflecting the judgment of our senior management based on our current estimates, expectations, forecasts and projections and include comments that express our current opinions about trends and factors that may impact future operating results. Disclosures that use words such as “believe,” “anticipate,” “estimate,” “intend,” “could,” “plan,” “expect,” “project” or the negative of these, as well as similar expressions, are intended to identify forward-looking statements.
Forward-looking statements are not guarantees of future performance, rely on a number of assumptions concerning future events, many of which are outside of our control, and involve known and unknown risks and uncertainties that could cause our actual results, performance or achievement, or industry results, to differ materially from any future results, performance or achievements, expressed or implied by such forward-looking statements. Although we believe that our plans, intentions, expectations, strategies and prospects as reflected in or suggested by those forward-looking statements are reasonable, we do not guarantee that the transactions and events described will happen as described (or that they will happen at all). For a further discussion of these and other factors that could impact our future results, performance or transactions, please carefully read “Risk Factors” in Part I, Item 1A below.
• | disruptions in general economic and business conditions, particularly in geographies where our business may be concentrated; |
• | the continued volatility and disruption of the capital and credit markets, higher interest rates, higher loan costs, less desirable loan terms and a reduction in the availability of mortgage loans and mezzanine financing, all of which could increase costs and could limit our ability to acquire additional real estate assets; |
• | continued high levels of, or increases in, unemployment and general slowdowns in commercial activity; |
• | our leverage and ability to refinance existing indebtedness or incur additional indebtedness; |
• | an increase in our debt service obligations; |
• | our ability to generate a sufficient amount of cash from operations to satisfy working capital requirements and to service our existing and future indebtedness; |
• | our ability to achieve improvements in operating efficiency; |
• | foreign currency fluctuations; |
• | adverse changes in the securities markets; |
• | our ability to retain our senior management and attract and retain qualified and experienced employees; |
• | our ability to attract new user and investor clients; |
• | our ability to retain major clients and renew related contracts; |
• | trends in use of large, full-service commercial real estate providers; |
• | changes in tax laws in the United States or Japan that reduce or eliminate deductions or other tax benefits we receive; |
• | future acquisitions may not be available at favorable prices or upon advantageous terms and conditions; and |
• | costs relating to the acquisition of assets we may acquire could be higher than anticipated. |
Any such forward-looking statements, whether made in this report or elsewhere, should be considered in the context of the various disclosures made by us about our businesses including, without limitation, the risk factors discussed below. Except as required under the federal securities laws and the rules and regulations of the U.S. Securities and Exchange Commission (the “SEC”), we do not have any intention or obligation to update publicly any forward-looking statements, whether as a result of new information, future events, changes in assumptions, or otherwise. For further discussion of these and other factors that could impact our future results, performance or transactions, please carefully read "Risk Factors" in Part I, Item 1A below.
PART I
Item 1. Business
Company Overview
Founded in 1977, Kennedy-Wilson Holdings, Inc. (which may be referred to, together with its subsidiaries, as “company,” “we,” “us,” and “our”) is an international real estate investment and services firm. We have grown from a real estate auction business into a vertically-integrated real estate operating company with approximately 300 professionals in 22 offices throughout the U.S. and Japan. We have over $7 billion of assets under management totaling over 40 million square feet of properties throughout the United States ("U.S.") and Japan, including ownership in 11,971 multifamily apartment units.
We are a holding company whose primary business operations are conducted through its wholly owned subsidiary, Kennedy-Wilson, Inc., or "Kennedy Wilson". Kennedy-Wilson Holdings, Inc. was incorporated in Delaware on July 9, 2007, under the name “Prospect Acquisition Corp.” On November 13, 2009, KW Merger Sub Corp., a wholly owned subsidiary of Prospect Acquisition Corp., merged with Kennedy Wilson, resulting in Kennedy Wilson becoming a wholly owned subsidiary of Prospect Acquisition Corp. Promptly after the merger, we changed the company name to “Kennedy-Wilson Holdings, Inc,” which is now listed on the New York Stock Exchange ("NYSE"). We refer to this transaction as the "Merger" throughout this document.
Business Segments
We are defined by two core business segments: KW Investments and KW Services. KW Investments invests our capital and our equity partners capital in multifamily, residential and office properties as well as loans secured by real estate. KW Services provides a full array of real estate-related services to investors and lenders, with a strong focus on financial institution-based clients.
KW Investments
We invest our capital and our equity partners capital in real estate assets through joint ventures, separate accounts, commingled funds, and wholly-owned. We are typically the general partner in these investment vehicles with ownership interests ranging from approximately 5%-50%. Our equity partners include financial institutions, foundations, endowments, high net worth individuals and other institutional investors. In many cases we get a promoted interest in the profits of our investments beyond our ownership percentage.
Our investment philosophy is based on three core fundamentals:
• | significant proprietary deal flow from an established network of industry relationships, particularly with financial institutions; |
• | focus on a systematic research process with a disciplined approach to investing; and |
• | superior in-house operating execution. |
Our primary investment markets include California, Washington, Hawaii and Japan, which we have identified as areas with dense populations, high barriers to entry, scarcity of land and supply constraints. We typically focus on the following opportunities:
• | real estate owners or lenders seeking liquidity; |
• | under-managed or under-leased assets; and |
• | repositioning opportunities. |
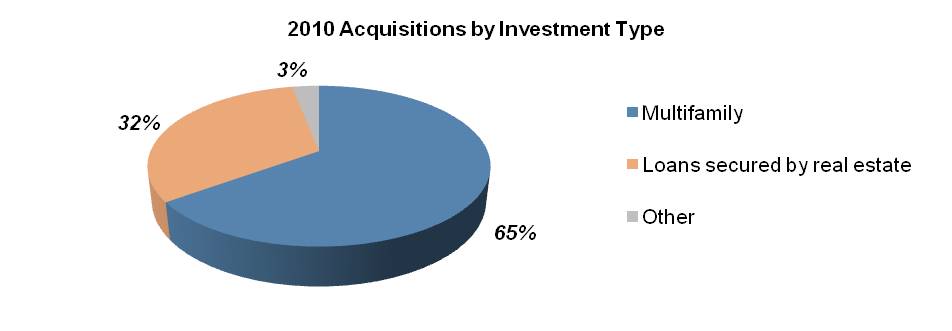
In 2010, we and our equity partners acquired $2.025 billion of real estate assets. Eighty-five percent of these acquisitions were sourced directly from financial institutions. Our 2010 acquisition activity consisted of the following investment types listed in the first table below:
1
Since 1999, we and our equity partners have invested in 201 transactions, deploying over $6.4 billion of capital, including $2.3 billion of equity. Of the transactions, 93 have been realized and generated an internal rate of return or "IRR" of 43% and a 1.7x equity multiple. Our equity partners and our current portfolio consists of 108 investments totaling over $3.4 billion of capital, including $1.2 billion of equity.
The following table describes our investment account, which includes the following financial statement captions below, and is derived from our consolidated balance sheet for the year ended December 31, 2010:
Dollars in millions | ||||
Investment in joint ventures | $ | 266.9 | ||
Real estate | 82.7 | |||
Mortgage debt | (35.2 | ) | ||
Notes receivable | 24.1 | |||
Loan pool participations | 25.2 | |||
$ | 363.7 | |||
The following table breaks down our investment account information derived from our consolidated balance sheet by investment type and geographic location:
Dollars in millions | |||||||||||||||||||||||
Multifamily | Loans Secured by Real Estate | Residential (1) | Office | Other | Total | ||||||||||||||||||
California | $ | 67.4 | $ | 63.7 | $ | 3.8 | $ | 18.3 | $ | — | $ | 153.2 | |||||||||||
Japan | 108.3 | — | — | 6.1 | — | 114.4 | |||||||||||||||||
Hawaii | — | 10.7 | 46.9 | — | — | 57.6 | |||||||||||||||||
Washington | 21.0 | 2.9 | 2.3 | 1.5 | — | 27.7 | |||||||||||||||||
Other | 2.7 | 4.9 | 0.3 | 0.8 | 2.1 | 10.8 | |||||||||||||||||
Total | $ | 199.4 | $ | 82.2 | $ | 53.3 | $ | 26.7 | $ | 2.1 | $ | 363.7 | |||||||||||
—————
(1) Includes for-sale residential, condominiums and residential land.
KW Services
KW Services offers a comprehensive line of real estate services for the full lifecycle of real estate ownership and investment to clients that include financial institutions, developers, builders and government agencies. KW Services has three business lines: auction and conventional sales, property services and investment management. These three business lines generate revenue for us through commissions and fees.
Since our inception, we have sold more than $10 billion of real estate through our auction platform and are considered one of the leaders in auction marketing, conducting live and online auctions. The auction group executes accelerated marketing
2
programs for all types of residential and commercial real estate. In 2010, we auctioned and conventionally sold over 40 projects in three countries and 18 states including California, Washington, Hawaii, Oregon, Texas, Nevada, Florida, Georgia, and North Carolina.
We manage over 40 million square feet of properties for institutional clients and individual investors in the U.S. and Japan, including 11,971 apartment units owned by us. With 22 offices throughout the U.S. and Japan, including five regional hubs, we have the capabilities and resources to provide property services to real estate owners as well as the experience as a real estate investor to understand client concerns.
Through our investment management business, we provide acquisition, asset management and disposition services to our equity partners as well as to third parties.
Additionally, KW Services plays a critical role in supporting the company's investment strategy by providing local market intelligence and real-time data for evaluating and valuing investments, generating proprietary transaction flow and creating value through efficient implementation of asset management or repositioning strategies.
Industry Overview
United States
We believe that the recent economic, capital and credit markets events have and will continue to create tremendous buying opportunities as properties may be purchased at significant discounts to historical cost. Many asset dispositions will result from:
▪ | highly leveraged property owners who will have loans maturing in 2011 and 2012 but will be unable to refinance; |
▪ | asset and loan sales directly from financial institutions; and |
▪ | companies reducing real estate portfolios to raise cash and shore up their balance sheets |
As sellers continue to be under pressure to move assets off of their balance sheets, we believe that our strong sourcing relationships will position us to acquire properties at steep discounts. Sellers will look to firms that they have relationships with and that can execute quickly and discreetly.
Over the past several years, many U.S. real estate markets have experienced a downturn in occupancy and property values. Unlike the last cycle, this recent downturn was driven by the lack of liquidity and the tightening of the credit markets rather than by an oversupply of new products. We believe that underlying real estate fundamentals have remained solid, particularly in major metropolitan and downtown areas where supply constraints exist.
Japan
It is expected that Japan, while still subject to the same market forces affecting economies across the globe, will likely experience a shorter economic downturn than that experienced in other industrialized economies because the Japanese banking system remains strong relative to its peers. We believe that the Japan's economy is in a better position to weather current economic conditions because, over the past decade, Japanese households have saved money and companies have steeply reduced their debt levels as a percentage of GDP. In the current credit environment, as in the U.S., highly-leveraged investors in Japan have been forced to reduce their debt.
Japan's current demographic trends include an influx of migration to major cities, creating strong demand for housing. Our research shows that real estate fundamentals have remained strong in greater Tokyo's residential market, and, in particular, in Tokyo's three major wards: Minato-ku, Shibuya-ku, and Setagaya-ku. With diminishing supply of new inventory due to stricter building regulations imposed in 2007, rents for quality assets are expected to remain strong while vacancy rates remain stable. We expect that properties in the greater Tokyo area that are newer and of higher quality will remain target assets for acquisition by many institutional investors.
Competition
We compete with a range of local and national real estate firms, individual investors and other corporations. Because of our unique mix of investment and service businesses, we compete with brokerage and property management companies as well as companies that invest in real estate and real estate secured loans. Our investment business competes with real estate investment partnerships, real estate investments trusts, other investment companies and regional investors and developers, especially those that invest in the western United States, Hawaii and Japan. We compete with them on the basis of our relationships with the sellers and our ability to close an investment transaction in a short time period at competitive pricing. The real estate services business is both highly fragmented and competitive. We compete with real estate brokerage and auction companies on the basis of our relationship with property owners, quality of service, and commissions charged. We compete
3
with property management and leasing firms also on the basis of our relationship with clients, the range and quality of services provided, and fees and commissions charged.
Competitive Advantages
We believe that the company has a unique platform from which to execute our investment and services strategy. The combination of a service business (including auctions) and an investment platform provides significant competitive advantages over other real estate buyers operating stand-alone or investment-focused firms and may allow us to generate superior risk-adjusted returns. Our investment strategy focuses on investments that offer significant appreciation potential through intensive property management, leasing, repositioning, redevelopment and the opportunistic use of capital. We differentiate ourselves from other firms in the industry with our full service, investment oriented structure. Whereas most other firms use an investment platform to obtain additional service business revenue, we use our service platform to enhance the investment process and ensure the alignment of interests with our investors.
Our competitive advantages include:
• | Transaction experience: Our Executive Committee has more than 125 years of combined real estate experience and has been working and investing together on average for over 15 years. Members of the Executive Committee have collectively acquired, developed and managed in excess of $15 billion of real estate investments in the U.S. and Japan through various economic cycles at our company and throughout their careers. |
• | Extensive relationship and sourcing network: We leverage our services business in order to source off-market deals. In addition, the Executive Committee and our acquisition team have transacted deals in nearly every major metropolitan market on the West Coast of the U.S., as well as in Japan. Their local presence and reputation in these markets have enabled them to cultivate key relationships with major holders of property inventory, in particular financial institutions, throughout the real estate community. |
• | Structuring expertise and speed of execution: Prior acquisitions completed by us have taken a variety of forms including direct property investments, joint ventures, exchanges involving stock or operating partnership units, participating loans and investments in performing and non-performing mortgages with the objective of long-term ownership. We believe we have developed a reputation of being able to quickly execute, as well as originate and creatively structure acquisitions, dispositions and financing transactions. |
• | Vertically-integrated platform for operational enhancement: We have approximately 300 employees in both KW Investments and KW Services, with 22 regional offices throughout the U.S. and Japan. This geographically diversified business model is aimed at weathering real estate cycles. We have a hands-on approach to real estate investing and possess the local expertise in property management, leasing, construction management, development and investment sales, which we believe enable us to invest successfully in selected submarkets. |
• | Risk protection and investment discipline: We underwrite our investments based upon a thorough examination of property economics and a critical understanding of market dynamics and risk management strategies. We conduct an in-depth sensitivity analysis on each of our acquisitions. This analysis applies various economic scenarios that include changes to rental rates, absorption periods, operating expenses, interest rates, exit values and holding periods. We use this analysis to develop our disciplined acquisition strategies. |
Transaction based results
A significant portion of our cash flow is tied to transaction activity, which can affect an investor’s ability to compare our financial condition and results of operations on a quarter-by-quarter basis. Historically, this seasonality has caused our revenue, operating income, net income and cash flows from operating activities to be tied to transaction activity, which is not necessarily concentrated in any one quarter.
Employees
As of December 31, 2010, we had approximately 300 professionals in 22 offices throughout the U.S. and Japan. We believe that we have been able to attract and maintain high quality employees. There are no employees subject to collective bargaining agreements. In addition, we believe we have a good relationship with our employees.
Item 1A. Risk Factors
Our results of operations and financial condition can be adversely affected by numerous risks. You should carefully
4
consider the risk factors detailed below in conjunction with the other information contained in this report. If any of the following risks actually occur, our business, financial condition, operating results, cash flows and/or future prospects could be materially adversely affected.
Risks Related to Our Business
The success of our business is significantly related to general economic conditions and the real estate industry and, accordingly, our business could be harmed by an economic slowdown and downturn in real estate asset values, property sales and leasing activities.
Our business is closely tied to general economic conditions in the real estate industry. As a result, our economic performance, the value of our real estate and real estate secured notes, and our ability to implement our business strategies may be affected by changes in national and local economic conditions. The condition of the real estate markets in which we operate tends to be cyclical and related to the condition of the economy in the U.S. and Japan as a whole and to the perceptions of investors of the overall economic outlook. Rising interest rates, declining employment levels, declining demand for real estate, declining real estate values or periods of general economic slowdown or recession or the perception that any of these events may occur have negatively impacted the real estate market in the past may in the future negatively affect our performance. In addition, the economic condition of each local market where we operate may be dependent on one or more industries. Our ability to change our portfolio promptly in response to economic or other conditions is limited. Certain significant expenditures, such as debt service costs, real estate taxes, and operating and maintenance costs are generally not reduced when market conditions are poor. These factors would impede us from responding quickly to changes in the performance of our investments and could adversely impact our business, financial condition and results of operations. We have experienced in past years and expect in the future to be negatively impacted by, periods of economic slowdown or recession, and corresponding declines in the demand for real estate and related services, within the markets in which we operate. The previous recession and the downturn in the real estate market have resulted in and/or may result in:
• | a general decline in rents due to defaulting tenants or less favorable terms for renewed or new leases; |
• | fewer purchases and sales of properties by clients, resulting in a decrease in property management fees and brokerage commissions; |
• | a decline in actual and projected sale prices of our properties resulting in lower returns on the properties in which we have invested; |
• | higher interest rates, higher loan costs, less desirable loan terms and a reduction in the availability of mortgage loans and mezzanine financing, all of which could increase costs and could limit our ability to acquire additional real estate assets; and |
• | a decrease in the availability of lines of credit and other sources of capital used to purchase real estate investments and distressed notes. |
If the economic and market conditions that prevailed in 2008 and 2009 were to return, our business performance and profitability could deteriorate. If this were to occur, we could fail to comply with certain financial covenants in our revolving credit agreement which would force us to seek an amendment with our lenders. No assurance can be given that we would be able to obtain any necessary waivers or amendments on satisfactory terms, if at all. In addition, in an extreme deterioration of our business, we could have insufficient liquidity to meet our debt service obligations when they come due in future years.
Adverse developments in the credit markets may harm our business, results of operations and financial condition.
Disruptions in the credit markets may adversely affect our business of providing advisory services to owners, investors and occupiers of real estate in connection with the leasing, disposition and acquisition of property. If our clients are unable to procure credit on favorable terms, there may be fewer completed leasing transactions, dispositions and acquisitions of property. In addition, if purchasers of real estate are not able to procure favorable financing resulting in the lack of disposition opportunities for our funds and projects, our services businesses will generate lower incentive fees and we may also experience losses of co-invested equity capital if the disruption causes a permanent decline in the value of investments made.
In 2008 and 2009, the credit markets experienced a disruption of unprecedented magnitude. This disruption reduced the availability and significantly increased the cost of most sources of funding. In some cases, these sources were eliminated. While the credit market has shown signs of improving since the second half of 2009, liquidity remains constrained and it is impossible to predict when the market will return to normalcy. This uncertainty may lead market participants to continue to act more conservatively, which may amplify decreases in demand and pricing in the markets we serve.
We could lose part or all of our investment in the real estate assets we have interests in, which could have a material
5
adverse effect on our financial condition and results of operations.
There is the inherent possibility in all of our real estate investments that we could lose all or part of our investment. Real estate investments are generally illiquid, which may affect our ability to change our portfolio in response to changes in economic and other conditions. Moreover, regarding our investment in real estate, we may not be able to unilaterally decide the timing of the disposition of an investment, and as a result, may not control when and whether any gain will be realized or loss avoided. The value of our investments can also be diminished by:
• | civil unrest, acts of war and terrorism and acts of God, including earthquakes, hurricanes and other natural disasters (which may result in uninsured or underinsured losses); |
• | the impact of present or future legislation in the U.S. or in Japan (including environmental regulation, changes in laws concerning foreign ownership of property, changes in real estate tax rates, changes in zoning laws and laws requiring upgrades for disabled persons) and the cost of compliance with these types of legislation; and |
• | liabilities relating to claims to the extent insurance is not available or is inadequate. |
We may be unsuccessful in renovating the properties we acquire resulting in investment losses.
Part of our investment strategy is to locate and acquire real estate assets that we believe are undervalued and to improve them to increase their resale value. We face risks arising from the acquisition of properties not yet fully developed or in need of substantial renovation or redevelopment, particularly the risk that we overestimate the value of the property and the risk that the cost or time to complete the renovation or redevelopment will exceed the budgeted amount. Such delays or cost overruns may arise from:
• | shortages of materials or skilled labor; |
• | a change in the scope of the original project; |
• | the difficulty in obtaining necessary zoning, land-use, environmental, building, occupancy and other governmental permits and authorization; |
• | the discovery of structural or other latent defects in the property once construction has commenced; and |
• | delays in obtaining tenants. |
Any failure to complete a redevelopment project in a timely manner and within budget or to sell or lease the project after completion could have a material adverse effect upon our business, results of operation and financial condition.
We may not recover part or any of our investment in the mezzanine loans we make or acquire due to a number of factors including the fact that such loans are subordinate to the interests of senior lenders.
We have made and expect to continue to make or acquire mezzanine loans, which are loans that are secured by real property, but are subject to the interests of lenders who are senior to us. These mezzanine loans are considered to involve a high degree of risk compared to other types of loans secured by real property. This is due to a variety of factors, including that a foreclosure by the holder of the senior loan could result in its mezzanine loan becoming uncollectible. Accordingly, we may not recover the full amount, or any, of our investment in mezzanine loans. In addition, mezzanine loans may have higher loan to value ratios than conventional term loans.
Our operations in Japan subject us to additional social, political and economic risks associated with conducting business in foreign countries, which may materially adversely effect our business and results of operations.
One of our strategies for the future is to continue our operations in Japan. The scope of our international operations may lead to more volatile financial results and difficulties in managing our businesses. This volatility and difficulty could be caused by, among other things, the following:
• | restrictions and problems relating to the repatriation of profits; |
• | difficulties and costs of staffing and managing international operations; |
• | the burden of complying with multiple and potentially conflicting laws; |
• | laws restricting foreign companies from conducting business and unexpected changes in regulatory requirements; |
• | the impact of different business cycles and economic instability; |
• | political instability and civil unrest; |
• | greater difficulty in perfecting our security interests, collecting accounts receivable, foreclosing on security and protecting our interests as a creditor in bankruptcies in certain geographic regions; |
6
• | potentially adverse tax consequences; |
• | share ownership restrictions on foreign operations; |
• | Japanese property and income taxes, tax withholdings and tariffs; and |
• | geographic, time zone, language and cultural differences between personnel in different areas of the world. |
Our joint venture activities subject us to unique third-party risks, including risks that other participants may become bankrupt or take action contrary to our best interests.
We have utilized joint ventures for large commercial investments and real estate developments. We plan to continue to acquire interests in additional limited and general partnerships, joint ventures and other enterprises, collectively referred to herein as “joint ventures”, formed to own or develop real property or interests in real property or note pools. It is our strategy in Japan to invest primarily through joint ventures. We have acquired and may acquire minority interests in joint ventures and we may also acquire interests as a passive investor without rights to actively participate in management of the joint ventures. Investments in joint ventures involve additional risks, including the possibility that the other participants may become bankrupt or have economic or other business interests or goals which are inconsistent with ours, that we will not have the right or power to direct the management and policies of the joint ventures and that other participants may take action contrary to our instructions or requests and against our policies and objectives. Should a participant in a material joint venture act contrary to our interest, it could have a material adverse effect upon our business, results of operations and financial condition. Moreover, we cannot be certain that we will continue these investments, or that we can identify suitable joint venture partners and form new joint ventures in the future.
We purchase distressed loans and loan portfolios that have a higher risk of default and delinquencies than newly originated loans and as a result, we may lose part or all of our investment in such loans and loan portfolios.
We may purchase loans and loan portfolios that are unsecured or secured by real or personal property. These loans and loan portfolios are generally non-performing or sub-performing, and often are in default at the time of purchase. In general, the distressed loans and loan portfolios we acquire are highly speculative investments and have a greater than normal risk of future defaults and delinquencies as compared to newly originated loans. Returns on loan investments depend on the borrower’s ability to make required payments or, in the event of default, our security interests, if any, and our ability to foreclose and liquidate whatever property that secure the loans and loan portfolios. We cannot be sure that we will be able to collect on a defaulted loan or foreclose on security successfully or in a timely fashion. There may also be instances when we are able to acquire title to an underlying property and sell it, but not make a profit on its investment.
We may not be successful in competing with companies in the real estate services and investment industry, some of which may have substantially greater resources than we do.
Real estate investment and services businesses are highly competitive. Our principal competitors include both large multinational companies and national and regional firms, such as Jones Lang LaSalle, Inc. and CB Richard Ellis, Inc. Many of our competitors have greater financial resources and a broader global presence than we do. We compete with companies in the U.S., and, to a limited extent, in Japan, with respect to:
• | selling commercial and residential properties on behalf of customers through brokerage and auction services; |
• | leasing and property management, including construction and engineering services; |
• | purchasing commercial and residential properties, as well as undeveloped land for our own account; and |
• | acquiring secured and unsecured loans. |
Our services operations must compete with a growing number of national firms seeking to expand market share. There can be no assurance that we will be able to continue to compete effectively, maintain current fee levels or arrangements, continue to purchase investment property profitably or avoid increased competition.
If we are unable to maintain or develop new client relationships, our service business and financial condition could be substantially impaired.
We are highly dependent on long-term client relationships and on revenues received for services with third-party owners and related parties. A considerable amount of our revenues are derived from fees related to our service business.
The majority of our property management agreements are cancelable prior to their expiration by the client for any reason on as little as 30 to 60 days’ notice. These contracts also may not be renewed when their respective terms expire. If we fail to maintain existing relationships, fail to develop and maintain new client relationships or otherwise lose a substantial number of
7
management agreements, we could experience a material adverse change in our business, financial condition and results of operations.
Decreases in the performance of the properties we manage are likely to result in a decline in the amount of property management fees and leasing commissions we generate.
Our property management fees are generally structured as a percentage of the revenues generated by the properties that we manage. Similarly, our leasing commissions typically are based on the value of the lease commitments. As a result, our revenues are adversely affected by decreases in the performance of the properties we manage and declines in rental value. Property performance will depend upon, among other things, our ability to control operating expenses (some of which are beyond our control), and financial conditions generally and in the specific areas where properties are located and the condition of the real estate market generally. If the performance or rental values of the properties we manage decline, the management fees and leasing commissions we derive from such properties could be materially adversely affected.
Our leasing activities are contingent upon various factors including tenant occupancy and rental rates, which if adversely affected, could cause our operating results to suffer.
A significant portion of our property management business involves facilitating the leasing of commercial space. In certain areas of operation, there may be inadequate commercial space to meet demand and there is a potential for a decline in the number of overall lease and brokerage transactions. In areas where the supply of commercial space exceeds demand, we may not be able to renew leases or obtain new tenants for our owned and managed rental properties as leases expire. Moreover, the terms of new leases and renewals (including renovation costs or costs of concessions to tenants) may be less favorable than current leases. Our revenues may be adversely affected by the failure to promptly find tenants for substantial amounts of vacant space, if rental rates on new or renewal leases are significantly lower than expected, or if reserves for costs of re-leasing prove inadequate. We cannot be sure that we can continue to lease properties for our clients and for our own account in a profitable manner.
Our ability to lease properties also depends on:
• | the attractiveness of the properties to tenants; |
• | competition from other available space; |
• | our ability to provide for adequate maintenance and insurance and to pay increased operating expenses which may not be passed through to tenants; |
• | the availability of capital to periodically renovate, repair and maintain the properties, as well as for other operating expenses; and |
• | the existence of potential tenants desiring to lease the properties. |
If we are unable to identify, acquire and integrate suitable acquisition targets, our future growth will be impeded.
Acquisitions and expansion have been, and will continue to be, a significant component of our growth strategy for the future. While maintaining our existing business lines, we intend to continue to pursue a sustained growth strategy by increasing revenues from existing clients, expanding the breadth of our service offerings, seeking selective co-investment opportunities and pursuing strategic acquisitions.
Our ability to manage our growth will require us to effectively integrate new acquisitions into our existing operations while managing development of principal properties. We expect that significant growth in several business lines occurring simultaneously will place substantial demands on our managerial, administrative, operational and financial resources. We cannot be sure that we will be able to successfully manage all factors necessary for a successful expansion of our business. Moreover, our strategy of growth depends on the existence of and our ability to identify attractive and synergistic acquisition targets. The unavailability of suitable acquisition targets, or our inability to find them, may result in a decline in business, financial condition and results of operations.
Our business is highly dependent upon the economy and real estate market in California which has recently experienced a significant downturn and is vulnerable to future decline.
We have a high concentration of our business activities in California. Consequently, our business, results of operations and financial condition are dependent upon general trends in California's economy and real estate market. California's economy has experienced a significant downturn in the recent recession and a sustained decline in the value of California real estate. Real estate market declines in California have become so severe that the market value of a number of properties securing loans has become significantly less than the outstanding balances of those loans. Real estate market declines may negatively affect
8
our ability to sell property at a profit. In addition, California historically has been vulnerable to certain natural disaster risks, such as earthquakes, floods, wild fires and erosion-caused mudslides. The existence of adverse economic conditions or the occurrence of natural disasters in California could have a material adverse effect on our business, financial condition and results of operations.
We own real estate properties located in Hawaii, which subjects us to unique risks relating to, among other things, the current recession in Hawaii, Hawaii’s economic dependence on fluctuating tourism, the isolated location of Hawaii and the potential for natural disasters.
We conduct operations and own properties in Hawaii. Consequently, our business, results of operations and financial condition are dependent upon and affected by general trends in Hawaii's economy and real estate market. Hawaii's economy has experienced a significant downturn in the current recession and a sustained decline in the value of Hawaiian real estate. Real estate market declines may negatively affect our ability to sell property at a profit. In addition, Hawaii’s economy is largely dependent upon tourism, which is subject to fluctuation and has recently experienced a significant drop. Hawaii historically has also been vulnerable to certain natural disaster risks, such as tsunamis, hurricanes and earthquakes, which could cause damage to properties owned by us or property values to decline in general. Hawaii’s remote and isolated location also may create additional operational costs and expenses, which could have a material adverse impact on our financial results.
Our auction services business has historically been countercyclical and, as a result, our operating results may be adversely affected when general economic conditions are improving.
Our results of operations are dependent on the performance of our auction services group, which historically has been countercyclical. Our auction services group has recently experienced an increase in revenues due to, among other things, the substantial increase in the number of foreclosures stemming from the current economic crisis. Improvements in general economic conditions may cause auction service revenues to decrease, which could cause a material adverse impact on our results of operations.
If we fail to comply with laws and regulations applicable to us in our role as a real estate broker, property/facility manager or developer, we may incur significant financial penalties.
We are subject to numerous federal, state, local and non-U.S. laws and regulations specific to the services we perform in our business, as well as laws of broader applicability, such as tax, securities and employment laws. Brokerage of real estate sales and leasing transactions and the provision of property management and valuation services require us to maintain applicable licenses in each U.S. state and certain non-U.S. jurisdictions in which we perform these services. If we fail to maintain our licenses or conduct these activities without a license, or violate any of the regulations covering our licenses, we may be required to pay fines (including treble damages in certain states) or return commissions received or have our licenses suspended or revoked.
We have certain obligations in connection with our real estate brokerage services which could subject us to liability in the event litigation is initiated against us for an alleged breach of any such obligation.
As a licensed real estate broker, we and our licensed employees are subject to certain statutory due diligence, disclosure and standard-of-care obligations. Failure to fulfill these obligations could subject us or our employees to litigation from parties who purchased, sold or leased properties they brokered or managed. In addition, we may become subject to claims by participants in real estate sales claiming that we did not fulfill our statutory obligations as a broker.
We may become subject to claims for construction defects or other similar actions in connection with the performance of our property management services.
In our property management capacity, we hire and supervise third-party contractors to provide construction and engineering services for our properties. While our role is limited to that of a supervisor, we cannot be sure that we will not be subjected to claims for construction defects or other similar actions. Adverse outcomes of property management litigation could have a material adverse effect on our business, financial condition and results of operations.
Our properties may subject us to potential environmental liability.
Under various federal, state and local laws, ordinances and regulations, a current or previous owner or operator of real estate may be liable for the cleanup of hazardous or toxic substances and may be liable to a governmental entity or to third parties for property damage and for investigation and clean-up costs incurred by governmental entities or third parties in connection with the contamination. Such laws typically impose liability without regard to whether the owner or operator knew of, or was responsible for, the presence of the hazardous or toxic substances, even when the contaminants were associated with
9
previous owners or operators. The costs of investigation, remediation or removal of hazardous or toxic substances may be substantial, and the presence of those substances, or the failure to properly remediate those substances, may adversely affect the owner’s or operator’s ability to sell or rent the affected property or to borrow using the property as collateral. The presence of contamination at a property can impair the value of the property even if the contamination is migrating onto the property from an adjoining property. Additionally, the owner of a site may be subject to claims by parties who have no relation to the property based on damages and costs resulting from environmental contamination emanating from the site.
In connection with the direct or indirect ownership, operation, management and development of real properties, we may be considered an owner or operator of those properties or as having arranged for the disposal or treatment of hazardous or toxic substances. Therefore, we may be potentially liable for removal or remediation costs.
Certain federal, state and local laws, regulations and ordinances also govern the removal, encapsulation or disturbance of asbestos-containing materials during construction, remodeling, renovation or demolition of a building. Such laws may impose liability for release of asbestos-containing materials, and third parties may seek recovery from owners or operators of real properties for personal injuries associated with asbestos-containing materials. We may be potentially liable for those costs for properties that we own. In the past, we have been required to remove asbestos from certain buildings that we own. There can be no assurance that in the future we will not be required to remove asbestos from our buildings or incur other substantial costs of environmental remediation.
Before consummating the acquisition of a particular piece of property, it is our policy to retain independent environmental consultants to conduct a thorough environmental review of the property to check for contaminants, including performing a Phase I environmental review. These assessments have included, among other things, a visual inspection of the properties and the surrounding area and a review of relevant federal, state and historical documents. To date, the assessments we have had done have not revealed any environmental liability that we believe would have a material adverse effect on our business, assets or results of operations as a whole, nor are we aware of any material environmental liability of the types described. Nevertheless, it is possible that the assessments we commissioned do not reveal all environmental liabilities or that there are material environmental liabilities of which we are currently unaware. There can be no assurance that future laws, ordinances or regulations will not impose any material environmental liability or that the current environmental condition of our properties will not be affected by tenants, by the condition of land or operations in the vicinity of those properties, or by unrelated third parties. We have not been notified by any governmental authority, and are not otherwise aware of any material noncompliance, liability or claim relating to hazardous or toxic substances in connection with any of our properties. There can be no assurance that federal, state and local agencies or private plaintiffs will not bring these types of actions in the future, or that those actions, if adversely resolved, would not have a material adverse effect on our business, financial condition and results of operations.
We may incur unanticipated expenses relating to laws benefiting disabled persons.
The Americans with Disabilities Act, or the ADA, generally requires that public accommodations such as hotels and office buildings be accessible to disabled people. We believe that our properties are in substantial compliance with the ADA and that we will not be required to make substantial capital expenditures to address the requirements of the ADA. If, however, our properties are not in compliance with the ADA, the U.S. federal government could fine us or private litigants could sue us for money damages. If we are required to make substantial alterations to one or more of our properties, our results of operations could be materially adversely affected.
We may incur significant costs complying with laws, regulations and covenants that are applicable to our properties and operations.
The properties in our portfolio and our operations are subject to various covenants and federal, state and local laws and regulatory requirements, including permits and licensing requirements. Such laws and regulations, including municipal or local ordinances, zoning restrictions and restrictive covenants imposed by community developers may restrict our use of our properties and may require us to obtain approval from local officials or community standards organizations at any time with respect to our properties, including prior to acquiring a property or when undertaking renovations of any of our existing properties. Among other things, these restrictions may relate to fire and safety, seismic, asbestos-cleanup or hazardous material abatement requirements. There can be no assurance that existing laws and regulations will not adversely affect us or the timing or cost of any future acquisitions or renovations, or that additional regulations will not be adopted that increase such delays or result in additional costs. Our failure to obtain required permits, licenses and zoning relief or to comply with applicable laws could have a material adverse effect on our business, financial condition and results of operations.
Our property insurance coverages are limited and any uninsured losses could cause us to lose part or all of our investment in our insured properties.
10
We carry comprehensive general liability coverage and umbrella coverage on all of our properties with limits of liability which we deem adequate and appropriate under the circumstances (subject to deductibles) to insure against liability claims and provide for the cost of legal defense. There are, however, certain types of extraordinary losses that may be either uninsurable, or that are not generally insured because it is not economically feasible to insure against those losses. Should any uninsured loss occur, we could lose our investment in, and anticipated revenues from, a property, which loss or losses could have a material adverse effect on our operations. Currently, we also insure some of our properties for loss caused by earthquake in levels we deem appropriate and, where we believe necessary, for loss caused by flood. We cannot be sure that the occurrence of an earthquake, flood or other natural disaster will not have a materially adverse effect on our business, financial condition and results of operations.
Risks Related to Our Company
If we are unable to raise additional debt and equity capital, our results of operations could suffer.
We depend upon third-party equity and debt financings to acquire properties through our investment business, which is a key driver of future growth. We estimate that in the next 12 to 18 months our acquisition plan will require between approximately $650 million and $1.0 billion in third-party equity and between approximately $1.3 billion and $1.5 billion in third-party debt. We expect to obtain debt financing from seller financing, the assumption of existing loans, government agencies and financial institutions. We expect to obtain equity financing from equity partners, which include pension funds, family offices, financial institutions, endowments and money managers. Our access to capital funding is uncertain. Our inability to raise additional capital on terms reasonably acceptable to us could jeopardize the future success of our business.
The loss of one or more key personnel could have a material adverse effect on our operations.
Our continued success is dependent to a significant degree upon the efforts of our senior executives, who have each been essential to our business. The departure of all or any of our executives for whatever reason or the inability of all or any of them to continue to serve in their present capacities or our inability to attract and retain other qualified personnel could have a material adverse effect upon our business, financial condition and results of operations. Our executives have built highly regarded reputations in the real estate industry. Our executives attract business opportunities and assist both in negotiations with lenders and potential joint venture partners and in the representation of large and institutional clients. If we lost their services, our relationships with lenders, joint ventures and clients would diminish significantly.
In addition, certain of our officers have strong regional reputations and they aid in attracting and identifying opportunities and negotiating for us and on behalf of our clients. In particular, we view the establishment and maintenance of strong relationships through certain officers as critical to our success in the Japanese market. As we continue to grow, our success will be largely dependent upon our ability to attract and retain qualified personnel in all areas of business. We cannot be sure that we will be able to continue to hire and retain a sufficient number of qualified personnel to support or keep pace with our planned growth.
The loss of our chief executive officer ("CEO") could have a material adverse effect on our operations.
Our continued success is dependent to a significant degree upon the efforts of our CEO, who is essential to our business. The departure of CEO for whatever reason or the inability of our CEO to continue to serve in his present capacity could have a material adverse effect upon our business, financial condition and results of operations. Our CEO has built a highly regarded reputation in the real estate industry. Our CEO attracts business opportunities and assists both in negotiations with lenders and potential joint venture partners and in the representation of large and institutional clients. If we lost his services, our relationships with lenders, joint ventures and clients would diminish significantly.
Our revenues and earnings may be materially and adversely affected by fluctuations in foreign currency exchange rates due to our international operations.
Our revenues from non-U.S. operations have been primarily denominated in the local currency where the associated revenues were earned. Thus, we may experience significant fluctuations in revenues and earnings because of corresponding fluctuations in foreign currency exchange rates. To date, our foreign currency exposure has been limited to the Japanese Yen. Due to the constantly changing currency exposures to which we will be subject and the volatility of currency exchange rates, there can be no assurance that we will not experience currency losses in the future, nor can we predict the effect of exchange rate fluctuations upon future operating results. Our management may decide to use currency hedging instruments from time to time including foreign currency forward contracts, purchased currency options (where applicable) and foreign currency borrowings. The economic risks associated with these hedging instruments include unexpected fluctuations in inflation rates, which could impact cash flow relative to paying down debt, and unexpected changes in our underlying net asset position. There
11
can be no assurance that any hedging will be effective.
Our operating results are subject to significant volatility from quarter to quarter as a result of the varied timing and magnitude of our strategic acquisitions and dispositions.
We have experienced a fluctuation in our financial performance from quarter to quarter due in part to the significance of revenues from the sales of real estate on overall performance. The timing of purchases and sales of our real estate investments has varied, and will continue to vary, widely from quarter to quarter due to variability in market opportunities, changes in interest rates, and the overall demand for residential and commercial real estate, among other things. While these factors have contributed to our increased operating income and earnings in the fourth quarter in past years, there can be no assurance that we will continue to perform well in the fourth quarter.
In addition, the timing and magnitude of brokerage commissions paid to us may vary widely from quarter to quarter depending upon overall activity in the general real estate market and the nature of our brokerage assignments, among other things.
We have in the past and may continue in the future to incur significant amounts of debt to finance acquisitions, which could negatively affect our cash flows and subject our properties or other assets to the risk of foreclosure.
We have historically financed new acquisitions and property purchases with cash derived from secured and unsecured loans and lines of credit. For instance, we typically purchase real property with loans secured by a mortgage on the property acquired. We anticipate the continuation of this trend. We do not have a policy limiting the amount of debt that we may incur. Accordingly, our management and board of directors have discretion to increase the amount of our outstanding debt at any time. We could become more highly leveraged, resulting in an increase in debt service costs that could adversely affect results of operations and increase the risk of default on debt. We may incur additional debt from time to time to finance strategic acquisitions, investments, joint ventures or for other purposes, subject to the restrictions contained in the documents governing our indebtedness. If we incur additional debt, the risks associated with our leverage, including our ability to service our debt, would increase. If we are required to seek an amendment to our credit agreement, our debt service obligations may be substantially increased.
The majority of our debt bears interest at variable rates. As a result, we are subject to fluctuating interest rates that may impact, adversely or otherwise, results of operations and cash flows. We may be subject to risks normally associated with debt financing, including the risk that cash flow will be insufficient to make required payments of principal and interest, and the risk that existing indebtedness on our properties will not be able to be refinanced or our leverage could increase our vulnerability to general economic downturns and adverse competitive and industry conditions, placing us at a disadvantage compared to those of our competitors that are less leveraged, our debt service obligations could limit our flexibility in planning for, or reacting to, changes in our business and in the commercial real estate services industry; our failure to comply with the financial and other restrictive covenants in the documents governing our indebtedness could result in an event of default that, if not cured or waived, results in foreclosure on substantially all of our assets; and that the terms of available new financing will not be as favorable as the terms of existing indebtedness. If we are unable to satisfy the obligations owed to any lender with a lien on one of our properties, the lender could foreclose on the real property or other assets securing the loan and we would lose that property or asset. The loss of any property or asset to foreclosure could have a material adverse effect on our business, financial condition and results of operations.
From time to time, Moody's Investors Service, Inc. and Standard & Poor's Ratings Services, a division of The McGraw-Hill Companies, Inc., rate our significant outstanding debt. These ratings and any downgrades thereof may impact our ability to borrow under any new agreements in the future, as well as the interest rates and other terms of any future borrowings, and could also cause a decline in the market price of our common stock.
We cannot be certain that our earnings will be sufficient to allow us to pay principal and interest on our debt and meet our other obligations. If we do not have sufficient earnings, we may be required to seek to refinance all or part of our existing debt, sell assets, borrow more money or sell more securities, none of which we can guarantee that we will be able to do and which, if accomplished, may adversely impact our stock price.
Our debt obligations impose significant operating and financial restrictions, which may prevent us from pursuing certain business opportunities and taking certain actions.
Our debt obligations impose, and future debt obligations may impose, significant operating and financial restrictions on us. These restrictions limit or prohibit, among other things, our ability to:
• | incur additional indebtedness; |
• | repay indebtedness (including the notes) prior to stated maturities; |
12
• | pay dividends on, redeem or repurchase our stock or make other distributions; |
• | make acquisitions or investments; |
• | create or incur liens; |
• | transfer or sell certain assets or merge or consolidate with or into other companies; |
• | enter into certain transactions with affiliates; |
• | sell stock in our subsidiaries; |
• | restrict dividends, distributions or other payments from our subsidiaries; and |
• | otherwise conduct necessary corporate activities. |
In addition, our unsecured credit facility requires us to maintain compliance with specified financial covenants, including maximum balance sheet leverage and fixed charge coverage ratios. As of December 31, 2010, we are in compliance with these covenants.
These covenants could adversely affect our ability to finance our future operations or capital needs and pursue available business opportunities. A breach of any of these covenants could result in a default in respect of the related indebtedness. If a default occurs, the relevant lenders could elect to declare the indebtedness, together with accrued interest and other fees, to be immediately due and payable and proceed against any collateral securing that indebtedness.
We have guaranteed a number of loans in connection with various equity partnerships which may result in us being obligated to make substantial payments.
We have provided guarantees associated with loans secured by assets held in various joint venture partnerships. The maximum potential amount of future payments (undiscounted) we could be required to make under the guarantees was approximately $28 million at December 31, 2010. The guarantees expire by the year end of 2011 and our performance under the guarantees would be required to the extent there is a shortfall in liquidation between the principal amount of the loan and the net sales proceeds of the property. If we were to become obligated to perform on these guarantees, it could have an adverse effect on our financial condition.
We have a number of equity partnerships that are subject to obligations under certain “non-recourse carve out” guarantees that may be triggered in the future.
Most of our real estate properties within our equity partnerships are encumbered by traditional non-recourse debt obligations. In connection with most of these loans, however, we entered into certain “non-recourse carve out” guarantees, which provide for the loans to become partially or fully recourse against us if certain triggering events occur. Although these events are different for each guarantee, some of the common events include:
• | The special purpose property-owning subsidiary’s filing a voluntary petition for bankruptcy; |
• | The special purpose property-owning subsidiary’s failure to maintain its status as a special purpose entity; and |
• | Subject to certain conditions, the special purpose property-owning subsidiary’s failure to obtain lender’s written consent prior to any subordinate financing or other voluntary lien encumbering the associated property. |
In the event that any of these triggering events occur and the loans become partially or fully recourse against us, our business, financial condition, results of operations and common stock price could be materially adversely affected.
The deteriorating financial condition and/or results of operations of certain of our clients could adversely affect our business.
We could be adversely affected by the actions and deteriorating financial condition and results of operations of certain of our clients if that led to losses or defaults by one or more of them, which in turn, could have a material adverse effect on our results of operations and financial condition.
Any of our clients may experience a downturn in its business that may weaken its results of operations and financial condition. As a result, a client may fail to make payments when due, become insolvent or declare bankruptcy. Any client bankruptcy or insolvency, or the failure of any client to make payments when due, could result in material losses to our company. A client bankruptcy would delay or preclude full collection of amounts owed to us. Additionally, certain corporate services and property management client agreements require that we advance payroll and other vendor costs on behalf of clients. If such a client were to file bankruptcy or otherwise fail, we may not be able to obtain reimbursement for those costs or
13
for the severance obligations we would incur as a result of the loss of the client.
We may incur expenses associated with defending law suits filed by former holders of Kennedy-Wilson's stock.
On November 13, 2009, our wholly-owned subsidiary, KW Merger Sub Corp., merged with and into Kennedy-Wilson. Prior to the merger, a small percentage of Kennedy-Wilson’s outstanding common stock was owned by holders who were not known to our management. If one or more of these holders were to bring a claim alleging that members of Kennedy-Wilson, Inc.’s board of directors breached their fiduciary duties in connection with approving the merger, we would incur costs defending and/or settling such claim.
Risks Related to Ownership of Our Common Stock
Our directors and officers and their affiliates are significant stockholders, which makes it possible for them to have significant influence over the outcome of all matters submitted to stockholders for approval and which influence may be in conflict with our interests and the interests of our other stockholders.
As of March 10, 2011, our directors and executive officers and their respective affiliates owned an aggregate of approximately 48.6% of the outstanding shares of our common stock. These stockholders will have significant influence over the outcome of all matters submitted for stockholder approval, including the election of our directors and other corporate actions. In addition, such influence by one or more of these affiliates could have the effect of discouraging others from attempting to purchase or take us over and/or reducing the market price offered for our common stock in such an event.
We may issue additional equity securities which may dilute your interest in us.
In order to expand our business, we may consider offering and issuing additional equity or equity-based securities. Holders of our securities may experience a dilution in the net tangible book value per share held by them if this occurs. The number of shares that we may issue for cash without stockholder approval will be limited by the rules of the NYSE or other exchange on which our securities are listed. However, there are generally exceptions which allow companies to issue a limited number of equity securities without stockholder approval which would dilute your ownership.
The price of our common stock may be volatile.
The price of our common stock may be volatile due to factors such as:
• | changes in real estate prices; |
• | actual or anticipated fluctuations in our quarterly and annual results and those of our publicly held competitors; |
• | mergers and strategic alliances among any real estate companies; |
• | market conditions in the industry; |
• | changes in government regulation and taxes; |
• | shortfalls in our operating results from levels forecasted by securities analysts; |
• | investor sentiment toward the stock of real estate companies in general; |
• | announcements concerning us or our competitors; and |
• | the general state of the securities markets. |
Kennedy-Wilson, Inc. has not recently operated as a “reporting company.” Fulfilling our obligations as a “reporting company” going forward will be expensive and time consuming.
Kennedy-Wilson has not been a public reporting company since 2004 and since that time has not been required to document and assess the effectiveness of its internal control procedures in order to satisfy the requirements of Section 404 of the Sarbanes-Oxley Act of 2002. Although we have maintained disclosure controls and procedures and internal control over financial reporting as required under the federal securities laws with respect to our activities, Kennedy-Wilson has not been required to establish and maintain such disclosure controls and procedures and internal controls over financial reporting which are required with respect to a public company with substantial operations. Under the Sarbanes-Oxley Act of 2002 and the related rules and regulations of the SEC, our management has been required to implement additional corporate governance practices and to adhere to a variety of reporting requirements and accounting rules. Compliance with these obligations requires significant time and resources from our management, finance and accounting staff and has significantly increased our legal, insurance and financial compliance costs. As a result of the increased costs associated with being a “reporting company,” Kennedy-Wilson's operating income as a percentage of revenue is likely to be lower.
14
Our common stock may be delisted, which could limit your ability to trade our common stock and subject us to additional trading restrictions.
Our common stock is listed on the NYSE, a national securities exchange. We cannot assure you that our common stock will continue to be listed on the NYSE in the future. If the NYSE delists our common stock from trading on its exchange, we could face significant material adverse consequences, including:
• | a limited availability of market quotations for our common stock; |
• | a limited amount of news and analyst coverage for our company; |
• | a decreased ability for us to issue additional securities or obtain additional financing in the future; and |
• | limited liquidity for our stockholders due to thin trading. |
Our staggered board may entrench management and discourage unsolicited stockholder proposals that may be in the best interests of stockholders and certain anti-takeover provisions in our organizational documents may discourage a change in control.
Our second amended and restated certificate of incorporation provides for our board of directors to be divided into three classes, each of which generally serves for a term of three years with only one class of directors being elected in each year. As a result, at any annual meeting only a minority of the board of directors will be considered for election. Since this “staggered board” would prevent our stockholders from replacing a majority of our board of directors at any annual meeting, it may entrench management and discourage unsolicited stockholder proposals that may be in the best interests of stockholders. Additionally, certain provisions of our second amended and restated certificate of incorporation and our amended and restated bylaws may have an anti-takeover effect and may delay, defer or prevent a tender offer or takeover attempt that a stockholder might consider in its best interest, including those attempts that might result in a premium over the market price for the shares held by stockholders.
In addition, Section 203 of the Delaware General Corporation Law, may, under certain circumstances, make it more difficult for a person who would be an “interested stockholder,” which is defined generally as a person with 15% or more of a corporation’s outstanding voting stock, to effect a “business combination” with the corporation for a three-year period. A “business combination” is defined generally as mergers, consolidations and certain other transactions, including sales, leases or other dispositions of assets with an aggregate market value equal to 10% or more of the aggregate market value of the corporation.
These anti-takeover provisions could make it more difficult for a third party to acquire us, even if the third party’s offer may be considered beneficial by many stockholders. As a result, stockholders may be limited in their ability to obtain a premium for their shares.
Item 1B. Unresolved Staff Comments
None
Item 2. Properties
Our corporate headquarters is located in Beverly Hills, California. We also have 21 other offices throughout the U.S., including our disaster recovery office in Austin, Texas, and one office in Japan. The Beverly Hills office operates as the main investment and asset management center for us in the United States, while the Japan office is the main investment and asset management center for the Japanese operations. The remaining office locations primarily operate as property management satellites. In general, we lease all of our offices. In addition, we have on-site property management offices located within properties that we manage. The most significant terms of the leasing arrangements for our offices are the length of the lease and the rent. Our leases have terms varying in duration. The rent payable under our office leases vary significantly from location to location as a result of differences in prevailing commercial real estate rates in different geographic locations. Our management believes that except as provided below, no single office lease is material to our business, results of operations or financial condition. In addition, our management believes there is adequate alternative office space available at acceptable rental rates to meet our needs, although adverse movements in rental rates in some markets may negatively affect our profits in those markets when we enter into new leases.
The following table sets forth certain information regarding our corporate headquarters and regional office located in Austin, Texas.
15
Location | Use | Approximate Square Footage | Lease Expiration | ||||
Beverly Hills, CA | Corporate Headquarters | 20,236 | 12/31/16 | ||||
Austin, TX | Regional Office; Disaster Recovery Office | 6,864 | 3/31/12 | ||||
Item 3. Legal Proceedings
We may be involved in various legal proceedings arising in the ordinary course of business, none of which is material to our business. From time to time, our real estate management division is named in “slip and fall” type litigation relating to buildings we manage. Our standard management agreement contains an indemnity provision whereby the building owner indemnifies and agrees to defend its real estate management division against such claims. In such cases, we are defended by the building owner’s liability insurer.
Item 4. Removed and Reserved
16
PART II
Item 5. Market for Registrant’s Common Equity, Related Stockholder Matters and Issuer Purchases of Equity Securities
Stock Price Information
From December 3, 2007 to March 18, 2010, our common stock traded on the NYSE Amex. Since March 19, 2010, our common stock has traded on the NYSE under the symbol “KW”. The following table sets forth, for the calendar quarter indicated, the high and low sales prices per share of common stock as reported on the NYSE Amex and the NYSE. The quotations listed below reflect interdealer prices, without retail markup, markdown or commission and may not necessarily represent actual transactions.
Common Stock | ||||||||
High | Low | |||||||
Fiscal year 2010 | ||||||||
Quarter ending March 31, 2010 | $ | 10.15 | $ | 8.90 | ||||
Quarter ending June 30, 2010 | $ | 11.50 | $ | 9.98 | ||||
Quarter ending September 30, 2010 | $ | 10.83 | $ | 9.37 | ||||
Quarter ending December 31, 2010 | $ | 10.77 | $ | 9.26 | ||||
Fiscal year 2009 | ||||||||
Quarter ending March 31, 2009 | $ | 9.46 | $ | 9.20 | ||||
Quarter ending June 30, 2009 | $ | 9.67 | $ | 9.49 | ||||
Quarter ending September 30, 2009 | $ | 9.94 | $ | 9.67 | ||||
Quarter ending December 31, 2009 | $ | 10.25 | $ | 8.85 | ||||
Holders
As of March 10, 2011, we had 63 holders of record of our common stock and six holders of record of our warrants.
Dividend Policy
We have not paid any dividends on our common stock to date. The payment of any dividends is within the discretion of our board of directors. It is the present intention of our board of directors to retain all earnings, if any, for use in our business operations and, accordingly, our board of directors currently does not anticipate declaring any dividends in the foreseeable future.
Recent Sales of Unregistered Securities
None
Equity Compensation Plan Information
See Item 12—“Security Ownership of Certain Beneficial Owners and Management and Related Stockholder Matters.”
Performance Graph
The graph below compares the cumulative total return of our common stock from December 3, 2007, the date that our common stock first became tradable separately, through December 31, 2010, with the comparable cumulative return of companies comprising the S&P 500 Index and a peer issuer selected by us. The peer issuer is a company in the real estate services and investment industry. As a result, the performance of our common stock relative to the performance of the common stock of the peer issuer prior to November 13, 2009, may not be representative of future results. The graph plots the growth in value of an initial investment of $100 in each of our common stock, the S&P 500 Index and a peer issuer selected by us over the indicated time periods, and assumes reinvestment of all dividends, if any, paid on the securities. We have not paid any cash dividends and, therefore, the cumulative total return calculation for us is based solely upon stock price appreciation and not upon reinvestment of cash dividends. The stock price performance shown on the graph is not necessarily indicative of future price performance.
17
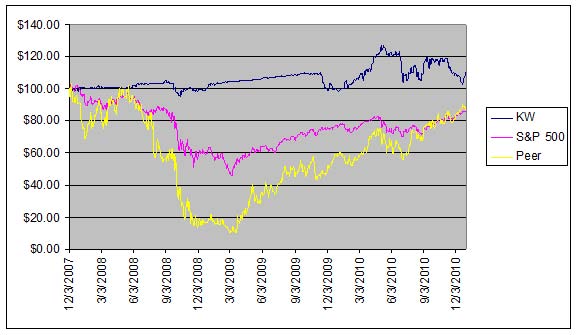
Note: The peer, CB Richard Ellis, is comparable beginning November 13, 2009.
Purchases of Equity Securities by the Company and Affiliated Purchasers in the Fourth Quarter of 2010
Period | Total Number of Shares Purchased | Average Price Paid per Share | Total Number of Shares Purchased as Part of Publicly Announced Plans or Programs | Maximum Number (or Approximate Dollar Value) of Shares that May yet be Purchased under the Plans or Programs | ||||||||||||
Common Stock | ||||||||||||||||
November 1 to November 30 | 111,690 | (2 | ) | $ | 10.04 | — | — | |||||||||
Warrants | ||||||||||||||||
October 1 to October 31 | 677,928 | (1 | ) | 1.50 | 677,928 | 5,823,448 | ||||||||||
November 1 to November 30 | 1,000,000 | (1 | ) | $ | 1.50 | 1,000,000 | 4,823,448 | |||||||||
December 1 to December 31 | 266,000 | (1 | ) | $ | 1.50 | 266,000 | 4,557,448 | |||||||||
______________________________________
(1) Warrants repurchased under a plan announced April 30, 2010, approving the repurchase of up to 7.5 million outstanding warrants. On September 21, 2010, the Board of Directors approved an increase to the number of warrants subject to the plan by 5 million.
(2) Repurchased 111,690 shares of common stock in private transactions from shareholders at a purchase price equal to the prior day’s closing price for our common stock.
18
Item 6. Selected Financial Data
The following tables summarize our selected historical consolidated financial information. This information was derived from our audited financial statements for each of the years ended December 31, 2010, 2009, 2008, 2007 and 2006. This information is only a summary. You should read this information together in conjunction with “Management’s Discussion and Analysis of Financial Condition and Results of Operations” and the financial statements and related notes included elsewhere in this document.
Year Ended December 31, | ||||||||||||||||||||
2010 | 2009 | 2008 | 2007 | 2006 | ||||||||||||||||
Statements of operations data: | ||||||||||||||||||||
Revenue | $ | 50,536,000 | $ | 86,235,000 | $ | 32,225,000 | $ | 33,393,000 | $ | 26,498,000 | ||||||||||
Merger-related expenses | 2,225,000 | 16,120,000 | — | — | — | |||||||||||||||
Other operating expenses | 67,712,000 | 78,752,000 | 32,571,000 | 43,180,000 | 34,606,000 | |||||||||||||||
Equity in joint venture income | 10,548,000 | 8,019,000 | 10,097,000 | 27,433,000 | 14,689,000 | |||||||||||||||
Interest income from loan pool participations and notes receivable | 11,855,000 | — | — | — | — | |||||||||||||||
Net income (loss) | 6,485,000 | (9,657,000 | ) | 667,000 | 9,037,000 | 6,541,000 | ||||||||||||||
Basic earnings (loss) per share | $ | (0.03 | ) | $ | (0.57 | ) | $ | 0.03 | $ | 0.44 | $ | 0.36 | ||||||||
As of December 31, | ||||||||||||||||||||
2010 | 2009 | 2008 | 2007 | 2006 | ||||||||||||||||
Balance sheet data: | ||||||||||||||||||||
Cash and cash equivalents | $ | 46,968,000 | $ | 57,784,000 | $ | 25,831,000 | $ | 24,248,000 | $ | 15,332,000 | ||||||||||
Investments in real estate and joint ventures | 349,587,000 | 228,305,000 | 190,915,000 | 80,026,000 | 57,744,000 | |||||||||||||||
Total assets | 487,848,000 | 336,257,000 | 256,837,000 | 145,814,000 | 107,746,000 | |||||||||||||||
Debt | 127,782,000 | 127,573,000 | 131,423,000 | 65,084,000 | 40,517,000 | |||||||||||||||
Kennedy-Wilson equity | 300,192,000 | 177,314,000 | 105,551,000 | 56,857,000 | 49,447,000 | |||||||||||||||
Total equity | $ | 312,906,000 | $ | 179,336,000 | $ | 105,802,000 | $ | 57,076,000 | $ | 49,603,000 | ||||||||||
Business Combination
See Note 3 of our Notes to the Consolidated Financial Statements for discussion of the business combinations (including the Merger) that occurred during the years ended December 31, 2010 and 2009.
19
Item 7. Management’s Discussion and Analysis of Financial Condition and Results of Operations
The following discussion and analysis should be read in conjunction with the financial statements and related notes and the other financial information appearing elsewhere in this report. This discussion and analysis contains forward-looking statements that involve risks, uncertainties and assumptions. See the section title "Forward-Looking Statements" for more information. Actual results could differ materially from those anticipated in the forward-looking statements as a result of many factors, including those discussed in “Risk Factors” on page 4 and elsewhere in this report.
In the interest of providing a more complete presentation of our financial performance since inception, this discussion and analysis includes comparisons of our consolidated financial results period from 2008 through 2010.
Overview
Founded in 1977, We are an international real estate investment and services firm. We have grown from a real estate auction business into a vertically-integrated real estate operating company with approximately 300 professionals in 22 offices throughout the U.S. and Japan. We have over $7 billion of assets under management totaling over 40 million square feet of properties throughout the U.S. and Japan, including ownership in 11,971 multifamily apartment units.
When reading our financial statements and the information included in this section, it should be considered that we have experienced, and continue to experience, the same material trends that have affected the nation. It is, therefore, a challenge to predict our future performance based on our historical results, but we believe that the following material trends assist in understanding our historical earnings and cash flows and the potential for the future.
Unless specifically noted otherwise, as used throughout this Management’s Discussion and Analysis section, “we,” “our,” or “us” refers to the business, operations and financial results of Kennedy-Wilson, Inc. prior to, and Kennedy-Wilson Holdings, Inc. subsequent to, the closing of the Merger as the context requires. “Prospect” refers to the operations or financial results of Prospect Acquisition Corp. prior to the closing of the Merger.
Macroeconomic Conditions
Our business is closely tied to general economic conditions and the real estate industry. As a result, our economic performance, the value of our real estate and real estate secured notes, and our ability to implement our business strategies may be affected by changes in national and local economic conditions. The condition of the real estate markets in which we operate tends to be cyclical and is related to the condition of the economy in the U.S. and Japan as a whole and to the perceptions of investors of the overall economic outlook. Rising interest rates, declining demand for real estate or periods of general economic slowdown or recession have had a direct negative impact on the real estate market in the past and a recurrence of these conditions in the U.S. or Japan could result in a reduction in our revenues. In addition, the economic condition of each local market where we operate may be dependent on one or more industries.
Beginning in 2003, economic conditions in the United States rebounded from the economic downturn in 2001 and 2002. The recovery, which positively impacted the commercial and residential real estate markets generally, continued through the second quarter of 2007, helping to improve the revenue in our services segment, particularly leasing and brokerage revenue. Improved economic conditions also resulted in a general increase in transaction activity, higher occupancy levels, rental rates, and property values, helping to increase the income in the our investments segment as several of our real estate investments were sold.
Starting in the third quarter of 2007, U.S. economic activity progressively weakened through the second quarter of 2010 due initially to stresses in the residential housing and financial sectors and the impact of sharply higher energy costs. The weakening economic activity developed into a recession, affecting all segments of the economy, in early 2008, as both consumer and business spending dropped. This weakening economic activity, coupled with capital market stresses, led to a global financial disruption in the third quarter of 2008, the consequences of which continued through the second quarter of 2010. This disruption caused credit markets to freeze up, investors to become more risk averse and assets of all types, from the riskiest to the most secure, to lose value. These conditions also caused the economy to contract further and job losses to accelerate throughout 2008, 2009 and into 2010. This resulted in a decline in leasing activity and space absorption, rising vacancy rates and decreasing rents across the United States, which in turn, reduced our services revenue, particularly leasing and brokerage revenue. Investment sales activity in the United States fell sharply from peak levels in 2007 and continued to decline through the end of 2009. This decline resulted in an absence of debt financing, weakening property fundamentals, and the re-pricing of risk in the face of economic and market uncertainty. The deteriorating conditions adversely affected our investments segment throughout the second quarter of 2010 as property values decreased sharply and disposition opportunities were markedly reduced.
The recent economic downturn also significantly affected countries throughout Asia, including Japan. The worldwide
20
recession led to falling stock prices and asset values in Asia and reduced economic growth prospects in Asia. Several property markets in Asia have been affected by real estate developments that resulted in an oversupply of completed or partially completed space. Property prices fell along with prices of other investments and asset values. These conditions resulted in a decline in our investment sales and investment activities in Japan beginning in late 2008 and continuing through the second quarter of 2010.
Starting in third quarter of 2010, credit markets began to rebound and banks began to liquidate loans and real estate owned ("REO") which resulted in an increase in both our investment and services segments. Interest rates remained low through 2010 and in many real estate properties prices began to stabilize towards the end of 2010. Rental rates have begun to rebound and concessions have dissipated, particularly in the multifamily sector.
A continuing rebound of our investments and services segments is expected, but contingent on, among other things, the U.S. and Japanese economies resuming their growth and credit markets retaining stability and predictability over a sustained period. As a vertically integrated company, we have the in-house expertise and skill sets to navigate through these times by taking advantage of opportunities in real estate and the capital markets.
International Operations
We have made investments in Japan and may expand our operations and investments in Japan. If we expand, the increased scope of our international operations may lead to more volatile financial results and difficulties in managing our businesses. This volatility and difficulty could be caused by, among other things, the following: currency fluctuations, restrictions and problems relating to the repatriation of profits; difficulties and costs of staffing and managing international operations; the burden of complying with multiple and potentially conflicting laws; laws restricting foreign companies from conducting business and unexpected changes in regulatory requirements; the impact of different business cycles and economic instability; political instability and civil unrest; greater difficulty in perfecting our security interests, collecting accounts receivable, foreclosing on security and protecting our interests as a creditor in bankruptcies in certain geographic regions; potentially adverse tax consequences; share ownership restrictions on foreign operations; Japanese property and income taxes, tax withholdings and tariffs; and geographic, time zone, language and cultural differences between personnel in different areas of the world.
Our revenues from non-U.S. operations have been primarily denominated in the local currency where the associated revenues were earned. Thus, we may experience significant fluctuations in revenues and earnings because of corresponding fluctuations in foreign currency exchange rates. To date, our foreign currency exposure has been limited to the Japanese Yen. Due to the constantly changing currency exposures to which we will be subject and the volatility of currency exchange rates, there can be no assurance that we will not experience currency losses in the future, nor can we predict the effect of exchange rate fluctuations upon future operating results. Our management may decide to use currency hedging instruments from time to time including foreign currency forward contracts, purchased currency options (where applicable) and foreign currency borrowings. The economic risks associated with these hedging instruments include unexpected fluctuations in inflation rates, which could impact cash flow relative to paying down debt, and unexpected changes in our underlying net asset position. There can be no assurance that any hedging will be effective.
Kennedy Wilson's 2010 Highlights
Strengthened balance sheet
• | Our book equity increased by 74% to $313 million at December 31, 2010 from $179 million as of December 31, 2009. |
• | Our investment account (Kennedy Wilson's equity in real estate and loan investments) increased by 72% to $364 million at December 31, 2010 from $212 million as of December 31, 2009. |
• | The amount available for us to borrow under our line of credit facility increased to $75 million from $30 million in 2010. |
• | We decreased our debt to book equity to 0.4x at December 31, 2010 from 0.7x at December 31, 2009, with a long term strategy of maintaining modest leverage. |
Improved operating metrics
• | We achieved a FY 2010 Adjusted EBITDA of $58 million: our best year in history versus an Adjusted EBITDA in 2009 of $37 million, an increase of 58%. |
• | Our investments segment Adjusted EBITDA for 2010 increased by 47% to $56 million from $38 million for FY 2009. |
• | Our services segment Adjusted EBITDA for FY 2010 increased by 164% to $9 million from $4 million for FY 2009. |
Capital raising success and robust acquisition program
• | Since and including our public listing in November 2009, we have raised $221 million of equity for us and over $1 billion of equity partner capital (including commitments) for our acquisition program. |
• | In 2010, we closed $2.025 billion of real estate and debt acquisitions through direct and joint venture investments |
21
(including approximately $1.3 billion of multifamily acquisitions and $650 million of debt purchases secured by real estate). These acquisitions were all in our target markets.
Significant multifamily platform
• | Our current multifamily platform, owned directly and through joint ventures including two deals that were in escrow as of December 31, 2010 and have subsequently closed, consists of 11,971 units within 78 apartment communities. The units are located in California (50%), the Pacific Northwest (30%) and Japan (20%). |
• | As of December 31, 2010, our multifamily portfolio was 96% occupied and on a trailing twelve month basis (annualized for communities purchased mid-year) produced a net operating income of $103 million. As of December 31, 2010, the debt associated with these properties was approximately $1.3 billion and our equity interest in the portfolio was approximately 32%. In many cases, in addition to our ownership percentage, we have a promoted interest in the profits of these investments. Management believes that our multifamily investments are in supply constrained markets which will experience significant rent growth over the next several years. |
• | We increased our investment in our Japanese multifamily subsidiary to 41.5% as of December 31, 2010 from 35.0% as of December 31, 2009; our Japanese portfolio is currently 96% occupied and our subsidiary has a currency gain in excess of $50 million. |
Accessed debt financing
• | We took advantage of the historically low interest rate environment to reduce our cost of debt at the corporate and joint venture levels. |
• | We borrowed in excess of $750 million of joint venture debt through acquisition financing and strategic property refinancing. |
Expansion of service business
• | Our management and leasing fees increased by 11% to $21 million for FY 2010 from $19 million for FY 2009 driven primarily by increased asset management fees earned through our acquisition activities. |
• | Our commissions increased by 140% to $12 million for FY 2010 from $5 million for FY 2009 driven primarily by increased auction commissions and acquisition fees. |
• | Our assets under management (owned and third-party) total approximately $7 billion as of December 31, 2010. |
• | We auctioned and conventionally sold over 40 projects in three countries and 18 states including California, Washington, Hawaii, Oregon, Texas, Nevada, Florida, Georgia, and North Carolina. |
• | We conducted commercial auctions, signaling the transition of the current real estate cycle. |
• | We added numerous new accounts to our property management business through organic growth and the acquisition of Sachse Real Estate. |
• | Our services business sourced several key acquisitions for the investment division through relationships with bank clients. |
Critical Accounting Policies
Basis of Presentation—The consolidated financial statements include the accounts of ourselves and our wholly-owned subsidiaries. All significant intercompany balances and transactions have been eliminated in consolidation. In addition, we evaluate our relationships with other entities to identify whether they are variable interest entities as defined by FASB Accounting Standards Codification (ASC) Subtopic 810-10 and to assess whether we are the primary beneficiary of such entities. If the determination is made that we are the primary beneficiary, then that entity is consolidated in the consolidated financial statements. The ownership of the other interest holders of consolidated subsidiaries is reflected as noncontrolling interests.
Revenue Recognition—Revenue primarily consists of management fees, performance fees, commission revenue and sales of real estate.
Management Fees are primarily comprised of property management fees, base asset management fees, and acquisition fees. Property management fees are earned for managing the operations of real estate assets and are based on a fixed percentage of the revenues generated from the respective real estate assets. Base asset management fees are earned from limited partners of funds we sponsor and are generally based on fixed percentage of committed capital or net asset value. These fees are recognized as revenue ratably over the period that the respective services are performed. Acquisition fees are earned for identifying and closing investments on behalf of investors and are based on a fixed percentage of the acquisition price. Acquisition fees are recognized upon the successful completion of an acquisition after all required services have been performed.
Performance fees or carried interest are allocated to the general partner or special limited partnership interest of our real estate funds based on the cumulative fund performance to date that are subject to preferred return to the limited partners. At the end of each reporting period, we calculate the performance fee that would be due to the general partner and special limited
22
partner interests for a fund, pursuant to the fund agreement, as if the fair value of the underlying investments were realized as of such date, irrespective of whether such amounts have been realized. As the fair value of underlying investments varies between reporting periods, it is necessary to make adjustments to amounts recorded as performance fee to reflect either (a) positive performance resulting in an increase in the performance fee allocated to the general partner or (b) negative performance that would cause the amount due to the us to be less than the amount previously recognized as revenue, resulting in a negative adjustment to performance fees allocated to the general partner. Substantially all of the carried interest is recognized in equity in joint venture income and in certain instances the performance fees are recognized in management and leasing fees in our consolidated statement of operations and comprehensive income (loss).
Commissions primarily consist of auction and real estate sales commissions and leasing commissions. In the case of auction and real estate sales commissions, this generally occurs when escrow closes. In accordance with the guidelines established for Reporting Revenue Gross as a Principal versus Net as an Agent in the ASC Subtopic 605-45, we record commission revenues and expenses on a gross basis. Of the criteria listed in the Subtopic 605-45, we are the primary obligor in the transaction, do not have inventory risk, perform all or part of the service, have credit risk, and have wide latitude in establishing the price of services rendered and discretion in selection of agents and determination of service specifications. Leasing fees that are payable upon tenant occupancy, payment of rent or other events beyond our control are recognized upon the occurrence of such events.
Sales of Real Estate are recognized at the close of escrow when title to the real property passes to the buyer and there is no continuing involvement in the real property. We follow the requirements for profit recognition as set forth by the Sale of Real Estate ASC Subtopic 360-20.
Investments in Joint Ventures—We have a number of joint venture interests, generally ranging from 5% to approximately 50%, that were formed to acquire, manage, and/or sell real estate. Investments in joint ventures which we do not control are accounted for under the equity method of accounting as we can exercise significant influence, but do not have the ability to control the joint venture. An investment in joint ventures is recorded at its initial investment plus or minus our share of undistributed income or loss and less distributions. Declines in value of our investment in joint ventures that are other than temporary are recognized when evidence indicates that such a decline has occurred.
Profit on the sales of real estate held by joint ventures that have continuing involvement are deferred until such time that the continuing involvement has been resolved and all the risks and rewards of ownership have passed to the buyer. Profit on sales to joint ventures in which we retain an equity ownership interest results in partial sales treatment in accordance with the provisions of the Sale of Real Estate ASC Subtopic 360-20, thus deferring a portion of the gain on our continuing ownership percentage in the joint ventures.
Two of our investments in joint ventures, KW Property Fund III, L.P. (KW Fund III) and SG KW Venture I, LLC (the Funds) are, for purposes of U.S. generally accepted accounting policies ("GAAP"), investment companies under the Investment Companies ASC Subtopic 946-10. Thus, each of the Funds reflects their investments at fair value, with unrealized gains and losses resulting from changes in fair value reflected in earnings. We have retained the specialized accounting for the Funds pursuant to Retention of Specialized Accounting for Investments in Consolidation ASC Subtopic 810-10 in recording its equity in joint venture income from the Funds.
Investments in loan pool participations and notes receivable—Interest income from investments in loan pool participations and notes receivable are recognized on a level yield basis under the provisions of Loans and Debt Securities Acquired with Deteriorated Credit Quality ASC Subtopic 310-30, where a level yield model is utilized to determine a yield rate which, based upon projected future cash flows, accretes interest income over the estimated holding period. When the future cash flows of a note cannot be reasonably estimated, cash payments are applied to the cost basis of the note until it is fully recovered before any interest income is recognized.
Fair Value Measurements—We account for fair value measurements of financial assets and financial liabilities and for fair value measurements of nonfinancial items that are recognized or disclosed at fair value in the financial statements on a recurring basis under the provisions of Fair Value Measurements ASC Subtopic 820-10. Subtopic 820-10 defines fair value as the price that would be received to sell an asset or paid to transfer a liability in an orderly transaction between market participants at the measurement date.
Long-Lived Assets—We review our long-lived assets (excluding goodwill) whenever events or changes in circumstances indicate that the carrying amount of an asset may not be recoverable in accordance with Impairment of Long-Lived Assets ASC Subtopic 360-10. Recoverability of assets to be held and used is measured by a comparison of the carrying amount of an asset to estimated undiscounted future cash flows expected to be generated by the asset. If the carrying amount of an asset exceeds its estimated future cash flows, an impairment charge is recognized in the amount by which the carrying amount of the asset
23
exceeds the fair value of the asset. Assets to be disposed of would be separately presented in the balance sheet and reported at the lower of the carrying amount or fair value less costs to sell, and are no longer depreciated. The assets and liabilities of assets to be disposed of classified as held for sale would be presented separately in the appropriate asset and liability sections of the balance sheet.
Noncontrolling Interests—We account for Noncontrolling Interests in accordance with Noncontrolling Interests in Consolidated Financial Statements ASC Subtopic 810-10, which establishes accounting and reporting standards for a parent company’s noncontrolling interest in a subsidiary.
Share-Based Payment Arrangements—We account for our share-based payment arrangements under the provisions of Share-Based Payments ASC Subtopic 718-10. Compensation cost for employee services received in exchange for an award of equity instruments are based on the grant-date fair value of the share-based award that is ultimately settled in our equity. The costs of employee services is recognized over the period during which an employee provides service in exchange for the share-based payment award. Share-based payment arrangements that vest ratably over the requisite service period are recognized on the straight-line basis and performance awards that vest ratably are recognized on a tranche by tranche basis over the performance period. Unrecognized compensation costs for share-based payment arrangements that have been modified are recognized over the original service or performance period.
Fair Value Option—We account for financial assets and financial liabilities at fair value on an instrument-by-instrument basis, with changes in fair value reported in earnings in accordance with the provisions of Fair Value Measurements and Disclosures ASC Subtopic 820-10.
Income Taxes—Income taxes are accounted for under the asset and liability method. Deferred tax assets and liabilities are recognized for the future tax consequences attributable to differences between the financial statement carrying amounts of existing assets and liabilities and their respective tax bases and operating loss and tax credit carryforwards. Deferred tax assets and liabilities are measured using enacted tax rates expected to apply to taxable income in the years in which those temporary differences are expected to be recovered or settled. The effect on deferred tax assets and liabilities of a change in tax rates is recognized in income in the period that includes the enactment date. In accordance with Accounting for Uncertainty in Income Taxes FASB Codification Subtopic 605-15, we recognize the effect of income tax positions only if those positions are more likely than not of being sustained. Recognized income tax positions are measured at the largest amount that is greater than 50% likely of being realized. Changes in recognition or measurement are reflected in the period in which the change in judgment occurs. We record interest related to unrecognized tax benefits in interest expense and penalties in selling, general, and administrative expenses.
Results of Operations
The following table sets forth items derived from our consolidated statement of operations for the years ended December 31, 2010, 2009, and 2008.
24
Year Ended December 31 | ||||||||||||
2010 | 2009 | 2008 | ||||||||||
Revenue | ||||||||||||
Management and leasing fees | $ | 21,330,000 | $ | 19,164,000 | $ | 19,051,000 | ||||||
Commissions | 11,734,000 | 4,931,000 | 10,201,000 | |||||||||
Sale of real estate | 13,472,000 | 59,397,000 | — | |||||||||
Rental and other income | 4,000,000 | 2,743,000 | 2,973,000 | |||||||||
Total revenue | 50,536,000 | 86,235,000 | 32,225,000 | |||||||||
Operating expenses | ||||||||||||
Commission and marketing expenses | 3,186,000 | 3,411,000 | 2,827,000 | |||||||||
Compensation and related expenses | 38,155,000 | 24,789,000 | 21,292,000 | |||||||||
Merger related expenses | 2,225,000 | 16,120,000 | — | |||||||||
Cost of real estate sold | 11,526,000 | 41,931,000 | — | |||||||||
General and administrative | 11,314,000 | 6,351,000 | 6,074,000 | |||||||||
Depreciation and amortization | 1,618,000 | 1,122,000 | 920,000 | |||||||||
Rental operating expense | 1,913,000 | 1,148,000 | 1,458,000 | |||||||||
Total operating expenses | 69,937,000 | 94,872,000 | 32,571,000 | |||||||||
Equity in joint venture income | 10,548,000 | 8,019,000 | 10,097,000 | |||||||||
Interest income from loan pool participations and notes receivable | 11,855,000 | — | — | |||||||||
Operating income (loss) | 3,002,000 | (618,000 | ) | 9,751,000 | ||||||||
Non-operating income (expense) | ||||||||||||
Interest income | 854,000 | 502,000 | 562,000 | |||||||||
Remeasurement gain | 2,108,000 | — | — | |||||||||
Gain on early extinguishment of mortgage debt | 16,670,000 | — | — | |||||||||
Loss on early extinguishment of corporate debt | (4,788,000 | ) | — | — | ||||||||
Interest expense | (7,634,000 | ) | (13,174,000 | ) | (8,596,000 | ) | ||||||
Other than temporary impairment | — | (328,000 | ) | (445,000 | ) | |||||||
Income (loss) before (provision for) benefit from income taxes | 10,212,000 | (13,618,000 | ) | 1,272,000 | ||||||||
(Provision for) benefit from income taxes | (3,727,000 | ) | 3,961,000 | (605,000 | ) | |||||||
Net income (loss) | 6,485,000 | (9,657,000 | ) | 667,000 | ||||||||
Net income attributable to the noncontrolling interests | (2,979,000 | ) | (5,679,000 | ) | (54,000 | ) | ||||||
Net income (loss) attributable to Kennedy Wilson Holdings, Inc. | 3,506,000 | (15,336,000 | ) | 613,000 | ||||||||
Preferred stock dividends and accretion of issuance costs | (4,558,000 | ) | — | — | ||||||||
Net income (loss) attributable to Kennedy Wilson Holdings, Inc. common shareholders | $ | (1,052,000 | ) | $ | (15,336,000 | ) | $ | 613,000 | ||||
EBITDA (1) | $ | 48,108,000 | $ | 18,620,000 | $ | 25,953,000 | ||||||
Adjusted EBITDA (2) | $ | 58,427,000 | $ | 37,054,000 | $ | 26,968,000 | ||||||
Additionally, we use certain non-GAAP measures to analyze our business, they include EBITDA(1) and Adjusted EBITDA(2) calculated as follows:
25
Year Ended December 31, | ||||||||||||
2010 | 2009 | 2008 | ||||||||||
Net income (loss) | $ | 6,485,000 | $ | (9,657,000 | ) | $ | 667,000 | |||||
Add back: | ||||||||||||
Interest expense | 7,634,000 | 13,174,000 | 8,596,000 | |||||||||
Kennedy-Wilson's share of interest expense included in investment in joint ventures and loan pool participations | 13,802,000 | 10,468,000 | 10,095,000 | |||||||||
Depreciation and amortization | 1,618,000 | 1,122,000 | 920,000 | |||||||||
Kennedy-Wilson's share of depreciation and amortization included in investment in joint ventures | 10,054,000 | 7,474,000 | 5,070,000 | |||||||||
Loss on early extinguishment of corporate debt | 4,788,000 | — | — | |||||||||
Income taxes | 3,727,000 | (3,961,000 | ) | 605,000 | ||||||||
EBITDA (1) | 48,108,000 | 18,620,000 | 25,953,000 | |||||||||
Add back: | ||||||||||||
Merger related expenses, including compensation related and general and administrative | 2,225,000 | 16,120,000 | — | |||||||||
Stock based compensation | 8,094,000 | 2,314,000 | 1,015,000 | |||||||||
Adjusted EBITDA (2) | $ | 58,427,000 | $ | 37,054,000 | $ | 26,968,000 | ||||||
—————
(1) EBITDA represents earnings before interest expense, income taxes, and depreciation and amortization. Our management believes EBITDA is useful in evaluating our operating performance compared to that of other companies in our industry because the calculation of EBITDA generally eliminates the effects of financing and income taxes and the accounting effects of capital spending and acquisitions. We do not adjust EBITDA for gains or losses on the extinguishment of mortgage debt as we are in the business of purchasing discounted notes secured by real estate and, in connection with these note purchases, we may resolve these loans through discounted payoffs with the borrowers. Such items may vary for different companies for reasons unrelated to overall operating performance. Additionally, we believe EBITDA is useful to investors to assist them in getting a more accurate picture of our results from operations.
(2) Adjusted EBITDA represents EBITDA, as defined above, adjusted for merger related compensation and related expenses and stock based compensation. Our management uses Adjusted EBITDA to analyze our business because it adjusts EBITDA for items we believe are not representative of the operating performance of our business going forward. Such items may vary for different companies for reasons unrelated to overall operating performance. Additionally, we believe Adjusted EBITDA is useful to investors as it provides a supplemental measure to assist them in getting a more accurate picture of our results from operations.
However, EBITDA and Adjusted EBITDA are not recognized measurements under GAAP and when analyzing our operating performance, readers should use EBITDA and Adjusted EBITDA in addition to, and not as an alternative for, net income as determined in accordance with GAAP. Because not all companies use identical calculations, our presentation of EBITDA and Adjusted EBITDA may not be comparable to similarly titled measures of other companies. Furthermore, EBITDA and Adjusted EBITDA are not intended to be a measure of free cash flow for our management’s discretionary use, as it does not consider certain cash requirements such as tax and debt service payments. The amounts shown for EBITDA and Adjusted EBITDA also differ from the amounts calculated under similarly titled definitions in our debt instruments, which are further adjusted to reflect certain other cash and non-cash charges and are used to determine compliance with financial covenants and our ability to engage in certain activities, such as incurring additional debt and making certain restricted payments.
26
The following summarizes revenue, operating expenses, operating income (loss) and net income (loss) and calculates EBITDA(1) and Adjusted EBITDA(2) by our services, investments, and corporate operating segments for the year ended December 31, 2010:
Services | Investments | Corporate | Consolidated | |||||||||||||
Revenue | $ | 33,064,000 | $ | 17,472,000 | $ | — | $ | 50,536,000 | ||||||||
Operating expenses | 23,701,000 | 27,585,000 | 18,651,000 | 69,937,000 | ||||||||||||
Equity in income of joint ventures | — | 10,548,000 | — | 10,548,000 | ||||||||||||
Income from loan pool particpations | — | 11,855,000 | — | 11,855,000 | ||||||||||||
Operating income (loss) | $ | 9,363,000 | $ | 12,290,000 | $ | (18,651,000 | ) | $ | 3,002,000 | |||||||
Net income (loss) | $ | 9,363,000 | $ | 30,392,000 | $ | (33,270,000 | ) | $ | 6,485,000 | |||||||
Add back: | ||||||||||||||||
Interest expense | — | 676,000 | 6,958,000 | 7,634,000 | ||||||||||||
Kennedy-Wilson's share of interest expense included in investment in joint ventures and loan pool participations | — | 13,802,000 | — | 13,802,000 | ||||||||||||
Depreciation and amortization | 117,000 | 1,342,000 | 159,000 | 1,618,000 | ||||||||||||
Kennedy-Wilson's share of depreciation and amortization included in investment in joint ventures | — | 10,054,000 | — | 10,054,000 | ||||||||||||
Loss on early extinguishment of corporate debt | — | — | 4,788,000 | 4,788,000 | ||||||||||||
Income taxes | — | — | 3,727,000 | 3,727,000 | ||||||||||||
EBITDA (1) | 9,480,000 | 56,266,000 | (17,638,000 | ) | 48,108,000 | |||||||||||
Add back: | ||||||||||||||||
Merger related compensation and related expenses | — | — | 2,225,000 | 2,225,000 | ||||||||||||
Stock based compensation | — | — | 8,094,000 | 8,094,000 | ||||||||||||
Adjusted EBITDA (2) | $ | 9,480,000 | $ | 56,266,000 | $ | (7,319,000 | ) | $ | 58,427,000 | |||||||
27
The following summarizes revenue, operating expenses, operating income (loss) and net income (loss) and calculates EBITDA(1) and Adjusted EBITDA(2) by our services, investments, and corporate operating segments for the year ended December 31, 2009:
Services | Investments | Corporate | Consolidated | |||||||||||||
Revenue | $ | 24,095,000 | $ | 62,114,000 | $ | 26,000 | $ | 86,235,000 | ||||||||
Operating expenses | 20,569,000 | 50,377,000 | 23,926,000 | 94,872,000 | ||||||||||||
Equity in income of joint ventures | — | 8,019,000 | — | 8,019,000 | ||||||||||||
Operating income (loss) | $ | 3,526,000 | $ | 19,756,000 | $ | (23,900,000 | ) | $ | (618,000 | ) | ||||||
Net income (loss) | $ | 3,526,000 | $ | 14,322,000 | $ | (27,505,000 | ) | $ | (9,657,000 | ) | ||||||
Add back: | ||||||||||||||||
Interest expense | — | 5,106,000 | 8,068,000 | 13,174,000 | ||||||||||||
Kennedy-Wilson's share of interest expense included in investment in joint ventures and loan pool participations | — | 10,468,000 | — | 10,468,000 | ||||||||||||
Depreciation and amortization | 70,000 | 919,000 | 133,000 | 1,122,000 | ||||||||||||
Kennedy-Wilson's share of depreciation and amortization included in investment in joint ventures | — | 7,474,000 | — | 7,474,000 | ||||||||||||
Income taxes | — | — | (3,961,000 | ) | (3,961,000 | ) | ||||||||||
EBITDA (1) | 3,596,000 | 38,289,000 | (23,265,000 | ) | 18,620,000 | |||||||||||
Add back: | ||||||||||||||||
Merger related expenses, including compensation and related general and administrative | — | — | 16,120,000 | 16,120,000 | ||||||||||||
Stock based compensation | — | — | 2,314,000 | 2,314,000 | ||||||||||||
Adjusted EBITDA (2) | $ | 3,596,000 | $ | 38,289,000 | $ | (4,831,000 | ) | $ | 37,054,000 | |||||||
28
The following summarizes revenue, operating expenses, operating income (loss) and net income (loss) and calculates EBITDA(1) and Adjusted EBITDA(2) by our services, investments, and corporate operating segments for the year ended December 31, 2008 :
Services | Investments | Corporate | Consolidated | |||||||||||||
Revenue | $ | 29,252,000 | $ | 2,973,000 | $ | — | $ | 32,225,000 | ||||||||
Operating expenses | 21,334,000 | 8,865,000 | 2,372,000 | 32,571,000 | ||||||||||||
Equity in income of joint ventures | — | 10,097,000 | — | 10,097,000 | ||||||||||||
Operating income (loss) | $ | 7,918,000 | $ | 4,205,000 | $ | (2,372,000 | ) | $ | 9,751,000 | |||||||
Net income (loss) | $ | 7,918,000 | $ | 2,231,000 | $ | (9,482,000 | ) | $ | 667,000 | |||||||
Add back: | ||||||||||||||||
Interest expense | — | 1,974,000 | 6,622,000 | 8,596,000 | ||||||||||||
Kennedy-Wilson's share of interest expense included in investment in joint ventures and loan pool participations | — | 10,095,000 | — | 10,095,000 | ||||||||||||
Depreciation and amortization | 83,000 | 683,000 | 154,000 | 920,000 | ||||||||||||
Kennedy-Wilson's share of depreciation and amortization included in investment in joint ventures | — | 5,070,000 | — | 5,070,000 | ||||||||||||
Income taxes | — | — | 605,000 | 605,000 | ||||||||||||
EBITDA (1) | 8,001,000 | 20,053,000 | (2,101,000 | ) | 25,953,000 | |||||||||||
Add back: | ||||||||||||||||
Stock based compensation | — | — | 1,015,000 | 1,015,000 | ||||||||||||
Adjusted EBITDA (2) | $ | 8,001,000 | $ | 20,053,000 | $ | (1,086,000 | ) | $ | 26,968,000 | |||||||
—————
(1) EBITDA represents earnings before interest expense, income taxes, and depreciation and amortization. Our management believes EBITDA is useful in evaluating our operating performance compared to that of other companies in our industry because the calculation of EBITDA generally eliminates the effects of financing and income taxes and the accounting effects of capital spending and acquisitions. We do not adjust EBITDA for gains or losses on the extinguishment of mortgage debt as we are in the business of purchasing discounted notes secured by real estate and, in connection with these note purchases, we may resolve these loans through discounted payoffs with the borrowers. Such items may vary for different companies for reasons unrelated to overall operating performance. Additionally, we believe EBITDA is useful to investors to assist them in getting a more accurate picture of our results from operations.
(2) Adjusted EBITDA represents EBITDA, as defined above, adjusted for merger related expenses and stock based compensation. Our management uses Adjusted EBITDA to analyze our business because it adjusts EBITDA for items we believe are not representative of the operating performance of our business going forward. Such items may vary for different companies for reasons unrelated to overall operating performance. Additionally, we believe Adjusted EBITDA is useful to investors as it provides a supplemental measure to assist them in getting a more accurate picture of our results from operations.
However, EBITDA and Adjusted EBITDA are not recognized measurements under GAAP and when analyzing our operating performance, readers should use EBITDA and Adjusted EBITDA in addition to, and not as an alternative for, net income as determined in accordance with GAAP. Because not all companies use identical calculations, our presentation of EBITDA and Adjusted EBITDA may not be comparable to similarly titled measures of other companies. Furthermore, EBITDA and Adjusted EBITDA are not intended to be a measure of free cash flow for our management’s discretionary use, as it does not consider certain cash requirements such as tax and debt service payments. The amounts shown for EBITDA and Adjusted EBITDA also differ from the amounts calculated under similarly titled definitions in our debt instruments, which are further adjusted to reflect certain other cash and non-cash charges and are used to determine compliance with financial covenants and our ability to engage in certain activities, such as incurring additional debt and making certain restricted payments.
The following compares results of operations for the years ended December 31, 2010 and December 31, 2009 and years ended December 31, 2009 and December 31, 2008.
29
Our Consolidated Financial Results and Comparison of the years ended December 31, 2010 and 2009
Our revenues for the year ended December 31, 2010 and 2009 were $50.5 million and $86.2 million, respectively. Total operating expenses for the same periods were $69.9 million and $94.9 million, respectively. Net loss attributable to our common shareholders was $1.1 million and $15.3 million in 2010 and 2009, respectively. Adjusted EBITDA was $58.4 million and $37.1 million in 2010 and 2009, respectively.
Revenues
Services Segment Revenues
For 2010, management and leasing generated revenues of $21.3 million (including related party fees of approximately $12.4 million) compared to approximately $19.2 million (including related party fees of approximately $10.1 million). Comparing the two years, management and leasing fees increased $2.2 million or 11% which is primarily due to increased asset management fees generated from the increased acquisition activity.
Commission revenues in 2010 increased to $11.7 million (including related party fees of approximately $5.4 million) compared to commission revenues in 2009 of $4.9 million (including related party fees of approximately $0.7 million). The increase can generally be attributed to the overall growth of our company in 2010. The increase in commission revenue was primarily related to a $1.9 million or 46% increase in auction fees from increased auction sales in 2010 versus 2009 and $3.0 million or 304% increase in acquisition fees related to the increased acquisition activity in our investment business.
Investments Segment Revenues
Rental income increased 46% to $4.0 million in 2010 from $2.7 million in 2009. The increase can be primarily attributed to the temporary control and consolidation of one of our multifamily investments that resulted in $1.2 million of consolidated rental income.
Sale of real estate decreased to $13.5 million in 2010 from $59.4 million in 2009. The decrease can be primarily be attributed to the sale of the remaining 11 condominium units in southern California and the sale of a 50% interest in an apartment project in northern California in 2010 versus the sale of 138 condominium units and land in southern California in 2009.
Operating Expenses
Operating expenses in 2010 were approximately $58.4 million (not including cost of real estate sold), as compared to $52.9 million in 2009. This increase of 10% was primarily due to the costs associated with being a public company for a full year in 2010 as compared to a few months in 2009.
Services Segment Operating Expenses
Commissions and marketing expenses decreased to $3.2 million in 2010, a 7% decrease from $3.4 million in 2009. The change in commission and marketing expense generally correlates with the change in auction fee revenue, as the auction business incurs the majority of the commission and marketing expense. However, in 2010, auction fee revenue increased 46% while auction commissions and marketing expense only increased 11%. This change is due to initiatives in our company to operate our business units more efficiently.
Compensation and related expenses were approximately $15.4 million in 2010, as compared to $13.2 million in 2009. The increase can be primarily attributed to discretionary compensation paid to employees which is commensurate with the increase in our services segment Adjusted EBITDA in 2010 as compared to 2009.
General and administrative expenses were $5.0 million in 2010 as compared to $3.9 million in 2009. The increase is primarily related to increased general and administrative expenses required to support the growth in our company and the associated service revenues.
Investments Segment Operating Expenses
Compensation and related expenses were approximately $9.3 million in 2010 as compared to $5.3 million in 2009. The increase can be primarily attributed to discretionary compensation paid to employees which is commensurate with the increase in our investment segment Adjusted EBITDA in 2010 as compared to 2009.
Cost of real estate sold decreased to $11.5 million in 2010 from $41.9 million in 2009. The decrease can be primarily be
30
attributed to the sale of the remaining 11 condominium units in southern California and the sale of a 50% interest in an apartment project in northern California in 2010 versus the sale of 138 condominium units and land in southern California in 2009.
Rental operating expenses in 2010 and 2009 were approximately $1.9 million and $1.1 million, respectively, an increase of 67% from 2009 to 2010. The increase can be primarily attributed to the temporary control and consolidation of one of our multifamily investments that resulted in $0.6 million of consolidated rental operating expenses during 2010.
General and administrative expenses were $3.5 million in 2010 as compared to $1.3 million in 2009. The increase is primarily related to increased general and administrative expenses required to support the growth in our company and the associated equity in income generated from our investment segment.
Depreciation and amortization expense increased to $1.6 million in 2010, a 44% increase from $1.1 million in 2009. The increase can be primarily attributed to the temporary control and consolidation of one of our multifamily investments that resulted in $0.4 million of consolidated depreciation expense during 2010.
Other Operating Expenses
Compensation and related expenses were approximately $13.4 million in 2010, as compared to $6.3 million in 2009. The increase is primarily related to $8.1 million of stock compensation expense in 2010 as compared to $2.3 million in 2009 associated with the 2009 Equity Participation Plan.
Merger related expenses were $2.2 million and related to compensation for 2010 as compared to $16.1 million in 2009, which comprised of $12.5 million related to compensation and related expenses and $3.7 million related to general and administrative expenses. These were costs incurred in connection with the Merger.
General and administrative expenses were $2.8 million in 2010, as compared to $1.1 million in 2009. The increase is primarily related to the cost of being a public company for an entire year in 2010 as compared to a couple months in 2009. Increases can specifically be attributed to audit and accounting fees and legal fees.
Investments Segment Equity in Joint Venture Income
Investments in joint ventures generated income of $10.5 million in 2010, a increase of $2.5 million or 32% from income of $8.0 million recorded in 2009, due primarily to $6.2 million of unrealized fair value gains recognized in 2010 versus $2.7 million in 2009. In order to get a more accurate picture of cash available for distribution at the joint venture, we look at equity in joint venture income before of our share of depreciation included in investment in joint ventures. Our share of depreciation generated at the joint venture level was $10.1 million for 2010 and $7.5 million for 2009, respectively.
Investments Segment Income from Loan Pool Participations and Notes Receivable
Income from loan pool participations and notes receivable generated income of $11.9 million for 2010 as compared to no income for 2009. The increase can be attributed accretion income recognized on the purchase loan pool, with equity partners and wholly owned, of over $650 million of unpaid principal balance.
Non-Operating Items
Remeasurement gain was $2.1 million for 2010 compared to no gain for 2009. The gain was related to the purchase of a controlling joint venture interest in a project in northern California with fair value in excess of the purchase price. There was no such gain in 2009.
Gain on early extinguishment of debt was $16.7 million for 2010 compared to no gain for 2009. The gain was related to the purchase of debt on a 2,700 acre ranch in Hawaii at a discount.
Loss on early extinguishment of debt was $4.8 million for 2010 compared to no loss for 2009. The loss was related to the early extinguishment of the convertible subordinated debt at an amount that was above face value and the associated decrease in the value of the beneficial conversion feature.
Interest expense was $7.6 million in 2010, a decrease of 42% compared to $13.2 million in 2009. The decrease can be primarily attributed to $2.9 million of interest expense incurred on the acquisition and sale of a condominium project in southern California in 2009 as compared to no interest expense incurred in 2010. Also in 2010, we paid off our convertible subordinated note and paid down debt on an apartment project in southern California which resulted in a decrease of approximately $2.0 million of interest in 2010 as compared to 2009.
31
We had net income of $3.0 million attributable to a non-controlling interest in 2010 compared to $5.7 million in 2009. The decrease is primarily due to the allocation to the noncontrolling interest in the income related to the sale of the condominium units in southern California during 2009.
Our Consolidated Financial Results and Comparison of years ended December 31, 2009 and 2008
Our revenues for the year ended December 31, 2009 and December 31, 2008 were $86.2 million and $32.2 million, respectively. Total operating expenses for the same periods were $94.9 million and $32.6 million, respectively. Net loss attributable to our common stockholders was $15.3 million in 2009 compared to net income of $0.6 million attributable to our common stockholders in 2008. Adjusted EBITDA was $37.1 million and $27.0 million in 2009 and 2008, respectively.
Revenues
Services Segment Revenues
For 2009, management and leasing generated revenues of $19.2 million (including related party fees of $10.1 million) compared to approximately $19.1 million (including approximately $8.4 million in related party fees). Comparing the two years, management and leasing fees increased 1% which is due to increased asset management fees associated with equity partner commitments.
Commissions revenues in 2009 decreased to $4.9 million (including approximately $0.7 million in related party fees) compared to commission revenues in 2008 of $10.2 million (including related party fees of approximately $4.3 million). Acquisition fees decreased $4.3 million in 2009 as compared to 2008. The decrease can be attributed primarily to a decrease in property acquisition for ourselves or with our equity partners during a time when prices were falling. This resulted in a decrease in acquisition fees.
Investments Segment Revenues
Rental income decreased 8% to $2.7 million in 2009 from $3.0 million in 2008. Rental income includes rental and other income from properties in which we hold a controlling interest. The decrease can be primarily attributed to the downturn in the economy and the rental markets.
Sale of real estate in 2009 produced gross revenue of $59.4 million related to the sale of 138 condominium units and land in southern California.
Operating Expenses
Operating expenses in 2009 were approximately $52.9 million (not including cost of real estate sold), representing a $20.4 million increase over 2008. This increase was primarily due to $16.1 million of merger related costs and costs associated with the amortization of the 2009 Equity Participation Plan and its replacement, another 2009 Equity Participation Plan.
Services Segment Operating Expenses
Commissions and marketing expenses increased to $3.4 million in 2009 from $2.8 million in 2008. The increase in commission expense corresponds to the higher percentage of auction fees in commission revenues in 2009 compared to 2008, which incur the majority of commission expenses. As noted above, commission revenue for 2008 included a greater component of acquisition fees, which incur a relatively minor portion of expenses. In addition, larger broker fees were paid to outside brokerage firms in 2009.
Compensation and related expenses were approximately $13.2 million in 2009, down 10% from $14.5 million in 2008. The decrease can be primarily attributed to a decrease in personnel.
Investments Segment Operating Expenses
Rental operating expenses in 2009 and 2008 were approximately $1.1 million and $1.5 million, respectively, a decrease of 21% from 2008 to 2009. The decrease can be attributed to the sale of two properties in southern California in 2009.
Cost of real estate sold was $41.9 million in 2009 and relates to the disposition of 138 condominium units and land in southern California. Cost of real estate sold was zero in 2008 as we did not recognize any sales on consolidated real estate.
Depreciation and amortization expense increased to $1.1 million in 2009, a 22% decrease from $0.9 million in 2008. The change was primarily due to the sale of an office building in southern California in 2008 and a full year of depreciation in 2009
32
from an apartment building in central California versus ten months in 2008.
Other Operating Expenses
Compensation and related expenses were approximately $6.3 million in 2009 as compared to $1.6 million in 2008. The increase is primarily due to costs associated with the 2009 Equity Participation Plan.
Merger related expenses were $16.1 million in 2009, $12.5 million related to compensation and related expenses and $3.6 million related to general and administrative expenses. These are costs incurred in connection with the Merger.
Investments Segment Equity in Joint Venture Income
Investments in joint ventures generated income of $8.0 million in 2009, a decrease of 21% from income of $10.1 million recorded in 2008, due primarily to fair value gain of $5.9 million recognized in 2008 as compared to $0.8 million in 2009. The decrease in fair value gain was offset by an increase of $3.0 million of equity in joint venture income earned in 2009 as compared to 2008 not related to fair value adjustments.
Non-Operating Items
Interest expense was $13.2 million in 2009, an increase of 53% compared to $8.6 million for in 2008. The increase was due to interest expense on the debt incurred for the condominium project acquisition, a full year of interest on the central California apartment project, and the debt service on the $30 million subordinate convertible loan originated in November 2008.
Net income of approximately $5.7 million attributable to a non-controlling interest in three properties was recognized in 2009 compared to net income of $0.1 million in 2008. The increase is primarily due to the allocation to the noncontrolling interest in the income related to the sale of condominium units in southern California.
Liquidity and Capital Resources
Our liquidity and capital resources requirements include expenditures for joint venture investments, real estate held for sale, distressed debt and working capital needs. Historically, we have not required significant capital resources to support our brokerage and property management operations. We finance these operations with internally generated funds, borrowings under our revolving line of credit and sales of equity and debt securities. Our investments in real estate are typically financed by mortgage loans secured primarily by that real estate. These mortgage loans are generally nonrecourse in that, in the event of default, recourse will be limited to the mortgaged property serving as collateral. In some cases, we guarantee a portion of the loan related to a joint venture investment, usually until some condition, such as completion of construction or leasing or certain net operating income criteria, has been met. We do not expect these guarantees to materially affect liquidity or capital resources.
Cash Flows
Net cash provided by operating activities totaled $2.2 million for the year ended December 31, 2010, an increase of $27.4 million as compared to the year ended December 31, 2009. The increase is primarily related to net income in 2010 of $6.4 million versus a net loss in 2009 of $9.7 million. Additionally, the increase can be attributed to an increase in operating distributions from joint ventures and an increase in stock compensation expense in 2010 versus 2009, as well as a decrease in gains from sales of real estate for the same periods. These increases were offset by a large gain from early extinguishment of debt and interest income from loan pool participations and notes receivable in 2010.
Net cash used in operating activities totaled $25.2 million for the year ended December 31, 2009, an increase of $10.6 million as compared to the year ended December 31, 2008. The change was primarily due to the cost incurred in connection with the Merger.
Net cash used in investing activities totaled approximately $114.8 million for the year ended December 31, 2010, an increase of $183.8 million as compared to the year ended December 31, 2009. This sharp decrease is primarily attributable to the assets acquired in the Merger in 2009. Additionally, significant cash was used in 2010 for the acquisition of a consolidated loan pool and contributions to joint ventures for new acquisitions and recapitalizations of current deals. Lastly, proceeds from the sale of real estate provided significantly more cash in 2009 versus 2010.
Net cash provided by investing activities totaled approximately $69.0 million for the year ended December 31, 2009, an increase of $165.8 million as compared to the year ended December 31, 2008. The increase was primarily due to assets acquired in connection with the Merger, decreased contributions to joint ventures, decreased distributions from joint ventures,
33
and proceeds from sales of real estate in 2009.
Net cash provided by financing activities totaled approximately $91.2 million for the year ended December 31, 2010, an increase of $106.9 million as compared to the year ended December 31, 2009. The large increase was primarily due the proceeds obtained from the issuance of the Series A and Series B preferred stock. This was offset by the cash used to pay off of our convertible subordinated note and repurchase warrants and common stock.
Net cash used in financing activities totaled approximately $15.7 million for the year ended December 31, 2009, a decrease of $128.3 million as compared to the year ended December 31, 2008. The decrease was primarily due to the issuance of stock and the issuance of convertible subordinated debt during the year ended December 31, 2008 as well as increased distributions to noncontrolling interests during the year ended December 31, 2009. Additionally, there were significant mortgage loan repayments from the sale of real estate during the year ended December 31, 2009.
To the extent that we engage in additional strategic investments, including real estate, note portfolios, or acquisitions of other property management companies, we may need to obtain third-party financing which could include bank financing or the public sale or private placement of debt or equity securities. We believe that existing cash and cash equivalents plus capital generated from property management and leasing, brokerage, sales of real estate owned, collections from notes receivable, as well as our current lines of credit, will provide us with sufficient capital requirements for the at least the next 12 months.
Under our current joint venture strategy, we generally contribute property, expertise, and typically a fully funded initial cash contribution (without commitment to additional funding by us). Capital required for additional improvements and supporting operations during lease-up and stabilization periods is generally obtained at the time of acquisition via debt financing or third party investors. Accordingly, we generally do not have significant capital commitments with unconsolidated entities. Infrequently, there may be some circumstances when we, usually with the other members of the joint venture entity, may be required to contribute additional capital for a limited period of time. We believe that we have the capital resources, generated from our business activities and borrowing capacity, to finance any such capital requirements, and do not believe that any additional capital contributions to joint ventures will materially affect liquidity.
Our need, if any, to raise additional funds to meet our capital requirements will depend on many factors, including the success and pace of the implementation of our strategy for growth. We regularly monitor capital raising alternatives to be able to take advantage of other available avenues to support our working capital and investment needs, including strategic partnerships and other alliances, bank borrowings, and the sale of equity or debt securities. We expect to meet the repayment obligations of notes payable and borrowings under lines of credit from cash generated by our business activities, including the sale of assets and the refinancing of debt. We intend to retain earnings to finance our growth and, therefore, do not anticipate paying dividends.
Contractual Obligations and Commercial Commitments
At December 31, 2010, our contractual cash obligations, including debt, lines of credit, and operating leases included the following:
Payments due by period | ||||||||||||||||||||
Total | Less than 1 year | 1 - 3 years | 4 - 5 years | After 5 years | ||||||||||||||||
Contractual obligations | ||||||||||||||||||||
Borrowings: (1) | ||||||||||||||||||||
Notes payable | $ | 24,783,000 | $ | 9,850,000 | $ | 11,200,000 | $ | 3,733,000 | $ | — | ||||||||||
Borrowings under lines of credit | 27,750,000 | — | 27,750,000 | — | — | |||||||||||||||
Mortgage loans payable | 35,249,000 | 311,000 | 34,938,000 | — | — | |||||||||||||||
Subordinated debt | 40,000,000 | — | — | — | 40,000,000 | |||||||||||||||
Total borrowings | 127,782,000 | 10,161,000 | 73,888,000 | 3,733,000 | 40,000,000 | |||||||||||||||
Operating leases | 9,065,000 | 1,865,000 | 3,004,000 | 2,793,000 | 1,403,000 | |||||||||||||||
Total contractual cash obligations | $ | 136,847,000 | $ | 12,026,000 | $ | 76,892,000 | $ | 6,526,000 | $ | 41,403,000 | ||||||||||
—————
(1) | See Notes 11-15 of our Note to Consolidated Financial Statements. Figures do not include scheduled interest payments. Assuming each debt obligation is held until maturity, we estimate that we will make the following interest |
34
payments: Less than 1 year-$6,668,000; 1-3 years-$10,733,000; 4-5 years-$7,304,000; After 5 years: $46,104,000. The interest payments on variable rate debt have been calculated at the interest rate in effect at December 31, 2010.
Off-Balance Sheet Arrangements
Guarantees
We have provided guarantees associated with loans secured by assets held in various joint venture partnerships. The maximum potential amount of future payments (undiscounted) we could be required to make under the guarantees was approximately $28 million and $35 million at December 31, 2010 and December 31, 2009, respectively. The guarantees expire by the year end of 2011 and our performance under the guarantees would be required to the extent there is a shortfall in liquidation between the principal amount of the loan and the net sales proceeds of the property. If we were to become obligated to perform on these guarantees, it could have an adverse affect on our financial condition.
Non-Recourse Carve Out Guarantees
Most of our real estate properties within our equity partnerships are encumbered by traditional non-recourse debt obligations. In connection with most of these loans, however, we entered into certain “non-recourse carve out” guarantees, which provide for the loans to become partially or fully recourse against us if certain triggering events occur. Although these events are different for each guarantee, some of the common events include:
• | The special purpose property-owning subsidiary’s filing a voluntary petition for bankruptcy; |
• | The special purpose property-owning subsidiary’s failure to maintain its status as a special purpose entity; and |
• | Subject to certain conditions, the special purpose property-owning subsidiary’s failure to obtain lender’s written consent prior to any subordinate financing or other voluntary lien encumbering the associated property. |
In the event that any of these triggering events occur and the loans become partially or fully recourse against us, our business, financial condition, results of operations and common stock price could be materially adversely affected.
In addition, other items that are customarily recourse to a non-recourse carve out guarantor include, but are not limited to, the payment of real property taxes, liens which are senior to the mortgage loan and outstanding security deposits.
Impact of Inflation and Changing Prices
Inflation has not had a significant impact on the results of operations of our company in recent years and is not anticipated to have a significant impact in the foreseeable future. Our exposure to market risk from changing prices consists primarily of fluctuations in rental rates of commercial and residential properties, market interest rates on residential mortgages and debt obligations and real estate property values. The revenues associated with the commercial services businesses are impacted by fluctuations in interest rates, lease rates, real property values and the availability of space and competition in the market place. Commercial service revenues are derived from a broad range of services that are primarily transaction driven and are therefore volatile in nature and highly competitive. The revenues of the property management operations with respect to rental properties are highly dependent upon the aggregate rents of the properties managed, which are affected by rental rates and building occupancy rates. Rental rate increases are dependent upon market conditions and the competitive environments in the respective locations of the properties. Employee compensation is the principal cost element of property management. Economic trends in 2010 were characterized by general decrease in commercial leasing volume in the U.S.
Qualitative and Quantitative Disclosures about Market Risk
The primary market risk exposure of our company relates to changes in interest rates in connection with our short-term borrowings, some of which bear interest at variable rates based on lender’s base rate, prime rate, and LIBOR plus an applicable borrowing margin. These borrowings do not give rise to a significant interest rate risk because they have short maturities. Historically, we have not experienced material gains or losses due to interest rate changes.
Interest Rate Risk
We have established an interest rate management policy, which attempts to minimize our overall cost of debt, while taking into consideration the earnings implications associated with the volatility of short-term interest rates. As part of this policy, we have elected to maintain a combination of variable and fixed rate debt.
The tables below represent contractual balances of our financial instruments at the expected maturity dates as well as the fair value at December 31, 2010. The expected maturity categories take into consideration actual amortization of principal and do not take into consideration reinvestment of cash. The weighted average interest rate for the various assets and liabilities
35
presented are actual as of December 31, 2010. We closely monitor the fluctuation in interest rates, and if rates were to increase significantly, we believe that we would be able to either hedge the change in the interest rate or to refinance the loans with fixed interest rate debt. All instruments included in this analysis are non-trading.
Principal maturing in: | Fair Value | |||||||||||||||||||||||||||||||
2010 | 2011 | 2012 | 2013 | 2014 | Thereafter | Total | December 31, 2010 | |||||||||||||||||||||||||
(in thousands) | ||||||||||||||||||||||||||||||||
Interest rate sensitive assets | ||||||||||||||||||||||||||||||||
Cash equivalents | $ | 46,968 | — | — | — | — | — | $ | 46,968 | $ | 46,968 | |||||||||||||||||||||
Average interest rate | 0.34 | % | — | — | — | — | — | 0.34 | % | — | ||||||||||||||||||||||
Variable rate receivables | — | $ | 18,402 | — | — | — | — | 18,402 | 28,338 | |||||||||||||||||||||||
Average interest rate | — | 4.78 | % | — | — | — | — | 4.78 | % | — | ||||||||||||||||||||||
Fixed rate receivables | 5,699 | — | — | — | — | — | 5,699 | 5,699 | ||||||||||||||||||||||||
Average interest rate | 12.32 | % | — | — | — | — | — | 12.32 | % | — | ||||||||||||||||||||||
Total | $ | 52,667 | $ | 18,402 | — | — | — | — | $ | 71,069 | $ | 81,005 | ||||||||||||||||||||
Weighted average interest rate | 1.64 | % | 4.78 | % | — | — | — | — | 2.45 | % | ||||||||||||||||||||||
Interest rate sensitive liabilities | ||||||||||||||||||||||||||||||||
Variable rate borrowings | $ | 17,497 | $ | 27,750 | — | $ | 14,968 | $ | 20,533 | — | $ | 80,748 | $ | 80,415 | ||||||||||||||||||
Average interest rate | 1.51 | % | 4.00 | % | — | 4.25 | % | 4.00 | % | — | 3.51 | % | — | |||||||||||||||||||
Fixed rate borrowings | — | 4,250 | $ | 2,784 | — | — | $ | 40,000 | 47,034 | 49,198 | ||||||||||||||||||||||
Average interest rate | — | 5.00 | % | 4.80 | % | — | — | 9.06 | % | 8.44 | % | — | ||||||||||||||||||||
Total | $ | 17,497 | $ | 32,000 | $ | 2,784 | $ | 14,968 | $ | 20,533 | $ | 40,000 | $ | 127,782 | $ | 129,613 | ||||||||||||||||
Weighted average interest rate | 1.51 | % | 4.13 | % | 4.80 | % | 4.25 | % | 4.00 | % | 9.06 | % | 5.32 | % | ||||||||||||||||||
Recently Issued Accounting Pronouncements
In December 2010, the FASB issued Accounting Standards Codification (ASC) Update No. 2010-29, Business Combinations (Topic 805): Disclosure of Supplementary Pro Forma Information for Business Combinations. The amendments in this update are effective prospectively for business combinations for which the acquisition date is on or after the beginning of the first annual reporting period beginning on or after December 15, 2010. We expect that the adoption of ASU 2010-29 will not have a material impact on our consolidated financial statements.
In April 2010, the FASB issued ASC Update No. 2010-18, Receivables (Topic 310): Effect of a Loan Modification When the Loan Is Part of a Pool That Is Accounted for as a Single Asset—a consensus of the FASB Emerging Issues Task Force, to clarify that loan modifications within loan pools accounted for as a single asset do not result in the removal of those loans from the pool even if the modification of those loans would otherwise be considered a troubled debt restructuring. Update No. 2010-18 is effective for interim and annual reporting periods ending after July 15, 2010, with early adoption permitted. This update is consistent with our current policy and, as such, Update No. 2010-18 has no material impact on the accompanying condensed consolidated financial statements.
In January 2010, the FASB issued Accounting Standards Codification (ASC) Update No. 2010-06, Fair Value Measurements and Disclosures: Improving Disclosures about Fair Value Measurements, to improve disclosure requirements related to Fair Value Measurements and Disclosures – Subtopic 820. Update No. 2010-06 is effective for interim and annual reporting periods ending after December 15, 2009, except for the disclosures about purchases, sales, issuance, and settlements in the roll forward activity in Level 3 fair value measurements which are effective for fiscal years beginning after December 15, 2010. Update No. 2010-06 was adopted on January 1, 2010, and there is no material impact to the accompanying consolidated financial statements. Additionally, we have adopted the disclosures requirements about purchases, sales, issuances, and settlements in the roll forward activity in Level 3 fair value measurements.
Item 7A. Quantitative and Qualitative Disclosures About Market Risk
The information contained in Item 7. “Management’s Discussion and Analysis of Financial Condition and Results of Operations” is incorporated by reference into Item 7A.
36
Item 8. Financial Statements and Supplementary Data
FINANCIAL STATEMENTS
Kennedy-Wilson Holdings, Inc.
Index to Financial Statements
Page | ||
Kennedy-Wilson Holdings, Inc: | ||
Financial Statements | ||
Financial Statement Schedules | ||
KW Residential, LLC: | ||
Financial Statements | ||
KW Property Fund III, LP: | ||
Financial Statements | ||
KW/WDC Portfolio Member, LLC and Subsidiaries and One Carlsbad: | ||
Financial Statements | ||
37
Report of Independent Registered Public Accounting Firm
The Board of Directors and Stockholders
Kennedy-Wilson Holdings, Inc.:
We have audited the accompanying consolidated balance sheets of Kennedy-Wilson Holdings, Inc. and subsidiaries as of December 31, 2010 and 2009, and the related consolidated statements of operations and comprehensive income (loss), equity, and cash flows for each of the years in the three-year period ended December 31, 2010. In connection with our audits of the consolidated financial statements, we also have audited financial statement schedule III. These consolidated financial statements and financial statement schedule are the responsibility of the Company's management. Our responsibility is to express an opinion on these consolidated financial statements and financial statement schedule based on our audits. We did not audit the December 31, 2009 financial statements of KW Residential, LLC a 35% owned investee company. Kennedy-Wilson Holdings, Inc.'s investment in KW Residential, LLC as of December 31, 2009 was $91,276,000 and its equity in joint venture income was $5,949,000 for the year ended December 31, 2009. The December 31, 2009 financial statements of KW Residential, LLC were audited by other auditors whose reports has been furnished to us, and our opinion, insofar as it relates to the December 31, 2009 amounts included for KW Residential, LLC, is based solely on the report of the other auditors.
We conducted our audits in accordance with the standards of the Public Company Accounting Oversight Board (United States). Those standards require that we plan and perform the audit to obtain reasonable assurance about whether the financial statements are free of material misstatement. An audit includes examining, on a test basis, evidence supporting the amounts and disclosures in the financial statements. An audit also includes assessing the accounting principles used and significant estimates made by management, as well as evaluating the overall financial statement presentation. We believe that our audits provide a reasonable basis for our opinion.
In our opinion, the consolidated financial statements referred to above present fairly, in all material respects, the financial position of Kennedy-Wilson Holdings, Inc. and subsidiaries as of December 31, 2010 and 2009, and the results of their operations and their cash flows for each of the years in the three-year period ended December 31, 2010, in conformity with U.S. generally accepted accounting principles. Also in our opinion, the related financial statement schedule, when considered in relation to the basic consolidated financial statements taken as a whole, presents fairly, in all material respects, the information set forth therein.
We also have audited, in accordance with the standards of the Public Company Accounting Oversight Board (United States), Kennedy-Wilson Holdings, Inc.'s internal control over financial reporting as of December 31, 2010, based on criteria established in Internal Control - Integrated Framework issued by the Committee of Sponsoring Organizations of the Treadway Commission (COSO), and our report dated March 10, 2011 expressed an unqualified opinion on the effectiveness of the Company's internal control over financial reporting.
/s/ KPMG LLP
Los Angeles, California
March 11, 2011
38
Report of Independent Registered Public Accounting Firm
The Board of Directors and Stockholders
Kennedy-Wilson Holdings, Inc.:
We have audited Kennedy-Wilson Holdings Inc.'s internal control over financial reporting as of December 31, 2010, based on criteria established in Internal Control - Integrated Framework issued by the Committee of Sponsoring Organizations of the Treadway Commission (COSO). Kennedy-Wilson Holdings Inc.'s management is responsible for maintaining effective internal control over financial reporting and for its assessment of the effectiveness of internal control over financial reporting. Our responsibility is to express an opinion on the Company's internal control over financial reporting based on our audit.
We conducted our audit in accordance with the standards of the Public Company Accounting Oversight Board (United States). Those standards require that we plan and perform the audit to obtain reasonable assurance about whether effective internal control over financial reporting was maintained in all material respects. Our audit included obtaining an understanding of internal control over financial reporting, assessing the risk that a material weakness exists, and testing and evaluating the design and operating effectiveness of internal control based on the assessed risk. Our audit also included performing such other procedures as we considered necessary in the circumstances. We believe that our audit provides a reasonable basis for our opinion.
A company's internal control over financial reporting is a process designed to provide reasonable assurance regarding the reliability of financial reporting and the preparation of financial statements for external purposes in accordance with U.S. generally accepted accounting principles. A company's internal control over financial reporting includes those policies and procedures that (1) pertain to the maintenance of records that, in reasonable detail, accurately and fairly reflect the transactions and dispositions of the assets of the company; (2) provide reasonable assurance that transactions are recorded as necessary to permit preparation of financial statements in accordance with U.S. generally accepted accounting principles, and that receipts and expenditures of the company are being made only in accordance with authorizations of management and directors of the company; and (3) provide reasonable assurance regarding prevention or timely detection of unauthorized acquisition, use, or disposition of the company's assets that could have a material effect on the financial statements.
Because of its inherent limitations, internal control over financial reporting may not prevent or detect misstatements. Also, projections of any evaluation of effectiveness to future periods are subject to the risk that controls may become inadequate because of changes in conditions, or that the degree of compliance with the policies or procedures may deteriorate.
In our opinion, Kennedy-Wilson Holdings Inc. maintained, in all material respects, effective internal control over financial reporting as of December 31, 2010, based on criteria established in Internal Control - Integrated Framework issued by the Committee of Sponsoring Organizations of the Treadway Commission.
We also have audited, in accordance with the standards of the Public Company Accounting Oversight Board (United States), the consolidated balance sheets of Kennedy-Wilson Holdings, Inc. and subsidiaries as of December 31, 2010 and 2009, and the related consolidated statements of operations and comprehensive income (loss), equity, and cash flows for each of the years in the three-year period ended December 31, 2010, and our report dated March 10, 2011 expressed an unqualified opinion on those consolidated financial statements. Our report indicates that the December 31, 2009 financial statements of KW Residential, LLC were audited by other auditors and our opinion, insofar as it relates to the amounts included in the December 31, 2009 consolidated financial statements of Kennedy-Wilson Holdings, Inc. for KW Residential, LLC is based solely on the report of the other auditors.
/s/ KPMG LLP
Los Angeles, California
March 11, 2011
39
Kennedy-Wilson Holdings, Inc. and Subsidiaries
Consolidated Balance Sheets
December 31, | ||||||||
2010 | 2009 | |||||||
Assets | ||||||||
Cash and cash equivalents | $ | 46,968,000 | $ | 57,784,000 | ||||
Accounts receivable | 2,097,000 | 887,000 | ||||||
Accounts receivable—related parties | 7,062,000 | 4,278,000 | ||||||
Income tax receivable | — | 6,848,000 | ||||||
Notes receivable | 20,264,000 | 541,000 | ||||||
Notes receivable—related parties | 3,837,000 | 6,644,000 | ||||||
Real estate, net of accumulated depreciation | 82,701,000 | 40,581,000 | ||||||
Real estate available for sale | — | 2,472,000 | ||||||
Investments in joint ventures ($34,687,000 and $19,612,000 carried at fair value as of December 31, 2010 and 2009, respectively) | 266,886,000 | 185,252,000 | ||||||
Investment in loan pool participations | 25,218,000 | — | ||||||
Other assets | 8,850,000 | 7,005,000 | ||||||
Goodwill | 23,965,000 | 23,965,000 | ||||||
Total assets | $ | 487,848,000 | $ | 336,257,000 | ||||
Liabilities and equity | ||||||||
Liabilities | ||||||||
Accounts payable | $ | 1,504,000 | $ | 860,000 | ||||
Accrued expenses and other liabilities | 9,064,000 | 8,648,000 | ||||||
Accrued salaries and benefits | 10,721,000 | 4,401,000 | ||||||
Deferred tax liability | 25,871,000 | 15,439,000 | ||||||
Notes payable | 24,783,000 | 26,133,000 | ||||||
Borrowings under line of credit | 27,750,000 | 10,000,000 | ||||||
Mortgage loans payable | 35,249,000 | 23,968,000 | ||||||
Convertible subordinated debt | — | 27,472,000 | ||||||
Junior subordinated debentures | 40,000,000 | 40,000,000 | ||||||
Total liabilities | 174,942,000 | 156,921,000 | ||||||
Equity | ||||||||
Cumulative Preferred stock, $0.0001 par value, 1,000,000 shares authorized, $1,000 per share liquidation preference: | ||||||||
6.00% Series A, 100,000 and 0 shares issued and outstanding as of December 31, 2010 and 2009, respectively, mandatorily convertible on May 19, 2015 | — | — | ||||||
6.452% Series B, 32,550 and 0 shares issued and outstanding as of December 31, 2010 and 2009, respectively, mandatorily convertible on November 18, 2018 | — | — | ||||||
Common stock, $0.0001 par value, 125,000,000 and 80,000,000 shares authorized, 41,291,596 and 41,177,658 shares issued and 40,179,906 and 41,177,658 shares outstanding as of December 31, 2010 and 2009, respectively | 4,000 | 4,000 | ||||||
Additional paid-in capital | 284,669,000 | 155,878,000 | ||||||
Retained earnings | 17,777,000 | 18,829,000 | ||||||
Accumulated other comprehensive income | 9,043,000 | 2,603,000 | ||||||
Shares held in treasury at cost, $0.0001 par value, 1,111,690 and 0 held as of December 31, 2010 and 2009, respectively | (11,301,000 | ) | — | |||||
Total Kennedy-Wilson Holdings, Inc. stockholders’ equity | 300,192,000 | 177,314,000 | ||||||
Noncontrolling interests | 12,714,000 | 2,022,000 | ||||||
Total equity | 312,906,000 | 179,336,000 | ||||||
Total liabilities and equity | $ | 487,848,000 | $ | 336,257,000 | ||||
See accompanying notes to consolidated financial statements.
40
Kennedy-Wilson Holdings, Inc. and Subsidiaries
Consolidated Statements of Operations and Comprehensive Income (Loss)
Year ended December 31, | ||||||||||||
2010 | 2009 | 2008 | ||||||||||
Revenue | ||||||||||||
Management and leasing fees | $ | 8,913,000 | $ | 9,026,000 | $ | 10,671,000 | ||||||
Management and leasing fees—related party | 12,417,000 | 10,138,000 | 8,380,000 | |||||||||
Commissions | 6,359,000 | 4,204,000 | 5,906,000 | |||||||||
Commissions—related party | 5,375,000 | 727,000 | 4,295,000 | |||||||||
Sale of real estate | 3,937,000 | 52,699,000 | — | |||||||||
Sale of real estate—related party | 9,535,000 | 6,698,000 | — | |||||||||
Rental and other income | 4,000,000 | 2,743,000 | 2,973,000 | |||||||||
Total revenue | 50,536,000 | 86,235,000 | 32,225,000 | |||||||||
Operating expenses | ||||||||||||
Commission and marketing expenses | 3,186,000 | 3,411,000 | 2,827,000 | |||||||||
Compensation and related expenses | 38,155,000 | 24,789,000 | 21,292,000 | |||||||||
Merger-related compensation and related expenses | 2,225,000 | 12,468,000 | — | |||||||||
Cost of real estate sold | 2,714,000 | 36,179,000 | — | |||||||||
Cost of real estate sold—related party | 8,812,000 | 5,752,000 | — | |||||||||
General and administrative | 11,314,000 | 6,351,000 | 6,074,000 | |||||||||
Merger-related general and administrative | — | 3,652,000 | — | |||||||||
Depreciation and amortization | 1,618,000 | 1,122,000 | 920,000 | |||||||||
Rental operating expense | 1,913,000 | 1,148,000 | 1,458,000 | |||||||||
Total operating expenses | 69,937,000 | 94,872,000 | 32,571,000 | |||||||||
Equity in joint venture income | 10,548,000 | 8,019,000 | 10,097,000 | |||||||||
Interest income from loan pool participations and notes receivable | 11,855,000 | — | — | |||||||||
Operating income (loss) | 3,002,000 | (618,000 | ) | 9,751,000 | ||||||||
Non-operating income (expense) | ||||||||||||
Interest income | 192,000 | 102,000 | 221,000 | |||||||||
Interest income—related party | 662,000 | 400,000 | 341,000 | |||||||||
Remeasurement gain | 2,108,000 | — | — | |||||||||
Gain on early extinguishment of mortgage debt | 16,670,000 | — | — | |||||||||
Loss on early extinguishment of corporate debt | (4,788,000 | ) | — | — | ||||||||
Interest expense | (7,634,000 | ) | (13,174,000 | ) | (8,596,000 | ) | ||||||
Other than temporary impairment | — | (328,000 | ) | (445,000 | ) | |||||||
Income (loss) before (provision for) benefit from income taxes | 10,212,000 | (13,618,000 | ) | 1,272,000 | ||||||||
(Provision for) benefit from income taxes | (3,727,000 | ) | 3,961,000 | (605,000 | ) | |||||||
Net income (loss) | 6,485,000 | (9,657,000 | ) | 667,000 | ||||||||
Net income attributable to the noncontrolling interests | (2,979,000 | ) | (5,679,000 | ) | (54,000 | ) | ||||||
Net income (loss) attributable to Kennedy-Wilson Holdings, Inc. | 3,506,000 | (15,336,000 | ) | 613,000 | ||||||||
Preferred stock dividends and accretion of issuance costs | (4,558,000 | ) | — | — | ||||||||
Net (loss) income attributable to Kennedy-Wilson Holdings, Inc. common shareholders | (1,052,000 | ) | (15,336,000 | ) | 613,000 | |||||||
Other comprehensive income, net of tax | 6,440,000 | 2,601,000 | 240,000 | |||||||||
Total comprehensive income (loss) | $ | 5,388,000 | $ | (12,735,000 | ) | $ | 853,000 | |||||
Basic income (loss) per share attributable to Kennedy-Wilson Holdings, Inc. coommon shareholders | $ | (0.03 | ) | $ | (0.57 | ) | $ | 0.03 | ||||
Weighted average shares outstanding for basic (loss) income per share | 38,978,272 | 26,891,304 | 22,892,498 | |||||||||
Diluted income (loss) per share attributable to Kennedy-Wilson Holdings, Inc. common shareholders | $ | (0.03 | ) | $ | (0.57 | ) | $ | 0.03 | ||||
Weighted average shares outstanding for diluted (loss) income per share | 38,978,272 | 26,891,304 | 24,310,299 | |||||||||
See accompanying notes to consolidated financial statements.
41
Kennedy-Wilson Holdings, Inc. and Subsidiaries
Consolidated Statement of Equity
Accumulated | ||||||||||||||||||||||||||||||||||||||
Additional | Other | |||||||||||||||||||||||||||||||||||||
Preferred Stock | Common Stock | Paid-in | Retained | Comprehensive | Treasury | Noncontrolling | ||||||||||||||||||||||||||||||||
Shares | Amount | Shares | Amount | Capital | Earnings | Income | Stock | Interests | Total | |||||||||||||||||||||||||||||
Balance, January 1, 2008 | — | $ | — | 21,370,370 | $ | 2,000 | $ | 9,975,000 | $ | 47,118,000 | $ | (238,000 | ) | $ | — | $ | 219,000 | $ | 57,076,000 | |||||||||||||||||||
Issuance of common stock | — | — | 5,598,982 | 1,000 | 52,353,000 | — | — | — | — | 52,354,000 | ||||||||||||||||||||||||||||
Issuance of common stock - exercise of stock options | — | — | 42,785 | — | 93,000 | — | — | — | — | 93,000 | ||||||||||||||||||||||||||||
Repurchase of common stock | — | — | (624,938 | ) | — | (6,170,000 | ) | — | — | — | — | (6,170,000 | ) | |||||||||||||||||||||||||
Amortization of equity compensation | — | — | — | — | 1,015,000 | — | — | — | — | 1,015,000 | ||||||||||||||||||||||||||||
Discount on convertible subordinated debt | — | — | — | — | 2,813,000 | — | — | — | — | 2,813,000 | ||||||||||||||||||||||||||||
Other comprehensive loss: | ||||||||||||||||||||||||||||||||||||||
Foreign currency translation, net of tax of $160,000 | — | — | — | — | — | — | 240,000 | — | — | 240,000 | ||||||||||||||||||||||||||||
Dividends paid | — | — | — | — | — | (2,264,000 | ) | — | — | — | (2,264,000 | ) | ||||||||||||||||||||||||||
Net income | — | — | — | — | — | 613,000 | — | — | 54,000 | 667,000 | ||||||||||||||||||||||||||||
Contributions from noncontrolling interests | — | — | — | — | — | — | — | — | 482,000 | 482,000 | ||||||||||||||||||||||||||||
Distributions to noncontrolling interests | — | — | — | — | — | — | — | — | (504,000 | ) | (504,000 | ) | ||||||||||||||||||||||||||
Balance, December 31, 2008 | — | — | 26,387,199 | 3,000 | 60,079,000 | 45,467,000 | 2,000 | — | 251,000 | 105,802,000 | ||||||||||||||||||||||||||||
Effect of Merger on common stock | — | — | 12,820,215 | 1,000 | 89,006,000 | — | — | — | — | 89,007,000 | ||||||||||||||||||||||||||||
Issuance of common stock - exercise of stock options | — | — | 55,449 | — | 59,000 | — | — | — | — | 59,000 | ||||||||||||||||||||||||||||
Repurchase of common stock | — | — | (442,648 | ) | — | (3,690,000 | ) | — | — | — | — | (3,690,000 | ) | |||||||||||||||||||||||||
Stock compensation expense | — | — | — | — | 3,857,000 | — | — | — | — | 3,857,000 | ||||||||||||||||||||||||||||
Common stock issued under 2009 Equity Participation Plan | — | — | 2,357,443 | — | — | — | — | — | — | — | ||||||||||||||||||||||||||||
2009 Equity Participation Plan replacement payment | — | — | — | — | (1,500,000 | ) | — | — | — | — | (1,500,000 | ) | ||||||||||||||||||||||||||
Other comprehensive loss: | ||||||||||||||||||||||||||||||||||||||
Foreign currency translation, net of tax of $1,472,000 | — | — | — | — | — | — | 2,407,000 | — | — | 2,407,000 | ||||||||||||||||||||||||||||
Unrealized loss on marketable security, net of tax of $129,000 | — | — | — | — | — | — | 194,000 | — | — | 194,000 | ||||||||||||||||||||||||||||
Dividends paid | — | — | — | — | — | (3,235,000 | ) | — | — | — | (3,235,000 | ) | ||||||||||||||||||||||||||
Additional shares to pre-Merger preferred shareholders | — | — | — | — | 7,879,000 | (7,879,000 | ) | — | — | — | — | |||||||||||||||||||||||||||
Accretion of common stock beneficial conversion | — | — | — | — | 188,000 | (188,000 | ) | — | — | — | — | |||||||||||||||||||||||||||
Net (loss) income | — | — | — | — | — | (15,336,000 | ) | — | — | 5,679,000 | (9,657,000 | ) | ||||||||||||||||||||||||||
Contributions from noncontrolling interests | — | — | — | — | — | — | — | — | 6,804,000 | 6,804,000 | ||||||||||||||||||||||||||||
Distributions to noncontrolling interests | — | — | — | — | — | — | — | — | (10,712,000 | ) | (10,712,000 | ) | ||||||||||||||||||||||||||
Balance, December 31, 2009 | — | — | 41,177,658 | 4,000 | 155,878,000 | 18,829,000 | 2,603,000 | — | 2,022,000 | 179,336,000 | ||||||||||||||||||||||||||||
Issuance of preferred stock, net of issuance costs of $256,000 | 132,550 | — | — | — | 132,294,000 | — | — | — | — | 132,294,000 | ||||||||||||||||||||||||||||
Repurchase of 1,111,690 common shares | — | — | (1,111,690 | ) | — | — | — | — | (11,301,000 | ) | — | (11,301,000 | ) | |||||||||||||||||||||||||
Repurchase and retirement of warrants | — | — | — | — | (11,500,000 | ) | — | — | — | — | (11,500,000 | ) | ||||||||||||||||||||||||||
Stock compensation expense | — | — | — | — | 7,666,000 | — | — | — | — | 7,666,000 | ||||||||||||||||||||||||||||
Common stock issued under 2009 Equity Participation Plan | — | — | 113,938 | — | 428,000 | — | — | — | — | 428,000 | ||||||||||||||||||||||||||||
Other comprehensive income: | ||||||||||||||||||||||||||||||||||||||
Foreign currency translation, net of tax of $4,269,000 | — | — | — | — | — | — | 6,434,000 | — | — | 6,434,000 | ||||||||||||||||||||||||||||
Unrealized gain on marketable security, net of tax of $5,000 | — | — | — | — | — | — | 6,000 | — | — | 6,000 | ||||||||||||||||||||||||||||
Preferred stock dividends paid | — | — | — | — | — | (4,533,000 | ) | — | — | — | (4,533,000 | ) | ||||||||||||||||||||||||||
Accretion of preferred stock issuance costs | — | — | — | — | 25,000 | (25,000 | ) | — | — | — | — | |||||||||||||||||||||||||||
Extinguished beneficial conversion feature on convertible debt | — | — | — | — | (122,000 | ) | — | — | — | — | (122,000 | ) | ||||||||||||||||||||||||||
Net income | — | — | — | — | — | 3,506,000 | — | — | 2,979,000 | 6,485,000 | ||||||||||||||||||||||||||||
Contributions from noncontrolling interests | — | — | — | — | — | — | — | — | 10,955,000 | 10,955,000 | ||||||||||||||||||||||||||||
Distributions to noncontrolling interests | — | — | — | — | — | — | — | — | (3,242,000 | ) | (3,242,000 | ) | ||||||||||||||||||||||||||
Balance, December 31, 2010 | 132,550 | $ | — | 40,179,906 | $ | 4,000 | $ | 284,669,000 | $ | 17,777,000 | $ | 9,043,000 | $ | (11,301,000 | ) | $ | 12,714,000 | $ | 312,906,000 | |||||||||||||||||||
See accompanying notes to consolidated financial statements.
42
Kennedy-Wilson Holdings, Inc. and Subsidiaries
Consolidated Statements of Cash Flows
Year ended December 31, | ||||||||||||
2010 | 2009 | 2008 | ||||||||||
Cash flows from operating activities: | ||||||||||||
Net income (loss) | $ | 6,485,000 | $ | (9,657,000 | ) | $ | 667,000 | |||||
Adjustments to reconcile net income (loss) to net cash provided by (used in) operating activities: | ||||||||||||
Gain from sale of real estate | (1,223,000 | ) | (16,520,000 | ) | — | |||||||
Gain from sale of real estate—related party | (723,000 | ) | (946,000 | ) | — | |||||||
Gain on early extinguishment of debt | (16,670,000 | ) | — | — | ||||||||
Loss on early extinguishment of debt | 4,788,000 | — | — | |||||||||
Remeasurement gain | (2,108,000 | ) | — | — | ||||||||
Note receivable and accrued interest forgiven in Merger | — | 4,281,000 | — | |||||||||
Depreciation and amortization | 1,618,000 | 1,122,000 | 920,000 | |||||||||
Provision for deferred income taxes | 6,158,000 | 4,497,000 | 3,372,000 | |||||||||
Amortization of deferred loan costs | 262,000 | 917,000 | 658,000 | |||||||||
Amortization of beneficial conversion of convertible subordinated debt | 168,000 | 285,000 | — | |||||||||
Equity in joint venture income | (10,548,000 | ) | (8,019,000 | ) | (10,097,000 | ) | ||||||
Accretion of interest income on loan pool participations and notes receivable | (11,855,000 | ) | — | — | ||||||||
Amortization of deferred compensation | — | 1,543,000 | 1,015,000 | |||||||||
Stock compensation expense | 8,094,000 | 2,314,000 | — | |||||||||
2009 Equity Participation Plan replacement payment | — | (1,500,000 | ) | — | ||||||||
Other than temporary impairment on available-for-sale security, net of tax | — | 194,000 | — | |||||||||
Change in assets and liabilities: | ||||||||||||
Accounts receivable | (1,039,000 | ) | 204,000 | 3,144,000 | ||||||||
Accounts receivable—related party | (2,784,000 | ) | 381,000 | (3,521,000 | ) | |||||||
Income tax receivable | 6,848,000 | (4,480,000 | ) | (2,368,000 | ) | |||||||
Operating distributions from joint ventures | 5,931,000 | 514,000 | 294,000 | |||||||||
Operating distributions from loan pool participation | 266,000 | — | — | |||||||||
Other assets | 1,432,000 | (2,893,000 | ) | (1,339,000 | ) | |||||||
Accounts payable | 644,000 | 501,000 | (374,000 | ) | ||||||||
Accrued expenses and other liabilities | 93,000 | 410,000 | 1,816,000 | |||||||||
Accrued salaries and benefits | 6,320,000 | 1,626,000 | (4,450,000 | ) | ||||||||
Income taxes payable | — | — | (4,406,000 | ) | ||||||||
Net cash provided by (used in) operating activities | 2,157,000 | (25,226,000 | ) | (14,669,000 | ) | |||||||
Cash flows from investing activities: | ||||||||||||
Additions to notes receivable | (25,636,000 | ) | (500,000 | ) | — | |||||||
Settlements of notes receivable | 8,438,000 | 302,000 | 26,000 | |||||||||
Additions to notes receivable—related party | (5,914,000 | ) | (8,774,000 | ) | (300,000 | ) | ||||||
Settlements of notes receivable—related party | 8,721,000 | 2,935,000 | 6,000 | |||||||||
Additions to notes receivable from sale of real estate | — | (2,663,000 | ) | — | ||||||||
Settlements of notes receivable from sale of real estate | — | 1,858,000 | ||||||||||
Net proceeds from sale of real estate held for sale | 3,639,000 | 58,027,000 | 5,181,000 | |||||||||
Net proceeds from sale of real estate—related party | 9,548,000 | — | — | |||||||||
Purchases of and additions to real estate | (23,764,000 | ) | (35,800,000 | ) | (41,460,000 | ) | ||||||
Assets acquired in merger | — | 89,181,000 | — | |||||||||
Distributions from joint ventures | 10,177,000 | 2,374,000 | 12,903,000 | |||||||||
Contributions to joint ventures | (83,891,000 | ) | (37,933,000 | ) | (73,129,000 | ) | ||||||
Contributions to loan pool participation | (16,154,000 | ) | — | — | ||||||||
Net cash (used in) provided by investing activities | (114,836,000 | ) | 69,007,000 | (96,773,000 | ) | |||||||
Cash flow from financing activities: | ||||||||||||
Borrowings under notes payable | 4,250,000 | 37,059,000 | 20,161,000 | |||||||||
Repayment of notes payable | (5,600,000 | ) | (32,114,000 | ) | (8,973,000 | ) | ||||||
Borrowings under lines of credit | 48,250,000 | 20,500,000 | 47,957,000 | |||||||||
Repayment of lines of credit | (30,500,000 | ) | (24,000,000 | ) | (39,457,000 | ) | ||||||
Borrowings under mortgage loans payable | 20,016,000 | 30,286,000 | 30,316,000 | |||||||||
Repayment of mortgage loans payable | (24,735,000 | ) | (35,866,000 | ) | (10,852,000 | ) | ||||||
Issuance of convertible subordinated debt | — | — | 30,000,000 | |||||||||
Repayment of convertible subordinated debt | (32,550,000 | ) | — | — | ||||||||
Debt issue costs | (644,000 | ) | (798,000 | ) | (518,000 | ) | ||||||
Issuance of preferred stock | 132,294,000 | — | — | |||||||||
Issuance of common stock | — | 59,000 | 52,447,000 | |||||||||
Repurchase of common stock | (11,301,000 | ) | (3,690,000 | ) | (6,170,000 | ) | ||||||
Repurchase of warrants | (11,500,000 | ) | — | — | ||||||||
Dividends paid | (4,533,000 | ) | (3,235,000 | ) | (2,264,000 | ) | ||||||
Contributions from noncontrolling interests | 10,955,000 | 6,804,000 | 482,000 | |||||||||
Distributions to noncontrolling interests | (3,242,000 | ) | (10,712,000 | ) | (504,000 | ) | ||||||
Net cash provided by (used in) financing activities | 91,160,000 | (15,707,000 | ) | 112,625,000 | ||||||||
Effect of currency exchange rate changes on cash and cash equivalents | 10,703,000 | 3,879,000 | 400,000 | |||||||||
Net change in cash and cash equivalents | (10,816,000 | ) | 31,953,000 | 1,583,000 | ||||||||
Cash and cash equivalents, beginning of year | 57,784,000 | 25,831,000 | 24,248,000 | |||||||||
Cash and cash equivalents, end of year | $ | 46,968,000 | $ | 57,784,000 | $ | 25,831,000 | ||||||
Supplemental disclosure of non-cash investing activities: | ||||||||||||
Unrealized loss on marketable security, net of tax of $5,000 and $129,000, respectively | $ | 11,000 | $ | 194,000 | $ | — | ||||||
Acretion of preferred stock issuance costs | 25,000 | — | — | |||||||||
See accompanying notes to consolidated financial statements.
43
Kennedy-Wilson Holdings, Inc. and Subsidiaries
Consolidated Statements of Cash Flows - (continued)
During 2010, as a result of the consolidation of two joint venture investments and a subsequent deconsolidation of one of those entities, accounts receivable increased by $171,000, real estate increased by $28,464,000, investment in joint ventures increased by $3,292,000, other assets increased by $3,174,000, accrued expenses and other liabilities increased by $323,000 and mortgage loan payable increased by $32,670,000.
In 2009, the debt on a piece of land that was sold was assumed by the buyer resulting in a decrease of proceeds from the sale of real estate of $2,025,000 and reduction of repayment of mortgage loans payable of $2,025,000.
In 2008, the Company converted notes receivable from various executives and directors of the Company related to a joint venture investment in Japan into equity in the Japanese joint venture resulting in an increase in investments in joint ventures of $4,397,000 and a decrease in notes receivable of $4,397,000.
Supplemental cash flow information: | ||||||||||||
Year ended December 31, | ||||||||||||
2010 | 2009 | 2008 | ||||||||||
Cash paid (received) during the year for: | ||||||||||||
Interest | $ | 8,400,000 | $ | 11,618,000 | $ | 6,945,000 | ||||||
Interest capitalized | $ | 790,000 | $ | — | $ | 999,000 | ||||||
Income taxes | $ | 25,000 | $ | (4,130,000 | ) | $ | 4,000,000 | |||||
See accompanying notes to consolidated financial statements.
44
Kennedy-Wilson Holdings, Inc. and Subsidiaries
Notes to Consolidated Financial Statements
December 31, 2010, 2009 and 2008
NOTE 1—ORGANIZATION
Kennedy-Wilson Holdings, Inc., a Delaware corporation, and its subsidiaries (“Kennedy-Wilson” or “KWH”), provide various commercial and residential real estate services including property management, asset management, brokerage and marketing in the U.S. and Japan primarily to institutional investors, financial institutions, pension funds, and developers. Kennedy-Wilson, principally through joint venture investments, also acquires, renovates and resells commercial and residential real estate, and invests in discounted loan portfolios.
On November 13, 2009, the stockholders of Prospect Acquisition Company (“Prospect”) approved a merger with Kennedy-Wilson, Inc. (“KWI”), whereby KWI became a wholly-owned subsidiary of Prospect, which was renamed Kennedy-Wilson Holdings, Inc. (the “Merger”). The directors and officers of KWI immediately before the Merger became the directors and officers of Kennedy-Wilson, except that one of the KWI directors immediately before the Merger resigned and was replaced by a director from Prospect (see note 3).
Kennedy-Wilson has evaluated all subsequent events through the date that the financial statements are available for issuance.
NOTE 2—BASIS OF PRESENTATION AND SUMMARY OF SIGNIFICANT ACCOUNTING POLICIES
BASIS OF PRESENTATION—The consolidated financial statements include the accounts of Kennedy-Wilson and its wholly owned subsidiaries. All significant intercompany balances and transactions have been eliminated in consolidation. In addition, Kennedy-Wilson evaluates its relationships with other entities to identify whether they are variable interest entities as defined by FASB Accounting Standards Codification (ASC) Subtopic 810 – Consolidation and to assess whether it is the primary beneficiary of such entities. If the determination is made that Kennedy-Wilson is the primary beneficiary, then that entity is consolidated into the consolidated financial statements in accordance with Consolidations ASC Subtopic 810-10. The ownership of the other interest holders of consolidated subsidiaries is reflected as noncontrolling interests.
USE OF ESTIMATES—The preparation of the accompanying consolidated financial statements in conformity with U.S. generally accepted accounting principles (GAAP) requires management to make estimates and assumptions about future events. These estimates and the underlying assumptions affect the amounts of assets and liabilities reported, disclosure about contingent assets and liabilities, and reported amounts of revenues and expenses. Management evaluates its estimates and assumptions on an ongoing basis using historical experience and other factors, including the current economic environment, which management believes to be reasonable under the circumstances. Management adjusts such estimates and assumptions when facts and circumstances dictate. Illiquid credit markets, volatile energy markets, and declines in consumer spending have combined to increase the uncertainty inherent in such estimates and assumptions. As future events and their effects cannot be determined with precision, actual results could differ significantly from these estimates. Changes in those estimates resulting from continuing changes in the economic environment will be reflected in the financial statements in future periods.
REVENUE RECOGNITION—Revenue primarily consists of management fees, performance fees, commission revenue and sales of real estate.
Management fees are primarily comprised of property management fees, base asset management fees, and acquisition fees. Property management fees are earned for managing the operations of real estate assets and are based on a fixed percentage of the revenues generated from the respective real estate assets. Base asset management fees are earned from limited partners of funds Kennedy-Wilson sponsors and are generally based on a fixed percentage of committed capital or net asset value. These fees are recognized as revenue ratably over the period that the respective services are performed. Acquisition fees are earned for identifying and closing investments on behalf of investors and are based on a fixed percentage of the acquisition price. Acquisition fees are recognized upon the successful completion of an acquisition after all required services have been performed.
Performance fees or carried interest are allocated to the general partner or special limited partner of Kennedy-Wilson's real estate funds based on the cumulative fund performance to date that are subject to preferred return to the limited partners. At the end of each reporting period, Kennedy-Wilson calculates the performance fee that would be due to the general partner and special limited partner interests for a fund, pursuant to the fund agreement, as if the fair value of the underlying investments were realized as of such date, irrespective of whether such amounts have been realized. As the fair value of underlying investments varies between reporting periods, it is necessary to make adjustments to amounts recorded as
45
Kennedy-Wilson Holdings, Inc. and Subsidiaries
Notes to Consolidated Financial Statements—(continued)
December 31, 2010, 2009 and 2008
Performance Fee to reflect either (a) positive performance resulting in an increase in the performance fee allocated to the general partner or (b) negative performance that would cause the amount due to the Kennedy-Wilson to be less than the amount previously recognized as revenue, resulting in a negative adjustment to performance fees allocated to the general partner. Substantially all of the carried interest is recognized in equity in joint venture income and in certain instances the performance fees are recognized in management and leasing fees in our consolidated statement of operations and comprehensive income (loss).
Commissions primarily consist of auction and real estate sales commissions and leasing commissions. In the case of auction and real estate sales commissions, the revenue is generally recognized when escrow closes. In accordance with the guidelines established for Reporting Revenue Gross as a Principal versus Net as an Agent in the ASC Subtopic 605-45, Kennedy-Wilson records commission revenues and expenses on a gross basis. Of the criteria listed in the Subtopic 605-45, Kennedy-Wilson is the primary obligor in the transaction, does not have inventory risk, performs all or part of the service, has credit risk, and has wide latitude in establishing the price of services rendered and discretion in selection of agents and determination of service specifications. Leasing fees that are payable upon tenant occupancy, payment of rent or other events beyond Kennedy-Wilson's control are recognized upon the occurrence of such events.
Sales of real estate are recognized at the close of escrow when title to the real property passes to the buyer and there is no continuing involvement in the real property. Kennedy-Wilson follows the requirements for profit recognition as set forth by the Sale of Real Estate ASC Subtopic 360-20.
INVESTMENTS IN JOINT VENTURES—Kennedy-Wilson has a number of joint venture interests, generally ranging from 5% to approximately 50%, that were formed to acquire, manage, and/or sell real estate. Investments in joint ventures which Kennedy-Wilson does not control are accounted for under the equity method of accounting as Kennedy-Wilson can exercise significant influence, but does not have the ability to control the joint venture. An investment in a joint venture is recorded at its initial investment and is increased or decreased by Kennedy-Wilson’s share of undistributed income or loss and less distributions. A decline in the value of an investments in a joint venture that is other than temporary is recognized when evidence indicates that such a decline has occurred in accordance with Equity Method Investments ASC Subtopic 323-10.
Profits on the sale of real estate held by joint ventures in which Kennedy-Wilson has continuing involvement are deferred until such time that the continuing involvement has been resolved and all the risks and rewards of ownership have passed to the buyer. Profit on sales to joint ventures in which Kennedy-Wilson retains an equity ownership interest results in partial sales treatment in accordance with Sale of Real Estate ASC Subtopic 360-20, thus deferring a portion of the gain as a result of Kennedy-Wilson’s continuing ownership percentage in the joint ventures.
Kennedy-Wilson has two investments in joint ventures, KW Property Fund III, L.P. (KW Fund III) and SG KW Venture I, LLC (the Funds) that are investment companies under the Investment Companies ASC Subtopic 946-10. Thus, the Funds reflect their investments at fair value, with unrealized gains and losses resulting from changes in fair value reflected in earnings. Kennedy-Wilson has retained the specialized accounting for the Funds pursuant to Retention of Specialized Accounting for Investments in Consolidation ASC Subtopic 810-10 in recording its equity in joint venture income from the Funds.
FAIR VALUE MEASUREMENTS—Kennedy-Wilson accounts for fair value measurements of financial assets and financial liabilities and for fair value measurements of nonfinancial items that are recognized or disclosed at fair value in the financial statements on a recurring basis under the provisions of Fair Value Measurements ASC Subtopic 820-10. Subtopic 820-10 defines fair value as the price that would be received to sell an asset or paid to transfer a liability in an orderly transaction between market participants at the measurement date.
GOODWILL—Goodwill results from the difference between the purchase price and the fair value of net assets acquired based upon the purchase method of accounting for business combinations. In accordance with Accounting for Goodwill ASC Subtopic 350-20, goodwill is reviewed for impairment on an annual basis. In testing for impairment, goodwill is assigned to the reporting unit based upon the amount of goodwill generated at the time of acquisition of the businesses by the reporting unit. An earnings multiple appropriate to the respective reporting unit is applied to the cash basis net operating income of the reporting unit. This process enables an approximation of the reporting unit’s value, which is then compared to the net book value of the reporting unit. As a result of the evaluation performed as described above, Kennedy-Wilson has determined that there was no impairment of goodwill as of December 31, 2010, 2009 and 2008.
CASH AND CASH EQUIVALENTS—Cash and cash equivalents consist of cash and all highly liquid investments purchased with maturities of three months or less.
46
Kennedy-Wilson Holdings, Inc. and Subsidiaries
Notes to Consolidated Financial Statements—(continued)
December 31, 2010, 2009 and 2008
LONG-LIVED ASSETS—Kennedy-Wilson reviews its long-lived assets (excluding goodwill) whenever events or changes in circumstances indicate that the carrying amount of an asset may not be recoverable in accordance with Impairment of Long-Lived Assets ASC Subtopic 360-10. Recoverability of assets to be held and used is measured by a comparison of the carrying amount of an asset to estimated undiscounted future cash flows expected to be generated by the asset. If the carrying amount of an asset exceeds its estimated undiscounted future cash flows, an impairment charge is recognized in the amount by which the carrying amount of the asset exceeds the fair value of the asset. Assets to be disposed of are presented separately in the balance sheet and reported at the lower of the carrying amount or fair value less costs to sell, and are no longer depreciated. The assets and liabilities of the assets to be disposed of classified as held for sale would be presented separately in the appropriate asset and liability sections of the balance sheet.
INVESTMENTS IN LOAN POOL PARTICIPATIONS AND NOTES RECEIVABLE—Interest income from investments in loan pool participations and notes receivable acquired with deteriorated credit quality are recognized on a level yield basis under the provisions of Loans and Debt Securities Acquired with Deteriorated Credit Quality ASC Subtopic 310-30, where a level yield model is utilized to determine a yield rate which, based upon projected future cash flows, accretes interest income over the estimated holding period. When the future cash flows of a note cannot be reasonably estimated, cash payments are applied to the cost basis of the note until it is fully recovered before any interest income is recognized.
FAIR VALUE OF FINANCIAL INSTRUMENTS—The estimated fair value of financial instruments is determined using available market information and appropriate valuation methodologies. Considerable judgment, however, is necessary to interpret market data and develop the related estimates of fair value. Accordingly, the estimates presented herein are not necessarily indicative of the amounts that could be realized upon disposition of the financial instruments. The use of different market assumptions or estimation methodologies may have a material impact on the estimated fair value amounts.
NONCONTROLLING INTERESTS—Noncontrolling interests are reported within equity as a separate component of Kennedy-Wilson's equity in accordance with Noncontrolling Interests in Consolidated Financial Statements ASC Subtopic 810-10. Revenues, expenses, gains, losses, net income or loss, and other comprehensive income are reported in the consolidated statement of operations and comprehensive income (loss) at the consolidated amounts and separately stated are amounts attributable to noncontrolling interests.
CAPITALIZED INTEREST—Kennedy-Wilson capitalizes interest in accordance with Capitalization of Interest Cost ASC Subtopic 835-20 for assets that are undergoing development or entitlement activities in preparation for their planned principal operations. For qualifying equity investments, interest is capitalized in accordance with Capitalization of Interest Cost in Financial Statements That Include Investments Accounted for Under the Equity Method ASC Subtopic 835-20. An appropriate interest rate is applied to Kennedy-Wilson’s cash investment in the qualifying asset. The interest is credited against interest expense and added to the basis in the investment. Interest is capitalized when the development or entitlement activity commences and ceases when the investment has begun its planned principal operations.
GUARANTEES—Kennedy-Wilson has certain guarantees associated with loans secured by assets held in various joint venture investments. The maximum potential amount of future payments (undiscounted) Kennedy-Wilson could be required to make under the guarantees was $28 million and $35 million at December 31, 2010 and 2009, respectively. The guarantees expire through 2011 and Kennedy-Wilson’s performance under the guarantees would be required to the extent there is a shortfall in liquidation between the principal amount of the loan and the net sales proceeds of the asset. Based upon Kennedy-Wilson’s evaluation of guarantees under Estimated Fair Value of Guarantees ASC Subtopic 460-10, the estimated fair value of guarantees made as of December 31, 2010 and 2009 is immaterial.
CONCENTRATION OF CREDIT RISK—Financial instruments that subject Kennedy-Wilson to credit risk consist primarily of accounts and notes receivable and cash equivalents. Credit risk is generally diversified due to the large number of entities composing Kennedy-Wilson’s customer base and their geographic dispersion throughout the U.S. Kennedy-Wilson performs ongoing credit evaluations of its customers and debtors. Cash and cash equivalents are invested in institutions insured by government agencies. Certain accounts contain balances in excess of the insured limits.
EARNINGS PER SHARE—Basic earnings per share is computed based upon the weighted average number of shares of common stock outstanding during the periods presented. Diluted earnings per share is computed based upon the weighted average number of shares of common stock and potentially dilutive securities outstanding during the periods presented. The dilutive impact of potentially dilutive securities including unvested shares, convertible securities and warrants which were outstanding during the period calculated by the “treasury stock” method.
REPURCHASE OF EQUITY INSTRUMENTS—Upon the decision to retire repurchased equity instruments, Kennedy-
47
Kennedy-Wilson Holdings, Inc. and Subsidiaries
Notes to Consolidated Financial Statements—(continued)
December 31, 2010, 2009 and 2008
Wilson records the retirement as a reduction to additional paid in capital.
SHARE-BASED PAYMENT ARRANGEMENTS—Kennedy-Wilson accounts for its share-based payment arrangements under the provisions of Share-Based Payments ASC Subtopic 718-10. Compensation cost for employee services received in exchange for an award of equity instruments is based on the grant-date fair value of the share-based award that is ultimately settled in equity of Kennedy-Wilson. The cost of employee services is recognized over the period during which an employee provides service in exchange for the share-based payment award. Share-based payment arrangements that vest ratably over the requisite service period are recognized on the straight-line basis and performance awards that vest ratably are recognized on a tranche by tranche basis over the performance period. Unrecognized compensation costs for share-based payment arrangements that have been modified are recognized over the original service or performance period.
FAIR VALUE OPTION—Kennedy-Wilson accounts for financial assets and financial liabilities at fair value on an instrument-by-instrument basis, with changes in fair value reported in earnings in accordance with the provisions of Fair Value Measurements and Disclosures ASC Subtopic 820-10.
INCOME TAXES—Income taxes are accounted for under the asset and liability method. Deferred tax assets and liabilities are recognized for the future tax consequences attributable to differences between the financial statement carrying amounts of existing assets and liabilities and their respective tax bases and operating loss and tax credit carryforwards. Deferred tax assets and liabilities are measured using enacted tax rates expected to apply to taxable income in the years in which those temporary differences are expected to be recovered or settled. The effect on deferred tax assets and liabilities of a change in tax rates is recognized in income in the period that includes the enactment date. In accordance with Accounting for Uncertainty in Income Taxes ASC Subtopic 740-10, Kennedy-Wilson recognizes the effect of income tax positions only if those positions are more likely than not of being sustained. Recognized income tax positions are measured at the largest amount that is greater than 50% likely of being realized. Changes in recognition or measurement are reflected in the period in which the change in judgment occurs.
Kennedy-Wilson records interest related to unrecognized tax benefits in interest expense and penalties in selling, general, and administrative expenses.
RECENT ACCOUNTING PRONOUNCEMENTS—In December 2010, the FASB issued Accounting Standards Codification (ASC) Update No. 2010-29, Business Combinations (Topic 805): Disclosure of Supplementary Pro Forma Information for Business Combinations. The amendments in this Update are effective prospectively for business combinations for which the acquisition date is on or after the beginning of the first annual reporting period beginning on or after December 15, 2010. Kennedy-Wilson expects that the adoption of ASU 2010-29 will not have a material impact on its consolidated financial statements.
In April 2010, the FASB issued ASC Update No. 2010-18, Receivables (Topic 310): Effect of a Loan Modification When the Loan Is Part of a Pool That Is Accounted for as a Single Asset—a consensus of the FASB Emerging Issues Task Force, to clarify that loan modifications within loan pools accounted for as a single asset do not result in the removal of those loans from the pool even if the modification of those loans would otherwise be considered a troubled debt restructuring. Update No. 2010-18 is effective for interim and annual reporting periods ending after July 15, 2010, with early adoption permitted. This update is consistent with Kennedy-Wilson’s current policy and, as such, Update No. 2010-18 has no material impact on the accompanying condensed consolidated financial statements.
In January 2010, the FASB issued Accounting Standards Codification (ASC) Update No. 2010-06, Fair Value Measurements and Disclosures: Improving Disclosures about Fair Value Measurements, to improve disclosure requirements related to Fair Value Measurements and Disclosures – Subtopic 820. Update No. 2010-06 is effective for interim and annual reporting periods ending after December 15, 2009, except for the disclosures about purchases, sales, issuance, and settlements in the roll forward activity in Level 3 fair value measurements which are effective for fiscal years beginning after December 15, 2010. Update No. 2010-06 was adopted on January 1, 2010, and there is no material impact to the accompanying consolidated financial statements. Additionally, Kennedy-Wilson has adopted the disclosures requirements about purchases, sales, issuances, and settlements in the roll forward activity in Level 3 fair value measurements.
RECLASSIFICATIONS—Certain balances included in prior years' financial statements have been reclassified to conform with current year presentation.
NOTE 3—BUSINESS COMBINATIONS
Prospect Acquisition Corp.
48
Kennedy-Wilson Holdings, Inc. and Subsidiaries
Notes to Consolidated Financial Statements—(continued)
December 31, 2010, 2009 and 2008
On November 13, 2009, KWI merged with Prospect, a blank check company formed for the purpose of acquiring control of, through a merger, capital stock exchange, asset acquisition, reverse capitalization, stock purchase, reorganization or other similar business combination, one or more operating businesses or assets in the financial services industry (the "Merger"). The resulting merged entity is KWH which continues the business operations of KWI, including all of their personnel and management. Consequently, the Merger achieved Prospect’s business combination purpose while providing $89 million in cash for KWH to take immediate actions to acquire real estate and loans secured by real estate in the distressed real estate markets in the United States and abroad.
The Merger was accounted for as a reverse acquisition in accordance with Business Combinations ASC 805-40, because the stockholders of KWI immediately prior to the consummation of the Merger obtained effective control of Prospect, immediately following completion of the Merger, through (1) their stockholder interest comprising the largest single control block of shares in the post-merger company, (2) a majority of the members of the board of directors of the post-merger company being comprised of KWI directors (initially, six directors of KWI and one director of Prospect), and (3) all of the senior executive officers of the post-merger company being comprised of KWI executive officers. Accordingly, the assets, liabilities and results of operations of KWI have become the historical financial statements of Prospect at the closing of the Merger, and Prospect’s assets (primarily cash and cash equivalents), liabilities and results of operations have been consolidated with KWI beginning on the date of the Merger, again becoming the combined entity of Kennedy-Wilson. The components of equity are the retained earnings and other equity balances of KWI immediately before the Merger with the capital share account of KWI adjusted to reflect the par value of the outstanding shares of Prospect. Assets, liabilities, and results of operations of Prospect have been consolidated at fair value in accordance with Business Combinations ASC Subtopic 805-10. All direct costs of the Merger have been charged to operations in the period that such costs were incurred.
Effective with the Merger, common stockholders of KWI received as consideration 20.4 million shares of Prospect’s common stock and preferred stockholders of KWI received as consideration 5.6 million shares of Prospect’s common stock, for an aggregate consideration of 26.0 million shares of Prospect common stock. In addition, 2.5 million shares of Prospect common stock were reserved for issuance to employees, non-employees and management of Kennedy-Wilson pursuant to an equity compensation plan adopted by Prospect’s board of directors and approved by Prospect’s stockholders on November 13, 2009. Upon completion of the Merger, Prospect shareholders were granted 12.8 million shares of KWH, with a fair value of $89 million, resulting in 31% ownership in the combined company Kennedy-Wilson. The net assets received from Prospect were $89 million of cash, no material liabilities were assumed, and no other identifiable intangible assets were acquired. Because the value of the consideration given to Prospect equals the fair value of the net identifiable assets, no goodwill was recorded from the Merger.
Merger related costs (in millions and included in the accompanying consolidated statements of operations and comprehensive income (loss) for the year ended December 31, 2009:
Compensation and related | $ | 12.5 | |
General and administrative | 3.6 | ||
Total | $ | 16.1 | |
The amount of Prospect revenue and earnings included in the accompanying consolidated statements of operations and comprehensive income (loss) for the year ended December 31, 2009 and the revenue and earnings of the combined entity had the acquisition date been January 1, 2009 and January 1, 2008, are as follows:
Unaudited, in 000’s, except for per share amounts | Revenue | Net Income Attributable to Kennedy-Wilson common shareholders | Earnings Per Share | |||||||||
Actual Prospect from November 13, 2009—December 31, 2009 | $ | 20 | $ | 16 | $ | — | ||||||
Supplemental pro forma from January 1, 2009—December 31, 2009 | 86,295 | 3,323 | 0.09 | |||||||||
Supplemental pro forma from January 1, 2008—December 31, 2008 | 36,034 | 1948 | 0.05 | |||||||||
This unaudited pro forma financial information is not intended to represent or be indicative of what would have occurred if the transaction had taken place on the dates presented and is not indicative of what Kennedy-Wilson’s actual results of
49
Kennedy-Wilson Holdings, Inc. and Subsidiaries
Notes to Consolidated Financial Statements—(continued)
December 31, 2010, 2009 and 2008
operations would have been had the acquisition been completed at the beginning of the periods indicated above.
Fairways 340, LLC
In June 2010, Kennedy-Wilson acquired its partners interest to obtain 100% of the interest in Fairways 340, LLC ("Fairways") that was previously accounted for under the equity method. The assets, liabilities, and results of the operations of Fairways at the date of acquisition were consolidated at fair value and direct costs of the business combination have been charged to operations in the period that such costs were incurred in accordance with Business Combinations ASC Subtopic 805-10. Kennedy-Wilson had a 49.83% ownership interest and equity with a fair value of $8.9 million before the combination and the combination was considered to be achieved in stages. As a result of remeasuring its basis at fair value (utilizing an income approach) upon the combination, Kennedy-Wilson recorded a remeasurement gain in the amount of $2.1 million in the accompanying consolidated statement of operations and comprehensive income (loss).
Subsequently, in October 2010, Kennedy-Wilson sold a controlling interest in Fairways to KW Fund III (of which KWH owns an 11.62% interest in) retaining a direct 50% ownership interest. The sale, which was considered in substance a sale of real estate, resulted in a gain of $0.7 million, after deferral of $0.1 million for the retained ownership interest, which is included in the accompanying consolidated statements of operations and comprehensive income (loss). During the period in which Fairways was consolidated, Kennedy-Wilson recorded $1.2 million in rental revenue, $0.6 million in rental and other expenses, $0.4 million in depreciation expense, and $0.3 million in interest expense in the accompanying consolidated statement of operations and comprehensive income (loss). At December 31, 2010, Fairways is presented as an equity method investment in joint venture.
NOTE 4—NOTES RECEIVABLE
Notes receivable consists of the following:
December 31, | ||||||||
2010 | 2009 | |||||||
Note receivable, fixed interest rate of 10%, interest only, due December 2011, secured by personal property | $ | 485,000 | $ | 500,000 | ||||
Note pool acquired with deteriorated credit quality consisting of loans secured by collateral located in Southern California, and Las Vegas, Nevada with various interest rates and maturities. (see additional discussion below) | 18,402,000 | — | ||||||
Note receivable, fixed interest rate of 8%, interest only, due May 2012, secured by personal guarantees of borrowers | 1,000,000 | — | ||||||
Note receivable, fixed interest rate of 12%, interest only, due September 2012 | 377,000 | — | ||||||
Other | — | 41,000 | ||||||
Total notes receivable | 20,264,000 | 541,000 | ||||||
Note receivable from a joint venture investment, fixed interest rate of 10%, principal and accrued interest, secured by deed of trust, repaid in 2010 | — | 805,000 | ||||||
Note receivable from a joint venture investment, fixed interest rate of 10% payments due from positive NOI, otherwise principal and accrued interest secured by deed of trust, repaid in 2010 | — | 1,352,000 | ||||||
Note receivable from a joint venture investment, fixed interest rate of 15%, principal and accrued interest due December 2011, secured by deed of trust | 2,898,000 | 4,487,000 | ||||||
Note receivable from a joint venture investment, fixed interest rate of 10%, principal and accrued interest due December 2011 | 939,000 | — | ||||||
Total notes receivable from related parties | 3,837,000 | 6,644,000 | ||||||
$ | 24,101,000 | $ | 7,185,000 | |||||
In 2010, Kennedy-Wilson entered into an arrangement to purchase a pool of loans or notes receivable with deteriorated credit quality from a bank for $25.3 million. Kennedy-Wilson expects to accrete $4.3 million in interest income on the notes
50
Kennedy-Wilson Holdings, Inc. and Subsidiaries
Notes to Consolidated Financial Statements—(continued)
December 31, 2010, 2009 and 2008
receivable over the estimated collection period. The amount contractually due under the terms of the notes as of December 31, 2010 is $33.3 million. Contractual payments of principal and interest of $0.1 million are due monthly. During the year ended December 31, 2010, Kennedy-Wilson has accreted $2.4 million as interest income on the notes receivable in the accompanying consolidated statements of operations and comprehensive income (loss). As of December 31, 2010, the assets and debt related to the notes receivable are $18.4 million and $15.0 million (see Note 13), respectively.
NOTE 5—REAL ESTATE
Kennedy-Wilson’s investment in real estate includes the following:
December 31, | ||||||||
2010 | 2009 | |||||||
Office building in Japan | $ | 9,279,000 | $ | 8,375,000 | ||||
House in Kona, Hawaii | 8,724,000 | 8,724,000 | ||||||
204-unit residential apartment complex in Lompoc, California | 25,780,000 | 25,707,000 | ||||||
2,700 acres of ranch land in Oahu, Hawaii | 36,726,000 | — | ||||||
Residential land in Kona, Hawaii | 4,101,000 | — | ||||||
Other | 2,097,000 | 845,000 | ||||||
86,707,000 | 43,651,000 | |||||||
Less: Accumlated depreciation | (4,006,000 | ) | (3,070,000 | ) | ||||
Total | $ | 82,701,000 | $ | 40,581,000 | ||||
During 2010, Kennedy-Wilson acquired a controlling interest and assumed the debt of a 2,700 acre ranch in Hawaii. The purchase price of the controlling interest combined with previously capitalized investments made by Kennedy-Wilson and the $16.0 million payoff of debt at a discount resulted in the new basis consolidated in the amount of $36.7 million as of December 31, 2010. The ranch is currently being developed for its intended use. As such, $0.8 million of avoidable interest has been capitalized to the project.
During 2010, Kennedy-Wilson purchased a note from a bank for $5.3 million secured by a house in Kona, Hawaii. The borrower subsequently transferred the deed to Kennedy-Wilson in lieu of a foreclosure. In addition, the borrower paid Kennedy-Wilson $0.2 million and issued an unsecured promissory note in the amount of $1.0 million.
During 2008, Kennedy-Wilson sold its interest in an entity that owned an office building located in Glendora, California for $1,488,000. The sale resulted in a gain of $564,000, which is included in rental and other income in the accompanying consolidated statements of income and comprehensive income (loss). Kennedy-Wilson continues to provide management services to the property and therefore it is not included in discontinued operations.
NOTE 6—REAL ESTATE AVAILABLE FOR SALE
In 2009, Kennedy-Wilson acquired a 149-unit condominium project located in Los Angeles, California. The project was purchased for the purposes of resale and was classified as held for sale at the date of acquisition. During 2009, Kennedy-Wilson sold 138 units with a historical cost basis of $34.4 million for a gain of $16.5 million. During 2010, Kennedy-Wilson sold the 11 remaining units with a historical cost basis of $2.5 million for a gain of $1.2 million.
NOTE 7—INVESTMENTS IN JOINT VENTURES
Kennedy-Wilson has a number of joint venture interests, generally ranging from 5% to approximately 50%, that were formed to acquire, manage, and/or sell real estate. Kennedy-Wilson has significant influence over these entities, but not voting or other control and, accordingly, these investments are accounted for under the equity method.
Summarized financial data of the joint ventures is as follows:
51
Kennedy-Wilson Holdings, Inc. and Subsidiaries
Notes to Consolidated Financial Statements—(continued)
December 31, 2010, 2009 and 2008
December 31, 2010 | ||||||||||||||||||||
KW Residential, LLC | Greater than 20% (1) | 10% - 20% (2) | Other | Total | ||||||||||||||||
Balance sheets for equity method investments: | ||||||||||||||||||||
Assets | ||||||||||||||||||||
Cash and restricted cash | $ | 26,792,000 | $ | 25,248,000 | $ | 396,000 | $ | 25,647,000 | $ | 78,083,000 | ||||||||||
Real estate | 609,430,000 | 215,473,000 | 119,252,000 | 1,787,396,000 | 2,731,551,000 | |||||||||||||||
Other | 10,571,000 | 7,056,000 | 28,583,000 | 183,125,000 | 229,335,000 | |||||||||||||||
Total assets | $ | 646,793,000 | $ | 247,777,000 | $ | 148,231,000 | $ | 1,996,168,000 | $ | 3,038,969,000 | ||||||||||
Liabilities | ||||||||||||||||||||
Debt | $ | 338,228,000 | $ | 81,544,000 | $ | 66,198,000 | $ | 1,351,208,000 | $ | 1,837,178,000 | ||||||||||
Other | 18,457,000 | 4,219,000 | 3,273,000 | 44,454,000 | 70,403,000 | |||||||||||||||
Total liabilities | 356,685,000 | 85,763,000 | 69,471,000 | 1,395,662,000 | 1,907,581,000 | |||||||||||||||
Partners’ capital | ||||||||||||||||||||
Kennedy Wilson | 108,265,000 | 35,807,000 | 36,182,000 | 76,713,000 | 256,967,000 | |||||||||||||||
Other partners | 181,843,000 | 126,207,000 | 42,578,000 | 523,793,000 | 874,421,000 | |||||||||||||||
Total partners’ capital | 290,108,000 | 162,014,000 | 78,760,000 | 600,506,000 | 1,131,388,000 | |||||||||||||||
Total liabilities and partners’ capital | $ | 646,793,000 | $ | 247,777,000 | $ | 148,231,000 | $ | 1,996,168,000 | $ | 3,038,969,000 | ||||||||||
December 31, 2009 | ||||||||||||
KW Residential, LLC | Other | Total | ||||||||||
Balance sheets for equity method investments: | ||||||||||||
Assets | ||||||||||||
Cash and restricted cash | $ | 32,343,000 | $ | 18,721,000 | $ | 51,064,000 | ||||||
Real estate | 548,927,000 | 1,759,495,000 | 2,308,422,000 | |||||||||
Other | 12,965,000 | 169,622,000 | 182,587,000 | |||||||||
Total assets | $ | 594,235,000 | $ | 1,947,838,000 | $ | 2,542,073,000 | ||||||
Liabilities | ||||||||||||
Debt | $ | 307,877,000 | $ | 1,045,862,000 | $ | 1,353,739,000 | ||||||
Other | 11,618,000 | 51,234,000 | 62,852,000 | |||||||||
Total liabilities | 319,495,000 | 1,097,096,000 | 1,416,591,000 | |||||||||
Partners’ capital | ||||||||||||
Kennedy Wilson | 91,276,000 | 87,766,000 | 179,042,000 | |||||||||
Other partners | 183,464,000 | 762,976,000 | 946,440,000 | |||||||||
Total partners’ capital | 274,740,000 | 850,742,000 | 1,125,482,000 | |||||||||
Total liabilities and partners’ capital | $ | 594,235,000 | $ | 1,947,838,000 | $ | 2,542,073,000 | ||||||
Total investments are comprised of the following:
52
Kennedy-Wilson Holdings, Inc. and Subsidiaries
Notes to Consolidated Financial Statements—(continued)
December 31, 2010, 2009 and 2008
Year ended December 31, 2010 | ||||||||||||||||||||
KW Residential, LLC | Greater than 20% (1) | 10% - 20% (2) | Other | Total | ||||||||||||||||
Equity method | $ | 108,265,000 | $ | 35,807,000 | $ | 36,182,000 | $ | 76,713,000 | $ | 256,967,000 | ||||||||||
Unrealized gain on fair value option | — | — | 7,384,000 | — | 7,384,000 | |||||||||||||||
108,265,000 | 35,807,000 | 43,566,000 | 76,713,000 | 264,351,000 | ||||||||||||||||
Cost method | — | — | — | 2,535,000 | 2,535,000 | |||||||||||||||
Total Investments | $ | 108,265,000 | $ | 35,807,000 | $ | 43,566,000 | $ | 79,248,000 | $ | 266,886,000 | ||||||||||
Year ended December 31, 2009 | |||||||||||||
KW Residential, LLC | Other | Total | |||||||||||
Equity method | $ | 91,276,000 | $ | 87,766,000 | $ | 179,042,000 | |||||||
Unrealized gain on fair value option | 4,907,000 | 4,907,000 | |||||||||||
91,276,000 | 92,673,000 | 183,949,000 | |||||||||||
Cost method | — | 1,303,000 | 1,303,000 | ||||||||||
Total Investments | $ | 91,276,000 | $ | 93,976,000 | $ | 185,252,000 | |||||||
Year ended December 31, 2010 | ||||||||||||||||||||
KW Residential, LLC | Greater than 20% (1) | 10% - 20% (2) | Other | Total | ||||||||||||||||
Statements of income: | ||||||||||||||||||||
Revenues | $ | 34,784,000 | $ | 24,059,000 | $ | 11,214,000 | $ | 130,884,000 | $ | 200,941,000 | ||||||||||
Depreciation | 11,857,000 | 4,461,000 | 2,369,000 | 38,143,000 | 56,830,000 | |||||||||||||||
Interest | 12,235,000 | 6,177,000 | 3,041,000 | 45,765,000 | 67,218,000 | |||||||||||||||
Other expenses | 15,920,000 | 18,695,000 | 5,968,000 | 71,702,000 | 112,285,000 | |||||||||||||||
Total expenses | 40,012,000 | 29,333,000 | 11,378,000 | 155,610,000 | 236,333,000 | |||||||||||||||
Gains on extinguishment of debt | — | 9,092,000 | — | 4,734,000 | 13,826,000 | |||||||||||||||
Net (loss) Income | $ | (5,228,000 | ) | $ | 3,818,000 | $ | (164,000 | ) | $ | (19,992,000 | ) | $ | (21,566,000 | ) | ||||||
Net income allocation: | ||||||||||||||||||||
Kennedy Wilson | $ | (1,670,000 | ) | $ | 7,238,000 | $ | 2,856,000 | $ | (353,000 | ) | $ | 8,071,000 | ||||||||
Other partners | (3,558,000 | ) | (3,420,000 | ) | (3,020,000 | ) | (19,639,000 | ) | (29,637,000 | ) | ||||||||||
Net (loss) income | $ | (5,228,000 | ) | $ | 3,818,000 | $ | (164,000 | ) | $ | (19,992,000 | ) | $ | (21,566,000 | ) | ||||||
53
Kennedy-Wilson Holdings, Inc. and Subsidiaries
Notes to Consolidated Financial Statements—(continued)
December 31, 2010, 2009 and 2008
Year ended December 31, 2009 | Year ended December 31, 2008 | |||||||||||||||||||||||
KW Residential, LLC | Other | Total | KW Residential LLC | Other | Total | |||||||||||||||||||
Statements of income: | ||||||||||||||||||||||||
Revenues | $ | 32,750,000 | $ | 140,119,000 | $ | 172,869,000 | $ | 28,323,000 | $ | 173,146,000 | $ | 201,469,000 | ||||||||||||
Depreciation | 12,021,000 | 36,221,000 | 48,242,000 | 5,413,000 | 40,155,000 | 45,568,000 | ||||||||||||||||||
Interest | 14,828,000 | 51,764,000 | 66,592,000 | 12,936,000 | 51,689,000 | 64,625,000 | ||||||||||||||||||
Other expenses | 17,361,000 | 66,228,000 | 83,589,000 | 14,044,000 | 61,969,000 | 76,013,000 | ||||||||||||||||||
Total expenses | 44,210,000 | 154,213,000 | 198,423,000 | 32,393,000 | 153,813,000 | 186,206,000 | ||||||||||||||||||
Gains on extinguishment of debt | 28,320,000 | — | 28,320,000 | — | — | — | ||||||||||||||||||
Net (loss) Income | $ | 16,860,000 | $ | (14,094,000 | ) | $ | 2,766,000 | $ | (4,070,000 | ) | $ | 19,333,000 | $ | 15,263,000 | ||||||||||
Net income allocation: | ||||||||||||||||||||||||
Kennedy Wilson | $ | 5,949,000 | $ | 3,107,000 | $ | 9,056,000 | $ | (694,000 | ) | $ | 4,812,000 | $ | 4,118,000 | |||||||||||
Other partners | 10,911,000 | (17,201,000 | ) | (6,290,000 | ) | (3,376,000 | ) | 14,521,000 | 11,145,000 | |||||||||||||||
Net (loss) income | $ | 16,860,000 | $ | (14,094,000 | ) | $ | 2,766,000 | $ | (4,070,000 | ) | $ | 19,333,000 | $ | 15,263,000 | ||||||||||
—————
(1) Investments in these joint ventures exceeds 20% of the total assets of Kennedy-Wilson as of December 31, 2010 or equity in income from the joint venture for the year ended December 31, 2010 exceeds 20% of Kennedy-Wilson's income from continuing operations before income taxes for the year ended December 31, 2010.
(2) Investments in these joint ventures exceeds 10% of the total assets of Kennedy-Wilson at December 31, 2010 or equity in income from the joint venture for the year ended December 31, 2010 exceeds 10% of Kennedy-Wilson's income from continuing operations before income taxes for the year ended December 31, 2010.
Equity in joint venture income for the years ended December 31:
2010 | 2009 | 2008 | ||||||||||
Net income allocation | $ | 8,071,000 | $ | 9,056,000 | $ | 4,118,000 | ||||||
Unrealized gain on fair value option | 2,477,000 | (1,037,000 | ) | 5,979,000 | ||||||||
$ | 10,548,000 | $ | 8,019,000 | $ | 10,097,000 | |||||||
In 2010, Kennedy-Wilson formed a new joint venture platform which provides for a capital commitment from a joint venture partner in the amount of $250 million with Kennedy-Wilson's capital commitment totaling $28 million. The commitment from the partner has a three-year investment period and each proposed investment within the platform is at the discretion of the joint venture partner. As of December 31, 2010, the partner has contributed $132.3 million of capital into three joint ventures. Through December 31, 2010, Kennedy-Wilson has contributed capital in the amount of $14.7 million, including $1.7 million of noncontrolling interests, into the three joint ventures. Of this amount, $12.7 million, including $1.3 million of noncontrolling interests, was used to buyout ownership interests from an existing joint venture partner in KW Residential, LLC ("KWR"). The remaining amount of $2.0 million, including $0.4 million of noncontrolling interests, was used to invest in new investments.
Additionally, during 2010, Kennedy-Wilson invested $14.2 million, including $4.4 million of noncontrolling interests, in six new joint ventures and recapitalized five joint ventures with $11.5 million, including $0.3 million of noncontrolling interests, to buyout ownership interests from existing joint venture partners.
Also, during 2010, Kennedy-Wilson made $31.0 million in additional contributions to existing joint venture investments. Of this amount $17.4 million was used by several joint ventures to pay down and/or refinance existing debt, which resulted in $5.3 million of gains from the early extinguishment of debt that is included in equity in joint venture income in the accompanying consolidated statements of operations and comprehensive income (loss).
In 2010, Kennedy-Wilson received $16.1 million in distributions from its joint ventures, of which $5.9 million was from operations and $10.2 million was return of capital.
54
Kennedy-Wilson Holdings, Inc. and Subsidiaries
Notes to Consolidated Financial Statements—(continued)
December 31, 2010, 2009 and 2008
In 2010, Kennedy-Wilson recognized $10.1 million in gains from foreign currency translation adjustments from its investment in KWR. The foreign currency gain is included in other comprehensive income, net of deferred income taxes of $4.1 million in the accompanying consolidated statements of income and comprehensive income (loss).
Kennedy-Wilson has determined that it has no investments in variable interest entities as of December 31, 2010 and had investments in two variable interest entities as of December 31, 2009 and has concluded that Kennedy-Wilson is not the primary beneficiary. As of December 31, 2009, the variable interest entities had assets totaling $132 million with Kennedy-Wilson’s exposure to loss as a result of its interests in these variable interest entities totaling $7.0 million related to its equity contributions. In addition, as of December 31, 2009, Kennedy-Wilson had $14.2 million in the form of loan guarantees that represented 20% of the mortgage loans of the underlying variable interest entities.
Investments in which Kennedy-Wilson does not have significant influence are accounted for under the cost method of accounting. As of December 31, 2010 and 2009, Kennedy-Wilson had five investments accounted for under the cost method with a carrying value totaling $2.5 million and $1.3 million, respectively.
Distributions in excess of Kennedy-Wilson’s basis in investments in joint ventures totaling $56,000 were deferred for the year ended December 31, 2008 due to continuing involvement in the real estate sold by the joint venture. Total deferred revenues and gains on sale of investments in joint ventures included in accrued expenses and other liabilities were $3,943,000 and $3,664,000 at December 31, 2010 and 2009, respectively.
NOTE 8—INVESTMENTS IN LOAN POOL PARTICIPATIONS
In 2010, Kennedy-Wilson, in partnership with a bank, acquired two loan portfolios totaling approximately $424.5 million in unpaid principal balance. The loan portfolios, which were acquired from a regional bank, are comprised of loans secured by residential, hotel, retail, office, land, multifamily and other assets predominantly located in Southern California. Kennedy-Wilson expects to accrete $21.9 million, including $4.1 million of noncontrolling interest, in interest income from loan pool participations over the estimated collection period. The amount contractually due under the terms of the notes as of December 31, 2010 is $306.7 million. Contractual payments of principal and interest of $1.1 million are due monthly. During 2010, Kennedy-Wilson recognized $9.3 million, including $1.4 million in noncontrolling interests, of interest income from loan pool participations and notes receivable in the accompanying consolidated statement of operations and comprehensive income (loss). Kennedy- Wilson’s investment balance was $25.2 million at December 31, 2010.
NOTE 9—FAIR VALUE MEASUREMENTS AND THE FAIR VALUE OPTION
FAIR VALUE MEASUREMENTS—Fair Value Measurements and Disclosures ASC Subtopic 820-10 establishes a fair value hierarchy that prioritizes the inputs to valuation techniques used to measure fair value. The hierarchy gives the highest priority to unadjusted quoted prices in active markets for identical assets or liabilities (Level 1 measurements) and the lowest priority to measurements involving significant unobservable inputs (Level 3 measurements). The three levels of the fair value hierarchy are as follows:
Level 1—Valuations based on unadjusted quoted market prices in active markets for identical securities.
Level 2—Valuations based on observable inputs (other than Level 1 prices), such as quoted prices for similar assets and quoted prices in markets that are not active.
Level 3—Valuations based on inputs that are unobservable and significant to the overall fair value measurement, and involve management judgment.
The level in the fair value hierarchy within which a fair value measurement in its entirety falls is based on the lowest level input that is significant to the fair value measurement in its entirety.
The following table presents fair value measurements (including items that are required to be measured at fair value and items for which the fair value option has been elected) as of December 31, 2010
Level 1 | Level 2 | Level 3 | Total | |||||||||||||
Available for sale securities | $ | 33,000 | $ | — | $ | — | $ | 33,000 | ||||||||
Investments in joint ventures | — | — | 34,654,000 | 34,654,000 | ||||||||||||
$ | 33,000 | $ | — | $ | 34,654,000 | $ | 34,687,000 | |||||||||
55
Kennedy-Wilson Holdings, Inc. and Subsidiaries
Notes to Consolidated Financial Statements—(continued)
December 31, 2010, 2009 and 2008
The following table presents fair value measurements (including items that are required to be measured at fair value and items for which the fair value option has been elected) as of December 31, 2009
Level 1 | Level 2 | Level 3 | Total | |||||||||||||
Available for sale securities | $ | 22,000 | $ | — | $ | — | $ | 22,000 | ||||||||
Investments in joint ventures | — | — | 19,590,000 | 19,590,000 | ||||||||||||
$ | 22,000 | $ | — | $ | 19,590,000 | $ | 19,612,000 | |||||||||
The following table presents changes in Level 3 investments for the years ended December 31:
2010 | 2009 | 2008 | ||||||||||
Beginning balance | $ | 19,590,000 | $ | 15,088,000 | $ | 22,000 | ||||||
Unrealized and realized gains | 6,199,000 | 2,725,000 | 7,047,000 | |||||||||
Purchases | 10,795,000 | 1,956,000 | 8,019,000 | |||||||||
Sales | (1,930,000 | ) | (179,000 | ) | — | |||||||
Ending Balance | $ | 34,654,000 | $ | 19,590,000 | $ | 15,088,000 | ||||||
The change in unrealized gains on level 3 investments during 2010, 2009 and 2008 for investments still held as of December 31, 2010, 2009 and 2008 was $6.2 million, $2.6 million, $7.0 million, respectively.
INVESTMENT IN INVESTMENT COMPANIES—Kennedy-Wilson records its investment in the Funds based upon the net assets that would be allocated to its interests in the Funds assuming the Funds were to liquidate their investments at fair value as of the reporting date. The Funds report their investments in real estate at fair value based on valuations of the underlying real estate holdings and indebtedness securing the real estate. The valuations of real estate were based on management estimates of the real estate assets using an income approach. Increases in fair value for the Funds of $3.7 million, $3.8 million, and $1.1 million were recorded in equity in joint venture income in the consolidated statement of operations and comprehensive income (loss) for the years ended December 31, 2010, 2009 and 2008, respectively. The indebtedness securing the real estate and the investments in debt securities were valued, in part, based on third party valuations and management estimates also using an income approach. Kennedy-Wilson’s investment balance in the Funds was $20.6 million and $7.9 million at December 31, 2010 and 2009, respectively, which are included in investments in joint ventures in the accompanying consolidated balance sheet. As of December 31, 2010, Kennedy-Wilson has unfunded capital commitments to the Funds in the amounts of $3.3 million and $6.0 million, respectively.
FAIR VALUE OPTION—Kennedy-Wilson has elected the fair value option for two investments in joint venture entities that were acquired during 2009. Kennedy-Wilson elected to record these investments at fair value to more accurately reflect the timing of the value created in the underlying investments and report those results in current operations. The increase, decrease, and increase in fair value for these investments of $2.5 million, $1.0 million, and $6.0 million were recorded in equity in joint venture income in the consolidated statements of operations and comprehensive income (loss) for the years ended December 31, 2010, 2009, and 2008, respectively. Kennedy-Wilson determines the fair value of these investments based upon the income approach, utilizing estimates of future cash flows, discount rates and liquidity risks.
FAIR VALUE OF FINANCIAL INSTRUMENTS—The carrying amount of cash and cash equivalents, accounts receivable, accounts payable, accrued expenses and other liabilities, accrued salaries and benefits, deferred and accrued income taxes, and income tax receivable approximate fair value due to their short-term maturities. The carrying value of notes receivable (excluding related party notes receivable as they are presumed not to be an arm’s length transaction) approximate fair value as they are negotiated based upon the fair value of loans with similar characteristics. Bank lines of credit and debt approximate fair value as the terms are comparable to the terms currently being offered to Kennedy-Wilson.
NOTE 10—OTHER ASSETS
Office furniture and equipment and leaseholds improvements are carried at cost. The office furniture and equipment are depreciated over a period of three to ten years and the leasehold improvements are amortized over their estimated useful lives or the lease term, whichever is shorter. Other assets consist of the following:
56
Kennedy-Wilson Holdings, Inc. and Subsidiaries
Notes to Consolidated Financial Statements—(continued)
December 31, 2010, 2009 and 2008
December 31, | ||||||||
2010 | 2009 | |||||||
Office furniture and equipment | $ | 3,020,000 | $ | 1,404,000 | ||||
Less: Accumulated depreciation | (661,000 | ) | (837,000 | ) | ||||
2,359,000 | 567,000 | |||||||
Prepaid expenses | 3,316,000 | 4,316,000 | ||||||
Loan fees, net of accumulated amortization of $467,000 and $1,213,000 at December 31, 2010 and 2009, respectively | 1,629,000 | 1,248,000 | ||||||
Deposits and other, net of accumulated amortization of $23,000 and $54,000 at December 31, 2010 and 2009, respectively | 1,546,000 | 874,000 | ||||||
$ | 8,850,000 | $ | 7,005,000 | |||||
Depreciation and amortization expense related to the above depreciable assets was $279,000, $209,000, and $256,000 for the years ended December 31, 2010, 2009 and 2008, respectively.
NOTE 11—NOTES PAYABLE
Notes payable were incurred primarily in connection with the acquisition of joint venture investments and include the following:
December 31, | ||||||||
2010 | 2009 | |||||||
Note payable, interest payable monthly, $467,000 monthly principal payments,variable interest rate at the lenders base rate, 4% at December 31, 2010, unsecured, due August 2014 | $ | 20,533,000 | $ | 26,133,000 | ||||
Note payable, fixed interest rate of 5%, interest payable monthly, unsecured, due November 2011 | 4,250,000 | — | ||||||
$ | 24,783,000 | $ | 26,133,000 | |||||
Kennedy-Wilson is required to comply with debt covenants for its borrowings under the $20.5 million outstanding loan amount. The covenants include a tangible net worth, minimum liquidity, debt service coverage ratio, and a requirement to be profitable. At December 31, 2010, Kennedy-Wilson was in compliance with all covenants.
The aggregate maturities of notes payable subsequent to December 31, 2010 are: $9,850,000 in 2011, $5,600,000 in 2012, $5,600,000 in 2013, and $3,733,000 in 2014.
NOTE 12—BORROWINGS UNDER LINES OF CREDIT
In July 2010, Kennedy-Wilson entered into a new unsecured revolving credit facility with US Bank and East West Bank, which effectively increased its existing revolving credit facility from $30 million to $75 million, extended the maturity date to August 2013, and established an interest rate floor of 4% . The facility is available for acquisitions and working capital. The facility bears interest at rates ranging from LIBOR plus 2.50% to LIBOR plus 3.00%, with a floor of 4%. During 2010, the average outstanding borrowings under the facility was $16.3 million with the high and low outstanding balances being $27.8 million and $0, respectively. During 2009, the average outstanding borrowings under the previous facility was $19.1 million with the high and low outstanding balances being $26.0 million and $10.0, respectively. The borrowings under this facility had interest rates ranging from 3.23% to 4.00% and 3.25% to 4.50% during the years ended December 31, 2010 and 2009, respectively. The principal amount outstanding under this facility was $27.8 million as of December 31, 2010 and $10.0 million as of December 31, 2009.
Kennedy-Wilson’s ability to borrow under this facility is subject to compliance with certain financial covenants, including maximum balance sheet leverage and fixed charge coverage ratios. As of December 31, 2010 and 2009, Kennedy-Wilson was in compliance with the covenants.
NOTE 13—MORTGAGE LOANS PAYABLE
57
Kennedy-Wilson Holdings, Inc. and Subsidiaries
Notes to Consolidated Financial Statements—(continued)
December 31, 2010, 2009 and 2008
December 31, | ||||||||
2010 | 2009 | |||||||
Mortgage loan payable, variable interest rate of 1-month LIBOR plus 1.25% (1.51% at December 31, 2010), interest payable monthly, due January 2012, secured by multi-family property | $ | 17,497,000 | $ | 20,740,000 | ||||
Mortgage loan payable, variable interest rate of long-term prime lending rate plus 3.50% (4.80 % at December 31, 2010), prime rate adjusts in April and August, interest and principal paid monthly, balance due October 2012, secured by office building | 2,784,000 | 2,778,000 | ||||||
Mortgage loan payable, variable interest rate of 1.00% over prime, interest due quarterly, principal due based on release prices for settled loans, unpaid principal due upon maturity on May 2013 | 14,968,000 | — | ||||||
Mortgage loan payable, variable interest rate of prime, repaid in 2010 | — | 450,000 | ||||||
$ | 35,249,000 | $ | 23,968,000 | |||||
During 2010, Kennedy-Wilson assumed debt secured by a project in Hawaii (see Note 5) of $32.7 million and simultaneously settled the note for $16.0 million, resulting in a gain on early extinguishment of debt in the amount of $16.7 million (net of closing costs).
The aggregate maturities of mortgage loans payable subsequent to December 31, 2010 are: $311,000 in 2011, $19,970,000 in 2012, and $14,968,000 in 2013.
NOTE 14—CONVERTIBLE SUBORDINATED DEBT
In July 2010, Kennedy-Wilson extinguished its convertible subordinated debt with a face value of $30.0 million for $32.5 million. The convertible subordinated debt was originally issued with a beneficial conversion feature and the carrying value of the convertible subordinated debt on the day of extinguishment was $27.7 million, net of the unamortized beneficial conversion of $2.3 million. The intrinsic value of the beneficial conversion feature was measured at $0.1 million on the day of extinguishment and was recorded as a reduction to additional paid in capital. The difference between the extinguishment amount and the carrying value of $4.8 million is included in the accompanying consolidated statement of operations and comprehensive income (loss) as a loss on early extinguishment of debt.
NOTE 15—JUNIOR SUBORDINATED DEBENTURES
In 2007, Kennedy-Wilson issued junior subordinated debentures in the amount of $40 million. The debentures were issued to a trust established by Kennedy-Wilson, which contemporaneously issued $40 million of trust preferred securities to Merrill Lynch International. The interest rate on the debentures is fixed for the first ten years at 9.06%, and variable thereafter at LIBOR plus 3.70%. Interest is payable quarterly with the principal due in 2037.
Prior to April 30, 2012, Kennedy-Wilson may redeem the debentures, upon a Special Event, as defined in the debentures, at a redemption price equal to 107.5% of the outstanding principal amount. After April 30, 2012, Kennedy-Wilson may redeem the debentures, in whole or in part, on any interest payment date at par.
Kennedy-Wilson is required to be in compliance with certain financial covenants, including maximum balance sheet leverage and fixed charge coverage ratios. As of December 31, 2010, Kennedy-Wilson was in compliance with the covenants.
NOTE 16—RELATED PARTY TRANSACTIONS
In 2010, in connection with the acquisition of third-party partners’ ownership interest in various joint venture investments, Kennedy-Wilson acquired the interests of various related party entities consisting of management and directors of Kennedy-Wilson for their net investments totaling $3.0 million.
During 2010, a noncontrolling entity comprised of Kennedy-Wilson executives co-invested $1.3 million with Kennedy-Wilson in the entity that invested in the venture that acquired a partial interest in KWR.
In 2010, Kennedy-Wilson sold a 50% ownership interest in Fairways and its entire 5% interest in another joint venture to
58
Kennedy-Wilson Holdings, Inc. and Subsidiaries
Notes to Consolidated Financial Statements—(continued)
December 31, 2010, 2009 and 2008
KW Fund III in which it also has an ownership interest of 11.62% and is the general partner. The gain recognized on the sale of Fairways in the amount of $0.7 million is included in the accompanying consolidated statements of operations and comprehensive income (loss). The gain recognized on the sale of the 5% joint venture interest in the amount of $0.6 million is included in equity in income of joint ventures in the accompanying consolidated statements of operations and comprehensive income (loss). Gains on the sale of Fairways and the 5% joint venture interest were deferred in the amount of $0.2 million and are included in accrued expenses and other liabilities in the accompanying consolidated balance sheets.
In 2010, the firm of Kulik, Gottesman & Mouton Ltd. was paid $177,000 for legal services provided by the firm and $43,000 for director’s fees for Kent Mouton, a partner in the firm and a member of Kennedy-Wilson’s Board of Directors, respectively. For 2009, the amounts were $366,000 and $25,000, respectively. For 2008, the amounts were $286,000 and $30,000, respectively. For the year ended December 31, 2009, Mr. Mouton received a payment of $10,000 upon the termination of the 2009 Equity Participation Plan. (See Note 19)
The firm of Solomon, Winnett & Rosenfield was paid $234,000, $219,000, and $194,000 for income tax services provided by the firm during the years ended December 31, 2010, 2009, and 2008, respectively. Jerry Solomon is a partner in the firm and a member of Kennedy-Wilson’s Board of Directors. For the years ended December 31, 2010, 2009, and 2008, Mr. Solomon was paid director’s fees in the amounts of $40,000, $22,000, and $29,000, respectively. For the year ended December 31, 2009, Mr. Solomon received a payment of $10,000 upon the termination of the 2009 Equity Participation Plan. (See Note 19)
In 2009, Kennedy-Wilson sold its ownership interest in two consolidated land projects to KW Fund III in which it also had an ownership interest of 7.64%. The gains recognized on the sale of these two ownership interests totaled $946,000 and are included in the accompanying consolidated statements of operations and comprehensive income (loss). Gains on the sale of the joint venture interests were deferred in the amount of $44,000 and are included in accrued expenses and other liabilities in the accompanying consolidated balance sheets.
In 2008, Kennedy-Wilson sold its ownership interest in three joint venture investments to KW Fund III in which it also had an ownership interest of 7.64%. The gains recognized on the sale of these three ownership interests totaled $1,409,000 and are included in equity in income of joint ventures in the accompanying consolidated statements of operations and comprehensive income (loss). Gains on the sale of the joint venture interests were deferred in the amount of $56,000 and are included in accrued expenses and other liabilities in the accompanying consolidated balance sheets.
In 2009, Kennedy-Wilson entered into a seven-year lease with an affiliate of a shareholder for its corporate offices in Beverly Hills, California commencing in January 2010 . In 2010, Kennedy-Wilson amended the lease to provide for the rental of additional square footage. As of December 31, 2010, the future minimum lease payments under this agreement are as follows:
Year | ||||
2011 | $ | 1,206,000 | ||
2012 | 1,244,000 | |||
2013 | 1,282,000 | |||
2014 | 1,321,000 | |||
2015 | 1,361,000 | |||
Thereafter | 1,403,000 | |||
Total minimum payments | $ | 7,817,000 | ||
Rental expense under this arrangement totaled $986,000 for the year ended December 31, 2010.
Kennedy-Wilson received fees and other income from affiliates and entities in which Kennedy-Wilson holds ownership interests in the following amounts:
59
Kennedy-Wilson Holdings, Inc. and Subsidiaries
Notes to Consolidated Financial Statements—(continued)
December 31, 2010, 2009 and 2008
Year ended December 31, | ||||||||||||
2010 | 2009 | 2008 | ||||||||||
Property management and leasing fees | $ | 12,417,000 | $ | 10,138,000 | $ | 8,380,000 | ||||||
Commissions | 5,375,000 | 727,000 | 4,295,000 | |||||||||
Sale of real estate | 9,535,000 | 6,698,000 | — | |||||||||
Total related party revenue | $ | 27,327,000 | $ | 17,563,000 | $ | 12,675,000 | ||||||
In 2010, Kennedy-Wilson received reimbursement from KWR for payroll and services in the amount of $222,000 and $599,000, respectively. For 2009 and 2008, Kennedy-Wilson was paid $273,000 and $270,000, respectively, for payroll and $147,000 and $139,000, respectively, for consulting services.
NOTE 17—INCOME TAXES
The (benefit from) provision for income taxes consists of the following:
Year ended December 31, | ||||||||||||
2010 | 2009 | 2008 | ||||||||||
Current | ||||||||||||
Federal | $ | (2,450,000 | ) | $ | (9,461,000 | ) | $ | (2,416,000 | ) | |||
State | 18,000 | 228,000 | (351,000 | ) | ||||||||
(2,432,000 | ) | (9,233,000 | ) | (2,767,000 | ) | |||||||
Deferred | ||||||||||||
Federal | 5,583,000 | 5,987,000 | 2,905,000 | |||||||||
State | 576,000 | (715,000 | ) | 467,000 | ||||||||
6,159,000 | 5,272,000 | 3,372,000 | ||||||||||
Total | $ | 3,727,000 | $ | (3,961,000 | ) | $ | 605,000 | |||||
A reconciliation of the statutory federal income tax rate of 34% with Kennedy-Wilson’s effective income tax rate is as follows:
Year ended December 31, | ||||||||||||
2010 | 2009 | 2008 | ||||||||||
Tax computed at statutory rate | $ | 3,472,000 | $ | (4,630,000 | ) | $ | 414,000 | |||||
State income taxes, net of federal benefit | 393,000 | (681,000 | ) | 69,000 | ||||||||
Non-vested stock expense | — | 525,000 | 375,000 | |||||||||
Capitalized transaction costs | — | 528,000 | — | |||||||||
Adjustment to investment basis | — | 954,000 | — | |||||||||
Extinguishment of debt | 818,000 | — | — | |||||||||
Noncontrolling interest and other | (956,000 | ) | (657,000 | ) | (253,000 | ) | ||||||
Provision for (benefit from) income taxes | $ | 3,727,000 | $ | (3,961,000 | ) | $ | 605,000 | |||||
The following summarizes the effect of deferred income tax items and the impact of “temporary differences” between amounts of assets and liabilities for financial reporting purposes and such amounts as measured by tax laws. Temporary differences and carryforwards which give rise to deferred tax assets and liabilities are as follows:
60
Kennedy-Wilson Holdings, Inc. and Subsidiaries
Notes to Consolidated Financial Statements—(continued)
December 31, 2010, 2009 and 2008
Year ended December 31, | ||||||||
2010 | 2009 | |||||||
Deferred tax assets: | ||||||||
Accrued reserves | $ | 196,000 | $ | 194,000 | ||||
Stock option expense | 1,714,000 | 309,000 | ||||||
Net operating loss carryforward and credits | 9,145,000 | 1,236,000 | ||||||
Hedging transactions | 1,032,000 | — | ||||||
Marketable securities | 289,000 | 294,000 | ||||||
Accrued bonuses | — | 456,000 | ||||||
Total deferred tax assets | 12,376,000 | 2,489,000 | ||||||
Deferred tax liabilities: | ||||||||
Depreciation and amortization | 6,644,000 | 6,366,000 | ||||||
Prepaid expenses and other | 814,000 | 1,096,000 | ||||||
Investment basis and reserve differences | 21,701,000 | 3,040,000 | ||||||
Accrued payroll | — | — | ||||||
Unrealized gain on fair value option | — | 3,639,000 | ||||||
Foreign currency translation | 6,773,000 | 1,472,000 | ||||||
Capitalized interest | 2,315,000 | 2,315,000 | ||||||
Total deferred tax liabilities | 38,247,000 | 17,928,000 | ||||||
Net deferred tax liability | $ | 25,871,000 | $ | 15,439,000 | ||||
Based upon the level of historical taxable income and projections for future taxable income over the periods which Kennedy-Wilson’s gross deferred tax assets are deductible, management believes it is more likely than not Kennedy-Wilson will realize the benefits of these deductible differences as of December 31, 2010.
Management has considered the likelihood and significance of possible penalties associated with Kennedy-Wilson's current and intended filing positions and has determined, based on its assessment, that such penalties, if any, would not be expected to be material.
Kennedy-Wilson’s federal income tax returns remain open to examination for the tax years 2007 through 2010. Kennedy-Wilson is currently under examination for 2008 and 2009.
NOTE 18—COMMITMENTS AND CONTINGENCIES
Future minimum lease payments under scheduled operating leases that have initial or remaining noncancelable terms in excess of one year are as follows:
Year | ||||
2011 | $ | 1,865,000 | ||
2012 | 1,579,000 | |||
2013 | 1,425,000 | |||
2014 | 1,396,000 | |||
2015 | 1,397,000 | |||
Thereafter | 1,403,000 | |||
Total minimum payments | 9,065,000 | |||
Net rental expense amounted to $2.2 million, $2.0 million, and $1.6 million for the years ended December 31, 2010, 2009, and 2008, respectively, and is included in general and administrative expense in the accompanying consolidated statements of operations and comprehensive income (loss).
EMPLOYMENT AGREEMENTS—Kennedy-Wilson has entered into employment agreements with its Chief Executive Officer and its Chief Executive Officer of the Commercial Investment Group, which provide for annual base compensation in
61
Kennedy-Wilson Holdings, Inc. and Subsidiaries
Notes to Consolidated Financial Statements—(continued)
December 31, 2010, 2009 and 2008
the aggregate amounts of $950,000 and $750,000, respectively, and expire in December 2019 and January 2014, respectively. The employment agreements provided for the payment of cash bonuses, in connection with the Merger, in the amounts of $4,850,000 and $2,000,000, respectively, and were paid in November 2009. Additionally, the employment agreements provide for cash bonuses of $2,425,000 and $1,000,000, respectively, based on Kennedy-Wilson's achievement of certain performance targets as described in the employment agreement and were paid on April 1, 2010 . The employment agreements also provide for the issuance of 556,875 shares of restricted stock to each officer that vest in equal amounts over five years provided certain performance targets are achieved (see Note 19). Also, in connection with the Merger, Kennedy-Wilson forgave a note, including principal and interest, due from its Chief Executive Officer in the total amount of $4,281,000. Additionally, the employment agreements provide for the payment of an annual discretionary bonus in an amount determined in the sole and absolute discretion of the Compensation Committee of the board of directors.
Kennedy-Wilson also has employment agreements with two other non-officer employees which provide for aggregate minimum annual compensation of $995,000 and expire in 2011 and 2014.
LITIGATION—Kennedy-Wilson is currently a defendant in certain routine litigation arising in the ordinary course of business. It is the opinion of management and legal counsel that the outcome of these actions will not have a material effect on the financial position or results of operations of Kennedy-Wilson.
NOTE 19—STOCK COMPENSATION PLANS
In March 2009, KWI adopted the 2009 Equity Participation Plan ("the Equity Plan") that allowed for the grant of up to 2,852,312 shares of common stock. KWI granted 1,426,156 performance awards and 1,426,156 service awards with an exercise price of $7.89. The performance and service awards were scheduled to vest ratably over a seven year period with settlement in shares of common stock of KWI. The option awards would have expired at the end of ten years. The Equity Plan allowed participants to settle vested awards with cash, a full recourse note, or net share settlement. Kennedy-Wilson determined the compensation expense to be recorded under the Equity Plan using the Black-Scholes-Merton option pricing model. The option pricing model inputs used to determine the grant date fair value of $10.3 million were an expected stock option term of 7 years, expected volatility of 43.4%, expected risk free rate of 2.5%, and no expected dividends. In November 2009, the Equity Plan was canceled and replaced by another 2009 Equity Participation Plan (the "New Equity Plan"). Upon termination of the Equity Plan, the board of directors of KWI approved a cash payment to option holders totaling $1.5 million.
On November 13, 2009, Kennedy-Wilson adopted the the New Equity Plan that allows for the grant of up to approximately 2.5 million shares of common stock. During 2010 and 2009, approximately 0.1 million and 2.4 million restricted share awards were granted to employees, respectively, which vest ratably over a five year period. Vesting of the restricted share awards is contingent upon the expected achievement of a performance target as of the initial vesting date of November 13, 2010 and each of the next four years thereafter. The performance targets were achieved for 2010. From inception of the plan through December 31, 2010, 467,781 shares have vested and been issued to participants and 18,562 shares have been forfeited. These restricted share awards are recognized as expense on a tranche by tranche basis over the five year performance period.
The cancellation and settlement of the Equity Plan along with the granting of new awards under the New Equity Plan was determined to be a plan modification. Therefore the aggregate compensation cost recognized as a result of the modification will be the remaining grant date fair value of the Equity Plan plus the incremental compensation cost resulting from the modification. The incremental compensation costs are measured as the grant date fair value of the restricted stock awards plus the cash paid to settle the Equity Plan awards less the fair value of the Equity Plan on the date of modification. Since, on the date of modification, the cumulative compensation cost recognized under the Equity Plan exceeded the cash paid to settle the award, no additional compensation costs were recorded as a result of the cash payment and it was recorded as a reduction to equity. The fair value of the Equity Plan on the date of modification was determined utilizing the Black-Scholes-Merton option pricing model. The option pricing model inputs used were an expected stock option term of 6.29 years, volatility of 41.9%, risk free interest rate of 2.95%, and no expected dividends.
As of December 31, 2010, there was $7.6 million of unrecognized compensation cost for the New Equity Plan related to unvested restricted shares and $6.2 million of unrecognized compensation cost for the Equity Plan. The cost for the New Equity Plan is expected to be recognized over a weighted average period of 2.0 years and the cost for the Equity Plan is expected to be recognized over a weighted average period of 3.1 years.
Compensation cost recognized for the years ended December 31, 2010 and 2009, was $8.1 million and $2.3 million, respectively, and is included in compensation and related expense in the accompanying statement of operations and comprehensive income (loss).
62
Kennedy-Wilson Holdings, Inc. and Subsidiaries
Notes to Consolidated Financial Statements—(continued)
December 31, 2010, 2009 and 2008
The following table sets forth activity under the New Equity Plan:
Nonvested at January 1, 2009 | — | ||
Granted | 2,357,443 | ||
Nonvested at December 31, 2009 | 2,357,443 | ||
Granted | 132,500 | ||
Vested | (467,781 | ) | |
Forfeited | (18,562 | ) | |
Nonvested at December 31, 2010 | 2,003,600 |
KWI had the 1992 Incentive and Non-statutory Stock Option Plan ("1992 Incentive and Option Plan"), which included a Plan A and Plan B and the 1992 Non-Employee Director Stock Option Plan ("Plan C"). An aggregate of 6,465,239 shares of common stock were reserved for issuance under Plans A and B and 308,050 shares of common stock were reserved for issuance under Plan C.
During the year ended December 31, 2009, the last remaining 55,448 options granted under Plan C of the KWI’s 1992 Incentive and Option Plan were exercised. During the year ended December 31, 2008, the last remaining 42,785 options granted under Plan B of the 1992 Incentive and Option Plan were exercised.
The following table sets forth activity under the option plans:
Options | Range of Exercise Prices | Weighted Average Exercise Price | |||||
Balance, January 1, 2008 | 98,233 | $1.00 - $2.32 | $1.55 | ||||
Exercised | (42,785 | ) | $2.17 | $2.17 | |||
Balance, December 31, 2008 | 55,448 | $1.00 - $2.32 | $1.07 | ||||
Granted | 2,852,312 | $7.89 | $7.89 | ||||
Exercised | (55,448 | ) | $1.00 - $2.32 | $1.07 | |||
Cancelled | (2,852,312 | ) | $7.89 | $7.89 | |||
Balance, December 31, 2009 | — | — | — | ||||
During 2001 and 2002, KWI’s chairman and chief executive officer was granted a total of 6,465,239 shares of non-vested stock that were scheduled to vest over a period of eight to ten years. For the years ended December 31, 2009 and 2008, compensation expense was $1.5 million and $1.0 million, respectively, and is included in compensation and related expenses in the accompanying consolidated statements of operations and comprehensive income (loss). As of December 31, 2009 and 2008, the amount of non-vested shares deducted from additional paid-in capital was $0, and $1.5 million, respectively. During 2009, in connection with the Merger, the vesting of the remaining unvested shares was accelerated and the expense was included in compensation and related expenses in the accompanying consolidated statements of operations and comprehensive income (loss).
NOTE 20—CAPITAL STOCK TRANSACTIONS
During 2010, Kennedy-Wilson repurchased 1,111,690 shares of its common stock at market for total consideration of $11,301,000. These shares are currently held in treasury.
During 2009 and 2008, Kennedy-Wilson acquired approximately 443,000 and 624,000 shares, respectively, of its common stock for total consideration of $3,690,000 and $6,170,000, respectively. These shares were subsequently retired.
During 2010, Kennedy-Wilson repurchased a total of 7,942,555 of its outstanding warrants for total consideration of $11,500,000. 9,807,445 of its warrants remain outstanding as of December 31, 2010. The warrants carry an exercise price of $12.50 with an expiration date of November 14, 2013. Kennedy-Wilson may call for redemption of the warrants in whole and not in part at a price of $0.01 per warrant if the share price of its common stock equals or exceeds $19.50 per share for any 20 trading days within a 30 trading day period ending on the third business day prior to the notice of redemption to warrant
63
Kennedy-Wilson Holdings, Inc. and Subsidiaries
Notes to Consolidated Financial Statements—(continued)
December 31, 2010, 2009 and 2008
holders, or upon not less than 30 days’ prior written notice of redemption to each warrant holder.
During 2010, Kennedy-Wilson issued two series of Convertible Cumulative Preferred stock (together “the Preferred Stock”), series A (100,000 shares) and series B (32,550 shares), for total proceeds less issuance costs of $99.8 million and $32.5 million, respectively. The series A Preferred Stock is convertible into common stock at any time at the option of the holder prior to May 19, 2015 at a price of $12.41 per share and is mandatorily convertible into common stock on May 19, 2015. The series B Preferred Stock is convertible into common stock at any time at the option of the holder prior to November 3, 2018 at a price of $10.70 per share and is mandatorily convertible into common stock on November 3, 2018. The series A and series B Preferred Stock have dividend rates of 6.0% and 6.452%, respectively, payable quarterly.
The certificate of designations of the Preferred Stock contain provisions that require Kennedy-Wilson to commence an offer to purchase all shares of the Preferred Stock at a purchase price in cash per share of Preferred Stock equal to $1,150 plus all accumulated and accrued dividends upon the occurrence of a fundamental change, defined as a change of control. The parties have agreed that a change of control is deemed to occur when any person or group other than the purchaser of the Preferred Stock and its affiliates, or any officer or director of Kennedy-Wilson as of the issue date of the Preferred Stock, acquires directly or indirectly voting control or direction over more than 35% of the voting control of Kennedy-Wilson for a period of seven consecutive days following the earlier of the date the company becomes aware of such acquisition and the date such person or group files a Schedule 13D. This change of control provision is within Kennedy-Wilson’s control as the Board of Directors, at its discretion, would be able to issue blank check Preferred Stock at any time for any reason which could dilute the person or group to below the 35% of the voting control threshold. As such, Kennedy-Wilson has concluded that the change of control is within the control of Kennedy-Wilson and therefore has classified the Preferred Stock as permanent equity in the accompanying consolidated balance sheets.
In connection with the issuance of the Preferred Stock, Kennedy-Wilson entered into registration rights agreements that allow for the holders of the Preferred Stock, with at least a 51% vote, to demand registration of the Preferred Stock (or converted common stock) on or after November 13, 2010. If Kennedy-Wilson does not satisfy the demand for registration, the holders of the Preferred Stock (or converted common stock) would be entitled to receive a payment in an amount equal to 1.50% per annum of the liquidation preference of $1,000 per share. There are sufficient shares of unregistered common stock authorized and unissued to accommodate the conversion feature.
In 2008, before preferred shares were converted to common shares and the shares were recast to match the presentation of Prospect in connection with the Merger, KWI issued 53,000 shares of Series A Preferred Stock (the “Initial Preferred Stock”). The proceeds from the issuance of the Initial Preferred Stock were $52,354,000, net of expenses related to the offering totaling $646,000. The holders of the Initial Preferred Stock were entitled to receive dividends at a rate of 7% of the liquidation value of $1,000 per share, payable quarterly. The Initial Preferred Stock had a conversion price of $42 per share. In connection with the Merger the Initial Preferred Stock was converted to common stock and the conversion price was modified to $36 per share. The change in conversion price resulted in the issuance of additional shares to pre-merger preferred shareholders in the amount of $7,879,000. In addition, cash dividend payments to pre-Merger preferred shareholders for the years ended December 31, 2009 and 2008 were $3,235,000 and $2,264,000, respectively.
NOTE 21—EMPLOYEE BENEFIT ARRANGEMENTS
Kennedy-Wilson has a qualified plan under the provisions of Section 401(k) of the Internal Revenue Code. Under this plan, participants are able to make salary deferral contributions of up to 15% of their total compensation, up to a specified maximum. The 401(k) plan also includes provisions which authorize Kennedy-Wilson to make discretionary contributions. During 2010, 2009, and 2008, Kennedy-Wilson made matching contributions of $232,000, $32,000, and $6,000, respectively, to this plan and is included in compensation and related expenses in the accompanying consolidated statements of operations and comprehensive loss.
NOTE 22—EARNINGS PER SHARE
The following table sets forth the computation of basic and diluted earnings per share:
64
Kennedy-Wilson Holdings, Inc. and Subsidiaries
Notes to Consolidated Financial Statements—(continued)
December 31, 2010, 2009 and 2008
Year ended December 31, | ||||||||||||
2010 | 2009 | 2008 | ||||||||||
Net (loss) income attributable to Kennedy-Wilson Holdings, Inc. common shareholders | $ | (1,052,000 | ) | $ | (15,336,000 | ) | $ | 613,000 | ||||
Basic (loss) income per share attributable to Kennedy-Wilson Holdings, Inc. common shareholders | (0.03 | ) | (0.57 | ) | 0.03 | |||||||
Weighted average shares outstanding for basic (loss) income per share | 38,978,272 | 26,891,304 | 22,892,498 | |||||||||
Diluted (loss) income per share attributable to Kennedy-Wilson Holdings, Inc. common shareholders: | $ | (0.03 | ) | $ | (0.57 | ) | $ | 0.03 | ||||
Weighted average shares outstanding for diluted (loss) income per share | 38,978,272 | 26,891,304 | 24,310,299 | |||||||||
Weighted average common shares | 38,978,272 | 26,891,304 | 22,892,498 | |||||||||
Options and warrants | — | — | 65,583 | |||||||||
Non-vested stock | — | — | 1,352,218 | |||||||||
Total diluted shares | 38,978,272 | 26,891,304 | 24,310,299 | |||||||||
The dilutive shares from warrants, convertible securities, options and non-vested stock have not been included in the diluted weighted average shares as Kennedy-Wilson has a net loss available to common shareholders. There were a total of 0, 147,857 and 0 potentially dilutive securities as of December 31, 2010, 2009 and 2008, respectively.
NOTE 23—SEGMENT INFORMATION
Kennedy-Wilson's business is defined by two core segments: KW Services and KW Investments. KW Services provides a full array of real estate-related services to investors and lenders, with a strong focus on financial institution-based clients. KW Investments invests Kennedy-Wilson capital in multifamily, residential and office properties as well as loans secured by real estate. Kennedy-Wilson’s segment disclosure with respect to the determination of segment profit or loss and segment assets is based on these services and investments.
KW SERVICES—Kennedy-Wilson offers a comprehensive line of real estate services for the full life cycle of real estate ownership and investment to clients that include financial institutions, developers, builders and government agencies. Kennedy Wilson provides auction and conventional sales, property management, asset management, leasing, construction management, acquisitions, dispositions and trust services.
KW INVESTMENTS—Kennedy-Wilson, on its own and through joint ventures, is an investor in real estate, including multifamily, residential and office properties as well as loans secured by real estate.
Substantially all of the management fees and commissions – related party revenues were generated via intersegment activity for the years ended December 31, 2010, 2009 and 2008. The amounts representing investments with related parties and non-affiliates are included in the investments segment. No single external customer provided Kennedy-Wilson with 10% or more of its revenues during any period presented in these financial statements.
65
Kennedy-Wilson Holdings, Inc. and Subsidiaries
Notes to Consolidated Financial Statements—(continued)
December 31, 2010, 2009 and 2008
The following tables summarize the income and expense activity by segment for the year ended December 31, 2010 and total assets as of December 31, 2010.
Services | Investments | Corporate | Consolidated | |||||||||||||
Management fees and commissions | $ | 15,272,000 | $ | — | $ | — | $ | 15,272,000 | ||||||||
Management fees and commissions - related party | 17,792,000 | — | — | 17,792,000 | ||||||||||||
Sale of real estate | — | 3,937,000 | — | 3,937,000 | ||||||||||||
Sale of real estate - related party | — | 9,535,000 | — | 9,535,000 | ||||||||||||
Rental and other revenue | — | 4,000,000 | — | 4,000,000 | ||||||||||||
Total revenue | 33,064,000 | 17,472,000 | — | 50,536,000 | ||||||||||||
Operating expenses | 23,584,000 | 26,243,000 | 18,492,000 | 68,319,000 | ||||||||||||
Depreciation and amortization | 117,000 | 1,342,000 | 159,000 | 1,618,000 | ||||||||||||
Total operating expenses | 23,701,000 | 27,585,000 | 18,651,000 | 69,937,000 | ||||||||||||
Equity in joint venture income | — | 10,548,000 | — | 10,548,000 | ||||||||||||
Income from loan pool participations and notes receivable | — | 11,855,000 | — | 11,855,000 | ||||||||||||
Total operating income (loss) | 9,363,000 | 12,290,000 | (18,651,000 | ) | 3,002,000 | |||||||||||
Interest income | — | — | 192,000 | 192,000 | ||||||||||||
Interest income - related party | — | — | 662,000 | 662,000 | ||||||||||||
Remeasurement gain | — | 2,108,000 | — | 2,108,000 | ||||||||||||
Gain on early extinguishment of debt | — | 16,670,000 | — | 16,670,000 | ||||||||||||
Loss on early extinguishment of debt | — | (4,788,000 | ) | (4,788,000 | ) | |||||||||||
Interest expense | — | (676,000 | ) | (6,958,000 | ) | (7,634,000 | ) | |||||||||
Income (loss) before provision for income taxes | $ | 9,363,000 | $ | 30,392,000 | (29,543,000 | ) | 10,212,000 | |||||||||
Provision for income taxes | (3,727,000 | ) | (3,727,000 | ) | ||||||||||||
Net income | $ | (33,270,000 | ) | $ | 6,485,000 | |||||||||||
Total assets | $ | 38,780,000 | $ | 400,519,000 | $ | 48,549,000 | $ | 487,848,000 | ||||||||
Expenditures for long lived assets | $ | 23,764,000 | $ | 23,764,000 | ||||||||||||
All of the revenues included in the table above are attributable to the United States, except for $485,000 in rental revenue that is attributable to Japan. This rental revenue was generated from the office building in Japan that had a carrying value of $8,891,000 as of December 31, 2010. The only other activity outside the United States is conducted through Kennedy-Wilson’s equity method investment KWR (See Note 7).
66
Kennedy-Wilson Holdings, Inc. and Subsidiaries
Notes to Consolidated Financial Statements—(continued)
December 31, 2010, 2009 and 2008
The following tables summarize the income and expense activity by segment for the year ended December 31, 2009 and total assets as of December 31, 2009.
Services | Investments | Corporate | Consolidated | |||||||||||||
Management fees and commissions | $ | 13,230,000 | $ | — | $ | — | $ | 13,230,000 | ||||||||
Management fees and commissions - related party | 10,865,000 | — | — | 10,865,000 | ||||||||||||
Sale of real estate | — | 52,699,000 | — | 52,699,000 | ||||||||||||
Sale of real estate - related party | — | 6,698,000 | — | 6,698,000 | ||||||||||||
Rental and other revenue | — | 2,717,000 | 26,000 | 2,743,000 | ||||||||||||
Total revenue | 24,095,000 | 62,114,000 | 26,000 | 86,235,000 | ||||||||||||
Operating expenses | 20,499,000 | 49,458,000 | 23,793,000 | 93,750,000 | ||||||||||||
Depreciation and amortization | 70,000 | 919,000 | 133,000 | 1,122,000 | ||||||||||||
Total operating expenses | 20,569,000 | 50,377,000 | 23,926,000 | 94,872,000 | ||||||||||||
Equity in joint venture income | — | 8,019,000 | — | 8,019,000 | ||||||||||||
Total operating income (loss) | 3,526,000 | 19,756,000 | (23,900,000 | ) | (618,000 | ) | ||||||||||
Interest income | — | — | 102,000 | 102,000 | ||||||||||||
Interest income - related party | — | — | 400,000 | 400,000 | ||||||||||||
Interest expense | — | (5,106,000 | ) | (8,068,000 | ) | (13,174,000 | ) | |||||||||
Other than temporary impairment on available for sale security | — | (328,000 | ) | — | (328,000 | ) | ||||||||||
Income (loss) before provision for income taxes | $ | 3,526,000 | $ | 14,322,000 | (31,466,000 | ) | (13,618,000 | ) | ||||||||
Benefit from income taxes | 3,961,000 | 3,961,000 | ||||||||||||||
Net loss | $ | (27,505,000 | ) | $ | (9,657,000 | ) | ||||||||||
Total assets | $ | 30,600,000 | $ | 236,780,000 | $ | 68,877,000 | $ | 336,257,000 | ||||||||
Expenditures for long lived assets | $ | 35,800,000 | $ | 35,800,000 | ||||||||||||
All of the revenues included in the table above are attributable to the United States, except for $483,000 in rental revenue that is attributable to Japan. This rental revenue was generated from the office building in Japan that had a carrying value of $8,145,000 as of December 31, 2009. The only other activity outside the United States is conducted through Kennedy-Wilson’s equity method investment KWR (See Note 7).
67
Kennedy-Wilson Holdings, Inc. and Subsidiaries
Notes to Consolidated Financial Statements—(continued)
December 31, 2010, 2009 and 2008
The following tables summarize the income and expense activity by segment for the year ended December 31, 2008 and total assets as of December 31, 2008.
Services | Investments | Corporate | Consolidated | |||||||||||||
Management fees and commissions | $ | 16,577,000 | $ | — | $ | — | $ | 16,577,000 | ||||||||
Management fees and commissions - related party | 12,675,000 | — | — | 12,675,000 | ||||||||||||
Rental and other revenue | — | 2,973,000 | — | 2,973,000 | ||||||||||||
Total revenue | 29,252,000 | 2,973,000 | — | 32,225,000 | ||||||||||||
Operating expenses | 21,251,000 | 8,182,000 | 2,218,000 | 31,651,000 | ||||||||||||
Depreciation and amortization | 83,000 | 683,000 | 154,000 | 920,000 | ||||||||||||
Total operating expenses | 21,334,000 | 8,865,000 | 2,372,000 | 32,571,000 | ||||||||||||
Equity in joint venture income | — | 10,097,000 | — | 10,097,000 | ||||||||||||
Total operating income (loss) | 7,918,000 | 4,205,000 | (2,372,000 | ) | 9,751,000 | |||||||||||
Interest income | — | — | 221,000 | 221,000 | ||||||||||||
Interest income - related party | — | — | 341,000 | 341,000 | ||||||||||||
Interest expense | — | (1,974,000 | ) | (6,622,000 | ) | (8,596,000 | ) | |||||||||
Other than temporary impairment on available for sale security | — | — | (445,000 | ) | (445,000 | ) | ||||||||||
Income (loss) before provision for income taxes | $ | 7,918,000 | $ | 2,231,000 | (8,877,000 | ) | 1,272,000 | |||||||||
Provision for income taxes | (605,000 | ) | (605,000 | ) | ||||||||||||
Net loss | $ | (9,482,000 | ) | $ | 667,000 | |||||||||||
Total assets | $ | 39,791,000 | $ | 175,368,000 | $ | 40,724,000 | $ | 255,883,000 | ||||||||
Expenditures for long lived assets | $ | 41,460,000 | $ | 41,460,000 | ||||||||||||
All of the revenues included in the table above are attributable to the United States, except for $198,000 in rental revenue that is attributable to Japan. This rental revenue was generated from the office building in Japan that had a carrying value of $8,428,000 as of December 31, 2008. The only other activity outside the United States is conducted through Kennedy-Wilson’s equity method investment KWR (See Note 7).
68
Kennedy-Wilson Holdings, Inc. and Subsidiaries
Notes to Consolidated Financial Statements—(continued)
December 31, 2010, 2009 and 2008
NOTE 24—UNAUDITED QUARTERLY INFORMATION
Year Ended December 31, 2010 | First Quarter | Second Quarter | Third Quarter | Fourth Quarter | ||||||||||||
Revenues | $ | 10,826,000 | $ | 9,046,000 | $ | 11,773,000 | $ | 18,891,000 | ||||||||
Operating expenses | 14,871,000 | 12,509,000 | 17,647,000 | 24,910,000 | ||||||||||||
Equity in joint venture (loss) income | 657,000 | (686,000 | ) | 5,191,000 | 5,386,000 | |||||||||||
Interest income from loan pool participations and notes receivable | 651,000 | 3,090,000 | 4,209,000 | 3,905,000 | ||||||||||||
Operating income (loss) | (2,737,000 | ) | (1,059,000 | ) | 3,526,000 | 3,272,000 | ||||||||||
Non-operating (expenses) income | (1,833,000 | ) | 16,818,000 | (6,842,000 | ) | (933,000 | ) | |||||||||
Income (loss) before provision for income taxes | (4,570,000 | ) | 15,759,000 | (3,316,000 | ) | 2,339,000 | ||||||||||
(Provision for) benefit from income taxes | 1,998,000 | (5,950,000 | ) | (383,000 | ) | 608,000 | ||||||||||
Net income (loss) | (2,572,000 | ) | 9,809,000 | (3,699,000 | ) | 2,947,000 | ||||||||||
Net income attributable to noncontrolling interests | (568,000 | ) | (591,000 | ) | (1,215,000 | ) | (605,000 | ) | ||||||||
Net (loss) income attributable to Kennedy-Wilson Holdings, Inc. shareholders | $ | (3,140,000 | ) | $ | 9,218,000 | $ | (4,914,000 | ) | $ | 2,342,000 | ||||||
Preferred stock dividends and accretion of issuance costs | — | (720,000 | ) | (1,804,000 | ) | (2,034,000 | ) | |||||||||
Net (loss) income attributable to Kennedy-Wilson Holdings, Inc. common shareholders | $ | (3,140,000 | ) | $ | 8,498,000 | $ | (6,718,000 | ) | $ | 308,000 | ||||||
Basic (loss) earnings per share | $ | (0.08 | ) | $ | 0.22 | $ | (0.17 | ) | $ | 0.01 | ||||||
Diluted (loss) earnings per share | (0.08 | ) | 0.20 | (0.17 | ) | 0.01 | ||||||||||
Year ended December 31, 2009 | First Quarter | Second Quarter | Third Quarter | Fourth Quarter | ||||||||||||
Revenues | $ | 12,483,000 | $ | 6,817,000 | $ | 41,021,000 | $ | 25,914,000 | ||||||||
Operating expenses | 11,942,000 | 8,660,000 | 32,687,000 | 41,583,000 | ||||||||||||
Equity in joint venture (loss) income | (192,000 | ) | (269,000 | ) | 893,000 | 7,587,000 | ||||||||||
Operating income (loss) | 349,000 | (2,112,000 | ) | 9,227,000 | (8,082,000 | ) | ||||||||||
Non-operating expenses | 2,461,000 | 2,741,000 | 5,611,000 | 2,187,000 | ||||||||||||
(Loss) income before provision for income taxes | (2,112,000 | ) | (4,853,000 | ) | 3,616,000 | (10,269,000 | ) | |||||||||
Benefit from (provision for) income taxes | 653,000 | 1,562,000 | (251,000 | ) | 1,997,000 | |||||||||||
Net (loss) income | (1,459,000 | ) | (3,291,000 | ) | 3,365,000 | (8,272,000 | ) | |||||||||
Net loss (income) attributable to noncontrolling interests | 57,000 | 210,000 | (3,325,000 | ) | (2,621,000 | ) | ||||||||||
Net (loss) income attributable to Kennedy-Wilson Holdings, Inc. shareholders | $ | (1,402,000 | ) | $ | (3,081,000 | ) | $ | 40,000 | $ | (10,893,000 | ) | |||||
Basic (loss) earnings per share | $ | (0.06 | ) | $ | (0.12 | ) | $ | — | $ | (0.34 | ) | |||||
Diluted (loss) earnings per share | (0.06 | ) | (0.12 | ) | — | (0.34 | ) | |||||||||
69
Kennedy-Wilson Holdings, Inc. and Subsidiaries
Schedule III—Real Estate and Accumulated Depreciation
December 31, 2010
(Dollars in thousands)
Intial Cost | Costs Capitalized Subsequent to Acquisition | Gross Balance at December 31, 2010 | ||||||||||||||||||||||||||||||||||||||||
Description | Encumbrances | Land | Building & Improvements | Improvements | Carrying Costs | Land | Building & Improvements | Total | Accumulated Depreciation | Depreciable Life in Years | Date of Construction | Date Acquired | ||||||||||||||||||||||||||||||
Commerical | ||||||||||||||||||||||||||||||||||||||||||
Commercial building, Tokyo, Japan | $ | 2,784,000 | $ | 3,970,000 | $ | 3,230,000 | $ | 2,080,000 | $ | — | $ | 5,065,000 | $ | 4,215,000 | $ | 9,280,000 | $ | (389,000 | ) | 37 yrs | 2007 | 2008 | ||||||||||||||||||||
Commercial building, Carlsbad, CA | — | 495,000 | 257,000 | — | — | 495,000 | 257,000 | 752,000 | — | 37 yrs | 1983 | 2010 | ||||||||||||||||||||||||||||||
Multifamily | ||||||||||||||||||||||||||||||||||||||||||
204-unit Apartment building, Lompoc, CA | 17,497,000 | 5,329,000 | 20,150,000 | 301,000 | — | 5,329,000 | 20,451,000 | 25,780,000 | (3,387,000 | ) | 39 yrs | 1986 | 2008 | |||||||||||||||||||||||||||||
Residential | ||||||||||||||||||||||||||||||||||||||||||
Single family home, Kona, Hi | — | 4,111,000 | 4,250,000 | 363,000 | — | 4,474,000 | 4,250,000 | 8,724,000 | (226,000 | ) | 39 yrs | 2008 | 2008 | |||||||||||||||||||||||||||||
Condominium unit, Seattle, Wa | — | — | 500,000 | — | — | 500,000 | 500,000 | — | 2007 | 2010 | ||||||||||||||||||||||||||||||||
Land | ||||||||||||||||||||||||||||||||||||||||||
Single family home lot, Kona, Hi | 4,250,000 | 4,101,000 | — | — | — | 4,101,000 | — | 4,101,000 | — | N/A | N/A | 2010 | ||||||||||||||||||||||||||||||
2700 acres, Oahu, Hi | — | 31,741,000 | 3,753,000 | 431,000 | — | 32,060,000 | 4,665,000 | 36,725,000 | (4,000 | ) | N/A | 1912 | 2010 | |||||||||||||||||||||||||||||
Land, Kent, WA | — | 733,000 | 112,000 | — | 845,000 | 845,000 | — | N/A | N/A | 2008 | ||||||||||||||||||||||||||||||||
$ | 24,531,000 | $ | 50,480,000 | $ | 32,140,000 | $ | 3,287,000 | $ | — | $ | 52,369,000 | $ | 34,338,000 | $ | 86,707,000 | $ | (4,006,000 | ) | ||||||||||||||||||||||||
See accompanying report of independent registered public accounting firm.
70
Kennedy-Wilson Holdings, Inc. and Subsidiaries
Schedule III—Real Estate and Accumulated Depreciation
December 31, 2010, 2009, and 2008
(Dollars in thousands)
Changes in real estate for the years ended December 31 were as follows:
For the year ended December 31, | ||||||||
2010 | 2009 | |||||||
Balance at the beginning of period | $ | 46,123,000 | $ | 50,883,000 | ||||
Additions during the period: | ||||||||
Improvements | — | 111,000 | ||||||
Acquisitions | 52,228,000 | 35,689,000 | ||||||
Deductions during the period: | ||||||||
Dispositions | (11,644,000 | ) | (40,560,000 | ) | ||||
Balance at close of period | $ | 86,707,000 | $ | 46,123,000 | ||||
Changes in accumulated depreciation for the years ended December 31 were as follows:
For the year ended December 31, | ||||||||||||
2010 | 2009 | 2008 | ||||||||||
Balance at the beginning of period | $ | 3,070,000 | $ | 2,156,000 | $ | 18,000 | ||||||
Additions during the period: | ||||||||||||
Depreciation expense | 1,339,000 | 914,000 | 664,000 | |||||||||
Deductions during the period: | ||||||||||||
Dispositions | (403,000 | ) | — | 1,474,000 | ||||||||
Balance at close of period | $ | 4,006,000 | $ | 3,070,000 | $ | 2,156,000 | ||||||
See accompanying report of independent registered public accounting firm.
71
Report of Independent Registered Public Accounting Firm
The Members
KW Residential, LLC:
We have audited the accompanying consolidated balance sheet of KW Residential, LLC and subsidiaries as of December 31, 2010, and the related consolidated statements of operations and comprehensive income, members' equity, and cash flows for the year then ended. These consolidated financial statements are the responsibility of the Company's management. Our responsibility is to express an opinion on these consolidated financial statements based on our audit.
We conducted our audit in accordance with the standards of the Public Company Accounting Oversight Board (United States). Those standards require that we plan and perform the audit to obtain reasonable assurance about whether the financial statements are free of material misstatement. The Company is not required to have, nor were we engaged to perform, an audit of its internal control over financial reporting. Our audit included consideration of internal control over financial reporting as a basis for designing audit procedures that are appropriate in the circumstances, but not for the purpose of expressing an opinion on the effectiveness of the Company's internal control over financial reporting. Accordingly, we express no such opinion. An audit also includes examining, on a test basis, evidence supporting the amounts and disclosures in the financial statements, assessing the accounting principles used and significant estimates made by management, as well as evaluating the overall financial statement presentation. We believe that our audit provides a reasonable basis for our opinion.
In our opinion, the consolidated financial statements referred to above present fairly, in all material respects, the financial position of KW Residential, LLC and subsidiaries as of December 31, 2010, and the results of their operations and their cash flows for the year then ended in conformity with U.S. generally accepted accounting principles.
/s/ KPMG AZSA LLC
Tokyo, Japan
March 11, 2011
72
Report of Independent Registered Public Accounting Firm
The Members
KW Residential, LLC:
We have audited the accompanying consolidated balance sheet of KW Residential LLC (a Delaware corporation) and subsidiaries, as of December 31, 2009, and the related consolidated statements of operations and comprehensive income, members' equity, and cash flows for each of the two years in the period ended December 31, 2009. These financial statements are the responsibility of the Company's management. Our responsibility is to express an opinion on these financial statements based on our audit.
We conducted our audit in accordance with the standards of the Public Company Accounting Oversight Board (United States). Those standards require that we plan and perform the audit to obtain reasonable assurance about whether the financial statements are free of material misstatement. The Company is not required to have, nor were we engaged to perform, an audit of its internal control over financial reporting. Our audit included consideration of internal control over financial reporting as a basis for designing audit procedures that are appropriate in the circumstances, but not for the purpose of expressing an opinion on the effectiveness of the Company's internal control over financial reporting. Accordingly, we express no such opinion. An audit also includes examining, on a test basis, evidence supporting the amounts and disclosures in the financial statements, assessing the accounting principles used and significant estimates made by management, as well as evaluating the overall financial statement presentation. We believe that our audit provide a reasonable basis for our opinion.
In our opinion, the consolidated financial statements referred to above present fairly, in all material respects, the financial position of KW Residential LLC and subsidiaries as of December 31, 2009, and the results of their operations and their cash flows for each of the two years in the period ended December 31, 2009 in conformity with accounting principles generally accepted in the United States of America.
/s/ GRANT THORNTON TAIYO ASG
Tokyo, Japan
March 13, 2010
73
KW Residential, LLC and Subsidiaries
Consolidated Balance Sheets
December 31, 2010 and 2009
December 31, | ||||||||
2010 | 2009 | |||||||
Assets | ||||||||
Rental property, net | $ | 609,430,001 | $ | 548,926,545 | ||||
Cash and cash equivalents | 5,216,811 | 14,491,228 | ||||||
Restricted cash | 21,575,193 | 17,851,677 | ||||||
Accounts receivable | 869,823 | 358,553 | ||||||
Other assets | 9,700,612 | 12,607,394 | ||||||
Total assets | $ | 646,792,440 | $ | 594,235,397 | ||||
Liabilities and members' equity | ||||||||
Liabilities | ||||||||
Accounts payable and accrued expenses | 7,204,729 | 7,357,935 | ||||||
Refundable tenant deposits | 4,239,973 | 3,939,294 | ||||||
Debt and borrowings | 338,227,939 | 307,877,381 | ||||||
Derivative liability | 6,609,056 | — | ||||||
Income tax payable | 381,691 | 73,292 | ||||||
Other liabilities | 21,877 | 247,667 | ||||||
Total liabilities | 356,685,265 | 319,495,569 | ||||||
Commitments and contingencies | ||||||||
Members' equity | ||||||||
Contributed capital | 225,001,154 | 233,616,132 | ||||||
Accumulated surplus | 7,554,192 | 12,040,418 | ||||||
Accumulated other comprehensive income | 57,551,829 | 29,083,278 | ||||||
Total members' equity | 290,107,175 | 274,739,828 | ||||||
Total liabilities and members' equity | $ | 646,792,440 | $ | 594,235,397 | ||||
The accompanying notes are an integral part of these consolidated financial statements.
74
KW Residential, LLC and Subsidiaries
Consolidated Statements of Operations and Comprehensive Income
Years Ended December 31, 2010, 2009 and 2008
Year ended December 31 | ||||||||||||
2010 | 2009 | 2008 | ||||||||||
Revenue | ||||||||||||
Rental income | $ | 34,515,674 | $ | 32,634,808 | $ | 28,278,928 | ||||||
Management fees | 268,381 | 115,318 | 43,831 | |||||||||
Total revenue | 34,784,055 | 32,750,126 | 28,322,759 | |||||||||
Operating Expenses | ||||||||||||
Property expenses | 10,387,147 | 8,543,655 | 7,694,554 | |||||||||
Compensation and related expenses | 2,943,106 | 2,736,620 | 2,453,719 | |||||||||
General and administrative expenses | 2,202,892 | 2,132,458 | 2,621,865 | |||||||||
Depreciation and amortization | 11,115,370 | 12,020,989 | 5,413,136 | |||||||||
Total operating expenses | 26,648,515 | 25,433,722 | 18,183,274 | |||||||||
Total operating income | 8,135,540 | 7,316,404 | 10,139,485 | |||||||||
Non-operating income (expense) | ||||||||||||
Interest expense | (12,234,711 | ) | (14,828,431 | ) | (12,936,440 | ) | ||||||
Gains on extinguishment of debt | — | 28,319,523 | — | |||||||||
Other | 270,432 | (3,984,175 | ) | (897,904 | ) | |||||||
Income (loss) before provision (benefit) for income taxes | (3,828,739 | ) | 16,823,321 | (3,694,859 | ) | |||||||
Provision (benefit) for income taxes | 657,487 | (36,694 | ) | 376,027 | ||||||||
Net income (loss) | (4,486,226 | ) | 16,860,015 | (4,070,886 | ) | |||||||
Other comprehensive income (loss) | ||||||||||||
Foreign currency translation gain (loss) | 35,077,607 | (4,488,486 | ) | 32,600,961 | ||||||||
Forward foreign currency loss | (6,609,056 | ) | — | — | ||||||||
28,468,551 | (4,488,486 | ) | 32,600,961 | |||||||||
Total comprehensive income | $ | 23,982,325 | $ | 12,371,529 | $ | 28,530,075 | ||||||
The accompanying notes are an integral part of these consolidated financial statements.
75
KW Residential, LLC and Subsidiaries
Consolidated Statement of Members' Equity
For the three years ended December 31, 2010
Contributed Capital | Accumulated Surplus (Deficit) | Accumulated Other Comprehensive Income | Total | |||||||||||||
Balance, January 1, 2008 | $ | 37,593,058 | $ | (748,711 | ) | $ | 970,803 | $ | 37,815,150 | |||||||
Capital contributions | 140,439,095 | — | — | 140,439,095 | ||||||||||||
Foreign currency translation gain | — | — | 32,600,961 | 32,600,961 | ||||||||||||
Net loss | — | (4,070,886 | ) | — | (4,070,886 | ) | ||||||||||
Balance, December 31, 2008 | 178,032,153 | (4,819,597 | ) | 33,571,764 | 206,784,320 | |||||||||||
Capital contributions | 55,583,979 | — | — | 55,583,979 | ||||||||||||
Foreign currency translation loss | — | — | (4,488,486 | ) | (4,488,486 | ) | ||||||||||
Net income | — | 16,860,015 | — | 16,860,015 | ||||||||||||
Balance, December 31, 2009 | 233,616,132 | 12,040,418 | 29,083,278 | 274,739,828 | ||||||||||||
Capital distributions | (8,614,978 | ) | — | — | (8,614,978 | ) | ||||||||||
Foreign currency translation gain | — | — | 35,077,607 | 35,077,607 | ||||||||||||
Forward foreign currency loss | — | — | (6,609,056 | ) | (6,609,056 | ) | ||||||||||
Net loss | — | (4,486,226 | ) | — | (4,486,226 | ) | ||||||||||
Balance, December 31, 2010 | $ | 225,001,154 | $ | 7,554,192 | $ | 57,551,829 | $ | 290,107,175 | ||||||||
The accompanying notes are an integral part of these consolidated financial statements.
76
KW Residential, LLC and Subsidiaries
Consolidated Statements of Cash Flows
Year ended December 31, | ||||||||||||
2010 | 2009 | 2008 | ||||||||||
Cash flows from operating activities: | ||||||||||||
Net (loss) income | $ | (4,486,226 | ) | $ | 16,860,015 | $ | (4,070,886 | ) | ||||
Adjustments to reconcile net (loss) income to net cash provided by (used in) operating activities: | ||||||||||||
Depreciation and amortization | 11,115,370 | 12,020,989 | 5,413,136 | |||||||||
Amortization of loan related costs | 4,308,948 | 5,131,237 | 1,716,307 | |||||||||
Gains on extinguishment of debt | — | (28,319,523 | ) | — | ||||||||
Losses on transfer to rental properties from held for sale | — | 3,009,702 | — | |||||||||
Purchases of real estate held for sale | — | — | (24,471,106 | ) | ||||||||
Change in assets and liabilities: | ||||||||||||
Accounts receivable | 336,953 | (106,930 | ) | (72,914 | ) | |||||||
Other assets | (1,531,508 | ) | 3,376,906 | (1,643,520 | ) | |||||||
Accounts payable and accrued expenses | (1,079,238 | ) | 1,557,978 | (2,072,233 | ) | |||||||
Other liabilities | 47,820 | (2,149,564 | ) | 1,403,606 | ||||||||
Net cash flow provided (used in) by operating activities | 8,712,119 | 11,380,810 | (23,797,610 | ) | ||||||||
Cash flows from investing activities: | ||||||||||||
Payments for purchases of property and equipment | (423,673 | ) | (133,118 | ) | — | |||||||
Collateral payments for derivative instruments | (1,149,788 | ) | — | — | ||||||||
Net cash flow (used in) provided by investing activities | (1,573,461 | ) | (133,118 | ) | — | |||||||
Cash flow from financing activities: | ||||||||||||
Debt and borrowings | — | 75,810,977 | 242,127,664 | |||||||||
Repayment of debt | (9,506,436 | ) | (136,868,701 | ) | (348,547,327 | ) | ||||||
Capital contributions | — | 55,583,979 | 140,439,095 | |||||||||
Capital distribution | (8,614,978 | ) | — | — | ||||||||
Loan related costs | (178,419 | ) | (1,570,986 | ) | (5,424,553 | ) | ||||||
Net cash flow (used in) provided by financing activities | (18,299,833 | ) | (7,044,731 | ) | 28,594,879 | |||||||
Effect of exchange rate changes on cash and cash equivalents | 1,886,758 | (236,551 | ) | 1,170,313 | ||||||||
Net change in cash and cash equivalents | (9,274,417 | ) | 3,966,410 | 5,967,582 | ||||||||
Cash and cash equivalents, beginning of year | 14,491,228 | 10,524,818 | 4,557,236 | |||||||||
Cash and cash equivalents, end of year | $ | 5,216,811 | $ | 14,491,228 | $ | 10,524,818 | ||||||
Supplemental disclosure of cash paid for during the year: | ||||||||||||
Interest | $ | 8,021,813 | $ | 9,535,128 | $ | 10,113,179 | ||||||
Income tax | 93,721 | 486,713 | 1,012,938 | |||||||||
Supplemental disclosure of non-cash transfers of real estate from held for sale to rental property | $ | — | $ | 25,156,431 | $ | 313,557,739 | ||||||
The accompanying notes are an integral part of these consolidated financial statements.
77
KW Residential, LLC and Subsidiaries
Notes to Consolidated Financial Statements
December 31, 2010, 2009 and 2008
NOTE 1-ORGANIZATION
KW Residential, LLC, a Delaware limited liability company (the "Company"), was formed in August 2005 to acquire, operate, improve, and dispose of real estate assets. The Company was established with two members (1) Kennedy Wilson Overseas, Inc. and (2) Wachovia KW2, LLC. that held a 35% and 65% membership interest, respectively. In September 2010, KWF Real Estate Venture I, LP acquired the 65% membership interest from Wachovia KW2, LLC. KWF Real Estate Venture I, LP is a Delaware registered limited partnership and is jointly owned by subsidiaries of Kennedy-Wilson Holdings, Inc. (10%) and Fairfax Financial Holdings Limited and affiliates (90%). The Company conducts its business through its Japanese subsidiaries, namely KW Investment Co. Ltd (“KWI”) and KIWI, KIWI 1, KIWI 2, KIWI 3, KIWI 4, KIWI 5, KIWI 6 and KIWI 7 (the "KIWI Entities"). The Company's investments include a portfolio of multifamily real estate properties that are held through the KIWI Entities comprising approximately 2,400 units in 50 properties, located primarily in Tokyo and surrounding areas. The Company, through KWI, also provides real estate services in Japan, including asset management and brokerage services to its own portfolio as well as to institutional investors, developers, and financial institutions.
NOTE 2-SUMMARY OF SIGNIFICANT ACCOUNTING POLICIES
BASIS OF CONSOLIDATION-The consolidated financial statements include the accounts of the Company and its wholly owned subsidiaries. All intercompany balances and transactions have been eliminated in consolidation. In addition, management evaluates the Company's relationships with other entities to identify whether they are variable interest entities and to assess whether it is the primary beneficiary of such entities. If the determination is made that the Company is the primary beneficiary, then that entity is included in the consolidated financial statements.
Certain subsidiaries use different fiscal year-ends from the Company's fiscal year-end of December 31. Material differences in intercompany transactions and accounts arising from the use of the different fiscal year-ends are adjusted in consolidation.
OPERATING CURRENCY-The functional currency of the Company is the U.S. dollar. The functional currency of the Company's wholly owned subsidiaries is the Japanese yen. The financial statements of the subsidiaries are translated into U.S. dollars by translating assets and liabilities at the closing exchange rate on the balance sheet date with translation adjustments reported directly in members' equity and income statement items at average exchange rates during the year. Individually material income and expense transactions are translated using the closing exchange rate in effect on the date the transaction is recognized.
USE OF ESTIMATES-The preparation of the accompanying consolidated financial statements in conformity with accounting principles generally accepted in the United States of America ("U.S. GAAP") requires management to make estimates and assumptions about future events. These estimates and the underlying assumptions affect the amounts of assets and liabilities reported, disclosure about contingent assets and liabilities, and reported amounts of revenues and expenses. Management evaluates its assumptions on an ongoing basis using historical experience and other factors, including the current economic environment, which management believes to be reasonable under the circumstances. Management adjusts such estimates and assumptions when facts and circumstances dictate. As future events and their effects cannot be determined with precision, actual results could differ significantly from these estimates. Changes in those estimates resulting from continuing changes in the economic environment will be reflected in the financial statements in future periods.
REVENUE RECOGNITION-Rental income from residents is recognized on a straight-line basis over the expected term of the leasing period, including any rent free months, which typically is two years. Up front payments received, such as “key money” are deferred and recognized over the expected lease period. Rental agreements are cancelable, by tenant, on one-month notice.
CASH AND CASH EQUIVALENTS-Cash and cash equivalents consist of cash and all highly liquid investments purchased with initial maturities of three months or less. The Company maintains cash balances in excess of governmentally insured limits of 10 million yen that is equivalent to $123,000 as of December 31, 2010. Cash and cash equivalents are placed with financial institutions that management believes are of high credit quality.
RESTRICTED CASH-Restricted cash consists of cash and cash equivalents that are restricted as to withdrawal or usage under the terms of certain contractual agreements.
During the ordinary course of business, the KIWI entities set up various trust accounts to manage their cash receipts and disbursements. As part of the trust agreements, these trusts are required to withhold the cash receipts and make the necessary disbursements before any surplus cash is made available to the KIWI Entities after a holding period of 3 months. In addition, these trusts also made disbursements to restricted cash accounts maintained with certain banks to meet the debt and borrowings obligations.
As of December 31, 2010, these trusts held cash of $11,768,091 that are restricted and not available for the KIWI Entities'
78
KW Residential, LLC and Subsidiaries
Notes to Consolidated Financial Statements
December 31, 2010, 2009 and 2008
withdrawal or usage. These restricted cash will be available for their withdrawal or usage gradually over a period not exceeding three months. In addition, as of December 31, 2010, the restricted cash accounts maintained with certain banks had a balance of $9,807,102. Surpluses, if any, arising after meeting the debt and borrowings obligations will be made available for the KIWI Entities' withdrawal or usage.
ACCOUNTS RECEIVABLE-Accounts receivable due from tenants are recorded at the contractual amount as determined by the lease agreements with tenants and do not bear interest. The allowance for doubtful accounts is management's best estimate of the amount of probable credit losses in the Company's existing accounts receivable. Management determines the allowance based on historical experience. Management reviews its allowance for doubtful accounts on a quarterly basis. Account balances are charged off against the allowance after all means of collection have been exhausted and the potential for recovery is considered remote.
RENTAL PROPERTY- Land, building and structures, and machinery and equipment are carried at cost. Major maintenance and improvements are capitalized with minor replacements, maintenance and repairs charged to current operations in the periods incurred. Depreciation is computed on the straight-line method over the following estimated useful lives of the assets:
Buildings | 31 | to | 46 years | ||
Short-lived structures and others | 2 | to | 19 years | ||
Machinery and equipment | 2 | to | 14 years |
During 2009, certain rental property was reclassified from held for sale into held for use. The rental property was transferred into held for use at the lower of carrying amount or fair value less costs to sell. Upon transferring the rental property, the Company recorded an impairment loss of $3,009,702 for the year ended December 31, 2009 that is included in other expenses in the accompanying statements of operations and comprehensive income.
LONG-LIVED ASSETS-Management reviews its long-lived assets whenever events or changes in circumstances indicate that the carrying amount of an asset may not be recoverable. Recoverability of assets to be held and used is measured by a comparison of the carrying amount of the asset, or the asset group, to estimated undiscounted future cash flows expected to be generated by the asset. The determination of undiscounted future cash flows requires significant estimates made by management and considers the most likely expected course of action at the balance sheet date. Subsequent changes in estimated undiscounted cash flows arising from changes in anticipated actions could affect the determination of whether impairment exists. If the carrying amount of an asset exceeds its estimated future cash flows, an impairment charge is recognized in the amount by which the carrying amount of the asset exceeds the estimated fair value of the asset. Assets to be disposed of are separately presented in the balance sheet and reported at the lower of the carrying amount or estimated fair value less costs to sell, and are no longer depreciated. The assets and liabilities of a disposal group classified as held for sale are presented separately in the appropriate asset and liability sections of the consolidated balance sheet.
During 2010 management performed impairment analysis on several properties due to deemed triggering events. Based on management's analysis, including assumptions about the length of the holding period until disposed, the estimated selling price and the current projected operating performance of the properties, management has concluded that no impairment of rental property existed as of December 31, 2010.
INCOME TAXES-Income taxes are accounted for under the asset and liability method. Deferred tax assets and liabilities are recognized for the future tax consequences attributable to differences between the financial statement carrying amounts of existing assets and liabilities and their respective tax basis and operating loss and tax credit carryforwards. Deferred tax assets and liabilities are measured using enacted tax rates expected to apply to taxable income in the years in which those temporary differences are expected to be recovered or settled. The effect on deferred tax assets and liabilities of a change in tax rates is recognized in income in the period that includes the enactment date. The Company recognizes the effect of income tax positions only if those positions are more likely than not of being sustained. Recognized income tax positions are measured at the largest amount that is greater than 50% likely of being realized. Changes in recognition or measurement are reflected in the period in which the change in judgment occurs. As of December 31, 2010, the Company has determined that there are no uncertain tax positions that would have a material impact on the Company's financial position or results of operations. Management of the Company does not expect material changes in uncertain tax positions within the next twelve months. As of December 31, 2010, the tax years 2005 through 2009 remain open for potential tax examination. The interest and penalties of back taxes arising from tax examinations are recognized as income tax expense.
FAIR VALUE MEASUREMENTS-The Company utilizes valuation techniques that maximize the use of observable
79
KW Residential, LLC and Subsidiaries
Notes to Consolidated Financial Statements
December 31, 2010, 2009 and 2008
inputs and minimize the use of unobservable inputs to the extent possible. The Company determines fair value based on assumptions that market participants would use in pricing an asset or liability in the principal or most advantageous market. When considering market participant assumptions in fair value measurements, the following fair value hierarchy distinguishes between observable and unobservable inputs, which are categorized in one of the following levels:
Level 1 - Unadjusted quoted prices in an active market for identical unrestricted assets and liabilities that the reporting entity has the ability to access at the measurement date.
Level 2 - Inputs other than quoted prices included in Level 1 that are observable for the asset or liability or can be corroborated with observable market data for substantially the entire contractual term of the asset or liability.
Level 3 - Unobservable inputs that reflect the entity's own assumptions about the assumption market participants would use in the pricing of the asset or liability and are consequently not based on market activity but rather through particular valuation techniques.
DERIVATIVE FINANCIAL INSTRUMENTS-The Company recognizes all derivative instruments as either assets or liabilities in the balance sheet at their respective fair values. For derivatives designated in hedging relationships, changes in the fair value are recognized in accumulated other comprehensive income, to the extent the derivative is effective at offsetting the changes in the item being hedged until the hedged item affects earnings.
For all hedging relationships, the Company formally documents the hedging relationship and its risk-management objective and strategy for undertaking the hedge, the hedging instrument, the hedged transaction, the nature of the risk being hedged, how the hedging instrument's effectiveness in offsetting the hedged risk will be assessed prospectively and retrospectively, and a description of the method used to measure ineffectiveness. Management also formally assesses, both at the inception of the hedging relationship and on an ongoing basis, whether the derivatives are highly effective. Gains and losses on the derivative representing either hedge ineffectiveness or hedge components excluded from the assessment of effectiveness are recognized in current earnings.
The Company discontinues hedge accounting prospectively when it determines that the derivative is no longer effective in offsetting cash flows attributable to the hedged risk, the derivative expires or is sold, terminated, or exercised, the cash flow hedge is dedesignated because a forecasted transaction is not probable of occurring, or management determines to remove the designation of the cash flow hedge.
In all situations in which hedge accounting is discontinued and the derivative remains outstanding, the Company continues to carry the derivative at its fair value on the balance sheet and recognizes any subsequent changes in its fair value in earnings. When it is probable that a forecasted transaction will not occur, the Company discontinues hedge accounting and recognizes immediately in earnings gains and losses that were accumulated in other comprehensive income related to the hedging relationship.
For derivative instruments that are not designated as a hedging instrument, the Company records changes in fair value in statements of operations and comprehensive income in the period that they occur.
DEFERRED FINANCING COSTS-The Company recognizes debt issuance costs on the balance sheet as deferred charges included in other assets and amortizes the balance over the term of the related debt. The Company classifies cash payments for debt issue costs as a financing activity in the consolidated statements of cash flows.
CORRECTION OF IMMATERIAL ERRORS-The 2009 statement of cash flow has been corrected to classify $13.9 million previously classified as cash and cash equivalents and $3.9 million previously classified as other assets as restricted cash. The impact of this correction on the statement of cash flows is that cash provided by operating activities for 2009 increased by $1.4 million, beginning cash and cash equivalents decreased by $15.6 million, and ending cash and cash equivalents decreased by $13.9 million. In addition, the impact of this correction on the 2008 statement of cash flows is that cash used in operating activities for 2008 increased by $6.1 million, beginning cash and cash equivalents decreased by $6.6 million, and ending cash and cash equivalents decreased by $15.6 million.
NOTE 3-EXTINGUISHMENT OF DEBT
The Company negotiated a discounted settlement of a note payable to Deutsche Bank due in May 2009 with an outstanding balance of $16,512,992. The discounted settlement resulted in a net gain from forgiveness of debt in the amount of $5,631,734 for the year ended December 31, 2009.
The Company negotiated a discounted settlement of a note payable to Morgan Stanley due in August 2010 in the amount of $114,628,821. The discounted settlement resulted in a net gain from forgiveness of debt in the amount of $22,687,789 for the year
80
KW Residential, LLC and Subsidiaries
Notes to Consolidated Financial Statements
December 31, 2010, 2009 and 2008
ended December 31, 2009.
NOTE 4-RENTAL PROPERTY
The composition of rental property consisted of the following as of December 31:
2010 | 2009 | |||||||
Land | $ | 313,124,204 | $ | 273,764,235 | ||||
Buildings and structures | 324,441,661 | 290,020,861 | ||||||
Machinery and equipment and other | 6,037,300 | 5,294,186 | ||||||
Less accumulated depreciation | (34,173,164 | ) | (20,152,737 | ) | ||||
Rental property, net | $ | 609,430,001 | $ | 548,926,545 | ||||
Depreciation and amortization expense for rental property for the years ended December 31, 2010, 2009 and 2008 was $11,115,370, $12,020,989 and $5,413,136, respectively.
NOTE 5-FAIR VALUE MEASUREMENTS
The Company has financial instruments that are measured at fair value on a recurring basis. The Company previously used interest rate cap instruments to manage fluctuations in interest rates. On September 3, 2010, in order to manage currency fluctuations between the Company's functional currency ( U.S. dollar) and its wholly-owned subsidiaries' functional currency (Japanese yen), the Company entered into a forward foreign currency contract to hedge a portion of its net investment in its wholly owned subsidiaries.
The Company's interest rate caps are valued based on the net present value of expected future cash flows as determined by the counter-party and the forward foreign currency contract is valued based on the difference between the contract rate and the forward rate of the yen at maturity applied to the notional value in yen discounted at a market rate for similar risks. The Company has determined that based on an evaluation of the significance of each of the inputs used to value these instruments that they are considered level 2 in their entirety.
The fair values of derivative instruments held as of December 31, 2010 and 2009:
Asset derivatives | ||||||||
2010 | 2009 | |||||||
B/S Location | Fair value | B/S Location | Fair value | |||||
Interest rate contracts | Other assets | $ | 117,360 | Other assets | $ | 351,168 | ||
Liability derivatives | ||||||||
2010 | 2009 | |||||||
B/S Location | Fair value | B/S Location | Fair value | |||||
Forward foreign exchange contract | Derivative liability | $ | 6,609,056 | — | ||||
As of December 31, 2010 the forward foreign exchange contract outstanding was:
Counterparty | Currency | Buy/Sell | Settlement date | In exchange for | Fair value | Unrealized gain (loss) | ||||||||||
Deutsche Bank | 10 billion yen | Sell | 9/9/2013 | $121.1 million | $ | (6,609,056 | ) | $ | (6,609,056 | ) | ||||||
The Company's loss of $6,609,056 on the forward foreign currency contract is included in other comprehensive income in the accompanying consolidated statements of operations and comprehensive income as the forward foreign currency contract qualifies as a hedging instrument designated in a hedging relationship under ASC Topic 815. The interest rate cap contracts do not qualify as designated hedging instruments under ASC Topic 815 and accordingly, for the gains (losses) on those interest rate cap contracts, the Company recorded $(272,964), $239,251, and $656,798 in other non-operating income (expense) in the
81
KW Residential, LLC and Subsidiaries
Notes to Consolidated Financial Statements
December 31, 2010, 2009 and 2008
accompanying consolidated statements of operations and comprehensive income for the years ended December 31, 2010, 2009, and 2008, respectively.
NOTE 7-OTHER ASSETS
The composition of other assets consisted of the following as of December 31:
2010 | 2009 | |||||||
Deposits for rented office | $ | 336,991 | $ | 305,391 | ||||
Consumption tax receivables | 1,865,937 | 768,711 | ||||||
Deferred tax assets | 302,191 | 511,709 | ||||||
Deferred loan costs | 3,733,144 | 8,668,367 | ||||||
Derivative assets | 117,360 | 351,168 | ||||||
Cash collateral placed for derivatives | 1,149,788 | — | ||||||
Other | 2,195,201 | 2,002,048 | ||||||
Total | $ | 9,700,612 | $ | 12,607,394 | ||||
NOTE 8-DEBT AND BORROWINGS
Debt and borrowings were incurred in connection with refinancing of rental property currently in use, and includes the following as of December 31:
2010 | 2009 | |||||||
Secured bond representing obligations to banks, due 2011 on lump sum payment with interest rate of 6 months TIBOR (rate 0.45% as of December 31, 2010) plus 0.30% per annum | $ | 36,814,333 | $ | 32,573,290 | ||||
Secured bond representing obligations to banks, due April 2011 lump-sum payment with interest rate of 3 months TIBOR (rate of 0.34% as of December 31, 2010) plus 1.64% per annum | 49,231,336 | 47,226,884 | ||||||
Secured bond representing obligations to banks, due August 2011 on lump-sum payment with interest rate of TIBOR (rate of 0.34% as of December 31, 2010) plus 1.79% per annum | 76,835,785 | 67,984,236 | ||||||
Secured loan representing obligations to bank, due May 2011 on lump-sum payment with interest rate of TIBOR (rate of 0.34% as of December 31, 2010) plus 0.65% per annum | 20,386,641 | 19,476,343 | ||||||
Secured loan representing obligations to financial institution, due May 2011 on lump-sum payment with interest rate of (rate of 0.34% as of December 31, 2010) plus 4.50% per annum | 11,270,004 | 10,103,827 | ||||||
Secured loan representing obligations to bank, due September 2011 on lump-sum payment with interest rate of TIBOR (rate 0.34% as of December 31, 2010) plus 0.80% per annum | 34,360,044 | 30,401,737 | ||||||
Secured loan representing obligations to financial institution, September 2011 on lump-sum payment with interest rate of TIBOR (rate of 0.34% as of December 31, 2010) plus 6.00% annum | 25,003,068 | 23,534,202 | ||||||
Secured bond representing obligations to banks, due March 2012 on lump-sum payment with interest rate of TIBOR (rate of 0.34% as of December 31, 2010) plus 2.99% per annum | 11,802,491 | 11,566,004 | ||||||
Secured bond representing obligations to banks, due August 2014 on lump-sum payment with fixed interest rate of 3% per annum | 5,368,758 | 5,293,160 | ||||||
Secured bond representing obligations to banks, due 2014 on lump-sum payment with interest rate of TIBOR (rate of 0.34% as of December 31, 2010) plus 2.99% per annum | 67,155,479 | 59,717,698 | ||||||
Total | $ | 338,227,939 | $ | 307,877,381 | ||||
82
KW Residential, LLC and Subsidiaries
Notes to Consolidated Financial Statements
December 31, 2010, 2009 and 2008
As of December 31, 2010, certain rental property, with a net book value of $605,610,974, was pledged as collateral for certain debt obligations.
The aggregate amounts of annual maturities of long-term debt as of December 31, 2010 are as follows:
2011 | $ | 255,189,713 | ||
2012 | 13,090,993 | |||
2013 | 1,288,502 | |||
2014 | 68,658,731 | |||
Total | $ | 338,227,939 | ||
The debt and borrowing arrangements were entered into by certain of the Company's subsidiaries for the financing of rental property and include certain covenants with which the respective subsidiaries are required to be in compliance. Key covenants included ensuring that the respective outstanding loans do not exceed a certain percentage (ranging from 63 percent to 89 percent) of the fair value of the respective rental properties (LTV). In addition, these subsidiaries are required to generate sufficient operating cash flows to meet its loan obligations. This is commonly referred to as debt service coverage ratios (DSCR) and the respective subsidiaries are required to maintain DSCR of at least 1.25 to 1.75 to be in compliance with the loan covenants.
The respective subsidiaries were in compliance with all applicable covenants as of December 31, 2010 and 2009.
The respective subsidiaries intend to refinance those debt and borrowings that will be due in 2011, and are currently in the process of negotiation with various banks. Management does not expect any material difficulties in the finalization of those refinancing negotiations.
NOTE 9-INCOME TAXES
Provision (benefit) for income taxes for the years ended December 31, 2010, 2009 and 2008 consists of following:
2010 | 2009 | 2008 | ||||||||||
Current | $ | 387,830 | $ | 107,474 | $ | 398,495 | ||||||
Deferred | 269,657 | (144,168 | ) | (22,468 | ) | |||||||
Total | $ | 657,487 | $ | (36,694 | ) | $ | 376,027 | |||||
Other than the income tax obligations in Japan as explained below, the Company has no other foreign tax obligations. For U.S. federal tax purposes, KW Residential, LLC is considered to be a pass-through entity and all applicable U.S. taxes are the responsibility of the members. In addition, most of KIWI Entities are exempt from Japanese income taxes based on a permitted structure under Japanese tax legislation. Accordingly, the taxes recorded in these financial statements relate to the income taxes of certain Japanese subsidiaries applicable in Japan.
The significant components of deferred tax assets and liabilities as of December 31 are as follows:
83
KW Residential, LLC and Subsidiaries
Notes to Consolidated Financial Statements
December 31, 2010, 2009 and 2008
2010 | 2009 | |||||||
Deferred tax assets: | ||||||||
Tax loss carryforwards | $ | 1,845,522 | $ | 13,937,621 | ||||
Accrued enterprise taxes | 26,848 | — | ||||||
Accrued expenses | 30,559 | 105,855 | ||||||
Depreciation | 211,642 | 46,169 | ||||||
Allowance for paid vacation | 30,624 | — | ||||||
Other | 6,418 | 7,460 | ||||||
Gross deferred tax assets | 2,151,613 | 14,100,105 | ||||||
Less: Valuation allowance | (1,845,522 | ) | (13,576,713 | ) | ||||
Total deferred tax assets | 306,091 | 523,392 | ||||||
Deferred tax liabilities: | ||||||||
Total deferred liabilities | (3,900 | ) | (11,683 | ) | ||||
Net deferred tax assets | $ | 302,191 | $ | 511,709 | ||||
Management has provided a valuation allowance against deferred tax assets as of December 31, 2010 and 2009, to reduce tax assets to management's estimate of the amount more likely than not to be realized due to the uncertainty of the timing of realization. The total valuation allowance for the year ended December 31, 2010 decreased by $11,731,191 and the year ended December 31, 2009 increased by $11,469,342.
Income taxes in Japan applicable to the Company are imposed by the national, prefectural and municipal governments, and in the aggregate resulted in a normal effective statutory rate of approximately 41% for the years ended December 31, 2010, 2009 and 2008. A reconciliation of the effective income tax rate reflected in the accompanying consolidated statements of income to the combined normal effective statutory tax rate for the years ended December 31, 2010, 2009 and 2008 is as follows:
2010 | 2009 | 2008 | |||||||
Effective statutory tax rate | (40.69 | )% | 40.69 | % | (40.69 | )% | |||
Nondeductible expenses | 3.04 | 0.03 | 3.94 | ||||||
Losses/(income) on tax exempted entities | 62.07 | — | — | ||||||
Change in valuation allowances | (10.83 | ) | (42.98 | ) | 46.98 | ||||
Per capita tax | 0.24 | 0.39 | 1.02 | ||||||
Others, net | 0.55 | 1.65 | (1.07 | ) | |||||
Effective income tax rate | 14.38 | % | (0.22 | )% | 10.18 | % | |||
As of December 31, 2010, the Company had tax loss carryforwards of $1,845,522. Such carryforwards, if not utilized, are scheduled to expire as follows:
2015 | $ | 512,967 | ||
2016 | 910,864 | |||
2017 | 421,691 | |||
Total | $ | 1,845,522 | ||
NOTE 9-LEASE
The Company leases its headquarters under a cancelable operating contract with 180 days notice. Rent expense was $300,092, $285,222 and $268,800 for the years ended December 31, 2010, 2009 and 2008, respectively. Aggregated monthly lease costs for 2010 were $25,008.
NOTE 10-RELATED PARTY TRANSACTIONS
Kennedy-Wilson Holdings, Inc. and an affiliate of Wachovia KW2, LLC known as Wachovia Development Corp.,
84
KW Residential, LLC and Subsidiaries
Notes to Consolidated Financial Statements
December 31, 2010, 2009 and 2008
provided administrative, consultation and professional services to the Company for the years ended December 31, 2009 and 2008. For the year ended December 31, 2010, only Kennedy-Wilson Holdings, Inc. continued to provide similar services to the Company.
In 2010, Kennedy-Wilson Holdings, Inc. was paid $221,590 for payroll services and $599,161 for consultant services. For 2009 and 2008, Kennedy-Wilson Holdings, Inc. was paid $272,619 and $147,031, $270,479 and $138,891, respectively. Accounts payable balance related to these items was $0 and $22,680 at December 31, 2010 and 2009, respectively.
In 2010, the Company had no transactions with Wachovia Development Corp. In 2009, Wachovia Development Corp. was paid $147,559 for consultant services. In 2008, Wachovia Development Corp. was paid $142,081 for consultant services and $24,696 for professional services. Accounts payable related to these items was $63,661 at December 31, 2009.
NOTE 11-SUBSEQUENT EVENTS
Management has evaluated all subsequent events through March 10, 2011 the date that the financial statements are available for issuance.
85
Report of Independent Registered Public Accounting Firm
The Partners
KW Property Fund III, L.P. and
KW Property Fund III (QP-A), L.P.:
We have audited the accompanying combined statements of financial condition of KW Property Fund III, L.P. and KW Property Fund III (QP-A), L.P. including the combined schedule of investments, as of December 31, 2010 and 2009, and the related combined statements of operations, partners' capital, and cash flows for each of the years in the three-year period ended December 31, 2010. These combined financial statements are the responsibility of the Partnership's management. Our responsibility is to express an opinion on these combined financial statements based on our audits.
We conducted our audits in accordance with the standards of the Public Company Accounting Oversight Board (United States). Those standards require that we plan and perform the audit to obtain reasonable assurance about whether the financial statements are free of material misstatement. An audit includes consideration of internal control over financial reporting as a basis for designing audit procedures that are appropriate in the circumstances, but not for the purpose of expressing an opinion on the effectiveness of the Partnership's internal control over financial reporting. Accordingly, we express no such opinion. An audit also includes examining, on a test basis, evidence supporting the amounts and disclosures in the financial statements, assessing the accounting principles used and significant estimates made by management, as well as evaluating the overall financial statement presentation. We believe that our audits provide a reasonable basis for our opinion.
In our opinion, the combined financial statements referred to above present fairly, in all material respects, the financial position of KW Property Fund III, L.P. and KW Property Fund III (QP-A), L.P. as of December 31, 2010 and 2009, and the results of their operations and their cash flows for each of the years in the three-year period ended December 31, 2010, in conformity with U.S. generally accepted accounting principles.
/s/ KPMG LLP
Los Angeles, California
March 11, 2011
86
KW FUND III, L.P. AND
KW FUND III (QP-A), L.P.
Statement of Financial Condition
December 31, 2010 and 2009
December 31, | |||||||||
2010 | 2009 | ||||||||
Assets | |||||||||
Investments at fair value (cost $81,311,936 in 2010 and $51,507,730 in 2009) | $ | 107,384,873 | $ | 70,461,406 | |||||
Cash and cash equivalents | 23,611,792 | 225,001,154 | 610,810 | ||||||
Escrows and deposits | 1,171,372 | 225,001,154 | — | ||||||
Due from limited partners | 246,665 | 225,001,154 | — | ||||||
Accounts receivable | 27,009 | 225,001,154 | 4,937 | ||||||
Prepaid expenses | 476,730 | 225,001,154 | 159,789 | ||||||
Total assets | $ | 132,918,441 | $ | 71,236,942 | |||||
Liabilities and partners' capital | |||||||||
Liabilities | |||||||||
Note payable | $ | — | $ | 8,000,000 | |||||
Interest payable | — | 225,001,154 | 2,449 | ||||||
Accounts payable and accrued expenses | 182,207 | 225,001,154 | 25,413 | ||||||
Due to General Partner | 2,520,001 | 225,001,154 | 807,206 | ||||||
Total liabilities | 2,702,208 | 8,835,068 | |||||||
Partners' capital | |||||||||
Limited partners | 110,038,884 | 54,010,856 | |||||||
General partner and special limited partner | 20,177,349 | 8,391,018 | |||||||
Total partners’ capital | 130,216,233 | 62,401,874 | |||||||
Total liabilities and partners’ capital | $ | 132,918,441 | $ | 71,236,942 | |||||
See accompanying notes to combined financial statements.
87
KW FUND III, L.P. AND
KW FUND III (QP-A), L.P.
Combined Schedule of Investments
December 31, 2010
Ownership interest | Security description | Percentage of total investments | Cost | Fair value | ||||||||||
Interests in real estate assets: | ||||||||||||||
100.00 | % | KW Pinole, LLC, a single-purpose entity holding a fee simple interest in a 147-unit multifamily project located in Pinole, California | 6.08 | % | $ | 4,792,668 | $ | 6,524,819 | ||||||
100.00 | KW Davis, LLC, a single-purpose entity holding a fee simple interest in a 240-unit multifamily project located in Davis, California | 8.63 | 8,803,217 | 9,266,702 | ||||||||||
100.00 | KW Napa, LLC, a single-purpose entity holding a fee simple interest in a 66-unit multifamily project located in Napa, California | 3.35 | 2,566,053 | 3,602,533 | ||||||||||
100.00 | Plum Canyon Investments, LLC, a single-purpose entity initially holding a fee simple interest in 56 undeveloped lots located in Lancaster, California. | 2.89 | 1,984,600 | 3,106,327 | ||||||||||
100.00 | Cypress Pointe Investments, LLC, a single-purpose entity holding a fee simple interest in 163 undeveloped lots located in Victorville, California | 3.52 | 3,536,251 | 3,778,195 | ||||||||||
100.00 | KW Kiahuna, LLC, a single-purpose entity holding a fee simple interest in 6 finished homes and 63 undeveloped lots located on the island of Kawai in Hawaii | 7.22 | 7,627,677 | 7,755,309 | ||||||||||
100.00 | KW Federal Way, LLC, a single-purpose entity holding a fee simple interest in a 518-unit multifamily project located in Federal Way, Washington | 20.51 | 6,267,092 | 22,027,468 | ||||||||||
50.00 | KW Funds-303 North Glenoaks, LLC, a single-purpose entity holding a fee simple interest in a 10-story, 176,480-square-foot office building and adjacent 6-story garage located in Burbank, California | 9.70 | 9,298,833 | 10,421,539 | ||||||||||
50.00 | KW Funds-333 North Glenoaks, LLC, a single-purpose entity holding a fee simple interest in a 6-story, 86,703-square-foot office building located in Burbank, California | 3.72 | 4,560,023 | 3,989,788 | ||||||||||
50.00 | KW Funds-Burbank Executive, LLC, a single-purpose entity holding a fee simple interest in a 6-story, 63,899-square-foot office building located in Burbank, California | 3.13 | 2,875,013 | 3,359,359 | ||||||||||
14.29 | KW Funds-6100 Wilshire, LLC, a single-purpose entity holding a fee simple interest in a 16-story, 213,961-square-foot office building located in Beverly Hills, California | 1.52 | 3,106,845 | 1,635,886 | ||||||||||
19.94 | Bay Fund Opportunity, LLC, an entity holding interests in two single-purpose entities each holding fee simple interests in two multifamily condominium projects with 484 units located in Richmond, California | 11.13 | 5,777,167 | 11,948,169 | ||||||||||
50.00 | Fairways 340, LLC, a single-purpose entity holding a fee simple interest in a 209-unit multifamily project located in Walnut Creek, California | 9.48 | 9,904,184 | 10,181,795 | ||||||||||
Interests in notes: | ||||||||||||||
45.08 | KW Kona Investors, LLC, an entity holding a $25,000,000 junior participation in a loan secured by a resort in Kona, Hawaii. This interest was acquired for $19,699,998, earns interest at a rate of LIBOR + 1.50% and matures on May 9, 2010 | 4.57 | 4,730,674 | 4,910,930 | ||||||||||
20.00 | SJ Real Estate Partners, LLC, an entity holding a non-performing loan acquired at a discount, secured by a 23-story residential tower with 213 units and 11,000 square feet of retail space located in San Jose, California | 4.54 | 5,481,639 | 4,876,054 | ||||||||||
Total investments | 100.00 | % | $ | 81,311,936 | $ | 107,384,873 | ||||||||
See accompanying notes to combined financial statements.
88
KW FUND III, L.P. AND
KW FUND III (QP-A), L.P.
Combined Schedule of Investments
December 31, 2009
Ownership interest | Security description | Percentage of total investments | Cost | Fair value | ||||||||||
Interests in real estate assets: | ||||||||||||||
100.00 | % | KW Pinole, LLC, a single-purpose entity holding a fee simple interest in a 147-unit multifamily project located in Pinole, California | 6.20 | % | $ | 3,314,696 | $ | 4,368,903 | ||||||
100.00 | KW Davis, LLC, a single-purpose entity holding a fee simple interest in a 240-unit multifamily project located in Davis, California | 13.07 | 7,685,305 | 9,207,216 | ||||||||||
100.00 | KW Napa, LLC, a single-purpose entity holding a fee simple interest in a 66-unit multifamily project located in Napa, California | 5.68 | 2,547,519 | 4,005,042 | ||||||||||
100.00 | Plum Canyon Investments, LLC, a single-purpose entity initially holding a fee simple interest in 56 undeveloped lots located in Lancaster, California. | 4.24 | 1,889,332 | 2,986,917 | ||||||||||
100.00 | Cypress Pointe Investments, LLC, a single-purpose entity holding a fee simple interest in 163 undeveloped lots located in Victorville, California | 4.12 | 2,467,280 | 2,906,062 | ||||||||||
50.00 | KW Funds-303 North Glenoaks, LLC, a single-purpose entity holding a fee simple interest in a 10-story, 176,480-square-foot office building and adjacent 6-story garage located in Burbank, California | 13.41 | 9,314,366 | 9,447,578 | ||||||||||
50.00 | KW Funds-333 North Glenoaks, LLC, a single-purpose entity holding a fee simple interest in a 6-story, 86,703-square-foot office building located in Burbank, California | 6.89 | 4,566,190 | 4,858,061 | ||||||||||
50.00 | KW Funds-Burbank Executive, LLC, a single-purpose entity holding a fee simple interest in a 6-story, 63,899-square-foot office building located in Burbank, California | 4.85 | 2,878,419 | 3,418,140 | ||||||||||
14.29 | KW Funds-6100 Wilshire, LLC, a single-purpose entity holding a fee simple interest in a 16-story, 213,961-square-foot office building located in Beverly Hills, California | 3.67 | 3,111,859 | 2,585,009 | ||||||||||
19.94 | Bay Fund Opportunity, LLC, an entity holding interests in two single-purpose entities each holding fee simple interests in two multifamily condominium projects with 484 units located in Richmond, California | 14.85 | 5,745,707 | 10,445,788 | ||||||||||
93.00 | KW Federal Way, LLC, a single-purpose entity holding a fee simple interest in a 518-unit multifamily project located in Federal Way, Washington | 16.87 | 3,895,546 | 11,890,101 | ||||||||||
Interests in notes: | ||||||||||||||
45.08 | KW Kona Investors, LLC, an entity holding a $25,000,000 junior participation in a loan secured by a resort in Kona, Hawaii. This interest was acquired for $19,699,998, earns interest at a rate of LIBOR + 1.50% and matures on May 9, 2010 | 6.16 | 4,091,511 | 4,342,589 | ||||||||||
Total investments | 100.00 | % | $ | 51,507,730 | $ | 70,461,406 | ||||||||
See accompanying notes to combined financial statements.
89
KW FUND III, L.P. AND
KW FUND III (QP-A), L.P.
Combined Statement of Operations
Year ended December 31, | ||||||||||||
2010 | 2009 | 2008 | ||||||||||
Investment income: | ||||||||||||
Dividends | $ | 3,325,350 | $ | 2,593,757 | $ | 32,145 | ||||||
Interest | 682,862 | 507,173 | 364,916 | |||||||||
Interest - related party | — | 130,785 | 404,921 | |||||||||
Total investment income | 4,008,212 | 3,231,715 | 801,982 | |||||||||
Expenses: | ||||||||||||
Management fees - related party | 3,554,005 | 744,089 | 490,555 | |||||||||
Legal fees | 152,761 | 729,553 | 107,264 | |||||||||
Other professional and administrative costs | 335,975 | 1,188,907 | 54,753 | |||||||||
Interest expense | 193,229 | 556,235 | 12,222 | |||||||||
Interest expense - related party | 93,750 | 20,899 | — | |||||||||
Total expenses | 4,329,720 | 3,239,683 | 664,794 | |||||||||
Net investment income (loss) | (321,508 | ) | (7,968 | ) | 137,188 | |||||||
Realized and unrealized gain on investments: | ||||||||||||
Net realized gain on investments | — | 377,292 | — | |||||||||
Net change in unrealized appreciation on investments | 7,116,258 | 13,674,702 | 5,278,974 | |||||||||
Net income (loss) | $ | 6,794,750 | $ | 14,044,026 | $ | 5,416,162 | ||||||
See accompanying notes to combined financial statements.
90
KW FUND III, L.P. AND
KW FUND III (QP-A), L.P.
Combined Statement of Partners' Capital
Years ended December 31, 2010, 2009 and 2008
General and special limited partner | KW Property Fund III, L.P. limited parnters | KW Property Fund III (QP-A), L.P. limited parnters | Total | |||||||||||||
Partners' deficit, December 31, 2007 | $ | — | $ | (82,222 | ) | $ | — | $ | (82,222 | ) | ||||||
Capital contributions | 1,491,106 | 28,331,017 | — | 29,822,123 | ||||||||||||
Capital distributions | (15,000 | ) | (285,000 | ) | — | (300,000 | ) | |||||||||
Net income | 1,280,145 | 4,136,017 | — | 5,416,162 | ||||||||||||
Partners' capital, December 31, 2008 | 2,756,251 | 32,099,812 | — | 34,856,063 | ||||||||||||
Capital contributions | 1,720,466 | 1,760,625 | 10,412,102 | 13,893,193 | ||||||||||||
Capital distributions | (127,769 | ) | (122,604 | ) | (141,035 | ) | (391,408 | ) | ||||||||
Net equalization | — | (1,042,089 | ) | 1,042,089 | ||||||||||||
Net income | 4,042,070 | 7,430,802 | 2,571,154 | 14,044,026 | ||||||||||||
Partners' capital, December 31, 2009 | 8,391,018 | 40,126,546 | 13,884,310 | 62,401,874 | ||||||||||||
Capital contributions | 8,550,382 | — | 56,513,045 | 65,063,427 | ||||||||||||
Capital distributions | — | (4,043,818 | ) | — | (4,043,818 | ) | ||||||||||
Net equalization | (6,628,385 | ) | 6,628,385 | — | ||||||||||||
Net income | 3,235,949 | 965,705 | 2,593,096 | 6,794,750 | ||||||||||||
Partners' capital, December 31, 2010 | $ | 20,177,349 | $ | 30,420,048 | $ | 79,618,836 | $ | 130,216,233 | ||||||||
See accompanying notes to combined financial statements.
91
KW FUND III, L.P. AND
KW FUND III (QP-A), L.P.
Combined Statements of Cash Flows
Years ended December 31, 2010, 2009 and 2008
Year ended December 31, | ||||||||||||
2010 | 2009 | 2008 | ||||||||||
Cash flows from operating activities: | ||||||||||||
Net income | $ | 6,794,750 | $ | 14,044,026 | $ | 5,416,162 | ||||||
Adjustments to reconcile net income to net cash used in operating activities: | ||||||||||||
Net realized gain on investments | — | (377,292 | ) | — | ||||||||
Net change in unrealized appreciation on investments | (7,116,258 | ) | (13,674,702 | ) | (5,278,974 | ) | ||||||
Change in assets and liabilities: | ||||||||||||
Purchases of investments | (18,446,395 | ) | (6,475,174 | ) | (34,629,630 | ) | ||||||
Purchases of investments - related party | (10,948,327 | ) | (7,264,148 | ) | (4,431,851 | ) | ||||||
Acquisition fees - related party | (412,487 | ) | (496,347 | ) | (1,441,388 | ) | ||||||
Proceeds on sale of investments | — | 3,608,100 | — | |||||||||
Escrows and deposits | (1,171,372 | ) | — | — | ||||||||
Interest receivable - related party | — | 34,188 | (34,188 | ) | ||||||||
Due from limited partners | (246,665 | ) | — | — | ||||||||
Accounts receivable | (22,072 | ) | (4,937 | ) | — | |||||||
Prepaid expenses | (316,941 | ) | (36,795 | ) | (122,994 | ) | ||||||
Interest payable | (2,449 | ) | (9,773 | ) | 12,222 | |||||||
Accounts payable and accrued expenses | 156,794 | 25,413 | — | |||||||||
Due to general partner | 1,712,795 | 630,885 | 94,099 | |||||||||
Net cash flow used in operating activities | (30,018,627 | ) | (9,996,556 | ) | (40,416,542 | ) | ||||||
Cash flow from financing activities: | ||||||||||||
Proceeds from note payable | — | — | 11,000,000 | |||||||||
Repayment of note payable | (8,000,000 | ) | (3,000,000 | ) | — | |||||||
Proceeds from short-term advances | 3,375,000 | 3,434,692 | — | |||||||||
Repayment of short-term advances | — | (3,434,692 | ) | — | ||||||||
Capital contributions | 61,688,427 | 13,893,193 | 29,822,123 | |||||||||
Capital distributions | (4,043,818 | ) | (391,408 | ) | (300,000 | ) | ||||||
Net cash flow provided by financing activities | 53,019,609 | 10,501,785 | 40,522,123 | |||||||||
Net change in cash and cash equivalents | 23,000,982 | 505,229 | 105,581 | |||||||||
Cash and cash equivalents, beginning of year | 610,810 | 105,581 | — | |||||||||
Cash and cash equivalents, end of year | $ | 23,611,792 | $ | 610,810 | $ | 105,581 | ||||||
Supplemental disclosure of cash paid for during the year: | ||||||||||||
Interest | $ | 289,428 | $ | 586,907 | $ | — | ||||||
Supplemental disclosure of non-cash financing activities: | ||||||||||||
Conversion of short-term advances to partners' capital | $ | 3,375,000 | $ | — | $ | — | ||||||
See accompanying notes to combined financial statements.
92
KW PROPERTY FUND III, L.P. AND
KW PROPERTY FUND III (QP A), L.P.
Notes to Combined Financial Statements
December 31, 2010 and 2009
(1) | Organization |
KW Property Fund III, L.P. (the L.P. Partnership), a Delaware limited partnership, commenced operations on December 19, 2007. KW Property Fund III (QP-A), L.P. (the QP-A Partnership), a Delaware limited partnership, commenced operations on February 5, 2009 as a separate legal entity from the L.P. Partnership with the sole purpose of coinvesting with the L.P. Partnership. Upon admission of the limited partners to the QP-A Partnership, the capital accounts of all of the limited partners were equalized such that the limited partners of the QP-A Partnership would have been invested in the Partnerships since the inception of the L.P. Partnership. This equalization is shown as net equalization in the combined statements of partners' capital. Together, the L.P. Partnership and QP-A Partnership are referred to as the Partnerships. The general partner of the L.P. Partnership and the QP-A Partnership is Kennedy Wilson Property Services III, L.P., a Delaware limited partnership (the General Partner), and the special limited partner of the L.P. Partnership and the QP-A Partnership is Kennedy Wilson Property Special Equity III, LLC, a Delaware limited liability company (the Special Limited Partner). The limited partnership agreements of the L.P. Partnership and the QP-A Partnership were amended on December 18, 2009 to extend the subscription period from December 19, 2009 to June 30, 2010. The limited partnership agreements of the Partnerships were amended again on July 28, 2010 to extend the subscription period from June 30, 2010 to August 16, 2010 with respect to the admission of certain prospective investors and to permit for corresponding increases in commitments of the General Partner and any limited partner that had previously agreed to increase its commitment at any subsequent closing.
The investment objective of the Partnerships is to acquire: office, multifamily, industrial and retail properties, and investments in debt securities in the real estate market that the General Partner believes can be acquired at substantial discounts to both historical and replacement cost. These properties will generally be located in selected geographic markets on the west coast of the U.S., Hawaii, and Japan. Under the terms of the partnership agreements, the Partnerships shall continue until the eighth anniversary of the effective date of December 19, 2007 and may be extended (i) by the General Partner in its discretion for one additional two-year period, (ii) by the General Partner with the prior consent of the Advisory Board, for an additional two-year period, and (iii) by the General Partner with the prior consent of limited partners holding a majority of aggregate commitments for additional one-year period.
The Partnerships have evaluated all subsequent events through the date that the financial statements are available for issuance.
(2) | Summary of Significant Accounting Policies |
The financial statements of the Partnerships have been presented on a combined basis because the Partnerships are under common management and are jointly invested in each investment. All intercompany transactions are eliminated in combination. These combined financial statements should be read in conjunction with the partnership agreements. Accordingly, the financial statements have been combined since the inception of the QP-A Partnership on February 5, 2009.
(a) | Use of Estimates |
The preparation of the accompanying combined financial statements in conformity with U.S. generally accepted accounting principles requires management to make estimates and assumptions about future events. These estimates and the underlying assumptions affect the amounts of assets and liabilities reported, and reported amounts of revenues and expenses. Management evaluates its estimates and assumptions on an ongoing basis using historical experience and other factors, including the current economic environment, which management believes to be reasonable under the circumstances. Such estimates and assumptions are adjusted when facts and circumstances dictate. As future events and their effects cannot be determined with precision, actual results could differ significantly from these estimates. Changes in those estimates resulting from continuing changes in the economic environment will be reflected in the
93
KW PROPERTY FUND III, L.P. AND
KW PROPERTY FUND III (QP A), L.P.
Notes to Combined Financial Statements
December 31, 2010 and 2009
combined financial statements in future periods.
(b) | Cash and Cash Equivalents |
The Partnerships consider their investment in a money market account to be a cash equivalent for purposes of the combined statements of cash flows.
The Partnerships maintain their cash in federally insured banking institutions. The account balances at these institutions periodically exceed the Federal Deposit Insurance Corporation's (FDIC) insurance coverage, and as a result, there is a concentration of credit risk related to amounts in excess of FDIC's insurance coverage.
(c) | Fair Value Measurements |
Fair value is defined as the price that would be received to sell an asset or would be paid to transfer a liability (the exit price) in an orderly transaction between market participants at the measurement date.
A three-level hierarchy was established for fair value measurements that distinguishes between market participant assumptions developed based on market data obtained from sources independent of the reporting entity (observable inputs) and the reporting entity's own assumptions about market participant assumptions developed based on the best information available in the circumstances (unobservable inputs). The hierarchy level assigned to each investment in the Partnerships is based on the assessment of the transparency and reliability of the inputs used in the valuation of such investment at the measurement date. The three hierarchy levels are defined as follows:
Level 1 - Valuations based on unadjusted quoted market prices in active markets for identical securities.
Level 2 - Valuations based on observable inputs (other than Level 1 prices), such as quoted prices for similar assets and quoted prices in markets that are not active.
Level 3 - Valuations based on inputs that are unobservable and significant to the overall fair value measurement, and involve management judgment.
The availability of valuation techniques and observable inputs can vary from investment to investment. To the extent that valuation is based on models or inputs that are less observable or unobservable in the market, the determination of fair value requires more judgment. Those estimated values do not necessarily represent the amounts that may be ultimately realized due to the occurrence of future circumstances that cannot be reasonably determined. Because of the inherent uncertainty of valuation, those estimated values may be materially higher or lower than the values that would have been used had a ready market for the investments existed. Accordingly, the degree of judgment exercised by the General Partner in determining fair value is greatest for investments classified as Level 3. In certain cases, the inputs used to measure fair value may fall into different levels of the fair value hierarchy. In such cases, for disclosure purposes, the level in the fair value hierarchy within which the fair value measurement falls is determined based on the lowest level input that is significant to the fair value measurement.
Fair value is a market-based measure considered from the perspective of a market participant rather than an entity-specific measure. Therefore, even when market assumptions are not readily available, the General Partner's own assumptions are set to reflect those that market participants would use in valuing the asset or liability at the measurement date. The General Partner uses prices and inputs that it believes are current as of the measurement date.
(d) | Valuation of Investments |
The Partnerships' investments in real estate and real estate related entities are stated at fair value determined
94
KW PROPERTY FUND III, L.P. AND
KW PROPERTY FUND III (QP A), L.P.
Notes to Combined Financial Statements
December 31, 2010 and 2009
by the General Partner by considering the projected operating cash flows or sales of comparable assets, if any. The operating cash flows are estimated on an asset by asset basis with a capitalization rate applied to the reversion year cash flows for the respective holding period. The Partnerships' investments in real estate related notes are stated at fair value based on a comparison of the yield that would be required in a current transaction, taking into consideration the risk of the underlying collateral and the credit risk of the borrower to the current yield of similar fixed income securities.
The accuracy of estimating fair value for Level 3 investments cannot be determined with precision, cannot be substantiated by comparison to quoted prices in active markets, and may not be realized in a current sale or immediate settlement of the asset or liability. Additionally, there are inherent uncertainties in any fair value measurement technique, and changes in the underlying assumptions used, including discount rates, liquidity risks, and estimates of future cash flows, could significantly affect the fair value measurement amounts.
The Partnerships investments in real estate and real estate related assets and real estate related fixed income securities are accounted for on a closing-date basis.
(e) | Concentration of Risk |
Substantially all of the Partnerships' investments are concentrated in real estate related investments in California, Washington and Hawaii. Adverse conditions in the sector or geographic locations would likely result in material declines in the value of the Partnerships' investments.
(f) | Revenue Recognition |
Dividend income from investments in real estate and real estate related entities is recorded when a disbursement has been approved and declared from the underlying investments of the Partnerships. Undistributed earnings from real estate and real estate related entities are considered by the General Partner in estimating the fair value of these investments.
Interest income on real estate related fixed income securities is recognized on the accrual basis in the period earned unless deemed doubtful of collection or the related security is in default.
(g) | Income Taxes |
Neither the L.P. Partnership nor the QP-A Partnership is subject to federal or state income taxes, and accordingly, no provision for income taxes has been made in the accompanying combined financial statements. The partners are required to report their proportional share of income, gains, loss, credit, or deduction on their respective tax returns.
The Partnerships are required to determine whether a tax position is more likely than not to be sustained upon examination by the applicable taxing authority, including resolution of any related appeals or litigation processes, based on the technical merits of the position. The tax benefit to be recognized is measured as the largest amount of benefit that is greater than fifty percent likely of being realized upon ultimate settlement, which could result in the Company recording a tax liability that would reduce net assets. Based on its analysis, the Company has determined that there are no tax benefits that would have a material impact on the Company's financial position or results of operations. The tax years 2007 (year of inception) through 2009 remain open to examination by the taxing jurisdictions to which the L.P. Partnership is subject. The tax year 2009 is open to examination by taxing jurisdictions to which the QP-A Partnership is subject.
(3) | Fair Value of Investments |
The following table presents the classification of the Partnerships fair value measurements as of December 31, 2010:
95
KW PROPERTY FUND III, L.P. AND
KW PROPERTY FUND III (QP A), L.P.
Notes to Combined Financial Statements
December 31, 2010 and 2009
Level 1 | Level 2 | Level 3 | Total | |||||||||||||
Interests in real estate assets | $ | — | $ | — | $ | 97,597,889 | $ | 97,597,889 | ||||||||
Interests in notes | — | — | 9,786,984 | 9,786,984 | ||||||||||||
$ | — | $ | — | $ | 107,384,873 | $ | 107,384,873 | |||||||||
The following table presents changes in Level 3 investments for the year ended December 31, 2010:
January 1, 2010 | Net Purchase or Sales | Realized Gains or Losses | Unrealized Appreciation or (Depreciation) | Net transfer in or out of Level 3 | Total | |||||||||||||||||||
Interests in real estate assets | $ | 66,118,818 | $ | 23,686,406 | $ | — | $ | 7,792,665 | $ | — | $ | 97,597,889 | ||||||||||||
Interests in notes | 4,342,588 | 6,120,803 | — | (676,407 | ) | — | 9,786,984 | |||||||||||||||||
$ | 70,461,406 | $ | 29,807,209 | $ | — | $ | 7,116,258 | $ | — | $ | 107,384,873 | |||||||||||||
The net change in unrealized appreciation on investments that use Level 3 inputs still held as of December 31, 2010 was $7,116,258.
The following table presents the classification of the Partnerships fair value measurements as of December 31, 2009:
Level 1 | Level 2 | Level 3 | Total | |||||||||||||
Interests in real estate assets | $ | — | $ | — | $ | 66,118,818 | $ | 66,118,818 | ||||||||
Interests in notes | — | — | 4,342,588 | 4,342,588 | ||||||||||||
$ | — | $ | — | $ | 70,461,406 | $ | 70,461,406 | |||||||||
The following table presents changes in Level 3 investments for the year ended December 31, 2009:
January 1, 2009 | Net Purchase or Sales | Realized Gains or Losses | Unrealized Appreciation or (Depreciation) | Net transfer in or out of Level 3 | Total | |||||||||||||||||||
Interests in real estate assets | $ | 40,772,128 | $ | 10,622,073 | $ | 377,292 | $ | 14,347,325 | $ | — | $ | 66,118,818 | ||||||||||||
Interests in notes | 5,009,715 | 5,496 | — | (672,623 | ) | — | 4,342,588 | |||||||||||||||||
$ | 45,781,843 | $ | 10,627,569 | $ | 377,292 | $ | 13,674,702 | $ | — | $ | 70,461,406 | |||||||||||||
The net change in unrealized appreciation on investments that use Level 3 inputs still held as of December 31, 2009 was $13,674,702.
The following table presents changes in Level 3 investments for the year ended December 31, 2008:
January 1, 2008 | Net Purchase or Sales | Realized Gains or Losses | Unrealized Appreciation or (Depreciation) | Net transfer in or out of Level 3 | Total | |||||||||||||||||||
Interests in real estate assets | $ | — | $ | 36,416,854 | $ | 4,355,274 | $ | — | $ | 40,772,128 | ||||||||||||||
Interests in notes | — | 4,086,015 | — | 923,700 | — | 5,009,715 | ||||||||||||||||||
$ | — | $ | 40,502,869 | $ | — | $ | 5,278,974 | $ | — | $ | 45,781,843 | |||||||||||||
The net change in unrealized appreciation on investments that use Level 3 inputs still held as of December 31,
96
KW PROPERTY FUND III, L.P. AND
KW PROPERTY FUND III (QP A), L.P.
Notes to Combined Financial Statements
December 31, 2010 and 2009
2008 was $5,278,974.
Since inception, all investments have been classified as Level 3 investments and there have been no transfers between other levels of the hierarchy.
(4) | Related-Party Transactions |
(a) | Acquisition of Investments |
During 2010 the Partnerships acquired the following investments from related parties:
• | An ownership interest in Fairways 340, LLC was acquired from an affiliate of the General Partner and Special Limited Partner for $9,630,450. |
• | The remaining ownership interest in KW Federal Way, LLC was acquired from affiliates of the General Partner and Special Limited Partner for $1,317,877. |
During 2009, the Partnerships acquired the following investments from related parties:
• | An ownership interest in KW Napa, LLC acquired from an affiliate of the General Partner and Special Limited Partner for $521,901. |
• | Ownership interests acquired in Plum Canyon Investments, LLC for $3,779,378 and Cypress Pointe Investments, LLC (Cypress) for $2,962,869 were acquired from affiliates of the General Partner and Special Limited Partner. The acquisition of Cypress was financed in part by a note from the affiliate at the underlying investee company level and was repaid in full by the underlying investee company in 2010. |
(b) | Management Fee |
The Partnerships shall pay the General Partner a management fee equal to 1.500% per annum of the aggregate commitments of the nonaffiliated partners of which 1.125% is for investment services and 0.375% is for placement fees paid by the General Partner. The Partnerships incurred $3,554,005, $744,089, and $490,555 of management fees for the years ended December 31, 2010, 2009, and 2008, respectively.
The management fee shall be reduced by any breakup fees, transaction fees, and monitoring fees received by the General Partner or an affiliate of the General Partner. The management fee will also be reduced, in any period, for any organizational expenses that the Partnerships pay in excess of $2 million. If the management fee reduction exceeds the management fee in any period, then any excess shall be carried forward to reduce management fees in future periods. There have been no reductions for the years ended December 31, 2010, 2009, and 2008.
During 2010, certain limited partners entered into separate letter agreements upon their admission to the Partnerships. The letter agreements stipulate that the limited partners shall not be required to make capital contributions for management fees that would be due for the period from inception of the Partnerships through the limited partners' admission until such time as the limited partners have received distributions related to investments made prior to their admission (including preferred return). The accrued and unpaid fees related to these arrangements totaled $1,559,074 as of December 31, 2010 and are included in due to General Partner in the accompanying combined statements of financial condition.
(c) | Acquisition Fee |
The Partnerships shall pay the General Partner an acquisition fee with respect to each investment equal to 1% of the nonaffiliated partners' percentage of the total acquisition cost of each investment on the closing of an acquisition. The Partnerships incurred total acquisition fees of $412,487, $496,347, $1,441,388 during 2010, 2009, and 2008, respectively, which have been included in the cost basis of the respective
97
KW PROPERTY FUND III, L.P. AND
KW PROPERTY FUND III (QP A), L.P.
Notes to Combined Financial Statements
December 31, 2010 and 2009
investments.
During 2010, certain limited partners entered into separate letter agreements upon their admission to the Partnerships. The letter agreements stipulate that the limited partners shall not be required to make capital contributions for acquisition fees incurred by the Partnerships prior the limited partners' admission until such time as the limited partners have received distributions related to investments made prior to their admission (including preferred return). The fees related to these arrangements totaled $503,169 as of December 31, 2010 and are included in due to General Partner in the accompanying combined statements of financial condition. The General Partner advanced $503,169 to the Partnerships in order to facilitate the equalization, which was required due to the admission of the new limited partners.
(d) | Organization Expense |
The Partnerships shall reimburse the General Partner for up to $2 million of organizational expense incurred on behalf of the Partnerships. Organization expenses in excess of $2 million will reduce the management fee paid to the General Partner. The Partnerships have incurred organization expenses of $207,891, $1,709,887, and $82,222 for the years ended December 31, 2010, 2009, and 2008, respectively, that are included in legal fees and other professional and administrative costs in the accompanying combined statements of operations. The Partnerships had $457,758 and $759,425 in organization expenses as of December 31, 2010 and 2009, respectively, that is included in due to the General Partner in the accompanying combined statements of financial condition.
(e) | Note Investment |
The underlying investment in KW Fund III Woodstone, LLC was a note to an affiliate of the General Partner that was paid in full on April 30, 2009 in accordance with its terms. The total interest income received in 2009 and 2008 from this investment was $535,706.
(f) | Short-Term Advances |
The Partnerships have the ability to borrow short-term advances from Kennedy-Wilson Holdings, Inc., an affiliate of the General Partner and Special Limited Partner. During 2010 and 2009, the Partnerships received advances in order to fund short-term investment requirements in advance of anticipated additional investor contributions. The advances under this arrangement with Kennedy-Wilson Holdings, Inc. accrue interest at 9% per annum. On April 22, 2010 and May 28, 2010, the Partnerships received advances in the amounts of $3,000,000 and $375,000, respectively, in order to make required principal payments on a note payable to Pacific Western Bank. During August 2010, the General Partner and Special Limited Partner increased their capital commitments to the Partnerships. Instead of contributing additional capital, these advances were converted to capital contributions for amounts due from the Special Limited Partner for capital calls made by the General Partner. On September 24, 2009, the Partnerships received advances totaling $500,000 and repaid this amount on September 25, 2009. On November 23, 2009, the Partnerships received advances totaling $999,145 and received an additional advance on November 30, 2009 totaling $1,935,547. All of the above advances were repaid prior to December 31, 2009. Total interest incurred for these advances was $93,750 and $20,899 during 2010 and 2009, respectively, and is included in interest expense - related party in the combined statements of operations.
(5) | Partners' Capital |
(a) | Contribution |
The total committed capital of the L.P. Partnership is $45,000,000 and $33,423,529 as of December 31, 2010 and 2009, of which 83.46% and 99.20% has been called, respectively. The total committed capital of the QP-A Partnership is $80,555,556 and $10,380,392 as of December 31, 2010 and 2009, of which
98
KW PROPERTY FUND III, L.P. AND
KW PROPERTY FUND III (QP A), L.P.
Notes to Combined Financial Statements
December 31, 2010 and 2009
83.39% and 99.87% has been called, respectively.
The General Partner is authorized to call additional capital in its sole discretion when additional capital is required to acquire investments, provide working capital, establish reserves, or pay expenses, costs, losses, or liabilities of the Partnerships. No limited partner shall be required to make any additional capital contributions in excess of its capital commitment. Any portion of a limited partner's capital commitment that has not been called by the General Partner or committed for investment within five years from the date of the initial closing is released from further commitment to the Partnership. Also, any portion of a limited partner's capital commitment that has been initially contributed but which has been distributed to the limited partner during the two-year period following the date of the initial closing is subject to recontribution during such two-year period.
As of December 31, 2009, $47,781 was due to the Special Limited Partner as a result of capital that was contributed in excess of amounts called by the General Partner. This amount is included in due to General Partner in the accompanying combined statement of financial condition as of December 31, 2009.
(b) | Distributions |
Distributions of net cash flow shall initially be made to the partners based on the percentage of their capital contribution to the total capital contributions. The initial amount apportioned to the limited partners shall be distributed to the limited partners and the Special Limited Partner as follows:
(i) First, 100% to limited partners until the limited partners have received cumulative distributions equal to the sum of (i) limited partners aggregate investment contributions made with respect to realized investments and (ii) limited partners allocable share of limited partners cost contributions,
(ii) Second, 100% to limited partners until the unpaid preferred return (9%) of limited partners is reduced to zero,
(iii) Third, either (i) 100% to limited partners or (ii) 50% to the Special Limited Partner and 50% to limited partners, as the case may be, to the extent necessary so that the aggregate distributions to the Special Limited Partner with respect to limited partners equals 20% of the cumulative amount of distributions made to limited partners, and
(iv) Thereafter, (i) 20% to the Special Limited Partner and (ii) 80% to limited partners.
The amounts distributed to the Special Limited Partner over the life of the Partnerships are subject to a giveback provision. Carried interest distributions to the Special Limited Partner that exceed 20% of distributions to the limited Partners, excluding amounts distributed as return of contributions, are to be returned to the Partnerships and immediately distributed to the limited Partners.
(c) | Allocation of Partnership Income and Losses |
The allocation of Partnership income and loss will generally follow the allocation of distributions.
(6) | Note Payable |
On December 23, 2008, the Partnerships borrowed $11,000,000 from Pacific Western Bank in order to acquire interests in two entities owning multifamily real estate projects in advance of anticipated additional investor contributions. This note was initially due on June 30, 2009 and was extended to March 31, 2010 after making a principal payment of $3,000,000 on December 31, 2009. On April 20, 2010, a $3,000,000 principal payment was made and the loan was extended to November 30, 2010. Subsequent payments of $750,000 per month were made in May, June and July of 2010, and a final principal payment in the amount of $2,750,000 was made in
99
KW PROPERTY FUND III, L.P. AND
KW PROPERTY FUND III (QP A), L.P.
Notes to Combined Financial Statements
December 31, 2010 and 2009
August of 2010. The note payable accrued interest at 5% per annum and was a general obligation of the Partnerships.
(7) | Financial Highlights |
The Internal Rate of Return (IRR) since inception of the limited partners of the L.P. Partnership, net of all fees and profit allocations to the Special Limited Partner, is 15.66%, 24.81%, and 21.06% from inception through December 31, 2010, 2009, and 2008, respectively.
The IRR since inception of the limited partner of the QP-A Partnership, net of all fees and profit allocations to the Special Limited Partner is 16.37%, 25.31%, and 21.36% from inception through December 31, 2010, 2009, and 2008, respectively.
The IRR was computed based on the actual dates of the cash inflows (capital contributions), outflows (cash distributions), and the ending net assets at the end of the period (residual value) of the limited partners' capital accounts as of December 31, 2010.
The following details certain financial ratios of the Partnerships for the years ended December 31:
2010 | 2009 | 2008 | ||||||||||||||||
L.P. Partnership | QP-A Partnership | L.P. Partnership | QP-A Partnership | L.P. Partnership | QP-A Partnership | |||||||||||||
Ratio to average limited partners’ capital: | ||||||||||||||||||
Net investment (loss) income | (0.34 | )% | (0.35 | )% | (0.02 | )% | (0.02 | )% | 0.21 | % | 0.21 | % | ||||||
Total expenses | 4.51 | % | 4.69 | % | 7.05 | % | 7.18 | % | 2.87 | % | 2.91 | % | ||||||
Incentive allocation | 1.77 | % | 1.84 | % | 7.17 | % | 9.16 | % | 5.38 | % | 4.42 | % | ||||||
Total expenses and incentive allocation | 6.28 | % | 6.53 | % | 14.22 | % | 16.34 | % | 8.25 | % | 7.33 | % | ||||||
The net investment income and total expense ratios (including incentive allocation) are calculated for the limited partners taken as a whole. The computation of such ratios, based on the amount of net investment income, expenses, and incentive allocation assessed to an individual investor, may vary from these ratios based on the timing of capital transactions. The above ratios are computed based upon the weighted average limited partners' capital of the Partnerships as measured at the end of each monthly accounting period for the years ended December 31, 2010, 2009, and 2008.
(8) | Subsequent Events |
In December 2010, the General Partner called capital in the amount of $19,600,000 for the acquisition of two multifamily investments that closed subsequent to December 31, 2010. The first investment was a 750-unit multifamily project located in Federal Way, Washington that closed on January 13, 2011 and the second was a 492-unit multifamily project located in Petaluma, California that closed on February 11, 2011.
Management has evaluated all subsequent events through March 11, 2011 the date that the financial statements are available for issuance.
100
KW PROPERTY FUND III, L.P. AND
KW PROPERTY FUND III (QP A), L.P.
Notes to Combined Financial Statements
December 31, 2010 and 2009
Report of Independent Registered Public Accounting Firm
The Managing Members
KW/WDC Portfolio Member LLC and Sunrise Property Associates, LLC:
We have audited the accompanying combined balance sheet of KW/WDC Portfolio Member LLC (a Delaware limited liability company) and subsidiaries and One Carlsbad as of December 31, 2010, and the related combined statements of operations, equity, and cash flows for the year then ended. These combined financial statements are the responsibility of management. Our responsibility is to express an opinion on these combined financial statements based on our audit.
We conducted our audit in accordance with the standards of the Public Company Accounting Oversight Board (United States). Those standards require that we plan and perform the audit to obtain reasonable assurance about whether the financial statements are free of material misstatement. An audit includes consideration of internal control over financial reporting as a basis for designing audit procedures that are appropriate in the circumstances, but not for the purpose of expressing an opinion on the effectiveness of the Company's internal control over financial reporting. Accordingly, we express no such opinion. An audit also includes examining, on a test basis, evidence supporting the amounts and disclosures in the financial statements, assessing the accounting principles used and significant estimates made by management, as well as evaluating the overall financial statement presentation. We believe that our audit provides a reasonable basis for our opinion.
In our opinion, the combined financial statements referred to above present fairly, in all material respects, the financial position of KW/WDC Portfolio Member LLC and subsidiaries and One Carlsbad as of December 31, 2010, and the results of their operations and their cash flows for the year then ended in conformity with U.S. generally accepted accounting principles.
The accompanying combined balance sheet of KW/WDC Portfolio Member LLC and subsidiaries and One Carlsbad, as of December 31, 2009, and the related combined statements of operations, equity, and cash flows for each of the years in the two year period ended December 31, 2009 were not audited by us and, accordingly, we do not express an opinion on them.
/s/ KPMG LLP
Los Angeles, California
March 11, 2011
101
KW/WDC Portfolio Member LLC and One Carlsbad
Combined Balance Sheets
December 31, 2010 and 2009
December 31, | ||||||||
2010 | 2009 | |||||||
Assets | Unaudited | |||||||
Real Estate | ||||||||
Land | $ | 27,159,471 | $ | 30,268,100 | ||||
Buildings | 82,892,252 | 94,320,312 | ||||||
Building improvements | 1,639,055 | 6,054,761 | ||||||
Furniture and equipment | 4,520 | 2,155,072 | ||||||
Total | 111,695,298 | 132,798,245 | ||||||
Accumulated depreciation | (3,607,310 | ) | (13,161,719 | ) | ||||
Real Estate, net | 108,087,988 | 119,636,526 | ||||||
Cash | 1,635,712 | 966,451 | ||||||
Acquired in-place lease value, net of accumulated amortization of $3,037,061 and $1,732,031, respectively | — | 91,159 | ||||||
Repair and replacement reserves held in escrow | 3,275,442 | 3,045,801 | ||||||
Real estate taxes and insurance reserves held in escrow | 387,073 | 546,876 | ||||||
Deferred financing costs, net of accumulated amortization of $254,097 and $1,186,472, respectively | 808,621 | 190,697 | ||||||
Deferred leasing costs, net of accumulated amortization of $524,825 and $414,825, respectively | 231,669 | 158,336 | ||||||
Accounts receivable | 40,843 | 8,603 | ||||||
Accrued rent | 101,489 | 33,013 | ||||||
Prepaid expenses and other assets | 289,151 | 282,262 | ||||||
Total assets | $ | 114,857,988 | $ | 124,959,724 | ||||
Liabilities and partners' capital | ||||||||
Liabilities | ||||||||
Mortgage loans payable | $ | 81,543,725 | $ | 104,259,459 | ||||
Accounts payable and accrued expenses | 818,680 | 898,329 | ||||||
Security deposits and other liabilities | 699,096 | 702,044 | ||||||
Total liabilities | 83,061,501 | 105,859,832 | ||||||
Partners' capital | ||||||||
Equity | 31,796,487 | 19,099,892 | ||||||
Total liabilities and partners’ capital | $ | 114,857,988 | $ | 124,959,724 | ||||
See accompanying notes to combined financial statements
102
KW/WDC Portfolio Member LLC and One Carlsbad
Combined Statements of Operations
For the periods January 1, 2010 through June 25, 2010, June 26, 2010 through December 31, 2010 and the years ended December 31, 2009 and 2008
Successor | Predecessor | |||||||||||||||||||||||
Year ended December 31, 2010 | ||||||||||||||||||||||||
Combined | Carlsbad | Period from June 26 to December 31 | Period from January 1 to June 25 | Year Ended December 31, 2009 | Year Ended December 31, 2008 | |||||||||||||||||||
Revenues: | Unaudited | |||||||||||||||||||||||
Rent | $ | 11,960,905 | $ | 1,626,181 | $ | 5,123,097 | $ | 5,211,628 | $ | 12,369,330 | $ | 12,894,484 | ||||||||||||
Other income | 974,450 | 36,827 | 491,096 | 446,527 | 541,672 | 556,599 | ||||||||||||||||||
Total revenues | 12,935,355 | 1,663,008 | 5,614,193 | 5,658,155 | 12,911,002 | 13,451,083 | ||||||||||||||||||
Operating expenses: | ||||||||||||||||||||||||
Property taxes | 1,220,747 | 183,579 | 398,238 | 638,931 | 1,643,230 | 1,597,989 | ||||||||||||||||||
Utilities | 1,133,723 | 67,165 | 579,349 | 487,209 | 1,108,619 | 1,085,105 | ||||||||||||||||||
Association fees | 16,054 | 16,054 | — | — | 14,372 | 19,274 | ||||||||||||||||||
Repairs and maintenance | 1,151,873 | 225,935 | 480,259 | 445,679 | 1,396,658 | 1,330,230 | ||||||||||||||||||
Management fees paid to related party | 496,681 | 46,871 | 225,095 | 224,715 | 508,202 | 531,874 | ||||||||||||||||||
Acquisition fees paid to related party | 442,315 | — | 442,315 | — | — | — | ||||||||||||||||||
General and administrative | 1,119,094 | 120,071 | 517,910 | 481,113 | 773,996 | 832,793 | ||||||||||||||||||
Insurance | 280,219 | 27,740 | 122,204 | 130,275 | 283,906 | 289,153 | ||||||||||||||||||
Depreciation and amortization | 4,461,879 | 688,460 | 2,128,829 | 1,644,590 | 4,208,445 | 4,289,954 | ||||||||||||||||||
Interest | 5,889,287 | 631,690 | 2,359,754 | 2,897,843 | 6,564,327 | 6,592,707 | ||||||||||||||||||
Marketing and promotion | 153,016 | 5,917 | 61,194 | 85,905 | 240,702 | 200,259 | ||||||||||||||||||
Bad debt expense | 6,234 | — | 2,983 | 3,252 | 12,579 | 56,086 | ||||||||||||||||||
Other property operating expenses | 245,546 | — | 133,199 | 112,347 | 165,974 | 147,556 | ||||||||||||||||||
Impairment loss | — | — | — | — | — | 8,750,000 | ||||||||||||||||||
Total operating expenses | 16,616,668 | 2,013,482 | 7,451,329 | 7,151,859 | 16,921,010 | 25,722,980 | ||||||||||||||||||
Gain on exiting of mortgage loans | 9,091,522 | 3,500,000 | 5,591,522 | — | — | — | ||||||||||||||||||
Revaluation loss on change in ownership | (8,386,821 | ) | — | — | (8,386,821 | ) | — | — | ||||||||||||||||
(Loss) income from continuing operations | (2,976,612 | ) | 3,149,526 | 3,754,386 | (9,880,525 | ) | (4,010,008 | ) | (12,271,897 | ) | ||||||||||||||
Discontinued Operations | ||||||||||||||||||||||||
Income from discontinued operations | — | — | — | — | — | 2,743,534 | ||||||||||||||||||
Net (loss) income | $ | (2,976,612 | ) | $ | 3,149,526 | $ | 3,754,386 | $ | (9,880,525 | ) | $ | (4,010,008 | ) | $ | (9,528,363 | ) | ||||||||
See accompanying notes to combined financial statements
103
KW/WDC Portfolio Member LLC and One Carlsbad
Combined Statements of Equity
Years ended December 31, 2010, 2009, and 2008
KW/WDC Portfolio Member LLC | One Carlsbad | Total | ||||||||||
Members' equity at December 31, 2007 (unaudited) | $ | 36,647,690 | $ | 3,409,187 | $ | 40,056,877 | ||||||
Contributions | 1,524,634 | — | 1,524,634 | |||||||||
Distributions | (8,311,023 | ) | (360,000 | ) | (8,671,023 | ) | ||||||
Net loss | (8,972,391 | ) | (555,972 | ) | (9,528,363 | ) | ||||||
Members' equity at December 31, 2008 (unaudited) | 20,888,910 | 2,493,215 | 23,382,125 | |||||||||
Contributions | 156,308 | — | 156,308 | |||||||||
Distributions | (304,033 | ) | (124,500 | ) | (428,533 | ) | ||||||
Net loss | (3,302,321 | ) | (707,687 | ) | (4,010,008 | ) | ||||||
Members' equity at December 31, 2009 (unaudited) | 17,438,864 | 1,661,028 | 19,099,892 | |||||||||
Contributions | — | 3,900,000 | 3,900,000 | |||||||||
Distributions | (2,531,306 | ) | — | (2,531,306 | ) | |||||||
Net loss | (9,880,525 | ) | — | (9,880,525 | ) | |||||||
Members' equity at June 25, 2010 | 5,027,033 | 5,561,028 | 10,588,061 | |||||||||
Contributions | 16,154,513 | — | 16,154,513 | |||||||||
Distributions | (1,850,000 | ) | — | (1,850,000 | ) | |||||||
Net income (loss) | 3,754,387 | 3,149,526 | 6,903,913 | |||||||||
Members' equity at December 31, 2010 | $ | 23,085,933 | $ | 8,710,554 | $ | 31,796,487 | ||||||
See accompanying notes to combined financial statements
104
KW/WDC Portfolio Member LLC and One Carlsbad
Combined Statements of Cash Flows
For the periods January 1, 2010 through June 25, 2010, June 26, 2010 through December 31, 2010 and the years ended December 31, 2009 and 2008
Successor | Predecessor | |||||||||||||||||||||||
Year ended December 31, 2010 | ||||||||||||||||||||||||
Combined | Carlsbad | Period from June 26 to December 31 | Period from January 1 to June 25 | Year Ended December 31, 2009 | Year Ended December 31, 2008 | |||||||||||||||||||
Cash flows from operating activities: | Unaudited | |||||||||||||||||||||||
Net income (loss) | $ | (2,976,613 | ) | $ | 3,149,526 | $ | 3,754,387 | $ | (9,880,525 | ) | $ | (4,010,008 | ) | $ | (9,528,363 | ) | ||||||||
Adjustments to reconcile net loss to net cash (used in) provided by operating activities: | ||||||||||||||||||||||||
Gain on exiting of mortgage loans | (9,091,522 | ) | (3,500,000 | ) | (5,591,522 | ) | — | — | — | |||||||||||||||
Revaluation loss on change in ownership | 8,386,821 | — | — | 8,386,821 | — | — | ||||||||||||||||||
Depreciation and amortization | 4,485,763 | 712,344 | 2,128,829 | 1,644,590 | 4,252,744 | 5,305,243 | ||||||||||||||||||
Gain on the sale of property | — | — | — | — | — | (3,050,390 | ) | |||||||||||||||||
Impairment Loss | — | — | — | — | — | 8,750,000 | ||||||||||||||||||
Change in assets and liabilities: | ||||||||||||||||||||||||
Real estate taxes and insurance reserves held in escrow | 159,803 | (27,303 | ) | 493,575 | (306,469 | ) | 45,886 | (49,503 | ) | |||||||||||||||
Accounts receivable | (32,240 | ) | (8,991 | ) | 6,752 | (30,002 | ) | 49,807 | 112,602 | |||||||||||||||
Prepaid expenses and other assets | (6,888 | ) | 912 | (161,391 | ) | 153,590 | (23,126 | ) | 22,991 | |||||||||||||||
Accrued rent | (68,476 | ) | (68,476 | ) | — | — | (26,865 | ) | (6,148 | ) | ||||||||||||||
Accounts payable and accrued expenses | (79,649 | ) | 85,948 | (1,338,759 | ) | 1,173,162 | 134,547 | (649,501 | ) | |||||||||||||||
Security deposits and other liabilities | (2,948 | ) | (16,252 | ) | (26,285 | ) | 39,589 | 11,333 | (175,139 | ) | ||||||||||||||
Net cash (used in) provided by operating activities | 774,051 | 327,708 | (734,414 | ) | 1,180,756 | 434,318 | 731,792 | |||||||||||||||||
Cash flows from investing activities: | ||||||||||||||||||||||||
Additions to real estate | (1,034,005 | ) | (171,000 | ) | (636,483 | ) | (226,521 | ) | (603,816 | ) | (3,731,473 | ) | ||||||||||||
Proceeds from sale of real estate | — | 22,966,000 | ||||||||||||||||||||||
Deferred leasing costs | (183,377 | ) | (183,377 | ) | — | — | (39,102 | ) | (44,358 | ) | ||||||||||||||
Capital expenditure from repair and replacement reserves held in escrow | (229,641 | ) | (2,559,952 | ) | 17,514 | 2,312,797 | 141,306 | 362,540 | ||||||||||||||||
Net cash used in investing activities | (1,447,023 | ) | (2,914,329 | ) | (618,969 | ) | 2,086,276 | (501,612 | ) | 19,552,709 | ||||||||||||||
Cash flows from financing activities: | ||||||||||||||||||||||||
Payments of mortgage loans payable | (13,624,212 | ) | (1,167,734 | ) | (12,456,478 | ) | — | (208,922 | ) | (13,131,619 | ) | |||||||||||||
Deferred financing fees | (706,762 | ) | (151,000 | ) | (555,762 | ) | — | (15,000 | ) | — | ||||||||||||||
Contributions from members | 20,054,513 | 3,900,000 | 16,154,513 | — | 156,308 | 1,524,634 | ||||||||||||||||||
Distributions to members | (4,381,306 | ) | — | (1,850,000 | ) | (2,531,306 | ) | (428,533 | ) | (8,671,023 | ) | |||||||||||||
Net cash provided by (used in) financing activities | 1,342,233 | 2,581,266 | 1,292,273 | (2,531,306 | ) | (496,147 | ) | (20,278,008 | ) | |||||||||||||||
Net change in cash | 669,261 | (5,355 | ) | (61,110 | ) | 735,726 | (563,441 | ) | 6,493 | |||||||||||||||
Cash at beginning of period | 966,451 | 9,918 | 1,692,260 | 956,533 | 1,529,892 | 1,523,399 | ||||||||||||||||||
Cash at end of period | $ | 1,635,712 | $ | 4,563 | $ | 1,631,150 | $ | 1,692,259 | $ | 966,451 | $ | 1,529,892 | ||||||||||||
Supplemental disclosure of cash flow information: | ||||||||||||||||||||||||
Cash paid for interest | $ | 4,420,620 | $ | 5,974,217 | $ | 5,032,361 | ||||||||||||||||||
Supplemental disclosure of noncash investing and financing activities: | ||||||||||||||||||||||||
Accrued additions to real estate included in accounts payable and accrued expenses | $ | 65,780 | $ | 4,157 | $ | 105,375 | ||||||||||||||||||
See accompanying notes to combined financial statements
105
KW/WDC Portfolio Member LLC
(A Delaware Limited Liability Company)
and ONE CARLSBAD
Notes to Combined Financial Statements
December 31, 2010 and 2009
(1) Organization
(a) | KW/WDC Portfolio Member LLC |
KW/WDC Portfolio Member LLC, a Delaware limited liability company (the Company) was formed on March 16, 2006. The Company had three members: (1) Kenedix GP, LLC (KDX), (2) K-W Properties (KWP), and (3) KW/WDC Portfolio Executives LLC (EXEC). The Company was organized to own an interest in KW/WDC Apartment Portfolio LLC.
The Company is the Developer Member of KW/WDC Apartment Portfolio LLC (the Portfolio), a Delaware limited liability company, which had two members: (1) the Company, and (2) Wachovia Development Corporation (WDC). The Portfolio is engaged in the acquisition, operation, improvement, and future disposition of an apartment portfolio consisting of four apartment buildings one of which was sold in December 2008.
On June 25, 2010 KWP acquired 100% of the KDX and EXEC interests in the Company. Simultaneously, the Company acquired 100% of the WDC Member interest in the Portfolio and the WDC member withdrew from the Portfolio. This resulted in KWP being the sole member of the Company and the Company being the sole member of the Portfolio.
On June 25, 2010 Arbor Bay Shorepark LLC, a Delaware limited liability company (Arbor) was admitted to the Company as a member and joint manager.
Each member of the Company contributed capital in the amount of $2,734,662 on June 25, 2010 and has a 50% membership interest in the Company. In accordance with the Company's amended and restated limited liability agreement, distributions are made to members in proportion to their capital contributions until those capital contributions has been reduced to zero, and in proportion to their percentage interest thereafter.
As a result of the ownership changes described above, push down accounting was applied to the transaction. Accordingly, the assets of the Company were revalued based on the restated equity at the time of the transaction.
Kennedy-Wilson Holdings, Inc. (KWH), an affiliate of KWP, has guaranteed certain exceptions to the nonrecourse liability of the mortgage loan.
(b) | One Carlsbad |
KWI Property Fund I, LP, a Delaware limited partnership (Fund I), acquired the property known as One Carlsbad (Carlsbad) on March 23, 2005 as a wholly owned subsidiary. Carlsbad consists of two suburban office buildings with surface parking located in Carlsbad, California. Kennedy-Wilson Property Services, Inc., a Delaware corporation and an affiliate of KWH, is the general partner of Fund I. Subsequently, on January 31, 2006, a 62.42% undivided interest in this property was sold to Sunrise Property Associates, LLC, a Delaware limited liability company, (Sunrise) and a Tenancy in Common Agreement was executed effective January 31, 2006.
Pursuant to this Tenancy in Common Agreement, neither a partnership nor a joint venture is formed and each tenant in common shall contribute, share and pay, in accordance with its respective tenant in common interest, all losses, burdens, duties, liabilities, costs and expenses incurred in connection with the property. Each tenant in common will, from time to time in proportion to its respective tenant in common interest, contribute monies which the tenants in common, in good faith, mutually agreed in writing to be reasonably required to maintain and operate the property. Allocations of income and expense and distributions are to each tenant in common in proportion to its respective interest. The Tenancy in Common Agreement remains in place until one tenant in common becomes the sole owner, the tenants in common agree to terminate the agreement, or the property is sold.
On September 30, 2010 KWP an affiliate of KWH acquired a 90% interest in Sunrise and thereby became the majority owner and manager of the 62.42% tenant in common.
(2) Summary of Significant Accounting Policies
106
KW/WDC Portfolio Member LLC
(A Delaware Limited Liability Company)
and ONE CARLSBAD
Notes to Combined Financial Statements
December 31, 2010 and 2009
Balances related to the year ended December 21, 2009 and the two year period ended December 31, 2009 are unaudited balances.
The financial statements of the Company and One Carlsbad (the Entities) have been presented on a combined basis in accordance with SX 2.10.3-09 (c) and are both 50% or less owned investments of KWH. All intercompany transactions have been eliminated in combination.
(a) | Principles of Combination and Consolidation |
The combined financial statements include the consolidated accounts of the Company with its wholly owned subsidiaries and One Carlsbad.
The Portfolio indirectly owns its real estate through the following wholly owned subsidiaries:
KW/WDC Beaverton LLC
KW/WDC Beaverton LLC (Beaverton) was formed on March 17, 2006, with the Portfolio as the sole member. Beaverton acquired the real property known as the Villas at Arbor Creek Apartments, a 440-unit apartment complex located in Beaverton, Oregon.
KW/WDC Norwalk LLC
KW/WDC Norwalk LLC (Norwalk) was formed on March 16, 2006, with the Portfolio as sole member. Norwalk acquired the real property known as the Courtyards Apartments, a 153-unit apartment complex located in Norwalk, California. Norwalk was sold in December of 2008 and is reflected as discontinued operations in the accompanying combined statement of operations.
KW/WDC Sacramento LLC
KW/WDC Sacramento LLC (Sacramento) was formed on March 16, 2006, with the Portfolio as sole member. Sacramento acquired the real property known as the Shorepark Apartments, a 393-unit apartment complex located in Sacramento, California.
KW/WDC Vallejo LLC
KW/WDC Vallejo LLC (Vallejo) was formed on March 16, 2006, with the Portfolio as sole member. Vallejo acquired the real property know, as the Bay Village Apartments, a 260-unit apartment complex located in Vallejo, California.
Each of the above entities shall exist until December 31, 2056, unless terminated sooner pursuant to the limited liability company agreement or by operation of law.
(b) Real Estate
The three apartment complexes, discussed above that were still owned at December 31, 2010 and 2009, were all acquired in March 2006 for a combined acquisition cost of $117,986,938, including capitalized acquisition costs of $1,935,638. As a result of the push down accounting described in the transaction above, the fair value of the real estate and related intangible assets was adjusted to $93,465,482 at the time of the transaction on June 25, 2010.
The fair value of real estate acquired was allocated to the acquired tangible assets, consisting primarily of land and building, and to the fair value of the identified acquired intangible assets, which primarily comprised in-place leases valued at $1,213,871, which was fully amortized in 2010.
The fair value of real estate was determined by valuing the property as if it were vacant, which was then allocated to land and building, based on management's determination of the relative fair values of these assets. The fair value of the acquired in-place lease value was determined by calculating the present value of the cash flows provided by the leases, net of related incremental expenses over the estimated lease-up period.
107
KW/WDC Portfolio Member LLC
(A Delaware Limited Liability Company)
and ONE CARLSBAD
Notes to Combined Financial Statements
December 31, 2010 and 2009
Carlsbad was acquired on March 23, 2005 for $19,615,125, including capitalized acquisition costs of $240,125. The fair value of real estate acquired was allocated to the acquired tangible assets, consisting of land and building, and to the fair value of the identified acquired intangible assets, which comprised in-place and above and below market lease values.
Property is recorded at cost and is depreciated using the straight line method over the estimated useful lives of the assets as follows:
Building | 39 years | |
Building improvements | 10 - 39 years | |
Equipment | 7 - 10 years | |
Tenant improvements | Lesser of usefil life of the asset or lease |
(c) | Impairment of Long-Lived Assets |
Long-lived assets are reviewed for impairment whenever events or changes in circumstances indicate that the carrying amount of an asset may not be recoverable in accordance with Impairment of Long-Lived Assets ASC Subtopic 360-10. Recoverability of assets to be held and used is measured by a comparison of the carrying amount of an asset to the estimated undiscounted future cash flows expected to be generated by the asset. If the carrying amount of an asset exceeds its estimated undiscounted future cash flows, an impairment charge is recognized in the amount by which the carrying amount of the asset exceeds the fair value of the asset. Assets to be disposed of would be separately presented in the balance sheet and reported at the lower of the carrying amount or fair value less costs to sell, and are no longer depreciated. The assets and liabilities of a disposal group classified as held for sale would be presented separately in the appropriate asset and liability sections of the balance sheet.
During the year ended December 21, 2008, based on the analysis described above, management determined that the Sacramento property was impaired and recognized an impairment loss of $8,750,000, which is included in the accompanying combined statement of operations.
(d) | Cash |
The Entities maintains their cash in federally insured banking institutions. The account balances at these institutions periodically exceed the Federal Deposit Insurance Corporation's (FDIC) insurance coverage and, as a result, there is a concentration of credit risk related to amounts in excess of FDIC insurance coverage. To mitigate this risk, the Entities place their cash with quality financial institutions.
(e) | Repair and Replacement Reserves and Real Estate Taxes and Insurance, Held in Escrow |
Deposits in escrow are typically funds held by a mortgage lender that are restricted in use for payment of real estate taxes, property insurance, and certain capital expenditures. Funds in tax and insurance escrows are used to pay real estate taxes and insurance premiums directly to the taxing authorities and insurance agencies, respectively. Funds in capital expenditure escrows are generally disbursed as reimbursement to the borrower upon submission of satisfactory evidence that the related capital expenditures are incurred as anticipated. These escrow deposits are refundable to the borrower upon repayment of the mortgage loan.
(f) | Accounts Receivable |
Accounts receivable due from tenants are recorded at the contractual amount as determined by the lease agreements, and do not bear interest. The allowance for doubtful accounts is the Entities' best estimate of the amount of probable credit losses in the Entities' existing accounts receivable. The Entities determine the allowance based on historical experience and specific item identification, which is reviewed on a quarterly basis. Account balances are charged off against the allowance after all means of collection have been exhausted and the potential for recovery is considered remote.
108
KW/WDC Portfolio Member LLC
(A Delaware Limited Liability Company)
and ONE CARLSBAD
Notes to Combined Financial Statements
December 31, 2010 and 2009
(g) | Deferred Financing and Leasing Costs |
Costs incurred in obtaining the mortgage loans are capitalized and amortized over the term of the mortgage loans on a straight-line basis, which approximates the effective-interest method. Amortization of the deferred financing costs were $18,713, $116,760 and $165,423 for the years ended December 31, 2010, 2009, and 2008 respectively, and is included in interest expense in the accompanying combined statements of operations. Costs incurred in securing leases are capitalized as deferred leasing costs and amortized over the life of the related lease.
(h) | Income Taxes |
No provision has been made in the accompanying consolidated financial statements for federal or state income taxes, as any such taxes related to the revenues and expenses of the Entities are the responsibility of the members.
The Entities are required to determine whether a tax position is more likely than not to be sustained upon examination by the applicable taxing authority, including resolution of any related appeals or litigation processes, based on the technical merits of the position. The tax benefit to be recognized is measured as the largest amount of benefit that is greater than fifty percent likely of being realized upon ultimate settlement, which could result in the Entities recording a tax liability that would reduce net assets. Based on their analysis, the Entities have determined that there are no tax benefits that would have a material impact on the Entities' financial position or results of operations. The tax years 2006 through 2009 remain open to examination by the taxing jurisdictions to which the Entities are subject.
(i) | Revenue Recognition |
Residential leases are for one year or less and revenue is recognized as earned. The lease amount for residential leases is fixed over the term of the lease and as such earned revenue approximates straight line revenue.
Office leases are typically entered into for a period of 5 years. Rental revenue related to office properties is recognized on the straight-line basis over the terms of the leases.
(j) | Use of Estimates |
The preparation of the accompanying combined financial statements in conformity with U.S. generally accepted accounting principles requires management to make estimates and assumptions about future events. These estimates and the underlying assumptions affect the amounts of assets and liabilities reported, and reported amounts of revenues and expenses. As future events and their effects cannot be determined with precision, actual results could differ significantly from these estimates. Changes in those estimates resulting from continuing changes in the economic environment will be reflected in the financial statements in future periods.
(4) Mortgage Loans Payable
(a) | Beaverton |
On June 1, 2006, Beaverton refinanced their mortgage loan with Wachovia for a total commitment of $25,900,000 (the Beaverton Loan). The initial advance under the Beaverton Loan was $25,230,000 with the balance being made available upon Beaverton satisfying certain conditions. On August 8, 2006, these conditions were met and the balance of the Beaverton Loan proceeds totaling $670,000 was distributed to the Company. Interest on this loan was fixed at a rate of 6.30% and required monthly interest-only payments until the loan was settled on September 29, 2010.
On September 29, 2010, the Beaverton Loan with a principal balance of $25,900,000 was refinanced with a Fannie Mae $21,262,000 10-year loan. The Fannie Mae Beaverton loan accrues interest at a fixed rate of 4.39% and requires monthly interest-only payments until May 1, 2013, at which time, principal and interest payments of $106,346 are due on a monthly basis until maturity. The loan matures on October 1, 2020 at which point all accrued and unpaid interest along with the principal amount outstanding, shall be due. The Fannie Mae Loan may be prepaid in whole, but not in part, with no prepayment premium any time after the last calendar day of the 4th month prior to the month in which the maturity date occurs (the open period). If any prepayment occurs prior to the open period but after the Yield Maintenance Period End Date, which is 114 months from October 1st 2010, the prepayment premium is 1.00% of the amount of principal being prepaid. If the prepayment occurs prior to the Yield Maintenance Period End Date,
109
KW/WDC Portfolio Member LLC
(A Delaware Limited Liability Company)
and ONE CARLSBAD
Notes to Combined Financial Statements
December 31, 2010 and 2009
the lender is to be paid a prepayment fee calculated as the greater of either (A) 1.00% of the principal amount being prepaid or (B) the present value of a series of payments equal to the payment differential over the remaining life of the loan that will allow the lender to attain a certain minimum yield maintenance premium as defined in the promissory note. The Fannie Mae Loan is secured by a first deed of trust and assignment of leases and rents of the Beaverton Property.
Due to the difference between the amounts of the original Beaverton Loan and the new Fannie Mae loan, the members contributed additional equity of $5,851,878 in 2010.
(b) | Sacramento |
On June 1, 2006, Sacramento refinanced their mortgage loan with Wachovia for a total amount of $38,800,000 (the Sacramento Loan). The Sacramento Loan accrued interest at a fixed rate of 6.30% and required monthly interest-only payments until the loan was settled at a discount on September 29, 2010. At the time of the settlement, the loan had an outstanding balance of $41,067,860 including principal and accrued interest. The loan was settled for $34,000,000 in cash and $1,476,338 in retained escrow funds resulting on a gain of $5,591,522. This gain is included in the gain on exiting of mortgage loans in the accompanying combined statement of operations.
On September 29, 2010, the Sacramento Loan was refinanced with a Fannie Mae $28,790,000 10-year loan. The Fannie Mae Sacramento Loan accrues interest at a fixed rate of 4.39% and requires monthly interest-only payments until May 1, 2013, at which time, principal and interest payments of $143,999 are due on a monthly basis until maturity. The loan matures on October 1, 2020 at which point all accrued and unpaid interest along with the principal amount outstanding, shall be due. The Fannie Mae Loan may be prepaid in whole, but not in part, with no prepayment premium any time after the last calendar day of the 4th month prior to the month in which the maturity date occurs (the open period). If any prepayment occurs prior to the open period but after the Yield Maintenance Period End Date, which is 114 months from October 1, 2010, the prepayment premium is 1.00% of the amount of principal being prepaid. If the prepayment occurs prior to the Yield Maintenance Period End Date, the lender is to be paid a prepayment fee calculated as the greater of either (A) 1.00% of the principal amount being prepaid or (B) the present value of a series of payments equal to the payment differential over the remaining life of the loan that will allow the lender to attain a certain minimum yield maintenance premium as defined in the promissory note. The Fannie Mae Loan is secured by a first deed of trust and assignment of leases and rents of the Sacramento Property.
Due to the difference between the amounts of the discounted payoff of the Sacramento Loan and the new Fannie Mae loan, the partnership contributed additional equity of $5,867,089 in 2010.
(c) | Vallejo |
On June 1, 2006, Vallejo refinanced their mortgage loan with Wachovia for a total amount of $24,500,000 (the Vallejo Loan).The Loan accrued interest at a fixed rate of 6.30% and required monthly interest-only payments until the loan was settled on September 29, 2010.
On September 29, 2010, the Vallejo Loan with a principal balance of $24,500,000 was refinanced with a Fannie Mae $21,100,000 10-year loan. The Fannie Mae Vallejo Loan accrues interest at a fixed rate of 4.39% and requires monthly interest-only payments until May 1, 2013, at which time, principal and interest payments of $105,536 are due on a monthly basis until maturity. The loan matures on October 1, 2020 at which point all accrued and unpaid interest along with the principal amount outstanding, shall be due. The Fannie Mae Loan may be prepaid in whole, but not in part, with no prepayment premium any time after the last calendar day of the 4th month prior to the month in which the maturity date occurs (the open period). If any prepayment occurs prior to the open period but after the Yield Maintenance Period End Date, which is 114 months from October 1, 2010, the prepayment premium is 1% of the amount of principal being prepaid. If the prepayment occurs prior to the Yield Maintenance Period End Date, the lender is to be paid a prepayment fee calculated as the greater of either (A) 1.00% of the principal amount being prepaid or (B) the present value of a series of payments equal to the payment differential over the remaining life of the loan that will allow the lender to attain a certain minimum yield maintenance premium as defined in the promissory note. The Fannie Mae Loan is secured by a first deed of trust and assignment of leases and rents of the Vallejo Property.
110
KW/WDC Portfolio Member LLC
(A Delaware Limited Liability Company)
and ONE CARLSBAD
Notes to Combined Financial Statements
December 31, 2010 and 2009
Due to the difference between the amounts of the original Vallejo Loan and the new Fannie Mae loan, the members contributed additional equity of $3,993,252.
(d) | One Carlsbad |
Carlsbad entered into a loan agreement dated March 23, 2005 with Wachovia Bank, N. A. (Wachovia) for the principal sum of $15,400,000. The note accrued interest at 5.35%, with interest only payments through May 11, 2008, and principal and interest payments of $85,995 thereafter until maturity on April 11, 2010.
Pursuant to an agreement with Wachovia, interest and escrow requirements were paid as due from the maturity date until September 30, 2010 when a loan modification agreement was executed between the tenants in common and Wachovia. On September 30, 2010, a loan modification agreement was executed between the tenants in common and Wachovia. Pursuant to this loan modification, the loan was paid down by $1,000,000, and bears interest at 5% with interest only payments due until the extended maturity date of April 11, 2015 at which time all unpaid principal and interest shall be due. The loan modification further provided that the outstanding principal balance was reduced by $3,500,000. This gain is included in the gain on exiting of mortgage loans in the accompanying combined statement of operations.
Future combined principal payments on the mortgage notes payable are as follows for the years ended December 31:
Total | ||||
2011 | $ | — | ||
2012 | — | |||
2013 | 774,531 | |||
2014 | 1,205,059 | |||
2015 | 11,650,763 | |||
Thereafter | 67,913,372 | |||
Total | $ | 81,543,725 | ||
(4) | Related Party Transactions |
Commencing October 1, 2006, each Property entered into a management agreement with a third party, FPI Management, Inc. (FPI). In accordance with the management agreement, each Property pays a monthly fee of 4% of gross rental revenues as compensation for management services. Per the agreement, 2.5% is paid to FPI and 1.5% is paid to KW Multi-Family Management Group, Ltd. (KWMF), which is an affiliate of KWP.
Commencing August 15, 2007, Beaverton entered into a management agreement with a third party, HSC Real Estate, Inc. (HSCREI) that replaced the agreement with FPI. In accordance with the management agreement, Beaverton pays a monthly fee of 4% of collected income as compensation for management services. Per the agreement, 3% is paid to HSCREI and 1% is paid to KWMF, which is an affiliate of KWP.
The Portfolio incurred $150,406, $151,609 and $187,080 in property management fees during the years ended December 31, 2010, 2009, and 2008, respectively, that were paid to KWP. In addition, the Entities paid $35,268 in expense reimbursements for the year ended December 31, 2008.
One Carlsbad entered into a management agreement with KWP. In accordance with the management agreement, KWP receives the greater of 3% per annum of the gross rentals of the property or $4,000 per month as a management fee, a construction supervision fees of 4% of costs incurred, and certain reimbursements. A separate listing agreement provides for leasing commissions pursuant to a schedule in line with industry standards.
Fees earned by KWP or KWP affiliates are as follows for the years ended December 31, 2010, 2009, and 2008:
111
KW/WDC Portfolio Member LLC
(A Delaware Limited Liability Company)
and ONE CARLSBAD
Notes to Combined Financial Statements
December 31, 2010 and 2009
2010 | 2009 | 2008 | ||||||||||
Acquisition fees | $ | 442,315 | $ | — | $ | — | ||||||
Property management fees | 46,871 | 57,589 | 65,371 | |||||||||
Accounting fees | 3,503 | 6,000 | 6,000 | |||||||||
Leasing commissions | 10,276 | 29,769 | 2,695 | |||||||||
Construction supervision fees | 4,563 | — | 1,324 | |||||||||
Maintenance fees | 1,500 | 6,000 | 6,000 | |||||||||
Totals | $ | 509,028 | $ | 99,358 | $ | 81,390 | ||||||
The construction supervision fees and leasing fees are capitalized to tenant improvements and deferred leasing costs, respectively.
(6) Lease Arrangements
The following is a schedule of future minimum rents to be received under noncancelable operating leases for One Carlsbad as of December 31, 2010:
Total | ||||
2011 | $ | 1,067,559 | ||
2012 | 853,559 | |||
2013 | 635,189 | |||
2014 | 493,403 | |||
2015 | 384,926 | |||
Total | $ | 3,434,636 | ||
Contractual rents are normally increased over the term of the lease. Depending on local market factors, increases may be structured as a fixed percentage increase for each year of the lease or as an increase based on the Consumer Price Index. Also, concessions in the form of free rent may sometimes be provided. Such determinable changes in contractual rents are recognized on a straight line basis over the life of the lease.
In addition to base rent, most tenants are assessed monthly for their proportionate share of estimated net increases in property operating costs and real property taxes. Such expense reimbursements are typically amounts in excess of the tenant's share of expenses attributable to a base year stipulated in the lease.
Leases related to the multifamily investments do not exceed twelve months.
(7) Subsequent Events
Management has evaluated all subsequent events through March 11, 2011 the date that the financial statements are available for issuance.
112
Item 9. Changes in and Disagreements with Accountants on Accounting and Financial Disclosure
None.
Item 9A. Controls and procedures
Disclosure controls and procedures and changes in internal control over financial reporting during the latest quarter
Disclosure controls and procedures are designed to ensure that information required to be disclosed by us in reports filed or submitted under the Exchange Act is recorded, processed, summarized and reported within the time periods specified in the SEC’s rules and forms. Disclosure controls include, without limitation, controls and procedures designed to ensure that information required to be disclosed under the Exchange Act is accumulated and communicated to management, including principal executive and financial officers, as appropriate to allow timely decisions regarding required disclosure. There are inherent limitations to the effectiveness of any system of disclosure controls and procedures, including the possibility of human error and the circumvention or overriding of the controls and procedures. Accordingly, even effective disclosure controls and procedures can only provide reasonable assurance of achieving their control objectives.
Our management carried out an evaluation, under the supervision of our Chief Executive Officer and Chief Financial Officer, of the effectiveness of the design and operation our disclosure controls and procedures as of December 31, 2010. Based upon that evaluation, our management, including our Chief Executive Officer and Chief Financial Officer, concluded that our disclosure controls and procedures were effective as of December 31, 2010.
Management’s Report on Internal Control over Financial Reporting
Our management, including our Chief Executive Officer and Chief Financial Officer, is responsible for establishing and maintaining adequate internal control over financial reporting, as defined in Rules 13a-15(e) and 15d-15(e) of the Exchange Act.
Our management conducted an evaluation of the effectiveness of our internal control over financial reporting based on criteria established in Internal Control - Integrated Framework issued by the Committee of Sponsoring Organizations of the Treadway Commission. Based on this evaluation, management concluded that our internal control over financial reporting was effective as of December 31, 2010.
KPMG LLP, an independent registered public accounting firm, audited the effectiveness of our internal control over financial reporting as of December 31, 2010, as stated in their report included in this report.
Changes in Internal Control Over Financial Reporting
There were no changes during our last fiscal quarter that materially affected, or are reasonably likely to materially affect, our internal control over financial reporting.
Item 9B. Other Information
None.
113
PART III
Item 10. Directors, Executive Officers and Corporate Governance
The information called for by this item is incorporated by reference from our definitive proxy statement for the fiscal year ended December 31, 2010, to be filed with the SEC within 120 days after the end of our fiscal year.
Item 11. Executive Compensation
The information called for by this item is incorporated by reference from our definitive proxy statement for the fiscal year ended December 31, 2010, to be filed with the SEC within 120 days after the end of our fiscal year.
Item 12. Security Ownership of Certain Beneficial Owners and Management and Related Stockholder Matters
The information called for by this item is incorporated by reference from our definitive proxy statement for the fiscal year ended December 31, 2010, to be filed with the SEC within 120 days after the end of our fiscal year.
Item 13. Certain Relationships and Related Transactions, and Director Independence
The information called for by this item is incorporated by reference from our definitive proxy statement for the fiscal year ended December 31, 2010, to be filed with the SEC within 120 days after the end of our fiscal year.
Item 14. Principal Accounting Fees and Services
The information called for by this item is incorporated by reference from our definitive proxy statement for the fiscal year ended December 31, 2010, to be filed with the SEC within 120 days after the end of our fiscal year.
114
PART IV
Item 15. Exhibits and Financial Statement Schedules
(a) The following documents are filed as part of this annual report:
(1) | Financial Statements. See the accompanying Index to Consolidated Financial Statements, which appears on page 37 of the annual report. The Report of Independent Registered Public Accounting Firm, the Consolidated Financial Statements and the Notes to Consolidated Financial Statements listed in the Index to Consolidated Financial Statements, which appear beginning on page 37 of this report, are incorporated by reference into Item 8 above. |
(2) | Financial Statement Schedules. Schedule III listed in the Index to Consolidated Financial Statements, which appear beginning on page 37 of this report, are incorporated by reference into Item 8 above. All other Financial Statement Schedules have been omitted because the information required to be set forth therein is either not applicable or is included in the Consolidated Financial Statements or the notes thereto. |
(3) | Exhibits. See Item 15(b) below. |
(b) Exhibits. The exhibits listed on the Exhibit Index set forth below on page 119 are filed as part of, or are incorporated by reference into, this annual report on Form 10-K.
115
SIGNATURES
Pursuant to the requirements of Section 13 or 15(d) of the Securities Exchange Act of 1934, as amended, the registrant has duly caused this report to be signed on its behalf by the undersigned, thereunto duly authorized, on the 11th day of March 2011.
KENNEDY-WILSON HOLDINGS, INC., a Delaware corporation | ||
By: | /s/ WILLIAM J. MCMORROW | |
William J. McMorrow | ||
Chief Executive Officer | ||
KNOW ALL PERSONS BY THESE PRESENTS, that each person whose signature appears below constitutes and appoints William J. McMorrow and Freeman Lyle, and each of them, his/her attorneys-in-fact, each with the power of substitution, for him/her in any and all capacities, to sign any amendments to this annual report on Form 10-K, and to file the same, with exhibits thereto and other documents in connection therewith with the Securities and Exchange Commission, hereby ratifying and confirming all that each of said attorneys-in-fact, or substitute or substitutes may do or cause to be done by virtue hereof.
Pursuant to the requirements of the Securities Exchange Act of 1934, this report has been signed below by the following persons on behalf of the registrant and in the capacities and on the date indicated.
Name | Title | Date | ||
/S/ WILLIAM J. MCMORROW William J. McMorrow | Chief Executive Officer (principal executive officer) and Chairman | March 11, 2011 | ||
/S/ FREEMAN LYLE Freeman Lyle | Executive Vice President and Chief Financial Officer (principal financial officer and principal accounting officer) | March 11, 2011 | ||
/S/ KENT MOUTON Kent Mouton | Director | March 11, 2011 | ||
/S/ JERRY R. SOLOMON Jerry R. Solomon | Director | March 11, 2011 | ||
/S/ NORM CREIGHTON Norm Creighton | Director | March 11, 2011 | ||
/S/ STANLEY ZAX Stanley Zax | Director | March 11, 2011 | ||
/S/ DAVID A. MINELLA David A. Minella | Director | March 11, 2011 | ||
/S/ CATHY HENDRICKSON Cathy Hendrickson | Director | March 11, 2011 | ||
116
EXHIBIT INDEX
Exhibit No. | Description | |
2.1 | Agreement and Plan of Merger, by and among Prospect Acquisition Corp., KW Merger Sub Corp. and Kennedy-Wilson, Inc., dated as of September 8, 2009.(1) | |
2.2 | Amendment No. 1 to the Agreement and Plan of Merger dated October 22, 2009 between Prospect Acquisition Corp., KW Merger Sub Corp. and Kennedy-Wilson, Inc.(1) | |
2.3 | Amendment No. 2 to the Agreement and Plan of Merger dated October 26, 2009 between Prospect Acquisition Corp., KW Merger Sub Corp. and Kennedy-Wilson, Inc.(1) | |
3.1 | Second Amended and Restated Certificate of Incorporation(2) | |
3.2 | Amended and Restated Bylaws.(3) | |
4.1 | Specimen Common Stock Certificate.(14) | |
4.2 | Specimen Warrant Certificate.(4) | |
4.3 | Amended and Restated Warrant Agreement between Continental Stock Transfer & Trust Company and Kennedy-Wilson Holdings, Inc.(5) | |
10.1 | Registration Rights Agreement dated November 14, 2007 by and among Prospect Acquisition Corp. and Flat Ridge Investments LLC, LLM Structured Equity Fund L.P., LLM Investors L.P., Capital Management Systems, Inc., SJC Capital LLC, Michael P. Castine, Daniel Gressel, Michael Downey, James J. Cahill and John Merchant.(9) | |
10.2 | Forfeiture Agreement dated September 8, 2009 by and among Prospect Acquisition Corp., De Guardiola Advisors, Inc., De Guardiola Holdings, Inc., Flat Ridge Investments LLC, LLM Structured Equity Fund L.P., LLM Investors L.P., CMS Platinum Fund, L.P., SJC Capital LLC, Michael P. Castine, Daniel Gressel, Michael Downey, James J. Cahill, John Merchant and Kennedy-Wilson, Inc.(12) | |
10.3 | Letter Agreement dated September 17, 2009 by Prospect Acquisition Corp. and Citigroup Global Markets Inc. Ladenburg Thalmann & Co. Inc. and I-Bankers Securities, Inc.(12) | |
10.4 | Letter Agreement dated September 4, 2009 by Prospect Acquisition Corp. and De Guardiola Advisors, Inc.(12) | |
10.5 | Lock-Up Agreement by Prospect Acquisition Corp. and certain stockholders of Prospect.(12) | |
10.6 | Kennedy-Wilson Holdings, Inc. 2009 Equity Participation Plan.(13) | |
10.7 | Form of Amended and Restated Consultant Restricted Stock Award Agreement to Kennedy-Wilson Holdings, Inc. 2009 Equity Participation Plan.(14) | |
10.8 | Form of Amended and Restated Employee Performance Unit Award Agreement to Kennedy-Wilson Holdings, Inc. 2009 Equity Participation Plan.(14) | |
10.9 | Form of Amended and Restated Employee Restricted Stock Award Agreement to Kennedy-Wilson Holdings, Inc. 2009 Equity Participation Plan.(14) | |
10.10 | Promissory Note issued by Kennedy-Wilson, Inc. to The Guardian Life Insurance Company of America on November 3, 2008.(12) | |
10.11† | Fifteenth Amendment to Employment Agreement by Kennedy-Wilson, Inc. and William J. McMorrow.(12) | |
10.12† | Employment Agreement dated August 14, 1992 between Kennedy-Wilson and William J. McMorrow.(12) | |
10.13† | Amendment to Employment Agreement dated as of January 1, 1993 between Kennedy-Wilson and William J. McMorrow.(12) | |
10.14† | Second Amendment to Employment Agreement dated as of between January 1, 1994 Kennedy-Wilson and William J. McMorrow.(12) | |
10.15 | Third Amendment to Employment Agreement dated as of March 31, 1995 between Kennedy-Wilson and William J. McMorrow.(15) | |
10.16† | Fourth Amendment to Employment Agreement dated as of January 1, 1996 Kennedy-Wilson and William J. McMorrow.(15) | |
117
Exhibit No. | Description | |
10.17† | Amendment to Employment Agreement dated as of February 28, 1996 between Kennedy-Wilson and William J. McMorrow.(12) | |
10.18† | Fifth Amendment to Employment Agreement dated as of May 19, 1997 between Kennedy-Wilson and William J. McMorrow.(15) | |
10.19† | Sixth Amendment to Employment Agreement dated as of August 20, 1998 between Kennedy-Wilson and William J. McMorrow.(12) | |
10.20† | Seventh Amendment to Employment Agreement dated as of August 9, 1999 between Kennedy-Wilson and William J. McMorrow.(12) | |
10.21† | Eighth Amendment to Employment Agreement dated as of January 3, 2000 between Kennedy-Wilson and William J. McMorrow.(12) | |
10.22† | Ninth Amendment to Employment Agreement dated as of October 1, 2000 between Kennedy-Wilson and William J. McMorrow.(12) | |
10.23† | Tenth Amendment to Employment Agreement dated as of April 22, 2002 between Kennedy-Wilson and William J. McMorrow.(12) | |
10.24† | Eleventh Amendment to Employment Agreement dated as of October 1, 2003 between Kennedy-Wilson and William J. McMorrow.(12) | |
10.25† | Twelfth Amendment to Employment Agreement dated as of April 21, 2004 between Kennedy-Wilson and William J. McMorrow.(12) | |
10.26† | Thirteenth Amendment to Employment Agreement dated as of January 1, 2008 between Kennedy-Wilson and William J. McMorrow.(12) | |
10.27† | Fourteenth Amendment to Employment Agreement dated as of February 1, 2009 between Kennedy-Wilson and William J. McMorrow.(12) | |
10.28† | Second Amendment to Employment Agreement by Kennedy-Wilson, Inc. and Mary L. Ricks.(12) | |
10.29† | Employment Agreement dated February 1, 2009 between Kennedy-Wilson and Mary L. Ricks.(12) | |
10.30† | First Amendment to Employment Agreement dated June 1, 2009 between Kennedy-Wilson and Mary L. Ricks.(12) | |
10.31† | First Amendment to Employment Agreement by Kennedy-Wilson, Inc. and Donald J. Herrema.(12) | |
10.32† | Employment Agreement dated June 15, 2009 between Kennedy-Wilson and Donald J. Herrema.(12) | |
10.33† | Employment Agreement dated April 1, 1996 between Kennedy-Wilson and Freeman Lyle.(12) | |
10.34† | Amendment to Employment Agreement dated April 1, 1997 between Kennedy-Wilson and Freeman Lyle.(12) | |
10.35† | Second Amendment to Employment Agreement dated April 1, 1998 between Kennedy-Wilson and Freeman Lyle.(12) | |
10.36† | Third Amendment to Employment Agreement dated as of August 15, 1998 between Kennedy-Wilson and Freeman Lyle.(12) | |
10.37† | Fourth Amendment to Employment Agreement dated as of April 1, 1999 between Kennedy-Wilson and Freeman Lyle.(12) | |
10.38† | Fifth Amendment to Employment Agreement dated as of April 1, 2000 between Kennedy-Wilson and Freeman Lyle.(12) | |
10.39† | Sixth Amendment to Employment Agreement dated as of January 1, 2001 between Kennedy-Wilson and Freeman Lyle.(12) | |
10.40† | Seventh Amendment to Employment Agreement dated as of March 28, 2001 between Kennedy-Wilson and Freeman Lyle.(12) | |
10.41† | Eighth Amendment to Employment Agreement dated as of September 1, 2002 between Kennedy-Wilson and Freeman Lyle.(12) | |
10.42† | Ninth Amendment to Employment Agreement dated October 1, 2003 between Kennedy-Wilson and Freeman Lyle.(12) | |
118
Exhibit No. | Description | |
10.43† | Tenth Amendment to Employment Agreement dated January 1, 2004 between Kennedy-Wilson and Freeman Lyle.(12) | |
10.44† | Eleventh Amendment to Employment Agreement dated January 1, 2005 between Kennedy-Wilson and Freeman Lyle.(12) | |
10.45† | Twelfth Amendment to Employment Agreement dated January 1, 2006 between Kennedy-Wilson and Freeman Lyle.(12) | |
10.46† | Thirteenth Amendment to Employment Agreement dated January 1, 2007 between Kennedy-Wilson and Freeman Lyle.(12) | |
10.47† | Fourteenth Amendment to Employment Agreement dated March 1, 2007 between Kennedy-Wilson and Freeman Lyle.(12) | |
10.48† | Fifteenth Amendment to Employment Agreement dated January 1, 2008 between Kennedy-Wilson and Freeman Lyle.(12) | |
10.49† | Sixteenth Amendment to Employment Agreement dated June 1, 2008 between Kennedy-Wilson and Freeman Lyle.(12) | |
10.50† | Seventeenth Amendment to Employment Agreement dated January 1, 2009 between Kennedy-Wilson and Freeman Lyle.(12) | |
10.51† | Seventeenth Amendment to Employment Agreement dated January 1, 2009 between Kennedy-Wilson and Freeman Lyle.(12) | |
10.52† | Amendment to Employment Agreement dated as of August 1, 2006 between KW Multi-Family Management Group and Robert Hart.(12) | |
10.53† | Second Amendment to Employment Agreement dated as of January 1, 2007 between KW Multi-Family Management Group and Robert Hart.(12) | |
10.54† | Third Amendment to Employment Agreement dated as of January 1, 2008 between KW Multi-Family Management Group and Robert Hart.(12) | |
10.55† | Fourth Amendment to Employment Agreement dated as of January 1, 2009 between KW Multi-Family Management Group and Robert Hart.(12) | |
10.56† | Business Loan Agreement dated July 29, 2009 between Kennedy-Wilson, Inc. and Pacific Western Bank.(12) | |
10.57† | Amended and Restated Loan Agreement dated June 5, 2008 between Kennedy-Wilson, Inc. and U.S. Bank National Association.(16) | |
10.58† | Junior Subordinated Indenture dated, January 31, 2007 between Kennedy-Wilson, Inc. and The Bank of New York Trust Company, National Association, as trustee.(12) | |
10.59† | First Amendment to Office Lease dated March 5, 1999 between Wilshire-Camden Associates and Kennedy-Wilson, Inc.(12) | |
10.60 | Second Amendment to Lease dated June 2, 1999 between Wilshire-Camden Associates and Kennedy-Wilson, Inc.(12) | |
10.61 | First Amendment to Office Lease dated March 5, 1999 between Wilshire-Camden Associates and Kennedy-Wilson, Inc.(12) | |
10.62 | Second Amendment to Lease dated June 2, 1999 between Wilshire-Camden Associates and Kennedy-Wilson, Inc.(12) | |
10.63 | Third Amendment to Office Lease dated December 20, 2002 between Brighton Enterprises, LLC and Kennedy-Wilson, Inc.(12) | |
10.64 | Fourth Amendment to Office Lease dated September 11, 2003 between Wilshire-Camden Associates and Kennedy-Wilson, Inc.(12) | |
119
Exhibit No. | Description | |
10.65 | Fifth Amendment to Office Lease dated January 7, 2006 between Douglas Emmett 2000, LLC and Kennedy-Wilson, Inc.(12) | |
10.66 | Standard Office Lease dated March 3, 2009 by and among 9701-Hempstead Plaza, LLC, 9701-Carolina Gardens LLC, 9701-West Point Realty LLC, 9701-Dakota Leasing LLC and 9701-Iowa Leasing LLC and Kennedy-Wilson Inc.(12) | |
10.67 | Second Amended and Restated Guaranty of Payment dated November 4, 2008 by Arthur S. Levine, as Trustee of the Ray J. Rutter Trust, Arthur S. Levine, as Trustee of the Susan Ray Rutter Trust, and Arthur S. Levine, as Trustee of the Robert Jonathan Rutter Trust, and Kennedy-Wilson Inc., to Bank Midwest N.A.(12) | |
10.68 | Amended and Restated Guaranty dated October 25, 2007 Agreement by Kennedy-Wilson, Inc. in favor of Bank of America, N.A., as agent for lenders.(12) | |
10.69 | Amendment to Irrevocable standby letters of credit dated October 26, 2007 from Bank of America to the beneficiary, City of Walnut Creek on behalf of Fairways 340 LLC.(12) | |
10.70 | Guaranty Agreement made as of August 14, 2007 by Kennedy-Wilson, Inc. in favor of Bank of America, N.A., as agent for lenders.(12) | |
10.71 | Repayment Guaranty made as of September 4, 2007 by Kennedy-Wilson, Inc. in favor of Wachovia Bank, N.A., as agent for lenders.(12) | |
10.72 | Commercial Guaranty made as of September 13, 2007 by Kennedy-Wilson, Inc., to Pacific Western Bank, on behalf of Windscape Village LLC.(12) | |
10.73 | Repayment Guaranty made as of May 9, 2007 by Kennedy-Wilson, Inc. and KW Property Fund I, L.P. for the benefit of Wachovia Bank National Association.(12) | |
10.74 | Commercial Guaranty dated January 16, 2009 to Pacific Western Bank by KWI Property Fund I, L.P.(12) | |
10.75 | Guaranty made as of May 29, 2008 by Kennedy-Wilson, Inc. and KW Property Fund III, L.P. for the benefit of Deutsche Bank, AG.(12) | |
10.76 | Guaranty made as of September 9, 2005, by Kennedy-Wilson, Inc., a Delaware corporation, in favor of Bank of America, N.A.(12) | |
10.77 | Guaranty made as of May 29, 2008 by Kennedy-Wilson, Inc. and KW Property Fund III, L.P. for the benefit of Deutsche Bank, AG.(12) | |
10.78 | Guaranty made as of September 9, 2005, by Kennedy-Wilson, Inc., a Delaware corporation, in favor of Bank of America, N.A.(12) | |
10.79 | Repayment Guaranty made as of September 4, 2007 by KWI Property Fund I, L.P. and KW Property Fund II, L.P., Delaware limited partnerships in favor of Wachovia Bank, N.A., as agent for lenders.(12) | |
10.80 | Fifteenth Amendment to Employment Agreement dated January 1, 2009 between Kennedy-Wilson Properties and James Rosten.(15) | |
10.81 | Eighteenth Amendment to Employment Agreement dated January 1, 2009 between Kennedy-Wilson and Freeman Lyle.(15) | |
10.82 | Fifth Amendment to Employment Agreement dated January 1, 2009 between KW Multi-Family Group, Ltd. and Robert Hart.(15) | |
10.83 | First Amendment to Forfeiture Agreement dated October 22, 2009 between Prospect Acquisition Corp., De Guardiola Advisors, Inc., De Guardiola Holdings, Inc., Flat Ridge Investments LLC, LLM Structured Equity Fund L.P, LLM Investors L.P., CMS Platinum Fund, L.P., SJC Capital LLC, Michael P. Castine, Daniel Gressel, Michael Downey, James J. Cahill, John Merchant and Kennedy-Wilson, Inc.(15) | |
10.84† | Waiver and Modification with respect to Employment Agreements dated October 22, 2009 between Kennedy-Wilson, Inc. and William J. McMorrow, Mary L. Ricks and Donald J. Herrema.(15) | |
10.85 | Agreement, dated as of November 11, 2009, by and between Prospect Acquisition Corp. and Victory Park Capital Advisors, LLC.(17) | |
10.86 | Stock Purchase Agreement, by and between Prospect Acquisition Corp. and Victory Park Special Situations Master Fund, LTD.(17) | |
120
Exhibit No. | Description | |
10.87 | Stock Purchase Agreement, dated as of November 12, 2009, by and between Prospect Acquisition Corp. and Credit Suisse Securities (USA) LLC.(17) | |
10.88 | Stock Purchase Agreement, dated as of November 11, 2009, by and between Prospect Acquisition Corp. and Nisswa Acquisition Master Fund, Ltd.(17) | |
10.89 | Share Purchase Agreement, dated as of November 12, 2009, by and between Prospect Acquisition Corp. and Milton Arbitrage Partners, LLC.(17) | |
10.90 | Stock Purchase Agreement(18) | |
10.91 | Stock Purchase Agreement, dated as of November 12, 2009, by and between Prospect Acquisition Corp. and Arrowgrass Master Fund Ltd.(19) | |
10.92 | Stock Purchase Agreement, dated as of November 12, 2009, by and between Prospect Acquisition Corp. and Bulldog Investors.(19) | |
10.93 | Stock Purchase Agreement, dated as of November 12, 2009, by and between Prospect Acquisition Corp. and Del Mar Master Fund Ltd.(19) | |
10.94 | Stock Purchase Agreement, dated as of November 12, 2009, by and between Prospect Acquisition Corp. and Citigroup Global Markets Inc.(19) | |
10.95 | Share Purchase Agreement, dated as of November 12, 2009, by and between Prospect Acquisition Corp. and IBS (MF) Ltd. In Respect of Glazer Merger Arbitrage Series.(19) | |
10.96 | Stock Purchase Agreement, dated as of November 12, 2009, by and between Prospect Acquisition Corp. and Glazer Offshore Fund Ltd.(19) | |
10.97 | Stock Purchase Agreement, dated as of November 12, 2009, by and between Prospect Acquisition Corp. and Glazer Capital Management, LP(19) | |
10.98 | Stock Purchase Agreement, dated as of November 12, 2009, by and between Prospect Acquisition Corp. and HFR MA Select Opportunity Master Trust.(19) | |
10.99 | Stock Purchase Agreement, dated as of November 12, 2009, by and between Prospect Acquisition Corp. and GSS Offshore SPC-Glazer Segregated Portfolio.(19) | |
10.100 | Stock Purchase Agreement, dated as of November 12, 2009, by and between Prospect Acquisition Corp. and GSS Offshore SPC-Glazer Segregated Portfolio.(19) | |
10.101 | Waiver and Modification With Respect to Employment Agreement Amendments.(20) | |
21 | List of Subsidiaries | |
23.1 | Consent of Independent Registered Public Accounting Firm | |
23.2 | Consent of Independent Registered Public Accounting Firm | |
23.3 | Consent of Independent Registered Public Accounting Firm | |
23.4 | Consent of Independent Registered Public Accounting Firm | |
23.5 | Consent of Independent Registered Public Accounting Firm | |
24 | Power of Attorney (included on signature page). | |
31.1 | Certification Pursuant to Rule 13a-14(a) under the Securities Exchange Act of 1934 of the Principal Executive Officer. | |
31.2 | Certification Pursuant to Rule 13a-14(a) under Securities Exchange Act of 1934 of the Principal Financial Officer. | |
32.1 | Certification Pursuant to 18 U.S.C. Section 1350, As Adopted Pursuant to Section 906 of the Sarbanes-Oxley Act of 2002 of the Principal Executive Officer. | |
32.2 | Certification Pursuant to 18 U.S.C. Section 1350, As Adopted Pursuant to Section 906 of the Sarbanes-Oxley Act of 2002 of the Principal Financial Officer | |
______________________________________
121
† Management Contract, Compensation Plan or Agreement.
(1) | Filed as Annex A to Amendment No. 5 to the Registrant’s Registration Statement on Form S-4 (File No.: 333-162116) filed on October 28, 2009 and incorporated by reference herein. |
(2) | Filed as Annex D to Amendment No. 5 to the Registrant’s Registration Statement on Form S-4 (File No.: 333-162116) filed on October 28, 2009 and incorporated by reference herein. |
(3) | Filed as Exhibit 3.2 to Amendment No. 3 to the Registrant’s Registration Statement on Form S-1 (File No. 333-145110) filed October 26, 2007 and incorporated by reference herein. |
(4) | Filed as Exhibit A to Annex C to Amendment No. 5 to the Registrant’s Registration Statement on Form S-4 (File No.: 333-162116) filed on October 28, 2009 and incorporated by reference herein. |
(5) | Filed as Annex C to Amendment No. 5 to the Registrant’s Registration Statement on Form S-4 (File No.: 333-162116) filed on October 28, 2009 and incorporated by reference herein. |
(6) | Filed as Exhibit 10.7 to the Registrant’s Annual Report on Form 10-K (File No.: 001-33824) filed on March 31, 2008 and incorporated by reference herein. |
(7) | Filed as Exhibit 10.9 to the Registrant’s Annual Report on Form 10-K (File No.: 001-33824) filed on March 31, 2008 and incorporated by reference herein. |
(8) | Filed as Exhibit 10.10 to the Registrant’s Registration Statement on Form S-1 (File No. 333-145110) filed October 26, 2007 and incorporated by reference herein. |
(9) | Filed as Exhibit 10.11 to the Registrant’s Annual Report on Form 10-K (File No.: 001-33824) filed on March 31, 2008 and incorporated by reference herein. |
(10) | Filed as Exhibit 10.1 to the Registrant’s Current Report on Form 8-K (File No.: 001-33824) filed January 7, 2009. |
(11) | Filed as Exhibit 10.2 to the Registrant’s Current Report on Form 8-K (File No.: 001-33824) filed January 7, 2009. |
(12) | Filed as an Exhibit to the Registrant’s Registration Statement on Form S-4 (File No.: 333-162116) filed on September 24, 2009 and incorporated by reference herein. |
(13) | Filed as Annex E to Amendment No. 5 to the Registrant’s Registration Statement on Form S-4 (File No.: 333-162116) filed on October 28, 2009 and incorporated by reference herein. |
(14) | Filed as an Exhibit to the Registrant’s Registration Statement on Form S-8 (File No.: 333-164928) filed on February 16, 2010 and incorporated by reference herein. |
(15) | Filed as an Exhibit to Amendment No. 2 to the Registrant’s Registration Statement on Form S-4 (File No.: 333-162116) filed on October 23, 2009 and incorporated by reference herein. |
(16) | Filed as an Exhibit to Amendment No. 1 to the Registrant’s Registration Statement on Form S-4 (File No.: 333-162116) filed on October 16, 2009 and incorporated by reference herein. |
(17) | Filed as an Exhibit to the Registrant’s Current Report on Form 8-K (File No.: 001-33824) filed November 11, 2009. |
(18) | Filed as an Exhibit to the Registrant’s Current Report on Form 8-K (File No.: 001-33824) filed November 12, 2009. |
(19) | Filed as an Exhibit to the Registrant’s Current Report on Form 8-K (File No.: 001-33824) filed November 13, 2009. |
(20) | Filed as an Exhibit to the Registrant’s Current Report on Form 8-K (File No.: 001-33824) filed November 19, 2009. |
(c) Financial Statement Schedules. Reference is made to Item 15(a)(2) above.
122