Attached files
| file | filename |
|---|---|
| 8-K - FORM 8-K - EL PASO ELECTRIC CO /TX/ | form8-k12x31x14.htm |
| EX-99.01 - EARNINGS PRESS RELEASE - EL PASO ELECTRIC CO /TX/ | exh990112-31x2014.htm |


Safe Harbor Statement 2 This presentation includes statements that may constitute forward-looking statements made pursuant to the safe harbor provisions of the Private Securities Litigation Reform Act of 1995. This information may involve risks and uncertainties that could cause actual results to differ materially from such forward-looking statements. Factors that could cause or contribute to such differences include, but are not limited to: Increased prices for fuel and purchased power and the possibility that regulators may not permit EE to pass through all such increased costs to customers or to recover previously incurred fuel costs in rates Recovery of capital investments and operating costs through rates in Texas and New Mexico Uncertainties and instability in the general economy and the resulting impact on EE’s sales and profitability Changes in customers’ demand for electricity as a result of energy efficiency initiatives and emerging competing services and technologies Unanticipated increased costs associated with scheduled and unscheduled outages of generating plant The size of our construction program and our ability to complete construction on budget Potential delays in our construction schedule due to legal challenges or other reasons Costs at Palo Verde Deregulation and competition in the electric utility industry Possible increased costs of compliance with environmental or other laws, regulations and policies Possible income tax and interest payments as a result of audit adjustments proposed by the IRS or state taxing authorities Uncertainties and instability in the financial markets and the resulting impact on EE’s ability to access the capital and credit markets Possible physical or cyber attacks, intrusions or other catastrophic events Other factors detailed by EE in its public filings with the Securities and Exchange Commission. EE’s filings are available from the Securities and Exchange Commission or may be obtained through EE’s website, http://www.epelectric.com February 25, 2015

Recent Highlights 3 Board elected new Chairman and Vice Chairman Board appointed Mary Kipp as President Strengthened our management team Set a new Native Peak record of 1,766 MW in June 2014 Palo Verde Nuclear Generating Station increased its capacity factor in 2014 to 93.7 percent Obtained all permits and regulatory approvals required to construct Montana Power Station (MPS) Finished construction of Eastside Operations Center February 25, 2015 Eastside Operations Center

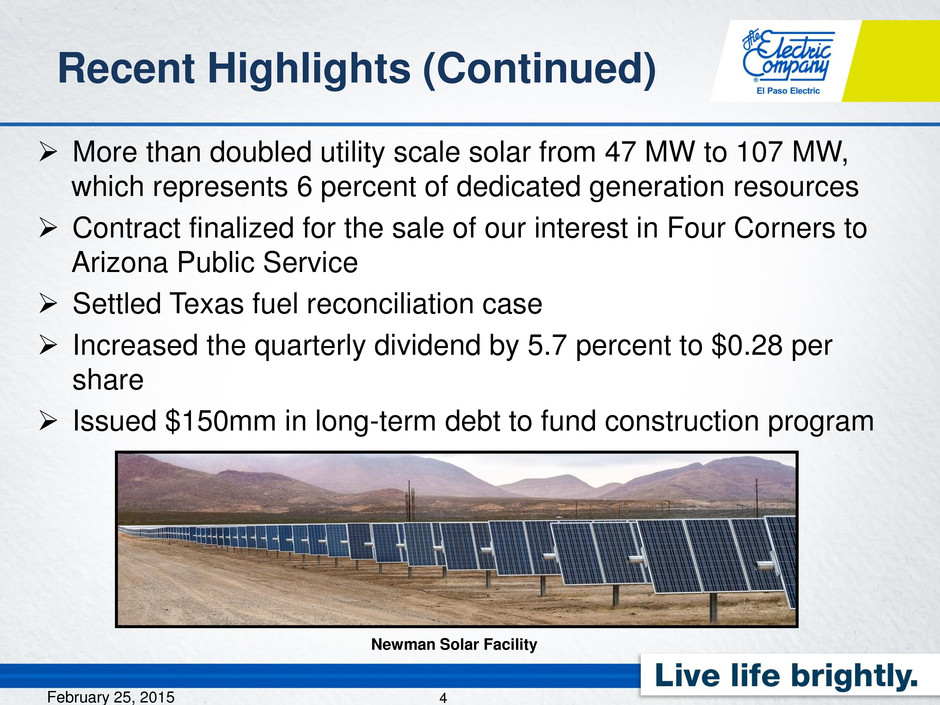
Recent Highlights (Continued) 4 More than doubled utility scale solar from 47 MW to 107 MW, which represents 6 percent of dedicated generation resources Contract finalized for the sale of our interest in Four Corners to Arizona Public Service Settled Texas fuel reconciliation case Increased the quarterly dividend by 5.7 percent to $0.28 per share Issued $150mm in long-term debt to fund construction program February 25, 2015 Newman Solar Facility

EE’s Commitment to the Community 5 EE’s employees are committed to delivering safe, reliable, and cost effective power consistently ranking at the top for grid reliability in Texas EE’s 2014 annual customer satisfaction survey results were the highest level achieved in the past six years Employees of EE contributed over 13,000 hours in 2014 to various volunteer organizations through the Volunteers in Action Program Combined employee/company contributions to the United Way Campaign totaled more than $350,000 February 25, 2015 Walk to End Alzheimer’s • Walk to End Alzheimer’s • March of Dimes • Child Crisis Center of El Paso* • Susan G. Komen Race for the Cure* • Opportunity Center for the Homeless* • Salvation Army • Big Brothers Big Sisters Over 100 Organizations and Activities Benefited from EE Contributions in 2014 Including: * EE represented largest corporate team participation

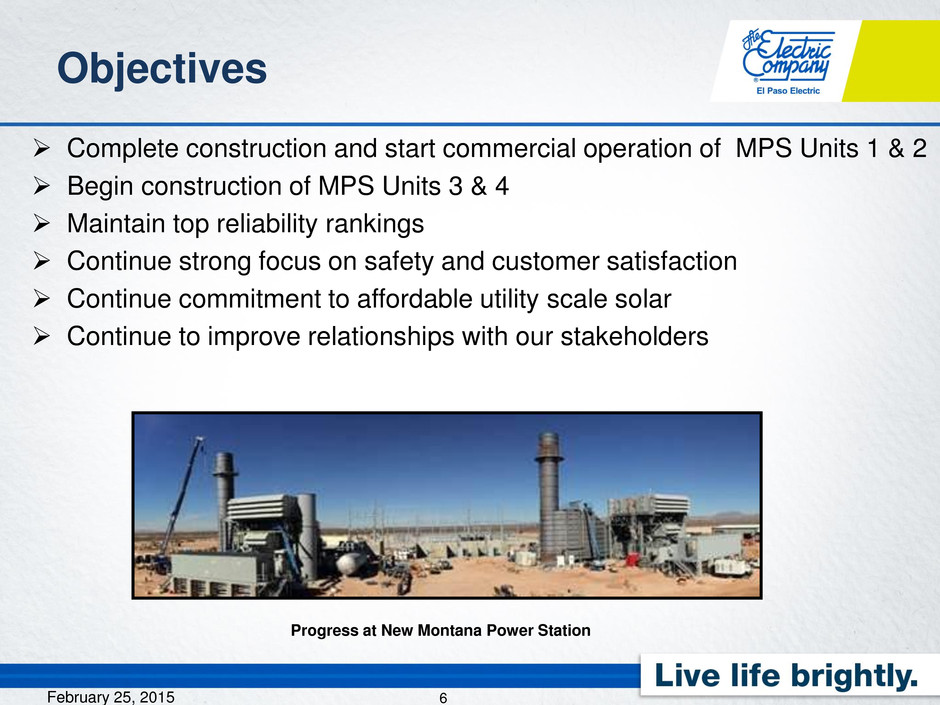
Objectives 6 Complete construction and start commercial operation of MPS Units 1 & 2 Begin construction of MPS Units 3 & 4 Maintain top reliability rankings Continue strong focus on safety and customer satisfaction Continue commitment to affordable utility scale solar Continue to improve relationships with our stakeholders February 25, 2015 Progress at New Montana Power Station

Historical Test Year End (Mar 2015) Need for Rate Case 7 February 25, 2015 Historical Test Year End (Dec 2014) File Rate Case (Apr or May 2015) Rate Increase Effective (Mar 2016) 2016 2014 2015 2016 File Rate Case (Jul or Aug 2015) Rate Increase Effective (Mar 2016) 2015 2014 Building new plant to support load growth, possible unit retirements and to continue providing safe, reliable, and cost effective service into the future EE will have placed $1.3 billion of new assets in service since July 1, 2009 PROPOSED NEW MEXICO RATE CASE TIMELINE PROPOSED TEXAS RATE CASE TIMELINE * Timelines reflect MPS Units 1 & 2 go into service by March 31, 2015

Historical Service Territory Growth 8 EE’s service territory has benefited from positive economic growth since 2008 driven by several major construction projects BRAC initiated investment at Fort Bliss totaling $5 billion Union Pacific’s $400 million intermodal rail yard in NM New $60 million downtown baseball stadium February 25, 2015 Texas Tech University Paul L. Foster School of Medicine Five story $60 million Health Sciences building at UTEP Gayle Greve Hunt School of Nursing New Sierra Providence Hospital El Paso Children’s Hospital

Future Service Territory Growth 9 Quality-of-Life bonds approved in 2012 totaling $473 million is mostly slated for projects going forward El Paso’s unemployment rate is the lowest level since 2008 El Paso’s industrial space vacancy rate is the lowest since 2007 New projects under construction $1 billion Army Medical Center at Fort Bliss Over $1 billion of state and federal transportation infrastructure projects $120 million Tenet Hospital $85 million Burrell College of Osteopathic Medicine in Las Cruces Recent corporate expansion announcements Charles Schwab to add 445 new jobs Prudential Financial to add 300 new jobs Automatic Data Processing to add 1,100 new jobs February 25, 2015

Vision Mission 10 February 25, 2015 2014 Financial Re ults

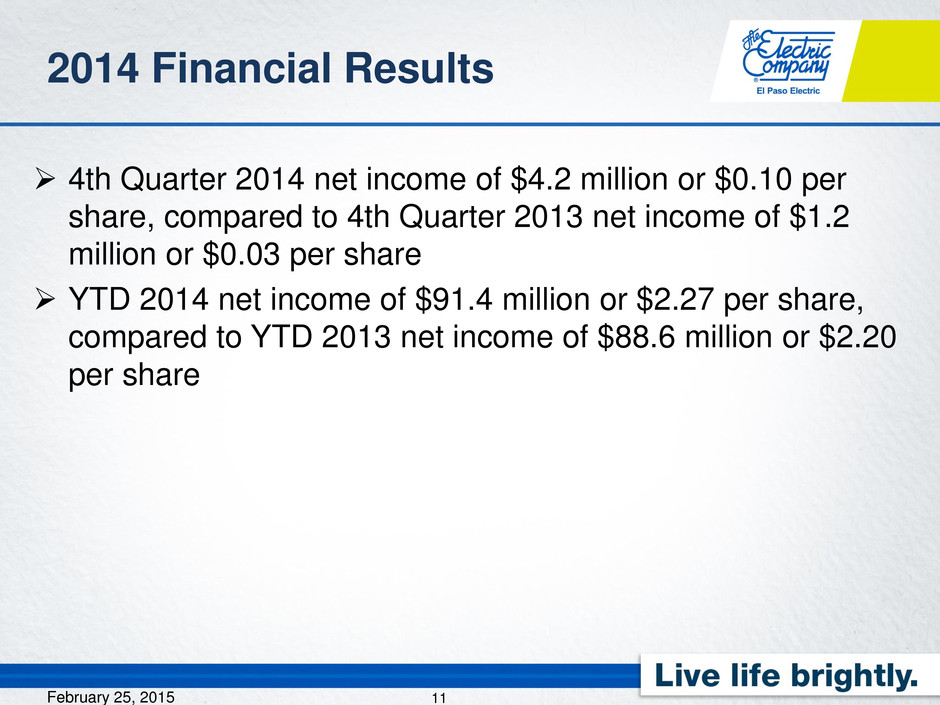
Vision Mission 4th Quarter 2014 net income of $4.2 million or $0.10 per share, compared to 4th Quarter 2013 net income of $1.2 million or $0.03 per share YTD 2014 net income of $91.4 million or $2.27 per share, compared to YTD 2013 net income of $88.6 million or $2.20 per share 2014 Financial Results 11 February 25, 2015

Vision Mission 4th Quarter Key Earnings Drivers 12 Basic EPS Description December 31, 2013 0.03$ Changes In: Investment and interest income 0.06 Increased due to gains on the sales of equity investments in Palo Verde decommissioning trust funds Allowance for funds used during construction 0.06 Increased due to higher construction balances Non-base revenue items, net of energy expense 0.04 Increased primarily due to PUCT awarded Texas Energy Efficiency bonus of $2.0 million Retail non-fuel base revenues 0.02 Increased due to customer growth in residential and small commercial customers and increased cooling degree days in October Income taxes (0.08) Increased primarily due to legislative timing of the bonus depreciation extension in 2014 Palo Verde operations and maintenance (0.03) Increased expenses primarily due to increased payroll including incentive compensation December 31, 2014 0.10$ February 25, 2015

Vision Mission 4th Quarter Retail Revenues and Sales 13 Non-Fuel Base Revenues (000's) 1 Percent Change 2 MWH 1 Percent Change 2 Residential 47,653$ 2.7% 552,977 2.2% C&I Small 38,449 1.7% 548,369 2.3% C&I Large 9,019 (2.4%) 269,584 (4.5%) Public Authorities 19,229 (0.8%) 360,381 (4.4%) Total Retail 114,350$ 1.3% 1,731,311 (0.3%) Cooling Degree Days (CDD's) 136 70.0% Heating Degree Days (HDD's) 858 -14.8% Average Retail Customers 398,765 1.3% February 25, 2015 (1) Non-Fuel Base Revenues and MWH sales represent actual Q4 2014 results (2) Percent Change expressed as change from Q4 2014 over Q4 2013

Vision Mission YTD Key Earnings Drivers 14 February 25, 2015 Basic EPS Description December 31, 2013 2.20$ Changes In: Allowance for funds used during construction 0.15 Increased due to higher construction balances Investment and interest income 0.13 Increased due to gains on the sales of equity investments in Palo Verde decommissioning trust funds Non-base revenue items, net of energy expense 0.10 Increased $7.8 million primarily due to PV performance awards, Texas energy efficiency bonus, and PV3 revenues, partially offset by a decrease of $3.3 million in transmission wheeling revenues Retail non-fuel base revenues (0.09) Decreased mainly due to reduction in sales to public authorities and residential customers Taxes other than income taxes (0.08) Increased primarily due to higher property tax values and assessments Depreciation and amortization expnse (0.06) Increased due to an increase in depreciable plant balances Palo Verde operations and maintenance (0.04) Increased expenses primarily due to increased payroll including incentive compensation Other (0.04) December 31, 2014 2.27$

Vision Mission YTD Retail Revenues and Sales 15 Non-Fuel Base Revenues (000's) 1 Percent Change 2 MWH 1 Percent Change 2 Residential 234,371$ (1.0%) 2,640,535 (1.4%) C&I Small 185,388 0.4% 2,357,846 0.4% C&I Large 39,239 (2.5%) 1,064,475 (2.8%) Public Authorities 92,066 (3.1%) 1,562,784 (3.7%) Total Retail 551,064$ (1.0%) 7,625,640 (1.6%) Cooling Degree Days (CDD's) 2,671 -0.9% Heating Degree Days (HDD's) 1,900 -21.7% Average Retail Customers 397,014 1.3% February 25, 2015 (1) Non-Fuel Base Revenues and MWH sales represent actual YTD 2014 results (2) Percent Change expressed as change from YTD 2014 over YTD 2013

Historical Weather Analysis 2,176 2,020 2,286 2,188 2,144 2,273 2,402 2,009 2,426 1,900 2,549 2,457 2,512 2,272 2,768 2,738 3,141 2,876 2,695 2,671 0 500 1,000 1,500 2,000 2,500 3,000 3,500 2005 2006 2007 2008 2009 2010 2011 2012 2013 2014 December YTD Degree Days HDD CDD 10 Year HDD Avg 10 Year CDD Avg 10-Yr HDD Average – 2,182 10-Yr CDD Average – 2,668 16 February 25, 2015 2014 HDD’s lowest in over 60 years

Vision Mission Expended $277.1mm for additions to utility plant for the twelve months ended December 31, 2014 Issued $150mm in long term debt on December 1, 2014 to fund construction program Board declared quarterly cash dividend of $0.28 per share on January 29, 2015 payable on March 31, 2015 EE made $44.6mm in dividend payments for the twelve months ended December 31, 2014 At December 31, 2014, EE had liquidity of $325.6mm including a cash balance of $40.5mm and unused capacity under the revolving credit facility Capital expenditures for utility plant in 2015 are anticipated to be approximately $271mm May issue long-term debt in late 2015 or early 2016 Capital Requirements and Liquidity 17 February 25, 2015

Capital Expenditure (Cash) Projection 18 $0 $50,000 $100,000 $150,000 $200,000 $250,000 $300,000 2015E 2016E 2017E 2018E 2019E 5- Year Estimated Cost of $1.1 billion Generation Transmission Distribution General $199mm $254mm ($000’s) $170mm $203mm $271mm February 25, 2015

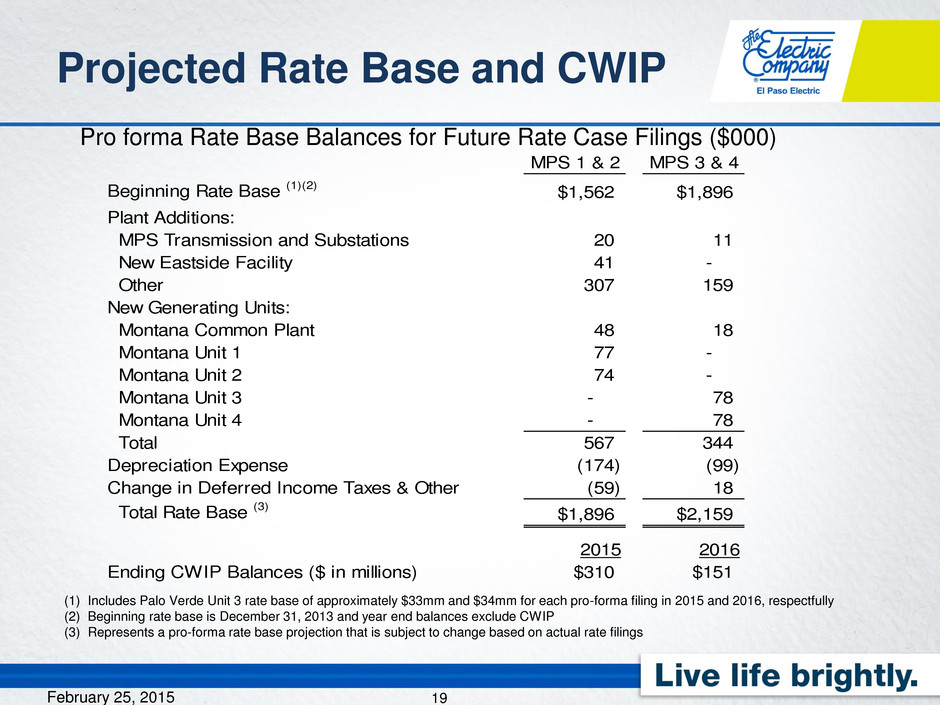
Projected Rate Base and CWIP 19 Pro forma Rate Base Balances for Future Rate Case Filings ($000) (1) Includes Palo Verde Unit 3 rate base of approximately $33mm and $34mm for each pro-forma filing in 2015 and 2016, respectfully (2) Beginning rate base is December 31, 2013 and year end balances exclude CWIP (3) Represents a pro-forma rate base projection that is subject to change based on actual rate filings MPS 1 & 2 MPS 3 & 4 Beginning Rate Base (1)(2) $1,562 $1,896 Plant Additions: MPS Transmission and Substations 20 11 New Eastside Facility 41 - Other 307 159 New Generating Units: Montana Common Plant 48 18 Montana Unit 1 77 - Montana Unit 2 74 - Montana Unit 3 - 78 Montana Unit 4 - 78 Total 567 344 Depreciation Expense (174) (99) Change in Deferred Income Taxes & Other (59) 18 Total Rate Base (3) $1,896 $2,159 2015 2016 Ending CWIP Balances ($ in millions) $310 $151 February 25, 2015

2015 Earnings Guidance 20 Interest expense Depreciation (1) Property taxes & O&M (1) Deregulated PV3 and non-fuel base revenues AFUDC (1) (2) Customer growth Return to normal weather Palo Verde decommissioning trust fund gains February 25, 2015 YOY EPS Drivers 2015 earnings are expected to decline from prior year due to regulatory lag, primarily related to major projects placed in service in Q1 2015 (1) Mainly related to MPS T&D, Common, Units 1 & 2, and the Eastside Operations Center (2) Some of the negative impact of AFUDC will be offset for AFUDC related to MPS Units 3 & 4 in 2015 2014 EPS Actual 2015 Earnings Guidance $1.75 $2.15 $2.27

Q & A 21 February 25, 2015
