Attached files
| file | filename |
|---|---|
| 8-K - 8-K - TOYS R US INC | d878130d8k.htm |
 EASY
EXPERT
FAIR
J.P.
Morgan
Global
High
Yield
&
Leveraged
Finance
Conference
February
2015
Exhibit 99.1
* * * * * * * |
 EASY
EXPERT
FAIR
2
FORWARD LOOKING STATEMENTS
PRELIMINARY ESTIMATES
The
financial
information
for
the
fourth
quarter
and
full
year
fiscal
2014
contained
in
this
presentation
are
preliminary
estimates
and
are
derived
from
preliminary
internal
financial
reports
and
are
subject
to
revision
based
on
the
completion
of
year-end
accounting
and
financial
reporting
processes.
Accordingly,
our
actual
results
may
differ
from
these
estimates
and
such
differences
may
be
material.
This presentation and the documents filed by TOYS“R”US, INC. with the Securities and
Exchange Commission contain “forward looking” statements within the meaning of
the federal securities laws and such statements are intended to be covered by the safe harbors
created thereby. These forward looking statements reflect our current views with respect
to, among other things, our operations and financial performance. All statements herein or therein that are not historical facts, including statements
about our beliefs or expectations, are forward-looking statements. We generally identify
these statements by words or phrases, such as “anticipate,” “estimate,” “plan,”
“project,” “expect,” “believe,” “intend,”
“foresee,” “forecast,” “will,” “may,” “outlook” or the negative version of these words or other similar words or phrases. These
statements discuss, among other things, our strategy, store openings, integration and
remodeling, the development, implementation and integration of our Internet business,
future financial or operational performance, projected sales for certain periods, comparable store net sales from one period to another, cost savings, results of
store closings and restructurings, outcome or impact of pending or threatened litigation,
domestic or international developments, amount and allocation of future capital
expenditures, growth initiatives, inventory levels, cost of goods, selection and type of
merchandise, marketing positions, implementation of safety standards, future
financings, estimates regarding future effective tax rates, and other goals and targets and
statements of the assumptions underlying or relating to any such statements. These
statements are subject to risks, uncertainties and other factors, including, among others, the seasonality of our business, competition in the retail industry, changes
in our product distribution mix and distribution channels, general economic factors in the
United States and other countries in which we conduct our business, consumer spending
patterns, live birth trends, our ability to implement our strategy, including implementing initiatives for season, our ability to recognize cost savings, marketing
strategies, the availability of adequate financing, access to trade credit, changes in
consumer preferences, changes in employment legislation, our dependence on key vendors
for our merchandise, political and other developments associated with our international operations, costs of goods that we sell, labor costs, transportation costs,
domestic and international events affecting the delivery of toys and other products to our
stores, product safety issues including product recalls, the existence of adverse
litigation, changes in laws that impact our business, our substantial level of indebtedness
and related debt-service obligations, restrictions imposed by covenants in our debt
agreements and other risks, uncertainties and factors set forth under Item 1A entitled “RISK FACTORS” of TOYS“R”US, INC.’s Annual Report on Form 10-K for the fiscal
year ended February 1, 2014 and in its other reports and documents filed with the Securities
and Exchange Commission. In addition, we typically earn a disproportionate part of our
annual operating earnings in the fourth quarter as a result of seasonal buying patterns and these buying patterns are difficult to forecast with certainty. These
factors should not be construed as exhaustive, and should be read in conjunction with the
other cautionary statements that are included in those reports and documents. We
believe that all forward-looking statements are based on reasonable assumptions when made; however, we caution that it is impossible to predict actual results or
outcomes or the effects of risks, uncertainties or other factors on anticipated results or
outcomes and that, accordingly, one should not place undue reliance on these
statements. Forward-looking statements speak only as of the date they were made, and we
undertake no obligation to update these statements in light of subsequent events or
developments unless required by the Securities and Exchange Commission’s rules and regulations. Actual results and outcomes may differ materially from
anticipated results or outcomes discussed in any forward-looking statement.
|
 EASY
EXPERT
FAIR
3
FULL YEAR AND Q4 UPDATE
FY 2014 Highlights
Note: See appendix for reconciliation of Adjusted EBITDA
1
Excludes
($51M)
charge
in
Q4
2013
(+1.0%
impact
–
INC;
+1.4%
impact
–
DEL)
and
Full
Year
2013
(+0.4%
impact
–
INC;
+0.6%
impact
–
DEL),
as
well
as
an
($8M)
charge
(+0.1%
impact –
INC; +0.1% impact –
DEL)
in Full Year 2014 related to excess and obsolete inventory identified in Q4 2013
2
Excludes $1M benefit (negligible impact to INC and DEL) in Full Year 2013 related to a dotcom
prior period sales adjustment •
Results reflect the successful execution of our
strategic plan
•
Gross margin rate improved by 51 bps; Gross margin
dollars
includes
a
negative
FX
impact
of
$83
million
1,2
•
Estimated Adjusted EBITDA improved by
approximately $57 million
•
Ended the year with clean inventory, improved
customer perception and global liquidity of $1,772
million
•
Strong international sales performance highlighted by
2.2% comparable store net sales growth
•
Continued improvement in gross margin rate as
compared to the prior year
•
Estimated Adjusted EBITDA improved by
approximately $22 million
Q4 2014 Highlights
Q4
$'s in billions unless otherwise stated
2013
2014
B/(P)
Toys"R"Us, Inc.
Net Sales
$5.3
$5.0
(5.4%)
Net Sales (2014 excl. FX impact)
5.3
5.2
(1.8%)
Gross Margin %
1,2
32.7%
33.9%
115 bps
Adjusted EBITDA ($'s in millions)
$505
$522-532
3.4%-5.3%
Toys-Delaware
Total Revenues
$3.6
$3.4
(5.3%)
Total Revenues (2014 excl. FX impact)
3.6
3.5
(4.6%)
Gross Margin %
1,2
31.5%
33.3%
175 bps
Full Year
$'s in billions unless otherwise stated
2013
2014
B/(P)
Toys"R"Us, Inc.
Net Sales
$12.5
$12.4
(1.5%)
Net Sales (2014 excl. FX impact)
12.5
12.6
0.5%
Gross Margin %
1,2
35.4%
35.9%
51 bps
Adjusted EBITDA
($'s in millions)
$583
$635-645
8.9%-10.6%
Toys-Delaware
Total Revenues
$8.6
$8.5
(2.0%)
Total Revenues (2014 excl. FX impact)
8.6
8.5
(1.3%)
Gross Margin %
1,2
34.6%
35.2%
59 bps |
 EASY
EXPERT
FAIR
4
ADJUSTED EBITDA
…Excluding Bonus and FX Impact
Adjusted EBITDA
Grew 9.8%...
$142M Year-over-Year Improvement
$57M Year-over-Year Improvement
1
1
2
Note:
See
appendix
for
reconciliation
of
Adjusted
EBITDA
1
Represents
the
mid-point
of
fiscal
2014
Adjusted
EBITDA
range
2
Estimate |
 EASY
EXPERT
FAIR
5
2014 STRATEGIC PRIORITIES
Transform the Customer
Experience
1
Develop High Performing, Highly
Engaged Teams
2
Become Fit for Growth
3
Enhancing the experience across
all customer touch points online
and in-store:
•
Price Perception
•
Optimize eCommerce
Experience
•
Supply Chain
•
Marketing Initiatives
•
Store Experience
•
Merchandising Initiatives
Recalibrate expectations for high
performing, highly engaged talent;
structure for customer focus,
flexibility and rapid change:
•
Organizational Structure
•
Strengthen Talent
•
Productivity Tracking
•
Training
•
Culture & Engagement
•
Rewards & Recognition
•
Strengthen Specialization of
Babies“R”Us and Toys“R”Us
Talent
Deciding where we will invest for
growth; reduce low ROI expenses
and invest for future growth:
•
Growth and Innovation
•
Margin Control & Forecasting
•
Holiday Planning
•
Expense Control and Process
Improvement
•
End-to-End Process
•
Digital Experience
•
Marketing Effectiveness
•
Store Experience |
 EASY
EXPERT
FAIR
6
TOYS“R”US CUSTOMER SATISFACTION SCORES IMPROVED YEAR-OVER-YEAR
1
Ratings are based on a scale of 1-10, the year-over-year change compares those
customers who rated us either a 9 or 10 in 2014 vs. 2013 Source: Internal company
survey 2014 vs. 2013
Categories
In-Stocks
Clean & Bright
Checkout Speed
Knowledgeable Team
Greet & Assist
Overall Satisfaction
Customer Satisfaction Metrics
5.0%
% Point Improvement
6.0%
2.7%
4.6%
4.6%
3.6% |
 EASY
EXPERT
FAIR
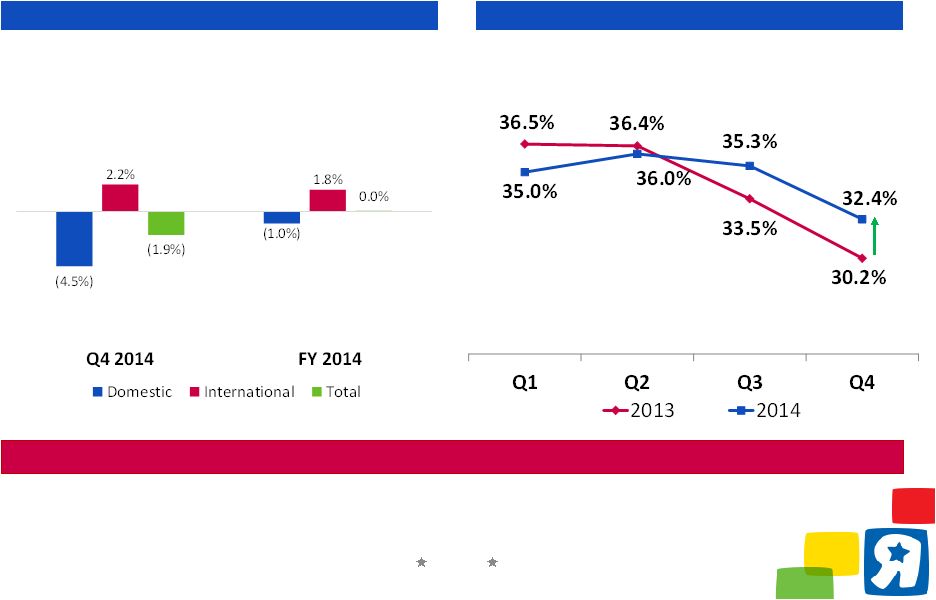
7
ANNUAL SALES STABILIZATION AND SIGNIFICANT MARGIN IMPROVEMENT
1
Excludes
($51M)
charge
in
Q4
2013
(+1.5%
impact),
$11M
benefit
in
Q1
2014
(-0.7%
impact)
and
($19M)
charge
in
Q2
2014
(+1.3%
impact)
related
to
excess
and
obsolete
inventory
identified
in
Q4
2013
2
Includes $2M benefit in Q1 2013 (+0.1% impact) related to unrecognized dotcom sales, and
excludes $3M recorded in Q2 2013 (-0.2% impact) related to a dotcom prior period
sales adjustment Domestic
Gross
Margin
Rate
1,2
Comparable Store Net Sales
Disciplined
promotion
strategy
leading
to
220
bps
improvement
in
Domestic
Gross
Margin
Continued focus on margin |
 EASY
EXPERT
FAIR
8
UPDATE ON COST SAVINGS INITIATIVES
•
Potential cost savings of $150-$200 million communicated
to investment community in September 2014
•
Estimate primarily focused on Domestic business
•
Achievable in run rate by 2016
•
Split between SG&A and Cost of Goods
•
Overall cost savings of over $100 million achieved in fiscal
year 2014
•
Driven by savings in store and procurement SG&A,
marketing effectiveness and life cycle management
•
Savings partially offset in EBITDA by increased
compensation expense resulting from bonus
normalization
•
$50-$75 million additional cost savings opportunities
subsequently identified in International Operations
•
Savings may require additional investments (e.g.
capex on systems)
Target Cost Reductions
Cost Savings Achieved
$’s in millions
$200 -
$275
Dashed bars represent high-end of range |
 EASY
EXPERT
FAIR
9
CAPITALIZATION AND GLOBAL LIQUIDITY
As of January 31, 2015
1
European Debt includes UK, France and Spain
Global Liquidity
Capitalization
1
Toys-Delaware ABL Excess Availability is presented net of the $125
minimum excess availability covenant
Q4
($'s in millions)
2014
Toys-Delaware
Toys-Delaware ABL Excess Availability
1
$848
Toys-Delaware Cash
121
Total Toys-Delaware Liquidity
969
International
Euro ABL/Japan Revolver Excess Availability
226
Non Toys-Delaware Cash
577
Total Inc/Int'l Liquidity
803
Total ABL/Revolver Excess Availability
1,074
Total Cash
698
Total Global Liquidity
$1,772
Debt Presented at Face Value
Q4
($'s in millions)
Rate
Maturity
O/S
Cash
$698
Inc. Notes
2017 Senior Notes
10.375%
8/15/2017
450
2018 Senior Notes
7.375%
10/15/2018
400
Propco II Senior Secured Notes
8.500%
12/1/2017
725
B-2/B-3 Term Loans
L + 3.75%
5/25/2018
202
North American ABL Facility
L + 1.50%
3/21/2019
--
FILO Term Loan
L + 7.25%
10/24/2019
280
B-4 Term Loan
L + 8.75%
4/24/2020
1,026
8 ¾% Debentures
8.750%
9/1/2021
22
International Loans
Japan Debt
Various
Various
63
European Debt
1
Various
Various
483
Other
Propco I Term Loan
L + 5.00%
8/21/2019
973
Capital Leases / Other
Various
Various
202
Total Debt
$4,826
Net Debt
$4,128
Toys-Delaware Notes and Loans |
 EASY
EXPERT
FAIR
10
APPENDIX |
 EASY
EXPERT
FAIR
11
TOYS“R”US INC. –
ADJUSTED EBITDA RECONCILIATION
1
The impact of these one-time adjustments are excluded from the Gross Margin balances in
this presentation ($'s in millions)
2/1/2014
1/31/2015
2/1/2014
1/31/2015
Operating (loss) income
($91)
$411-421
($350)
$185-195
Add:
Non-controlling interest
(3)
(2)
(3)
(4)
Depreciation and amortization
101
92
388
377
EBITDA
7
501-511
35
558-568
Adjustments:
Obsolete inventory clearance
1
51
--
51
8
Prior period adjustments
1
--
--
(1)
--
Sponsors’
management and advisory fees
5
4
22
18
Litigation expense
3
(8)
23
(8)
Severance
--
1
13
17
Store closure costs
2
--
2
5
Impairment of long-lived assets
37
5
44
13
Net gains on sales of properties
--
--
(8)
(5)
Compensation expense
2
5
3
20
Property losses, net of insurance recoveries
--
--
--
(9)
Obsolete inventory clearance
--
--
--
1
Prior period adjustments
17
--
17
--
Certain legal and accounting transaction costs
--
12
1
13
Non-controlling interest
3
2
3
4
Goodwill impairment
378
--
378
--
Adjusted EBITDA
$505
$522-532
$583
$635-645
Q4
Full Year |
 EASY
EXPERT
FAIR
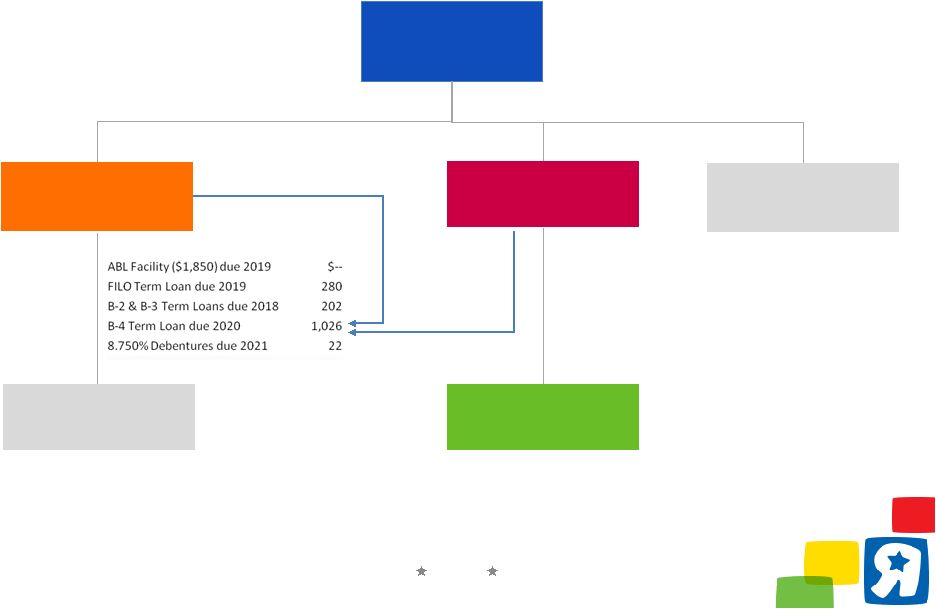
12
SIMPLIFIED ORGANIZATIONAL STRUCTURE
Toys“R”Us,
Inc.
Toys“R”Us
International
Entities
Guaranty of
B-4 Term Loan
Toys“R”Us
Property
Company
II,
LLC
(“PropCo
II”)
8.500% Senior Secured Notes due 2017 $725
Term Loan due
2019 $973
Total Funded Debt¹
Revolving Credit Facilities
$546
--
10.375% Senior Notes due 2017
$450
7.375% Senior Notes due 2018
400
Note: Chart has been simplified and does not include all entities; debt balances
presented at face value and excludes capital leases and finance obligations associated
with capital projects 1
Includes Spanish PropCo Loan, French PropCo Loan, UK PropCo Loans, Japan Bank Loans and Toys
Asia Debt Wayne
Real
Estate
Parent
Company,
LLC
Toys“R”Us
Property
Company
I,
LLC
(“PropCo
I”)
Toys“R”Us-Delaware,
Inc.
(Toys-Delaware)
65% Pledge of Canadian
Subsidiary Stock
$’s in millions | as of January 31, 2015 |