Attached files
| file | filename |
|---|---|
| 8-K - 8-K - STAG Industrial, Inc. | a15-5112_18k.htm |
Exhibit 99.1

STAG INDUSTRIAL ANNOUNCES FULL YEAR AND FOURTH QUARTER
2014 RESULTS
Boston, MA — February 23, 2015 - STAG Industrial, Inc. (the “Company”) (NYSE:STAG), a real estate investment trust focused on the acquisition and operation of single-tenant, industrial properties throughout the United States, today announced its financial and operating results for the fourth quarter and full year 2014.
“2014 represented a year of continued successful execution of our business plan and preparation for the future of our company,” said Ben Butcher, Chief Executive Officer of the Company. “We generated strong results on the investment, leasing, and capital markets fronts. We also made significant progress in growing and otherwise improving our platform to prepare for STAG’s future opportunities and challenges.”
2014 Annual Highlights:
· Generated Cash Net Operating Income (“Cash NOI”) of $142.4 million compared to $115.1 million for the year ended 2013, an increase of 24%.
· Generated Core Funds from Operations (“Core FFO”) of $84.2 million compared to $67.9 million for the year ended 2013, an increase of 24%. This represents $1.45 of Core FFO per diluted share for the year ended 2014 compared to $1.37 of Core FFO per share for the year ended 2013, an increase of 6%.
· Acquired 43 industrial buildings consisting of approximately 9.3 million square feet for $429.1 million resulting in growth of 31% of the Company’s assets on real estate cost basis in 2014, before dispositions. The acquired buildings were 99% occupied at closing.
· Executed leases for approximately 6.0 million square feet consisting of 646,000 square feet of new leases, 4.3 million square feet of renewal leases, and 1.1 million square feet of temporary leases. Experienced an increase in cash and GAAP rent of 5.1% and 9.5%, respectively.
· Achieved a retention rate of 69.7% for leases expiring in the year. Experienced an increase in cash and GAAP rent of 5.1% and 9.6%, respectively for the year’s renewals.
· Priced and modified 100% or approximately $1 billion of the Company’s unsecured debt resulting in an increase in maturity of 4.5 years and an improvement and conformity of all the Company’s debt covenants.
· Raised $317 million of common equity at an average price of $21.98 per share through a combination of the Company’s “At the Market” (“ATM”) programs executed throughout the year and a follow-on offering in the fourth quarter.
· Increased monthly per share common stock dividend twice for a total increase of 10% in 2014.
· Appointed Geoffrey G. Jervis as the Company’s Chief Financial Officer, Executive Vice President, and Treasurer, effective July 1, 2014.
· Appointed Jeffrey M. Sullivan as the Company’s Executive Vice President, General Counsel and Secretary, effective January 1, 2015.
Fourth Quarter Highlights:
· Generated Cash NOI of $41.4 million compared to $33.4 million for the fourth quarter of 2013, an increase of 24%.
· Generated Core FFO of $23.9 million compared to $18.9 million for the fourth quarter of 2013, an increase of 26%. This represents $0.37 of Core FFO per diluted share for the fourth quarter of 2014 (flat to the comparable period in 2013 due, in part, to capital markets activity in the quarter).
· Increased monthly per share common stock dividend by 2.3% to $0.1125 per share commencing with the January 2015 dividend. The increase equates to an annualized dividend of $1.35 per share, or a yield of 5.5% based on the year ended stock price of $24.50.
· Acquired 12 industrial buildings consisting of approximately 2.7 million square feet for $136.4 million. The acquired buildings were 100% occupied at closing.
· Achieved quarter-end occupancy on the Company’s portfolio of 94.9%.
· Executed leases for approximately 2.8 million square feet consisting of approximately 272,000 square feet of new leases, 2.3 million square feet of renewal leases, and 186,000 square feet of temporary leases. Experienced an increase in cash and GAAP rent of 5.4% and 10.2%, respectively.
· Achieved a retention rate of 71.7% for leases expiring in the quarter. Experienced an increase in cash and GAAP rent of 4.7% and 9.3% respectively, for the quarter’s renewals.
· Completed a $600 million comprehensive modification and refinancing of the Company’s unsecured revolving credit facility and unsecured term loans.
· Issued $50 million of previously announced (April 2, 2014) senior unsecured notes with a 10-year term.
· Agreed to pricing of a new $200 million private placement of senior unsecured notes and issued $80 million of the notes with a 12-year term. (The Company issued the remaining $120 million in senior unsecured notes on February 20, 2015).
· Raised $153 million of common equity at an average price of $21.15 per share through a combination of the Company’s “ATM” programs and a follow-on offering.
Acquisition & Disposition Activity and Guidance
During the year ended December 31, 2014, the Company acquired 43 industrial buildings consisting of approximately 9.3 million square feet for $429.1 million. The acquired buildings were 99% occupied at closing. The chart below reflects the acquisition activity during the year ended December 31, 2014:
2014 ACQUISITION ACTIVITY
|
Quarter |
|
Square Feet (MM) |
|
Buildings |
|
Cost (MM) (1) |
|
Weighted Average Remaining |
| |
|
Q1 |
|
1.0 |
|
4 |
|
$ |
37.3 |
|
4.9 |
|
|
Q2 |
|
2.1 |
|
9 |
|
81.7 |
|
4.9 |
| |
|
Q3 |
|
3.5 |
|
18 |
|
173.7 |
|
4.4 |
| |
|
Q4 |
|
2.7 |
|
12 |
|
136.4 |
|
4.7 |
| |
|
Total/Weighted Average |
|
9.3 |
|
43 |
|
$ |
429.1 |
|
4.7 |
|
(1) Cost includes purchase price plus property acquisition costs
During the three months ended December 31, 2014, the Company acquired 12 industrial buildings consisting of approximately 2.7 million square feet for $136.4 million. The acquired buildings were 100% occupied at closing. Details of the acquired buildings are shown in the chart below:
FOURTH QUARTER 2014 ACQUISITIONS
|
Location (CBSA) (1) |
|
Date Acquired |
|
Square Feet |
|
Buildings |
|
Cost (MM) (2) |
|
Remaining Lease |
| |
|
Racine, WI |
|
10/22/2014 |
|
98,151 |
|
1 |
|
$ |
6.2 |
|
1.9 |
|
|
Fort Wayne, IN |
|
11/03/2014 |
|
108,800 |
|
1 |
|
4.4 |
|
5.2 |
| |
|
Nashville-Davidson-Murfreesboro-Franklin, TN |
|
11/04/2014 |
|
102,505 |
|
1 |
|
4.8 |
|
4.8 |
| |
|
Chicago-Joliet-Naperville, IL-IN-WI |
|
11/06/2014 |
|
338,740 |
|
1 |
|
15.7 |
|
9.1 |
| |
|
Milwaukee-Waukesha-West Allis, WI |
|
11/10/2014 |
|
202,500 |
|
1 |
|
9.4 |
|
4.5 |
| |
|
Lancaster, PA |
|
11/14/2014 |
|
206,236 |
|
1 |
|
8.4 |
|
2.6 |
| |
|
Oxnard-Thousand Oaks-Ventura, CA |
|
11/17/2014 |
|
309,500 |
|
1 |
|
21.6 |
|
4.0 |
| |
|
Oxnard-Thousand Oaks-Ventura, CA |
|
11/17/2014 |
|
423,106 |
|
1 |
|
33.0 |
|
4.0 |
| |
|
Atlanta-Sandy Springs-Marietta, GA |
|
11/20/2014 |
|
145,262 |
|
1 |
|
4.5 |
|
4.4 |
| |
|
Winston-Salem, NC |
|
11/24/2014 |
|
385,000 |
|
1 |
|
14.9 |
|
5.4 |
| |
|
Houston-Sugar Land-Baytown, TX |
|
12/22/2014 |
|
185,000 |
|
1 |
|
7.1 |
|
3.3 |
| |
|
Spartanburg, SC |
|
12/23/2014 |
|
226,140 |
|
1 |
|
6.4 |
|
5.1 |
| |
|
Total/Weighted Average |
|
|
|
2,730,940 |
|
12 |
|
$ |
136.4 |
|
4.7 |
|
(1) Core based statistical area
(2) Cost includes purchase price plus property acquisition costs
Subsequent to year-end, and through February 23, 2015, the Company acquired one industrial building consisting of 503,490 square feet for $34.3 million and was funded by using cash on hand and granting 812,676 Common Units in the Operating Partnership (“OP Units”) with a fair value of $21.9 million. This building was under contract as of December 31, 2014. As of February 23, 2015, the Company had entered into contracts to acquire seven industrial buildings for $93.8 million. Included in the acquisitions under contract are three build-to-suit transactions, which are scheduled to close in the second quarter of 2015. The Company also executed non-binding letters of intent (“LOI”) to acquire six additional industrial buildings for $39.4 million.
As of February 23, 2015, the Company’s pipeline of potential acquisitions is $1.2 billion and 94 industrial buildings. The pipeline is a point in time measure that includes all of the transactions under consideration
by the Company’s acquisitions group that have passed the initial screening process. The pipeline also includes transactions under contract and transactions with non-binding LOIs.
Inclusive of contracts executed but not yet closed, the Company has closed or committed to close a total of $128.1 million of acquisitions year-to-date. In 2015, consistent with past years, the Company will target 25% growth in its portfolio, equating to approximately $450 million of acquisitions.
The purchase and sale agreements for the properties under contract are subject to satisfaction of closing conditions, and the properties under LOI require the negotiation and execution of definitive purchase and sale agreements. There can be no assurance that any of the properties under contract or LOI will be acquired on the terms anticipated or at all. In addition, there can be no assurance that the Company will achieve its targeted acquisition level for 2015.
During the year ended December 31, 2014, the Company sold four industrial buildings consisting of 433,153 square feet for $13.5 million. The chart below reflects the disposition activity during the year ended December 31, 2014:
2014 DISPOSITION ACTIVITY
|
Quarter |
|
Square Feet |
|
Buildings |
|
Price $ (MM) |
| |
|
Q1 |
|
15,085 |
|
1 |
|
$ |
0.5 |
|
|
Q2 |
|
0 |
|
0 |
|
0.0 |
| |
|
Q3 |
|
181,838 |
|
1 |
|
7.1 |
| |
|
Q4 |
|
236,230 |
|
2 |
|
5.9 |
| |
|
Total |
|
433,153 |
|
4 |
|
$ |
13.5 |
|
During the three months ended December 31, 2014, the Company sold two industrial buildings consisting of 236,230 square feet for $5.9 million. The Company recorded effectively offsetting items associated with these dispositions inclusive of an impairment charge of $2.8 million and termination fee income of $2.4 million. Details of the dispositions are shown in the chart below:
FOURTH QUARTER 2014 DISPOSITIONS
|
Location (CBSA) |
|
Date Sold |
|
Square Feet |
|
Buildings |
|
Price $ (MM) |
| |
|
Detroit-Warren-Dearborn, MI |
|
11/04/2014 |
|
87,932 |
|
1 |
|
$ |
3.4 |
|
|
Orlando-Kissimmee-Sanford, FL |
|
12/30/2014 |
|
148,298 |
|
1 |
|
2.5 |
| |
|
Total |
|
|
|
236,230 |
|
2 |
|
$ |
5.9 |
|
As in prior years, in 2015 the Company will evaluate the opportunistic disposition of certain assets. Assets under consideration include property types no longer considered core to the Company’s business such as the Company’s small flex/office building portfolio.
Leasing Activity
During the year ended December 31, 2014, the Company executed approximately 6.0 million square feet of leases of all types, comprised of 4.3 million square feet of renewal leases, 646,452 square feet of new leases, and 1.1 million square feet of temporary leases. The chart below reflects the leasing activity:
2014 LEASING ACTIVITY
|
Lease Type |
|
Count |
|
Square Feet |
|
Base Rent |
|
Lease |
|
Tenant |
|
Total Costs |
|
Cash Rent |
|
GAAP Rent |
| ||||
|
New Leases |
|
11 |
|
646,452 |
|
$ |
3.95 |
|
$ |
0.68 |
|
$ |
0.46 |
|
$ |
1.14 |
|
6.5 |
% |
11.5 |
% |
|
Renewal Leases |
|
31 |
|
4,288,760 |
|
3.79 |
|
0.29 |
|
0.43 |
|
0.72 |
|
5.0 |
% |
9.4 |
% | ||||
|
Total /Weighted Avg New & Renewal |
|
42 |
|
4,935,212 |
|
$ |
3.81 |
|
$ |
0.34 |
|
$ |
0.43 |
|
$ |
0.78 |
|
5.1 |
% |
9.5 |
% |
|
Temporary Leases |
|
12 |
|
1,058,701 |
|
|
|
|
|
|
|
|
|
|
|
|
| ||||
|
Total Leasing Activity |
|
54 |
|
5,993,913 |
|
|
|
|
|
|
|
|
|
|
|
|
| ||||
(1) Cash basis rent growth is a ratio of the change in net effective rent (excluding straight-line rent adjustments as required by GAAP) of the comparable lease.
(2) GAAP basis rent growth is a ratio of the change in net effective rent (including straight-line rent adjustments as required by GAAP) of the comparable lease.
(3) Rent change for new leases where there were no prior comparable leases, due to extended downtime or materially different lease structures are excluded.
During the three months ended December 31, 2014, the Company executed leases consisting of approximately 2.8 million square feet. The leases signed are detailed below:
FOURTH QUARTER 2014 LEASING ACTIVITY
|
Lease Type |
|
Count |
|
Square Feet |
|
Base Rent |
|
Lease |
|
Tenant |
|
Total Costs |
|
Cash Rent |
|
GAAP Rent |
| ||||
|
New Leases |
|
6 |
|
271,700 |
|
$ |
3.83 |
|
$ |
0.70 |
|
$ |
0.94 |
|
$ |
1.64 |
|
3.4 |
% |
14.0 |
% |
|
Renewal Leases |
|
14 |
|
2,312,163 |
|
3.74 |
|
0.30 |
|
0.09 |
|
0.39 |
|
5.6 |
% |
9.9 |
% | ||||
|
Total /Weighted Avg New & Renewal |
|
20 |
|
2,583,863 |
|
$ |
3.75 |
|
$ |
0.34 |
|
$ |
0.18 |
|
$ |
0.52 |
|
5.4 |
% |
10.2 |
% |
|
Temporary Leases |
|
4 |
|
185,645 |
|
|
|
|
|
|
|
|
|
|
|
|
| ||||
|
Total Leasing Activity |
|
24 |
|
2,769,508 |
|
|
|
|
|
|
|
|
|
|
|
|
| ||||
|
|
|
|
|
|
|
|
|
|
|
|
|
|
|
|
|
|
| ||||
Eight leases consisting of approximately 1.0 million square feet expired in the fourth quarter and the tenant retention rate for these leases was 71.7%. The rental rate on the renewed leases expiring in the fourth quarter increased 4.7% on a cash basis and 9.3% on a GAAP basis. The weighted average tenant retention rate for the year ended December 31, 2014 was 69.7% as detailed in the chart below:
2014 RETENTION
|
Quarter |
|
Expiring Square Footage |
|
Retained Square |
|
Retention Rate (1) |
|
Cash Rent Change |
|
GAAP Rent Change |
|
|
Q1 |
|
874,858 |
|
659,887 |
|
75.4 |
% |
3.7 |
% |
11.2 |
% |
|
Q2 |
|
835,206 |
|
293,000 |
|
35.1 |
% |
13.5 |
% |
13.7 |
% |
|
Q3 |
|
766,079 |
|
754,479 |
|
98.5 |
% |
3.5 |
% |
7.5 |
% |
|
Q4 |
|
991,626 |
|
710,710 |
|
71.7 |
% |
4.7 |
% |
9.3 |
% |
|
Total / Weighted Average |
|
3,467,769 |
|
2,418,076 |
|
69.7 |
% |
5.1 |
% |
9.6 |
% |
(1) Based on square feet retained in the period
Subsequent to December 31, 2014, the Company has executed two temporary leases consisting of 64,645 square feet.
As of February 23, 2015, the Company had 19 leases in negotiation for approximately 2.4 million square feet. These negotiations are subject to various conditions that have not yet been satisfied and there can be no assurance that the transactions will be consummated.
Portfolio Highlights
The Company’s occupancy rate at the end of the fourth quarter was 94.9% based on total square footage of 47.0 million. The quarterly occupancy rate and total square footage through the end of the fourth quarter appears below:
2014 OCCUPANCY
|
Quarter |
|
Number of Buildings |
|
Total Square Footage |
|
Occupancy % |
|
|
Q1 |
|
212 |
|
39,046,566 |
|
95.3 |
% |
|
Q2 |
|
221 |
|
41,197,524 |
|
94.5 |
% |
|
Q3 |
|
238 |
|
44,499,166 |
|
94.8 |
% |
|
Q4 |
|
248 |
|
47,024,076 |
|
94.9 |
% |
The Company’s portfolio, inclusive of acquisitions and dispositions, totaled approximately 47.0 million square feet as of December 31, 2014, representing an increase in square footage of 23% since December 31, 2013. Portfolio characteristics are detailed in the chart below:
PORTFOLIO CHARACTERISTICS
|
|
|
December 31, 2014 |
|
December 31, 2013 |
|
|
Square Feet |
|
47,024,076 |
|
38,086,376 |
|
|
# of Tenants |
|
227 |
|
191 |
|
|
Average Lease Size |
|
168,311 |
|
164,799 |
|
|
Average Building Size |
|
189,613 |
|
182,231 |
|
|
Average Building Age |
|
29 |
|
28 |
|
|
Average Clear Height (1) |
|
26-29’ |
|
26-29’ |
|
(1) Excludes flex / office buildings
The chart below details the Company’s market exposure:
BUILDINGS BY LOCATION CLASSIFICATION
|
Location |
|
|
|
Square Footage |
|
|
|
Annualized Base Rental Revenue |
| |||||
|
Classification (1) |
|
# of Buildings |
|
Amount |
|
% |
|
Occupancy |
|
Amount |
|
% |
| |
|
Primary |
|
48 |
|
9,505,778 |
|
20.2 |
% |
95.8 |
% |
$ |
34,440,483 |
|
20.0 |
% |
|
Secondary |
|
146 |
|
30,061,349 |
|
63.9 |
% |
93.7 |
% |
111,059,071 |
|
64.5 |
% | |
|
Tertiary |
|
54 |
|
7,456,949 |
|
15.9 |
% |
98.3 |
% |
26,724,275 |
|
15.5 |
% | |
|
TOTAL |
|
248 |
|
47,024,076 |
|
100.0 |
% |
94.9 |
% |
$ |
172,223,829 |
|
100.0 |
% |
(1) As defined by CBRE-RE
The chart below details the Company’s tenant credit profile:
TENANT CREDIT PROFILE (1)
|
|
|
December 31, 2014 |
|
December 31, 2013 |
|
|
Tenants Publicly Rated |
|
53.6 |
% |
57.7 |
% |
|
Tenants Rated Investment Grade |
|
27.6 |
% |
30.5 |
% |
|
Tenant Revenue > $100 Million |
|
87.5 |
% |
87.0 |
% |
|
Tenant Revenue >$ 1 Billion |
|
58.3 |
% |
59.6 |
% |
(1) Percentages based on annualized base rental revenue and includes tenants, guarantors, and / or non-guarantor parents
As a high growth company, the Company’s same store Cash NOI is impacted by the material annual additions to the “same store” portfolio, averaging 41% per annum on a real estate cost basis since the Company’s initial public offering in 2011. Furthermore, to date, the Company has generally acquired buildings that are approximately 100% occupied, while the broader market, which ultimately governs the Company’s occupancy, is between 90% and 95% occupied. Therefore, the Company’s same store Cash NOI performance is not representative of the true performance of the portfolio. So long as the Company acquires buildings at a material pace with occupancy levels above market, management believes this dynamic (normalization of occupancy) will continue to exist and will tend to dampen our “same store” performance (see the Company’s supplemental information package for additional disclosure). Operationally, the Company’s asset management team focuses on retention rates, de novo leasing
activity, rental rate achievement, and other property level revenue and expense items. All of these measures are disclosed in our supplemental information package.
Key Financial Measures
Cash NOI and Core FFO for the year were $142.4 million and $84.2 million, respectively. Cash NOI and Core FFO for the three months ended December 31, 2014 were $41.4 million and $23.9 million, respectively. The Company believes that Cash NOI and Core FFO are useful supplemental measures of the Company’s operating performance as they provide a more meaningful and consistent comparison of the Company’s operating performance and allow investors to more easily compare the Company’s operating results.
The Company continued its accretive growth of recurring operating income during the year, with Core FFO growing 24% as compared to the year ended 2013 and 6% on a diluted, per share basis. Cash NOI also grew 24% over the same period. For the three months ended December 31, 2014, Core FFO grew 26% as compared to the three months ended December 31, 2013 in the aggregate and remained flat on a diluted, per share basis. Cash NOI grew 24% over the same time period. Core FFO and Cash NOI do not include a full quarter’s income associated with buildings acquired during the quarter. Inclusive of this income and exculsive of termination fee income, run rate Cash NOI would have been $40.0 million for the three months ended December 31, 2014.
Net loss for the three months ended December 31, 2014 was $2.6 million. Included in net loss is depreciation and amortization expense of $25.5 million. A reconciliation of net income (loss) to Cash NOI, adjusted earnings before interest, tax, depreciation and amortization (“Adjusted EBITDA”), Core FFO, FFO, and adjusted FFO (“AFFO”), all non-GAAP financial measures, appears at the end of this release (see the Company’s supplemental information package for additional disclosure).
The Company’s key financial measures are noted in the chart below:
KEY FINANCIAL MEASURES
|
|
|
Three months ended December 31, |
|
Year ended December 31, |
| ||||||||||||
|
Metrics |
|
2014 |
|
2013 |
|
% Change |
|
2014 |
|
2013 |
|
% Change |
| ||||
|
($000,000s, except per share data) |
|
|
|
|
|
|
|
|
|
|
|
|
| ||||
|
Cash Net Operating Income |
|
$ |
41.4 |
|
$ |
33.4 |
|
24 |
% |
$ |
142.4 |
|
$ |
115.1 |
|
24 |
% |
|
Adjusted EBITDA |
|
$ |
33.9 |
|
$ |
27.1 |
|
25 |
% |
$ |
120.7 |
|
$ |
98.0 |
|
23 |
% |
|
Core FFO |
|
$ |
23.9 |
|
$ |
18.9 |
|
26 |
% |
$ |
84.2 |
|
$ |
67.9 |
|
24 |
% |
|
Core FFO per share / unit - diluted |
|
$ |
0.37 |
|
$ |
0.37 |
|
0 |
% |
$ |
1.45 |
|
$ |
1.37 |
|
6 |
% |
|
AFFO |
|
$ |
22.6 |
|
$ |
18.1 |
|
25 |
% |
$ |
83.0 |
|
$ |
66.1 |
|
26 |
% |
|
Net Income (Loss) |
|
$ |
(2.6 |
) |
$ |
5.2 |
|
-151 |
% |
$ |
(5.0 |
) |
$ |
4.9 |
|
-203 |
% |
General and administrative expenses for the three months ended December 31, 2014 were $6.9 million. This included a non-recurring, non-cash compensation expense of $929,000 related to the early departure of an officer. Excluding this non-recurring expense, general and administrative expenses for the quarter were $6.0 million. The Company estimates that general and administrative expenses will be approximately $30 million for 2015. The Company has a long term goal of having general and administrative expenses at approximately 10% of Cash NOI. As a growth company, the Company’s expense levels are the result of developing a platform to confidently address not only the recent opportunities and challenges but also future opportunities and challenges management foresees.
Liquidity, Capital Markets Activity, and Financial Statistics
As of December 31, 2014, the Company had total immediate liquidity of $458 million, comprised of $24 million of cash and $434 million of immediate availability on the Company’s unsecured credit facility, unsecured term loans, and unsecured notes. This liquidity is sufficient to address the Company’s anticipated 2015 acquisitions. The Company also had $5 million of additional capacity on its unsecured facilities.
As of December 31, 2014, the Company’s enterprise value was approximately $2.5 billion comprised of $1.6 billion of equity market capitalization, $139 million of preferred equity and total debt of $686 million.
During the year ended December 31, 2014, the Company completed a comprehensive refinance and modification of 100% of its unsecured debt as explained in the paragraphs below, the modification included $600 million refinancing of the Company’s unsecured revolving credit facility and term loans and, pricing of $300 million in private senior unsecured notes.
On April 2, 2014, the Company agreed to pricing of a $100 million note purchase agreement providing for the future private placement of senior unsecured notes consisting of $50 million in Series A 12-year notes, and $50 million in Series B 10-year notes. Notes issued for this private placement will bear interest at a fixed rate of 4.98%. On July, 1, 2014, the Company issued the Series A notes, and on October 1, 2014, the Company issued the Series B notes.
On November 24, 2014, the Company agreed to pricing of a $200 million note purchase agreement providing for the future private placement of senior unsecured notes consisting of $80 million in Series C 12-year notes, $100 million in Series D 10-year notes, and $20 million in Series E 12-year notes. Notes issued for this private placement will bear interest at a fixed rate of 4.42%, 4.32%, and 4.42%, respectively. On December 30, 2014, the Company issued the $80 million Series C 12-year notes. On February 20, 2015, the Company issued the remaining $100 million in Series D and $20 million in Series E notes.
On December 22, 2014, the Company completed the following refinancing and modification of the unsecured credit facility and unsecured term loans:
· New $300 million Unsecured Revolving Credit Facility, maturing in 2019
· New $150 million, 7-year Unsecured Term Loan A, maturing in 2022
· Amendment to existing unfunded $150 million, 7-year Unsecured Term Loan B, maturing in 2021
· Extinguishment of $150 million, 5-year Unsecured Term Loan, maturing in 2017
The impact of the modification and refinancing of the unsecured revolving credit facility and unsecured term loans, as well as the private placement activity can be seen in the detailed debt maturity chart below:
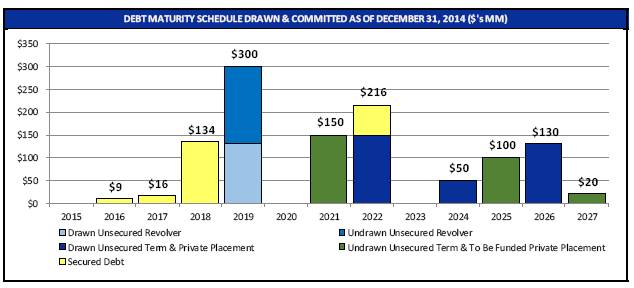
The refinancing and modification of the Company’s unsecured debt resulted in an increase in maturity of 4.5 years and an improvement and conformity of all the Company’s debt covenants.
As of December 31, 2014, the Company had approximately $686.3 million of debt outstanding with a weighted average remaining term of 6.9 years and a weighted average interest rate of 4.04%.
Subsequent to the end of the quarter, on January 6, 2015, Fitch Ratings assigned a ‘BBB-’ rating; outlook positive, to STAG Industrial Operating Partnership L.P.’s $80 million, 12-year unsecured notes issued through a private placement on December 30, 2014. Fitch Ratings also re-affirmed its ‘BBB-’ rating; outlook positive, for the Company and its operating partnership, with additional ratings as follows: senior unsecured: ‘BBB-’; outlook positive, and preferred equity: ‘BB’; outlook positive.
The chart below details the Company’s debt capital structure and financial ratios:
DEBT CAPITAL STRUCTURE AND FINANCIAL RATIOS
|
|
|
December 31, 2014 |
|
December 31, 2013 |
| ||
|
Total Debt ($000s) |
|
$ |
686,347 |
|
$ |
556,091 |
|
|
Weighted Average Duration (years) |
|
6.9 |
|
4.7 |
| ||
|
Weighted Average Interest Rate |
|
4.04 |
% |
3.64 |
% | ||
|
% Secured |
|
33 |
% |
41 |
% | ||
|
% Maturing Next 12 Months |
|
0.0 |
% |
0.0 |
% | ||
|
Net Debt to Real Estate Cost Basis (1) |
|
37 |
% |
40 |
% | ||
|
Total Debt to Enterprise Value |
|
28 |
% |
32 |
% | ||
|
Net Debt to Adjusted EBITDA (2) |
|
4.9 |
x |
5.1 |
x | ||
|
Interest Coverage Ratio (3) |
|
5.0 |
x |
5.3 |
x | ||
(1) Real estate cost basis is equal to the book value of rental property and deferred leasing intangibles, exclusive of the related accumulated depreciation and amortization.
(2) Annualized Adjusted EBITDA as defined at the end of this release.
(3) Adjusted EBITDA divided by interest expense less non-cash portion of interest expense.
In 2014, the Company continued to utilize its ATM programs as its primary source of equity capital. As a supplement to the activity under the ATM programs, in October 2014, the Company executed a marketed, overnight common stock offering. The Company expects to continue to rely on the ATM programs in the future as its primary source of equity and execute discrete follow-on offerings as required and available.
During the three months ended December 31, 2014, the Company issued 889,839 shares of common stock under its ATM programs realizing gross proceeds of $18.5 million. The Company has two ATM programs with a total of $182 million available. The chart below reflects the activity for the year ended December 31, 2014:
2014 ATM ACTIVITY
|
ATM |
|
Shares Issued |
|
Price per Share (Weighted Avg) |
|
Gross Proceeds (MM) |
|
Net Proceeds (MM) |
| |||
|
Q1 |
|
3,431,459 |
|
$ |
22.61 |
|
$ |
77.6 |
|
$ |
76.4 |
|
|
Q2 |
|
1,756,613 |
|
23.79 |
|
41.8 |
|
41.2 |
| |||
|
Q3 |
|
2,003,465 |
|
22.32 |
|
44.7 |
|
44.0 |
| |||
|
Q4 |
|
889,839 |
|
20.82 |
|
18.5 |
|
18.2 |
| |||
|
Total/Weighted Average |
|
8,081,376 |
|
$ |
22.60 |
|
$ |
182.6 |
|
$ |
179.8 |
|
On October 20, 2014, the Company closed a marketed, overnight common stock offering of 6,325,000 shares, inclusive of underwriters’ option to purchase additional shares, at a price of $21.20 per share. The Company raised gross proceeds of $134.1 million and net proceeds of $128.2 million.
Dividends
The Company’s dividend policy is set by the Board of Directors which considers, among other factors, a combination of (i) REIT distribution requirements and (ii) recurring, distributable, cash income. Other factors include AFFO, which the Company considers when determining its distribution levels. In 2014, dividend income was approximately 66% taxable income and the remainder was a return of capital. The Company’s AFFO payout ratio was 94.3% for the three months ended December 31, 2014.
On October 30, 2014, the Board of Directors declared an increase in the Company’s monthly common stock dividend from a rate of $0.11 per share to $0.1125 per share, commencing with the January 2015 dividend. The increase equates to an annual dividend of $1.35 per share of common stock and represents an annual dividend yield of 5.5% based on the Company’s December 31, 2014 stock price of $24.50 per share. On February 20, 2015, the Company’s Board of Directors declared a monthly dividend of $0.1125 per share for the months of April, May, and June. The record and payment dates for the 2015 first and second quarter dividends are as follows:
Q1 & Q2 2015 COMMON DIVIDENDS DECLARED
|
Month |
|
Record Date |
|
Payment Date |
|
Dividend |
| |
|
January-2015 |
|
January 30, 2015 |
|
February 17, 2015 |
|
$ |
0.1125 |
|
|
February-2015 |
|
February 27, 2015 |
|
March 16, 2015 |
|
$ |
0.1125 |
|
|
March-2015 |
|
March 31, 2015 |
|
April 15, 2015 |
|
$ |
0.1125 |
|
|
April-2015 |
|
April 30, 2015 |
|
May 15, 2015 |
|
$ |
0.1125 |
|
|
May-2015 |
|
May 29, 2015 |
|
June 15, 2015 |
|
$ |
0.1125 |
|
|
June-2015 |
|
June 30, 2015 |
|
July 15, 2015 |
|
$ |
0.1125 |
|
On February 20, 2015, the Company’s Board of Directors has declared a March 16, 2015 record date for the first quarter preferred stock dividends for its 9.0% Series A Cumulative Redeemable Preferred Stock (NYSE: STAG Pr A) (“Series A Preferred”) and its 6.625% Series B Cumulative Redeemable Preferred Stock (NYSE: STAG Pr B) (“Series B Preferred”). The quarterly dividend for the Series A Preferred is $0.5625 per share, which equates to $2.25 per share on an annualized basis, and the quarterly dividend for the Series B Preferred is $0.4140625 per share, which equates to $1.65625 per share on an annualized basis. Both preferred stock dividends will be payable on March 31, 2015.
Personnel
During the year ended December 31, 2014, the Company had four changes to its executive management team:
· On February 7, 2014, Gregory W. Sullivan, former Chief Financial Officer, Executive Vice President and Treasurer of the Company, notified the Company of his intention not to renew his contract at its expiration on April 20, 2014.
· On May 14, 2014, the Company appointed Geoffrey G. Jervis to serve as the Company’s Chief Financial Officer, Executive Vice President, and Treasurer, effective July 1, 2014.
· On September 8, 2014, Kathryn Arnone, Executive Vice President, General Counsel and Secretary of the Company, notified the Company that she is resigning effective December 31, 2014. On December 15, 2014, Ms. Arnone informed the board of directors that she was resigning immediately due to illness.
· On September 8, 2014, the Company announced the appointment of Jeffrey M. Sullivan to serve as the Company’s Executive Vice President, General Counsel and Secretary of the Company, effective January 1, 2015.
Furthermore, in 2014 and 2015, the Company has hired or intends to hire 31 new employees, representing a growth of 70% in personnel from December 31, 2013. The growth is primarily designed to address additional needs associated with the Company’s projected growth.
Conference Call
The Company will host a conference call today, at 11:00 a.m. (Eastern Time) to discuss the quarter’s results. The call can be accessed live over the phone toll-free by dialing (877) 407-4018, or for international callers, (201) 689-8471. A replay will be available shortly after the call and can be accessed by dialing (877) 870-5176, or for international callers, (858) 384-5517. The passcode for the replay is 13598657.
Interested parties may also listen to a simultaneous webcast of the conference call by visiting the Investor Relations section of the Company’s website at www.stagindustrial.com, or by clicking on the following link:
http://ir.stagindustrial.com/corporateprofile.aspx?iid=4263385
Supplemental Schedules
The Company has provided a supplemental information package to provide additional disclosure and financial information on its website (www.stagindustrial.com) under the “Presentations” tab in the Investor Relations section.
Additional information is also available on the Company’s website at www.stagindustrial.com.
CONSOLIDATED BALANCE SHEETS
STAG Industrial, Inc.
(unaudited, $000s, except share data)
|
|
|
December 31, 2014 |
|
December 31, 2013 |
| ||
|
Assets |
|
|
|
|
| ||
|
Rental Property: |
|
|
|
|
| ||
|
Land |
|
$ |
191,238 |
|
$ |
134,399 |
|
|
Buildings and improvements |
|
1,224,727 |
|
944,647 |
| ||
|
Less: accumulated depreciation |
|
(105,789 |
) |
(71,653 |
) | ||
|
Total rental property, net |
|
1,310,176 |
|
1,007,393 |
| ||
|
Cash and cash equivalents |
|
23,878 |
|
6,690 |
| ||
|
Restricted cash |
|
6,906 |
|
6,806 |
| ||
|
Tenant accounts receivable, net |
|
16,833 |
|
13,790 |
| ||
|
Prepaid expenses and other assets |
|
22,531 |
|
16,526 |
| ||
|
Interest rate swaps |
|
959 |
|
3,924 |
| ||
|
Due from related parties |
|
130 |
|
185 |
| ||
|
Deferred leasing intangibles, net of accumulated amortization of $146,026 and $95,201, respectively |
|
247,904 |
|
214,967 |
| ||
|
Total assets |
|
$ |
1,629,317 |
|
$ |
1,270,281 |
|
|
Liabilities and Equity |
|
|
|
|
| ||
|
Liabilities: |
|
|
|
|
| ||
|
Mortgage notes payable |
|
$ |
225,347 |
|
$ |
225,591 |
|
|
Unsecured credit facility |
|
131,000 |
|
80,500 |
| ||
|
Unsecured term loans |
|
150,000 |
|
250,000 |
| ||
|
Unsecured notes |
|
180,000 |
|
— |
| ||
|
Accounts payable, accrued expenses and other liabilities |
|
21,558 |
|
18,574 |
| ||
|
Interest rate swaps |
|
873 |
|
— |
| ||
|
Tenant prepaid rent and security deposits |
|
11,480 |
|
8,972 |
| ||
|
Dividends and distributions payable |
|
7,355 |
|
5,166 |
| ||
|
Deferred leasing intangibles, net of accumulated amortization of $6,565 and $4,520, respectively |
|
10,180 |
|
6,914 |
| ||
|
Total liabilities |
|
737,793 |
|
595,717 |
| ||
|
Equity: |
|
|
|
|
| ||
|
Preferred stock, par value $0.01 per share, 10,000,000 shares authorized, |
|
|
|
|
| ||
|
Series A, 2,760,000 shares (liquidation preference of $25.00 per share) issued and outstanding at December 31, 2014 and December 31, 2013 |
|
69,000 |
|
69,000 |
| ||
|
Series B, 2,800,000 shares (liquidation preference of $25.00 per share) issued and outstanding at December 31, 2014 and December 31, 2013 |
|
70,000 |
|
70,000 |
| ||
|
Common stock, par value $0.01 per share, 100,000,000 shares authorized, 64,434,852 and 44,764,377 shares issued and outstanding at December 31, 2014 and December 31, 2013, respectively |
|
644 |
|
447 |
| ||
|
Additional paid-in capital |
|
928,242 |
|
577,039 |
| ||
|
Common stock dividends in excess of earnings |
|
(203,241 |
) |
(116,877 |
) | ||
|
Accumulated other comprehensive income (loss) |
|
(489 |
) |
3,440 |
| ||
|
Total stockholders’ equity |
|
864,156 |
|
603,049 |
| ||
|
Noncontrolling interest |
|
27,368 |
|
71,515 |
| ||
|
Total equity |
|
891,524 |
|
674,564 |
| ||
|
Total liabilities and equity |
|
$ |
1,629,317 |
|
$ |
1,270,281 |
|
CONSOLIDATED STATEMENTS OF OPERATIONS
STAG Industrial, Inc.
(unaudited, $000s, except share data)
|
|
|
Three months ended December 31, |
|
Year ended December 31, |
| ||||||||
|
|
|
2014 |
|
2013 |
|
2014 |
|
2013 |
| ||||
|
Revenue |
|
|
|
|
|
|
|
|
| ||||
|
Rental income |
|
$ |
43,375 |
|
$ |
32,134 |
|
$ |
149,470 |
|
$ |
116,344 |
|
|
Tenant recoveries |
|
6,513 |
|
4,949 |
|
23,607 |
|
16,349 |
| ||||
|
Other income |
|
145 |
|
335 |
|
739 |
|
1,200 |
| ||||
|
Total revenue |
|
50,033 |
|
37,418 |
|
173,816 |
|
133,893 |
| ||||
|
Expenses |
|
|
|
|
|
|
|
|
| ||||
|
Property |
|
9,103 |
|
6,827 |
|
33,388 |
|
24,010 |
| ||||
|
General and administrative |
|
6,934 |
|
4,482 |
|
26,396 |
|
17,867 |
| ||||
|
Property acquisition costs |
|
953 |
|
596 |
|
4,390 |
|
3,427 |
| ||||
|
Depreciation and amortization |
|
25,451 |
|
18,653 |
|
88,057 |
|
67,556 |
| ||||
|
Loss on impairment |
|
2,840 |
|
— |
|
2,840 |
|
— |
| ||||
|
Other expenses |
|
192 |
|
285 |
|
803 |
|
621 |
| ||||
|
Total expenses |
|
45,473 |
|
30,843 |
|
155,874 |
|
113,481 |
| ||||
|
Other income (expense) |
|
|
|
|
|
|
|
|
| ||||
|
Interest income |
|
4 |
|
4 |
|
15 |
|
13 |
| ||||
|
Interest expense |
|
(7,168 |
) |
(5,453 |
) |
(25,109 |
) |
(20,319 |
) | ||||
|
Loss on extinguishment of debt |
|
(686 |
) |
— |
|
(686 |
) |
— |
| ||||
|
Gain on the sales of rental property |
|
646 |
|
— |
|
2,799 |
|
— |
| ||||
|
Total other income (expense) |
|
(7,204 |
) |
(5,449 |
) |
(22,981 |
) |
(20,306 |
) | ||||
|
Net income (loss) from continuing operations |
|
$ |
(2,644 |
) |
$ |
1,126 |
|
$ |
(5,039 |
) |
$ |
106 |
|
|
Discontinued operations |
|
|
|
|
|
|
|
|
| ||||
|
Loss attributable to discontinued operations |
|
— |
|
(757 |
) |
— |
|
(509 |
) | ||||
|
Gain on sales of real estate |
|
— |
|
4,841 |
|
— |
|
5,305 |
| ||||
|
Total income attributable to discontinued operations |
|
— |
|
4,084 |
|
— |
|
4,796 |
| ||||
|
Net income (loss) |
|
$ |
(2,644 |
) |
$ |
5,210 |
|
$ |
(5,039 |
) |
$ |
4,902 |
|
|
Less: Income (loss) attributable to noncontrolling interest after preferred stock dividends |
|
(199 |
) |
336 |
|
(1,014 |
) |
(620 |
) | ||||
|
Net income (loss) attributable to STAG Industrial, Inc. |
|
$ |
(2,445 |
) |
$ |
4,874 |
|
$ |
(4,025 |
) |
$ |
5,522 |
|
|
Less: preferred stock dividends |
|
2,712 |
|
2,712 |
|
10,848 |
|
9,495 |
| ||||
|
Less: amount allocated to unvested restricted |
|
87 |
|
64 |
|
345 |
|
262 |
| ||||
|
Net income (loss) attributable to common stockholders |
|
$ |
(5,244 |
) |
$ |
2,098 |
|
$ |
(15,218 |
) |
$ |
(4,235 |
) |
|
Weighted average common shares outstanding — basic and diluted |
|
62,778,210 |
|
44,136,797 |
|
54,086,345 |
|
42,364,125 |
| ||||
|
Income (loss) per share — basic and diluted |
|
|
|
|
|
|
|
|
| ||||
|
Loss from continuing operations attributable to common stockholders |
|
$ |
(0.08 |
) |
$ |
(0.03 |
) |
$ |
(0.28 |
) |
$ |
(0.20 |
) |
|
Income from discontinued operations attributable to common stockholders |
|
$ |
— |
|
$ |
0.08 |
|
$ |
— |
|
$ |
0.10 |
|
|
Income (loss) per share — basic and diluted |
|
$ |
(0.08 |
) |
$ |
0.05 |
|
$ |
(0.28 |
) |
$ |
(0.10 |
) |
RECONCILIATIONS OF GAAP TO NON-GAAP MEASURES
STAG Industrial, Inc.
(unaudited, $000s, except share data)
|
|
|
Three months ended December 31, |
|
Year ended December 31, |
| ||||||||
|
|
|
2014 |
|
2013 |
|
2014 |
|
2013 |
| ||||
|
NET OPERATING INCOME RECONCILIATION |
|
|
|
|
|
|
|
|
| ||||
|
Net income (loss) |
|
$ |
(2,644 |
) |
$ |
5,210 |
|
$ |
(5,039 |
) |
$ |
4,902 |
|
|
Asset management fee income |
|
(135 |
) |
(186 |
) |
(598 |
) |
(893 |
) | ||||
|
General and administrative |
|
6,934 |
|
4,482 |
|
26,396 |
|
17,867 |
| ||||
|
Property acquisition costs |
|
953 |
|
596 |
|
4,390 |
|
3,427 |
| ||||
|
Depreciation and amortization |
|
25,451 |
|
21,091 |
|
88,057 |
|
70,597 |
| ||||
|
Interest income |
|
(4 |
) |
(4 |
) |
(15 |
) |
(13 |
) | ||||
|
Interest expense |
|
7,168 |
|
5,453 |
|
25,109 |
|
20,319 |
| ||||
|
Loss on impairment |
|
2,840 |
|
— |
|
2,840 |
|
— |
| ||||
|
Loss on extinguishment of debt |
|
686 |
|
— |
|
686 |
|
— |
| ||||
|
Other expenses |
|
192 |
|
285 |
|
803 |
|
621 |
| ||||
|
Gain on the sales of rental property |
|
(646 |
) |
(4,841 |
) |
(2,799 |
) |
(5,305 |
) | ||||
|
Corporate sub lease rental income |
|
(17 |
) |
— |
|
(17 |
) |
— |
| ||||
|
NET OPERATING INCOME |
|
$ |
40,778 |
|
$ |
32,086 |
|
$ |
139,813 |
|
$ |
111,522 |
|
|
|
|
|
|
|
|
|
|
|
| ||||
|
Net operating income |
|
$ |
40,778 |
|
$ |
32,086 |
|
$ |
139,813 |
|
$ |
111,522 |
|
|
Straight-line rent adjustments, net |
|
(1,030 |
) |
(803 |
) |
(3,673 |
) |
(2,941 |
) | ||||
|
Intangible amortization in rental income, net |
|
1,653 |
|
2,144 |
|
6,253 |
|
6,544 |
| ||||
|
CASH NET OPERATING INCOME |
|
$ |
41,401 |
|
$ |
33,427 |
|
$ |
142,393 |
|
$ |
115,125 |
|
|
|
|
|
|
|
|
|
|
|
| ||||
|
Cash net operating income |
|
$ |
41,401 |
|
$ |
33,427 |
|
|
|
|
| ||
|
Cash NOI from acquisitions’ timing |
|
1,213 |
|
1,487 |
|
|
|
|
| ||||
|
Termination fee income |
|
(2,392 |
) |
(2,500 |
) |
|
|
|
| ||||
|
Cash NOI from dispositions |
|
(196 |
) |
(42 |
) |
|
|
|
| ||||
|
RUN RATE CASH NOI |
|
$ |
40,026 |
|
$ |
32,372 |
|
|
|
|
| ||
|
|
|
|
|
|
|
|
|
|
| ||||
|
ADJUSTED EBITDA RECONCILIATION |
|
|
|
|
|
|
|
|
| ||||
|
Net income (loss) |
|
$ |
(2,644 |
) |
$ |
5,210 |
|
$ |
(5,039 |
) |
$ |
4,902 |
|
|
Intangible amortization in rental income, net |
|
1,653 |
|
2,144 |
|
6,253 |
|
6,544 |
| ||||
|
Termination income |
|
(2,484 |
) |
(2,500 |
) |
(2,519 |
) |
(2,500 |
) | ||||
|
Property acquisition costs |
|
953 |
|
596 |
|
4,390 |
|
3,427 |
| ||||
|
Depreciation and amortization |
|
25,451 |
|
21,091 |
|
88,057 |
|
70,597 |
| ||||
|
Interest income |
|
(4 |
) |
(4 |
) |
(15 |
) |
(13 |
) | ||||
|
Interest expense |
|
7,168 |
|
5,453 |
|
25,109 |
|
20,319 |
| ||||
|
Offering costs |
|
— |
|
— |
|
— |
|
27 |
| ||||
|
Loss on impairment |
|
2,840 |
|
— |
|
2,840 |
|
— |
| ||||
|
Loss on extinguishment of debt |
|
686 |
|
— |
|
686 |
|
— |
| ||||
|
Gain on sales of real estate |
|
(646 |
) |
(4,841 |
) |
(2,799 |
) |
(5,305 |
) | ||||
|
Consultant services |
|
— |
|
— |
|
2,839 |
|
— |
| ||||
|
Non-recurring non-cash compensation |
|
929 |
|
— |
|
929 |
|
— |
| ||||
|
ADJUSTED EBITDA |
|
$ |
33,902 |
|
$ |
27,149 |
|
$ |
120,731 |
|
$ |
97,998 |
|
RECONCILIATIONS OF GAAP TO NON-GAAP MEASURES
STAG Industrial, Inc.
(unaudited, $000s, except share data)
|
|
|
Three months ended December 31, |
|
Year ended December 31, |
| ||||||||
|
|
|
2014 |
|
2013 |
|
2014 |
|
2013 |
| ||||
|
CORE FUNDS FROM OPERATIONS RECONCILIATION |
|
|
|
|
|
|
|
|
| ||||
|
Net income (loss) |
|
$ |
(2,644 |
) |
$ |
5,210 |
|
$ |
(5,039 |
) |
$ |
4,902 |
|
|
Rental property depreciation and amortization |
|
25,412 |
|
21,091 |
|
87,856 |
|
70,597 |
| ||||
|
Loss on impairment |
|
2,840 |
|
— |
|
2,840 |
|
— |
| ||||
|
Gain on sales of real estate |
|
(646 |
) |
(4,841 |
) |
(2,799 |
) |
(5,305 |
) | ||||
|
Funds from operations |
|
$ |
24,962 |
|
$ |
21,460 |
|
$ |
82,858 |
|
$ |
70,194 |
|
|
Preferred stock dividends |
|
(2,712 |
) |
(2,712 |
) |
(10,848 |
) |
(9,495 |
) | ||||
|
Amount allocated to unvested restricted stockholders |
|
(87 |
) |
(64 |
) |
(345 |
) |
(262 |
) | ||||
|
Funds from operations attributable to common stockholders and unit holders |
|
$ |
22,163 |
|
$ |
18,684 |
|
$ |
71,665 |
|
$ |
60,437 |
|
|
|
|
|
|
|
|
|
|
|
| ||||
|
Funds from operations attributable to common stockholders and unit holders |
|
$ |
22,163 |
|
$ |
18,684 |
|
$ |
71,665 |
|
$ |
60,437 |
|
|
Intangible amortization in rental income, net |
|
1,653 |
|
2,144 |
|
6,253 |
|
6,544 |
| ||||
|
Termination income |
|
(2,484 |
) |
(2,500 |
) |
(2,519 |
) |
(2,500 |
) | ||||
|
Property acquisition costs |
|
953 |
|
596 |
|
4,390 |
|
3,427 |
| ||||
|
Offering costs |
|
— |
|
— |
|
— |
|
27 |
| ||||
|
Loss on extinguishment of debt |
|
686 |
|
— |
|
686 |
|
— |
| ||||
|
Consultant services |
|
— |
|
— |
|
2,839 |
|
— |
| ||||
|
Non-recurring non-cash compensation |
|
929 |
|
— |
|
929 |
|
— |
| ||||
|
CORE FUNDS FROM OPERATIONS |
|
$ |
23,900 |
|
$ |
18,924 |
|
$ |
84,243 |
|
$ |
67,935 |
|
|
|
|
|
|
|
|
|
|
|
| ||||
|
Weighted average shares and units outstanding |
|
|
|
|
|
|
|
|
| ||||
|
Weighted average common shares |
|
62,778,210 |
|
44,136,797 |
|
54,086,345 |
|
42,364,125 |
| ||||
|
Weighted average restricted shares |
|
264,041 |
|
214,389 |
|
268,894 |
|
218,934 |
| ||||
|
Weighted average units |
|
2,427,440 |
|
6,898,650 |
|
3,706,932 |
|
6,641,055 |
| ||||
|
Weighted average shares and units outstanding - basic |
|
65,469,691 |
|
51,249,836 |
|
58,062,171 |
|
49,224,114 |
| ||||
|
Unvested outperformance plan |
|
— |
|
490,436 |
|
— |
|
490,436 |
| ||||
|
Weighted average shares and units outstanding - diluted |
|
65,469,691 |
|
51,740,272 |
|
58,062,171 |
|
49,714,550 |
| ||||
|
CORE FUNDS FROM OPERATIONS PER SHARE / UNIT - BASIC |
|
$ |
0.37 |
|
$ |
0.37 |
|
$ |
1.45 |
|
$ |
1.38 |
|
|
CORE FUNDS FROM OPERATIONS PER SHARE / UNIT - DILUTED |
|
$ |
0.37 |
|
$ |
0.37 |
|
$ |
1.45 |
|
$ |
1.37 |
|
|
|
|
|
|
|
|
|
|
|
| ||||
|
ADJUSTED FUNDS FROM OPERATIONS RECONCILIATION |
|
|
|
|
|
|
|
|
| ||||
|
Core funds from operations |
|
$ |
23,900 |
|
$ |
18,924 |
|
$ |
84,243 |
|
$ |
67,935 |
|
|
Add: non-rental property depreciation and amortization |
|
39 |
|
— |
|
201 |
|
— |
| ||||
|
Straight-line rent adjustments, net |
|
(941 |
) |
(803 |
) |
(3,255 |
) |
(2,941 |
) | ||||
|
Recurring capital expenditures |
|
(26 |
) |
(434 |
) |
(1,316 |
) |
(1,374 |
) | ||||
|
Lease renewal commissions and tenant improvements |
|
(1,731 |
) |
(580 |
) |
(2,486 |
) |
(1,565 |
) | ||||
|
Non-cash portion of interest expense |
|
328 |
|
297 |
|
1,337 |
|
1,080 |
| ||||
|
Non-cash compensation expense |
|
1,047 |
|
743 |
|
4,239 |
|
2,970 |
| ||||
|
ADJUSTED FUNDS FROM OPERATIONS |
|
$ |
22,616 |
|
$ |
18,147 |
|
$ |
82,963 |
|
$ |
66,105 |
|
Non-GAAP Financial Measures
Net operating income (NOI) and Cash NOI: is defined as rental revenue, including reimbursements, less property expenses and real estate taxes, which excludes depreciation, amortization, general and administrative expenses, interest expense, interest income, asset management fee income, property acquisition costs, offering costs, gain on sales of real estate, and other expenses. The Company defines Cash NOI as NOI less straight-line rent adjustments and less intangible amortization in rental income. The Company defines Run Rate Cash NOI as Cash NOI plus Cash NOI adjusted for a full period of acquisitions, less termination income, less Cash NOI from dispositions. The Company considers NOI and Cash NOI to be appropriate supplemental performance measures because they reflect the operating performance of the Company’s properties and exclude certain items that are not considered to be controllable in connection with the management of the property. However, these measures should not be viewed as alternative measures of the Company’s financial performance since they exclude expenses which could materially impact the Company’s results of operations. Further, the Company’s NOI and Cash NOI may not be comparable to that of other real estate companies, as they may use different methodologies for calculating NOI and Cash NOI.
Funds from Operations (FFO): is calculated in accordance with the standards established by the National Association of Real Estate Investment Trusts (“NAREIT”). FFO represents net income (loss) (computed in accordance with GAAP), excluding gains (or losses) from sales of depreciable operating property, impairment write-downs of depreciable real estate, real estate related depreciation and amortization (excluding amortization of deferred financing costs and fair market value of debt adjustment) and after adjustments for unconsolidated partnerships and joint ventures. The Company uses FFO as a supplemental performance measure because, in excluding real estate related depreciation and amortization and gains and losses from property dispositions, it provides a performance measure that, when compared year-over-year, captures trends in occupancy rates, rental rates and operating costs. The Company also believes that, as a widely recognized measure of the performance of REITs, FFO will be used by investors as a basis to compare the Company’s operating performance with that of other REITs.
Core FFO and Adjusted FFO (AFFO): are presented excluding property acquisition costs, offering costs, lease termination income, and intangible amortization in rental income. AFFO of the Company also excludes non-rental property depreciation and amortization, straight-line rent adjustments, non-cash portion of interest expense, non-cash compensation expense and deducts recurring capital expenditures and lease renewal commissions and tenant improvements. In Core FFO and AFFO, the Company also excludes certain consultant services fees, and certain non-cash compensation. The Company believes that Core FFO and AFFO are useful supplemental measures regarding the Company’s operating performance as they provide a more meaningful and consistent comparison of the Company’s operating performance and allows investors to more easily compare the Company’s operating results.
However, because FFO, Core FFO and AFFO exclude rental property depreciation and amortization and capture neither the changes in the value of the Company’s properties that result from use or market conditions, nor the level of capital expenditures and leasing commissions necessary to maintain the operating performance of the Company’s properties, all of which have real economic effect and could materially impact the Company’s results from operations, the utility of FFO, Core FFO and AFFO as measures of the Company’s performance is limited. Other equity REITs may not calculate FFO in accordance with the NAREIT definition and, accordingly, the Company’s FFO, Core FFO and AFFO may not be comparable to such other REITs. FFO, Core FFO and AFFO should not be used as a measure of the Company’s liquidity, and are not indicative of funds available for the Company’s cash needs, including its ability to pay dividends.
Adjusted Earnings before Interest, Taxes, Depreciation, and Amortization (Adjusted EBITDA): represents net income (loss) (computed in accordance with GAAP) before interest, tax, depreciation and amortization, property acquisition costs, offering costs, consultant services fees, certain non-recurring,
non-cash compensation, gain on sales of real estate, and intangible amortization in rental income. Adjusted EBITDA is deemed helpful to investors by the Company as a supplemental measure of the operating performance of a real estate company because it is a direct measure of the actual operating results of the Company’s industrial properties. The Company also uses this measure in ratios to compare its performance to that of its industry peers.
Forward-Looking Statements
This press release, together with other statements and information publicly disseminated by the Company, contains certain forward-looking statements within the meaning of Section 27A of the Securities Act of 1933, as amended, and Section 21E of the Securities Exchange Act of 1934, as amended. The Company intends such forward-looking statements to be covered by the safe harbor provisions for forward-looking statements contained in the Private Securities Litigation Reform Act of 1995 and includes this statement for purposes of complying with these safe harbor provisions. Forward-looking statements, which are based on certain assumptions and describe the Company’s future plans, strategies and expectations, are generally identifiable by use of the words “believe,” “will,” “expect,” “intend,” “anticipate,” “estimate,” “should,” “project” or similar expressions. You should not rely on forward-looking statements since they involve known and unknown risks, uncertainties and other factors that are, in some cases, beyond the Company’s control and which could materially affect actual results, performances or achievements. Factors that may cause actual results to differ materially from current expectations include, but are not limited to, the risk factors discussed in the Company’s Annual Report on Form 10-K for the year ended December 31, 2014. Accordingly, there is no assurance that the Company’s expectations will be realized. Except as otherwise required by the federal securities laws, the Company disclaims any obligation or undertaking to publicly release any updates or revisions to any forward-looking statement contained herein (or elsewhere) to reflect any change in the Company’s expectations with regard thereto or any change in events, conditions or circumstances on which any such statement is based.
Source: STAG Industrial, Inc.
Contact:
STAG Industrial, Inc.
Brad Shepherd, Vice President, Investor Relations
617-226-4987
InvestorRelations@stagindustrial.com