Attached files
| file | filename |
|---|---|
| EX-99.1 - EXHIBIT 99.1 Q4 2014 EARNINGS RELEASE - NORTHWESTERN CORP | ex991pressreleaseq42014.htm |
| 8-K - 8-K Q4 2014 EARNINGS - NORTHWESTERN CORP | form8kearningsreleaseq42014.htm |

2014 Earnings Webcast February 12, 2015 Thompson Falls

Presenting Today 2 Bob Rowe, President & CEO Brian Bird, Vice President & CFO
3 Forward Looking Statements During the course of this presentation, there will be forward-looking statements within the meaning of the “safe harbor” provisions of the Private Securities Litigation Reform Act of 1995. Forward-looking statements often address our expected future business and financial performance, and often contain words such as “expects,” “anticipates,” “intends,” “plans,” “believes,” “seeks,” or “will.” The information in this presentation is based upon our current expectations as of the date hereof unless otherwise noted. Our actual future business and financial performance may differ materially and adversely from our expectations expressed in any forward-looking statements. We undertake no obligation to revise or publicly update our forward-looking statements or this presentation for any reason. Although our expectations and beliefs are based on reasonable assumptions, actual results may differ materially. The factors that may affect our results are listed in certain of our press releases and disclosed in the Company’s 10-K which we filed with the SEC on February 12, 2015 and our other public filings with the SEC.

• In November 2014, we completed the purchase of eleven hydroelectric generating facilities in Montana with 633 megawatts of generation capacity and one storage reservoir, for an adjusted purchase price of $904 million. To help finance the transaction we accessed the capital markets and issued: • $400 million of common equity (7.77 million shares @ $51.50 per share) • $450 million of 30-year Montana first mortgage bonds at a fixed rate of 4.176% • $26.7 million net income improvement in 2014, as compared with 2013 • Gross margin improvement from energy supply acquisitions and income tax benefits recognized partially offset by higher operating costs and hydro transaction expense. • Non-GAAP Adjusted EPS of $2.68, a 7.2% improvement over 2013 Adjusted EPS of $2.50. • 2014 Adjusted EPS at midpoint of $2.60 - $2.75 guidance range. • Upgrade of our senior secured and senior unsecured credit ratings by Fitch in November 2014. • 20% increase in our quarterly stock dividend • 48 cents per share payable March 31, 2015 Recent Significant Activities 4
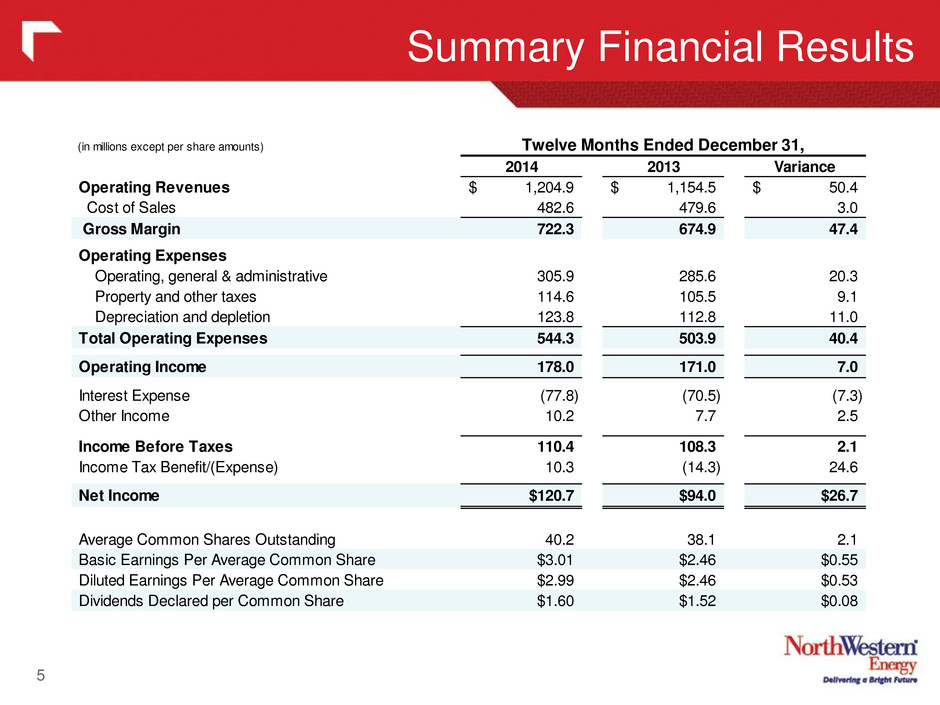
Summary Financial Results 5 (in millions except per share amounts) 2014 2013 Variance Operating Revenues 1,204.9$ 1,154.5$ 50.4$ Cost of Sales 482.6 479.6 3.0 Gross Margin 722.3 674.9 47.4 Operating Expenses Operating, general & administrative 305.9 285.6 20.3 Property and other taxes 114.6 105.5 9.1 Depreciation and depletion 123.8 112.8 11.0 Total Operating Expenses 544.3 503.9 40.4 Operating Income 178.0 171.0 7.0 Interest Expense (77.8) (70.5) (7.3) Other Income 10.2 7.7 2.5 Income Before Taxes 110.4 108.3 2.1 Income Tax Benefit/(Expense) 10.3 (14.3) 24.6 Net Income $120.7 $94.0 $26.7 Average Common Shares Outstanding 40.2 38.1 2.1 Basic Earnings Per Average Common Share $3.01 $2.46 $0.55 Diluted Earnings Per Average Common Share $2.99 $2.46 $0.53 Dividends Declared per Common Share $1.60 $1.52 $0.08 Twelve Months Ended December 31,

6 Gross Margin (dollars in millions) Twelve Months Ended December 31, 2014 2013 Variance Electric $ 529.4 $ 506.5 $ 22.9 4.5% Natural gas 192.9 166.7 26.2 15.7% Other - 1.7 (1.7) (100.0%) Gross Margin $ 722.3 $ 674.9 $ 47.4 7.0% $ 21.4 Natural gas production $ 20.5 Hydro operations $ 5.9 Electric transmission $ 4.9 Montana natural gas rate increase $ 1.6 Electric retail volumes $ 1.4 Natural gas retail volumes $ (3.4) Operating expenses recovered in trackers $ (1.9) Electric DSM lost revenues $ (3.0) Other $47.4 million increase in gross margin due to the following factors:

Operating Expenses 7 (dollars in millions) Twelve Months Ended December 31, 2014 2013 Variance Operating, general & admin. $ 305.9 $ 285.6 $ 20.3 7.1% Property and other taxes 114.6 105.5 9.1 8.6% Depreciation and depletion 123.8 112.8 11.0 9.8% Operating Expenses $ 544.3 $ 503.9 $ 40.4 8.0% Increase in operating expenses due mainly to the following factors: $20.3 million increase in OG&A $ 8.9 Natural gas production $ 5.5 Hydro operating costs $ 5.1 Hydro Transaction legal and professional fees $ 1.7 Non-employee directors deferred compensation $ (3.4) Operating expenses recovered in trackers $ 2.5 Other $9.1 million increase in property and other taxes due primarily to higher estimated property valuations in Montana and plant additions, including approximately $1.9 million related to natural gas production assets and $1.7 million from the hydro operations. $11.0 million increase in depreciation and depletion expense primarily due to plant additions, including approximately $4.8 million related to natural gas production assets and $2.1 million from the hydro operations.
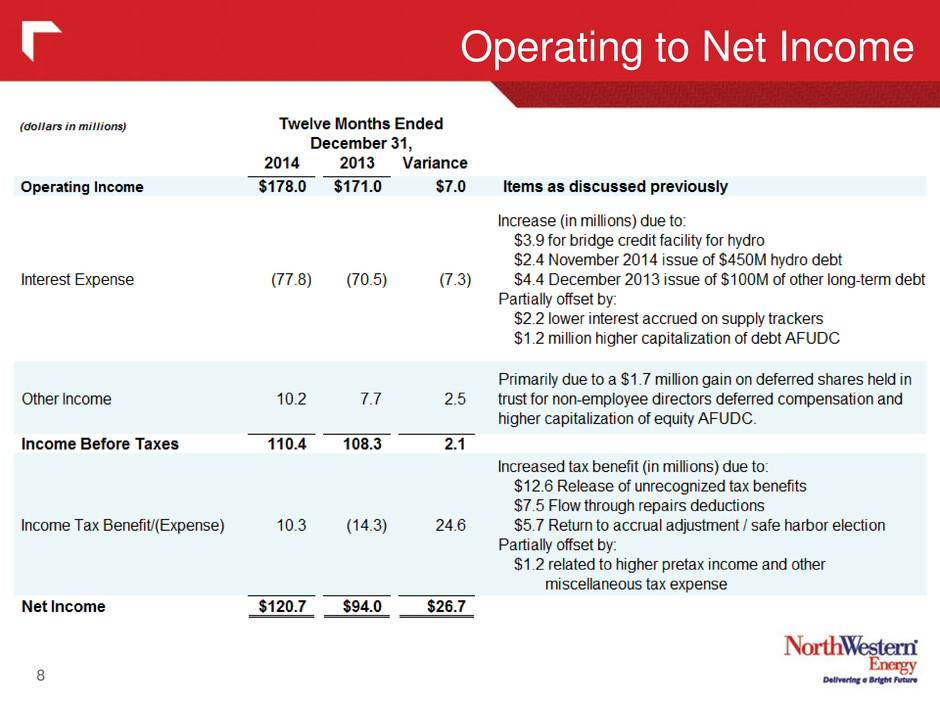
Operating to Net Income 8
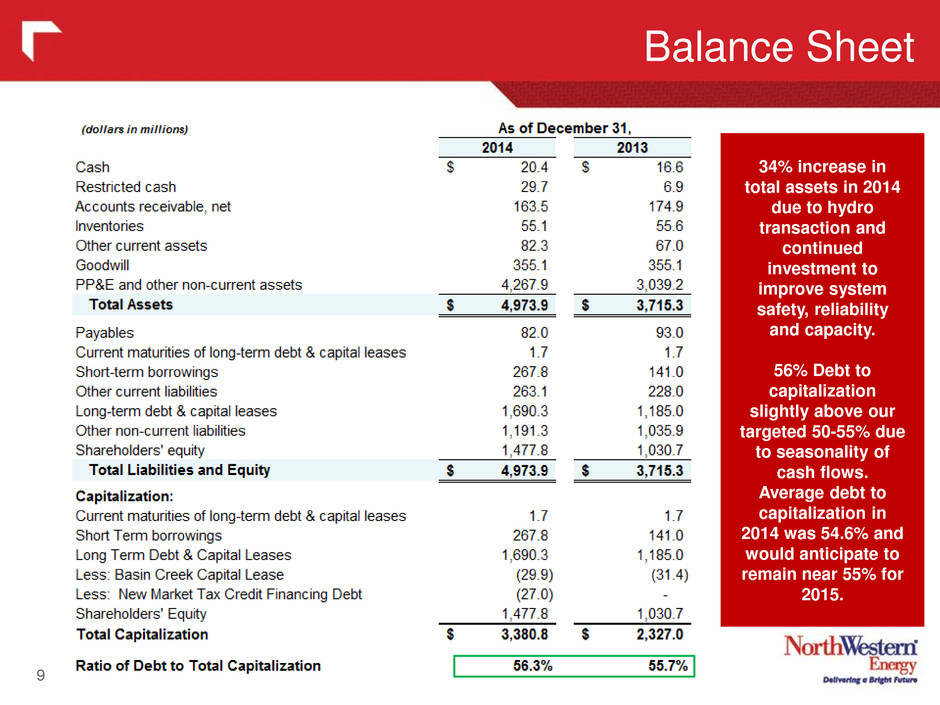
Balance Sheet 9 34% increase in total assets in 2014 due to hydro transaction and continued investment to improve system safety, reliability and capacity. 56% Debt to capitalization slightly above our targeted 50-55% due to seasonality of cash flows. Average debt to capitalization in 2014 was 54.6% and would anticipate to remain near 55% for 2015.

Cash Flow 10 $56.3 million improvement in cash flow provided by operating activities driven by higher net income and improved collections of customer receivables*. * Cash flow in 2013 was affected by billing delays resulting from the implementation of our new customer information system in September 2013.

Non-GAAP Adjusted EPS 11 2014 Non-GAAP Adjusted EPS of $2.68. This reflects an $0.18, or 7%, improvement over 2013 non-GAAP earnings.

(in millions) Twelve Months Ended December 30, 2014 Hy dr o Eq ui ty D ilu tio n (1 ) Hy dr o Tr an sa ct io n Ex pe ns e Hy dr o Op er at io ns (N ov . 1 8 - D ec . 3 1) Fa vo ra bl e W ea th er No n- em pl oy ee D ef er re d Co m pe ns at io n In co m e Ta x Ad ju st m en t ( 2) Twelve Months Ended December 30, 2014 Twelve Months Ended December 30, 2013 Pr io r P er io d DS M R ev en ue No n- em pl oy ee D ef er re d Co m pe ns at io n Fa vo ra bl e W ea th er Hy dr o Tr an sa ct io n Ex pe ns e Twelve Months Ended December 30, 2013 Revenues $1,204.9 - - (20.5) (1.3) - - $1,183.1 $33.2 2.9% $1,149.9 (1.0) - (3.7) - $1,154.5 Cost of Sales 482.6 - - - - - - 482.6 3.1 0.6% 479.5 - - - - 479.6 Gross Margin 722.3 - - (20.5) (1.3) - - 700.5 30.2 4.5% 670.3 (1.0) - (3.7) - 674.9 - Op. Expenses - OG&A 305.9 - (9.5) (5.5) - (4.0) - 286.9 8.1 2.9% 278.8 - (2.3) - (4.4) 285.6 Prop. & other taxes 114.6 - - (1.7) - - - 112.9 7.3 6.9% 105.6 - - - - 105.5 Depreciation 123.8 - - (2.1) - - - 121.6 8.8 7.8% 112.8 - - - - 112.8 Total Op. Exp. 544.3 - (9.5) (9.3) - (4.0) - 521.5 24.3 4.9% 497.2 - (2.3) - (4.4) 503.9 - Op. Income 178.0 - 9.5 (11.2) (1.3) 4.0 - 179.0 5.9 3.4% 173.1 (1.0) 2.3 (3.7) 4.4 171.0 - Interest Expense (77.8) - 5.8 2.5 - - - (69.5) (0.8) 1.2% (68.7) - - - 1.9 (70.5) Other Income 10.2 - - - - (4.0) - 6.2 0.8 15.2% 5.4 - (2.3) - - 7.7 - Pretax Income 110.4 - 15.4 (8.7) (1.3) - - 115.8 6.0 5.4% 109.8 (1.0) - (3.7) 6.3 108.3 Income Taxes 10.3 - (5.9) 3.3 0.5 - (18.5) (10.3) 4.6 -30.9% (14.9) 0.4 - 1.4 (2.4) (14.3) - Net Income $120.7 - 9.5 (5.4) (0.8) - (18.5) $105.5 $10.6 11.1% $94.9 (0.6) - (2.3) 3.9 $94.0 ETR -9.3% - 38.5% 38.5% 38.5% - - 8.9% 13.5% 38.5% - 38.5% 38.5% 13.2% FY Diluted Shares 40.4 (1.1) 39.3 1.1 2.9% 38.2 38.2 FY Diluted EPS $2.99 0.08 0.24 (0.14) (0.02) - (0.47) $2.68 $0.18 7.2% $2.50 (0.02) - (0.05) 0.11 $2.46 1. 2014 Guidance excluded all earnings impacts from the hydro acquisition (transaction expense and income from operations) and assumed 39.3 million diluted shares outstanding (i.e. our share count absent the shares issued in November 2014 to fund the hydro transaction). 2. Adjustment to income tax expense to remove the flow-through benefit related the release of unrecognized tax benefits, 2014 bonus depreciation (not originally contemplated in guidance) and other tax items related to prior years. Incr. / (Decr.) $ % GAAP Remove Impact of: Non-GAAP Non-GAAP Remove Impact of: GAAP Full Year Non-GAAP Adjusted P&L 12 $6.0 Million, or 5.4%, improvement in non-GAAP adjusted pretax income.

Non-GAAP Effective Tax Rate 13 Non-GAAP effective tax rate of 8.9% lower than 12%-14% as previously included in guidance. This difference is due primarily to slightly lower pretax income and higher than anticipated ongoing repairs / meters flow through tax benefits. We anticipate flow through tax benefits to continue to keep our book effective tax rate at or below approximately 20% through 2017. Additionally, we expect NOLs to be available into 2017 to reduce cash taxes. $12.6M release of unrecognized tax benefits due to lapse of statutes of limitations in 3rd quarter 2014. $4.3M cumulative adjustment for election of safe harbor method related to the deductibility of repair costs for years prior to 2014. $1.3M adjustment for benefits related to 2014 bonus depreciation not contemplated in guidance and $0.3M other miscellaneous impacts related to prior years.

2015 Earnings Guidance 14 Our 2015 guidance range of $3.10 - $3.30 based upon, but not limited to, the following major assumptions and expectations: • Normal weather in our electric and natural gas service territories; • Successful integration and a full year earnings contribution from the recently acquired hydro assets; • Excludes any potential additional impact as a result of the FERC decision regarding revenue allocation at our Dave Gates Generating Station; • A consolidated income tax rate of approximately 15% to 19% of pre-tax income; and • Diluted average shares outstanding of approximately 47.1 million. Continued investment in our system to serve our customers and communities is expected to provide a targeted 7-10% total return to our investors through a combination of earnings growth and dividend yield. See “Non-GAAP Financial Measures” slide in appendix for “Non-GAAP “Adjusted EPS”. $2.60 - $2.75 $2.02 $2.14 $2.53 $2.66 $2.46 $2.99 $- $1.50 $1.75 $2.00 $2.25 $2.50 $2.75 $3.00 $3.25 $3.50 2009 2010 2011 2012 2013 2014 2015E GAAP Diluted EPS Initial Guidance Range Non-GAAP "Adjusted" EPS Diluted Earnings Per Share $3.10 - $3.30

2014 to 2015 Earnings & Dividend Bridge 2015 ESTIMATES Basic assumptions include, but are not limited to: • Normal weather in our electric and natural gas service territories; • Successful integration and a full year earnings contribution from the recently acquired hydro assets; • Excludes any potential additional impact as a result of the FERC decision regarding revenue allocation at our Dave Gates Generating Station; • A consolidated effective income tax rate of approximately 15% - 19% of pre-tax income; and • Diluted average shares outstanding of approximately 47.1 million. * 2015 Earnings drivers shown above are calculated using a 38.5% effective tax rate. The anticipated “Incremental tax benefits” in 2015 are primarily due to increased repairs tax deductions resulting from increased maintenance capital spending and other flow-through tax benefits. 15 $2.68 Low Midpoint High $2.68 $2.68 2.75 - 2.83 (0.94) - (0.88) (0.31) - (0.29) (0.36) - (0.34) (0.24) - (0.21) 0.13 - 0.16 $1.03 - $1.27 $3.71 - $3.95 (0.61) - (0.65) $3.10 - $3.30 $3.20 $3.10 - $3.30 60% 60% $1.86 $1.98 $1.92 2015 Diluted EPS midpoint 2015 Diluted EPS guidance range 2015 Targeted dividend payout ratio 2015 Preliminary targeted dividend range 2015 Targeted dividend midpoint 2014 Non-GAAP Adjusted Diluted EPS 2015 Earnings Drivers (after-tax and per share) Gross margin improvements Interest expense / other income Incremental tax benefits * Subtotal of anticipated improvements 2015 EPS prior to dilution Dilutive impact of equity issuance (7.8M shares / $400M) 2015 Preliminary EPS guidance range Property & other taxes Depreciation & depletion OG&A expense increases

Montana Hydro Acquisition Complete 16 • On September 26, 2014, after a yearlong process, the Montana Public Service Commission issued a final order approving our application to purchase eleven hydroelectric generating facilities (633 MW) from PPL Montana, subject to certain conditions, including the following: – Inclusion of $870 million of the $900 million purchase price for the hydro assets in our Montana jurisdictional rate base with a 50-year life; – Return on equity of 9.8%, a cost of debt of 4.25% and a capital structure of 52% debt and 48% equity, resulting in an associated first year annual retail revenue requirement of approximately $117 million; – Authorized issuance in aggregate of $900 million of securities necessary to complete the purchase, with the debt portion of the financing to have a term of 30 years and not to exceed 4.25%; – A final compliance filing in December 2015 to reflect post-closing adjustments, the conveyance of the Kerr project (with no financial risk to customers) and the actual property tax expense for the hydroelectric facilities; and – Tracking of revenue credits on a portfolio basis through our electricity supply costs tracker. • Equity and debt financing completed. – $400M of Equity – 7.767M shares issued at $51.50 per share – $450M of 30-year first mortgage bonds with a 4.176% coupon • 4.353% estimated all-in cost of debt including up-front costs and hedge amortization • 4.250% cost of debt recoverable in hydro approval provided by the Montana PSC • Transaction closed on November 18, 2014. Cochrane Dam

Shareholder Incurred Hydro Costs 17 From the announcement in September 2013, the due diligence, regulatory approval, and financing process took just under 14 months and nearly $50 million of shareholder incurred costs to consummate the transaction. While prudently incurred, the costs were significant. However, we strongly believe this transaction will benefit our customers, shareholders and employees, as well as the entire state of Montana, for generations to come.
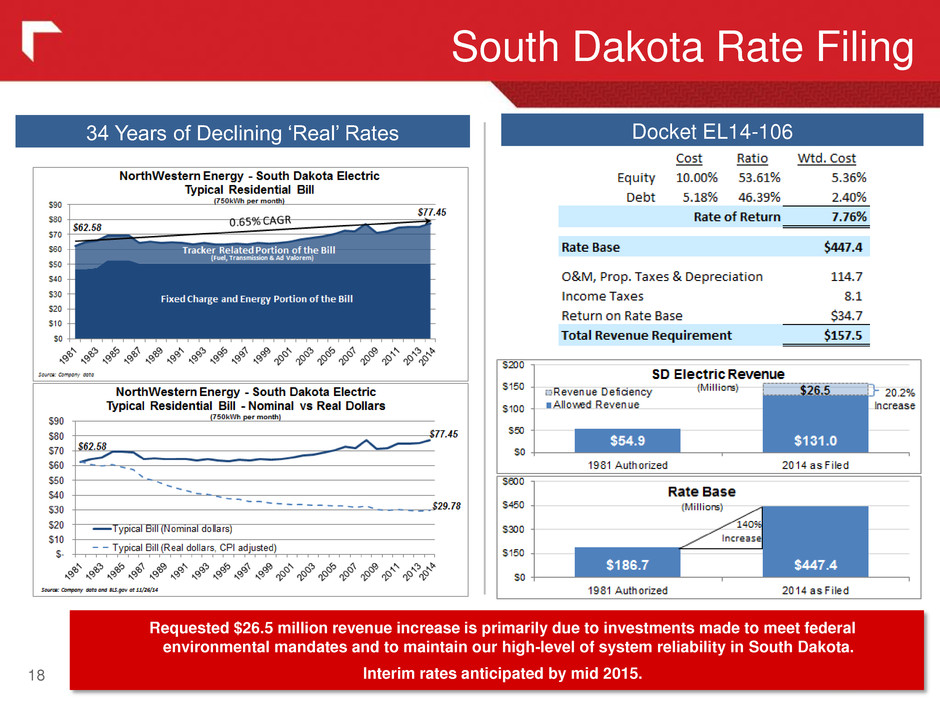
South Dakota Rate Filing 18 34 Years of Declining ‘Real’ Rates Docket EL14-106 Requested $26.5 million revenue increase is primarily due to investments made to meet federal environmental mandates and to maintain our high-level of system reliability in South Dakota. Interim rates anticipated by mid 2015.

Other Activity 19 • Big Stone Air Quality Projects • Coal Plant is subject to BART requirements of the Regional Haze Rule • Must install and operate new system to reduce SO2, NOx and particulate emissions • Our 23.4% portion of the project cost is $95-$105 million with $71.8 million capitalized through December 31, 2014 • Expected to be operational during the second half of 2015 • Distribution and Transmission System Investment • Distribution (DSIP) and Transmission (TSIP) Infrastructure Project to reverse the trend in aging infrastructure, maintain reliability, proactively manage safety, build capacity into the system and prepare our network for the adoption of new technologies. • Total DSIP and TSIP capital expenditures expected to be approximately $340 million over the next 5 years. • Natural Gas Reserves • We currently own 25% of our Montana natural gas need (for both retail customers and owned gas powered electric generation) with approximately $100 million invested through December 2014. We target to own 50% of this need and estimate we would need to invest an additional $100 million to reach our ownership goal. • Dave Gates Generating Station (DGGS) • In April 2014, FERC issued a decision to allocate only a fraction of the costs to FERC jurisdictional customers. • In May 2014, we filed a request for rehearing, which remains pending (uncertain on the timeline for FERC to act). • Consistent with the FERC decision, we have deferred $27.3 million of revenue through December 31, 2014. • If unsuccessful in the rehearing, we may appeal to the U.S. Circuit Court of Appeals. • We do not believe an impairment loss is probable at this time; however, we will continue to evaluate as facts and circumstances change.
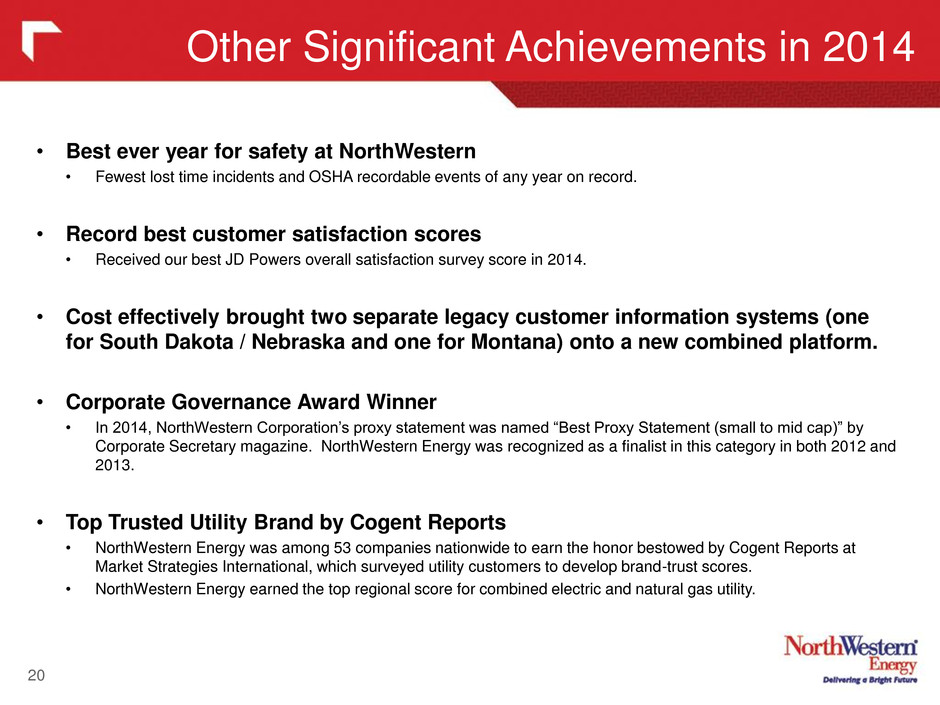
Other Significant Achievements in 2014 20 • Best ever year for safety at NorthWestern • Fewest lost time incidents and OSHA recordable events of any year on record. • Record best customer satisfaction scores • Received our best JD Powers overall satisfaction survey score in 2014. • Cost effectively brought two separate legacy customer information systems (one for South Dakota / Nebraska and one for Montana) onto a new combined platform. • Corporate Governance Award Winner • In 2014, NorthWestern Corporation’s proxy statement was named “Best Proxy Statement (small to mid cap)” by Corporate Secretary magazine. NorthWestern Energy was recognized as a finalist in this category in both 2012 and 2013. • Top Trusted Utility Brand by Cogent Reports • NorthWestern Energy was among 53 companies nationwide to earn the honor bestowed by Cogent Reports at Market Strategies International, which surveyed utility customers to develop brand-trust scores. • NorthWestern Energy earned the top regional score for combined electric and natural gas utility.
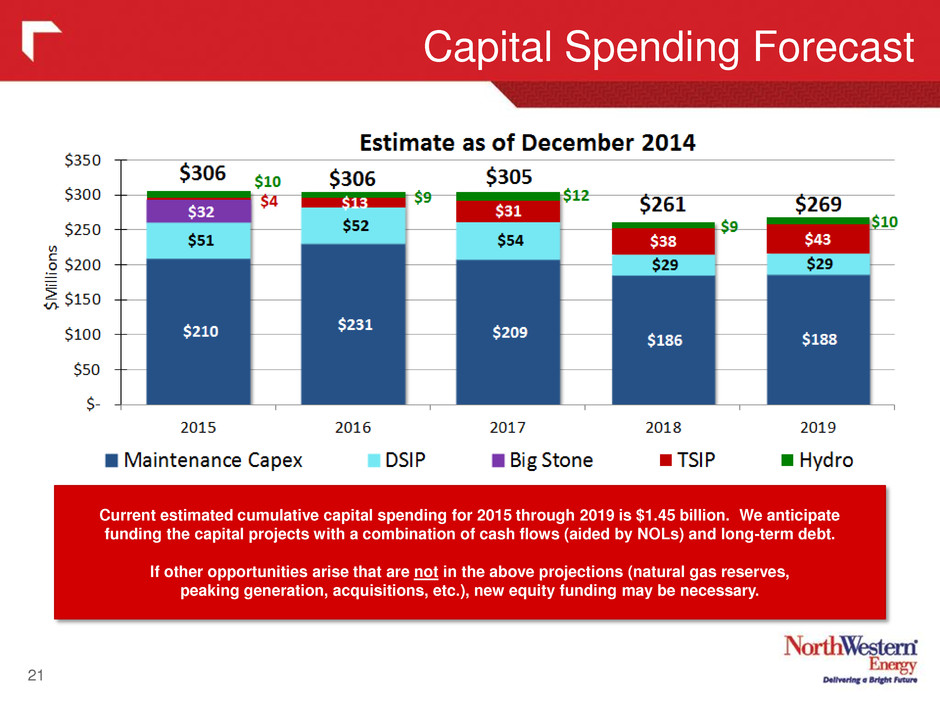
Capital Spending Forecast 21 Current estimated cumulative capital spending for 2015 through 2019 is $1.45 billion. We anticipate funding the capital projects with a combination of cash flows (aided by NOLs) and long-term debt. If other opportunities arise that are not in the above projections (natural gas reserves, peaking generation, acquisitions, etc.), new equity funding may be necessary. *

22 Appendix

23 2013 to 2014 Full Year - Reconciliation ($millions, except EPS) Tw el ve M on th s En de d, De ce m be r 3 1, 2 01 3 Na tu ra l g as p ro du ct ion Hy dr o op er at ion s El ec tri c tra ns m iss ion M on ta na n at ur al ga s ra te in cr ea se El ec tri c re ta il v olu m es Na tu ra l g as re ta il v olu m es O pe ra tin g ex pe ns es re co ve re d in tra ck er s De m an d Si de M an ag em en t ( DS M ) l os t re ve nu es Na tu ra l g as p ro du ct ion Hy dr o op er at ing c os ts Hy dr o Tr an sa ct ion c os ts No ne m plo ye e dir ec to rs d ef err ed co m pe ns at ion Pe rm an en t a nd flo w- th ro ug h ad jus tm en ts to in co m e ta x Im pa ct o f h igh er s ha re c ou nt Al l o th er , n et Tw el ve M on th s En de d, De ce m be r 3 1, 2 01 4 Gross Margin 674.9$ 21.4 20.5 5.9 4.9 1.6 1.4 (3.4) (1.9) (3.0) 722.3 Operating Expenses Op.,Gen., & Administrative 285.6 (3.4) 8.9 5.5 5.1 1.7 2.5 305.9 Prop. & other taxes 105.5 9.1 114.6 Depreciation and depletion 112.8 11.0 123.8 Total Operating Expense 503.9 - - - - - - (3.4) - 8.9 5.5 5.1 1.7 - - 22.6 544.3 Operating Income 171.0 21.4 20.5 5.9 4.9 1.6 1.4 - (1.9) (8.9) (5.5) (5.1) (1.7) - - (25.6) 178.0 Interest Expense (70.5) (3.9) (3.4) (77.8) Other Income (Expense) 7.7 1.7 0.8 10.2 Income Before Inc. Taxes 108.3 21.4 20.5 5.9 4.9 1.6 1.4 - (1.9) (8.9) (5.5) (9.0) - - - (28.3) 110.4 Income Tax Benefit (Expense)1 (14.3) (8.2) (7.9) (2.3) (1.9) (0.6) (0.5) - 0.7 3.4 2.1 3.5 - 25.3 - 11.0 10.3 Net Income (Loss) 94.0$ 13.2 12.6 3.6 3.0 1.0 0.9 - (1.2) (5.5) (3.4) (5.5) - 25.3 - (17.3) 120.7 Fully Diluted Shares 38.23 2.20 - 40.43 Fully Diluted EPS 2.46$ 0.33 0.31 0.09 0.07 0.02 0.02 - (0.03) (0.14) (0.08) (0.14) - 0.63 (0.13) (0.42) 2.99$ 1.) Income Tax Benefit (Expense) calculation on reconciling items assumes normal effective tax rate of 38.5%.

24 Full Year - Electric Segment
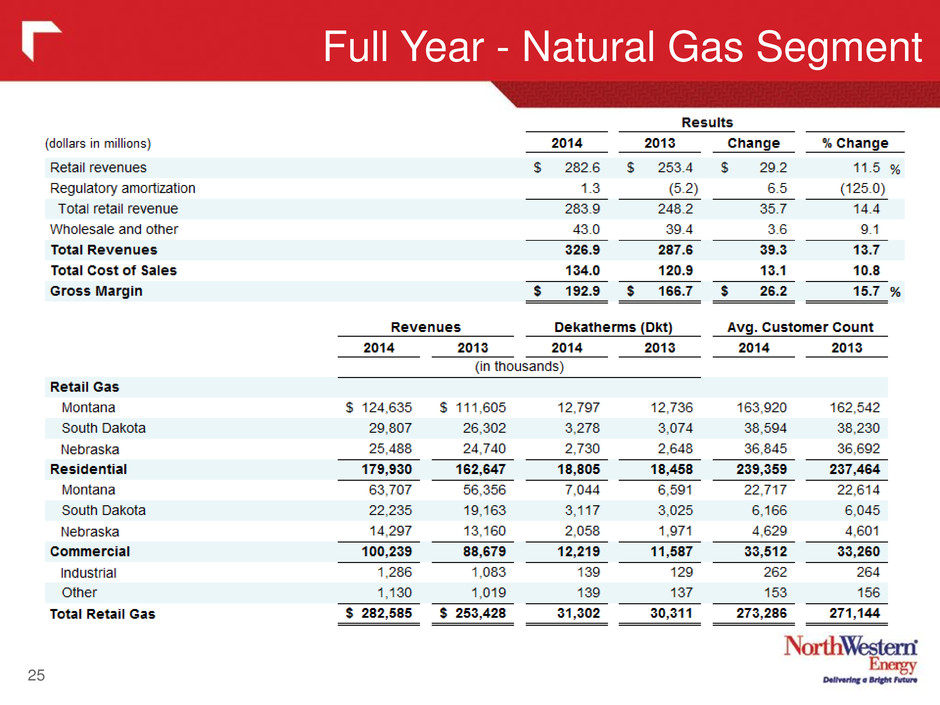
25 Full Year - Natural Gas Segment
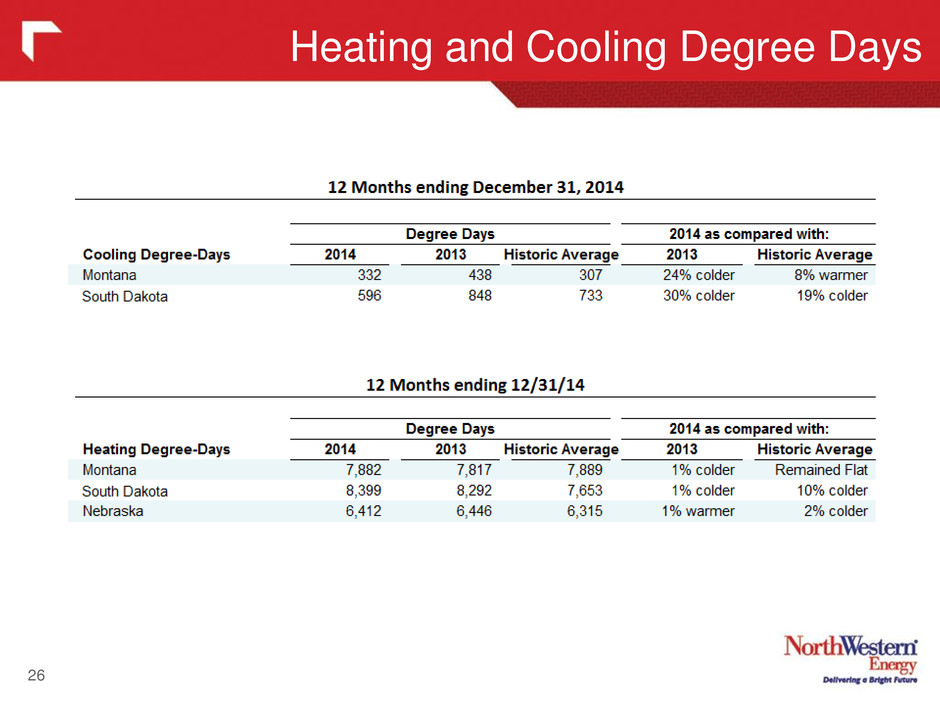
26 Heating and Cooling Degree Days
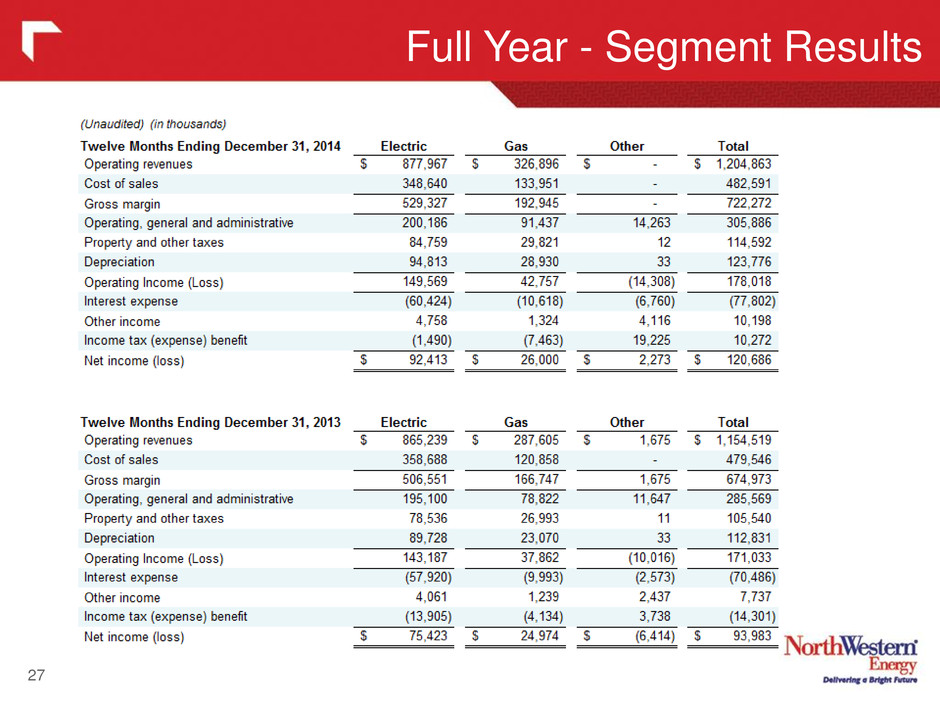
27 Full Year - Segment Results

(in millions) Variance Income Before Income Taxes $110.4 $108.3 $2.1 Income tax calculated at 35% federal statutory rate 38.6 35.0% 37.9 35.0% 0.7 Permanent or flow through adjustments: State income, net of federal provisions (2.0) -1.8% (3.1) -2.8% 1.1 Flow through repairs deduction (25.3) -22.9% (17.8) -16.4% (7.5) Release of unrecognized tax benefit (12.6) -11.4% - 0.0% (12.6) Prior year permanent return to accrual adjustments (5.2) -4.7% 0.5 0.5% (5.7) Production tax credits (3.1) -2.8% (3.2) -2.9% 0.1 Plant and depreciation of flow through items 0.1 0.1% (0.6) -0.5% 0.7 Other, net (0.8) -0.7% 0.6 0.3% (1.4) (48.9) -44.3% (23.6) -21.8% (25.3) Income tax (benefit)/expense (10.3)$ -9.3% 14.3$ 13.2% (24.6)$ Twelve Months Ended December 31, 2014 2013 Income Tax Reconciliation 28 Three items primarily account for the significant improvements in 2014 tax benefit

Fourth Quarter - Summary Financial Results 29
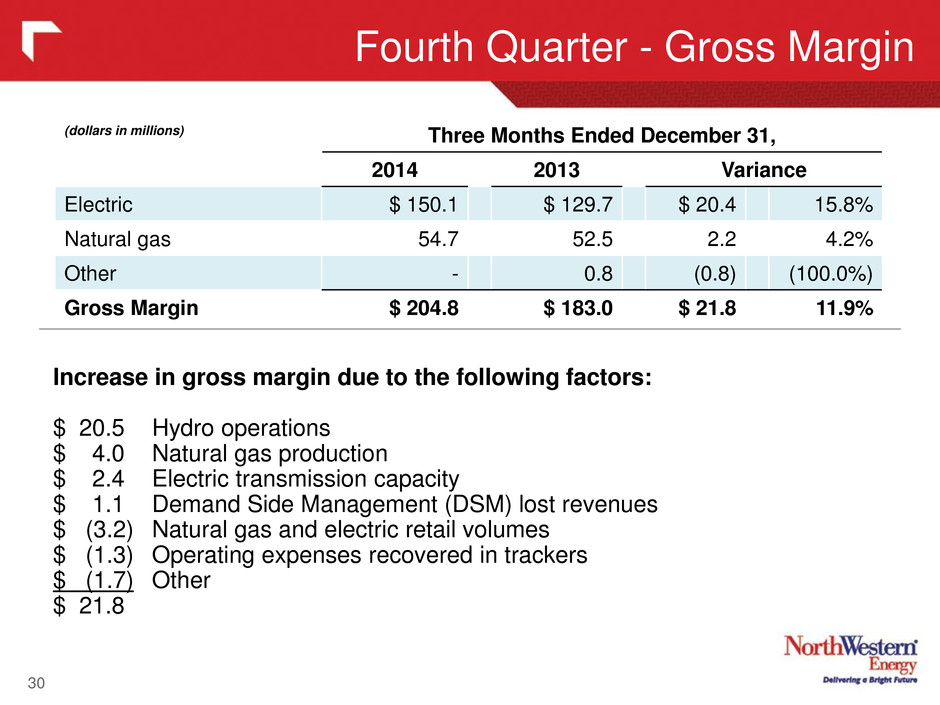
30 Fourth Quarter - Gross Margin (dollars in millions) Three Months Ended December 31, 2014 2013 Variance Electric $ 150.1 $ 129.7 $ 20.4 15.8% Natural gas 54.7 52.5 2.2 4.2% Other - 0.8 (0.8) (100.0%) Gross Margin $ 204.8 $ 183.0 $ 21.8 11.9% Increase in gross margin due to the following factors: $ 20.5 Hydro operations $ 4.0 Natural gas production $ 2.4 Electric transmission capacity $ 1.1 Demand Side Management (DSM) lost revenues $ (3.2) Natural gas and electric retail volumes $ (1.3) Operating expenses recovered in trackers $ (1.7) Other $ 21.8

Fourth Quarter - Operating Expenses 31 Increase in operating expenses due mainly to the following factors: $14.5 million increase in OG&A $ 5.6 Hydro Transaction legal and professional fees $ 5.5 Hydro operations $ 3.9 Non-employee directors deferred compensation $ 1.3 Natural gas production $ (2.8) Bad debt expenses $ (1.3) Operating expenses recovered in trackers $ 2.3 Other $2.3 million increase in property and other taxes due primarily to plant additions and higher estimated property valuations in Montana, with approximately $1.7 million from the hydro operations. $4.5 million increase in depreciation and depletion expense primarily due to plant additions, including approximately $1.2 million related to natural gas production assets and $2.1 from the hydro operations. (dollars in millions) Three Months Ended December 31, 2014 2013 Variance Operating, general & admin. $ 91.3 $ 76.8 $ 14.5 18.8% Property and other taxes 30.3 28.0 2.3 8.2% Depreciation and depletion 32.6 28.1 4.5 16.1% Operating Expenses $ 154.2 $ 133.0 $ 21.2 15.9%

Fourth Quarter - Operating to Net Income 32
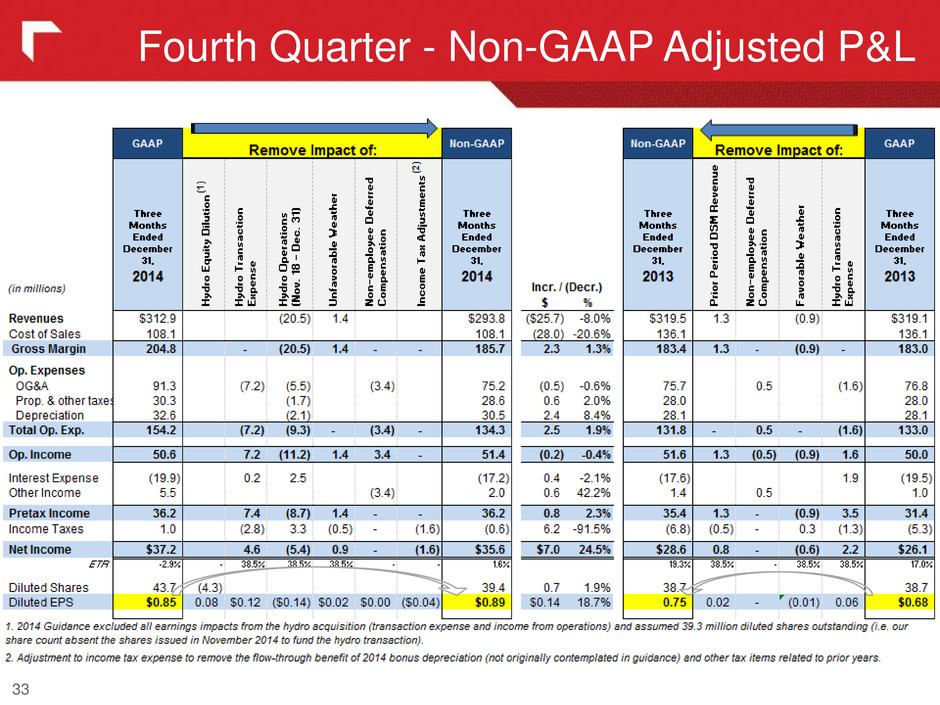
Fourth Quarter - Non-GAAP Adjusted P&L 33

These materials include financial information prepared in accordance with GAAP, as well as other financial measures, such as Gross Margin and Adjusted Diluted EPS, that are considered “non-GAAP financial measures.” Generally, a non- GAAP financial measure is a numerical measure of a company's financial performance, financial position or cash flows that exclude (or include) amounts that are included in (or excluded from) the most directly comparable measure calculated and presented in accordance with GAAP. Gross Margin (Revenues less Cost of Sales) is a non-GAAP financial measure due to the exclusion of depreciation from the measure. Gross Margin is used by us to determine whether we are collecting the appropriate amount of energy costs from customers to allow recovery of operating costs. Adjusted Diluted EPS is another non-GAAP measure. The Company believes the presentation of Adjusted Diluted EPS is more representative of our normal earnings than the GAAP EPS due to the exclusion (or inclusion) of certain impacts that are not reflective of ongoing earnings. The presentation of these non-GAAP measures is intended to supplement investors' understanding of our financial performance and not to replace other GAAP measures as an indicator of actual operating performance. Our measures may not be comparable to other companies' similarly titled measures. Non-GAAP Financial Measures 34 (in thousands) 2009 2010 2011 2012 2013 2014 Reported GAAP diluted EPS 2.02$ 2.14$ 2.53$ 2.66$ 2.46$ 2.99$ Non-GAAP Adjustments Weather - 0.06 (0.05) 0.14 (0.05) (0.02) Rate adjustments - (0.05) - - - - Insurance recoveries - (0.08) - - - - Income tax adjustments - - (0.17) (0.06) - (0.47) Transmission revenue - low hydro - - 0.05 - - - Dispute with former employee - - 0.05 - - - DGGS FERC ALJ initial decision (2011 portion) - - - 0.12 - - Rel s o M SC DGGS deferral - - - (0.05) - - DSM L st R venue recovery - - - (0.05) (0.02) - CELP rbitrati decision - - - (0.79) - - MSTI Impairment - - - 0.40 - - Hydro Transaction costs - - - - 0.11 0.24 Hydro operations (Nov. 18, 2014 - Dec. 31, 2014) - - - - - (0.14) Hydro equity dilution - - - - - 0.08 Adjusted Non-GAAP diluted EPS 2.02$ 2.07$ 2.41$ 2.37$ 2.50$ 2.68$ Use of Non-GAAP Financial Measures - Reconcile to Non-GAAP diluted EPS

35
