Attached files
| file | filename |
|---|---|
| EXCEL - IDEA: XBRL DOCUMENT - LINKEDIN CORP | Financial_Report.xls |
| EX-31.2 - CERTIFICATION OF PFO REQUIRED UNDER RULE 13A-14(A) AND 15D-14(A) - LINKEDIN CORP | lnkd-exhibit312x12312014x1.htm |
| EX-23.1 - CONSENT OF DELOITTE & TOUCHE LLP - LINKEDIN CORP | lnkd-exhibit231x12312014x1.htm |
| EX-32.1 - CERTIFICATION OF PEO AND PFO REQUIRED UNDER RULE 13A-14(B) - LINKEDIN CORP | lnkd-exhibit321x12312014x1.htm |
| EX-31.1 - CERTIFICATION OF PEO REQUIRED UNDER RULE 13A-14(A) AND 15D-14(A) - LINKEDIN CORP | lnkd-exhibit311x12312014x1.htm |
| EX-21.1 - LIST OF SUBSIDIARIES - LINKEDIN CORP | lnkd-exhibit211x12312014x1.htm |
UNITED STATES
SECURITIES AND EXCHANGE COMMISSION
Washington, D.C. 20549
FORM 10-K
(Mark One)
x | ANNUAL REPORT PURSUANT TO SECTION 13 OR 15(d) OF THE SECURITIES EXCHANGE ACT OF 1934 |
For the fiscal year ended December 31, 2014
or
¨ | TRANSITION REPORT PURSUANT TO SECTION 13 OR 15(d) OF THE SECURITIES EXCHANGE ACT OF 1934 |
For the transition period from to
Commission File Number: 001-35168
LinkedIn Corporation
(Exact name of registrant as specified in its charter)
Delaware | 47-0912023 | |
(State or other jurisdiction of incorporation or organization) | (I.R.S. Employer Identification No.) | |
2029 Stierlin Court
Mountain View, CA 94043
(Address of principal executive offices) (Zip Code)
(650) 687-3600
(Registrant’s telephone number, including area code)
Securities registered pursuant to Section 12(b) of the Act:
Title of Each Class | Name of Each Exchange on Which Registered | |
Class A Common Stock, par value $0.0001 per share | New York Stock Exchange | |
Securities registered pursuant to Section 12(g) of the Act:
None
Indicate by check mark if the registrant is a well-known seasoned issuer, as defined in Rule 405 of the Securities Act. Yes x No ¨
Indicate by check mark if the registrant is not required to file reports pursuant to Section 13 or Section 15(d) of the Act. Yes ¨ No x
Indicate by check mark whether the registrant (1) has filed all reports required to be filed by Section 13 or 15 (d) of the Securities Exchange Act of 1934 during the preceding 12 months (or for such shorter period that the registrant was required to file such reports), and (2) has been subject to such filing requirements for the past 90 days. Yes x No ¨
Indicate by check mark whether the registrant has submitted electronically and posted on its corporate Web site, if any, every Interactive Data File required to be submitted and posted pursuant to Rule 405 of Regulation S-T (§232.405 of this chapter) during the preceding 12 months (or for such shorter period that the registrant was required to submit and post such files). Yes x No ¨
Indicate by check mark if disclosure of delinquent filers pursuant to Item 405 of Regulation S-K (§229.405 of this chapter) is not contained herein, and will not be contained, to the best of registrant’s knowledge, in definitive proxy or information statements incorporated by reference in Part III of this Form 10-K or any amendment to this Form 10-K. ¨
Indicate by check mark whether the registrant is a large accelerated filer, an accelerated filer, a non-accelerated filer, or a smaller reporting company. See the definitions of “large accelerated filer,” “accelerated filer” and “smaller reporting company” in Rule 12b-2 of the Exchange Act.
Large accelerated filer | x | Accelerated filer | ¨ | |
Non-accelerated filer | ¨ | (Do not check if a smaller reporting company) | Smaller reporting company | ¨ |
Indicate by check mark whether the registrant is a shell company (as defined in Rule 12b-2 of the Exchange Act). Yes ¨ No x
As of June 30, 2014 (the last business day of the registrant’s most recently completed second fiscal quarter), the aggregate market value of Class A and Class B common stock held by non-affiliates of the registrant was $18,265,264,582.
As of February 5, 2015, there were 109,390,310 shares of the registrant’s Class A common stock outstanding and 15,727,814 shares of the registrant’s Class B common stock outstanding.
DOCUMENTS INCORPORATED BY REFERENCE
Portions of the registrant’s definitive Proxy Statement for its 2015 Annual Meeting of stockholders are incorporated by reference in Part III of this Annual Report on Form 10-K where indicated. Such proxy statement will be filed with the Securities and Exchange Commission within 120 days of the registrant’s fiscal year ended December 31, 2014.
Table of Contents
Page | |||
PART I | |||
Item 1. | |||
Item 1A. | |||
Item 1B. | |||
Item 2. | |||
Item 3. | |||
Item 4. | |||
PART II | |||
Item 5. | |||
Item 6. | |||
Item 7. | |||
Item 7A. | |||
Item 8. | |||
Item 9. | |||
Item 9A. | |||
Item 9B. | |||
PART III | |||
Item 10. | |||
Item 11. | |||
Item 12. | |||
Item 13. | |||
Item 14. | |||
PART IV | |||
Item 15. | |||
Special Note Regarding Forward Looking Statements
This Annual Report on Form 10-K contains “forward-looking statements” within the meaning of Section 21E of the Securities Exchange Act of 1934, as amended, or the Exchange Act, particularly in Part I, Item 1: “Business,” Part I, Item 1A: “Risk Factors” and Part 2, Item 7: “Management’s Discussion and Analysis of Financial Condition and Results of Operations.” These statements are often identified by the use of words such as “may,” “will,” “expect,” “believe,” “anticipate,” “intend,” “could,” “should,” “estimate,” or “continue,” and similar expressions or variations. All statements other than statements of historical fact could be deemed forward-looking, including, but not limited to:
• | our ability to timely and effectively scale and adapt our existing technology and network infrastructure; |
• | our ability to increase our member base and create long-term value for all of our stakeholders; |
• | our ability to increase engagement of our solutions by our members, enterprises and professional organizations; |
• | our ability to develop effective solutions for mobile devices; |
• | our ability to protect our users’ information and adequately address privacy concerns; |
• | our ability to maintain an adequate rate of revenue growth; |
• | the effects of increased competition in our market; |
• | our ability to effectively manage our growth, including viral member growth; |
• | our ability to retain our existing subscribers and our Talent Solutions and Marketing Solutions customers; |
• | our ability to successfully enter new markets, expand our product offerings and manage our international presence and expansion; |
• | our ability to maintain, protect and enhance our brand and intellectual property; |
• | costs associated with defending intellectual property infringement and other claims; |
• | our investment philosophy for 2015; |
• | our expectations for our financial performance in 2015, including our revenues, cost of revenues, expenses and expected tax benefits; and |
• | the attraction and retention of qualified employees and key personnel. |
For a discussion of some of the factors that could cause actual results to differ materially from our forward-looking statements, see the discussion on risk factors that appears in Part I, Item 1A: “Risk Factors” of this Annual Report on Form 10-K and other risks and uncertainties detailed in this and our other reports and filings with the Securities and Exchange Commission, or SEC. The forward-looking statements in this Annual Report on Form 10-K represent our views as of the date of this Annual Report on Form 10-K. We anticipate that subsequent events and developments will cause our views to change. However, while we may elect to update these forward-looking statements at some point in the future, we have no current intention of doing so except to the extent required by applicable law. You should, therefore, not rely on these forward-looking statements as representing our views as of any date subsequent to the date of this Annual Report on Form 10-K.
-3-
PART I
Item 1. | Business |
Overview
We are the world’s largest professional network on the Internet with approximately 347 million members in over 200 countries and territories as of the date of this Annual Report on Form 10-K. We believe we are the most extensive, accurate and accessible network focused on professionals.
We seek to create value for members by connecting them to the people, knowledge and opportunities that matter most to them professionally. Our members create the core of our platform, and we, in turn, provide members with applications and tools to help them manage their careers to achieve their full potential.
We provide the majority of our products at no cost to our members with the belief that this model drives the greatest possible value for the largest number of professionals on our network. In return, our platform continues to grow, strengthening the network effect that benefits each individual LinkedIn member.
The critical mass of our network also allows us to create value for our customers. We generate revenue across three distinct product lines: Talent Solutions, Marketing Solutions and Premium Subscriptions. All three product lines are sold through two channels, an offline field sales organization which engages with both large and small enterprise customers; as well as an online, self-serve channel where we generate revenue from enterprise customers and individual members purchasing subscriptions. We strive to ensure that our Talent Solutions, Marketing Solutions and Premium Subscriptions products provide both a high level of value for our customers and a high degree of relevance for our members. We believe this monetization strategy properly aligns objectives between members and customers, and supports our financial objective of sustainable revenue and earnings growth over the long term.
We were incorporated in Delaware in March 2003 under the name LinkedIn, Ltd. and changed our name to LinkedIn Corporation in January 2005. Our principal executive offices are located at 2029 Stierlin Court, Mountain View, CA 94043, and our telephone number is (650) 687-3600. Our website address is www.linkedin.com. We completed our initial public offering in May 2011 and our Class A common stock is listed on the New York Stock Exchange (“NYSE”) under the symbol “LNKD”. Unless the context requires otherwise, the words “LinkedIn,” “we,” “Company,” “us” and “our” refer to LinkedIn Corporation and our subsidiaries.
Our Mission
Our mission is to connect the world’s professionals to make them more productive and successful. We believe that prioritizing the needs of our members is the most effective and, ultimately, the most profitable means to accomplish our mission and create long-term value for all stakeholders.
We design our solutions to empower professionals to achieve greater professional success, while simultaneously enabling customers to identify and connect with the world’s best and most relevant talent.
Our Vision
Our vision is to create economic opportunity for every member of the global workforce. We believe this is the fundamental potential of our network.
In order to achieve this vision, we seek to develop the world’s first economic graph, a digital representation of the global economy. Manifesting this vision requires scaling our presence across six key areas: the global workforce, companies, job opportunities, professional skills, higher education institutions and professional knowledge. By operationalizing this vision, we believe LinkedIn will enable our members to navigate the increasingly challenging global economy more effectively.
Our Strategy
Our strategy is informed by our mission to connect the world’s professionals to make them more productive and successful. The key elements of that strategy include:
• | Foster Viral Member Growth. With approximately 347 million members as of December 31, 2014, we will continue to pursue initiatives that promote the viral growth of our member base, specifically members expanding this base by inviting others. In addition, our members perpetuate our viral growth through sharing content, which is then shared further on members’ networks. Viral growth is a critical element of our mission to connect the world’s professionals. |
-4-
• | Serve as the Professional Profile of Record. We seek to create the primary professional profile for every professional worldwide. Members can increasingly represent their identities in the form of a dynamic portfolio versus a static resume through rich media and the ability to click to add skills and professional accomplishments. Using our platform, any member can find other professionals on LinkedIn, connect with members relevant to their professional network, and be found by other professionals on the Internet. |
• | Become the Definitive Professional Publishing Platform. We strive to make members more productive and successful by creating the web’s definitive professional publishing platform, which enables members to publish, discover and consume relevant professional content at global scale. LinkedIn’s publishing platform encompasses features and products including the ability for all members to create long-form content, our Influencer program, our Pulse news product and Slideshare platform, and the LinkedIn homepage. Through these product experiences, we believe LinkedIn can help members establish themselves as experts, improve their skills and expertise and get daily news about their industry and areas of interest. |
• | Expand Our International Presence. We have seen significant growth in our international member base and have established operations in several regions around the world. We intend to continue to grow our international member base by expanding our sales, technical and support operations in additional international locations and by further developing our brand across various international geographies. In addition, the 2014 launch of LinkedIn in Simplified Chinese represents the largest potential market we have entered with local product development. |
• | Increase Monetization While Creating Value for Our Members. A core part of our strategy is ensuring that our customer-focused solutions add meaningful value for our members. For example, by enabling members to represent their professional identities and build their personal brands, Talent Solutions customers can better identify members as passive hiring candidates for new career opportunities. |
Our Solutions
Our solutions are designed to make professionals more productive and successful and to connect talent with opportunity at massive scale. To date our focus has been to develop products that enable our members to create, manage and share their professional identities online, build and engage with their professional networks, access shared knowledge and business insights, and find business opportunities.
-5-
Our principal free and monetized solutions are described below:
Free Solutions
Ability to Manage Professional Identity | Enhanced Ability to Build and Engage with Professional Networks | Access to Knowledge, Insights and Opportunities | Ubiquitous Access | |||
Profile Public Profile Who's Viewed Your Profile Profile Rank Rich Media Sharing Skills/Endorsements Publishing Platform | LinkedIn Connections Invitations Search LinkedIn Contacts Introductions People You May Know Address Book Importer People Following | Network Updates Pulse Influencers Slideshare Groups Company Pages Jobs University Pages LinkedIn Alumni Personalization Platform | Mobile Apps (LinkedIn Flagship, Pulse, Connected, Job Search, Slideshare, Recruiter & Sales Navigator) APIs | |||
Monetized Solutions
Talent Solutions | Marketing Solutions | Premium Subscriptions | ||
LinkedIn Corporate Solutions (Recruiter, Job Slots, Recruitment Media, Career Pages, Talent Pipeline) LinkedIn Job Postings Recruiter Lite Job Seeker | Enterprise Solutions (Display Ads, Sponsored InMails) Sponsored Updates LinkedIn Ads Ads API | Professional/ Individual Subscriptions Sales Solutions (Sales Navigator) | ||
Free Solutions
Most of our member solutions are available at no cost and are designed to provide compelling professional benefits.
Ability to Manage Professional Identity
• | Profile. Our core offering provides every member with an online professional profile. A member’s profile is accessible to all members on our network and includes user-generated information including current job title and employer, education, career history, domain expertise, accomplishments, skills and additional professional information such as honors, awards, association memberships, patents, publications, certifications and languages spoken. Members populate their own profile information, enabling them to ensure their professional identity is accurate, current and under their control. In addition, in 2014, we piloted Add-to-Profile Certifications allowing members to update their profiles with certifications from courses completed through partner sites. |
• | Who’s Viewed Your Profile / How You Rank. The Who’s Viewed Your Profile module provides real-time analytics to help members better manage their professional profile including information on who has viewed their profile, top search keywords used to reach their profile, and other details and trends on the demographics of the audience that has viewed their profile. Additional features of this product are available for members with Premium Subscriptions. With the "How You Rank" tool, members can see how they compare to others in their network with profile views and receive personalized recommendations on how to increase their visibility. |
• | Rich Media/Skills/Endorsements. Members can provide examples of their work and skills by sharing rich media content in their profiles. Additionally, members are able to both specify skills on their professional profiles and search for skills and expertise across our network, which surfaces key people |
-6-
within a community, top locations, related companies, relevant jobs, and groups where members can interact with like-minded professionals. In addition, Endorsements enables members to endorse their first degree connections for skills with one click.
• | Publishing Platform. In 2014, LinkedIn began opening our publishing platform to the broader membership base, with the goal of providing the majority of members the ability to publish long-form content. When a member publishes a post on LinkedIn, their original content becomes part of their professional profile, is shared with their trusted network and has the ability to reach a large group of professionals assembled online. Additionally, members have the ability to follow other members that are not in their networks and build their own group of followers. |
Enhanced Ability to Build and Engage with Professional Networks
• | LinkedIn Connections. Once two members are connected, their profile information is shared and, subject to privacy settings, each member has access to the other member’s list of connections for further networking. Connections across the network are classified to three degrees: first degree connections are members who agree to connect, second degree connections are members who share one or more mutual connections, and third degree connections are related via two connections. Members can retrieve the contact information of their first degree connections and browse their second and third degree connections in order to find additional opportunities to network and connect. |
• | Invitations. Members can expand their networks by sending invitations. Any non-member accepting an invitation simultaneously becomes a LinkedIn member, connected to the sender, after completing the registration process. |
• | Search. Our proprietary search technology allows users to conduct real-time, multilingual searches of our rich dataset in a completely personalized manner, as a member’s profile and network affect relevance and ranking of results. Our search capabilities include: |
• | People. Faceted, structured search across all member profiles. |
• | Job Postings. Faceted, structured search across all of the available jobs listed on our network. |
• | Companies. Faceted, structured search of enterprises and professional organizations. |
• | Groups. Search all professional groups on our network. |
• | Network Updates. Search our network’s shared content updates. |
• | Inbox Messages. Search inbox messages. |
• | Address Book. Detailed, structured search across all of the connections a member has on LinkedIn. |
• | Publishing Content. Search Influencer and member posts on LinkedIn by topic or Influencer name. |
• | Universities. Search all universities on our network. |
• | LinkedIn Contacts. Members can bring all of their contacts from their address books, email accounts, and calendars together and keep them up to date in one place. |
We also provide other products to help our members develop their professional networks including: Introductions, which allows one member to request an introduction to another member through a mutual connection; People You May Know, which recommends members whom you may already know and with whom you may want to create a first degree connection; Address Book Importer, which allows members to quickly and easily import contact information from their existing digital address books to LinkedIn; and People Following, which allows members to follow individuals or groups on LinkedIn.
Access to Knowledge, Insights and Opportunities
• | Network Updates. Network Updates provide a real-time stream of data from professionals and professional sources, personalized for each member. The stream allows each member to control and select data by relevancy and remain up-to-date on what is happening in their professional world. |
• | Pulse. Pulse enables our members to be better informed in their everyday jobs by showing them relevant news that has been collected and organized by the members in their networks and fellow professionals in their industries. |
-7-
• | Influencers. LinkedIn Influencers provides a publishing platform for thought leaders to post unique knowledge and professional insights on LinkedIn. Members can follow these individuals to receive relevant content directly in their Network Updates and email. Members can "like" and comment directly on posts and share these insights with their networks. |
• | Slideshare. Slideshare provides our members with access to the world’s largest community for sharing presentations on the Internet. Slideshare supports a wide variety of rich media including presentation files, documents, PDFs, videos and webinars. |
• | Groups. Groups provide a forum for our members to discuss topics of interest and meet and interact with other professionals who share those interests and have opinions and domain expertise in specific areas. Group members are able to discuss, share, comment and make their group memberships part of their profiles. |
• | Company Pages. Company Pages provide members with a holistic view of a company. By aggregating data across the members employed at a particular company, we can show which members have recently joined a company, recently changed their title at a company or recently left a company. Members can also see who they know at a particular company. Companies can add information to their profiles including information about careers at the company and can highlight specific brands and products via Showcase Pages. Members can follow companies and automatically receive recent updates and recommend products and services. |
• | Jobs. Members actively seeking job opportunities can find millions of open jobs posted on LinkedIn. Jobs include suggestions for relevant positions through paid posts as well as open roles from companies’ career sites, applicant tracking systems and third-party sites. |
• | University Pages. University Pages provide students, prospective students, and alumni access to insights and information on thousands of universities globally. Members can receive updates on campus news and activities from the schools themselves and engage with both the campus community and alumni of schools. Additional tools such as University Rankings, which use alumni career outcomes to rank schools for specific careers, and University Finder, which show the most attended schools for a given career, offer new ways for students to navigate one of life’s biggest decisions: choosing where to go to school and what to study. |
• | LinkedIn Alumni. LinkedIn Alumni provides our members with insights about the alumni of their schools, enabling members to easily explore alumni career trends, make connections, and find opportunities. The product allows members to dynamically analyze the career trends of their fellow alumni by providing an interactive tool to view alumni by location, company, and job function. |
We also provide other products to help our members access knowledge, insights and opportunities including the Personalization Platform, which has a number of analytically driven customized products, such as Jobs You May Be Interested In, Groups You May Like, Companies To Follow, People Who Viewed This Profile Also Viewed and People Who Viewed This Job Also Viewed.
Ubiquitous Access
Because professionals constantly require access to critical information, our platform is accessible online anytime and anywhere, including on mobile devices.
• | LinkedIn Mobile. LinkedIn mobile applications are provided across a range of platforms and languages, including iOS for iPhone and iPad, Android, Blackberry, Nokia Asha, and Windows Mobile. Members can access LinkedIn content via LinkedIn’s flagship app, which showcases the essentials of the LinkedIn platform on mobile, in addition to a suite of apps tailored for more specific use cases from job searching to news consumption, including: Pulse, Connected, Job Search, Slideshare, Recruiter and Sales Navigator. |
• | Robust set of APIs. We believe that every modern business application is more useful and productive if it is personalized according to a professional’s profile and his or her network of connections. We maintain a public website that allows any developer to agree to a standard set of guidelines and terms and then integrate our content and services into their applications leveraging standards-based technology. These applications can be hosted on third-party websites or deployed on our platform. Our Certified Developer Program provides a network of developers screened to help marketers, agencies and companies use LinkedIn to connect with their audiences. Third parties are increasingly leveraging our APIs. |
-8-
Monetized Solutions
In addition to our free solutions, we also charge for certain solutions that provide members, enterprises and professional organizations with enhanced functionality and additional benefits.
Talent Solutions
Our Talent Solutions include LinkedIn Corporate Solutions, LinkedIn Job Postings and Subscriptions for individuals. Our products aim to be the most effective way for enterprises and professional organizations to efficiently identify and acquire the right talent for their needs.
LinkedIn Corporate Solutions. LinkedIn Corporate Solutions include the following products:
• | LinkedIn Recruiter. Our flagship Talent Solutions product enables enterprises and professional organizations to find, contact and hire highly qualified passive and active candidates. We believe that a majority of our members are passive in that they are not actively looking to change jobs. Recruiter provides premium functionality including: |
• | Advanced Searches. Ability to search and view every profile on our network, giving most recruiters access to tens of millions more profiles than they would have available with our free offering. Advanced searches can be conducted using keywords found anywhere in a member's profile, such as schools attended and languages spoken, or by data derived from profiles, such as type of experience and seniority. |
• | Project Management. As enterprises and professional organizations find relevant profiles, they are able to organize them into project folders, add notes, and add reminders for follow-up. |
• | InMail. Enterprises and professional organizations can send messages directly to candidates to tell them more about their organization or the specific opportunity, subject to the member's discretion. |
• | Collaboration. Recruiters in the same enterprise or professional organization can see which profiles their colleagues have viewed, saved, or annotated. |
• | LinkedIn Talent Pipeline. Enterprises and professional organizations can easily manage all of their talent leads in one place. LinkedIn Talent Pipeline is available as a standalone solution or as part of Recruiter. |
• | Job Slots. A Job Slot enables an enterprise or professional organization to post a job on the LinkedIn platform typically for one year. The job that is posted can be changed, updated or modified at any time over the life of the contract. |
• | LinkedIn Recruitment Media. Enterprises and professional organizations can target career-related messaging to qualified candidates. We provide promotional material in the form of advertisements, videos, or emails to specific audiences defined by enterprises and professional organizations based on professional profile data. |
• | LinkedIn Career Pages. Enterprises and professional organizations are able to customize the career section of Company Profiles and content on Career Pages to allow potential candidates to learn more about what it is like to work at the enterprise or professional organization, whom to contact if they are interested in a position and what relevant opportunities are available. |
• | Work With Us. Enterprises and professional organizations can elect to display the “Jobs You May be Interested In” (JYMBII) module as an add-on to each of their employee's profiles, allowing them to leverage their employee base to attract relevant candidates. |
LinkedIn Job Postings. Enterprises and professional organizations of all sizes are able to advertise job opportunities on our network. Job Postings include:
• | Self-Service Job Posting. This service enables recruiters and hiring managers to post and manage job opportunities on our network. |
• | Jobs You May Be Interested In (JYMBII). We use profile data to display relevant job postings to members even if they are not conducting a job search. Job recommendations are displayed on a member's homepage and can also be displayed on other websites. In addition, companies can highlight job recommendations in JYMBII through Sponsored Jobs. |
-9-
Subscriptions for Individuals
• | Recruiter Lite. This product is similar to our flagship Recruiter product without custom workflows and team collaboration. |
• | Job Seeker. The Job Seeker subscription enables members to stand out to recruiters and hiring managers, get in touch with recruiters, and see how they compare to other candidates. Members can quickly find job opportunities wherever they want with location-based search, and can get automatic recommendations and notifications based on their searches. |
Marketing Solutions
Our Marketing Solutions products enable enterprises and individuals the ability to advertise to our member base. Our targeting capabilities allow marketers to reach potential customers according to a number of attributes such as industry, function, seniority, and company size, among others. Our Marketing Solutions include Enterprise Solutions, Sponsored Updates, LinkedIn Ads and Ads API.
Enterprise Solutions. These products target larger advertisers who receive dedicated account management and have access to additional Marketing Solutions:
• | Display Ads. Advertisers can use the same targeting engine used for LinkedIn Ads to serve ads in a variety of sizes and formats, including rich media. Additional LinkedIn-specific formats are also available, including Follow Ads. In addition, with our acquisition of Bizo, Inc. in 2014, we are now offering off-network advertising. |
• | Sponsored InMails. Advertisers can directly reach their target audience with long-form, customized messages through LinkedIn’s InMail functionality. |
Sponsored Updates. Available via both field sales and self-service channels, Sponsored Updates are content-rich promoted updates that enable advertisers to share and amplify content marketing messages to a targeted audience. Sponsored Updates appear in the desktop and mobile streams of targeted members.
LinkedIn Ads. Our self-service platform enables advertisers to build and target their advertisements to our members based on information in their profile. LinkedIn Ads includes the following features:
• | Targeting. Ads are targeted to specific members based on their profile information. Targetable attributes include the member's title, function, employer, industry and geography. |
• | Daily Campaign Budgets. A maximum daily budget can be set for advertisements. |
• | Campaign Management. Advertisers can set up and manage multiple campaigns as well as multiple ad units per campaign. |
• | Reporting. Advertisers can continuously monitor clicks, impressions, click-through rates, average cost-per-click and total budget spent by ad. |
Ads API. LinkedIn’s Ads API program enables our social ad partners to build custom solutions for creating, managing, and optimizing LinkedIn Ads and Sponsored Updates campaigns at scale.
-10-
Premium Subscriptions
Our Premium Subscription services target small- and medium-sized enterprises and professional organizations, individual members and business groups in larger enterprises. Certain of our Talent Solutions products (Recruiter Lite and Job Seeker) are sold directly through our site to individuals. All of our subscription packages are designed for general professionals to manage their professional identity, grow their networks and connect with talent. These subscriptions bundles are sold at different price points. Key features found in the subscription bundles include:
• | Open Profile. This opens opportunities to subscribers by allowing anyone on LinkedIn to contact them for free. |
• | Top Keyword Suggestions. Custom keyword suggestions for subscribers’ profiles appear more often in search results. |
• | Larger Search Listing. This attracts more visitors to a subscriber’s profile with a search listing twice the size of a free member’s. |
• | Premium Search. This provides advanced search filters and unlimited people searches within a subscriber’s network up to third degree connections. |
• | Saved Search Alerts. Alerts allow subscribers to stay up to date on key activities, such as searches for candidates, leads or other decision makers. |
• | Who's Viewed Your Profile. Subscribers can see who viewed their profiles in the last 90 days and how they found the subscriber. |
• | How You Rank. Subscribers can see how they rank for profile views as compared to their connections, colleagues and other professionals. |
• | InMail Messages. Subscribers can send direct messages to anyone on LinkedIn. |
Sales Navigator (Sales Solutions). LinkedIn Sales Navigator is a premium social selling solution that provides sales professionals with the ability to quickly find, qualify and create new opportunities and helps sales management accelerate the social selling capabilities of their sales organization. We market Sales Navigator through both our field sales force, as well as our self-service subscription platform for individual members.
It includes the following features:
• | Lead Recommendations. Provides sales professional the ability to quickly discover the right people with customized suggestions based on similar decision makers and influencers at target accounts. |
• | Real-Time Sales Updates. Allows for relevant and timely sales insights on accounts and leads, including job changes, shares and news mentions. |
• | Account and Contact Import. Automatically imports existing accounts and contacts from Salesforce.com into Sales Navigator. |
• | TeamLink. Allows sales professionals to broaden their network to include everyone on their team, increasing the number of reachable prospects and allowing them to focus on the best prospects. |
• | Lead Builder & Premium Search. Create lead lists using custom criteria to find new accounts or upload named accounts, helping sales professionals find the right people faster. |
• | CRM Integration. Turns contact records into rich profiles by allowing users to see LinkedIn information directly in Salesforce.com or Microsoft Dynamics. |
Sales, Marketing and Customer Support
Sales
Depending on the specific product, we sell our Talent and Marketing and Sales Solutions offline through our field sales organization or online through our website. We sell our Premium Subscriptions primarily online through our website. Our field sales organization uses a direct sales force to solicit customers and agencies. In the United States, our field sales organization is located in Chicago, New York and the San Francisco Bay Area. Outside of the United States, we have additional field sales offices around the world.
For our Talent Solutions, we divide our field sales organization between account executives who are responsible for new business and relationship managers who focus on renewing and selling additional seats and solutions to existing customers. Some of our Talent Solutions products, such as Recruiter Lite, Job Postings and Job Seeker, are sold through our website.
-11-
For our Marketing Solutions, our field sales organization focuses on advertising agencies, large brand advertisers and performance advertisers that want to target professionals on our website. We also sell our Marketing Solutions to online advertisers that use our online self-service system to establish accounts, create ads, target members, and launch and manage their advertising campaigns.
For our Sales Solutions, we divide our field sales organization between account executives who are responsible for attracting new business and relationship managers who focus on renewing and selling additional seats and solutions to existing customers. Our Sales Solutions products are also available for purchase online.
Marketing
To date, our member base has grown, in large part, virally based on members inviting other members to join our network. Through this word-of-mouth marketing, we have been able to build our brand with relatively low marketing costs. We use the quality of our own products and solutions as our most effective marketing tool, and word-of-mouth momentum continues to drive member awareness and trust worldwide.
Customer Support
We believe that customer support is critical to retaining and expanding both our member base and customers. Our global customer operations group responds to both business and technical inquiries from individual members, enterprises and professional organizations relating to their accounts and how to use our features and products. Self-service support is available through our website and customers can also contact us via email. We have specific premium support teams dedicated to premium subscribers, online advertisers, and our Talent and Sales Solutions customers.
Customers
Our customers include individuals, enterprises, and professional organizations. No individual customer represented more than 10% of our net revenue in 2014, 2013 or 2012.
Technology Infrastructure
Our technology platform is designed to create an engaging professional networking experience for our members and is built to enable future growth at scale. We employ technological innovations to increase efficiency and scale our business.
Our products rely upon and leverage the massive amounts of data in our network. This rich dataset has grown exponentially, requiring scalable computing resources. We will continue to invest in building proprietary technologies and using open sourced technologies for our data, search and solutions. Our product development expense was $536.2 million, $395.6 million and $257.2 million in 2014, 2013 and 2012, respectively.
Our key technology platforms are described below:
• | Professional Graph. Our fully distributed system is comprised of a graph engine where nodes can represent individuals, companies, schools and other entities and edges can be a connection, a “follow,” or an employee at a given company. The professional graph holds an individual’s real-time network and enables a variety of complex calls like establishing the degree by which two nodes are connected (e.g., second degree vs. third degree). |
• | Open Sourced Technologies. We deploy aspects of our technology into the open source community to help increase the speed at which the technology can mature. The combination of open source and proprietary technologies used in our platforms allows us to quickly deploy our products at scale. For example, Hadoop is an open source project used to batch compute data for different features on our website based on our members’ data and traffic patterns. Hadoop enables us to scale our calculations on an expanding set of data and to perform these calculations more frequently. |
• | Search. Our proprietary search technology combines structured and free-form content to allow users to search across numerous parameters. Our search is powered by our rich dataset based on facets and keywords and is fundamentally personalized as all search requests use a member’s network to affect relevance and ranking. Our search is real time, distributed and multilingual and serves the needs of both members and enterprises and professional organizations. |
• | Customized Content, Matching, Targeting and Recommendations. We have developed a proprietary intelligence and recommendation engine for extracting professional insights by utilizing our rich dataset. This engine enables us to provide our users with customized content and recommendations. For example, based on a member’s profile, their second and third degree connections, their viewing and |
-12-
clicking history, and a host of other criteria, our algorithms can provide intelligence and recommendations around Talent Match, People You May Know, Groups You May Like, Jobs You May Be Interested In, Sponsored Content or Companies You May Be Interested In. Our targeting and recommendation technologies continue beyond just a member’s profile by providing intelligence around similar profile views and similar job views.
• | Ad Targeting Platform. We use a combination of traditional and proprietary ad targeting and delivery technologies. The combination is optimized to work with our respective partners to provide the optimal user experience. Our proprietary systems leverage our feature extraction, information retrieval, and matching systems to provide the most relevant ads. |
• | Document Conversion Technologies. We use a combination of open source and proprietary technologies to convert documents in various formats (e.g., pdf, doc, ppt) into HTML5, a mark-up language for structuring and presenting content on the Internet, so that the document can be displayed on LinkedIn.com and Slideshare.net, and embedded throughout the Internet. |
• | Service Infrastructure. We have invested and are continuing to invest in updating our online applications to our new service infrastructure, which we believe will improve developer productivity, agility and operability, and accelerate our mobile strategy. |
Operations
We have developed our website and related infrastructure with the goal of maximizing the availability of our platform to our members, enterprises and professional organizations. Our website and related infrastructure are hosted on a network located in multiple third-party facilities, and we lease data center facilities in various locations.
Intellectual Property
We protect our intellectual property rights by relying on federal, state, and common law rights in the United States and equivalent rights in other jurisdictions, as well as contractual restrictions. We control access to our proprietary technology, in part, by entering into confidentiality and invention assignment agreements with our employees and contractors, and confidentiality agreements with third parties.
In addition to these contractual arrangements, we also rely on a combination of trade secrets, copyrights, trademarks, trade dress, domain names and patents to protect our intellectual property. We pursue the registration of our domain names, trademarks, and service marks in the United States and in certain locations outside the United States. Our trademarks and registered trademarks in the United States and other countries include “LinkedIn” and the “in” design mark, as well as others. We hold a growing portfolio of issued patents in the United States and internationally, and regularly file patent applications to protect intellectual property that we believe is important to our business. We believe the duration of our patents is adequate relative to the expected lives of our products.
Circumstances outside our control could pose a threat to our intellectual property rights. For example, effective intellectual property protection may not be available in the United States or other countries in which our products and solutions are distributed. Also, the efforts we have taken to protect our proprietary rights may not be sufficient or effective. Any significant impairment of our intellectual property rights could harm our business or our ability to compete. Also, protecting our intellectual property rights is costly and time-consuming. Any unauthorized disclosure or use of our intellectual property could make it more expensive to do business and harm our operating results.
Companies in the Internet, social media technology and other industries may own large numbers of patents, copyrights, and trademarks and may frequently request license agreements, threaten litigation, or file suit against us based on allegations of infringement or other violations of intellectual property rights. From time to time, we face, and we expect to face in the future, allegations that we have infringed the trademarks, copyrights, patents and other intellectual property rights of third parties, including our competitors and non-practicing entities.
Competition
We face significant competition in all aspects of our business, and we expect such competition to increase, particularly in the market for online professional networks and engagement of professionals. Specifically, we compete for members, enterprises and professional organizations as discussed below.
• | Members-professional networks. The space for online professional networks is rapidly evolving. Other companies such as Facebook, Google, Microsoft and Twitter are developing or could develop solutions that compete with ours. Further, some of these companies are partnering with third parties to offer |
-13-
products and services that could compete with ours. Additionally, we face competition from a number of companies outside the United States that provide online professional networking solutions. We also compete against smaller companies that focus on groups of professionals within a specific industry or vertical. Our competitors may announce new products, services or enhancements that better address changing industry standards or the needs of members and customers, such as mobile access or different market focus. Any such increased competition could cause pricing pressure, loss of business or decreased member activity, any of which could adversely affect our business and operating results. Internet search engines could also change their methodologies in ways that adversely affect our ability to optimize our page rankings within their search results.
• | Enterprises and professional organizations-Talent Solutions. With respect to our Talent Solutions, we compete with online recruiting companies, talent management companies and larger companies that are focusing on talent management and human resource services, job boards and traditional recruiting firms. Additionally, other companies, including newcomers to the recruiting industry, may partner with Internet companies, including social networking companies, to provide services that compete with our solutions, either on their own or as third party applications. If the efficiency and usefulness of our products to enterprises and professional organizations do not exceed those provided by competitors, we will not be able to compete successfully. |
• | Enterprises and Professional Organizations-Marketing Solutions. With respect to our Marketing Solutions, we compete with online and offline outlets that generate revenue from advertisers and marketers. To the extent competitors are better able to provide customers with cost-effective access to attractive demographics, either through new business models or increased user volume, we may not be successful in retaining our existing advertisers or attracting new advertisers, and our business would be harmed. |
• | Enterprises and professional organizations-Premium Subscriptions/Sales Solutions. With respect to our Premium Subscriptions and Sales Solutions, we compete with online and offline companies for customers with lead generation and customer intelligence and insights. Our Sales Solutions product is in the early stages, and we may not be able to compete effectively in this area. |
We believe that we have competitive strengths that position us favorably in our lines of business. However, our industry is evolving rapidly and is becoming increasingly competitive. Larger and more established companies may focus on professional networking and could directly compete with us. Smaller companies could also launch new products and services that we do not offer and that could gain market acceptance quickly.
Government Regulation
We are subject to a number of foreign and domestic laws and regulations that affect companies conducting business online, many of which are evolving and could be interpreted in ways that could harm our business. In the United States and abroad, laws and regulations relating to the liability of providers of online services for activities of their users and other third parties are being tested by a number of claims, including actions based on invasion of privacy and other torts, unfair competition, copyright and trademark infringement, and other theories based on the nature and content of the materials searched, the ads posted, or the content provided by users. Any court ruling or other governmental action that imposes liability on providers of online services for the activities of their users and other third parties could harm our business. In addition, rising concern about the use of social networking technologies for illegal conduct, such as the unauthorized dissemination of national security information, money laundering or supporting terrorist activities, may in the future produce legislation or other governmental action that could require changes to our products or services, restrict or impose additional costs upon the conduct of our business or cause users to abandon material aspects of our service.
In the area of information security and data protection, most states have enacted laws and regulations requiring notification to users when there is a security breach of personal data, or requiring the adoption of minimum information security standards that are often vaguely defined and difficult to practically implement. The costs of compliance with these laws and regulations may increase in the future as a result of amendments or changes in interpretation. Furthermore, any failure on our part to comply with these laws and regulations may subject us to significant liabilities.
We are also subject to federal, state, and foreign laws and regulations regarding privacy and protection of member data. Our privacy policy and user agreement describe our practices concerning the use, storage,
-14-
transmission and disclosure of member data. Any failure by us to comply with these terms or privacy related laws and regulations could result in proceedings against us by governmental authorities or others, which could harm our business. In addition, the interpretation of privacy and data protection laws and their application to online services are unclear, evolving and in a state of flux. There is a risk that these laws and regulations may be interpreted and applied in conflicting ways from state to state, country to country, or region to region, and in a manner that is not consistent with our current data protection practices, or that new laws or regulations will be enacted. There are a number of legislative proposals pending before U.S. state and federal legislative bodies and foreign governments concerning privacy and data protection that could affect us. Complying with these varying domestic and international requirements could cause us to incur additional costs and change our business practices. Further, any failure by us to adequately protect our members’ privacy and data could result in a loss of member confidence in our services and ultimately in a loss of members and customers, which could adversely affect our business.
In addition, because our services are accessible worldwide, certain foreign jurisdictions have claimed and others may claim that we are required to comply with their laws and regulations, including with respect to the storage, use and disclosure of member information, even in jurisdictions where we have no local entity, employees, or infrastructure.
Our Values and Company Culture
Our values and unique company culture serve as the foundation to our success. Our values are the principles by which we manage our day-to-day business and facilitate decision-making. Our core values are:
• | Members First. We encourage employees to know and understand our members and to ensure that we foster the long-term vitality of the LinkedIn ecosystem. |
• | Relationships Matter. By fostering trust with colleagues and partners, we all succeed. We fundamentally believe that doing what is right is more important than being right. We manage compassionately by recognizing that people have experiences and perspectives that may differ from our own. |
• | Be Open, Honest and Constructive. We expect our employees to communicate with clarity and provide feedback with consistency in a constructive way. |
• | Demand Excellence. Our employees are encouraged to lead by example, seek to solve big challenges, set measureable and actionable goals, and continuously learn, iterate and improve. |
• | Take Intelligent Risks. Taking intelligent risks has been paramount in building the company to date. No matter how large the company becomes, we strive to never lose our startup mentality. |
• | Act Like an Owner. Talent is our most important asset. We expect employees to act as an owner in each decision they make, no matter how big or small. |
Our company culture reflects who we are and the company we aspire to be. Our culture is shaped in large part by our values and is best defined by:
• | Transformation. People who work at LinkedIn are here because they seek to make a positive and lasting impact on the world, help realize the full potential of LinkedIn and fundamentally alter the trajectory of their careers. |
• | Integrity. We don’t believe the ends justify the means. Rather, we expect employees to do the right thing no matter what. |
• | Collaboration. Much like the network effects inherent in our business model, we believe that as valuable as we are as individuals, we are all exponentially more valuable when aligned and working together. |
• | Humor. Fulfilling our mission and vision requires an intense focus so we believe it is important to not take ourselves too seriously and try to have some fun while doing it. |
• | Results. We set clear, actionable goals and have high expectations for our performance. We count on our employees to consistently deliver excellent results, seek leverage through greater efficiency and effectiveness, and demonstrate leadership at all levels throughout the organization. |
We believe we have assembled a talented group of employees and strive to hire the best employees to solve significant challenges in our markets. As of December 31, 2014, we had 6,897 employees, consisting of 2,838 employees in engineering, product development and customer operations, 2,989 employees in sales and marketing, and 1,070 employees in general and administrative functions.
-15-
While we encourage collaboration, we also embrace individual thinking and creativity. For example, one of our key approaches to attracting and retaining technical talent and fostering continued innovation is through our company-sponsored “inDays” and “hackdays” where our employees are encouraged to take the time to explore and implement new ideas. Participants then present their ideas in front of the whole company with prizes awarded for the best ideas. Some of our significant new products have been developed as a result of inDays and hackdays.
Information about Segment and Geographic Revenue
Information about segment and geographic revenue is set forth in Note 14 of the Notes to Consolidated Financial Statements under Item 8 of this Annual Report on Form 10-K.
Seasonality
Our business is affected by both cyclicality in business activity and seasonal fluctuations in Internet usage. We believe our rapid growth has masked the cyclicality and seasonality of our business. As our revenue growth rate slows, we expect that the cyclicality and seasonality in our business may become more pronounced and may in the future cause our operating results to fluctuate. In particular, we expect new business and renewals of Talent Solutions to be stronger in the fourth quarter of the year due to budgetary cycles and our Marketing Solutions business to be stronger in the second and fourth quarter of the year in alignment with industry advertising spending.
Available Information
Our website is located at www.linkedin.com, and our investor relations website is located at http://investors.linkedin.com/. The following filings are available free of charge through our investor relations website after we file them with the SEC: Annual Reports on Form 10-K, Quarterly Reports on Form 10-Q, and our Proxy Statements for our annual meetings of stockholders.
We webcast our earnings calls and certain events we participate in or host with members of the investment community on our investor relations website. Additionally, we provide notifications of news or announcements regarding our financial performance, including SEC filings, investor events, press and earnings releases, and blogs as part of our investor relations website. Investors and others can receive real-time notifications of new information posted on our investor relations website by signing up for email alerts and RSS feeds. Further corporate governance information, including our certificate of incorporation, bylaws, governance guidelines, board committee charters, and code of conduct, is also available on our investor relations website under the heading “Corporate Governance.” The contents of our websites are not intended to be incorporated by reference into this Annual Report on Form 10-K or in any other report or document we file with the SEC, and any references to our websites are intended to be inactive textual references only. We have used, and intend to continue to use, our investor relations website, as well as our website (www.linkedin.com), the LinkedIn page (https://www.linkedin.com/company/linkedin), our Twitter feed (https://twitter.com/linkedin) and our corporate blog (www.blog.linkedin.com), as a means of disclosing material non-public information and for complying with our disclosure obligations under Regulation FD.
Item 1A. | Risk Factors |
Investing in our Class A common stock involves a high degree of risk. You should carefully consider the risks and uncertainties described below, together with all of the other information in this Annual Report on Form 10-K, including our consolidated financial statements and related notes, before deciding whether to purchase shares of our Class A common stock. If any of the following risks are realized, our business, operating results and prospects could be materially and adversely affected. In that event, the price of our Class A common stock could decline, and you could lose part or all of your investment.
Risks Related to Our Business
We have a limited operating history in new and unproven markets, which makes it difficult to evaluate our future prospects and may increase the risk that we will not be successful.
We have a limited operating history in new and unproven markets that may not develop as expected. This limited operating history makes it difficult to effectively assess or forecast our future prospects. You should consider our business and prospects in light of the risks and difficulties we encounter or may encounter in these rapidly evolving markets. These risks and difficulties include our ability to, among other things:
• | hire, integrate and retain world class talent; |
-16-
• | continue to earn and preserve our members’ trust with respect to their professional reputation and information; |
• | develop and maintain scalable, high-performance technology infrastructure that can efficiently and reliably handle increased member usage globally while also implementing appropriate localization, as well as the deployment of new features and products; |
• | avoid interruptions or disruptions in our service or slower than expected load times for our services; |
• | create value for our members as well as increase the size of the overall network through new member growth; |
• | responsibly use the data that our members share with us to provide solutions that make our members more productive and successful and that are critical to the talent, marketing and sales needs of enterprises and professional organizations; |
• | process, store, protect and use personal data in compliance with governmental regulations, contractual obligations and other legal obligations related to privacy and security; |
• | halt the operations of websites that aggregate our data and/ or combine it with data from other companies or sources, or copycat websites that have misappropriated our data; |
• | increase revenue from the solutions we provide; |
• | successfully adapt to mobile markets and optimize services for mobile devices; |
• | successfully expand our business in markets outside the United States; |
• | successfully compete with other companies that are currently in, or may in the future enter, the online professional networking space; and |
• | defend ourselves against litigation, regulatory, intellectual property, privacy and other claims. |
If the market for online professional networks does not develop as we expect, or if we fail to address the needs of this market, our business will be harmed. We may not be able to successfully address these risks and difficulties or others, including those described elsewhere in these risk factors. Failure to adequately address these risks and difficulties could harm our business and cause our operating results to suffer.
We may not timely and effectively scale and adapt our existing technology and network infrastructure to ensure that our services and solutions are accessible within an acceptable load time. Additionally, natural disasters or other catastrophic occurrences beyond our control could interfere with access to our services.
A key element to our continued growth is the ability of our members, users (whom we define as anyone who visits one of our websites through a computer or application on a mobile device, regardless of whether or not they are a member), enterprises and professional organizations in all geographies to access our websites, services and solutions within acceptable load times. We call this website performance. We have experienced, and may in the future experience, service disruptions, outages and other performance problems due to a variety of factors, including infrastructure changes, human or software errors, capacity constraints due to an overwhelming number of users accessing our services simultaneously, and denial of service or fraud or security attacks. In some instances, we may not be able to identify the cause or causes of these website performance problems within an acceptable period of time. We expect it will become increasingly difficult to maintain and improve our website performance, especially during peak usage times and as our solutions become more complex and our total user traffic increases. If our services are unavailable when users attempt to access them or they do not load as quickly as users expect, users may seek other websites or services to obtain the information for which they are looking, and may not return to our website or use our services as often in the future, or at all. This would negatively impact our ability to attract members, enterprises and professional organizations and increase engagement of our members and users. We expect to continue to make significant investments to maintain and improve website performance and to enable rapid releases of new features and products. To the extent that we do not effectively address capacity constraints, upgrade our systems as needed and continually develop our technology and network architecture to accommodate actual and anticipated changes in technology, our business and operating results may be harmed.
We have implemented a disaster recovery program, which allows us to move production traffic to a backup data center in the event of a catastrophe. For the majority of our services, we serve traffic out of multiple data centers in parallel. This allows us the ability to move traffic immediately and, in the event of a problem, the ability to recover in a short period of time. However, some of our services have not yet migrated to this model and still operate solely in a primary data center. In the event of a disaster, these services would remain shut down during the transition to a backup data center. To the extent our disaster recovery program does not effectively support the movement of traffic in a timely or complete manner in the event of a catastrophe, our business and operating results may be harmed.
-17-
Our systems are also vulnerable to damage or interruption from catastrophic occurrences such as earthquakes, floods, fires, power loss, telecommunication failures, terrorist attacks and similar events. Our U.S. corporate offices and certain of the facilities we lease to house our computer and telecommunications equipment are located in the San Francisco Bay Area and Southern California, both regions known for seismic activity. Despite any precautions we may take, the occurrence of a natural disaster or other unanticipated problems at our hosting facilities could result in lengthy interruptions in our services.
We do not carry business interruption insurance sufficient to compensate us for the potentially significant losses, including the potential harm to the growth of our business that may result from interruptions in our service as a result of system failures.
If our security measures are compromised, or if our websites are subject to attacks that degrade or deny the ability of members or customers to access our solutions, or if our member data is compromised, members and customers may curtail or stop use of our solutions.
Our solutions involve the collection, processing, storage, sharing, disclosure and usage of members’ and customers’ information and communications, some of which may be private. We also work with third party vendors to process credit card payments by our customers and are subject to payment card association operating rules. We are vulnerable to computer viruses, break-ins, phishing attacks, attempts to overload our servers with denial-of-service or other attacks and similar disruptions from unauthorized use of our computer systems, any of which could lead to interruptions, delays, or website shutdowns, causing loss of critical data or the unauthorized disclosure or use of personally identifiable or confidential information. For example, in June 2012, approximately 6.5 million of our members’ encrypted passwords were stolen and published on an unauthorized website. If we experience compromises to our security that result in website performance or availability problems, the complete shutdown of our websites, or the loss or unauthorized disclosure of confidential information, such as credit card information, our members or customers may be harmed or lose trust and confidence in us, and decrease the use of our website, apps and services or stop using our services in their entirety, and we would suffer reputational and financial harm.
In addition, we may be subject to regulatory investigations or litigation in connection with a security breach or related issue, and we could also be liable to third parties for these types of breaches. Such litigation, regulatory investigations and our technical activities intended to prevent future security breaches are likely to require additional management resources and expenditures. If our security measures fail to protect this information adequately or we fail to comply with the applicable credit card association operating rules, we could be liable to both our customers for their losses, as well as the vendors under our agreements with them, we could be subject to fines and higher transaction fees, we could face regulatory action, and our customers and vendors could end their relationships with us, any of which could harm our business and financial results.
Our core value of putting our members first may conflict with the short-term interests of our business.
One of our core values is to make decisions based on the best long-term interests of our members, which we believe is essential to our success in increasing our member growth rate and engagement, creating value for our members and in serving the best, long-term interests of the company and our stockholders. Therefore, in the past, we have forgone, and may in the future forgo, certain expansion or short-term revenue opportunities that we do not believe are in the best interests of our members, even if our decision negatively impacts our operating results in the short term. In addition, our philosophy of putting our members first, as long as our members are adhering to our terms of service, may cause disagreements, or negatively impact our relationships, with our existing or prospective customers. This could result in enterprises and professional organizations blocking access to our services or refusing to purchase our Talent Solutions, Marketing Solutions or Premium Subscriptions. Our decisions may not result in the long-term benefits that we expect, in which case our member engagement, business and operating results could be harmed.
The number of our registered members is higher than the number of actual members and a substantial majority of our traffic is generated by a minority of our members. Our business may be adversely impacted if we are unable to attract and retain additional members who actively use our services.
The number of registered members in our network is higher than the number of actual members because some members have multiple registrations, other members have died or become incapacitated, and others may have registered under fictitious names or created fraudulent accounts. While the number of registered members represents what we believe to be reasonable estimates of our member base, there are inherent challenges in ensuring that the number of registered members presents an accurate reflection of our member network. For example, we do not have a reliable system for identifying and counting duplicate or fraudulent accounts, or
-18-
deceased, incapacitated or other non-members and so we rely on estimates and assumptions, which may not be accurate. In addition, our methodology for measuring our membership numbers, and specifically for making estimates regarding non-members who should not be included as registered members, has changed over time and may continue to change from time to time. While we are using what we believe to be reasonable and appropriate methods of measuring the number of registered members, there are no methodologies available that would provide us with an exact number of non-actual member types of accounts. Therefore, we cannot assure you that our current or future methodologies are accurate, and we will need to continue to adjust them in the future from time to time, which could result in the number of registered members being lower or higher than expected. Further, a substantial majority of our members do not visit our websites on a monthly basis, and a substantial majority of our desktop and mobile traffic is generated by a minority of our members. If the number of our actual members does not meet our expectations, if the rate at which we add new members slows or declines or if we are unable to increase the breadth and frequency of our visiting members, then our business may not grow as fast as we expect.
The tracking of certain of our performance metrics is done with internal tools and is not independently verified. Certain of our performance metrics are subject to inherent challenges in measurement, and real or perceived inaccuracies in such metrics may harm our reputation and negatively affect our business.
We track certain performance metrics, including number of registered members, unique visiting members and member page views, with internal tools, which are not independently verified by any third party. Our internal tools have a number of limitations and our methodologies for tracking these metrics may change over time, which could result in unexpected changes to our metrics, including the metrics we report. If the internal tools we use to track these metrics undercount or overcount performance or contain algorithm or other technical errors, the data we report may not be accurate. In addition, limitations or errors with respect to how we measure data may affect our understanding of certain details of our business, which could affect our longer term strategies. If our performance metrics are not accurate representations of our member base or traffic levels, or if we discover material inaccuracies in our metrics, our reputation may be harmed and our operating and financial results could be adversely affected, causing our stock price to decline. In addition, historically, we reported information regarding certain of our internal metrics based on data provided by comScore, a leading provider of digital marketing intelligence. We recently began disclosing certain of these internal metrics, as opposed to reporting the comScore information, and inconsistency between these internal metrics and comScore data regarding our metrics could confuse investors or lead to questions about the integrity of our internal data.
If our members' profiles are out-of-date, inaccurate or lack the information that users and customers want to see, we may not be able to realize the full potential of our network, which could adversely impact the growth of our business.
If our members do not update their information or provide accurate and complete information when they join LinkedIn, or do not establish sufficient connections, the value of our network may be negatively impacted because our value proposition as a professional network and as a source of accurate and comprehensive data will be weakened. For example, customers of our Talent Solutions may not find members that meet their qualifications or may misidentify a candidate as having such qualifications, which could result in mismatches that erode customer confidence in our solutions. Similarly, incomplete or outdated member information would diminish the ability of our Marketing or Sales Solutions customers to reach their target audiences and our ability to provide our customers with valuable insights. Therefore, we must provide features and products that demonstrate the value of our network to our members and motivate them to contribute additional, timely and accurate information to their profile and our network. If we fail to successfully motivate our members to do so, our business and operating results could be adversely affected.
Many individuals use mobile devices to access online services. If users of these devices do not widely adopt solutions we develop for these devices or if we are unable to effectively operate on mobile devices, our business could be adversely affected.
The number of people who access online services through mobile devices, such as smart phones, handheld tablets and mobile telephones, as opposed to personal computers, has increased dramatically in the past few years and is projected to continue to increase. If the mobile solutions we have developed do not meet the needs of prospective members, current members or customers, they may not sign up or reduce their usage of our platform and our business could suffer. Additionally, we are dependent on the interoperability of LinkedIn with popular mobile operating systems that we do not control, such as Android and iOS, and any changes in such systems and terms of service that degrade our solutions’ functionality, give preferential treatment to competitive products or prevent our ability to promote advertising could adversely affect traffic and monetization on mobile devices. We may not
-19-
be successful in maintaining and developing relationships with key participants in the mobile industry or in developing products that operate effectively with these technologies, systems, networks, or standards. Each manufacturer or distributor may establish unique technical standards for its devices, and our products and services may not work or be viewable on these devices as a result. Some manufacturers may also elect not to include our products on their devices. As new devices and new platforms are continually being released, it is difficult to predict the challenges we may encounter in developing versions of our solutions for use on these alternative devices, and we are devoting significant resources to the support and maintenance of such devices.
Growth in access to LinkedIn’s services through mobile devices as a substitute for access on personal computers may negatively affect our revenue and financial results.
Our members are increasingly accessing LinkedIn on mobile devices. While many of our members who use our online services on mobile devices also access LinkedIn through personal computers, we have seen substantial growth in mobile usage. While we offer Sponsored Updates on mobile devices, historically, our Marketing Solutions products have not been made widely available on mobile products, and subsequently have not generated a material amount of revenue. We are devoting valuable resources to solutions related to monetization of mobile usage, and cannot assure you that these solutions will be successful. If our members increasingly use mobile devices as a substitute for access to our online services as opposed to personal computers, and if we are unable to successfully implement monetization strategies for our solutions on mobile devices, or these strategies are not as successful as our offerings for personal computers, or if we incur excessive expenses in this effort, our financial performance and ability to grow revenue would be negatively affected.
Our solutions and internal systems rely on software that is highly technical, and if it contains undetected errors, our business could be adversely affected.
Our solutions and internal systems rely on software that is highly technical and complex. In addition, our solutions and internal systems depend on the ability of our software to store, retrieve, process, and manage immense amounts of data. Our software has contained, and may now or in the future contain, undetected errors, bugs, or vulnerabilities. Some errors in our software may only be discovered after the code has been released for external or internal use. Errors or other design defects within our software may result in a negative experience for members or customers, delay product introductions or enhancements, or result in measurement or other errors. Any errors, bugs, or defects discovered in our software could result in damage to our reputation, loss of members, loss of revenue, or liability for damages, any of which could adversely affect our business and financial results.
We collect, process, store, share, disclose and use personal information and other data, which subjects us to governmental regulations and other legal obligations related to privacy and security, and our actual or perceived failure to comply with such obligations could harm our business.
We collect, process, store, share, disclose and use information from and about our members, customers and users, including personal information and other data, and we enable our members to passively and proactively share their personal information with each other and with third parties and to communicate and share news and other information into and across our platform. There are numerous laws around the world regarding privacy and security, including laws regarding the collection, processing, storage, sharing, disclosure, use and security of personal information and other data from and about our members and users. The scope of these laws are changing, subject to differing interpretations, may be costly to comply with, and may be inconsistent among countries and jurisdictions or conflict with other rules.
We strive to comply with applicable laws, policies, and legal obligations and certain applicable industry codes of conduct relating to privacy and data protection and are subject to the terms of our privacy policies and privacy-related obligations to third parties (including voluntary third-party certification bodies such as TRUSTe). However, these obligations may be interpreted and applied in new ways and/or in a manner that is inconsistent from one jurisdiction to another and may conflict with other rules or our practices. Data privacy and security are active areas and new laws and regulations are likely to be enacted.
Any failure or perceived failure by us to comply with our privacy policies, our privacy-related obligations to members, customers or other third parties, or our privacy or security-related legal obligations, or any compromise of security that results in the unauthorized release or transfer of personal or other information, which may include personally identifiable information or other member data, may result in governmental enforcement actions, litigation or public statements critical of us by consumer advocacy groups or others and could cause our members and customers to lose trust in us, which could have an adverse effect on our business. Additionally, if third parties we work with, such as customers, vendors or developers, violate applicable laws, our policies or other privacy or
-20-
security-related obligations, such violations may also put our members’ information at risk and could in turn have an adverse effect on our business. Finally, governmental agencies may request or take member or customer data for national security or informational purposes, and also can make data requests in connection with criminal or civil investigations or other matters, which could harm our reputation and our business.
Public scrutiny of Internet privacy and security issues may result in increased regulation and different industry standards, which could deter or prevent us from providing our current products and solutions to our members and customers, thereby harming our business.
The regulatory framework for privacy and security issues worldwide is evolving and is likely to remain in flux for the foreseeable future. Various government and consumer agencies have also called for new regulation and changes in industry practices. Practices regarding the registration, collection, processing, storage, sharing, disclosure, use and security of personal and other information by companies offering online services have recently come under increased public scrutiny.
In the U.S., the federal government, including the White House, the Federal Trade Commission, the Department of Commerce and Congress, and many state governments are reviewing the need for greater regulation of the collection, processing, storage, sharing, disclosure, use and security of information concerning consumer behavior with respect to online services, including regulations aimed at restricting certain targeted advertising practices and collection and use of data from mobile devices. For example, the State of California and other states have passed laws relating to disclosure of companies’ practices with regard to Do-Not-Track signals from Internet browsers, the ability to delete information of minors, and new definitions that may impact data breach notification requirements. California has also adopted privacy guidelines with respect to mobile applications. In addition, the European Union is actively considering a new General Data Protection Regulation, which may result in significantly greater compliance burdens for companies with users and operations in the European Union. Outside the European Union and the United States, a number of countries have adopted or are considering privacy laws and regulations that may result in significant greater compliance burdens.
In addition, government agencies and regulators have reviewed, are reviewing and will continue to review, the privacy practices of online media companies including our privacy and security policies and practices. The FTC in particular has approved consent decrees resolving complaints and their resulting investigations into the privacy and security practices of a number of online social media companies. These reviews can and have resulted in changes to our products and policies, and could result in additional changes in the future. If we are unable to comply with any such reviews or decrees that result in recommendations or binding changes, or if the recommended changes result in degradation of our products, our business could be harmed.
Our business, including our ability to operate and expand internationally or on new technology platforms, could be adversely affected if legislation or regulations are adopted, interpreted or implemented in a manner that is inconsistent with our current business practices and that require changes to these practices, the design of our websites, mobile applications, products, features or our privacy policy. In particular, the success of our business has been, and we expect will continue to be, driven by our ability to responsibly use the data that our members share with us. Therefore, our business could be harmed by any significant change to applicable laws, regulations or industry standards or practices regarding the storage, use or disclosure of data our members choose to share with us, or regarding the manner in which the express or implied consent of consumers for such use and disclosure is obtained. Such changes may require us to modify our products and features, possibly in a material manner, and may limit our ability to develop new products and features that make use of the data that we collect about our members.
Our business is subject to a variety of U.S. and foreign laws, many of which are unsettled and still developing and which could subject us to claims or otherwise harm our business.
We are subject to a variety of laws in the United States and abroad, including laws regarding privacy, data protection, data security, data retention and consumer protection, accessibility, sending electronic messages and the provision of online payment services, including credit card processing, which are continuously evolving and developing. In addition, some of our members are subject to laws and/or licensing or certification obligations that may restrict their ability to engage with LinkedIn’s online services. The scope and interpretation of the laws and other obligations that are or may be applicable to us or certain groups of our members are often uncertain and may be conflicting, particularly laws and other obligations outside the United States. For example, laws related to the online dissemination of content of others and laws related to sending messages over online service are continuing to evolve and are being tested pursuant to actions based on, among other things, invasion of privacy, spam, and
-21-
other torts, unfair competition, copyright and trademark infringement, credit reporting and other theories based on the nature and content of the materials and messages sent or provided by others.
In addition, regulatory authorities around the world are considering a number of legislative and regulatory proposals concerning privacy, spam, data storage, data protection, content regulation, cybersecurity and other matters that may be applicable to our business. Compliance with these laws may require substantial investment or may provide technical challenges for our business. It is also likely that as our business grows, evolves, and an increasing portion of our business shifts to mobile, and our solutions are used in a greater number of countries and additional groups, we will become subject to laws and regulations in additional jurisdictions. Further, as our services and solutions expand to include more content (including from third parties), additional laws and regulations may become applicable to our products and offerings including laws requiring us to restrict the availability of such content on a geographical basis or to certain groups of members. In some cases, laws and legal obligations of various jurisdictions may be ambiguous or conflict as to LinkedIn’s right to display and distribute certain content as part of its online services. Users of our site and our solutions could also abuse or misuse our products in ways that violate laws. It is difficult to predict how existing laws will be applied to our business and the new laws and legal obligations to which we may become subject.
If we are not able to comply with these laws or other legal obligations or if we (or our members) become liable under these laws or legal obligations, or if our services are suspended or blocked, we could be directly harmed, and we may be forced to implement new measures to reduce exposure to this liability. This may require us to expend substantial resources or to discontinue certain solutions, which would negatively affect our business, financial condition and results of operations. In addition, the increased attention focused upon liability issues as a result of lawsuits and legislative proposals could harm our reputation or otherwise impact the growth of our business. Any costs incurred as a result of this potential liability could harm our business and operating results.
We expect our operating results to fluctuate on a quarterly and annual basis, which may result in a decline in our stock price if such fluctuations result in a failure to meet the expectations of securities analysts or investors.
Our revenue and operating results have in the past and could in the future vary significantly from quarter-to-quarter and year-to-year and may fail to match our past performance, our projections or the expectations of securities analysts because of a variety of factors, many of which are outside of our control. Any of these events could cause the market price of our Class A common stock to fluctuate. Factors that may contribute to the variability of our operating results include:
• | our ability to create value for our members as well as increase the size of our member base; |
• | our commitment to putting our members first even if it means forgoing short-term revenue opportunities; |
• | shifts in the way members and users access our websites and services from personal computers to mobile devices; |
• | disruptions or outages in the availability of our websites or services, actual or perceived breaches of privacy, and compromises of our member data; |
• | changes in our pricing policies or those of our competitors; |
• | our ability to increase sales of our products and solutions to new customers and expand sales of additional products and solutions to our existing customers; |
• | the size and seasonal variability of our customers’ recruiting, marketing and sales budgets; |
• | the extent to which existing customers renew their agreements with us and the timing and terms of those renewals; |
• | general industry and macroeconomic conditions, in particular, deterioration in labor markets, which would adversely impact sales of our Talent Solutions, or economic growth that does not lead to job growth, for instance increases in productivity; |
• | the cost of investing in our technology infrastructure, product initiatives and international expansion may be greater than we anticipate; |
• | expenses related to hiring, incentivizing and retaining employees; |
• | the timing and costs of expanding our field sales organization and delays or inability in achieving expected productivity; |
• | the timing of certain expenditures, including hiring of employees and capital expenditures; |
• | the entrance of new competitors in our market whether by established companies or the entrance of new companies; and |
• | changing tax laws and regulations. |
-22-
Given our limited operating history and the rapidly evolving market of online professional networks, our historical operating results may not be indicative of our future operating results. We believe our rapid growth has masked the cyclicality and seasonality of our business. As our revenue growth rate slows, we expect that the cyclicality and seasonality in our business may become more pronounced and may in the future cause our operating results to fluctuate. In particular, we expect sales of Talent Solutions to be weaker in the first quarter of the year due to budgetary cycles and sales of our Marketing Solutions to be weaker in the third quarter of the year as use of online services during the summer months generally slows. In addition, global economic concerns continue to create uncertainty and unpredictability and add risk to our future outlook. Sovereign debt issues and economic uncertainty in the United States, Europe and around the world raise concerns in markets important to our business. An economic downturn in any particular region in which we do business or globally could result in reductions in sales of our products, decreased renewals of existing arrangements and other adverse effects that could harm our operating results.
We expect our revenue growth rate to decline, and, as our costs increase, we may not be able to generate sufficient revenue to sustain our profitability over the long term.
From 2009 to 2014, our annual net revenue grew from $120.1 million to $2,218.8 million, which represents a compounded annual growth rate of approximately 79%. As our net revenue has increased, our revenue growth rate has slowed, and we expect that it will continue to decline over time. We also expect that the growth rates of each of our three primary product lines will fluctuate and that these product lines may not grow at the same rate. In recent years, and continuing into 2014, our philosophy has been to invest for future growth. We expect to continue to expend substantial financial and other resources on:
• | our technology infrastructure, including architecture, development tools scalability, availability, performance and security, as well as disaster recovery measures; |
• | product development, including investments in our product development team and the development of new features for both members and customers, including those for mobile use and our sales solutions products; |
• | sales and marketing, including a significant expansion of our field sales organization; |
• | international expansion in an effort to increase our member base, member activity and sales; |
• | general administration, including legal and accounting expenses related to being a public company with an expanding global presence; and |
• | capital expenditures, including facilities and build-out of our data centers. |
These investments may not result in increased revenue or business growth, or increased network growth or member value, and will increase our expenses. Even if our revenue continues to increase, we expect that due to increased expenses, in particular, stock-based compensation, depreciation and amortization and provision for income taxes, we may incur a GAAP loss during future periods including the first quarter of 2015. If we fail to continue to grow our revenue and overall business, our operating results and business would be harmed.
We face competition in the market for online professional networks from social networking sites and Internet search companies, among others, as well as continued competition for customers.
We face significant competition in all aspects of our business, and we expect such competition to increase, particularly in the market for online professional networks and engagement of professionals.
Our industry is evolving rapidly and is becoming increasingly competitive. Larger and more established companies may focus on our market and could directly compete with us. Smaller companies, including application developers, could also launch new products and services that compete with us and that could gain market acceptance quickly. We may also face competition if we shift our focus of development to new or different products or separate areas of our business.
We expect our existing competitors in the markets for Talent Solutions, Marketing Solutions, Premium Subscriptions (including Sales Solutions) to continue to focus on these areas. A number of these companies may have greater resources than us, which may enable them to compete more effectively. Specifically, we are investing significantly in our Marketing Solutions products with respect to content and mobile solutions, and we may not be as
-23-
successful as our competitors in generating revenue through new forms of content marketing or mobile advertising. Additionally, users of social networks may choose to use, or increase their use of, those networks for professional purposes, which may result in those users decreasing or eliminating their use of LinkedIn. Companies that currently focus on social networking could also expand their focus to professionals. We and other companies have historically established alliances and relationships with some of these companies to allow broader exposure to users and access to data on the Internet. We may also, in the future, establish alliances or relationships with other competitors or potential competitors. To the extent companies terminate such relationships and establish alliances and relationships with others, our business could be harmed. Additionally, other companies that provide content for professionals could develop more compelling offerings than ours. This could impact the engagement of our members, and could also compete with our Premium Subscriptions and adversely impact our ability to sell and renew subscriptions to our members. Specifically, we compete for members, enterprises and professional organizations as discussed below.
Members-professional networks. The space for online professional networks is rapidly evolving. Other companies such as Facebook, Google, Microsoft and Twitter are developing or could develop solutions that compete with ours. Further, some of these companies are partnering with third parties to offer products and services that could compete with ours. Additionally, we face competition from a number of companies outside the United States that provide online professional networking solutions. We also compete against smaller companies that focus on groups of professionals within a specific industry or vertical. Our competitors may announce new products, services or enhancements that better address changing industry standards or the needs of members and customers, such as mobile access or different market focus. Any such increased competition could cause pricing pressure, loss of business or decreased member activity, any of which could adversely affect our business and operating results. Internet search engines could also change their methodologies in ways that adversely affect our ability to optimize our page rankings within their search results.
Enterprises and professional organizations-Talent Solutions. With respect to our Talent Solutions, we compete with online recruiting companies, talent management companies and larger companies that are focusing on talent management and human resource services, job boards and traditional recruiting firms. Additionally, other companies, including newcomers to the recruiting industry, may partner with Internet companies, including social networking companies, to provide services that compete with our solutions, either on their own or as third party applications. If the efficiency and usefulness of our products to enterprises and professional organizations do not exceed those provided by competitors, we will not be able to compete successfully.
Enterprises and professional organizations-Marketing Solutions. With respect to our Marketing Solutions, we compete with online and offline outlets that generate revenue from advertisers and marketers. To the extent competitors are better able to provide customers with cost-effective access to attractive demographics, either through new business models or increased user volume, we may not be successful in retaining our existing advertisers or attracting new advertisers, and our business would be harmed.
Enterprises and professional organizations-Premium Subscriptions/Sales Solutions. With respect to our Premium Subscriptions and Sales Solutions, we compete with online and offline companies for customers with lead generation and customer intelligence and insights. Our Sales Solutions product is in the early stages, and we may not be able to compete effectively in this area.
If we fail to effectively manage our growth, our business and operating results could be harmed.
We continue to experience rapid growth in our headcount and operations, which will continue to place significant demands on our management and our operational and financial infrastructure. As of December 31, 2014, approximately 37% of our employees had been with us for less than one year and approximately 62% for less than two years. As we continue to grow, we must effectively integrate, develop and motivate a large number of new employees in various countries around the world, and we must maintain the beneficial aspects of our corporate culture. We intend to continue to make substantial investments to expand our engineering, research and development, field sales, and general and administrative organizations, and our international operations. To attract top talent, we have had to offer, and believe we will need to continue to offer, highly competitive compensation packages before we can validate the productivity of those employees. In addition, fluctuations in the price of our Class A common stock may make it more difficult or costly to use equity compensation to motivate, incentivize and retain our employees. We face significant competition for talent from other Internet and high-growth companies, which include both publicly traded and privately-held companies. As we have transitioned from a private company to a public company, this competition has become even more acute in assessing appropriate compensation packages, particularly, determining the mix of cash and equity compensation. The risks of over-hiring (especially given overall
-24-
macroeconomic risks) or over-compensating employees and the challenges of integrating a rapidly growing employee base into our corporate culture are exacerbated by our international expansion. Additionally, because of our growth, we have significantly expanded our operating lease commitments, which have increased our expenses. We may not be able to hire new employees quickly enough to meet our needs. If we fail to effectively manage our hiring needs and successfully integrate our new hires, our efficiency and ability to meet our forecasts and our employee morale, productivity and retention could suffer, and our business and operating results could be adversely affected.
Additionally, if we do not effectively manage the growth of our business and operations, the quality of our solutions could suffer, which could negatively affect our brand, operating results and overall business. Further, we have made changes in the past, and will make changes in the future, to our features, products and services that our members or customers may not like, find useful or agree with. We may also decide to discontinue certain features, products or services, or charge for certain features, products or services that are currently free or increase fees for any of our features, products or services. If members or customers are unhappy with these changes, they may decrease their engagement on our site, or stop using features, products or services or the site generally. In addition, they may choose to take other types of action against us such as organizing petitions or boycotts focused on our company, our website or any of our services, filing claims with the government or other regulatory bodies, or filing lawsuits against us. Any of these actions could negatively impact our member growth and engagement and our brand, which would harm our business. To effectively manage this growth, we will need to continue to improve our operational, financial and management controls, and our reporting systems and procedures by, among other things:
• | improving our information technology infrastructure to maintain the effectiveness of our solutions; |
• | enhancing information and communication systems to ensure that our employees and offices around the world are well-coordinated and can effectively communicate with each other and our growing base of members, enterprises and professional organizations; |
• | enhancing our internal controls to ensure timely and accurate reporting of all of our operations; and |
• | appropriately documenting our information technology systems and our business processes. |
These systems enhancements and improvements will require significant capital expenditures and allocation of valuable management and employee resources. If we fail to implement these improvements effectively, our ability to manage our expected growth and comply with the rules and regulations that are applicable to publicly reporting companies will be impaired.
Our international operations account for a significant portion of our revenue and are subject to increased challenges and risks.
We have offices around the world and our websites and mobile applications are available in numerous languages. For the year ended December 31, 2014, international revenue represented 40% of our total revenue. We expect to continue to expand our international operations in the future, particularly in emerging markets, by opening offices in different countries and expanding our offerings in new languages. However, we have limited operating history as a company outside the United States, and our ability to manage our business and conduct our operations internationally including in emerging markets, requires considerable management attention and resources and is subject to the particular challenges of supporting a rapidly growing business in an environment of multiple languages, cultures, customs, legal systems, alternative dispute resolution systems, regulatory systems and commercial infrastructures. International expansion has required and will continue to require us to invest significant funds and other resources. Operating internationally subjects us to new risks and may increase risks that we currently face, including risks associated with:
• | recruiting and retaining talented and capable employees in foreign countries and maintaining our company culture across all of our offices; |
• | providing solutions across a significant distance, in different languages, in competitive market environments and among different cultures, including potentially modifying our, services, solutions and features to ensure that they are culturally relevant in different countries and conforming to local laws and regulations, which may include modifying or blocking content in certain jurisdictions if it is deemed objectionable or unlawful; |
• | increased competition from local websites and services, that provide online professional networking solutions, such as Germany-based Xing and France-based Viadeo, and online recruitment services, such as Australia-based Seek and Japan-based Recruit, which may benefit from first-mover advantages. These competitors have expanded and may continue to expand their geographic footprint; |
• | differing and potentially lower levels of member growth and activity in new and nascent geographies; |
-25-
• | compliance with applicable foreign laws and regulations, which may change or conflict with each other, as well as potential risk of penalties to individual members of management if our practices are deemed to be out of compliance; |
• | longer payment cycles in some countries; |
• | credit risk and higher levels of payment fraud; |
• | laws and regulations that favor local competitors or prohibit or limit foreign ownership of businesses; |
• | legal regimes where the application of laws and regulations is subject to greater uncertainty, as well as higher risk of corruption, fraud and unethical business practices; |
• | compliance with anti-bribery laws including, without limitation, compliance with the Foreign Corrupt Practices Act and the UK Anti-Bribery Act; |
• | implementing and maintaining effective internal processes and controls; |
• | compliance with various economic and trade sanctions regulations which restrict certain conduct of business; |
• | currency exchange rate fluctuations; |
• | foreign exchange controls that might prevent us from repatriating cash earned outside the United States; |
• | foreign exchange controls that might require significant lead time in setting up operations and bank accounts before monetizing our operations in certain geographic territories; |
• | political and economic instability in some countries; |
• | laws and proposed legislation relating to data localization in various countries, which may restrict our ability to do business in new and existing markets; |
• | double taxation of our non-U.S. earnings and potentially adverse tax consequences due to changes in the tax laws of the United States or the foreign jurisdictions in which we operate; and |
• | higher costs of doing business internationally. |
If our revenue from our international operations, and particularly from our operations in the countries and regions on which we have focused our spending, do not exceed the expense of establishing and maintaining these operations, our business and operating results will suffer. In addition, as our member base expands internationally, members in certain geographies may have lower levels of activity with our websites and services.
Finally, we recently established a joint venture to expand our operations in the People’s Republic of China ("PRC"), which is in its early stages. The PRC’s laws and regulations, as they apply to our business operations in Mainland China, have resulted in modifications to our products and services in Mainland China and subject us to additional privacy and security regulations. For example, the PRC government has laws and regulations that govern the dissemination of content over the Internet, and may enact additional laws or regulations in the future. Failure to comply with these requirements may mean that we will not obtain necessary licenses to operate in Mainland China, result in the blocking of our services in Mainland China, or lead to the loss of licenses to operate in Mainland China once we have obtained them. In addition, our compliance with these rules could harm our business, reputation and brand. We will need to allocate significant resources to developing our presence in China, and we may not be successful in doing so.
Our business depends on a strong and trusted brand, and any failure to maintain, protect and enhance our brand would hurt our ability to retain or expand our base of members, enterprises and professional organizations, our ability to increase their level of engagement and our ability to attract and retain high level employees.
We have developed a strong and trusted brand that we believe has contributed significantly to the success of our member network and business. Our brand is predicated on the idea that individual professionals will trust us and find immense value in building and maintaining their professional identities and reputations on our platform. Maintaining, protecting and enhancing the “LinkedIn,” “SlideShare” and related brands is critical to expanding our base of members, enterprises, advertisers, corporate customers and other partners, and increasing their engagement with our services, and will depend largely on our ability to maintain member trust, be a technology leader and continue to provide valuable and high-quality solutions, which we may not do successfully. Despite our efforts to protect our brand and prevent its misuse, if others misuse our brand or pass themselves off as being endorsed or affiliated with us, it could harm our reputation and our business could suffer. If our members or potential members determine that they can use other platforms, such as social networks, for the same purposes as or as a replacement for our network, or if they choose to blend their professional and social networking activities, our brand and our business could be harmed. Our members or customers could find that new products or features that we introduce are difficult to use or may feel that they degrade their experience with online service offered by LinkedIn, which could harm our reputation for delivering high-quality products. Our brand is also important in
-26-
attracting and maintaining high performing employees. If we do not successfully maintain a strong and trusted brand, our business could be harmed.
We may not be able to halt the operations of online services that aggregate our data as well as data from other companies, including social networks, or copycat online services that have misappropriated our data in the past or may misappropriate our data in the future. These activities could harm our brand and our business.
From time to time, third parties have accessed data from our networks through scraping, robots or other means and used this data or aggregated this data on their online services with other data. In addition, “copycat” online services have misappropriated data on our network and attempted to imitate our brand or the functionality of our services, and these services or others could use similar tactics to develop products that compete with ours. These activities could degrade our brand, negatively impact our website performance and harm our business. When we have become aware of such online services, in many instances we have employed contractual, technological or legal measures in an attempt to halt unauthorized activities, but these measures may not be successful. In addition, if our customers do not comply with our terms of service, they also may be able to abuse our products and services and provide access to our solutions to unauthorized users. However, we may not be able to detect any or all of these types of activities in a timely manner and, even if we could, technological and legal measures may be insufficient to stop their operations. In some cases, particularly in the case of online services operating from outside of the United States, our available legal remedies may not be adequate to protect our business against such activities. Regardless of whether we can successfully enforce our rights against these parties, any measures that we may take could require us to expend significant financial or other resources.
Failure to protect or enforce our intellectual property rights could harm our business and operating results.
We regard the protection of our trade secrets, copyrights, trademarks, trade dress, databases, domain names and patents as critical to our success. We strive to protect our intellectual property rights by relying on federal, state and common law rights and other rights provided under foreign laws. These laws are subject to change at any time and could further restrict our ability to protect our intellectual property. In addition, the existing laws of certain foreign countries in which we operate may not protect our intellectual property rights to the same extent as do the laws of the United States. We also have a practice of entering into confidentiality and invention assignment agreements with our employees and contractors, and often enter into confidentiality agreements with parties with whom we conduct business in order to limit access to, and disclosure and use of, our proprietary information. In addition, from time to time we make our intellectual property available to others under license agreements. However, these contractual arrangements and the other steps we have taken to protect our intellectual property may not prevent the misappropriation of our proprietary information, infringement of our intellectual property rights or deter independent development of similar or competing technologies by others and may not provide an adequate remedy in the event of such misappropriation or infringement.
Obtaining and maintaining effective intellectual property rights is expensive, including the costs of defending our rights. We are seeking to protect our trademarks and patents, and other intellectual property rights in a number of jurisdictions, a process that is expensive and may not be successful in all jurisdictions for every such right. Even where we have such rights, they may later be found to be unenforceable or have a limited scope of enforceability. In addition, we may not seek to pursue such protection in every location. In particular, we believe it is important to maintain, protect and enhance our brands, including “LinkedIn” and “SlideShare”. Accordingly, we pursue the registration of domain names and our trademarks and service marks in the United States and in many locations outside the United States. We have already and may, over time, increase our investment in protecting innovations through investments in patents and similar rights, and this process is expensive and time-consuming.
Litigation may be necessary to enforce our intellectual property rights, protect our proprietary rights or determine the validity and scope of proprietary rights claimed by others. Any litigation of this nature, regardless of outcome or merit, could result in substantial costs and diversion of management and technical resources, any of which could adversely affect our business and operating results. We may incur significant costs in enforcing our trademarks against those who attempt to imitate our “LinkedIn” brand and other valuable trademarks and service marks.
In addition, we have chosen to make certain of our technology available under open source licenses that allow others to use the technology without payment to us. While we hope to benefit from these activities by having access to others’ useful technology under open source licenses, there is no assurance that we will receive the business benefits we expect.
-27-
If we fail to maintain, protect and enhance our intellectual property rights, our business and operating results may be harmed, and the market price of our Class A common stock could decline.
We are, and expect in the future to be, subject to legal proceedings and litigation, including intellectual property and privacy disputes, which are costly to defend and could materially harm our business and operating results.
We are party to lawsuits and legal proceedings in the normal course of business. These matters are often expensive and disruptive to normal business operations. We are currently facing, or may face in the future, allegations, lawsuits and regulatory inquiries, audits and investigations regarding data privacy, security, labor and employment and intellectual property infringement, including claims related to privacy, patents, publicity, trademarks, copyrights and other rights. Litigation and regulatory proceedings, and particularly the patent infringement and class action matters we are facing or may face, may be protracted and expensive, and the results are difficult to predict. Certain of these matters include speculative claims for substantial or indeterminate amounts of damages, and include claims for injunctive relief. Additionally, our litigation costs are significant. Adverse outcomes with respect to litigation or any of these legal proceedings may result in significant settlement costs or judgments, penalties and fines, or require us to modify our products and features or require us to stop offering certain features, all of which could negatively impact our membership and revenue growth. Additionally, we are subject to mandatory periodic audits, which would likely increase our regulatory compliance costs, and may require us to change our business practices, which could negatively impact our revenue growth. Managing legal proceedings, litigation and audits, even if we achieve favorable outcomes, is time-consuming and diverts management’s attention from our business.
In addition, we use open source software in our solutions and plan to continue to use open source software in the future. The terms of many open source licenses have not been interpreted by United States or other courts, and these licenses could be construed in a manner that imposes unanticipated conditions or restrictions on our ability to commercialize our products. We may face claims from others claiming ownership of open source software, or breach of open source license terms, including a demand for release of material portions of our source code or otherwise seeking to enforce the terms of the applicable open source license. These claims could also result in litigation, which could be costly to defend, require us to purchase a costly license, require us to establish additional specific open source compliance procedures, or require us to devote additional research and development resources to remove open source elements from or otherwise change our solutions, any of which would have a negative effect on our business and operating results. In addition, if we were to combine our proprietary technology with open source software in a certain manner, we could, under certain open source licenses, be required to release the source code of our proprietary software which would have a material adverse effect on our business, results of operations or financial condition.
The results of regulatory proceedings, litigation, claims and audits cannot be predicted with certainty, and determining reserves for pending litigation and other legal, regulatory and audit matters requires significant judgment. There can be no assurance that our expectations will prove correct, and even if these matters are not resolved in our favor or without significant cash settlements, these matters, and the time and resources necessary to litigate or, resolve them, could harm our business, our operating results, our reputation or the market price of our Class A common stock.
If we do not continue to attract new customers, or if existing customers do not renew their subscriptions, renew on less favorable terms, or fail to purchase additional solutions, we may not achieve our revenue projections, and our operating results would be harmed.
In order to grow our business, we must continually attract new customers, sell additional solutions to existing customers and reduce the level of non-renewals in our business. Our ability to do so depends in large part on the success of our sales and marketing efforts. We do not typically enter into long-term contracts with our customers, and even when we do, they can generally terminate their relationship with us. We have limited historical data with respect to rates of customer renewals, upgrades and expansions, so we may not accurately predict future trends for any of these metrics. Furthermore, the nature of our products and solutions is such that customers may decide to terminate or not renew their agreements with us without causing significant disruptions to their own businesses.
We must demonstrate that our Talent Solutions are an important recruiting tool for enterprises and professional organizations and that our Marketing and Sales Solutions provide them with access to an audience of one of the most influential, affluent and highly educated audiences on the Internet. However, potential customers
-28-
may not be familiar with our solutions or may prefer other or more traditional products and services for their talent, advertising and marketing needs.
Our customer base and our customers’ renewal rates may decline or fluctuate because of several factors, including the prices of our solutions, the prices of products and services offered by our competitors, reduced hiring by our customers or reductions in their talent or marketing spending levels due to macroeconomic or other factors and the efficacy and cost-effectiveness of our solutions. If we do not attract new customers or if our customers do not renew their agreements for our solutions, renew on less favorable terms, or do not purchase additional functionality or offerings, our revenue may grow more slowly than expected or decline.
Ultimately, attracting new customers and retaining existing customers requires that we continue to provide high quality solutions that our customers value. In particular, our Talent Solutions customers will discontinue their purchases of our solutions if we fail to effectively connect them with the talent they seek, and our premium subscribers will discontinue their subscriptions if they do not find the networking and business opportunities that they value. Similarly, customers of our Marketing Solutions will not continue to do business with us if their advertisements do not reach their intended audiences. Therefore we must continue to demonstrate to our customers that using our Marketing Solutions is the most effective and cost-efficient way to maximize their results. Even if our Marketing Solutions are providing value to our customers, advertisers are sensitive to general economic downturns and reductions in consumer spending, among other events and trends, which generally results in reduced advertising expenditures and could adversely affect sales of our Marketing Solutions. In addition, we have recently expanded our Marketing Solutions products to include off-network advertising. This product area will complement our current offerings primarily sold on our wholly owned properties, and we may not be successful or our customers or members may not be receptive to these products. Finally, we are in the early stages of developing our Sales Solutions products which may not be successful. If we fail to provide high quality solutions and convince customers of our value proposition, we may not be able to retain existing customers or attract new customers, which would harm our business and operating results.
Because we recognize most of the revenue from our Talent Solutions and our Premium Subscriptions over the term of the agreement, a significant downturn in these businesses may not be immediately reflected in our operating results.
We recognize most of the revenue from sales of our Talent Solutions and Premium Subscriptions over the terms of the agreements, which is typically 12 months. As a result, a significant portion of the revenue we report in each quarter is generated from agreements entered into during previous quarters. Consequently, a decline in new or renewed agreements in any one quarter may not significantly impact our revenue in that quarter but will negatively affect our revenue in future quarters. In addition, we may be unable to adjust our fixed costs in response to reduced revenue. Accordingly, the effect of significant declines in the sales of these offerings may not be reflected in our short-term results of operations.
We depend on world class talent to grow and operate our business, and if we are unable to hire, retain and motivate our personnel, we may not be able to grow effectively.
Our future success will depend upon our continued ability to identify, hire, develop, motivate and retain world class talent. Our ability to execute efficiently is dependent upon contributions from all of our employees, in particular our senior management team. Key institutional knowledge remains with a small group of long-term employees whom we may not be able to retain. We may not be able to retain the services of any of our long-term employees or other members of senior management in the future. For example, two members of our executive team left the company in 2014. We do not have employment agreements other than offer letters with any key employee, and we do not maintain key person life insurance for any employee. In addition, from time to time, there may be changes in our senior management team that may be disruptive to our business. If our senior management team, including any new hires that we may make, fails to work together effectively and to execute our plans and strategies on a timely basis, our business could be harmed.
Our growth strategy also depends on our ability to expand and retain our organization with world class talent. Identifying, recruiting, training and integrating qualified individuals will require significant time, expense and attention. In addition to hiring new employees, we must continue to focus on retaining our best talent. Competition for these resources, particularly for engineers, is intense, and competition for the facilities to house our employees is also intense, specifically in the San Francisco Bay Area, where our headquarters is located. We may need to invest significant amounts of cash and equity for new employees and we may never realize returns on these investments, and we also are investing heavily in our facilities. If we are not able to effectively increase and retain
-29-
our talent, our ability to achieve our strategic objectives will be adversely impacted, and our business will be harmed.
We believe that our culture has the potential to be a key contributor to our success. In 2014, we increased the size of our workforce by more than 37% as compared to 2013, and we expect to continue to hire aggressively as we expand. If we do not continue to develop our corporate culture as we grow and evolve, including maintaining our culture of transparency with our employees, it could harm our ability to foster the innovation, creativity and teamwork we believe we need to support our growth. In addition, we completed our initial public offering in May 2011. As a result, employees who have been with us since that time (or prior to May 2011) have been able to and may continue to realize substantial financial gains in connection with the sales of their shares from the exercise of their vested options, which could result in a loss of employees. There will likely be disparities of wealth between those of our employees whom we hired prior to our initial public offering in May 2011 and those who joined us after we became a public company, which could adversely impact relations among employees and our culture in general.
The effectiveness of our Marketing Solutions depends in part on our relationships with advertising serving technology companies.
We rely, in part, on advertising serving technology companies to deliver our Marketing Solutions product. Our agreements with these companies may not be extended or renewed after their respective expirations, or we may not be able to extend or renew our agreements on terms and conditions favorable to us. If these agreements are terminated, we may not be able to enter into agreements with alternative companies on acceptable terms or on a timely basis or both, which could negatively impact revenue from our Marketing Solutions.
Enterprises or professional organizations, including governmental agencies, may restrict access to our services, which could lead to the loss or slowing of growth in our member base or the level of member engagement.
Our solutions depend on the ability of our members to access the Internet and our services. Enterprises or professional organizations, including governmental agencies, could block or restrict access to our online services, website or the Internet generally for a number of reasons such as security or confidentiality concerns or regulatory reasons, or they may adopt policies that prohibit listing the employers’ names on the employees’ LinkedIn profiles in order to minimize the risk that employees will be contacted and hired by other employers.
In some cases, certain governments may seek to restrict the Internet or our service providers’ websites, services and solutions and the performance of our websites, services and solutions could be suspended, blocked (in whole or part) or otherwise adversely impacted in these jurisdictions. For example, the government of the People’s Republic of China has blocked access to many social networking and other sites (including ours for a brief period), and certain self-regulatory organizations have policies that could result in access to our content, services or features being blocked. Any restrictions on the use of our services by our members and users could lead to the loss or slowing of growth in our member base or the level of member engagement.
If Internet search engines’ methodologies are modified or our search result page rankings decline for other reasons, our member and non-member engagement could decline.
We depend in part on various Internet search engines, such as Google, Bing and Yahoo!, to direct a significant amount of traffic to our website. Similarly, we depend on providers of mobile application “store fronts” to allow users to locate and download our mobile applications that enable our service. Our ability to maintain the number of visitors directed to our website and users of our online services is not entirely within our control. Our competitors’ search engine optimization, or SEO, efforts may result in their websites receiving a higher search result page ranking than ours, or Internet search engines could revise their methodologies in an attempt to improve their search results, which could adversely affect the placement of our search result page ranking. If search engine companies modify their search algorithms in ways that are detrimental to our new user growth or in ways that make it harder for our members to use our website, or if our competitors’ SEO efforts are more successful than ours, overall growth in our member base could slow, member and non-member engagement could decrease, and we could lose existing members. These modifications may be prompted by search engine companies entering the online professional networking market or aligning with competitors. Our website has experienced fluctuations in search result rankings in the past, and we anticipate similar fluctuations in the future. Any reduction in the number of users directed to our websites would harm our business and operating results.
-30-
Our business depends on continued and unimpeded access to the Internet by us and our members on personal computers and mobile devices. If government regulations relating to the Internet or other areas of our business change, if Internet access providers are able to block, degrade, or charge for access to certain of our products and services, or if third parties disrupt access to the Internet, we could incur additional expenses and the loss of members and customers.
Our products and services depend on the ability of our members and customers to access the Internet through their personal computers and mobile devices. Currently, this access is provided by companies that have significant market power in the broadband and Internet access marketplace, including incumbent telephone companies, cable companies, mobile communications companies, and government-owned service providers, any of whom could take actions that degrade, disrupt, or increase the cost of user access to our products or solutions, which would, in turn, negatively impact our business. In addition, Internet access could be disrupted by other third parties. Further, the adoption of any laws or regulations that adversely affect the growth, popularity or use of the Internet, including laws limiting Internet neutrality, could decrease the demand for our subscription service or the usage of our services and increase our cost of doing business.
Our growth depends in part on the success of our strategic relationships with third parties.
We anticipate that we will continue to depend on relationships with various third parties, including technology, access to platforms and content providers to grow our business. Identifying, negotiating and maintaining relationships with third parties requires significant time and resources, as does integrating third-party content and technology. Our agreements with technology and content providers and similar third parties are typically non-exclusive and do not prohibit them from working with our competitors or from offering competing services. In some cases, in particular, with respect to content providers, these relationships are undocumented, or, if there are agreements in place, they may be easily terminable. Our competitors may be effective in providing incentives to these parties to favor their solutions or may prevent us from developing strategic relationships with these parties. These third parties may decide that working with LinkedIn is not in their interest. In addition, these third parties may not perform as expected under our agreements with them, and we have had, and may in the future have, disagreements or disputes with these parties, which could negatively affect our brand and reputation. It is possible that these third parties may not be able to devote the resources we expect to the relationship or they may terminate their relationships with us. Further, as users increasingly access our services through mobile devices, we are becoming more dependent on the distribution of our mobile applications through third parties, and we may not be able to access their application program interfaces or be able to distribute our applications or provide ease of integration, and this may also impact our ability to monetize our mobile products. If we are unsuccessful in establishing or maintaining our relationships with third parties, our ability to compete in the marketplace or to grow our business could be impaired, and our operating results would suffer. Even if we are successful, these relationships may not result in improved operating results.
If currency exchange rates fluctuate substantially in the future, the results of our operations, which are reported in U.S. dollars, could be adversely affected.
As we continue to expand our international operations, we become more exposed to the effects of fluctuations in currency exchange rates. We incur expenses for employee compensation and other operating expenses at our non-U.S. locations in the local currency, and accept payment from customers in currencies other than the U.S. dollar. Since we conduct business in currencies other than U.S. dollars but report our financial results in U.S. dollars, we face exposure to fluctuations in currency exchange rates. Consequently, exchange rate fluctuations between the U.S. dollar and other currencies could have a material impact on our profitability, and because we recognize revenue over time, exchange rate fluctuations at one point in time may have a negative impact in future quarters. Although we hedge a portion of our foreign currency exposure, significant fluctuations in exchange rates between the U.S. dollar and foreign currencies may adversely affect our net income (loss). Additionally, hedging programs rely on our ability to forecast accurately and could expose us to additional risks that could adversely affect our financial condition and results of operations.
The intended tax efficiency of our corporate structure and intercompany arrangements depend on the application of the tax laws of various jurisdictions and on how we operate our business, and changes to our effective tax rate could adversely impact our results.
Our corporate structure and intercompany arrangements, including the manner in which we develop and use our intellectual property and the transfer pricing of our intercompany transactions, are intended to optimize business efficiency as well as reduce our worldwide effective tax rate. The application of the tax laws of various jurisdictions,
-31-
including the United States and the other jurisdictions in which we operate, to our international business activities is subject to interpretation and depends on our ability to operate our business in a manner consistent with our corporate structure and intercompany arrangements. The taxing authorities of the jurisdictions in which we operate may challenge our methodologies for valuing developed technology or for transfer pricing on intercompany arrangements. In particular, our non-U.S. headquarters is located in Dublin, Ireland, but tax authorities in other jurisdictions where we operate may make a determination that the manner in which we operate results in our business not achieving the intended tax consequences. This could increase our worldwide effective tax rate and harm our financial position and results of operations. Our effective tax rate could be adversely affected by several other factors, many of which are outside of our control, such as: increases in expenses that are not deductible for tax purposes, the tax effects of restructuring charges or purchase accounting for acquisitions, changes related to our ability to ultimately realize future benefits attributed to our deferred tax assets, including those related to other-than-temporary impairment, and a change in our decision to indefinitely reinvest foreign earnings. Further, we are currently undergoing review and audit by both domestic and foreign tax authorities and expect such actions to continue in the future. Any adverse outcome of such a review or audit could have a negative effect on our operating results and financial condition.
The enactment of legislation implementing changes in the U.S. taxation of international business activities, the adoption of other tax reform policies or changes in tax legislation or policies in jurisdictions outside the United States could materially impact our financial position and results of operations.
Members of the U.S. House of Representatives and the U.S. Senate have released draft proposals to reform the U.S. system for taxing cross-border income. Possible future changes to U.S. tax laws, including limitations on the ability of taxpayers to claim and utilize foreign tax credits and the deferral of certain tax deductions until earnings outside of the United States are repatriated to the United States, as well as changes to U.S. tax laws that may be enacted in the future, could impact the tax treatment of our foreign earnings and adversely impact our effective tax rate. Due to the large and expanding scale of our international business activities, any changes in the U.S. or international taxation of such activities may increase our worldwide effective tax rate and harm our financial position and results of operations.
The tax authorities in Ireland have announced changes to the treatment of non-resident Irish entities, commonly used in a “double Irish” structure. The changes will impact newly created Irish entities immediately but are not expected to impact existing non-resident Irish entities, such as ours, until after December 31, 2020. These changes may adversely impact our effective tax rate and harm our financial position and results of operations. The United Kingdom has also recently proposed new tax legislation on diverted profits which may ultimately impact our foreign tax liability and negatively impact our effective tax rate and results of operations.
Additionally, the Organisation for Economic Co-Operation and Development recently released draft guidance covering various topics, including addressing the “tax challenges of the digital economy,” country-by-country reporting, and definitional changes to permanent establishment, which could ultimately impact our tax liabilities to foreign jurisdictions and treatment of our foreign earnings from a U.S. perspective which may adversely impact our effective tax rate and harm our financial position and results of operations.
We may require additional capital to support business growth, and this capital might not be available on acceptable terms, if at all.
We intend to continue to make investments to support our business growth and may require additional funds to respond to business challenges, including the need to develop new features and products or enhance our existing solutions, improve our operating infrastructure or acquire complementary businesses and technologies. Accordingly, we have engaged and may continue to engage in equity or debt financings to secure additional funds. If we raise additional funds through future issuances of equity or convertible debt securities, our existing stockholders could suffer significant dilution, and any new equity securities we issue could have rights, preferences and privileges superior to those of holders of our Class A common stock. Any debt financing we secure in the future could involve restrictive covenants relating to our capital raising activities and other financial and operational matters, which may make it more difficult for us to obtain additional capital and to pursue business opportunities, including potential acquisitions. We may not be able to obtain additional financing on terms favorable to us, if at all. If we are unable to obtain adequate financing or financing on terms satisfactory to us when we require it, our ability to continue to support our business growth and to respond to business challenges could be significantly impaired, and our business may be harmed.
-32-
Acquisitions and investments could result in operating difficulties, dilution, and other harmful consequences that may adversely impact our business and results of operations.
We have made and will continue to make acquisitions to add employees, complementary companies, products, or technologies or revenue. These transactions could be material to our financial condition and results of operations. We also expect to continue to evaluate and enter into discussions regarding a wide array of potential strategic transactions. The identification of suitable acquisition candidates can be difficult, time-consuming and costly, and we may not be able to complete acquisitions on favorable terms, if at all. The process of integrating an acquired company, business, or technology has created, and will continue to create, unforeseen operating difficulties and expenditures. The areas where we face risks include:
• | loss of key employees of the acquired company and other challenges associated with integrating new employees into our culture, as well as reputational harm if integration is not successful; |
• | diversion of management time and focus from operating our business to acquisition integration challenges; |
• | implementation or remediation of controls, procedures, and policies at the acquired company; |
• | integration of the acquired company’s accounting, human resource, and other administrative systems, and coordination of product, engineering, and sales and marketing function; |
• | assumption of contractual obligations that contain terms that are not beneficial to us, require us to license or waive intellectual property rights or increase our risk for liability; |
• | failure to successfully further develop the acquired technology; |
• | liability for activities of the acquired company before the acquisition, including patent and trademark infringement claims, violations of laws, commercial disputes, tax liabilities, and other known and unknown liabilities; and |
• | failure to accurately forecast the financial impact of an acquisition transaction, including accounting charges. |
These risks or other problems encountered in connection with our acquisitions and investments could cause us to fail to realize the anticipated benefits of such acquisitions or investments, incur unanticipated liabilities, and adversely affect our business generally.
Future acquisitions could also result in dilutive issuances of our equity securities, the incurrence of debt, contingent liabilities, or amortization expenses, or write-offs of goodwill, any of which could harm our financial condition. In addition, any acquisitions we announce could be viewed negatively by users, marketers, developers or investors.
Risks Related to Our Class A Common Stock
The dual class structure of our common stock as contained in our charter documents has the effect of concentrating voting control with those stockholders who held our stock prior to our initial public offering, including our founders and our executive officers, employees and directors and their affiliates, and limiting our other stockholders’ ability to influence corporate matters.
Our Class B common stock has 10 votes per share, and our Class A common stock has one vote per share. Stockholders who hold shares of our Class B common stock, including our founders, and our executive officers, employees and directors and their affiliates, together held approximately 59.1% of the voting power of our outstanding capital stock as of December 31, 2014. Our co-founder and Chair, Reid Hoffman, held approximately 11.6% of the outstanding shares of our Class A and Class B common stock, representing approximately 54.3% of the voting power of our outstanding capital stock as of December 31, 2014. Mr. Hoffman has significant influence over the management and affairs of the company and over all matters requiring stockholder approval, including election of directors and significant corporate transactions, such as a merger or other sale of our company or its assets. Mr. Hoffman will continue to have significant influence over these matters for the foreseeable future.
In addition, the holders of our Class B common stock collectively will continue to be able to control all matters submitted to our stockholders for approval even though their stock holdings represent less than 50% of the outstanding shares of our common stock. Because of the 10-to-1 voting ratio between our Class B and Class A common stock, the holders of our Class B common stock collectively will continue to control a majority of the combined voting power of our common stock even when the shares of Class B common stock represent as little as 10% of the combined voting power of all outstanding shares of our Class A and Class B common stock. This
-33-
concentrated control will limit the ability of our Class A stockholders to influence corporate matters for the foreseeable future, and, as a result, the market price of our Class A common stock could be adversely affected.
Future transfers by holders of our Class B common stock will generally result in those shares converting to Class A common stock, which will have the effect, over time, of increasing the relative voting power of those holders of Class B common stock who retain their shares in the long term. If, for example, Mr. Hoffman retains a significant portion of his holdings of Class B common stock for an extended period of time, he could, in the future, continue to control a majority of the combined voting power of our Class A and Class B common stock. As a board member, Mr. Hoffman owes a fiduciary duty to our stockholders and must act in good faith in a manner he reasonably believes to be in the best interests of our stockholders. As a stockholder, even a controlling stockholder, Mr. Hoffman is entitled to vote his shares in his own interests, which may not always be in the interests of our stockholders generally.
Our stock price has been volatile in the past and may be subject to volatility in the future.
The trading price of our Class A common stock has been volatile historically, and could be subject to wide fluctuations in response to various factors, some of which are beyond our control. During 2014, the closing price of our Class A common stock ranged from $142.33 to $238.43. Fluctuations in the valuation of companies perceived by investors to be comparable to us or in valuation metrics, such as our price to earnings ratio, could impact our stock price. Additionally, the stock markets have at times experienced extreme price and volume fluctuations that have affected and might in the future affect the market prices of equity securities of many companies. These fluctuations have, in some cases, been unrelated or disproportionate to the operating performance of these companies. Further, the trading prices of publicly traded shares of companies in our industry have been particularly volatile and may be very volatile in the future. These broad market and industry fluctuations, as well as general economic, political and market conditions such as recessions, interest rate changes, international currency fluctuations or political unrest, may negatively impact the market price of our Class A common stock. Volatility in our stock price also impacts the value of our equity compensation, which affects our ability to recruit and retain employees. In addition, some companies that have experienced volatility in the market price of their stock have been subject to securities class action litigation. We may be the target of this type of litigation in the future. Securities litigation against us could result in substantial costs and divert our management’s attention from other business concerns, which could harm our business.
There may be a limited market for investors in our industry.
There are few publicly traded companies in the social and professional networking and related industries at this time, and we were among the first social networking companies to go public. Investors may have limited funds to invest in the social and professional networking sector, and as publicly traded securities in these industries become more available, investors who have purchased or may in the future purchase securities in this sector may choose to sell LinkedIn securities that they have already purchased in favor of other companies, and/or choose to invest in other companies, including our competitors. As a result, demand for our Class A common stock could decline, which would result in a corresponding decline in our stock price.
Anti-takeover provisions in our charter documents and under Delaware law could make an acquisition of us more difficult, limit attempts by our stockholders to replace or remove our current management and limit the market price of our Class A common stock.
Provisions in our amended and restated certificate of incorporation and amended and restated bylaws, may have the effect of delaying or preventing a change of control or changes in our management. Our certificate of incorporation and bylaws include provisions that:
• | authorize our board of directors to issue, without further action by the stockholders, up to 100,000,000 shares of undesignated preferred stock; |
• | require that any action to be taken by our stockholders be effected at a duly called annual or special meeting and not by written consent; |
• | specify that special meetings of our stockholders can be called only by our board of directors, the Chair of our board of directors, or our Chief Executive Officer; |
• | establish an advance notice procedure for stockholder proposals to be brought before an annual meeting, including proposed nominations of persons for election to our board of directors; |
• | establish that our board of directors is divided into three classes, Class I, Class II and Class III, with each class serving three-year staggered terms; |
• | prohibit cumulative voting in the election of directors; |
-34-
• | provide that our directors may be removed only for cause; |
• | provide that vacancies on our board of directors may be filled only by a majority of directors then in office, even though less than a quorum; |
• | require the approval of our board of directors or the holders of a supermajority of our outstanding shares of capital stock to amend our bylaws and certain provisions of our certificate of incorporation; and |
• | reflect two classes of common stock, as discussed above. |
These provisions may frustrate or prevent any attempts by our stockholders to replace or remove our current management by making it more difficult for stockholders to replace members of our board of directors, which is responsible for appointing the members of our management. Provisions in the indenture related to our convertible debt may also deter or prevent a business combination. In addition, institutional shareholder representative groups, shareholder activists and others may disagree with our corporate governance provisions or other practices, including our dual class structure and the other anti-takeover provisions, such as those listed above. We generally will consider recommendations of institutional shareholder representative groups, but we will make decisions based on what our board and management believe to be in the best long term interests of our company and stockholders. Our dual class structure concentrates the voting power of our stock in a small group of stockholders who would have the ability to control the outcome of a stockholder vote. Additionally, these groups could make recommendations to our stockholders against our practices or our board members if they disagree with our positions. Finally, because we are incorporated in Delaware, we are governed by the provisions of Section 203 of the Delaware General Corporation Law, which generally prohibits a Delaware corporation from engaging in any of a broad range of business combinations with any “interested” stockholder for a period of three years following the date on which the stockholder became an “interested” stockholder.
If securities or industry analysts publish reports that are interpreted negatively by the investment community or publish negative research reports about our business, our share price and trading volume could decline.
The trading market for our Class A common stock depends, to some extent, on the research and reports that securities or industry analysts publish about us or our business. We do not have any control over these analysts or the information contained in their reports. If one or more analysts publish research reports that are interpreted negatively by the investment community, or have a negative tone regarding our business, financial or operating performance, industry or end-markets, our share price could decline. In addition, if one or more of these analysts cease coverage of our company or fail to regularly publish reports on us, we could lose visibility in the financial markets, which could cause our share price or trading volume to decline.
We do not intend to pay dividends for the foreseeable future.
We have never declared or paid any cash dividends on our common stock and do not intend to pay any cash dividends in the foreseeable future. We anticipate that we will retain all of our future earnings for use in the development of our business and for general corporate purposes. Any determination to pay dividends in the future will be at the discretion of our board of directors. Accordingly, investors must rely on sales of their Class A common stock after price appreciation, which may never occur, as the only way to realize any future gains on their investments.
Risks Related to our Convertible Notes
Servicing our convertible notes may require a significant amount of cash, and we may not have sufficient cash flow or the ability to raise the funds necessary to satisfy our obligations under the convertible notes, and our future debt may contain limitations on our ability to pay cash upon conversion or repurchase of the convertible notes.
In November 2014, we issued approximately $1.3 billion aggregate principal amount of 0.50% convertible senior notes due 2019 (the "Notes"). As of December 31, 2014, we had a total par value of approximately $1.3 billion of outstanding Notes. Holders of the Notes will have the right to require us to repurchase all or a portion of their notes upon the occurrence of a fundamental change before the relevant maturity date, in each case at a repurchase price equal to 100% of the principal amount of the Notes, plus accrued and unpaid interest, if any, to the fundamental change repurchase date. In addition, upon conversion of the Notes, unless we elect to deliver solely shares of our common stock to settle such conversion (other than paying cash in lieu of delivering any fractional
-35-
shares), we will be required to make cash payments in respect of the Notes being converted. Moreover, we will be required to repay the Notes in cash at their maturity, unless earlier converted or repurchased.
Our ability to make cash payments in connection with conversions of the Notes or repurchase the Notes in the event of a fundamental change will depend on market conditions and our future performance, which is subject to economic, financial, competitive and other factors beyond our control. We also may not use the cash raised through the issuance of the Notes in an optimally productive and profitable manner. At the time we are required to make repurchases of the Notes being surrendered or converted at their maturity, we may not have enough available cash or be able to obtain financing to refinance the Notes on commercially reasonable terms or at all. Our level of indebtedness could adversely affect our future operations by increasing our vulnerability to adverse changes in general economic and industry conditions by limiting or prohibiting our ability to obtain additional financing for future capital expenditures, acquisitions and general corporate and other purposes. If we are unable to make cash payments upon conversion of the Notes we would be required to issue significant amounts of our Class A common stock, which would be dilutive to existing stockholders. In addition, if we do not have sufficient cash to repurchase the Notes following a fundamental change, we would be in default under the terms of the Notes, which could seriously harm our business. The terms of the Notes do not limit the amount of future indebtedness we may incur and if we incur significantly more debt, this could intensify the risks described above.
The conditional conversion feature of the Notes, if triggered, may adversely affect our financial condition and operating results.
In the event the conditional conversion feature of the Notes is triggered, holders of notes will be entitled to convert the notes at any time during specified periods at their option. If one or more holders elect to convert their Notes, unless we elect to satisfy our conversion obligation by delivering solely shares of our common stock (other than paying cash in lieu of delivering any fractional share), we would be required to settle a portion or all of our conversion obligation through the payment of cash, which could adversely affect our liquidity. In addition, even if holders do not elect to convert their Notes, we could be required under applicable accounting rules to reclassify all or a portion of the outstanding principal of the Notes as a current rather than long-term liability, which would result in a material reduction of our net working capital.
Note hedge and warrant transactions we have entered into may affect the value of the Notes and our common stock.
Concurrently with the issuance of the Notes, we entered into note hedge transactions with certain financial institutions, which we refer to as the “option counterparties.” The note hedge transactions are expected to reduce the potential dilution upon any conversion of the Notes and/or offset any cash payments we are required to make in excess of the principal amount of converted Notes, as the case may be. We also entered into warrant transactions with the option counterparties. However, the warrant transactions could separately have a dilutive effect to the extent that the market price per share of our common stock exceeds $381.82.
In connection with establishing their initial hedge of the note hedge and warrant transactions, the option counterparties or their respective affiliates have purchased shares of our common stock and/or entered into various derivative transactions with respect to our common stock following the pricing of the Notes. In addition, the option counterparties or their respective affiliates may modify their hedge positions by entering into or unwinding various derivatives contracts with respect to our common stock and/or purchasing or selling our common stock or other securities of ours in secondary market transactions prior to the maturity of the Notes (and are likely to do so during any observation period related to a conversion of Notes or following any repurchase of Notes by us on any fundamental change repurchase date or otherwise). This activity could cause or avoid an increase or a decrease in the market price of our common stock or the Notes.
In addition, if any such convertible note hedge and warrant transactions fail to become effective, the option counterparties or their respective affiliates may unwind their hedge positions with respect to our common stock, which could adversely affect the value of our common stock and the value of the Notes.
We are subject to counterparty risk with respect to the note hedge transactions.
The option counterparties are financial institutions or affiliates of financial institutions, and we will be subject to the risk that these option counterparties may default under the note hedge transactions. Our exposure to the credit risk of the option counterparties will not be secured by any collateral. If one or more of the option counterparties to one or more of our note hedge transactions becomes subject to insolvency proceedings, we will become an unsecured creditor in those proceedings with a claim equal to our exposure at the time under those transactions.
-36-
Our exposure will depend on many factors but, generally, the increase in our exposure will be correlated to the increase in the market price of our common stock and in the volatility of the market price of our common stock. In addition, upon a default by one of the option counterparties, we may suffer adverse tax consequences and dilution with respect to our common stock. We can provide no assurances as to the financial stability or viability of any of the option counterparties.
Item 1B. | Unresolved Staff Comments |
None.
Item 2. | Properties |
Our headquarters is located in Mountain View, California, where we lease approximately 373,000 square feet of office space under a lease that expires in 2023. We also lease office space of approximately 1,876,000 square feet in locations throughout the United States and approximately 634,000 square feet internationally, some of which is currently under construction. We own land in Mountain View, CA, and Dublin, Ireland, where we are building or are planning to build additional office space. In addition, we have data centers in the United States and Singapore pursuant to various lease agreements.
We believe that our current facilities are adequate to meet our current needs. We intend to expand our facilities or add new facilities as we add employees and enter new geographic markets, and we believe that suitable additional or alternative space will be available as needed to accommodate ongoing operations and any such growth.
Item 3. | Legal Proceedings |
We are subject to legal proceedings and litigation arising in the ordinary course of business, including, but not limited to, certain pending patent and privacy matters, including class action lawsuits, as well as inquiries, investigations, audits and other regulatory proceedings. Although occasional adverse decisions or settlements may occur, we do not believe that the final disposition of any of these matters will have a material adverse effect on our business. Certain of these matters include speculative claims for substantial or indeterminate amounts of damages, and include claims for injunctive relief. Additionally, our litigation costs are significant. Other regulatory matters could result in fines and penalties being assessed against us, and we may become subject to mandatory periodic audits, which would likely increase our regulatory compliance costs. Adverse results of litigation or regulatory matters could also result in us being required to change our business practices, which could negatively impact our membership and revenue growth.
We record a liability when we believe that it is both probable that a loss has been incurred and the amount can be reasonably estimated. Periodically, we evaluate developments in our legal matters that could affect the amount of liability that has been previously accrued, if any, and make adjustments as appropriate. Significant judgment is required to determine both likelihood of there being, and the estimated amount of, a loss related to such matters, and our judgment may be incorrect. The outcome of any proceeding is not determinable in advance. Until the final resolution of any such matters that we may be required to accrue for, we may be exposed to loss in excess of the amount accrued, and such amounts could be material.
Item 4. | Mine Safety Disclosures |
Not applicable.
-37-
PART II
Item 5. | Market for Registrant’s Common Equity, Related Stockholder Matters and Issuer Purchases of Equity Securities |
Our Class A common stock is listed on the New York Stock Exchange (“NYSE”) under the symbol “LNKD.” There is no public trading market for our Class B common stock. The following table sets forth the high and low sales price per share of our Class A common stock as reported on the NYSE for the periods indicated:
2014 | 2013 | ||||||||||||||
High | Low | High | Low | ||||||||||||
First Quarter | $ | 234.48 | $ | 178.25 | $ | 184.15 | $ | 109.80 | |||||||
Second Quarter | 190.00 | 136.02 | 202.91 | 160.20 | |||||||||||
Third Quarter | 232.28 | 153.31 | 257.56 | 177.26 | |||||||||||
Fourth Quarter | 243.25 | 187.61 | 254.20 | 207.33 | |||||||||||
On December 31, 2014, the last reported stock price of our Class A common stock on the NYSE was $229.71. As of December 31, 2014, we had 97 holders of record of our Class A common stock and 25 holders of record of our Class B common stock. The actual number of stockholders is greater than this number of record holders, and includes stockholders who are beneficial owners, but whose shares are held in street name by brokers and other nominees. This number of holders of record also does not include stockholders whose shares may be held in trust by other entities.
We have never declared or paid, and do not anticipate declaring or paying, any cash dividends on our capital stock. Any future determination as to the declaration and payment of dividends, if any, will be at the discretion of our board of directors and will depend on then existing conditions, including our financial condition, operating results, contractual restrictions, capital requirements, business prospects and other factors our board of directors may deem relevant.
Performance Graph
This performance graph shall not be deemed “soliciting material” or to be “filed” with the Securities and Exchange Commission for purposes of Section 18 of the Securities Exchange Act of 1934, as amended, or the Exchange Act, or otherwise subject to the liabilities under that Section, and shall not be deemed to be incorporated by reference into any filing of LinkedIn Corporation under the Securities Act of 1933, as amended, or the Exchange Act.
The following graph shows a comparison from May 19, 2011 (the date our common stock commenced trading on the NYSE), through December 31, 2014, of the cumulative total returns for our Class A common stock, the NASDAQ Composite Index and the RDG Internet Composite Index. Such returns are based on historical results and are not intended to suggest future performance. Data for the NASDAQ Composite Index and the RDG Internet Composite Index assume reinvestment of dividends.
-38-
COMPARISON OF 44 MONTH CUMULATIVE TOTAL RETURN
Among LinkedIn Corporation, the NASDAQ Composite Index, and the RDG Internet Composite Index
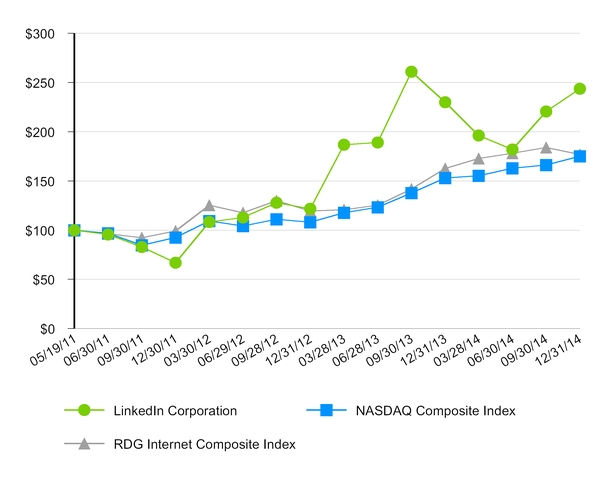
Period Ending | |||||||||||||||||||||||||||||||||||||||||||||||
Index | 5/19/2011 | 6/30/2011 | 9/30/2011 | 12/31/2011 | 3/31/2012 | 6/30/2012 | 9/30/2012 | 12/31/2012 | 3/28/2013 | 6/28/2013 | 9/30/2013 | 12/31/2013 | 3/28/2014 | 6/30/2014 | 9/30/2014 | 12/31/2014 | |||||||||||||||||||||||||||||||
LinkedIn Corporation | 100.00 | 95.59 | 82.84 | 66.85 | 108.21 | 112.75 | 127.75 | 121.82 | 186.80 | 189.18 | 261.07 | 230.06 | 196.22 | 181.93 | 220.47 | 243.72 | |||||||||||||||||||||||||||||||
NASDAQ Composite Index | 100.00 | 96.74 | 84.67 | 92.45 | 109.39 | 104.19 | 111.16 | 107.94 | 117.70 | 123.27 | 137.75 | 152.95 | 155.35 | 162.95 | 166.23 | 175.13 | |||||||||||||||||||||||||||||||
RDG Internet Composite Index | 100.00 | 96.25 | 92.28 | 99.15 | 125.24 | 117.63 | 129.81 | 119.54 | 120.80 | 125.35 | 141.71 | 162.77 | 172.72 | 178.05 | 183.89 | 176.78 | |||||||||||||||||||||||||||||||
-39-
Issuer Purchases of Equity Securities
The following table provides information with respect to repurchases of unvested shares of our Class B common stock made pursuant the 2003 Plan during the three months ended December 31, 2014. No shares of our Class A common stock were repurchased during the period.
Period | Total Number of Shares Purchased (1) | Weighted Average Price Paid Per Share | Total Number of Shares Purchased as Part of Publicly Announced Plans or Programs | Maximum Number of Shares That May Yet Be Purchased Under the Plans or Programs | |||||||||
October 1 - October 31, 2014 | 15 | $ | 14.46 | — | — | ||||||||
November 1 - November 30, 2014 | — | — | — | — | |||||||||
December 1 - December 31, 2014 | — | — | — | — | |||||||||
Total | 15 | $ | 14.46 | — | |||||||||
__________________
(1) | Under the 2003 Plan, participants may exercise options prior to vesting, subject to a right of a repurchase by us. All shares in the above table were shares repurchased as a result of us exercising this right and not pursuant to a publicly announced plan or program. |
Item 6. | Selected Financial Data |
The following selected historical consolidated financial data should be read in conjunction with Item 7, “Management’s Discussion and Analysis of Financial Condition and Results of Operations,” our consolidated financial statements, and the related notes under Item 8 “Financial Statements and Supplementary Data” of this Annual Report on Form 10-K to fully understand factors that may affect the comparability of the information presented below.
The consolidated statements of operations data for the years ended December 31, 2014, 2013 and 2012 and the consolidated balance sheet data as of December 31, 2014 and 2013 are derived from our audited consolidated financial statements appearing under Item 8 “Financial Statements and Supplementary Data” of this Annual Report on Form 10-K. The consolidated statements of operations data for the years ended December 31, 2011 and 2010 and the consolidated balance sheet data as of December 31, 2012, 2011 and 2010 are derived from audited consolidated financial statements not included in this report. Our historical results are not necessarily indicative of future results.
-40-
Year Ended December 31, | |||||||||||||||||||
2014 | 2013 | 2012 | 2011 | 2010 | |||||||||||||||
(in thousands, except per share data) | |||||||||||||||||||
Consolidated Statements of Operations Data: | |||||||||||||||||||
Net revenue | $ | 2,218,767 | $ | 1,528,545 | $ | 972,309 | $ | 522,189 | $ | 243,099 | |||||||||
Costs and expenses: | |||||||||||||||||||
Cost of revenue (exclusive of depreciation and amortization shown separately below) | 293,797 | 202,908 | 125,521 | 81,448 | 44,826 | ||||||||||||||
Sales and marketing | 774,411 | 522,100 | 324,896 | 164,703 | 58,978 | ||||||||||||||
Product development | 536,184 | 395,643 | 257,179 | 132,222 | 65,104 | ||||||||||||||
General and administrative | 341,294 | 225,566 | 128,002 | 74,871 | 35,064 | ||||||||||||||
Depreciation and amortization | 236,946 | 134,516 | 79,849 | 43,100 | 19,551 | ||||||||||||||
Total costs and expenses | 2,182,632 | 1,480,733 | 915,447 | 496,344 | 223,523 | ||||||||||||||
Income from operations | 36,135 | 47,812 | 56,862 | 25,845 | 19,576 | ||||||||||||||
Other income (expense), net | (4,930 | ) | 1,416 | 252 | (2,903 | ) | (610 | ) | |||||||||||
Income before income taxes | 31,205 | 49,228 | 57,114 | 22,942 | 18,966 | ||||||||||||||
Provision for income taxes | 46,525 | 22,459 | 35,504 | 11,030 | 3,581 | ||||||||||||||
Net income (loss) | (15,320 | ) | 26,769 | 21,610 | 11,912 | 15,385 | |||||||||||||
Accretion of redeemable noncontrolling interest | (427 | ) | — | — | — | — | |||||||||||||
Net income (loss) attributable to common stockholders | $ | (15,747 | ) | $ | 26,769 | $ | 21,610 | $ | 11,912 | $ | 3,429 | ||||||||
Net income (loss) per share attributable to common stockholders: | |||||||||||||||||||
Basic | $ | (0.13 | ) | $ | 0.24 | $ | 0.21 | $ | 0.15 | $ | 0.08 | ||||||||
Diluted | $ | (0.13 | ) | $ | 0.23 | $ | 0.19 | $ | 0.11 | $ | 0.07 | ||||||||
Weighted-average shares used to compute net income (loss) per share attributable to common stockholders: | |||||||||||||||||||
Basic | 122,800 | 113,643 | 105,166 | 77,185 | 42,446 | ||||||||||||||
Diluted | 122,800 | 118,944 | 112,844 | 104,118 | 46,459 | ||||||||||||||
Other Financial and Operational Data: | |||||||||||||||||||
Adjusted EBITDA (1) | $ | 592,214 | $ | 376,243 | $ | 223,030 | $ | 98,713 | $ | 47,959 | |||||||||
Number of registered members (at period end) | 346,731 | 276,842 | 201,912 | 144,974 | 90,437 | ||||||||||||||
(1) | We define adjusted EBITDA as net income (loss), plus: provision for income taxes; other (income) expense, net; depreciation and amortization; and stock-based compensation. See “Adjusted EBITDA” below for more information and for a reconciliation of adjusted EBITDA to net income (loss), the most directly comparable financial measure calculated and presented in accordance with U.S. generally accepted accounting principles, or GAAP. |
Stock-based compensation included in the consolidated statements of operations data above was as follows:
-41-
Year Ended December 31, | |||||||||||||||||||
2014 | 2013 | 2012 | 2011 | 2010 | |||||||||||||||
(in thousands) | |||||||||||||||||||
Cost of revenue | $ | 28,617 | $ | 15,600 | $ | 6,416 | $ | 1,678 | $ | 439 | |||||||||
Sales and marketing | 60,166 | 36,187 | 17,726 | 8,074 | 1,225 | ||||||||||||||
Product development | 154,856 | 98,861 | 46,026 | 13,625 | 3,248 | ||||||||||||||
General and administrative | 75,494 | 43,267 | 16,151 | 6,391 | 3,920 | ||||||||||||||
Total stock-based compensation | $ | 319,133 | $ | 193,915 | $ | 86,319 | $ | 29,768 | $ | 8,832 | |||||||||
As of December 31, | |||||||||||||||||||
2014 | 2013 | 2012 | 2011 | 2010 | |||||||||||||||
(in thousands) | |||||||||||||||||||
Consolidated Balance Sheet Data: | |||||||||||||||||||
Cash and cash equivalents | $ | 460,887 | $ | 803,089 | $ | 270,408 | $ | 339,048 | $ | 92,951 | |||||||||
Marketable securities | 2,982,422 | 1,526,212 | 479,141 | 238,456 | — | ||||||||||||||
Property and equipment, net | 740,909 | 361,741 | 186,677 | 114,850 | 56,743 | ||||||||||||||
Working capital | 3,239,315 | 2,113,479 | 603,418 | 499,268 | 66,734 | ||||||||||||||
Total assets | 5,427,257 | 3,352,793 | 1,382,330 | 873,697 | 238,188 | ||||||||||||||
Convertible senior notes, net | 1,081,553 | — | — | — | — | ||||||||||||||
Redeemable noncontrolling interest | 5,427 | 5,000 | — | — | — | ||||||||||||||
Redeemable convertible preferred stock | — | — | — | — | 87,981 | ||||||||||||||
Convertible preferred stock | — | — | — | — | 15,846 | ||||||||||||||
Total stockholders’ equity | 3,325,392 | 2,629,394 | 908,424 | 624,979 | 36,249 | ||||||||||||||
Adjusted EBITDA
To provide investors with additional information regarding our financial results, we disclose adjusted EBITDA, a non-GAAP financial measure, in the table below and within this Annual Report on Form 10-K. The following table presents a reconciliation of adjusted EBITDA to net income (loss), the most directly comparable GAAP financial measure.
We include adjusted EBITDA in this Annual Report on Form 10-K because it is a key measure used by our management and board of directors to understand and evaluate our core operating performance and trends, to prepare and approve our annual budget and to develop short- and long-term operational plans. In particular, the exclusion of certain expenses in calculating adjusted EBITDA can provide a useful measure for period-to-period comparisons of our core business. Additionally, adjusted EBITDA is a key financial measure used by the compensation committee of our board of directors in connection with the payment of bonuses to our executive officers and employees. Accordingly, we believe that adjusted EBITDA provides useful information to investors and others in understanding and evaluating our operating results in the same manner as our management and board of directors.
Our use of adjusted EBITDA has limitations as an analytical tool, and you should not consider it in isolation or as a substitute for analysis of our results as reported under GAAP. Some of these limitations are:
• | although depreciation and amortization are non-cash charges, the assets being depreciated and amortized may have to be replaced in the future, and adjusted EBITDA does not reflect cash capital expenditure requirements for such replacements or for new capital expenditure requirements; |
• | adjusted EBITDA does not reflect changes in, or cash requirements for, our working capital needs; |
• | adjusted EBITDA does not consider the potentially dilutive impact of stock-based compensation; |
• | adjusted EBITDA does not reflect tax payments that may represent a reduction in cash available to us; and |
• | other companies, including companies in our industry, may calculate adjusted EBITDA differently, which reduces its usefulness as a comparative measure. |
-42-
Because of these limitations, you should consider adjusted EBITDA alongside other financial performance measures, including various cash flow metrics, net income (loss) and our other GAAP results. The following table presents a reconciliation of adjusted EBITDA for each of the periods indicated:
Year Ended December 31, | |||||||||||||||||||
2014 | 2013 | 2012 | 2011 | 2010 | |||||||||||||||
(in thousands) | |||||||||||||||||||
Reconciliation of Adjusted EBITDA: | |||||||||||||||||||
Net income (loss) | $ | (15,320 | ) | $ | 26,769 | $ | 21,610 | $ | 11,912 | $ | 15,385 | ||||||||
Provision for income taxes | 46,525 | 22,459 | 35,504 | 11,030 | 3,581 | ||||||||||||||
Other (income) expense, net | 4,930 | (1,416 | ) | (252 | ) | 2,903 | 610 | ||||||||||||
Depreciation and amortization | 236,946 | 134,516 | 79,849 | 43,100 | 19,551 | ||||||||||||||
Stock-based compensation | 319,133 | 193,915 | 86,319 | 29,768 | 8,832 | ||||||||||||||
Adjusted EBITDA | $ | 592,214 | $ | 376,243 | $ | 223,030 | $ | 98,713 | $ | 47,959 | |||||||||
-43-
Item 7. | Management’s Discussion and Analysis of Financial Condition and Results of Operations |
This section and other parts of this Annual Report on Form 10-K contain forward-looking statements that involve risks and uncertainties. Forward-looking statements can also be identified by words such as “anticipates,” “expects,” “believes,” “plans,” “predicts,” and similar terms. Forward-looking statements are not guarantees of future performance and the Company’s actual results may differ significantly from the results discussed in the forward-looking statements. Factors that might cause such differences include, but are not limited to, those discussed in the subsection entitled “Risk Factors” above, which are incorporated herein by reference.
You should read the following discussion in conjunction with the consolidated financial statements and notes thereto included under Item 8 “Financial Statements and Supplementary Data” of this Annual Report on Form 10-K. All information presented herein is based on the Company’s fiscal calendar. Unless otherwise stated, references in this report to particular years or quarters refer to the Company’s fiscal years ended December 31 of the applicable year and the associated quarters of those fiscal years. The Company assumes no obligation to revise or update any forward-looking statements for any reason, except as required by law.
Overview
We are the world’s largest professional network on the Internet with approximately 347 million members in over 200 countries and territories. We believe we are the most extensive, accurate and accessible network focused on professionals. We seek to create value for members by connecting them to the most important people, knowledge, and opportunities in their professional lives. Our members create the core of our platform, and we, in turn, provide members with applications and tools to help them more effectively manage their careers to achieve their full potential.
In 2014, we continued to experience both revenue growth and increased levels of member activity and platform growth compared to the same periods in 2013. With respect to our platform, we continue to increase the value we deliver to members and increase our network of registered members as we continue to introduce new and expanded product offerings and expand our international presence. With respect to monetization, our net revenue was $2,218.8 million in 2014, which represented an increase of 45% from 2013. Our future growth will depend, in part, on our ability to continue to increase our member base and create value for our members, as well as continuing to expand our product offerings on both mobile and desktop devices and international presence, which we believe will result in increased sales of our Talent Solutions, Marketing Solutions and Premium Subscriptions to new and existing customers. As our net revenue increases, we expect our net revenue growth rate to continue to decrease over time. Also, given the large scale and critical mass of our network, we believe growth in member activity and network growth, as measured by our key metrics, will continue to decelerate over time and that this could impact the growth of portions of our business.
In November 2014, we issued $1,322.5 million aggregate principal amount of 0.50% convertible senior notes due 2019 (the "Notes"). The total net proceeds from this offering, after deducting initial purchasers' discount and debt issuance costs, were approximately $1,305.3 million. Concurrently with the issuance of the Notes, we used approximately $248.0 million of the net proceeds of the offering of the Notes to pay the cost of convertible note hedge transactions, which was partially offset by $167.3 million in proceeds from warrants we sold.
In 2015, our philosophy is to continue to invest for long-term growth and we expect to continue to invest heavily in the following:
• | Talent. We expect to increase our workforce, which will result in an increase in headcount-related expenses, including stock-based compensation expense. As of December 31, 2014, we had 6,897 employees, which represented an increase of 37% compared to the prior year end. |
• | Technology. We expect to continue to make significant capital expenditures to upgrade our technology and network infrastructure to improve the ability of our website to handle expected increases in usage, to enable the release of new features and solutions, and to scale for future growth. |
• | Product. We expect to continue to invest heavily in our product development efforts, specifically around mobile, to enable our members and customers to derive more value from our platform. For example, in 2014, the Company launched Sponsored Updates in Marketing Solutions and the next generation of Sales Navigator in Premium Subscriptions, both of which are available on mobile devices. Mobile continues to be the fastest growing channel for member engagement, growing at nearly three times the rate of overall site traffic. We internally track and define traffic in terms of the average number of members who have visited |
-44-
LinkedIn.com on either mobile or desktop devices at least once during a month. Mobile unique visiting members represented 46% of unique visiting members in 2014.
• | Monetization. We expect to continue to aggressively expand our field sales organization to market our solutions both in the United States and internationally. |
As a result of our investment philosophy, we do not expect to be profitable on a U.S. generally accepted accounting principles (“GAAP”) basis in 2015.
Key Metrics
We regularly review a number of metrics, including the following key metrics, to evaluate our business, measure our performance, identify trends affecting our business, formulate financial projections and make strategic decisions.
• | Number of Registered Members. We define the number of registered members in our network as the number of individual users who have created a member profile on LinkedIn.com as of the date of measurement. We believe the number of registered members is an indicator of the growth of our network and our ability to receive the benefits of the network effects resulting from such growth. Growth in our member base depends, in part, on our ability to successfully develop and market our solutions to professionals who have not yet become members of our network. Member growth will also be contingent on our ability to translate our offerings into additional languages, create more localized products in certain key markets, and more broadly expand our member base internationally. We believe that a higher number of registered members will result in increased sales of our Talent Solutions, Marketing Solutions and Premium Subscriptions, as customers will have access to a larger pool of professional talent. However, a higher number of registered members will not immediately increase sales, nor will a higher number of registered members in a given region immediately increase sales in that region, as growth of sales and marketing activities generally takes more time to develop than membership growth. |
The following table presents the number of registered members as of the periods presented by geographic region:
December 31, | December 31, | ||||||||||||||||
2014 | 2013 | % Change | 2013 | 2012 | % Change | ||||||||||||
(in thousands, except percentages) | |||||||||||||||||
Members by geographic region: | |||||||||||||||||
United States | 111,422 | 94,115 | 18 | % | 94,115 | 73,633 | 28 | % | |||||||||
Other Americas (1) | 59,658 | 47,646 | 25 | % | 47,646 | 32,746 | 46 | % | |||||||||
Total Americas | 171,080 | 141,761 | 21 | % | 141,761 | 106,379 | 33 | % | |||||||||
EMEA (2) | 110,654 | 85,656 | 29 | % | 85,656 | 60,020 | 43 | % | |||||||||
APAC (3) | 64,997 | 49,425 | 32 | % | 49,425 | 35,513 | 39 | % | |||||||||
Total number of registered members (4) | 346,731 | 276,842 | 25 | % | 276,842 | 201,912 | 37 | % | |||||||||
______________________
(1) | Canada, Latin America and South America |
(2) | Europe, the Middle East and Africa (“EMEA”) |
(3) | Asia-Pacific (“APAC”) |
(4) | The number of registered members is higher than the number of actual members due to various factors. For more information, see “Risk Factors—The number of our registered members is higher than the number of actual members and a substantial majority of our traffic is generated by a minority of our members. Our business may be adversely impacted if we are unable to attract and retain additional members who actively use our services.” |
The number of our registered members increased by 25% in 2014 compared to 2013, and by 37% in 2013 compared to 2012. Over these same periods, the growth rate in our net revenue exceeded the growth rate of our number of registered members. While growth in the number of registered members is an important indicator of expected revenue growth, it also informs our management’s decisions with respect to those areas of our business that will require further investment to support expected future membership growth. For example, as the number of registered members increases, we will need to increase our capital expenditures to improve our information
-45-
technology infrastructure to maintain the effectiveness of our solutions and the performance of our website for our members.
• | Unique Visiting Members. In the second quarter of 2014, we transitioned to disclosing our internal measure of unique visiting members, which we track and define as the total number of members who have visited LinkedIn.com on desktop and mobile at least once during the month. Historically, we disclosed unique visitors based on data provided by comScore, a leading provider of digital marketing intelligence. comScore defines unique visitors as users who have visited our desktop website (which excludes mobile visitors) at least once during a month, regardless of whether they are members. We believe our internal measure of unique visiting members is a more relevant measure of engagement on our website, particularly with the increase in engagement on mobile devices. We will no longer be disclosing unique visitors from comScore and prior period comparisons reflect our internal measure of unique visiting members. We view unique visiting members as a key indicator of growth in our brand awareness among members and whether we are delivering members' value by continuing to improve our product offerings. Higher levels of member traffic contribute to building a larger pool of professional talent and a richer data ecosystem, which is our key monetizable asset. We leverage these assets both indirectly and directly to grow sales within Talent Solutions, Marketing Solutions and Premium Subscriptions. Growth in unique visiting members will be driven by growth in the number of registered members, improvements to features and products that drive traffic to our website and international expansion. |
The following table presents the average monthly number of unique visiting members during the periods presented:
Year Ended December 31, | Year Ended December 31, | ||||||||||||||||
2014 | 2013 | % Change | 2013 | 2012 | % Change | ||||||||||||
(in thousands) | (in thousands) | ||||||||||||||||
Unique visiting members (1), (3) | 87,222 | 73,147 | 19 | % | 73,147 | 52,834 | 38 | % | |||||||||
Mobile unique visiting members (2), (3) | 40,050 | 26,521 | 51 | % | 26,521 | 12,265 | 116 | % | |||||||||
______________________
(1) | Members who have visited LinkedIn.com on their desktops and/or LinkedIn.com/LinkedIn flagship app on their mobile devices. |
(2) | Members who have visited LinkedIn.com and/or LinkedIn flagship app on their mobile devices. |
(3) | We track unique visiting members using internal tools, which are subject to various risks. For more information, see “Risk Factors—The tracking of certain of our performance metrics is done with internal tools and is not independently verified. Certain of our performance metrics are subject to inherent challenges in measurement, and real or perceived inaccuracies in such metrics may harm our reputation and negatively affect our business.” |
• | Member Page Views. In the second quarter of 2014, we transitioned to disclosing our internal measure of page views, which we track and define as the total number of page views on LinkedIn.com for desktop and mobile that members view during the measurement period. Historically, we disclosed page views based on data provided by comScore, which defines page views as the number of pages on our desktop website (which excludes mobile page views) that users view during the measurement period, regardless of whether they are members. We believe our internal measure of page views is a more relevant measure of engagement on our website, particularly with the increase in engagement on mobile devices. We will no longer be disclosing page views from comScore and prior period comparisons reflect our internal measure of member page views. Similar to unique visiting members, we believe member page views is a key indicator of whether our members are deriving increased value from our solutions. We expect growth in member page views will be driven, in part, by growth in the number of registered members, improvements in products and features that drive member traffic to our website, and international expansion. However, member page views may not capture all of the value that our members and other users derive from our solutions because part of the benefit of certain products and features is that the member does not need to visit our website to receive value from our platform. For example, members can respond to InMails they receive from other members without accessing their LinkedIn account or our website. In addition, mobile page views may be lower than they would otherwise be on desktop because a well-designed mobile app reduces the number of clicks and pages a user touches in order to create a high quality mobile experience. |
-46-
The following table presents the number of member page views during the periods presented:
Year Ended December 31, | Year Ended December 31, | ||||||||||||||||
2014 | 2013 | % Change | 2013 | 2012 | % Change | ||||||||||||
(in millions) | (in millions) | ||||||||||||||||
Member page views (1), (2) | 109,110 | 82,990 | 31 | % | 82,990 | 50,964 | 63 | % | |||||||||
______________________
(1) | These metrics include member page views on LinkedIn.com for desktop and LinkedIn.com/LinkedIn flagship app for mobile. |
(2) | We track page views using internal tools, which are subject to various risks. For more information, see “Risk Factors—The tracking of certain of our performance metrics is done with internal tools and is not independently verified. Certain of our performance metrics are subject to inherent challenges in measurement, and real or perceived inaccuracies in such metrics may harm our reputation and negatively affect our business.” |
• | Number of LinkedIn Corporate Solutions Customers. We define the number of LinkedIn Corporate Solutions ("LCS") customers as the number of enterprises and professional organizations that we have under active contracts for our LCS products as of the date of measurement. Our LCS products include LinkedIn Recruiter, Job Slots, LinkedIn Recruitment Media and LinkedIn Career Pages, which are all part of Talent Solutions. LCS products do not include LinkedIn Jobs or Subscriptions. LCS customers have historically purchased through our field sales channel, which represents approximately 75% of Talent Solutions revenue. We believe the number of LCS customers is an indicator of our market penetration in the online recruiting market and the value that our products bring to both large and small enterprises and professional organizations. |
The following table presents the number of LCS customers as of the periods presented:
December 31, | December 31, | ||||||||||||||||
2014 | 2013 | % Change | 2013 | 2012 | % Change | ||||||||||||
LCS customers | 33,271 | 24,444 | 36 | % | 24,444 | 16,409 | 49 | % | |||||||||
The number of LCS customers increased by 36% in 2014 compared to 2013, and by 49% in 2013 compared to 2012. During these periods, we experienced an increase in net revenue from sales of our Talent Solutions (as further described in “Results of Operations” below), which was, and continues to be, positively impacted by increases in the number of our customers that have purchased our LCS products.
• | Sales Channel Mix. Depending on the specific product, we sell our Talent Solutions and Marketing Solutions offline through our field sales organization or online on our website. The majority of our Premium Subscriptions are sold online on our website; however, with the launch of our new Sales Navigator in 2014, and our increasing investment in a Sales Solutions field sales team, we expect that the portion of Premium Subscriptions revenue derived from our field sales channel will increase over time. Our field sales organization uses a direct sales force to solicit customers and agencies. This offline channel is characterized by a longer sales cycle where price can be negotiated, higher relative average selling prices, longer contract terms, higher selling expenses and a longer cash collection cycle compared to our online channel. |
Our online, or self-service, sales channel allows members to purchase solutions directly on our website. Members can purchase Premium Subscriptions as well as certain lower priced products in our Talent Solutions and Marketing Solutions, such as job postings and self-service advertising. This channel is characterized by lower average selling prices and higher cancellations compared to our offline channel, lower selling costs due to our automated payments platform and a highly liquid collection cycle.
-47-
The following table presents our net revenue by field sales and online sales:
Year Ended December 31, | ||||||||||||||||||||
2014 | 2013 | 2012 | ||||||||||||||||||
($ in thousands) | ||||||||||||||||||||
Field sales | $ | 1,349,804 | 61 | % | $ | 891,458 | 58 | % | $ | 552,459 | 57 | % | ||||||||
Online sales | 868,963 | 39 | % | 637,087 | 42 | % | 419,850 | 43 | % | |||||||||||
Net revenue | $ | 2,218,767 | 100 | % | $ | 1,528,545 | 100 | % | $ | 972,309 | 100 | % | ||||||||
Adjusted EBITDA
To provide investors with additional information regarding our financial results, we disclose adjusted EBITDA, a non-GAAP financial measure, within this Annual Report on Form 10-K. The following table presents a reconciliation of adjusted EBITDA to net income, the most directly comparable U.S. GAAP financial measure.
We include adjusted EBITDA in this Annual Report on Form 10-K because it is a key measure used by our management and board of directors to understand and evaluate our core operating performance and trends, to prepare and approve our annual budget and to develop short- and long-term operational plans. In particular, the exclusion of certain expenses in calculating adjusted EBITDA can provide a useful measure for period-to-period comparisons of our core business. Additionally, adjusted EBITDA is a key financial measure used by the compensation committee of our board of directors in connection with the payment of bonuses to our executive officers and employees. Accordingly, we believe that adjusted EBITDA provides useful information to investors and others in understanding and evaluating our operating results in the same manner as our management and board of directors.
For additional information on the limitations of adjusted EBITDA, see “Adjusted EBITDA” in Item 6 “Selected Financial Data” for more information.
Year Ended December 31, | |||||||||||
2014 | 2013 | 2012 | |||||||||
(in thousands) | |||||||||||
Reconciliation of Adjusted EBITDA: | |||||||||||
Net income (loss) | $ | (15,320 | ) | $ | 26,769 | $ | 21,610 | ||||
Provision for income taxes | 46,525 | 22,459 | 35,504 | ||||||||
Other (income) expense, net | 4,930 | (1,416 | ) | (252 | ) | ||||||
Depreciation and amortization | 236,946 | 134,516 | 79,849 | ||||||||
Stock-based compensation | 319,133 | 193,915 | 86,319 | ||||||||
Adjusted EBITDA | $ | 592,214 | $ | 376,243 | $ | 223,030 | |||||
Results of Operations
The following tables set forth our results of operations for the periods presented as a percentage of net revenue for those periods. The period-to-period comparison of financial results is not necessarily indicative of future results.
-48-
Year Ended December 31, | ||||||||
2014 | 2013 | 2012 | ||||||
(as a percentage of net revenue) | ||||||||
Consolidated Statements of Operations Data: (1) | ||||||||
Net revenue | 100 | % | 100 | % | 100 | % | ||
Costs and expenses: | ||||||||
Cost of revenue (exclusive of depreciation and amortization shown separately below) | 13 | 13 | 13 | |||||
Sales and marketing | 35 | 34 | 33 | |||||
Product development | 24 | 26 | 26 | |||||
General and administrative | 15 | 15 | 13 | |||||
Depreciation and amortization | 11 | 9 | 8 | |||||
Total costs and expenses | 98 | 97 | 94 | |||||
Income from operations | 2 | 3 | 6 | |||||
Other income (expense), net | — | — | — | |||||
Income before income taxes | 1 | 3 | 6 | |||||
Provision for income taxes | 2 | 1 | 4 | |||||
Net income (loss) | (1 | ) | 2 | 2 | ||||
Accretion of redeemable noncontrolling interest | — | — | — | |||||
Net income (loss) attributable to common stockholders | (1 | )% | 2 | % | 2 | % | ||
______________________
(1) Certain items may not total due to rounding.
Net Revenue
We generate revenue from Talent Solutions, Marketing Solutions and Premium Subscriptions.
Talent Solutions. Revenue from Talent Solutions is derived primarily from providing access to the LinkedIn Recruiter product and job postings. We provide access to our professional database of both active and passive job candidates with LinkedIn Recruiter, which allows corporate recruiting teams to identify candidates based on industry, job function, geography, experience/education, and other specifications. Revenue from the LinkedIn Recruiter product is recognized ratably over the subscription period, which consists primarily of annual subscriptions that are billed monthly, quarterly, or annually. We also earn revenue from the placement of job postings on our website, which generally run for 30 days. Independent recruiters can pay to post job openings that are accessible through job searches or targeted job matches. Revenue from job postings is recognized as the posting is displayed or at the expiration of the contract period, if unutilized.
Marketing Solutions. Revenue from Marketing Solutions is earned from the display of advertisements (both graphic and text link) on our website primarily based on a cost per advertisement model. Revenue from Internet advertising is recognized as the online advertisements are displayed on our website. The typical duration of our advertising contracts is approximately two months.
Premium Subscriptions. Revenue from Premium Subscriptions is derived primarily from selling various online subscriptions to customers that allow users to have further access to premium services on LinkedIn.com. We also include revenue from our Sales Solutions products, which also includes solutions sold through our field sales channel. We offer our members monthly or annual subscriptions. Revenue from Premium Subscriptions is recognized ratably over the contract period, which is generally one to 12 months.
In the second quarter of 2014, recruitment media products were reclassified from Marketing Solutions to Talent Solutions as they are generally sold to Talent Solutions customers. Accordingly, prior period amounts have been recast to conform to the current period presentation. Recruitment media revenue was $72.2 million, $50.6 million and $23.0 million in 2014, 2013 and 2012, respectively.
-49-
Year Ended December 31, | Year Ended December 31, | ||||||||||||||||||||
2014 | 2013 | % Change | 2013 | 2012 | % Change | ||||||||||||||||
($ in thousands) | |||||||||||||||||||||
Net revenue by product: | |||||||||||||||||||||
Talent Solutions | $ | 1,327,737 | $ | 910,257 | 46 | % | $ | 910,257 | $ | 546,585 | 67 | % | |||||||||
Marketing Solutions | 454,500 | 311,777 | 46 | % | 311,777 | 235,275 | 33 | % | |||||||||||||
Premium Subscriptions | 436,530 | 306,511 | 42 | % | 306,511 | 190,449 | 61 | % | |||||||||||||
Total | $ | 2,218,767 | $ | 1,528,545 | 45 | % | $ | 1,528,545 | $ | 972,309 | 57 | % | |||||||||
Percentage of net revenue by product: (1) | |||||||||||||||||||||
Talent Solutions | 60 | % | 60 | % | 60 | % | 56 | % | |||||||||||||
Marketing Solutions | 20 | % | 20 | % | 20 | % | 24 | % | |||||||||||||
Premium Subscriptions | 20 | % | 20 | % | 20 | % | 20 | % | |||||||||||||
Total | 100 | % | 100 | % | 100 | % | 100 | % | |||||||||||||
______________________
(1) Certain items may not total due to rounding.
Total net revenue increased $690.2 million in 2014 compared to 2013. Net revenue from our Talent Solutions increased $417.5 million as a result of increased spending by existing customers as well as generating business from new customers, as evidenced by the 36% increase in the number of LCS customers as of December 31, 2014 compared to December 31, 2013. Net revenue from our Marketing Solutions increased $142.7 million primarily due to the increase in revenue of $113.3 million from the introduction of Sponsored Updates in our field sales and self-service channels, which was launched in the third quarter of 2013, and to a lesser extent, revenue of $22.9 million from our current acquisition of Bizo, Inc. Sponsored Updates represented approximately one-third of Marketing Solutions revenue in 2014, and we expect it to continue to represent a larger percentage of Marketing Solutions revenue as we continue to gain traction in our shift to content marketing. Net revenue from our Premium Subscriptions increased $130.0 million primarily due to the increase in revenue of $59.4 million from our Sales Solutions products, which include Sales Navigator. Our Sales Solutions products continue to grow at a higher rate than our other Premium Subscription products as well as continue to represent a larger percentage of total Premium Subscriptions revenue. Sales Navigator represented approximately one-quarter of Premium Subscriptions revenue in 2014. In addition, the increase is a result of an increase in the number of premium subscribers due to a higher number of members and member engagement. Specifically, the number of registered members is a meaningful metric in evaluating and understanding net revenue from our Premium Subscriptions because an increase in the number of registered members has historically led to a proportionate increase in the number of premium subscribers.
Total net revenue increased $556.2 million in 2013 compared to 2012. Net revenue from our Talent Solutions increased $363.7 million as a result of further market penetration of our LCS product, as evidenced by the 49% increase in the number of LCS customers as of December 31, 2013 compared to December 31, 2012. Net revenue from our Marketing Solutions increased $76.5 million due to higher sales volume by our field sales and self-service advertising solutions and higher average advertising prices. The increase in sales volume is driven by higher user engagement, which is positively impacted by increases in the number of our registered members, and can be measured, in part, by page views on our website. Net revenue from our Premium Subscriptions increased $116.1 million as a result of an increase in the number of premium subscribers due to increases in member engagement. In addition, although still in their early stages in 2013, our Sales Solutions products, which are included in Premium Subscriptions and include Sales Navigator, continued to grow at a faster rate than our other Premium Subscription products as well as continued to represent a larger percentage of total Premium Subscriptions revenue.
-50-
The following table presents our net revenue by geographic region:
Year Ended December 31, | Year Ended December 31, | ||||||||||||||||||||
2014 | 2013 | % Change | 2013 | 2012 | % Change | ||||||||||||||||
($ in thousands) | ($ in thousands) | ||||||||||||||||||||
Net revenue by geographic region: | |||||||||||||||||||||
United States | $ | 1,333,978 | $ | 942,122 | 42 | % | $ | 942,122 | $ | 619,485 | 52 | % | |||||||||
Other Americas (1) | 143,207 | 109,672 | 31 | % | 109,672 | 66,099 | 66 | % | |||||||||||||
Total Americas | 1,477,185 | 1,051,794 | 40 | % | 1,051,794 | 685,584 | 53 | % | |||||||||||||
EMEA (2) | 554,567 | 358,244 | 55 | % | 358,244 | 217,342 | 65 | % | |||||||||||||
APAC (3) | 187,015 | 118,507 | 58 | % | 118,507 | 69,383 | 71 | % | |||||||||||||
Total | $ | 2,218,767 | $ | 1,528,545 | 45 | % | $ | 1,528,545 | $ | 972,309 | 57 | % | |||||||||
______________________
(1) | Canada, Latin America and South America |
(2) | Europe, the Middle East and Africa (“EMEA”) |
(3) | Asia-Pacific (“APAC”) |
International revenue increased $298.4 million in 2014 compared to 2013, and $233.6 million in 2013 compared to 2012. International revenue represented 40%, 38% and 36% of total revenue in 2014, 2013 and 2012, respectively. The increase in international revenue is due to the expansion of our sales, technical and support operations in international locations and growth in our international member base due to developing our brand across various geographies. We expect international revenue to increase on an absolute basis and as a percentage of total revenue in 2015 as we continue to expand our sales force in key international markets where member engagement supports business efforts at scale.
The following table presents our net revenue by geography, by product:
Year Ended December 31, | Year Ended December 31, | ||||||||||||||||||||
2014 | 2013 | % Change | 2013 | 2012 | % Change | ||||||||||||||||
($ in thousands) | ($ in thousands) | ||||||||||||||||||||
Net revenue by geography, by product: | |||||||||||||||||||||
United States | |||||||||||||||||||||
Talent Solutions | $ | 809,560 | $ | 582,928 | 39 | % | $ | 582,928 | $ | 369,577 | 58 | % | |||||||||
Marketing Solutions | 272,179 | 179,983 | 51 | % | 179,983 | 138,141 | 30 | % | |||||||||||||
Premium Subscriptions | 252,239 | 179,211 | 41 | % | 179,211 | 111,767 | 60 | % | |||||||||||||
Total United States revenue | $ | 1,333,978 | $ | 942,122 | 42 | % | $ | 942,122 | $ | 619,485 | 52 | % | |||||||||
International | |||||||||||||||||||||
Talent Solutions | $ | 518,177 | $ | 327,329 | 58 | % | $ | 327,329 | $ | 177,008 | 85 | % | |||||||||
Marketing Solutions | 182,321 | 131,794 | 38 | % | 131,794 | 97,134 | 36 | % | |||||||||||||
Premium Subscriptions | 184,291 | 127,300 | 45 | % | 127,300 | 78,682 | 62 | % | |||||||||||||
Total International revenue | $ | 884,789 | $ | 586,423 | 51 | % | $ | 586,423 | $ | 352,824 | 66 | % | |||||||||
Total | $ | 2,218,767 | $ | 1,528,545 | 45 | % | $ | 1,528,545 | $ | 972,309 | 57 | % | |||||||||
-51-
Cost of Revenue
Our cost of revenue primarily consists of salaries, benefits and stock-based compensation for our production operations, customer support, infrastructure and advertising operations teams and web hosting costs related to operating our website. Credit card processing fees, sales taxes, allocated facilities costs and other supporting overhead costs are also included in cost of revenue. We also expect higher expenses from off-network advertising associated with Marketing Solutions products in 2015 in connection with our acquisition of Bizo, Inc. Consistent with our investment philosophy for 2015, we expect cost of revenue to increase on an absolute basis and remain relatively flat as a percentage of revenue.
Year Ended December 31, | Year Ended December 31, | ||||||||||||||||||||
2014 | 2013 | % Change | 2013 | 2012 | % Change | ||||||||||||||||
($ in thousands) | |||||||||||||||||||||
Cost of revenue | $ | 293,797 | $ | 202,908 | 45 | % | $ | 202,908 | $ | 125,521 | 62 | % | |||||||||
Percentage of net revenue | 13 | % | 13 | % | 13 | % | 13 | % | |||||||||||||
Headcount (at period end) | 1,043 | 793 | 32 | % | 793 | 497 | 60 | % | |||||||||||||
Cost of revenue increased $90.9 million in 2014 compared to 2013. The increase was primarily attributed to increases in headcount related expenses of $47.7 million as we continue to hire to support the growth of our business, other direct costs of $15.7 million (primarily consisting of credit card processing fees), web hosting service expenses of $13.7 million, and facilities and related costs of $11.8 million.
Cost of revenue increased $77.4 million in 2013 compared to 2012. The increase was primarily attributed to increases in headcount related expenses of $36.5 million as we continue to hire to support the growth of our business, web hosting service expenses of $21.8 million, other direct costs of $9.1 million (primarily consisting of credit card processing fees), and facilities and related costs of $8.7 million.
Sales and Marketing
Our sales and marketing expenses primarily consist of salaries, benefits, stock-based compensation, travel expense and incentive compensation for our sales and marketing employees. In addition, sales and marketing expenses include customer acquisition marketing, branding, advertising, public relations costs, and commissions paid to agencies, as well as allocated facilities and other supporting overhead costs. We plan to continue to invest heavily in sales and marketing to expand our global footprint, grow our current customer accounts and continue building brand awareness. Consistent with our investment philosophy for 2015, we expect sales and marketing expenses to increase on an absolute basis and remain relatively flat as a percentage of revenue.
Year Ended December 31, | Year Ended December 31, | ||||||||||||||||||||
2014 | 2013 | % Change | 2013 | 2012 | % Change | ||||||||||||||||
($ in thousands) | |||||||||||||||||||||
Sales and marketing | $ | 774,411 | $ | 522,100 | 48 | % | $ | 522,100 | $ | 324,896 | 61 | % | |||||||||
Percentage of net revenue | 35 | % | 34 | % | 34 | % | 33 | % | |||||||||||||
Headcount (at period end) | 2,989 | 2,159 | 38 | % | 2,159 | 1,468 | 47 | % | |||||||||||||
Sales and marketing expenses increased $252.3 million in 2014 compared to 2013. The increase was primarily attributed to an increase in headcount related expenses of $204.9 million as we continue to expand our field sales organization globally. We also experienced increases in facilities and related costs of $19.7 million, consulting services of $11.7 million, marketing and public relations expenses of $9.0 million, and agency commissions of $3.6 million.
Sales and marketing expenses increased $197.2 million in 2013 compared to 2012. The increase was primarily attributed to an increase in headcount related expenses of $152.2 million as we continue to expand our field sales organization. We also experienced increases in agency commissions of $17.8 million, facilities and related costs of $16.6 million, consulting services of $6.8 million and marketing and public relations expenses of $2.6 million.
-52-
Product Development
Our product development expenses primarily consist of salaries, benefits and stock-based compensation for our engineers, product managers and developers. In addition, product development expenses include outside services and consulting, as well as allocated facilities and other supporting overhead costs. We believe that continued investment in features, software development tools and code modification is important to achieving our strategic objectives. Consistent with our investment philosophy for 2015, we expect to continue to invest heavily in product development; therefore, we expect product development expense to increase on an absolute basis and remain relatively flat as a percentage of revenue.
Year Ended December 31, | Year Ended December 31, | ||||||||||||||||||||
2014 | 2013 | % Change | 2013 | 2012 | % Change | ||||||||||||||||
($ in thousands) | |||||||||||||||||||||
Product development | $ | 536,184 | $ | 395,643 | 36 | % | $ | 395,643 | $ | 257,179 | 54 | % | |||||||||
Percentage of net revenue | 24 | % | 26 | % | 26 | % | 26 | % | |||||||||||||
Headcount (at period end) | 1,795 | 1,378 | 30 | % | 1,378 | 1,025 | 34 | % | |||||||||||||
Product development expenses increased $140.5 million in 2014 compared to 2013. The increase was primarily attributed to an increase in headcount related expenses of $124.0 million as a result of our focus on developing new features and products that create value for our members. We also experienced increases in facilities and related costs of $13.6 million and web hosting service expenses of $2.8 million.
Product development expenses increased $138.5 million in 2013 compared to 2012. The increase was primarily attributed to an increase in headcount related expenses of $128.6 million as a result of our focus on developing new features and products to encourage member growth and engagement. We also experienced increases in facilities and related costs of $5.8 million, and web hosting service expenses of $3.3 million.
General and Administrative
Our general and administrative expenses primarily consist of salaries, benefits and stock-based compensation for our executive, finance, legal, information technology, human resources and other administrative employees. In addition, general and administrative expenses include outside consulting, legal and accounting services, and facilities and other supporting overhead costs not allocated to other departments. Consistent with our investment philosophy for 2015, we expect general and administrative expenses to increase on an absolute basis and remain relatively flat as a percentage of revenue. In particular, we anticipate that costs related to legal proceedings will increase, and we expect to continue to be subject to increasing litigation and compliance requirements.
Year Ended December 31, | Year Ended December 31, | ||||||||||||||||||||
2014 | 2013 | % Change | 2013 | 2012 | % Change | ||||||||||||||||
($ in thousands) | |||||||||||||||||||||
General and administrative | $ | 341,294 | $ | 225,566 | 51 | % | $ | 225,566 | $ | 128,002 | 76 | % | |||||||||
Percentage of net revenue | 15 | % | 15 | % | 15 | % | 13 | % | |||||||||||||
Headcount (at period end) | 1,070 | 715 | 50 | % | 715 | 468 | 53 | % | |||||||||||||
General and administrative expenses increased $115.7 million in 2014 compared to 2013. The increase was primarily attributed to an increase in headcount related expenses of $83.4 million to support our overall growth. We also experienced increases in legal and consulting services of $13.9 million, primarily due to increasing litigation and compliance costs, facilities and related costs of $10.4 million, and bad debt expense of $6.7 million.
General and administrative expenses increased $97.6 million in 2013 compared to 2012. The increase was primarily a result of an increase in headcount related expenses of $66.8 million to support our overall growth. We also experienced increases in legal and consulting services of $20.4 million, primarily due to increasing litigation and compliance costs, facilities and related costs of $5.0 million, and bad debt expense of $4.8 million.
-53-
Depreciation and Amortization
Depreciation and amortization expenses primarily consist of depreciation on computer equipment, software, leasehold improvements, capitalized software development costs and amortization of purchased intangibles. We expect that depreciation and amortization expenses will increase on an absolute basis and remain relatively flat as percentage of revenue as we continue to expand our technology and facilities infrastructure.
Year Ended December 31, | Year Ended December 31, | ||||||||||||||||||||
2014 | 2013 | % Change | 2013 | 2012 | % Change | ||||||||||||||||
($ in thousands) | |||||||||||||||||||||
Depreciation and amortization | $ | 236,946 | $ | 134,516 | 76 | % | $ | 134,516 | $ | 79,849 | 68 | % | |||||||||
Percentage of net revenue | 11 | % | 9 | % | 9 | % | 8 | % | |||||||||||||
Depreciation and amortization expenses increased $102.4 million in 2014 compared to 2013. The increase in depreciation expense of $84.2 million was the result of the build out of our data centers, increases in leasehold improvements as we lease additional facilities to accommodate our headcount growth, and increases in capitalized website and internal-use software. The increase in amortization expense of $18.2 million was primarily the result of amortization of developed technology from our recent acquisitions.
Depreciation and amortization expenses increased $54.7 million in 2013 compared to 2012. The increase in depreciation expense of $48.1 million was primarily a result of our continued investment in expanding our technology infrastructure in order to support continued growth in our member base, and to a lesser extent, increases in amortization of acquired intangible assets of $6.5 million.
Other Income (Expense), Net
Other income (expense), net consists primarily of the interest expense from our Notes, income earned on our investments, and foreign exchange gains and losses. Hedging strategies that we have implemented or may implement to mitigate foreign exchange risk may not eliminate our exposure to foreign exchange fluctuations. We expect interest expense to increase on an absolute basis and as a percentage of revenue for 2015 as we recently issued our Notes in November 2014.
Year Ended December 31, | |||||||||||
2014 | 2013 | 2012 | |||||||||
(in thousands) | |||||||||||
Interest income | $ | 4,971 | $ | 2,895 | $ | 1,025 | |||||
Interest expense | (6,797 | ) | — | — | |||||||
Net loss on foreign exchange and foreign currency derivative contracts | (3,284 | ) | (1,626 | ) | (672 | ) | |||||
Net realized gain on sales of marketable securities | 117 | 127 | 60 | ||||||||
Other non-operating income (expense), net | 63 | 20 | (161 | ) | |||||||
Total other income (expense), net | $ | (4,930 | ) | $ | 1,416 | $ | 252 | ||||
Other income (expense), net decreased $6.3 million in 2014 compared to 2013 primarily due to interest expense related to our Notes. Other income, net increased $1.2 million in 2013 compared to 2012 primarily due to interest earned on higher investment balances, offset by foreign currency exchange losses.
Provision for Income Taxes
Provision for income taxes consists of federal and state income taxes in the United States and income taxes in certain foreign jurisdictions. See Note 13, Income Taxes, of the Notes to the Consolidated Financial Statements under Item 8 for additional information. We expect that our provision for income taxes may equal or exceed income before taxes in 2015.
Year Ended December 31, | Year Ended December 31, | ||||||||||||||||||||
2014 | 2013 | % Change | 2013 | 2012 | % Change | ||||||||||||||||
($ in thousands) | |||||||||||||||||||||
Provision for income taxes | $ | 46,525 | $ | 22,459 | 107 | % | $ | 22,459 | $ | 35,504 | (37 | )% | |||||||||
-54-
Income tax expense increased $24.1 million in 2014 compared to 2013. The effective tax rates as of December 31, 2014 and December 31, 2013 were 149% and 46%, respectively. The increase in year-over-year effective tax rates was primarily due to increased foreign losses for which deferred tax assets have not been recognized and the 2012 Federal Research and Experimentation credit, which was included in the 2013 tax benefit. The increase in foreign losses is due primarily to research and development expenses growing at a faster rate than international revenue. International research and development expenses include costs charged by LinkedIn Corporation pursuant to U.S. Treasury Regulations and guidelines from the Organisation for Economic Co-operation and Development ("OECD").
Income tax expense decreased $13.0 million in 2013 compared to 2012. The effective tax rates as of December 31, 2013 and December 31, 2012 were 46% and 62%, respectively. The decrease in year-over-year effective tax rates was primarily due to the benefit from the 2012 and 2013 Federal Research and Experimentation credit offset by increased non-deductible acquisition related expenses and increased foreign losses for which deferred tax assets have not been recognized. The increase in foreign losses is due primarily to research and development expenses which grew internationally at a rate which was higher than the growth rate of international revenues. International research and development expenses include costs charged by LinkedIn Corporation pursuant to U.S. Treasury Regulations and guidelines from the OECD.
On December 19, 2014, the President signed into law the Tax Increase Prevention Act of 2014 (the "2014 Act"). Under prior law, a taxpayer was entitled to a research tax credit for qualifying amounts paid or incurred on or before December 31, 2013. The 2014 Act extended the research credit for one year to December 31, 2014. The extension of the research credit was retroactive and includes amounts paid or incurred after December 31, 2013. As a result of the retroactive extension, we recognized a tax benefit of $15.5 million in the fourth quarter of 2014 for qualifying amounts incurred in 2014. The federal research credit has not been extended to new research activities incurred after December 31, 2014. We will therefore not have a similar favorable impact to our effective tax rate in 2015 unless new legislation is passed which will provide a credit for qualifying amounts generated in 2015.
Quarterly Results of Operations Data
The following tables set forth our unaudited quarterly consolidated statements of operations data and our unaudited statements of operations data as a percentage of net revenue for each of the eight quarters ended December 31, 2014. We have prepared the quarterly data on a consistent basis with the audited consolidated financial statements included in this Annual Report on Form 10-K. In the opinion of management, the financial information reflects all necessary adjustments, consisting only of normal recurring adjustments, necessary for a fair presentation of this data. This information should be read in conjunction with the audited consolidated financial statements and related notes included under Item 8 of this Annual Report on Form 10-K. The results of historical periods are not necessarily indicative of the results of operations for a full year or any future period.
-55-
For the Three Months Ended | |||||||||||||||||||||||||||||||
Dec 31, 2014 | Sep 30, 2014 | Jun 30, 2014 | Mar 31, 2014 | Dec 31, 2013 | Sep 30, 2013 | Jun 30, 2013 | Mar 31, 2013 | ||||||||||||||||||||||||
(in thousands, except per share data) | |||||||||||||||||||||||||||||||
Consolidated Statements of Operations Data: | |||||||||||||||||||||||||||||||
Net revenue | $ | 643,432 | $ | 568,265 | $ | 533,877 | $ | 473,193 | $ | 447,219 | $ | 392,960 | $ | 363,661 | $ | 324,705 | |||||||||||||||
Costs and expenses: | |||||||||||||||||||||||||||||||
Cost of revenue (exclusive of depreciation and amortization shown separately below) (1) | 86,902 | 74,904 | 69,536 | 62,455 | 57,865 | 53,395 | 49,264 | 42,384 | |||||||||||||||||||||||
Sales and marketing (1) | 224,227 | 199,168 | 184,494 | 166,522 | 157,235 | 133,172 | 122,276 | 109,417 | |||||||||||||||||||||||
Product development (1) | 150,289 | 136,542 | 128,731 | 120,622 | 113,140 | 106,223 | 95,608 | 80,672 | |||||||||||||||||||||||
General and administrative (1) | 96,722 | 89,266 | 80,688 | 74,618 | 64,790 | 61,767 | 56,225 | 42,784 | |||||||||||||||||||||||
Depreciation and amortization | 71,118 | 59,782 | 56,306 | 49,740 | 42,750 | 33,767 | 32,193 | 25,806 | |||||||||||||||||||||||
Total costs and expenses | 629,258 | 559,662 | 519,755 | 473,957 | 435,780 | 388,324 | 355,566 | 301,063 | |||||||||||||||||||||||
Income (loss) from operations | 14,174 | 8,603 | 14,122 | (764 | ) | 11,439 | 4,636 | 8,095 | 23,642 | ||||||||||||||||||||||
Other income (expense), net | (7,305 | ) | 152 | 1,197 | 1,026 | 1,820 | 156 | (252 | ) | (308 | ) | ||||||||||||||||||||
Income before income taxes | 6,869 | 8,755 | 15,319 | 262 | 13,259 | 4,792 | 7,843 | 23,334 | |||||||||||||||||||||||
Provision for income taxes | 3,774 | 12,917 | 16,253 | 13,581 | 9,477 | 8,155 | 4,109 | 718 | |||||||||||||||||||||||
Net income (loss) | 3,095 | (4,162 | ) | (934 | ) | (13,319 | ) | 3,782 | (3,363 | ) | 3,734 | 22,616 | |||||||||||||||||||
Accretion of redeemable noncontrolling interest | (100 | ) | (101 | ) | (100 | ) | (126 | ) | — | — | — | — | |||||||||||||||||||
Net income (loss) attributable to common stockholders | $ | 2,995 | $ | (4,263 | ) | $ | (1,034 | ) | $ | (13,445 | ) | $ | 3,782 | $ | (3,363 | ) | $ | 3,734 | $ | 22,616 | |||||||||||
Net income (loss) per share attributable to common stockholders: | |||||||||||||||||||||||||||||||
Basic | $ | 0.02 | $ | (0.03 | ) | $ | (0.01 | ) | $ | (0.11 | ) | $ | 0.03 | $ | (0.03 | ) | $ | 0.03 | $ | 0.21 | |||||||||||
Diluted | $ | 0.02 | $ | (0.03 | ) | $ | (0.01 | ) | $ | (0.11 | ) | $ | 0.03 | $ | (0.03 | ) | $ | 0.03 | $ | 0.20 | |||||||||||
Weighted-average shares used to compute net income (loss) per share attributable to common stockholders: | |||||||||||||||||||||||||||||||
Basic | 124,590 | 123,427 | 122,170 | 120,967 | 119,849 | 113,940 | 111,214 | 109,445 | |||||||||||||||||||||||
Diluted | 127,338 | 123,427 | 122,170 | 120,967 | 124,438 | 113,940 | 116,627 | 115,398 | |||||||||||||||||||||||
__________________
(1) | Stock-based compensation included in above line items: |
Cost of revenue | $ | 8,614 | $ | 7,336 | $ | 6,831 | $ | 5,836 | $ | 4,783 | $ | 4,098 | $ | 3,913 | $ | 2,806 | |||||||||||||||
Sales and marketing | 18,725 | 15,334 | 13,926 | 12,181 | 10,630 | 9,853 | 8,843 | 6,861 | |||||||||||||||||||||||
Product development | 44,134 | 40,014 | 37,582 | 33,126 | 29,152 | 27,186 | 24,885 | 17,638 | |||||||||||||||||||||||
General and administrative | 22,153 | 20,226 | 16,489 | 16,626 | 12,612 | 13,308 | 10,713 | 6,634 | |||||||||||||||||||||||
Total stock-based compensation | $ | 93,626 | $ | 82,910 | $ | 74,828 | $ | 67,769 | $ | 57,177 | $ | 54,445 | $ | 48,354 | $ | 33,939 | |||||||||||||||
-56-
For the Three Months Ended | |||||||||||||||||||||||
Dec 31, 2014 | Sep 30, 2014 | Jun 30, 2014 | Mar 31, 2014 | Dec 31, 2013 | Sep 30, 2013 | Jun 30, 2013 | Mar 31, 2013 | ||||||||||||||||
(as a percentage of net revenue) | |||||||||||||||||||||||
Consolidated Statements of Operations Data: (1) | |||||||||||||||||||||||
Net revenue | 100 | % | 100 | % | 100 | % | 100 | % | 100 | % | 100 | % | 100 | % | 100 | % | |||||||
Costs and expenses: | |||||||||||||||||||||||
Cost of revenue | 14 | 13 | 13 | 13 | 13 | 14 | 14 | 13 | |||||||||||||||
Sales and marketing | 35 | 35 | 35 | 35 | 35 | 34 | 34 | 34 | |||||||||||||||
Product development | 23 | 24 | 24 | 25 | 25 | 27 | 26 | 25 | |||||||||||||||
General and administrative | 15 | 16 | 15 | 16 | 14 | 16 | 15 | 13 | |||||||||||||||
Depreciation and amortization | 11 | 11 | 11 | 11 | 10 | 9 | 9 | 8 | |||||||||||||||
Total costs and expenses | 98 | 98 | 97 | 100 | 97 | 99 | 98 | 93 | |||||||||||||||
Income (loss) from operations | 2 | 2 | 3 | — | 3 | 1 | 2 | 7 | |||||||||||||||
Other income (expense), net | (1 | ) | — | — | — | — | — | — | — | ||||||||||||||
Income before income taxes | 1 | 2 | 3 | — | 3 | 1 | 2 | 7 | |||||||||||||||
Provision for income taxes | 1 | 2 | 3 | 3 | 2 | 2 | 1 | — | |||||||||||||||
Net income (loss) | — | (1 | ) | — | (3 | ) | 1 | (1 | ) | 1 | 7 | ||||||||||||
Accretion of redeemable noncontrolling interest | — | — | — | — | — | — | — | — | |||||||||||||||
Net income (loss) attributable to common stockholders | — | % | (1 | )% | — | % | (3 | )% | 1 | % | (1 | )% | 1 | % | 7 | % | |||||||
______________________
(1) Certain items may not total due to rounding.
-57-
For the Three Months Ended | |||||||||||||||||||||||||||||||
Dec 31, 2014 | Sep 30, 2014 | Jun 30, 2014 | Mar 31, 2014 | Dec 31, 2013 | Sep 30, 2013 | Jun 30, 2013 | Mar 31, 2013 | ||||||||||||||||||||||||
(in thousands) | |||||||||||||||||||||||||||||||
Additional Financial Data: | |||||||||||||||||||||||||||||||
Net revenue by product: | |||||||||||||||||||||||||||||||
Talent Solutions (1) | $ | 369,348 | $ | 344,568 | $ | 322,227 | $ | 291,594 | $ | 261,359 | $ | 237,668 | $ | 216,938 | $ | 194,292 | |||||||||||||||
Marketing Solutions (1) | 152,729 | 109,231 | 106,476 | 86,064 | 97,732 | 75,510 | 73,747 | 64,788 | |||||||||||||||||||||||
Premium Subscriptions | 121,355 | 114,466 | 105,174 | 95,535 | 88,128 | 79,782 | 72,976 | 65,625 | |||||||||||||||||||||||
Total | $ | 643,432 | $ | 568,265 | $ | 533,877 | $ | 473,193 | $ | 447,219 | $ | 392,960 | $ | 363,661 | $ | 324,705 | |||||||||||||||
Net revenue by geographic region: | |||||||||||||||||||||||||||||||
United States | $ | 388,194 | $ | 343,132 | $ | 317,774 | $ | 284,878 | $ | 271,140 | $ | 245,302 | $ | 224,277 | $ | 201,403 | |||||||||||||||
Other Americas (2) | 39,238 | 36,538 | 35,527 | 31,904 | 31,612 | 27,027 | 26,857 | 24,176 | |||||||||||||||||||||||
Total Americas | 427,432 | 379,670 | 353,301 | 316,782 | 302,752 | 272,329 | 251,134 | 225,579 | |||||||||||||||||||||||
EMEA (3) | 162,064 | 139,702 | 134,930 | 117,871 | 108,309 | 90,087 | 84,691 | 75,157 | |||||||||||||||||||||||
APAC (4) | 53,936 | 48,893 | 45,646 | 38,540 | 36,158 | 30,544 | 27,836 | 23,969 | |||||||||||||||||||||||
Total | $ | 643,432 | $ | 568,265 | $ | 533,877 | $ | 473,193 | $ | 447,219 | $ | 392,960 | $ | 363,661 | $ | 324,705 | |||||||||||||||
Net revenue by geography, by product: | |||||||||||||||||||||||||||||||
United States | |||||||||||||||||||||||||||||||
Talent Solutions (1) | $ | 222,670 | $ | 208,635 | $ | 197,852 | $ | 180,403 | $ | 164,207 | $ | 152,371 | $ | 140,420 | $ | 125,930 | |||||||||||||||
Marketing Solutions (1) | 94,991 | 68,767 | 59,383 | 49,038 | 55,269 | 45,789 | 41,259 | 37,666 | |||||||||||||||||||||||
Premium Subscriptions | 70,533 | 65,730 | 60,539 | 55,437 | 51,664 | 47,142 | 42,598 | 37,807 | |||||||||||||||||||||||
Total United States revenue | $ | 388,194 | $ | 343,132 | $ | 317,774 | $ | 284,878 | $ | 271,140 | $ | 245,302 | $ | 224,277 | $ | 201,403 | |||||||||||||||
International | |||||||||||||||||||||||||||||||
Talent Solutions (1) | $ | 146,678 | $ | 135,933 | $ | 124,375 | $ | 111,191 | $ | 97,152 | $ | 85,297 | $ | 76,518 | $ | 68,362 | |||||||||||||||
Marketing Solutions (1) | 57,738 | 40,464 | 47,093 | 37,026 | 42,463 | 29,721 | 32,488 | 27,122 | |||||||||||||||||||||||
Premium Subscriptions | 50,822 | 48,736 | 44,635 | 40,098 | 36,464 | 32,640 | 30,378 | 27,818 | |||||||||||||||||||||||
Total International revenue | $ | 255,238 | $ | 225,133 | $ | 216,103 | $ | 188,315 | $ | 176,079 | $ | 147,658 | $ | 139,384 | $ | 123,302 | |||||||||||||||
Total | $ | 643,432 | $ | 568,265 | $ | 533,877 | $ | 473,193 | $ | 447,219 | $ | 392,960 | $ | 363,661 | $ | 324,705 | |||||||||||||||
Net revenue by sales channel: | |||||||||||||||||||||||||||||||
Field sales | $ | 413,867 | $ | 341,691 | $ | 318,984 | $ | 275,262 | $ | 270,672 | $ | 227,588 | $ | 209,227 | $ | 183,971 | |||||||||||||||
Online sales | 229,565 | 226,574 | 214,893 | 197,931 | 176,547 | 165,372 | 154,434 | 140,734 | |||||||||||||||||||||||
Total | $ | 643,432 | $ | 568,265 | $ | 533,877 | $ | 473,193 | $ | 447,219 | $ | 392,960 | $ | 363,661 | $ | 324,705 | |||||||||||||||
______________________
(1) | Prior period amounts have been recast to conform to the current year presentation. See Note 14, Information About Revenue and Geographic Areas, of the Notes to Consolidated Financial Statements under Item 8 for additional information. |
(2) | Canada, Latin America and South America |
(3) | Europe, the Middle East and Africa (“EMEA”) |
(4) | Asia-Pacific (“APAC”) |
-58-
For the Three Months Ended | |||||||||||||||||||||||||||||||
Dec 31, 2014 | Sep 30, 2014 | Jun 30, 2014 | Mar 31, 2014 | Dec 31, 2013 | Sep 30, 2013 | Jun 30, 2013 | Mar 31, 2013 | ||||||||||||||||||||||||
(in thousands, except customer and headcount data) | |||||||||||||||||||||||||||||||
Other Financial and Operational Data: | |||||||||||||||||||||||||||||||
Adjusted EBITDA (1) | $ | 178,918 | $ | 151,295 | $ | 145,256 | $ | 116,745 | $ | 111,366 | $ | 92,848 | $ | 88,642 | $ | 83,387 | |||||||||||||||
Number of registered members (at period end) | 346,731 | 331,517 | 313,428 | 296,466 | 276,842 | 259,179 | 238,072 | 218,269 | |||||||||||||||||||||||
LinkedIn Corporate Solutions customers (at period end) | 33,271 | 30,314 | 28,080 | 25,844 | 24,444 | 22,001 | 20,256 | 18,138 | |||||||||||||||||||||||
Headcount (at period end): | |||||||||||||||||||||||||||||||
United States | 4,617 | 4,323 | 3,861 | 3,669 | 3,435 | 3,304 | 2,967 | 2,668 | |||||||||||||||||||||||
International | 2,280 | 2,119 | 1,897 | 1,747 | 1,610 | 1,508 | 1,274 | 1,111 | |||||||||||||||||||||||
Total | 6,897 | 6,442 | 5,758 | 5,416 | 5,045 | 4,812 | 4,241 | 3,779 | |||||||||||||||||||||||
______________________
(1) | We define adjusted EBITDA as net income (loss), plus: provision for income taxes, other (income) expense, net, depreciation and amortization, and stock-based compensation. See “Adjusted EBITDA” in Item 6 “Selected Financial Data” for more information. |
For the Three Months Ended | |||||||||||||||||||||||||||||||
Dec 31, 2014 | Sep 30, 2014 | Jun 30, 2014 | Mar 31, 2014 | Dec 31, 2013 | Sep 30, 2013 | Jun 30, 2013 | Mar 31, 2013 | ||||||||||||||||||||||||
(in thousands) | |||||||||||||||||||||||||||||||
Reconciliation of Adjusted EBITDA: | |||||||||||||||||||||||||||||||
Net income (loss) | $ | 3,095 | $ | (4,162 | ) | $ | (934 | ) | $ | (13,319 | ) | $ | 3,782 | $ | (3,363 | ) | $ | 3,734 | $ | 22,616 | |||||||||||
Provision for income taxes | 3,774 | 12,917 | 16,253 | 13,581 | 9,477 | 8,155 | 4,109 | 718 | |||||||||||||||||||||||
Other (income) expense, net | 7,305 | (152 | ) | (1,197 | ) | (1,026 | ) | (1,820 | ) | (156 | ) | 252 | 308 | ||||||||||||||||||
Depreciation and amortization | 71,118 | 59,782 | 56,306 | 49,740 | 42,750 | 33,767 | 32,193 | 25,806 | |||||||||||||||||||||||
Stock-based compensation | 93,626 | 82,910 | 74,828 | 67,769 | 57,177 | 54,445 | 48,354 | 33,939 | |||||||||||||||||||||||
Adjusted EBITDA | $ | 178,918 | $ | 151,295 | $ | 145,256 | $ | 116,745 | $ | 111,366 | $ | 92,848 | $ | 88,642 | $ | 83,387 | |||||||||||||||
Liquidity and Capital Resources
Year Ended December 31, | |||||||||||
2014 | 2013 | 2012 | |||||||||
(in thousands) | |||||||||||
Consolidated Statements of Cash Flows Data: | |||||||||||
Purchases of property and equipment | $ | 547,633 | $ | 278,019 | $ | 125,420 | |||||
Depreciation and amortization | 236,946 | 134,516 | 79,849 | ||||||||
Cash flows provided by operating activities | $ | 568,951 | $ | 436,473 | $ | 267,070 | |||||
Cash flows used in investing activities | (2,293,271 | ) | (1,357,545 | ) | (433,028 | ) | |||||
Cash flows provided by financing activities | 1,388,485 | 1,454,219 | 96,563 | ||||||||
As of December 31, 2014, we had cash and cash equivalents of $460.9 million and marketable securities of $2,982.4 million. Our cash equivalents and marketable securities are comprised primarily of U.S. treasury securities, U.S. agency securities, corporate debt securities, commercial paper and money market funds. As of December 31, 2014, the amount of cash and cash equivalents held by foreign subsidiaries was $182.3 million. If these funds are needed for our domestic operations, we would be required to accrue and pay U.S. taxes to repatriate these funds to the extent these funds exceed amounts owed to the U.S. parent entity. However, our intent is to permanently reinvest these funds outside the U.S. and our current plans do not demonstrate a need to repatriate them to fund our domestic operations. We do not provide for federal income taxes on the undistributed earnings of our foreign subsidiaries. However, we believe the income tax liability would be insignificant if these earnings were to be repatriated. We believe that our existing cash and cash equivalents and marketable securities balances, together with cash generated from operations, will be sufficient to meet our working capital expenditure requirements for at least the next 12 months.
-59-
Operating Activities
Operating activities provided $569.0 million of cash in 2014. The cash flow from operating activities consisted primarily of the changes in our operating assets and liabilities, with deferred revenue increasing $129.3 million and accounts payable and other liabilities increasing $150.0 million, partially offset by an increase in accounts receivable of $137.6 million, and an increase in excess tax benefit from stock-based compensation of $99.2 million, which is reclassified as a financing activity. The increase in our deferred revenue and accounts payable and other liabilities was primarily due to increases in transaction volumes in 2014 compared to 2013. We had a net loss in 2014 of $15.3 million, which included non-cash stock-based compensation of $319.1 million and non-cash depreciation and amortization of $236.9 million.
Operating activities provided $436.5 million of cash in 2013. The cash flow from operating activities consisted primarily of the changes in our operating assets and liabilities, with deferred revenue increasing $134.5 million and accounts payable and other liabilities increasing $114.7 million, partially offset by an increase in accounts receivable of $102.6 million, and an increase in excess tax benefit from stock-based compensation of $43.8 million, which is reclassified as a financing activity. The increases in our deferred revenue and accounts payable and other liabilities were primarily due to increases in transaction volumes in 2013 compared to 2012. We had net income in 2013 of $26.8 million, which included non-cash stock-based compensation of $193.9 million and non-cash depreciation and amortization of $134.5 million.
Operating activities provided $267.1 million of cash in 2012. The cash flow from operating activities consisted primarily of the changes in our operating assets and liabilities, with deferred revenue increasing $117.9 million and accounts payable and other liabilities increasing $85.6 million, partially offset by an increase in accounts receivable of $91.3 million, an increase in excess tax benefit from the exercise of stock options of $35.8 million, which is reclassified as a financing activity, and an increase in prepaid expenses and other assets of $13.0 million. The increases in our deferred revenue and accounts receivable were primarily due to increases in transaction volumes in 2012 compared to 2011. We had net income in 2012 of $21.6 million, which included non-cash depreciation and amortization of $79.8 million and non-cash stock-based compensation of $86.3 million.
Investing Activities
Our primary investing activities consisted of purchases of investments, purchases of property and equipment, as well as payments for acquisitions and intangible assets. We continued to invest in technology hardware to support our growth, software to support website functionality development, website operations and our corporate infrastructure. Purchases of property and equipment may vary from period to period due to the timing of the expansion of our operations. Our planned purchases of property and equipment for 2015 are expected to be in the range of $525.0 million and $550.0 million.
In 2014, we had net purchases of investments of $1,472.3 million, purchases of property and equipment of $547.6 million, which includes $178.7 million in purchases of land, and payments for intangible assets and acquisitions, net of cash acquired, of $253.5 million. In 2013, we had net purchases of investments of $1,055.4 million, purchases of property and equipment of $278.0 million, and payments for intangible assets and acquisitions, net of cash acquired, of $19.2 million. In 2012, we had net purchases of investments of $245.5 million, purchases of property and equipment of $125.4 million, and made payments for intangible assets and acquisitions, net of cash acquired, of $57.0 million.
Financing Activities
In 2014, we received net proceeds from our Notes issuance, after deducting initial purchasers' discount and debt issuance costs, of approximately $1,305.4 million. Concurrently with the issuance of the Notes, we used approximately $248.0 million of the net proceeds of the offering of the Notes to pay the cost of convertible note hedge transactions, which was partially offset by $167.3 million in proceeds from warrants we sold. See Note 8, Convertible Senior Notes, of the Notes to Consolidated Financial Statements under Item 8 for additional information.
In 2013, we received net proceeds from our follow-on offering, net of underwriting discounts and commissions and other costs of $1,348.1 million in proceeds.
-60-
With the exception of the Notes issuance and the follow-on offering, our financing activities consist primarily of the excess tax benefit from stock-based compensation and the proceeds from the issuance of common stock from employee stock option exercises and our employee stock purchase plan.
Off Balance Sheet Arrangements
We did not have any off balance sheet arrangements in 2014, 2013 or 2012.
Contractual Obligations
Our principal obligations consist of our operating leases and 0.50% convertible senior notes. Our headquarters is located in Mountain View, California, where we lease approximately 373,000 square feet of office space under a lease that expires in 2023. We also lease office space of approximately 1,876,000 square feet in locations throughout the United States and approximately 634,000 square feet internationally, some of which is currently under construction. In addition, we have data centers in the United States and Singapore pursuant to various lease agreements. We have several significant long-term purchase obligations outstanding with third parties. We do not have any significant capital lease obligations. As of December 31, 2014, the following table summarizes our contractual obligations and the effect such obligations are expected to have on our liquidity and cash flow in future periods:
Payments Due by Period | |||||||||||||||||||
Total | Less Than 1 Year | 1 - 3 Years | 3 - 5 Years | More Than 5 Years | |||||||||||||||
(in thousands) | |||||||||||||||||||
Operating lease obligations (1) | $ | 1,443,144 | $ | 114,582 | $ | 271,547 | $ | 266,454 | $ | 790,561 | |||||||||
0.50% convertible senior notes (2) | $ | 1,355,342 | $ | 6,392 | $ | 13,225 | $ | 1,335,725 | $ | — | |||||||||
Purchase obligations | $ | 67,482 | $ | 39,453 | $ | 28,004 | $ | 25 | $ | — | |||||||||
______________________
(1) | Subsequent to December 31, 2014, we entered into a sublease agreement for several buildings we lease in Sunnyvale, California, which have total lease commitments, exclusive of lease incentives, of $230.0 million. Under the sublease agreement, the Company will receive approximately $215.3 million in sublease income over the next 12 years. |
(2) | Represents the aggregate principal amount and related interest on our convertible senior notes. See Note 8, Convertible Senior Notes, of the Notes to Consolidated Financial Statements under Item 8 for additional information. |
The contractual commitment amounts in the table above are associated with agreements that are enforceable and legally binding. Obligations under contracts that we can cancel without a significant penalty are not included in the table above.
Contingent obligations arising from unrecognized tax benefits are not included in the contractual obligations because it is expected that the unrecognized benefits would only result in an insignificant amount of cash payments.
Critical Accounting Policies and Estimates
Our consolidated financial statements are prepared in accordance with U.S. GAAP. The preparation of these consolidated financial statements requires us to make estimates and assumptions that affect the reported amounts of assets, liabilities, revenue, expenses and related disclosures. We evaluate our estimates and assumptions on an ongoing basis. Our estimates are based on historical experience and various other assumptions that we believe to be reasonable under the circumstances. Our actual results could differ from these estimates.
We believe that the assumptions and estimates associated with revenue recognition, stock-based compensation, the valuation of goodwill and intangible assets, website and internal-use software development costs, leases, income taxes and legal contingencies have the greatest potential impact on our consolidated financial statements. Therefore, we consider these to be our critical accounting policies and estimates. For further information on all of our significant accounting policies, see Note 1, Description of Business and Summary of Significant Accounting Policies, of the Notes to Consolidated Financial Statements under Item 8.
-61-
Revenue Recognition
A majority of our arrangements for Talent Solutions and Marketing Solutions include multiple deliverables. We allocate consideration at the inception of an arrangement to all deliverables based on the relative selling price method in accordance with the selling price hierarchy. The objective of the hierarchy is to determine the price at which we would transact a sale if the service was sold on a stand-alone basis and requires the use of: (i) vendor-specific objective evidence ("VSOE"), if available; (ii) third-party evidence ("TPE"), if VSOE is not available; and (iii) best estimate of selling price ("BESP"), if neither VSOE nor TPE is available.
VSOE. We determine VSOE based on our historical pricing and discounting practices for the specific solution when sold separately. In determining VSOE, we require that a substantial majority of the selling prices for these services fall within a reasonably narrow pricing range. We have not historically priced our Marketing Solutions within a narrow range to allow us to establish VSOE. We have established VSOE for some of our Talent Solutions products and for such products, VSOE has been used to allocate the selling price of deliverables.
TPE. When VSOE cannot be established for deliverables in multiple element arrangements, we apply judgment with respect to whether we can establish selling price based on TPE. TPE is determined based on competitor prices for similar deliverables when sold separately. Generally, our go-to-market strategy differs from that of our peers and our offerings contain a significant level of differentiation such that the comparable pricing of services with similar functionality cannot be obtained. Furthermore, we are unable to reliably determine what similar competitor services’ selling prices are on a stand-alone basis. As a result, we have not been able to establish selling price based on TPE.
BESP. When we are unable to establish selling price using VSOE or TPE, we use BESP in our allocation of arrangement consideration. The process for determining our BESP for deliverables without VSOE or TPE involves management's judgment. Our process considers multiple factors that may vary depending upon the unique facts and circumstances related to each deliverable. Key factors that we considered in developing our BESPs include: (1) historical sales prices, (2) prices we charge for similar offerings, (3) sales volume, and (4) geographies. Generally, we are not able to establish VSOE or TPE for our Talent Solutions and Marketing Solutions deliverables. The allocation of revenue has generally been based on our BESPs.
If the facts and circumstances underlying the factors we considered change or should future facts and circumstances lead us to consider additional factors, both our determination of our relative selling price under the hierarchy and our BESPs could change in future periods.
Stock-Based Compensation
We measure stock-based compensation at the grant date based on the fair value of the award and recognize expense on a straight-line basis over the requisite service period, which is generally the vesting period of the award.
Stock-based compensation expense is recorded net of estimated forfeitures. On a quarterly basis, we estimate the forfeiture rate based on our historical experience and adjust the rate to reflect changes in facts and circumstances, if any. We revise our estimated forfeiture rate if actual forfeitures differ from our initial estimates, which may cause fluctuations in our stock-based compensation in the period of change.
Determining the fair value of stock-based awards at the grant date requires judgment. We use the Black-Scholes option-pricing model to determine the fair value of stock options and our employee stock purchase plan ("ESPP") awards. The determination of the grant date fair value using an option-pricing model is affected by the market value of our common stock as well as assumptions regarding a number of other complex and subjective variables. These variables include our expected stock price volatility over the expected term of the awards, stock option exercise and cancellation behaviors, risk-free interest rates, and expected dividends, which are estimated as follows:
• | Expected Term. The expected term represents the period of time that awards are expected to be outstanding. Beginning in 2014, we estimate the term of stock options based on a combination of historical and estimated future exercise behavior, which we believe is sufficient to provide a reasonable estimate. Prior to 2014, the expected term was estimated using the simplified method allowed under SEC guidance. For ESPP shares, the expected term is based on the purchase period, which is six months. |
• | Volatility. As we do not have a significant trading history for our common stock, the expected stock price volatility for our common stock is estimated by taking the average historic price volatility for industry peers based on daily price observations over a period equivalent to the expected term of the stock option grants. |
-62-
Industry peers consist of several public companies in the technology industry similar in size, stage of life cycle and financial leverage. We do not rely on implied volatilities of traded options in our industry peers’ common stock because the volume of activity is relatively low. Beginning in 2015, we expect to estimate volatility by taking the average historical price volatility of our own common stock for a period similar to our expected term, which is how we currently estimate the volatility for our ESPP awards. We do not expect a significant change in our volatility as a result.
• | Risk-Free Rate. The risk-free interest rate is based on the yields of U.S. Treasury securities with maturities similar to the expected term of the stock options or ESPP awards. |
• | Dividend Yield. We have never declared or paid any cash dividends and do not presently plan to pay cash dividends in the foreseeable future. Consequently, we used an expected dividend yield of zero. |
Valuation of Goodwill and Intangible Assets
When we acquire businesses, we allocate the purchase price to the tangible assets and liabilities and identifiable intangible assets acquired. Any residual purchase price is recorded as goodwill. The allocation of the purchase price requires management to make significant estimates in determining the fair value of acquired assets and assumed liabilities, especially with respect to intangible assets. These estimates are based on information obtained from management of the acquired companies, market participant data, and historical experience. These estimates can include, but are not limited to:
• | the time and expenses that would be necessary to recreate the asset; |
• | the profit margin a market participant would receive; |
• | cash flows that an asset is expected to generate in the future; and |
• | discount rates. |
These estimates are inherently uncertain and unpredictable. A change in these estimates could impact our allocation of purchase price to the acquired assets and assumed liabilities. In addition, if unanticipated events or circumstances occur, which affect the accuracy or validity of these estimates, we would evaluate whether we record an adjustment to the value previously allocated to the acquired asset or assumed liability with a corresponding offset to goodwill. After the end of the measurement period, which cannot exceed one year from the acquisition date, all adjustments to acquired assets or assumed liabilities are recorded to earnings in our consolidated statements of operations.
Website and Internal-Use Software Development Costs
We capitalize certain costs related to the development of our website and mobile applications, or software developed for internal-use. We begin to capitalize our costs to develop software when preliminary development efforts are successfully completed, management has authorized and committed project funding, and it is probable that the project will be completed and the software will be used as intended. Such costs are amortized on a straight-line basis over the estimated useful life of the related asset, generally estimated to be two years. Costs incurred prior to meeting these criteria, together with costs incurred for training and maintenance, are expensed as incurred and recorded within product development expenses in our consolidated statements of operations. We exercise judgment in determining the point at which various projects may be capitalized, in assessing the ongoing value of the capitalized costs, and in determining the estimated useful lives over which the costs are amortized. To the extent that we change the manner in which we develop and test new features and functionalities related to our website and mobile applications, assess the ongoing value of capitalized assets, or determine the estimated useful lives over which the costs are amortized, the amount of website and internal-use software development costs we capitalize and amortize could change in future periods.
Leases
Historically, all of our significant leases have been accounted for as operating leases. Accounting for these leases requires significant judgment by management. Management determines whether leases are accounted for as a capital or operating lease, or whether we are considered the owner for accounting purposes, based on an evaluation of the specific contractual lease terms in accordance with authoritative accounting guidance on leases.
If the lease is considered a capital lease or we are considered the owner for accounting purposes, we would record the property and a related capital lease obligation on our balance sheet. The asset would then be
-63-
depreciated over the expected lease term. Rent payments for these properties would be allocated between interest expense and a reduction of the capital lease obligation.
If the lease is considered an operating lease, it is not recorded on our balance sheet and rent expense is recognized on a straight-line basis over the expected lease term.
The most significant estimates used by management in accounting for property leases and the impact of these estimates are as follows:
• | Expected lease term. The expected lease term is used in determining whether the lease is accounted for as an operating lease or a capital lease. A lease is considered a capital lease if the lease term is equal to or exceeds 75% of the leased asset’s estimated economic life. The expected lease term is also used in determining the depreciable life of the asset or the straight-line rent recognition period. Increasing the expected lease term will increase the probability that a lease will be considered a capital lease and will generally result in higher rent expense for an operating lease and higher interest and depreciation expenses for a capital lease. |
• | Incremental borrowing rate. The incremental borrowing rate is primarily used in determining whether the lease is accounted for as an operating lease or a capital lease. A lease is considered a capital lease if the net present value of the lease payments is equal to or greater than 90% of the fair market value of the property. We utilize the incremental borrowing rate to discount the gross value of the minimum lease payments related to a contractual lease obligation. We estimate this rate using interest swap rates comparable to the expected term of the lease payments and our credit spread. Increasing the incremental borrowing rate decreases the net present value of the lease payments. |
• | Fair market value of leased asset. The fair market value of leased property is generally estimated based on comparable market data. Fair market value is used in determining whether the lease is accounted for as an operating lease or a capital lease. |
If our assumptions change and we amend an existing lease or enter into a new lease, we may have leases that are accounted for as capital leases, as well as operating leases. Accounting for a lease as a capital lease would accelerate the timing of expense recognition due to the recognition of larger amounts of interest expense near the beginning of the lease term. It would also change the characterization of expense from rent expense to a combination of depreciation and interest expense, both of which are excluded from our adjusted EBITDA metric and would likely impact other financial metrics. However, lease classification would not be expected to impact our cash flow.
Income Taxes
We record income taxes using the asset and liability method, which requires the recognition of deferred tax assets and liabilities for the expected future tax consequences of events that have been recognized in our financial statements or tax returns. In estimating future tax consequences, generally all expected future events other than enactments or changes in the tax law or rates are considered. Valuation allowances are provided when necessary to reduce deferred tax assets to the amount expected to be realized.
We recognize a tax benefit from an uncertain tax position only if it is more likely than not the tax position will be sustained on examination by the taxing authorities, based on the technical merits of the position. The tax benefits recognized in the financial statements from such positions are then measured based on the largest benefit that has a greater than 50% likelihood of being realized upon settlement. In the event that any unrecognized tax benefits are recognized, the effective tax rate will be affected. If recognized, approximately $38.1 million of unrecognized tax benefit would impact the effective tax rate at December 31, 2014. Although we believe our estimates are reasonable, no assurance can be given that the final tax outcome of these matters will be the same as these estimates. These estimates are updated quarterly based on factors such as change in facts or circumstances, changes in tax law, new audit activity, and effectively settled issues.
We follow specific and detailed guidelines in each tax jurisdiction regarding the recoverability of any tax assets recorded on the balance sheet and provide necessary valuation allowances as required. Future realization of deferred tax assets ultimately depends on the existence of sufficient taxable income of the appropriate character (for example, ordinary income or capital gain) within the carryback or carryforward periods available under the tax law. We regularly review our deferred tax assets for recoverability based on historical taxable income, projected future taxable income, the expected timing of the reversals of existing temporary differences and tax planning strategies. Our judgments regarding future profitability may change due to many factors, including future market
-64-
conditions and our ability to successfully execute our business plans and/or tax planning strategies. Should there be a change in our ability to recover our deferred tax assets, our tax provision would increase or decrease in the period in which the assessment is changed.
Legal Contingencies
We are subject to legal proceedings and litigation arising in the ordinary course of business. Periodically, we evaluate the status of each legal matter and assess our potential financial exposure. If the potential loss from any legal proceeding or litigation is considered probable and the amount can be reasonably estimated, we accrue a liability for the estimated loss. Significant judgment is required to determine the probability of a loss and whether the amount of the loss is reasonably estimable. The outcome of any proceeding is not determinable in advance. As a result, the assessment of a potential liability and the amount of accruals recorded are based only on the information available at the time. As additional information becomes available, we reassess the potential liability related to the legal proceeding or litigation, and may revise our estimates. Any revisions could have a material effect on our results of operations. See Note 11, Commitments and Contingencies, of the Notes to the Consolidated Financial Statements under Item 8 for additional information on our legal proceedings and litigation.
Recently Issued Accounting Guidance
Derivatives and Hedging
In November 2014, the Financial Accounting Standards Board ("FASB") issued new authoritative guidance on determining whether the host contract in a hybrid financial instrument issued in the form of a share is more akin to debt or to equity. The guidance applies to hybrid financial instruments that include embedded derivative features, which must be evaluated to determine whether the nature of the host contract is more akin to debt or to equity and whether the economic characteristics and risks of the embedded derivative feature are clearly and closely related to the host contract. If the host contract is akin to equity, then equity-like features (for example, a conversion option) are considered clearly and closely related to the host contract and, thus, would not be separated from the host contract. If the host contract is akin to debt, then equity-like features are not considered clearly and closely related to the host contract. In the latter case, an entity may be required to separate the equity-like embedded derivative feature from the debt host contract if certain other criteria are met. Similarly, debt-like embedded derivative features may require separate accounting from an equity-like host contract. The standard will be effective for us in the first quarter of 2016; however, we may elect to early adopt. We are currently evaluating whether this standard will have a material impact on our financial statements.
Revenue Recognition
In May 2014, FASB issued new authoritative guidance on revenue from contracts with customers. The guidance outlines a single comprehensive model for entities to use in accounting for revenue arising from contracts with customers and supersedes most current revenue recognition guidance, including industry-specific guidance. The core principle of the revenue model is that "an entity recognizes revenue to depict the transfer of promised goods or services to customers in an amount that reflects the consideration to which the entity expects to be entitled in exchange for those goods or services." The guidance also requires significantly expanded disclosures about revenue recognition. This standard will be effective for us in the first quarter of 2017 and will be applied using either the full or modified retrospective adoption methods. Early adoption of this guidance is not permitted. We are currently evaluating adoption methods and whether this standard will have a material impact on our financial results.
Item 7A. | Quantitative and Qualitative Disclosure About Market Risk |
We have operations both within the United States and internationally, and we are exposed to market risks in the ordinary course of our business. These risks include primarily interest rate, foreign exchange risks and inflation.
Interest Rate Fluctuation Risk
We had cash, cash equivalents, and marketable securities of $3,443.3 million and $2,329.3 million as of December 31, 2014 and 2013, respectively. This amount was invested primarily in money market funds and highly liquid investment grade fixed income securities. The cash, cash equivalents and marketable securities are held for working capital purposes. Our investment policy and strategy is focused on the preservation of capital and
-65-
supporting our liquidity requirements. We do not enter into investments for trading or speculative purposes. At December 31, 2014, the weighted-average duration of our investment portfolio was less than one year.
Our fixed-income portfolio is subject to fluctuations in interest rates, which could affect our results of operations. Based on our investment portfolio balance as of December 31, 2014, a hypothetical increase in interest rates of 1% (100 basis points) would have resulted in a decrease in the fair value of our portfolio of approximately $18.6 million, and a hypothetical increase of 0.5% (50 basis points) would have resulted in a decrease in the fair value of our portfolio of approximately $9.3 million.
Foreign Currency Exchange Risks
We have foreign currency exchange risks related to our revenue and operating expenses denominated in currencies other than the U.S. dollar, principally the British Pound Sterling, the Euro, the Australian dollar, the Canadian dollar, the Indian rupee and the Singapore dollar. The volatility of exchange rates depends on many factors that we cannot forecast with reliable accuracy. We have experienced and will continue to experience fluctuations in our net income (loss) as a result of gains (losses) related to remeasuring certain monetary assets and liabilities that are denominated in currencies other than the U.S. dollar. In the event our foreign currency denominated assets, liabilities, sales or expenses increase, our operating results may be more greatly affected by fluctuations in the exchange rates of the currencies in which we do business.
We enter into foreign currency derivative contracts to hedge against assets and liabilities for which we have foreign currency exposure to minimize the risk that our earnings will be adversely affected by exchange rate fluctuations. Our foreign currency derivative contracts are not designated as hedging instruments. These derivative instruments are carried at fair value with changes in the fair value recorded to other income (expense), net in our consolidated statements of operations. These contracts do not subject us to material balance sheet risk due to exchange rate movements because gains and losses on these derivatives are intended to offset gains and losses on the hedged foreign currency denominated assets and liabilities.
As of December 31, 2014, we had outstanding foreign currency derivative contracts with a total notional amount of $190.1 million. If overall foreign currency exchange rates appreciated (depreciated) uniformly by 5% against the U.S. dollar, our foreign currency derivative contracts outstanding as of December 31, 2014 would experience a loss (gain) of approximately $8.0 million.
Market Risk and Market Interest Risk
On November 12, 2014, we issued $1,322.5 million aggregate principal amount of 0.50% convertible senior notes (the “Notes”). Holders may convert their notes prior to maturity under certain circumstances. Upon conversion, we will pay or deliver, as the case may be, cash, shares of our Class A common stock, or a combination of cash and shares of our Class A common stock, at our election. We intend to settle the principal and interest due on the Notes in cash. Concurrent with the issuance of the Notes, we purchased options (“Note Hedges”) and sold warrants, in order to reduce the potential economic dilution upon conversion of the Notes.
We do not have economic interest rate exposure related to the Notes, as they have a fixed annual interest rate of 0.50%. We do, however, have interest rate risk because the fair value of our Notes will generally increase when interest rates fall and decrease when interest rates rise. Additionally, the fair value of our Notes may be impacted by price of our Class A common stock. As of December 31, 2014, the estimated fair value of our Notes was $1,405.2 million based on the closing trading price of the Notes as of the last day of trading for the period. See Note 8, Convertible Senior Notes, under Item 8 for additional information on the Notes, including the carrying value of the Notes.
Inflation Risk
We do not believe that inflation has had a material effect on our business, financial condition or results of operations. If our costs were to become subject to significant inflationary pressures, we may not be able to fully offset such higher costs through price increases. Our inability or failure to do so could harm our business, financial condition and results of operations.
-66-
Item 8. | Financial Statements and Supplementary Data |
LINKEDIN CORPORATION
INDEX TO CONSOLIDATED FINANCIAL STATEMENTS
Page | |
The supplementary financial information required by this Item 8 is included in Item 7 under the caption “Quarterly Results of Operations.”
-67-
REPORT OF INDEPENDENT REGISTERED PUBLIC ACCOUNTING FIRM
To the Board of Directors and Stockholders of
LinkedIn Corporation
Mountain View, California
We have audited the accompanying consolidated balance sheets of LinkedIn Corporation and subsidiaries (the “Company”) as of December 31, 2014 and 2013, and the related consolidated statements of operations, comprehensive income (loss), stockholders’ equity, and cash flows for each of the three years in the period ended December 31, 2014. These financial statements are the responsibility of the Company’s management. Our responsibility is to express an opinion on these financial statements based on our audits.
We conducted our audits in accordance with the standards of the Public Company Accounting Oversight Board (United States). Those standards require that we plan and perform the audit to obtain reasonable assurance about whether the financial statements are free of material misstatement. An audit includes examining, on a test basis, evidence supporting the amounts and disclosures in the financial statements. An audit also includes assessing the accounting principles used and significant estimates made by management, as well as evaluating the overall financial statement presentation. We believe that our audits provide a reasonable basis for our opinion.
In our opinion, such consolidated financial statements present fairly, in all material respects, the financial position of LinkedIn Corporation and subsidiaries as of December 31, 2014 and 2013, and the results of their operations and their cash flows for each of the three years in the period ended December 31, 2014, in conformity with accounting principles generally accepted in the United States of America.
We have also audited, in accordance with the standards of the Public Company Accounting Oversight Board (United States), the Company's internal control over financial reporting as of December 31, 2014, based on the criteria established in Internal Control - Integrated Framework (2013) issued by the Committee of Sponsoring Organizations of the Treadway Commission and our report dated February 12, 2015, expressed an unqualified opinion on the Company's internal control over financial reporting.
/s/ DELOITTE & TOUCHE LLP
San Jose, California
February 12, 2015
-68-
LINKEDIN CORPORATION
CONSOLIDATED BALANCE SHEETS
(In thousands, except share data)
December 31, | |||||||
2014 | 2013 | ||||||
ASSETS | |||||||
CURRENT ASSETS: | |||||||
Cash and cash equivalents | $ | 460,887 | $ | 803,089 | |||
Marketable securities | 2,982,422 | 1,526,212 | |||||
Accounts receivable (net of allowance for doubtful accounts of $11,944 and $6,138 at December 31, 2014 and 2013, respectively) | 449,048 | 302,168 | |||||
Deferred commissions | 66,561 | 47,496 | |||||
Prepaid expenses | 52,978 | 32,114 | |||||
Other current assets | 110,204 | 44,391 | |||||
Total current assets | 4,122,100 | 2,755,470 | |||||
Property and equipment, net | 740,909 | 361,741 | |||||
Goodwill | 356,718 | 150,871 | |||||
Intangible assets, net | 131,275 | 43,046 | |||||
Other assets | 76,255 | 41,665 | |||||
TOTAL ASSETS | $ | 5,427,257 | $ | 3,352,793 | |||
LIABILITIES, REDEEMABLE NONCONTROLLING INTEREST AND STOCKHOLDERS’ EQUITY | |||||||
CURRENT LIABILITIES: | |||||||
Accounts payable | $ | 100,297 | $ | 66,744 | |||
Accrued liabilities | 260,189 | 183,004 | |||||
Deferred revenue | 522,299 | 392,243 | |||||
Total current liabilities | 882,785 | 641,991 | |||||
CONVERTIBLE SENIOR NOTES, NET | 1,081,553 | — | |||||
DEFERRED TAX LIABILITIES | — | 14,879 | |||||
OTHER LONG TERM LIABILITIES | 132,100 | 61,529 | |||||
Total liabilities | 2,096,438 | 718,399 | |||||
COMMITMENTS AND CONTINGENCIES (Note 11) | |||||||
REDEEMABLE NONCONTROLLING INTEREST | 5,427 | 5,000 | |||||
STOCKHOLDERS’ EQUITY (Note 12): | |||||||
Class A common stock, $0.0001 par value; 1,000,000,000 shares authorized, 110,291,709 and 109,259,689 shares issued and outstanding, respectively, at December 31, 2014 and 103,218,118 and 103,194,534 shares issued and outstanding, respectively, at December 31, 2013 | 11 | 10 | |||||
Class B common stock, $0.0001 par value; 120,000,000 shares authorized, 15,782,261 and 17,157,215 shares issued and outstanding at December 31, 2014 and 2013, respectively | 2 | 2 | |||||
Additional paid-in capital | 3,285,705 | 2,573,449 | |||||
Accumulated other comprehensive income (loss) | (198 | ) | 314 | ||||
Accumulated earnings | 39,872 | 55,619 | |||||
Total stockholders’ equity | 3,325,392 | 2,629,394 | |||||
TOTAL LIABILITIES, REDEEMABLE NONCONTROLLING INTEREST AND STOCKHOLDERS’ EQUITY | $ | 5,427,257 | $ | 3,352,793 | |||
See notes to consolidated financial statements.
-69-
LINKEDIN CORPORATION
CONSOLIDATED STATEMENTS OF OPERATIONS
(In thousands, except per share data)
Year Ended December 31, | |||||||||||
2014 | 2013 | 2012 | |||||||||
Net revenue | $ | 2,218,767 | $ | 1,528,545 | $ | 972,309 | |||||
Costs and expenses: | |||||||||||
Cost of revenue (exclusive of depreciation and amortization shown separately below) | 293,797 | 202,908 | 125,521 | ||||||||
Sales and marketing | 774,411 | 522,100 | 324,896 | ||||||||
Product development | 536,184 | 395,643 | 257,179 | ||||||||
General and administrative | 341,294 | 225,566 | 128,002 | ||||||||
Depreciation and amortization | 236,946 | 134,516 | 79,849 | ||||||||
Total costs and expenses | 2,182,632 | 1,480,733 | 915,447 | ||||||||
Income from operations | 36,135 | 47,812 | 56,862 | ||||||||
Other income (expense), net | (4,930 | ) | 1,416 | 252 | |||||||
Income before income taxes | 31,205 | 49,228 | 57,114 | ||||||||
Provision for income taxes | 46,525 | 22,459 | 35,504 | ||||||||
Net income (loss) | (15,320 | ) | 26,769 | 21,610 | |||||||
Accretion of redeemable noncontrolling interest | (427 | ) | — | — | |||||||
Net income (loss) attributable to common stockholders | $ | (15,747 | ) | $ | 26,769 | $ | 21,610 | ||||
Net income (loss) per share attributable to common stockholders: | |||||||||||
Basic | $ | (0.13 | ) | $ | 0.24 | $ | 0.21 | ||||
Diluted | $ | (0.13 | ) | $ | 0.23 | $ | 0.19 | ||||
Weighted-average shares used to compute net income (loss) per share attributable to common stockholders: | |||||||||||
Basic | 122,800 | 113,643 | 105,166 | ||||||||
Diluted | 122,800 | 118,944 | 112,844 | ||||||||
See notes to consolidated financial statements.
-70-
LINKEDIN CORPORATION
CONSOLIDATED STATEMENTS OF COMPREHENSIVE INCOME (LOSS)
(In thousands)
Year Ended December 31, | |||||||||||
2014 | 2013 | 2012 | |||||||||
Net income (loss) | $ | (15,320 | ) | $ | 26,769 | $ | 21,610 | ||||
Other comprehensive income (loss): | |||||||||||
Change in unrealized gains (losses) on investments, net of tax | (355 | ) | 113 | 273 | |||||||
Less: reclassification adjustment for net investment gains included in net income (loss), net of tax | (111 | ) | (59 | ) | (113 | ) | |||||
Change in foreign currency translation adjustment | (46 | ) | — | — | |||||||
Total other comprehensive income (loss) | (512 | ) | 54 | 160 | |||||||
Comprehensive income (loss) | (15,832 | ) | 26,823 | 21,770 | |||||||
Accretion of redeemable noncontrolling interest | (427 | ) | — | — | |||||||
Comprehensive income (loss) attributable to common stockholders | $ | (16,259 | ) | $ | 26,823 | $ | 21,770 | ||||
See notes to consolidated financial statements.
-71-
LINKEDIN CORPORATION
CONSOLIDATED STATEMENTS OF STOCKHOLDERS’ EQUITY
FOR THE YEARS ENDED DECEMBER 31, 2014, 2013 AND 2012
(In thousands, except shares)
Stockholders’ Equity | ||||||||||||||||||||||
Common Stock | Additional Paid-In Capital | Accumulated Other Compre- hensive Income (Loss) | Accumulated Earnings | Total | ||||||||||||||||||
Shares | Amount | |||||||||||||||||||||
BALANCE—December 31, 2011 | 101,480,394 | $ | 10 | $ | 617,629 | $ | 100 | $ | 7,240 | $ | 624,979 | |||||||||||
Issuance of common stock upon exercise of employee stock options | 5,864,624 | 1 | 44,401 | — | — | 44,402 | ||||||||||||||||
Issuance of common stock upon vesting of restricted stock units | 293,701 | — | — | — | — | — | ||||||||||||||||
Issuance of common stock in connection with employee stock purchase plan | 232,994 | — | 16,862 | — | — | 16,862 | ||||||||||||||||
Issuance of common stock related to acquisitions, net of reacquired shares | 860,497 | — | 71,478 | — | — | 71,478 | ||||||||||||||||
Vesting of early exercised stock options | — | — | 3,365 | — | — | 3,365 | ||||||||||||||||
Repurchase of unvested early exercised stock options | (85,009 | ) | — | — | — | — | — | |||||||||||||||
Stock-based compensation | — | — | 89,739 | — | — | 89,739 | ||||||||||||||||
Excess income tax benefit from stock-based compensation | — | — | 35,829 | — | — | 35,829 | ||||||||||||||||
Change in net unrealized gain on investments | — | — | — | 160 | — | 160 | ||||||||||||||||
Net income attributable to common stockholders | — | — | — | — | 21,610 | 21,610 | ||||||||||||||||
BALANCE—December 31, 2012 | 108,647,201 | $ | 11 | $ | 879,303 | $ | 260 | $ | 28,850 | $ | 908,424 | |||||||||||
Issuance of common stock in connection with follow-on offering, net of offering costs | 6,188,340 | 1 | 1,348,058 | — | — | 1,348,059 | ||||||||||||||||
Issuance of common stock upon exercise of employee stock options | 3,659,817 | — | 32,824 | — | — | 32,824 | ||||||||||||||||
Issuance of common stock upon vesting of restricted stock units | 1,154,252 | — | — | — | — | — | ||||||||||||||||
Issuance of common stock in connection with employee stock purchase plan | 217,743 | — | 24,589 | — | — | 24,589 | ||||||||||||||||
Issuance of common stock related to acquisitions, net of reacquired shares | 487,958 | — | 40,834 | — | — | 40,834 | ||||||||||||||||
Vesting of early exercised stock options | — | — | 937 | — | — | 937 | ||||||||||||||||
Repurchase of unvested early exercised stock options | (3,562 | ) | — | — | — | — | — | |||||||||||||||
Stock-based compensation | — | — | 203,149 | — | — | 203,149 | ||||||||||||||||
Excess income tax benefit from stock-based compensation | — | — | 43,755 | — | — | 43,755 | ||||||||||||||||
Change in net unrealized gain on investments | — | — | — | 54 | — | 54 | ||||||||||||||||
Net income attributable to common stockholders | — | — | — | — | 26,769 | 26,769 | ||||||||||||||||
BALANCE—December 31, 2013 | 120,351,749 | $ | 12 | $ | 2,573,449 | $ | 314 | $ | 55,619 | $ | 2,629,394 | |||||||||||
Stockholders’ Equity | ||||||||||||||||||||||
Common Stock | Additional Paid-In Capital | Accumulated Other Compre- hensive Income (Loss) | Accumulated Earnings | Total | ||||||||||||||||||
Shares | Amount | |||||||||||||||||||||
BALANCE—December 31, 2013 | 120,351,749 | $ | 12 | $ | 2,573,449 | $ | 314 | $ | 55,619 | $ | 2,629,394 | |||||||||||
Issuance of common stock upon exercise of employee stock options | 2,371,271 | 1 | 33,576 | — | — | 33,577 | ||||||||||||||||
Issuance of common stock upon vesting of restricted stock units | 1,628,389 | — | — | — | — | — | ||||||||||||||||
Issuance of common stock in connection with employee stock purchase plan | 261,108 | — | 32,816 | — | — | 32,816 | ||||||||||||||||
Issuance of common stock related to acquisitions, net of reacquired shares | 430,584 | — | 64,207 | — | — | 64,207 | ||||||||||||||||
Repurchase of unvested early exercised stock options | (1,151 | ) | — | — | — | — | — | |||||||||||||||
Stock-based compensation | — | — | 330,346 | — | — | 330,346 | ||||||||||||||||
Equity component of convertible senior notes, net | — | — | 236,752 | — | — | 236,752 | ||||||||||||||||
Purchase of convertible note hedges | — | — | (247,969 | ) | — | — | (247,969 | ) | ||||||||||||||
Issuance of warrants | — | — | 167,296 | — | — | 167,296 | ||||||||||||||||
Other equity | — | — | 348 | — | — | 348 | ||||||||||||||||
Excess income tax benefit from stock-based compensation | — | — | 94,884 | — | — | 94,884 | ||||||||||||||||
Change in net unrealized loss on investments | — | — | — | (466 | ) | — | (466 | ) | ||||||||||||||
Cumulative translation adjustment | — | — | — | (46 | ) | — | (46 | ) | ||||||||||||||
Net loss attributable to common stockholders | — | — | — | — | (15,747 | ) | (15,747 | ) | ||||||||||||||
BALANCE—December 31, 2014 | 125,041,950 | $ | 13 | $ | 3,285,705 | $ | (198 | ) | $ | 39,872 | $ | 3,325,392 | ||||||||||
See notes to consolidated financial statements.
-72-
LINKEDIN CORPORATION
CONSOLIDATED STATEMENTS OF CASH FLOWS
(In thousands)
Year Ended December 31, | |||||||||||
2014 | 2013 | 2012 | |||||||||
OPERATING ACTIVITIES: | |||||||||||
Net income (loss) | $ | (15,320 | ) | $ | 26,769 | $ | 21,610 | ||||
Adjustments to reconcile net income (loss) to net cash provided by operating activities: | |||||||||||
Depreciation and amortization | 236,946 | 134,516 | 79,849 | ||||||||
Provision for doubtful accounts and sales returns | 11,346 | 4,775 | 623 | ||||||||
Amortization of investment premiums, net | 13,613 | 8,268 | 5,330 | ||||||||
Amortization of debt discount and transaction costs | 5,916 | — | — | ||||||||
Stock-based compensation | 319,133 | 193,915 | 86,319 | ||||||||
Excess income tax benefit from stock-based compensation | (99,247 | ) | (43,755 | ) | (35,829 | ) | |||||
Changes in operating assets and liabilities: | |||||||||||
Accounts receivable | (137,571 | ) | (102,618 | ) | (91,277 | ) | |||||
Deferred commissions | (22,409 | ) | (18,249 | ) | (17,145 | ) | |||||
Prepaid expenses and other assets | (42,032 | ) | (19,481 | ) | (12,993 | ) | |||||
Accounts payable and other liabilities | 149,971 | 114,713 | 85,561 | ||||||||
Income taxes, net | 19,280 | 3,120 | 27,077 | ||||||||
Deferred revenue | 129,325 | 134,500 | 117,945 | ||||||||
Net cash provided by operating activities | 568,951 | 436,473 | 267,070 | ||||||||
INVESTING ACTIVITIES: | |||||||||||
Purchases of property and equipment | (547,633 | ) | (278,019 | ) | (125,420 | ) | |||||
Purchases of investments | (3,431,566 | ) | (1,493,754 | ) | (443,992 | ) | |||||
Sales of investments | 294,033 | 179,904 | 58,594 | ||||||||
Maturities of investments | 1,665,199 | 258,425 | 139,911 | ||||||||
Payments for intangible assets and acquisitions, net of cash acquired | (253,538 | ) | (19,197 | ) | (57,036 | ) | |||||
Changes in deposits and restricted cash | (19,766 | ) | (4,904 | ) | (5,085 | ) | |||||
Net cash used in investing activities | (2,293,271 | ) | (1,357,545 | ) | (433,028 | ) | |||||
FINANCING ACTIVITIES: | |||||||||||
Proceeds from issuance of convertible senior notes, net | 1,305,414 | — | — | ||||||||
Payments for convertible note hedges | (247,969 | ) | — | — | |||||||
Proceeds from issuance of warrants | 167,296 | — | — | ||||||||
Proceeds from follow-on offering, net of offering costs | — | 1,348,059 | (382 | ) | |||||||
Proceeds from issuance of preferred shares in joint venture | 400 | 4,600 | — | ||||||||
Proceeds from issuance of common stock from employee stock options | 33,577 | 32,824 | 44,402 | ||||||||
Proceeds from issuance of common stock from employee stock purchase plan | 32,816 | 24,589 | 16,862 | ||||||||
Excess income tax benefit from stock-based compensation | 99,247 | 43,755 | 35,829 | ||||||||
Other financing activities | (2,296 | ) | 392 | (148 | ) | ||||||
Net cash provided by financing activities | 1,388,485 | 1,454,219 | 96,563 | ||||||||
EFFECT OF EXCHANGE RATE CHANGES ON CASH AND CASH EQUIVALENTS | (6,367 | ) | (466 | ) | 755 | ||||||
CHANGE IN CASH AND CASH EQUIVALENTS | (342,202 | ) | 532,681 | (68,640 | ) | ||||||
CASH AND CASH EQUIVALENTS—Beginning of period | 803,089 | 270,408 | 339,048 | ||||||||
CASH AND CASH EQUIVALENTS—End of period | $ | 460,887 | $ | 803,089 | $ | 270,408 | |||||
SUPPLEMENTAL DISCLOSURES OF OTHER CASH FLOW INFORMATION: | |||||||||||
Cash paid for income taxes | $ | 10,291 | $ | 6,049 | $ | 2,828 | |||||
SUPPLEMENTAL DISCLOSURES OF NONCASH INVESTING AND FINANCING ACTIVITIES: | |||||||||||
Purchases of property and equipment recorded in accounts payable and accrued liabilities | $ | 43,472 | $ | 25,724 | $ | 22,223 | |||||
Vesting of early exercised stock options | $ | 335 | $ | 937 | $ | 3,365 | |||||
Issuance of Class A common stock and stock options for business combinations | $ | 64,207 | $ | 40,927 | $ | 71,478 | |||||
See notes to consolidated financial statements.
-73-
Notes to Consolidated Financial Statements
1. | Description of Business and Summary of Significant Accounting Policies |
LinkedIn Corporation and its subsidiaries (the “Company”), a Delaware corporation, was incorporated on March 6, 2003. The Company operates an online professional network on the Internet through which the Company’s members are able to create, manage and share their professional identities online, build and engage with their professional networks, access shared knowledge and insights, and find business opportunities, enabling them to be more productive and successful. The Company believes it is the most extensive, accurate and accessible network focused on professionals.
Certain Significant Risks and Uncertainties
The Company operates in a dynamic industry and, accordingly, can be affected by a variety of factors. For example, management of the Company believes that changes in any of the following areas could have a significant negative effect on the Company in terms of its future consolidated financial position, results of operations, or cash flows: scaling and adaptation of existing technology and network infrastructure; protection of customers’ information and privacy concerns; security measures related to the Company’s website; rates of revenue growth; engagement and usage of the Company’s solutions; management of the Company’s growth; new markets and international expansion; protection of the Company’s brand and intellectual property; competition in the Company’s market; qualified employees and key personnel; intellectual property infringement and other claims; and changes in government regulation affecting the Company’s business, among other things.
Principles of Consolidation
The consolidated financial statements include the Company, its wholly-owned subsidiaries, and variable interest entities in which LinkedIn is the primary beneficiary in accordance with the consolidation accounting guidance. All intercompany balances and transactions have been eliminated.
Redeemable noncontrolling interest is included within the equity section in the consolidated balance sheets. Redeemable noncontrolling interest is considered to be temporary equity and is therefore reported outside of permanent equity equal to its redemption value as of the balance sheet date.
Use of Estimates
The preparation of the Company’s consolidated financial statements in conformity with generally accepted accounting principles (“GAAP”) in the United States of America requires management to make estimates and assumptions that affect the reported amounts of assets and liabilities and disclosure of contingent assets and liabilities at the date of the consolidated financial statements and the reported amounts of income and expenses during the reporting period. These estimates are based on information available as of the date of the consolidated financial statements; therefore, actual results could differ from management’s estimates.
Concentrations of Credit Risk
Financial instruments, which potentially subject the Company to concentrations of credit risk, consist primarily of cash and cash equivalents, marketable securities, foreign exchange contracts and accounts receivable. Although the Company deposits its cash with financial institutions that management believes are of high credit quality, its deposits, at times, may exceed federally insured limits. The Company's investment portfolio consists of investment grade securities diversified amongst security types, industries, and issuers. The Company's investment policy limits the amount of credit exposure to a maximum of 5% for any one issuer, except for its U.S. treasury and agency securities, and the Company believes no significant concentration risk exists with respect to these investments. Foreign exchange contracts are transacted with various financial institutions with high credit standings.
Credit risk with respect to accounts receivable is dispersed due to the large number of customers, none of which accounted for more than 10% of total accounts receivable as of December 31, 2014 and 2013. In addition, the Company’s credit risk is mitigated by the relatively short collection period. The Company records accounts receivable at the invoiced amount and does not charge interest. Collateral is not required for accounts receivable. The Company's allowance for doubtful accounts is based on historical loss patterns, the number of days that billings are past due, and an evaluation of the potential risk of loss associated with delinquent accounts. The following table presents the changes in the allowance for doubtful accounts (in thousands):
-74-
Year Ended December 31, | |||||||||||
2014 | 2013 | 2012 | |||||||||
Allowance for doubtful accounts: | |||||||||||
Balance, beginning of period | $ | 6,138 | $ | 3,774 | $ | 5,460 | |||||
Add: bad debt expense (credit) | 10,273 | 4,130 | (176 | ) | |||||||
Less: write-offs, net of recoveries and other adjustments | (4,467 | ) | (1,766 | ) | (1,510 | ) | |||||
Balance, end of period | $ | 11,944 | $ | 6,138 | $ | 3,774 | |||||
Foreign Currency
The functional currency of the Company's foreign subsidiaries is generally the U.S. dollar. For those entities where the functional currency is the local currency, adjustments resulting from translating the financial statements into U.S. dollars are recorded as a component of accumulated other comprehensive income (loss) in stockholders' equity. Monetary assets and liabilities denominated in a foreign currency are translated into U.S. dollars at the exchange rate on the balance sheet date. Revenue and expenses are translated at the average exchange rate during the period. Equity transactions are translated using historical exchange rates. Foreign currency transaction gains and losses are included in other income (expense), net in the consolidated statements of operations.
Cash Equivalents
Cash equivalents consist of highly liquid marketable securities with original maturities of three months or less at the time of purchase and consist primarily of money market funds, commercial paper, U.S. treasury securities and U.S. agency securities. Cash equivalents are stated at fair value.
Marketable Securities
Marketable securities consist of commercial paper, certificates of deposit, U.S. treasury securities, U.S. agency securities, corporate debt securities and municipal securities, and are classified as available-for-sale securities. As the Company views these securities as available to support current operations, it has classified all available-for-sale securities as short-term. Available-for-sale securities are carried at fair value with unrealized gains and losses reported as a component of accumulated other comprehensive income in stockholders' equity, while realized gains and losses and other-than-temporary impairments are reported as a component of net income. For the periods presented, realized and unrealized gains and losses on investments were not material. An impairment charge is recorded in the consolidated statements of operations for declines in fair value below the cost of an individual investment that are deemed to be other than temporary. The Company assesses whether a decline in value is temporary based on the length of time that the fair market value has been below cost, the severity of the decline and the intent and ability to hold or sell the investment. The Company did not identify any marketable securities as other-than-temporarily impaired as of December 31, 2014 and 2013.
Fair Value of Financial Instruments
The Company applies fair value accounting for all financial assets and liabilities and non-financial assets and liabilities that are recognized or disclosed at fair value in the financial statements on a recurring basis. Fair value is based on an expected exit price as defined by the authoritative guidance on fair value measurements, which represents the amount that would be received on the sale of an asset or paid to transfer a liability, as the case may be, in an orderly transaction between market participants. As such, fair value may be based on assumptions that market participants would use in pricing an asset or liability. The authoritative guidance on fair value measurements establishes a consistent framework for measuring fair value on either a recurring or nonrecurring basis whereby inputs, used in valuation techniques, are assigned a hierarchical level. The following are the hierarchical levels of inputs to measure fair value:
• | Level 1: Observable inputs that reflect quoted prices (unadjusted) for identical assets or liabilities in active markets. |
• | Level 2: Inputs reflect: quoted prices for identical assets or liabilities in markets that are not active; quoted prices for similar assets or liabilities in active markets; inputs other than quoted prices that are observable for the assets or liabilities; or inputs that are derived principally from or corroborated by observable market data by correlation or other means. |
-75-
• | Level 3: Unobservable inputs reflecting the Company’s assumptions incorporated in valuation techniques used to determine fair value. These assumptions are required to be consistent with market participant assumptions that are reasonably available. |
The valuation techniques used to measure the fair value of money market funds and treasury securities were derived from quoted market prices for identical instruments in active markets. The valuation technique used to measure the fair value of the Company’s Level 2 fixed income securities are obtained from an independent pricing service, which may use quoted market prices for identical or comparable instruments or model-driven valuation using significant inputs derived from or corroborated by observable market data. The Company's procedures include controls to ensure that appropriate fair values are recorded, including comparing the fair values obtained from the Company's pricing service against fair values obtained from another independent source.
Deferred Commissions
Deferred commissions are the incremental costs that are directly associated with non-cancelable subscription contracts primarily related to sales of the Company’s Talent Solutions products. Deferred commissions consist of sales commissions paid to the Company’s direct sales representatives and certain third-party agencies and are deferred and amortized over the non-cancelable terms of the related customer contracts, which are generally 12 months. The commission payments are generally paid in full the month after the customer contract is signed. The deferred commission amounts are recoverable through future revenue streams under the non-cancelable customer contracts. The Company believes the commission charges are so closely related to the revenue from the non-cancelable customer contracts that they should be recorded as an asset and charged to expense over the same period that the subscription revenue is recognized. Short-term deferred commissions are included in deferred commissions while long-term deferred commissions are included in other assets in the consolidated balance sheets. The amortization of deferred commissions is included in sales and marketing expense in the consolidated statements of operations.
Derivative Financial Instruments
The Company enters into foreign currency derivative contracts with financial institutions to reduce the risk that its cash flows and earnings will be adversely affected by foreign currency exchange rate fluctuations. The Company's foreign currency derivative contracts, which are not designated as hedging instruments, are used to reduce the exchange rate risk associated with its foreign currency denominated monetary assets and liabilities. The Company's program is not designated for trading or speculative purposes. The foreign currency derivative contracts that were not settled as of December 31, 2014 and 2013 are recorded at fair value in the consolidated balance sheets. Foreign currency derivative contracts are marked-to-market at the end of each reporting period and the related gains and losses are recognized in other income (expense), net of transaction gains or losses related to the hedged items in the consolidated statements of operations.
Net realized and unrealized gains and losses were not material for the years ended December 31, 2014, 2013, and 2012. As of December 31, 2014 and 2013, the Company had outstanding foreign currency derivative contracts with a total notional amount of $190.1 million and $94.8 million, respectively.
Property and Equipment
Property and equipment are stated at cost, less accumulated depreciation and amortization. Depreciation is computed using the straight-line method over the estimated useful lives of the assets, which range from two to five years. Leasehold improvements are depreciated over the shorter of the lease term or expected useful lives of the improvements. Depreciation expense totaled $202.3 million, $118.1 million and $70.0 million for the years ended December 31, 2014, 2013 and 2012, respectively.
Website and Internal-Use Software Development Costs
The Company capitalizes certain costs to develop its website, mobile applications and internal-use software when preliminary development efforts are successfully completed, management has committed project resourcing, and it is probable that the project will be completed and the software will be used as intended. Such costs are amortized on a straight-line basis over the estimated useful life of the related asset, which is generally two years. Costs incurred prior to meeting these criteria, together with costs incurred for training and maintenance, are expensed as incurred.
-76-
The Company capitalized website and internal-use software costs of $55.7 million, $39.3 million and $20.0 million for the years ended December 31, 2014, 2013 and 2012, respectively. The Company’s capitalized website and internal-use software depreciation is included in depreciation and amortization in the Company’s consolidated statements of operations, and totaled $40.7 million, $15.6 million and $11.2 million for the years ended December 31, 2014, 2013 and 2012, respectively. The Company had unamortized capitalized website and internal-use software of $59.4 million and $44.3 million in the consolidated balance sheets as of December 31, 2014 and 2013, respectively.
Goodwill, Intangible Assets, Long-Lived Assets and Impairment Assessments
Goodwill. Goodwill represents the excess of the purchase price of an acquired business over the fair value of the underlying net tangible and intangible assets. Goodwill is evaluated for impairment annually in the third quarter of the Company's fiscal year, and whenever events or changes in circumstances indicate the carrying value of goodwill may not be recoverable. Triggering events that may indicate impairment include, but are not limited to, a significant adverse change in member engagement or business climate that could affect the value of goodwill or a significant decrease in expected cash flows. Since inception through December 31, 2014, the Company did not have any goodwill impairment.
Intangible assets. Intangible assets consist of identifiable intangible assets, primarily developed technology, resulting from the Company's acquisitions. Intangible assets acquired in a business combination are measured initially at fair value; other intangible assets are initially measured at cost. Thereafter, intangible assets are amortized on a straight-line basis over their estimated useful lives.
Long-lived assets. The Company evaluates its long-lived assets for impairment including property and equipment and intangible assets, whenever events or changes in circumstances indicate that the carrying amount of such assets may not be recoverable. Recoverability of assets to be held and used is measured by a comparison of the carrying amount of an asset to future undiscounted net cash flows expected to be generated by the asset. If such assets are considered to be impaired, the impairment to be recognized is measured as the amount by which the carrying amount of the assets exceeds the fair value of the assets.
Legal Contingencies
The Company is regularly subject to claims, lawsuits, investigations, and other proceedings that arise in the ordinary course of business. Certain of these matters include speculative claims for substantial or indeterminate amounts of damages. The Company records a liability when it believes that it is both probable that a loss has been incurred, and the amount can be reasonably estimated. Significant judgment is required to determine both likelihood of there being and the estimated amount of a loss related to such matters. The Company periodically evaluates developments in its legal matters that could affect the amount of liability that it has previously accrued, if any, and adjusts accordingly to reflect the impact of negotiations, settlements, rulings, advice of legal counsel, and updated information. Until the final resolution of such matters, there may be an exposure to loss in excess of the amount recorded, and such amounts could be material. Any estimates and assumptions that change or prove to have been incorrect could have a material impact on the Company's business, consolidated financial position, results of operations, or cash flows.
In management’s opinion, there was not at least a reasonable possibility that the Company may have incurred a material loss, or a material loss in excess of a recorded accrual, with respect to loss contingencies for legal and other contingencies as of December 31, 2014. However, because the outcome of litigation is inherently uncertain, if one or more of these legal matters were resolved against the Company in excess of management's expectations, its consolidated financial statements of a particular reporting period could be materially adversely affected.
Revenue Recognition
In general, the Company recognizes revenue when (i) persuasive evidence of an arrangement exists, (ii) delivery has occurred or services have been rendered to the customer, (iii) the fee is fixed or determinable, and (iv) collectability is reasonably assured. Where arrangements have multiple elements, revenue is allocated to the elements based on the relative selling price method and revenue is recognized based on the Company’s policy for each respective element.
The Company generates revenue primarily from sales of the following services:
• | Talent Solutions—Talent Solutions revenue is derived primarily from providing access to the LinkedIn Recruiter product and job postings. The Company provides access to its professional database of both |
-77-
active and passive job candidates with LinkedIn Recruiter, which allows corporate recruiting teams to identify candidates based on industry, job function, geography, experience/education, and other specifications. Revenue from providing access to the LinkedIn Recruiter product is recognized ratably over the subscription period, which consists primarily of annual subscriptions that are billed monthly, quarterly, or annually. The Company also earns revenue from the placement of job postings on its website, which generally run for 30 days. Independent recruiters can pay to post job openings that are accessible through job searches or targeted job matches. Revenue from job postings is recognized as the posting is displayed or at the expiration of the contract period, if unutilized.
• | Marketing Solutions—The Company earns revenue from the display of advertisements (both graphic and text link) on its website primarily based on a cost per advertisement model. Revenue from Internet advertising is generally recognized on a gross basis, with the exception of transactions with advertising agencies, which are recognized net of agency discounts. The typical duration of the Company's advertising contracts is approximately two months. |
• | Premium Subscriptions—The Company sells various subscriptions to customers that allow users to have further access to premium services via its LinkedIn.com website. The Company offers its members monthly or annual subscriptions. Revenue from Premium Subscription services is recognized ratably over the contractual period, generally from one to 12 months. |
Amounts billed or collected in excess of revenue recognized are included as deferred revenue. Sales tax is excluded from reported net revenue. Although historical refunds have been minimal, the Company estimates allowances for each revenue type shown above based on information available as of each balance sheet date. This information includes historical refunds as well as specific known service quality issues. The Company records revenue for transactions in which it acts as an agent on a net basis, and revenue for transactions in which it acts as a principal on a gross basis.
A majority of the Company's arrangements for Talent Solutions and Marketing Solutions include multiple deliverables. The Company allocates consideration at the inception of an arrangement to all deliverables based on the relative selling price method in accordance with the selling price hierarchy. The objective of the hierarchy is to determine the price at which the Company would transact a sale if the service were sold on a stand-alone basis and requires the use of: (i) vendor-specific objective evidence (“VSOE”) if available; (ii) third-party evidence (“TPE”) if VSOE is not available; and (iii) best estimate of selling price (“BESP”) if neither VSOE nor TPE is available.
VSOE. The Company determines VSOE based on its historical pricing and discounting practices for the specific product or service when sold separately. In determining VSOE, the Company requires that a substantial majority of the selling prices for these services fall within a reasonably narrow pricing range.
The Company has not historically priced its Marketing Solutions within a narrow range to establish VSOE for such products. As a result, the Company has established VSOE for a limited number of Talent Solutions products, and for such products, VSOE has been used to allocate the selling price to deliverables.
TPE. When VSOE cannot be established for deliverables in multiple element arrangements, the Company applies judgment with respect to whether it can establish a selling price based on TPE. TPE is determined based on competitor prices for similar deliverables when sold separately. Generally, the Company’s go-to-market strategy differs from that of its peers and its offerings contain a significant level of differentiation such that the comparable pricing of services with similar functionality cannot be obtained. Furthermore, the Company is unable to reliably determine what similar competitor services’ selling prices are on a stand-alone basis. As a result, the Company has not been able to establish selling prices based on TPE.
BESP. When the Company is unable to establish selling prices using VSOE or TPE, the Company uses BESP in its allocation of arrangement consideration. BESP is generally used to allocate the selling price to deliverables in the Company’s multiple element arrangements. The Company determines BESP for deliverables by considering multiple factors including, but not limited to, its pricing practices, prices it charges for similar offerings, sales volume, geographies, market conditions, and the competitive landscape.
Advertising Costs
Advertising costs are expensed when incurred and are included in sales and marketing expense in the consolidated statements of operations. The Company incurred advertising costs of $5.7 million, $3.9 million and $3.6 million for the years ended December 31, 2014, 2013 and 2012, respectively.
-78-
Stock-Based Compensation
Stock-based compensation expense is measured at the grant date based on the fair value of the award and is recognized on a straight-line basis over the requisite service period of the award, which is generally four years. See Note 12, Stockholders' Equity, for additional information.
Leases and Asset Retirement Obligations
The Company leases its office facilities and data centers under operating lease agreements. Office facilities subject to an operating lease and the related lease payments are not recorded on the Company’s balance sheet. The terms of certain lease agreements provide for increasing rental payments; however, the Company recognizes rent expense on a straight-line basis over the term of the lease. Any lease incentives are recognized as reductions of rent expense on a straight-line basis over the term of the lease. The lease term begins on the date of the initial possession of the leased property for purposes of recognizing rent expense.
The Company establishes assets and liabilities for the contractual obligation to retire long-lived assets at the termination or expiration of a lease based on the present value of estimated future costs related to such obligations. Such assets are depreciated over the shorter of the lease period, or the life of the asset, and the recorded liabilities are accreted to the future value of the estimated retirement costs, both of which are included in operating expenses in the consolidated statements of operations.
Rent expense, principally for leased office space and data centers under operating lease commitments, was $94.2 million, $54.9 million and $30.7 million for the years ended December 31, 2014, 2013 and 2012, respectively.
Income Taxes
The Company records income taxes using the asset and liability method which requires the recognition of deferred tax assets and liabilities for the expected future tax consequences of events that have been recognized in the Company’s consolidated financial statements or tax returns. In estimating future tax consequences, generally all expected future events other than enactments or changes in the tax law or rates are considered. Valuation allowances are provided when necessary to reduce deferred tax assets to the amount expected to be realized.
Recently Issued Accounting Guidance
Derivatives and Hedging
In November 2014, the Financial Accounting Standards Board ("FASB") issued new authoritative guidance on determining whether the host contract in a hybrid financial instrument issued in the form of a share is more akin to debt or to equity. The guidance applies to hybrid financial instruments that include embedded derivative features, which must be evaluated to determine whether the nature of the host contract is more akin to debt or to equity and whether the economic characteristics and risks of the embedded derivative feature are clearly and closely related to the host contract. If the host contract is akin to equity, then equity-like features (for example, a conversion option) are considered clearly and closely related to the host contract and, thus, would not be separated from the host contract. If the host contract is akin to debt, then equity-like features are not considered clearly and closely related to the host contract. In the latter case, an entity may be required to separate the equity-like embedded derivative feature from the debt host contract if certain other criteria are met. Similarly, debt-like embedded derivative features may require separate accounting from an equity-like host contract. The standard will be effective for the Company in the first quarter of 2016; however, the Company may elect to early adopt. The Company is currently evaluating whether this standard will have a material impact on its financial statements.
Revenue Recognition
In May 2014, the FASB issued new authoritative guidance on revenue from contracts with customers. The guidance outlines a single comprehensive model for entities to use in accounting for revenue arising from contracts with customers and supersedes most current revenue recognition guidance, including industry-specific guidance. The core principle of the revenue model is that "an entity recognizes revenue to depict the transfer of promised goods or services to customers in an amount that reflects the consideration to which the entity expects to be entitled in exchange for those goods or services." The guidance also requires significantly expanded disclosures about revenue recognition. This standard will be effective for the Company in the first quarter of 2017 and will be applied using either the full or modified retrospective adoption methods. Early adoption of this guidance is not permitted. The Company is currently evaluating adoption methods and whether this standard will have a material impact on its financial results.
-79-
2. | Fair Value Measurements |
The Company’s assets and liabilities that are measured at fair value on a recurring basis, by level, within the fair value hierarchy as of December 31, 2014 and 2013, are summarized as follows (in thousands):
Level 1 | Level 2 | Level 3 | Total | ||||||||||||
December 31, 2014: | |||||||||||||||
Assets: | |||||||||||||||
Cash equivalents: | |||||||||||||||
Money market funds | $ | 95,470 | $ | — | $ | — | $ | 95,470 | |||||||
Commercial paper | — | 54,344 | — | 54,344 | |||||||||||
U.S. treasury securities | 54,349 | — | — | 54,349 | |||||||||||
U.S. agency securities | — | 43,000 | — | 43,000 | |||||||||||
Marketable securities: | |||||||||||||||
Commercial paper | 122,371 | — | 122,371 | ||||||||||||
Certificates of deposit | 5,927 | — | 5,927 | ||||||||||||
U.S. treasury securities | 1,234,568 | — | 1,234,568 | ||||||||||||
U.S. agency securities | 881,962 | — | 881,962 | ||||||||||||
Corporate debt securities | 722,705 | — | 722,705 | ||||||||||||
Municipal securities | 14,889 | — | 14,889 | ||||||||||||
Other current assets: | |||||||||||||||
Foreign currency derivative contracts | — | 5,591 | — | 5,591 | |||||||||||
Total assets | $ | 1,384,387 | $ | 1,850,789 | $ | — | $ | 3,235,176 | |||||||
Liabilities: | |||||||||||||||
Accrued liabilities: | |||||||||||||||
Foreign currency derivative contracts | $ | — | $ | 149 | $ | — | $ | 149 | |||||||
Total liabilities | $ | — | $ | 149 | $ | — | $ | 149 | |||||||
December 31, 2013: | |||||||||||||||
Assets: | |||||||||||||||
Cash equivalents: | |||||||||||||||
Money market funds | $ | 242,712 | $ | — | $ | — | $ | 242,712 | |||||||
Commercial paper | — | 15,698 | — | 15,698 | |||||||||||
U.S. treasury securities | 318,495 | — | — | 318,495 | |||||||||||
U.S. agency securities | — | 50,000 | — | 50,000 | |||||||||||
Repurchase agreements | — | 1,400 | — | 1,400 | |||||||||||
Marketable securities: | |||||||||||||||
Commercial paper | — | 85,947 | — | 85,947 | |||||||||||
Certificates of deposit | — | 20,025 | — | 20,025 | |||||||||||
U.S. treasury securities | 149,908 | — | — | 149,908 | |||||||||||
U.S. agency securities | — | 928,473 | — | 928,473 | |||||||||||
Corporate debt securities | — | 326,345 | — | 326,345 | |||||||||||
Municipal securities | — | 15,514 | — | 15,514 | |||||||||||
Other current assets: | |||||||||||||||
Foreign currency derivative contracts | — | 453 | — | 453 | |||||||||||
Total assets | $ | 711,115 | $ | 1,443,855 | $ | — | $ | 2,154,970 | |||||||
Liabilities: | |||||||||||||||
Accrued liabilities: | — | ||||||||||||||
Foreign currency derivative contracts | $ | — | $ | 1,129 | $ | — | $ | 1,129 | |||||||
Total liabilities | $ | — | $ | 1,129 | $ | — | $ | 1,129 | |||||||
-80-
The fair value of the Company's Level 1 financial instruments, which are traded in active markets, are based on quoted market prices for identical instruments. The fair value of the Company's Level 2 fixed income securities are obtained from an independent pricing service, which may use quoted market prices for identical or comparable instruments or model driven valuations using observable market data or inputs corroborated by observable market data. The Company's procedures include controls to ensure that appropriate fair values are recorded, including comparing the fair values obtained from the Company's pricing service against fair values obtained from other independent sources. The Company's derivative instruments are valued using pricing models that use observable market inputs and, therefore, are classified as Level 2.
See Note 8, Convertible Senior Notes, for the carrying amount and estimated fair value of the Company's convertible senior notes, which are not recorded at fair value as of December 31, 2014.
3. | Acquisitions and Joint Venture |
Fiscal 2014 Acquisitions
Bizo
On August 13, 2014, LinkedIn completed its acquisition of Bizo, Inc. ("Bizo"), a San Francisco, California-based privately held company that enables measurable display and social advertising programs specifically focused on professional segments. LinkedIn's purchase price of $160.3 million for all the outstanding shares of capital stock of Bizo consisted of $153.5 million in cash and the fair value of assumed Bizo equity awards. In connection with these assumed awards, LinkedIn issued 70,172 stock options and 1,788 restricted stock units ("RSUs"). The fair value of the earned portion of assumed stock awards of $6.8 million is included in the purchase price, with the remaining fair value of $4.9 million resulting in post-acquisition compensation expense that will be recognized over the requisite service period of approximately two years from the date of acquisition.
To retain the services of certain former Bizo employees, LinkedIn offered 67,664 shares of non-vested Class A common stock with a total fair value of $14.6 million that will be earned over two years from the date of acquisition. As the shares are subject to post-acquisition employment, the Company is accounting for them as post-acquisition compensation expense.
Bright
On February 28, 2014, LinkedIn completed its acquisition of Bright Media Corporation ("Bright"), a San Francisco, California-based privately held online job board with candidate matching capabilities. LinkedIn's purchase price of $100.6 million for all the outstanding shares of capital stock of Bright consisted of $50.5 million in cash and 241,875 shares of LinkedIn Class A common stock. LinkedIn also issued 11,702 stock options related to assumed Bright equity awards. The fair value of the earned portion of assumed stock options of $0.8 million is included in the purchase price, with the remaining fair value of $1.4 million resulting in post-acquisition compensation expense that will be recognized over the requisite service period of approximately three years from the date of acquisition.
To retain the services of certain former Bright employees, LinkedIn offered 55,186 shares of non-vested Class A common stock with a total fair value of $11.3 million and $2.6 million in cash that will be earned over three years from the date of acquisition. As the equity awards and cash are subject to post-acquisition employment, the Company is accounting for them as post-acquisition compensation expense.
Other acquisitions
LinkedIn completed five other acquisitions for a total purchase price of $23.8 million, which consisted of $16.5 million in cash, 46,091 shares of LinkedIn Class A common stock and assumed equity awards. To retain the services of certain former employees, LinkedIn offered 79,604 shares of unvested Class A common stock with a total fair value of $12.5 million that will be earned over two years from the date of acquisition. As the equity awards are subject to post-acquisition employment, the Company is accounting for them as post-acquisition compensation expense.
-81-
These acquisitions, including Bizo and Bright, have been accounted for as business combinations under the acquisition method and, accordingly, the total purchase price is allocated to the tangible and intangible assets acquired and the liabilities assumed based on their respective fair values on the acquisition dates. The results of operations of these acquisitions have been included in the consolidated financial statements from the date of each respective acquisition. The Company has recognized $22.9 million in revenue related to its acquisition of Bizo. The following table presents the purchase price allocations recorded in the Company's consolidated balance sheets as of the acquisition dates (in thousands):
Bizo | Bright | Other acquisitions | Total | ||||||||||||
Net tangible assets | $ | 8,159 | $ | 905 | $ | 221 | $ | 9,285 | |||||||
Goodwill (1) | 113,551 | 73,851 | 18,445 | 205,847 | |||||||||||
Intangible assets (2) | 47,800 | 32,200 | 5,299 | 85,299 | |||||||||||
Net deferred tax liability | (9,257 | ) | (6,323 | ) | (195 | ) | (15,775 | ) | |||||||
Total purchase price (3) | $ | 160,253 | $ | 100,633 | $ | 23,770 | $ | 284,656 | |||||||
_______________________
(1) | The goodwill represents the excess value of the purchase price over both tangible and intangible assets acquired. The goodwill in these transactions is primarily attributable to expected operational synergies, assembled workforces, and the future development initiatives of the assembled workforces. None of the goodwill is expected to be deductible for tax purposes. |
(2) | Identifiable definite-lived intangible assets were comprised of developed technology of $81.4 million and customer relationships of $3.9 million. The overall weighted-average life of the identifiable definite-lived intangible assets acquired in the purchase of the companies was 3.0 years, which will be amortized on a straight-line basis over their estimated useful lives. |
(3) | Subject to adjustment based on (i) purchase price adjustment provisions contained in the acquisition agreement and (ii) indemnification obligations of the acquired company stockholders. |
Supplemental information on an unaudited pro forma basis, as if the Bright and Bizo acquisitions had been consummated on January 1, 2013, is presented as follows (in thousands, except per share amounts):
Year Ended December 31, | |||||||
2014 | 2013 | ||||||
Revenue | $ | 2,247,187 | $ | 1,574,460 | |||
Net loss attributable to common stockholders | $ | (50,786 | ) | $ | (9,007 | ) | |
Net loss per share attributable to common stockholders - diluted | $ | (0.41 | ) | $ | (0.08 | ) | |
These pro forma results are based on estimates and assumptions, which the Company believes are reasonable. They are not necessarily indicative of the Company's consolidated results of operations in future periods or the results that actually would have been realized had the companies operated on a combined basis during the periods presented. The pro forma results include adjustments primarily related to amortization of developed technology, benefit arrangements in connection with the acquisition, and stock-based compensation expenses for assumed unearned equity awards.
Fiscal 2013 Joint Venture
On November 3, 2013, the Company entered into an agreement to create LinkedIn CN Limited, a joint venture (“JV”) with Dragon Networking, an affiliate of China Broadband Capital, and SCCV IV Success HoldCo, Ltd., an affiliate of Sequoia Capital, (collectively, the “Partners”) to engage in the investment, organization, management and operation of a professional social network in the People’s Republic of China (“PRC”). As of December 31, 2014, the Company owned approximately 93% of the outstanding equity interests in the JV in the form of common shares by contributing intellectual property. The Partners contributed $5.0 million in cash in exchange for 7% of the outstanding equity interests in the form of preferred shares. Pending the occurrence of certain events, the Partners will contribute an additional $20.0 million in cash in exchange for equity interests in the form of preferred shares (“Second Closing”), at which point the Company and the Partners would own approximately 72% and 28% of the outstanding equity interests in the JV, respectively.
-82-
The preferred shares may be callable or puttable, generally at fair value, subject to a floor and cap, following the fifth anniversary of the Second Closing or at the occurrence of certain events.
The Company has determined it is the primary beneficiary of the JV due to the percentage ownership as well as the power to direct the activities that most significantly impact the JV's economic performance. Furthermore, the Company has the right to receive benefits and obligation to absorb losses from the entity. The liabilities of the JV are recourse solely to the JV’s assets, except for as it relates to a guarantee made by the Company to the JV in the event that the JV cannot fulfill the liability resulting from the exercise of the put right by the Partners.
The noncontrolling interest in the JV is classified outside of permanent equity in the Company’s consolidated balance sheet as of December 31, 2014, as the preferred shares include a put right available to the noncontrolling interest holders in the future. Earnings attributable to the noncontrolling interest on the Company’s consolidated financial statements include the accretion to the redemption value.
Fiscal 2013 Acquisition
Pulse
On April 17, 2013, LinkedIn completed its acquisition of Alphonso Labs, Inc. ("Pulse"), a San Francisco, California-based privately held leading mobile news reader and content distribution platform. LinkedIn's purchase price of $47.6 million for all the outstanding shares of capital stock of Pulse consisted of $6.7 million in cash and 225,882 shares of LinkedIn Class A common stock. LinkedIn also issued 9,182 stock options related to assumed Pulse equity awards. The fair value of the earned portion of assumed stock options of $0.3 million is included in the purchase price, with the remaining fair value of $1.2 million resulting in post-acquisition compensation expense that will be recognized over the requisite service period of approximately three years from the date of acquisition.
The acquisition has been accounted for as a business combination under the acquisition method and, accordingly, the total purchase price is allocated to the tangible and intangible assets acquired and the liabilities assumed based on their respective fair values on the acquisition date. Pulse's results of operations have been included in the consolidated financial statements from the date of acquisition. To retain the services of certain former Pulse employees, LinkedIn offered nonvested Class A common stock that will be earned over three years from the date of acquisition. As these equity awards are subject to post-acquisition employment, the Company is accounting for them as post-acquisition compensation expense. In connection with these post-acquisition arrangements, the Company issued 244,601 shares of nonvested Class A common stock with a total fair value of $44.0 million.
The following table presents the purchase price allocation recorded in the Company's consolidated balance sheets on the acquisition date (in thousands):
Total | ||||
Net tangible assets | $ | 221 | ||
Goodwill (1) | 35,657 | |||
Intangible assets (2) | 14,000 | |||
Net deferred tax liability | (2,267 | ) | ||
Total purchase consideration | $ | 47,611 | ||
_______________________
(1) | The goodwill represents the excess value of the purchase price over both tangible and intangible assets acquired and liabilities assumed. The goodwill in this transaction is primarily attributable to expected operational synergies, the assembled workforce, and the future development initiatives of the assembled workforce. None of the goodwill is expected to be deductible for tax purposes. |
(2) | Identifiable definite-lived intangible assets were comprised of developed technology of $9.5 million, trade name of $2.7 million, registered user base of $1.2 million and backlog of $0.6 million. The overall weighted-average life of the identifiable definite-lived intangible assets acquired was 2.9 years, which will be amortized on a straight-line basis over their estimated useful lives. |
Pro forma results of operations for this acquisition have not been presented as the financial impact to the Company’s consolidated financial statements is not material.
-83-
Fiscal 2012 Acquisitions
Slideshare
On May 17, 2012, LinkedIn completed its acquisition of Slideshare, Inc. (“Slideshare”), a San Francisco, California-based privately held provider of a professional and educational content platform that allows users to upload documents to share ideas, conduct research, connect with others, and generate leads for their businesses. LinkedIn’s purchase price of $74.1 million for all the outstanding shares of capital stock of Slideshare consisted of approximately $32.2 million paid in cash consideration and 375,956 shares of LinkedIn Class A common stock. LinkedIn also issued 82,108 stock options and 14,146 RSUs related to assumed Slideshare equity awards. The fair value of the earned portion of assumed stock options and RSUs of $2.4 million is included in the purchase price, with the remaining fair value of $6.9 million resulting in post-acquisition compensation expense that will generally be recognized ratably over two years from the date of acquisition.
The acquisition has been accounted for under the acquisition method, and, accordingly, the total purchase price has been allocated to the tangible and intangible assets acquired and the liabilities assumed based on their respective fair values on the acquisition date. Slideshare’s results of operations have been included in the consolidated financial statements from the date of acquisition. To retain the services of certain former Slideshare employees, LinkedIn offered nonvested Class A common stock and cash bonuses that will be earned in equal semi-annual installments over two years from the date of acquisition. As these equity awards and payments are subject to post-acquisition employment, the Company is accounting for these arrangements as post-acquisition compensation expense. In connection with these post-acquisition arrangements, the Company issued 198,915 shares of nonvested Class A common stock with a total fair value of $20.9 million.
Other acquisitions
In 2012, the Company completed five other acquisitions for total cash consideration of approximately $28.3 million and 297,515 shares of LinkedIn Class A common stock. The total purchase price of these acquisitions, of which two were accounted for as the purchase of an asset and the others as purchases of businesses under the acquisition method, has been allocated to the tangible and identifiable intangible assets acquired and the net liabilities assumed based on their respective fair values on the acquisition dates.
The following table presents the purchase price allocations initially recorded in the Company’s consolidated balance sheets on the respective acquisition dates (in thousands):
Slideshare | Other Acquisitions | Total | |||||||||
Net tangible assets (liabilities) | $ | 3,234 | $ | (456 | ) | $ | 2,778 | ||||
Goodwill (1) | 62,420 | 40,545 | 102,965 | ||||||||
Intangible assets (2) | 12,800 | 21,642 | 34,442 | ||||||||
Net deferred tax liability | (4,369 | ) | (4,984 | ) | (9,353 | ) | |||||
Total purchase consideration | $ | 74,085 | $ | 56,747 | $ | 130,832 | |||||
_______________________
(1) | The goodwill represents the excess value of the purchase price over both tangible and intangible assets acquired. The goodwill in these transactions is primarily attributable to expected operational synergies, the assembled workforces, and the future development initiatives of the assembled workforces. None of the goodwill is expected to be deductible for tax purposes. |
(2) | Identifiable definite-lived intangible assets were comprised of developed technology of $24.3 million, trade name of $4.3 million, patents of $3.4 million, customer relationships of $1.2 million, non-compete agreements of $0.4 million and other intangible assets of $0.8 million. The overall weighted-average life of the identifiable definite-lived intangible assets acquired in the purchase of the companies was 4.5 years, which will be amortized on a straight-line basis over their estimated useful lives. |
The Company’s consolidated financial statements include the operating results of all acquired businesses from the date of each acquisition. Pro forma results of operations for all of these acquisitions have not been presented as the financial impact to the Company’s consolidated financial statements, both individually and in aggregate, are not material.
-84-
4. | Cash and Investments |
The following table presents cash, cash equivalents and available-for-sale investments for the periods presented (in thousands):
Amortized Cost | Gross Unrealized Gains | Gross Unrealized Losses | Estimated Fair Market Value | ||||||||||||
December 31, 2014: | |||||||||||||||
Cash | $ | 213,724 | $ | — | $ | — | $ | 213,724 | |||||||
Cash equivalents: | |||||||||||||||
Money market funds | 95,470 | — | — | 95,470 | |||||||||||
Commercial paper | 54,340 | 4 | — | 54,344 | |||||||||||
U.S. treasury securities | 54,349 | — | — | 54,349 | |||||||||||
U.S. agency securities | 42,999 | 1 | — | 43,000 | |||||||||||
Marketable securities: | |||||||||||||||
Commercial paper | 122,345 | 33 | (7 | ) | 122,371 | ||||||||||
Certificates of deposit | 5,925 | 2 | — | 5,927 | |||||||||||
U.S. treasury securities | 1,234,870 | 64 | (366 | ) | 1,234,568 | ||||||||||
U.S. agency securities | 881,843 | 393 | (274 | ) | 881,962 | ||||||||||
Corporate debt securities | 723,412 | 225 | (932 | ) | 722,705 | ||||||||||
Municipal securities | 14,893 | 4 | (8 | ) | 14,889 | ||||||||||
Total cash, cash equivalents, and marketable securities | $ | 3,444,170 | $ | 726 | $ | (1,587 | ) | $ | 3,443,309 | ||||||
December 31, 2013: | |||||||||||||||
Cash | $ | 174,784 | $ | — | $ | — | $ | 174,784 | |||||||
Cash equivalents: | |||||||||||||||
Money market funds | 242,712 | — | — | 242,712 | |||||||||||
Commercial paper | 15,696 | 2 | — | 15,698 | |||||||||||
U.S. treasury securities | 318,500 | — | (5 | ) | 318,495 | ||||||||||
U.S. agency securities | 50,000 | — | — | 50,000 | |||||||||||
Repurchase agreements | 1,400 | — | — | 1,400 | |||||||||||
Marketable securities: | |||||||||||||||
Commercial paper | 85,930 | 18 | (1 | ) | 85,947 | ||||||||||
Certificates of deposit | 20,025 | 2 | (2 | ) | 20,025 | ||||||||||
U.S. treasury securities | 149,845 | 67 | (4 | ) | 149,908 | ||||||||||
U.S. agency securities | 928,371 | 410 | (308 | ) | 928,473 | ||||||||||
Corporate debt securities | 326,027 | 399 | (81 | ) | 326,345 | ||||||||||
Municipal securities | 15,504 | 14 | (4 | ) | 15,514 | ||||||||||
Total cash, cash equivalents, and marketable securities | $ | 2,328,794 | $ | 912 | $ | (405 | ) | $ | 2,329,301 | ||||||
The following table presents available-for-sale investments by contractual maturity date as of December 31, 2014 (in thousands):
Amortized Cost | Estimated Fair Market Value | ||||||
Due in one year or less | $ | 2,064,242 | $ | 2,064,301 | |||
Due after one year through two years | 919,046 | 918,121 | |||||
Total | $ | 2,983,288 | $ | 2,982,422 | |||
-85-
5. | Property and Equipment |
The following table presents the detail of property and equipment, net, for the periods presented (in thousands):
December 31, | |||||||
2014 | 2013 | ||||||
Land | $ | 179,232 | $ | — | |||
Computer equipment | 489,763 | 347,545 | |||||
Software | 47,157 | 32,103 | |||||
Capitalized website and internal-use software | 131,182 | 80,074 | |||||
Furniture and fixtures | 64,180 | 28,786 | |||||
Leasehold improvements | 235,845 | 116,887 | |||||
Total | 1,147,359 | 605,395 | |||||
Less accumulated depreciation and amortization | (406,450 | ) | (243,654 | ) | |||
Property and equipment, net | $ | 740,909 | $ | 361,741 | |||
In 2014, the Company purchased land for $179.2 million, of which $159.8 million was accounted for as a business combination in accordance with U.S. GAAP. The Company allocated approximately $159.3 million to land, $0.7 million to leases currently in place, and $0.2 million to net liabilities.
6. | Goodwill and Other Intangible Assets |
Goodwill
The following table presents the goodwill activity for the periods presented (in thousands):
Goodwill—December 31, 2012 | $ | 115,214 | |
2013 acquisitions | 35,657 | ||
Goodwill—December 31, 2013 | 150,871 | ||
2014 acquisitions | 205,847 | ||
Goodwill—December 31, 2014 | $ | 356,718 | |
-86-
Other Intangible Assets
The following table presents the detail of other intangible assets for the periods presented (dollars in thousands):
Gross Carrying Amount | Accumulated Amortization | Net Carrying Amount | Weighted- Average Remaining Life (1) | ||||||||||
December 31, 2014: | |||||||||||||
Developed technology | $ | 113,466 | $ | (37,936 | ) | $ | 75,530 | 2.2 years | |||||
Trade name | 7,000 | (5,203 | ) | 1,797 | 1.0 year | ||||||||
Patents | 53,256 | (5,046 | ) | 48,210 | 10.3 years | ||||||||
Customer relationships | 5,100 | (1,161 | ) | 3,939 | 2.6 years | ||||||||
Other intangible assets | 4,152 | (2,353 | ) | 1,799 | 0.9 years | ||||||||
Total | $ | 182,974 | $ | (51,699 | ) | $ | 131,275 | 5.2 years | |||||
December 31, 2013: | |||||||||||||
Developed technology | $ | 37,452 | $ | (16,340 | ) | $ | 21,112 | 2.2 years | |||||
Trade name | 7,000 | (2,869 | ) | 4,131 | 1.9 years | ||||||||
Patents | 16,398 | (1,261 | ) | 15,137 | 11.1 years | ||||||||
Customer relationships | 1,200 | (380 | ) | 820 | 3.4 years | ||||||||
Other intangible assets | 6,705 | (4,859 | ) | 1,846 | 2.0 years | ||||||||
Total | $ | 68,755 | $ | (25,709 | ) | $ | 43,046 | 5.4 years | |||||
__________________
(1) | The weighted-average remaining life of other intangible assets excludes the impact of $0.4 million in indefinite-lived intangible assets as of December 31, 2014 and December 31, 2013. |
Amortization expense for the years ended December 31, 2014, 2013 and 2012 was $34.6 million, $16.4 million and $9.9 million, respectively. Estimated amortization of purchased intangible assets for future periods is as follows (in thousands):
Year Ending December 31, | |||
2015 | $ | 44,338 | |
2016 | 36,397 | ||
2017 | 16,721 | ||
2018 | 4,938 | ||
2019 | 4,789 | ||
Thereafter | 23,671 | ||
Total | $ | 130,854 | |
7. | Accrued Liabilities |
The following table presents the detail of accrued liabilities for the periods presented (in thousands):
December 31, | |||||||
2014 | 2013 | ||||||
Accrued vacation and employee-related expenses | $ | 88,100 | $ | 64,757 | |||
Accrued incentives | 69,583 | 60,081 | |||||
Accrued commissions | 59,357 | 32,218 | |||||
Accrued sales tax and value-added taxes | 11,249 | 10,851 | |||||
Other accrued expenses | 31,900 | 15,097 | |||||
Total | $ | 260,189 | $ | 183,004 | |||
-87-
8. | Convertible Senior Notes |
On November 12, 2014, the Company issued $1,322.5 million aggregate principal amount of convertible senior notes (the “Notes”). The total net proceeds from this offering were $1,305.3 million, after deducting transaction costs related to the initial purchasers’ discount and debt issuance costs.
The Notes are governed by an indenture between the Company, as the issuer, and U.S. Bank National Association, as Trustee. The Notes are unsecured and do not contain any financial covenants or any restrictions on the payment of dividends, the incurrence of senior debt or other indebtedness, or the issuance or repurchase of securities by the Company. The Notes mature on November 1, 2019, unless converted, and bear interest at a rate of 0.50% payable semi-annually in arrears on May 1 and November 1 of each year, commencing May 1, 2015.
The Notes are convertible at an initial conversion rate of 3.3951 shares of common stock per $1,000 principal amount of notes, which is equivalent to an initial conversion price of approximately $294.54 per share of common stock.
Holders may convert their notes under the following circumstances:
• | during any calendar quarter beginning after the calendar quarter ending on March 31, 2015 (and only during such calendar quarter), if, for at least 20 trading days during the 30 consecutive trading days ending on the last trading day of the immediately preceding calendar quarter the last reported sale price of the Company’s Class A common stock is greater than or equal to 130% of the conversion price; |
• | during the five business day period after any five consecutive trading day period when the trading price per $1,000 principal amount of notes for each trading day is less than 98% of the product of the last reported sales price of the Company’s Class A common stock and the conversion rate; or |
• | upon the occurrence of specified corporate events. |
On or after May 1, 2019, up until the close of business on the second trading day immediately preceding the maturity date, a holder may convert all or any portion of its notes regardless of the foregoing conditions. Upon conversion, the Company will pay or deliver, as the case may be, cash, shares of its Class A common stock, or a combination of cash and shares of its Class A common stock, at the Company’s election. The Company intends to settle the principal and interest due on the Notes in cash.
The conversion rate will be subject to adjustment in some events but will not be adjusted for any accrued or unpaid interest. A holder who converts its notes in connection with certain corporate events that constitute a “make-whole fundamental change” per the indenture governing the Notes are, under certain circumstances, entitled to an increase in the conversion rate. In addition, if the Company undergoes a fundamental change prior to the maturity date, holders may require the Company to repurchase for cash all or a portion of its notes at a repurchase price equal to 100% of the principal amount of the repurchased notes, plus accrued and unpaid interest.
In accounting for the issuance of the Notes, the Company separated the Notes into liability and equity components. The carrying amount of the liability component was calculated by measuring the fair value of a similar liability that does not have an associated convertible feature. The carrying amount of the equity component, representing the conversion option, was determined by deducting the fair value of the liability component from the par value of the Notes. The difference between the principal amount of the Notes and the liability component (the “debt discount”) is amortized to interest expense using the effective interest method over the term of the Notes. The equity component of the Notes is included in additional paid-in capital in the consolidated balance sheet and is not remeasured as long as it continues to meet the conditions for equity classification.
The Company incurred transaction costs of approximately $0.7 million related to the issuance of the Notes. In accounting for the transaction costs, the Company allocated the total amount incurred to the liability and equity components using the same proportions as the proceeds from the Notes. Transaction costs attributable to the liability component were recorded in other assets in the consolidated balance sheet and are being amortized to interest expense over the term of the Notes, and transaction costs attributable to the equity component were netted with the equity component in stockholders’ equity.
-88-
The Notes consisted of the following (in thousands):
December 31, | |||
2014 | |||
Liability: | |||
Principal | $ | 1,322,500 | |
Less: debt discount, net of amortization | (240,947 | ) | |
Net carrying amount | $ | 1,081,553 | |
Equity | $ | 230,191 | |
The Company recognized interest expense on the Notes in 2014 as follows (in thousands, except for percentage):
Amount | |||
Contractual interest expense based on 0.50% per annum | $ | 881 | |
Amortization of debt issuance costs | 14 | ||
Amortization of debt discount | 5,902 | ||
Total | $ | 6,797 | |
Effective interest rate of the liability component | 4.7 | % | |
The total estimated fair value of the Notes as of December 31, 2014 was $1,405.2 million. The fair value was determined based on the closing trading price of the Notes as of the last day of trading for the period. The Company considers the fair value of the Notes to be a Level 2 measurement due to the limited trading activity of the Notes.
Based on the closing price of our Class A common stock of $229.71 on December 31, 2014, the if-converted value of the Notes was less than the principal amount.
Note Hedges and Warrants
Concurrently with the issuance of the Notes, the Company purchased options (“Note Hedges”) with respect to its Class A common stock for $248.0 million with certain bank counterparties. The Note Hedges cover up to 4,490,020 shares of the Company's Class A common stock at a strike price of $294.54 per share, which corresponds to the initial conversion price of the Notes, and are exercisable by the Company upon conversion of the Notes. The Note Hedges are intended to reduce the potential economic dilution upon conversion of the Notes. The Note Hedges are separate transactions and are not part of the terms of the Notes. Holders of the Notes will not have any rights with respect to the Note Hedges.
Concurrently with the issuance of the Notes, the Company sold warrants to bank counterparties for total proceeds of $167.3 million that provides the counterparties with the right to buy up to 4,490,020 shares of our Class A common stock at a strike price of $381.82 per share. The warrants are separate transactions and are not part of the Notes or Note Hedges. Holders of the Notes and Note Hedges will not have any rights with respect to the Warrants.
The amounts paid and received for the Note Hedges and warrants have been recorded in additional paid-in capital in the consolidated balance sheets. The fair value of the Note Hedges and warrants are not remeasured through earnings each reporting period. The amounts paid for the Note Hedges are tax deductible expenses, while the proceeds received from the warrants are not taxable.
Impact to Earnings per Share
The Notes will have no impact to diluted earnings per share until the average price of our Class A common stock exceeds the conversion price of $294.54 per share because the principal amount of the Notes is intended to be settled in cash upon conversion. Under the treasury stock method, in periods the Company reports net income, the Company is required to include the effect of additional shares that may be issued under the Notes when the price of the Company’s Class A common stock exceeds the conversion price. Under this method, the cumulative dilutive effect of the Notes would be approximately 1,026,000 shares if the average price of the Company’s Class A
-89-
common stock is $381.82. However, upon conversion, there will be no economic dilution from the Notes, as exercise of the Note Hedges eliminate any dilution from the Notes that would have otherwise occurred when the price of the Company’s Class A common stock exceeds the conversion price. The Note Hedges are required to be excluded from the calculation of diluted earnings per share, as they would be anti-dilutive under the treasury stock method.
The warrants will have a dilutive effect when the average share price exceeds the warrant’s strike price of $381.82 per share. As the price of the Company’s Class A common stock continues to increase above the warrant strike price, additional dilution would occur at a declining rate so that a $10 increase from the warrant strike price would yield cumulative dilution of approximately 1,229,000 diluted shares for EPS purposes. However, upon conversion, the Note Hedges would neutralize the dilution from the Notes so that there would only be dilution from the warrants, which would result in actual dilution of approximately 115,000 shares at a common stock price of $391.82.
9. | Other Income (Expense), Net |
The following table presents the detail of other income (expense), net, for the periods presented (in thousands):
Year Ended December 31, | |||||||||||
2014 | 2013 | 2012 | |||||||||
Interest income | $ | 4,971 | $ | 2,895 | $ | 1,025 | |||||
Interest expense | (6,797 | ) | — | — | |||||||
Net loss on foreign exchange and foreign currency derivative contracts | (3,284 | ) | (1,626 | ) | (672 | ) | |||||
Net realized gain on sales of marketable securities | 117 | 127 | 60 | ||||||||
Other non-operating income (expense), net | 63 | 20 | (161 | ) | |||||||
Total other income (expense), net | $ | (4,930 | ) | $ | 1,416 | $ | 252 | ||||
10. | Income (Loss) Per Share |
Basic and diluted net income (loss) per common share is presented in conformity with the two-class method required for participating securities.
Class A and Class B common stock are the only outstanding equity in the Company. The rights of the holders of Class A and Class B common stock are identical, except with respect to voting and conversion. Each share of Class A common stock is entitled to one vote per share and each share of Class B common stock is entitled to ten votes per share. Shares of Class B common stock may be converted into Class A common stock at any time at the option of the stockholder, and are automatically converted to Class A common stock upon a sale or transfer, subject to certain limited exceptions.
Basic net income (loss) per share attributable to common stockholders is computed using the weighted-average number of common shares outstanding during the period. Diluted net income (loss) per share attributable to common stockholders is computed using the weighted-average number of common shares and, if dilutive, potential common shares outstanding during the period. The Company’s potential common shares consist of shares issuable upon the release of RSUs, and to a lesser extent, the incremental common shares issuable upon the exercise of stock options and purchases related to the 2011 Employee Stock Purchase Plan. The dilutive effect of these potential common shares is reflected in diluted earnings per share by application of the treasury stock method. The computation of the diluted net income (loss) per share of Class A common stock assumes the conversion of Class B common stock, while the diluted net income (loss) per share of Class B common stock does not assume the conversion of Class A common stock as Class A common stock is not convertible into Class B common stock.
The undistributed earnings are allocated based on the contractual participation rights of the Class A and Class B common shares as if the earnings for the year had been distributed. As the liquidation and dividend rights are identical, the undistributed earnings are allocated on a proportionate basis. Further, as the conversion of Class B common stock is assumed in the computation of the diluted net income (loss) per share of Class A common stock, the undistributed earnings are equal to net income (loss) for that computation.
-90-
The following table presents the calculation of basic and diluted net income (loss) per share attributable to common stockholders (in thousands, except per share data):
Year Ended December 31, | |||||||||||||||||||||||
2014 | 2013 | 2012 | |||||||||||||||||||||
Class A | Class B | Class A | Class B | Class A | Class B | ||||||||||||||||||
Basic net income (loss) per share attributable to common stockholders: | |||||||||||||||||||||||
Numerator: | |||||||||||||||||||||||
Allocation of undistributed earnings | $ | (13,659 | ) | $ | (2,088 | ) | $ | 22,443 | $ | 4,326 | $ | 14,735 | $ | 6,874 | |||||||||
Denominator: | |||||||||||||||||||||||
Weighted-average common shares outstanding | 106,518 | 16,282 | 95,282 | 18,361 | 71,711 | 33,455 | |||||||||||||||||
Basic net income (loss) per share attributable to common stockholders | $ | (0.13 | ) | $ | (0.13 | ) | $ | 0.24 | $ | 0.24 | $ | 0.21 | $ | 0.21 | |||||||||
Diluted net income (loss) per share attributable to common stockholders: | |||||||||||||||||||||||
Numerator: | |||||||||||||||||||||||
Allocation of undistributed earnings for basic computation | $ | (13,659 | ) | $ | (2,088 | ) | $ | 22,443 | $ | 4,326 | $ | 14,735 | $ | 6,874 | |||||||||
Reallocation of undistributed earnings as a result of conversion of Class B to Class A shares | (2,088 | ) | — | 4,326 | — | 6,874 | — | ||||||||||||||||
Reallocation of undistributed earnings to Class B shares | — | — | — | 713 | — | 902 | |||||||||||||||||
Allocation of undistributed earnings | $ | (15,747 | ) | $ | (2,088 | ) | $ | 26,769 | $ | 5,039 | $ | 21,609 | $ | 7,776 | |||||||||
Denominator: | |||||||||||||||||||||||
Number of shares used in basic calculation | 106,518 | 16,282 | 95,282 | 18,361 | 71,711 | 33,455 | |||||||||||||||||
Weighted-average effect of dilutive securities | |||||||||||||||||||||||
Add: | |||||||||||||||||||||||
Conversion of Class B to Class A common shares outstanding | 16,282 | — | 18,361 | — | 33,455 | — | |||||||||||||||||
Employee stock options | — | — | 4,128 | 4,025 | 7,288 | 7,151 | |||||||||||||||||
RSUs and other dilutive securities | — | — | 1,173 | — | 390 | — | |||||||||||||||||
Number of shares used in diluted calculation | 122,800 | 16,282 | 118,944 | 22,386 | 112,844 | 40,606 | |||||||||||||||||
Diluted net income (loss) per share attributable to common stockholders | $ | (0.13 | ) | $ | (0.13 | ) | $ | 0.23 | $ | 0.23 | $ | 0.19 | $ | 0.19 | |||||||||
The following weighted-average employee equity awards were excluded from the calculation of diluted net income (loss) per share attributable to common stockholders because their effect would have been anti-dilutive for the periods presented (in thousands):
Year Ended December 31, | ||||||||
2014 | 2013 | 2012 | ||||||
Employee stock options | 4,093 | 588 | 28 | |||||
RSUs and other equity | 4,844 | 162 | 36 | |||||
Total | 8,937 | 750 | 64 | |||||
-91-
11. | Commitments and Contingencies |
Aggregate Future Lease Commitments
The Company leases its office facilities and data centers under operating lease agreements, the longest of which is expected to expire in 2027. The Company’s future minimum payments, which exclude operating expenses, under non-cancelable operating leases for office facilities and data centers having initial terms in excess of one year as of December 31, 2014, are as follows (in thousands):
Year Ending December 31, | Operating Leases (1) | ||
2015 | $ | 114,582 | |
2016 | 135,831 | ||
2017 | 135,716 | ||
2018 | 133,698 | ||
2019 | 132,756 | ||
Thereafter | 790,561 | ||
Total minimum lease payments | $ | 1,443,144 | |
______________________
(1) | In January 2015, the Company entered into a sublease agreement for several buildings it leases in Sunnyvale, California, which have total lease commitments, exclusive of lease incentives, of $230.0 million. Under the sublease agreement, the Company will receive approximately $215.3 million in sublease income over the next 12 years. |
Legal Proceedings
The Company is subject to legal proceedings and litigation arising in the ordinary course of business, including, but not limited to, certain pending patent and privacy matters, including class action lawsuits, as well as inquiries, investigations, audits and other regulatory proceedings. Although occasional adverse decisions or settlements may occur, the Company does not believe that the final disposition of any of these matters will have a material adverse effect on the business. Certain of these matters include speculative claims for substantial or indeterminate amounts of damages, and include claims for injunctive relief. Additionally, the Company's litigation costs are significant. Other regulatory matters could result in fines and penalties being assessed against the Company, and it may become subject to mandatory periodic audits, which would likely increase its regulatory compliance costs. Adverse results of litigation or regulatory matters could also result in the Company being required to change its business practices, which could negatively impact its membership and revenue growth.
The Company records a liability when it believes that it is both probable that a loss has been incurred and the amount can be reasonably estimated. The Company periodically evaluates developments in its legal matters that could affect the amount of liability that it has previously accrued, if any, and makes adjustments as appropriate. Significant judgment is required to determine both likelihood of there being, and the estimated amount of, a loss related to such matters, and the Company’s judgment may be incorrect. The outcome of any proceeding is not determinable in advance. Until the final resolution of any such matters that the Company may be required to accrue for, it may be exposed to loss in excess of the amount accrued, and such amounts could be material.
Indemnifications
In the ordinary course of business, the Company enters into contractual arrangements under which it agrees to provide indemnification of varying scope and terms to business partners and other parties with respect to certain matters, including, but not limited to, losses arising out of the Company’s breach of such agreements and out of intellectual property infringement claims made by third parties. In these circumstances, payment may be conditional on the other party making a claim pursuant to the procedures specified in the particular contract. Further, the Company’s obligations under these agreements may be limited in terms of time and/or amount, and in some instances, it may have recourse against third parties for certain payments. In addition, the Company has indemnification agreements with certain of its directors and executive officers that require it, among other things, to indemnify them against certain liabilities that may arise by reason of their status or service as directors or officers with the Company. The terms of such obligations may vary.
-92-
12. | Stockholders’ Equity |
Follow-on Offering
In September 2013, the Company closed a follow-on offering, at which time it sold a total of 6,188,340 shares of its Class A common stock (inclusive of 807,174 shares from the full exercise of the over-allotment option granted to the underwriters). The public offering price of the shares sold in the offering was $223.00 per share. The total gross proceeds from the offering to the Company were $1,380.0 million. After deducting underwriting discounts and commissions and offering expenses, the aggregate net proceeds received by the Company totaled approximately $1,348.1 million.
Preferred Stock
After its initial public offering ("IPO"), the Company had 100,000,000 shares of preferred stock authorized, none of which were issued and outstanding as of December 31, 2014 and 2013.
Common Stock
Following its IPO, the Company has two classes of authorized common stock outstanding; Class A common stock and Class B common stock at a maximum aggregate number authorized of 1,000,000,000 and 120,000,000, respectively. As of December 31, 2014, the Company had outstanding 109,259,689 shares of Class A common stock and 15,782,261 shares of Class B common stock. The rights of the holders of Class A and Class B common stock are identical, except with respect to voting and conversion. Each share of Class A common stock is entitled to one vote per share and each share of Class B common stock is entitled to ten votes per share. Shares of Class B common stock may be converted into Class A common stock at any time at the option of the stockholder, and are automatically converted upon sale or transfer to Class A common stock, subject to certain limited exceptions. After its IPO, the Company had an additional 1,000,000,000 shares of common stock authorized, none of which were issued and outstanding as of December 31, 2014 and 2013.
Common Stock Reserved for Future Issuance
As of December 31, 2014, the Company had reserved shares of common stock for future issuances in connection with the following:
Options outstanding | 3,027,717 | |
RSUs outstanding | 5,140,627 | |
Available for future stock option and RSU grants | 5,571,416 | |
Available for future employee stock purchase plan awards | 2,623,788 | |
Total reserved for future issuance | 16,363,548 | |
Equity Incentive Plans
The Company has two equity incentive plans: the Amended and Restated 2003 Stock Incentive Plan (the “2003 Plan”) and the 2011 Equity Incentive Plan (the “2011 Plan” and together with the 2003 Plan, the "Equity Plans"). As of December 31, 2014, a total of 50,814,756 shares of common stock were reserved for the issuance of equity awards under the Equity Plans. Upon the Company's IPO in 2011, the 2003 Plan was terminated and all shares that remained available for future issuance under the 2003 Plan at the time of its termination were transferred to the 2011 Plan. No further equity awards can be granted under the 2003 Plan. As of December 31, 2014, 1,844,687 options to purchase common stock granted under the 2003 Plan remain outstanding. Any of these shares that expire, are forfeited, are repurchased by the Company or are otherwise terminated will become available under the 2011 Plan. As of December 31, 2014, the total number of shares available for future grants under the 2011 Plan was 5,571,416 shares, including shares transferred from the 2003 Plan.
Under the 2011 Plan, the Company has the ability to issue incentive stock options ("ISOs"), nonstatutory stock options ("NSOs"), stock appreciation rights, restricted stock, RSUs, performance units and/or performance shares. The ISOs and NSOs will be granted at a price per share not less than the market value of the underlying stock at date of grant. Option grants are generally NSOs and granted only to certain employees and members of the Company’s Board. Options granted to existing employees generally vest monthly over a four-year period, while options granted to new employees vest over a four-year period with 25% vesting at the end of one year and the
-93-
remainder vesting monthly thereafter. Options granted generally are exercisable up to ten years. RSUs generally vest over a four-year period with 25% vesting at the end of one year and the remainder vesting quarterly thereafter.
Employee Stock Purchase Plan
The Employee Stock Purchase Plan (the "ESPP") allows eligible employees to purchase shares of the Company’s Class A common stock at a discount through payroll deductions of up to 10% of their eligible compensation, subject to any plan limitations. The ESPP provides for six-month offering periods, and at the end of each offering period, employees are able to purchase shares at 85% of the lower of the fair market value of the Company’s Class A common stock on the first trading day of the offering period or on the last day of the offering period. As of December 31, 2014, a total of 3,500,000 shares of common stock were reserved for the issuance of equity awards under the ESPP. Employees purchased 261,108 shares of common stock at an average exercise price of $125.68 in fiscal 2014. As of December 31, 2014, approximately 2,623,788 shares remained available for future issuance.
Stock Option Activity
A summary of stock option activity in 2014 is as follows:
Options Outstanding | Weighted- Average Remaining Contractual Term (in years) | Aggregate Intrinsic Value (in thousands) | ||||||||||
Number of Shares | Weighted- Average Exercise Price | |||||||||||
Outstanding—December 31, 2013 | 5,130,636 | $ | 34.54 | |||||||||
Assumed options from acquisitions | 83,797 | 51.47 | ||||||||||
Granted | 428,026 | 208.05 | ||||||||||
Exercised | (2,371,271 | ) | 14.17 | |||||||||
Canceled or expired | (243,471 | ) | 108.65 | |||||||||
Outstanding—December 31, 2014 | 3,027,717 | $ | 69.53 | 6.23 | $ | 485,209 | ||||||
Options vested and expected to vest as of December 31, 2014 | 2,922,212 | $ | 65.45 | 6.14 | $ | 480,199 | ||||||
Options vested and exercisable as of December 31, 2014 | 2,088,190 | $ | 30.59 | 5.32 | $ | 415,826 | ||||||
Aggregate intrinsic value represents the difference between the Company’s closing stock price of its Class A common stock and the exercise price of outstanding, in-the-money options. The Company’s closing stock price as reported on the New York Stock Exchange as of December 31, 2014 was $229.71. The total intrinsic value of options exercised was approximately $440.3 million, $655.9 million and $553.5 million for the years ended December 31, 2014, 2013 and 2012, respectively. As of December 31, 2014, total unrecognized compensation cost, adjusted for estimated forfeitures, related to unvested stock options was approximately $55.8 million, which is expected to be recognized over the next 2.56 years.
The following table summarizes information about outstanding and vested stock options as of December 31, 2014:
-94-
Options Outstanding | Options Vested and Exercisable | ||||||||||||||
Exercise Price | Numbers of Shares Outstanding | Weighted Average Remaining Contractual Life (Years) | Weighted Average Exercise Price | Number of Shares | Weighted Average Exercise Price | ||||||||||
$0.06 - $1.50 | 28,501 | 2.60 | $ | 1.08 | 28,501 | $ | 1.08 | ||||||||
$2.32 | 902,415 | 4.13 | 2.32 | 902,415 | 2.32 | ||||||||||
$3.00 - $14.46 | 355,184 | 5.45 | 7.97 | 351,940 | 7.99 | ||||||||||
$14.50 - $19.63 | 271,147 | 6.14 | 19.30 | 209,554 | 19.44 | ||||||||||
$22.59 | 316,524 | 6.16 | 22.59 | 246,526 | 22.59 | ||||||||||
$45.00 - $161.34 | 203,379 | 6.70 | 74.21 | 108,324 | 56.52 | ||||||||||
$170.46 | 524,195 | 8.08 | 170.46 | 175,149 | 170.46 | ||||||||||
$172.02 - $204.04 | 322,960 | 9.06 | 201.57 | 54,484 | 197.48 | ||||||||||
$207.33 - $233.08 | 90,930 | 9.65 | 227.93 | 7,138 | 222.69 | ||||||||||
$233.64 | 12,482 | 8.59 | 233.64 | 4,159 | 233.64 | ||||||||||
3,027,717 | 6.23 | $ | 69.53 | 2,088,190 | $ | 30.59 | |||||||||
RSU Activity
A summary of RSU activity in 2014, is as follows:
Number of Shares | Weighted- Average Grant Date Fair Value | |||||
Unvested—December 31, 2013 | 4,048,089 | $ | 144.53 | |||
Assumed from acquisitions | 5,582 | 175.34 | ||||
Granted | 3,411,742 | 195.36 | ||||
Released | (1,628,389 | ) | 147.29 | |||
Canceled | (696,397 | ) | 149.08 | |||
Unvested—December 31, 2014 | 5,140,627 | $ | 176.78 | |||
The intrinsic value of RSUs released was approximately $317.7 million, $238.8 million and $29.8 million for the years ended December 31, 2014, 2013 and 2012, respectively. The total intrinsic value of unvested RSUs as of December 31, 2014 was $1,180.9 million. The total RSUs expected to vest as of December 31, 2014 was 4,562,072 shares with an intrinsic value of $1,047.9 million. As of December 31, 2014, total unrecognized compensation cost, adjusted for estimated forfeitures, related to RSUs was approximately $743.6 million, which is expected to be recognized over the next 2.82 years.
Restricted Stock
In connection with certain acquisitions, the Company has granted 202,454 shares of restricted stock. As of December 31, 2014, the total unrecognized compensation cost related to restricted stock was approximately $47.5 million, which is expected to be recognized over the next 1.57 years.
Stock-Based Compensation Expense
The fair value of options granted to employees is estimated on the grant date using the Black-Scholes option valuation model. This valuation model for stock-based compensation expense requires the Company to make assumptions and judgments about the variables used in the calculation, including the expected term, the volatility of the Company’s common stock, a risk-free interest rate, and expected dividends. Beginning in 2014, the Company transitioned from using the simplified method for calculating the expected term of options as described in the SEC's Staff Accounting Bulletin No. 107, Share-Based Payment, because it believes there is sufficient historical information to derive a reasonable estimate. The calculation considers a combination of historical and estimated future exercise behavior. The volatility for stock options is based on an average of the historical volatilities of the common stock of several entities with characteristics similar to those of the Company. The volatility for ESPP is based on the historical volatility of the Company's common stock. The risk-free rate is based on the U.S. Treasury yield curve in effect at the time of grant for periods corresponding with the expected life of the option. The Company
-95-
uses an expected dividend yield of zero as it does not anticipate paying any dividends in the foreseeable future. The Company also estimates forfeitures of unvested stock options based on the Company’s historical experience. To the extent actual forfeitures differ from the estimates, the difference will be recorded as a cumulative adjustment in the period estimates are revised. Compensation cost is not recorded for options that do not vest.
The following table presents the weighted-average assumptions used to estimate the fair value of options granted during the periods presented, excluding assumed acquisition-related stock options:
Year Ended December 31, | ||||||||
2014 | 2013 | 2012 | ||||||
Volatility | 45 | % | 54 | % | 54 | % | ||
Expected dividend yield | — | — | — | |||||
Risk-free rate | 1.17 | % | 1.15 | % | 0.95 | % | ||
Expected term (in years) | 4.07 | 6.27 | 6.08 | |||||
The weighted-average grant date fair value of options granted, excluding assumed acquisition-related stock options, was $76.39, $89.13 and $51.76, for the years ended December 31, 2014, 2013 and 2012, respectively. The weighted-average grant date fair value of assumed acquisition-related stock options for the years ended December 31, 2014 and 2013 was $164.71 and $166.08, respectively.
The following table presents the weighted-average assumptions used to estimate the fair value of the ESPP during the periods presented:
Year Ended December 31, | ||||||||
2014 | 2013 | 2012 | ||||||
Volatility | 44 | % | 42 | % | 48 | % | ||
Expected dividend yield | — | — | — | |||||
Risk-free rate | 0.06 | % | 0.10 | % | 0.14 | % | ||
Expected term (in years) | 0.50 | 0.50 | 0.50 | |||||
The following table presents the amount of stock-based compensation related to stock-based awards to employees on the Company’s consolidated statements of operations during the periods presented (in thousands):
Year Ended December 31, | |||||||||||
2014 | 2013 | 2012 | |||||||||
Cost of revenue | $ | 28,617 | $ | 15,600 | $ | 6,416 | |||||
Sales and marketing | 60,166 | 36,187 | 17,726 | ||||||||
Product development | 154,856 | 98,861 | 46,026 | ||||||||
General and administrative | 75,494 | 43,267 | 16,151 | ||||||||
Total stock-based compensation | 319,133 | 193,915 | 86,319 | ||||||||
Tax benefit from stock-based compensation | (90,542 | ) | (52,559 | ) | (20,395 | ) | |||||
Total stock-based compensation, net of tax effect | $ | 228,591 | $ | 141,356 | $ | 65,924 | |||||
The Company capitalized $13.1 million, $9.2 million and $3.4 million of stock-based compensation as website development costs for the years ended December 31, 2014, 2013 and 2012, respectively. Management modified or accelerated the vesting terms for certain employee options, which resulted in an additional $0.1 million, $1.3 million and $3.0 million of stock-based compensation expense for the years ended December 31, 2014, 2013 and 2012, respectively.
13. | Income Taxes |
The Company accounts for income taxes in accordance with authoritative guidance, which requires the use of the asset and liability method. Under this method, deferred income tax assets and liabilities are determined based upon the difference between the consolidated financial statement carrying amounts and the tax basis of assets and liabilities and are measured using the enacted tax rate expected to apply to taxable income in the years in which the differences are expected to be reversed.
-96-
The following table presents domestic and foreign components of income before income taxes for the periods presented (in thousands):
Year Ended December 31, | |||||||||||
2014 | 2013 | 2012 | |||||||||
Domestic | $ | 149,453 | $ | 145,421 | $ | 110,535 | |||||
Foreign | (118,248 | ) | (96,193 | ) | (53,421 | ) | |||||
Total | $ | 31,205 | $ | 49,228 | $ | 57,114 | |||||
The following table presents the components of the provision for income taxes for the periods presented (in thousands):
Year Ended December 31, | |||||||||||
2014 | 2013 | 2012 | |||||||||
Current: | |||||||||||
Federal | $ | 99,377 | $ | 35,754 | $ | 30,919 | |||||
State | 10,343 | 5,513 | 3,452 | ||||||||
Foreign | 11,534 | 10,358 | 4,390 | ||||||||
Total current | 121,254 | 51,625 | 38,761 | ||||||||
Deferred: | |||||||||||
Federal | (67,415 | ) | (25,469 | ) | (395 | ) | |||||
State | (5,992 | ) | (2,579 | ) | (2,629 | ) | |||||
Foreign | (1,322 | ) | (1,118 | ) | (233 | ) | |||||
Total deferred | (74,729 | ) | (29,166 | ) | (3,257 | ) | |||||
Total provision | $ | 46,525 | $ | 22,459 | $ | 35,504 | |||||
The following table presents a reconciliation of the statutory federal rate and the Company’s effective tax rate for the periods presented:
Year Ended December 31, | ||||||||
2014 | 2013 | 2012 | ||||||
U.S. federal taxes at statutory rate | 35 | % | 35 | % | 35 | % | ||
State income taxes, net of federal benefit | 9 | 4 | 2 | |||||
Foreign rate differential | 106 | 36 | 12 | |||||
Permanent differences | 5 | 1 | 1 | |||||
Stock-based compensation | 5 | 5 | 3 | |||||
Change in valuation allowance | — | — | (2 | ) | ||||
Research and development credits | (57 | ) | (56 | ) | — | |||
Transaction-related expenses | 44 | 23 | 11 | |||||
Other | 2 | (2 | ) | — | ||||
Total | 149 | % | 46 | % | 62 | % | ||
On December 19, 2014, the President signed into law The Tax Increase Prevention Act of 2014 (the "2014 Act"). Under prior law, a taxpayer was entitled to a research tax credit for qualifying amounts paid or incurred on or before December 31, 2013. The 2014 Act extended the research credit for one year to December 31, 2014. The extension of the research credit was retroactive and includes amounts paid or incurred after December 31, 2013. As a result of the retroactive extension, the Company recognized a tax benefit of $15.5 million in the twelve months ended December 31, 2014 for qualifying amounts incurred in 2014.
-97-
Deferred income taxes reflect the net tax effects of temporary differences between the carrying amounts of assets and liabilities for financial reporting purposes and the amounts used for income tax purposes. The following table presents the significant components of the Company’s deferred tax assets and liabilities for the periods presented (in thousands):
December 31, | |||||||
2014 | 2013 | ||||||
Deferred tax assets: | |||||||
Accruals and reserves | $ | 83,805 | $ | 34,801 | |||
Net operating loss carryforwards | 4,083 | 2,129 | |||||
Tax credit carryforwards | 38,411 | 23,917 | |||||
Stock-based compensation | 33,194 | 22,030 | |||||
Other | 11,352 | 1,298 | |||||
Total deferred tax assets | 170,845 | 84,175 | |||||
Less valuation allowance | (43,671 | ) | (27,302 | ) | |||
Net deferred tax assets | 127,174 | 56,873 | |||||
Deferred tax liability: | |||||||
Prepaid expenses | (3,891 | ) | (3,485 | ) | |||
Intangible assets | (17,863 | ) | (4,905 | ) | |||
Depreciation | (20,740 | ) | (30,444 | ) | |||
Other | (2,123 | ) | (677 | ) | |||
Total deferred tax liabilities | (44,617 | ) | (39,511 | ) | |||
Total net deferred tax assets | $ | 82,557 | $ | 17,362 | |||
Realization of deferred tax assets is dependent upon the generation of future taxable income, if any, the timing and amount of which are uncertain. Due to the history of losses the Company has generated in the past in certain jurisdictions, the Company believes that it is more likely than not that California and certain international deferred tax assets will not be realized as of December 31, 2014. Accordingly, the Company has recorded a valuation allowance on such deferred tax assets. The valuation allowance increased by $16.4 million and $12.1 million in 2014 and 2013, respectively. The increase in the valuation allowance for 2014 is primarily related to California research and development credits.
Pursuant to authoritative guidance, the benefit of stock options will only be recorded to stockholders’ equity when cash taxes payable is reduced. As of December 31, 2014, the portion of net operating loss carryforwards and credit carryforwards related to stock options is approximately $394.3 million tax-effected. This amount will be credited to stockholders' equity when it is realized on the tax return.
As of December 31, 2014, the Company had net operating loss carryforwards for federal income tax return purposes of approximately $905.3 million, which expire at various dates beginning in the year 2023, if not utilized. The Company had net operating loss carryforwards of approximately $508.9 million for California income tax return purposes and approximately $1,078.8 million for other state income tax return purposes which expire at various dates beginning in the year 2013, if not utilized.
As of December 31, 2014, the Company had research and development credit carryforwards for federal income tax return purposes of approximately $60.4 million, which expire at various dates beginning in the year 2023, if not utilized. The Company had research and development credit carryforwards for state income tax return purposes of approximately $76.0 million, which can be carried forward indefinitely.
Utilization of the net operating loss carryforwards and credits may be subject to a substantial annual limitation due to the ownership change limitations provided by the Internal Revenue Code of 1986, as amended and similar state provisions. The annual limitation may result in the expiration of net operating losses and credits before utilization. The Company believes an ownership change, as defined under Section 382 of the Internal Revenue Code, existed in prior years, and has reduced its net operating loss carryforwards to reflect the limitation.
-98-
As of December 31, 2014, the Company had approximately $66.5 million in total unrecognized tax benefits. A reconciliation of the beginning and ending amount of unrecognized tax benefits is as follows (in thousands):
Year Ended December 31, | |||||||
2014 | 2013 | ||||||
Unrecognized tax benefits balance at January 1 | $ | 43,735 | $ | 19,344 | |||
Gross increase for tax positions of prior years | 2,116 | 9,482 | |||||
Gross decrease for tax positions of prior years | (264 | ) | — | ||||
Gross increase for tax positions of current year | 20,921 | 14,909 | |||||
Gross unrecognized tax benefits at December 31 | $ | 66,508 | $ | 43,735 | |||
If the $66.5 million of unrecognized tax benefits as of December 31, 2014 is recognized, approximately $38.1 million would decrease the effective tax rate in the period in which each of the benefits is recognized. If the $43.7 million of unrecognized tax benefits as of December 31, 2013 is recognized, approximately $25.3 million would decrease the effective tax rate in the period in which each of the benefits is recognized. The remaining amount would be offset by the reversal of related deferred tax assets on which a valuation allowance is placed. The Company does not expect any material changes to its unrecognized tax benefits within the next twelve months.
The Company recognizes interest and penalties related to uncertain tax positions in income tax expense. As of December 31, 2014 and 2013, penalties and interest were immaterial.
The Company files income tax returns in the U.S. federal jurisdiction as well as many U.S. states and foreign jurisdictions. The tax years 2003 to 2013 remain open to examination by the major jurisdictions in which the Company is subject to tax. Fiscal years outside the normal statute of limitation remain open to audit by tax authorities due to tax attributes generated in those early years which have been carried forward and may be audited in subsequent years when utilized. The Company is currently under audit by the Internal Revenue Service (“IRS”) for the 2010 through 2012 tax years. The Company is subject to the continuous examination of income tax returns by various tax authorities. The Company regularly assesses the likelihood of adverse outcomes resulting from these examinations to determine the adequacy of the provision for income taxes. The Company believes that adequate amounts have been reserved for any adjustments that may ultimately result from these examinations and does not anticipate a significant impact to the gross unrecognized tax benefits within the next 12 months related to these years.
The Company attributes net revenue, costs and expenses to domestic and foreign components based on the terms of its agreements with its subsidiaries. The Company does not provide for federal income taxes on the undistributed earnings of its foreign subsidiaries, as such earnings are to be reinvested offshore indefinitely. The income tax liability would be insignificant if these earnings were to be repatriated.
14. | Information About Revenue and Geographic Areas |
The Company considers operating segments to be components of the Company in which separate financial information is available that is evaluated regularly by the Company’s chief operating decision maker in deciding how to allocate resources and in assessing performance. The chief operating decision maker for the Company is the Chief Executive Officer ("CEO"). The CEO reviews financial information presented on a consolidated basis, accompanied by information about revenue by product, sales channel, and geographic region for purposes of allocating resources and evaluating financial performance. Accordingly, the Company has determined that it has one operating segment, and therefore, one reportable segment.
In the second quarter of 2014, recruitment media products were reclassified from Marketing Solutions to Talent Solutions as they are generally sold to Talent Solutions customers. Accordingly, prior period amounts have been recast to conform to the current period presentation. Recruitment media revenue in 2014, 2013 and 2012 was $72.2 million, $50.6 million and $23.0 million, respectively.
Revenue by geography is generally based on the shipping address of the customer. The following tables present the Company’s revenue by product line, as well as revenue and long-lived assets by geographic region for the periods presented (in thousands):
-99-
Year Ended December 31, | |||||||||||
2014 | 2013 | 2012 | |||||||||
Net revenue by product: | |||||||||||
Talent Solutions | $ | 1,327,737 | $ | 910,257 | $ | 546,585 | |||||
Marketing Solutions | 454,500 | 311,777 | 235,275 | ||||||||
Premium Subscriptions | 436,530 | 306,511 | 190,449 | ||||||||
Total | $ | 2,218,767 | $ | 1,528,545 | $ | 972,309 | |||||
Year Ended December 31, | |||||||||||
2014 | 2013 | 2012 | |||||||||
Net revenue by geographic region: | |||||||||||
United States | $ | 1,333,978 | $ | 942,122 | $ | 619,485 | |||||
Other Americas (1) | 143,207 | 109,672 | 66,099 | ||||||||
Total Americas | 1,477,185 | 1,051,794 | 685,584 | ||||||||
EMEA (2) | 554,567 | 358,244 | 217,342 | ||||||||
APAC (3) | 187,015 | 118,507 | 69,383 | ||||||||
Total | $ | 2,218,767 | $ | 1,528,545 | $ | 972,309 | |||||
______________________
(1) | Canada, Latin America and South America |
(2) | Europe, the Middle East and Africa (“EMEA”) |
(3) | Asia-Pacific (“APAC”) |
No individual customer accounted for 10% or more of consolidated net revenue or accounts receivable for any of the periods presented.
Long-Lived Assets
December 31, | |||||||||||
2014 | 2013 | 2012 | |||||||||
United States | $ | 657,788 | $ | 328,384 | $ | 172,278 | |||||
Other Americas | 11,326 | 3,836 | 1,071 | ||||||||
Total Americas | 669,114 | 332,220 | 173,349 | ||||||||
EMEA | 40,944 | 13,918 | 6,714 | ||||||||
APAC | 30,851 | 15,603 | 6,614 | ||||||||
Total | $ | 740,909 | $ | 361,741 | $ | 186,677 | |||||
15. | Subsequent Events |
In January 2015, the Company entered into a sublease agreement for several buildings it leases in Sunnyvale, California, which have total lease commitments, exclusive of lease incentives, of $230.0 million. Under the sublease agreement, the Company will receive approximately $215.3 million in sublease income over the next 12 years.
-100-
Item 9. | Changes in and Disagreements with Accountants on Accounting and Financial Disclosure |
None.
Item 9A. | Controls and Procedures |
Disclosure Controls and Procedures
As of the end of the period covered by this report, our management conducted an evaluation, under the supervision and with the participation of our Chief Executive Officer and Chief Financial Officer, of the effectiveness of the design and operation of our disclosure controls and procedures, as such term is defined in the Securities Exchange Act of 1934 (the Exchange Act). Based upon that evaluation, our Chief Executive Officer and Chief Financial Officer concluded that our disclosure controls and procedures were effective as of the end of the period covered by this report in ensuring that information required to be disclosed was recorded, processed, summarized and reported within the time periods specified in the SEC's rules and forms, and to provide reasonable assurance that information required to be disclosed by us in such reports is accumulated and communicated to our management, including our Chief Executive Officer and Chief Financial Officer, as appropriate to allow timely decisions regarding required disclosure.
Management's Report on Internal Control Over Financial Reporting
Our management is responsible for establishing and maintaining adequate internal control over financial reporting, as such term is defined in the Exchange Act. Under the supervision and with the participation of our Chief Executive Officer and Chief Financial Officer, our management conducted an evaluation of the effectiveness of our internal control over financial reporting based upon the framework in “Internal Control - Integrated Framework (2013)” issued by the Committee of Sponsoring Organizations of the Treadway Commission. Based on that evaluation, management concluded that our internal control over financial reporting was effective as of December 31, 2014.
Deloitte & Touche LLP, an independent registered public accounting firm, has audited the consolidated financial statements included in this Form 10-K and, as part of the audit, has issued a report, included herein, on the effectiveness of LinkedIn's internal control over financial reporting as of December 31, 2014.
Changes in Internal Control over Financial Reporting
During the fourth quarter of fiscal 2014, there were no changes in the internal control over financial reporting that materially affected, or are reasonably likely to materially affect, LinkedIn's internal control over financial reporting.
Inherent Limitations of Disclosure Controls and Procedures and Internal Control over Financial Reporting
It should be noted that any system of controls, however well designed and operated, can provide only reasonable, and not absolute, assurance that the objectives of the system will be met. In addition, the design of any control system is based in part upon certain assumptions made by management about the likelihood of future events.
-101-
REPORT OF INDEPENDENT REGISTERED PUBLIC ACCOUNTING FIRM
To the Board of Directors and Stockholders of
LinkedIn Corporation
Mountain View, California
We have audited the internal control over financial reporting of LinkedIn Corporation and subsidiaries (the "Company") as of December 31, 2014, based on criteria established in Internal Control - Integrated Framework (2013) issued by the Committee of Sponsoring Organizations of the Treadway Commission. The Company's management is responsible for maintaining effective internal control over financial reporting and for its assessment of the effectiveness of internal control over financial reporting, included in the accompanying Management's Report on Internal Control over Financial Reporting. Our responsibility is to express an opinion on the Company's internal control over financial reporting based on our audit.
We conducted our audit in accordance with the standards of the Public Company Accounting Oversight Board (United States). Those standards require that we plan and perform the audit to obtain reasonable assurance about whether effective internal control over financial reporting was maintained in all material respects. Our audit included obtaining an understanding of internal control over financial reporting, assessing the risk that a material weakness exists, testing and evaluating the design and operating effectiveness of internal control based on the assessed risk, and performing such other procedures as we considered necessary in the circumstances. We believe that our audit provides a reasonable basis for our opinion.
A company's internal control over financial reporting is a process designed by, or under the supervision of, the company's principal executive and principal financial officers, or persons performing similar functions, and effected by the company's board of directors, management, and other personnel to provide reasonable assurance regarding the reliability of financial reporting and the preparation of financial statements for external purposes in accordance with generally accepted accounting principles. A company's internal control over financial reporting includes those policies and procedures that (1) pertain to the maintenance of records that, in reasonable detail, accurately and fairly reflect the transactions and dispositions of the assets of the company; (2) provide reasonable assurance that transactions are recorded as necessary to permit preparation of financial statements in accordance with generally accepted accounting principles, and that receipts and expenditures of the company are being made only in accordance with authorizations of management and directors of the company; and (3) provide reasonable assurance regarding prevention or timely detection of unauthorized acquisition, use, or disposition of the company's assets that could have a material effect on the financial statements.
Because of the inherent limitations of internal control over financial reporting, including the possibility of collusion or improper management override of controls, material misstatements due to error or fraud may not be prevented or detected on a timely basis. Also, projections of any evaluation of the effectiveness of the internal control over financial reporting to future periods are subject to the risk that the controls may become inadequate because of changes in conditions, or that the degree of compliance with the policies or procedures may deteriorate.
In our opinion, the Company maintained, in all material respects, effective internal control over financial reporting as of December 31, 2014, based on the criteria established in Internal Control - Integrated Framework (2013) issued by the Committee of Sponsoring Organizations of the Treadway Commission.
We have also audited, in accordance with the standards of the Public Company Accounting Oversight Board (United States), the consolidated financial statements as of and for the year ended December 31, 2014, of the Company and our report dated February 12, 2015, expressed an unqualified opinion on those financial statements.
/s/ DELOITTE & TOUCHE LLP
San Jose, California
February 12, 2015
-102-
Item 9B. | Other Information |
None.
PART III
Item 10. | Directors, Executive Officers and Corporate Governance |
The information required by this item will be contained in our definitive proxy statement to be filed with the Securities and Exchange Commission in connection with our 2015 annual meeting of stockholders (the “Proxy Statement”), which is expected to be filed not later than 120 days after the end of our fiscal year ended December 31, 2014, and is incorporated in this report by reference.
Item 11. | Executive Compensation |
The information required by this item will be set forth in the Proxy Statement and is incorporated herein by reference.
Item 12. | Security Ownership of Certain Beneficial Owners and Management and Related Stockholder Matters |
The information required by this item will be set forth in the Proxy Statement and is incorporated herein by reference.
Item 13. | Certain Relationships and Related Transactions and Director Independence |
The information, if any, required by this item will be set forth in the Proxy Statement and is incorporated herein by reference.
Item 14. | Principal Accountant Fees and Services |
The information required by this item will be set forth in the Proxy Statement and is incorporated herein by reference.
-103-
PART IV
Item 15. | Exhibits, Financial Statement Schedules |
(a) The following documents are filed as part of this report:
1. Consolidated Financial Statements
See Index to Consolidated Financial Statements at Item 8 herein.
2. Financial Statement Schedules
Schedules not listed above have been omitted because the information required to be set forth therein is not applicable or is shown in the financial statements or notes herein.
3. Exhibits
See the Exhibit Index immediately following the signature page of this Annual Report on Form 10-K.
Signatures
Pursuant to the requirements of Section 13 or 15(d) of the Securities Exchange Act of 1934, the registrant has duly caused this report to be signed on its behalf by the undersigned, thereunto duly authorized.
LINKEDIN CORPORATION | |||
Dated: February 12, 2015 | By: | /S/ JEFFREY WEINER | |
Jeffrey Weiner | |||
Chief Executive Officer and Director | |||
POWER OF ATTORNEY
Each person whose individual signature appears below hereby authorizes and appoints Michael J. Callahan and Steven Sordello, and each of them, with full power of substitution and resubstitution and full power to act without the other, as his or her true and lawful attorney-in-fact and agent to act in his or her name, place and stead and to execute in the name and on behalf of each person, individually and in each capacity stated below, and to file any and all amendments to this Annual Report on Form 10-K, and to file the same, with all exhibits thereto, and other documents in connection therewith, with the Securities and Exchange Commission, granting unto said attorneys-in-fact and agents, and each of them, full power and authority to do and perform each and every act and thing, ratifying and confirming all that said attorneys-in-fact and agents or any of them or their or his substitute or substitutes may lawfully do or cause to be done by virtue thereof.
Pursuant to the requirements of the Securities Exchange Act of 1934, this report has been signed below by the following persons on behalf of the registrant and in the capacities and on the dates indicated.
Signature | Title | Date | ||
/s/ JEFFREY WEINER | Chief Executive Officer and Director (principal executive officer) | February 12, 2015 | ||
Jeffrey Weiner | ||||
/s/ STEVEN SORDELLO | Senior Vice President and Chief Financial Officer (principal financial officer) | February 12, 2015 | ||
Steven Sordello | ||||
/s/ SUSAN TAYLOR | Vice President, Corporate Controller and Chief Accounting Officer (principal accounting officer) | February 12, 2015 | ||
Susan Taylor | ||||
/s/ A. GEORGE “SKIP” BATTLE | Director | February 12, 2015 | ||
A. George “Skip” Battle | ||||
/s/ REID HOFFMAN | Chair of the Board of Directors | February 12, 2015 | ||
Reid Hoffman | ||||
/s/ LESLIE KILGORE | Director | February 12, 2015 | ||
Leslie Kilgore | ||||
/s/ STANLEY MERESMAN | Director | February 12, 2015 | ||
Stanley Meresman | ||||
/s/ MICHAEL MORITZ | Director | February 10, 2015 | ||
Michael Moritz | ||||
/s/ DAVID SZE | Director | February 12, 2015 | ||
David Sze | ||||
Exhibit Index
Exhibit Number | Exhibit Description | Incorporated by Reference | ||||||||
Form | File No. | Exhibit(s)/ Appendix | Filing Date | |||||||
3.1 | Form of Amended and Restated Certificate of Incorporation of LinkedIn Corporation. | S-1 | 333-171903 | 3.2 | March 11, 2011 | |||||
3.2 | Form of Amended and Restated Bylaws of LinkedIn Corporation. | S-1 | 333-171903 | 3.4 | March 11, 2011 | |||||
4.1 | Form of LinkedIn Corporation’s Class A Common Stock Certificate. | S-1 | 333-171903 | 4.1 | May 9, 2011 | |||||
4.2 | Form of LinkedIn Corporation’s Class B Common Stock Certificate. | S-1 | 333-171903 | 4.2 | May 9, 2011 | |||||
4.3 | Third Amended and Restated Investors’ Rights Agreement, by and among LinkedIn Corporation and the investors listed on Exhibit A thereto, dated June 13, 2008. | S-1 | 333-171903 | 4.2 | January 27, 2011 | |||||
4.4 | Indenture, dated November 12, 2014, between LinkedIn Corporation and U.S. Bank National Association. | 8-K | 001-35168 | 4.1 | November 12, 2014 | |||||
4.5 | Form of Global 0.50% Convertible Senior Note due 2019 (included in Exhibit 4.4). | 8-K | 001-35168 | 4.2 | November 12, 2014 | |||||
10.1+ | Amended and Restated 2003 Stock Incentive Plan and Form of Stock Option Agreement. | S-1 | 333-171903 | 10.1 | January 27, 2011 | |||||
10.2+ | 2011 Equity Incentive Plan and Form of Stock Option Agreement under 2011 Equity Incentive Plan. | S-1 | 333-171903 | 10.2 | May 4, 2011 | |||||
10.3+ | Form of Indemnification Agreement by and between LinkedIn Corporation and each of its directors and executive officers. | S-1 | 333-171903 | 10.3 | March 11, 2011 | |||||
10.4+ | Offer Letter, between LinkedIn Corporation and Jeffrey Weiner, dated September 9, 2009, effective June 24, 2009, as amended. | S-1 | 333-171903 | 10.4 | January 27, 2011 | |||||
10.5+ | Offer Letter, between LinkedIn Corporation and Steven Sordello, dated June 14, 2007. | S-1 | 333-171903 | 10.5 | January 27, 2011 | |||||
10.6 | Membership Units Purchase Agreement by and between LinkedIn Corporation and Reid Hoffman, dated June 13, 2008. | S-1 | 333-171903 | 10.12 | January 27, 2011 | |||||
10.7 | Lease by and between LinkedIn Corporation and Britannia Hacienda VIII LLC, dated March 20, 2007. | S-1 | 333-171903 | 10.14 | January 27, 2011 | |||||
10.7A | First Amendment to Lease by and between LinkedIn Corporation and Britannia Hacienda VIII LLC, dated September 24, 2007. | S-1 | 333-171903 | 10.14A | January 27, 2011 | |||||
-106-
Exhibit Number | Exhibit Description | Incorporated by Reference | ||||||||
Form | File No. | Exhibit(s)/ Appendix | Filing Date | |||||||
10.7B | Second Amendment to Lease by and between LinkedIn Corporation and Britannia Hacienda VIII LLC, dated June 25, 2008. | S-1 | 333-171903 | 10.14B | January 27, 2011 | |||||
10.7C | Third Amendment to Lease by and between LinkedIn Corporation and Britannia Hacienda VIII LLC, dated December 18, 2009. | S-1 | 333-171903 | 10.14C | January 27, 2011 | |||||
10.7D | Fourth Amendment to Lease by and between LinkedIn Corporation and Britannia Hacienda VIII LLC, dated March 3, 2010. | S-1 | 333-171903 | 10.14D | January 27, 2011 | |||||
10.7E | Fifth Amendment to Lease by and between LinkedIn Corporation and Britannia Hacienda VIII LLC, dated December 17, 2010. | S-1 | 333-171903 | 10.14E | January 27, 2011 | |||||
10.7F | Sixth Amendment to Lease by and between LinkedIn Corporation and Britannia Hacienda VIII LLC, dated October 25, 2011. | 8-K | 001-35168 | 10.1 | October 28, 2011 | |||||
10.8 | Sublease by and between LinkedIn Corporation and Omnicell, Inc., dated January 4, 2011. | S-1 | 333-171903 | 10.15 | January 27, 2011 | |||||
10.9 | Sublease by and between LinkedIn Corporation and Actel Corporation, dated February 18, 2010. | S-1 | 333-171903 | 10.16 | January 27, 2011 | |||||
10.10+ | 2011 Employee Stock Purchase Plan. | S-1 | 333-171903 | 10.17 | May 4, 2011 | |||||
10.11+ | Form of Supplement to Offer Letter by and between LinkedIn Corporation and certain named executive officers. | S-1 | 333-171903 | 10.18 | May 4, 2011 | |||||
10.12 | Form of Restricted Stock Unit Agreement under 2011 Equity Incentive Plan. | 10-Q | 001-35168 | 10.1 | August 9, 2011 | |||||
10.13+† | 2014 Executive Bonus Compensation Plan. | 10-Q | 001-35168 | 10.1 | May 1, 2014 | |||||
10.14+ | Form of Change of Control Agreement between LinkedIn Corporation and certain named executive officers. | 10-K | 001-35168 | 10.19 | February 13, 2014 | |||||
10.15 | Form of Convertible Note Hedge Confirmation. | 8-K | 001-35168 | 10.2 | November 7, 2014 | |||||
10.16 | Form of Warrant Confirmation. | 8-K | 001-35168 | 10.3 | November 7, 2014 | |||||
10.17 | Agreement and Plan of Merger By and Among the Company, Bright Media Corporation and other parties. | 8-K | 001-35168 | 2.1 | March 2, 2014 | |||||
10.18+ | LinkedIn Corporation Executive Bonus Compensation Plan | Schedule 14A | 001-35168 | Appendix A | April 28, 2014 | |||||
10.19 | Agreement and Plan of Merger By and Among the Company, Bizo, Inc. and other parties. | 8-K | 001-35168 | 2.1 | August 15, 2014 | |||||
-107-
Exhibit Number | Exhibit Description | Incorporated by Reference | ||||||||
Form | File No. | Exhibit(s)/ Appendix | Filing Date | |||||||
21.1 | List of subsidiaries. | |||||||||
23.1 | Consent of Deloitte & Touche LLP, independent registered public accounting firm. | |||||||||
24.1 | Power of Attorney (see the signature page to this Annual Report on Form 10-K). | |||||||||
31.1 | Certification of Principal Executive Officer Required Under Rule 13a-14(a) and 15d-14(a) of the Securities Exchange Act of 1934, as amended. | |||||||||
31.2 | Certification of Principal Financial Officer Required Under Rule 13a-14(a) and 15d-14(a) of the Securities Exchange Act of 1934, as amended. | |||||||||
32.1 | Certification of Principal Executive Officer and Principal Financial Officer Required Under Rule 13a-14(b) of the Securities Exchange Act of 1934, as amended, and 18 U.S.C. §1350. | |||||||||
101.INS | XBRL Instance Document | |||||||||
101.SCH | XBRL Taxonomy Extension Schema | |||||||||
101.CAL | XBRL Taxonomy Extension Calculation Linkbase | |||||||||
101.LAB | XBRL Taxonomy Extension Label Linkbase | |||||||||
101.PRE | XBRL Taxonomy Extension Presentation Linkbase | |||||||||
101.DEF | XBRL Taxonomy Extension Definition Linkbase | |||||||||
+ | Indicates a management contract or compensatory plan. |
† | Portions of have been granted confidential treatment by the SEC. |
-108-