Attached files
| file | filename |
|---|---|
| EX-99.1 - EXHIBIT 99.1 - USG CORP | a51033796ex99_1.htm |
| 8-K - USG CORPORATION 8-K - USG CORP | a51033796.htm |
Exhibit 99.2
February 5, 2015 USG Corporation Fourth Quarter 2014 Earnings Conference Call and Webcast
This presentation contains forward-looking statements within the meaning of the Private Securities Litigation Reform Act of 1995 related to management’s expectations about future conditions. Actual business, market or other conditions may differ materially from management’s expectations and, accordingly, may affect our sales and profitability or other results and liquidity. Actual results may differ materially due to various other factors, including: economic conditions, such as the levels of new home and other construction activity, employment levels, the availability of mortgage, construction and other financing, mortgage and other interest rates, housing affordability and supply, the levels of foreclosures and home resales, currency exchange rates and consumer confidence; capital markets conditions and the availability of borrowings under our credit agreement or other financings; our substantial indebtedness and our ability to incur substantial additional indebtedness; competitive conditions, such as price, service and product competition; shortages in raw materials; changes in raw material and energy costs; volatility in the assumptions used to determine the funded status of our pension plans; the loss of one or more major customers and our customers’ ability to meet their financial obligations to us; capacity utilization rates for us and the industry; our ability to expand into new geographic markets and the stability of such markets; our ability to successfully operate the joint venture with Boral Limited, including risks that our joint venture partner, Boral Limited, may not fulfill its obligations as an investor or may take actions that are inconsistent with our objectives; our ability to protect our intellectual property and other proprietary rights; changes in laws or regulations, including environmental and safety regulations; the satisfactory performance of certain business functions by third party service providers; our ability to achieve anticipated savings from cost reduction programs; the outcome in contested litigation matters; the effects of acts of terrorism or war upon domestic and international economies and financial markets; and acts of God. We assume no obligation to update any forward-looking information contained in this presentation. Additional information concerning these and other factors may be found in our filings with the Securities and Exchange Commission, including the “Risk Factors” in our most recent Annual Report on Form 10-K and Quarterly Reports on Form 10-Q for the quarters ended June 30, 2014 and September 30, 2014. CAUTIONARY STATEMENTS
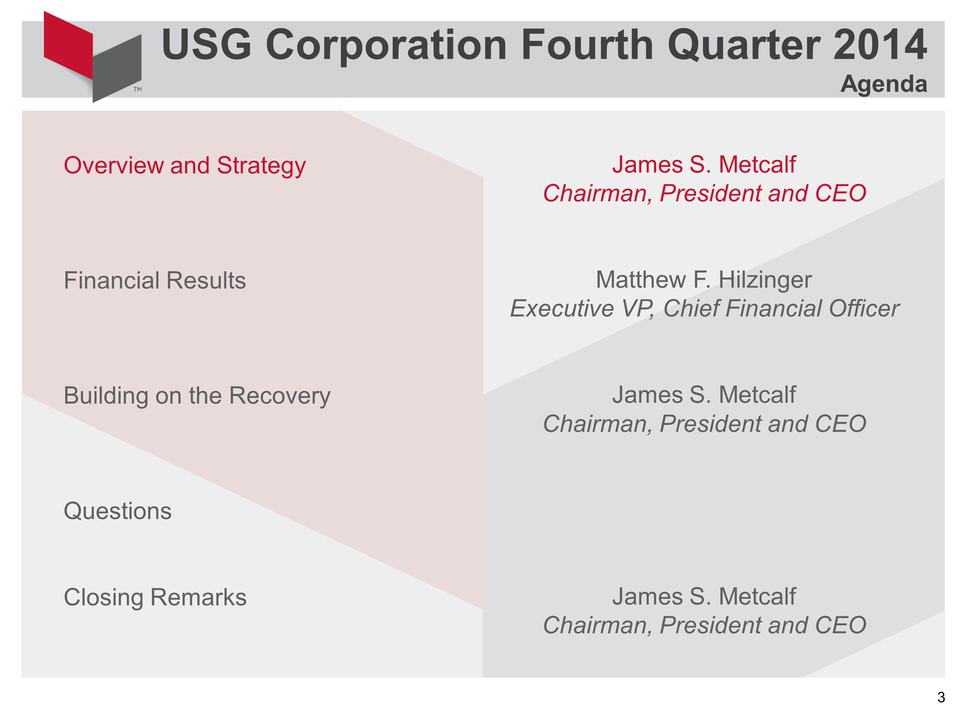
USG Corporation Fourth Quarter 2014Agenda Overview and StrategyFinancial ResultsBuilding on the RecoveryQuestionsClosing Remarks James S. MetcalfChairman, President and CEOMatthew F. HilzingerExecutive VP, Chief Financial OfficerJames S. MetcalfChairman, President and CEOJames S. MetcalfChairman, President and CEO
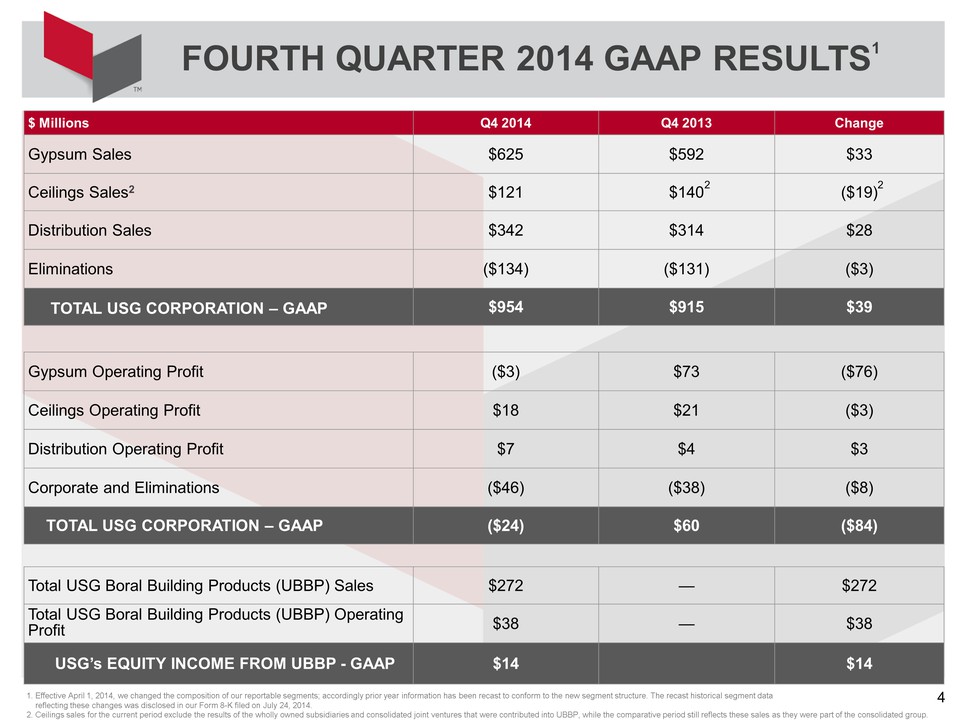
FOURTH QUARTER 2014 GAAP RESULTS1 1. Effective April 1, 2014, we changed the composition of our reportable segments; accordingly prior year information has been recast to conform to the new segment structure. The recast historical segment data reflecting these changes was disclosed in our Form 8-K filed on July 24, 2014. 2. Ceilings sales for the current period exclude the results of the wholly owned subsidiaries and consolidated joint ventures that were contributed into UBBP, while the comparative period still reflects these sales as they were part of the consolidated group. 2 2 Gypsum Sales $625 $592 $33 Ceilings Sales2 $121 $140 ($19) Distribution Sales $342 $314 $28 Eliminations ($134) ($131) ($3) Gypsum Operating Profit ($3) $73 ($76) Ceilings Operating Profit $18 $21 ($3) Distribution Operating Profit $7 $4 $3 Corporate and Eliminations ($46) ($38) ($8) Total USG Boral Building Products (UBBP) Sales $272 — $272 Total USG Boral Building Products (UBBP) Operating Profit $38 — $38
PLAN TO WIN Strengthen the core- North American manufacturing and distribution - De-lever our balance sheetDiversify the sources of our earnings- Strategic geographic extensions- USG Boral Building Products- Adjacent products/systemsDifferentiate through innovation- Differentiate USG in the market - Focus on high performance products and solutions that improve energy efficiency, sustainability, and speed of construction

USG Corporation Fourth Quarter 2014Agenda Overview and StrategyFinancial ResultsBuilding on the RecoveryQuestionsClosing Remarks James S. MetcalfChairman, President and CEOMatthew F. HilzingerExecutive VP, Chief Financial OfficerJames S. MetcalfChairman, President and CEOJames S. MetcalfChairman, President and CEO
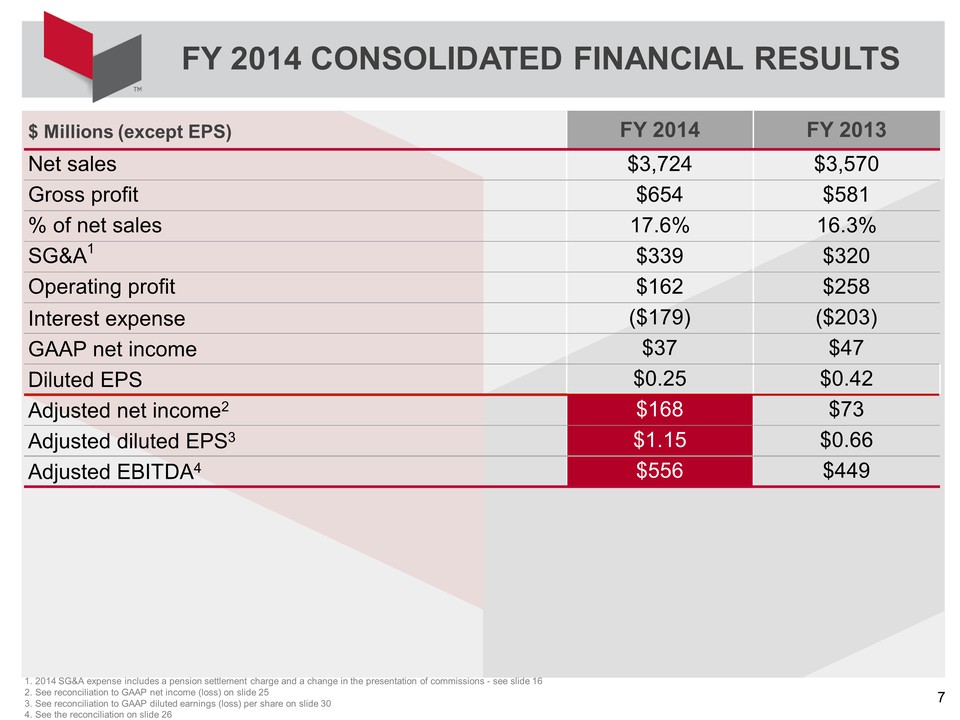
FY 2014 CONSOLIDATED FINANCIAL RESULTS 1. 2014 SG&A expense includes a pension settlement charge and a change in the presentation of commissions - see slide 16 2. See reconciliation to GAAP net income (loss) on slide 25 3. See reconciliation to GAAP diluted earnings (loss) per share on slide 30 4. See the reconciliation on slide 26 $ Millions (except EPS) FY 2014 FY 2013 Net sales $3,724 $3,570 Gross profit $654 $581 % of net sales 17.6% 16.3% SG&A1 $339 $320 Operating profit $162 $258 Interest expense ($179) ($203) GAAP net income $37 $47 Diluted EPS $0.25 $0.42 Adjusted net income2 $73 Adjusted diluted EPS3 $0.66 Adjusted EBITDA4$449
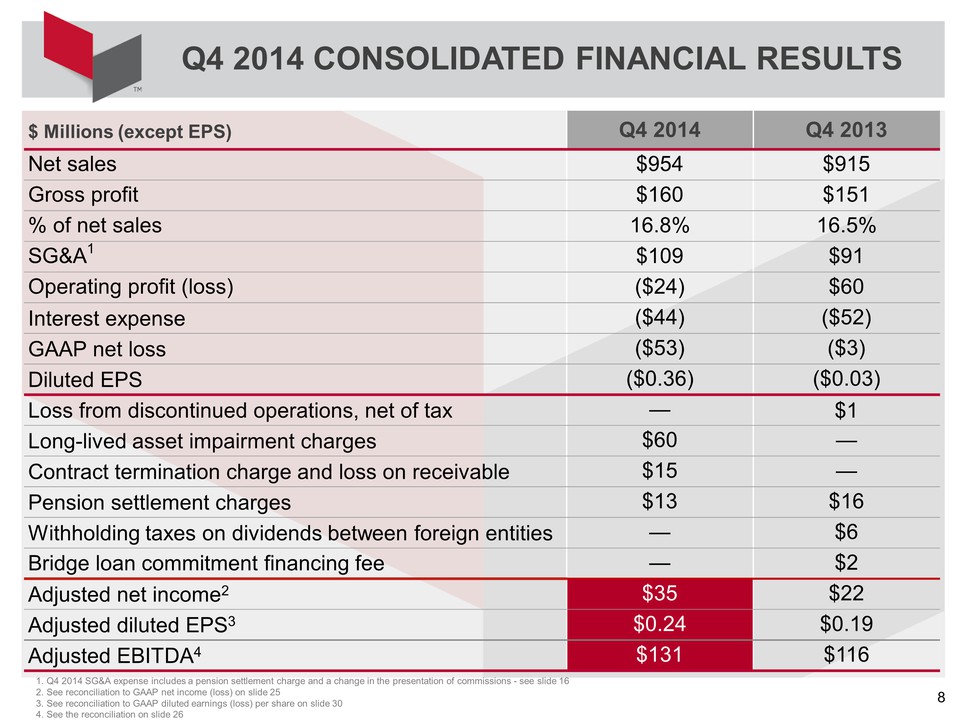
1. Q4 2014 SG&A expense includes a pension settlement charge and a change in the presentation of commissions - see slide 16 2. See reconciliation to GAAP net income (loss) on slide 25 3. See reconciliation to GAAP diluted earnings (loss) per share on slide 30 4. See the reconciliation on slide 26 Q4 2014 CONSOLIDATED FINANCIAL RESULTS $ Millions (except EPS) Q4 2014 Q4 2013 Net sales $954 $915 Gross profit $160 $151 % of net sales 16.8% 16.5% SG&A1 $109 $91 Operating profit (loss) ($24) $60 Interest expense ($44) ($52) GAAP net loss ($53) ($3) Diluted EPS ($0.36) ($0.03) Loss from discontinued operations, net of tax — $1 Long-lived asset impairment charges $60 — Contract termination charge and loss on receivable $15 — Pension settlement charges $13 $16 Withholding taxes on dividends between foreign entities — $6 Bridge loan commitment financing fee — $2 Adjusted net income2 $22 Adjusted diluted EPS3 $0.19 Adjusted EBITDA4 $116
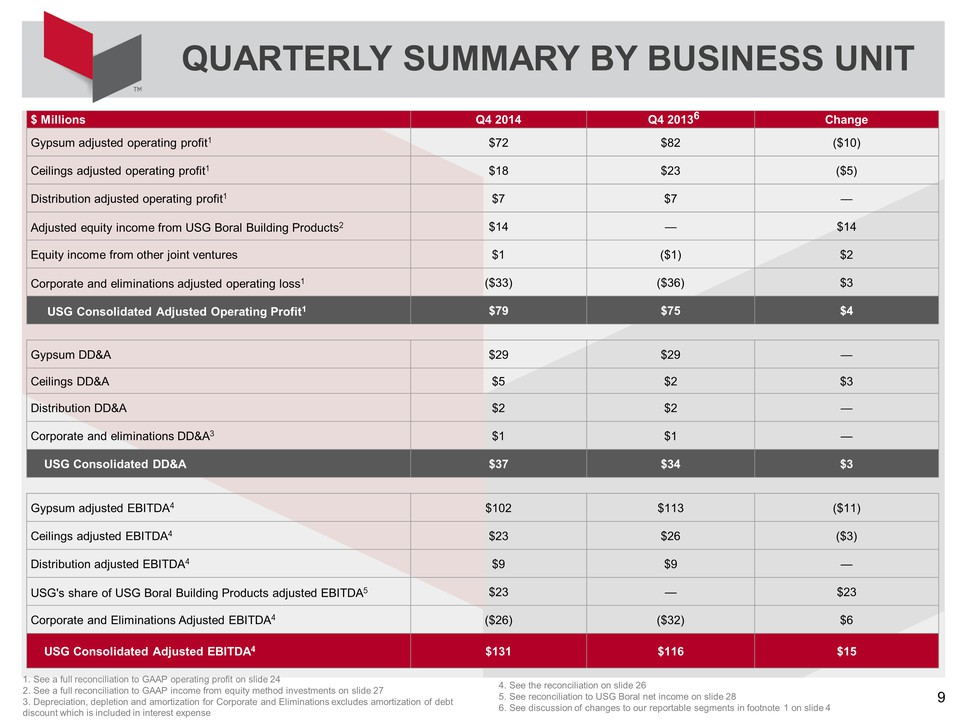
1. See a full reconciliation to GAAP operating profit on slide 242. See a full reconciliation to GAAP income from equity method investments on slide 273. Depreciation, depletion and amortization for Corporate and Eliminations excludes amortization of debt discount which is included in interest expense QUARTERLY SUMMARY BY BUSINESS UNIT6 4. See the reconciliation on slide 26 5. See reconciliation to USG Boral net income on slide 28 6. See discussion of changes to our reportable segments in footnote 1 on slide 4 Gypsum adjusted operating profit1 $72 $82 ($10) Ceilings adjusted operating profit1 $18 $23 ($5) Distribution adjusted operating profit1 $7 $7 — Adjusted equity income from USG Boral Building Products2 $14 — $14 Equity income from other joint ventures $1 ($1) $2 Corporate and eliminations adjusted operating loss1 ($33) ($36) $3 Gypsum DD&A $29 $29 — Ceilings DD&A $5 $2 $3 Distribution DD&A $2 $2 — Corporate and eliminations DD&A3 $1 $1 — Gypsum adjusted EBITDA4 $102 $113 ($11) Ceilings adjusted EBITDA4 $23 $26 ($3) Distribution adjusted EBITDA4 $9 $9 — USG's share of USG Boral Building Products adjusted EBITDA5 $23 — $23 Corporate and Eliminations Adjusted EBITDA4 ($26) ($32) $6
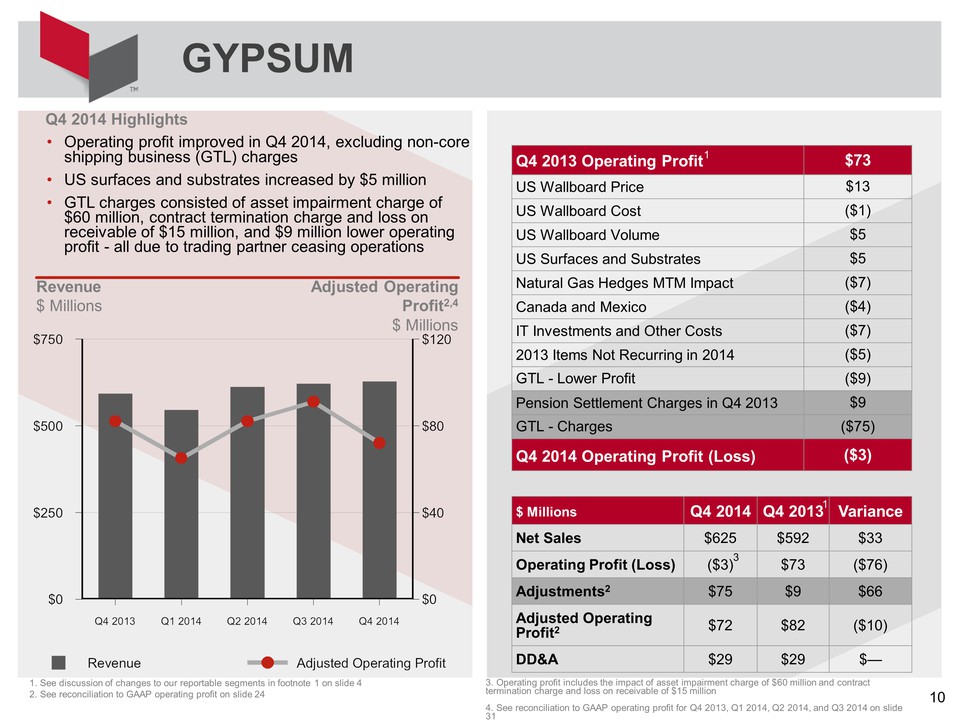
Q4 2014 HighlightsOperating profit improved in Q4 2014, excluding non-core shipping business (GTL) chargesUS surfaces and substrates increased by $5 millionGTL charges consisted of asset impairment charge of $60 million, contract termination charge and loss on receivable of $15 million, and $9 million lower operating profit - all due to trading partner ceasing operations GYPSUM 1. See discussion of changes to our reportable segments in footnote 1 on slide 42. See reconciliation to GAAP operating profit on slide 24 Revenue$ Millions Adjusted Operating Profit2,4$ Millions 1 3 3. Operating profit includes the impact of asset impairment charge of $60 million and contract termination charge and loss on receivable of $15 million4. See reconciliation to GAAP operating profit for Q4 2013, Q1 2014, Q2 2014, and Q3 2014 on slide 31
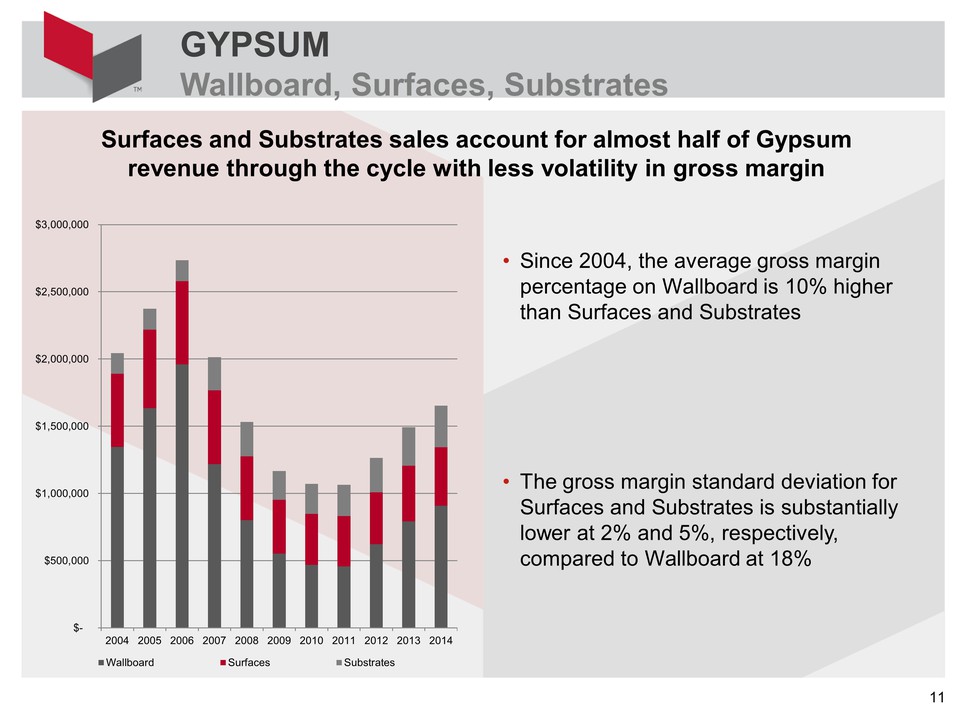
GYPSUMWallboard, Surfaces, Substrates Surfaces and Substrates sales account for almost half of Gypsum revenue through the cycle with less volatility in gross margin Since 2004, the average gross margin percentage on Wallboard is 10% higher than Surfaces and SubstratesThe gross margin standard deviation for Surfaces and Substrates is substantially lower at 2% and 5%, respectively, compared to Wallboard at 18%
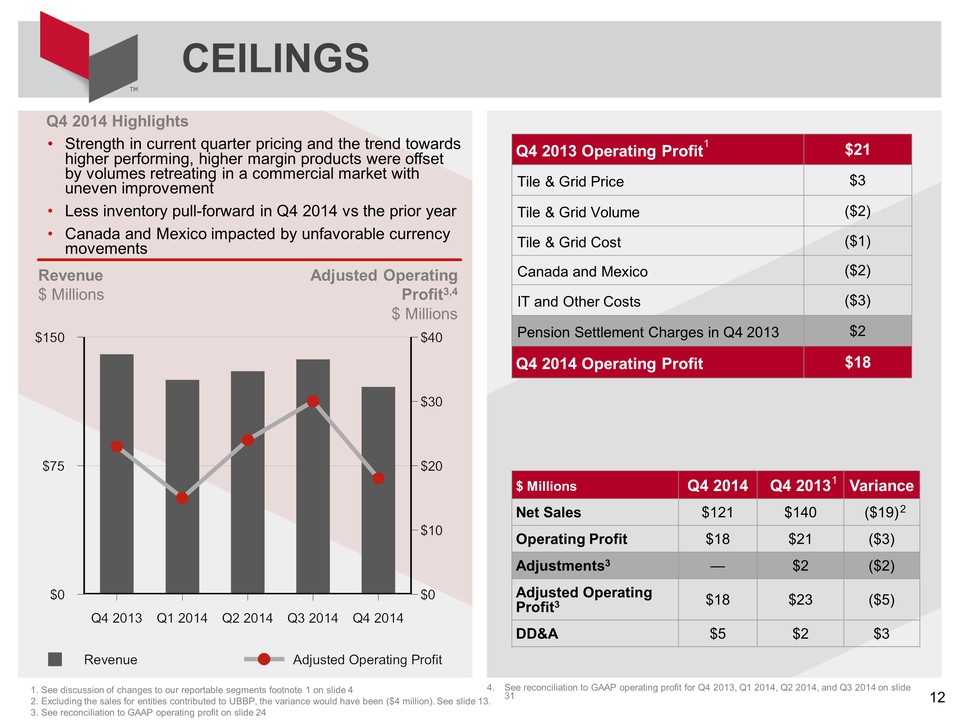
Q4 2014 HighlightsStrength in current quarter pricing and the trend towards higher performing, higher margin products were offset by volumes retreating in a commercial market with uneven improvementLess inventory pull-forward in Q4 2014 vs the prior yearCanada and Mexico impacted by unfavorable currency movements CEILINGS 1. See discussion of changes to our reportable segments footnote 1 on slide 42. Excluding the sales for entities contributed to UBBP, the variance would have been ($4 million). See slide 13.3. See reconciliation to GAAP operating profit on slide 24 Revenue$ Millions Adjusted Operating Profit3,4$ Millions 1 2 1 4. See reconciliation to GAAP operating profit for Q4 2013, Q1 2014, Q2 2014, and Q3 2014 on slide 31
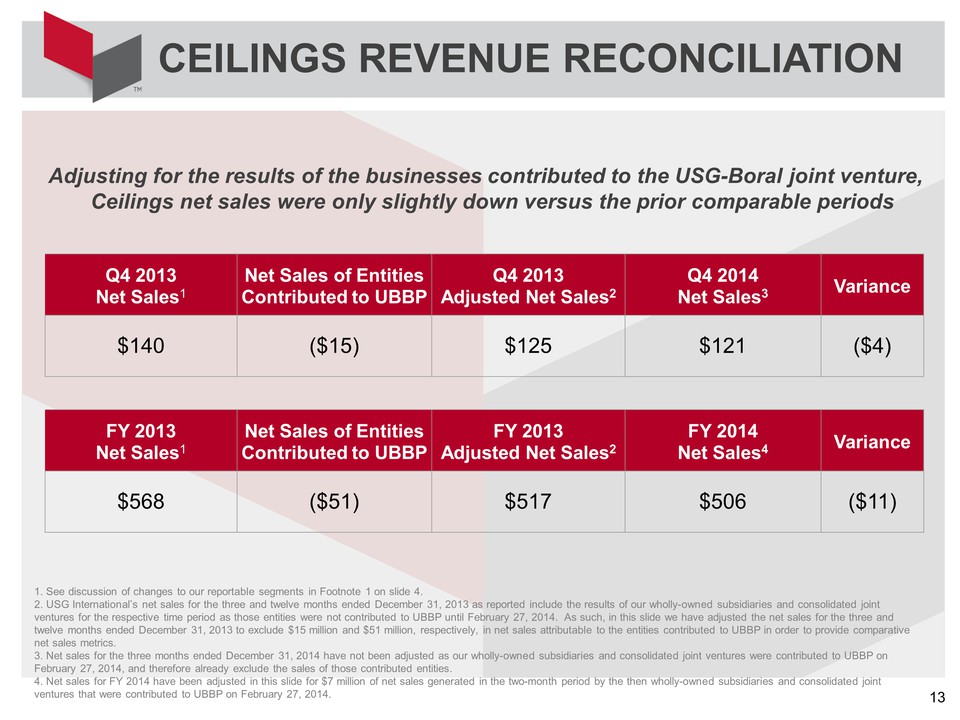
CEILINGS REVENUE RECONCILIATION 1. See discussion of changes to our reportable segments in Footnote 1 on slide 4.2. USG International’s net sales for the three and twelve months ended December 31, 2013 as reported include the results of our wholly-owned subsidiaries and consolidated joint ventures for the respective time period as those entities were not contributed to UBBP until February 27, 2014. As such, in this slide we have adjusted the net sales for the three and twelve months ended December 31, 2013 to exclude $15 million and $51 million, respectively, in net sales attributable to the entities contributed to UBBP in order to provide comparative net sales metrics.3. Net sales for the three months ended December 31, 2014 have not been adjusted as our wholly-owned subsidiaries and consolidated joint ventures were contributed to UBBP on February 27, 2014, and therefore already exclude the sales of those contributed entities.4. Net sales for FY 2014 have been adjusted in this slide for $7 million of net sales generated in the two-month period by the then wholly-owned subsidiaries and consolidated joint ventures that were contributed to UBBP on February 27, 2014. Adjusting for the results of the businesses contributed to the USG-Boral joint venture, Ceilings net sales were only slightly down versus the prior comparable periods
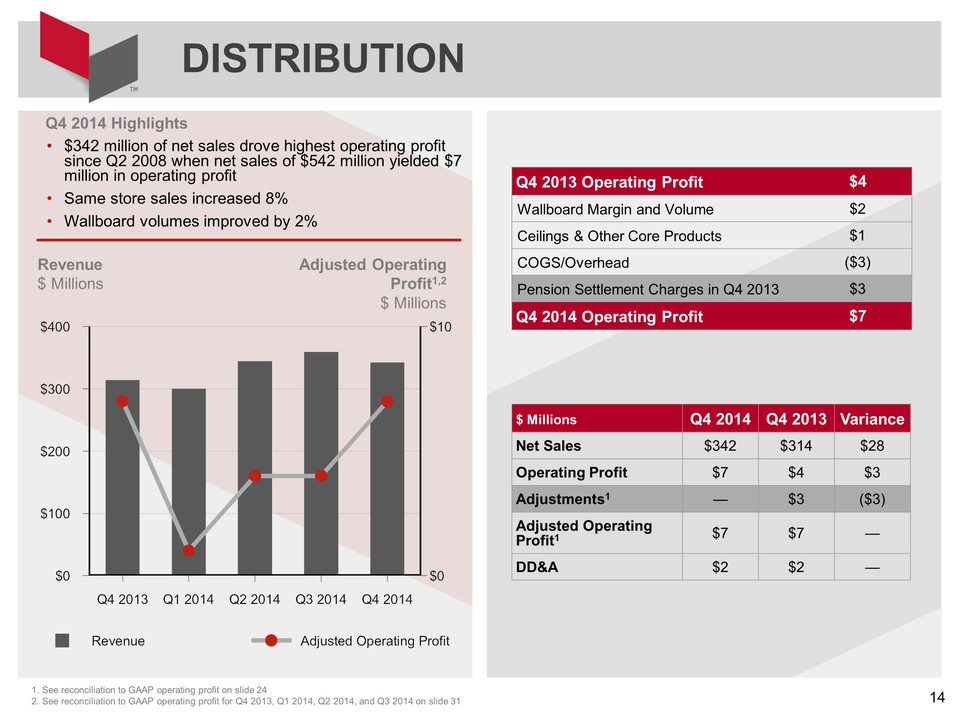
Q4 2014 Highlights$342 million of net sales drove highest operating profit since Q2 2008 when net sales of $542 million yielded $7 million in operating profitSame store sales increased 8% Wallboard volumes improved by 2% DISTRIBUTION Revenue$ Millions Adjusted Operating Profit1,2$ Millions 1. See reconciliation to GAAP operating profit on slide 242. See reconciliation to GAAP operating profit for Q4 2013, Q1 2014, Q2 2014, and Q3 2014 on slide 31
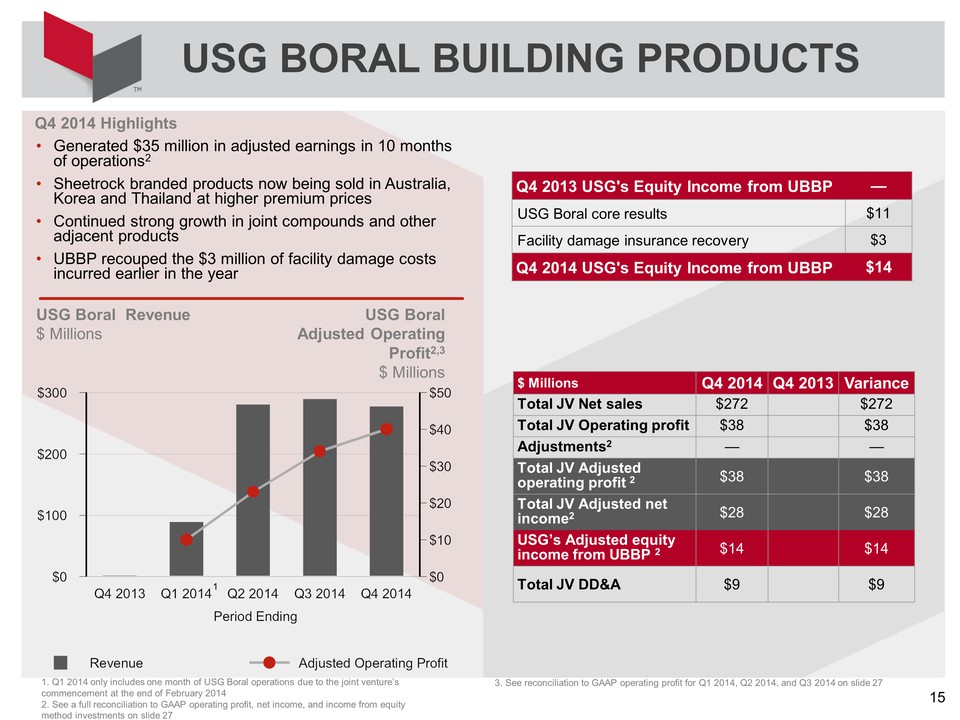
Q4 2014 HighlightsGenerated $35 million in adjusted earnings in 10 months of operations2Sheetrock branded products now being sold in Australia, Korea and Thailand at higher premium pricesContinued strong growth in joint compounds and other adjacent productsUBBP recouped the $3 million of facility damage costs incurred earlier in the year USG BORAL BUILDING PRODUCTS USG Boral Revenue$ Millions USG Boral Adjusted Operating Profit2,3$ Millions 3. See reconciliation to GAAP operating profit for Q1 2014, Q2 2014, and Q3 2014 on slide 27 1. Q1 2014 only includes one month of USG Boral operations due to the joint venture’s commencement at the end of February 20142. See a full reconciliation to GAAP operating profit, net income, and income from equity method investments on slide 27
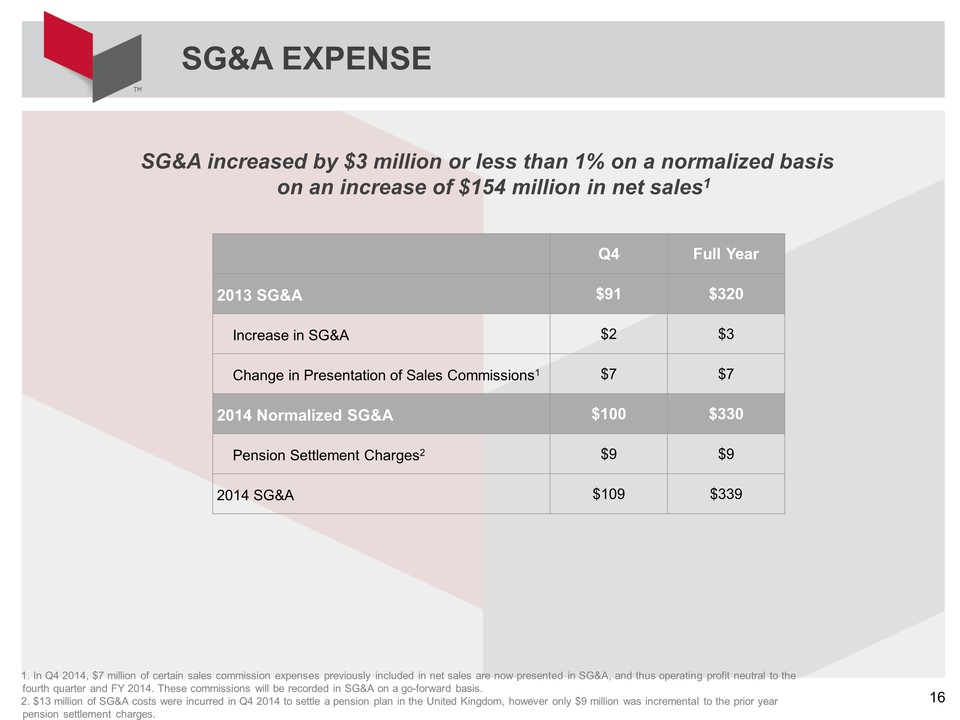
SG&A EXPENSE 1. In Q4 2014, $7 million of certain sales commission expenses previously included in net sales are now presented in SG&A, and thus operating profit neutral to the fourth quarter and FY 2014. These commissions will be recorded in SG&A on a go-forward basis. 2. $13 million of SG&A costs were incurred in Q4 2014 to settle a pension plan in the United Kingdom, however only $9 million was incremental to the prior year pension settlement charges. SG&A increased by $3 million or less than 1% on a normalized basis on an increase of $154 million in net sales1
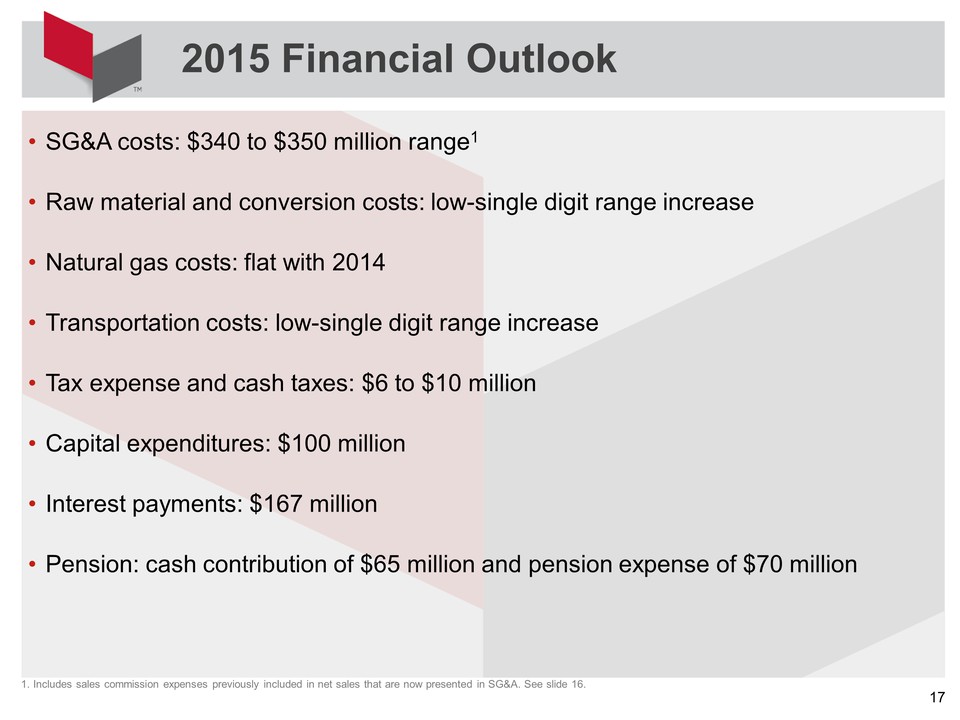
SG&A costs: $340 to $350 million range1Raw material and conversion costs: low-single digit range increase Natural gas costs: flat with 2014Transportation costs: low-single digit range increase Tax expense and cash taxes: $6 to $10 millionCapital expenditures: $100 million Interest payments: $167 millionPension: cash contribution of $65 million and pension expense of $70 million 2015 Financial Outlook 1. Includes sales commission expenses previously included in net sales that are now presented in SG&A. See slide 16.
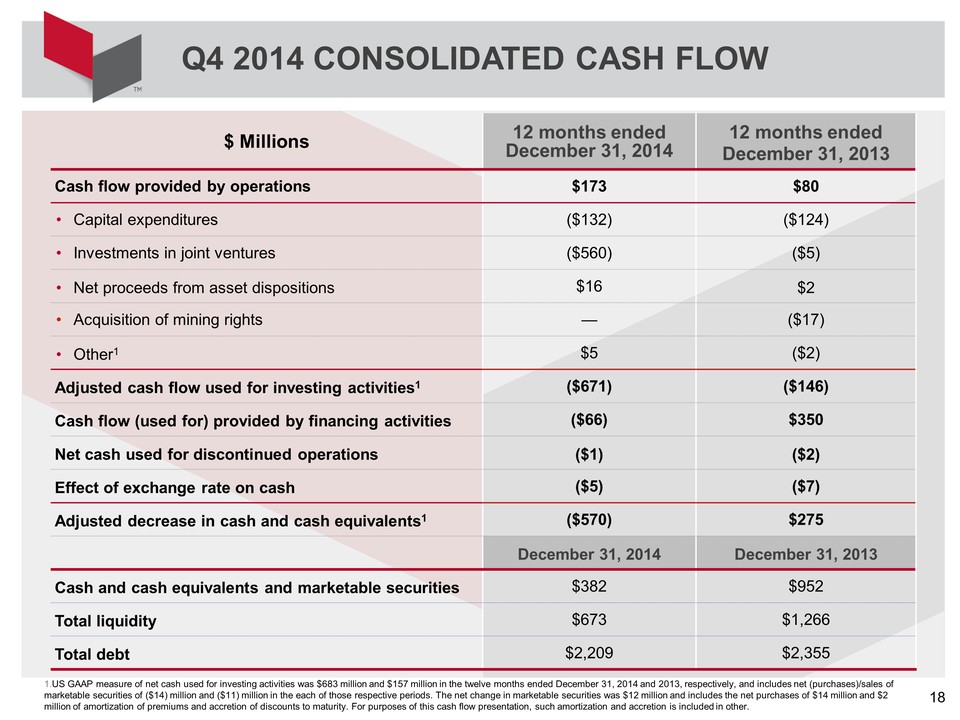
Q4 2014 CONSOLIDATED CASH FLOW 1.US GAAP measure of net cash used for investing activities was $683 million and $157 million in the twelve months ended December 31, 2014 and 2013, respectively, and includes net (purchases)/sales of marketable securities of ($14) million and ($11) million in the each of those respective periods. The net change in marketable securities was $12 million and includes the net purchases of $14 million and $2 million of amortization of premiums and accretion of discounts to maturity. For purposes of this cash flow presentation, such amortization and accretion is included in other.$ Millions 12 months ended December 31, 2014 12 months ended December 31, 2013 Cash flow provided by operations $173 $80 Capital expenditures ($132) ($124) Investments in joint ventures ($560) ($5) Net proceeds from asset dispositions $16 $2 Acquisition of mining rights — ($17) Other1 $5 ($2) Adjusted cash flow used for investing activities1 ($671) ($146) Cash flow (used for) provided by financing activities ($66) $350 Net cash used for discontinued operations ($1) ($2) Effect of exchange rate on cash ($5) ($7) Adjusted decrease in cash and cash equivalents1 ($570) $275 December 31, 2014 December 31, 2013 Cash and cash equivalents and marketable securities $382 $952 Total liquidity $673 $1,266 Total debt $2,209 $2,355
USG Corporation Fourth Quarter 2014 Agenda James S. MetcalfChairman, President and CEOMatthew F. HilzingerExecutive VP, Chief Financial OfficerJames S. MetcalfChairman, President and CEOJames S. MetcalfChairman, President and CEO Overview and StrategyFinancial ResultsBuilding on the RecoveryQuestionsClosing Remarks
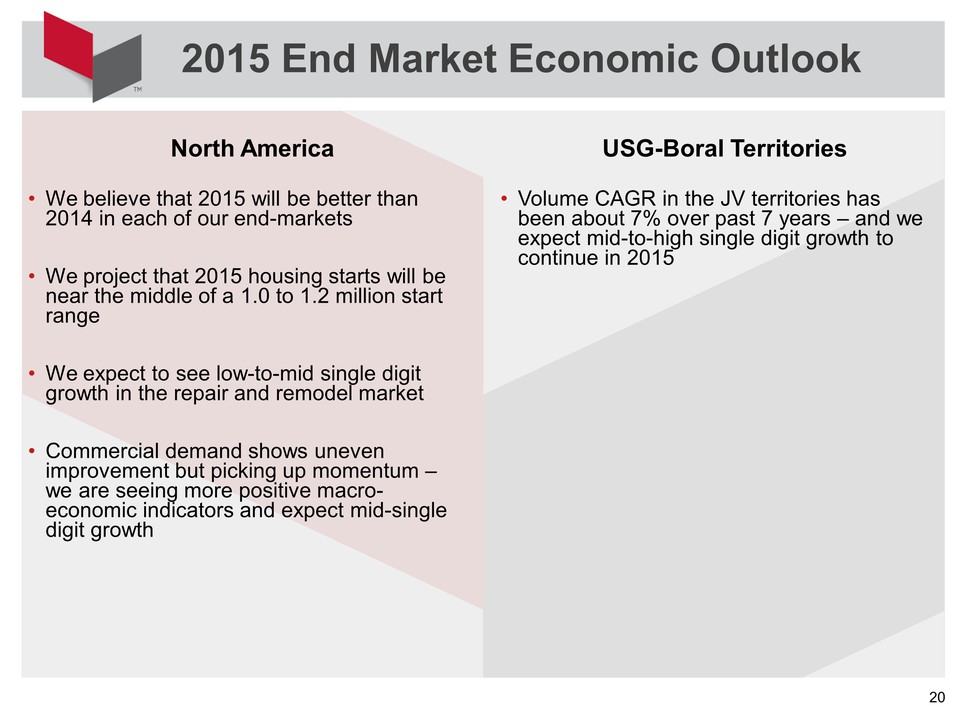
North AmericaWe believe that 2015 will be better than 2014 in each of our end-marketsWe project that 2015 housing starts will be near the middle of a 1.0 to 1.2 million start rangeWe expect to see low-to-mid single digit growth in the repair and remodel marketCommercial demand shows uneven improvement but picking up momentum – we are seeing more positive macro-economic indicators and expect mid-single digit growth 2015 End Market Economic Outlook USG-Boral TerritoriesVolume CAGR in the JV territories has been about 7% over past 7 years – and we expect mid-to-high single digit growth to continue in 2015
USG Corporation Fourth Quarter 2014 Agenda James S. MetcalfChairman, President and CEOMatthew F. HilzingerExecutive VP, Chief Financial OfficerJames S. MetcalfChairman, President and CEOJames S. MetcalfChairman, President and CEO Overview and StrategyFinancial ResultsBuilding on the RecoveryQuestionsClosing Remarks
USG Corporation Fourth Quarter 2014 Agenda James S. MetcalfChairman, President and CEOMatthew F. HilzingerExecutive VP, Chief Financial OfficerJames S. MetcalfChairman, President and CEOJames S. MetcalfChairman, President and CEO Overview and StrategyFinancial ResultsBuilding on the RecoveryQuestionsClosing Remarks
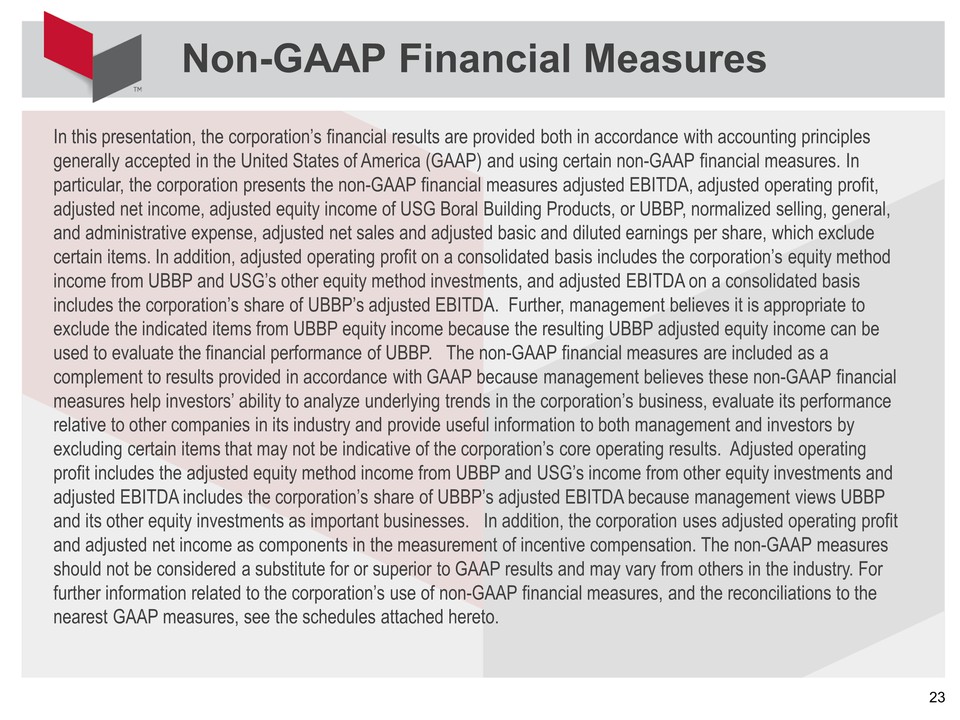
In this presentation, the corporation’s financial results are provided both in accordance with accounting principles generally accepted in the United States of America (GAAP) and using certain non-GAAP financial measures. In particular, the corporation presents the non-GAAP financial measures adjusted EBITDA, adjusted operating profit, adjusted net income, adjusted equity income of USG Boral Building Products, or UBBP, normalized selling, general, and administrative expense, adjusted net sales and adjusted basic and diluted earnings per share, which exclude certain items. In addition, adjusted operating profit on a consolidated basis includes the corporation’s equity method income from UBBP and USG’s other equity method investments, and adjusted EBITDA on a consolidated basis includes the corporation’s share of UBBP’s adjusted EBITDA. Further, management believes it is appropriate to exclude the indicated items from UBBP equity income because the resulting UBBP adjusted equity income can be used to evaluate the financial performance of UBBP. The non-GAAP financial measures are included as a complement to results provided in accordance with GAAP because management believes these non-GAAP financial measures help investors’ ability to analyze underlying trends in the corporation’s business, evaluate its performance relative to other companies in its industry and provide useful information to both management and investors by excluding certain items that may not be indicative of the corporation’s core operating results. Adjusted operating profit includes the adjusted equity method income from UBBP and USG’s income from other equity investments and adjusted EBITDA includes the corporation’s share of UBBP’s adjusted EBITDA because management views UBBP and its other equity investments as important businesses. In addition, the corporation uses adjusted operating profit and adjusted net income as components in the measurement of incentive compensation. The non-GAAP measures should not be considered a substitute for or superior to GAAP results and may vary from others in the industry. For further information related to the corporation’s use of non-GAAP financial measures, and the reconciliations to the nearest GAAP measures, see the schedules attached hereto. Non-GAAP Financial Measures
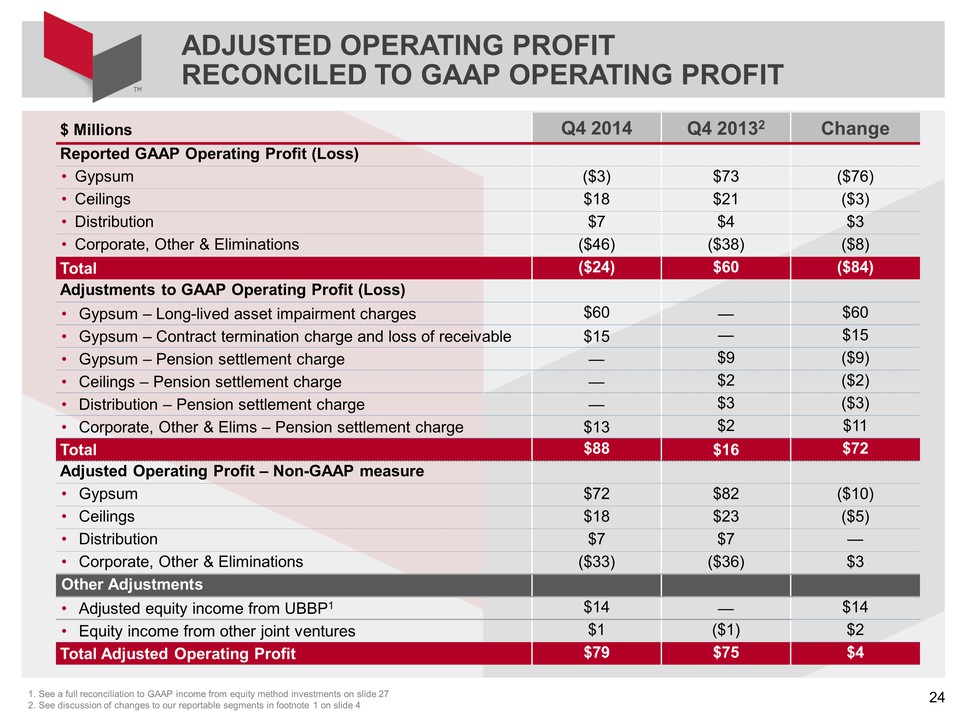
ADJUSTED OPERATING PROFIT RECONCILED TO GAAP OPERATING PROFIT 1. See a full reconciliation to GAAP income from equity method investments on slide 272. See discussion of changes to our reportable segments in footnote 1 on slide 4 $ Millions Q4 2014 Q4 20132 Change Reported GAAP Operating Profit (Loss) Gypsum ($3) $73 ($76) Ceilings $18 $21 ($3) Distribution $7 $4 $3 Corporate, Other & Eliminations ($46) ($38) ($8) Total ($24) $60 ($84) Adjustments to GAAP Operating Profit (Loss) Gypsum – Long-lived asset impairment charges $60 — $60 Gypsum – Contract termination charge and loss of receivable $15 — $15 Gypsum – Pension settlement charge — $9 ($9) Ceilings – Pension settlement charge — $2 ($2) Distribution – Pension settlement charge — $3 ($3) Corporate, Other & Elims – Pension settlement charge $13 $2 $11 Total $88 $16 $72 Adjusted Operating Profit – Non-GAAP measure Gypsum $72 $82 ($10) Ceilings $18 $23 ($5) Distribution $7 $7 — Corporate, Other & Eliminations ($33) ($36) $3 Other Adjustments Adjusted equity income from UBBP1 $14 — $14 Equity income from other joint ventures $1 ($1) $2 Total Adjusted Operating Profit $79 $75 $4
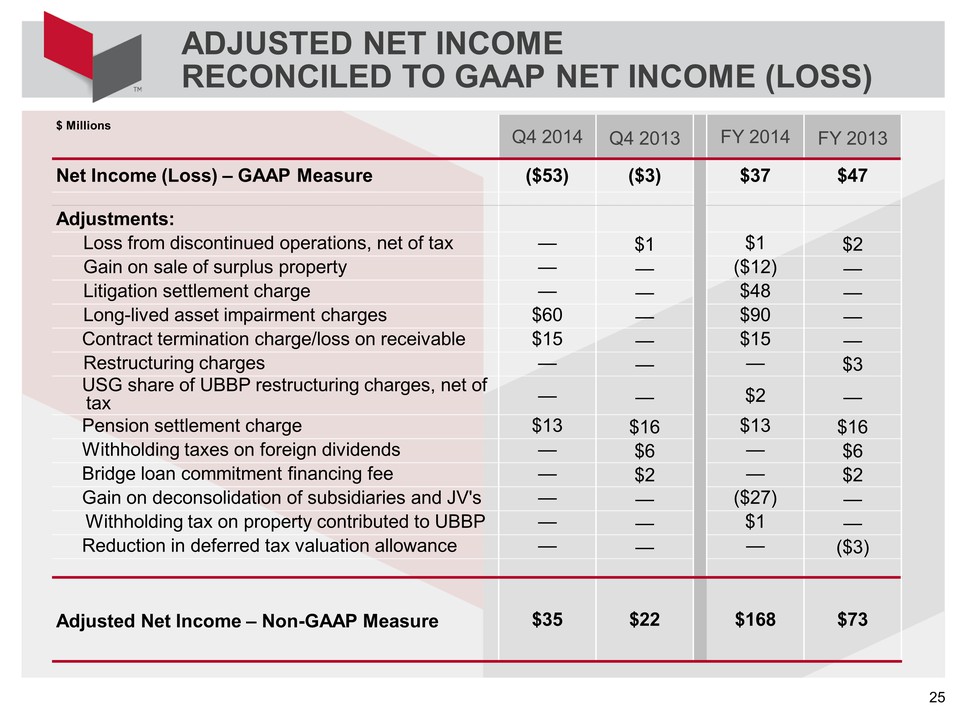
ADJUSTED NET INCOME RECONCILED TO GAAP NET INCOME (LOSS) $ Millions Q4 2014 Q4 2013 FY 2014 FY 2013 Net Income (Loss) – GAAP Measure ($53) ($3) $37 $47 Adjustments: Loss from discontinued operations, net of tax — $1 $1 $2 Gain on sale of surplus property — — ($12) — Litigation settlement charge — — $48 — Long-lived asset impairment charges $60 — $90 — Contract termination charge/loss on receivable $15 — $15 — Restructuring charges — — — $3 USG share of UBBP restructuring charges, net of tax — — $2 — Pension settlement charge $13 $16 $13 $16 Withholding taxes on foreign dividends — $6 — $6 Bridge loan commitment financing fee — $2 — $2 Gain on deconsolidation of subsidiaries and JV's — — ($27) — Withholding tax on property contributed to UBBP — — $1 — Reduction in deferred tax valuation allowance — — — ($3) Adjusted Net Income – Non-GAAP Measure $35 $22 $168 $73
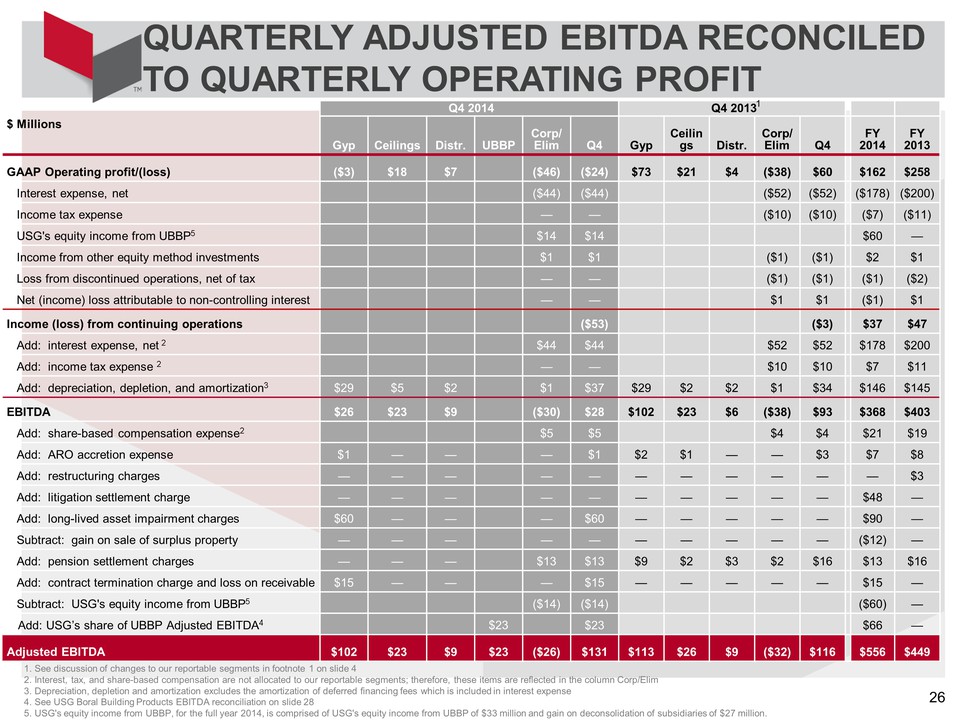
QUARTERLY ADJUSTED EBITDA RECONCILED TO QUARTERLY OPERATING PROFIT 1. See discussion of changes to our reportable segments in footnote 1 on slide 42. Interest, tax, and share-based compensation are not allocated to our reportable segments; therefore, these items are reflected in the column Corp/Elim 3. Depreciation, depletion and amortization excludes the amortization of deferred financing fees which is included in interest expense4. See USG Boral Building Products EBITDA reconciliation on slide 285. USG's equity income from UBBP, for the full year 2014, is comprised of USG's equity income from UBBP of $33 million and gain on deconsolidation of subsidiaries of $27 million.$ Millions Gyp Ceilings Distr. UBBP Corp/ Elim Q4 Gyp Ceilings Distr. Corp/ Elim Q4 FY 2014 FY 2013 GAAP Operating profit/(loss) ($3) $18 $7 ($46) ($24) $73 $21 $4 ($38) $60 $162 $258 Interest expense, net ($44) ($44) ($52) ($52) ($178) ($200) Income tax expense — — ($10) ($10) ($7) ($11) USG's equity income from UBBP5 $14 $14 $60 — Income from other equity method investments $1 $1 ($1) ($1) $2 $1 Loss from discontinued operations, net of tax — — ($1) ($1) ($1) ($2) Net (income) loss attributable to non-controlling interest — — $1 $1 ($1) $1 Income (loss) from continuing operations ($53) ($3) $37 $47 Add: interest expense, net 2 $44 $44 $52 $52 $178 $200 Add: income tax expense 2 — — $10 $10 $7 $11 Add: depreciation, depletion, and amortization3 $29 $5 $2 $1 $37 $29 $2 $2 $1 $34 $146 $145 EBITDA $26 $23 $9 ($30) $28 $102 $23 $6 ($38) $93 $368 $403 Add: share-based compensation expense2 $5 $5 $4 $4 $21 $19 Add: ARO accretion expense $1 — — — $1 $2 $1 — — $3 $7 $8 Add: restructuring charges — — — — — — — — — — — $3 Add: litigation settlement charge — — — — — — — — — — $48 — Add: long-lived asset impairment charges $60 — — — $60 — — — — — $90 — Subtract: gain on sale of surplus property — — — — — — — — — — ($12) — Add: pension settlement charges — — — $13 $13 $9 $2 $3 $2 $16 $13 $16 Add: contract termination charge and loss on receivable $15 — — — $15 — — — — — $15 — Subtract: USG's equity income from UBBP5 ($14) ($14) ($60) — Add: USG’s share of UBBP Adjusted EBITDA4 $23 $23 $66 — Adjusted EBITDA $102 $23 $9 $23 ($26) $131 $113 $26 $9 ($32) $116 $556 $449
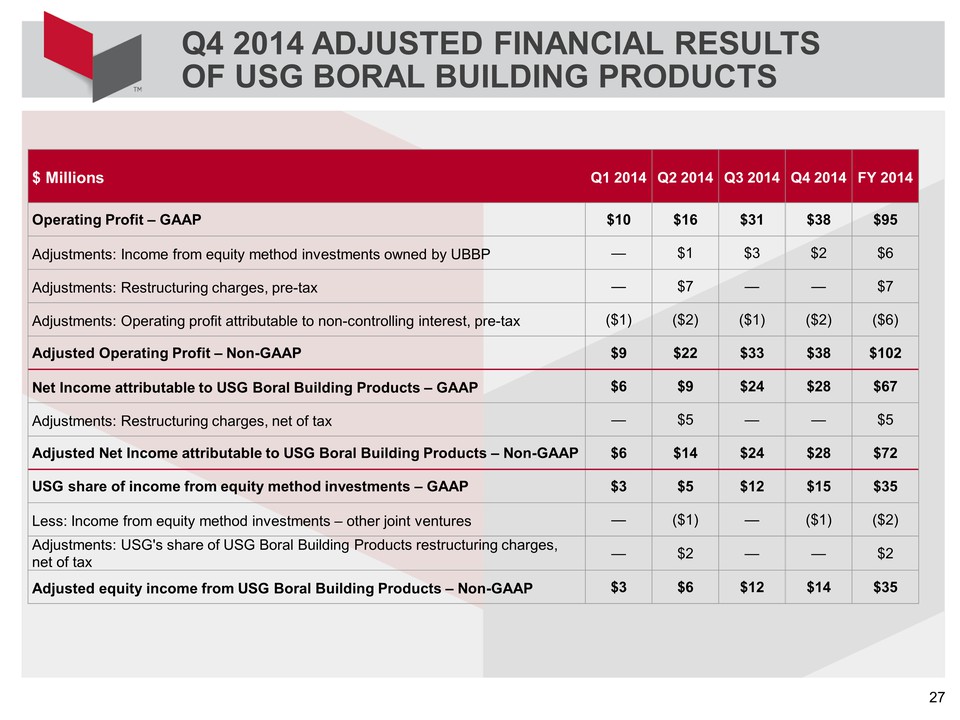
Q4 2014 ADJUSTED FINANCIAL RESULTS OF USG BORAL BUILDING PRODUCTS Operating Profit – GAAP $10 $16 $31 $38 $95 Adjustments: Income from equity method investments owned by UBBP — $1 $3 $2 $6 Adjustments: Restructuring charges, pre-tax — $7 — — $7 Adjustments: Operating profit attributable to non-controlling interest, pre-tax ($1) ($2) ($1) ($2) ($6) Adjusted Operating Profit – Non-GAAP $9 $22 $33 $38 $102 Net Income attributable to USG Boral Building Products – GAAP $6 $9 $24 $28 $67 Adjustments: Restructuring charges, net of tax — $5 — — $5 Adjusted Net Income attributable to USG Boral Building Products – Non-GAAP $6 $14 $24 $28 $72 USG share of income from equity method investments – GAAP $3 $5 $12 $15 $35 Less: Income from equity method investments – other joint ventures — ($1) — ($1) ($2) Adjustments: USG's share of USG Boral Building Products restructuring charges, net of tax — $2 — — $2 Adjusted equity income from USG Boral Building Products – Non-GAAP $3 $6 $12 $14 $35
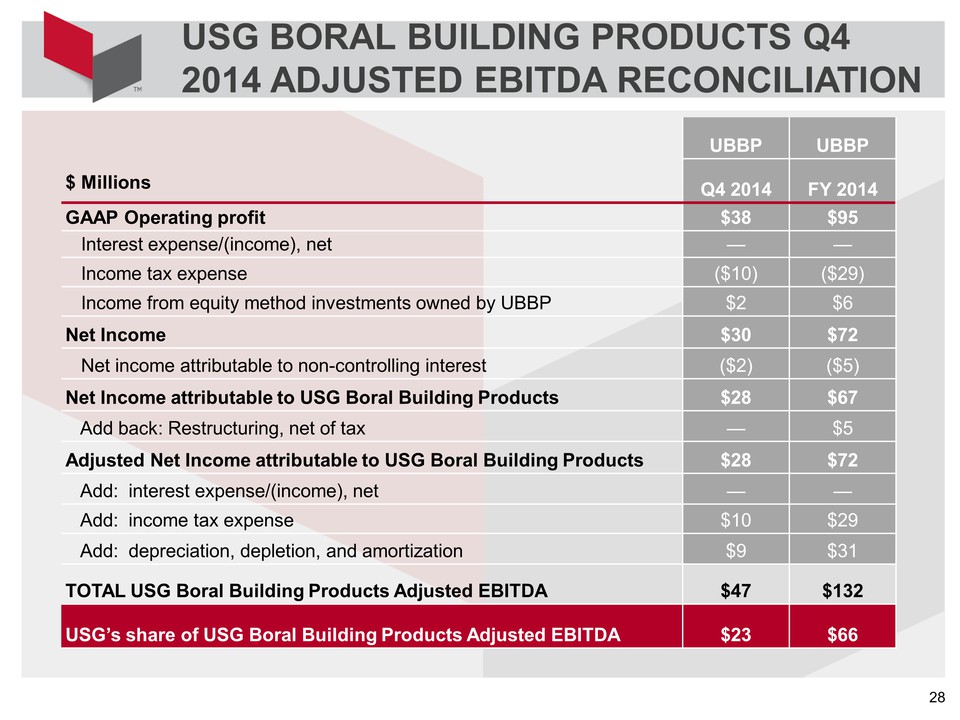
USG BORAL BUILDING PRODUCTS Q4 2014 ADJUSTED EBITDA RECONCILIATION $ Millions GAAP Operating profit Interest expense/(income), net Income tax expense Income from equity method investments owned by UBBP Net Income Net income attributable to non-controlling interest Net Income attributable to USG Boral Building Products Add back: Restructuring, net of tax Adjusted Net Income attributable to USG Boral Building Products Add: interest expense/(income), net Add: income tax expense Add: depreciation, depletion, and amortization TOTAL USG Boral Building Products Adjusted EBITDA $47 $132
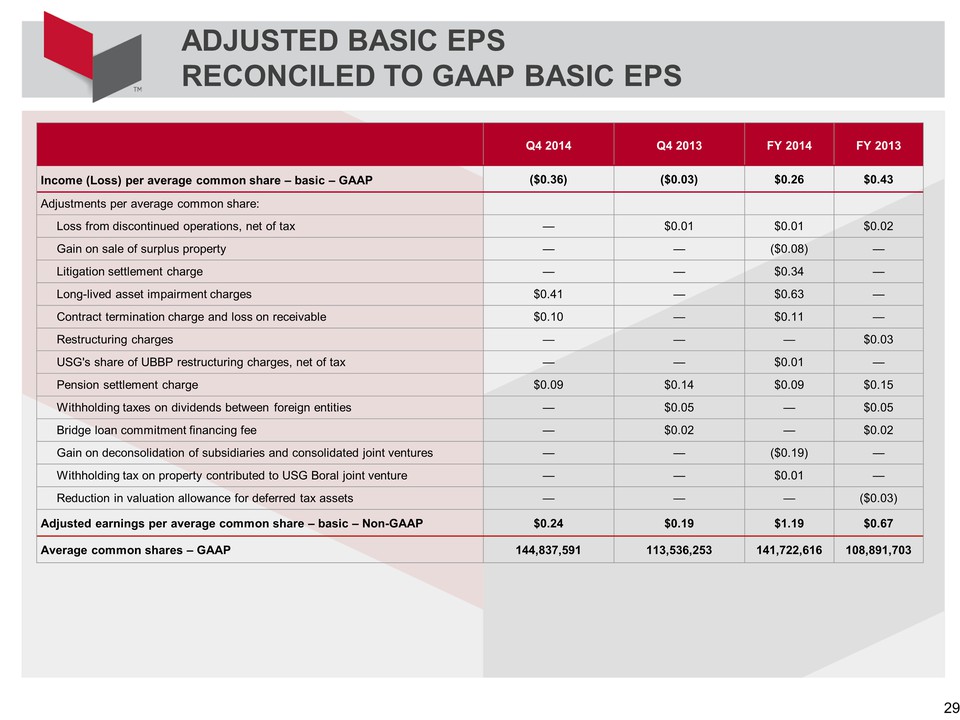
ADJUSTED BASIC EPS RECONCILED TO GAAP BASIC EPS Q4 2014 Q4 2013 FY 2014 FY 2013 Income (Loss) per average common share – basic – GAAP ($0.36) ($0.03) $0.26 $0.43 Adjustments per average common share: Loss from discontinued operations, net of tax — $0.01 $0.01 $0.02 Gain on sale of surplus property — — ($0.08) — Litigation settlement charge — — $0.34 — Long-lived asset impairment charges $0.41 — $0.63 — Contract termination charge and loss on receivable $0.10 — $0.11 — Restructuring charges — — — $0.03 USG's share of UBBP restructuring charges, net of tax — — $0.01 — Pension settlement charge $0.09 $0.14 $0.09 $0.15 Withholding taxes on dividends between foreign entities — $0.05 — $0.05 Bridge loan commitment financing fee — $0.02 — $0.02 Gain on deconsolidation of subsidiaries and consolidated joint ventures — — ($0.19) — Withholding tax on property contributed to USG Boral joint venture — — $0.01 — Reduction in valuation allowance for deferred tax assets — — — ($0.03) Adjusted earnings per average common share – basic – Non-GAAP $0.24 $0.19 $1.19 $0.67 Average common shares – GAAP 144,837,591 113,536,253 141,722,616 108,891,703
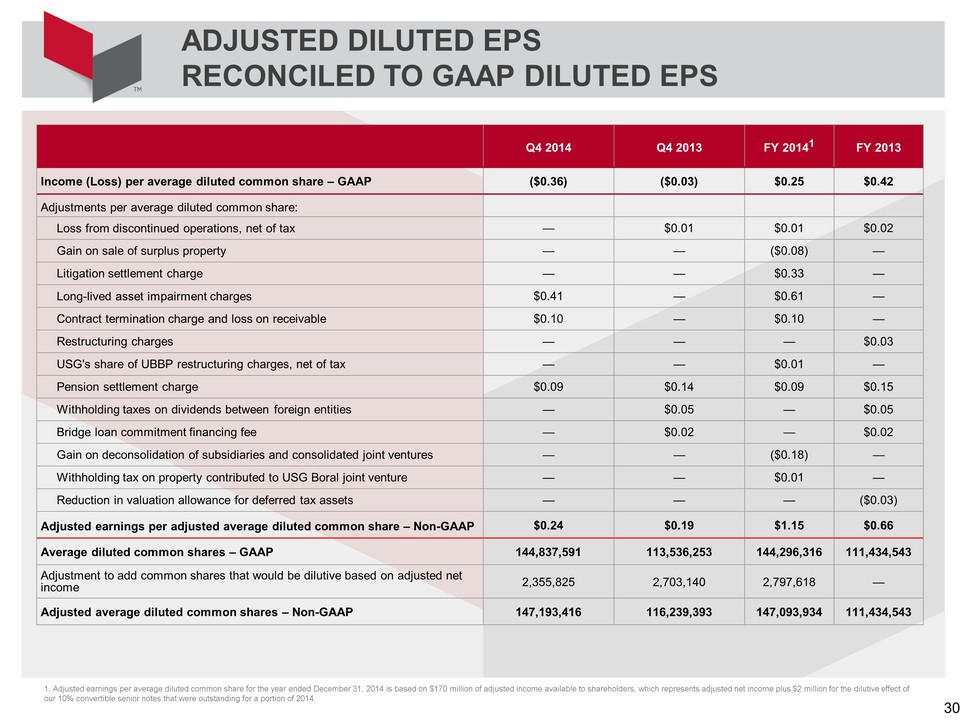
ADJUSTED DILUTED EPS RECONCILED TO GAAP DILUTED EPS 1. Adjusted earnings per average diluted common share for the year ended December 31, 2014 is based on $170 million of adjusted income available to shareholders, which represents adjusted net income plus $2 million for the dilutive effect of our 10% convertible senior notes that were outstanding for a portion of 2014. Q4 2014 Q4 2013 FY 20141 FY 2013 Income (Loss) per average diluted common share – GAAP ($0.36) ($0.03) $0.25 $0.42 Adjustments per average diluted common share: Loss from discontinued operations, net of tax — $0.01 $0.01 $0.02 Gain on sale of surplus property — — ($0.08) — Litigation settlement charge — — $0.33 — Long-lived asset impairment charges $0.41 — $0.61 — Contract termination charge and loss on receivable $0.10 — $0.10 — Restructuring charges — — — $0.03 USG's share of UBBP restructuring charges, net of tax — — $0.01 — Pension settlement charge $0.09 $0.14 $0.09 $0.15 Withholding taxes on dividends between foreign entities — $0.05 — $0.05 Bridge loan commitment financing fee — $0.02 — $0.02 Gain on deconsolidation of subsidiaries and consolidated joint ventures — — ($0.18) — Withholding tax on property contributed to USG Boral joint venture — — $0.01 — Reduction in valuation allowance for deferred tax assets — — — ($0.03) Adjusted earnings per adjusted average diluted common share – Non-GAAP $0.24 $0.19 $1.15 $0.66 Average diluted common shares – GAAP 144,837,591 113,536,253 144,296,316 111,434,543 Adjustment to add common shares that would be dilutive based on adjusted net income 2,355,825 2,703,140 2,797,618 — Adjusted average diluted common shares – Non-GAAP 147,193,416 116,239,393 147,093,934 111,434,543
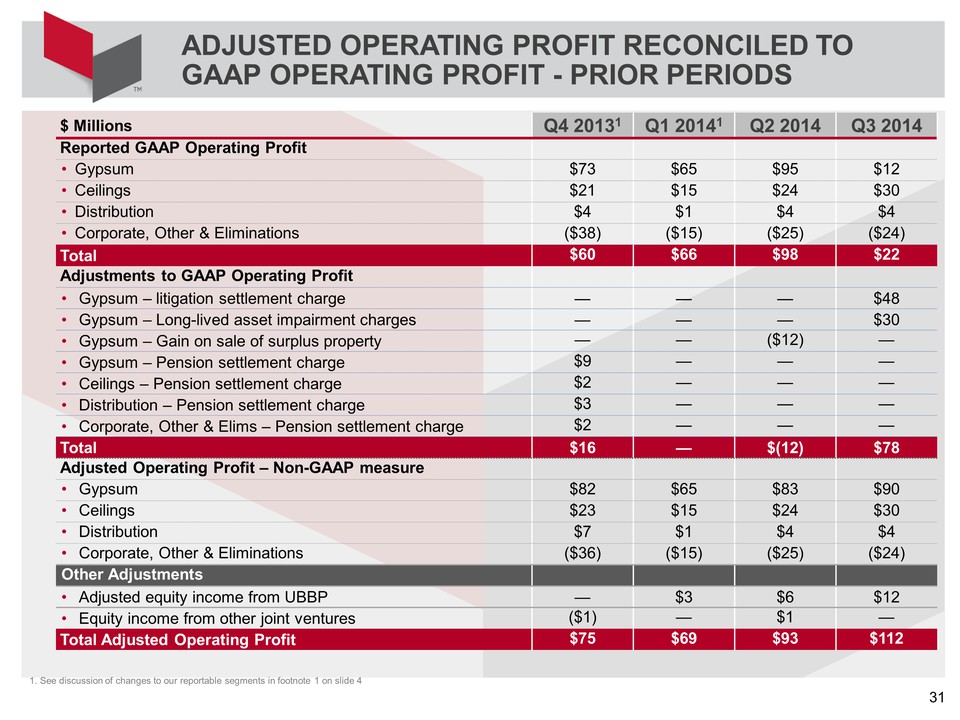
ADJUSTED OPERATING PROFIT RECONCILED TO GAAP OPERATING PROFIT - PRIOR PERIODS 1. See discussion of changes to our reportable segments in footnote 1 on slide 4$ Millions Q4 20131 Q1 20141 Q2 2014 Q3 2014 Reported GAAP Operating Profit Gypsum $73 $65 $95 $12 Ceilings $21 $15 $24 $30 Distribution $4 $1 $4 $4 Corporate, Other & Eliminations ($38) ($15) ($25) ($24) Total $60 $66 $98 $22 Adjustments to GAAP Operating Profit Gypsum – litigation settlement charge — — — $48 Gypsum – Long-lived asset impairment charges — — — $30 Gypsum – Gain on sale of surplus property — — ($12) — Gypsum – Pension settlement charge $9 — — — Ceilings – Pension settlement charge $2 — — — Distribution – Pension settlement charge $3 — — — Corporate, Other & Elims – Pension settlement charge $2 — — — Total $16 — $(12) $78 Adjusted Operating Profit – Non-GAAP measure Gypsum $82 $65 $83 $90 Ceilings $23 $15 $24 $30 Distribution $7 $1 $4 $4 Corporate, Other & Eliminations ($36) ($15) ($25) ($24) Other Adjustments Adjusted equity income from UBBP — $3 $6 $12 Equity income from other joint ventures ($1) — $1 — Total Adjusted Operating Profit $75 $69 $93 $112