Attached files
| file | filename |
|---|---|
| EX-99.1 - TRINITY CAPITAL CORPORATION PRESS RELEASE ANNOUNCING RESULTS OF SHAREHOLDER MEETING - TRINITY CAPITAL CORP | form8k20150125annmtgpr.htm |
| 8-K - TRINITY CAPITAL CORPORATION FORM 8-K ANNOUNCING RESULTS OF SHAREHOLDER MEETING - TRINITY CAPITAL CORP | form8k20150125annmtg.htm |

Trinity Capital Corporation Annual Meeting of ShareholdersJanuary 22, 2015

This presentation contains forward looking statements of the Company and its management within the meaning of such term in the Private Securities Litigation Reform Act of 1995, with respect to the financial condition, results of operations, plans, objectives, future performance and business of the Company. Actual results could differ materially from the results indicated in the presentation because of risks and uncertainties, including those described in Item 1A “Risk Factors” in the Company’s Form 10-K for December 31, 2013. All statements in this presentation, including forward-looking statements, speak only as of the date they are made, and the Company undertakes no obligation to update or revise any statement in light of new information or future events.

Consumer spending trends higherLower gas prices Hiring gains widespreadSoftware and IT sectorsManufacturing activity advancedConstruction and real estate activity expanded Source: FRB Beige Book 12/3/2014

New Mexico has struggled to recover from the recent recession due in part to the state’s heavy reliance on the government sector and a sharp decline in construction activity. Cutbacks in the government sector have led to job losses in both government employment and professional & business services employment. Residential construction activity has struggled to bounce back and remains well below pre-recession levels. However, unemployment rates have fallen gradually in New Mexico, and employment has increased modestly over the past year. Employment gains in recent years have been primarily driven by the energy, healthcare, and leisure & hospitality sectors. Source: New Mexico Economic Update, Alison Felix, Economist & Branch, Executive, Federal Reserve Bank of Kansas City Denver Branch, October 6, 2014.

LANL BudgetState Government and TourismReal EstateBanking Industry

Highly regulated industryGlass-Steagall ActDodd-Frank Wall Street Reform Act of 2010

Years Ended December 31 2013 2012 As Restated 2011 Unaudited and As Restated 2010 Unaudited and As Restated 2009 (Dollars in thousands, except per share data) Statement of Operations Data: Interest income 61,181 $ 67,274 $ 66,044 $ 72,078 $ 77,768 $ Interest expense 8,821 10,393 12,506 17,815 23,977 Net interest income 52,360 56,881 53,538 54,263 53,791 Provision for loan losses - 27,206 30,561 27,095 30,408 Net interest income after provision for loan losses 52,360 29,675 22,977 27,168 23,383 Noninterest income 15,465 19,125 15,831 16,260 20,489 Noninterest expenses 54,476 51,558 52,577 48,851 43,317 Income (loss) before provision (benefit) for income taxes 13,349 (2,758) (13,769) (5,423) 555 (Benefit) provision for income taxes - (250) 9,639 (3,337) 10 Net income (loss) 13,349 (2,508) (23,408) (2,086) 545 Dividends on preferred shares 2,144 2,115 2,142 2,127 1,604 Net income (loss) available to common shareholders 11,205 $ (4,623) $ (25,550) $ (4,213) $ (1,059) $ Common Share Data: Earnings (loss) per common share 1.74 $ (0.72) $ (3.96) $ (0.65) $ (0.16) $ Diluted earnings (loss) per common share 1.74 (0.72) (3.96) (0.65) (0.16) Book value per common share 8.71 7.09 7.89 12.22 13.54 Shares outstanding at end of period 6,449,726 6,449,726 6,449,726 6,449,726 6,440,784 Weighted average common shares outstanding 6,449,726 6,449,726 6,449,726 6,445,542 6,444,268 Diluted weighted average common shares outstanding 6,449,726 6,449,726 6,449,726 6,445,542 6,449,134 Dividend payout ratio N/A -20.83% -6.31% N/A -171.79% Cash dividends declared per common share - $ 0.15 $ 0.25 $ - $ 0.67 $

Restated FinancialsRe-File CALL reports and Y-9 for 2012 and 20132014 Quarterly ReportsRe-File Quarterly CALL reports and Y-9 for 2014File SEC Form 10-Qs2014 Annual ReportFile SEC Form 10-K

Positive Indicators Trinity Capital Corporation
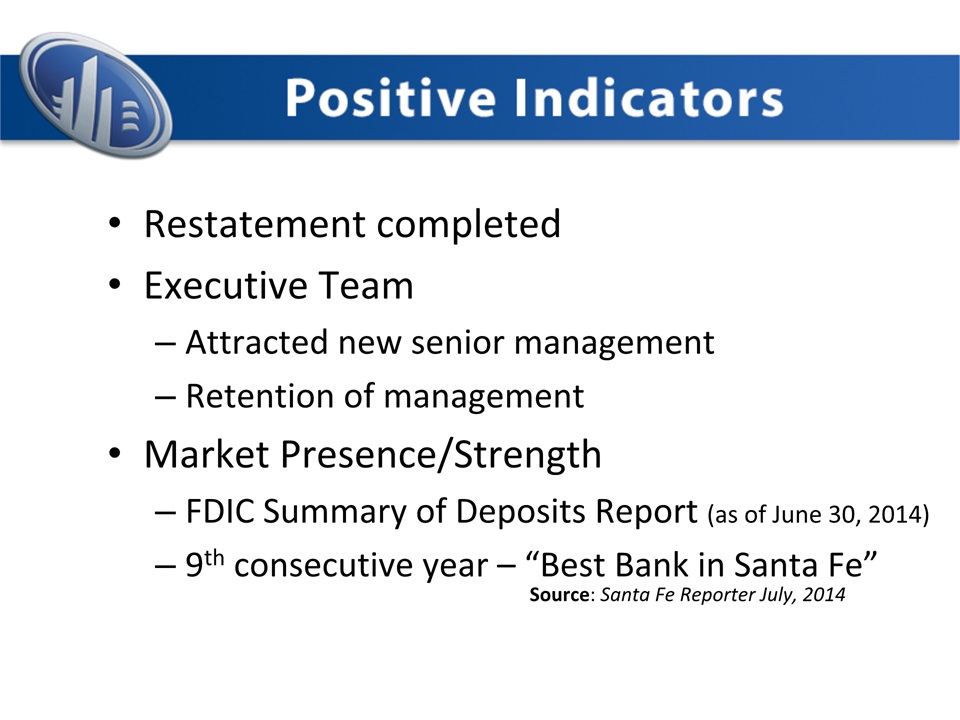
Restatement completedExecutive TeamAttracted new senior managementRetention of managementMarket Presence/StrengthFDIC Summary of Deposits Report (as of June 30, 2014)9th consecutive year – “Best Bank in Santa Fe” Source: Santa Fe Reporter July, 2014

2015 Strategic direction Trinity Capital Corporation


National economy expected to register modest improvement; State economy lagging National trend Santa Fe, Albuquerque, Rio Rancho and Farmington markets reflect the strongest economic trends Interest rates could rise in 2015 LANB growth will come from relationship expansion and competitors rather than through market expansion Commercial Real Estate and Residential 1-4 values stable and improving Regulatory climate will focus on risk management and capital preservation Deposit and loan growth opportunities subject to pricing and competitive pressures Banks with strong non-interest income business lines will differentiate themselves from traditional banking models Industry consolidation will result in fewer competitors

14

• Reduce credit risk profile • Continue to comply and emerge from consent order • Increase earnings and capital • Maximize efficiencies • Buy down Trust Preferred Securities (TruPS) & Troubled Asset Relief Program (TARP)• Improve risk management capabilities

Differentiate ourselves from the competition through superior service and our local decision making, responsiveness and continued market presence Expand on building a growing portfolio of low cost relationship-based deposits Maximize shareholder value
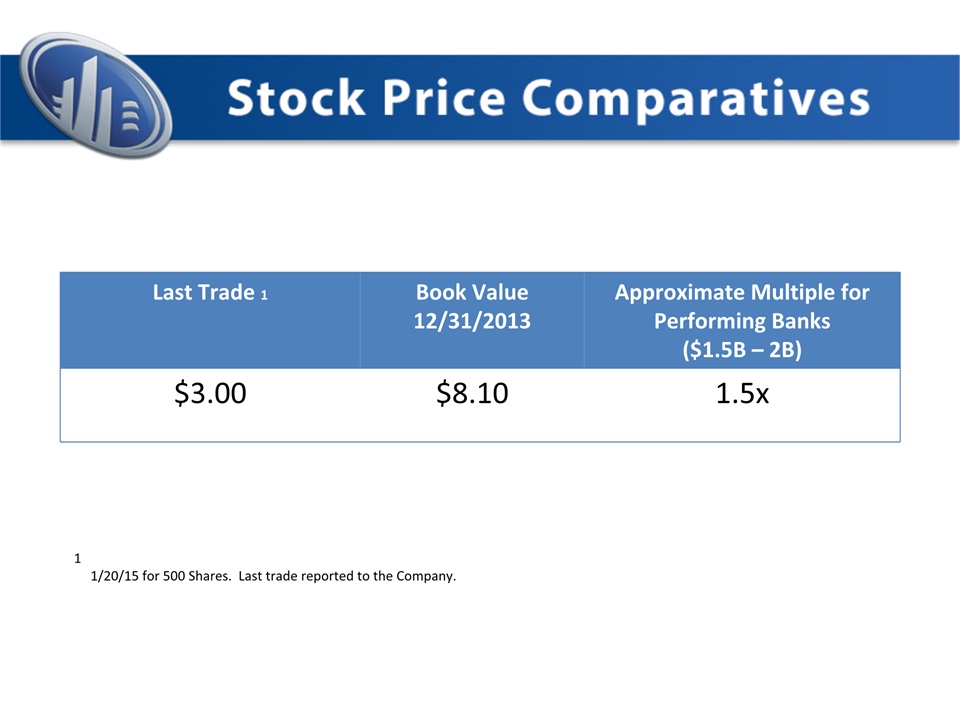
Last Trade 1 Book Value12/31/2013 Approximate Multiple for Performing Banks ($1.5B – 2B) $3.00 $8.10 1.5x 1 1/20/15 for 500 Shares. Last trade reported to the Company.

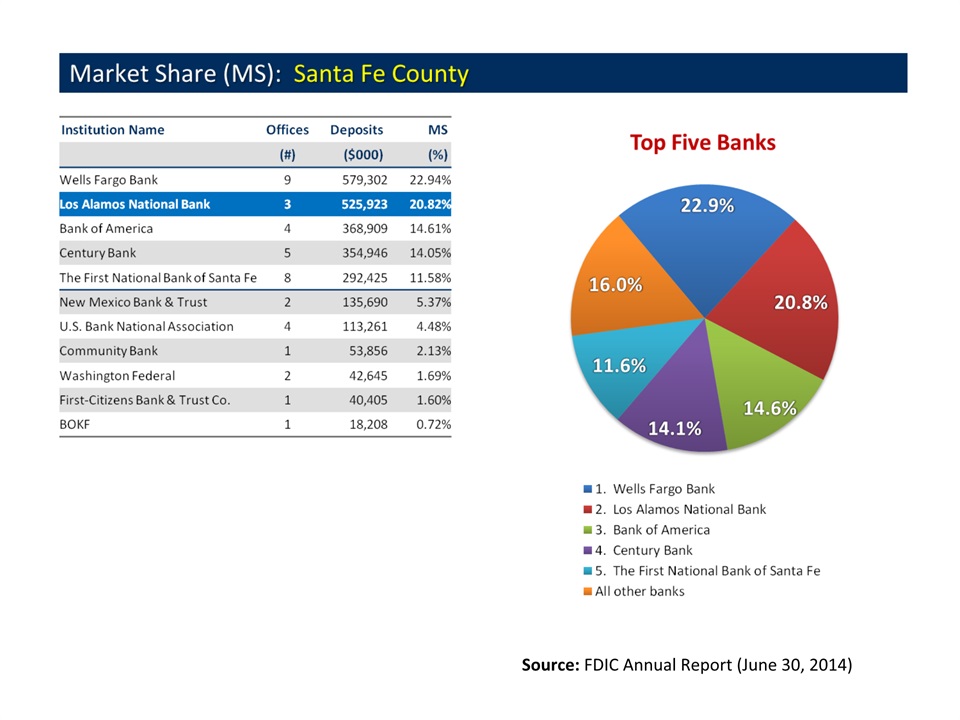
Source: FDIC Annual Report (June 30, 2014)
Source: FDIC Annual Report (June 30, 2014)

Source: FDIC Annual Report (June 30, 2014)

Achieve Financial Performance GoalsEstablish Enterprise Risk Management ProgramIncrease Return On Assets & Return On EquityRetain, Attract and Develop TalentEnhance Products and ServicesEnhance Total Shareholder ValueMaximize Operating Efficiencies

Questions?