Attached files
| file | filename |
|---|---|
| EX-23.1 - EX-23.1 - Franklin Financial Network Inc. | d851655dex231.htm |
| EX-23.3 - EX-23.3 - Franklin Financial Network Inc. | d851655dex233.htm |
Table of Contents
Index to Financial Statements
As filed with the Securities and Exchange Commission on January 15, 2015
Registration No. 333-
UNITED STATES
SECURITIES AND EXCHANGE COMMISSION
Washington, D.C. 20549
FORM S-1
REGISTRATION STATEMENT
UNDER
THE SECURITIES ACT OF 1933
FRANKLIN FINANCIAL NETWORK, INC.
(Exact name of registrant as specified in its charter)
| Tennessee | 6022 | 20-8839445 | ||
| (State or other jurisdiction of incorporation or organization) |
(Primary Standard Industrial Classification Code Number) |
(I.R.S. Employer Identification No.) |
722 Columbia Avenue
Franklin, Tennessee 37064
(615) 236-2265
(Address, including zip code, and telephone number, including area code, of registrant’s principal executive offices)
Richard E. Herrington
President and Chief Executive Officer
Franklin Financial Network, Inc.
722 Columbia Avenue
Franklin, Tennessee 37064
(615) 236-2265
(Name, address, including zip code, and telephone number, including area code of agent for service)
Copies to:
| Steven J. Eisen, Esq. Mark L. Miller, Esq. Baker, Donelson, Bearman, Caldwell & Berkowitz, PC 211 Commerce Street, Suite 800 Nashville, Tennessee 37201 (615) 726-5600 |
Edward F. Petrosky, Esq. Samir A. Gandhi, Esq. Sidley Austin LLP 787 Seventh Avenue New York, NY 10019 (212) 839-5300 |
Approximate date of commencement of the proposed sale of the securities to the public: As soon as practicable after this registration statement becomes effective.
If any of the securities being registered on this Form are to be offered on a delayed or continuous basis pursuant to Rule 415 under the Securities Act of 1933, check the following box. ¨
If this Form is filed to register additional securities for an offering pursuant to Rule 462(b) under the Securities Act, please check the following box and list the Securities Act registration statement number of the earlier effective registration statement for the same offering. ¨
If this Form is a post-effective amendment filed pursuant to Rule 462(c) under the Securities Act, check the following box and list the Securities Act registration statement number of the earlier effective registration statement for the same offering. ¨
If this Form is a post-effective amendment filed pursuant to Rule 462(d) under the Securities Act, check the following box and list the Securities Act registration statement number of the earlier effective registration statement for the same offering. ¨
Indicate by check mark whether the registrant is a large accelerated filer, an accelerated filer, a non-accelerated filer, or a smaller reporting company. See the definitions of “large accelerated filer,” “accelerated filer,” “non-accelerated filer” and “smaller reporting company” in Rule 12b-2 of the Exchange Act.
| Large accelerated filer ¨ |
Accelerated filer ¨ | Non-accelerated filer x | Smaller reporting company ¨ |
CALCULATION OF REGISTRATION FEE
|
| ||||
| Title of each class of securities to be registered |
Proposed maximum aggregate offering price(1) |
Amount of registration fee(2) | ||
| Common Stock, no par value |
$50,000,000 | $5,810 | ||
|
| ||||
|
| ||||
| (1) | Estimated solely for the purpose of calculating the registration fee in accordance with Rule 457(o) under the Securities Act of 1933, as amended. Includes offering of additional shares that the underwriters have the option to purchase. |
| (2) | Calculated pursuant to Rule 457(o) under the Securities Act based on an estimate of the proposed maximum offering price. |
The registrant hereby amends this registration statement on such date or dates as may be necessary to delay its effective date until the registrant shall file a further amendment which specifically states that this registration statement shall thereafter become effective in accordance with Section 8(a) of the Securities Act or until the registration statement shall become effective on such date as the Securities and Exchange Commission, acting pursuant to Section 8(a), may determine.
Table of Contents
Index to Financial Statements
The information in this prospectus is not complete and may be changed. We may not sell these securities until the registration statement filed with the Securities and Exchange Commission is effective. This prospectus is not an offer to sell these securities and it is not soliciting an offer to buy these securities in any state where the offer or sale is not permitted.
Subject to Completion
Preliminary Prospectus dated January 15, 2015
PROSPECTUS
Shares

Franklin Financial Network, Inc.
Common Stock
This is Franklin Financial Network Inc.’s initial public offering. We are offering shares of our common stock.
We expect the public offering price to be between $ and $ per share. Currently, our shares of common stock trade on the over the counter bulletin board (“OTCBB”). After pricing of the offering, we expect that the shares will trade on the under the symbol “ .”
Investing in the common stock involves risks that are described in the “Risk Factors” section beginning on page 23 of this prospectus.
| Per Share |
Total |
|||||||
| Public offering price |
$ | $ | ||||||
| Underwriting discount |
$ | $ | ||||||
| Proceeds, before expenses, to us |
$ | $ | ||||||
The underwriters may also exercise their option to purchase up to an additional shares from us, at the public offering price, less the underwriting discount, for 30 days after the date of this prospectus.
Neither the Securities and Exchange Commission nor any state securities commission has approved or disapproved of these securities or determined if this prospectus is truthful or complete. Any representation to the contrary is a criminal offense. Shares of our common stock are not savings or deposit accounts or other obligations of any bank or non-bank subsidiary of our company, and they are not insured by the Federal Deposit Insurance Corporation, the Deposit Insurance Fund, or any other governmental agency.
The shares will be ready for delivery on or about , 2015.
BofA Merrill Lynch
The date of this prospectus is , 2015.
Table of Contents
Index to Financial Statements
| 1 | ||||
| UNAUDITED PRO FORMA COMBINED CONDENSED FINANCIAL INFORMATION |
17 | |||
| 23 | ||||
| 40 | ||||
| 42 | ||||
| 43 | ||||
| 44 | ||||
| 45 | ||||
| MANAGEMENT’S DISCUSSION AND ANALYSIS OF FINANCIAL CONDITION AND RESULTS OF OPERATIONS |
47 | |||
| 87 | ||||
| 104 | ||||
| 115 | ||||
| 123 | ||||
| 130 | ||||
| SECURITY OWNERSHIP OF CERTAIN BENEFICIAL OWNERS AND MANAGEMENT |
131 | |||
| 133 | ||||
| 135 | ||||
| 145 | ||||
| MATERIAL U.S. FEDERAL INCOME TAX CONSIDERATIONS FOR NON-U.S. HOLDERS |
147 | |||
| 150 | ||||
| 157 | ||||
| 157 | ||||
| 157 | ||||
| F-1 |
i
Table of Contents
Index to Financial Statements
ABOUT THIS PROSPECTUS
You should rely only on the information contained in this prospectus or in any free writing prospectus that we authorized to be delivered to you. We and the underwriters have not authorized anyone to provide you with additional or different information. If anyone provides you with additional, different or inconsistent information, you should not rely on it. We and the underwriters take no responsibility for, and can provide no assurance as to the reliability of, any other information that others may give you. This prospectus is an offer to sell only the shares offered hereby, and only under circumstances and in jurisdictions where it is lawful to do so. We are not making an offer of these securities in any state, country or other jurisdiction where the offer is not permitted. You should assume that the information contained in this prospectus and any free writing prospectus we authorized to be delivered to you is accurate only as of their respective dates or the date or dates specified in those documents regardless of its time of delivery or the time of any sale of our common stock. Our business, financial condition, results of operations, cash flows and prospects may have changed since those dates.
For investors outside the United States: Neither we nor any of the underwriters have done anything that would permit this offering or possession or distribution of this prospectus in any jurisdiction where action for that purpose is required, other than in the United States. Persons outside the United States who come into possession of this prospectus must inform themselves about, and observe any restrictions relating to, the offering of the common stock and the distribution of this prospectus outside the United States.
Market Data
This prospectus includes industry and trade association data, forecasts and information that we have prepared based, in part, upon data, forecasts and information obtained from independent trade associations, industry publications and surveys, government agencies and other information available to us, which information may be specific to particular markets or geographic locations. Some data is also based on our good faith estimates, which are derived from management’s knowledge of the industry and independent sources. Industry publications and surveys and forecasts generally state that the information contained therein has been obtained from sources believed to be reliable. Although we believe these sources are reliable, we have not independently verified the information. Statements as to our market position are based on market data currently available to us. While we are not aware of any misstatements regarding our industry data presented herein, our estimates involve risks and uncertainties and are subject to change based on various factors, including those discussed under the heading “RISK FACTORS” in this prospectus. Similarly, we believe our internal research is reliable, even though such research has not been verified by any independent sources.
Implications of Being an Emerging Growth Company
As a company with less than $1.0 billion in revenue during our last fiscal year, we qualify as an “emerging growth company” as defined in the Jumpstart Our Business Startups Act of 2012 (the “JOBS Act”). We will continue to be an emerging growth company until the earliest to occur of: (1) the end of the fiscal year following the fifth anniversary of the effectiveness of our Form S-4 filed with the Securities and Exchange Commission (the “SEC”) on May 14, 2014 in connection with our acquisition of MidSouth Bank (“MidSouth”), which registered our common stock issued in the acquisition of MidSouth under the Securities Act of 1933, as amended (the “Securities Act”), and resulted in us becoming an SEC reporting company under Section 15(d) of the Securities Exchange Act of 1934, as amended (the “Exchange Act”); (2) the last day of the fiscal year in which we have more than $1.0 billion in annual revenues; (3) the date on which we are deemed to be a “large accelerated filer” under the Exchange Act; or (4) the date on which we have, during the previous three-year period, issued publicly or privately, more than $1.0 billion in non-convertible debt securities. Until we cease to be an emerging growth company, we may take advantage of specified reduced reporting and other regulatory requirements generally unavailable to other public companies. Among other things, those provisions allow us to present only two years of audited financial statements, discuss only our results of operations for two years in related Management’s Discussions and Analyses and provide less than five years of selected financial data in an
ii
Table of Contents
Index to Financial Statements
initial public offering registration statement; not to provide an auditor attestation of our internal control over financial reporting under the Sarbanes-Oxley Act of 2002, as amended; to choose not to adopt new or released financial accounting standards until such standards are applicable to private companies; to provide reduced disclosure regarding our executive compensation arrangements pursuant to the rules applicable to smaller reporting companies, which means we do not have to include a compensation discussion and analysis and certain other disclosure regarding our executive compensation; and not to seek a non-binding advisory vote on executive compensation or shareholder approval of golden parachute arrangements not previously approved. We may choose to take advantage of some or all of these reduced reporting and other regulatory requirements, including those reduced requirements pertaining to the periodic reports we file with the SEC and proxy statements we use to solicit proxies from our shareholders. We have elected in this prospectus to take advantage of the reduced disclosure requirements relating to executive compensation arrangements.
We have also elected not to take advantage of the extended transition period that allows an emerging growth company to delay the adoption of certain accounting standards until those standards would otherwise apply to private companies, which means that the financial statements included in this prospectus, as well as the financial statements we file in the future, will be subject to all new or revised accounting standards generally applicable to public companies. As a result, we will comply with new or revised accounting standards to the same extent that compliance is required for non-emerging growth companies. Our decision to opt out of the extended transition period under the JOBS Act is irrevocable.
iii
Table of Contents
Index to Financial Statements
This summary highlights information contained elsewhere in this prospectus. This summary is not complete and does not contain all of the information that you should consider before investing in our shares of common stock. You should carefully read this prospectus in its entirety before making an investment decision. In particular, you should read the section entitled “RISK FACTORS” beginning on page 23, “MANAGEMENT’S DISCUSSION AND ANALYSIS OF FINANCIAL CONDITION AND RESULTS OF OPERATIONS” beginning on page 47 and our consolidated financial statements and notes related to those statements included elsewhere in this prospectus. As used in this prospectus, unless the context otherwise indicates, any reference to “Franklin Financial,” “our company,” “the company,” “us,” “we” and “our” refers to Franklin Financial Network, Inc. together with its consolidated subsidiaries (including Franklin Synergy), any reference to “FFN” refers to Franklin Financial Network, Inc. only and any reference to “Franklin Synergy” or the “Bank” refers to our banking subsidiary, Franklin Synergy Bank. We have applied to list our common stock on the under the symbol “ ”.
Unless otherwise indicated, the information included in this prospectus assumes (1) the sale of our common stock in this offering at an offering price of $ per shares of common stock, which is the mid-point of the pricing range set forth on the cover page of this prospectus and (2) that the underwriter has not exercised its option to purchase up to shares of common stock.
Company Overview
We are a bank holding company headquartered in Franklin, Tennessee. Through our wholly owned bank subsidiary, Franklin Synergy Bank, a Tennessee-chartered commercial bank and a member of the Federal Reserve System, we provide a full range of banking and related financial services with a focus on service to small businesses, corporate entities, local governments and individuals. We operate through 11 branches in the demographically attractive and growing Williamson and Rutherford Counties within the Nashville metropolitan area.
As of September 30, 2014, we had consolidated total assets of $1.24 billion, total loans, including loans held for sale, of $745 million, total deposits of $1.05 billion and total shareholders’ equity of $116 million. Our 2014 third quarter financial information gives effect to our acquisition of MidSouth, which was completed on July 1, 2014.
Our History and Growth
We were formed as a Tennessee corporation in April 2007 and commenced banking operations through the newly-formed Franklin Synergy Bank in November 2007. Our shareholders are predominantly comprised of individuals, many of whom are customers of the Bank and reside in our target markets. As of the date of this offering, individuals own over 85% of our outstanding common equity.
We were established with the objective of building a locally-managed commercial bank to service the needs of Franklin, Tennessee and the greater Williamson County area. Our mission statement is to build a legacy company by creating shareholder value, cultivating strong customer relationships and fostering an extraordinary team of directors, officers and employees. We were formed by a core management team of veteran bankers based in Middle Tennessee led by our Chairman and Chief Executive Officer, Richard Herrington. Many of our founders built Franklin Financial Corporation (not directly affiliated with our company), which was founded in 1988, and grew the newly-formed real estate-oriented bank to nine branches and $785 million in assets as of June 30, 2002, before announcing the sale of the bank to Fifth Third Bancorp in July 2002. Mr. Herrington and certain members of this management team subsequently joined Cumberland Bancorp (later renamed Civitas BankGroup, Inc. (“Civitas BankGroup”)), a troubled Tennessee-based bank holding company, in December
1
Table of Contents
Index to Financial Statements
2002, to lead its restructuring. The team led a dramatic improvement of Cumberland’s asset quality and profitability, by decreasing nonperforming loans to total loans from 2.25% in 2003 to 0.31% in 2006 and growing net income from $1.1 million in 2003 to $6.7 million in 2006, before it was acquired by Greene County Bancshares, Inc. in May 2007.
Since our inception and prior to acquiring MidSouth in July 2014, we have achieved significant and consistent organic growth. From December 31, 2009 to June 30, 2014 (one day before the MidSouth acquisition closed), we:
| • | grew our consolidated total assets by a compound annual growth rate (“CAGR”) of 30% from $272 million to $872 million as of June 30, 2014; |
| • | increased our total loans, including loans held for sale, by a CAGR of 28% from $168 million to $502 million as of June 30, 2014; |
| • | increased our total deposits by a CAGR of 30% from $227 million to $747 million as of June 30, 2014 and achieved a number one deposit market share in Williamson County based on deposits at June 30, 2014; |
| • | expanded our employee base from 70 full-time equivalent employees to 126 full-time equivalent employees as of June 30, 2014; and |
| • | added an additional four branches to expand our footprint to a total of six branches. |
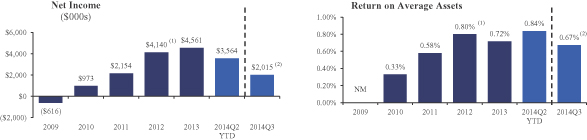
As we have grown, we have leveraged our infrastructure to improve our efficiency ratio from 93% in 2009 to 63% for the six months ended June 30, 2014. This improved efficiency has led to greater profitability, as we went from recording a loss of $0.6 million for the year ended December 31, 2009 to a profit of $5.9 million for the last twelve months ending June 30, 2014 and a 0.84% annualized return on average total assets for the six months ended June 30, 2014. In addition, from the year ended December 31, 2009 to the six months ended June 30, 2014, we increased our return on average equity from (2.8%) to 10.3%, and our return on average tangible common equity from (2.8%) to 12.1%.
We have preserved our strong credit culture while growing steadily as evidenced by our low balance of nonperforming loans, which were 0.33% of our total loans as of June 30, 2014, and quarterly net charge-offs to average loans which have averaged 0.04% from January 1, 2009 through June 30, 2014.
MidSouth Acquisition
On July 1, 2014, we completed our acquisition of MidSouth which enabled us to increase our footprint in Middle Tennessee and in the Nashville metropolitan area, specifically in the attractive Rutherford County market. The acquisition also diversified our revenue mix by expanding our retail customer base and increasing our capacity to provide wealth management services, including trust powers, which we believe is a competitive advantage to drive new relationships with higher income customers. Headquartered in Murfreesboro, Tennessee and founded in 2004, MidSouth had five branches located throughout Rutherford County, which is adjacent to Williamson County. Although MidSouth operated in close proximity to us, there was no overlap of branch locations and MidSouth’s customer base complemented ours with minimal overlap.
Immediately prior to closing the acquisition, MidSouth had total assets of $281 million, total loans of $199 million, including loans held for sale, and total deposits of $244 million. MidSouth’s loan portfolio, like ours, was primarily comprised of real estate loans. For the six-month period ended June 30, 2014, MidSouth’s balance of nonperforming loans to total loans was 1.34% and net recoveries to average loans, on an annualized basis, was 0.17%.
2
Table of Contents
Index to Financial Statements
As a result of the MidSouth acquisition, and as of July 1, 2014, the Company, after giving effect to purchase accounting:
| • | grew our consolidated total assets from $872 million to $1.17 billion; |
| • | increased our total loans, including loans held for sale, from $502 million to $693 million; |
| • | increased our total deposits from $747 million to $992 million; and |
| • | expanded our employee base from 126 full-time equivalent employees to 227 full-time equivalent employees. |
Third Quarter 2014 and Organic Growth
In the quarter immediately following our completion of the MidSouth acquisition, we continued to achieve organic growth as a combined company. From July 1, 2014 (after giving effect to the MidSouth acquisition) to September 30, 2014, we:
| • | grew our consolidated total assets 6% from $1.17 billion to $1.24 billion as of September 30, 2014; |
| • | increased our total loans, including loans held for sale, 7% from $693 million to $745 million as of September 30, 2014; and |
| • | increased our total deposits 6% from $992 million to $1.05 billion as of September 30, 2014. |
The following charts show our growth in total loans, deposits and net income as well as our annualized return on average assets since 2009.
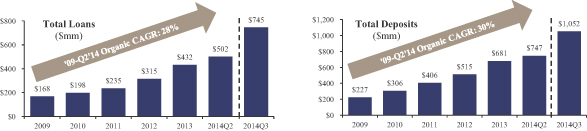
Note: Total loans and total deposits in millions. 2014 Q3 numbers include impact from MidSouth acquisition which closed July 1st.
| (1) | Includes $0.6 million gain of life insurance benefits. |
| (2) | Includes $0.6 million of expenses attributed to the acquisition of MidSouth. |
3
Table of Contents
Index to Financial Statements
Our Market Opportunity
Our Market
We operate 11 branches in Williamson and Rutherford Counties within the Nashville metropolitan area. Below is a map of our branch network:

4
Table of Contents
Index to Financial Statements
Our markets are among the most attractive, both in Tennessee and the Southeast, and compare favorably to some of the more well-known and higher-profile markets in the U.S., although our markets are not dependent on commodity pricing. We believe that our focus on, and success in, growing market share in Williamson and Rutherford Counties will enhance our long-term value and profitability compared to financial institutions of our size in other regions of the country. As the following charts demonstrate, the markets in which we operate are characterized by strong demographics including high incomes, increasing population, a growing workforce and unemployment that tends to be below the national rate.
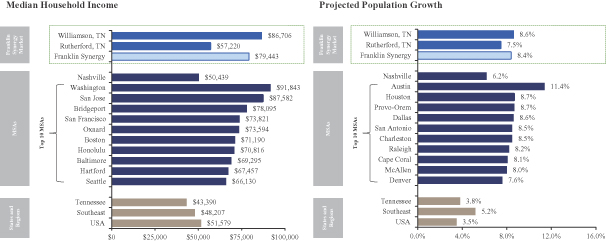
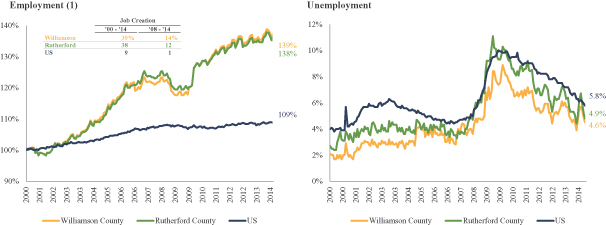
| Source: | Bureau of Labor Statistics and SNL Financial. |
| Note: | Southeast includes AL, AR, FL, GA, MS, NC, SC, TN, VA and WV. Metrics weighted by population. |
| Note: | Projected figures calculated from 2014 to 2019. |
| Note: | Franklin Synergy refers to Williamson and Rutherford counties weighted by deposits. |
| (1) | Employment rate indexed against 2000 data. |
5
Table of Contents
Index to Financial Statements
Nashville
In 2013, Nashville was ranked by Forbes as one of the Best Cities for Business and Careers. Its leading industries are health care management, tourism, education, music and entertainment. Healthcare is the largest industry in Nashville, with healthcare companies contributing $30 billion per year and 200,000 jobs to the economy of Nashville and its surrounding areas according to the Nashville Health Care Council. The Nashville area contains 21 accredited four-year colleges and universities (including Vanderbilt University, which was most recently ranked by US News & World Report as 16th among national universities). Based on Census data, Nashville’s 2010 – 2013 net domestic migration rate of 2.5% ranked sixth among major metropolitan areas.1 Additionally, there is no state personal income tax on wages.
Jobs have been created at a robust rate, as civilian labor force employment in the Nashville Metropolitan Statistical Area (“MSA”) has grown since 2000 by 15% to approximately 810,000. Large companies continue to be attracted to the Nashville area and its favorable economic and business-friendly climate. For example, Amazon.com now employs 2,000 Nashville area residents and announced plans in July 2014 to build a new sorting center, creating another 100 jobs. In October 2014, Under Armour announced its plan to build a distribution center, bringing 1,500 new jobs. Furthermore, in November 2014, Bridgestone Americas announced that it will relocate its headquarters to Nashville, creating 600 new jobs for the city, and FedEx announced its plans to build a new distribution center in the area creating another 350 jobs.
Williamson County
Williamson County is the wealthiest county in Tennessee and one of the wealthiest in the U.S., with a median household income of $86,706. It is also the fastest-growing county in Tennessee, as its population, currently 199,481, increased by 8.9% from 2010 to 2014 and is projected to increase by 8.6% from 2014 through 2019. Civilian labor force employment in the county has grown since 2000 by 39% to approximately 96,000.
There has been successful regional economic development in Williamson County. There are currently 14 Fortune 1,000 companies with significant presences and/or regional headquarters in the county. Within the last seven years, Mars Petcare established a global innovation center; Nissan relocated its North American headquarters; and Verizon Wireless, Jackson National Life and Shelter Insurance relocated their regional or state headquarters, all within Williamson County. The county has only 4.6% unemployment and there are over 6,000 businesses. According to Metrostudy, the nation’s leading provider of primary and secondary market information to the housing, retail and related industries nationwide, new home sales in Williamson County are robust, with only 1.6 months of inventory of homes on the market and residential closings are up 9% over 2013 for the twelve months ended September 30, 2014.
Williamson County has three AAA-rated government entities: the county, the city of Franklin and the city of Brentwood. In September 2014, Franklin was designated by Money Magazine as one of the Top 50 places to live in the U.S., due to the area’s abundance of jobs, low cost of living, cultural/lifestyle considerations and top schools. Williamson County features the highest ranked public school district in Tennessee.
Rutherford County
Rutherford County is one of the wealthiest counties in Tennessee, with a median household income of $57,220. It is the fifth largest county in Tennessee with a population of 282,183, which has increased by 7.5% from 2010 to 2014 and is projected to increase by an additional 7.5% from 2014 through 2019.
| 1 | Per NewGeography.com. |
6
Table of Contents
Index to Financial Statements
Rutherford County features strong economic development and quality of life. Civilian employment in the county has grown since 2000 by 38% to almost 140,000. The drivers of expanding economic development in Rutherford County have been manufacturing, small businesses and the presence of the largest undergraduate university in Tennessee, Middle Tennessee State University. The county is home to one of Nissan’s U.S. manufacturing facilities, one of Bridgestone’s manufacturing facilities, and a General Mills production facility. The county has 4.9% unemployment. According to Metrostudy, there are 1.4 months of inventory of homes on the market and residential closings are up 5% over 2013 for the twelve months ended September 30, 2014.
Our Business Strategy
We consider ourselves to be bankers, not just lenders. Our core business strategy is to provide our banking customers with a full suite of financial services by cultivating strong long-term customer relationships and by developing an extraordinary team of officers and employees focused on the customer experience. We are focused on providing convenience and personal service to our customers that is superior to that of the out-of-state super-regional and national financial institutions operating in our markets, while simultaneously managing risk and profitability by remaining selective when expanding our customer base and making loans. We also prioritize our client’s financial security and privacy and assist the communities in which we do business through socially responsible leadership. Our unique culture is a cornerstone to our business and has resulted in substantial but stable growth and profitability.
By continuing to offer several value-added products and services within our core areas of strength, such as mortgage lending and wealth management, to invest in technology to improve our systems and the customer experience, and to leverage strong relationships with consumers, professionals, local governments and businesses within our community, we believe we can gain greater market share, which will improve our operational efficiency and increase profitability. As evidence of the success of our strategy, our deposit market share in Williamson County has increased from 3.4% in 2009 to a market-leading approximately 13.0% currently, despite the presence of more institutions competing for deposits.
The key components of our strategy include the following:
Real Estate Focus, with Enhanced Small Business Initiative
We are real estate bankers with a focus on Middle Tennessee. Our management team’s experience building a robust real estate lending platform at Franklin Financial Corporation from 1989 to 2002 formed the basis for our lending principles that have helped us grow profitably while managing credit and other risks. Our lending philosophy focuses on three principles: (1) we focus our underwriting and rely strongly on the credit of secondary sources of repayment (i.e., collateral), (2) the substantial majority of our collateral, by choice, is local in-market real estate and (3) we limit unsecured lending (which comprises less than 2% of our total loan portfolio).
Approximately ninety percent (90%) of our loan portfolio is secured by real estate. We are primarily focused on residential construction lending and office/warehouse commercial real estate lending, which limits our exposure to commitments to larger projects, such as multifamily projects and hospitality and leisure projects. Our real estate portfolio is fairly evenly divided among (1) short-term construction loans (primarily residential), (2) traditional commercial real estate, and (3) mortgage loans (many of which are business loans secured by local real estate). Thirty-one percent (31%) of our loan portfolio is in commercial real estate, 30% is in construction loans and 28% is in one-to-four family residential loans, with the average loan size for a project of less than $200,000. The construction loans and many of the other real estate loans in our lending portfolio have variable interest rates and the average maturity of our loan portfolio is 47 months, which we believe allows us to be well positioned in a rising rate environment.
7
Table of Contents
Index to Financial Statements
The average life of our construction loans is less than nine months, and we have averaged $20 million in construction loan pay-offs per month for the nine months ended September 30, 2014. Some of these construction loans lead to mortgage loans originated by our mortgage banking team and are subsequently sold into the secondary market. We have no significant concentration of builder or subdivision exposure within our construction loan portfolio. We have increased our focus on small business lending and have grown our commercial and industrial loans (“C&I loans”) by a CAGR of 37% from December 31, 2009 through June 30, 2014. As of September 30, 2014, C&I loans now represent 10% of our portfolio.
Continue to Prudently Manage Credit Risk
We do not avoid risk—we manage it prudently. We believe that our strong balance sheet and our enterprise risk management philosophy have been important in gaining and maintaining the confidence of our various constituencies and growing our business and footprint within the growing Middle Tennessee market. Our focus on asset quality is the foundation of our profitability and financial strength. The credit quality of our loan portfolio has continually improved, as nonperforming loans have decreased from 3.37% of our loan portfolio at December 31, 2009 to 0.45% at September 30, 2014. Further, our investment portfolio is mainly comprised of securities representing U.S. government agency mortgage-backed securities, which account for 91% of the fair value of our investment portfolio as of September 30, 2014, and the balance of the securities portfolio is comprised of other federal and municipal securities, such as U.S. Treasury securities.
Optimize Presence throughout Our Footprint
Our recent acquisition of MidSouth allowed us to expand selectively into Rutherford County; a contiguous market with long-term growth potential similar to Williamson County. We currently have the top position in the Williamson County deposit market, with 13% market share, and rank sixth in the Rutherford County deposit market, with 7% market share. The strong demographic profiles and economic momentum of Williamson and Rutherford Counties translate into what we believe to be significant organic growth potential over the next few years. We do not believe that we need to add a significant number of new branches or otherwise meaningfully increase our physical presence in order to realize the growth potential contained within these markets. We will evaluate opportunities to open new branches or ancillary offices (i.e., loan production or wealth management offices), as well as acquisitions, as they arise, but our strategy does not necessitate inorganic growth.
Diversification of Revenue
We are continuously expanding the products and services we offer to our customers. Our range of products and services diversifies our earnings stream, strengthens our balance sheet and provides greater flexibility to manage our business in volatile interest rate environments and amid shrinking interest rate margins in the U.S. banking industry. Recently, via the MidSouth acquisition, we have further invested in our mortgage banking division and expanded into wealth management. We will look to further grow these divisions in order to better provide a full suite of services to our customers, add more “touch points” that our customers have with the Bank and drive greater fee income and profitability. Rather than engaging in mass-market advertising, we typically attract new customers by utilizing existing customer relationships and maintaining our presence in our communities. This practice provides opportunities for our relationship managers to cross-sell other products and services to these clients. In addition, we offer our expertise and targeted service offerings for a variety of small businesses and non-profit organizations.
We believe that enhancing our cross-selling capabilities will enable us to generate higher revenues, increase our deposits and diversify our income stream.
8
Table of Contents
Index to Financial Statements
Our fee income businesses consist of the following:
| • | Mortgage Banking. Our mortgage banking business has generated 13.5% of our revenue (defined in accordance with the industry standard as net interest income plus noninterest income) for the nine months ended September 30, 2014. We sell the majority of loans that are originated in-house in the secondary market and we have the option to retain servicing rights. We are currently servicing 1,722 loans with an approximate aggregate principal balance of $398 million. For the nine months ended September 30, 2014, we originated $219 million of loans. Our efforts to expand our Mortgage Banking business have emphasized purchase loans versus attracting rate sensitive refinancing opportunities. Additionally, mortgage production has a natural tie-in to our residential construction business as a number of our newly originated loans are sourced from our construction loan relationships. |
| • | Wealth Management/Trust Services. Our wealth management business has $168 million in assets under management as of September 30, 2014. Leveraging MidSouth’s wealth management expertise into our selective customer base and the wealthy Williamson County market represents an attractive and unique opportunity. With the MidSouth acquisition, we acquired a trust business and we believe that our possession of a trust charter is a competitive advantage, enabling us to attract newer and wealthier customers and more “sticky” long term deposits. |
For the nine months ended September 30, 2014, noninterest income represented 21.8% of our revenue.
Enhance Deposit Base
We will look to attract more low-cost, high-quality and long-term retail deposits. Our cost of deposits for the nine months ended September 30, 2014 was 0.61%, compared to 1.88% in 2009, as a result of our increased ability to attract transactional accounts. During the twelve months ended September 30, 2014, we attracted $528 million of deposits. We are able to leverage existing relationships throughout our customer base by cross-selling services and incentivizing our bankers to bring in deposit relationships, in addition to loans. Local government deposits represent an attractive source of low-cost, seasonal but predictable deposits. As of September 30, 2014, public funds interest checking deposits had a balance of $122 million. We will look to increase the amount of municipal deposits in the future. We believe that the expansion of our small business loan portfolio will provide an attractive and growing source of low-cost deposits in the future.
Additionally, our investments in technology, which have resulted in a strong mobile banking platform and services such as remote deposit capture, enable us to attract and retain deposit customers in a competitive local environment. Furthermore, to expand our customer base, we have created retail banking products intended to appeal to a wide demographic of potential customers, such as our Synergy Cobalt Club, which provides retail banking services targeted to young professionals and our Pineapple Gold Club, which provides retail banking services targeted to people ages 50 and over. Finally, our treasury management services, which include Automated Clearing House (“ACH”) and lockbox product suites, also help to broaden our deposit base through their appeal to small business and commercial deposit customers.
Attract and Retain High Quality Employees
We employ many experienced loan officers with deep local market knowledge and long-term existing relationships. We have been successful in hiring talented employees due to our service-oriented culture and efficient decision making processes. On average, loan officers have 18 years of lending experience. Additionally, we are able to attract and retain talented officers through our incentive compensation plan, which rewards officers with stock options, restricted stock units and cash. All of our officers are shareholders through direct stock
9
Table of Contents
Index to Financial Statements
ownership, restricted stock and stock options. We believe that by compensating our officers in the form of equity, we align the interests of our team with those of our shareholders, and incentivize them to maximize shareholder value. Lastly, we invest continuously in our employee base. For example, we created a leadership program, “Leadership Franklin Synergy Bank,” where we train our employees not only to be better bankers, but also to be leaders in our communities.
Our Competitive Strengths
We believe that we have a unique operating culture that differentiates us from our competitors and enables us to organically grow our business and enhance shareholder value. This unique operating culture includes:
| • | a commitment to provide superior and personal service to our customers, both through our employees and via our continued investment in cutting edge technologies in areas of deposit taking, loan origination and risk management; |
| • | a focus on building long-term relationships with our customers; and |
| • | community leadership, as we look to engage with local civic, professional and charitable organizations and exhort our employees to do so as well. |
Our culture forms the basis for our competitive strengths, which we believe allow us to leverage our market opportunity and grow our business profitability. In particular, we believe that the following strengths differentiate us from our competitors and provide a strong foundation from which to deliver growth and profitability, all while enhancing shareholder value:
Well Positioned in Attractive Markets
We believe that we are well positioned to grow our business profitably in the demographically attractive and growing markets within the Nashville metropolitan area in which we operate. We believe that our target market segments, small to medium size for profit businesses and the consumer base working or living in and near our geographical footprint, demand the convenience and personal service that a smaller, independent financial institution such as we can offer. Currently, there are few Tennessee-headquartered banks with assets over $1 billion—there is only one public Middle Tennessee-based bank trading on a major exchange. We believe the heavy out-of-state banking presence (out-of-state super-regional and national financial institutions control approximately 59% of local deposits in the Nashville metropolitan area) provides an opportunity for a strong local bank like us to add greater market share from customers who are looking for more personal banking services and a more customer-friendly experience. Through our efforts to expand our deposit base, we currently have the largest market share of deposits in Williamson County.
10
Table of Contents
Index to Financial Statements
As demonstrated below, our local markets compare favorably to higher profile markets in almost all measures.
| MSA | County | |||||||||||||||||||||||||||||||||||
| Top 5 MSAs by Population Growth | ||||||||||||||||||||||||||||||||||||
| USA | Austin | Provo | Houston | Dallas | San Antonio | Nashville | Williamson | Rutherford | ||||||||||||||||||||||||||||
| Estimated Population Growth |
3.5% | 11.4% | 8.7% | 8.7% | 8.6% | 8.5% | 6.2% | 8.6% | 7.5% | |||||||||||||||||||||||||||
| Median Household Income |
$ | 51,579 | $ | 58,706 | $ | 58,735 | $ | 56,545 | $ | 56,739 | $ | 50,754 | $ | 50,439 | $ | 86,706 | $ | 57,220 | ||||||||||||||||||
| Unemployment |
5.8% | 4.3% | 4.6% | 4.5% | 4.6% | 4.3% | 5.1% | 4.6% | 4.9% | |||||||||||||||||||||||||||
| Home Price Y-O-Y |
5.8 | 6.6 | 7.3 | 8.8 | 5.9 | 5.5 | 5.2 | 7.6 | 6.2 | |||||||||||||||||||||||||||
| Housing Vacancy |
11.4 | 7.2 | 5.1 | 9.6 | 7.9 | 8.4 | 7.7 | 4.9 | 6.2 | |||||||||||||||||||||||||||
| % of Households w/ Income > 200k |
4.5 | 5.6 | 3.3 | 6.1 | 5.4 | 3.7 | 3.9 | 11.9 | 2.9 | |||||||||||||||||||||||||||
Note: Housing Vacancy Rate is calculated as Vacant Housing Units/Total Housing Units.
Source: SNL Financial and Moody’s Economy.
Experienced Management Team
We have an experienced management team with a history of working together in our target markets and a track record of delivering growth and shareholder value. Many members of our executive leadership team have been with us since inception and many have worked together at previous banks, including both large financial institutions and community banks. Our Chief Executive Officer, President, Chief Mortgage Officer, Chief Financial Officer, Chief Investment Officer and Chief Credit Officer have worked in our local market for an average of twenty-three years and experienced a variety of economic cycles. This deep local experience has given us the ability to understand and react to market changes and maintain strong profitability and growth without sacrificing asset quality. The MidSouth acquisition has bolstered our team, as several key managers have extensive experience working together in the Rutherford County market with MidSouth and other area banks.
Our management team has a proven track record of delivering shareholder value. Richard Herrington co-founded Franklin Financial Corporation (Franklin National Bank) in 1988, where he and his management team grew assets by a CAGR of 27.5% from 1995 – 2002 and positioned the bank to eventually be sold to Fifth Third, which was announced in 2002 and closed in 2004, for 5.4 times tangible book value. According to SNL Financial, this multiple represents the 9th highest price to book multiple for all bank transactions announced in the past 20 years where deal value was in excess of $50 million. He then served as Chief Executive Officer at Cumberland Bancorp (later renamed Civitas BankGroup, Inc.), where he and his team restructured the bank and significantly bolstered profitability, growing net income by a CAGR of 82% from 2003 – 2006, before selling the bank to Greene County Bancshares in 2007 for 3.0 times tangible book value.
The members of our Board of Directors have diverse industry experiences and have deep and long-term ties to the local community. We believe that we have an ideal blend of directors that have been with our management team at previous banks as well as directors that have joined our Board in recent years.
Local Real Estate Lending Expertise
We are real estate bankers that have focused on Middle Tennessee collateral since 1989. Our in-depth knowledge of the commercial customers, real estate development and credit in Williamson and Rutherford Counties gives us a competitive advantage in loan production, deposit attraction and ancillary revenue generation as we grow market share. Even when the local loan market gets competitive, we do not compromise on pricing and structuring of loan facilities, as our bankers are able to provide customized solutions delivered with a relatively quick turnaround time, as a result of the fact that our underwriting and banking operations occur locally.
With our firm principles of lending on Middle Tennessee collateral, our local real estate expertise and our localized delivery apparatus, we are poised to capture greater market share in the demographically-attractive and growing Williamson and Rutherford Counties.
11
Table of Contents
Index to Financial Statements
Successful Balance of Growth and Profitability
We understand the importance of successfully balancing growth and profitability with asset quality to enhance shareholder value. The following highlights the key aspects of our approach to maintaining this balance:
| • | Consistent, Strong and Disciplined Growth. Our approach balances both disciplined growth and profitability. Our community-focused business model has resulted in loan growth with a CAGR of 28% from December 31, 2009 to June 30, 2014. We have multiple lending opportunities to continue this trajectory and the MidSouth acquisition has provided us an immediate presence in the attractive Rutherford County market. Our lending momentum has continued, as loans have grown by 7% from July 1, 2014 to September 30, 2014. Additionally, we have increased focus on small business lending and grown our C&I loans, which represent approximately 10% of our portfolio at September 30, 2014, by a CAGR of 37% since 2009. We have grown our deposit market share in Williamson County and are now the top local institution with a market share of 13%. Our growth has resulted in improved profitability, as reflected by return on average assets increasing from negative in 2009 to 0.67% for the third quarter of 2014. |
| • | Disciplined Credit Risk Management. Our robust approach to risk management has enabled growth of our loan portfolio without compromising credit. Our credit risk management strategy is based on prudent underwriting criteria and local knowledge. Our lending decisions are centralized and committee-focused, with committees meeting multiple times per week. We are collateral lenders, with strong focus on secondary sources of repayment, especially collateral based in Williamson and Rutherford Counties. As a result of the implementation of our risk management strategy, less than 2% of our current total loans are unsecured. As the following charts demonstrate, our conservative credit culture has resulted in strong credit metrics as we have grown our business. |
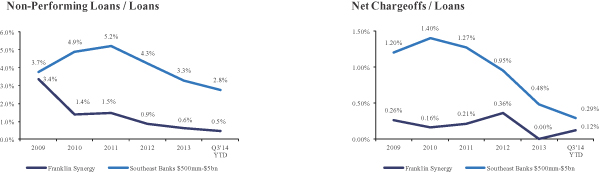
Source: SNL Financial. Southeast Banks with assets between $500mm-$5bn. Based on regulatory financials.
We believe that by maintaining our consistent origination and underwriting strategy, we will be able to maintain our consistent growth across shifting market environments.
12
Table of Contents
Index to Financial Statements
Risks Related to Our Company
There are a number of risks that you should consider before investing in our common stock. These risks are discussed more fully in the section titled “RISK FACTORS,” beginning on page 23.
Our Corporate Information
Our principal executive office is located at 722 Columbia Avenue, Franklin, Tennessee 37064-2828, and our telephone number is (615) 236-2265. Our website is www.franklinsynergybank.com. The information contained on or accessible from our website does not constitute a part of this prospectus and is not incorporated by reference herein.
13
Table of Contents
Index to Financial Statements
The Offering
| Common stock offered by us |
shares. |
| Option to purchase additional shares of common stock |
shares. |
| Common stock to be outstanding after this offering |
shares ( shares if the underwriters exercise in full their option to purchase additional shares). |
| Use of proceeds |
Assuming an initial public offering price of $ per share, which is the midpoint of the offering price range set forth on the cover page of this prospectus, we estimate that the net proceeds to us from the sale of our common stock in this offering will be $ million (or $ million if the underwriters exercise in full their option to purchase additional shares), after deducting estimated underwriting discounts and offering expenses. |
| We intend to: |
| • | initially retain the net proceeds from this offering at our holding company and to use such proceeds to support our continued growth, including organic growth and potential future acquisitions and for general corporate purposes; and |
| • | use a portion of the net proceeds of this offering to redeem the outstanding shares of Senior Non-Cumulative Perpetual Preferred Stock, Series A, liquidation preference of $1,000 per share (“Series A Preferred Stock”) issued to the U.S. Treasury pursuant to our participation in the Small Business Lending Fund (“SBLF”) program, prior to March 2016, which is when the dividend rate on such Series A Preferred Stock increases to 9.0%. |
| See “USE OF PROCEEDS.” |
| Dividends |
We have not historically declared or paid cash dividends on our common stock and we do not expect to pay cash dividends on our common stock in the foreseeable future. Instead, we anticipate that all of our future earnings will be retained to support our operations and finance the growth and development of our business. Any future determination to pay dividends on our common stock will be made by our board of directors and will depend upon our results of operations, financial condition, capital requirements, regulatory and contractual restrictions, our business strategy and other factors that our board of directors deems relevant. See “DIVIDEND POLICY.” |
| Rank |
Our common stock is subordinate to our Series A Preferred Stock (which we plan to redeem with a portion of the net proceeds of this offering) with respect to the payment of dividends and the distribution of assets upon liquidation. |
14
Table of Contents
Index to Financial Statements
| Listing |
We have applied to list our common stock on the under the symbol “ .” |
| Risk factors |
Investing in our common stock involves risks. See “RISK FACTORS,” beginning on page 23, for a discussion of certain factors that you should carefully consider before making an investment decision. |
References in this section to the number of shares of our common stock outstanding after this offering are based on shares of our common stock issued and outstanding as of , 2015. Unless otherwise noted, these references exclude:
| • | shares of our common stock reserved for issuance upon conversion of our Series A Preferred Stock. See “DESCRIPTION OF CAPITAL STOCK—Preferred Stock”; |
| • | shares of our common stock reserved for issuance upon exercise of the 2010 Warrants, which were issued to subscribers in connection with stock offerings in 2007 and 2010. See “DESCRIPTION OF CAPITAL STOCK—2010 Warrants”; and |
| • | shares of our common stock reserved for issuance under the 2007 Omnibus Equity Incentive Plan. |
Unless otherwise indicated, the information contained in this prospectus is as of the date set forth on the cover page of this prospectus, assumes that the underwriters’ option to purchase additional shares is not exercised and assumes that the common stock to be sold in this offering is sold at $ per share, which is the midpoint of the price range set forth on the cover page of this prospectus.
15
Table of Contents
Index to Financial Statements
Summary Consolidated Financial Data—Franklin Financial Network, Inc.
| (Amounts in thousands, except |
As of or for the Nine Months Ended September 30, |
As of or for the Year Ended December 31, | ||||||||||||||||||||||||||
| 2014 | 2013 | 2013 | 2012 | 2011 | 2010 | 2009 | ||||||||||||||||||||||
| Income Statement Data: |
||||||||||||||||||||||||||||
| Interest Income |
$ | 29,690 | $ | 17,551 | $ | 24,982 | $ | 20,004 | $ | 16,092 | $ | 13,008 | $ | 10,978 | ||||||||||||||
| Interest Expense |
4,120 | 2,894 | 3,937 | 4,048 | 3,956 | 4,089 | 3,774 | |||||||||||||||||||||
| Net Interest Income |
25,570 | 14,657 | 21,045 | 15,956 | 12,136 | 8,919 | 7,204 | |||||||||||||||||||||
| Provision for Loan Losses |
1,489 | 457 | 907 | 1,548 | 680 | 1,268 | 1,407 | |||||||||||||||||||||
| Noninterest Income |
7,125 | 5,182 | 6,819 | 8,645 | 4,460 | 5,428 | 3,783 | |||||||||||||||||||||
| Noninterest Expense |
21,959 | 14,279 | 19,662 | 16,857 | 13,651 | 12,105 | 10,196 | |||||||||||||||||||||
| Net Income before Taxes |
9,247 | 5,103 | 7,295 | 6,196 | 2,265 | 973 | (616 | ) | ||||||||||||||||||||
| Provision for Taxes |
3,668 | 1,945 | 2,734 | 2,056 | 111 | — | — | |||||||||||||||||||||
| Net Income |
5,579 | 3,158 | 4,561 | 4,140 | 2,154 | 973 | (616 | ) | ||||||||||||||||||||
| Profitability (%) |
||||||||||||||||||||||||||||
| Return on Average Assets |
0.77 | % | 0.69 | % | 0.72 | % | 0.80 | % | 0.58 | % | 0.33 | % | — | |||||||||||||||
| Return on Average Equity |
8.8 | 8.2 | 8.2 | 8.4 | 5.6 | 3.3 | — | |||||||||||||||||||||
| Return on Average Tangible Common Equity1 |
10.3 | 10.2 | 10.1 | 10.5 | 6.1 | 3.4 | — | |||||||||||||||||||||
| Efficiency Ratio |
67.2 | 72.0 | 70.6 | 68.5 | 82.3 | 84.4 | 92.8 | |||||||||||||||||||||
| Net Interest Margin |
3.64 | 3.30 | 3.41 | 3.17 | 3.36 | 3.11 | 3.17 | |||||||||||||||||||||
| Balance Sheet Data: |
||||||||||||||||||||||||||||
| Loans (including HFS) |
$ | 744,927 | $ | 387,428 | $ | 431,998 | $ | 314,838 | $ | 235,200 | $ | 197,648 | $ | 167,620 | ||||||||||||||
| Loan Loss Reserve |
5,883 | 4,432 | 4,900 | 3,983 | 3,413 | 3,177 | 2,189 | |||||||||||||||||||||
| Cash |
36,657 | 16,390 | 18,217 | 24,977 | 23,286 | 16,363 | 9,765 | |||||||||||||||||||||
| Securities2 |
408,392 | 240,147 | 328,122 | 222,191 | 197,026 | 127,957 | 87,239 | |||||||||||||||||||||
| Total Intangible Assets |
12,075 | 258 | 252 | 199 | 157 | 157 | 157 | |||||||||||||||||||||
| Assets |
1,238,579 | 659,905 | 796,374 | 577,762 | 465,123 | 349,877 | 271,720 | |||||||||||||||||||||
| Deposits |
1,051,558 | 523,674 | 681,300 | 514,643 | 405,606 | 306,008 | 226,577 | |||||||||||||||||||||
| Liabilities |
1,122,125 | 595,772 | 731,211 | 526,406 | 417,744 | 316,348 | 242,511 | |||||||||||||||||||||
| Common Equity |
106,454 | 54,133 | 55,163 | 41,356 | 37,379 | 33,529 | 29,209 | |||||||||||||||||||||
| Total Equity |
116,454 | 64,133 | 65,163 | 51,356 | 47,378 | 33,529 | 29,209 | |||||||||||||||||||||
| Asset Quality (%) |
||||||||||||||||||||||||||||
| Nonperforming Loans / Total Loans |
0.45 | % | 0.68 | % | 0.60 | % | 0.85 | % | 1.46 | % | 1.39 | % | 3.37 | % | ||||||||||||||
| Loan Loss Reserve / Loans (excluding HFS) |
0.82 | 1.17 | 1.16 | 1.33 | 1.49 | 1.65 | 1.36 | |||||||||||||||||||||
| Net Charge-offs (Recoveries) / Average Loans |
0.12 | 0.00 | (0.00 | ) | 0.36 | 0.21 | 0.16 | 0.26 | ||||||||||||||||||||
| Capital (%) |
||||||||||||||||||||||||||||
| Tangible Common Equity1 to Tangible Assets |
7.7 | % | 8.2 | % | 6.9 | % | 7.1 | % | 8.0 | % | 9.5 | % | 10.7 | % | ||||||||||||||
| Leverage Ratio3 |
8.8 | 10.3 | 9.8 | 9.3 | 10.8 | 10.1 | 11.0 | |||||||||||||||||||||
| Tier 1 Common Ratio3 |
11.2 | 12.6 | 11.8 | N/A | N/A | N/A | N/A | |||||||||||||||||||||
| Tier 1 Ratio3 |
12.4 | 14.9 | 13.8 | 14.3 | 16.3 | 15.3 | 15.2 | |||||||||||||||||||||
| Risk-based Capital Ratio3 |
13.1 | 15.9 | 14.8 | 15.5 | 17.6 | 16.6 | 16.5 | |||||||||||||||||||||
| 1 | “Tangible common equity” is defined as total shareholders’ equity at end of period less: (1) the liquidation preference value of the preferred stock; and (2) goodwill and other intangible assets. “Other intangible assets” is defined as the sum of core deposit intangible and Small Business Administration loan servicing rights. |
| 2 | “Securities” line item includes restricted equity securities. |
| 3 | Capital ratios prior to 2013 reflect capital ratios for Franklin Synergy Bank only. Holding company capital ratios are not available for periods prior to 2013 since consolidated regulatory reports were not required during those periods. |
16
Table of Contents
Index to Financial Statements
UNAUDITED PRO FORMA COMBINED CONDENSED FINANCIAL INFORMATION
The following unaudited pro forma combined condensed statements of income for the nine months ended September 30, 2014 and year ended December 31, 2013, are presented as if the acquisition of MidSouth had occurred on January 1, 2013. The historical consolidated financial information has been adjusted to reflect factually supportable items that are directly attributable to the acquisition and, expected to have a continuing impact on consolidated results of operations. Because the acquisition was completed on July 1, 2014, MidSouth’s results of operations for the first six months of 2014 are used for purposes of computing pro forma amounts for the nine months ended September 30, 2014.
The preparation of the unaudited pro forma combined condensed income statements and related adjustments required management to make certain assumptions and estimates. The assumptions underlying the pro forma adjustments are described in the accompanying notes, which should be read in conjunction with this unaudited pro forma combined condensed financial information. In the opinion of management, all adjustments and/or disclosures necessary for a fair statement of the pro forma data have been made. The unaudited pro forma combined condensed financial information is presented for illustrative purposes only and does not necessarily reflect what our results of operations and financial condition would have been if we had operated as a stand-alone company during all periods presented, and, accordingly, such information should not be relied upon as an indicator of our future performance. The unaudited pro forma combined condensed financial information also does not consider any potential impact of current market conditions on revenues, potential revenue enhancements, anticipated cost savings and expense efficiencies, among other factors.
These unaudited pro forma combined condensed financial information and the notes thereto should be read together with the following:
| • | the accompanying notes to the unaudited pro forma combined condensed financial information; |
| • | FFN’s unaudited consolidated financial statements and accompanying notes as of and for the nine months ended September 30, 2014 and audited consolidated financial statements and accompanying notes as of and for the year ended December 31, 2013, included elsewhere in this prospectus; |
| • | MidSouth’s unaudited financial statements and accompanying notes as of and for the six months ended June 30, 2014 and audited consolidated financial statements and accompanying notes as of and for the year ended December 31, 2013, included elsewhere in this prospectus; |
| • | the section entitled “MANAGEMENT’S DISCUSSION AND ANALYSIS OF FINANCIAL CONDITION AND RESULTS OF OPERATIONS,” included elsewhere in this prospectus. |
17
Table of Contents
Index to Financial Statements
Unaudited Pro Forma Combined Condensed Statement of Income
For the Nine Months Ended September 30, 2014
(in thousands, except per share data)
| FFN as Reported |
MidSouth as Reported for the six months ended June 30, 2014 |
MidSouth Account Reclassification |
Pro Forma Adjustments |
Pro Forma Combined |
||||||||||||||||
| Interest income: |
||||||||||||||||||||
| Loans, including fees |
$ | 22,466 | $ | 4,538 | $ | — | $ | (514 | )(b) | $ | 26,490 | |||||||||
| Investment securities |
6,992 | 840 | — | — | 7,832 | |||||||||||||||
| Federal funds sold and other |
232 | 39 | — | — | 271 | |||||||||||||||
|
|
|
|
|
|
|
|
|
|
|
|||||||||||
| Total interest income |
29,690 | 5,417 | — | (514 | ) | 34,593 | ||||||||||||||
| Interest expense: |
||||||||||||||||||||
| Deposits |
3,808 | 397 | — | 59 | (d) | 4,264 | ||||||||||||||
| FHLB advances and other borrowings |
312 | 4 | — | — | 316 | |||||||||||||||
|
|
|
|
|
|
|
|
|
|
|
|||||||||||
| Total interest expense |
4,120 | 401 | — | 59 | 4,580 | |||||||||||||||
| Net interest income |
25,570 | 5,016 | — | (573 | ) | 30,013 | ||||||||||||||
| Provision for loan losses |
1,489 | 350 | — | — | 1,839 | |||||||||||||||
|
|
|
|
|
|
|
|
|
|
|
|||||||||||
| Net interest income after loan loss provision |
24,081 | 4,666 | — | (573 | ) | 28,174 | ||||||||||||||
| Non-interest income: |
||||||||||||||||||||
| Service charges on deposit accounts and other fees |
1,186 | 547 | — | — | 1,733 | |||||||||||||||
| Net gain on sale of loans |
4,226 | 1,012 | 227 | (g) | — | 5,465 | ||||||||||||||
| Gain on sale of investment securities, net |
93 | 115 | — | — | 208 | |||||||||||||||
| Other |
1,620 | 398 | — | — | 2,018 | |||||||||||||||
|
|
|
|
|
|
|
|
|
|
|
|||||||||||
| Total non-interest income |
7,125 | 2,072 | 227 | 9,424 | ||||||||||||||||
| Non-interest expense: |
||||||||||||||||||||
| Salaries and employee benefits |
13,494 | 3,616 | — | 114 | (e) | 17,224 | ||||||||||||||
| Occupancy and equipment |
3,238 | 617 | — | (56 | )(c) | 3,799 | ||||||||||||||
| All other expenses |
5,227 | 3,272 | 227 | (g) | (1,830 | )(a) | 6,896 | |||||||||||||
|
|
|
|
|
|
|
|
|
|
|
|||||||||||
| Total non-interest expense |
21,959 | 7,505 | 227 | (1,772 | ) | 27,919 | ||||||||||||||
|
|
|
|
|
|
|
|
|
|
|
|||||||||||
| Income (loss) before income tax expense |
9,247 | (767 | ) | — | 1,199 | 9,679 | ||||||||||||||
| Income tax expense |
3,668 | — | — | 165 | (f) | 3,833 | ||||||||||||||
|
|
|
|
|
|
|
|
|
|
|
|||||||||||
| Net income (loss) |
5,579 | (767 | ) | — | 1,034 | 5,846 | ||||||||||||||
| Dividends paid on Series A preferred stock |
(75 | ) | — | — | — | (75 | ) | |||||||||||||
|
|
|
|
|
|
|
|
|
|
|
|||||||||||
| Net income available (loss allocated) to common shareholders |
5,504 | (767 | ) | — | 1,034 | 5,771 | ||||||||||||||
|
|
|
|
|
|
|
|
|
|
|
|||||||||||
| Basic earnings (loss) available to common shareholders per share |
$ | 0.94 | $ | (0.20 | ) | $ | 0.75 | |||||||||||||
| Diluted earnings (loss) available to common shareholders per share |
$ | 0.91 | $ | (0.11 | ) | $ | 0.73 | |||||||||||||
| Weighted average common shares outstanding, including participating securities: |
||||||||||||||||||||
| Basic |
5,841 | 3,899 | 7,709 | |||||||||||||||||
| Diluted |
6,016 | 6,680 | 7,916 | |||||||||||||||||
See accompanying notes to Unaudited Pro Forma Combined Condensed Financial Information
18
Table of Contents
Index to Financial Statements
Unaudited Pro Forma Combined Condensed Statement of Income
For the Year Ended December 31, 2013
(in thousands, except per share data)
| FFN as Reported |
MidSouth as Reported |
MidSouth Account Reclassification |
Pro Forma Adjustments |
Pro Forma Combined |
||||||||||||||||
| Interest income: |
||||||||||||||||||||
| Loans, including fees |
$ | 20,094 | $ | 8,296 | $ | — | $ | 1,451 | (b) | $ | 29,841 | |||||||||
| Investment securities |
4,722 | 1,388 | — | — | 6,110 | |||||||||||||||
| Federal funds sold and other |
166 | 145 | — | — | 311 | |||||||||||||||
|
|
|
|
|
|
|
|
|
|
|
|||||||||||
| Total interest income |
24,982 | 9,829 | — | 1,451 | 36,262 | |||||||||||||||
| Interest expense: |
— | — | ||||||||||||||||||
| Deposits |
3,693 | 914 | — | (172 | )(d) | 4,435 | ||||||||||||||
| FHLB advances and other borrowings |
244 | 2 | — | — | 246 | |||||||||||||||
|
|
|
|
|
|
|
|
|
|
|
|||||||||||
| Total interest expense |
3,937 | 916 | — | (172 | ) | 4,681 | ||||||||||||||
| Net interest income |
21,045 | 8,913 | — | 1,623 | 31,581 | |||||||||||||||
| Provision for loan losses |
907 | — | — | — | 907 | |||||||||||||||
|
|
|
|
|
|
|
|
|
|
|
|||||||||||
| Net interest income after loan loss provision |
20,138 | 8,913 | — | 1,623 | 30,674 | |||||||||||||||
| Non-interest income: |
||||||||||||||||||||
| Service charges on deposit accounts and other fees |
1,164 | 1,072 | — | — | 2,236 | |||||||||||||||
| Net gain on sale of loans |
4,403 | 1,413 | 408 | (g) | — | 6,224 | ||||||||||||||
| Gain on sale of investment securities, net |
88 | 2 | — | — | 90 | |||||||||||||||
| Other |
1,164 | 664 | — | — | 1,828 | |||||||||||||||
|
|
|
|
|
|
|
|
|
|
|
|||||||||||
| Total non-interest income |
6,819 | 3,151 | 408 | — | 10,378 | |||||||||||||||
| Non-interest expense: |
||||||||||||||||||||
| Salaries and employee benefits |
13,142 | 5,985 | — | 204 | (e) | 19,331 | ||||||||||||||
| Occupancy and equipment |
2,731 | 1,117 | — | (112 | )(c) | 3,736 | ||||||||||||||
| All other expenses |
3,789 | 3,458 | 408 | (g) | 269 | (a) | 7,924 | |||||||||||||
|
|
|
|
|
|
|
|
|
|
|
|||||||||||
| Total non-interest expense |
19,662 | 10,560 | 408 | 361 | 30,991 | |||||||||||||||
|
|
|
|
|
|
|
|
|
|
|
|||||||||||
| Income before income tax expense |
7,295 | 1,504 | — | 1,262 | 10,061 | |||||||||||||||
| Income tax expense |
2,734 | — | — | 1,059 | (f) | 3,793 | ||||||||||||||
|
|
|
|
|
|
|
|
|
|
|
|||||||||||
| Net income |
4,561 | 1,504 | 203 | 6,268 | ||||||||||||||||
| Dividends paid on Series A preferred stock |
(109 | ) | — | — | — | (109 | ) | |||||||||||||
|
|
|
|
|
|
|
|
|
|
|
|||||||||||
| Net income available to common shareholders |
$ | 4,452 | $ | 1,504 | $ | — | $ | 203 | $ | 6,159 | ||||||||||
|
|
|
|
|
|
|
|
|
|
|
|||||||||||
| Basic earnings available to common shareholders per share |
$ | 1.13 | $ | 0.39 | $ | 0.92 | ||||||||||||||
| Diluted earnings available to common shareholders per share |
$ | 1.10 | $ | 0.23 | $ | 0.89 | ||||||||||||||
| Weighted average common shares outstanding, including participating securities: |
||||||||||||||||||||
| Basic |
3,934 | 3,866 | 6,699 | |||||||||||||||||
| Diluted |
4,038 | 6,493 | 6,886 | |||||||||||||||||
See accompanying notes to Unaudited Pro Forma Combined Condensed Financial Information
19
Table of Contents
Index to Financial Statements
NOTES TO UNAUDITED PRO FORMA COMBINED CONDENSED FINANCIAL INFORMATION
(all amounts are in thousands, except per share data, unless otherwise indicated)
Note 1—Basis of Pro Forma Presentation
The unaudited pro forma combined condensed statement of income for the nine months ended September 30, 2014 and year ended December 31, 2013, are based on the historical financial statements of FFN and MidSouth after giving effect to the completion of the acquisition and the assumptions and adjustments described in the accompanying notes. Such financial statements do not reflect cost savings or operating synergies expected to result from the acquisition, or the costs to achieve these cost savings or operating synergies, or any anticipated disposition of assets that may result from the integration of the operations of the two companies. Certain historical financial information has been reclassified to conform to the current presentation.
The unaudited pro forma combined condensed financial information is presented solely for illustrative purposes and is not necessarily indicative of the combined results of income that might have been achieved for the periods or dates indicated, nor is it necessarily indicative of the future results of the combined company.
Note 2—Unaudited Pro Forma Accounting Adjustments
The following unaudited pro forma adjustments result from accounting for the acquisition, including the determination of fair value of the assets, liabilities, and commitments which FFN, as the acquirer, acquired from MidSouth. The descriptions related to the effect of these adjustments on the income statement are as follows.
Income Statements—the explanations and descriptions below are referenced to the Unaudited Pro Forma Combined Condensed Statements of Income for the nine months ended September 30, 2014 and year ended December 31, 2013.
Income Statements—Pro Forma Adjustments
| Pro Forma Adjusting entries (Income Statements) |
Nine Months Ended Sept 30, 2014 |
Year Ended Dec 31, 2013 |
||||||
| a Amortization expense of core deposit intangible |
$ | 282 | $ | 700 | ||||
| a Acquisition related transaction costs |
(2,112 | ) | (431 | ) | ||||
| b Adjustment for estimate of loan interest accretion |
(514 | ) | 1,451 | |||||
| c Adjustment for estimate of land improvements fair value adjustment amortization |
(56 | ) | (112 | ) | ||||
| d Adjustment for estimate of time deposits fair value adjustment amortization |
59 | (172 | ) | |||||
| e Amortization of retention bonuses |
114 | 204 | ||||||
| f Income tax expense of pro-forma adjustments |
165 | 1,059 | ||||||
| a | The core deposit intangible (“CDI”) was approximately $3,059 and will be amortized over a ten year period on an accelerated basis which is expected to increase amortization expense by approximately $282 and $700 of for the nine months ended September 30, 2014 and the year ended December 31, 2013, respectively. |
| Adjustment | to decrease non-interest expense for non-recurring costs incurred and included in the nine months ended September 30, 2014 and the year ended December 31, 2013 financial results of the combined entity. These costs (approximately $2,112 and $431, respectively) are transaction costs directly related to the acquisition. |
| b | Represents an estimate of interest income accretion related to the fair value adjustment of the loans acquired pursuant to the acquisition. The amount will be accreted as an increase to interest income on a level yield method based on the maturities of the underlying loans, which is expected to approximate 36 months. |
20
Table of Contents
Index to Financial Statements
| Estimates for the amount of income accretion related to the loans fair value adjustment total a decrease of $514 for the nine months ended September 30, 2014 and increase of $1,451 for the year ended December 31, 2013. For the nine months ended September 30, 2014, the pro forma adjustment for the income accretion related to the loans fair value adjustment is a decreasing value due to the amount of accretion currently recognized in the historical financial results of FFN compared to the projected accretion as if the acquisition had occurred effective January 1, 2013. |
| c | The land improvements on properties held by MidSouth were adjusted to fair value at the acquisition date. The fair value adjustment of these buildings and leasehold improvements was approximately $2,811. This amount will be amortized as a decrease to depreciation expense on a straight-line basis over an estimated useful life of 25 years. |
| d | The time deposits acquired from MidSouth were adjusted to fair value at the acquisition date. The preliminary estimate of the fair value adjustment at acquisition date was approximately $173. This amount will be amortized as a decrease to interest expense on a pro rata basis based on the maturities of the underlying time deposits. Adjustments to amortization for the nine months ended September 30, 2014 total a decrease of $59 and increase of $172 for the year ended December 31, 2013. |
| e | FFN provided retention bonuses of $1,025 to certain executive and non–executive officers of Mid-South. These bonuses are to be paid in 20% cash and 80% stock compensation (common stock and stock options), which vest over a period of 3 to 5 years. |
| f | Adjustment to reflect the income tax expense of the Pro Forma Combined entity using 38.29% as the incremental effective tax rate. Income tax expense reported for MidSouth was zero for the period presented in the Unaudited Pro Forma Combined Condensed Financial Statements as a result of the full valuation allowance related to net deferred tax assets. Therefore, the Pro Forma Adjustment for income tax expense considers the pretax net income (loss) of MidSouth and all other income statement Pro Forma Adjustments for the period. |
Income Statements—reclassifications
The following reclassifications adjusted MidSouth’s historical income statements to conform to FFN’s historical income statements.
| g | Mortgage origination expenses netted against fees on mortgage originations in MidSouth’s non-interest income have been reclassified to all other expenses to conform to FFN’s historical income statement. |
Other Transaction Costs, Not Included in Pro forma Statement on Income- Forward Looking Information
In addition to the $2,543 in transaction cost incurred, management is looking into opportunities for cost savings and synergies, but nothing has been finalized related to those plans. In addition, there are no specific plans to close any branches, or dispose of assets in general. Retention bonuses to non-executive officers and other employees in the amount of $53 were paid in Year 1. These bonuses are not reflected in the Pro forma Income statement adjustments, since they are a non–recurring expense.
Note 3—Earnings per Common Share
Unaudited pro forma earnings per common share for the nine months ended September 30, 2014 and year ended December 31, 2013 have been calculated using FFN’s historic weighted average common shares outstanding plus the common shares assumed to be issued to MidSouth shareholders in the acquisition.
Under the terms of the Merger Agreement, MidSouth shareholders were entitled to receive 0.425926 shares of FFN common stock for each common share of MidSouth and 0.851852 shares of FFN common stock for each share of MidSouth preferred stock. Each warrant to purchase shares of MidSouth common stock was
21
Table of Contents
Index to Financial Statements
converted into that number of shares of FFN common stock equal to (i) $5.75 less the strike price of the warrant at the effective date of the acquisition (ii) divided by $13.50. Cash was paid only to the extent of fractional shares resulting from the exchange rate provided in the merger agreement and any MidSouth shareholders that properly dissent from the acquisition. No significant cash was paid to MidSouth shareholders as a result of the acquisition.
Each option to purchase a share of MidSouth common stock was converted into an option to purchase a share of FFN common stock multiplied by the exchange ratio of one share of MidSouth common stock equating to 0.425926 shares of FFN common stock (the “Exchange Ratio”) and the exercise price became the exercise price of such option divided by the Exchange Ratio.
The following table sets forth the calculation of basic and diluted unaudited pro forma earnings per common share for the nine months ended September 30, 2014 and year ended December 31, 2013.
| Nine Months Ended Sept 30, 2014 |
Year Ended Dec 31, 2013 |
|||||||||||||||
| Basic | Diluted | Basic | Diluted | |||||||||||||
| Pro forma net income available to common shareholders |
$ | 5,771 | $ | 5,771 | $ | 6,159 | $ | 6,159 | ||||||||
| Weighted average common shares outstanding, including participating securities: |
||||||||||||||||
| FFN |
5,841 | 6,016 | 3,934 | 4,038 | ||||||||||||
| Common shares issued to MidSouth shareholders |
1,868 | 1,868 | 2,765 | 2,765 | ||||||||||||
| Dilutive effect of MidSouth stock option conversion(1) |
— | 32 | — | 83 | ||||||||||||
|
|
|
|
|
|
|
|
|
|||||||||
| Pro forma |
7,709 | 7,916 | 6,699 | 6,886 | ||||||||||||
|
|
|
|
|
|
|
|
|
|||||||||
| Pro forma net income per common share |
$ | 0.75 | $ | 0.73 | $ | 0.92 | $ | 0.89 | ||||||||
|
|
|
|
|
|
|
|
|
|||||||||
| (1) | MidSouth employee stock options converted to FFN stock options upon the closing of the acquisition using the exchange ratio of 0.425926. |
22
Table of Contents
Index to Financial Statements
An investment in our common stock involves a number of risks. Before making a decision to purchase our common stock, you should carefully consider the following risks, as well as the other information contained in this prospectus. The risks described below are those that we believe are the material risks we face. If any of the following risks occur, our business, financial condition and results of operations could be materially adversely affected. As a result, the trading price of our common stock could decline and you could lose part or all of your investment.
Risks Related to Our Business
We May Not Be Able to Implement Our Growth Strategy Effectively
Our business has grown quickly. Furthermore, our strategy focuses on organic growth, supplemented by opportunistic acquisitions. We may not be able to execute aspects of our growth strategy to sustain our historical rate of growth or may not be able to grow at all. More specifically, we may not be able to generate sufficient new loans and deposits within acceptable risk and expense tolerances, obtain the personnel or funding necessary for additional growth or find suitable acquisition candidates. Various factors, such as economic conditions and competition, may impede or prohibit the growth of our operations, the opening of new branches and the consummation of acquisitions.
Our Limited Operating History as an Integrated Company May Make it Difficult for Investors to Evaluate Our Business, Financial Condition and Results of Operations and Also Impairs Our Ability to Accurately Forecast Our Future Performance
Our limited operating history as an integrated company following our acquisition of MidSouth on July 1, 2014 may not provide an adequate basis for investors to evaluate our business, financial condition and results of operations. Our future operating results depend upon a number of factors, including our ability to manage our growth, retain our customer base and successfully identify and respond to emerging trends in our primary product lines and markets. It may also be difficult for us to evaluate trends that may affect our business and to determine whether our expansion may be profitable. Thus, any predictions about our future revenue and expenses may not be as accurate as they would be if we had a longer operating history or operated in a more predictable market.
Competition For Deposits and Loans Is Expected To Be Intense, and No Assurance Can Be Given That We Will Be Successful in Our Efforts to Compete with Other Financial Institutions
The commercial banking industry in Williamson County, Tennessee consists of 32 banks and two savings and loan institutions, with 101 total offices and total deposits of $5.8 billion as of June 30, 2014, which is the most recent date such information has been released by the Federal Deposit Insurance Corporation (“FDIC”). The commercial banking industry in Rutherford County, Tennessee consists of 20 banks and no savings and loan institutions, with 77 total offices and total deposits of $3.3 billion as of June 30, 2014, which is the most recent date such information has been released by the FDIC. Offices affiliated with out-of-state financial institutions have entered Tennessee in recent years to offer all financial services, including lending and deposit gathering activities. Also, changes to laws on interstate banking and branching now permit banks and bank holding companies headquartered outside Tennessee to move into Williamson County and Rutherford County more easily. In addition, there are credit unions, finance companies, securities brokerage firms, and other types of businesses offering financial services. Technological advances and the growth of e-commerce have made it possible for non-financial institutions to offer products and services that traditionally have been offered by banking institutions. Competition for deposit and loan opportunities in our market area is expected to be intense because of existing competitors and the geographic expansion into the market area by other institutions. See “SUPERVISION AND REGULATION.” No assurance can be given that we will be successful in our efforts to compete with other such institutions.
23
Table of Contents
Index to Financial Statements
We Have Incurred Substantial Expenses Related to Our Recent Acquisition
We have incurred substantial expenses in connection with completing our recent acquisition of MidSouth and integrating the operations of the acquired businesses of Midsouth with our operations. There are a number of factors beyond our control that could affect the total amount or the timing of our transaction and integration expenses and such expenses may exceed our initial projections. Many of the expenses that will be incurred, by their nature, are difficult to accurately estimate at the present time. As a result, the transaction and integration expenses associated with our recent acquisition of MidSouth could exceed the savings that we expect to achieve from the realization of economies of scale and cost savings related to the integration of the acquired business of MidSouth following the completion of our recent acquisition.
There Can Be No Assurance That the Bank Will Not Incur Excessive Loan Losses
An allowance for loan losses account is accumulated through monthly provisions against income. This account is a valuation allowance established for probable incurred credit losses inherent in the loan portfolio. Banks are susceptible to risks associated with their loan portfolios. The Bank’s loan customers may include a disproportionate number of individuals and entities seeking to establish a new banking relationship because they are dissatisfied with the amount or terms of credit offered by their current banks, or they may have demonstrated less than satisfactory performance in previous banking relationships. If the Bank lends to individuals who have demonstrated less than satisfactory performance in previous banking relationships, the Bank could experience disproportionate loan losses, which could have a significantly negative impact on the Bank’s earnings. Although management is aware of the potential risks associated with extending credit to customers with whom they have not had a prior lending relationship, there can be no assurance that the Bank will not incur excessive loan losses. Bank regulators may disagree with the Bank’s characterization of the collectability of loans and may require the Bank to downgrade credits and increase our provision for loan losses that would negatively impact results of operations and capital levels.
Changes in Interest Rates May Reduce the Bank’s Profitability
We incur interest rate risk. The Bank’s profitability is dependent, to a large extent, upon net interest income, which is the difference between its interest income on interest-earning assets, such as loans and investment securities and interest expense on interest-bearing liabilities, such as deposits and borrowings. The Bank will continue to be affected by changes in interest rates and other economic factors beyond its control, particularly to the extent that such factors affect the overall volume of our lending and deposit activities. The matching of assets and liabilities may be analyzed by examining the extent to which such assets and liabilities are “interest rate sensitive” and by monitoring an institution’s interest rate sensitivity “gap.” An asset or liability is said to be interest rate sensitive within a specific time period if it will mature or reprice within that time period. The interest rate sensitivity gap is defined as the difference between the amount of interest-earning assets maturing or repricing within a specific time period and the amount of interest-bearing liabilities maturing or repricing within that time period. A gap is considered positive when the amount of interest rate sensitive assets exceeds the amount of interest rate sensitive liabilities. A gap is considered negative when the amount of interest rate sensitive liabilities exceeds the amount of interest rate sensitive assets. During a period of rising interest rates, a negative gap would tend to adversely affect net interest income while a positive gap would tend to result in an increase in net interest income. During a period of falling interest rates, a negative gap would tend to result in an increase in net interest income while a positive gap would tend to adversely affect net interest income. Furthermore, an increase in interest rates may negatively affect the market value of securities in our investment portfolio. A reduction in the market value of our portfolio will increase the unrealized loss position of our available-for-sale investments. Any of these events could materially adversely affect our results of operations or financial condition.
If We Fail to Effectively Manage Credit Risk and Interest Rate Risk, Our Business and Financial Condition Will Suffer
We must effectively manage credit risk. There are risks inherent in making any loan, including risks with respect to the period of time over which the loan may be repaid, risks relating to proper loan underwriting
24
Table of Contents
Index to Financial Statements
and guidelines, risks resulting from changes in economic and industry conditions, risks inherent in dealing with individual borrowers and risks resulting from uncertainties as to the future value of collateral. There is no assurance that our credit risk monitoring and loan approval procedures are, or will be, adequate or will reduce the inherent risks associated with lending. Our credit administration personnel, policies and procedures may not adequately adapt to changes in economic or any other conditions affecting customers and the quality of our loan portfolio. Any failure to manage such credit risks may materially adversely affect our business and our consolidated results of operations and financial condition.
The Bank Depends on Its Ability to Attract Deposits
The acquisition of local deposits is a primary objective of the Bank. If customers move money out of bank deposits and into other investments, we would lose a relatively low-cost source of funds, increasing our funding costs and reducing our net interest income and net income. In addition to the traditional deposit accounts solicited in its community, the Bank also solicits local deposits through the Internet and will offer Internet-only deposit accounts to supplement traditional depository accounts. The Bank is a member of the Federal Home Loan Bank (the “FHLB”) for use as a general funding source and may use Internet funds and brokered deposits to balance funding needs. The ability of the Bank to accept brokered deposits is dependent on its ability to be “well capitalized.”
The Bank May Be Required to Rely on Secondary Sources of Liquidity to Meet Withdrawal Needs or Fund Operations, and There Can Be No Assurance That These Sources Will Be Sufficient to Meet Future Liquidity Demands
The primary source of the Bank’s funds is customer deposits and loan repayments. While scheduled loan repayments are a relatively stable source of funds, they are subject to the ability of borrowers to repay the loans. The ability of borrowers to repay loans can be adversely affected by a number of factors, including changes in general economic conditions, adverse trends or events affecting business industry groups, reductions in real estate values or markets, business closings or lay-offs, inclement weather, natural disasters and international instability. Additionally, deposit levels may be affected by a number of factors, including rates paid by competitors, general interest rate levels, returns available to customers on alternative investments and general economic conditions. Accordingly, the Bank may be required from time to time to rely on secondary sources of liquidity to meet withdrawal demands or otherwise fund operations. These sources include Internet funds, brokered certificates of deposit, borrowings from the Federal Reserve, FHLB advances, and federal funds lines of credit from correspondent banks. While management believes that these sources are currently adequate, there can be no assurance that they will be sufficient to meet future liquidity demands. The Bank may be required to slow or discontinue loan growth, capital expenditures or other investments or liquidate assets should these sources not be adequate.
Economic Challenges, Especially Those Affecting the Local Economy Where We Operate, Could Affect Our Financial Condition and Results of Operations
If the communities in which we operate do not grow or if prevailing local or national economic conditions are unfavorable, our business may not succeed. Adverse economic conditions to the extent they develop in our primary market area, which currently is limited to Williamson County and Rutherford County, Tennessee and the surrounding areas, could reduce our growth rate, affect the ability of our customers to repay their loans, and generally affect our financial condition and results of operations. Moreover, management cannot give any assurance that we will benefit from any market growth or favorable economic conditions in our primary market area if they do occur. Continued adverse market or economic conditions may increase the risk that the Bank’s borrowers will be unable to timely make their loan payments. Furthermore, even if the Bank’s borrowers continue to make timely loan payments, a deterioration in the real estate market could cause a decline in the appraised values of such mortgaged properties. In the event of such a deterioration, the Bank may be forced to write down the value of the loans, which could have a negative effect on the Bank’s capital ratios and earnings.
25
Table of Contents
Index to Financial Statements
The Bank’s loan portfolio is real-estate focused. While real estate lending is the expertise of our lending staff and management, risks associated with this type of lending are heavily influenced by the economic environment. In addition, the market value of the real estate securing loans as collateral could be adversely affected by unfavorable changes in market and economic conditions.
As of September 30, 2014, approximately 89.2% of the Bank’s total loans were real-estate secured. One-to-four family residential properties accounted for 28.1% of the Bank’s portfolio, owner-occupied commercial real estate was 10.6% and other commercial real estate was 20.8% of the total loan portfolio. Total construction and land development lending accounted for 29.8% of total loans with custom-built residential homes representing 4.9%, other residential construction lending totaling 19.8%, commercial construction lending totaling 2.5% and land development lending totaling 2.5%. Other real estate, including multi-family and farmland, accounted for less than 1% of the total loan portfolio. A sustained period of increased payment delinquencies, foreclosures, or losses caused by continuing adverse market or economic conditions in the state of Tennessee, or more specifically the Bank’s market area in Williamson County and Rutherford County in Middle Tennessee, could adversely affect the value of our assets, revenues, results of operations, and financial condition.
Our Financial Condition and Results of Operations Could be Affected if Long-Term Business Strategies Are Not Effectively Executed
Although the Bank’s primary focus in the near term will be organically growing its balance sheet, over the longer term, management may pursue a growth strategy for the Bank’s business through de novo branching. The Bank’s prospects must be considered in light of the risks, expenses, and difficulties occasionally encountered by financial services companies in growth stages, which may include the following:
| • | Operating Results: There is no assurance that existing offices or future offices will maintain or achieve deposit levels, loan balances, or other operating results necessary to avoid losses or produce profits. The Bank’s growth strategy necessarily entails growth in overhead expenses as it routinely adds new offices and staff. Historical results may not be indicative of future results or results that may be achieved as the Bank continues to increase the number and concentration of the Bank’s branch offices. |
| • | Development of Offices: There are considerable costs involved in opening branches, and new branches generally do not generate sufficient revenues to offset their costs until they have been in operation for at least a year or more. Accordingly, de novo branches may be expected to negatively impact earnings during this period of time until the branches reach certain economies of scale. |
| • | Regulatory and Economic Factors: Growth and expansion plans may be adversely affected by a number of regulatory and economic developments or other events. Failure to obtain required regulatory approvals, changes in laws and regulations, or other regulatory developments and changes in prevailing economic conditions or other unanticipated events may prevent or adversely affect continued growth and expansion. Failure to successfully address the issues identified above could have a material adverse effect on the Bank’s business, future prospects, financial condition, or results of operations, and could adversely affect the Bank’s ability to successfully implement its longer term business strategy. |
Our Financial Statements Reflect the Application of Purchase Accounting. Any Change in the Assumptions Used in Such Methodology Could Have a Material Adverse Effect on Our Results of Operations.
We have acquired a significant amount of our assets and assumed a significant amount of our liabilities in our acquisition of MidSouth and our combined financial results are influenced by the application of purchase accounting. Purchase accounting requires management to make assumptions regarding the assets purchased and
26
Table of Contents
Index to Financial Statements
liabilities assumed to determine their fair value at acquisition. If these assumptions are incorrect or our accountants or the regulatory agencies to whom we report do not concur with our judgments and require that we change or modify our assumptions, such change or modification could have a material adverse effect on our financial condition or results of operations or our previously reported results.
The Accuracy of Our Financial Statements and Related Disclosures Could be Affected if the Judgments, Assumptions or Estimates Used in Our Critical Accounting Policies are Inaccurate
The preparation of financial statements and related disclosure in conformity with accounting principles generally accepted in the United States requires us to make judgments, assumptions and estimates that affect the amounts reported in our consolidated financial statements and accompanying notes. Our critical accounting policies, which are included in the section entitled “MANAGEMENT’S DISCUSSION AND ANALYSIS OF FINANCIAL CONDITION AND RESULTS OF OPERATIONS” in this prospectus, describe those significant accounting policies and methods used in the preparation of our consolidated financial statements that we consider “critical” because they require judgments, assumptions and estimates that materially affect our consolidated financial statements and related disclosures. As a result, if future events differ significantly from the judgments, assumptions and estimates in our critical accounting policies, those events or assumptions could have a material impact on our consolidated financial statements and related disclosures.
Negative Public Opinion or Failure to Maintain Our Reputation in the Communities We Serve Could Adversely Affect Our Business and Prevent Us from Growing Our Business
As a community bank, our reputation within the communities we serve is critical to our success. We have set ourselves apart from our competitors by building strong personal and professional relationships with our customers and by being an active member of the communities we serve. As such, we strive to enhance our reputation by recruiting, hiring and retaining employees who share our core values of being an integral part of the communities we serve and delivering superior service to our customers. If our reputation is negatively affected by the actions of our employees or otherwise, we may be less successful in attracting new customers, and our business, financial condition, results of operations and prospects could be materially and adversely affected. Further, negative public opinion can expose us to litigation and regulatory action as we seek to implement our growth strategy, such as delays in regulatory approval based on unfounded complaints, which could impede the timeliness of regulatory approval for acquisitions we may make.
The Obligations Associated with Being a Public Company Will Require Significant Resources and Management Attention, Which Will Increase Our Costs of Operations and May Divert Focus from Our Business Operations
We have only recently been required to file periodic reports with the SEC. As a public company, we are required to file periodic reports containing our consolidated financial statements with the SEC within a specified time following the completion of quarterly and annual periods. As a public company, we also now incur significant legal, accounting, insurance and other expenses. Compliance with these reporting requirements and other rules of the SEC and the rules of the will increase our legal and financial compliance costs and make some activities more time consuming and costly. Furthermore, the need to establish the corporate infrastructure demanded of a public company may divert management’s attention from implementing our growth strategy, which could prevent us from successfully implementing our strategic initiatives and improving our business, results of operations and financial condition. We have made, and will continue to make, changes to our internal controls and procedures for financial reporting and accounting systems to meet our reporting obligations as a public company. However, we cannot predict or estimate the amount of additional costs we may incur in order to comply with these requirements. We anticipate that these costs will materially increase our general and administrative expenses.
27
Table of Contents
Index to Financial Statements
If We Fail to Correct Any Material Weakness That We Identify in Our Internal Control over Financial Reporting or Otherwise Fail to Maintain Effective Internal Control over Financial Reporting, We May Not Be Able to Report Our Financial Results Accurately and Timely
Our management is responsible for establishing and maintaining adequate internal control over financial reporting and for evaluating and reporting on our system of internal control. Our internal control processes are designed to provide reasonable assurance regarding the reliability of financial reporting and the preparation of financial statements for external purposes in accordance with generally accepted accounting principles (“GAAP”). As a public company, we are required to comply with the Sarbanes-Oxley Act and other rules that govern public companies. In particular, we will be required to certify our compliance with Section 404 of the Sarbanes-Oxley Act beginning with our annual report on Form 10-K for the year ended December 31, 2015, which will require us to furnish annually a report by management on the effectiveness of our internal control over financial reporting. In addition, unless we remain an emerging growth company and elect additional transitional relief available to emerging growth companies, our independent registered public accounting firm will be required to report on the effectiveness of our internal control over financial reporting, beginning as of that second annual report.
If we identify material weaknesses in our internal control over financial reporting in the future and we cannot comply with the requirements of the Sarbanes-Oxley Act in a timely manner or attest that our internal control over financial reporting is effective, or if our independent registered public accounting firm cannot express an opinion as to the effectiveness of our internal control over financial reporting when required, we may not be able to report our financial results accurately and timely. As a result, investors, counterparties and customers may lose confidence in the accuracy and completeness of our financial reports; our liquidity, access to capital markets and perceptions of our creditworthiness could be adversely affected; and the market price of our common stock could decline. In addition, we could become subject to investigations by the stock exchange on which our securities are listed, the SEC, the Board of Governors of the Federal Reserve, the FDIC, or other regulatory authorities, which could require additional financial and management resources. These events could have an adverse effect on our business, financial condition and results of operations.
A Failure in, or Breach of, Our Operational or Security Systems or Infrastructure, or Those of Our Third Party Vendors and Other Service Providers or Other Third Parties, Including as a Result of Cyber Attacks, Could Disrupt Our Businesses, Result in the Disclosure or Misuse of Confidential or Proprietary Information, Damage Our Reputation, Increase Our Costs, and Cause Losses
We rely heavily on communications and information systems to conduct our business. Information security risks for financial institutions such as us have generally increased in recent years in part because of the proliferation of new technologies, the use of the Internet and telecommunications technologies to conduct financial transactions, and the increased sophistication and activities of organized crime, hackers, and terrorists, activists, and other external parties. As customer, public, and regulatory expectations regarding operational and information security have increased, our operating systems and infrastructure must continue to be safeguarded and monitored for potential failures, disruptions, and breakdowns. Our business, financial, accounting, and data processing systems, or other operating systems and facilities, may stop operating properly or become disabled or damaged as a result of a number of factors, including events that are wholly or partially beyond our control. For example, there could be electrical or telecommunication outages; natural disasters such as earthquakes, tornadoes, and hurricanes; disease pandemics; events arising from local or larger scale political or social matters, including terrorist acts; and as described below, cyber attacks.
Our business relies on its digital technologies, computer and email systems, software and networks to conduct its operations. Although we have information security procedures and controls in place, our technologies, systems and networks and our customers’ devices may become the target of cyber attacks or information security breaches that could result in the unauthorized release, gathering, monitoring, misuse, loss, or
28
Table of Contents
Index to Financial Statements
destruction of our or our customers’ or other third parties’ confidential information. Third parties with whom we do business or who facilitate our business activities, including financial intermediaries, or vendors that provide service or security solutions for our operations, and other unaffiliated third parties, could also be sources of operational and information security risk to us, including from breakdowns or failures of their own systems or capacity constraints. In addition, hardware, software or applications we develop or procure from third parties may contain defects in design or manufacture or other problems that could unexpectedly compromise information security.
While we have disaster recovery and other policies and procedures designed to prevent or limit the effect of the failure, interruption or security breach of our information systems, there can be no assurance that any such failures, interruptions or security breaches will not occur or, if they do occur, that they will be adequately addressed. Our risk and exposure to these matters remain heightened because of the evolving nature of these threats. As a result, cyber security and the continued development and enhancement of our controls, processes, and practices designed to protect our systems, computers, software, data, and networks from attack, damage or unauthorized access remain a focus for us. As threats continue to evolve, we may be required to expend additional resources to continue to modify or enhance our protective measures or to investigate and remediate information security vulnerabilities. Disruptions or failures in the physical infrastructure or operating systems that support our businesses and clients, or cyber attacks or security breaches of the networks, systems or devices that our clients use to access our products and services, could result in client attrition, regulatory fines, penalties or intervention, reputation damage, reimbursement or other compensation costs, and/or additional compliance costs, any of which could have a material effect on our results of operations or financial condition. Furthermore, if such attacks are not detected immediately, their effect could be compounded. To date, to our knowledge, we have not experienced any material impact relating to cyber-attacks or other information security breaches.
The Bank Is Subject to General Banking Risks
Several risks are inherent in the business of banking. Factors outside the Bank’s control, such as instability in interest rates, a depressed economy, government regulation, and federal monetary policy, for example, could adversely impact the banking industry. Banks are also exposed to risk of loss as a result of fraud, embezzlement, insider abuse, and mismanagement. Extensions of credit create a risk that loans cannot, or will not, be repaid.
Earnings are affected by the ability of the Bank to properly originate, underwrite and service loans. The Bank could sustain losses if it incorrectly assesses the creditworthiness of its borrowers or fails to detect or respond to deterioration in asset quality in a timely manner. Rapid changes in loan and deposit terms could result in a risk of loss from changes in interest rates. In managing its loans and investments (assets) and its borrowings and deposits (liabilities), the Bank will run the risk of having insufficient liquid assets to meet withdrawal requests.
Beyond general banking risk, we will take limited risk in mortgage banking, wealth management, trust services or other financial services being offered. Such risks could have a material adverse effect on our business, financial condition, results of operations and prospects.
Because We Engage in Lending Secured By Real Estate and May Be Forced to Foreclose on the Collateral Property and Own The Underlying Real Estate, We May Be Subject to the Increased Costs and Risk Associated with the Ownership of Real Property, Which Could Have an Adverse Effect on Our Business or Results of Operations
A significant portion of our loan portfolio is secured by real estate property. During the ordinary course of business, we may foreclose on and take title to properties securing certain loans, in which case, we are
29
Table of Contents
Index to Financial Statements
exposed to the risks inherent in the ownership of real estate. The amount that we, as a mortgagee, may realize after a default is dependent upon factors outside of our control, including:
| • | general or local economic conditions; |
| • | environmental cleanup liability; |
| • | neighborhood values; |
| • | interest rates; |
| • | real estate tax rates; |
| • | operating expenses of the mortgaged properties; |
| • | supply of and demand for rental units or properties; |
| • | ability to obtain and maintain adequate occupancy of the properties; |
| • | zoning laws; |
| • | governmental rules, regulations and fiscal policies; and |
| • | tornadoes or other natural or man-made disasters. |
Certain expenditures associated with the ownership of real estate, principally real estate taxes and maintenance costs, may also adversely affect our operating expenses.
We Are Subject to Environmental Liability Risk Associated with Lending Activities
A significant portion of our loan portfolio is secured by real estate, and we could become subject to environmental liabilities with respect to one or more of these properties. During the ordinary course of business, we may foreclose on and take title to properties securing defaulted loans. In doing so, there is a risk that hazardous or toxic substances could be found on these properties. If hazardous conditions or toxic substances are found on these properties, we may be liable for remediation costs, as well as for personal injury and property damage, civil fines and criminal penalties regardless of when the hazardous conditions or toxic substances first affected any particular property. Environmental laws may require us to incur substantial expenses to address unknown liabilities and may materially reduce the affected property’s value or limit our ability to use or sell the affected property. In addition, future laws or more stringent interpretations or enforcement policies with respect to existing laws may increase our exposure to environmental liability. Although we have policies and procedures to perform an environmental review before initiating any foreclosure action on nonresidential real property, these reviews may not be sufficient to detect all potential environmental hazards. The remediation costs and any other financial liabilities associated with an environmental hazard could have a material adverse effect on us.
Our Loan Portfolio Includes a Meaningful Amount of Real Estate Construction and Development Loans, Which Have a Greater Credit Risk Than Residential Mortgage Loans
The percentage of loans in real estate construction and development in our portfolio was approximately 29.8% of total loans at September 30, 2014. These loans make up approximately 2.3% of our non-performing loans at September 30, 2014. This type of lending is generally considered to have relatively high credit risks because the principal is concentrated in a limited number of loans with repayment dependent on the successful completion and operation of the related real estate project. The credit quality of many of these loans deteriorated
30
Table of Contents
Index to Financial Statements
during the challenging economic period of 2008 to 2012 due to the adverse conditions in the real estate market during that period and that type of deterioration could occur again. Weakness in residential real estate market prices in the Middle Tennessee area as well as demand could result in price reductions in home and land values adversely affecting the value of collateral securing the construction and development loans that we hold. Should we experience the return of these adverse economic and real estate market conditions we may experience increases in non-performing loans and other real estate owned, increased losses and expenses from the management and disposition of non-performing assets (“NPAs”), increases in provision for loan losses, and increases in operating expenses as a result of the allocation of management time and resources to the collection and work out of loans, all of which would negatively impact our financial condition and results of operations.
We Are Dependent on Key Personnel
We are materially dependent on the performance of its executive management team, loan officers, and other support personnel. The loss of the services of any of these employees could have a material adverse effect on our business, results of operations, and financial condition. Many of these key officers have important customer relationships, which are instrumental to the Bank’s operations. Changes in key personnel and their responsibilities may be disruptive to our business and could have a material adverse effect on our business, financial condition, and results of operations. Management believes that future results also will depend, in part, upon attracting and retaining highly skilled and qualified management, especially in the new market areas into which we may enter, as well as in sales and marketing personnel. Competition for such personnel is intense, and management cannot be sure that we will be successful in attracting or retaining such personnel. See “MANAGEMENT.”
Risks Related to the Regulation of Our Business
We Are Subject to Extensive Regulation
We are subject to extensive governmental regulation and control. Compliance with state and federal banking laws has a material effect on our business and operations. Our operations will at all times be subject to state and federal banking laws, regulations, and procedures. The laws and regulations applicable to the banking industry could change at any time and are subject to interpretation, and management cannot predict the effects of these changes on our business and profitability. Because government regulation greatly affects the business and financial results of all commercial banks and bank holding companies, the cost of compliance could adversely affect our ability to operate profitably. Non-banking financial institutions, such as securities brokerage firms, insurance companies, and money market funds are now permitted to offer services which compete directly with services offered by banks. See “SUPERVISION AND REGULATION.”
The Regulatory Environment for the Financial Services Industry Is Being Significantly Impacted by Financial Regulatory Reform Initiatives, Which May Adversely Impact Our Business, Results of Operations and Financial Condition.
The 2010 Dodd-Frank Wall Street Reform and Consumer Protection Act (the “Dodd-Frank Act”) contains comprehensive provisions governing the practices and oversight of financial institutions and other participants in the financial markets. See “SUPERVISION AND REGULATION.” The Dodd-Frank Act established, among other requirements, a new financial industry regulator, the Consumer Financial Protection Bureau (the “CFPB”), to centralize responsibility for consumer financial protection with broad rulemaking authority to administer and carry out the purposes and objectives of the “Federal consumer financial laws and to prevent evasions thereof,” with respect to all financial institutions that offer financial products and services to consumers, including deposit products, residential mortgages, home-equity loans and credit cards and contains provisions on mortgage-related matters, such as steering incentives, determinations as to a borrower’s ability to repay and prepayment penalties. The CFPB is also authorized to prescribe rules applicable to any covered person or service provider, identifying and prohibiting “unfair, deceptive, or abusive acts or practices” in connection
31
Table of Contents
Index to Financial Statements
with any transaction with a consumer for a consumer financial product or service, or the offering of a consumer financial product or service (“UDAAP authority”). The ongoing broad rulemaking powers of the CFPB and its UDAAP authority have the potential to have a significant impact on the operations of financial institutions offering consumer financial products or services. The CFPB has indicated that they are examining proposing new rules on overdrafts and other consumer financial products or services and if any such rule limits our ability to provide such financial products or services it may have an adverse effect on our business. Additional legislative or regulatory action that may impact our business may result from the multiple studies mandated under the Dodd-Frank Act. Although the applicability of certain elements of the Dodd-Frank Act is limited to institutions with more than $10 billion in assets, there can be no guarantee that such applicability will not be extended in the future or that regulators or other third parties will not seek to impose such requirements on institutions with less than $10 billion in assets.
The evolving regulatory environment causes uncertainty with respect to the manner in which we conduct our businesses and requirements that may be imposed by our regulators. Regulators have implemented and continue to propose new regulations and issue supervisory guidance and have been increasing their examination and enforcement action activities. We expect that regulators will continue taking formal enforcement actions against financial institutions in addition to addressing supervisory concerns through non-public supervisory actions or findings. We are unable to predict the nature, extent or impact of any additional changes to statutes or regulations, including the interpretation, implementation or enforcement thereof, which may occur in the future.
The impact of the evolving regulatory environment on our business and operations depends upon a number of factors including final implementing regulations, guidance and interpretations of the regulatory agencies, supervisory priorities and actions, the actions of our competitors and other marketplace participants, and the behavior of consumers. The evolving regulatory environment could require us to limit or change our business practices, limit our product offerings, require continued investment of management time and resources in compliance efforts, limit fees we can charge for services, require us to meet more stringent capital, liquidity and leverage ratio requirements, increase costs, impact the value of our assets, or otherwise adversely affect our businesses. The regulatory environment and enhanced examination and supervisory expectations and scrutiny can also potentially impact our ability to pursue business opportunities and obtain required regulatory approvals for potential investments and acquisitions.
Compliance and other regulatory requirements and expenditures have increased significantly for us and other financial services firms, and we expect them to continue to increase as regulators adopt new rules, interpret existing rules and increase their scrutiny of financial institutions, including controls and operational processes. We may face additional compliance and regulatory risk to the extent that we enter into new lines of business or new business arrangements with third-party service providers, alternative payment providers or other industry participants, including providers or participants that may not be regulated financial institutions. The additional expense, time and resources needed to comply with ongoing regulatory requirements may adversely impact our business and results of operations. In addition, regulatory findings and ratings could negatively impact our business strategies.
We Are Affected by Governmental Monetary Policies
Like all regulated financial institutions, we are affected by monetary policies implemented by the Federal Reserve and other federal instrumentalities. A primary instrument of monetary policy employed by the Federal Reserve is the restriction or expansion of the money supply through open market operations. This instrument of monetary policy frequently causes volatile fluctuations in interest rates, and it can have a direct, adverse effect on the operating results of financial institutions. Borrowings by the United States government to finance the government debt may also cause fluctuations in interest rates and have similar effects on the operating results of such institutions. See “SUPERVISION AND REGULATION.”
32
Table of Contents
Index to Financial Statements
The Impact of the Changing Regulatory Capital Requirements and Recently Adopted Capital Rules Is Uncertain
Under recently adopted rules by the Federal Reserve and FDIC, the leverage and risk-based capital ratios of bank holding companies may not be lower than the leverage and risk-based capital ratios for insured depository institutions. These rules will become effective as to FFN and the Bank on January 1, 2015 and include new minimum risk-based capital and leverage ratios. Moreover, these rules refine the definition of what constitutes “capital” for purposes of calculating those ratios. The new minimum capital level requirements applicable to bank holding companies and banks subject to the rules are: (i) a new common equity Tier 1 capital ratio of 4.5%; (ii) a Tier 1 risk-based capital ratio of 6% (increased from 4%); (iii) a total risk-based capital ratio of 8% (unchanged from current rules); and (iv) a Tier 1 leverage ratio of 4% for all institutions. The rules also establish a “capital conservation buffer” of 2.5% (to be phased in over three years) above the new regulatory minimum capital ratios, and result in the following minimum ratios once the capital conservation buffer is fully phased in: (i) a common equity Tier 1 risk-based capital ratio of 7.0%, (ii) a Tier 1 risk-based capital ratio of 8.5%, and (iii) a total risk-based capital ratio of 10.5%. The capital conservation buffer requirement is to be phased in beginning in January 2016 at 0.625% of risk-weighted assets and would increase each year until fully implemented in January 2019. An institution will be subject to limitations on paying dividends, engaging in share repurchases and paying discretionary bonuses if its capital levels fall below the buffer amounts. These limitations establish a maximum percentage of eligible retained income that could be utilized for such actions.
The application of these more stringent capital requirements to FFN and the Bank could, among other things, result in lower returns on invested capital, require the raising of additional capital, and result in regulatory actions if FFN or the Bank were to be unable to comply with such requirements. Furthermore, the imposition of liquidity requirements in connection with the implementation of the final rules could result in FFN or the Bank having to lengthen the term of their funding, restructure their business models and/or increase their holdings of liquid assets. Implementation of changes to asset risk weightings for risk-based capital calculations, items included or deducted in calculating regulatory capital and/or additional capital conservation buffers could result in management modifying its business strategy and could limit FFN’s and the Bank’s ability to make distributions, including paying dividends or buying back shares. See “SUPERVISION AND REGULATION.”
The Expanding Body of Federal, State and Local Regulation and/or the Licensing of Loan Servicing, Collections or Other Aspects of Our Business May Increase the Cost of Compliance And the Risks of Noncompliance
We service our own loans, and loan servicing is subject to extensive regulation by federal, state and local governmental authorities as well as to various laws and judicial and administrative decisions imposing requirements and restrictions on those activities. The volume of new or modified laws and regulations has increased in recent years and, in addition, some individual municipalities have begun to enact laws that restrict loan servicing activities including delaying or temporarily preventing foreclosures or forcing the modification of certain mortgages. If regulators impose new or more restrictive requirements, we may incur additional significant costs to comply with such requirements which may further adversely affect us. In addition, our failure to comply with these laws and regulations could possibly lead to: civil and criminal liability; loss of licensure; damage to our reputation in the industry; fines and penalties and litigation, including class action lawsuits; and administrative enforcement actions. Any of these outcomes could materially and adversely affect our business, financial condition, results of operations and prospects.
Federal and State Regulators Periodically Examine Our Business and We May Be Required to Remediate Adverse Examination Findings
The Federal Reserve, the FDIC, and the Tennessee Department of Financial Institutions (“TDFI”) periodically examine our business, including our compliance with laws and regulations. If, as a result of an examination, a banking agency were to determine that our financial condition, capital resources, asset quality, earnings prospects, management, liquidity or other aspects of any of our operations had become unsatisfactory,
33
Table of Contents
Index to Financial Statements
or that we were in violation of any law or regulation, they may take a number of different remedial actions as they deem appropriate. These actions include the power to enjoin “unsafe or unsound” practices, to require affirmative action to correct any conditions resulting from any violation or practice, to issue an administrative order that can be judicially enforced, to direct an increase in our capital, to restrict our growth, to assess civil money penalties, to fine or remove officers and directors and, if it is concluded that such conditions cannot be corrected or there is an imminent risk of loss to depositors, to terminate our deposit insurance and place us into receivership or conservatorship. Any regulatory action against us could have an adverse effect on our business, financial condition and results of operations.
Our FDIC Deposit Insurance Premiums and Assessments May Increase
The deposits of our subsidiary bank are insured by the FDIC up to legal limits and, accordingly, subject our bank subsidiary to the payment of FDIC deposit insurance assessments. The Bank’s regular assessments are based on its average consolidated total assets minus average tangible equity as well as by risk classification, which includes regulatory capital levels and the level of supervisory concern. High levels of bank failures since the beginning of the financial crisis and increases in the statutory deposit insurance limits have increased resolution costs to the FDIC and put significant pressure on the Deposit Insurance Fund (“DIF”). In order to maintain a strong funding position and restore the reserve ratios of the DIF, the FDIC has, in the past, increased deposit insurance assessment rates and charged a special assessment to all FDIC-insured financial institutions. Further increases in assessment rates or special assessments may occur in the future, especially if there are significant additional financial institution failures. Any future special assessments, increases in assessment rates or required prepayments in FDIC insurance premiums could reduce our profitability or limit our ability to pursue certain business opportunities, which could have an adverse effect on our business, financial condition and results of operations.
We Are Required to Act As a Source of Financial and Managerial Strength For Our Bank in Times of Stress
Under federal law and longstanding Federal Reserve policy, we are expected to act as a source of financial and managerial strength to our bank, and to commit resources to support our bank if necessary. We may be required to commit additional resources to our bank at times when we may not be in a financial position to provide such resources or when it may not be in our, or our shareholders’ or creditors’, best interests to do so. Providing such support is more likely during times of financial stress for us and our bank, which may make any capital we are required to raise to provide such support more expensive than it might otherwise be. In addition, any capital loans we make to our bank are subordinate in right of payment to depositors and to certain other indebtedness of our bank. In the event of our bankruptcy, any commitment by us to a federal banking regulator to maintain the capital of our bank will be assumed by the bankruptcy trustee and entitled to priority of payment. See “SUPERVISION AND REGULATION—Bank Holding Company Regulation.”
Future Acquisitions Generally Will Require Regulatory Approvals and Failure to Obtain Them Would Restrict Our Growth
We may decide to explore complementing and expanding our products and services by pursuing strategic acquisitions. Generally, any acquisition of target financial institutions, branches or other banking assets by us will require approval by and cooperation from, a number of governmental regulatory agencies, possibly including the Federal Reserve, and the FDIC, as well as state banking regulators. In acting on applications, federal banking regulators consider, among other factors:
| • | The effect of the acquisition on competition; |
| • | The financial condition, liquidity, results of operations, capital levels and future prospects of the applicant and the bank(s) involved; |
34
Table of Contents
Index to Financial Statements
| • | The quantity and complexity of previously consummated acquisitions; |
| • | The managerial resources of the applicant and the bank(s) involved; |
| • | The convenience and needs of the community, including the record of performance under the Community Reinvestment Act of 1977 (the “CRA”); |
| • | The effectiveness of the applicant in combating money-laundering activities; |
| • | The applicant’s regulatory compliance record; and |
| • | The extent to which the acquisition would result in greater or more concentrated risk to the stability of the United States banking or financial system. |
Such regulators could deny our application based on the above criteria or other considerations, which would restrict our growth, or the regulatory approvals may not be granted on terms that are acceptable to us. For example, we could be required to sell branches as a condition to receiving regulatory approvals and such a condition may not be acceptable to us or may reduce the benefit of any acquisition.
We Face a Risk of Noncompliance and Enforcement Action with the Bank Secrecy Act and Other Anti-Money Laundering Statutes and Regulations
The Bank Secrecy Act (the “BSA”), the USA PATRIOT Act of 2001 (the “Patriot Act”) and other laws and regulations require financial institutions, among other duties, to institute and maintain an effective anti-money laundering program and file suspicious activity and currency transaction reports as appropriate. The federal Financial Crimes Enforcement Network is authorized to impose significant civil money penalties for violations of those requirements and has recently engaged in coordinated enforcement efforts with the individual federal banking regulators, as well as the U.S. Department of Justice, Drug Enforcement Administration and Internal Revenue Service. We are also subject to increased scrutiny of compliance with the rules enforced by the Office of Foreign Assets Control. If our policies, procedures and systems are deemed deficient, we would be subject to liability, including fines and regulatory actions, which may include restrictions on our ability to pay dividends and the necessity to obtain regulatory approvals to proceed with certain aspects of our business plan, including our acquisition plans. Failure to maintain and implement adequate programs to combat money laundering and terrorist financing could also have serious reputational consequences for us. Any of these results could have an adverse effect on our business, financial condition and results of operations.
There Are Substantial Regulatory Limitations on Changes of Control of a Bank Holding Company
With certain limited exceptions, federal regulations prohibit a person, a company or a group of persons deemed to be “acting in concert” from, directly or indirectly, acquiring more than 10% (5% if the acquirer is a bank holding company) of any class of our voting stock or obtaining the ability to control in any manner the election of a majority of our directors or otherwise direct the management or policies of FFN without prior notice or application to and the approval of the Federal Reserve. Companies investing in banks and bank holding companies receive additional review and may be required to become bank holding companies, subject to regulatory supervision. Accordingly, prospective investors must be aware of and comply with these requirements, if applicable, in connection with any purchase of shares of our common stock. These provisions effectively inhibit certain mergers or other business combinations, which, in turn, could adversely affect the market price of our common stock.
35
Table of Contents
Index to Financial Statements
Risks Related to an Investment in Our Common Stock
Shares of Our Common Stock Are Not Insured
Shares of our common stock are not deposits and are not insured by the FDIC or any other entity and you will bear the risk of loss if the value or market price of our common stock is adversely affected.
There Is Currently a Very Limited Public Market for Our Common Stock and One May Not Develop
Although we are an SEC reporting company, prior to this offering our common stock had very little liquidity, with only limited trading of our common stock on the OTCBB. We have applied to list our common stock on the , but an active, liquid trading market for our common stock may not develop or be sustained following this offering. A public trading market having the desired characteristics of depth, liquidity and orderliness depends upon the presence in the marketplace and independent decisions of willing buyers and sellers of our common stock, over which we have no control. If an active, liquid trading market for our common stock does not develop, shareholders may not be able to sell their shares at the volume, prices and times desired. Moreover, the lack of an established market could materially and adversely affect the value of our common stock. The market price of our common stock could decline significantly due to actual or anticipated issuances or sales of our common stock in the future.
The Market Price of Our Common Stock May Fluctuate Significantly
The market price of our common stock could fluctuate significantly due to a number of factors, including, but not limited to:
| • | our quarterly or annual earnings, or those of other companies in our industry; |
| • | actual or anticipated fluctuations in our operating results, financial condition or asset quality; |
| • | changes in economic or business conditions; |
| • | the public reaction to our press releases, our other public announcements and our filings with the SEC; |
| • | perceptions in the market place involving our competitors and/or us; |
| • | changes in business, legal or regulatory conditions, or other developments affecting participants in our industry, and publicity regarding our business or any of our significant customers or competitors; |
| • | changes in governmental monetary policies, including the policies of the Federal Reserve; |
| • | changes in financial estimates and recommendations by securities analysts following our stock, or the failure of securities analysts to cover our common stock after this offering; |
| • | the failure of securities analysts to cover, or continue to cover, us after the offering; |
| • | changes in earnings estimates by securities analysts or our ability to meet those estimates; |
| • | significant acquisitions or business combinations, strategic partnerships, joint ventures, or capital commitments by or involving our competitors or us; |
36
Table of Contents
Index to Financial Statements
| • | the trading volume of our common stock; |
| • | future sales of our common stock; |
| • | our treatment as an “emerging growth company” under federal securities laws; |
| • | additions or departures of key personnel; |
| • | changes in accounting standards, policies, guidance, interpretations or principles; |
| • | failure to integrate acquisitions or realize anticipated benefits from our acquisitions; |
| • | rapidly changing technology; and |
| • | other news, announcements or disclosures (whether by us or others) related to us, our competitors, our core market or the bank and non-bank financial services industries. |
If any of the foregoing occurs, it could cause our stock price to fall and expose us to litigation that, even if our defense is successful, could distract management and be costly to defend.
Securities Analysts May Not Initiate or Continue Coverage on Our Common Stock, Which Could Adversely Affect the Market for Our Common Stock
The trading market for our common stock will depend in part on the research and reports that securities analysts publish about us and our business. We do not have any control over these securities analysts and they may not cover our common stock. If securities analysts do not cover our common stock, the lack of research coverage may adversely affect our market price. If we are covered by securities analysts and our common stock is the subject of an unfavorable report, the price of our common stock may decline. If one or more of these analysts cease to cover us or fail to publish regular reports on us, we could lose visibility in the financial markets, which could cause the price or trading volume of our common stock to decline.
Investors in this Offering Will Experience Immediate and Substantial Dilution
The initial public offering price is expected to be substantially higher than the net tangible book value per share of our common stock immediately following this offering. Therefore, if you purchase shares in this offering, you will experience immediate and substantial dilution in net tangible book value per share in relation to the price that you paid for your shares. We expect the dilution as a result of this offering to be $ per share, based on an assumed initial offering price of $ per share (the midpoint of the range set forth on the cover page of this prospectus) and our pro forma net tangible book value of $ per share as of September 30, 2014. Accordingly, if we were liquidated at our pro forma net tangible book value, you would not receive the full amount of your investment.
We Have Broad Discretion in the Use of the Net Proceeds from this Offering and Our Use of Those Proceeds May Not Yield a Favorable Return on Your Investment
We intend to use the net proceeds of this offering (which will be approximately $ million) to support our organic growth and other general corporate purposes, including potential future acquisitions of bank and non-bank financial services companies that we believe are complementary to our business and consistent with our growth strategy. In addition, we intend to use a portion of the net proceeds of this offering to redeem the outstanding shares of Series A Preferred Stock issued to the U.S. Treasury pursuant to our participation in the SBLF program, prior to March 2016, which is when the dividend rate on such Series A Preferred Stock increases to 9.0%. We are currently paying a dividend rate of 1.0% on the Series A Preferred Stock.
37
Table of Contents
Index to Financial Statements
The Rights of Our Common Shareholders Are Subordinate to the Rights of the Holders of Our Series A Preferred Stock and Any Debt Securities That We May Issue and May Be Subordinate to the Holders of Any Other Class of Preferred Stock That We May Issue in the Future
We have issued 10,000 shares of our Series A Preferred Stock. These shares have rights that are senior to our common stock. As a result, we must make payments on the preferred stock before any dividends can be paid on our common stock and, in the event of our bankruptcy, dissolution or liquidation, the holders of the Series A Preferred Stock must be satisfied in full before any distributions can be made to the holders of our common stock. Our Board of Directors has the authority to issue in the aggregate up to 1,000,000 shares of preferred stock and to determine the terms of each issue of preferred stock without shareholder approval. Accordingly, you should assume that any shares of preferred stock that we may issue in the future will also be senior to our common stock and could have a preference on liquidating distributions or a preference on dividends that could limit our ability to pay dividends to the holders of our common stock. Because our decision to issue debt or equity securities or incur other borrowings in the future will depend on market conditions and other factors beyond our control, the amount, timing, nature or success of our future capital-raising efforts is uncertain. Thus, common shareholders bear the risk that our future issuances of debt or equity securities or our incurrence of other borrowings will negatively affect the market price of our common stock.
There Is No Certainty of Return on Investment
No assurance can be given that a holder of the shares will realize a substantial return on his or her investment, or any return at all. Further, as a result of the uncertainty and risks associated with our operations as described in this “RISK FACTORS” section, it is possible that an investor will lose his or her entire investment.
We Cannot Ensure When Or If We Will Pay Dividends
Our ability to pay dividends is highly dependent on the Bank’s ability to pay dividends and may be limited based upon restrictions of the SBLF and based upon our earnings and capital needs. As a result of our participation in the SBLF, the likelihood of our declaring dividends to our shareholders is contingent on the anticipated growth and capital preservation strategy to maintain a strong capital level for both the Bank and FFN. The Bank is also subject to various legal, regulatory and other restrictions on its ability to pay dividends and make other distributions and payments to us and may require regulatory approval to do so. See “DIVIDEND POLICY.” As a result, we cannot project or guarantee when dividends will be declared in the future, if at all. See “DESCRIPTION OF CAPITAL STOCK—Preferred Stock.” Our Board of Directors has also decided to not pay dividends on common stock at this time.
We May Require Additional Capital
The Board of Directors believes that the current level of capital will be adequate at the present time to sustain the operations and projected growth of FFN and the Bank. If FFN or the Bank fails to meet sufficient financial performance (including as a result of significant provision expense as a result of deterioration in asset quality) or if the assets of the Bank grow more quickly than projected, management may determine, or government regulators may require, FFN or the Bank to raise additional capital. In the event FFN or the Bank falls below certain regulatory capital adequacy standards, they may become subject to regulatory intervention and restrictions. We can give no assurance that such additional capital is available at prices that will be acceptable to us, if at all. In the event of the issuance of additional shares, then current shareholders will not have the first right to subscribe to new shares (preemptive rights), so their ownership percentage may be diluted in the future. See “DESCRIPTION OF CAPITAL STOCK—Common Stock.”
We Are an Emerging Growth Company and It Cannot Be Certain if the Reduced Disclosure Requirements Applicable to Emerging Growth Companies Will Make Our Common Stock Less Attractive to Investors
We are an emerging growth company. For as long as we continue to be an emerging growth company, among other things, we may take advantage of certain exemptions from various reporting requirements that are
38
Table of Contents
Index to Financial Statements
applicable to public companies that are not emerging growth companies, including, but not limited to, not being required to comply with the auditor attestation requirements of Section 404 of the Sarbanes-Oxley Act, reduced disclosure obligations regarding executive compensation in its periodic reports and proxy statements, and exemptions from the requirements of holding a nonbinding advisory vote on executive compensation and shareholder approval of any golden parachute payments not previously approved. In addition, even if we comply with the greater obligations of public companies that are not emerging growth companies, we may avail ourselves of the reduced requirements applicable to emerging growth companies from time to time in the future, so long as it is an emerging growth company. We will remain an emerging growth company for up to five years, though we may cease to be an emerging growth company earlier under certain circumstances, including if, before the end of such five years, we are deemed to be a large accelerated filer under the rules of the SEC (which depends on, among other things, having a market value of common stock held by non-affiliates in excess of $700 million) or if our total annual gross revenues equal or exceed $1 billion in a fiscal year. We cannot predict if investors will find our common stock less attractive because we will rely on these exemptions. If some investors find our common stock less attractive as a result, there may be a less active trading market for our common stock and our stock price may be more volatile.
39
Table of Contents
Index to Financial Statements
CAUTIONARY STATEMENT REGARDING FORWARD-LOOKING STATEMENTS
Certain statements contained in this prospectus that are not statements of historical fact constitute “forward-looking statements” within the meaning of Section 27A of the Securities Act and Section 21E of the Exchange Act. Forward-looking statements reflect our current views and may relate to, among other matters, our financial condition, results of operations, plans, objectives, future performance, and business. Forward-looking statements are based on many assumptions and estimates and are not guarantees of future performance. The actual results may differ materially from those anticipated in any forward-looking statements, as they will depend on many factors about which we are unsure, including many factors that are beyond our control. The words “may,” “would,” “could,” “should,” “will,” “likely,” “expect,” “anticipate,” “predict,” “will likely result in,” “project,” “potential,” “continue,” “contemplate,” “seek,” “assume,” “believe,” “intend,” “plan,” “forecast,” “goal,” and “estimate,” as well as similar expressions, or the negative version of those words are meant to identify such forward-looking statements. Potential risks and uncertainties that could cause actual results to differ materially from those anticipated in our forward-looking statements include, but are not limited to, those described under the “RISK FACTORS” section and the following:
| • | our limited operating history as an integrated company following our acquisition of MidSouth on July 1, 2014; |
| • | expected revenue synergies and cost savings from our acquisition of MidSouth may not be fully realized; |
| • | revenues may be lower than expected; |
| • | credit losses as a result of, among other potential factors, declining real estate values, increasing interest rates, increasing unemployment, or changes in payment behavior or other factors; |
| • | restrictions or conditions imposed by our regulators on its operations; |
| • | the adequacy of the level of our allowance for loan losses and the amount of loan loss provisions required in future periods; |
| • | examinations by our regulatory authorities, including the possibility that the regulatory authorities may, among other things, require us to increase its allowance for loan losses or write down assets; |
| • | increases in competitive pressure in the banking and financial services industries; |
| • | changes in the interest rate environment which could reduce anticipated or actual margins; |
| • | changes in political conditions or the legislative or regulatory environment, including governmental initiatives affecting the financial services industry; |
| • | general economic conditions resulting in, among other things, a deterioration in credit quality; |
| • | changes occurring in business conditions and inflation; |
| • | changes in funding or increased regulatory requirements with regard to funding; |
| • | increased cybersecurity risk, including potential business disruptions or financial losses; |
| • | changes in technology; |
| • | changes in deposit flows; |
40
Table of Contents
Index to Financial Statements
| • | changes in monetary and tax policies; |
| • | changes in accounting policies and practices; |
| • | the rate of delinquencies and amounts of loans charged off; |
| • | the rate of loan growth in recent years and the lack of seasoning of a portion of our loan portfolio; |
| • | our ability to maintain appropriate levels of capital; |
| • | our ability to attract and retain key personnel; |
| • | our ability to retain its existing clients, including its deposit relationships; |
| • | adverse changes in asset quality and resulting credit risk-related losses and expenses; |
| • | loss of consumer confidence and economic disruptions resulting from terrorist activities; and |
| • | risks related to this offering. |
We caution you that the important factors referenced above may not contain all of the factors that are important to you in making a decision to invest in our common stock. Because of these and other risks and uncertainties, our actual future results may be materially different from the results indicated by any forward-looking statements. In addition, our past results of operations do not necessarily indicate our future results. Therefore, we caution you not to place undue reliance on our forward-looking information and statements. The forward-looking statements included in this prospectus are made only as of the date hereof. We undertake no obligation, except as may be required by law, to publicly update or otherwise revise any forward-looking statements, whether as a result of new information, future events, or otherwise. Comparisons of results for current or prior periods are not intended to express any future trends or indications of future performance, unless expressed as such, and should only be viewed as historical data.
All forward-looking statements in this prospectus are based on information available to us as of the date of this prospectus. Although we believe that the expectations reflected in our forward-looking statements are reasonable, we cannot guarantee you that these expectations will be achieved. We do not undertake any obligation to publicly update or otherwise revise any forward-looking statements, whether as a result of new information, future events, or otherwise.
41
Table of Contents
Index to Financial Statements
We intend to initially retain the net proceeds from this offering at our holding company and to use such proceeds to support our continued growth, including organic growth and potential future acquisitions and for general corporate purposes. In addition, we intend to use a portion of the net proceeds of this offering to redeem the outstanding shares of Series A Preferred Stock issued to the U.S. Treasury pursuant to our participation in the SBLF program, prior to March 2016, which is when the dividend rate on such Series A Preferred Stock increases to 9.0%. We are currently paying a dividend rate of 1.0% on the Series A Preferred Stock. From time to time, we may evaluate and conduct due diligence with respect to potential acquisition candidates and may enter into letters of intent, although we do not have any current plans, arrangements or understandings to make a material acquisition. There can be no assurance that we will enter into any definitive agreements in respect of any such transaction. Our management will retain broad discretion to allocate the net proceeds of this offering. Although we intend to initially retain the net proceeds of this offering at our holding company, we may elect to contribute a portion of the net proceeds to the Bank as regulatory capital. The precise amounts and timing of our use of the proceeds will depend upon market conditions and other factors.
We estimate that the net proceeds from the sale of the shares of our common stock in this offering will be approximately $ million, after deducting the estimated underwriting discounts and commissions and estimated offering expenses payable by us, based on an assumed initial public offering price of $ per share, which is the midpoint of the estimated initial public offering price range set forth on the cover page of this prospectus. If the underwriters exercise their option to purchase additional shares in full, the net proceeds to us will be approximately $ million.
A $1.00 increase (or decrease) in the assumed initial public offering price of $ per share, which is the midpoint of the estimated initial public offering price range set forth on the cover page of this prospectus, would increase (or decrease) the net proceeds from the sale of the shares of common stock by us by approximately $ million, assuming that the number of shares offered by us, as set forth on the cover page of this prospectus, remains the same and after deducting estimated underwriting discounts and commissions and estimated offering expenses payable by us.
A 100,000 share increase (or decrease) in the number of shares of common stock offered by us, would increase (or decrease) the net proceeds from the sale of the shares of common stock by us by approximately $ million, assuming an initial public offering price of $ per share, which is the midpoint of the estimated initial public offering price range set forth on the cover page of this prospectus, and after deducting estimated underwriting discounts and commissions and estimated offering expenses payable by us.
42
Table of Contents
Index to Financial Statements
We have not declared or paid any dividends on our common stock. We currently intend to retain all of our future earnings, if any, for use in our business and do not anticipate paying cash dividends on our common stock in the foreseeable future. Payments of future dividends, if any, will be at the discretion of our board of directors after taking into account various factors, including our business, operating results and financial condition, current and anticipated cash needs, plans for expansion, tax considerations, general economic conditions and any legal or contractual limitations on our ability to pay dividends. We are not obligated to pay dividends on our common stock.
As a bank holding company, our ability to pay dividends is affected by the policies and enforcement powers of the Federal Reserve. In addition, because we are a holding company, we are dependent upon the payment of dividends by the Bank to us as our principal source of funds to pay dividends in the future, if any, and to make other payments. The Bank is also subject to various legal, regulatory and other restrictions on its ability to pay dividends and make other distributions and payments to us. See “SUPERVISION AND REGULATION.” In addition, in the future we may enter into borrowing or other contractual arrangements that restrict our ability to pay dividends.
As a result of our participation in the SBLF program, we are obligated to pay quarterly non-cumulative dividends on our Series A Preferred Stock held by the U.S. Treasury. Payments are due each January 1, April 1, July 1 and October 1. The dividend rate on our Series A Preferred Stock is 1.0% per annum as of September 30, 2014 and will increase to 9.0% beginning March 2016. Failure to pay quarterly dividends on the Series A Preferred Stock may limit our ability to pay dividends on our common stock in the future.
43
Table of Contents
Index to Financial Statements
The following table shows our capitalization, including regulatory capital ratios, on a consolidated basis, as of September 30, 2014, on an actual basis and on an as adjusted basis after giving effect to the net proceeds from the sale by us of shares at an assumed initial offering price of $ per share, the midpoint of the offering price range on the cover page of this prospectus, after deducting estimated underwriting discounts and offering expenses. You should read the following table in conjunction with the sections entitled “UNAUDITED PRO FORMA COMBINED CONDENSED FINANCIAL INFORMATION,” “MANAGEMENT’S DISCUSSION AND ANALYSIS OF FINANCIAL CONDITION AND RESULTS OF OPERATIONS” and our consolidated financial statements and related notes appearing elsewhere in this prospectus.
| As of September 30, 2014 | ||||||||
| Actual | As Adjusted | |||||||
| (Dollars in thousands, except per share data) |
||||||||
| Shareholders’ equity: |
||||||||
| Senior non-cumulative preferred stock, no par value, $10,000 liquidation value: Series A, 1,000,000 shares authorized; 10,000 shares issued and outstanding(1) |
$ | 10,000 | $ | |||||
| Common stock, no par value; 10,000,000 shares authorized; issued and outstanding—7,739,644 shares actual, shares as adjusted(1) |
93,888 | |||||||
| Retained earnings |
12,562 | |||||||
| Accumulated other comprehensive income (loss) |
4 | |||||||
|
|
|
|
|
|||||
| Total shareholders’ equity |
$ | 116,454 | $ | |||||
|
|
|
|
|
|||||
| Capital Ratios: |
||||||||
| Tier 1 capital to average assets |
8.83 | % | ||||||
| Tier 1 capital to risk-weighted assets |
12.35 | |||||||
| Total capital to risk-weighted assets |
13.05 | |||||||
| Tangible common equity to tangible assets(2) |
7.70 | |||||||
| (1) | Our charter authorizes us to issue up to 10,000,000 shares of common stock and up to 1,000,000 shares of our preferred stock. |
| (2) | Tangible common equity to tangible assets is a non-GAAP financial measure. We calculate tangible common equity as total shareholders’ equity less preferred stock, goodwill, core deposit intangibles and other intangible assets, net of loan servicing rights, and we calculate tangible assets as total assets less goodwill and core deposit intangibles and other intangible assets, net of loan servicing rights. We believe that the most directly comparable GAAP financial measure is total shareholders’ equity to total assets. For a reconciliation of the non-GAAP financial measure to its most directly comparable GAAP financial measure, see “MANAGEMENT’S DISCUSSION AND ANALYSIS OF FINANCIAL CONDITION AND RESULTS OF OPERATIONS—GAAP Reconciliation and Management Explanation of Non-GAAP Financial Measures.” |
44
Table of Contents
Index to Financial Statements
If you invest in our common stock, your ownership interest will be diluted to the extent that the initial public offering price per share of our common stock in this offering exceeds the net tangible book value per share of common stock upon completion of this offering.
Net tangible book value per common share represents the amount of our total tangible assets less total liabilities and preferred stock, divided by the number of shares of common stock outstanding. Our net tangible book value as of September 30, 2014 was $94.4 million, or $12.19 per share of common stock.
Investors participating in this offering will incur immediate, substantial dilution. After giving effect to the sale of shares of our common stock by us (assuming the underwriters do not exercise their option to purchase additional shares) at the initial public offering price of $ per share, the midpoint of the estimated initial public offering price range set forth on the cover page of this prospectus, and after deducting the estimated underwriting discounts and commissions and estimated offering expenses payable by us, our net tangible book value as of September 30, 2014 would have been approximately $ million, or approximately $ per share of common stock. This represents an immediate increase in net tangible book value of $ per share to existing common shareholders, and an immediate dilution of $ per share to investors participating in this offering. If the initial public offering price is higher or lower, the dilution to new shareholders will be greater or less, respectively.
The following table illustrates the calculation of the amount of dilution per share that a purchaser of our common stock in this offering will incur given the assumptions above:
| Assumed initial public offering price per share of common stock |
$ | |||||
| Net tangible book value per common share as of September 30, 2014 |
$ | 12.19 | ||||
| Increase in tangible book value per common share attributable to this offering |
||||||
| As adjusted net tangible book value per common share after this offering |
||||||
| Dilution in net tangible book value per common share to new investors(1) |
$ |
| (1) | Dilution is determined by subtracting net tangible book value per common share after giving effect to this offering from the initial public offering price paid by a new investor. |
A $1.00 increase (or decrease) in the assumed initial public offering price of $ per share, which is the midpoint of the estimated initial public offering price range set forth on the cover page of this prospectus, would increase (or decrease) the as adjusted net tangible book value per share after this offering by approximately $ , and dilution in net tangible book value per share to new investors by approximately $ , assuming that the number of shares offered by us, as set forth on the cover page of this prospectus, remains the same and after deducting estimated underwriting discounts and commissions and estimated offering expenses payable by us. If the underwriters exercise in full their option to purchase additional shares of our common stock in this offering, the as adjusted net tangible book value after this offering would be $ per share, the increase in net tangible book value to existing shareholders would be $ per share and the dilution to new investors would be $ per share, in each case assuming an initial public offering price of $ per share, which is the midpoint of the estimated initial public offering price range set forth on the cover page of this prospectus.
45
Table of Contents
Index to Financial Statements
The following table summarizes, as of September 30, 2014, the differences between our existing shareholders and new investors with respect to the number of shares of our common stock purchased from us, the total consideration paid to us and the average price per share paid by existing shareholders and investors purchasing common stock in the offering. The calculations with respect to shares purchased by new investors in this offering reflect the initial public offering price of $ per share, which is the midpoint of the estimated initial public offering price range set forth on the cover page of this prospectus, before deducting estimated underwriting discounts and commissions and estimated offering expenses payable by us:
| Shares Purchased | Total Contributions | Average Price Per Share |
||||||||||||||
| Number | Percentage | Amount | Percentage | |||||||||||||
| Existing shareholders |
% | % | $ | |||||||||||||
| New investors |
||||||||||||||||
|
|
|
|
|
|
|
|||||||||||
| Total |
% | % | $ | |||||||||||||
|
|
|
|
|
|
|
|||||||||||
The discussion and tables above assume no exercise of the underwriters’ option to purchase additional shares, and no exercise of any outstanding options. In addition, if the underwriters’ option to purchase additional shares is exercised in full, the number of shares of common stock held by existing shareholders will be further reduced to % of the total number of shares of common stock to be outstanding upon the completion of this offering, and the number of shares of common stock held by investors participating in this offering will be further increased to shares or % of the total number of shares of common stock to be outstanding upon the completion of this offering.
The discussion and tables above exclude 1,269,839 shares of our common stock issuable upon the exercise of outstanding options and warrants. As of September 30, 2014, we had outstanding options to purchase 1,237,962 shares of common stock at a weighted average exercise price of $11.30 per share. As of September 30, 2014, we had outstanding warrants to purchase 31,877 shares of common stock at an exercise price of $12.00 per share. To the extent any of these options or warrants are exercised, investors purchasing common stock in this offering will experience further dilution.
46
Table of Contents
Index to Financial Statements
MANAGEMENT’S DISCUSSION AND ANALYSIS OF FINANCIAL CONDITION AND
RESULTS OF OPERATIONS
This section presents management’s perspective on our financial condition and results of operations. The following discussion and analysis is intended to highlight and supplement data and information presented elsewhere in this prospectus, including the consolidated financial statements and related notes and should be read in conjunction with the accompanying tables and our annual audited financial statements and unaudited interim financial statements. To the extent that this discussion describes prior performance, the descriptions relate only to the periods listed, which may not be indicative of our future financial outcomes. In addition to historical information, this discussion contains forward-looking statements that involve risks, uncertainties and assumptions that could cause results to differ materially from management’s expectations. Factors that could cause these differences are discussed in the sections titled “RISK FACTORS” and “CAUTIONARY STATEMENT REGARDING FORWARD-LOOKING STATEMENTS.” All amounts are in thousands, except per share data or unless otherwise indicated.
Critical Accounting Policies
The accounting and reporting policies of the Company are in accordance with accounting principles generally accepted in the United States of America and conform to general practices within the banking industry. To prepare financial statements in conformity with accounting principles generally accepted in the United States of America, management makes estimates and assumptions based on available information. These estimates and assumptions affect the amounts reported in the financial statements and the disclosures provided, and actual results could differ. The allowance for loan losses and fair value of financial instruments are particularly subject to change.
The Company’s accounting policies are integral to understanding the results reported. These accounting policies are described in detail in Note 1 of the notes to the consolidated financial statements. The critical accounting policies require judgment to ascertain the valuation of assets, liabilities, commitments and contingencies. Management has established policies and control procedures that are intended to ensure valuation methods are well controlled and applied consistently from period to period. In addition, the policies and procedures are intended to ensure that the process for changing methodologies occurs in an appropriate manner. The following is a brief summary of the more significant policies.
Principles of Consolidation
The consolidated financial statements include Franklin Financial Network, Inc. and its wholly owned subsidiaries, Franklin Synergy Bank and Banc Compliance Group, Inc. (“Banc Compliance Group”), which sold substantially all its assets on December 31, 2014 to BCG Consulting, LLC, together referred to as “the Company.” The consolidated financial statements have been prepared in conformity with accounting principles generally accepted in the United States of America and conform to general practices within the banking industry. All significant intercompany accounts and transactions have been eliminated in the consolidated financial statements.
Purchased Loans
The Company maintains an allowance for loan losses on purchased loans based on credit deterioration subsequent to the acquisition date. In accordance with the accounting guidance for business combinations, because we recorded all acquired loans at fair value as of the date of the MidSouth acquisition, we did not establish an allowance for loan losses on any of the loans we purchased as of the acquisition date as any credit deterioration evident in the loans was included in the determination of the acquisition date fair values. For purchased credit-impaired loans accounted for under ASC 310-30, management establishes an allowance for loan losses subsequent to the date of acquisition by re-estimating expected cash flows on these loans on a quarterly
47
Table of Contents
Index to Financial Statements
basis, with any decline in expected cash flows due to credit triggering impairment recorded as provision for loan losses. The allowance established is the excess of the loan’s carrying value over the present value of projected future cash flows, discounted at the current accounting yield of the loan. These cash flow evaluations are inherently subjective as they require material estimates, all of which may be susceptible to significant change. While the determination of specific cash flows involves estimates, each estimate is unique to the individual loan, and none is individually significant. For non-purchased credit-impaired loans acquired in the MidSouth transaction and that are accounted for under ASC 310-20, the historical loss estimates are based on the historical losses experienced by MidSouth for loans with similar characteristics as those acquired other than purchased credit-impaired loans. We record an allowance for loan losses only when the calculated amount exceeds the remaining credit mark established at acquisition.
Allowance for Loan Losses
The allowance for loan losses is a valuation allowance for probable incurred credit losses. Loan losses are charged against the allowance when management believes the uncollectibility of a loan balance is confirmed. Subsequent recoveries, if any, are credited to the allowance. Management estimates the allowance balance required using past loan loss experience, the nature and volume of the portfolio, information about specific borrower situations and estimated collateral values, economic conditions, and other factors. Allocations of the allowance may be made for specific loans, but the entire allowance is available for any loan that, in management’s judgment, should be charged off.
The allowance consists of specific and general components. The specific component relates to loans that are individually classified as impaired. A loan is impaired when, based on current information and events, it is probable that the Company will be unable to collect all amounts due according to the contractual terms of the loan agreement. Loans for which the terms have been modified resulting in a concession, and for which the borrower is experiencing financial difficulties, are considered troubled debt restructurings and classified as impaired.
Factors considered by management in determining impairment include payment status, collateral value, and the probability of collecting scheduled principal and interest payments when due. Loans that experience insignificant payment delays and payment shortfalls generally are not classified as impaired. Management determines the significance of payment delays and payment shortfalls on a case-by-case basis, taking into consideration all of the circumstances surrounding the loan and the borrower, including the length of the delay, the reasons for the delay, the borrower’s prior payment record, and the amount of the shortfall in relation to the principal and interest owed.
All loans classified by management as substandard or worse are individually evaluated for impairment. If a loan is impaired, a portion of the allowance is allocated so that the loan is reported, net, at the present value of estimated future cash flows using the loan’s existing rate or at the fair value of collateral if repayment is expected solely from the collateral.
Troubled debt restructurings are separately identified for impairment disclosures and are measured at the present value of estimated future cash flows using the loan’s effective rate at inception. If a troubled debt restructuring is considered to be a collateral dependent loan, the loan is reported, net, at the fair value of the collateral. For troubled debt restructurings that subsequently default, the Company determines the amount of reserve in accordance with the accounting policy for the allowance for loan losses.
The general component covers non-impaired loans and is based on historical loss experience adjusted for current factors. The historical loss experience is determined by portfolio segment and is based on a combination of the Bank’s loss history and loss history from the Bank’s peer group over the past three years. This actual loss experience is supplemented with other economic factors based on the risks present for each portfolio segment. These economic factors include consideration of the following: levels of and trends in
48
Table of Contents
Index to Financial Statements
delinquencies and impaired loans; levels of and trends in charge-offs and recoveries; trends in volume and terms of loans; effects of any changes in risk selection and underwriting standards; other changes in lending policies, procedures, and practices; experience, ability, and depth of lending management and other relevant staff; national and local economic trends and conditions; industry conditions; and effects of changes in credit concentrations.
Mortgage Servicing Rights
When loans are sold with servicing retained, servicing rights are initially recorded at fair value with the income statement effect recorded in gain on sale of loans. Fair value is based on market prices for comparable servicing contracts. All classes of servicing assets are subsequently measured using the amortization method which requires servicing rights to be amortized into non-interest income in proportion to, and over the period of, the estimated future net servicing income of the underlying loans.
Servicing assets are evaluated for impairment based upon the fair value of the rights as compared to carrying amount. Impairment is determined by stratifying rights into groupings based on predominant risk characteristics, such as interest rate, loan type and investor type. Impairment is recognized through a valuation allowance for an individual grouping, to the extent that fair value is less than the carrying amount. If the Company later determines that all or a portion of the impairment no longer exists for a particular grouping, a reduction of the allowance may be recorded as an increase to income. Changes in valuation allowances are reported with loan servicing fees on the income statement. The fair values of servicing rights are subject to significant fluctuations as a result of changes in estimated and actual prepayment speeds and default rates and losses.
Servicing fee income, which is reported on the income statement as loan servicing fees, is recorded for fees earned for servicing loans. The fees are based on a contractual percentage of the outstanding principal or a fixed amount per loan and are recorded as income when earned. The amortization of mortgage servicing rights is netted against mortgage loan servicing fee income.
Comparison of Results of Operations for the Three and Nine Months Ended September 30, 2014 and 2013
Overview
The Company reported net income of $2,015 and $5,579 for the three and nine months ended September 30, 2014, respectively, compared to $1,010 and $3,158 for the three and nine months ended September 30, 2013. After the payment of preferred dividends on the senior preferred stock issued to the Treasury pursuant to SBLF, the Company’s net earnings available to common shareholders for the three and nine months ended September 30, 2014 was $1,990 and $5,504, respectively, compared to $985 and $3,075 for the same periods in 2013. The primary reason for the increase in net earnings available to common shareholders for the three and nine months ended September 30, 2014, was increased interest income on loans and investment securities due to significant organic growth in each of these portfolios over the same periods in 2013 and due to the acquisition of MidSouth, which added $184.3 million in loans, excluding loans held for sale, and $57.4 million in securities available for sale, after considering the effect of purchase accounting entries.
MidSouth Acquisition
The acquisition of MidSouth increased the Company’s net interest income by approximately $2,994 and increased net income available to common shareholders by approximately $853 for both the three and nine month periods ended September 30, 2014. The earnings growth was offset somewhat by an increase in non-interest expenses related to the Company’s acquisition of MidSouth. Salaries expense totaled $6,144 and $13,494 for the three and nine months ended September 30, 2014, compared to $3,339 and $9,830 for the same periods in 2013, an increase of $2,805 and $3,664 between the respective periods, most of which is attributed to the addition of the MidSouth personnel. Expenses related to the Company’s acquisition of MidSouth totaled $603
49
Table of Contents
Index to Financial Statements
and $853 for the three and nine months ended September 30, 2014, respectively. These expenses were related to the systems conversions and various professional fees for legal, accounting and investment banking consultants. These and other factors that contributed to the Company’s earnings results for the periods indicated are discussed in more detail below.
On July 1, 2014, the acquisition of MidSouth was completed, expanding the Company’s presence in the Nashville-Davidson-Murfreesboro-Franklin, TN Metropolitan Statistical Area, specifically in the Rutherford County market. Headquartered in Murfreesboro, Tennessee and founded in 2004, MidSouth had five branches located throughout Rutherford County, which is adjacent to Williamson County. As of June 30, 2014, MidSouth had total assets of $281 million, total loans, excluding loans held for sale, of $192 million and total deposits of $244 million. MidSouth held a loan portfolio that was primarily comprised of real estate loans. Immediately prior to the closing of the acquisition, for the six-month period ended June 30, 2014, MidSouth’s balance of nonperforming loans totaled 1.34% and net recoveries to average loans, on an annualized basis, was 0.17%.
As a result of the MidSouth acquisition and as of July 1, 2014, the Company, after giving effect to purchase accounting:
| • | grew consolidated total assets from $872 million to $1.17 billion; |
| • | increased total loans, including loans held for sale, from $502 million to $693 million; |
| • | increased total deposits from $747 million to $992 million; and |
| • | expanded its employee base from 126 full-time equivalent employees to 227 full-time equivalent employees. |
Net Interest Income/Margin
Net interest income consists of interest income generated by earning assets, less interest expense. Net interest income for the three and nine months ended September 30, 2014, totaled $11,127 and $25,570, respectively, compared to $5,385 and $14,657 for the same periods in 2013, an increase of $5,742 and $10,913 between the respective periods. For the three and nine months ended September 30, 2014, interest income increased $6,354 and $12,139, respectively, due to growth in both the loan and investment securities portfolios, offset by increases in interest expense totaling $612 and $1,226 as a result of increases in both interest-bearing deposits and borrowings.
Interest-earning assets averaged $1,143,401 and $938,406 during the three and nine months ended September 30, 2014 compared to $614,222 and $592,991 for the same periods in 2013, an increase of $529,179 and $345,415, or 86.2% and 58.2%, respectively. This increase was due primarily to the recent acquisition of MidSouth. Average loans increased 94.8% and 63.5% and investment securities increased 64.5% and 51.3% for the three and nine months ended September 30, 2014 and 2013, respectively. The yield on average interest-earning assets increased 27 basis points to 4.23% during the nine month period ending September 30, 2014, compared to 3.96% for the same period in 2013. For the three months ended September 30, 2014 and 2013, the yield on average interest earning assets increased 31 basis points to 4.40% compared to 4.09% for the same period during 2013. A decrease in the yield on average loans between the nine month periods was more than offset by an increase in the yield on average securities available for sale between the periods. For the three months ended September 30, 2014 and 2013, the yield on available for sale securities was 2.45% and 1.78%, respectively. The primary driver for the increase was the slowing of prepayment amortization during the three months ended September 30, 2014, as compared to the same period during 2013. During the three months ended September 30, 2014, prepayment amortization of available for sale securities was $828, which represented a yield reduction of 102 basis points. During the three months ended September 30, 2013, prepayment amortization of available for sale securities was $927, which represented a yield reduction of 196 basis points. For the nine
50
Table of Contents
Index to Financial Statements
months ended September 30, 2014 and 2013, the yield on available for sale securities was 2.62% and 1.51%, respectively. The primary driver for the increase was the slowing of prepayment amortization during the nine months ended September 30, 2014, as compared to the same period during 2013. During the nine months ended September 30, 2014, prepayment amortization of available for sale securities was $1,942, which represented a yield reduction of 88 basis points. During the nine months ended September 30, 2013, prepayment amortization of available for sale securities was $3,263, which represented a yield reduction of 227 basis points.
Interest-bearing liabilities averaged $952,871 and $797,635 during the three and nine month periods ending September 30, 2014 compared to $522,695 and $506,179 for the same periods in 2013, an increase of $430,176 and $291,456, or 82.3% and 57.6%, respectively. Total average interest-bearing deposits grew $270,627 and $107,975, including increases in average brokered Certificates of deposit outstanding of $58,492 and $44,051 for the three and nine month periods ending September 30, 2014 as compared to the same periods during 2013. Rapid growth in the loan portfolio also resulted in an increase in average FHLB advances of $7,728 and $14,454. Average federal funds purchased increased $604 for the nine month period ending September 30, 2014 and decreased $13,576 for the three month period ending September 30, 2014 as compared to the same periods during 2013. The decrease in average fed funds purchased for the three month period was due to the timing of funding received from the MidSouth acquisition and the addition of public fund deposits. The cost of average interest-bearing liabilities decreased seven basis points to 0.69% during the nine months ended September 30, 2014, compared to 0.76% for the same period in 2013. This favorable decline was primarily due to decreases in the rates paid on money market accounts and time deposits. The effect of the $291,456 increase in average interest-bearing liabilities, offset somewhat by the seven basis points decrease in cost of average interest-bearing liabilities, resulted in the $1,226 increase in interest expense between the two nine month periods. For the three month periods ending September 30, 2014 and 2013, the cost of average interest-bearing liabilities decreased seven basis points to 0.65% from 0.72%. The decline was primarily due to decreases in the cost of funds for money market and time deposit accounts that offset increases in the rates paid on brokered certificates of deposit, FHLB advances, and federal funds purchased. The $430,176 increase in average interest-bearing liabilities for the three month period ending September 30, 2014, as compared to the same period during 2013, resulted in an increase in interest expense of $612 between the two three-month periods.
(This space intentionally left blank)
51
Table of Contents
Index to Financial Statements
The tables below summarize average balances, yields, cost of funds, and the analysis of changes in interest income and interest expense for the three-and nine-month periods ended September 30, 2014 and 2013:
Average Balances (7)—Yields & Rates
(Dollars are in thousands)
| Three Months Ended September 30, | ||||||||||||||||||||||||
| 2014 | 2013 | |||||||||||||||||||||||
| Average Balance |
Interest Inc / Exp |
Average Yield / Rate |
Average Balance |
Interest Inc / Exp |
Average Yield / Rate |
|||||||||||||||||||
| ASSETS: |
||||||||||||||||||||||||
| Loans(1) |
$ | 719,155 | $ | 10,168 | 5.61 | % | $ | 369,112 | $ | 5,186 | 5.57 | % | ||||||||||||
| Securities available for sale(6) |
324,574 | 2,007 | 2.45 | 189,255 | 847 | 1.78 | ||||||||||||||||||
| Securities held to maturity |
57,611 | 407 | 2.80 | 43,169 | 268 | 2.46 | ||||||||||||||||||
| Certificates of deposit at other financial institutions |
250 | 1 | 1.59 | — | — | 0.00 | ||||||||||||||||||
| Federal funds sold and other(2) |
41,811 | 109 | 1.03 | 12,686 | 37 | 1.15 | ||||||||||||||||||
|
|
|
|
|
|
|
|
|
|
|
|
|
|||||||||||||
| TOTAL INTEREST EARNING ASSETS |
$ | 1,143,401 | $ | 12,692 | 4.40 | % | $ | 614,222 | $ | 6,338 | 4.09 | % | ||||||||||||
| Allowance for loan losses |
(5,862 | ) | (4,318 | ) | ||||||||||||||||||||
| All other assets |
60,508 | 25,203 | ||||||||||||||||||||||
|
|
|
|
|
|||||||||||||||||||||
| TOTAL ASSETS |
$ | 1,198,047 | $ | 635,107 | ||||||||||||||||||||
| LIABILITIES & SHAREHOLDERS’ EQUITY |
||||||||||||||||||||||||
| Deposits: |
||||||||||||||||||||||||
| Interest checking |
$ | 190,294 | $ | 111 | 0.23 | % | $ | 93,114 | $ | 67 | 0.29 | % | ||||||||||||
| Money market |
355,488 | 567 | 0.63 | 215,736 | 415 | 0.76 | ||||||||||||||||||
| Savings |
27,253 | 32 | 0.47 | 14,500 | 18 | 0.49 | ||||||||||||||||||
| Time deposits |
322,329 | 736 | 0.91 | 151,242 | 374 | 0.98 | ||||||||||||||||||
| FHLB advances |
33,065 | 80 | 0.96 | 25,337 | 29 | 0.45 | ||||||||||||||||||
| Federal funds purchased and other(3) |
24,442 | 39 | 0.63 | 22,766 | 50 | 0.88 | ||||||||||||||||||
|
|
|
|
|
|
|
|
|
|
|
|
|
|||||||||||||
| TOTAL INTEREST BEARING LIABILITIES |
$ | 952,871 | $ | 1,565 | 0.65 | % | $ | 522,695 | $ | 953 | 0.72 | % | ||||||||||||
| Demand deposits |
128,982 | 59,643 | ||||||||||||||||||||||
| Other liabilities |
2,290 | 1,868 | ||||||||||||||||||||||
| Total shareholders’ equity |
113,904 | 50,901 | ||||||||||||||||||||||
|
|
|
|
|
|||||||||||||||||||||
| TOTAL LIABILITIES AND SHAREHOLDERS’ EQUITY |
$ | 1,198,047 | $ | 635,107 | ||||||||||||||||||||
| NET INTEREST SPREAD(4) |
3.75 | % | 3.37 | % | ||||||||||||||||||||
| NET INTEREST INCOME |
$ | 11,127 | $ | 5,385 | ||||||||||||||||||||
| NET INTEREST MARGIN(5) |
3.86 | % | 3.48 | % | ||||||||||||||||||||
| (1) | Loan balances include both loans held in the Bank’s portfolio and mortgage loans held for sale and are net of deferred origination fees and costs. Non-accrual loans are included in total loan balances. |
| (2) | Includes federal funds sold, capital stock in the Federal Reserve Bank and FHLB, and interest-bearing deposits at the Federal Reserve Bank. |
| (3) | Includes repurchase agreements. |
| (4) | Represents the average rate earned on interest-earning assets minus the average rate paid on interest-bearing liabilities. |
| (5) | Represents net interest income (annualized) divided by total average earning assets. |
| (6) | Interest income and rates exclude the effects of a tax equivalent adjustment to adjust tax exempt investment income on tax exempt investment securities to a fully taxable basis due to immateriality. |
| (7) | Average balances are average daily balances. |
52
Table of Contents
Index to Financial Statements
Average Balances (7)—Yields & Rates
(Dollars are in thousands)
| Nine Months Ended September 30, | ||||||||||||||||||||||||
| 2014 | 2013 | |||||||||||||||||||||||
| Average Balance |
Interest Inc / Exp |
Average Yield / Rate |
Average Balance |
Interest Inc / Exp |
Average Yield / Rate |
|||||||||||||||||||
| ASSETS: |
||||||||||||||||||||||||
| Loans(1) |
$ | 552,157 | $ | 22,466 | 5.44 | % | $ | 337,810 | $ | 14,434 | 5.71 | % | ||||||||||||
| Securities available for sale(6) |
295,602 | 5,793 | 2.62 | 191,982 | 2,170 | 1.51 | ||||||||||||||||||
| Securities held to maturity |
58,522 | 1,199 | 2.74 | 42,062 | 821 | 2.60 | ||||||||||||||||||
| Certificates of deposit at other financial institutions |
84 | 2 | 3.18 | — | — | 0.00 | ||||||||||||||||||
| Federal funds sold and other(2) |
32,041 | 230 | 0.96 | 21,137 | 126 | 0.79 | ||||||||||||||||||
|
|
|
|
|
|
|
|
|
|
|
|
|
|||||||||||||
| TOTAL INTEREST EARNING ASSETS |
$ | 938,406 | $ | 29,690 | 4.23 | % | $ | 592,991 | 17,551 | 3.96 | % | |||||||||||||
| Allowance for loan losses |
(5,466 | ) | (4,178 | ) | ||||||||||||||||||||
| All other assets |
39,574 | 23,496 | ||||||||||||||||||||||
|
|
|
|
|
|||||||||||||||||||||
| TOTAL ASSETS |
$ | 972,514 | $ | 612,309 | ||||||||||||||||||||
| LIABILITIES & SHAREHOLDERS’ EQUITY |
||||||||||||||||||||||||
| Deposits: |
||||||||||||||||||||||||
| Interest checking |
$ | 191,248 | $ | 408 | 0.29 | % | $ | 116,067 | $ | 283 | 0.33 | % | ||||||||||||
| Money market |
280,870 | 1,465 | 0.70 | 215,939 | 1,313 | 0.81 | ||||||||||||||||||
| Savings |
22,572 | 83 | 0.49 | 12,528 | 46 | 0.49 | ||||||||||||||||||
| Time deposits |
253,192 | 1,852 | 0.98 | 132,721 | 1,091 | 1.10 | ||||||||||||||||||
| FHLB advances |
28,791 | 189 | 0.88 | 14,337 | 67 | 0.62 | ||||||||||||||||||
| Federal funds purchased and other(3) |
20,962 | 123 | 0.78 | 14,587 | 94 | 0.86 | ||||||||||||||||||
|
|
|
|
|
|
|
|
|
|
|
|
|
|||||||||||||
| TOTAL INTEREST BEARING LIABILITIES |
$ | 797,635 | $ | 4,120 | 0.69 | % | $ | 506,179 | $ | 2,894 | 0.76 | % | ||||||||||||
| Demand deposits |
84,908 | 52,707 | ||||||||||||||||||||||
| Other liabilities |
4,905 | 1,849 | ||||||||||||||||||||||
| Total shareholders’ equity |
85,066 | 51,574 | ||||||||||||||||||||||
|
|
|
|
|
|||||||||||||||||||||
| TOTAL LIABILITIES AND SHAREHOLDERS’ EQUITY |
$ | 972,514 | $ | 612,309 | ||||||||||||||||||||
| NET INTEREST SPREAD(4) |
3.54 | % | 3.20 | % | ||||||||||||||||||||
| NET INTEREST INCOME |
$ | 25,570 | $ | 14,657 | ||||||||||||||||||||
| NET INTEREST MARGIN(5) |
3.64 | % | 3.30 | % | ||||||||||||||||||||
| (1) | Loan balances include both loans held in the Bank’s portfolio and mortgage loans held for sale and are net of deferred origination fees and costs. Non-accrual loans are included in total loan balances. |
| (2) | Includes federal funds sold, capital stock in the Federal Reserve Bank and FHLB, and interest-bearing deposits at the Federal Reserve Bank. |
| (3) | Includes repurchase agreements. |
| (4) | Represents the average rate earned on interest-earning assets minus the average rate paid on interest-bearing liabilities. |
| (5) | Represents net interest income (annualized) divided by total average earning assets. |
| (6) | Interest income and rates exclude the effects of a tax equivalent adjustment to adjust tax exempt investment income on tax exempt investment securities to a fully taxable basis due to immateriality. |
| (7) | Average balances are average daily balances. |
53
Table of Contents
Index to Financial Statements
The tables below detail the components of the changes in net interest income for the periods indicated. For each major category of interest-earning assets and interest-bearing liabilities, information is provided with respect to changes due to average volume and changes due to rates, with the changes in both volumes and rates allocated to these two categories based on the proportionate absolute changes in each category.
Analysis of Changes in Interest Income and Expenses
| Net change three months ended September 30, 2014 versus September 30, 2013 |
||||||||||||
| Volume | Rate | Net Change | ||||||||||
| INTEREST INCOME |
||||||||||||
| Loans |
$ | 4,918 | $ | 64 | $ | 4,982 | ||||||
| Securities available for sale |
607 | 554 | 1,161 | |||||||||
| Securities held to maturity |
89 | 49 | 138 | |||||||||
| Certificates of deposit at other financial institutions |
1 | — | 1 | |||||||||
| Federal funds sold and other |
85 | (13 | ) | 72 | ||||||||
|
|
|
|
|
|
|
|||||||
| TOTAL INTEREST INCOME |
$ | 5,700 | $ | 654 | $ | 6,354 | ||||||
|
|
|
|
|
|
|
|||||||
| INTEREST EXPENSE |
||||||||||||
| Deposits |
||||||||||||
| Interest checking |
$ | 70 | $ | (26 | ) | $ | 44 | |||||
| Money market accounts |
269 | (117 | ) | 152 | ||||||||
| Savings |
16 | (2 | ) | 14 | ||||||||
| Time deposits |
423 | (61 | ) | 362 | ||||||||
| FHLB advances |
9 | 42 | 51 | |||||||||
| Other borrowed funds |
4 | (15 | ) | (11 | ) | |||||||
|
|
|
|
|
|
|
|||||||
| TOTAL INTEREST EXPENSE |
$ | 791 | $ | (179 | ) | $ | 612 | |||||
|
|
|
|
|
|
|
|||||||
| NET INTEREST INCOME |
$ | 4,909 | $ | 833 | $ | 5,742 | ||||||
|
|
|
|
|
|
|
|||||||
| Net change nine months ended September 30, 2014 versus September 30, 2013 |
||||||||||||
| Volume | Rate | Net Change | ||||||||||
| INTEREST INCOME |
||||||||||||
| Loans |
$ | 9,159 | $ | (1,127 | ) | $ | 8,032 | |||||
| Securities available for sale |
1,172 | 2,450 | 3,622 | |||||||||
| Securities held to maturity |
334 | 11 | 345 | |||||||||
| Certificates of deposit at other financial institutions |
2 | — | 2 | |||||||||
| Federal funds sold and other |
47 | 91 | 138 | |||||||||
|
|
|
|
|
|
|
|||||||
| TOTAL INTEREST INCOME |
$ | 10,714 | $ | 1,425 | $ | 12,139 | ||||||
|
|
|
|
|
|
|
|||||||
| INTEREST EXPENSE |
||||||||||||
| Deposits |
||||||||||||
| Interest checking |
$ | 183 | $ | (58 | ) | $ | 125 | |||||
| Money market accounts |
395 | (243 | ) | 152 | ||||||||
| Savings |
37 | — | 37 | |||||||||
| Time deposits |
990 | (229 | ) | 761 | ||||||||
| FHLB advances |
68 | 54 | 122 | |||||||||
| Other borrowed funds |
41 | (12 | ) | 29 | ||||||||
|
|
|
|
|
|
|
|||||||
| TOTAL INTEREST EXPENSE |
$ | 1,714 | $ | (488 | ) | $ | 1,226 | |||||
|
|
|
|
|
|
|
|||||||
| NET INTEREST INCOME |
$ | 9,000 | $ | 1,913 | $ | 10,913 | ||||||
|
|
|
|
|
|
|
|||||||
54
Table of Contents
Index to Financial Statements
Provision for Loan Losses
The provision for loan losses represents a charge to earnings necessary to establish an allowance for loan losses that, in management’s evaluation, should be adequate to provide coverage for probable losses incurred in the loan portfolio. The allowance is increased by the provision for loan losses and is decreased by charge-offs, net of recoveries on prior loan charge-offs.
The provision for loan losses was $664 and $225 for the three months ended September 30, 2014 and 2013, respectively, and $1,489 and $457 for the nine months ended September 30, 2014 and 2013, respectively. The higher provision for the nine months ended September 30, 2014, compared to the same period in 2013 is due primarily to higher loan growth during the three and nine months ended September 30, 2014, compared to the same periods in 2013. Nonperforming loans at September 30, 2014 totaled $3,356 compared to $2,601 at December 31, 2013, representing 0.5% and 0.6% of total loans, respectively.
Non-Interest Income
Non-interest income for the three and nine months ended September 30, 2014 was $3,274 and $7,125 compared to $1,317 and $5,182 for the same periods in 2013. The following is a summary of the components of non-interest income (in thousands):
| Three Months Ended September 30, |
$ Increase (Decrease) |
% Increase (Decrease) |
||||||||||||||
| 2014 | 2013 | |||||||||||||||
| Service charges on deposit accounts |
$ | 13 | $ | 12 | $ | 1 | 8.3 | % | ||||||||
| Other service charges and fees |
600 | 270 | 330 | 122.2 | ||||||||||||
| Net gains on sale of loans |
1,875 | 714 | 1,161 | 162.6 | ||||||||||||
| Loan servicing fees, net |
73 | (19 | ) | 92 | 484.2 | |||||||||||
| Gain on sale of investment securities, net |
22 | — | 22 | 100.0 | ||||||||||||
| Net gain (loss) on sale of foreclosed assets |
(3 | ) | (29 | ) | 26 | 89.7 | ||||||||||
| Compliance consulting fees |
117 | 124 | (7 | ) | (5.6 | ) | ||||||||||
| Other |
577 | 245 | 332 | 135.5 | ||||||||||||
|
|
|
|
|
|
|
|
|
|||||||||
| Total non-interest income |
$ | 3,274 | $ | 1,317 | $ | 1,957 | 148.6 | % | ||||||||
|
|
|
|
|
|
|
|
|
|||||||||
| Nine Months Ended September 30, |
$ Increase (Decrease) |
% Increase (Decrease) |
||||||||||||||
| 2014 | 2013 | |||||||||||||||
| Service charges on deposit accounts |
$ | 37 | $ | 39 | $ | (2 | ) | (5.1 | %) | |||||||
| Other service charges and fees |
1,149 | 868 | 281 | 32.4 | ||||||||||||
| Net gains on sale of loans |
4,226 | 3,611 | 615 | 17.0 | ||||||||||||
| Loan servicing fees, net |
173 | (317 | ) | 490 | 154.6 | |||||||||||
| Gain on sale of investment securities, net |
93 | 78 | 15 | 19.2 | ||||||||||||
| Net gain (loss) on sale of foreclosed assets |
28 | (250 | ) | 278 | 111.2 | |||||||||||
| Compliance consulting fees |
412 | 457 | (45 | ) | (9.8 | ) | ||||||||||
| Other |
1,007 | 696 | 311 | 44.7 | ||||||||||||
|
|
|
|
|
|
|
|
|
|||||||||
| Total non-interest income |
$ | 7,125 | $ | 5,182 | $ | 1,943 | 37.5 | % | ||||||||
|
|
|
|
|
|
|
|
|
|||||||||
Other service charges and fees for the nine months ending September 30, 2014 increased $281, or 32.4%, from the same period in 2013 due primarily to the MidSouth acquisition, which contributed to increases in ATM fees and investment management fees. Net gains on the sale of loans include net gains realized from the sales of mortgage loans and Small Business Administration (“SBA”) loans. Net gains on the sale of mortgage loans are based, in part, on differences between the carrying value of loans being sold to third-party investors and the selling price. Also included are changes in the fair value of mortgage banking derivatives entered into by the
55
Table of Contents
Index to Financial Statements
Company to hedge the change in interest rates on loan commitments prior to their sale in the secondary market. Fluctuations in mortgage interest rates, changes in the demand for certain loans by investors, and whether servicing rights associated with the loans being sold are retained or released all affect the net gains on mortgage loan sales. Net gains for the nine months ending September 30, 2014 were $4,226, an increase of $615, or 17.0%, from the same period in 2013. The increase was primarily due to the growth in mortgage loan volumes during 2014 and from the addition of the mortgage lending team from the MidSouth acquisition. Residential refinancing activity that began to surge during the second half of 2011 in response to historically low interest rates remained significant into 2013 but began to decrease in the second half of that year. Net gains for the three months ending September 30, 2014 were $1,875, an increase of $1,161, or 162.6%, from the same period during 2013. The increase was primarily due to volume of mortgage loans originated and the sales related to those loans.
Loan servicing fees are fees earned for servicing residential mortgages and SBA loans offset by the amortization of mortgage servicing rights. These mortgage servicing rights are initially recorded at fair value and then amortized in proportion to, and over the period of, the estimated life of the underlying loans. In addition, impairment to the mortgage servicing rights may be recognized through a valuation allowance, and adjustments to the allowance can affect the net loan servicing fees. For the three and nine months ending September 30, 2014, net loan servicing fees were $73 and $173 compared to ($19) and ($317) for the three and nine months ending September 30, 2013. The favorable increase to loan servicing fees was primarily related to a decrease in amortization as a result of a decrease in residential refinancing activity.
Net gain (loss) on foreclosed assets consists of gains or losses on the sale of Other Real Estate Owned (“OREO”) properties and other foreclosed assets and valuation adjustments against the carrying costs of foreclosed assets. For the nine months ended September 30, 2014, there was a gain on the sale of OREO of $28 compared to a loss of $250 for the nine months ended September 30, 2013. For the three months ended September 30, 2014 and 2013, there were net losses of $3 and $29, respectively.
Compliance consulting fees were earned from activities engaged by Banc Compliance Group. These fees were consulting fees paid by banking institutions unaffiliated with the Company for the services provided by Banc Compliance Group. The net loss of three clients contributed to the slight decline in these fees during the periods presented.
Non-interest Expense
Non-interest expense for the three and nine months ended September 30, 2014 was $10,389 and $21,959 compared to $4,842 and $14,279 for the same periods in 2013. This increase was the result of the following components listed in the table below (in thousands):
| Three Months Ended September 30, |
$ Increase (Decrease) |
% Increase (Decrease) |
||||||||||||||
| 2014 | 2013 | |||||||||||||||
| Salaries and employee benefits |
$ | 6,144 | $ | 3,339 | $ | 2,805 | 84.0 | % | ||||||||
| Occupancy and equipment |
1,443 | 666 | 777 | 116.7 | ||||||||||||
| FDIC assessment expense |
181 | 101 | 80 | 79.2 | ||||||||||||
| Marketing |
224 | 70 | 154 | 220.0 | ||||||||||||
| Professional fees |
961 | 79 | 882 | 1116.5 | ||||||||||||
| Other |
1,436 | 587 | 849 | 144.6 | ||||||||||||
|
|
|
|
|
|
|
|
|
|||||||||
| Total non-interest expense |
$ | 10,389 | $ | 4,842 | $ | 5,547 | 114.6 | % | ||||||||
|
|
|
|
|
|
|
|
|
|||||||||
56
Table of Contents
Index to Financial Statements
| Nine Months Ended September 30, |
$ Increase (Decrease) |
% Increase (Decrease) |
||||||||||||||
| 2014 | 2013 | |||||||||||||||
| Salaries and employee benefits |
$ | 13,494 | $ | 9,830 | $ | 3,664 | 37.3 | % | ||||||||
| Occupancy and equipment |
3,238 | 1,990 | 1,248 | 62.7 | ||||||||||||
| FDIC assessment expense |
420 | 254 | 166 | 65.4 | ||||||||||||
| Marketing |
470 | 193 | 277 | 143.5 | ||||||||||||
| Professional fees |
1,594 | 322 | 1,272 | 395.0 | ||||||||||||
| Other |
2,743 | 1,690 | 1,053 | 62.3 | ||||||||||||
|
|
|
|
|
|
|
|
|
|||||||||
| Total non-interest expense |
$ | 21,959 | $ | 14,279 | $ | 7,680 | 53.8 | % | ||||||||
|
|
|
|
|
|
|
|
|
|||||||||
The increase in non-interest expense noted in the tables above is indicative of the Company’s overall growth during this time. Two primary increases for the three and nine months ending September 30, 2014, were in salaries and occupancy, as the Bank has added six branches, five of which were added with the acquisition of MidSouth, and expanded its headquarters offices in downtown Franklin, Tennessee from one period to the next. Staffing increased from 118 full-time equivalent employees as of September 30, 2013, to 227 as of September 30, 2014. The increased staffing is due to the retention of the majority of the MidSouth employees to continue to support the branches as well as additional operational staff needed to handle the growth in loans and deposits.
The increase in professional fees during the nine months ending September 30, 2014, is primarily from fees associated with the acquisition of MidSouth. These expenses totaled $1,594 for the nine months ended September 30, 2014, compared to $322 for the same period in 2013, and included consulting fees and various legal and accounting fees. For the three months ended September 30, 2014, professional fees increased to $961, an increase of $882, or 1116.5%, from the same period during 2013. The increase for the three months ended September 30, 2014 as compared to the same period during 2013 can be attributed to expenses associated with the acquisition of MidSouth and various consulting, legal, and accounting fees.
Income Tax Expense
The Company recognized an income tax expense for the three and nine months ended September 30, 2014, of $1,333 and $3,668, respectively, compared to $625 and $1,945 for three and nine months ended September 30, 2013, respectively. The Company’s year-to-date income tax expense for the period ended September 30, 2014 reflects an effective income tax rate of 39.7% compared to 38.1% for the same period in 2013. This increase in the effective tax rate resulted from unfavorable permanent differences arising from non-deductible expenses associated with the MidSouth acquisition and from stock based compensation expense incurred from the vesting of incentive stock options as a result of employee retirement.
Comparison of Balance Sheets at September 30, 2014 and December 31, 2013
Overview
The Company’s total assets increased by $442,205, or 55.5%, from December 31, 2013 to September 30, 2014. The increase in total assets has primarily been the result of the acquisition of MidSouth along with growth in the loan portfolio. In addition, a portion of the proceeds from a private placement of the Company’s common stock in September 2013, were used to increase capital at the Bank and to support continued earnings growth at the Bank through purchases of investment securities and the funding of loans.
The MidSouth acquisition added approximately $293,830 of assets and $252,736 of liabilities to the Company’s consolidated balance sheet as of the acquisition date. The Company issued approximately 2.8 million common shares as purchase consideration in connection with the acquisition which added approximately $41,094 to consolidated shareholders’ equity at the transaction date.
57
Table of Contents
Index to Financial Statements
Loans
Lending-related income is the most important component of the Company’s net interest income and is a major contributor to profitability. The loan portfolio is the largest component of earning assets, and it therefore generates the largest portion of revenues. The absolute volume of loans and the volume of loans as a percentage of earning assets is an important determinant of net interest margin as loans are expected to produce higher yields than securities and other earning assets. Total loans, net of deferred fees, at September 30, 2014 and December 31, 2013 were $719,275 and $421,304, respectively, an increase of $297,971, or 70.7%. This growth in the loan portfolio is due to the acquisition of MidSouth, increased market penetration and a healthy local economy, as well as the addition of experienced lending officers.
The table below provides a summary of the loan portfolio composition for the periods noted.
| Types of Loans |
September 30, 2014 | December 31, 2013 | ||||||||||||||
| Amount | % of Total Loans |
Amount | % of Total Loans |
|||||||||||||
| Total loans, excluding PCI loans |
||||||||||||||||
| Real estate: |
||||||||||||||||
| Residential |
$ | 201,430 | 28.0 | % | $ | 138,466 | 32.8 | % | ||||||||
| Construction and land development |
213,975 | 29.7 | 113,710 | 26.9 | ||||||||||||
| Commercial |
223,820 | 31.1 | 125,202 | 29.7 | ||||||||||||
| Commercial and industrial |
68,693 | 9.5 | 36,397 | 8.6 | ||||||||||||
| Consumer and other |
7,442 | 1.0 | 8,250 | 2.0 | ||||||||||||
|
|
|
|
|
|
|
|
|
|||||||||
| Total loans—gross, excluding PCI loans |
$ | 715,360 | 99.3 | % | $ | 422,025 | 100.0 | % | ||||||||
|
|
|
|
|
|
|
|
|
|||||||||
| Types of Loans |
September 30, 2014 | December 31, 2013 | ||||||||||||||
| Amount | % of Total Loans |
Amount | % of Total Loans |
|||||||||||||
| Total PCI loans (note 1) |
||||||||||||||||
| Real estate: |
||||||||||||||||
| Residential |
$ | 994 | 0.1 | % | $ | — | — | % | ||||||||
| Construction and land development |
78 | NM | — | — | ||||||||||||
| Commercial |
2,362 | 0.3 | — | — | ||||||||||||
| Commercial and industrial |
1,352 | 0.2 | — | — | ||||||||||||
| Consumer and other |
2 | NM | — | — | ||||||||||||
|
|
|
|
|
|
|
|
|
|||||||||
| Total loans—gross PCI loans |
4,788 | 0.7 | — | — | ||||||||||||
|
|
|
|
|
|
|
|
|
|||||||||
| Total gross loans |
$ | 720,148 | 100.0 | % | $ | 422,025 | 100.0 | % | ||||||||
|
|
|
|
|
|||||||||||||
| Less: deferred loan fees, net |
(873 | ) | (721 | ) | ||||||||||||
| Allowance for loan losses |
(5,883 | ) | (4,900 | ) | ||||||||||||
|
|
|
|
|
|||||||||||||
| Total loans, net allowance for loan losses |
$ | 713,392 | $ | 416,404 | ||||||||||||
|
|
|
|
|
|||||||||||||
| note | 1: PCI accounted for pursuant to ASC Topic 310-30. |
As presented in the above table, gross loans increased 70.6% during the first nine months of 2014, primarily due to completing the acquisition of MidSouth, which initially added $184.3 million to the Company’s loan portfolio, after applying purchase accounting adjustments. During this period, the Company experienced growth in real estate loans of 70.3% with the majority of the growth occurring in the construction and land development (88.2%), commercial real estate (80.7%) and residential real estate (46.2%) segments. The Company also experienced strong growth of 92.4% in the commercial and industrial segment during the first nine months of 2014.
58
Table of Contents
Index to Financial Statements
Real estate loans comprised 89.2% of the loan portfolio at September 30, 2014. All three categories of real estate loans, residential, construction and land development and commercial real estate, were nearly equal in their respective percentages of the total portfolio. The largest portion of this portfolio as of September 30, 2014, was commercial real estate loans, which totaled 35.2% of real estate loans. Commercial real estate loans totaled $226,182 at September 30, 2014, and comprised 31.4% of the total loan portfolio. The commercial real estate loan classification primarily includes commercial-based mortgage loans that are secured by nonfarm, nonresidential real estate properties and multi-family residential properties.
The residential real estate classification primarily includes 1-4 family residential loans which are typically conventional first-lien home mortgages, not including loans held-for-sale in the secondary market. Residential real estate loans increased 46.2% during the first nine months of 2014 and comprised 31.5% of real estate loans and 28.1% of total loans at September 30, 2014.
Construction and land development loans totaled $214,053 at September 30, 2014, and comprised 33.3% of real estate loans and 29.7% of the total loan portfolio. Loans in this classification provide financing for the construction and development of residential properties and commercial income properties, multi-family residential development, and land designated for future development.
C&I loans grew 92.4% during the first nine months of 2014, primarily due to the acquisition of MidSouth and comprised 9.7% of total loans at September 30, 2014, as compared to 8.6% as of December 31, 2013. The commercial and industrial classification primarily consists of commercial loans to small-to-medium sized businesses.
The repayment of loans is a source of additional liquidity for us. The following table sets forth the loans maturing within specific intervals at September 30, 2014, excluding unearned net fees and costs.
Loan Maturity Schedule
| September 30, 2014 | ||||||||||||||||
| One year or less |
Over one year to five years |
Over five years |
Total | |||||||||||||
| Real estate: |
||||||||||||||||
| Residential |
$ | 20,864 | $ | 99,693 | $ | 81,867 | $ | 202,424 | ||||||||
| Construction and land development |
163,857 | 34,175 | 16,021 | 214,053 | ||||||||||||
| Commercial |
23,243 | 96,153 | 106,786 | 226,182 | ||||||||||||
| Commercial and industrial |
21,323 | 39,656 | 9,066 | 70,045 | ||||||||||||
| Consumer and other |
2,458 | 4,472 | 514 | 7,444 | ||||||||||||
|
|
|
|
|
|
|
|
|
|||||||||
| Total |
$ | 231,745 | $ | 274,149 | $ | 214,254 | 720,148 | |||||||||
|
|
|
|
|
|
|
|
|
|||||||||
| Fixed interest rate |
$ | 121,014 | $ | 236,260 | $ | 109,963 | $ | 467,237 | ||||||||
| Variable interest rate |
110,731 | 37,889 | 104,291 | 252,911 | ||||||||||||
|
|
|
|
|
|
|
|
|
|||||||||
| Total |
$ | 231,745 | $ | 274,149 | $ | 214,254 | $ | 720,148 | ||||||||
|
|
|
|
|
|
|
|
|
|||||||||
The information presented in the above table is based upon the contractual maturities of the individual loans, including loans which may be subject to renewal at their contractual maturity. Renewal of such loans is subject to review and credit approval, as well as modification of terms upon their maturity. Consequently, management believes this treatment presents fairly the maturity structure of the loan portfolio.
Allowance for Loan Losses
The Company maintains an allowance for loan losses that management believes is adequate to absorb the probable incurred losses inherent in the Company’s loan portfolio. The allowance is increased by provisions for loan losses charged to earnings and is decreased by loan charge-offs net of recoveries of prior period loan
59
Table of Contents
Index to Financial Statements
charge-offs. The level of the allowance is determined on a quarterly basis, although management is engaged in monitoring the adequacy of the allowance on a more frequent basis. In estimating the allowance balance, the following factors are considered:
| • | past loan experience; |
| • | the nature and volume of the portfolio; |
| • | risks known about specific borrowers; |
| • | underlying estimated values of collateral securing loans; |
| • | current and anticipated economic conditions; and |
| • | other factors which may affect the allowance for probable incurred losses. |
The allowance for loan losses consists of two primary components: (1) a specific component which relates to loans that are individually classified as impaired and (2) a general component which covers non-impaired loans and is based on historical loss experience adjusted for current factors. The historical loss experience is determined by portfolio segment and is based on a combination of the Company’s loss history and loss history from peer group over the past three years. This actual loss experience is supplemented with other economic factors based on the risks present for each portfolio segment.
The following loan portfolio segments have been identified: (1) Construction and land development loans, (2) Commercial real estate loans, (3) Residential real estate, (4) C&I loans, and (5) Consumer and other loans. Management evaluates the risks associated with these segments based upon specific characteristics associated with the loan segments. These risk characteristics include, but are not limited to, the value of the underlying collateral, adverse economic conditions, and the borrower’s cash flow. While the total allowance consists of a specific portion and a general portion, both portions of the allowance are available to provide for probable incurred loan losses in the entire portfolio.
In the table below, the components, as discussed above, of the allowance for loan losses are shown at September 30, 2014 and December 31, 2013.
| September 30, 2014 | December 31, 2013 | increase (decrease) | ||||||||||||||||||||||||||||||||||
| Loan Balance |
ALLL Balance |
% | Loan Balance |
ALLL Balance |
% | Loan Balance |
ALLL Balance |
|||||||||||||||||||||||||||||
| Non impaired loans |
$ | 539,595 | $ | 5,844 | 1.08 | % | $ | 417,402 | $ | 4,352 | 1.04 | % | $ | 122,193 | $ | 1,492 | 4 bps | |||||||||||||||||||
| MidSouth loans (note 1) |
174,871 | — | — | — | — | — | 174,871 | — | — | |||||||||||||||||||||||||||
| Impaired loans |
894 | 39 | 4.36 | 4,623 | 548 | 11.85 | (3,729 | ) | (509 | ) | -749 bps | |||||||||||||||||||||||||
|
|
|
|
|
|
|
|
|
|
|
|
|
|
|
|
|
|
|
|||||||||||||||||||
| Non-PCI loans |
715,360 | 5,883 | 0.82 | 422,025 | 4,900 | 1.16 | 293,335 | 983 | -34 bps | |||||||||||||||||||||||||||
| PCI loans |
4,788 | — | — | — | 4,788 | — | — | |||||||||||||||||||||||||||||
|
|
|
|
|
|
|
|
|
|
|
|
|
|
|
|
|
|
|
|||||||||||||||||||
| Total loans |
$ | 720,148 | $ | 5,883 | 0.82 | %* | $ | 422,025 | $ | 4,900 | 1.16 | % | $ | 298,123 | $ | 983 | -34 bps | |||||||||||||||||||
| * | The significant decrease in this ratio compared to the prior period end is primarily due to the addition of the MidSouth loans, since the MidSouth loans were purchased at discounts. |
| note 1: | Loans acquired pursuant to the July 1, 2014 acquisition of MidSouth that are not PCI loans. These are performing loans recorded at estimated fair value at the acquisition date. The fair value adjustment at the acquisition date was approximately $7,347, or approximately 3.8% of the outstanding aggregate loan |
60
Table of Contents
Index to Financial Statements
| balances acquired. This amount is accreted into interest income over the remaining lives of the related loans on a level yield basis. Because these loans were recorded at estimated fair value on July 1, 2014, no allowance for loan loss was recorded at September 30, 2014 related to the acquired loans. |
At September 30, 2014, the allowance for loan losses was $5,883, compared to $4,900 at December 31, 2013. The allowance for loan losses as a percentage of total loans was 0.82% and 1.16% at September 30, 2014 and December 31, 2013, respectively. Loan growth during this period is the primary reason for the increase in the allowance amount. The decrease in the allowance for loan losses as a percentage of total loans is due to the required accounting for bank mergers and acquisitions which requires banks to use purchase accounting and to record transactions at fair value. Therefore, the loans acquired through the acquisition of MidSouth have been evaluated and a fair value adjustment was recorded. A portion of the fair value adjustment included a credit valuation allowance and any additional loan loss reserve needed for these loans was included in the fair value adjustment.
The table below sets forth the activity in the allowance for loan losses for the periods presented.
| Nine Months Ended September 30, 2014 |
Nine Months Ended September 30, 2013 |
|||||||
| Beginning balance |
$ | 4,900 | $ | 3,983 | ||||
| Loans charged-off: |
||||||||
| Residential real estate |
11 | (107 | ) | |||||
| Construction & land development |
— | — | ||||||
| Commercial real estate |
540 | — | ||||||
| Commercial & industrial |
4 | — | ||||||
| Consumer |
— | — | ||||||
|
|
|
|
|
|||||
| Total loans charged-off |
555 | (107 | ) | |||||
| Recoveries on loans previously charged-off: |
||||||||
| Residential real estate |
49 | 99 | ||||||
| Construction & land development |
— | — | ||||||
| Commercial real estate |
— | — | ||||||
| Commercial & industrial |
— | — | ||||||
| Consumer |
— | — | ||||||
|
|
|
|
|
|||||
| Total loan recoveries |
49 | 99 | ||||||
| Net recoveries (charge-offs) |
(506 | ) | (8 | ) | ||||
| Provision for loan losses charged to expense |
1,489 | 457 | ||||||
|
|
|
|
|
|||||
| Total allowance at end of period |
$ | 5,883 | $ | 4,432 | ||||
|
|
|
|
|
|||||
| Total loans, gross, at end of period(1) |
$ | 720,148 | $ | 378,622 | ||||
|
|
|
|
|
|||||
| Average gross loans(1) |
$ | 541,105 | $ | 326,150 | ||||
|
|
|
|
|
|||||
| Allowance to total loans |
0.82 | % | 1.17 | % | ||||
|
|
|
|
|
|||||
| Net charge-offs (recoveries) to average loans, annualized |
0.13 | % | 0.00 | % | ||||
|
|
|
|
|
|||||
| (1) | Loan balances exclude loans held for sale |
61
Table of Contents
Index to Financial Statements
While no portion of the allowance is in any way restricted to any individual loan or group of loans, and the entire allowance is available to absorb losses from any and all loans, the following table summarizes the allocation of allowance for loan losses by loan category and loans in each category as a percentage of total loans, for the periods presented.
| September 30, 2014 | December 31, 2013 | |||||||||||||||||||||||
| Amount | % of Allowance to Total |
% of Loan Type to Total Loans |
Amount | % of Allowance to Total |
% of loan Type to Total Loans |
|||||||||||||||||||
| Real estate loans: |
||||||||||||||||||||||||
| Residential |
$ | 1,744 | 29.7 | % | 28.1 | % | $ | 1,402 | 28.6 | % | 32.8 | % | ||||||||||||
| Construction and land development |
2,141 | 36.4 | 29.7 | 1,497 | 30.5 | 26.9 | ||||||||||||||||||
| Commercial |
1,373 | 23.3 | 31.4 | 1,566 | 32.0 | 29.7 | ||||||||||||||||||
|
|
|
|
|
|
|
|
|
|
|
|
|
|||||||||||||
| Total real estate |
5,258 | 89.4 | 89.2 | 4,465 | 91.1 | 89.4 | ||||||||||||||||||
| Commercial and industrial |
576 | 9.8 | 9.8 | 337 | 6.9 | 8.6 | ||||||||||||||||||
| Consumer and other |
49 | 0.8 | 1.0 | 98 | 2.0 | 2.0 | ||||||||||||||||||
|
|
|
|
|
|
|
|
|
|
|
|
|
|||||||||||||
| Totals |
$ | 5,883 | 100.0 | % | 100.0 | % | $ | 4,900 | 100.0 | % | 100.0 | % | ||||||||||||
|
|
|
|
|
|
|
|
|
|
|
|
|
|||||||||||||
Non-performing Assets
Non-performing loans consist of non-accrual loans and loans that are past due 90 days or more and still accruing interest. NPAs consist of non-performing loans plus OREO (i.e., real estate acquired through foreclosure or deed in lieu of foreclosure). Loans are placed on non-accrual status when they are past due 90 days and management believes the borrower’s financial condition, after giving consideration to economic conditions and collection efforts, is such that collection of interest is doubtful. When a loan is placed on non-accrual status, interest accruals cease and uncollected interest is reversed and charged against current income. The interest on these loans is accounted for on the cash-basis, or cost-recovery method, until qualifying for return to accrual. Loans are returned to accrual status when all the principal and interest amounts contractually due are brought current and future payments are reasonably assured.
The primary component of non-performing loans is non-accrual loans, which as of September 30, 2014 totaled $2,904. The other component of non-performing loans are loans past due greater than 90 days and still accruing interest. Loans past due greater than 90 days are placed on non-accrual status unless they are both well-secured and in the process of collection. There were outstanding loans totaling $452 that were past due 90 days or more and still accruing interest at September 30, 2014.
The table below summarizes non-performing loans and assets for the periods presented.
| September 30, 2014 |
December 31, 2013 |
|||||||
| Non-accrual loans |
$ | 2,904 | $ | 2,601 | ||||
| Past due loans 90 days or more and still accruing interest |
452 | — | ||||||
|
|
|
|
|
|||||
| Total non-performing loans |
3,356 | 2,601 | ||||||
| Foreclosed real estate OREO |
1,690 | 181 | ||||||
|
|
|
|
|
|||||
| Total non-performing assets |
5,046 | 2,782 | ||||||
| Total non-performing loans as a percentage of total loans |
0.5 | % | 0.6 | % | ||||
| Total non-performing assets as a percentage of total assets |
0.4 | 0.3 | ||||||
| Allowance for loan losses as a percentage of non-performing loans |
175 | 188 | ||||||
62
Table of Contents
Index to Financial Statements
As of September 30, 2014, there were 21 loans on non-accrual status. The amount and number are further delineated by collateral category and number of loans in the table below.
| Total Amount | Percentage of Total Non-Accrual Loans |
Number of Non-Accrual Loans |
||||||||||
| Residential real estate |
$ | 379 | 13.1 | % | 8 | |||||||
| Construction & land development |
78 | 2.7 | 1 | |||||||||
| Commercial real estate |
2,160 | 74.4 | 7 | |||||||||
| Commercial & industrial |
287 | 9.8 | 5 | |||||||||
| Consumer |
— | — | — | |||||||||
|
|
|
|
|
|
|
|||||||
| Total non-accrual loans |
$ | 2,904 | 100.0 | % | 21 | |||||||
|
|
|
|
|
|
|
|||||||
Investment Securities and Other Earning Assets
The investment securities portfolio is intended to provide the Company with adequate liquidity, flexible asset/liability management and a source of stable income. The portfolio is structured with minimal credit exposure to the Company and consists of both securities classified as available-for-sale and securities classified as held-to-maturity. All available-for sale securities are carried at fair value and may be used for liquidity purposes should management deem it to be in the Company’s best interest. Securities available-for-sale, consisting primarily of U.S. government sponsored enterprises and mortgage-backed securities, were $346,750 at September 30, 2014, compared to $268,515 at December 31, 2013, an increase of $78,485 or 29.2%. The increase in available-for-sale securities was primarily attributed to the third quarter acquisition of MidSouth.
The held-to-maturity securities are carried at amortized cost. This portfolio, consisting of U.S. government sponsored enterprises, mortgage-backed securities and municipal securities, totaled $56,293 at September 30, 2014, compared to $56,575 at December 31, 2013, a decrease of $282 or 0.5%.
The combined portfolios represented 32.6% and 40.8% of total assets at September 30, 2014, and December 31, 2013, respectively. At September 30, 2014, the Company had no securities that were classified as having Other Than Temporary Impairment.
The Company also had other investments of $5,349 and $3,032 at September 30, 2014, and December 31, 2013, respectively, consisting of capital stock in the Federal Reserve and the FHLB (required as members of the Federal Reserve Bank System and the FHLB System). The FHLB and Federal Reserve investments are “restricted” in that they can only be sold back to the respective institutions or another member institution at par, and are thus, not liquid, have no ready market or quoted market value, and are carried at cost.
Bank Premises and Equipment
Bank premises and equipment totaled $13,113 at September 30, 2014 compared to $4,138 at December 31, 2013, an increase of $8,975 or 216.9%. This increase was primarily the result of the acquisition of MidSouth, which included six buildings, along with all the related furniture and equipment. Also contributing to the increase were leasehold improvements and furniture purchases related to an addition to the Company’s main office in downtown Franklin, Tennessee and the relocation of one branch in the second quarter of 2014 and another branch in the third quarter of 2014, which includes the build-out and furnishing of these newly leased offices.
Deposits
Deposits represent the Company’s largest source of funds. The Company competes with other bank and nonbank institutions for deposits, as well as with a growing number of non-deposit investment alternatives
63
Table of Contents
Index to Financial Statements
available to depositors, such as mutual funds, money market funds, annuities, and other brokerage investment products. Challenges to deposit growth include price changes on deposit products given movements in the rate environment and other competitive pricing pressures, and customer preferences regarding higher-costing deposit products or non-deposit investment alternatives.
At September 30, 2014, total deposits were $1,051,558, an increase of $370,258, or 54.3%, compared to $681,300 at December 31, 2013. Most of the growth in deposits is attributable to the acquisition of MidSouth, which added $244,415 to total deposits. Included in the Company’s funding strategy are brokered deposits. Total brokered deposits increased from $40,401 at December 31, 2013 to $74,628 at September 30, 2014, primarily due to the brokered deposits that were added in the acquisition of MidSouth. Time deposits excluding brokered deposits as of September 30, 2014, amounted to $191,867, compared to $257,637 as of December 31, 2013.
The following table shows time deposits in denominations of $100 or more by category based on time remaining until maturity.
Maturity of non-brokered time deposits of $100 or more
| September 30, 2014 | ||||
| Three months or less |
$ | 23,204 | ||
| Three through six months |
8,606 | |||
| Six through twelve months |
53,022 | |||
| Over twelve months |
59,497 | |||
|
|
|
|||
| Total |
$ | 144,329 | ||
|
|
|
|||
Federal Funds Purchased and Repurchase Agreements
As of September 30, 2014, the Company had federal funds purchased from correspondent banks totaling $10,159 compared to $20,825 outstanding as of December 31, 2013. Securities sold under agreements to repurchase had an outstanding balance of $24,079 as of September 30, 2014, compared to $3,466 as of December 31, 2013. Securities sold under agreements to repurchase are financing arrangements that mature daily. At maturity, the securities underlying the agreements are returned to the Company.
FHLB Advances
The Company has established a line of credit with the Federal Home Bank of Cincinnati which is secured by a blanket pledge of 1-4 family residential mortgages. At September 30, 2014, advances totaled $33,000 compared to $23,000 as of December 31, 2013.
At September 30, 2014, the scheduled maturities of these and advances and interest rates were as follows:
| Scheduled Maturities |
Amount | Weighted Average Rates |
||||||
| 2014 |
$ | 14,000 | 0.48 | % | ||||
| 2015 |
2,000 | 0.70 | ||||||
| 2017 |
10,000 | 1.27 | ||||||
| 2018 |
7,000 | 1.61 | ||||||
|
|
|
|
|
|||||
| Total |
$ | 33,000 | 0.97 | % | ||||
|
|
|
|
|
|||||
64
Table of Contents
Index to Financial Statements
Comparison of Results of Operations for the Years Ended December 31, 2013 and 2012
Net Income
We reported $4,561 in net income for the year ended December 31, 2013, compared to $4,140 for the year ended December 31, 2012. After the payment of preferred dividends on the senior preferred stock issued to the Treasury pursuant to the SBLF, our net earnings available to common shareholders for the year ended December 31, 2013 was $4,452 compared to $3,682 the similar period in 2012. The primary reason for the increase in net earnings available to common shareholders for the year was increased interest income on loans offset somewhat by an increase in salaries expense. The increase in interest income is reflective of the loan growth experienced by the bank during these periods. This and other factors contributing to our earnings results for the periods indicated are discussed below.
Net Interest Income/Margin
Net interest income consists of interest income generated by earning assets, less interest expense.
Comparison of net interest income for the years ended December 31, 2013 and 2012
Net interest income increased $5,089, or 31.9% to $21,045 during the year ended December 31, 2013 compared to $15,956 for the same period in 2012. The increase was the result of a $4,978 increase in interest income, primarily from interest on loans as a result of loan growth, combined with a $111 decrease in interest expense due to a decrease the cost of funds.
Interest-earning assets averaged $616,716 during the year ended December 31, 2013 as compared to $503,215 for the same period in 2012, an increase of $113,501, or 22.6%. This increase was due primarily to average loan growth between the periods of 28.9%. The yield on average interest-earning assets increased 7 basis points to 4.05% during the year ended December 31, 2013 compared to 3.98% for the same period in 2012. A decrease in the yield on average loans between these periods was offset by an increase in the yield on average securities available for sale and by an increase in the higher yielding loan portfolio as a percentage of total interest-earning assets during the year. The effect of the $113,501 increase in average interest-earning assets offset by declining yields on loans resulted in the $4,978 increase in interest income between the two years.
Interest-bearing liabilities averaged $525,906 during the year ended December 31, 2013 as compared to $425,786 for the same period in 2012, an increase of $100,120, or 23.5%. Total average interest-bearing deposits grew $78,462, including an $8,136 increase in average brokered CDs outstanding. Rapid growth in the loan portfolio also resulted in an increase in average FHLB advances of $9,565 and average Federal funds purchased of $12,093. The cost of average interest-bearing liabilities decreased 20 bps to 0.75% during the year ended December 31, 2013, compared to 0.95% for 2012. This favorable decline was primarily due to decreases in the rates paid on money market accounts and time deposits, including a 25 bps decrease on the average yield on brokered CDs. The effect of the $100,120 increase in average interest-bearing liabilities offset by the 20 bps decrease in cost of average interest-bearing liabilities resulted in the $111 decrease in interest expense between the two years.
Comparison of net interest income for the years ended December 31, 2012 and 2011
Net interest income increased $3,820, or 31.5% to $15,956 during the year ended December 31, 2012 compared to $12,136 for the same period in 2011. The increase was the result of a $3,912 increase in interest income, primarily from interest on loans, offset by a $92 increase in interest expense.
Interest-earning assets averaged $503,215 during the year ended December 31, 2012 as compared to $361,587 for the same period in 2011, an increase of $141,628, or 39.2%. This increase was due primarily to
65
Table of Contents
Index to Financial Statements
average loan growth during 2012 of 32.2% and an increase in the average investment securities portfolio of 49.2%. The yield on average interest-earning assets decreased 47 bps to 3.98% during the year ended December 31, 2012 compared to 4.45% for the same period in 2011. A 15 bps increase in the yield on loans was the result of growth of more than 50% in both real estate construction loans and commercial loans in 2012 combined with increasing yields on these portfolios due, in part, to shorter maturities and faster recognition of origination fee income. This 15 bps increase was, however, more than offset by a 116 bps decrease in the yield on the total investment securities portfolio. The effect of the $141,628 increase in average interest-earning assets offset somewhat by the 47 bps decrease in yields on average interest-earning assets resulted in the $3,912 increase in interest income between the two years.
Interest-bearing liabilities averaged $425,786 during the year ended December 31, 2012 as compared to $309,556 for the same period in 2011, an increase of $116,230, or 37.5%. Growth in total average interest-bearing deposits of $107,975 accounts for most of this increase. The cost of average interest-bearing liabilities decreased 33 bps to 0.95% during the year ended December 31, 2012, compared to 1.28% for 2011. This favorable decline was primarily due to decreases in the rates paid on money market accounts and time deposits. The effect of the $116,230 increase in average interest-bearing liabilities offset somewhat by the 33 bps decrease in cost of average interest-bearing liabilities resulted in the $92 increase in interest expense between the two years.
See the tables “Average Balances—Yields & Rates,” and “Analysis of Changes in Interest Income and Expenses” below.
Average Balances (7)—Yields & Rates
(dollars are in thousands)
| Years Ended December 31, | ||||||||||||||||||||||||||||||||||||
| 2013 | 2012 | 2011 | ||||||||||||||||||||||||||||||||||
| Average Balance |
Interest Inc / Exp |
Average Yield/Rate |
Average Balance |
Interest Inc / Exp |
Average Yield/Rate |
Average Balance |
Interest Inc /Exp |
Average Yield/Rate |
||||||||||||||||||||||||||||
| ASSETS: |
||||||||||||||||||||||||||||||||||||
| Loans(1) |
$ | 354,248 | $ | 20,094 | 5.67 | % | $ | 274,815 | $ | 16,262 | 5.92 | % | $ | 207,936 | $ | 12,001 | 5.77 | % | ||||||||||||||||||
| Securities available for sale(6) |
199,072 | 3,558 | 1.79 | 186,361 | 3,092 | 1.66 | 127,423 | 3,696 | 2.90 | |||||||||||||||||||||||||||
| Securities held to maturity |
44,666 | 1,164 | 2.61 | 15,658 | 480 | 3.07 | 7,953 | 277 | 3.48 | |||||||||||||||||||||||||||
| Federal funds sold and other(2) |
18,730 | 166 | 0.89 | 26,381 | 170 | 0.64 | 18,275 | 118 | 0.65 | |||||||||||||||||||||||||||
|
|
|
|
|
|
|
|
|
|
|
|
|
|
|
|
|
|
|
|||||||||||||||||||
| TOTAL INTEREST-EARNING ASSETS |
$ | 616,716 | $ | 24,982 | 4.05 | % | $ | 503,215 | $ | 20,004 | 3.98 | % | $ | 361,587 | $ | 16,092 | 4.45 | % | ||||||||||||||||||
| Allowance for loan losses |
(4,277 | ) | (3,426 | ) | (3,217 | ) | ||||||||||||||||||||||||||||||
| All other assets |
24,737 | 17,302 | 12,810 | |||||||||||||||||||||||||||||||||
|
|
|
|
|
|
|
|||||||||||||||||||||||||||||||
| TOTAL ASSETS |
$ | 637,176 | $ | 517,091 | $ | 371,180 | ||||||||||||||||||||||||||||||
| LIABILITIES & SHAREHOLDERS’ EQUITY |
||||||||||||||||||||||||||||||||||||
| Deposits: |
||||||||||||||||||||||||||||||||||||
| Interest checking |
$ | 111,507 | $ | 350 | 0.31 | % | $ | 87,972 | $ | 299 | 0.34 | % | $ | 59,961 | $ | 230 | 0.38 | % | ||||||||||||||||||
| Money market |
215,257 | 1,718 | 0.80 | 190,731 | 1,935 | 1.01 | 112,349 | 1,390 | 1.24 | |||||||||||||||||||||||||||
| Savings |
13,651 | 68 | 0.50 | 8,993 | 58 | 0.64 | 6,221 | 53 | 0.85 | |||||||||||||||||||||||||||
| Time deposits |
148,434 | 1,557 | 1.05 | 122,691 | 1,625 | 1.32 | 123,881 | 2,192 | 1.77 | |||||||||||||||||||||||||||
| FHLB advances |
19,479 | 100 | 0.51 | 9,914 | 88 | 0.89 | 3,212 | 58 | 1.81 | |||||||||||||||||||||||||||
| Federal funds purchased and other(3) |
17,578 | 144 | 0.82 | 5,485 | 43 | 0.78 | 3,932 | 33 | 0.84 | |||||||||||||||||||||||||||
|
|
|
|
|
|
|
|
|
|
|
|
|
|
|
|
|
|
|
|||||||||||||||||||
| TOTAL INTEREST-BEARING LIABILITIES |
$ | 525,906 | $ | 3,937 | 0.75 | % | $ | 425,786 | $ | 4,048 | 0.95 | % | $ | 309,556 | $ | 3,956 | 1.28 | % | ||||||||||||||||||
| Demand deposits |
53,867 | 39,746 | 22,179 | |||||||||||||||||||||||||||||||||
| Other liabilities |
2,048 | 2,019 | 1,308 | |||||||||||||||||||||||||||||||||
| Total shareholders’ equity |
55,355 | 49,540 | 38,137 | |||||||||||||||||||||||||||||||||
|
|
|
|
|
|
|
|||||||||||||||||||||||||||||||
| TOTAL LIABILITIES AND SHAREHOLDERS’ EQUITY |
$ | 637,176 | $ | 517,091 | $ | 371,180 | ||||||||||||||||||||||||||||||
| NET INTEREST SPREAD(4) |
3.30 | % | 3.02 | % | 3.17 | % | ||||||||||||||||||||||||||||||
| NET INTEREST INCOME |
$ | 21,045 | $ | 15,956 | $ | 12,136 | ||||||||||||||||||||||||||||||
| NET INTEREST MARGIN(5) |
3.41 | % | 3.17 | % | 3.36 | % | ||||||||||||||||||||||||||||||
66
Table of Contents
Index to Financial Statements
| (1) | Loan balances include both loans held in the Bank’s portfolio and mortgage loans held for sale and are net of deferred origination fees and costs. Non-accrual loans are included in total loan balances. |
| (2) | Includes Federal Funds sold, capital stock in the Federal Reserve Bank and FHLB, and interest-bearing deposits at the Federal Reserve Bank. |
| (3) | Includes repurchase agreements. |
| (4) | Represents the average rate earned on interest-earning assets minus the average rate paid on interest-bearing liabilities. |
| (5) | Represents net interest income (annualized) divided by total average earning assets. |
| (6) | Interest income and rates exclude the effects of a tax equivalent adjustment to adjust tax exempt investment income on tax exempt investment securities to a fully taxable basis due to immateriality. |
| (7) | Average balances are average daily balances. |
The tables below detail the components of the changes in net interest income for the periods indicated. For each major category of interest-earning assets and interest-bearing liabilities, information is provided with respect to changes due to average volume and changes due to rates, with the changes in both volumes and rates allocated to these two categories based on the proportionate absolute changes in each category.
Analysis of Changes in Interest Income and Expenses
| Net change years ended December 31, 2013 versus December 31, 2012 |
||||||||||||
| Volume | Rate | Net Change | ||||||||||
| INTEREST INCOME |
||||||||||||
| Loans |
$ | 4,700 | $ | (868 | ) | $ | 3,832 | |||||
| Securities available for sale |
211 | 255 | 466 | |||||||||
| Securities held to maturity |
889 | (205 | ) | 684 | ||||||||
| Federal funds sold and other |
(49 | ) | 45 | (4 | ) | |||||||
|
|
|
|
|
|
|
|||||||
| TOTAL INTEREST INCOME |
$ | 5,751 | $ | (773 | ) | $ | 4,978 | |||||
|
|
|
|
|
|
|
|||||||
| INTEREST EXPENSE |
||||||||||||
| Deposits |
||||||||||||
| Interest checking |
$ | 80 | $ | (29 | ) | $ | 51 | |||||
| Money market accounts |
249 | (466 | ) | (217 | ) | |||||||
| Savings |
30 | (20 | ) | 10 | ||||||||
| Time deposits |
341 | (409 | ) | (68 | ) | |||||||
| FHLB advances |
85 | (73 | ) | 12 | ||||||||
| Other borrowed funds |
95 | 6 | 101 | |||||||||
|
|
|
|
|
|
|
|||||||
| TOTAL INTEREST EXPENSE |
$ | 880 | $ | (991 | ) | $ | (111 | ) | ||||
|
|
|
|
|
|
|
|||||||
| NET INTEREST INCOME |
$ | 4,871 | $ | 218 | $ | 5,089 | ||||||
|
|
|
|
|
|
|
|||||||
67
Table of Contents
Index to Financial Statements
| Net change years ended December 31, 2012 versus December 31, 2011 |
||||||||||||
| Volume | Rate | Net Change | ||||||||||
| INTEREST INCOME |
||||||||||||
| Loans |
$ | 3,860 | $ | 401 | $ | 4,261 | ||||||
| Securities available for sale |
1,710 | (2,314 | ) | (604 | ) | |||||||
| Securities held to maturity |
268 | (65 | ) | 203 | ||||||||
| Federal funds sold and other |
52 | — | 52 | |||||||||
|
|
|
|
|
|
|
|||||||
| TOTAL INTEREST INCOME |
$ | 5,890 | $ | (1,978 | ) | $ | 3,912 | |||||
|
|
|
|
|
|
|
|||||||
| INTEREST EXPENSE |
||||||||||||
| Deposits |
||||||||||||
| Interest checking |
$ | 107 | $ | (38 | ) | $ | 69 | |||||
| Money market accounts |
970 | (425 | ) | 545 | ||||||||
| Savings |
24 | (19 | ) | 5 | ||||||||
| Time deposits |
(21 | ) | (546 | ) | (567 | ) | ||||||
| FHLB advances |
121 | (91 | ) | 30 | ||||||||
| Other borrowed funds |
13 | (3 | ) | 10 | ||||||||
|
|
|
|
|
|
|
|||||||
| TOTAL INTEREST EXPENSE |
$ | 1,214 | $ | (1,122 | ) | $ | 92 | |||||
|
|
|
|
|
|
|
|||||||
| NET INTEREST INCOME |
$ | 4,676 | $ | (856 | ) | $ | 3,820 | |||||
|
|
|
|
|
|
|
|||||||
Provision for Loan Losses
The provision for loan losses represents a charge to earnings necessary to establish an allowance for loan losses that, in our management’s evaluation, should be adequate to provide coverage for probable losses incurred in the loan portfolio. The allowance is increased by the provision for loan losses and is decreased by charge-offs, net of recoveries on prior loan charge-offs.
The provision for loan losses was $907 and $1,548 for the years ended December 31, 2013 and 2012, respectively. The lower provision in 2013 compared to 2012 is due primarily to fewer charge-offs combined with recoveries received on previously charged-off residential real estate loans that resulted in net recoveries in 2013 of $10 compared to net charge-offs of $978 in 2012, primarily from $575 in charge-offs on commercial real estate loans and $443 on residential real estate loans. A slight decrease in the general reserves as a percentage of total loans resulting from improving economic conditions has also contributed to the lower provision. Nonperforming loans at December 31, 2013, totaled $2,601 compared to $2,677 at December 31, 2012, representing 0.6% and 0.9% of total loans, respectively. Total loans past due more than 30 days were $4,831 at December 31, 2013 and $2,638 at December 31, 2012.
68
Table of Contents
Index to Financial Statements
Non-Interest Income
Our non-interest income is composed of several components, some of which vary significantly between annual periods. The following is our non-interest income for the years ended December 31, 2013 and 2012 (in thousands):
| Years ending December 31, |
$ Increase (decrease) |
% Increase (decrease) |
||||||||||||||
| 2013 | 2012 | |||||||||||||||
| Service charges on deposit accounts |
$ | 52 | $ | 48 | $ | 4 | 8.3 | % | ||||||||
| Other service charges and fees |
1,112 | 987 | 125 | 12.7 | ||||||||||||
| Net gains on sale of loans |
4,403 | 5,550 | (1,147 | ) | (20.7 | ) | ||||||||||
| Loan servicing fees, net |
(365 | ) | (736 | ) | 371 | (50.4 | ) | |||||||||
| Gain on bank owned life insurance |
— | 606 | (606 | ) | (100.0 | ) | ||||||||||
| Gain on sale of investment securities, net |
88 | 991 | (903 | ) | (91.1 | ) | ||||||||||
| Investment services |
358 | 408 | (50 | ) | (12.3 | ) | ||||||||||
| Compliance consulting fees |
641 | 513 | 128 | 25.0 | ||||||||||||
| Other |
530 | 278 | 252 | 90.6 | ||||||||||||
|
|
|
|
|
|
|
|
|
|||||||||
| Total non-interest income |
$ | 6,819 | $ | 8,645 | $ | (1,826 | ) | (21.1 | %) | |||||||
|
|
|
|
|
|
|
|
|
|||||||||
Other service charges and fees for the year ending December 31, 2013, were $1,112, an increase of $125, or 12.7% over the same period in 2012. This increase was due primarily to an increase in ATM fee income as well as an increase in insufficient fund charges.
Net gains on the sale of loans include net gains realized from the sales of mortgage loans and SBA loans. Net gains on the sale of mortgage loans are based, in part, on differences between the carrying value of loans being sold to third-party investors and the selling price. Also included are changes in the fair value of mortgage banking derivatives entered into by the Company to hedge the change in interest rates on loan commitments prior to their sale in the secondary market. Fluctuations in mortgage interest rates, changes in the demand for certain loans by investors, and whether servicing rights associated with the loans being sold are retained or released all affect the net gains on mortgage loan sales. In 2011, the Company made a strategic decision to begin originating SBA loans and subsequently selling the government-guaranteed portions of these loans to a third-party investor. The net gains for the year ending December 31, 2013, were $4,403, a decrease of $1,147, or 20.7% from the same period in 2012. The decrease was primarily due to unfavorable changes in the fair value of the mortgage banking derivatives and smaller differences between the carrying value of the loans sold and the selling price. Residential refinancing activity that began to surge during the second half of 2011 in response to historically low interest rates remained significant throughout 2012 and into 2013. Refinancing activity decreased significantly in the second half of 2013. Gains from the sale of SBA loans increased during 2013 to $279, an increase of 42.3% from $196 for the same period during 2012. The volume of sold government guaranteed portions of SBA loans increased to $3,429 in 2013 from $2,163 in 2012, an increase of 58.5%.
Investment services income includes commissions and fees earned from the sale of investment securities to correspondent banks. These commissions have provided steady income to the Company for the periods presented, totaling $358 and $408 for the years-ended December 31, 2013 and 2012, respectively. The decrease during 2013 can be attributed to a slowdown in bond trading caused by uncertainty regarding the future of the Federal Reserve’s quantitative easing program in addition to an increase in loan demand at financial institutions.
Loan servicing fees are fees earned for servicing residential mortgages and SBA loans offset by the amortization of mortgage servicing rights. These mortgage servicing rights are initially recorded at fair value and then amortized in proportion to, and over the period of, the estimated life of the underlying loans. In addition, impairment to the mortgage servicing rights may be recognized through a valuation allowance, and adjustments
69
Table of Contents
Index to Financial Statements
to the allowance can affect the net loan servicing fees. The amortization of mortgage servicing rights has exceeded the servicing fees earned during each of the periods presented due the relatively young age of the mortgage portfolio being serviced. For the year ending December 31, 2013, net loan servicing fees were ($365) compared to ($736) for the year ending December 31, 2012, and included a reversal of a $90 impairment that had been recorded during the same period in 2012.
Sales of available-for-sale securities for the year ending December 31, 2013, of $16,290 resulted in net gains of $88. Sales during the years ended December 31, 2012 of $48,995, resulted in net gains of $991.
Compliance consulting fees were from activities engaged by Banc Compliance Group. These fees were consulting fees paid by banking institutions unaffiliated with the Corporation for the services provided by Banc Compliance Group. A growing client base has contributed to the growth in these fees during the periods presented.
Additionally, a gain on bank-owned life insurance added $606 to non-interest income in 2012 due to the payout of a policy subsequent to the death of a valued member of the Company’s executive management team.
Non-interest Expense
The following is our non-interest expense for the years ended December 31, 2013 and 2012 (in thousands):
| Years ending December 31, |
$ Increase (decrease) |
% Increase (decrease) |
||||||||||||||
| 2013 | 2012 | |||||||||||||||
| Salaries and employee benefits |
$ | 13,142 | $ | 11,020 | $ | 2,122 | 19.3 | % | ||||||||
| Occupancy and equipment |
2,731 | 2,496 | 235 | 9.4 | ||||||||||||
| FDIC assessment expense |
354 | 441 | (87 | ) | (19.7 | ) | ||||||||||
| Loss on sale and write-down of foreclosed assets |
223 | 44 | 179 | 406.8 | ||||||||||||
| Marketing |
283 | 231 | 52 | 22.5 | ||||||||||||
| Professional fees |
596 | 380 | 216 | 56.8 | ||||||||||||
| Other |
2,333 | 2,245 | 88 | 3.9 | ||||||||||||
|
|
|
|
|
|
|
|
|
|||||||||
| Total non-interest expense |
$ | 19,662 | $ | 16,857 | $ | 2,805 | 16.6 | % | ||||||||
|
|
|
|
|
|
|
|
|
|||||||||
As shown in the tables above, non-interest expense has increased each period and is indicative of the Company’s overall growth during this time. The primary increases have been in salaries and occupancy, as the bank has added two branches and a loan production office during these periods and increased staffing from 98 full-time equivalent employees as of December 31, 2012, to 123 as of December 31, 2013. The increased staffing is due not only to the new branch locations but also to additional operational staff needed to handle the growth in loans and deposits.
FDIC assessment expense was $354 for the year ended December 31, 2013, a decrease of $87, or 19.7%, from the same period in 2012. This expense has decreased over time due to lower FDIC insurance premiums resulting from favorable trends in our capital levels and supervisory evaluations.
Loss on sale and write-down of foreclosed assets consists of gains or losses on the sale of OREO properties and other foreclosed assets and valuation adjustments against the carrying costs of foreclosed assets. For the year ended December 31, 2013, these expenses were $223 compared to $44 for the year ended December 31, 2012. This increase was primarily due to a valuation adjustment of $190 on one OREO property.
70
Table of Contents
Index to Financial Statements
The increase in professional fees during 2013 is due primarily to fees associated with the “Agreement and Plan of Reorganization and Bank Merger” with MidSouth. These costs totaled $175 during 2013 and included consulting fees with the Company’s financial advisor, various legal fees associated with the letter of intent, definitive agreement and merger application, as well as fees for due diligence and valuation services.
A large component of other non-interest expenses is costs related to maintaining the deposit, mortgage loan and other loan portfolios. Specifically, deposit related expenses include costs associated with ATMs, Internet banking and remote deposit processing. Mortgage loan expenses include vendor service fees, investor transaction fees and credit report fees. Expenses associated with other loans include appraisal, legal and credit report fees. Each of these categories of expenses increased during the periods presented due to growth in the deposit and loan portfolios.
Income Tax Expense
We recognized an income tax expense for the year ended December 31, 2013, of $2,734 representing an effective tax rate of 37.5%. Income tax expense for years ended December 31, 2012 was $2,056, an effective tax rate of 33.2%.
Comparison of Balance Sheets at December 31, 2013 and 2012
Overview
Our total assets increased by $112,639, or 24.2%, from December 31, 2011 to December 31, 2012 and by $218,612, or 37.8%, from that date to December 31, 2013. The increase in our total assets has primarily been the result of growth in the loan portfolio. In addition, a portion of the proceeds from a private placement stock offering in September, 2013, was used to increase capital at the Bank and to support continued earnings growth at the Bank through purchases of investment securities and the funding of loans.
Loans
Lending-related income is the most important component of our net interest income and is a major contributor to profitability. The loan portfolio is the largest component of earning assets, and it therefore generates the largest portion of revenues. The absolute volume of loans and the volume of loans as a percentage of earning assets is an important determinant of net interest margin as loans are expected to produce higher yields than securities and other earning assets. Total loans, net of deferred fees, at December 31, 2013 and 2012, were $421,304 and $299,483, respectively, an increase of $121,821, or 40.7%. This growth in the Bank’s loan portfolio is due to increased market penetration and a healthy local economy that was not greatly impacted by the recent recession. We have also been adding experienced lending officers to our staff and intend to continue doing so to maintain this loan growth.
71
Table of Contents
Index to Financial Statements
The table below provides a summary of the loan portfolio composition for the periods noted.
| Types of Loans |
12/31/13 | 12/31/12 | 12/31/11 | 12/31/10 | 12/31/09 | |||||||||||||||||||||||||||||||||||
| Amount | % of total |
Amount | % of total |
Amount | % of total |
Amount | % of total |
Amount | % of total |
|||||||||||||||||||||||||||||||
| Real estate: |
||||||||||||||||||||||||||||||||||||||||
| Residential |
$ | 138,466 | 32.8 | % | $ | 106,589 | 35.5 | % | $ | 91,896 | 39.9 | % | $ | 91,748 | 47.7 | % | $ | 71,373 | 44.4 | % | ||||||||||||||||||||
| Construction and land development |
113,710 | 26.9 | 83,767 | 27.9 | 49,920 | 21.7 | 39,040 | 20.3 | 31,011 | 19.3 | ||||||||||||||||||||||||||||||
| Commercial |
125,202 | 29.7 | 77,682 | 25.9 | 65,822 | 28.6 | 47,554 | 24.7 | 45,615 | 28.3 | ||||||||||||||||||||||||||||||
| Commercial and Industrial |
36,397 | 8.6 | 20,280 | 6.8 | 14,315 | 6.2 | 11,925 | 6.2 | 11,072 | 6.9 | ||||||||||||||||||||||||||||||
| Consumer and other |
8,250 | 2.0 | 11,758 | 3.9 | 8,132 | 3.6 | 2,156 | 1.1 | 1,833 | 1.1 | ||||||||||||||||||||||||||||||
|
|
|
|
|
|
|
|
|
|
|
|
|
|
|
|
|
|
|
|
|
|||||||||||||||||||||
| Total loans—gross |
422,025 | 100.0 | % | 300,076 | 100.0 | % | 230,085 | 100.0 | % | 192,423 | 100.0 | % | 160,904 | 100.0 | % | |||||||||||||||||||||||||
|
|
|
|
|
|
|
|
|
|
|
|||||||||||||||||||||||||||||||
| Less: deferred loan fees, net |
(721 | ) | (593 | ) | (450 | ) | (286 | ) | (201 | ) | ||||||||||||||||||||||||||||||
| Less: allowance for loan losses |
(4,900 | ) | (3,983 | ) | (3,413 | ) | (3,177 | ) | (2,189 | ) | ||||||||||||||||||||||||||||||
|
|
|
|
|
|
|
|
|
|
|
|||||||||||||||||||||||||||||||
| Total loans, net |
$ | 416,404 | $ | 295,500 | $ | 226,222 | $ | 188,960 | $ | 158,514 | ||||||||||||||||||||||||||||||
|
|
|
|
|
|
|
|
|
|
|
|||||||||||||||||||||||||||||||
Real estate loans comprised 89.4% of the loan portfolio at December 31, 2013. The largest portion (32.8%) of this portfolio as of December 31, 2013, was residential real estate loans which totaled $138,466, up $31,877, or 29.9%, from December 31, 2012. The residential real estate classification primarily includes 1-4 family residential loans which are typically conventional first-lien home mortgages, not including loans held for sale in the secondary market.
Construction and land development loans totaled $113,710 at December 31, 2013, up $29,943, or 35.7%, from December 31, 2012, and comprised 26.9% of the total loan portfolio. Loans in this classification provide financing for the development of commercial income properties, multi-family residential development, and land designated for future development.
Commercial real estate loans totaled $125,202 at December 31, 2013, up $47,520, or 61.2%, from December 31, 2012, and comprised 29.7% of the total loan portfolio. The commercial real estate loan classification primarily includes commercial-based mortgage loans that are secured by nonfarm, nonresidential real estate properties and multi-family residential properties. The growth in this portfolio is due primarily to the addition of new lenders at the bank.
C&I loans have been increasing steadily and comprised 8.6% of total loans at December 31, 2013. The commercial loan classification primarily consists of commercial loans to small businesses as well as commercial leases.
72
Table of Contents
Index to Financial Statements
The repayment of loans is a source of additional liquidity for us. The following table sets forth the loans maturing within specific intervals at December, 2013, excluding unearned net fees and costs.
Loan Maturity Schedule
| December 31, 2013 | ||||||||||||||||
| One year or less | Over one year to five years |
Over five Years | Total | |||||||||||||
| Real estate: |
||||||||||||||||
| Residential |
$ | 18,138 | $ | 67,986 | $ | 52,342 | $ | 138,466 | ||||||||
| Construction and land development |
104,050 | 9,368 | 292 | 113,710 | ||||||||||||
| Commercial |
20,950 | 61,294 | 42,958 | 125,202 | ||||||||||||
| Commercial and Industrial |
16,130 | 13,546 | 6,721 | 36,397 | ||||||||||||
| Consumer and other |
4,158 | 3,764 | 328 | 8,250 | ||||||||||||
|
|
|
|
|
|
|
|
|
|||||||||
| Total |
$ | 163,426 | $ | 155,958 | $ | 102,641 | $ | 422,025 | ||||||||
|
|
|
|
|
|
|
|
|
|||||||||
| Fixed interest rate |
$ | 97,704 | $ | 141,575 | $ | 65,133 | $ | 304,412 | ||||||||
| Variable interest rate |
65,722 | 14,383 | 37,508 | 117,613 | ||||||||||||
|
|
|
|
|
|
|
|
|
|||||||||
| Total |
$ | 163,426 | $ | 155,958 | $ | 102,641 | $ | 422,025 | ||||||||
|
|
|
|
|
|
|
|
|
|||||||||
The information presented in the above table is based upon the contractual maturities of the individual loans, including loans which may be subject to renewal at their contractual maturity. Renewal of such loans is subject to review and credit approval, as well as modification of terms upon their maturity. Consequently, we believe this treatment presents fairly the maturity structure of the loan portfolio.
Allowance for Loan Losses
We maintain an allowance for loan losses that we believe is adequate to absorb the probable incurred losses inherent in our loan portfolio. The allowance is increased by provisions for loan losses charged to earnings and is decreased by loan charge-offs net of recoveries of prior period loan charge-offs. The level of the allowance is determined on a quarterly basis, although management is engaged in monitoring the adequacy of the allowance on a more frequent basis. In estimating the allowance balance, we consider such factors as:
| • | our past loan experience; |
| • | the nature and volume of the portfolio; |
| • | risks known about specific borrowers; |
| • | underlying estimated values of collateral securing loans; |
| • | current and anticipated economic conditions; and, |
| • | other factors which we believe affect the allowance for probable incurred losses. |
The allowance for loan losses consists of two primary components: (1) a specific component which relates to loans that are individually classified as impaired and (2) a general component which covers non-impaired loans and is based on historical loss experience adjusted for current factors. The historical loss experience is determined by portfolio segment and is based on a combination of the Company’s loss history and loss history from peer group over the past three years. This actual loss experience is supplemented with other economic factors based on the risks present for each portfolio segment.
The following loan portfolio segments have been identified: (1) Construction and land development loans, (2) Commercial real estate loans, (3) Residential real estate, (4) C&I loans, and (4) Consumer and other
73
Table of Contents
Index to Financial Statements
loans. We evaluate the risks associated with these segments based upon specific characteristics associated with the loan segments. These risk characteristics include, but are not limited to, the value of the underlying collateral, adverse economic conditions, and the borrower’s cashflow. While the total allowance consists of a specific portion and a general portion, both portions of the allowance are available to provide for probable incurred loan losses in the entire portfolio.
At December 31, 2013, the allowance for loan losses was $4,900, compared to $3,983 at December 31, 2012. The allowance for loan losses as a percentage of total loans was 1.16% and 1.33% at December 31, 2013 and 2012, respectively. Loan growth during these periods is the primary reason for the increases in the allowance amount. The decrease in the ratio for the year ended December 31, 2013, compared to the year ended December 31, 2012, is due to a decrease in the general reserves as a percent of total loans as a result of improving economic conditions.
The table below sets forth the activity in the allowance for loan losses for the periods presented.
Analysis of Changes in Allowance for Loan Losses
| December 31, | ||||||||||||||||||||
| 2013 | 2012 | 2011 | 2010 | 2009 | ||||||||||||||||
| Beginning balance |
$ | 3,983 | $ | 3,413 | $ | 3,177 | $ | 2,189 | $ | 1,136 | ||||||||||
| Loans charged-off: |
||||||||||||||||||||
| Residential real estate |
(107 | ) | (443 | ) | (418 | ) | — | (112 | ) | |||||||||||
| Construction & land development |
— | (25 | ) | — | (280 | ) | (192 | ) | ||||||||||||
| Commercial real estate |
— | (575 | ) | — | — | — | ||||||||||||||
| Commercial & industrial |
(19 | ) | — | (26 | ) | — | (50 | ) | ||||||||||||
| Consumer |
— | (7 | ) | — | — | — | ||||||||||||||
|
|
|
|
|
|
|
|
|
|
|
|||||||||||
| Total loans charged-off |
(126 | ) | (1,050 | ) | (444 | ) | (280 | ) | (354 | ) | ||||||||||
| Recoveries on loans previously charged-off: |
||||||||||||||||||||
| Residential real estate |
136 | 14 | — | — | — | |||||||||||||||
| Construction & land development |
— | 58 | — | — | — | |||||||||||||||
| Commercial real estate |
— | — | — | — | — | |||||||||||||||
| Commercial & industrial |
— | — | — | — | — | |||||||||||||||
| Consumer |
— | — | — | — | — | |||||||||||||||
|
|
|
|
|
|
|
|
|
|
|
|||||||||||
| Total loan recoveries |
136 | 72 | — | — | — | |||||||||||||||
| Net recoveries (charge-offs) |
(10 | ) | (978 | ) | (444 | ) | (280 | ) | (354 | ) | ||||||||||
| Provision for loan losses charged to expense |
907 | 1,548 | 680 | 1,268 | 1,407 | |||||||||||||||
|
|
|
|
|
|
|
|
|
|
|
|||||||||||
| Total allowance at end of period |
$ | 4,900 | $ | 3,983 | $ | 3,413 | $ | 3,177 | $ | 2,189 | ||||||||||
|
|
|
|
|
|
|
|
|
|
|
|||||||||||
| Total loans, gross, at end of period(1) |
$ | 422,025 | $ | 300,076 | $ | 230,085 | $ | 192,423 | $ | 160,904 | ||||||||||
|
|
|
|
|
|
|
|
|
|
|
|||||||||||
| Average gross loans(1) |
$ | 343,924 | $ | 266,469 | $ | 203,997 | $ | 173,535 | $ | 132,718 | ||||||||||
|
|
|
|
|
|
|
|
|
|
|
|||||||||||
| Allowance to total loans |
1.16 | % | 1.33 | % | 1.48 | % | 1.65 | % | 1.36 | % | ||||||||||
|
|
|
|
|
|
|
|
|
|
|
|||||||||||
| Net charge-offs to average loans |
0.00 | % | 0.37 | % | 0.22 | % | 0.16 | % | 0.27 | % | ||||||||||
|
|
|
|
|
|
|
|
|
|
|
|||||||||||
| (1) | Loan balances exclude loans held for sale. |
74
Table of Contents
Index to Financial Statements
While no portion of the allowance is in any way restricted to any individual loan or group of loans, and the entire allowance is available to absorb losses from any and all loans, the following table summarizes our allocation of allowance for loan losses by loan category and loans in each category as a percentage of total loans, for the periods presented.
| December 31, 2013 | December 31, 2012 | December 31, 2011 | ||||||||||||||||||||||||||||||||||
| Amount | % of allowance to total |
% of loan type to total loans |
Amount | % of allowance to total |
% of loan type to total loans |
Amount | % of allowance to total |
% of loan type to total loans |
||||||||||||||||||||||||||||
| Real estate loans: |
||||||||||||||||||||||||||||||||||||
| Residential |
$ | 1,402 | 28.6 | % | 32.8 | % | $ | 893 | 22.4 | % | 35.5 | % | $ | 1,043 | 30.6 | % | 39.9 | % | ||||||||||||||||||
| Construction and land development |
1,497 | 30.5 | 26.9 | 1,342 | 33.7 | 27.9 | 928 | 27.2 | 21.7 | |||||||||||||||||||||||||||
| Commercial |
1,566 | 32.0 | 29.7 | 1,267 | 31.8 | 25.9 | 1,151 | 33.7 | 28.6 | |||||||||||||||||||||||||||
|
|
|
|
|
|
|
|
|
|
|
|
|
|
|
|
|
|
|
|||||||||||||||||||
| Total real estate loans |
4,465 | 91.1 | 89.4 | 3,502 | 87.9 | 89.3 | 3,122 | 91.5 | 90.2 | |||||||||||||||||||||||||||
| Commercial loans |
337 | 6.9 | 8.6 | 275 | 6.9 | 6.8 | 188 | 5.5 | 6.2 | |||||||||||||||||||||||||||
| Consumer and other loans |
98 | 2.0 | 2.0 | 206 | 5.2 | 3.9 | 103 | 3.0 | 3.6 | |||||||||||||||||||||||||||
|
|
|
|
|
|
|
|
|
|
|
|
|
|
|
|
|
|
|
|||||||||||||||||||
| Total |
$ | 4,900 | 100 | % | 100 | % | $ | 3,983 | 100.0 | % | 100 | % | $ | 3,413 | 100.0 | % | 100 | % | ||||||||||||||||||
|
|
|
|
|
|
|
|
|
|
|
|
|
|
|
|
|
|
|
|||||||||||||||||||
| December 31, 2010 | December 31 2009 | |||||||||||||||||||||||
| Amount | % of allowance to total |
% of loan type to total loans |
Amount | % of allowance to total |
% of loan type to total loans |
|||||||||||||||||||
| Real estate loans: |
||||||||||||||||||||||||
| Residential |
$ | 1,071 | 33.7 | % | 47.7 | % | $ | 395 | 18.0 | % | 44.4 | % | ||||||||||||
| Construction and land development |
696 | 21.9 | 20.3 | 510 | 23.3 | 19.3 | ||||||||||||||||||
| Commercial |
1,130 | 35.6 | 24.7 | 1,105 | 50.5 | 28.3 | ||||||||||||||||||
|
|
|
|
|
|
|
|
|
|
|
|
|
|||||||||||||
| Total real estate loans |
2,897 | 91.2 | 92.7 | 2,010 | 91.8 | 92.0 | ||||||||||||||||||
| Commercial loans |
217 | 6.8 | 6.2 | 136 | 6.2 | 6.9 | ||||||||||||||||||
| Consumer and other loans |
63 | 2.0 | 1.1 | 43 | 2.0 | 1.1 | ||||||||||||||||||
|
|
|
|
|
|
|
|
|
|
|
|
|
|||||||||||||
| Total |
$ | 3,177 | 100.0 | % | 100.0 | % | $ | 2,189 | 100.0 | % | 100.0 | % | ||||||||||||
|
|
|
|
|
|
|
|
|
|
|
|
|
|||||||||||||
Fluctuations in the allocations during the periods presented are due, in part, to changes in the specific reserve factors assigned to each category of loans. The Company has relied heavily on the loss history of peer groups due to the lack of its own history of losses; therefore, reserve factors have been adjusted in accordance with the loss performance experienced by a select group of local peer banks. Allocations between categories of loans have also been affected by the change in the mix of loans among the categories.
As of December 31, 2013, the largest component of the allowance for loan losses was associated with commercial real estate loans. The increase on these reserves as a percentage of the total allowance was primarily due to significant commercial real estate loan growth during 2013. During 2013, commercial real estate loans increased from $77,682 at December 31, 2012 to $125,202 at December 31, 2013, an increase of 61.2%. In addition, a specific reserve increase of $80 occurred during 2013 related to an existing impaired credit which accounted for 26.8% of the increase of reserves for commercial real estate loans. The next largest component of the allowance was associated with construction and land development loans. Reserves for these loans have continued to increase with loan growth as construction and land development loans increased to $113,710 as of December 31, 2013, from $83,767 as December 31, 2012, an increase of 35.7%. This growth has contributed to consistent reserve growth for construction and land development loans. During 2013, the allowance for loan losses as a percentage of the allowance total for residential real estate loans increased to 28.6% from 22.4% as of December 31, 2013 and 2012, respectively. Residential real estate loans grew to $138,466 from $106,589, an increase of 29.9%, as of December 31, 2013 and 2012, respectively.
75
Table of Contents
Index to Financial Statements
Non-performing Assets
Non-performing loans consist of non-accrual loans and loans that are past due 90 days or more and still accruing interest. NPAs consist of non-performing loans plus OREO (i.e., real estate acquired through foreclosure or deed in lieu of foreclosure). We place loans on non-accrual status when they are past due 90 days and management believes the borrower’s financial condition, after giving consideration to economic conditions and collection efforts, is such that collection of interest is doubtful. When we place a loan on non-accrual status, interest accruals cease and uncollected interest is reversed and charged against current income. The interest on these loans is accounted for on the cash-basis, or cost-recovery method, until qualifying for return to accrual. Loans are returned to accrual status when all the principal and interest amounts contractually due are brought current and future payments are reasonably assured.
The primary component of non-performing loans is non-accrual loans, which as of December 31, 2013 totaled $2,601. The other component of non-performing loans are loans past due greater than 90 days and still accruing interest. Loans that are past due greater than 90 days are placed on non-accrual status unless they are both well-secured and in the process of collection. We had no loans outstanding that were past due 90 days or more and still accruing interest at December 31, 2013.
At December 31, 2013 and 2012, total OREO was $181 and $2,089, respectively, and is included in our NPAs. OREO is carried at the lower of cost or market less the estimated cost to sell. Further declines in real estate values can affect the market value of these assets. Any further decline in market value beyond its cost basis is recorded as a current expense in our Consolidated Statement of Income.
The table below summarizes non-performing loans and assets for the periods presented.
| December 31, | ||||||||||||||||||||
| 2013 | 2012 | 2011 | 2010 | 2009 | ||||||||||||||||
| Non-accrual loans |
$ | 2,601 | $ | 2,677 | $ | 3,431 | $ | 2,399 | $ | 5,144 | ||||||||||
| Past due loans 90 days or more and still accruing interest |
0 | 0 | 0 | 358 | 507 | |||||||||||||||
|
|
|
|
|
|
|
|
|
|
|
|||||||||||
| Total non-performing loans |
2,601 | 2,677 | 3,431 | 2,757 | 5,651 | |||||||||||||||
| Foreclosed real estate (“OREO”) |
181 | 2,089 | 744 | 2,184 | 1,600 | |||||||||||||||
|
|
|
|
|
|
|
|
|
|
|
|||||||||||
| Total non-performing assets |
2,782 | 4,766 | 4,175 | 4,941 | 7,251 | |||||||||||||||
| Total non-performing loans as a percentage of total loans |
0.6 | % | 0.9 | % | 1.5 | % | 1.4 | % | 3.5 | % | ||||||||||
| Total non-performing assets as a percentage of total assets |
0.3 | % | 0.8 | % | 0.9 | % | 1.4 | % | 2.7 | % | ||||||||||
| Allowance for loan losses as a percentage of non-performing loans |
188 | % | 149 | % | 99 | % | 115 | % | 39 | % | ||||||||||
Investment Securities and Other Earning Assets
The investment securities portfolio is intended to provide us with adequate liquidity, flexible asset/liability management and a source of stable income. The portfolio is structured with minimal credit exposure to us and consists of both securities classified as available-for-sale and securities classified as held-to-maturity. All available-for sale securities are carried at fair value and may be used for liquidity purposes should management deem it to be in our best interest. Unrealized gains and losses on this portfolio are excluded from earnings, but are reported as other comprehensive income in a separate component of shareholders’ equity, net of income tax. Premium amortization and discount accretion are recognized as adjustments to interest income using the interest method. Realized gains or losses on sales are based on the net proceeds and the adjusted carrying value amount of the securities sold using the specific identification method. The held-to-maturity securities are carried at amortized cost.
76
Table of Contents
Index to Financial Statements
Distribution of Investment Securities
| December 31, 2013 | December 31, 2012 | December 31, 2011 | ||||||||||||||||||||||||||||||||||
| Amortized Cost |
Fair Value |
% of total |
Amortized Cost |
Fair Value |
% of total |
Amortized Cost |
Fair Value |
% of total |
||||||||||||||||||||||||||||
| AVAILABLE-FOR-SALE |
||||||||||||||||||||||||||||||||||||
| US government-sponsored entities and agencies |
$ | 16,029 | $ | 14,724 | 5.5 | % | $ | 4,020 | $ | 4,022 | 2.2 | % | $ | 1,000 | $ | 1,001 | 0.5 | % | ||||||||||||||||||
| US Treasury securities |
— | — | — | 8,000 | 8,000 | 4.3 | 5,000 | 5,000 | 2.7 | |||||||||||||||||||||||||||
| Mortgage-backed securities: residential |
259,831 | 253,791 | 94.5 | 169,902 | 171,433 | 92.1 | 178,152 | 180,672 | 96.8 | |||||||||||||||||||||||||||
| State and political subdivisions |
— | — | — | 2,690 | 2,663 | 1.4 | — | — | — | |||||||||||||||||||||||||||
|
|
|
|
|
|
|
|
|
|
|
|
|
|
|
|
|
|
|
|||||||||||||||||||
| Total |
$ | 275,860 | $ | 268,515 | 100.0 | % | $ | 184,612 | $ | 186,118 | 100.0 | % | $ | 184,152 | $ | 186,673 | 100.0 | % | ||||||||||||||||||
|
|
|
|
|
|
|
|
|
|
|
|
|
|
|
|
|
|
|
|||||||||||||||||||
| December 31, 2013 | December 31, 2012 | December 31, 2011 | ||||||||||||||||||||||||||||||||||
| Amortized Cost |
Fair Value |
% of total |
Amortized Cost |
Fair Value |
% of total |
Amortized Cost |
Fair Value |
% of total |
||||||||||||||||||||||||||||
| HELD TO MATURITY |
||||||||||||||||||||||||||||||||||||
| US government-sponsored entities and agencies |
$ | 8,225 | $ | 7,753 | 14.4 | % | $ | 2,971 | $ | 3,001 | 8.7 | % | $ | — | $ | — | — | |||||||||||||||||||
| US Treasury securities |
— | — | — | — | — | — | — | — | — | |||||||||||||||||||||||||||
| Mortgage-backed securities: residential |
39,043 | 37,275 | 69.0 | 24,686 | 25,133 | 72.8 | 6,327 | 6,635 | 74.9 | % | ||||||||||||||||||||||||||
| State and political subdivisions |
9,307 | 8,976 | 16.6 | 6,158 | 6,383 | 18.5 | 2,124 | 2,222 | 25.1 | |||||||||||||||||||||||||||
|
|
|
|
|
|
|
|
|
|
|
|
|
|
|
|
|
|
|
|||||||||||||||||||
| Total |
$ | 56,575 | $ | 54,004 | 100.0 | % | $ | 33,815 | $ | 34,517 | 100.0 | % | $ | 8,451 | $ | 8,857 | 100.0 | % | ||||||||||||||||||
|
|
|
|
|
|
|
|
|
|
|
|
|
|
|
|
|
|
|
|||||||||||||||||||
The tables below summarize the maturity distribution of securities, weighted average yield by range of maturities, and distribution of securities as of December 31, 2013.
| One year or less | Over one through five years |
Over five through ten years |
Over ten years | Total | ||||||||||||||||||||||||||||||||||||
| Fair Value |
Yield | Fair Value |
Yield | Fair Value |
Yield | Fair Value |
Yield | Fair Value |
Yield | |||||||||||||||||||||||||||||||
| AVAILABLE-FOR-SALE |
||||||||||||||||||||||||||||||||||||||||
| US government-sponsored entities and agencies |
$ | — | — | $ | — | — | $ | — | — | $ | 14,724 | 3.07 | % | $ | 14,724 | 3.07 | % | |||||||||||||||||||||||
| Mortgage-backed securities: residential |
1,359 | 3.20 | % | 219,090 | 2.55 | % | 1,522 | 2.88 | % | 31,820 | 2.76 | 253,791 | 2.60 | |||||||||||||||||||||||||||
| State and political subdivisions |
— | — | — | — | — | — | — | — | — | — | ||||||||||||||||||||||||||||||
|
|
|
|
|
|
|
|
|
|
|
|
|
|
|
|
|
|
|
|
|
|||||||||||||||||||||
| Total |
$ | 1,359 | 3.20 | % | $ | 219,090 | 2.55 | % | $ | 1,522 | 2.88 | % | $ | 46,544 | 2.86 | % | $ | 268,515 | 2.63 | % | ||||||||||||||||||||
|
|
|
|
|
|
|
|
|
|
|
|
|
|
|
|
|
|
|
|
|
|||||||||||||||||||||
| One year or less | Over one through five years |
Over five through ten years |
Over ten years | Total | ||||||||||||||||||||||||||||||||||||
| Amortized Cost |
Yield | Amortized Cost |
Yield | Amortized Cost |
Yield | Amortized cost |
Yield | Amortized Cost |
Yield | |||||||||||||||||||||||||||||||
| HELD-TO-MATURITY |
||||||||||||||||||||||||||||||||||||||||
| US government-sponsored entities and agencies |
$ | — | — | $ | 725 | (0.08 | %) | $ | 3,500 | 2.50 | % | $ | 4,000 | 3.30 | % | $ | 8,225 | 2.66 | % | |||||||||||||||||||||
| Mortgage-backed securities: residential |
— | — | 14,483 | 2.44 | 3,712 | 3.21 | 20,848 | 2.70 | 39,043 | 2.65 | ||||||||||||||||||||||||||||||
| State and political subdivisions |
— | — | 767 | 0.97 | 1,612 | 3.38 | 6,928 | 3.41 | 9,307 | 3.20 | ||||||||||||||||||||||||||||||
|
|
|
|
|
|
|
|
|
|
|
|
|
|
|
|
|
|
|
|
|
|||||||||||||||||||||
| Total |
$ | — | — | $ | 15,975 | 2.26 | % | $ | 8,824 | 2.96 | % | $ | 31,776 | 2.93 | % | $ | 56,575 | 2.75 | % | |||||||||||||||||||||
|
|
|
|
|
|
|
|
|
|
|
|
|
|
|
|
|
|
|
|
|
|||||||||||||||||||||
Other earning assets are comprised of federal funds sold, interest-bearing deposits in financial institutions and restricted equity securities. We held no federal funds sold as of December 31, 2013, or December 31, 2012. At December 31, 2013, we held no certificates of deposit at other FDIC insured financial institutions compared to $100 at December 31, 2012. At December 31, 2013, we held $9,882 in an interest-bearing deposit account at the Federal Reserve Bank, compared to $22,430 at December 31, 2012. In addition to our available-for-sale securities portfolio, we use federal funds sold and interest-bearing deposits in financial institutions for liquidity management and for investment yields. These accounts, as a group, will fluctuate as funding needs change.
77
Table of Contents
Index to Financial Statements
We also had other investments of $3,032 and $2,258 at December 31, 2013 and 2012, respectively, consisting of capital stock in the Federal Reserve and the FHLB (required as members of the Federal Reserve Bank System and the FHLB System). The FHLB and Federal Reserve investments are “restricted” in that they can only be sold back to the respective institutions or another member institution at par, and are thus, not liquid, have no ready market or quoted market value, and are carried at cost.
Bank Premises and Equipment
Bank premises and equipment was $4,138 at December 31, 2013 compared to $2,944 at December 31, 2012, an increase of $1,194 or 40.6%. This increase was primarily the result of construction in process on an addition to the Company’s main office in downtown Franklin, Tennessee. This addition was completed in the first quarter of 2014. At December 31, 2013, we operated from four banking locations, including our main office, and a mortgage loan production office in Brentwood, Tennessee, and a deposit and loan production office in Spring Hill, Tennessee. The Bank received regulatory approval to convert the office in Spring Hill to a full service branch, which opened on February 12, 2014. As of December 31, 2013, we leased all banking locations.
Deposits
Deposits represent our largest source of funds. We compete with other bank and nonbank institutions for deposits, as well as with a growing number of non-deposit investment alternatives available to depositors, such as mutual funds, money market funds, annuities, and other brokerage investment products. Challenges to deposit growth include price changes on deposit products given movements in the rate environment and other competitive pricing pressures, and customer preferences regarding higher-costing deposit products or non-deposit investment alternatives.
At December 31, 2013, total deposits were $681,300, an increase of $166,657, or 32.4%, compared to $514,643 at December 31, 2012. Included in our funding strategy are brokered deposits. Total brokered deposits increased from $3,366 at December 31, 2012 to $40,401 at December 31, 2013. Excluding brokered deposits, deposits increased $129,622 from December 31, 2012, to December, 2013, approximately half of which was due to an increase in public funds deposits.
Maturity of non-brokered time deposits of $100,000 or more
| Dec. 31, 2013 | Dec. 31, 2012 | |||||||
| Three months or less |
$ | 6,336 | $ | 21,177 | ||||
| Three through six months |
5,445 | 5,435 | ||||||
| Six through twelve months |
25,982 | 21,388 | ||||||
| Over twelve months |
39,079 | 25,875 | ||||||
|
|
|
|
|
|||||
| Total |
$ | 76,842 | $ | 73,875 | ||||
|
|
|
|
|
|||||
Federal Funds Purchased and Repurchase Agreements
As of December 31, 2013, the Company had federal funds purchased from correspondent banks totaling $20,825 compared to $20 outstanding as of December 31, 2012. The primary reason for this increase was to fund the growth in loans that has exceeded deposit growth for the same periods.
As of December 31, 2013, securities sold under agreements to repurchase had an outstanding balance of $3,466 compared to $1,582 as of December 31, 2012. Securities sold under agreements to repurchase are financing arrangements that mature daily. At maturity, the securities underlying the agreements are returned to the Company.
78
Table of Contents
Index to Financial Statements
FHLB Advances
The Company has established a line of credit with the Federal Home Bank of Cincinnati which is secured by a blanket pledge of 1-4 family residential mortgages. These accounts are summarized in the table below for the periods presented.
Schedule of FHLB advances
| Years Ended December 31, |
Maximum outstanding at any month end |
Average balance |
Average interest rate during the period |
Ending Balance |
Weighted Average interest rate at period end |
|||||||||||||||
| 2013 |
$ | 38,000 | $ | 19,479 | 0.51 | % | $ | 23,000 | 0.52 | % | ||||||||||
| 2012 |
$ | 15,000 | $ | 9,914 | 0.88 | % | $ | 8,000 | 0.95 | % | ||||||||||
Liquidity
Liquidity is defined as the ability to meet anticipated customer demands for funds under credit commitments and deposit withdrawals at a reasonable cost and on a timely basis.
Liquidity risk involves the risk of being unable to fund assets with the appropriate duration and rate-based liabilities, as well as the risk of not being able to meet unexpected cash needs. Liquidity planning and management are necessary to ensure the ability to fund operations cost-effectively and to meet current and future potential obligations such as loan commitments, lease obligations, and unexpected deposit outflows. In this process, management focuses on both assets and liabilities and on the manner in which they combine to provide adequate liquidity to meet the Company’s needs.
Funds are available from a number of basic banking activity sources including the core deposit base, the repayment and maturity of loans, payments of principal and interest as well as sales of investments classified as available-for-sale, and sales of brokered deposits. As of September 30, 2014, $346,750 of the investment securities portfolio was classified as available-for-sale and is reported at fair value on the consolidated balance sheet. Another $56,293 of the portfolio was classified as held-to-maturity and is reported at amortized cost. Approximately $347,748 of the total $403,043 investment securities portfolio on hand at September 30, 2014, was pledged to secure public deposits and repurchase agreements. Other funding sources available include repurchase agreements, federal funds purchased, and borrowings from the FHLB.
Effects of Inflation and Changing Prices
The accompanying consolidated financial statements have been prepared in accordance with GAAP, which require the measurement of financial position and operating results in terms of historical dollars without considering the change in the relative purchasing power of money over time due to inflation. Unlike most industrial companies, virtually all of the assets and liabilities of a financial institution are monetary in nature. As a result, interest rates generally have a more significant impact on the performance of a financial institution than the effects of general levels of inflation. Although interest rates do not necessarily move in the same direction or to the same extent as the prices of goods and services, increases in inflation generally have resulted in increased interest rates. In addition, inflation affects financial institutions’ increased cost of goods and services purchased, the cost of salaries and benefits, occupancy expense, and similar items. Inflation and related increases in interest rates generally decrease the market value of investments and loans held and may adversely affect liquidity, earnings, and shareholders’ equity. Commercial and other loan originations and refinancings tend to slow as interest rates increase, and can reduce the Company’s earnings from such activities.
79
Table of Contents
Index to Financial Statements
Off Balance Sheet Arrangements
The Company generally does not have any off-balance sheet arrangements other than approved and unfunded loans and lines and letters of credit to customers in the ordinary course of business. At September 30, 2014, the Company had unfunded loan commitments outstanding of $32,074, unused lines of credit of $202,978, and outstanding standby letters of credit of $10,964.
Emerging Growth Company Status
The Company is an emerging growth company, as defined in the JOBS Act, and may take advantage of certain exemptions from various reporting requirements that are applicable to public companies that are not emerging growth companies, including, but not limited to, not being required to comply with the auditor attestation requirements of Section 404 of the Sarbanes-Oxley Act, reduced disclosure obligations regarding executive compensation in periodic reports and proxy statements, and exemptions from the requirements of holding a nonbinding advisory vote on executive compensation and shareholder approval of any golden parachute payments not previously approved. In addition, even if the Company complies with the greater obligations of public companies that are not emerging growth companies, the Company may avail itself of the reduced requirements applicable to emerging growth companies from time to time in the future, so long as the Company is an emerging growth company. The Company will remain an emerging growth company for up to five years, though it may cease to be an emerging growth company earlier under certain circumstances, including if, before the end of such five years, it is deemed to be a large accelerated filer under the rules of the SEC (which depends on, among other things, having a market value of common stock held by non-affiliates in excess of $700 million) or if total annual gross revenues equal or exceed $1 billion in a fiscal year. Management cannot predict if investors will find the Company’s common stock less attractive because it will rely on these exemptions. If some investors find the Company’s common stock less attractive as a result, there may be a less active trading market for its common stock and the Company’s stock price may be more volatile.
Further, the JOBS Act exempts emerging growth companies from being required to comply with new or revised financial accounting standards until private companies (that is, those that have not had a Securities Act registration statement declared effective or do not have a class of securities registered under the Exchange Act) are required to comply with the new or revised financial accounting standards. The JOBS Act provides that a company can elect to opt out of the extended transition period and comply with the requirements that apply to non-emerging growth companies but any such an election to opt out is irrevocable. The Company has elected to opt out of such extended transition period, which means that when a standard is issued or revised and it has different application dates for public or private companies, it adopts the new or revised standard at the time public companies adopt the new or revised standard. This election is irrevocable.
GAAP Reconciliation and Management Explanation of Non-GAAP Financial Measures
Some of the financial data included in our selected historical consolidated financial information are not measures of financial performance recognized by GAAP. Our management uses these non-GAAP financial measures in its analysis of our performance:
| • | “Common shareholders’ equity” is defined as total shareholders’ equity at end of period less the liquidation preference value of the preferred stock; |
| • | “Tangible common shareholders’ equity” is common shareholders’ equity less goodwill and other intangible assets; |
| • | “Total tangible assets” is defined as total assets less goodwill and other intangible assets; |
| • | “Other intangible assets” is defined as the sum of core deposit intangible and SBA servicing rights; |
80
Table of Contents
Index to Financial Statements
| • | “Tangible book value per share” is defined as tangible common shareholders’ equity divided by total common shares outstanding. This measure is important to investors interested in changes from period-to-period in book value per share exclusive of changes in intangible assets; |
| • | “Tangible common shareholders’ equity ratio” is defined as the ratio of tangible common shareholders’ equity divided by total tangible assets. We believe that this measure is important to many investors in the marketplace who are interested in relative changes from period-to period in common equity and total assets, each exclusive of changes in intangible assets; |
| • | “Return on Average Tangible Common Equity” is defined as net income available to common shareholders divided by average tangible common shareholders’ equity; |
| • | “Efficiency ratio” is defined as noninterest expenses divided by our operating revenue, which is equal to net interest income plus noninterest income; |
| • | “Adjusted yield on loans” is our yield on loans after excluding loan accretion from our acquired loan portfolio. Our management uses this metric to better assess the impact of purchase accounting on our yield on loans, as the effect of loan discount accretion is expected to decrease as the acquired loans mature or roll off of our balance sheet; |
| • | “Net interest margin” is defined as annualized net interest income divided by average interest-earning assets for the period; |
| • | “Adjusted net interest margin” is net interest margin after excluding loan accretion from the acquired loan portfolio and premiums for acquired time deposits. Our management uses this metric to better assess the impact of purchase accounting on net interest margin, as the effect of loan discount accretion and accretion of net discounts and premiums related to deposits is expected to decrease as the acquired loans and deposits mature or roll off of our balance sheet. |
81
Table of Contents
Index to Financial Statements
We believe these non-GAAP financial measures provide useful information to management and investors that is supplementary to our financial condition, results of operations and cash flows computed in accordance with GAAP; however, we acknowledge that our non-GAAP financial measures have a number of limitations. As such, you should not view these disclosures as a substitute for results determined in accordance with GAAP, and they are not necessarily comparable to non-GAAP financial measures that other companies use. The following reconciliation table provides a more detailed analysis of these non-GAAP financial measures:
| (Amounts in thousands, except share/per share data and percentages) |
As of or for the Nine Months Ended September 30, |
As of or for the Year Ended December 31, | ||||||||||||||||||||||||||
| 2014 | 2013 | 2013 | 2012 | 2011 | 2010 | 2009 | ||||||||||||||||||||||
| Total shareholders’ equity |
$ | 116,454 | $ | 64,133 | $ | 65,163 | $ | 51,356 | $ | 47,379 | $ | 33,529 | $ | 29,209 | ||||||||||||||
| Less: Preferred stock |
10,000 | 10,000 | 10,000 | 10,000 | 10,000 | — | — | |||||||||||||||||||||
|
|
|
|
|
|
|
|
|
|
|
|
|
|
|
|||||||||||||||
| Total common shareholders’ equity |
106,454 | 54,133 | 55,163 | 41,356 | 37,379 | 33,529 | 29,209 | |||||||||||||||||||||
| Less: Goodwill and other intangibles |
12,075 | 258 | 252 | 199 | 157 | 157 | 157 | |||||||||||||||||||||
|
|
|
|
|
|
|
|
|
|
|
|
|
|
|
|||||||||||||||
| Tangible common shareholders’ equity |
$ | 94,379 | $ | 53,875 | $ | 54,911 | $ | 41,157 | $ | 37,222 | $ | 33,372 | $ | 29,052 | ||||||||||||||
|
|
|
|
|
|
|
|
|
|
|
|
|
|
|
|||||||||||||||
| Common shares outstanding |
7,739,644 | 4,669,123 | 4,862,875 | 3,621,154 | 3,550,988 | 3,535,901 | 3,125,478 | |||||||||||||||||||||
|
|
|
|
|
|
|
|
|
|
|
|
|
|
|
|||||||||||||||
| Tangible book value per share |
$ | 12.19 | $ | 11.54 | $ | 11.29 | $ | 11.37 | $ | 10.48 | $ | 9.44 | $ | 9.30 | ||||||||||||||
|
|
|
|
|
|
|
|
|
|
|
|
|
|
|
|||||||||||||||
| Net income available to common shareholders |
$ | 5,504 | $ | 3,075 | $ | 4,452 | $ | 3,682 | $ | 2,154 | $ | 973 | $ | (616 | ) | |||||||||||||
| Average tangible common equity |
72,343 | 41,352 | 45,124 | 39,372 | 35,377 | 28,907 | 22,191 | |||||||||||||||||||||
|
|
|
|
|
|
|
|
|
|
|
|
|
|
|
|||||||||||||||
| Return on average tangible common equity |
10.17 | % | 9.94 | % | 9.87 | % | 9.35 | % | 6.09 | % | 3.37 | % | — | % | ||||||||||||||
|
|
|
|
|
|
|
|
|
|
|
|
|
|
|
|||||||||||||||
| Efficiency Ratio: |
||||||||||||||||||||||||||||
| Net interest income |
$ | 25,570 | $ | 14,657 | $ | 21,045 | $ | 15,956 | $ | 12,136 | $ | 8,919 | $ | 7,204 | ||||||||||||||
| Noninterest income |
7,125 | 5,182 | 6,819 | 8,645 | 4,460 | 5,428 | 3,783 | |||||||||||||||||||||
|
|
|
|
|
|
|
|
|
|
|
|
|
|
|
|||||||||||||||
| Operating revenue |
32,695 | 19,839 | 27,864 | 24,601 | 16,596 | 14,347 | 10,987 | |||||||||||||||||||||
| Expense |
||||||||||||||||||||||||||||
| Total noninterest expense |
21,959 | 14,279 | 19,662 | 16,857 | 13,651 | 12,105 | 10,196 | |||||||||||||||||||||
|
|
|
|
|
|
|
|
|
|
|
|
|
|
|
|||||||||||||||
| Efficiency ratio |
67.16 | % | 71.97 | % | 70.56 | % | 68.52 | % | 82.25 | % | 84.37 | % | 92.80 | % | ||||||||||||||
|
|
|
|
|
|
|
|
|
|
|
|
|
|
|
|||||||||||||||
| Reported yield on loans |
5.44 | % | 5.71 | % | 5.67 | % | 5.92 | % | 5.77 | % | 5.64 | % | 5.18 | % | ||||||||||||||
| Effect of accretion income on acquired loans |
(0.19 | %) | 0.00 | % | 0.00 | % | 0.00 | % | 0.00 | % | 0.00 | % | 0.00 | % | ||||||||||||||
|
|
|
|
|
|
|
|
|
|
|
|
|
|
|
|||||||||||||||
| Adjusted yield on loans |
5.25 | % | 5.71 | % | 5.67 | % | 5.92 | % | 5.77 | % | 5.64 | % | 5.18 | % | ||||||||||||||
|
|
|
|
|
|
|
|
|
|
|
|
|
|
|
|||||||||||||||
| Reported net interest margin |
3.64 | % | 3.30 | % | 3.41 | % | 3.17 | % | 3.16 | % | 4.75 | % | 4.36 | % | ||||||||||||||
| Effect of accretion income on acquired loans |
(0.11 | %) | 0.00 | % | 0.00 | % | 0.00 | % | 0.00 | % | 0.00 | % | 0.00 | % | ||||||||||||||
| Effect of premium amortization of acquired deposits |
(0.01 | %) | 0.00 | % | 0.00 | % | 0.00 | % | 0.00 | % | 0.00 | % | 0.00 | % | ||||||||||||||
|
|
|
|
|
|
|
|
|
|
|
|
|
|
|
|||||||||||||||
| Adjusted net interest margin |
3.52 | % | 3.30 | % | 3.41 | % | 3.17 | % | 3.16 | % | 4.75 | % | 4.36 | % | ||||||||||||||
|
|
|
|
|
|
|
|
|
|
|
|
|
|
|
|||||||||||||||
Quantitative and Qualitative Disclosures About Market Risk
The Company’s primary component of market risk is interest rate volatility. Fluctuations in interest rates will ultimately impact both the level of income and expense recorded on a large portion of the Company’s assets and liabilities, and the market value of all interest-earning assets and interest-bearing liabilities, other than those which possess a short term to maturity. Based upon the nature of the Company’s operations, the Company is not subject to foreign currency exchange or commodity price risk.
Management seeks to maintain profitability in both immediate and long-term earnings through funds management/interest rate risk management. Interest rate risk (sensitivity) management deals with the potential impact on earnings associated with changing interest rates using various rate change (shock) scenarios. The
82
Table of Contents
Index to Financial Statements
Company’s rate sensitivity position has an important impact on earnings. Senior management monitors the Company’s rate sensitivity position throughout each month, and then the Asset Liability Committee (“ALCO”) of the Bank meets on a quarterly basis to analyze the rate sensitivity position and other aspects of asset/liability management. These meetings cover the spread between the cost of funds (primarily time deposits) and interest yields generated primarily through loans and investments, rate shock analyses, liquidity and dependency positions, and other areas necessary for proper balance sheet management.
Management believes interest rate risk is best measured by earnings simulation modeling. The simulation is run using the prime rate as the base with the assumption of rates increasing 100, 200, 300 and 400 basis points or decreasing 100, 200, 300 and 400 basis points. All rates are increased or decreased parallel to the change in prime rate. As a result of the simulation, over a 12-month time period ending September 30, 2015, net interest income was estimated to increase 1.98% and 3.16% if rates were to increase 100 basis points and 200 basis points, respectively, and was estimated to decrease 3.58% and 15.92% in a 100 basis points and 200 basis points declining rate assumption, respectively. These results are in line with the Company’s guidelines for rate sensitivity.
The following chart reflects the Company’s sensitivity to changes in interest rates as indicated as of September 30, 2014.
| Projected Interest Rate |
Net Interest |
Net Interest Income $ Change from Base |
% Change from Base | |||||||
| -400 |
$25,473 | $ | -16,607 | -39.47 | % | |||||
| -300 |
30,006 | -12,074 | -28.69 | |||||||
| -200 |
35,380 | -6,699 | -15.92 | |||||||
| -100 |
40,574 | -1,506 | -3.58 | |||||||
| Base |
42,080 | 0.00 | ||||||||
| +100 |
42,914 | 835 | 1.98 | |||||||
| +200 |
43,410 | 1,330 | 3.16 | |||||||
| +300 |
43,799 | 1,719 | 4.09 | |||||||
| +400 |
44,132 | 2,052 | 4.88 | |||||||
The preceding sensitivity analysis is a modeling analysis, which changes periodically and consists of hypothetical estimates based upon numerous assumptions including interest rate levels, changes in the shape of the yield curve, prepayments on loans and securities, rates on loans and deposits, reinvestments of pay downs and maturities of loans, investments and deposits, changes in spreads between key market rates, and other assumptions. In addition, there is no input for growth or a change in asset mix. While assumptions are developed based on the current economic and market conditions, the Company cannot make any assurances as to the predictive nature of these assumptions, including how customer preferences or competitor influences might change. As market conditions vary from those assumed in the sensitivity analysis, actual results will differ. Also, these results do not include any management action that might be taken in responding to or anticipating changes in interest rates. The simulation results are one indicator of interest rate risk, and actual net interest income is largely impacted by the allocation of assets, liabilities, and product mix.
Summary Discussion of Results of Operation and Financial Condition of MidSouth for its Period Ended June 30, 2014
Overview
MidSouth was a community bank headquartered in Murfreesboro, Rutherford County, Tennessee, which is part of the Nashville metropolitan area. MidSouth was a state-chartered bank that operated from six locations in Rutherford County—its main office, three branch banking offices and a mortgage loan office in Murfreesboro, and one branch banking office in Smyrna. MidSouth offered a wide range of banking services including checking, savings, money market accounts, treasury management, certificates of deposit and loans for consumer, commercial and real estate purposes. In addition to traditional banking services, MidSouth offered trust services and also investment services to its customers through Raymond James Financial Services.
83
Table of Contents
Index to Financial Statements
We acquired MidSouth on July 1, 2014. The following discussion and analysis presents the results of operations and financial condition of MidSouth for the six months ended June 30, 2014. The preparation of financial results for MidSouth’s period commencing January 1, 2014 and ending on June 30, 2014 prevents direct comparability of certain elements of FFN’s results of operations for the periods indicated.
History & Background
| • | Pre-2012 |
MidSouth was a state-chartered bank that began operations on January 20, 2004 and operated in Rutherford County, Tennessee. Its growth was fueled by the rapid population increase experienced in Rutherford County in the mid- to late-2000’s, which created numerous construction and development lending opportunities to meet the needs of the growing community.
Beginning in late-2008 and carrying into 2010, MidSouth experienced significant asset quality issues, primarily from the deterioration in real estate development projects it had financed. In an effort to address its credit issues during this period, MidSouth curtailed many of its lending activities and began shrinking the overall size of the institution to preserve capital. As a result of these efforts, MidSouth reduced its total assets from $270.8 million as of December 31, 2008 to $238.7 million as of December 31, 2011 and reduced its total loans, excluding loans held for sale and net of allowance from loan loss, from $216.7 million as of December 31, 2008 to $137.1 million as of December 31, 2011. MidSouth’s nonperforming assets reached a peak in September 2009 at $17.5 million. Primarily as a result of the level of NPAs, MidSouth entered into a formal written agreement with the Federal Reserve Bank of Atlanta on August 5, 2010. During 2010, MidSouth began to stabilize its operations and continued to improve asset quality. By December 31, 2011, MidSouth had reduced its nonperforming assets to $9.3 million, and had grown earnings to just over $1 million.
| • | 2012-2013 Highlights |
During 2012-2013, MidSouth continued its efforts to improve asset quality, and once loan demand started to increase, began to grow assets and loans and began to improve earnings. As a result of MidSouth’s progress and continuing efforts, the Federal Reserve Bank terminated its written agreement with MidSouth effective April 26, 2012.
From December 31, 2011 to December 31, 2013, MidSouth’s total assets grew by $38.0 million, or 15.9%. As of December 31, 2013, MidSouth had $276.6 million in total assets, total loans, excluding loans held for sale, of $168.1 million, and had reduced MidSouth’s NPAs to $4.3 million. MidSouth recorded net income of $1.6 million in 2012 and $1.5 million in 2013.
In November 2013, MidSouth entered into an Agreement and Plan of Reorganization and Bank Merger with FFN and the Bank.
Results of Operations
MidSouth had a loss of $767 for the first six months of 2014, or $0.20 basic loss per share. The diluted loss per share was $0.11 per share for the first six months of 2014. MidSouth’s loss included merger-related expenses that totaled $1,231 from system de-conversion fees and from professional fees that included accounting, legal, and investment banker expenses.
MidSouth’s interest income for the six months ended June 30, 2014 was $5,417, and total interest expense was $401, resulting in net interest income for the first six months of 2014 totaling $5,016. These results reflect the increase in loan volume during these periods and MidSouth’s management of rates on interest-bearing liabilities which had been reduced to 0.42% for the first six months of 2014.
84
Table of Contents
Index to Financial Statements
MidSouth recorded provision for loan losses of $350 during the first six months of the 2014, reflecting the increased loan volumes that occurred during the period. Prior to 2014, MidSouth had not recorded any loan loss provision expense since 2011 due to the volume of recoveries experienced during the period 2011 through first quarter 2014, which funded the allowance for loan losses.
MidSouth’s non-interest income for the six months ended June 30, 2014 was $2,072, which reflected $1,012 in mortgage origination fees, other commissions and fees of $374, brokerage fees of $372, service charges on deposits of $173, and gains on sales of available-for-sale securities of $115. Other than non-core income from gains on sales of securities, most noninterest income items were relatively flat in comparison with 2013. Fees on mortgage originations were on pace to exceed 2013’s results due to the addition of a team of higher-volume originators during the first quarter of 2014. With the additional originators, MidSouth’s mortgage loan volume increased from $7.5 million in the first quarter of 2014 to $26.6 million in the second quarter of 2014.
MidSouth’s noninterest expense for the six months ended June 30, 2014 was $7,505, which reflected $1,231 of merger-related expenses that were included in professional fees and data processing expense, as discussed earlier. Employee salaries and benefits totaled $3,616 for the first six months of 2014, which included increased salaries and commissions paid related to the mortgage originators and support personnel that were added early in 2014. MidSouth also incurred $124 in losses on the disposal of fixed assets that were not going to have future value or be transferred over to Franklin Synergy Bank as part of the acquisition. The loss on fixed assets was primarily attributed to core system applications, computer hardware, computer software, building signs and other fixed assets that were expected to be replaced once the acquisition by Franklin Synergy Bank became effective.
Financial Condition
MidSouth’s total assets were $281,051 as of June 30, 2014 and had increased in the first six months of 2014 as a result of the growth in MidSouth’s loan portfolio and loans held for sale.
MidSouth’s loans, net of allowance for loan losses, totaled $188,396 at June 30, 2014, an increase of $20,285, or 12.1%, from December 31, 2013. The increase was primarily due to the increased loan demand that MidSouth had experienced, mainly in the construction and land development loan portfolio, which accounted for $17,755 of the growth in the total loan portfolio.
MidSouth’s loan portfolio was composed of six primary loan categories: commercial, financial and agricultural; commercial real estate; residential real estate; construction and land development; multifamily real estate; and consumer and other loans. At June 30, 2014, real estate loans accounted for 88.3% of total loans.
The table below sets forth MidSouth’s loan categories and the percentages of each of the loan categories in the portfolio at June 30, 2014 and December 31, 2013:
| (Dollars in thousands) |
June 30, 2014 |
% of Total | December 31, 2013 |
% of Total | ||||||||||||
| Commercial, financial and agricultural |
$ | 20,636 | 10.8 | % | $ | 21,108 | 12.4 | % | ||||||||
| Real estate: |
||||||||||||||||
| Commercial |
83,540 | 43.6 | 79,481 | 46.5 | ||||||||||||
| Residential |
40,617 | 21.2 | 39,927 | 23.4 | ||||||||||||
| Construction and land development |
44,141 | 23.0 | 26,386 | 15.4 | ||||||||||||
| Multifamily |
888 | 0.4 | 2,419 | 1.4 | ||||||||||||
| Consumer and other |
1,870 | 1.0 | 1,589 | 0.9 | ||||||||||||
|
|
|
|
|
|
|
|
|
|||||||||
| Total |
$ | 191,692 | 100.0 | % | $ | 170,910 | 100.0 | % | ||||||||
|
|
|
|
|
|
|
|
|
|||||||||
85
Table of Contents
Index to Financial Statements
As represented in the table, gross loans increased by approximately 12.2% during the first six months of 2014. MidSouth experienced growth in the following categories: construction and land development loans (67.3%); commercial real estate loans (5.1%); residential real estate loans (1.7%); and consumer and other loans (17.7%). MidSouth experienced decreases in commercial, financial and agricultural loans (2.2%) and multifamily real estate loans (63.3%). The significant growth in construction and land development was fueled by the population increase experienced in Rutherford County, Tennessee and the demand that resulted from that growth.
MidSouth’s allowance for loan losses was $3,296 as of June 30, 2014 and $2,799 as of December 31, 2013. As a percentage of total loans the allowance was 1.72% and 1.64%, respectively. This increase was primarily attributed to the $350 provision that MidSouth recorded during June 2014. As a result of the acquisition of MidSouth on July 1, 2014, we valued MidSouth’s loan portfolio at it fair value without carrying over its existing allowance for loan losses as of June 30, 2014.
MidSouth’s non-performing loans were $2,673 as of June 30, 2014 and $3,485 as of December 31, 2013. This decrease was primarily attributable to MidSouth’s ongoing efforts to improve the overall credit quality of its loan portfolio for the periods indicated.
As of June 30, 2014, MidSouth’s securities portfolio totaled $57,601. This represents a 26.0% decrease from the December 31, 2013 total of $77,850 and is a result of MidSouth’s increased loan volumes. The sales of available-for-sale securities were used to provide the liquidity necessary to fund MidSouth’s loan growth. All of MidSouth’s securities were classified as available for sale. MidSouth’s securities portfolio primarily consisted of liquid securities with minimal credit risk including U.S Government agency obligations, agency mortgage-backed securities, and state and municipal securities. As a result of our acquisition of MidSouth on July 1, 2014, we valued MidSouth’s securities portfolio at its fair value, which approximated its carrying value.
MidSouth’s total liabilities were $252,563 as of June 30, 2014 and $248,953 as of December 31, 2013. MidSouth’s deposits totaled $244,242 as of June 30, 2014, of which $55,682 were noninterest-bearing deposits and $188,560 were interest-bearing deposits, and $241,948 as of December 31, 2013, of which $49,375 were noninterest-bearing deposits and $192,573 were interest-bearing deposits. As of June 30, 2014 MidSouth had $6,000 in short-term advances from the FHLB of Cincinnati and $5,000 in FHLB advances as of December 31, 2013. The short-term advances that were outstanding as of June 30, 2014 were assumed by the Bank at the time of the acquisition of MidSouth on July 1, 2014.
As a result of the acquisition of MidSouth on July 1, 2014, MidSouth’s outstanding shares of common stock, Series 2009A Preferred stock, Series 2009A warrants, Series 2011-A Preferred stock and Series 2011-A warrants were all converted to common stock of FFN at the defined conversion ratios noted in the amended S-4 filed by FFN on May 7, 2014.
86
Table of Contents
Index to Financial Statements
Company Overview
We are a bank holding company headquartered in Franklin, Tennessee. Through our wholly owned bank subsidiary, Franklin Synergy Bank, a Tennessee-chartered commercial bank and a member of the Federal Reserve System, we provide a full range of banking and related financial services with a focus on service to small businesses, corporate entities, local governments and individuals. We operate through 11 branches in the demographically attractive and growing Williamson and Rutherford Counties within the Nashville metropolitan area.
As of September 30, 2014, we had consolidated total assets of $1.24 billion, total loans, including loans held for sale, of $745 million, total deposits of $1.05 billion and total shareholders’ equity of $116 million. Our 2014 third quarter financial information gives effect to our acquisition of MidSouth, which was completed on July 1, 2014.
Our principal executive office is located at 722 Columbia Avenue, Franklin, Tennessee 37064-2828, and our telephone number is (615) 236-2265. Our website is www.franklinsynergybank.com. The information contained on or accessible from our website does not constitute a part of this prospectus and is not incorporated by reference herein.
Our History and Growth
We were formed as a Tennessee corporation in April 2007 and commenced banking operations through the newly-formed Franklin Synergy Bank in November 2007. Our shareholders are predominantly comprised of individuals, many of whom are customers of the Bank and reside in our target markets. As of the date of this offering, individuals own over 85% of our outstanding common equity.
We were established with the objective of building a locally-managed commercial bank to service the needs of Franklin, Tennessee and the greater Williamson County area. Our mission statement is to build a legacy company by creating shareholder value, cultivating strong customer relationships and fostering an extraordinary team of directors, officers and employees. We were formed by a core management team of veteran bankers based in Middle Tennessee led by our Chairman and Chief Executive Officer, Richard Herrington. Many of our founders built Franklin Financial Corporation (which is not directly affiliated with our company), which was founded in 1988, and grew the newly-formed real estate-oriented bank to nine branches and $785 million in assets as of June 30, 2002, before announcing the sale of the bank to Fifth Third Bancorp in July 2002. Mr. Herrington and certain members of this management team subsequently joined Cumberland Bancorp (later renamed Civitas BankGroup, Inc.), a troubled Tennessee-based bank holding company, in December 2002, to lead its restructuring. The team led a dramatic improvement of Cumberland’s asset quality and profitability, by decreasing nonperforming loans to total loans from 2.25% in 2003 to 0.31% in 2006 and growing net income from $1.1 million in 2003 to $6.7 million in 2006, before it was acquired by Greene County Bancshares, Inc. in May 2007.
Since our inception and prior to acquiring MidSouth in July 2014, we have achieved significant and consistent organic growth. From December 31, 2009 to June 30, 2014 (one day before the MidSouth acquisition closed), we:
| • | grew our consolidated total assets by a CAGR of 30% from $272 million to $872 million as of June 30, 2014; |
| • | increased our total loans, including loans held for sale, by a CAGR of 28% from $168 million to $502 million as of June 30, 2014; |
87
Table of Contents
Index to Financial Statements
| • | increased our total deposits by a CAGR of 30% from $227 million to $747 million as of June 30, 2014 and achieved a number one deposit market share in Williamson County based on deposits at June 30, 2014; |
| • | expanded our employee base from 70 full-time equivalent employees to 126 full-time equivalent employees as of June 30, 2014; and |
| • | added four branches to expand our footprint to a total of six branches. |
As we have grown, we have leveraged our infrastructure to improve our efficiency ratio from 93% in 2009 to 63% for the six months ended June 30, 2014. This improved efficiency has led to greater profitability, as we went from recording a loss of $0.6 million for the year ended December 31, 2009 to a profit of $5.9 million for the last twelve months ending June 30, 2014 and a 0.84% annualized return on average total assets for the six months ended June 30, 2014. In addition, from the year ended December 31, 2009 to the six months ended June 30, 2014, we increased our return on average equity from (2.8%) to 10.3%, and our return on average tangible common equity from (2.8%) to 12.1%.
We have preserved our strong credit culture while growing steadily as evidenced by our low balance of nonperforming loans, which were 0.33% of our total loans as of June 30, 2014, and quarterly net charge-offs to average loans which have averaged 0.04% from January 1, 2009 through June 30, 2014.
MidSouth Acquisition
On July 1, 2014, we completed our acquisition of MidSouth which enabled us to increase our footprint in Middle Tennessee and in the Nashville metropolitan area, specifically in the attractive Rutherford County market. The acquisition also diversified our revenue mix by expanding our retail customer base and increasing our capacity to provide wealth management services, including trust powers which we believe is a competitive advantage to drive new relationships with higher income customers. Headquartered in Murfreesboro, Tennessee and founded in 2004, MidSouth had five branches located throughout Rutherford County, which is adjacent to Williamson County. Although MidSouth operated in close proximity to us, there was no overlap of branch locations and MidSouth’s customer base complemented ours with minimal overlap.
Immediately prior to closing the acquisition, MidSouth had total assets of $281 million, total loans of $199 million, including loans held for sale, and total deposits of $244 million. MidSouth’s loan portfolio, like ours, was primarily comprised of real estate loans. For the six-month period ended June 30, 2014, MidSouth’s balance of nonperforming loans to total loans was 1.34% and net recoveries to average loans, on an annualized basis, was 0.17%.
As a result of the MidSouth acquisition, and as of July 1, 2014, the Company, after giving effect to purchase accounting:
| • | grew our consolidated total assets from $872 million to $1.17 billion; |
| • | increased our total loans, including loans held for sale, from $502 million to $693 million; |
| • | increased our total deposits from $747 million to $992 million; and |
| • | expanded our employee base from 126 full-time equivalent employees to 227 full-time equivalent employees. |
88
Table of Contents
Index to Financial Statements
Third Quarter 2014 and Organic Growth
In the quarter immediately following our completion of the MidSouth acquisition, we continued to achieve organic growth as a combined company. From July 1, 2014 (after giving effect to the MidSouth acquisition) to September 30, 2014, we:
| • | grew our consolidated total assets 6% from $1.17 billion to $1.24 billion as of September 30, 2014; |
| • | increased our total loans, including loans held for sale, 7% from $693 million to $745 million as of September 30, 2014; and |
| • | increased our total deposits 6% from $992 million to $1.05 billion as of September 30, 2014. |
The following charts show our growth in total loans, deposits and net income as well as our annualized return on average assets since 2009.
Note: Total loans and total deposits in millions. 2014 Q3 numbers include impact from MidSouth acquisition which closed July 1st.
| (1) | Includes $0.6 million gain of life insurance benefits. |
| (2) | Includes $0.6 million of expenses attributed to the acquisition of MidSouth. |
89
Table of Contents
Index to Financial Statements
Our Market Opportunity
Our Market
We operate 11 branches in Williamson and Rutherford Counties within the Nashville metropolitan area. Below is a map of our branch network:
90
Table of Contents
Index to Financial Statements
Our markets are among the most attractive, both in Tennessee, and the Southeast, and compare favorably to some of the more well-known and higher-profile markets in the U.S., although our markets are not dependent on commodity pricing. We believe that our focus on, and success in, growing market share in Williamson and Rutherford Counties will enhance our long-term value and profitability compared to financial institutions of our size in other regions of the country. As the following charts demonstrate, the markets in which we operate are characterized by strong demographics including high incomes, increasing population, a growing workforce and unemployment that tends to be below the national rate.
Source: Bureau of Labor Statistics and SNL Financial.
Note: Southeast includes AL, AR, FL, GA, MS, NC, SC, TN, VA and WV. Metrics weighted by population.
Note: Projected figures calculated from 2014 to 2019.
Note: Franklin Synergy refers to Williamson and Rutherford counties weighted by deposits.
| (1) | Employment rate indexed against 2000 data. |
Nashville
In 2013, Nashville was ranked by Forbes as one of the Best Cities for Business and Careers. Its leading industries are health care management, tourism, education, music and entertainment. Healthcare is the largest industry in Nashville, with healthcare companies contributing $30 billion per year and 200,000 jobs to the economy of Nashville and its surrounding areas according to the Nashville Health Care Council. The Nashville area contains 21 accredited four-year colleges and universities (including Vanderbilt University, which was most
91
Table of Contents
Index to Financial Statements
recently ranked by US News & World Report as 16th among national universities). Based on Census data, Nashville’s 2010 – 2013 net domestic migration rate of 2.5% ranked sixth among major metropolitan areas.2 Additionally, there is no state personal income tax on wages.
Jobs have been created at a robust rate, as civilian labor force employment in the Nashville MSA has grown since 2000 by 15% to approximately 810,000. Large companies continue to be attracted to the Nashville area and its favorable economic and business-friendly climate. For example, Amazon.com now employs 2,000 Nashville area residents and announced plans in July 2014 to build a new sorting center, creating another 100 jobs. In October 2014, Under Armour announced its plan to build a distribution center, bringing 1,500 new jobs. Furthermore, in November 2014, Bridgestone Americas announced that it will relocate its headquarters to Nashville, creating 600 new jobs for the city, and FedEx announced its plans to build a new distribution center in the area creating another 350 jobs.
Williamson County
Williamson County is the wealthiest county in Tennessee and one of the wealthiest in the U.S., with a median household income of $86,706. It is also the fastest-growing county in Tennessee, as its population, currently 199,481, increased by 8.9% from 2010 to 2014 and is projected to increase by 8.6% from 2014 through 2019. Civilian labor force employment in the county has grown since 2000 by 39% to approximately 96,000.
There has been successful regional economic development in Williamson County. There are currently 14 Fortune 1,000 companies with significant presences and/or regional headquarters in the county. Within the last seven years, Mars Petcare established a global innovation center; Nissan relocated its North American headquarters; and Verizon Wireless, Jackson National Life and Shelter Insurance relocated their regional or state headquarters, all within Williamson County. The county has only 4.6% unemployment and there are over 6,000 businesses. According to Metrostudy, the nation’s leading provider of primary and secondary market information to the housing, retail and related industries nationwide, new home sales in Williamson County are robust, with only 1.6 months of inventory of homes on the market and residential closings are up 9% over 2013 for the twelve months ended September 30, 2014.
Williamson County has three AAA-rated government entities: the county, the city of Franklin and the city of Brentwood. In September 2014, Franklin was designated by Money Magazine as one of the Top 50 places to live in the U.S., due to the area’s abundance of jobs, low cost of living, cultural/lifestyle considerations and top schools. Williamson County features the highest ranked public school district in Tennessee.
Rutherford County
Rutherford County is one of the wealthiest counties in Tennessee, with a median household income of $57,220. It is the fifth largest county in Tennessee with a population of 282,183, which has increased by 7.5% from 2010 to 2014 and is projected to increase by an additional 7.5% from 2014 through 2019.
Rutherford County features strong economic development and quality of life. Civilian employment in the county has grown since 2000 by 38% to almost 140,000. The drivers of expanding economic development in Rutherford County have been manufacturing, small businesses and the presence of the largest undergraduate university in Tennessee, Middle Tennessee State University. The county is home to one of Nissan’s U.S. manufacturing facilities, one of Bridgestone’s manufacturing facilities, and a General Mills production facility. The county has 4.9% unemployment. According to Metrostudy, there are 1.4 months of inventory of homes on the market and residential closings are up 5% over 2013 for the twelve months ended September 30, 2014.
| 2 | Per NewGeography.com. |
92
Table of Contents
Index to Financial Statements
Our Business Strategy
We consider ourselves to be bankers, not just lenders. Our core business strategy is to provide our banking customers with a full suite of financial services by cultivating strong long-term customer relationships and by developing an extraordinary team of officers and employees focused on the customer experience. We are focused on providing convenience and personal service to our customers that is superior to that of the out-of-state super-regional and national financial institutions operating in our markets, while simultaneously managing risk and profitability by remaining selective when expanding our customer base and making loans. We also prioritize our client’s financial security and privacy and assist the communities in which we do business through socially responsible leadership. Our unique culture is a cornerstone to our business and has resulted in substantial but stable growth and profitability.
By continuing to offer several value-added products and services within our core areas of strength, such as mortgage lending and wealth management, to invest in technology to improve our systems and the customer experience, and to leverage strong relationships with consumers, professionals, local governments and businesses within our community, we believe we can gain greater market share, which will improve our operational efficiency and increase profitability. As evidence of the success of our strategy, our deposit market share in Williamson County has increased from 3.4% in 2009 to a market-leading approximately 13.0% currently, despite the presence of more institutions competing for deposits.
The key components of our strategy include the following:
Real Estate Focus, with Enhanced Small Business Initiative
We are real estate bankers with a focus on Middle Tennessee. Our management team’s experience building a robust real estate lending platform at Franklin Financial Corporation from 1989 to 2002 formed the basis for our lending principles that have helped us grow profitably while managing credit and other risks. Our lending philosophy focuses on three principles: (1) we focus our underwriting and rely strongly on the credit of secondary sources of repayment (i.e., collateral), (2) the substantial majority of our collateral, by choice, is local in-market real estate and (3) we limit unsecured lending (which comprises less than 2% of our total loan portfolio).
Approximately ninety percent (90%) of our loan portfolio is secured by real estate. We are primarily focused on residential construction lending and office/warehouse commercial real estate lending, which limits our exposure to commitments to larger projects, such as multifamily projects and hospitality and leisure projects. Our real estate portfolio is fairly evenly divided among (1) short-term construction loans (primarily residential), (2) traditional commercial real estate, and (3) mortgage loans (many of which are business loans secured by local real estate). Thirty-one percent (31%) of our loan portfolio is in commercial real estate, 30% is in construction loans and 28% is in one-to-four family residential loans, with the average loan size for a project of less than $200,000. The construction loans and many of the other real estate loans in our lending portfolio have variable interest rates and the average maturity of our loan portfolio is 47 months, which we believe allows us to be well positioned in a rising rate environment.
The average life of our construction loans is less than nine months, and we have averaged $20 million in construction loan pay-offs per month for the nine months ended September 30, 2014. Some of these construction loans lead to mortgage loans originated by our mortgage banking team and are subsequently sold into the secondary market. We have no significant concentration of builder or subdivision exposure within our construction loan portfolio. We have increased our focus on small business lending and have grown our C&I loans by a CAGR of 37% from December 31, 2009 through June 30, 2014. As of September 30, 2014, C&I loans now represent 10% of our portfolio.
93
Table of Contents
Index to Financial Statements
Continue to Prudently Manage Credit Risk
We do not avoid risk—we manage it prudently. We believe that our strong balance sheet and our enterprise risk management philosophy have been important in gaining and maintaining the confidence of our various constituencies and growing our business and footprint within the growing Middle Tennessee market. Our focus on asset quality is the foundation of our profitability and financial strength. The credit quality of our loan portfolio has continually improved, as nonperforming loans have decreased from 3.37% of our loan portfolio at December 31, 2009 to 0.45% at September 30, 2014. Further, our investment portfolio is mainly comprised of securities representing U.S. government agency mortgage-backed securities, which account for 91% of the fair value of our investment portfolio as of September 30, 2014, and the balance of the securities portfolio is comprised of other federal and municipal securities, such as U.S. Treasury securities.
Optimize Presence throughout Our Footprint
Our recent acquisition of MidSouth allowed us to expand selectively into Rutherford County; a contiguous market with long-term growth potential similar to Williamson County. We currently have the top position in the Williamson County deposit market, with 13% market share, and rank sixth in the Rutherford County deposit market, with 7% market share. The strong demographic profiles and economic momentum of Williamson and Rutherford Counties translate into what we believe to be significant organic growth potential over the next few years. We do not believe that we need to add a significant number of new branches or otherwise meaningfully increase our physical presence in order to realize the growth potential contained within these markets. We will evaluate opportunities to open new branches or ancillary offices (i.e., loan production or wealth management offices), as well as acquisitions, as they arise, but our strategy does not necessitate inorganic growth.
Diversification of Revenue
We are continuously expanding the products and services we offer to our customers. Our range of products and services diversifies our earnings stream, strengthens our balance sheet and provides greater flexibility to manage our business in volatile interest rate environments and amid shrinking interest rate margins in the U.S. banking industry. Recently, via the MidSouth acquisition, we have further invested in our mortgage banking division and expanded into wealth management. We will look to further grow these divisions in order to better provide a full suite of services to our customers, add more “touch points” that our customers have with the Bank and drive greater fee income and profitability. Rather than engaging in mass-market advertising, we typically attract new customers by utilizing existing customer relationships and maintaining our presence in our communities. This practice provides opportunities for our relationship managers to cross-sell other products and services to these clients. In addition, we offer our expertise and targeted service offerings for a variety of small businesses and non-profit organizations.
We believe that enhancing our cross-selling capabilities will enable us to generate higher revenues, increase our deposits and diversify our income stream.
Our fee income businesses consist of the following:
| • | Mortgage Banking. Our mortgage banking business has generated 13.5% of our revenue (defined in accordance with the industry standard as net interest income plus noninterest income) for the nine months ended September 30, 2014. We sell the majority of loans that are originated in-house in the secondary market and we have the option to retain servicing rights. We are currently servicing 1,722 loans with an approximate aggregate principal balance of $398 million. For the nine months ended September 30, 2014, we originated $219 million of loans. Our efforts to expand our Mortgage Banking business have emphasized purchase loans versus attracting rate sensitive |
94
Table of Contents
Index to Financial Statements
| refinancing opportunities. Additionally, mortgage production has a natural tie-in to our residential construction business as a number of our newly originated loans are sourced from our construction loan relationships. |
| • | Wealth Management/Trust Services. Our wealth management business has $168 million in assets under management as of September 30, 2014. Leveraging MidSouth’s wealth management expertise into our selective customer base and the wealthy Williamson County market represents an attractive and unique opportunity. With the MidSouth acquisition, we acquired a trust business and we believe that our possession of a trust charter is a competitive advantage, enabling us to attract newer and wealthier customers and more “sticky” long term deposits. |
For the nine months ended September 30, 2014, noninterest income represented 21.8% of our revenue.
Enhance Deposit Base
We will look to attract more low-cost, high-quality and long-term retail deposits. Our cost of deposits for the nine months ended September 30, 2014 was 0.61%, compared to 1.88% in 2009, as a result of our increased ability to attract transactional accounts. During the twelve months ended September 30, 2014, we attracted $528 million of deposits. We are able to leverage existing relationships throughout our customer base by cross-selling services and incentivizing our bankers to bring in deposit relationships, in addition to loans. Local government deposits represent an attractive source of low-cost, seasonal but predictable deposits. As of September 30, 2014, public funds interest checking deposits had a balance of $122 million. We will look to increase the amount of municipal deposits in the future. We believe that the expansion of our small business loan portfolio will provide an attractive and growing source of low-cost deposits in the future.
Additionally, our investments in technology, which have resulted in a strong mobile banking platform and services such as remote deposit capture, enable us to attract and retain deposit customers in a competitive local environment. Furthermore, to expand our customer base, we have created retail banking products intended to appeal to a wide demographic of potential customers, such as our Synergy Cobalt Club, which provides retail banking services targeted to young professionals and our Pineapple Gold Club, which provides retail banking services targeted to people ages 50 and over. Finally, our treasury management services, which include ACH and lockbox product suites, also help to broaden our deposit base through their appeal to small business and commercial deposit customers.
Attract and Retain High Quality Employees
We employ many experienced loan officers with deep local market knowledge and long-term existing relationships. We have been successful in hiring talented employees due to our service-oriented culture and efficient decision making processes. On average, loan officers have 18 years of lending experience. Additionally, we are able to attract and retain talented officers through our incentive compensation plan, which rewards officers with stock options, restricted stock units and cash. All of our officers are shareholders through direct stock ownership, restricted stock and stock options. We believe that by compensating our officers in the form of equity, we align the interests of our team with those of our shareholders, and incentivize them to maximize shareholder value. Lastly, we invest continuously in our employee base. For example, we created a leadership program, “Leadership Franklin Synergy Bank,” where we train our employees not only to be better bankers, but also to be leaders in our communities.
Distinguishing the Bank
We believe that the Bank distinguishes itself in the community because of the following initiatives:
| • | Service Culture. Every employee position has service goals and objectives. All customers are greeted by competent employees with a warm and friendly attitude, and a proactive approach in addressing customer service issues and challenges. |
95
Table of Contents
Index to Financial Statements
| • | Technology. The Bank offers innovative Internet-based, mobile and electronic banking products and processes to supplement its traditional branch banking delivery system. |
| • | Empowerment. Employees are empowered with appropriate decision-making authority so that customer issues and requests can be resolved quickly. |
| • | Employee Community Involvement. Appropriate staff are leaders and active in the community. Activities include membership and leadership in various committees and organizations throughout the community. |
| • | Promotion and Advertising. The Bank engages in image and product promotion and advertising to promote itself as a bank uniting traditional bank values with newly evolving Internet and electronic delivery systems. |
| • | Sales Culture. The entire staff is active in bank marketing and sales campaigns and is compensated for performance. |
| • | Public and Community Relations. The Bank supports numerous community organizations and is seen as a leader in the Middle Tennessee Community. |
Our Competitive Strengths
We believe that we have a unique operating culture that differentiates us from our competitors and enables us to organically grow our business and enhance shareholder value. This unique operating culture includes:
| • | a commitment to provide superior and personal service to our customers, both through our employees and via our continued investment in cutting edge technologies in areas of deposit taking, loan origination and risk management; |
| • | a focus on building long-term relationships with our customers; and |
| • | community leadership, as we look to engage with local civic, professional and charitable organizations and exhort our employees to do so as well. |
Our culture forms the basis for our competitive strengths, which we believe allow us to leverage our market opportunity and grow our business profitability. In particular, we believe that the following strengths differentiate us from our competitors and provide a strong foundation from which to deliver growth and profitability, all while enhancing shareholder value:
Well Positioned in Attractive Markets
We believe that we are well positioned to grow our business profitably in the demographically attractive and growing markets within the Nashville metropolitan area in which we operate. We believe that our target market segments, small to medium size for profit businesses and the consumer base working or living in and near our geographical footprint, demand the convenience and personal service that a smaller, independent financial institution such as we can offer. Currently, there are few Tennessee-headquartered banks with assets over $1 billion—there is only one public Middle Tennessee-based bank trading on a major exchange. We believe the heavy out-of-state banking presence (out-of-state super-regional and national financial institutions control approximately 59% of local deposits in the Nashville metropolitan area) provides an opportunity for a strong local bank like us to add greater market share from customers who are looking for more personal banking services and a more customer-friendly experience. Through our efforts to expand our deposit base, we currently have the largest market share of deposits in Williamson County.
96
Table of Contents
Index to Financial Statements
As demonstrated below, our local markets compare favorably to higher profile markets in almost all measures.
| MSA | County | |||||||||||||||||||||||||||||||||||
| Top 5 MSAs by Population Growth | ||||||||||||||||||||||||||||||||||||
| USA | Austin | Provo | Houston | Dallas | San Antonio | Nashville | Williamson | Rutherford | ||||||||||||||||||||||||||||
| Estimated Population Growth |
3.5% | 11.4% | 8.7% | 8.7% | 8.6% | 8.5% | 6.2% | 8.6% | 7.5% | |||||||||||||||||||||||||||
| Median Household Income |
$ | 51,579 | $ | 58,706 | $ | 58,735 | $ | 56,545 | $ | 56,739 | $ | 50,754 | $ | 50,439 | $ | 86,706 | $ | 57,220 | ||||||||||||||||||
| Unemployment |
5.8% | 4.3% | 4.6% | 4.5% | 4.6% | 4.3% | 5.1% | 4.6% | 4.9% | |||||||||||||||||||||||||||
| Home Price Y-O-Y |
5.8 | 6.6 | 7.3 | 8.8 | 5.9 | 5.5 | 5.2 | 7.6 | 6.2 | |||||||||||||||||||||||||||
| Housing Vacancy |
11.4 | 7.2 | 5.1 | 9.6 | 7.9 | 8.4 | 7.7 | 4.9 | 6.2 | |||||||||||||||||||||||||||
| % of Households w/ Income > 200k |
4.5 | 5.6 | 3.3 | 6.1 | 5.4 | 3.7 | 3.9 | 11.9 | 2.9 | |||||||||||||||||||||||||||
Note: Housing Vacancy Rate is calculated as Vacant Housing Units / Total Housing Units.
Source: SNL Financial and Moody’s Economy.
Experienced Management Team
We have an experienced management team with a history of working together in our target markets and a track record of delivering growth and shareholder value. Many members of our executive leadership team have been with us since inception and many have worked together at previous banks, including both large financial institutions and community banks. Our Chief Executive Officer, President, Chief Mortgage Officer, Chief Financial Officer, Chief Investment Officer and Chief Credit Officer have worked in our local market for an average of twenty-three years and experienced a variety of economic cycles. This deep local experience has given us the ability to understand and react to market changes and maintain strong profitability and growth without sacrificing asset quality. The MidSouth acquisition has bolstered our team, as several key managers have extensive experience working together in the Rutherford County market with MidSouth and other area banks.
Our management team has a proven track record of delivering shareholder value. Richard Herrington co-founded Franklin Financial Corporation (Franklin National Bank) in 1988, where he and his management team grew assets by a CAGR of 27.5% from 1995 – 2002 and positioned the bank to eventually be sold to Fifth Third, which was announced in 2002 and closed in 2004, for 5.4 times tangible book value. According to SNL Financial, this multiple represents the 9th highest price to book multiple for all bank transactions announced in the past 20 years where deal value was in excess of $50 million. He then served as Chief Executive Officer at Cumberland Bancorp (later renamed Civitas BankGroup, Inc.), where he and his team restructured the bank and significantly bolstered profitability, growing net income by a CAGR of 82% from 2003 – 2006, before selling the bank to Greene County Bancshares in 2007 for 3.0 times tangible book value.
The members of our Board of Directors have diverse industry experiences and have deep and long-term ties to the local community. We believe that we have an ideal blend of directors that have been with our management team at previous banks as well as directors that have joined our Board in recent years.
Local Real Estate Lending Expertise
We are real estate bankers that have focused on Middle Tennessee collateral since 1989. Our in-depth knowledge of the commercial customers, real estate development and credit in Williamson and Rutherford Counties gives us a competitive advantage in loan production, deposit attraction and ancillary revenue generation as we grow market share. Even when the local loan market gets competitive, we do not compromise on pricing and structuring of loan facilities, as our bankers are able to provide customized solutions delivered with a relatively quick turnaround time, as a result of the fact that our underwriting and banking operations occur locally.
With our firm principles of lending on Middle Tennessee collateral, our local real estate expertise and our localized delivery apparatus, we are poised to capture greater market share in the demographically-attractive and growing Williamson and Rutherford Counties.
97
Table of Contents
Index to Financial Statements
Successful Balance of Growth and Profitability
We understand the importance of successfully balancing growth and profitability with asset quality to enhance shareholder value. The following highlights the key aspects of our approach to maintaining this balance:
| • | Consistent, Strong and Disciplined Growth. Our approach balances both disciplined growth and profitability. Our community-focused business model has resulted in loan growth with a CAGR of 28% from December 31, 2009 to June 30, 2014. We have multiple lending opportunities to continue this trajectory and the MidSouth acquisition has provided us an immediate presence in the attractive Rutherford County market. Our lending momentum has continued, as loans have grown by 7% from July 1, 2014 to September 30, 2014. Additionally, we have increased focus on small business lending and grown our C&I loans, which represent approximately 10% of our portfolio at September 30, 2014, by a CAGR of 37% since 2009. We have grown our deposit market share in Williamson County and are now the top local institution with a market share of 13%. Our growth has resulted in improved profitability, as reflected by return on average assets increasing from negative in 2009 to 0.67% for the third quarter of 2014. |
| • | Disciplined Credit Risk Management. Our robust approach to risk management has enabled growth of our loan portfolio without compromising credit. Our credit risk management strategy is based on prudent underwriting criteria and local knowledge. Our lending decisions are centralized and committee-focused, with committees meeting multiple times per week. We are collateral lenders, with strong focus on secondary sources of repayment, especially collateral based in Williamson and Rutherford Counties. As a result of the implementation of our risk management strategy, less than 2% of our current total loans are unsecured. As the following charts demonstrate, our conservative credit culture has resulted in strong credit metrics as we have grown our business. |
Source: SNL Financial. Southeast Banks with assets between $500mm-$5bn. Based on regulatory financials.
We believe that by maintaining our consistent origination and underwriting strategy, we will be able to maintain our consistent growth across shifting market environments.
Products and Services
The Bank operates as a full-service financial institution for its customers in its expanded market area with a full line of financial products, including:
Commercial Banking
Traditional commercial banking services are the mainstay of the Bank. The Bank’s focus is to service small to medium-sized businesses and self-employed professionals. Certain not-for-profit and governmental entities find the Bank’s services attractive.
98
Table of Contents
Index to Financial Statements
The Bank’s focus in the commercial banking market is to provide high quality service for its customers supported by the latest bank technology. In the credit service area, the Bank endeavors to give its commercial customers access to a highly-trained team of credit and deposit service specialists who remain with the customer relationship for long periods of time. Credit decision-making is customized to meet the borrower’s financial needs and designed for rapid response. Credit judgments involve the Bank’s senior management and, where legally required, involve the directors of the Bank. Government guaranteed lending services such as the S.B.A. may be utilized as needed.
Consumer Banking
The Bank offers a broad range of financial services designed to meet the credit, savings, and transactional needs of local consumers. First mortgage real estate loans, home equity loans, and other personal loans are the focus of consumer lending. Consumer depository and transaction needs are met through dual delivery systems of traditional branches and the Internet, including mobile banking.
Mortgage Loans
Our mortgage loan department originates single-family, fixed rate residential mortgage loans that we sell in the secondary market. Construction loans also are available for residential and commercial purposes.
Deposits
The Bank’s deposit products include demand, negotiable order of withdrawal (“NOW”), money market accounts, certificates of deposit (“CDs”), municipal deposits, savings, and deposit accounts. CDs offer various maturities ranging from thirty days to five years. The Bank generates relationships by personal contacts within the conventional trading markets for such services by its officers, directors, and employees, who include persons with banking experience in these markets. The Bank also solicits local deposits through the Internet and offers Internet-only deposit accounts to supplement traditional depository accounts. Loan customers are encouraged to bring their deposit business to the Bank, including transaction accounts, CDs, and retirement accounts. This practice further increases the deposit base for the Bank and assists in controlling overall market costs related to deposit acquisition.
Wealth Management/Trust Services
As a result of the MidSouth acquisition, the Bank has increased its capacity to provide wealth management services, including trust services, as the Bank is now authorized to exercise trust powers, which provides the Bank with a competitive advantage.
Other Products and Services
In order to meet all financial needs of the customers, the Bank offers retirement planning, financial planning, investment services and insurance products through its financial services department. Some of these products may be outsourced through relationships with other financial institutions.
Credit Underwriting
We apply consistent credit principles in our assessment of lending proposals, whether commercial real estate, residential and commercial construction, commercial and industrial, consumer or other lending. We are collateral-focused lenders, which means our assessment of any potential loan includes an analysis of whether the secondary source of repayment can generate sufficient cash flow to ensure the likelihood that the borrower’s repayment obligations to the Bank can be fully met. Additionally, our underwriting procedures include an assessment of the borrower’s cash flow sustainability, the acceptability of the borrowing purpose, the borrower’s liquidity, collateral quality and adequacy, industry dynamics, and management capability, integrity and experience. For consumer and other lending, our underwriting process is intended to assess the prospective borrower’s credit standing and ability to repay (which we analyze based on the borrower’s cash flow, liquidity, credit standing, employment history and overall financial condition) and the value and adequacy of any collateral.
99
Table of Contents
Index to Financial Statements
We establish conservative collateral guidelines that recognize the potential effects of volatility or deterioration of the value of collateral we accept, the majority of which is real estate, as well as inventory, receivables and machinery. We manage this risk in a number of ways, including through advance rate guidelines for the various types of collateral we typically accept. In addition, where we take real estate as collateral, and for some other specialized assets, we require an assessment of value based on appropriate methodology and benchmarks. For our larger real estate commitments, this assessment can include an independent third party appraisal review and, where appropriate, additional reviews.
We also assess the presence and viability of one or more acceptable secondary sources of repayment to mitigate potential future borrower cash flow deterioration. We generally limit unsecured lending to situations, short-term in nature, involving long-standing customers of sound net worth and above-average liquidity with strong repayment ability. We have a delegated commitment authority framework that provides a conservative level of lending authority to our bankers commensurate with their role and lending experience. Commitments above these lending thresholds established for a banker require the approval, depending on the size of the commitment, of our regional credit managers, central credit senior managers, Chief Credit Officer or, for our largest commitments, our loan committee, with committees meeting multiple times per week. Loan analyses and decisions are documented and form part of the loan’s continual monitoring and relationship management record. We believe this framework provides the necessary separation of authority and independence in the credit underwriting process while providing flexibility to expedite appropriate credit decisions and provide competitive customer service.
Marketing
We market our products and services through a variety of distribution channels. Fundamentally, we focus on a relationship banking model and try to build long-term relationships with our customers. In our community banking markets, our lending officers actively solicit new and existing businesses in the communities we serve. Our management and loan officers are very active members of the communities in which we operate and leverage that involvement to develop customer relationships and brand recognition. Some of our other distribution channels include:
| • | online advertising through the Bank’s website and traditional print media outlets that include online advertising as part of their advertising package; |
| • | social media channels, including Facebook and Twitter; |
| • | regular email blasts to the customer base are used for advertising purposes; |
| • | Bank events such as Customer Appreciation Day, holiday events, seasonal sports events with local speakers, educational seminars for local real estate professionals and builders, hosted art show in branches and Chamber After Hours events; |
| • | community events, including volunteer efforts as well as sponsorships and participation in numerous local community and civic clubs and non-profit organizations; |
| • | Pineapple Gold and Cobalt Clubs—Social events, educational offerings and travel clubs that target an older demographic (Pineapple Gold) as well as younger customers (Cobalt Club); and |
| • | traditional sources such as local radio and print advertising. |
Investment Portfolio
We manage our investments for the primary purpose of liquidity, with a secondary focus on returns. Substantially all of our investments in our portfolio are classified as available-for-sale and can be used to
100
Table of Contents
Index to Financial Statements
collateralize FHLB borrowings, public funds deposits or other borrowings. Each investment portfolio consists of a variety of high-grade securities, including government agency securities, government/agency guaranteed mortgage-backed securities. We regularly evaluate the composition of our investment portfolio as changes occur with respect to the interest rate yield curve and may sell investment securities from time to time to adjust our exposure to changes in interest rates or to provide liquidity to meet loan demand.
Recent Trends
From a financial perspective, management believes the Bank has reached key milestones significantly faster than most banks in the United States during their first seven full years of operation. As of September 30, 2014, the Bank had $745 million in loans, including loans held for sale; assets of $1.24 billion, $1.05 billion in deposits, $116 million of shareholders equity, and achieved a number one deposit market share in Williamson County based on deposits at June 30, 2014. Challenges and expectations expand as the Bank becomes more mature. Management addresses changes in banking over recent years and embarks on new initiatives as appropriate. In the past, banks needed branches on every corner; today that is considered an outdated way of doing business. Many of the Bank’s customers like to visit with personnel at the Bank, and the Bank will continue to offer a welcoming environment. Other customers prefer to bank online and through mobile channels. The Bank provides a full range of banking products designed to attract all types of customers.
The Bank continues to enhance banking convenience by offering the option of opening accounts online and through mobile channels (savings accounts, checking accounts and CDs). Customers can access banking services at their convenience. The Bank’s remote deposit system allows consumers to deposit checks online without the need to come to a branch. Business customers enjoy this convenience as well.
Local businesses are important to the Bank. The Bank has many products that can help its corporate customers become more profitable, including sweep accounts, credit card processing, remote capture and automated lock box. A unique offering is workplace banking, which allows employers to offer a special banking benefits package to their employees. The Bank also can meet the borrowing needs of businesses through traditional working capital loans, as well as account receivable loans and business expansion loans. One of the Bank’s specialties is customizing services to the unique needs of the business.
Competition
All phases of FFN’s and the Bank’s business are highly competitive. FFN and the Bank are subject to intense competition from various financial institutions and other companies or firms that offer financial services. the Bank competes for deposits with other commercial banks, savings and loan associations, credit unions and issuers of commercial paper and other securities, such as money-market and mutual funds. In making loans, the Bank competes with other commercial banks, savings and loan associations, consumer finance companies, credit unions, leasing companies, and other lenders. Information about specific competition in Williamson County and Rutherford County is included under “RISK FACTORS—Competition For Deposits and Loans is Expected To Be Intense, and No Assurance Can Be Given That We Will Be Successful in Our Efforts to Compete with Other Financial Institutions.”
The banking industry continues to see consolidation, and the Board of Directors believes the trend of having either extremely large regional banks or smaller community banks will continue. The successful implementation of our business plan and the growth of the target market should combine to produce opportunities for FFN and the Bank.
While the direction of recent and proposed federal legislation seems to favor increased competition between banks and different types of financial or other institutions for both deposits and loans, it is not possible to forecast the impact such developments may have on commercial banking in general or as to the Bank or FFN
101
Table of Contents
Index to Financial Statements
in particular. The Bank will continue to compete with these and other financial institutions, many of which have far greater assets and financial resources than the Bank and whose common stock may be more widely traded than that of FFN. See “SUPERVISION AND REGULATION.” No assurance can be given that the Bank will be successful in its efforts to compete with such other institutions.
Enterprise Risk Management
We place significant emphasis on risk mitigation as an integral component of our organizational culture. We believe that our emphasis on risk management is manifested in our solid asset quality statistics and our credit risk management procedures discussed above.
We also focus on risk management in numerous other areas throughout our organization, including with respect to asset/liability management, regulatory compliance and internal controls. We have implemented an extensive asset/liability management process aided by simulation models provided by reputable third parties. We engage in ongoing internal audit and review of all areas of our operations and regulatory compliance.
We are implementing management assessment and testing of internal controls consistent with the Sarbanes-Oxley Act and have engaged an experienced independent public accounting firm to assist us with respect to compliance.
Properties
FFN’s and the Bank’s main office and headquarters operation is located at 722 Columbia Avenue, Franklin, Tennessee 37064. This location is leased by the Bank. The Bank operates branches at the following locations: 3359 Aspen Grove Drive, Suite 100, Franklin, Tennessee 37067; 134 Pewitt Drive, Suite 100, Brentwood, Tennessee 37027; 1015 Westhaven Blvd., Suite 150, Franklin, Tennessee 37064; 40 Moss Lane, Suite 100, Franklin, Tennessee 37064; 2035 Wall Street, Spring Hill, Tennessee 37174; One East College Street, Murfreesboro, Tennessee 37130; 724 President Place, Smyrna, Tennessee 37167; 2415 Memorial Boulevard, Murfreesboro, Tennessee 37129; 2782 South Church Street, Murfreesboro, Tennessee 37127; and 2610 Old Fort Parkway, Murfreesboro, Tennessee 37128. The Bank also operates mortgage loan office at 123 East College Street, Murfreesboro, Tennessee 37129. Seven of these locations are leased by the Bank; five are owned. Certain lease agreements for these properties are with entities owned by related parties of FFN and the Bank.
The Bank agreed to sell the real estate of three of its branches in Rutherford County, Tennessee to Murfreesboro Branches, LLC (“Buyer”), an affiliate of Henry W. Brockman and Dr. David H. Kemp, each of whom are directors of the Bank and FFN, for a purchase price of $4,095,000 (the “Sale”). Consummation of the Sale is subject to customary closing conditions, including title insurance and other requirements. Buyer agreed to lease such real estate back to the Bank as of the date of the closing of the Sale, each lease having a term of 13 years. See “CERTAIN RELATIONSHIPS AND RELATED TRANSACTIONS—Certain Transactions with Management.”
Employees
Management employs officers who have substantial experience and proven records in the banking industry and proven histories in business and commerce, and pays competitive salaries to attract and retain such persons. It is not anticipated that we will experience any substantial difficulty in attracting and retaining the desired caliber of officers and other employees. We offer a typical health and disability insurance plan to our employees and those of its subsidiaries, as well as a 401(k) Plan and officer stock incentive awards. See “EXECUTIVE COMPENSATION AND OTHER INFORMATION.”
FFN and the Bank have nine directors, and, as of September 30, 2014, we and our subsidiaries had 227 full-time employees and one part-time employee. We consider our relationship with our employees to be excellent. Furthermore, we are not subject to any collective bargaining agreements.
102
Table of Contents
Index to Financial Statements
The executive officers are compensated consistent with their responsibilities and experience and comparable to local market norms. Compensation includes a base salary, eligibility for an annual bonus based on board approved performance criteria and health insurance. Officers may enter into employment agreements as competitive factors dictate and which might include appropriate severance, change in control payments, and non- compete agreements. Currently, there are 12 members of senior management that have entered into such employment agreements. We sponsor a qualified 401(k) savings plan that allows eligible employees to defer a portion of their salary. The plan provides for the Bank to make annual discretionary contributions to the plan, which generally are made in the form of employer securities.
Trademarks
We obtained registrations with the United States Patent and Trademark Office for the protection of the trademarks “FRANKLIN SYNERGY BANK®” and “FRANKLIN FINANCIAL NETWORK®.” Management does not believe these trademarks are confusingly similar to trademarks used by other institutions in the financial services business and intends to protect the use of these trademarks nationwide.
Litigation
As of the date of this prospectus, neither we nor any subsidiary is aware of any pending or threatened material legal proceeding to which we or any such subsidiary are a party. Similarly, none of the properties of us or any subsidiary is subject to such proceedings.
Policies and Procedures
The Board of Directors of the Bank has established a statement of lending policies and procedures being used by loan officers of the Bank when making loans. Asset quality is of utmost importance and an independent loan review process has been established to monitor the Bank’s lending function. It is imperative that the Board of Directors and management have an independent and objective evaluation of the quality of specific individual loans and of the overall quality of the total portfolio.
The Board of Directors of the Bank also has established an investment policy that guides the Bank officers in determining the investment portfolio of the Bank. Other policies include a code of ethics policy, audit policy, loan policy, fair lending, compliance, bank secrecy, personnel and information system policies.
Under the CRA, the Federal Reserve evaluates the Bank’s record of helping to meet the credit needs of its community consistent with safe and sound operations. The Federal Reserve also takes this record into account when deciding on certain applications submitted by the Bank. The Bank’s assessment area is Williamson County, Rutherford County and Davidson County for business loans, mortgage, and general financial services.
The Bank is a fair and equal credit lender. Management’s lending objectives are to make credit products available to all segments of the Bank’s market and community. Williamson County has one moderate census tract, Davidson County has thirty-eight moderate income census tracts and twenty-nine low income tracts, and Rutherford County has seven moderate census tract and two low census tracts. Products are being developed and marketed to individuals and businesses located in those census tracts.
103
Table of Contents
Index to Financial Statements
The following summaries of statutes and regulations affecting banks and their holding companies do not purport to be complete. Such summaries are qualified in their entirety by reference to the statutes and regulations described.
Bank Holding Company Regulation
FFN is a bank holding company within the meaning of the Bank Holding Company Act of 1956, as amended (the “Holding Company Act”), and is registered with the Federal Reserve. Banking subsidiaries of bank holding companies are subject to restrictions under federal law, which limit the transfer of funds by the subsidiary banks to their respective holding companies and non-banking subsidiaries, whether in the form of loans, extensions of credit, investments or asset purchases. Under Section 23A of the Federal Reserve Act, such transfers by any subsidiary bank to its holding company or any nonbanking subsidiary are limited in amount to 10% of the subsidiary bank’s capital and surplus and, with respect to FFN and all such non-banking subsidiaries, to an aggregate of 20% of such bank’s capital and surplus. Also, banking subsidiaries of bank holding companies are also subject to the provisions of Section 23B of the Federal Reserve Act, which, among other things, prohibits an institution from engaging in certain transactions with certain affiliates unless the transactions are on terms substantially the same, or at least as favorable to such institution or its subsidiaries, as those prevailing at the time for comparable transactions with nonaffiliated companies. Furthermore, such loans and extensions of credit are required to be secured in specified amounts. The Holding Company Act also prohibits, subject to certain exceptions, a bank holding company from engaging in or acquiring direct or indirect control of more than 5% of the voting stock of any company engaged in non-banking activities. An exception to this prohibition is for activities expressly found by the Federal Reserve to be so closely related to banking or managing or controlling banks as to be a proper incident thereto, such as consumer lending and other activities that have been approved by the Federal Reserve by regulation or order. Certain servicing activities are also permissible for a bank holding company if conducted for or on behalf of the bank holding company or any of its affiliates.
As a holding company, FFN is required to file with the Federal Reserve semi-annual reports and such additional information as the Federal Reserve may require. The Federal Reserve may also make examinations of FFN and its non-bank affiliates.
According to federal law and Federal Reserve policy, holding companies are expected to act as a source of financial and managerial strength to each of its subsidiary bank and to commit resources to support each such subsidiary. This support may be required at times when a holding company may not be able to provide such support. Furthermore, in the event of a loss suffered or anticipated by the FDIC—either as a result of default of a banking or thrift subsidiary of FFN or related to FDIC assistance provided to a subsidiary in danger of default—the other banking subsidiaries of FFN may be assessed for the FDIC’s loss, subject to certain exceptions.
Regulation Y generally requires persons acting directly or indirectly or in concert with one or more persons to give the Federal Reserve 60 days advanced written notice before acquiring control of a holding company. Under the regulation, control is defined as the ownership or control with the power to vote 25% or more of any class of voting securities of the holding company. The regulation also provides for a presumption of control if a person owns, controls, or holds with the power to vote 10% or more (but less than 25%) of any class of voting securities. A bank holding company may be limited to ownership of 5% ownership of voting securities. If the person or persons making the acquisition is a company, prior approval from the Federal Reserve may be required.
Various federal and state statutory provisions limit the amount of dividends subsidiary banks can pay to their holding companies without regulatory approval. The payment of dividends by any bank also may be affected by other factors, such as the maintenance of adequate capital for such subsidiary bank. In addition to the foregoing restrictions, the Federal Reserve has the power to prohibit dividends by holding companies if their
104
Table of Contents
Index to Financial Statements
actions constitute unsafe or unsound practices. The Federal Reserve has issued a policy statement on the payment of cash dividends by holding companies, which expresses the Federal Reserve’s view that a holding company experiencing earnings weaknesses should not pay cash dividends that exceed its net income or that could only be funded in ways that weaken the holding company’s financial health, such as by borrowing. The Federal Reserve may also order a bank holding company to terminate an activity or control of a non-bank subsidiary if such activity or control constitutes a significant risk to the financial safety, soundness, or stability of a subsidiary bank and is inconsistent with sound banking principles. Furthermore, the TDFI also has authority to prohibit the payment of dividends by a Tennessee bank when it determines such payment to be an unsafe and unsound banking practice.
A holding company and its subsidiaries are also prohibited from acquiring any voting shares of, or interest in, any banks located outside of the state in which the operations of the holding company’s subsidiaries are located, unless the holding company and its subsidiaries are well-capitalized and well managed.
In approving acquisitions by holding companies of banks and companies engaged in the banking-related activities described above, the Federal Reserve considers a number of factors, including the expected benefits to the public such as greater convenience, increased competition, or gains in efficiency, as weighed against the risks of possible adverse effects such as undue concentration of resources, decreased or unfair competition, conflicts of interest, or unsound banking practices. The Federal Reserve is also empowered to differentiate between new activities and activities commenced through the acquisition of a going concern.
The Attorney General of the United States may, within 30 days after approval by the Federal Reserve of an acquisition, bring an action challenging such acquisition under the federal antitrust laws, in which case the effectiveness of such approval is stayed pending a final ruling by the courts. Failure of the Attorney General to challenge an acquisition does not, however, exempt the holding company from complying with both state and federal antitrust laws after the acquisition is consummated or immunize the acquisition from future challenge under the anti-monopolization provisions of the Sherman Act.
Capital Guidelines
The Federal Reserve has issued risk-based capital guidelines for bank holding companies and member banks. Under the guidelines, the minimum ratio of capital to risk-weighted assets (including certain off-balance sheet items, such as standby letters of credit) is 8%. To be considered a “well capitalized” bank or bank holding company under the guidelines, a bank or bank holding company must have a total risk-based capital ratio of 10% or greater. At least half of the total capital is to be comprised of common equity, retained earnings, and a limited amount of perpetual preferred stock, after subtracting goodwill and certain other adjustments (“Tier I capital”). The remainder may consist of perpetual debt, mandatory convertible debt securities, a limited amount of subordinated debt, other preferred stock not qualifying for Tier I capital, and a limited amount of loan loss reserves (“Tier II capital”). The Bank is subject to similar capital requirements adopted by the Federal Reserve. In addition, the Federal Reserve and the FDIC have adopted a minimum leverage ratio (Tier I capital to total assets) of 3% or 4% based on supervisory considerations. Generally, banking organizations are expected to operate well above the minimum required capital level of 3% unless they meet certain specified criteria, including that they have the highest regulatory ratings. Most banking organizations are required to maintain a leverage ratio of 3% or 4%, as applicable, plus an additional cushion of at least 1% to 2%. The guidelines also provide that banking organizations experiencing internal growth or making acquisitions are expected to maintain strong capital positions substantially above the minimum supervisory levels without significant reliance upon intangible assets.
In July 2013, the federal banking regulators, in response to the statutory requirements of Dodd-Frank, adopted regulations implementing the Basel Capital Adequacy Accord (“Basel III”), which had been approved by the Basel member central bank governors in 2010 as an agreement among the countries’ central banks and bank regulators on the amount of capital banks must hold as a cushion against losses and insolvency. The new
105
Table of Contents
Index to Financial Statements
minimum capital to risk-weighted assets (“RWA”) requirements are a common equity Tier 1 capital ratio of 4.5% and a Tier 1 capital ratio of 6.0%, and a total capital ratio of 8.0%. The minimum leverage ratio (Tier 1 capital to total assets) is 4.0%. The new rule also changes the definition of capital, mainly by adopting stricter eligibility criteria for regulatory capital instruments, and new constraints on the inclusion of minority interests, mortgage-servicing assets, deferred tax assets, and certain investments in the capital of unconsolidated financial institutions. In addition, the new rule requires that most regulatory capital deductions be made from common equity tier 1 capital.
Under the Basel III, in order to avoid limitations on capital distributions, including dividend payments and certain discretionary bonus payments to executive officers, a banking organization must hold a capital conservation buffer composed of common equity tier 1 capital above its minimum risk-based capital requirements. The buffer is measured relative to RWA. Phase-in of the capital conservation buffer requirements will begin on January 1, 2016 and the requirements will be fully phased in on January 1, 2019. A banking organization with a buffer greater than 2.5% once the capital conservation buffer is fully phased in would not be subject to limits on capital distributions or discretionary bonus payments; however, a banking organization with a buffer of less than 2.5% would be subject to increasingly stringent limitations as the buffer approaches zero. The new rule also prohibits a banking organization from making distributions or discretionary bonus payments during any quarter if its eligible retained income is negative in that quarter and its capital conservation buffer ratio was less than 2.5% at the beginning of the quarter. Effectively, the Basel III framework will require us to meet minimum capital ratios of (i) 7% for common equity Tier 1 capital, (ii) 8.5% Tier 1 capital, and (iii) 10.5% total capital. The eligible retained income of a banking organization is defined as its net income for the four calendar quarters preceding the current calendar quarter, based on the organization’s quarterly regulatory reports, net of any distributions and associated tax effects not already reflected in net income. When the new rule is fully phased in, the minimum capital requirements plus the capital conservation buffer will exceed the prompt corrective action (“PCA”) well-capitalized thresholds.
Under the new rule, mortgage-servicing assets and deferred tax assets are subject to stricter limitations than those applicable under the current general risk-based capital rule. More specifically, certain deferred tax assets arising from temporary differences, mortgage-servicing assets, and significant investments in the capital of unconsolidated financial institutions in the form of common stock are each subject to an individual limit of 10% of common equity tier 1 capital elements and are subject to an aggregate limit of 15% of common equity tier 1 capital elements. The amount of these items in excess of the 10% and 15% thresholds are to be deducted from common equity tier 1 capital. Amounts of mortgage-servicing assets, deferred tax assets, and significant investments in unconsolidated financial institutions that are not deducted due to the aforementioned 10% and 15% thresholds must be assigned a 250% risk weight. Finally, the new rule increases the risk weights for past-due loans, certain commercial real estate loans, and some equity exposures, and makes selected other changes in risk weights and credit conversion factors.
The new minimum capital requirements of Basel III are effective on January 1, 2015, whereas the capital conservation buffer and the deductions from common equity tier 1 capital phase in over time. Similarly, nonqualifying capital instruments phase out over time, except as described above.
Failure to meet statutorily mandated capital guidelines or more restrictive ratios separately established for a financial institution could subject a banking institution to a variety of enforcement remedies available to federal regulatory authorities, including issuance of a capital directive, the termination of deposit insurance by the FDIC, a prohibition on accepting or renewing brokered deposits, limitations on the rates of interest that the institution may pay on its deposits, and other restrictions on its business.
Tennessee Banking Act; Federal Deposit Insurance Act
The Bank is incorporated under the banking laws of the State of Tennessee and, as such, is subject to the applicable provisions of those laws. The Bank is subject to the supervision of the TDFI and to regular examination by that department. The Bank is a member of the Federal Reserve and therefore is subject to Federal
106
Table of Contents
Index to Financial Statements
Reserve regulations and policies and is subject to regular exam by the Federal Reserve. The Bank’s deposits are insured by the FDIC through DIF, and the Bank is, therefore, subject to the provisions of the Federal Deposit Insurance Act (“FDIA”).
The FDIC has adopted a risk-based assessment system for insured depository institutions that takes into account the risks attributable to different categories and concentrations of assets and liabilities. Under the Dodd-Frank Act, the FDIC was required to adopt regulations that would base deposit insurance assessments on total assets less capital rather than deposit liabilities and to include off-balance sheet liabilities of institutions and their affiliates in risk-based assessments. EESA (as defined below) provided for a temporary increase in the basic limit on federal deposit insurance coverage from $100,000 to $250,000 per depositor. This increased level of basic deposit insurance was made permanent by the Dodd-Frank Act. The Dodd-Frank Act also repealed the prohibition on paying interest on demand transaction accounts, but did not extend unlimited insurance protection for these accounts.
The FDIC may terminate its insurance of deposits if it finds that the institution has engaged in unsafe and unsound practices, is in an unsafe or unsound condition to continue operations, or has violated any applicable law, regulation, rule, order or condition imposed by the FDIC.
Tennessee statutes and the federal law regulate a variety of the banking activities of the Bank, including required reserves, investments, loans, mergers and consolidations, issuances of securities, payments of dividends, and the establishment of branches. There are certain limitations under federal and Tennessee law on the payment of dividends by banks. A state bank, with the approval of the TDFI, may transfer funds from its surplus account to the undivided profits (retained earnings) account or any part of its paid-in-capital account. The payment of dividends by any bank is dependent upon its earnings and financial condition and, in addition to the limitations referred to above, is subject to the statutory power of certain federal and state regulatory agencies to act to prevent what they deem unsafe or unsound banking practices. The payment of dividends could, depending upon the financial condition of the Bank, be deemed to constitute such an unsafe or unsound practice. Also, without regulatory approval, a dividend only can be paid to the extent of the net income of the bank for that year plus the net income of the prior two years. The FDIA prohibits a state bank, the deposits of which are insured by the FDIC, from paying dividends if it is in default in the payment of any assessments due the FDIC.
State banks also are subject to regulation respecting the maintenance of certain minimum capital levels (see above), and the Bank is required to file annual reports and such additional information as the Tennessee Banking Act and Federal Reserve regulations require. The Bank also is subject to certain restrictions on loan amounts, interest rates, “insider” loans to officers, directors and principal shareholders, tie-in arrangements, privacy, transactions with affiliates, and many other matters. Strict compliance at all times with state and federal banking laws is required.
Tennessee law contains limitations on the interest rates that may be charged on various types of loans and restrictions on the nature and amount of loans that may be granted and on the types of investments which may be made. The operations of banks are also affected by various consumer laws and regulations, including those relating to equal credit opportunity and regulation of consumer lending practices. All Tennessee banks must become and remain insured banks under the FDIA. (See 12 U.S.C. § 1811, et seq.).
Under Tennessee law, state banks are prohibited from lending to any one person, firm, or corporation amounts more than 15% of its equity capital accounts, except (i) in the case of certain loans secured by negotiable title documents covering readily marketable nonperishable staples or (ii) the Bank may make a loan to one person, firm or corporation of up to 25% of its equity capital accounts with the prior written approval of the Bank’s Board of Directors or finance committee (however titled).
The TDFI and the Federal Reserve will examine the Bank periodically for compliance with various regulatory requirements. Such examinations, however, are for the protection of the DIF and for depositors and not for the protection of investors and shareholders.
107
Table of Contents
Index to Financial Statements
The Federal Deposit Insurance Corporation Improvement Act of 1991 (“FDICIA”)
The FDICIA substantially revised the depository institution regulatory and funding provisions of the FDIA, and made revisions to several other federal banking statutes. Among other things, FDICIA requires the federal banking regulators to take “prompt corrective action” in respect of FDIC-insured depository institutions that do not meet minimum capital requirements. FDICIA establishes five capital tiers: “well capitalized,” “adequately capitalized,” “undercapitalized,” “significantly undercapitalized” and “critically undercapitalized.” Under applicable regulations, a FDIC-insured depository institution is defined to be well capitalized if it maintains a Leverage Ratio of at least 5%, a risk adjusted Tier 1 Capital Ratio of at least 6% and a Total Capital Ratio of at least 10% and is not subject to a directive, order or written agreement to meet and maintain specific capital levels. An insured depository institution is defined to be adequately capitalized if it meets all of its minimum capital requirements as described above in the first paragraph of the section entitled “Capital Guidelines.” In addition, an insured depository institution is considered undercapitalized if it fails to meet any minimum required measure; significantly undercapitalized if it has a total risk-based capital ratio of less than 6%, a tier 1 risked-based capital ratio less than 3% or a leverage ratio less than 3%; and critically undercapitalized if it fails to maintain a level of tangible equity equal to not less than 2% of total assets. An insured depository institution may be deemed to be in a capitalization category that is lower than is indicated by its actual capital position if it receives an unsatisfactory examination rating.
FDICIA generally prohibits an FDIC-insured depository institution from making any capital distribution (including payment of dividends) or paying any management fee to its holding company if the depository institution would thereafter be undercapitalized. Undercapitalized depository institutions are subject to restrictions on borrowing from the Federal Reserve. In addition, undercapitalized depository institutions are subject to growth limitations and are required to submit capital restoration plans. A depository institution’s holding company must guarantee the capital plan, up to an amount equal to the lesser of 5% of the depository institution’s assets at the time it becomes undercapitalized or the amount of the capital deficiency when the institution fails to comply with the plan. The federal banking agencies may not accept a capital plan without determining, among other things, that the plan is based on realistic assumptions and is likely to succeed in restoring the depository institution’s capital. If a depository institution fails to submit an acceptable plan, it is treated as if it is significantly undercapitalized.
Significantly undercapitalized depository institutions may be subject to a number of requirements and restrictions, including orders to sell sufficient voting stock to become adequately capitalized, requirements to reduce total assets and cessation of receipt of deposits from correspondent banks. Critically undercapitalized depository institutions are subject to appointment of a receiver or conservator generally within 90 days of the date on which they became critically undercapitalized.
The capital-based prompt corrective action provision of FDICIA and their implementing regulations apply to FDIC-insured depository institutions and are not directly applicable to the holding companies which control those institutions. However, the Federal Reserve has indicated that, in regulating bank holding companies, it will take appropriate action at the holding company level based on an assessment of the effectiveness of supervisory actions imposed upon subsidiary depository institutions pursuant to these provisions and regulations.
The FDIC has adopted regulations under FDICIA governing the receipt of brokered deposits and pass-through insurance. Under the regulations, a bank cannot accept or rollover or renew brokered deposits unless it is well capitalized or it is adequately capitalized and receives a waiver from the FDIC. A bank that cannot receive brokered deposits also cannot offer “pass-through” insurance on certain employee benefit accounts. Whether or not it has obtained this waiver, an adequately capitalized bank may not pay an interest rate on any deposits in excess of 75 basis points over certain index prevailing market rates specified by regulation. There are no such restrictions on a bank that is well capitalized.
108
Table of Contents
Index to Financial Statements
FDICIA contains numerous other provisions, including accounting, audit and reporting requirements, limitations on the FDIC’s payment of deposits at foreign branches, new regulatory standards in such areas as asset quality, earnings and compensation and revised regulatory standards for, among other things, powers of state banks, real estate lending and capital adequacy. FDICIA also requires that a depository institution provide 90 days prior notice of the closing of any branches.
The Dodd-Frank Act
In July 2010, the Dodd-Frank Act was signed into law, incorporating numerous financial institution regulatory reforms. Many of these reforms were implemented over the course of 2011-13 and continue to be implemented through regulations being adopted by various federal banking and securities regulations. The following discussion describes the material elements of the regulatory framework. Many of the Dodd-Frank Act provisions are stated to only apply to larger financial institutions and do not directly impact community-based institutions like the Bank. For instance, provisions that regulate derivative transactions and limit derivatives trading activity of federally-insured institutions, enhance supervision of “systemically significant” institutions, impose new regulatory authority over hedge funds, limit proprietary trading by banks, and phase-out the eligibility of trust preferred securities for Tier 1 capital are among the provisions that do not directly impact the Bank either because of exemptions for institutions below a certain asset size or because of the nature of the Bank’s operations. Other provisions that will impact the Bank will:
| • | Change the assessment base for federal deposit insurance from the amount of insured deposits to consolidated assets less tangible capital, eliminate the ceiling and increase the size of the floor of the DIF, and offset the impact of the increase in the minimum floor on institutions with less than $10 billion in assets. |
| • | Make permanent the $250,000 limit for federal deposit insurance. |
| • | Repeal the federal prohibition on payment of interest on demand deposits, thereby permitting depositing institutions to pay interest on business transaction and other accounts. |
| • | Centralize responsibility for consumer financial protection by creating the CFPB, responsible for implementing federal consumer protection laws, although banks below $10 billion in assets will continue to be examined and supervised for compliance with these laws by their federal bank regulator. |
| • | Restrict the preemption of state law by federal law and disallow national bank subsidiaries from availing themselves of such preemption. |
| • | Impose new requirements for mortgage lending, including new minimum underwriting standards, prohibitions on certain yield-spread compensation to mortgage originators, special consumer protections for mortgage loans that do not meet certain provision qualifications, prohibitions and limitations on certain mortgage terms and various new mandated disclosures to mortgage borrowers. |
| • | Apply the same leverage and risk based capital requirements that apply to insured depository institutions to holding companies. |
| • | Permit national and state banks to establish de novo interstate branches at any location where a bank based in that state could establish a branch, and require that bank holding companies and banks be well-capitalized and well managed in order to acquire banks located outside their home state. |
109
Table of Contents
Index to Financial Statements
| • | Impose new limits on affiliated transactions and cause derivative transactions to be subject to lending limits. |
| • | Implement corporate governance revisions, including with regard to executive compensation and proxy access to shareholders that apply to all public companies not just financial institutions. |
Many aspects of the Dodd-Frank Act are subject to rulemaking and will take effect over several years, and their impact on the Bank or the financial industry is difficult to predict before such regulations are adopted. However, there is a significant possibility that the Dodd-Frank Act will, in the long run, increase regulatory burden, compliance costs, and interest expense for community banks.
Gramm-Leach-Bliley Act
The Gramm-Leach-Bliley Act ratified new powers for banks and bank holding companies, especially in the areas of securities and insurance. This law also includes requirements regarding the privacy and protection of customer information held by financial institutions, as well as many other providers of financial services. There are provisions providing for functional regulation of the various services provided by institutions among different regulators. There are other provisions which limit the future expansion of unitary thrift holding companies which now prevent companies like Wal-Mart from owning a thrift institution. Finally, among many other sections of this law, there is some relief for small banks from the regulatory burden of the CRA.
USA PATRIOT Act, International Money Laundering Abatement and Financial Anti-Terrorism Act, and Bank Secrecy Act
The Patriot Act contains the International Money Laundering Abatement and Financial Anti-Terrorism Act of 2001 (the “IMLAFA”). The IMLAFA substantially broadens existing anti-money laundering legislation, specifically related to the BSA, and the extraterritorial jurisdiction of the United States, imposes new compliance and due diligence obligations, creates new crimes and penalties, compels the production of documents located both inside and outside the United States, including those of foreign institutions that have a correspondent relationship in the United States, and clarifies the safe harbor from civil liability to customers. The U.S. Treasury Department has issued a number of regulations implementing the Patriot Act that apply certain of its requirements to financial institutions such as FFN’s banking and broker-dealer subsidiaries. The regulations impose new obligations on financial institutions to maintain appropriate policies, procedures and controls to detect, prevent and report money laundering and terrorist financing. The Treasury Department expects to issue a number of additional regulations which will further clarify the Patriot Act’s requirements.
The IMLAFA requires all “financial institutions,” as defined, to establish anti-money laundering compliance and due diligence programs. Such programs must include, among other things, adequate policies, the designation of a compliance officer, employee training programs, and an independent audit function to review and test the program.
The Housing and Economic Recovery Act of 2008 (the “Housing Act”)
The Housing Act contained three distinct divisions: Division A, which addressed housing finance reform and provided for the rescue of the Federal National Mortgage Association (“Fannie Mae”) and the Federal Home Loan Mortgage Corporation (“Freddie Mac”); Division B, which provided for foreclosure prevention; and Division C, which contained tax incentives, reforms and revenue offsets. The Housing Act was intended to help stabilize the nation’s housing markets and provide relief for homeowners. The legislation offered emergency financing to Fannie Mae and Freddie Mac, set up a $300-billion fund for the Federal Housing Administration (the “FHA”) to insure new 30-year fixed-rate mortgages for at-risk borrowers in owner-occupied homes if their lenders agree to write down loan balances to 90% of the homes’ current appraised value, and restored banks’ authority to make investments designed primarily to promote the public welfare through the provision of
110
Table of Contents
Index to Financial Statements
housing, services, or jobs, including distressed middle-income communities. To free up safer and more affordable mortgage credit, the Housing Act permanently increased to $625,500 (from $417,000) the size of home loans that Fannie Mae and Freddie Mac can buy and the FHA can insure. They also could buy and back mortgages 15% higher than the median home price in certain areas. The measure included $15 billion in tax cuts, including a significant expansion of the low-income housing tax credit and a credit of up to $7,500 for first-time home buyers for houses purchased between April 9, 2008, and July 1, 2009. Provisions of this law were updated by later legislation.
Emergency Economic Stabilization Act of 2008 and the American Recovery and Reinvestment Act of 2009
The Emergency Economic Stabilization Act of 2008 (“EESA”) provided authority to the Treasury Secretary to restore liquidity and stability to the U.S. financial system and to ensure the economic well-being of Americans. EESA authorized the Secretary to establish a Troubled Asset Relief Program (“TARP”) to purchase troubled assets from financial institutions and establish an Office of Financial Stability within the Treasury Department to implement the TARP. EESA required the Treasury Secretary to establish guidelines and policies to carry out the purposes of EESA, including a program to guarantee troubled assets of financial institutions and the establishment of risk-based premiums for such guarantees sufficient to cover anticipated claims.
EESA required federal entities to work with servicers to encourage loan modifications, considering net present value to the taxpayer. For mortgages and mortgage-backed securities acquired through TARP, the Secretary was required to implement a plan to mitigate foreclosures and to encourage servicers of mortgages to modify loans through Hope for Homeowners and other programs. The Secretary was authorized to loan guarantees and credit enhancement to avoid foreclosures. The Secretary was required to coordinate with other federal entities that hold troubled assets in order to identify opportunities to modify loans, considering net present value to the taxpayer.
Other provisions of EESA increased FDIC insurance from $100,000 to $250,000 on deposits, protected the Exchange Stabilization Fund (the “ESF”) from incurring any losses due to the temporary money market mutual fund guarantee by requiring the program created in the EESA to reimburse the ESF, restated the SEC’s authority to suspend the application of Statement Number 157 of the Financial Accounting Standards Board (mark to market) if the SEC determines that it is in the public interest and protects investors, changed the tax treatment of losses on the preferred stock of certain government sponsored entities, such as Freddie Mac and Fannie Mae, for financial institutions, applied limits on executive compensation and golden parachutes for certain executives of employers who participate in the auction program, and extended current law tax forgiveness on the cancellation of mortgage debt.
The American Recovery and Reinvestment Act of 2009 (“ARRA”) amended the EESA and was intended to provide a stimulus to the U.S. economy in the wake of the economic downturn. ARRA includes federal tax cuts, expansion of unemployment benefits and other social welfare provisions, and domestic spending in education, health care, and infrastructure, including the energy sector. ARRA also included numerous non-economic recovery related items that were either part of longer-term plans (e.g., a study of the effectiveness of medical treatments) or desired by Congress (e.g., a limitation on executive compensation in federally-aided banks).
Small Business Jobs and Credit Act of 2010
In July 2010, the U.S. Congress passed the Small Business Jobs and Credit Act of 2010, which includes as a part thereof, the establishment of a $30 billion SBLF. The SBLF is a fund created by Congress to be used by the Treasury to make preferred stock investments in banks and bank holding companies that are not on the FDIC’s troubled bank list to stimulate small business lending. Eligible banks and holding companies with less than $10 billion in assets can receive an investment totaling up to 3% of the institution’s risk-weighted assets. The size of the investment can be increased to 5% of risk-weighted assets for institutions under $1 billion in total
111
Table of Contents
Index to Financial Statements
assets. The Treasury’s guidelines related to the SBLF permit participants in the Capital Purchase Program (“CPP”) to refinance securities issued to the Treasury under the CPP. However, CPP investments would be required to be paid in full since simultaneous participation in the CPP and the SBLF is not permissible. Dividends will be payable quarterly on the preferred stock issued to the Treasury under the SBLF, but unlike dividends owed on preferred stock issued to the Treasury under the CPP, dividends payable on the preferred stock issued under the SBLF will be non-cumulative, meaning that the issuer can miss a regular dividend payment and not have to subsequently make the payment before it pays the next quarterly dividend. Accordingly, the preferred stock issued under the SBLF will qualify for Tier 1 capital treatment under the more stringent capital standards imposed under the Dodd-Frank Act. Although dividends on the preferred stock are non-cumulative, the failure to pay dividends causes certain consequences including prohibitions on repurchasing shares of the issuer’s stock or paying dividends on shares of the issuer’s stock that are pari passu or junior to the shares issued to the Treasury under the SBLF.
The initial dividend rate on the preferred stock issued under the SBLF program will be at most 5.0% but is subject to a reduction to as low as 1.0% during a participant’s first years after the investment depending on the amount of increase in the institution’s small business lending following its issuance of the preferred stock to the Treasury. After the initial four-and-a half year period the rate will increase to 9.0%. Under the SBLF, small business lending means lending as defined by and reported in an eligible institutions’ quarterly call report, where each loan comprising such lending is one of the following types: (i) C&I loans; (ii) owner-occupied nonfarm, nonresidential real estate loans; (iii) loans to finance agricultural production and other loans to farmers; and (iv) loans secured by farmland. Loans greater than $10 million or to businesses with more than $50 million in revenue are excluded. If any part of the loan is guaranteed by a U.S. government agency or enterprise, the guaranteed portion is subtracted from the loan amounts. See “DESCRIPTION OF CAPITAL STOCK—Preferred Stock.”
The JOBS Act
The JOBS Act increased the threshold under which a bank or bank holding company may terminate registration of a security under the Exchange Act to 1,200 shareholders of record from 300. The JOBS Act also raised the threshold requiring banks and bank holding companies to register to 2,000 shareholders from 500. Since the JOBS Act was signed, numerous banks or bank holding companies have filed to deregister their common stock.
FDIC Insurance Premiums
The Bank is required to pay quarterly FDIC deposit insurance assessments to the DIF. The FDIC merged the Bank Insurance Fund (“BIF”) and the Savings Association Insurance Fund (“SAIF”) to form the DIF on March 31, 2006, in accordance with the Federal Deposit Insurance Reform Act of 2005. The FDIC maintains the DIF by assessing depository institutions an insurance premium. The amount each institution is assessed is based upon statutory factors that include the balance of insured deposits as well as the degree of risk the institution poses to the insurance fund. The FDIC uses a risk-based premium system that assesses higher rates on those institutions that pose greater risks to the DIF.
Effective April 1, 2009, the FDIC revised its risk-based assessment system to adjust the risk-based calculation of an institution’s unsecured debt, secured liabilities and brokered deposits. On November 12, 2009, the FDIC announced a final rule to increase of 3 basis points the deposit assessment base rate, beginning January 1, 2011. Additional increases in premiums will impact FFN’s earnings adversely. Depending on any future losses that the FDIC insurance fund may suffer due to failed institutions, there can be no assurance that there will not be additional significant premium increases in order to replenish the fund.
Under the FDIA, insurance of deposits may be terminated by the FDIC upon a finding that the institution has engaged in unsafe and unsound practices, is in an unsafe or unsound condition to continue operations or has violated any applicable law, regulation, rule, order or condition imposed by a federal bank regulatory agency.
112
Table of Contents
Index to Financial Statements
Privacy
Under the Right to Financial Privacy Act, which imposes a duty to maintain confidentiality of consumer financial records and prescribes procedures for complying with administrative subpoenas of financial records, financial institutions are required to disclose their policies for collecting and protecting confidential information. Customers generally may prevent financial institutions from sharing personal financial information with nonaffiliated third parties except for third parties that market the institutions’ own products and services. Additionally, financial institutions generally may not disclose consumer account numbers to any nonaffiliated third party for use in telemarketing, direct mail marketing or other marketing through electronic mail to consumers.
The CRA
The CRA requires that, in connection with examinations of financial institutions within its jurisdiction, the FDIC and the state banking regulators, as applicable, evaluate the record of each financial institution in meeting the credit needs of its local community, including low and moderate-income neighborhoods. These facts are also considered in evaluating mergers, acquisitions and applications to open a branch or facility. Failure to adequately meet these criteria could impose additional requirements and limitations on us. Additionally, we must publicly disclose the terms of various CRA-related agreements.
Other Regulations
Interest and other charges that our subsidiary bank collects or contracts for are subject to state usury laws and federal laws concerning interest rates. Our bank’s loan operations are also subject to federal laws applicable to credit transactions, such as:
| • | The federal Truth-In-Lending Act, governing disclosures of credit terms to consumer borrowers; |
| • | The Home Mortgage Disclosure Act, requiring financial institutions to provide information to enable the public and public officials to determine whether a financial institution is fulfilling its obligation to help meet the housing needs of the community it serves; |
| • | The Equal Credit Opportunity Act, prohibiting discrimination on the basis of race, creed or other prohibited factors in extending credit; |
| • | The Fair Credit Reporting Act, governing the use and provision of information to credit reporting agencies; |
| • | The Fair Debt Collection Practices Act, governing the manner in which consumer debts may be collected by collection agencies; and |
| • | The rules and regulations of the various governmental agencies charge with the responsibility of implementing these federal laws. |
In addition, our bank subsidiary’s deposit operations are subject to the Electronic Funds Transfer Act and Regulation E issued by the Federal Reserve to implement this act, which governs automatic deposits to and withdrawals from deposit accounts and customers’ rights and liabilities arising from the use of automated teller machines and other electronic banking services.
Effects of Governmental Policies
The Bank’s earnings are affected by the difference between the interest earned by the Bank on its loans and investments and the interest paid by the Bank on its deposits or other borrowings. The yields on its assets and the rates paid on its liabilities are sensitive to changes in prevailing market rates of interest. Thus, the earnings
113
Table of Contents
Index to Financial Statements
and growth of the Bank are influenced by general economic conditions, fiscal policies of the federal government, and the policies of regulatory agencies, particularly the Federal Reserve, which establishes national monetary policy. The nature and impact of any future changes in fiscal or monetary policies cannot be predicted.
Commercial banks are affected by the credit policy of various regulatory authorities, including the Federal Reserve. An important function of the Federal Reserve is to regulate the national supply of bank credit. Among the instruments of monetary policy used by the Federal Reserve to implement these objectives are open market operations in U.S. Government securities, changes in reserve requirements on bank deposits, changes in the discount rate on bank borrowings and limitations on interest rates that banks may pay on time and savings deposits. The Federal Reserve uses these means in varying combinations to influence overall growth of bank loans, investments and deposits, and also to affect interest rates charged on loans, received on investments or paid for deposits.
The monetary and fiscal policies of regulatory authorities, including the Federal Reserve, also affect the banking industry. Through changes in the reserve requirements against bank deposits, open market operations in U.S. Government securities and changes in the discount rate on bank borrowings, the Federal Reserve influences the cost and availability of funds obtained for lending and investing. No prediction can be made with respect to possible future changes in interest rates, deposit levels or loan demand or with respect to the impact of such changes on the business and earnings of the Bank.
From time to time, legislation is enacted which has the effect of increasing the cost of doing business, limiting or expanding permissible activities, or affecting the competitive balance between banks and other financial institutions. With the enactments of EESA, AARA, and the Dodd-Frank Act and the significant amount of regulations that are to come from the passage of this legislation, the nature and extent of the future legislative and regulatory changes affecting financial institutions and the resulting impact on those institutions is very unpredictable at this time. Bills are currently pending which may have the effect of changing the way the Bank conducts its business.
114
Table of Contents
Index to Financial Statements
Directors
The following tables set forth information regarding our directors as of the date of this prospectus.
| Name |
Age |
Director Since | ||
| Jimmy E. Allen |
74 | July 2014 | ||
| Henry W. Brockman, Jr. |
65 | 2007 | ||
| James W. Cross, IV |
50 | July 2009 | ||
| Richard E. Herrington |
67 | 2007 | ||
| Dr. David H. Kemp |
56 | 2007 | ||
| Lee M. Moss |
63 | July 2014 | ||
| Paul M. Pratt, Jr. |
51 | 2007 | ||
| Pamela J. Stephens |
56 | July 2009 | ||
| Melody J. Sullivan |
62 | May 2010 |
The following is a brief discussion of the business and banking background and experience of our directors. Other than with respect to Messrs. Richard E. Herrington and Kevin Herrington, who are father and son, no director has any family relationship, as defined in Item 401 of Regulation S-K, with any other director or with any of our executive officers.
Jimmy E. Allen, age 74, is a director of FFN and the Bank. Mr. Allen is the President of Venture Express, Inc.; Creative Transportation; Allen’s Cartage Company, LaVergne, Tennessee; and co-owner of Center Hill Marina & Yacht Club. He attended Austin Peay State University, Clarksville, Tennessee and the University of Tennessee, Nashville. Mr. Allen formerly served as a member of the board of directors of MidSouth, Rutherford Bank & Trust, Murfreesboro and Independent Bank, Gallatin, Tennessee. He served as past chairman of Tennessee Trucking Association and Nashville Motor Freight. His past accomplishments include being selected as Nashville Business Journal’s Executive of the Year. He is a supporter of Vanderbilt Children’s Hospital and Ronald McDonald House.
Henry W. Brockman, Jr., age 65, has been a member of the board of directors of FFN and the Bank since both entities’ inception. Mr. Brockman has over 30 years of financial services and business experience, all of which is in Middle or West Tennessee. Mr. Brockman began his financial services career in 1979 as a securities broker with J.C. Bradford in Nashville, Tennessee. He rose through the ranks to become Managing Partner in charge of Institutional Sales and Trading before retiring in 2000. Mr. Brockman held Series 7, Series 63, and Series 8 licenses from 1979 through 2005. Mr. Brockman also held a listed seat at the NYSE from 1998 through 2000. From 2002 to 2004, Mr. Brockman was Manager of Institutional Sales for Morgan Keegan in Memphis, Tennessee. Mr. Brockman is a 1972 graduate of the University of Tennessee, Knoxville with a Bachelor of Science degree. In 1974, Mr. Brockman received a Masters of Library Science from the Peabody College (now Vanderbilt University) in Nashville, Tennessee.
James W. Cross, IV, age 50, has been a director of FFN and the Bank since July of 2009. Mr. Cross is President of Century Construction Company, Inc., a General Contractor in Franklin, Tennessee. Mr. Cross also serves as President of Land Contractors, Inc., a site development firm also based in Franklin, Tennessee. Mr. Cross has more than 20 years of business experience in Tennessee, beginning his career at Century Construction Company, Inc., a firm started by his father, James W. Cross, III in 1958. Mr. Cross served on the Board of Directors of Franklin Financial Corporation, parent of Franklin National Bank and the Tennessee affiliate Board of Directors of Fifth Third Bank in Franklin, Tennessee. Mr. Cross is a member of the board of directors of Williamson Medical Center, Battle Ground Academy, and the Williamson County Library Foundation. He previously served on the board of directors of Franklin Tomorrow, Leadership Franklin, Youth Leadership Franklin, the Franklin-Williamson County Chamber of Commerce and the Williamson County Library.
115
Table of Contents
Index to Financial Statements
Richard E. Herrington, age 67, is the President, Chief Executive Officer and Chairman of FFN and is the Chairman and Chief Executive Officer of the Bank. He is a veteran Williamson County, Tennessee banker with 40 years of banking experience. In his early career, he was employed by banks in Florida and South Carolina. He moved to Middle Tennessee in 1977, and began working at First American Bank in Nashville in financial management working up to Senior Vice President. Later, he was a bank consultant with Price Waterhouse prior to establishing his own community bank data processing and consulting firm. In 1988, Mr. Herrington co-founded Franklin Financial Corporation (Franklin National Bank) where he served as President and CEO until 2002. Late in 2002, he was recruited by the Board of Civitas BankGroup (then Cumberland Bancorp) and became the President and CEO and board member of the five-bank holding company, charged with engineering a turn-around of the troubled banking organization. In accomplishing this, he assembled a five-member executive management team that executed a successful four-year remediation plan. Mr. Herrington holds a B.A. from Newberry College in Newberry, South Carolina and certificates from the Graduate School of Economics at Florida State University and the Stonier Graduate School of Banking.
Dr. David H. Kemp, age 56, has been a member of the board of directors of FFN and the Bank since these entities’ inception. Dr. Kemp has more than 24 years of healthcare experience in Franklin, Tennessee. Dr. Kemp opened Kemp Orthodontics in Franklin in 1986 and has owned and operated the business since that time. Dr. Kemp serves on the Advisory Council of 3M Unitek in Monrovia, California, advising on new products and improvements to existing orthodontic products. From 1993 to April 2007, Dr. Kemp served as an Advisory Board member to First Tennessee Bank in Franklin, supporting Regional Presidents in the accomplishment of their responsibilities by assisting in contacts with community leaders. Dr. Kemp holds a Bachelor of Science from the University of Tennessee, Martin, Tennessee. Dr. Kemp is also a graduate of The University of Tennessee, Center for the Health Sciences, Memphis, Tennessee and holds both a Doctor of Dental Science and a Postdoctoral Master of Science in Orthodontics.
Lee Moss, age 63, is President of the Bank and a director of FFN and the Bank. Mr. Moss was the Chairman and Chief Executive Officer of MidSouth. He served on MidSouth’s Loan and Executive Committee (Executive Chairman), Trust Committee (Chairman), Executive Leadership Committee (Chairman) and the Asset/Liability Committee. In 1973, Mr. Moss graduated from the University of Tennessee with a Bachelor of Science degree, majoring in Banking. He graduated from the National Commercial Lending School in 1978 and the Graduate School of Banking of the South in 1983. Mr. Moss worked for Valley Fidelity Bank in Knoxville for one year after graduating from the University of Tennessee, and then worked 28 years with Third National Bank/SunTrust Bank in Nashville. He served in numerous leadership capacities in both the Retail and Commercial divisions of the bank, and in January 1995, he moved to Murfreesboro where he served as Regional President, overseeing Rutherford and Wilson Counties. In January 2003, Moss served as one of the organizers for MidSouth. Since moving to Murfreesboro, Mr. Moss currently serves as Chairman of Middle Tennessee Medical Center’s Board, member of Saint Thomas Health Services Board in Nashville, MTSU Wesley Foundation Board Member, Business Education Partnership Board, and as a Sunday School teacher and Administrative board member for First United Methodist Church. Moss is a graduate of Leadership Rutherford and Leadership Middle Tennessee.
Paul M. Pratt, Jr., age 51, has been a member of the board of directors of FFN and the Bank since those entities’ inception. Mr. Pratt has 28 years of financial services and business experience in Franklin, Tennessee. In 1983, Mr. Pratt began his financial services career with Full Service Insurance, an independent insurance broker in Franklin, Tennessee. He rose through the ranks to become President, the position he holds today. Mr. Pratt is a 1983 graduate of Columbia State Community College with an Associate Degree in Engineering. Mr. Pratt is a Past President of the Board of Directors of the Franklin Noon Rotary Club and a former board member of Williamson Medical Foundation, a non-profit dedicated to philanthropic community gifts to Williamson Medical Center in Franklin, Tennessee. Mr. Pratt also served on the Williamson County Advisory Board of Cumberland Bank until April 2007.
Pamela J. Stephens, age 56, has been a director of FFN and the Bank since July of 2009. Ms. Stephens is a Funeral Director and part owner of Williamson Memorial Funeral Home and Gardens in Franklin, Tennessee
116
Table of Contents
Index to Financial Statements
and Spring Hill Memorial Park and Funeral Home in Spring Hill, Tennessee. From 2003 to 2007, Ms. Stephens served on the board of directors of Cumberland Bank in Franklin, Tennessee. Ms. Stephens is a Paul Harris Fellow where she served as charter president of the Rotary Club of Spring Hill. She is a past president of the Cemetery Association of Tennessee and past president of the Southern Cemetery and Funeral Association, a member of the board of directors of the Franklin-Williamson County Chamber of Commerce and board of director of the Tennessee Funeral Directors Association.
Melody J. Sullivan, age 62, has been a director of FFN and the Bank since May of 2010. Ms. Sullivan founded the first woman-owned CPA firm in Franklin, Tennessee’s Historic Downtown business district in July of 1986 after working as a staff accountant for one of Nashville’s most respected business owners and CPA firms, and serving as comptroller for a local food service company. She served on the Board of Directors of Franklin National Bank for 14 years and Fifth Third Bank for 5 years. Ms. Sullivan is a member and past president of the Franklin Breakfast Rotary Club. She currently serves on the board of directors for Waves in Franklin, Tennessee, an organization dedicated to enabling individuals with intellectual and developmental disabilities to progress toward their full potential. She is a past president of the board of directors of Franklin Family YMCA and has served on the board of directors of United Way of Williamson County, Franklin Tomorrow, the Williamson County-Franklin Chamber of Commerce, The March of Dimes, Williamson County CASA, and Historic Carnton Plantation. Ms. Sullivan is a graduate of Leadership Franklin. She is a past chairperson of the Small Business Development Division of the Williamson County-Franklin Chamber of Commerce.
Executive Officers
The following tables set forth information regarding our executive officers as of the date of this prospectus.
| Name |
Age |
Position | ||||
| Sally E. Bowers |
61 | Executive Vice President, Chief Mortgage Officer of the Bank | ||||
| Dallas G. Caudle, Jr. |
67 | Executive Vice President, Rutherford County Community President of the Bank | ||||
| Kevin A. Herrington |
39 | Executive Vice President, Chief Operating Officer of the Bank | ||||
| Richard E. Herrington |
67 | President, Chief Executive Officer and Chairman of FFN and Chairman and Chief Executive Officer of the Bank | ||||
| J. Myers Jones, III |
64 | Executive Vice President, Chief Credit Officer of the Bank | ||||
| Sally P. Kimble |
61 | Executive Vice President, Chief Financial Officer, Chief Administrative Officer of FFN | ||||
| David J. McDaniel |
47 | Executive Vice President, Chief Retail Officer, Williamson County Community President of the Bank | ||||
| Lee M. Moss |
63 | President of the Bank | ||||
The following is a brief discussion of the business and banking background and experience of our executive officers. Other than with respect to Messrs. Richard E. Herrington and Kevin Herrington, who are father and son, no director has any family relationship, as defined in Item 401 of Regulation S-K, with any other director or with any of our executive officers.
Sally E. Bowers, age 61, has been the Executive Vice President and Mortgage Division Manager of the Bank since November 2007. She has over 30 years of banking experience in Middle Tennessee, primarily in the mortgage banking area. Ms. Bowers began her banking career in 1975 in retail banking at Fidelity Federal Savings Bank which later merged with Union Planters National Bank. During her 20 years at Fidelity Federal/Union Planters, she rose to Vice President and was responsible for mortgage, commercial and consumer loan production. She spent a short stint in 1996 as Vice President/Mortgage Production Officer at First American National Bank. In 1996, Ms. Bowers joined Franklin National Bank as Vice President/Mortgage Lending
117
Table of Contents
Index to Financial Statements
Manager and later rose to Senior Vice President with full responsibility for production, secondary market, servicing and operation of the bank’s mortgage subsidiary, Franklin Financial Mortgage. After the sale of Franklin National Bank, she joined Cumberland Bank as Executive Vice President and Mortgage Division Manager in 2004 with management responsibilities of the mortgage division. Ms. Bowers has thorough knowledge of all facets of mortgage banking. Ms. Bowers is a graduate of Memphis State University and the BAI Graduate School of Retail Banking at Vanderbilt University’s Owen School of Management.
Dallas G. Caudle, Jr., age 67, is the Executive Vice President, Rutherford County Community President of the Bank. Mr. Caudle was the President and Chief Operating Officer of MidSouth from 2009 until our acquisition of MidSouth effective July 1, 2014. Prior to that, Mr. Caudle was the Executive Vice President, Chief Operating Officer, and Corporate Secretary of MidSouth from 2003 to 2009. Mr. Caudle received a Bachelor of Science degree in Mathematics from Middle Tennessee State University. He continued his education through the American Institution of Banking; Tennessee School of Banking at Vanderbilt University, and the National Automated Clearing House Association’s The Payment Institute at the University of Colorado. Mr. Caudle began his banking career in 1971 at Murfreesboro Bank & Trust Company (now SunTrust Bank). He started as a Management Trainee, and within two years was promoted to Branch Manager. When Murfreesboro Bank & Trust moved to its new location in 1978, Mr. Caudle became the Data Processing Manager. Other positions he held while with the bank included Bank Operations Manager; Marketing and Product Development; Corporate Services Manager; and Commercial Lending Officer.
Kevin A. Herrington, age 39, is the Executive Vice President and Chief Operations Officer of the Bank. While completing his education, Mr. Herrington worked part-time in banking as a Systems Support Specialist from 1997 through 1998. After a term in the military, he joined Franklin National Bank in 2000 as the Manager of Information Systems, overseeing the IT department. In 2002, he was recruited to Civitas BankGroup to centralize and standardize the IT and data processing areas. He built a central wide-area network, improved security and controls, and implemented a complete update of policies and procedures. Mr. Herrington updated and brought in-house all technology and technology-related customer products. He successfully navigated the process of strengthening all IT-related controls related to compliance with the Sarbanes Oxley Act. Additionally, Mr. Herrington has achieved the major recognized certifications within the industry including CISSP (certified information systems security professional), and AAP (accredited ACH professional). Mr. Herrington is a graduate of Belmont University and served as a First Lieutenant in Field Artillery in the US Army. Kevin Herrington is the son of Richard E. Herrington.
Richard E. Herrington, age 67, is the President, Chief Executive Officer and Chairman of FFN and is the Chairman and Chief Executive Officer of the Bank. He is a veteran Williamson County, Tennessee banker with 40 years of banking experience. In his early career, he was employed by banks in Florida and South Carolina. He moved to Middle Tennessee in 1977, and began working at First American Bank in Nashville in financial management working up to Senior Vice President. Later, he was a bank consultant with Price Waterhouse prior to establishing his own community bank data processing and consulting firm. In 1988, Mr. Herrington co-founded Franklin Financial Corporation (Franklin National Bank) where he served as President and CEO until 2002. Late in 2002, he was recruited by the Board of Civitas BankGroup (then Cumberland Bancorp) and became the President and CEO and board member of the five-bank holding company, charged with engineering a turn-around of the troubled banking organization. In accomplishing this, he assembled a five-member executive management team that executed a successful four-year remediation plan. Mr. Herrington holds a B.A. from Newberry College in Newberry, South Carolina and certificates from the Graduate School of Economics at Florida State University and the Stonier Graduate School of Banking.
J. Myers Jones, III, age 64, serves as Executive Vice President, Chief Credit Officer, positions he has held since July of 2009. Mr. Jones has more than 30 years of local community banking experience, most recently with Cadence Bank in Franklin, Tennessee, where he served as Executive Vice President of Commercial Lending. Prior to his service at Cadence Bank, Mr. Jones served as President and CEO of Franklin National Bank in Franklin, Tennessee, for 13 years prior to Franklin National’s acquisition by Fifth Third Bank. In addition to
118
Table of Contents
Index to Financial Statements
Franklin National Bank and Cadence Bank, Mr. Jones was instrumental in the success of several other area banks, including Sovran Bank and Commerce Union Bank. Mr. Jones is a graduate of Austin Peay State University in Clarksville, Tennessee and the Herbert V. Prochnow Graduate School of Banking at the University of Wisconsin in Madison, Wisconsin. In addition, Mr. Myers is a graduate of the ABA National Commercial Lending School at the University of Oklahoma.
Sally P. Kimble, age 61, is the Executive Vice President, Chief Financial Officer and Chief Administrative Officer of FFN. Ms. Kimble’s background is primarily in accounting, operations and finance, having worked in community banking organizations for almost 30 years. Prior to joining the Bank in April 2012, Ms. Kimble had recently been with American Bank & Trust of the Cumberlands in Cookeville, Tennessee, where she served as Executive Vice President, Chief Operating Officer, and Chief Financial Officer. Kimble also served as Executive Vice President and Chief Financial Officer for Capital Bank & Trust Company (Capital Bancorp, Inc.) in Nashville for seven years and prior to that was Treasurer, Senior Vice President and Chief Financial Officer for First Bank & Trust (First Financial Corporation) in Mt. Juliet, Tennessee. Ms. Kimble holds a B.A. from the University of Tennessee and certificates from the Graduate School of Bank Investments and Financial Management at the University of South Carolina and the Graduate School of Banking of the South at Louisiana State University. In addition, she holds a certificate from the College of Financial Planning in Denver, Colorado.
David McDaniel, age 47, is the Executive Vice President and Chief Retail Officer of the Bank. Mr. McDaniel is a Brentwood native and served as Regional President at Community First Bank & Trust in Cool Springs prior to joining the Bank. In a banking career that spans more than 18 years, Mr. McDaniel has held roles at AmSouth Bank, First American Bank, Equitable Securities and Merrill Lynch. He holds a B.S. in Finance and an M.B.A. from the University of Tennessee in Knoxville, Tennessee. He is a graduate of Brentwood Academy in Brentwood. Mr. McDaniel is a graduate of Leadership Franklin and a member of the Williamson County/Franklin Chamber of Commerce.
Lee Moss, age 63, is President of the Bank and a director of FFN and the Bank. Mr. Moss was the Chairman and Chief Executive Officer of MidSouth. He served on MidSouth’s Loan and Executive Committee (Executive Chairman), Trust Committee (Chairman), Executive Leadership Committee (Chairman) and the Asset/Liability Committee. In 1973, Mr. Moss graduated from the University of Tennessee with a Bachelor of Science degree, majoring in Banking. He graduated from the National Commercial Lending School in 1978 and the Graduate School of Banking of the South in 1983. Mr. Moss worked for Valley Fidelity Bank in Knoxville for one year after graduating from the University of Tennessee, and then worked 28 years with Third National Bank/SunTrust Bank in Nashville. He served in numerous leadership capacities in both the Retail and Commercial divisions of the bank, and in January 1995, he moved to Murfreesboro where he served as Regional President, overseeing Rutherford and Wilson Counties. In January 2003, Moss served as one of the organizers for MidSouth. Since moving to Murfreesboro, Mr. Moss currently serves as Chairman of Middle Tennessee Medical Center’s Board, member of Saint Thomas Health Services Board in Nashville, MTSU Wesley Foundation Board Member, Business Education Partnership Board, and as a Sunday School teacher and Administrative board member for First United Methodist Church. Mr. Moss is a graduate of Leadership Rutherford and Leadership Middle Tennessee.
Director Independence
The Tennessee Business Corporation Act (the “TBCA”) as well as our Bylaws (which reference the TBCA) require our board of directors to have a minimum of one director. The board of directors may determine the number of directors from time to time by the vote of the majority of the whole board. The Tennessee Banking Act and the bylaws of the Bank require the Bank to have a board of directors consisting of not less than five nor more than 25 members. Each of the directors of the Bank during his or her whole term of service must be a citizen of the United States. A majority of the Bank’s directors must reside either within the State of Tennessee or within 100 miles of the location of any branch for at least one year immediately preceding their election and during the entire term of their service as directors.
119
Table of Contents
Index to Financial Statements
Under the rules of the , independent directors must comprise a majority of our board of directors not later than the first anniversary of the date of this offering. The rules of the , as well as those of the SEC, also impose several other requirements with respect to the independence of our directors. Our board of directors has undertaken a review of the independence of each director based upon these rules. Applying these standards, our board of directors has affirmatively determined that Mr. Allen, Ms. Stephens and Ms. Sullivan qualify as independent directors under applicable rules. In making these determinations, our board of directors considered the current and prior relationships that each director has with our company and all other facts and circumstances our board of directors deemed relevant in determining their independence, including the beneficial ownership of our capital stock by each director, and the transactions involving them described in the section titled “CERTAIN RELATIONSHIPS AND RELATED TRANSACTIONS.”
Leadership Structure
Our board of directors meets at least annually, and the board of directors of the Bank meets at least monthly. Our board of directors does not have a policy regarding the separation of the roles of Chief Executive Officer and Chairman of the Board, as the board believes that it is in the best interests of our organization to make that determination from time to time based on the position and direction of our organization and the membership of the board. The board has determined that having our Chief Executive Officer serve as Chairman of the Board is in the best interests of our shareholders at this time. This structure makes best use of the Chief Executive Officer’s extensive knowledge of our organization and the banking industry. The board views this arrangement as also providing an efficient connection between our management and the board, enabling the board to obtain information pertaining to operational matters expeditiously and enabling our Chairman to bring areas of concern before the board in a timely manner.
Committees of the Board of Directors
Our board of directors plans to establish the following committees in connection with this offering: an audit committee, a compensation committee and a corporate governance and nominating committee. The composition and responsibilities of each committee are described below. Members will serve on these committees until their resignation or until otherwise determined by our board of directors.
Audit Committee
The purpose of the audit committee will be set forth in the audit committee charter and will include assisting the board of directors in overseeing:
| • | the quality and integrity of our financial statements, our financial reporting process and our systems of internal accounting and financial controls; |
| • | our compliance with legal and regulatory requirements; |
| • | the independent auditor’s qualification, performance and independence; |
| • | the performance of our internal audit function; and |
| • | the evaluation of risk assessment and risk management issues. |
Upon consummation of this offering, the audit committee will consist of , and , with serving as chairman. Our board has determined each of these members is an independent director under the applicable SEC rules and the listing standards for audit committee members, and is an “audit committee financial expert” within the meaning of Item 407 of Regulation S-K. Each member of the audit committee has the ability to read and understand fundamental financial statements. Prior to the consummation of
120
Table of Contents
Index to Financial Statements
this offering, our board of directors will adopt a written charter under which the audit committee will operate. A copy of the charter, which will satisfy the applicable standards of the SEC and the , will be available on our website.
Nominating and Corporate Governance Committee
The purpose of the nominating and corporate governance committee will be set forth in the nominating and corporate governance committee charter and will include:
| • | identifying individuals qualified to become members of our board of directors, and selecting, or recommending that our board of directors select, the director nominees for each annual meeting of shareholders or to otherwise fill vacancies or newly created directorships on the board of directors; |
| • | overseeing the evaluation of the performance of our board of directors and management; |
| • | reviewing and recommending to our board of directors committee structure, membership and operations; |
| • | developing and recommending to our board of directors a set of corporate governance guidelines applicable to us; and |
| • | leading our board of directors in its annual review process. |
Upon consummation of this offering, the nominating and corporate governance committee will consist of , and , with serving as chairman. Prior to the consummation of this offering, our board of directors will adopt a written charter under which the nominating and corporate governance committee will operate. A copy of the charter, which will satisfy the applicable standards of the , will be available on our website.
Compensation Committee
The purpose of the compensation committee will be set forth in the compensation committee charter and will include:
| • | oversight of our executive compensation policies and practices; |
| • | reviewing and approving, or recommending to our board of directors to review and approve, matters related to the compensation of our Chief Executive Officer and our other executive officers; and |
| • | overseeing administration and monitoring of our incentive and equity-based compensation plans. |
Upon consummation of this offering, the compensation committee will consist of and , with serving as chairman. Our board has determined each of these members is an independent director under the applicable SEC rules and listing standards for compensation committee members. Prior to the consummation of this offering, our board of directors will adopt a written charter under which the compensation committee will operate. A copy of the charter, which will satisfy the applicable standards of the SEC and the , will be available on our website.
Risk Management and Oversight
The Board of Directors is responsible for engaging external accounting and auditing firms to independently assess critical elements of risk. The Committee has engaged Crowe Horwath LLP to perform the
121
Table of Contents
Index to Financial Statements
annual financial audit and render an opinion on the fairness of the financial statements. The firm of Crowell & Crowell, PLLC performs an annual audit of information systems and internal control. The firm of Crowell & Crowell, PLLC also performs loan review on a semi-annual and as-needed basis. Independent auditors report their findings directly to the Audit Committee of the Board of Directors.
Corporate Governance Guidelines and Code of Business Conduct and Ethics
Our board of directors will adopt corporate governance guidelines, which will set forth a flexible framework within which our board of directors, assisted by board committees, will direct the affairs of our company. The guidelines will address, among other things, the composition and functions of our board of directors, director independence, compensation of directors, management succession and review, board committees and selection of new directors.
We will adopt a code of business conduct and ethics applicable to our directors, officers and employees including specific standards and guidelines applicable to our principal executive, financial and accounting officers and all persons performing similar functions. A copy of that code and the corporate governance guidelines will be available on our corporate website upon completion of this offering. We expect that any amendments to such code and guidelines, or any waivers of their requirements, will be disclosed on our corporate website and by other means required by the rules.
122
Table of Contents
Index to Financial Statements
EXECUTIVE COMPENSATION AND OTHER INFORMATION
Compensation of Directors and Executive Officers
We are providing compensation disclosure that satisfies the requirements applicable to emerging growth companies, as defined in the JOBS Act. Our named executive officers for 2014, which consist of our principal executive officer and our two other most highly compensated executive officers are:
| • | Richard E. Herrington, our President, Chief Executive Officer and Chairman of the Board; |
| • | Sally E. Bowers, our Executive Vice President, Chief Mortgage Officer; and |
| • | J. Myers Jones, III, our Executive Vice President, Chief Credit Officer. |
Summary Compensation Table
The table below shows the compensation for services in all capacities we paid during the years ended December 31, 2014 and 2013, to our Chief Executive Officer and our two other most highly compensated executive officers (which we refer to as named executive officers):
| Name and Principal Position |
Year | Salary ($) |
Bonus ($) |
Stock Awards ($)(1) |
Option Awards ($)(1) |
All Other Compensation ($) |
Total ($) |
|||||||||||||||||||||
| Richard E. Herrington, Chief Executive Officer |
|
2014 2013 |
|
$ $ |
339,520 313,207 |
|
$ $ |
7,752 7,245 |
|
$ $ |
42,201 38,649 |
|
$ $ |
40,255 20,973 |
|
$ $ |
50,854 56,356 |
(2)
|
$ $ |
480,583 436,430 |
| |||||||
| Sally E. Bowers, EVP, Chief Mortgage Officer |
|
2014 2013 |
|
$ $ |
131,467 130,000 |
|
$ $ |
5,241 5,241 |
|
$ $ |
14,837 14,287 |
|
$ $ |
8,595 6,743 |
|
$ $ |
267,091 236,754 |
(3)
|
$ $ |
427,230 393,025 |
| |||||||
| J. Myers Jones, III, Chief Credit Officer |
|
2014 2013 |
|
$ $ |
189,137 176,639 |
|
$ $ |
4,332 4,030 |
|
$ $ |
28,350 26,117 |
|
|
15,985 11,667 |
|
|
18,286 11,360 |
(4)
|
$ $ |
256,090 229,813 |
| |||||||
| (1) | The amounts in the Stock Awards and Option Awards columns represent grant date fair values computed in accordance with Financial Accounting Standards Board Accounting Standards Codification Topic 718, Stock Compensation (FASB ASC Topic 718). The assumptions used in determining the values of stock awards and option awards are provided in Note 12 to FFN’s Consolidated Financial Statements contained elsewhere in this prospectus. |
| (2) | For 2014 includes: a company car allowance of $11,100; country club membership dues of $13,675; spouse travel of $2,063; 401(k) company matching contributions of $10,400; life insurance premiums of $3,756; director fees of $6,000; and health insurance premiums of $3,860. |
| (3) | For 2014, includes: $247,617 in commissions; a company car allowance of $6,000; 401(k) company matching contributions of $10,339; life insurance premiums of $662; and health insurance premiums of $2,473. |
| (4) | For 2014, includes: a company car allowance of $5,400; 401(k) company matching contributions of $8,036; life insurance premiums of $1,250; and health insurance premiums of $3,600. |
123
Table of Contents
Index to Financial Statements
Outstanding Equity Awards at Fiscal Year-End
The following tables show the number of equity awards outstanding as of December 31, 2014 for our named executive officers.
| Option Awards | Stock Awards | |||||||||||||||||||||||||||||||||||
| Name |
Number of Securities Underlying Unexercised Options (#) Exercisable |
Number of Securities Underlying Unexercised Options (#) Unexercisable(1) |
Equity Incentive Plan Awards: Number of Securities Underlying Unexercised Unearned Options (#) |
Option Exercise Price ($) |
Option Expiration Date(2) |
Number of Shares or Units of Stock That Have Not Vested (#)(3) |
Market Value of Shares or Units of Stock That Have Not Vested ($)(4) |
Equity Incentive Plan Awards: Number of Unearned Shares, Units or Other Rights That Have Not Vested (#) |
Equity Incentive Plan Awards: Market or Payout Value of Unearned Shares, Units or Other Rights That Have Not Vested ($) |
|||||||||||||||||||||||||||
| Richard E. Herrington |
39,375 | — | — | $ | 10.00 | 12/20/2017 | 5,505 | $ | 95,237 | — | — | |||||||||||||||||||||||||
| 3,508 | — | — | 10.00 | 02/20/2018 | ||||||||||||||||||||||||||||||||
| 22,437 | — | — | 11.75 | 06/15/2019 | ||||||||||||||||||||||||||||||||
| 3,085 | 1,542 | — | 10.00 | 07/22/2020 | ||||||||||||||||||||||||||||||||
| 7,041 | 4,694 | — | 10.50 | 06/02/2021 | ||||||||||||||||||||||||||||||||
| 8,727 | 13,090 | — | 12.00 | 06/01/2022 | ||||||||||||||||||||||||||||||||
| 2,173 | 8,694 | — | 13.00 | 05/31/2023 | ||||||||||||||||||||||||||||||||
| — | 11,628 | — | 13.50 | 04/15/2024 | ||||||||||||||||||||||||||||||||
| — | 5,000 | — | 13.50 | 07/31/2024 | ||||||||||||||||||||||||||||||||
| Sally E. Bowers |
9,375 | — | — | $ | 10.00 | 12/20/2017 | 1,978 | $ | 34,219 | — | — | |||||||||||||||||||||||||
| 638 | — | — | 10.00 | 02/20/2018 | ||||||||||||||||||||||||||||||||
| 11,151 | — | — | 11.75 | 06/15/2019 | ||||||||||||||||||||||||||||||||
| 2,900 | 725 | — | 10.00 | 07/22/2020 | ||||||||||||||||||||||||||||||||
| 3,150 | 2,100 | — | 10.50 | 06/02/2021 | ||||||||||||||||||||||||||||||||
| 3,590 | 5,384 | — | 12.00 | 06/01/2022 | ||||||||||||||||||||||||||||||||
| 699 | 2,795 | — | 13.00 | 05/31/2023 | ||||||||||||||||||||||||||||||||
| — | 3,494 | — | 13.50 | 04/15/2024 | ||||||||||||||||||||||||||||||||
| J. Myers Jones, III |
— | 6,498 | — | $ | 13.50 | 04/15/2024 | 3,707 | $ | 64,131 | |||||||||||||||||||||||||||
| 4,000 | — | — | 11.75 | 07/23/2019 | ||||||||||||||||||||||||||||||||
| 5,614 | 1,403 | — | 10.00 | 07/22/2020 | ||||||||||||||||||||||||||||||||
| 5,241 | 3,494 | — | 10.50 | 06/02/2021 | ||||||||||||||||||||||||||||||||
| 5,713 | 8,569 | — | 12.00 | 06/01/2022 | ||||||||||||||||||||||||||||||||
| 1,209 | 4,836 | — | 13.00 | 06/06/2018 | ||||||||||||||||||||||||||||||||
| (1) | Options vest in five equal increments beginning on the first anniversary of grant. |
| (2) | The expiration date of each option occurs ten years after the date of grant for each option. |
| (3) | Restricted stocks awards were granted on May 31, 2013 and April 15, 2014, as part of the Bank’s equity incentive plan and vest in 5 equal increments over 5 years. |
| (4) | Based on a share price of $17.30, the last reported sale of our common stock on December 31, 2014. |
124
Table of Contents
Index to Financial Statements
Outside Director Compensation Table for 2014
| Name(1) |
Fees Earned or Paid in Cash ($) |
Stock Awards ($) |
Option Awards ($)(2)(3) |
Non-Equity Incentive Plan Compensation ($) |
Nonqualified Deferred Compensation Earnings ($) |
All Other Compensation ($) |
Total ($) | |||||||||||||||||||||
| Jimmy E. Allen |
$ | 2,000 | — | $ | 40,315 | — | — | — | $ | 42,315 | ||||||||||||||||||
| Henry W. Brockman, Jr. |
4,000 | — | 7,854 | — | — | — | 11,854 | |||||||||||||||||||||
| James W. Cross, IV |
4,000 | — | 7,854 | — | — | — | 11,854 | |||||||||||||||||||||
| Dr. David H. Kemp |
4,750 | — | 7,854 | — | — | — | 12,604 | |||||||||||||||||||||
| Matthias B. Murfree, III(4) |
1,000 | — | 40,315 | — | — | — | 41,315 | |||||||||||||||||||||
| Paul M. Pratt, Jr. |
4,000 | — | 7,854 | — | — | — | 11,854 | |||||||||||||||||||||
| Melody J. Sullivan |
4,750 | — | 7,854 | — | — | — | 12,604 | |||||||||||||||||||||
| Pamela J. Stephens |
4,000 | — | 7,854 | — | — | — | 11,854 | |||||||||||||||||||||
| (1) | Mr. Herrington’s compensation is discussed above under the heading “Summary Compensation Table.” |
| (2) | The aggregate number of option awards outstanding at December 31, 2014, to outside directors was as follows: |
| Henry W. Brockman, Jr. |
18,675 | |||
| James W. Cross, IV |
9,300 | |||
| Dr. David H. Kemp |
19,925 | |||
| Paul M. Pratt, Jr. |
19,925 | |||
| Melody J. Sullivan |
8,850 | |||
| Pamela J. Stephens |
9,300 | |||
| Jimmy E. Allen |
6,389 |
| (3) | The amounts in the Option Awards column represent grant date fair values computed in accordance with Financial Accounting Standards Board Accounting Standards Codification Topic 718, Stock Compensation (FASB ASC Topic 718). The assumptions used in determining the values of option awards are provided in Note 12 to FFN’s Consolidated Financial Statements contained elsewhere in this prospectus. |
| (4) | Mr. Murfree’s term as a director ceased on November 5, 2014 upon his death. |
Directors of the Bank receive fees for monthly Board meetings. The Board of Directors of FFN meets at least once per year, and the Board of Directors of the Bank meets monthly. Audit and Personnel Committee chairpersons also receive fees for committee meetings.
There is standard medical and disability insurance for officers and employees similar to other banking institutions in the area. FFN may enter into other incentive compensation, bonus, and/or pension plans with its officers and employees in the future as may be decided by the Board of Directors. Officers and employees will receive salaries standard in the market and industry. See “BUSINESS—Employees.”
An aggregate of equity incentive awards equal to up to 2,000,000 shares is reserved for stock options and restricted shares for employees and others pursuant to an Omnibus Equity Incentive Plan (see further details below). Stock options have been issued with exercise prices ranging from $8.57-$18.45. Options and restricted shares have been issued in the following amounts to the described groups of individuals:
1. Incorporators/Non-Employee Directors. Each of the Incorporators received options to purchase 12.5% of the number of shares that the Incorporator purchased in FFN’s initial stock offering (up to the first 50,000 shares an Incorporator purchased) at $10.00 per Share, resulting in 33,750 options issued to Incorporators. No Incorporator could receive options to purchase shares that exceed the number of shares being purchased by the Incorporator. Such options were issued to the Incorporators as a form of recognition for the risk these individuals bore and their efforts in organizing FFN. In addition, non-employee directors were issued an additional 500 options each on February 20, 2008; 3,875 options each
125
Table of Contents
Index to Financial Statements
on June 15, 2009; 450 options each on July 22, 2010; 900 options each on June 2, 2011; 2,175 options each on June 1, 2012; and 2,475 options each on May 31, 2013, for year-end compensation, and 3,300 options each on June 1, 2014.
2. Employees. As an incentive to employees of FFN or the Bank, incentive awards are made available for allocation by the Board of Directors through the Omnibus Equity Incentive Plan. Currently, FFN has the ability to issue up to 607,068 additional equity incentive awards after allocating 1,217,644 options to employees/directors/incorporators and 103,744 shares of restricted stock to employees for year-end incentive compensation.
2007 Omnibus Equity Incentive Plan
In 2007, FFN adopted the 2007 Qualified-Nonqualified Stock Option Plan. The shareholders of FFN at the annual meeting of shareholders in 2013 approved an amendment and restatement of this plan to be renamed the 2007 Omnibus Equity Incentive Plan (the “Plan”) (i) to increase the number of shares of FFN’s common stock available for issuance under the Plan from 1,000,000 to 1,500,000; and (ii) to add other forms of compensation that can be awarded under the Plan to include Stock Appreciation Rights (“SARs”), Restricted Stock, and cash awards. The shareholders of FFN at the annual meeting of shareholders in 2014 approved an amendment to the Plan to increase the number of shares of FFN’s common stock available for issuance under the Plan from 1,500,000 to 2,000,000. The Board of Directors recommended adoption of the amendments as being necessary to attract new employees as FFN continues to grow and to have the ability to continue to reward employees with such incentive compensation, and encourage such valued employees to acquire a proprietary interest in FFN and to remain in its employ and service.
The Plan allows a committee chosen by the Board of Directors (“Committee”) to grant incentive stock options (“ISOs”) within the meaning of the Internal Revenue Code of 1986, as amended (the “Code”) to key employees and officers of FFN and the Bank and non-qualified options (“NSOs” and, together with the ISOs, the “Options”) to non-employee directors, incorporators, and others for the purchase of shares (“Participants”). As amended, the Plan also allows the Committee to grant awards of SARs, restricted stock, and cash to key employees and officers of FFN and the Bank and to non-employee directors and incorporators. The purpose of the Plan is to advance the interests of FFN and the Bank by stimulating the efforts of key employees, directors, incorporators, and consultants, increasing their desire to continue in their employment with or services to FFN and the Bank, assisting FFN and the Bank in competing effectively with other enterprises for the services of new employees and directors necessary for the continued improvement of operations, and to attract and retain the best possible personnel for service as employees, officers, directors, and consultants of FFN and the Bank. Accordingly, the Plan is designed to promote the interests of FFN and the Bank and its shareholders, and, by facilitating stock ownership on the part of such participants, to encourage them to acquire a proprietary interest in FFN and to remain in its employ and service.
Committee Authority
The Committee may at any time terminate, suspend, or amend the Plan, except that the Committee shall not, without the authorization of the holders of a majority of the Stock (as defined in the Plan) voted at a shareholders’ meeting duly called and held, change any provisions (other than those adjustments for changes in capitalization) that (a) result in repricing Options or otherwise increase the benefits accruing to Participants or non-employee directors, (b) increase the number of shares of common stock issuable under the Plan or (c) modify the requirements for eligibility as a Participant in the Plan. The Committee may postpone any exercise of an Option for such time as the Committee may deem necessary in order to permit FFN (i) to effect, amend, or maintain any necessary registration of the Plan or the shares issuable upon the exercise of an Option under the securities laws of any applicable jurisdiction, (ii) to permit any action to be taken in order to (A) list such stock on a stock exchange if shares are then listed on such exchange or (B) comply with restrictions or regulations incident to the maintenance of a public market for its shares, including any rules or regulations of any stock
126
Table of Contents
Index to Financial Statements
exchange on which the shares are listed, or (iii) to determine that such shares and the Plan are exempt from such registration or that no action of the kind referred to in (ii) (B) above needs to be taken; and FFN shall not be obligated by virtue of any terms and conditions of any Option Agreement (as defined in the Plan) or any provision of the Plan to recognize the exercise of an Option or to sell or issue shares in violation of the Act or the law of any government having jurisdiction thereof. Any such postponement does not extend the terms of an Option and neither FFN nor its directors or officers have respect to any shares as to which the Option shall lapse because of such postponement.
Types of Awards
Options
Options are rights to purchase a specified number of shares of common stock at a price fixed by the Committee. Each option must be represented by an award agreement that identifies the option as either an “incentive stock option” within the meaning of Section 422 of the Code or “non-qualified option,” which does not satisfy the conditions of Section 422 of the Code. The award agreement also must specify the number of shares of common stock that may be issued upon exercise of the options and set forth the exercise price of the options. The exercise price for options that qualify as incentive stock options may not be less than 100% of the fair market value of the common stock as of the date of grant. The option exercise price may be satisfied in cash, by check, by exchanging shares of common stock owned by the Participant, delivery of a properly executed exercise notice along with sale or loan proceeds, other consideration permitted by applicable laws or by a combination of these methods. Options have a maximum term of ten years from the date of grant. The Committee has broad discretion to determine the terms and conditions upon which options may be exercised, and the Committee may determine to include additional terms in the award agreements.
Stock Appreciation Rights
SARs may be granted in connection with a previously or contemporaneously granted stock option or independently. SARs are rights to receive cash or shares of common stock, or a combination thereof, as the Committee may determine. The Committee may provide in the SAR agreement circumstances under which SARs will become immediately exercisable and may accelerate the exercisability of any SAR at any time. To date, FFN has not issued any SARs under the Plan.
SARs granted in connection with a stock option are exercisable only when and to the extent that the related stock option is exercisable and expire on the date on which the related stock option expires. If a SAR granted in connection with a stock option is exercised, the related stock option ceases to be exercisable. The amount of the payment for SARs granted in connection with stock options is equal to the excess of (i) the fair market value on the date of exercise of the SAR of the common stock covered by the surrendered portion of the related stock option over (ii) the exercise price of the stock option covered by the surrendered portion of the related stock option.
SARs granted independently of stock options are exercisable as specified in the award agreement. The amount of the payment for SARs granted independently of stock options is equal to the excess of (i) the fair market value of the common stock covered by the exercised portion of the SAR as of the date of such exercise over (ii) the fair market value of the common stock covered by the exercised portion of the SAR as of the last market trading date prior to the date on which the SAR was granted; provided, however, that the Committee may place limits on the aggregate amount that may be paid upon exercise of a SAR.
Stock Awards
Restricted Stock grants are awards of common stock subject to vesting restrictions and/or restrictions on transferability. Shares of common stock that are issued as “restricted stock” will have a legend and may not be
127
Table of Contents
Index to Financial Statements
sold, transferred, or disposed of until the restrictions have lapsed. The shares do have voting rights prior to the vesting thereof and would be entitled to receive dividends if paid by FFN prior to the vesting of the shares. The Committee has broad discretion as to the specific terms and conditions of each award, including applicable rights upon certain terminations of employment and restrictions on the transferability of stock purchased pursuant to stock purchase rights.
Cash Bonuses
Cash bonus awards entitle the grantee to cash payments based upon the achievement of employment or pre-established long-term performance factors. The Committee has discretion to determine the Participants to whom cash bonus awards are to be made, the times in which such awards are to be made, the size of such awards, and all other conditions of such awards, including any performance requirements.
Adjustments upon Change of Capitalization
Subject to any required action by FFN’s shareholders, the number of shares of common stock covered by outstanding stock options, SARs, or restricted stock, and the number of shares of common stock which have been authorized for issuance under the Plan but as to which no award has been granted or which have been returned to the Plan upon cancellation or expiration of an award, as well as the price per share of common stock covered by each such outstanding award, will be proportionately adjusted for any increase or decrease in the number of issued shares of common stock resulting from a stock split, reverse stock split, stock dividend, combination or reclassification of the common stock, or any other increase or decrease in the number of issued shares of common stock effected without receipt of consideration by FFN.
Transferability
Awards may not be sold, pledged, assigned, hypothecated, transferred (except by will or the laws of descent or distribution) or disposed without obtaining from the Committee permission to transfer such awards, which the Committee may (but need not) grant after making certain conclusions regarding the award’s transferability that are set forth in the Plan. Further, no award shall be payable to or exercisable by anyone other than the Participant to whom it was granted while the Participant is alive except in cases involving (a) permanent disability involving a mental incapacity or (b) awards that have been transferred in accordance with the Plan.
Amendment and Termination
The Board of Directors may amend, alter, suspend or terminate the Plan at any time. Any amendment to the Plan must be approved by the shareholders to the extent such approval is required by the terms of the Plan, the rules and regulations of the SEC, or the rules and regulations of any exchange upon which FFN’s stock is listed, if any. However, no amendment, alteration, suspension or termination of the Plan may impair the rights of any Participant, unless mutually agreed in writing by the Participant and the Committee.
Federal Income Tax Consequences
The following is a summary of the material anticipated United States federal income tax consequences of the Plan to FFN and the Participants. The summary is based on current federal income tax law, which is subject to change, and does not address state, local, or foreign tax consequences or considerations.
The grant of a stock option that does not have a readily ascertainable value will not result in taxable income at the time of the grant for either FFN or the Participant. Upon exercising an incentive stock option, the Participant will have no taxable income (except that the alternative minimum tax may apply) and FFN will receive no deduction. Upon exercising a nonqualified stock option, the Participant will recognize ordinary income in the amount by which the fair market value of common stock at the time of exercise exceeds the option
128
Table of Contents
Index to Financial Statements
exercise price, and FFN will be entitled to a deduction for the same amount. The Participant’s income is subject to withholding tax as wages if the Participant is an employee.
The tax treatment of the Participant upon a disposition of shares of common stock acquired through the exercise of an option is dependent upon the length of time that the shares have been held and on whether such shares were acquired by exercising an incentive stock option or a nonqualified stock option. If an employee exercises an incentive stock option and holds the shares for at least two years from the date of grant and at least one year after exercise, then any gain or loss realized based on the exercise price of the option will be treated as long-term capital gain or loss. Shares obtained upon exercise of an incentive stock option that are sold without satisfying these holding periods will be treated as shares received from the exercise of a nonqualified stock option. Generally, upon the sale of shares obtained by exercising a nonqualified stock option, the Participant will treat the gain realized on the sale as a capital gain. Generally, there will be no tax consequence to FFN in connection with the disposition of shares of common stock acquired under a stock option, except that FFN may be entitled to a deduction in the case of a disposition of shares acquired upon exercise of an incentive stock option before the applicable holding periods have been satisfied.
The grant of a SAR will not result in taxable income to the Participant at the time of the award. Upon exercising the SAR, the Participant will recognize ordinary income in the amount by which the fair market value of the common stock or the amount of cash, as the case may be, exceeds the SAR exercise price, if any. FFN will be entitled to a deduction for the same amount. The Participant’s income is subject to withholding tax as wages if the Participant is an employee. Upon a disposition of shares of common stock acquired through the exercise of the SAR, the Participant may recognize capital gain or loss, the character of which is dependent upon the length of time that the shares have been held. Generally, there will be no tax consequences to FFN in connection with the disposition of shares of common stock acquired under a SAR.
The federal income tax consequences of awards of restricted stock will depend on the facts and circumstances of each award, and in particular, the nature of the restrictions imposed with respect to the common stock, which is the subject of the award. In general, if the common stock is subject to a substantial risk of forfeiture, i.e., limited in terms of transferability, a taxable event occurs only when the risk of forfeiture lapses. At that time, the Participant will recognize ordinary income to the extent of the excess of the fair market value of the common stock on the date the risk ceases over the amount that the Participant paid for the shares, if any, and FFN will be entitled to a deduction in the same amount. Prior to the lapse of restrictions on the restricted stock, any dividends on such shares will be paid currently and will be treated as ordinary compensation income to the Participant, subject to withholding. Subsequent to the determination and satisfaction of the ordinary income tax consequences, any further gain or loss realized on the subsequent disposition of such stock will be a long- or short-term capital gain or loss depending upon the applicable holding period.
Alternatively, within thirty days after transfer of the restricted stock, a Participant may make an election under Section 83(b) of the Code, which would allow the Participant to include in income in the year that the restricted common stock is awarded an amount equal to the fair market value of the restricted stock on the date of such award determined as if the restricted common stock were not subject to restrictions. FFN is then entitled to a compensation-paid deduction in the same amount. The election is required to be written and delivered to FFN within that thirty-day period. The Participant is also required to confirm the election with the filing of the Participant’s federal income tax return for the year in which the award is made. Failure to satisfy either of these requirements may invalidate the intended election. In the event of a valid Section 83(b) election, the Participant will not recognize income at the time that the restrictions actually lapse. In addition, any appreciation or depreciation in the value of the stock and any dividends paid on the stock after a valid Section 83(b) election are not deductible by FFN as compensation paid. For purposes of determining the period of time that the Participant holds the restricted stock, the holding period begins on the award date when a Participant makes a Section 83(b) election. Further, any dividends received after the Section 83(b) election is made will constitute ordinary dividend income to the Participant and will not be deductible by FFN. If the restricted stock subject to the Section 83(b) election is subsequently forfeited, however, the Participant is not entitled to a deduction or tax refund.
129
Table of Contents
Index to Financial Statements
A Participant will realize ordinary compensation income upon receipt of a cash bonus award equaling the amount of cash received. Wage withholding rules will apply. FFN will be entitled to a deduction at the time of payment in an amount equal to such income.
Award Grants
The grant of awards under the Plan is at the discretion of the Committee. The Committee has made awards of Incentive Stock Options, Nonqualified Stock Options, and restricted shares. Effective as of June 24, 2014, the aggregate number of shares of common stock reserved for equity incentive awards for employees and others pursuant to the Plan was increased from 1,500,000 to 2,000,000. Outstanding options and restricted shares were issued in the following amounts to the described groups of individuals:
| 2007-December 31, 2014: |
||||
| Total Granted Non-employee Directors |
175,120 | |||
| Total Granted Employees |
1,314,176 | |||
| Total Forfeited or expired |
(242,088 | ) | ||
| Total Exercised |
(29,564 | ) | ||
|
|
|
|||
| Total outstanding equity incentive awards at 12/31/14 |
1,217,644 | |||
|
|
|
COMPENSATION COMMITTEE INTERLOCKS AND INSIDER PARTICIPATION
During the last fiscal year, the entire board of directors of FFN performed the functions of the Compensation Committee. None of FFN’s executive officers has ever served as a director of another entity any of whose executive officers served on FFN’s Compensation Committee.
130
Table of Contents
Index to Financial Statements
SECURITY OWNERSHIP OF CERTAIN BENEFICIAL OWNERS AND MANAGEMENT
The following table sets forth information with respect to the beneficial ownership of our common stock as of December 31, 2014 for each of our directors; each of our named executive officers; and all of our executive officers and directors as a group, subject to certain assumptions set forth in the footnotes and as adjusted to reflect the sale of the shares of our common stock offered in this offering. We are not aware of any shareholder, or group of affiliated shareholders, who beneficially owns more than five percent of the outstanding shares of our common stock.
Beneficial ownership for the purposes of the following table is determined in accordance with rules and regulations of the SEC and generally includes any shares over which a person exercises sole or shared voting and/or investment power. Shares of common stock subject to options and warrants currently exercisable or exercisable within 60 days are deemed outstanding for purposes of computing the percentage ownership of the person holding the options or warrants but are not deemed outstanding for purposes of computing the percentage ownership of any other person. Except as otherwise indicated, we believe the beneficial owners of the common stock listed below, based on information furnished by them, have sole voting and investment power with respect to the number of shares listed opposite their names.
The number of shares to be sold in this offering and the number of shares and percentages of beneficial ownership after this offering set forth below are based on 7,757,445 shares of our common stock outstanding on December 31, 2014, plus the number of shares of our common stock to be sold in this offering, assuming no exercise of the underwriters’ option to purchase additional shares.
Unless otherwise indicated, the address of each of the individuals named in the table below under “Named Executive Officers and Directors” is c/o Franklin Financial Network, Inc., 722 Columbia Avenue, Franklin, Tennessee 37064.
| Shares Beneficially Owned Prior to this Offering |
Shares Beneficially Owned After Giving Effect to this Offering |
|||||||||||
| Name |
Number | Percentage | Percentage | |||||||||
| Named Executive Officers and Directors: |
||||||||||||
| Jimmy E. Allen |
95,763 | (1) | 1.23 | % | % | |||||||
| Sally E. Bowers |
35,250 | (2) | * | % | ||||||||
| Henry W. Brockman, Jr. |
78,565 | (3) | 1.01 | % | % | |||||||
| James W. Cross, IV |
22,265 | (4) | * | % | ||||||||
| Richard E. Herrington |
352,624 | (5) | 4.50 | % | % | |||||||
| Dr. David H. Kemp |
296,501 | (6) | 3.82 | % | % | |||||||
| Lee Moss |
61,057 | (7) | * | % | ||||||||
| Paul M. Pratt, Jr. |
37,890 | (8) | * | % | ||||||||
| Pamela J. Stephens |
5,298 | (9) | * | % | ||||||||
| Melody J. Sullivan |
8,030 | (10) | * | % | ||||||||
| J. Myers Jones, III |
25,886 | (11) | * | % | ||||||||
| All Executive Officers and Directors as a group (15 persons) |
1,136,973 | 14.17 | % | % | ||||||||
| * | Amount represents less than 1.0% of outstanding common stock. |
| (1) | Includes 89,374 shares of our outstanding common stock beneficially owned by Mr. Allen. Also includes 6,389 shares of common stock issuable upon the exercise of options exercisable on December 31, 2014 or within 60 days thereafter. |
| (2) | Includes 1,770 shares of our outstanding common stock beneficially owned by Ms. Bowers. Also includes 1,978 shares of restricted stock and 31,502 shares of common stock issuable upon the exercise of options exercisable on December 31, 2014 or within 60 days thereafter. |
131
Table of Contents
Index to Financial Statements
| (3) | Includes 53,300 shares of our outstanding common stock beneficially owned by Mr. Brockman. Also includes 13,500 shares of common stock held by Mr. Brockman’s spouse, warrants to purchase 125 shares of our common stock and 11,640 shares of common stock issuable upon the exercise of options exercisable on December 31, 2014 or within 60 days thereafter. |
| (4) | Includes 20,000 shares of our outstanding common stock beneficially owned by Mr. Cross jointly. Also includes 2,265 shares of common stock issuable upon the exercise of options exercisable on December 31, 2014 or within 60 days thereafter. |
| (5) | Includes 151,473 shares of our outstanding common stock beneficially owned by Mr. Herrington. Also includes 5,505 shares of restricted stock, 52,000 shares held by Mr. Herrington’s wife, 57,300 shares of common stock beneficially owned by Mr. Herrington jointly, and 86,346 shares of common stock issuable upon the exercise of options exercisable on December 31, 2014 or within 60 days thereafter. |
| (6) | Includes 142,605 shares of our outstanding common stock beneficially owned by Mr. Kemp. Also includes 140,506 shares held by Mr. Kemp’s wife, warrants to purchase 500 shares of our common stock, and 12,890 shares of common stock issuable upon the exercise of options exercisable on December 31, 2014 or within 60 days thereafter. |
| (7) | Includes 38,174 shares of our common stock beneficially owned by Mr. Moss. Also includes 3,716 shares of restricted stock and 19,167 shares of common stock issuable upon the exercise of options exercisable on December 31, 2014 or within 60 days thereafter. |
| (8) | Includes 10,000 shares of our outstanding common stock beneficially owned by Mr. Pratt. Also includes 15,000 shares held by Mr. Pratt’s wife, and 12,890 shares of common stock issuable upon the exercise of options exercisable on December 31, 2014 or within 60 days thereafter. |
| (9) | Includes 2,908 shares of our outstanding common stock beneficially owned by Ms. Stephens. Also includes warrants to purchase 125 shares of our common stock, and 2,265 shares of common stock issuable upon the exercise of options exercisable on December 31, 2014 or within 60 days thereafter. |
| (10) | Includes 6,000 shares of our outstanding common stock beneficially owned by Ms. Sullivan. Also includes warrants to purchase 125 shares of our common stock, and 1,905 shares of common stock issuable upon the exercise of options exercisable on December 31, 2014 or within 60 days thereafter. |
| (11) | Includes 402 shares of our outstanding common stock beneficially owned by Mr. Jones. Also includes 3,707 shares of restricted stock and 21,777 shares of common stock issuable upon the exercise of options exercisable on December 31, 2014 or within 60 days thereafter. |
132
Table of Contents
Index to Financial Statements
CERTAIN RELATIONSHIPS AND RELATED TRANSACTIONS
The Bank has had, and expects to have in the future, loans and other banking transactions in the ordinary course of business with directors (including our independent directors) and executive officers of FFN and its subsidiaries, including members of their families or corporations, partnerships or other organizations in which such officers or directors have a controlling interest. These loans are made on substantially the same terms (including interest rates and collateral) as those available at the time for comparable transactions with persons not related to the bank and did not involve more than the normal risk of collectability or present other unfavorable features.
In addition, the Bank is subject to the provisions of Section 23A of the Federal Reserve Act, which places limits on the amount of loans or extensions of credit to, or investments in, or certain other transactions with, affiliates and on the amount of advances to third parties collateralized by the securities or obligations of affiliates. the Bank is also subject to the provisions of Section 23B of the Federal Reserve Act which, among other things, prohibits an institution from engaging in certain transactions with certain affiliates unless the transactions are on terms substantially the same, or at least as favorable to such institution or its subsidiaries, as those prevailing at the time for comparable transactions with nonaffiliated companies.
Policies and Procedures for Related Person Transactions
FFN has a written related person transactions policy, pursuant to which FFN’s executive officers, directors and principal shareholders, including their immediate family members, are not permitted to enter into a related person transaction with FFN without the consent of FFN’s audit committee. Any request for FFN to enter into a transaction with an executive officer, director, principal shareholder or any of such persons’ immediate family members, other than transactions available to all employees generally or involving less than $5,000 when aggregated with similar transactions, must be presented to FFN’s audit committee for review, consideration and approval, unless the transaction involves an employment or other compensatory arrangement approved by the personnel committee. All of FFN’s directors, executive officers and employees are required to report to FFN’s audit committee any such related person transaction. In approving or rejecting the proposed agreement, FFN’s audit committee will take into account, among other factors it deems appropriate, whether the proposed related person transaction is on terms no less favorable than terms generally available to an unaffiliated third party under the same or similar circumstances, the extent of the person’s interest in the transaction and, if applicable, the impact on a director’s independence. After consideration of these and other factors, the audit committee may approve or reject the transaction. Consistent with the policy, if FFN should discover related person transactions that have not been approved, the audit committee will be notified and will determine the appropriate action, including ratification, rescission or amendment of the transaction.
Certain Transactions with Management
Banking transactions with directors, officers, and employees may be performed in the ordinary course of business. Any extensions of credit to these individuals is made on the same terms, including interest rates and collateral, as those prevailing at the time for comparable transactions with other persons and will not involve more than the normal risk of repayment. Outstanding loans to executive officers, directors, principal shareholders, and companies with whom they are associated as of September 30, 2014, were $5.5 million.
The officers and directors are required to devote only so much of their time to the business of the Bank and FFN as in their judgment is reasonably required. The officers and directors, and their affiliates, may engage, and are presently engaging, for their own accounts in other business ventures, including management and the formation of other corporations or ventures. Such activities may result in conflicts of interest.
Based on competitive bids, FFN is using Full Service Insurance to provide various insurance coverage including health, director’s and officer’s liability, personal property and bond coverage. Full Service Insurance is
133
Table of Contents
Index to Financial Statements
an affiliate of Paul M. Pratt, Jr., one of the directors of FFN. Mr. Pratt owns 50% of Full Service Insurance and the remaining 50% is owned by Mr. Pratt’s brother. In 2014, payments to Full Service Insurance totaled $207,935.00.
The Bank leases a facility from Columbia Avenue Partners, LLC (“Columbia Avenue Partners”) in Downtown Franklin to house the main office, corporate headquarters, and operational areas. Columbia Avenue Partners is an affiliate of Henry W. Brockman, Dr. David H. Kemp, and, until December 31, 2013, Paul M. Pratt, Jr., each of whom are directors of FFN and the Bank. The Bank received a third party review to assure lease rates and terms are competitive. In 2014, payments to Columbia Avenue Partners, LLC totaled $952,040.37. In early 2013, construction began on an additional operations facility adjacent to the Bank’s 722 Columbia Avenue headquarters. This property is now leased from Columbia Avenue Partners. In addition to the Columbia Avenue offices, the Bank has signed a lease with Berry Farms Real Estate Partners, LLC, consisting of directors Brockman, Kemp, and, until December 31, 2013, Pratt, for the Bank’s Berry Farms branch, which opened in September 2013. In 2014, payments to Berry Farms Real Estate Partners, LLC totaled $136,569.69. In September 2013, the Bank entered into an agreement with Aspen Development of Cool Springs, LLC, comprised of directors Brockman and Kemp, to relocate the Bank’s Cool Springs branch. That lease commenced in June 2014. In June 2013, the Bank entered into an agreement with Brentwood Town Center Real Estate Partners, LLC, comprised of directors Brockman and Kemp, to relocate the Bank’s Brentwood branch. That lease commenced in July 2014, and Brentwood Town Center Real Estate Partners, LLC subsequently sold the property to Brentwood Med, LLC, an unrelated third party, in September 2014.
Century Construction Company was contracted by Columbia Avenue Partners to provide the leasehold improvement build-out for the current Columbia Avenue facility and is also providing the build-out for the new adjacent operations center and office space in Downtown Franklin. Additionally, Century Construction performed build-out and other construction work for the following branches of the Bank: Brentwood, Berry Farms, Cool Springs, Spring Hill and Westhaven. Century Construction Company is an affiliate of and is wholly owned by James W. Cross, IV, a director of FFN and the Bank. In 2014, the Bank paid Century Construction Company a total of $3,152,458.57 for leasehold improvement build-outs and other construction work.
The Bank agreed to sell the real estate of three of its branches in Rutherford County, Tennessee to Murfreesboro Branches, LLC (“Buyer”), an affiliate of directors Brockman and Kemp, for a purchase price of $4,095,000 (the “Sale”). Consummation of the Sale is subject to customary closing conditions, including title insurance and other requirements. Buyer agreed to lease such real estate back to the Bank as of the date of the closing of the Sale, each lease having a term of 13 years.
134
Table of Contents
Index to Financial Statements
We are authorized by our charter to issue a maximum of 10,000,000 shares of common stock, no par value, and 1,000,000 shares of preferred stock, having no designated par value per share. As of September 30, 2014, there were 7,739,644 shares of common stock issued and outstanding. Also, there are 31,877 shares reserved for the exercise of previously issued 2010 Warrants and 1,237,962 shares reserved for the exercise of stock options, restricted stock and other equity incentives under our Omnibus Equity Incentive Plan. See “MANAGEMENT.” As of September 30, 2014, there were 10,000 shares of Series A Preferred Stock issued and outstanding. The outstanding shares of common stock are fully paid and nonassessable.
Common Stock
The following is a summary of certain rights and provisions of the shares of our common stock. This summary does not purport to be complete and is qualified in its entirety by reference to our charter and bylaws and the TBCA.
Dividend Rights and Limitations on Payment of Dividends
Except as described below, the holders of common stock are entitled to receive, pro rata, such dividends and other distributions as and when declared by FFN’s board of directors out of the assets and funds legally available therefore. FFN’s ability to pay dividends is dependent upon the ability of FFN to earn income and is especially dependent upon the ability of the Bank to earn income and pay dividends. The Bank may declare dividends only so long as its minimum regulatory capital requirements will not be impaired. In addition, the board of directors of the Bank under state banking law may not declare dividends in any calendar year that exceed the total of its net income of that year combined with its retained net income of the preceding two years without the approval of the Commissioner of Financial Institutions. Also, despite the availability of net or accumulated earnings in later years of operations and the capacity to maintain capital at levels required by governmental regulation, the directors of the Bank and/or the directors of FFN may choose to retain all earnings for the operation of the business. FFN has not paid any dividends on its common stock.
Voting Rights
The holders of common stock are entitled to one vote per share on all matters presented for a shareholder vote. There is no provision for cumulative voting. A set of bylaws is adopted for the guidance and control of FFN. Amendments to the bylaws are effected by majority vote of the shareholders or directors.
Board of Directors
The business of FFN is controlled by a board of directors, which is elected by a plurality vote of the shareholders. Shareholders are required to state nominations for directors in writing and file such nominations with the secretary of FFN. To be timely, nominations for directors must be mailed and received at the principal office of FFN not less than 120 days prior to the meeting at which directors are to be elected. The directors will hold office for one (1) year terms. Any vacancies in the board of directors and any newly created directorships may be filled only by a majority vote of the directors then in office. The current Board is comprised of nine (9) directors. The number of directors serving on the Board may be changed by a resolution adopted by the affirmative vote of a majority of the directors then in office. Each director shall serve until his or her successor is elected and qualified or until his or her earlier death, resignation, or removal. The provisions of this section of the charter may be amended with a majority vote of the shareholders.
Liquidation Rights
Upon the voluntary or involuntary dissolution, liquidation, or winding up of the affairs of FFN, after the payment in full of its debts and other liabilities, and the payment of any accrued but unpaid dividends and any
135
Table of Contents
Index to Financial Statements
liquidation preference on outstanding shares of preferred stock, the remainder of its assets, if any, is to be distributed pro rata among the holders of shares of common stock. Subject to any required regulatory approvals, the board of directors of FFN, at its discretion, may authorize and issue shares of preferred stock and debt obligations, whether or not subordinated, without prior approval of the shareholders, thereby further depleting the liquidation value of the shares of common stock.
Preemptive Rights
Owners of shares of common stock of FFN will not have the preemptive right to purchase additional shares offered by FFN in the future. That is, FFN may sell additional shares to particular shareholders or to non-shareholders without first offering each then-current shareholder the right to purchase the same percentage of such newly offered shares as is the shareholder’s percentage of the then-outstanding shares of FFN.
Redemption
The shares may not be redeemed except upon consent of both the shareholder and FFN, as well as the Federal Reserve.
Conversion Rights
The holders of shares have no conversion rights.
Liability to Further Calls or to Assessments by FFN
The shares are not subject to liability for further calls or to assessments by FFN.
Preferred Stock
The Charter of FFN authorizes the issuance by FFN of up to 1,000,000 shares of its preferred stock. The preferred stock may be issued by vote of the Directors without shareholder approval. The preferred stock may be issued in one or more classes and series, with such designations, full or limited voting rights (or without voting rights), redemption, conversion or sinking fund provisions, dividend rates or provisions, liquidation rights, and other preferences and limitations as the board of directors may determine in the exercise of its business judgment. The preferred stock may be issued by the board of directors for a variety of reasons.
The preferred stock could be issued in public or private transactions in one or more (isolated or series of) issues. The shares of any issue of preferred stock could be issued with rights, including voting, dividend, and liquidation features, superior to those of any issue or class of shares. The issuance of shares of the preferred stock could serve to dilute the voting rights or ownership percentage of holders of the Shares (or any other shares). The issuance of shares of the preferred stock might also serve to deter or block any attempt to obtain control of FFN or to facilitate any such attempt.
In 2011, the board of directors authorized management of FFN to consider participating in the voluntary SBLF authorized by Congress under the Small Business Jobs and Credit Act of 2010 (see “SUPERVISION AND REGULATION”). The purpose of the SBLF is to provide capital to community banking organizations in order to incentivize increased small business lending. The more a bank participating in the SBLF increases its small business lending, the lower the rate it will pay on the funds received under the program.
The capital is provided to banks by having the United States Department of the Treasury (“Treasury”) provide a bank with capital by purchasing Tier 1 qualifying preferred stock or equivalents. To encourage community bank participation, the cost of capital will start no higher than 5.0%. If a bank’s small business lending increases by 10.0% or more, then the rate will fall as low as 1.0%. Banks that increase their lending by
136
Table of Contents
Index to Financial Statements
amounts less than 10.0% can benefit from rates set between 2.0% and 4.0%. If lending does not increase in the first two years, however, the rate will increase to 7.0%. After 4.5 years, the rate will increase to 9.0% if the bank has not already repaid the SBLF funding.
Management reviewed the SBLF program and determined that participation in the program would be beneficial to FFN. FFN was notified by the Treasury that FFN had received preliminary approval to participate in the SBLF in the amount of $10,000,000. As a result, on September 27, 2011, FFN issued 10,000 shares of Series A Preferred Stock to the Treasury for a purchase price of $10,000,000. The specific terms of the Series A Preferred Stock are as follows:
| Issuer: | The term “Issuer” includes a bank holding company or savings and loan holding company with total consolidated assets of less than $10 billion. FFN applied and qualified with Treasury as an “Issuer.” | |
| Financial Instrument: | Senior perpetual noncumulative preferred stock (“Senior Preferred”), liquidation preference of $1,000 per share. | |
| Regulatory Capital Treatment: |
Tier 1. | |
| Investment Amount: | An Issuer that is a bank holding company or savings and loan holding company that has total assets of $1 billion or less may issue a total amount of Senior Preferred equal to not less than 1.0% and not more than 5.0% of its risk-weighted assets (“RWA”). Total assets are measured as reported in the call reports of the Issuer or, for holding companies, the combined total assets reported in the call reports of the Issuer’s insured depository institution subsidiaries, as of the end of the fourth quarter of calendar year 2009, and RWA are measured as reported in the most recent call reports as of the date of application. | |
| Ranking: | With respect to all distributions, the Senior Preferred will rank senior to common stock and pari passu with all existing preferred stock other than preferred shares that rank junior to any existing preferred shares. | |
| Calculation of Qualified Small Business Lending: |
Qualified Small Business Lending, as measured for the purpose of calculating the dividend rate for the Senior Preferred, is defined as the sum of all lending by the Issuer of the following types, as reported in the Issuer’s most recent quarterly call report: | |
| (i) C&I loans; | ||
| (ii) owner-occupied nonfarm, nonresidential real estate loans; | ||
| (iii) loans to finance agricultural production and other loans to farmers; and | ||
| (iv) loans secured by farmland; | ||
| and, within these loan categories, excluding: | ||
| (A) any loan or group of loans to the same borrower and its affiliates with an original principal or commitment amount greater than $10 million or that is made to a borrower that had (or whose ultimate parent company had) more than $50 million in revenues during the most recent fiscal year ended as of the date of origination; | ||
137
Table of Contents
Index to Financial Statements
| (B) to the extent not included in (A) or (C), the portion of any loans guaranteed by the SBA, any other U.S. Government agency, or a U.S. Government-sponsored enterprise; and | ||
| (C) to the extent not included in (A) or (B), the portion of any loans held by the Issuer for which the risk is assumed by a third party (for example, the portion of loans that have been participated), | ||
| while, further, adding to the amount determined above, the cumulative amount of net loan charge-offs with respect to Qualified Small Business Lending as measured since, and including, the quarter ending September 30, 2010. | ||
| The amount of Qualified Small Business Lending, including the exclusions listed above, shall be calculated and reported on the date of Treasury’s investment (the “Investment Date”) by the Issuer in a format specified by Treasury (the “Initial Supplemental Report”) and during the first nine calendar quarters thereafter (each, a “Quarterly Supplemental Report”), concurrent with the Issuer’s publication of its call report. | ||
| Calculation of Lending Baseline: |
Not later than three business days prior to the Investment Date, the Issuer shall submit an Initial Supplemental Report reporting Qualified Small Business Lending as of the Investment Date and for the each of the four full quarters ending on June 30, 2010. In calculating such Qualified Small Business Lending, if any gains in Qualified Small Business Lending resulted from mergers and acquisitions, or purchases of loans during any quarter during such four quarter period, the Issuer shall recalculate Qualified Small Business Lending for all earlier quarters in such four quarter period to include such gains on a pro forma combined basis. The average of Qualified Small Business Lending reported for these four quarters shall be the baseline against which subsequent lending is measured (the “Baseline”). | |
| When applicable, at the beginning of each quarter that begins after the Investment Date, the Baseline will be increased by the amount of any gains realized by the Issuer resulting from mergers and acquisitions, or purchases of loans, as measured since, and including, the quarter ending on September 30, 2010. | ||
| Dividend Rate: | The Senior Preferred will pay noncumulative dividends. The dividend rate will be adjusted to reflect the amount of an Issuer’s change in Qualified Small Business Lending from the Baseline, based on the following schedule: | |
| Dividend Rate Following Investment Date | ||
| Increase in Qualified Small Business Lending from the Baseline |
First 9 Quarters* |
Quarter 10 to Year 4.5 |
After Year 4.5 |
|||||||||
| 0% or less |
5.0 | % | 7.0 | % | 9.0 | % | ||||||
| more than 0%, but less than 2.5% |
5.0 | % | 5.0 | % | 9.0 | % | ||||||
| 2.5% or more, but less than 5% |
4.0 | % | 4.0 | % | 9.0 | % | ||||||
| 5% or more, but less than 7.5% |
3.0 | % | 3.0 | % | 9.0 | % | ||||||
| 7.5% or more, but less than 10% |
2.0 | % | 2.0 | % | 9.0 | % | ||||||
| 10% or more |
1.0 | % | 1.0 | % | 9.0 | % | ||||||
|
* For the first nine quarters, the dividend rate will be adjusted quarterly. |
138
Table of Contents
Index to Financial Statements
| Initial rate and adjustments in the first ten quarters: On the Investment Date, and at the beginning of each of the next ten calendar quarters thereafter, the amount of Qualified Small Business Lending reported by the Issuer in the most recent Supplemental Report will be compared to the Baseline amount of Qualified Small Business Lending. The dividend rate will be adjusted to reflect the amount of an Issuer’s change in Qualified Small Business Lending from the Baseline, as reflected in the table above. | ||
| Rate adjustments following the first ten quarters: The rate in effect at the beginning of the tenth full calendar quarter after the Investment Date will be payable until the expiration of the four-and-one-half-year period beginning on the Investment Date. | ||
| If, at the beginning of the tenth full calendar quarter after the Investment Date, the Issuer’s most recent Quarterly Supplemental Report shows that the amount of Qualified Small Business Lending has not increased relative to the Baseline, the dividend rate will increase to 7% per annum until the four-and-one-half-year period that started on the Investment Date expires. | ||
| Limitation on rate reductions: The reduction in the dividend rate will not apply to a dollar amount of the investment that is greater than the dollar amount of the increase in Qualified Small Business Lending since the Baseline. Dividends on any amount that is in excess of the increase in the amount of Qualified Small Business Lending will be payable at a rate of 5.0% per annum until the expiration of the four-and-one-half-year period that begins on the Investment Date, and 9.0% per annum thereafter. | ||
| Rate adjustment 4.5 years after the Investment Date: At the expiration of the four-and-one-half-year period that begins on the Investment Date, the dividend rate will increase to 9.0% per annum. | ||
| Timing: Dividends will be payable quarterly on January 1, April 1, July 1, and October 1 of each year. As of September 30, 2014, FFN is paying a rate of 1.0%. | ||
| Redemption: | The Senior Preferred may be redeemed at any time at the option of the Issuer, subject to the approval of the appropriate federal banking agency. All redemptions of Senior Preferred must be made at a per share redemption price equal to 100% of the liquidation preference, plus accrued and unpaid dividends as of the date of redemption (“Redemption Date”) for the quarter that includes the Redemption Date, and a pro rata portion of any lending incentive fee. All redemptions must be in amounts equal to at least 25% of the number of originally issued shares, or 100% of the then-outstanding shares (if less than 25% of the number of originally issued shares). | |
139
Table of Contents
Index to Financial Statements
| Right to Pay Dividends and Repurchase Shares: |
Unless otherwise restricted by the appropriate federal or state banking agency, the Issuer may pay dividends on preferred shares ranking pari passu with the Senior Preferred, junior preferred shares, or other junior securities (including common stock), or redeem or repurchase equity securities, subject to the limitations listed under “Provisions upon Nonpayment of Dividends,” if after giving effect to the dividend payment or share repurchase, the dollar amount of the Issuer’s Tier 1 capital would be at least 90% of the amount existing at the time immediately following the Investment Date (the “Tier 1 Dividend Threshold”), excluding any subsequent net charge-offs and redemptions of the Senior Preferred since the Investment Date, subject to (i) and (ii) below: | |
| (i) During the period beginning on the second anniversary of the Investment Date and ending on the day before the tenth anniversary of the Investment Date, for every 1.0% increase in Qualified Small Business Lending the Issuer has achieved above the Baseline, the Tier 1 Dividend Threshold will be decreased by a dollar amount equal to 10% of the amount of the Senior Preferred investment; and | ||
| (ii) For Issuers that are not publicly traded,1 during the period beginning on the tenth anniversary of the Investment Date and ending on the Redemption Date, the Issuer may not effect any repurchases or declare or pay any dividends on preferred shares ranking pari passu with the Senior Preferred, junior preferred shares, or other junior securities (including common stock). | ||
| Provisions upon Nonpayment of Dividends: |
For any missed payment: The following restrictions will apply whenever dividends payable on the Senior Preferred have not been declared and paid for any quarterly dividend period:
(i) The Chief Executive Officer and Chief Financial Officer of the Issuer will be required to provide written notice, in a form reasonably satisfactory to Treasury, which is to include the rationale of the Issuer’s board of directors for not declaring dividends; and | |
| (ii) No repurchases may be effected and no dividends may be declared or paid on preferred shares ranking pari passu with the Senior Preferred, junior preferred shares, or other junior securities (including common stock) during the current quarter and for the next three quarters following the failure to declare and pay dividends on the Senior Preferred (provided, however, that, in any such quarter in which Treasury’s dividend is paid, dividend payments on shares ranking pari passu may be paid to the extent necessary to avoid any resulting material covenant breach). | ||
| After four missed payments: Whenever dividends on the Senior Preferred have not been declared and paid for four quarterly dividends or more, whether or not consecutive, and during such time the Issuer was not subject to a regulatory determination that prohibits the declaration and payment of dividends, the board of directors of the Issuer must certify, in writing, that the Issuer used best efforts to | ||
| 1 | As used herein, “publicly traded” means a company (1) whose securities are traded on a national securities exchange and (2) required to file, under the federal securities laws, periodic reports such as the annual (Form 10-K) and quarterly (Form 10-Q) reports with either the SEC or its primary federal bank regulator. A company may be required to do so by virtue of having securities registered under Section 12 of the Exchange Act, which applies to all companies that are traded on an exchange or that have $10 million in assets and 2,000 shareholders of record or Section 15(d) of the Exchange Act which requires companies that have filed a registration statement under the Securities Act to file reports required under Section 13 of the Exchange Act, e.g., periodic reports. |
140
Table of Contents
Index to Financial Statements
| declare and pay such quarterly dividends in a manner consistent with safe and sound banking practices and the directors’ fiduciary obligation. | ||
| After five missed payments: Whenever dividends on the Senior Preferred have not been declared and paid for five quarterly dividends or more, whether or not consecutive, Treasury will have the right, but not the obligation, to appoint a representative to serve as an observer on the Issuer’s board of directors. This right will end when full dividends have been paid for four consecutive subsequent dividend periods. | ||
| After six missed payments: Whenever dividends on the Senior Preferred have not been declared and paid for six quarterly dividend periods or more, whether or not consecutive, if the liquidation preference of the Senior Preferred is $25 million or more, the holder of the Senior Preferred will have the right to elect two directors to the Issuer’s board of directors. The right to elect directors will end when full dividends have been paid for four consecutive subsequent dividend periods. | ||
| Small Business Lending Plan: |
The Issuer shall provide to the appropriate federal banking agency, and, if applicable, state banking agency, a small business lending plan at the time it submits its application for this program. The plan will be confidential supervisory information. | |
| Downstreaming of Investment: |
The Issuer, if it is a holding company, shall contribute not less than 90% of the amount of Treasury’s investment to its insured depository institution subsidiaries; provided, that no insured depository institution may receive more than 5% of its RWA (if the Issuer has total assets of $1 billion or less). | |
| Voting Rights: | The Senior Preferred will be nonvoting, other than for consent rights granted to Treasury with respect to (i) any authorization or issuance of shares ranking senior to the Senior Preferred, (ii) any amendment to the rights of the Senior Preferred, and (iii) any merger, exchange, dissolution, or similar transaction which would affect the rights of the Senior Preferred. | |
| Registration Rights: | Holders of the Senior Preferred have the option to exercise certain registration rights in the event the Issuer registers equity securities in an underwritten public offering, subject to certain exceptions. | |
| Transferability: | The Senior Preferred will not be subject to any restrictions on transfer. The Issuer may merge or sell all, or substantially all, of its assets (as well as, in the case of an Issuer that is a bank holding company, any insured depository institution subsidiary), provided that the rights of the Senior Preferred and the obligations of the Issuer relating thereto are assumed and an equivalent Senior Preferred is issued by the successor entity. | |
| Access and Information: |
The Issuer will permit the holder of the Senior Preferred, the holder’s designees, the Inspector General of the Department of the Treasury, and the Comptroller General of the United States to examine the Issuer’s corporate books and discuss matters relevant to the investment with principal officers, after being provided with reasonable notice. | |
| Certifications: | The Issuer will provide the following certifications to Treasury: | |
| (i) The Issuer’s Chief Executive Officer and Chief Financial Officer, as well as the directors (trustees) of the Issuer who attest to the Issuer’s call report (or those of its insured depositories, in the case of a holding company), will certify to Treasury that information provided on each Supplemental Report is accurate. | ||
141
Table of Contents
Index to Financial Statements
| (ii) Following the Investment Date, within 90 days of the end of each fiscal year of the Issuer during which a Supplemental Report is submitted, the Issuer will receive and submit to Treasury a certification from its auditors that the processes and controls used to generate the Supplemental Reports are satisfactory. | ||
| (iii) Annually, until the Redemption Date, the Issuer will certify to Treasury that (A) businesses that received loans from the Issuer following the Investment Date have certified to the Issuer that their principals have not been convicted of, or pleaded nolo contendre to a sex offense against a minor, as required by Section 3011(c) of the Small Business Jobs and Credit Act of 2010, and (B) these certifications will be retained in accordance with standard recordkeeping practices established by the appropriate federal banking agency. | ||
| (iv) Annually, until the Redemption Date, the Issuer will certify to Treasury that it is in compliance with the Customer Identification Program requirements set forth in 31 C.F.R. § 103.121. | ||
| Issuers must submit valid and timely certifications to be eligible for any dividend rate adjustment on the Senior Preferred. Issuers must also complete a short annual lending survey. | ||
2010 Warrants
FFN previously issued warrants to subscribers in connection with stock offerings in 2007 and 2010. The 2010 Warrants outstanding as of the date of this prospectus allow holders to purchase 31,877 shares at $12.00 per share. All of these 2010 Warrants expire March 30, 2017.
All of the 2010 Warrants provide that if, after the issuance of the 2010 Warrants, the number of outstanding shares is increased by a stock dividend payable in shares, or by a split up of shares, then on the day following the date fixed for the determination of holders of shares entitled to receive such stock dividend or split up, the number of shares issuable on exercise of the warrant shall be increased in proportion to such increase in outstanding shares and the then applicable 2010 Warrant price shall be correspondingly decreased. These 2010 Warrants also provide that if after the issuance of the 2010 Warrant, the number of outstanding shares is decreased by a combination or reclassification of shares then, after the combination or reclassification, the number of shares issuable upon exercise of such warrant shall be decreased in proportion to such decrease in outstanding shares and the then applicable 2010 Warrant price shall be correspondingly increased.
If, after the issuance of the 2010 Warrants any class of capital stock of FFN (other than common stock) is issued by way of a stock dividend on outstanding common stock, then, commencing with the day following the date fixed for the determination of holders of common stock entitled to receive such stock dividend, in addition to any share of common stock receivable upon exercise of the warrants, the 2010 Warrant holders shall, upon such exercise of the 2010 Warrants, be entitled to receive, as nearly as practicable, the same number of shares of dividend stock, plus any shares issued upon any subsequent change, replacement, subdivisions, or combination thereof to which the holders would have been entitled had their 2010 Warrants been exercised immediately prior to such dividend. No adjustment in the 2010 Warrant price shall be made merely by virtue of the happening of any such event.
142
Table of Contents
Index to Financial Statements
If, after the issuance of the 2010 Warrants, any capital reorganization, redemption, or reclassification of the common stock of FFN, or consolidation or merger of FFN with another corporation, or the sale of all or substantially all of its assets to another corporation is effected (each, a “Significant Corporate Event”), then, as a condition of such Significant Corporate Event, lawful and fair provision shall be made with respect to the 2010 Warrants as follows:
| • | The 2010 Warrant holders shall have the right to purchase and receive upon the basis and upon the terms and conditions specified in the 2010 Warrants (and in lieu of the shares of FFN common stock immediately purchasable and receivable upon the exercise of the rights represented by the 2010 Warrants), such shares of stock, securities, or assets as may be issued or payable with respect to or in exchange for a number of outstanding shares of common stock equal to the number of shares immediately purchasable and receivable upon the exercise of the rights represented by the 2010 Warrants had such Significant Corporate Event not taken place, and |
| • | In any such case, appropriate provision shall be made with respect to the rights and interests of the 2010 Warrant holders so that the provisions thereof shall be applicable as nearly as may be in relation to any share of stock, securities, or assets thereafter deliverable upon the exercise thereof. |
FFN shall not effect any such consolidation, merger, or sale unless prior to the consummation thereof the successor corporation (if other than FFN) resulting from such consolidation or merger, or the corporation purchasing such assets, shall assume by written instrument executed and delivered to FFN the obligation to deliver to the 2010 Warrant holders such shares of stock, securities or assets as, in accordance with the foregoing provisions, such holders may be entitled to purchase.
In the event the common stock of FFN is to be registered under the Act or is traded on a national securities exchange at $15.00 or more for forty-five (45) consecutive days, FFN may redeem the 2010 Warrants at any time thereafter with not less than thirty (30) days’ written notice to the holder of such 2010 Warrant, in whole or in part, at a redemption price of $1.00 per warrant; provided, however, that the holder of the 2010 Warrant may exercise the 2010 Warrant, in whole or in part, during such thirty (30) day period.
Upon the issuance of the 2010 Warrants, cumulative adjustments in the number of shares issuable on exercise of the 2010 Warrants shall be made only to the nearest multiple of one whole share, i.e., fractional shares shall be disregarded.
FFN may, without the consent of the holders of the 2010 Warrants, make changes in the 2010 Warrant that are required to cure any ambiguity or to correct any defective or inconsistent provision or clerical omission or mistake in the 2010 Warrant, add to the covenants and agreements that FFN is required to observe, or result in the surrender of any right or power reserved to or conferred upon FFN in the 2010 Warrant, but which changes do not or will not adversely affect, alter or change the rights, privileges, or immunities of the holders of 2010 Warrants.
The 2010 Warrant does not entitle the holder thereof to any of the rights of a shareholder of FFN. If the 2010 Warrant is lost, stolen, mutilated or destroyed, FFN, on such terms as to indemnity or otherwise as it, in its discretion may impose (which shall, in the case of a mutilated 2010 Warrant, include the surrender thereof), will issue a new warrant of like denomination, tenor and date as the 2010 Warrant so lost, stolen, mutilated or destroyed. FFN shall reserve and keep available at all times a number of its authorized but unissued shares that will be sufficient to permit the exercise in full of all outstanding 2010 Warrants.
Any notice or demand to be given or made by the holder of the 2010 Warrant to FFN shall be sufficiently given or made if sent by mail, first class or registered, postage prepaid, addressed to FFN at its principal office as set forth on the cover of the 2010 Warrant. Any notice or demand to be given or made by FFN to or on the holder of the 2010 Warrant shall be sufficiently given or made if sent by mail, first class or registered, postage prepaid, addressed to such holder at the address contained in the corporate records of FFN.
143
Table of Contents
Index to Financial Statements
Incorporators’ and Employees’ Equity Incentive Awards
Each of the incorporators of the Bank (the “Incorporators”) received stock options to purchase 12.5% of the number of shares that such Incorporators purchased in the initial offering of shares (up to a maximum of 6,250 options) at an exercise price of $10.00 per share. As a result, a total of 33,750 Incorporator’s options were issued in 2007. These options for the group of Incorporators vested in equal increments each year for five years and are exercisable in whole or in part until the tenth anniversary of the issuance of the options. See “MANAGEMENT.”
A Qualified-Nonqualified Stock Option Plan was adopted in 2007, amended in 2013 to increase the number of shares reserved thereunder from 1,000,000 to 1,500,000 and to allow for the issuance of additional equity-based awards, including shares of restricted stock and stock appreciation rights, and amended again in 2014 to increase the number of shares reserved for issuance from 1,500,000 to 2,000,000. As amended, the Plan is known as FFN’s 2007 Omnibus Equity Incentive Plan (the “Plan”), and is available for the issuance of equity incentives to employees, directors and others. Shareholders have approved the reservation of shares of common stock for issuance upon the exercise of equity incentive awards under the Plan equal to up to 2,000,000 shares. As of December 31, 2014, a total of 1,048,913 stock options and 103,744 shares of restricted stock granted to employees were outstanding, a total of 53,242 stock options granted to former non-employee directors of MidSouth were outstanding, and 115,489 options granted to current and former non-employee directors were outstanding. There remain 607,068 options or other equity incentive awards not yet granted under the plan as of December 31, 2014. All options granted at this time have an exercise price ranging from $8.57 to $18.45 per share. See “MANAGEMENT.”
Transfer Agent
The transfer agent and registrar for our common stock is Computershare Inc.
Listing
We have applied to list our common stock on the under the symbol “ .”
144
Table of Contents
Index to Financial Statements
SHARES ELIGIBLE FOR FUTURE SALE
Prior to this offering, there has been no public market for our common stock, and no predictions can be made about the effect, if any, that market sales of shares of our common stock or the availability of such shares for sale will have on the market price prevailing from time to time. Nevertheless, the actual sale of, or the perceived potential for the sale of, our common stock in the public market may have a material adverse effect on the market price for our common stock and could impair our ability to raise capital through future sales of our securities.
Sale of Restricted Shares
Upon completion of this offering, we will have an aggregate of shares of our common stock outstanding (or shares of our common stock if the underwriters exercise their option to purchase additional shares in full). Of these shares, the shares of our common stock to be sold in this offering (or shares of our common stock if the underwriters exercise their option to purchase additional shares in full) will be freely tradable without restriction or further registration under the Securities Act, except for any shares which may be acquired by any of our affiliates as that term is defined in Rule 144 under the Securities Act. The remaining shares of our common stock outstanding, and the shares issuable upon the exercise of our currently outstanding warrants, will be restricted securities, as that term is defined in Rule 144, and such shares and any unrestricted shares acquired by any of our affiliates may in the future be sold under the Securities Act to the extent permitted by Rule 144 or any applicable exemption under the Securities Act.
Stock Incentive Plans
Following the completion of this offering, we intend to file a registration statement on Form S-8 under the Securities Act with the SEC to register approximately shares of our common stock issued or reserved for issuance under the Plan. The Form S-8 is expected to become effective immediately upon filing. As a result, subject to expiration of any lock-up restrictions as described below and following the completion of any remaining vesting periods and other vesting requirements, shares of our common stock issued under the Plan, and shares of our common stock issuable upon the exercise of options granted or to be granted under the Plan, will be freely tradable without restriction under the Securities Act, unless such shares are held by any of our affiliates.
As of December 31, 2014, options to purchase a total of 1,217,644 shares of common stock under the Plan were outstanding, of which options to purchase 790,098 shares were exercisable, and 103,744 restricted shares were outstanding that were not fully vested. See the section titled “EXECUTIVE COMPENSATION AND OTHER INFORMATION—2007 Omnibus Equity Incentive Plan” for a description of the Plan.
Lock-up Agreements
Holders of approximately % of the shares of our common stock outstanding prior to this offering, including all of our executive officers and directors, have agreed not to sell any shares of our common stock for a period of at least 180 days from the date of this prospectus, subject to certain exceptions. See “UNDERWRITING—No Sales of Similar Securities” for a description of the terms, including any exceptions to the provisions of these agreements.
Rule 144
In general, under Rule 144 under the Securities Act as currently in effect, a person who is not one of our affiliates who has beneficially owned shares of our common stock for at least six months may sell shares without restriction, provided the current public information requirements of Rule 144 continue to be satisfied. If a person who is not one of our affiliates has beneficially owned the shares of common stock proposed to be sold for at least one year, then that person may sell those shares without complying with any of the requirements of
145
Table of Contents
Index to Financial Statements
Rule 144. We estimate that substantially all of the shares of common stock that are not subject to the lock-up restrictions described above have been held by non-affiliates for at least one year and therefore may be freely sold by such persons upon the completion of this offering.
Our affiliates who have beneficially owned shares of our common stock for at least six months may, in reliance on Rule 144, sell within any three-month period a number of shares that does not exceed the greater of:
| • | 1.0% of the number of shares of our common stock then outstanding, which will equal approximately shares immediately after this offering, assuming the underwriters do not exercise their option to purchase additional shares; and |
| • | the average weekly trading volume of our common stock on the during the four calendar weeks immediately preceding the filing of a notice on Form 144 with respect to the sale. |
Sales of restricted shares by our affiliates under Rule 144 are also subject to requirements regarding the manner of sale, notice, and the availability of current public information about us. Rule 144 also provides that affiliates relying on Rule 144 to sell shares of our common stock that are not restricted shares must nonetheless comply with the same restrictions applicable to restricted shares, other than the holding period requirement.
Rule 701
In general, under Rule 701 of the Securities Act, any of our employees, consultants or advisors who purchased shares from us in connection with a qualified compensatory stock plan or other written agreement, such as the Plan, before the effective date of the registration statement for this offering that was completed in reliance on Rule 701 and complied with the requirements of Rule 701 will, subject to the lock-up restrictions described below, be eligible to resell such shares 90 days after the date of this prospectus in reliance on Rule 144, but without compliance with certain restrictions, including the holding period, contained in Rule 144.
146
Table of Contents
Index to Financial Statements
MATERIAL U.S. FEDERAL INCOME TAX CONSIDERATIONS FOR NON-U.S. HOLDERS
The following is a general discussion of the material U.S. federal income tax consequences of the ownership and disposition of our common stock by a non-U.S. holder (as defined below) that purchases our common stock pursuant to this offering and holds such common stock as a capital asset (generally, property held for investment). This discussion is based on currently existing provisions of U.S. federal income tax law, the Code, applicable U.S. Treasury regulations promulgated thereunder, judicial decisions, and rulings and pronouncements of the U.S. Internal Revenue Service, or the IRS, all as in effect on the date hereof and all of which are subject to change, possibly with retroactive effect, or subject to different interpretation.
This discussion does not address all the tax consequences that may be relevant to specific holders in light of their particular circumstances or to holders subject to special treatment under U.S. federal income tax laws (such as financial institutions, insurance companies, tax-exempt organizations, controlled foreign corporations, passive foreign investment companies, retirement plans, partnerships and their partners, dealers in securities, brokers, U.S. expatriates, persons who have acquired our common stock as compensation or otherwise in connection with the performance of services, or persons who have acquired our common stock as part of a straddle, hedge, conversion transaction or other integrated investment). In addition, this discussion does not address any other U.S. federal tax consequences (such as the Medicare contribution tax or U.S. federal estate or gift tax) or any aspects of state, local, or foreign tax laws.
If a partnership or other entity or arrangement treated as a partnership for U.S. federal income tax purposes holds our common stock, the tax treatment of a partner will generally depend upon the status of the partner and the activities of the partnership. A partnership that holds our common stock and any partner who owns an interest in such a partnership should consult their tax advisors regarding the U.S. federal income tax consequences of an investment in our common stock.
YOU ARE URGED TO CONSULT YOUR TAX ADVISOR WITH RESPECT TO THE APPLICATION OF THE U.S. FEDERAL INCOME TAX LAWS TO YOUR PARTICULAR SITUATION, AS WELL AS ANY TAX CONSEQUENCES OF THE PURCHASE, OWNERSHIP AND DISPOSITION OF OUR COMMON STOCK ARISING UNDER THE U.S. FEDERAL ESTATE OR GIFT TAX RULES OR UNDER THE LAWS OF ANY STATE, LOCAL, NON-U.S. OR OTHER TAXING JURISDICTION OR UNDER ANY APPLICABLE TAX TREATY.
As used in this discussion, the term “non-U.S. holder” refers to a beneficial owner of our common stock that for U.S. federal income tax purposes is neither a partnership (including any entity or arrangement treated as a partnership for such purposes) nor:
| • | an individual who is a citizen or resident of the United States; |
| • | a corporation (or other entity taxable as a corporation) created or organized in or under the laws of the United States or any state thereof, including the District of Columbia; |
| • | an estate the income of which is subject to U.S. federal income tax regardless of its source; or |
| • | a trust (1) if a court within the United States is able to exercise primary supervision over its administration and one or more U.S. persons have the authority to control all of its substantial decisions, or (2) that has in effect a valid election under applicable Treasury Regulations to be treated as a U.S. person. |
Dividends and Distributions
In the event that we make a distribution of cash or other property (other than certain distributions of our stock) with respect of our common stock, the distribution generally will be treated as a dividend to the extent of
147
Table of Contents
Index to Financial Statements
our current or accumulated earnings and profits as determined under U.S. federal income tax principles. To the extent those distributions exceed both our current and our accumulated earnings and profits, they will first constitute a nontaxable return of capital, on a share-by-share basis, and will first reduce your basis in our common stock, but not below zero, and then will be treated as gain from the disposition of the common stock, the tax treatment of which is discussed below under “Sale, Exchange or Other Taxable Disposition.”
Any dividend paid to you generally will be subject to U.S. withholding tax either at a rate of 30% of the gross amount of the dividend or such lower rate as may be specified by an applicable income tax treaty. In order to receive a reduced treaty rate, you must provide us with an IRS Form W-8BEN (or successor form) or other appropriate version of IRS Form W-8 (or successor form), including a U.S. taxpayer identification number, certifying qualification for the reduced rate. A non-U.S. holder of shares of our common stock eligible for a reduced rate of U.S. withholding tax pursuant to an income tax treaty may obtain a refund of any excess amounts withheld by filing an appropriate claim for refund with the IRS. If the non-U.S. holder holds the stock through a financial institution or other agent acting on the non-U.S. holder’s behalf, the non-U.S. holder will be required to provide appropriate documentation to the agent, which then will be required to provide certification to us or our paying agent, either directly or through other intermediaries.
Dividends received by you that are effectively connected with your conduct of a U.S. trade or business (and, if an income tax treaty applies, that are attributable to a permanent establishment or a fixed base maintained by you in the United States), are exempt from such withholding tax. In order to obtain this exemption, you must provide us with an IRS Form W-8ECI (or successor form) or other applicable IRS Form W-8 (or successor form) properly certifying such exemption. Such effectively connected dividends, although not subject to withholding tax, generally are taxed at the same graduated rates applicable to U.S. persons, net of certain deductions and credits. In addition, if you are a corporate non-U.S. holder, dividends you receive that are effectively connected with your conduct of a U.S. trade or business may also be subject to a branch profits tax at a rate of 30% or such lower rate as may be specified by an applicable income tax treaty.
A non-U.S. holder eligible for a reduced rate of U.S. withholding tax pursuant to an income tax treaty may obtain a refund of any excess amounts withheld by timely filing an appropriate claim for refund with the IRS.
Sale, Exchange or Other Taxable Disposition
Subject to the discussion below regarding backup withholding and foreign accounts, you generally will not be required to pay U.S. federal income tax on any gain realized upon the sale or other disposition of our common stock unless:
| • | the gain is effectively connected with your conduct of a U.S. trade or business (and, if an income tax treaty applies, the gain is attributable to a permanent establishment or a fixed base maintained by you in the United States); |
| • | you are an individual who is present in the United States for a period or periods aggregating 183 days or more during the calendar year in which the sale or disposition occurs and certain other conditions are met; or |
| • | our common stock constitutes a U.S. real property interest by reason of our status as a “United States real property holding corporation,” or USRPHC, for U.S. federal income tax purposes at any time within the shorter of the five-year period preceding your disposition of, or your holding period for, our common stock. |
We believe that we are not currently and will not become a USRPHC. However, because the determination of whether we are a USRPHC depends on the fair market value of our U.S. real property relative to
148
Table of Contents
Index to Financial Statements
the fair market value of our other business assets, there can be no assurance that we will not become a USRPHC in the future. Even if we become a USRPHC, however, as long as our common stock is regularly traded on an established securities market, such common stock will be treated as U.S. real property interests only if you actually or constructively hold more than 5% of such regularly traded common stock at any time during the shorter of the five-year period preceding your disposition of, or your holding period for, our common stock.
If you are a non-U.S. holder described in the first bullet above, you will be required to pay tax on the net gain derived from the sale under regular graduated U.S. federal income tax rates, and a corporate non-U.S. holder described in the first bullet above also may be subject to the branch profits tax at a 30% rate, or such lower rate as may be specified by an applicable income tax treaty. If you are an individual non-U.S. holder described in the second bullet above, you will be required to pay a flat 30% tax on the gain derived from the sale, which tax may be offset by U.S.-source capital losses for the year. You should consult any applicable income tax or other treaties that may provide for different rules.
Information Reporting and Backup Withholding
Information returns will be filed with the IRS in connection with payments of dividends and the proceeds from a sale or other disposition of our common stock. Information reporting and backup withholding (at the then applicable rate) may also apply to payments made to you on or with respect to our common stock, unless you certify as to your status as a non-U.S. person under penalties of perjury or otherwise establish an exemption and certain other conditions are satisfied. Backup withholding is not an additional tax. Any amounts withheld under the backup withholding rules from a payment to you will be allowed as a refund or a credit against your U.S. federal income tax liability, if any, provided that the required information is timely furnished to the IRS.
Foreign Account Tax Compliance Act
Withholding at a rate of 30% generally is required on dividends with respect to, and, after December 31, 2016, gross proceeds from the sale or other disposition of, our common stock held by or through certain foreign financial institutions (including investment funds), unless such institution enters into an agreement with the U.S. Treasury Department to report, on an annual basis, information with respect to interests in, and accounts maintained by, the institution that are owned by certain U.S. persons and by certain non-U.S. entities that are wholly or partially owned by U.S. persons and to withhold on certain payments. An intergovernmental agreement between the United States and an applicable foreign country, or future Treasury regulations or other guidance, may modify these requirements. Accordingly, the entity through which our common stock is held will affect the determination of whether such withholding is required. Similarly, dividends with respect to, and gross proceeds from the sale or other disposition of, our common stock held by an investor that is a non-financial non-U.S. entity that does not qualify under certain exemptions generally will be subject to withholding at a rate of 30%, unless such entity either (1) certifies that such entity does not have any “substantial United States owners” or (2) provides certain information regarding the entity’s “substantial United States owners.” Prospective investors should consult their tax advisors regarding the possible implications of these rules on their investment in our common stock.
149
Table of Contents
Index to Financial Statements
Merrill Lynch, Pierce, Fenner & Smith Incorporated is acting as representative of each of the underwriters named below. Subject to the terms and conditions set forth in an underwriting agreement among us and the underwriters, we have agreed to sell to the underwriters, and each of the underwriters has agreed, severally and not jointly, to purchase from us, the number of shares of common stock set forth opposite its name below.
| Underwriter | Number of | |
| Merrill Lynch, Pierce, Fenner & Smith |
||
|
| ||
| Total |
||
|
|
Subject to the terms and conditions set forth in the underwriting agreement, the underwriters have agreed, severally and not jointly, to purchase all of the shares sold under the underwriting agreement if any of these shares are purchased. If an underwriter defaults, the underwriting agreement provides that the purchase commitments of the nondefaulting underwriters may be increased or the underwriting agreement may be terminated.
We have agreed to indemnify the underwriters against certain liabilities, including liabilities under the Securities Act, or to contribute to payments the underwriters may be required to make in respect of those liabilities.
The underwriters are offering the shares, subject to prior sale, when, as and if issued to and accepted by them, subject to approval of legal matters by their counsel, including the validity of the shares, and other conditions contained in the underwriting agreement, such as the receipt by the underwriters of officer’s certificates and legal opinions. The underwriters reserve the right to withdraw, cancel or modify offers to the public and to reject orders in whole or in part.
Commissions and Discounts
The representative has advised us that the underwriters propose initially to offer the shares to the public at the public offering price set forth on the cover page of this prospectus and to dealers at that price less a concession not in excess of $ per share. After the initial offering, the public offering price, concession or any other term of the offering may be changed.
The following table shows the public offering price, underwriting discount and proceeds before expenses to us. The information assumes either no exercise or full exercise by the underwriters of their option to purchase additional shares.
| Per Share | Without Option | With Option | ||||||||||
| Public offering price |
$ | $ | $ | |||||||||
| Underwriting discount |
$ | $ | $ | |||||||||
| Proceeds, before expenses, to us |
$ | $ | $ | |||||||||
The expenses of the offering, not including the underwriting discount, are estimated at $ and are payable by us.
Option to Purchase Additional Shares
We have granted an option to the underwriters, exercisable for 30 days after the date of this prospectus, to purchase up to additional shares at the public offering price, less the underwriting discount. If the
150
Table of Contents
Index to Financial Statements
underwriters exercise this option, each will be obligated, subject to conditions contained in the underwriting agreement, to purchase a number of additional shares proportionate to that underwriter’s initial amount reflected in the above table.
Reserved Shares
At our request, the underwriters have reserved for sale, at the initial public offering price, up to % of the shares offered by this prospectus for sale to some of our directors, officers, employees, distributors, dealers, business associates and related persons. If these persons purchase reserved shares, this will reduce the number of shares available for sale to the general public. Any reserved shares that are not so purchased will be offered by the underwriters to the general public on the same terms as the other shares offered by this prospectus.
No Sales of Similar Securities
We, our executive officers and directors and our other existing security holders have agreed not to sell or transfer any common stock or securities convertible into, exchangeable for, exercisable for, or repayable with common stock, for 180 days after the date of this prospectus without first obtaining the written consent of Merrill Lynch, Pierce, Fenner & Smith Incorporated. Specifically, we and these other persons have agreed, with certain limited exceptions, not to directly or indirectly
| • | offer, pledge, sell or contract to sell any common stock, |
| • | sell any option or contract to purchase any common stock, |
| • | purchase any option or contract to sell any common stock, |
| • | grant any option, right or warrant for the sale of any common stock, |
| • | lend or otherwise dispose of or transfer any common stock, |
| • | request or demand that we file a registration statement related to the common stock, or |
| • | enter into any swap or other agreement that transfers, in whole or in part, the economic consequence of ownership of any common stock whether any such swap or transaction is to be settled by delivery of shares or other securities, in cash or otherwise. |
This lock-up provision applies to common stock and to securities convertible into or exchangeable or exercisable for or repayable with common stock. It also applies to common stock owned now or acquired later by the person executing the agreement or for which the person executing the agreement later acquires the power of disposition.
Listing
We expect the shares to be approved for listing on the under the symbol “ .”
Before this offering, there has been limited public market for our common stock, with only very limited trading of our common stock on the OTCBB. The initial public offering price will be determined through negotiations between us and the representative. In addition to prevailing market conditions, the factors to be considered in determining the initial public offering price are
| • | the valuation multiples of publicly traded companies that the representative believes to be comparable to us, |
| • | our financial information, |
151
Table of Contents
Index to Financial Statements
| • | the history of, and the prospects for, our company and the industry in which we compete, |
| • | an assessment of our management, its past and present operations, and the prospects for, and timing of, our future revenues, |
| • | the present state of our development, and |
| • | the above factors in relation to market values and various valuation measures of other companies engaged in activities similar to ours. |
An active trading market for the shares may not develop. It is also possible that after the offering the shares will not trade in the public market at or above the initial public offering price.
The underwriters do not expect to sell more than 5% of the shares in the aggregate to accounts over which they exercise discretionary authority.
Price Stabilization, Short Positions and Penalty Bids
Until the distribution of the shares is completed, SEC rules may limit underwriters and selling group members from bidding for and purchasing our common stock. However, the representative may engage in transactions that stabilize the price of the common stock, such as bids or purchases to peg, fix or maintain that price.
In connection with the offering, the underwriters may purchase and sell our common stock in the open market. These transactions may include short sales, purchases on the open market to cover positions created by short sales and stabilizing transactions. Short sales involve the sale by the underwriters of a greater number of shares than they are required to purchase in the offering. “Covered” short sales are sales made in an amount not greater than the underwriters’ option to purchase additional shares described above. The underwriters may close out any covered short position by either exercising their option to purchase additional shares or purchasing shares in the open market. In determining the source of shares to close out the covered short position, the underwriters will consider, among other things, the price of shares available for purchase in the open market as compared to the price at which they may purchase shares through the option granted to them. “Naked” short sales are sales in excess of such option. The underwriters must close out any naked short position by purchasing shares in the open market. A naked short position is more likely to be created if the underwriters are concerned that there may be downward pressure on the price of our common stock in the open market after pricing that could adversely affect investors who purchase in the offering. Stabilizing transactions consist of various bids for or purchases of shares of common stock made by the underwriters in the open market prior to the completion of the offering.
The underwriters may also impose a penalty bid. This occurs when a particular underwriter repays to the underwriters a portion of the underwriting discount received by it because the representative has repurchased shares sold by or for the account of such underwriter in stabilizing or short covering transactions.
Similar to other purchase transactions, the underwriters’ purchases to cover the syndicate short sales may have the effect of raising or maintaining the market price of our common stock or preventing or retarding a decline in the market price of our common stock. As a result, the price of our common stock may be higher than the price that might otherwise exist in the open market. The underwriters may conduct these transactions on the , in the over-the-counter market or otherwise.
Neither we nor any of the underwriters make any representation or prediction as to the direction or magnitude of any effect that the transactions described above may have on the price of our common stock. In addition, neither we nor any of the underwriters make any representation that the representative will engage in these transactions or that these transactions, once commenced, will not be discontinued without notice.
152
Table of Contents
Index to Financial Statements
Electronic Distribution
In connection with the offering, certain of the underwriters or securities dealers may distribute prospectuses by electronic means, such as e-mail.
Other Relationships
Some of the underwriters and their affiliates have engaged in, and may in the future engage in, investment banking and other commercial dealings in the ordinary course of business with us or our affiliates. They have received, or may in the future receive, customary fees and commissions for these transactions.
In addition, in the ordinary course of their business activities, the underwriters and their affiliates may make or hold a broad array of investments and actively trade debt and equity securities (or related derivative securities) and financial instruments (including bank loans) for their own account and for the accounts of their customers. Such investments and securities activities may involve securities and/or instruments of ours or our affiliates. The underwriters and their affiliates may also make investment recommendations and/or publish or express independent research views in respect of such securities or financial instruments and may hold, or recommend to clients that they acquire, long and/or short positions in such securities and instruments.
Notice to Prospective Investors in the European Economic Area
In relation to each Member State of the European Economic Area (each, a “Relevant Member State”), no offer of shares may be made to the public in that Relevant Member State other than:
| A. | to any legal entity which is a qualified investor as defined in the Prospectus Directive; |
| B. | to fewer than 100 or, if the Relevant Member State has implemented the relevant provision of the 2010 PD Amending Directive, 150, natural or legal persons (other than qualified investors as defined in the Prospectus Directive), as permitted under the Prospectus Directive, subject to obtaining the prior consent of the representative; or |
| C. | in any other circumstances falling within Article 3(2) of the Prospectus Directive, |
provided that no such offer of shares shall require the Company or the representative to publish a prospectus pursuant to Article 3 of the Prospectus Directive or supplement a prospectus pursuant to Article 16 of the Prospectus Directive.
Each person in a Relevant Member State who initially acquires any shares or to whom any offer is made will be deemed to have represented, acknowledged and agreed that it is a “qualified investor” within the meaning of the law in that Relevant Member State implementing Article 2(1)(e) of the Prospectus Directive. In the case of any shares being offered to a financial intermediary as that term is used in Article 3(2) of the Prospectus Directive, each such financial intermediary will be deemed to have represented, acknowledged and agreed that the shares acquired by it in the offer have not been acquired on a non-discretionary basis on behalf of, nor have they been acquired with a view to their offer or resale to, persons in circumstances which may give rise to an offer of any shares to the public other than their offer or resale in a Relevant Member State to qualified investors as so defined or in circumstances in which the prior consent of the representative has been obtained to each such proposed offer or resale.
The Company, the representative and their affiliates will rely upon the truth and accuracy of the foregoing representations, acknowledgements and agreements.
153
Table of Contents
Index to Financial Statements
This prospectus has been prepared on the basis that any offer of shares in any Relevant Member State will be made pursuant to an exemption under the Prospectus Directive from the requirement to publish a prospectus for offers of shares. Accordingly any person making or intending to make an offer in that Relevant Member State of shares which are the subject of the offering contemplated in this prospectus may only do so in circumstances in which no obligation arises for the Company or any of the underwriters to publish a prospectus pursuant to Article 3 of the Prospectus Directive in relation to such offer. Neither the Company nor the underwriters have authorized, nor do they authorize, the making of any offer of shares in circumstances in which an obligation arises for the Company or the underwriters to publish a prospectus for such offer.
For the purpose of the above provisions, the expression “an offer to the public” in relation to any shares in any Relevant Member State means the communication in any form and by any means of sufficient information on the terms of the offer and the shares to be offered so as to enable an investor to decide to purchase or subscribe the shares, as the same may be varied in the Relevant Member State by any measure implementing the Prospectus Directive in the Relevant Member State and the expression “Prospectus Directive” means Directive 2003/71/EC (including the 2010 PD Amending Directive, to the extent implemented in the Relevant Member States) and includes any relevant implementing measure in the Relevant Member State and the expression “2010 PD Amending Directive” means Directive 2010/73/EU.
Notice to Prospective Investors in the United Kingdom
In addition, in the United Kingdom, this document is being distributed only to, and is directed only at, and any offer subsequently made may only be directed at persons who are “qualified investors” (as defined in the Prospectus Directive) (i) who have professional experience in matters relating to investments falling within Article 19 (5) of the Financial Services and Markets Act 2000 (Financial Promotion) Order 2005, as amended (the “Order”) and/or (ii) who are high net worth companies (or persons to whom it may otherwise be lawfully communicated) falling within Article 49(2)(a) to (d) of the Order (all such persons together being referred to as “relevant persons”). This document must not be acted on or relied on in the United Kingdom by persons who are not relevant persons. In the United Kingdom, any investment or investment activity to which this document relates is only available to, and will be engaged in with, relevant persons.
Notice to Prospective Investors in Switzerland
The shares may not be publicly offered in Switzerland and will not be listed on the SIX Swiss Exchange (“SIX”) or on any other stock exchange or regulated trading facility in Switzerland. This document has been prepared without regard to the disclosure standards for issuance prospectuses under art. 652a or art. 1156 of the Swiss Code of Obligations or the disclosure standards for listing prospectuses under art. 27 ff. of the SIX Listing Rules or the listing rules of any other stock exchange or regulated trading facility in Switzerland. Neither this document nor any other offering or marketing material relating to the shares or the offering may be publicly distributed or otherwise made publicly available in Switzerland.
Neither this document nor any other offering or marketing material relating to the offering, the Company, the shares have been or will be filed with or approved by any Swiss regulatory authority. In particular, this document will not be filed with, and the offer of shares will not be supervised by, the Swiss Financial Market Supervisory Authority FINMA (FINMA), and the offer of shares has not been and will not be authorized under the Swiss Federal Act on Collective Investment Schemes (“CISA”). The investor protection afforded to acquirers of interests in collective investment schemes under the CISA does not extend to acquirers of shares.
Notice to Prospective Investors in the Dubai International Financial Centre
This prospectus relates to an Exempt Offer in accordance with the Offered Securities Rules of the Dubai Financial Services Authority (“DFSA”). This prospectus is intended for distribution only to persons of a type specified in the Offered Securities Rules of the DFSA. It must not be delivered to, or relied on by, any other
154
Table of Contents
Index to Financial Statements
person. The DFSA has no responsibility for reviewing or verifying any documents in connection with Exempt Offers. The DFSA has not approved this prospectus nor taken steps to verify the information set forth herein and has no responsibility for the prospectus. The shares to which this prospectus relates may be illiquid and/or subject to restrictions on their resale. Prospective purchasers of the shares offered should conduct their own due diligence on the shares. If you do not understand the contents of this prospectus you should consult an authorized financial advisor.
Notice to Prospective Investors in Australia
No placement document, prospectus, product disclosure statement or other disclosure document has been lodged with the Australian Securities and Investments Commission (“ASIC”), in relation to the offering. This prospectus does not constitute a prospectus, product disclosure statement or other disclosure document under the Corporations Act 2001 (the “Corporations Act”), and does not purport to include the information required for a prospectus, product disclosure statement or other disclosure document under the Corporations Act.
Any offer in Australia of the shares may only be made to persons (the “Exempt Investors”) who are “sophisticated investors” (within the meaning of section 708(8) of the Corporations Act), “professional investors” (within the meaning of section 708(11) of the Corporations Act) or otherwise pursuant to one or more exemptions contained in section 708 of the Corporations Act so that it is lawful to offer the shares without disclosure to investors under Chapter 6D of the Corporations Act.
The shares applied for by Exempt Investors in Australia must not be offered for sale in Australia in the period of 12 months after the date of allotment under the offering, except in circumstances where disclosure to investors under Chapter 6D of the Corporations Act would not be required pursuant to an exemption under section 708 of the Corporations Act or otherwise or where the offer is pursuant to a disclosure document which complies with Chapter 6D of the Corporations Act. Any person acquiring shares must observe such Australian on-sale restrictions.
This prospectus contains general information only and does not take account of the investment objectives, financial situation or particular needs of any particular person. It does not contain any securities recommendations or financial product advice. Before making an investment decision, investors need to consider whether the information in this prospectus is appropriate to their needs, objectives and circumstances, and, if necessary, seek expert advice on those matters.
Notice to Prospective Investors in Hong Kong
The shares have not been offered or sold and will not be offered or sold in Hong Kong, by means of any document, other than (a) to “professional investors” as defined in the Securities and Futures Ordinance (Cap. 571) of Hong Kong and any rules made under that Ordinance; or (b) in other circumstances which do not result in the document being a “prospectus” as defined in the Companies Ordinance (Cap. 32) of Hong Kong or which do not constitute an offer to the public within the meaning of that Ordinance. No advertisement, invitation or document relating to the shares has been or may be issued or has been or may be in the possession of any person for the purposes of issue, whether in Hong Kong or elsewhere, which is directed at, or the contents of which are likely to be accessed or read by, the public of Hong Kong (except if permitted to do so under the securities laws of Hong Kong) other than with respect to shares which are or are intended to be disposed of only to persons outside Hong Kong or only to “professional investors” as defined in the Securities and Futures Ordinance and any rules made under that Ordinance.
Notice to Prospective Investors in Japan
The shares have not been and will not be registered under the Financial Instruments and Exchange Law of Japan (Law No. 25 of 1948, as amended) and, accordingly, will not be offered or sold, directly or indirectly, in
155
Table of Contents
Index to Financial Statements
Japan, or for the benefit of any Japanese Person or to others for re-offering or resale, directly or indirectly, in Japan or to any Japanese Person, except in compliance with all applicable laws, regulations and ministerial guidelines promulgated by relevant Japanese governmental or regulatory authorities in effect at the relevant time. For the purposes of this paragraph, “Japanese Person” shall mean any person resident in Japan, including any corporation or other entity organized under the laws of Japan.
Notice to Prospective Investors in Singapore
This prospectus has not been registered as a prospectus with the Monetary Authority of Singapore. Accordingly, this prospectus and any other document or material in connection with the offer or sale, or invitation for subscription or purchase, of shares may not be circulated or distributed, nor may the shares be offered or sold, or be made the subject of an invitation for subscription or purchase, whether directly or indirectly, to persons in Singapore other than (i) to an institutional investor under Section 274 of the Securities and Futures Act, Chapter 289 of Singapore (the “SFA”), (ii) to a relevant person pursuant to Section 275(1), or any person pursuant to Section 275(1A), and in accordance with the conditions specified in Section 275, of the SFA, or (iii) otherwise pursuant to, and in accordance with the conditions of, any other applicable provision of the SFA.
Where the shares are subscribed or purchased under Section 275 of the SFA by a relevant person which is:
| (a) | a corporation (which is not an accredited investor (as defined in Section 4A of the SFA)) the sole business of which is to hold investments and the entire share capital of which is owned by one or more individuals, each of whom is an accredited investor; or |
| (b) | a trust (where the trustee is not an accredited investor) whose sole purpose is to hold investments and each beneficiary of the trust is an individual who is an accredited investor, |
securities (as defined in Section 239(1) of the SFA) of that corporation or the beneficiaries’ rights and interest (howsoever described) in that trust shall not be transferred within six months after that corporation or that trust has acquired the shares pursuant to an offer made under Section 275 of the SFA except:
| (a) | to an institutional investor or to a relevant person defined in Section 275(2) of the SFA, or to any person arising from an offer referred to in Section 275(1A) or Section 276(4)(i)(B) of the SFA; |
| (b) | where no consideration is or will be given for the transfer; |
| (c) | where the transfer is by operation of law; |
| (d) | as specified in Section 276(7) of the SFA; or |
| (e) | as specified in Regulation 32 of the Securities and Futures (Offers of Investments) (Shares and Debentures) Regulations 2005 of Singapore. |
156
Table of Contents
Index to Financial Statements
Baker, Donelson, Bearman, Caldwell & Berkowitz, PC, Nashville, Tennessee, has passed upon the validity of the common stock offered hereby on behalf of us. Certain legal matters will be passed upon on behalf of the underwriters by Sidley Austin LLP, New York, New York.
The consolidated financial statements of Franklin Financial Network, Inc. as of December 31, 2013 and 2012, and for the years then ended, have been included herein in reliance upon the reports of Crowe Horwath LLP, independent registered public accounting firm, appearing elsewhere herein, and upon authority of said firm as experts in accounting and auditing.
The consolidated financial statements of MidSouth as of December 31, 2013 and 2012 and for each of the three years in the period ended December 31, 2013, have been included herein in reliance upon the reports of Maggart & Associates, P.C., independent registered public accounting firm, appearing elsewhere herein, and upon authority of said firm as experts in accounting and auditing.
WHERE YOU CAN FIND MORE INFORMATION
We have filed a registration statement on Form S-1 with the SEC for the stock we are offering by this prospectus. This prospectus does not include all of the information contained in the registration statement. You should refer to the registration statement and its exhibits for additional information. Whenever we make reference in this prospectus to any of our contracts, agreements or other documents, the references are not necessarily complete and you should refer to the exhibits attached to the registration statement for copies of the actual contract, agreement or other document.
You can read our SEC filings, including the registration statement, over the Internet at the SEC’s website at http://www.sec.gov. You may also read and copy any document we file with the SEC at its public reference facilities at 100 F Street, N.E., Room 1580, Washington, DC 20549. You may also obtain copies of the documents at prescribed rates by writing to the Public Reference Section at the SEC at 100 F Street, N.E., Room 1580, Washington, DC 20549. Please call the SEC at 1-800-SEC-0330 for further information on the operation of the public reference facilities.
We file with or furnish to the SEC periodic reports and other information. These reports and other information may be inspected and copied at the public reference facilities maintained by the SEC or obtained from the SEC’s website as provided above. Our website on the Internet is located at www.franklinsynergy.com, and we will make our periodic reports and other information filed with or furnished to the SEC available, free of charge, through our website, as soon as reasonably practicable after those reports and other information are electronically filed with or furnished to the SEC. Information on our website or any other website is not incorporated by reference into this prospectus and does not constitute a part of this prospectus.
157
Table of Contents
Index to Financial Statements
INDEX TO CONSOLIDATED FINANCIAL STATEMENTS
(AUDITED AND UNAUDITED)
FRANKLIN FINANCIAL NETWORK, INC.
Unaudited Financial Statements
F-1
Table of Contents
Index to Financial Statements
FRANKLIN FINANCIAL NETWORK, INC.
CONDENSED CONSOLIDATED BALANCE SHEETS
September 30, 2014 and December 31, 2013
(Dollar amounts in thousands, except share and per share data)
PART I FINANCIAL INFORMATION
ITEM 1. CONDENSED CONSOLIDATED FINANCIAL STATEMENTS
| September 30, 2014 |
December 31, 2013 |
|||||||
| (Unaudited) | ||||||||
| ASSETS |
||||||||
| Cash and due from financial institutions |
$ | 36,657 | $ | 18,217 | ||||
| Certificates of deposit at other financial institutions |
250 | — | ||||||
| Securities available for sale |
346,750 | 268,515 | ||||||
| Securities held to maturity (fair value 2014—$55,904 and 2013—$54,004) |
56,293 | 56,575 | ||||||
| Loans held for sale, at fair value |
25,652 | 10,694 | ||||||
| Loans |
719,275 | 421,304 | ||||||
| Allowance for loan losses |
(5,883 | ) | (4,900 | ) | ||||
|
|
|
|
|
|||||
| Net loans |
713,392 | 416,404 | ||||||
|
|
|
|
|
|||||
| Restricted equity securities, at cost |
5,349 | 3,032 | ||||||
| Premises and equipment, net |
13,113 | 4,138 | ||||||
| Accrued interest receivable |
3,426 | 2,396 | ||||||
| Bank owned life insurance |
11,579 | 8,232 | ||||||
| Deferred tax asset |
8,028 | 3,995 | ||||||
| Foreclosed assets |
1,690 | 181 | ||||||
| Servicing rights, net |
2,956 | 2,640 | ||||||
| Mortgage banking derivative asset |
368 | 464 | ||||||
| Goodwill |
9,121 | 157 | ||||||
| Core deposit intangible, net |
2,876 | — | ||||||
| Other assets |
1,079 | 734 | ||||||
|
|
|
|
|
|||||
| Total assets |
$ | 1,238,579 | $ | 796,374 | ||||
|
|
|
|
|
|||||
| LIABILITIES AND SHAREHOLDERS’ EQUITY |
||||||||
| Deposits |
||||||||
| Non-interest bearing |
$ | 136,830 | $ | 52,686 | ||||
| Interest bearing |
914,728 | 628,614 | ||||||
|
|
|
|
|
|||||
| Total deposits |
1,051,558 | 681,300 | ||||||
| Federal funds purchased and repurchase agreements |
34,238 | 24,291 | ||||||
| FHLB advances |
33,000 | 23,000 | ||||||
| Accrued interest payable |
437 | 222 | ||||||
| Mortgage banking derivative liability |
54 | — | ||||||
| Other liabilities |
2,838 | 2,398 | ||||||
|
|
|
|
|
|||||
| Total liabilities |
1,122,125 | 731,211 | ||||||
| Shareholders’ equity |
||||||||
| Senior non-cumulative preferred stock, no par value, $10,000 liquidation value: Series A, 1,000,000 shares authorized; 10,000 shares issued and outstanding at September 30, 2014 and December 31, 2013, respectively |
10,000 | 10,000 | ||||||
| Common stock, no par value; 10,000,000 shares authorized; 7,739,644 and 4,862,875 issued at September 30, 2014 and December 31 2013, respectively |
93,888 | 52,638 | ||||||
| Retained earnings |
12,562 | 7,058 | ||||||
| Accumulated other comprehensive income (loss) |
4 | (4,533 | ) | |||||
|
|
|
|
|
|||||
| Total shareholders’ equity |
116,454 | 65,163 | ||||||
|
|
|
|
|
|||||
| Total liabilities and shareholders’ equity |
$ | 1,238,579 | $ | 796,374 | ||||
|
|
|
|
|
|||||
See accompanying notes to condensed consolidated financial statements.
F-2
Table of Contents
Index to Financial Statements
FRANKLIN FINANCIAL NETWORK, INC.
CONDENSED CONSOLIDATED STATEMENTS OF INCOME
Three and Nine Months Ended September 30, 2014 and 2013
(Dollar amounts in thousands, except share and per share data)
(Unaudited)
| Three Months Ended September 30, |
Nine Months Ended September 30, |
|||||||||||||||
| 2014 | 2013 | 2014 | 2013 | |||||||||||||
| Interest income and dividends |
||||||||||||||||
| Loans, including fees |
$ | 10,168 | $ | 5,186 | $ | 22,466 | $ | 14,434 | ||||||||
| Securities: |
||||||||||||||||
| Taxable |
2,395 | 1,098 | 6,932 | 2,979 | ||||||||||||
| Tax-Exempt |
20 | 17 | 60 | 46 | ||||||||||||
| Dividends on restricted equity securities |
84 | 30 | 175 | 57 | ||||||||||||
| Federal funds sold and other |
25 | 7 | 57 | 35 | ||||||||||||
|
|
|
|
|
|
|
|
|
|||||||||
| 12,692 | 6,338 | 29,690 | 17,551 | |||||||||||||
| Interest expense |
||||||||||||||||
| Deposits |
1,446 | 874 | 3,808 | 2,733 | ||||||||||||
| Federal funds purchased and repurchase agreements |
39 | 50 | 123 | 94 | ||||||||||||
| FHLB advances |
80 | 29 | 189 | 67 | ||||||||||||
|
|
|
|
|
|
|
|
|
|||||||||
| 1,565 | 953 | 4,120 | 2,894 | |||||||||||||
| Net interest income |
11,127 | 5,385 | 25,570 | 14,657 | ||||||||||||
| Provision for loan losses |
664 | 225 | 1,489 | 457 | ||||||||||||
|
|
|
|
|
|
|
|
|
|||||||||
| Net interest income after provision for loan losses |
10,463 | 5,160 | 24,081 | 14,200 | ||||||||||||
| Noninterest income |
||||||||||||||||
| Service charges on deposit accounts |
13 | 12 | 37 | 39 | ||||||||||||
| Other service charges and fees |
600 | 270 | 1,149 | 868 | ||||||||||||
| Net gains on sale of loans |
1,875 | 714 | 4,226 | 3,611 | ||||||||||||
| Loan servicing fees, net |
73 | (19 | ) | 173 | (317 | ) | ||||||||||
| Gain on sale of securities |
22 | — | 93 | 78 | ||||||||||||
| Net gain (loss) on sale and write-down of foreclosed assets |
(3 | ) | (29 | ) | 28 | (250 | ) | |||||||||
| Other |
694 | 369 | 1,419 | 1,153 | ||||||||||||
|
|
|
|
|
|
|
|
|
|||||||||
| Total noninterest income |
3,274 | 1,317 | 7,125 | 5,182 | ||||||||||||
| Noninterest expense |
||||||||||||||||
| Salaries and employee benefits |
6,144 | 3,339 | 13,494 | 9,830 | ||||||||||||
| Occupancy and equipment |
1,443 | 666 | 3,238 | 1,990 | ||||||||||||
| FDIC assessment expense |
181 | 101 | 420 | 254 | ||||||||||||
| Marketing |
224 | 70 | 470 | 193 | ||||||||||||
| Professional fees |
961 | 79 | 1,594 | 322 | ||||||||||||
| Other |
1,436 | 587 | 2,743 | 1,690 | ||||||||||||
|
|
|
|
|
|
|
|
|
|||||||||
| Total noninterest expense |
10,389 | 4,842 | 21,959 | 14,279 | ||||||||||||
|
|
|
|
|
|
|
|
|
|||||||||
| Income before income tax expense |
3,348 | 1,635 | 9,247 | 5,103 | ||||||||||||
| Income tax expense |
1,333 | 625 | 3,668 | 1,945 | ||||||||||||
|
|
|
|
|
|
|
|
|
|||||||||
| Net income |
$ | 2,015 | $ | 1,010 | $ | 5,579 | $ | 3,158 | ||||||||
| Dividends paid on Series A preferred stock |
(25 | ) | (25 | ) | (75 | ) | (83 | ) | ||||||||
|
|
|
|
|
|
|
|
|
|||||||||
| Net income available to common shareholders |
$ | 1,990 | $ | 985 | $ | 5,504 | $ | 3,075 | ||||||||
|
|
|
|
|
|
|
|
|
|||||||||
| Earnings per share: |
||||||||||||||||
| Basic |
$ | 0.26 | $ | 0.27 | $ | 0.94 | $ | 0.84 | ||||||||
| Diluted |
0.25 | 0.26 | 0.91 | 0.82 | ||||||||||||
See accompanying notes to condensed consolidated financial statements.
F-3
Table of Contents
Index to Financial Statements
FRANKLIN FINANCIAL NETWORK, INC.
CONDENSED CONSOLIDATED STATEMENTS OF COMPREHENSIVE INCOME
Three and Nine Months Ended September 30, 2014 and 2013
(Dollar amounts in thousands, except share and per share data)
(Unaudited)
| Three Months Ended September 30, |
Nine Months Ended September 30, |
|||||||||||||||
| 2014 | 2013 | 2014 | 2013 | |||||||||||||
| Net income |
$ | 2,015 | $ | 1,010 | $ | 5,579 | $ | 3,158 | ||||||||
| Other comprehensive income (loss), net of tax: |
||||||||||||||||
| Unrealized gains/losses on securities: |
||||||||||||||||
| Unrealized holding gain (loss) arising during the period |
(623 | ) | 819 | 7,445 | (4,138 | ) | ||||||||||
| Reclassification adjustment for gains included in net income |
(22 | ) | — | (93 | ) | (78 | ) | |||||||||
|
|
|
|
|
|
|
|
|
|||||||||
| Net unrealized gains (losses) |
(645 | ) | 819 | 7,352 | (4,216 | ) | ||||||||||
|
|
|
|
|
|
|
|
|
|||||||||
| Tax effect |
247 | (313 | ) | (2,815 | ) | 1,614 | ||||||||||
|
|
|
|
|
|
|
|
|
|||||||||
| Total other comprehensive income (loss) |
(398 | ) | 506 | 4,537 | (2,602 | ) | ||||||||||
|
|
|
|
|
|
|
|
|
|||||||||
| Comprehensive income |
$ | 1,617 | $ | 1,516 | $ | 10,116 | $ | 556 | ||||||||
|
|
|
|
|
|
|
|
|
|||||||||
See accompanying notes to condensed consolidated financial statements.
F-4
Table of Contents
Index to Financial Statements
FRANKLIN FINANCIAL NETWORK, INC.
CONDENSED CONSOLIDATED STATEMENT OF CHANGES IN SHAREHOLDERS’ EQUITY
Nine Months Ended September 30, 2014 and 2013
(Dollar amounts in thousands, except share and per share data)
(Unaudited)
| Preferred Stock |
Common Stock |
Retained Earnings |
Accumulated Other Comprehensive Income (Loss) |
Total Shareholders’ Equity |
||||||||||||||||
| Balance at December 31, 2012 |
$ | 10,000 | $ | 37,821 | $ | 2,606 | $ | 929 | $ | 51,356 | ||||||||||
| Exercise of common stock warrants, 2,775 shares |
— | 33 | — | — | 33 | |||||||||||||||
| Exercise of common stock options, 5,755 shares |
— | 58 | — | — | 58 | |||||||||||||||
| Issuance of 958,924 shares of common stock, net of stock offering costs of $601 |
— | 11,865 | — | — | 11,865 | |||||||||||||||
| Dividends paid on Series A preferred stock |
— | — | (83 | ) | — | (83 | ) | |||||||||||||
| Stock based compensation expense |
— | 261 | — | — | 261 | |||||||||||||||
| Stock issued in conjunction with 401(k) employer match, 17,596 shares |
— | 229 | — | — | 229 | |||||||||||||||
| Stock issued in conjunction with stock option exchange, 32,814 shares |
— | (142 | ) | — | — | (142 | ) | |||||||||||||
| Net income |
— | — | 3,158 | — | 3,158 | |||||||||||||||
| Other comprehensive loss |
— | — | — | (2,602 | ) | (2,602 | ) | |||||||||||||
|
|
|
|
|
|
|
|
|
|
|
|||||||||||
| Balance at September 30, 2013 |
$ | 10,000 | $ | 50,125 | $ | 5,681 | $ | (1,673 | ) | $ | 64,133 | |||||||||
|
|
|
|
|
|
|
|
|
|
|
|||||||||||
| Balance at December 31, 2013 |
$ | 10,000 | $ | 52,638 | $ | 7,058 | $ | (4,533 | ) | $ | 65,163 | |||||||||
| Exercise of common stock options, 6,508 shares |
— | 56 | — | — | 56 | |||||||||||||||
| Dividends paid on Series A preferred stock |
— | — | (75 | ) | — | (75 | ) | |||||||||||||
| Stock based compensation expense |
— | 457 | — | — | 457 | |||||||||||||||
| Stock issued in conjunction with 401(k) employer match, 20,345 shares |
— | 275 | — | — | 275 | |||||||||||||||
| Stock (2,766,191 shares) and stock options (137,280 options) issued related to MidSouth Bank acquisition, net of stock issuance costs of $514 |
— | 40,462 | — | — | 40,462 | |||||||||||||||
| Net income |
— | — | 5,579 | — | 5,579 | |||||||||||||||
| Other comprehensive income |
— | — | — | 4,537 | 4,537 | |||||||||||||||
|
|
|
|
|
|
|
|
|
|
|
|||||||||||
| Balance at September 30, 2014 |
$ | 10,000 | $ | 93,888 | $ | 12,562 | $ | 4 | $ | 116,454 | ||||||||||
|
|
|
|
|
|
|
|
|
|
|
|||||||||||
See accompanying notes to condensed consolidated financial statements.
F-5
Table of Contents
Index to Financial Statements
FRANKLIN FINANCIAL NETWORK, INC.
CONDENSED CONSOLIDATED STATEMENTS OF CASH FLOWS
Nine Months Ended September 30, 2014 and 2013
(Dollar amounts in thousands, except share and per share data)
(Unaudited)
| Nine Months Ended September 30, |
||||||||
| 2014 | 2013 | |||||||
| Cash flows from operating activities |
||||||||
| Net income |
$ | 5,579 | $ | 3,158 | ||||
| Adjustments to reconcile net income to net cash from operating activities |
||||||||
| Depreciation and amortization on premises and equipment |
616 | 492 | ||||||
| Accretion of purchase accounting adjustments |
(831 | ) | — | |||||
| Net amortization of securities |
1,928 | 3,497 | ||||||
| Amortization of loan servicing right asset |
547 | 991 | ||||||
| Amortization of core deposit intangible |
184 | — | ||||||
| Increase (decrease) in impairment of servicing asset |
— | (90 | ) | |||||
| Provision for loan losses |
1,489 | 457 | ||||||
| Origination of loans held for sale |
(191,142 | ) | (244,491 | ) | ||||
| Proceeds from sale of loans held for sale |
186,618 | 253,939 | ||||||
| Net gain on sale of loans |
(4,226 | ) | (3,611 | ) | ||||
| Gain on sale of available for sale securities |
(93 | ) | (78 | ) | ||||
| Income from bank owned life insurance |
(203 | ) | (204 | ) | ||||
| (Gain) loss on sale and write down of foreclosed assets |
(28 | ) | 250 | |||||
| Stock-based compensation |
457 | 261 | ||||||
| Compensation expense related to common stock issued to 401(k) plan |
275 | 229 | ||||||
| Net change in: |
||||||||
| Accrued interest receivable and other assets |
101 | (688 | ) | |||||
| Accrued interest payable and other liabilities |
(719 | ) | 891 | |||||
|
|
|
|
|
|||||
| Net cash from operating activities |
552 | 15,003 | ||||||
| Cash flows from investing activities |
||||||||
| Available for sale securities: |
||||||||
| Sales |
34,087 | 11,555 | ||||||
| Purchases |
(118,611 | ) | (88,211 | ) | ||||
| Maturities, prepayments and calls |
69,465 | 67,289 | ||||||
| Held to maturity securities: |
||||||||
| Purchases |
(8,601 | ) | (19,656 | ) | ||||
| Maturities, prepayments and calls |
8,655 | 4,095 | ||||||
| Net change in loans |
(114,676 | ) | (79,196 | ) | ||||
| Purchase of restricted equity securities |
(745 | ) | (664 | ) | ||||
| Proceeds from sale of foreclosed assets |
634 | 1,870 | ||||||
| Purchases of premises and equipment, net |
(2,941 | ) | (978 | ) | ||||
| Decrease in interest bearing deposits in financial institutions |
— | 100 | ||||||
| Net cash acquired from acquisition (See Note 2) |
12,197 | — | ||||||
|
|
|
|
|
|||||
| Net cash from investing activities |
(120,536 | ) | (103,796 | ) | ||||
| Cash flows from financing activities |
||||||||
| Increase in deposits |
125,903 | 9,031 | ||||||
| (Decrease) increase in federal funds purchased and repurchase agreements |
9,054 | 37,995 | ||||||
| Proceeds from FHLB advances |
4,000 | 21,449 | ||||||
| Proceeds from exercise of common stock warrants |
— | 30 | ||||||
| Proceeds from exercise of common stock options |
56 | 58 | ||||||
| Cash paid in conjunction with stock option exchange |
— | (142 | ) | |||||
| Proceeds from issuance of common stock, net of offering costs |
(514 | ) | 11,868 | |||||
| Dividends paid on preferred stock |
(75 | ) | (83 | ) | ||||
|
|
|
|
|
|||||
| Net cash from financing activities |
138,424 | 80,206 | ||||||
|
|
|
|
|
|||||
| Net change in cash and cash equivalents |
18,440 | (8,587 | ) | |||||
| Cash and cash equivalents at beginning of period |
18,217 | 24,977 | ||||||
|
|
|
|
|
|||||
| Cash and cash equivalents at end of period |
$ | 36,657 | $ | 16,390 | ||||
|
|
|
|
|
|||||
| Supplemental information: |
||||||||
| Interest paid |
$ | 3,905 | $ | 2,951 | ||||
| Income taxes paid |
4,546 | 1,944 | ||||||
| Non-cash supplemental information: |
||||||||
| Fair value of stock and stock options issued related to MidSouth Bank acquisition (See Note 2) |
$ | 40,976 | $ | — | ||||
| Transfers from loans to foreclosed assets |
1,315 | 761 | ||||||
| Transfer from additional paid-in-capital to common stock |
— | 426 | ||||||
See accompanying notes to condensed consolidated financial statements.
F-6
Table of Contents
Index to Financial Statements
FRANKLIN FINANCIAL NETWORK, INC.
NOTES TO CONDENSED CONSOLIDATED FINANCIAL STATEMENTS
(Dollar amounts in thousands, except share and per share data)
(Unaudited)
NOTE 1—BASIS OF PRESENTATION
The accompanying unaudited consolidated financial statements of Franklin Financial Network, Inc. (“FFN”), and its wholly owned subsidiaries, Franklin Synergy Bank and Banc Compliance Group, Inc., which sold substantially all its assets on December 31, 2014 (collectively, the “Company”), have been prepared in accordance with instructions to Form 10-Q and therefore do not include all information and footnotes necessary for a fair presentation of financial position, results of operations, and cash flows in conformity with U.S. generally accepted accounting principles (U.S. GAAP). All adjustments which are, in the opinion of management, necessary for a fair presentation of the results for the periods reported have been included as required by Regulation S-X, Rule 10-01. All such adjustments are of a normal recurring nature. It is suggested that these interim consolidated financial statements and notes be read in conjunction with the financial statements and accompanying notes included in the Company’s prospectus filed with the SEC pursuant to Rule 424(b) under the Securities Act of 1933, as amended (the “Securities Act”), on May 15, 2014.
NOTE 2— ACQUISITIONS
Acquisition of MidSouth Bank
On July 1, 2014 the Company completed the acquisition of MidSouth Bank (“MidSouth”), pursuant to the terms of the Agreement and Plan of Reorganization and Bank Merger (the “merger agreement”) dated November 19, 2013.
The acquisition was accounted for under the acquisition method of accounting in accordance with ASC Topic 805, Business Combinations. The Company recognized goodwill on this acquisition of $8,964, after consideration of a measurement period adjustment discussed below, which is nondeductible for tax purposes as this acquisition was a nontaxable transaction. The goodwill is calculated based on the fair values of the assets acquired and liabilities assumed as of the acquisition date. Fair value estimates are based on the information available, and are subject to change for up to one year after the closing date of the acquisition as additional information relative to closing date fair values becomes available. Fair values are preliminary estimates due to pending appraisals on loans and other real estate owned.
The Company acquired 100% of the outstanding preferred and common stock of MidSouth. The purchase price consisted of both cash and stock. MidSouth’s common shareholders received 0.425926 shares of FFN common stock for each share of MidSouth common stock. MidSouth’s preferred shareholders received 0.851852 shares of FFN common stock for each share of MidSouth preferred stock. Each MidSouth Series 2009A warrant holder received 0.18 shares of FFN common stock for each MidSouth Series 2009A warrant, and each Series 2011-A warrant holder received 0.146667 shares of FFN common stock for each MidSouth Series 2011-A warrant. In lieu of issuing fractional shares of FFN common stock, FFN paid former MidSouth shareholders an amount in cash determined by multiplying (i) $13.50 by (ii) the fraction of a share (rounded to the nearest ten thousandth when expressed in decimal form) of FFN common stock.
MidSouth common stock options were converted into options to purchase shares of FFN common stock based on the 0.425926 exchange ratio, with the new exercise price becoming the exercise price of the MidSouth options divided by the exchange ratio. On the date of the acquisition, 2,766,191 shares of FFN common stock were exchanged for the common and preferred stock, and common stock warrants of MidSouth in accordance with the proration and allocation procedures contained in the merger agreement and as noted above. Subsequently, cash totaling $100 was paid to dissenting MidSouth shareholders representing 7,427 shares of FFN common stock. In addition, $18 of cash was paid to MidSouth shareholders for fractional shares in accordance with the merger agreement.
F-7
Table of Contents
Index to Financial Statements
Based on a valuation of the FFN’s common stock as of July 1, 2014, the resulting purchase price was $41,094. The following table summarizes the purchase price calculation:
| Number of shares of MidSouth common stock outstanding at July 1, 2014 |
3,912,503 | |||||||||||
| Common stock per share exchange ratio |
0.425926 | |||||||||||
|
|
|
|||||||||||
| Total FFN common shares issued, net of 1,048.5142 fractional shares |
1,662,641 | |||||||||||
| Number of shares of MidSouth preferred stock outstanding at July 1, 2014 |
1,259,907 | |||||||||||
| Common stock per share exchange ratio |
0.851852 | |||||||||||
|
|
|
|||||||||||
| Total FFN common shares issued, net of 203.1097 fractional shares |
1,068,366 | |||||||||||
| Number of MidSouth Series 2009A preferred warrants outstanding at July 1, 2014 |
242,350 | |||||||||||
| Common stock per share exchange ratio |
0.180000 | |||||||||||
|
|
|
|||||||||||
| Total FFN common shares issued, net of 50.3800 fractional shares |
34,157 | |||||||||||
| Number of MidSouth Series 2011-A preferred warrants outstanding at July 1, 2014 |
7,141 | |||||||||||
| Common stock per share exchange ratio |
0.146667 | |||||||||||
|
|
|
|||||||||||
| Total FFN common shares issued, net of 20.3482 fractional shares |
1,027 | |||||||||||
|
|
|
|||||||||||
| Total FFN common shares issued, net of 1,322.3521 fractional shares and 2,747.2227 MidSouth dissenting converted common shares |
2,766,191 | |||||||||||
| Multiplied by FFN common stock value per share at July 1, 2014 |
$ | 14.50 | ||||||||||
|
|
|
|||||||||||
| Total Stock Consideration—Fair value of FFN common stock issued |
$ | 40,110 | ||||||||||
|
|
|
|||||||||||
| FFN stock options granted to MidSouth option holders |
137,280 | |||||||||||
| Grant date fair value per share of FFN options at July 1, 2014 |
$ | 6.31 | ||||||||||
|
|
|
|||||||||||
| Fair value of FFN stock options granted to MidSouth option holders |
$ | 866 | ||||||||||
|
|
|
|||||||||||
| Total MidSouth dissenting common shares |
6,450 | |||||||||||
| Common stock per share exchange ratio |
0.425926 | |||||||||||
|
|
|
|||||||||||
| Total converted MidSouth dissenting common shares, including 5.2227 fractional shares |
2,747.2227 | |||||||||||
| Total MidSouth dissenting preferred shares |
5,500 | |||||||||||
| Preferred stock per share exchange ratio |
0.851852 | |||||||||||
|
|
|
|||||||||||
| Total converted MidSouth dissenting preferred shares, including 0.1860 fractional shares |
4,685.1860 | |||||||||||
|
|
|
|||||||||||
| Total converted MidSouth dissenting shares |
7,432.4087 | |||||||||||
| Multiplied by the cash consideration each MidSouth share was entitled to receive |
$ | 13.50 | ||||||||||
|
|
|
|||||||||||
| Cash consideration paid to dissenting shareholders |
$ | 100 | ||||||||||
| Total fractional shares resulting from acquisition of MidSouth |
1,322.3521 | |||||||||||
| Multiplied by the cash consideration each MidSouth share was entitled to receive |
$ | 13.50 | ||||||||||
|
|
|
|||||||||||
| Cash consideration paid for fractional shares |
$ | 18 | ||||||||||
|
|
|
|||||||||||
| Total Cash Consideration |
$ | 118 | ||||||||||
|
|
|
|||||||||||
| Total Purchase Price |
$ | 41,094 | ||||||||||
|
|
|
F-8
Table of Contents
Index to Financial Statements
The table below summarizes the preliminary estimates of the fair value of the assets purchased, including goodwill, and liabilities assumed as of the July 1, 2014 purchase date.
| In Thousands |
Fair Value Recorded by FFN |
|||
| Assets |
||||
| Cash and due from banks |
$ | 1,369 | ||
| Interest-bearing accounts at other financial institutions |
10,946 | |||
| Securities, available-for-sale |
57,431 | |||
| Loans held for sale |
7,071 | |||
| Loans |
184,345 | |||
| Certificates of deposit at other financial institutions |
250 | |||
| Restricted equity securities |
1,572 | |||
| Bank premises and equipment, net |
6,650 | |||
| Bank-owned life insurance |
3,144 | |||
| Accrued interest receivable |
728 | |||
| Foreclosed assets |
800 | |||
| Core deposit intangible |
3,060 | |||
| Deferred tax asset |
6,753 | |||
| Other assets |
747 | |||
|
|
|
|||
| Total assets acquired |
$ | 284,866 | ||
|
|
|
|||
| Liabilities |
||||
| Deposits |
$ | (244,415 | ) | |
| Short-term borrowings |
(6,893 | ) | ||
| Other liabilities |
(1,428 | ) | ||
|
|
|
|||
| Total liabilities assumed |
$ | (252,736 | ) | |
|
|
|
|||
| Net assets acquired |
32,130 | |||
| Total consideration paid |
41,094 | |||
|
|
|
|||
| Goodwill |
$ | 8,964 | ||
|
|
|
|||
In the acquisition, the Company purchased $184,345 of loans at fair value, net of $7,347, or 3.8%, estimated discount to the outstanding principal balance, representing 38.0% of the Company’s total loans at June 30, 2014. Of the total loans acquired, management identified loans totaling $5,527 as having credit deficiencies. All loans that were on non-accrual status and all loan relationships that were identified as substandard or impaired as of the acquisition date were considered by management to be credit-impaired and are accounted for pursuant to ASC Topic 310-30. The table below summarizes the total contractually required principal and interest cash payments, management’s estimate of expected total cash payments and fair value of the loans as of July 1, 2014 for purchased credit-impaired (“PCI”) loans. Contractually required principal and interest payments have been adjusted for estimated prepayments.
| Contractually required principal and interest |
$ | 8,510 | ||
| Non-accretable difference |
(1,745 | ) | ||
|
|
|
|||
| Cash flows expected to be collected |
6,765 | |||
| Accretable yield |
(1,238 | ) | ||
|
|
|
|||
| Total purchased credit-impaired loans acquired |
$ | 5,527 | ||
|
|
|
F-9
Table of Contents
Index to Financial Statements
The table below presents information with respect to the fair value of acquired loans, as well as their unpaid principal balance at acquisition date.
| Unpaid Principal Balance |
Fair Value |
|||||||
| Loans: |
||||||||
| Residential real estate |
$ | 39,425 | $ | 38,618 | ||||
| Commercial real estate |
82,465 | 80,566 | ||||||
| Construction and land development |
43,766 | 42,454 | ||||||
| Commercial loans |
16,311 | 15,352 | ||||||
| Consumer and other loans |
1,865 | 1,828 | ||||||
| Purchased credit-impaired |
7,860 | 5,527 | ||||||
|
|
|
|
|
|||||
| Total earning assets |
$ | 191,692 | $ | 184,345 | ||||
|
|
|
|
|
|||||
In its assumption of the deposit liabilities, the Company believed the deposits assumed from the acquisition have an intangible value. The Company applied ASC Topic 805, which prescribes the accounting for goodwill and other intangible assets such as core deposit intangibles, in a business combination. The Company determined the estimated fair value of the core deposit intangible asset totaled $3,060, which will be amortized utilizing an accelerated amortization method over an estimated economic life of 8.2 years. When determining the valuation amount, deposits were analyzed based on factors such as type of deposit, deposit retention, interest rates and age of deposit relationships.
Pro-forma information
Pro-forma data for the three and nine month periods ending September 30, 2013 listed in the table below presents pro-forma information as if the MidSouth acquisition occurred at the beginning of 2013. Because the MidSouth transaction closed on July 1, 2014, and its actual results are included in the Company’s actual operating results for the three-month period ending September 30, 2014, there is no pro-forma information for the three months ending September 30, 2014.
| Three months ended Sept 30, |
Nine months ended Sept 30, |
|||||||||||
| 2013 | 2014 | 2013 | ||||||||||
| Net interest income |
$ | 8,019 | $ | 30,014 | $ | 22,547 | ||||||
| Net income available to common shareholders |
1,411 | 5,790 | 4,115 | |||||||||
| Earnings per share—basic |
$ | 0.23 | $ | 0.61 | $ | 0.71 | ||||||
| Earnings per share—diluted |
$ | 0.23 | $ | 0.60 | $ | 0.69 | ||||||
Supplemental pro forma earnings for 2014 were adjusted to exclude $2,084 of acquisition-related costs incurred in 2014 and $665 of discount accretion and $124 of premium amortization related to the fair value adjustments to acquisition-date assets and liabilities. Supplemental pro forma earnings for 2013 were adjusted to include these items, as appropriate.
During the three and nine months ending September 30, 2014 the acquisition of MidSouth increased net interest income by approximately $2,994 and net income available to common shareholders by approximately $853.
F-10
Table of Contents
Index to Financial Statements
NOTE 3—SECURITIES
The following table summarizes the amortized cost and fair value of the available for sale securities portfolio at September 30, 2014 and December 31, 2013 and the corresponding amounts of gross unrealized gains and losses recognized in accumulated other comprehensive income.
| Amortized Cost |
Gross Unrealized Gains |
Gross Unrealized Losses |
Fair Value |
|||||||||||||
| September 30, 2014 |
||||||||||||||||
| U.S. government sponsored entities and agencies |
$ | 20,130 | $ | 232 | $ | (550 | ) | $ | 19,812 | |||||||
| U.S. Treasury securities |
7,000 | — | — | 7,000 | ||||||||||||
| Mortgage-backed securities: residential |
307,633 | 3,029 | (2,776 | ) | 307,886 | |||||||||||
| Mortgage-backed securities: commercial |
6,490 | 26 | (49 | ) | 6,467 | |||||||||||
| State and political subdivisions |
5,490 | 95 | — | 5,585 | ||||||||||||
|
|
|
|
|
|
|
|
|
|||||||||
| Total |
$ | 346,743 | $ | 3,382 | $ | (3,375 | ) | $ | 346,750 | |||||||
|
|
|
|
|
|
|
|
|
|||||||||
| Amortized Cost |
Gross Unrealized Gains |
Gross Unrealized Losses |
Fair Value |
|||||||||||||
| December 31, 2013 |
||||||||||||||||
| U.S. government sponsored entities and agencies |
$ | 16,029 | $ | — | $ | (1,305 | ) | $ | 14,724 | |||||||
| Mortgage-backed securities: residential |
259,831 | 1,560 | (7,600 | ) | 253,791 | |||||||||||
|
|
|
|
|
|
|
|
|
|||||||||
| Total |
$ | 275,860 | $ | 1,560 | $ | (8,905 | ) | $ | 268,515 | |||||||
|
|
|
|
|
|
|
|
|
|||||||||
The amortized cost and fair value of the held to maturity securities portfolio at September 30, 2014 and December 31, 2013 and the corresponding amounts of gross unrecognized gains and losses were as follows:
| Amortized Cost |
Gross Unrecognized Gains |
Gross Unrecognized Losses |
Fair Value |
|||||||||||||
| September 30, 2014 |
||||||||||||||||
| U.S. government sponsored entities and agencies |
$ | 6,546 | $ | 119 | $ | (167 | ) | $ | 6,498 | |||||||
| Mortgage backed securities: residential |
40,524 | 417 | (940 | ) | 40,001 | |||||||||||
| State and political subdivisions |
9,223 | 275 | (93 | ) | 9,405 | |||||||||||
|
|
|
|
|
|
|
|
|
|||||||||
| Total |
$ | 56,293 | $ | 811 | $ | (1,200 | ) | $ | 55,904 | |||||||
|
|
|
|
|
|
|
|
|
|||||||||
| Gross Amortized Cost |
Gross Unrecognized Gains |
Gross Unrecognized Losses |
Fair Value |
|||||||||||||
| December 31, 2013 |
||||||||||||||||
| U.S. government sponsored entities and agencies |
$ | 8,225 | $ | 12 | $ | (484 | ) | $ | 7,753 | |||||||
| Mortgage backed securities: residential |
39,043 | 293 | (2,061 | ) | 37,275 | |||||||||||
| State and political subdivisions |
9,307 | 89 | (420 | ) | 8,976 | |||||||||||
|
|
|
|
|
|
|
|
|
|||||||||
| Total |
$ | 56,575 | $ | 394 | $ | (2,965 | ) | $ | 54,004 | |||||||
|
|
|
|
|
|
|
|
|
|||||||||
Sales of available for sale securities were as follows:
| Three Months Ended September 30, |
Nine Months Ended September 30, |
|||||||||||||||
| 2014 | 2013 | 2014 | 2013 | |||||||||||||
| Proceeds |
$ | 9,767 | $ | — | $ | 34,087 | $ | 11,555 | ||||||||
| Gross gains |
31 | — | 256 | 141 | ||||||||||||
| Gross losses |
(9 | ) | — | (163 | ) | (63 | ) | |||||||||
F-11
Table of Contents
Index to Financial Statements
The amortized cost and fair value of the investment securities portfolio are shown by contractual maturity. Securities not due at a single maturity date, primarily mortgage-backed securities, are shown separately.
| September 30, 2014 | ||||||||
| Amortized Cost |
Fair Value |
|||||||
| Available for sale |
||||||||
| Three months or less |
$ | 7,000 | $ | 7,000 | ||||
| Over three months through one year |
— | — | ||||||
| Over one year through five years |
259 | 263 | ||||||
| Over five years through ten years |
13,030 | 13,147 | ||||||
| Over ten years |
12,331 | 11,987 | ||||||
| Mortgage-backed securities: commercial |
6,490 | 6,467 | ||||||
| Mortgage-backed securities: residential |
307,633 | 307,886 | ||||||
|
|
|
|
|
|||||
| Total |
$ | 346,743 | $ | 346,750 | ||||
|
|
|
|
|
|||||
| Held to maturity |
||||||||
| Over three months through one year |
$ | 251 | $ | 252 | ||||
| Over one year through five years |
1,422 | 1,478 | ||||||
| Over five years through ten years |
1,106 | 1,116 | ||||||
| Over ten years |
12,990 | 13,057 | ||||||
| Mortgage-backed securities: residential |
40,524 | 40,001 | ||||||
|
|
|
|
|
|||||
| Total |
$ | 56,293 | $ | 55,904 | ||||
|
|
|
|
|
|||||
Securities pledged at September 30, 2014 and December 31, 2013 had a carrying amount of $347,748 and $194,925 and were pledged to secure public deposits and repurchase agreements.
At September 30, 2014 and December 31, 2013, there were no holdings of securities of any one issuer, other than the U.S. government-sponsored entities and agencies, in an amount greater than 10% of shareholders’ equity.
The following table summarizes the securities with unrealized and unrecognized losses at September 30, 2014 and December 31, 2013, aggregated by major security type and length of time in a continuous unrealized loss position:
| Less Than 12 Months | 12 Months or Longer | Total | ||||||||||||||||||||||
| Fair Value |
Unrealized Losses |
Fair Value |
Unrealized Losses |
Fair Value |
Unrealized Losses |
|||||||||||||||||||
| September 30, 2014 |
||||||||||||||||||||||||
| Available for sale |
||||||||||||||||||||||||
| U.S. government sponsored entities and agencies |
$ | 1,048 | $ | (4 | ) | $ | 8,063 | $ | (546 | ) | $ | 9,111 | $ | (550 | ) | |||||||||
| Mortgage-backed securities: commercial |
5,611 | (49 | ) | — | — | 5,611 | (49 | ) | ||||||||||||||||
| Mortgage-backed securities: residential |
82,851 | (870 | ) | 52,533 | (1,906 | ) | 135,384 | (2,776 | ) | |||||||||||||||
|
|
|
|
|
|
|
|
|
|
|
|
|
|||||||||||||
| Total available for sale |
$ | 89,510 | $ | (923 | ) | $ | 60,596 | $ | (2,452 | ) | $ | 150,106 | $ | (3,375 | ) | |||||||||
|
|
|
|
|
|
|
|
|
|
|
|
|
|||||||||||||
F-12
Table of Contents
Index to Financial Statements
| Less Than 12 Months | 12 Months or Longer | Total | ||||||||||||||||||||||
| Fair Value |
Unrecognized Losses |
Fair Value |
Unrecognized Losses |
Fair Value |
Unrecognized Losses |
|||||||||||||||||||
| Held to maturity |
||||||||||||||||||||||||
| U.S. government sponsored entities and agencies |
$ | — | $ | — | $ | 2,833 | $ | (167 | ) | $ | 2,833 | $ | (167 | ) | ||||||||||
| Mortgage-backed securities: residential |
14,556 | (449 | ) | 11,189 | (491 | ) | 25,745 | (940 | ) | |||||||||||||||
| State and political subdivisions |
509 | — | (1) | 3,950 | (93 | ) | 4,459 | (93 | ) | |||||||||||||||
|
|
|
|
|
|
|
|
|
|
|
|
|
|||||||||||||
| Total held to maturity |
$ | 15,065 | $ | (449 | ) | $ | 17,972 | $ | (751 | ) | $ | 33,037 | $ | (1,200 | ) | |||||||||
|
|
|
|
|
|
|
|
|
|
|
|
|
|||||||||||||
| (1) | Unrecognized loss for this category was less than $1 when rounded. |
| Less Than 12 Months | 12 Months or Longer | Total | ||||||||||||||||||||||
| Fair Value |
Unrealized Losses |
Fair Value |
Unrealized Losses |
Fair Value |
Unrealized Losses |
|||||||||||||||||||
| December 31, 2013 |
||||||||||||||||||||||||
| Available for sale |
||||||||||||||||||||||||
| U.S. government sponsored entities and agencies |
$ | 12,983 | $ | (1,128 | ) | $ | 1,741 | $ | (177 | ) | $ | 14,724 | $ | (1,305 | ) | |||||||||
| Mortgage-backed securities: residential |
168,817 | (6,762 | ) | 11,721 | (838 | ) | 180,538 | (7,600 | ) | |||||||||||||||
|
|
|
|
|
|
|
|
|
|
|
|
|
|||||||||||||
| Total available for sale |
$ | 181,800 | $ | (7,890 | ) | $ | 13,462 | $ | (1,015 | ) | $ | 195,262 | $ | (8,905 | ) | |||||||||
|
|
|
|
|
|
|
|
|
|
|
|
|
|||||||||||||
| Less Than 12 Months | 12 Months or Longer | Total | ||||||||||||||||||||||
| Fair Value |
Unrecognized Losses |
Fair Value |
Unrecognized Losses |
Fair Value |
Unrecognized Losses |
|||||||||||||||||||
| Held to maturity |
||||||||||||||||||||||||
| U.S. government sponsored entities and agencies |
$ | 6,168 | $ | (332 | ) | $ | 848 | $ | (152 | ) | $ | 7,016 | $ | (484 | ) | |||||||||
| Mortgage-backed securities: residential |
19,952 | (1,752 | ) | 4,042 | (309 | ) | 23,994 | (2,061 | ) | |||||||||||||||
| State and political subdivisions |
5,762 | (342 | ) | 422 | (78 | ) | 6,184 | (420 | ) | |||||||||||||||
|
|
|
|
|
|
|
|
|
|
|
|
|
|||||||||||||
| Total held to maturity |
$ | 31,882 | $ | (2,426 | ) | $ | 5,312 | $ | (539 | ) | $ | 37,194 | $ | (2,965 | ) | |||||||||
|
|
|
|
|
|
|
|
|
|
|
|
|
|||||||||||||
Unrealized losses on debt securities have not been recognized into income because the issuers bonds are of high credit quality (rated AA or higher), management does not intend to sell and it is likely that management will not be required to sell the securities prior to their anticipated recovery, and the decline in fair value is largely due to changes in interest rates and other market conditions. The fair value is expected to recover as the bonds approach maturity.
F-13
Table of Contents
Index to Financial Statements
NOTE 4—LOANS
Loans at September 30, 2014 and December 31, 2013 were as follows:
| September 30, 2014 |
December 31, 2013 |
|||||||
| Loans that are not PCI loans |
||||||||
| Construction and land development |
$ | 213,975 | $ | 113,710 | ||||
| Commercial real estate: |
||||||||
| Nonfarm, nonresidential |
218,149 | 114,852 | ||||||
| Other |
5,671 | 10,350 | ||||||
| Residential real estate: |
||||||||
| Closed-end 1-4 family |
128,693 | 98,615 | ||||||
| Other |
72,737 | 39,851 | ||||||
| Commercial and industrial |
68,693 | 36,397 | ||||||
| Consumer and other |
7,442 | 8,250 | ||||||
|
|
|
|
|
|||||
| Loans before net deferred loan fees |
715,360 | 422,025 | ||||||
| Deferred loan fees, net |
(873 | ) | (721 | ) | ||||
|
|
|
|
|
|||||
| Total loans that are not PCI loans |
714,487 | 421,304 | ||||||
|
|
|
|
|
|||||
| September 30, 2014 |
December 31, 2013 |
|||||||
| PCI loans |
||||||||
| Construction and land development |
$ | 78 | $ | — | ||||
| Commercial real estate: |
||||||||
| Nonfarm, nonresidential |
1,830 | — | ||||||
| Other |
532 | — | ||||||
| Residential real estate: |
||||||||
| Closed-end 1-4 family |
842 | — | ||||||
| Other |
152 | — | ||||||
| Commercial and industrial |
1,352 | — | ||||||
| Consumer and other |
2 | — | ||||||
|
|
|
|
|
|||||
| Total PCI loans |
4,788 | — | ||||||
|
|
|
|
|
|||||
| Allowance for loan losses |
(5,883 | ) | (4,900 | ) | ||||
|
|
|
|
|
|||||
| Total loans, net of allowance for loan losses |
$ | 713,392 | $ | 416,404 | ||||
|
|
|
|
|
|||||
The following table presents the activity in the allowance for loan losses by portfolio segment for the three-month period ending September 30, 2014:
| Construction and Land Development |
Commercial Real Estate |
Residential Real Estate |
Commercial and Industrial |
Consumer and Other |
Total | |||||||||||||||||||
| Three Months Ending September 30, 2014 |
||||||||||||||||||||||||
| Allowance for loan losses: |
||||||||||||||||||||||||
| Beginning balance |
$ | 1,910 | $ | 1,740 | $ | 1,560 | $ | 508 | $ | 53 | $ | 5,771 | ||||||||||||
| Provision for loan losses |
231 | 173 | 192 | 72 | (4 | ) | 664 | |||||||||||||||||
| Loans charged-off |
— | (540 | ) | (11 | ) | (4 | ) | — | (555 | ) | ||||||||||||||
| Recoveries |
— | — | 3 | — | — | 3 | ||||||||||||||||||
|
|
|
|
|
|
|
|
|
|
|
|
|
|||||||||||||
| Total ending allowance balance |
$ | 2,141 | $ | 1,373 | $ | 1,744 | $ | 576 | $ | 49 | $ | 5,883 | ||||||||||||
|
|
|
|
|
|
|
|
|
|
|
|
|
|||||||||||||
There was no allowance for loan losses for PCI loans for the three months ended September 30, 2014.
F-14
Table of Contents
Index to Financial Statements
The adequacy of the allowance for loan losses is assessed at the end of each calendar quarter. The level of the allowance is based upon evaluation of the loan portfolio, current asset quality trends, known and inherent risks in the portfolio, adverse situations that may affect the borrowers’ ability to repay (including the timing of future payment), the estimated value of any underlying collateral, composition of the loan portfolio, economic conditions, historical loss experience, industry and peer bank loan quality indicators and other pertinent factors. The impact of the three months ended activity based allowance disclosures was not material to the Company’s results of operations during the three months ended September 30, 2013.
The following table presents the activity in the allowance for loan losses by portfolio segment for the nine month periods ending September 30, 2014 and 2013:
| Construction and Land Development |
Commercial Real Estate |
Residential Real Estate |
Commercial and Industrial |
Consumer and Other |
Total | |||||||||||||||||||
| Nine Months Ending September 30, 2014 |
||||||||||||||||||||||||
| Allowance for loan losses: |
||||||||||||||||||||||||
| Beginning balance |
$ | 1,552 | $ | 1,511 | $ | 1,402 | $ | 337 | $ | 98 | $ | 4,900 | ||||||||||||
| Provision for loan losses |
589 | 402 | 304 | 243 | (49 | ) | 1,489 | |||||||||||||||||
| Loans charged-off |
— | (540 | ) | (11 | ) | (4 | ) | — | (555 | ) | ||||||||||||||
| Recoveries |
— | — | 49 | — | — | 49 | ||||||||||||||||||
|
|
|
|
|
|
|
|
|
|
|
|
|
|||||||||||||
| Total ending allowance balance |
$ | 2,141 | $ | 1,373 | $ | 1,744 | $ | 576 | $ | 49 | $ | 5,883 | ||||||||||||
|
|
|
|
|
|
|
|
|
|
|
|
|
|||||||||||||
| Nine Months Ending September 30, 2013 |
||||||||||||||||||||||||
| Allowance for loan losses: |
||||||||||||||||||||||||
| Beginning balance |
$ | 1,342 | $ | 1,267 | $ | 893 | $ | 275 | $ | 206 | $ | 3,983 | ||||||||||||
| Provision for loan losses |
243 | 20 | 119 | 131 | (56 | ) | 457 | |||||||||||||||||
| Loans charged-off |
— | — | (107 | ) | — | — | (107 | ) | ||||||||||||||||
| Recoveries |
— | — | 99 | — | — | 99 | ||||||||||||||||||
|
|
|
|
|
|
|
|
|
|
|
|
|
|||||||||||||
| Total ending allowance balance |
$ | 1,585 | $ | 1,287 | $ | 1,004 | $ | 406 | $ | 150 | $ | 4,432 | ||||||||||||
|
|
|
|
|
|
|
|
|
|
|
|
|
|||||||||||||
There was no allowance for loan losses for PCI loans for the nine months ended September 30, 2014.
The following table presents the balance in the allowance for loan losses and the recorded investment in loans by portfolio segment and based on impairment method as of September 30, 2014 and December 31, 2013. For purposes of this disclosure, recorded investment in loans excludes accrued interest receivable and deferred loan fees, net due to immateriality.
| Construction and Land Development |
Commercial Real Estate |
Residential Real Estate |
Commercial and Industrial |
Consumer and Other |
Total | |||||||||||||||||||
| September 30, 2014 |
||||||||||||||||||||||||
| Allowance for loan losses: |
||||||||||||||||||||||||
| Ending allowance balance attributable to loans: |
||||||||||||||||||||||||
| Individually evaluated for impairment |
$ | — | $ | — | $ | — | $ | 39 | $ | — | $ | 39 | ||||||||||||
| Collectively evaluated for impairment |
2,141 | 1,373 | 1,744 | 537 | 49 | 5,844 | ||||||||||||||||||
| Purchased credit-impaired loans |
— | — | — | — | — | — | ||||||||||||||||||
|
|
|
|
|
|
|
|
|
|
|
|
|
|||||||||||||
| Total ending allowance balance |
$ | 2,141 | $ | 1,373 | $ | 1,744 | $ | 576 | $ | 49 | $ | 5,883 | ||||||||||||
|
|
|
|
|
|
|
|
|
|
|
|
|
|||||||||||||
F-15
Table of Contents
Index to Financial Statements
| Construction and Land Development |
Commercial Real Estate |
Residential Real Estate |
Commercial and Industrial |
Consumer and Other |
Total | |||||||||||||||||||
| Loans: |
||||||||||||||||||||||||
| Individually evaluated for impairment |
$ | — | $ | 835 | $ | — | $ | 59 | $ | — | $ | 894 | ||||||||||||
| Collectively evaluated for impairment |
213,975 | 222,985 | 201,430 | 68,634 | 7,442 | 714,466 | ||||||||||||||||||
| Purchased credit-impaired loans |
78 | 2,362 | 994 | 1,352 | 2 | 4,788 | ||||||||||||||||||
|
|
|
|
|
|
|
|
|
|
|
|
|
|||||||||||||
| Total ending loans balance |
$ | 214,053 | $ | 226,182 | $ | 202,424 | $ | 70,045 | $ | 7,444 | $ | 720,148 | ||||||||||||
|
|
|
|
|
|
|
|
|
|
|
|
|
|||||||||||||
| Construction and Land Development |
Commercial Real Estate |
Residential Real Estate |
Commercial and Industrial |
Consumer and Other |
Total | |||||||||||||||||||
| December 31, 2013 |
||||||||||||||||||||||||
| Allowance for loan losses: |
||||||||||||||||||||||||
| Ending allowance balance attributable to loans: |
||||||||||||||||||||||||
| Individually evaluated for impairment |
$ | — | $ | 455 | $ | 93 | $ | — | $ | — | $ | 548 | ||||||||||||
| Collectively evaluated for impairment |
1,552 | 1,056 | 1,309 | 337 | 98 | 4,352 | ||||||||||||||||||
| Purchased credit-impaired loans |
— | — | — | — | — | — | ||||||||||||||||||
|
|
|
|
|
|
|
|
|
|
|
|
|
|||||||||||||
| Total ending allowance balance |
$ | 1,552 | $ | 1,511 | $ | 1,402 | $ | 337 | $ | 98 | $ | 4,900 | ||||||||||||
|
|
|
|
|
|
|
|
|
|
|
|
|
|||||||||||||
| Loans: |
||||||||||||||||||||||||
| Individually evaluated for impairment |
$ | — | $ | 3,361 | $ | 1,262 | $ | — | $ | — | $ | 4,623 | ||||||||||||
| Collectively evaluated for impairment |
113,710 | 121,841 | 137,204 | 36,397 | 8,250 | 417,402 | ||||||||||||||||||
| Purchased credit-impaired loans |
— | — | — | — | — | — | ||||||||||||||||||
|
|
|
|
|
|
|
|
|
|
|
|
|
|||||||||||||
| Total ending loans balance |
$ | 113,710 | $ | 125,202 | $ | 138,466 | $ | 36,397 | $ | 8,250 | $ | 422,025 | ||||||||||||
|
|
|
|
|
|
|
|
|
|
|
|
|
|||||||||||||
Loans collectively evaluated for impairment reported at September 30, 2014 include certain loans acquired from MidSouth on July 1, 2014. The acquired loans were recorded at estimated fair value at date of acquisition, which included an estimated credit discount. On July 1, 2014, acquired non-PCI loans were recorded at an estimated fair value of $178,818, comprised of contractually unpaid principal totaling $183,832 net of estimated discounts totaling $5,014 which included both credit and interest rate discount components. Management evaluated these loans for credit deterioration since acquisition and determined that no allowance for loan losses was necessary at September 30, 2014.
F-16
Table of Contents
Index to Financial Statements
The following table presents information related to impaired loans by class of loans as of September 30, 2014 and December 31, 2013:
| Unpaid Principal Balance |
Recorded Investment |
Allowance for Loan Losses Allocated |
||||||||||
| September 30, 2014 |
||||||||||||
| With no allowance recorded: |
||||||||||||
| Commercial real estate: |
||||||||||||
| Nonfarm, nonresidential |
$ | 2,422 | $ | 835 | $ | — | ||||||
| With an allowance recorded: |
||||||||||||
| Commercial real estate: |
||||||||||||
| Nonfarm, nonresidential |
— | — | — | |||||||||
| Commercial and industrial |
59 | 59 | 39 | |||||||||
|
|
|
|
|
|
|
|||||||
| Subtotal |
59 | 59 | 39 | |||||||||
|
|
|
|
|
|
|
|||||||
| Total |
$ | 2,481 | $ | 894 | $ | 39 | ||||||
|
|
|
|
|
|
|
|||||||
| December 31, 2013 |
||||||||||||
| With no allowance recorded: |
||||||||||||
| Commercial real estate: |
||||||||||||
| Nonfarm, nonresidential |
$ | 1,986 | $ | 1,986 | $ | — | ||||||
| Residential real estate: |
||||||||||||
| 1-4 family |
36 | 36 | — | |||||||||
|
|
|
|
|
|
|
|||||||
| Subtotal |
2,022 | 2,022 | — | |||||||||
|
|
|
|
|
|
|
|||||||
| With an allowance recorded: |
||||||||||||
| Commercial real estate: |
||||||||||||
| Nonfarm, nonresidential |
$ | 2,480 | $ | 1,375 | $ | 455 | ||||||
| Residential real estate: |
||||||||||||
| 1-4 family |
1,687 | 1,226 | 93 | |||||||||
|
|
|
|
|
|
|
|||||||
| Subtotal |
4,167 | 2,601 | 548 | |||||||||
|
|
|
|
|
|
|
|||||||
| Total |
$ | 6,189 | $ | 4,623 | $ | 548 | ||||||
|
|
|
|
|
|
|
|||||||
The following table presents the average recorded investment of impaired loans by class of loans for the three and nine months ended September 30, 2014 and 2013:
| Three Months Ended September 30, |
Nine Months Ended September 30, |
|||||||||||||||
| Average Recorded Investment |
2014 | 2013 | 2014 | 2013 | ||||||||||||
| With no allowance recorded: |
||||||||||||||||
| Construction and land development |
$ | — | $ | — | $ | — | $ | — | ||||||||
| Commercial real estate: |
||||||||||||||||
| Nonfarm, nonresidential |
211 | — | 71 | — | ||||||||||||
| Residential real estate: |
||||||||||||||||
| 1-4 family |
— | 36 | — | 36 | ||||||||||||
|
|
|
|
|
|
|
|
|
|||||||||
| Subtotal |
211 | 36 | 71 | 36 | ||||||||||||
|
|
|
|
|
|
|
|
|
|||||||||
| With an allowance recorded: |
||||||||||||||||
| Construction and land development |
— | $ | 74 | — | 73 | |||||||||||
| Commercial real estate: |
||||||||||||||||
| Nonfarm, nonresidential |
1,194 | 1,375 | 837 | 1,375 | ||||||||||||
| Residential real estate: |
||||||||||||||||
| 1-4 family |
— | 1,226 | 476 | 1,226 | ||||||||||||
| Commercial and industrial |
64 | — | 65 | 20 | ||||||||||||
|
|
|
|
|
|
|
|
|
|||||||||
| Subtotal |
1,258 | 2,675 | 1,378 | 2,694 | ||||||||||||
|
|
|
|
|
|
|
|
|
|||||||||
| Total |
$ | 1,469 | $ | 2,711 | $ | 1,449 | $ | 2,730 | ||||||||
|
|
|
|
|
|
|
|
|
|||||||||
F-17
Table of Contents
Index to Financial Statements
The impact on net interest income for these loans was not material to the Company’s results of operations for the three and nine months ended September 30, 2014 and 2013.
The following table presents the recorded investment in nonaccrual and loans past due over 90 days still on accrual by class of loans as of September 30, 2014 and December 31, 2013:
| Nonaccrual | Loans Past Due Over 90 Days |
|||||||
| September 30, 2014 |
||||||||
| Commercial real estate: |
||||||||
| Nonfarm, nonresidential |
$ | 1,628 | $ | — | ||||
| Other |
532 | — | ||||||
| Residential real estate: |
||||||||
| Closed-end1-4 family |
337 | 411 | ||||||
| Other |
42 | — | ||||||
| Construction and land development |
78 | — | ||||||
| Commercial and industrial |
287 | 41 | ||||||
|
|
|
|
|
|||||
| Total |
$ | 2,904 | $ | 452 | ||||
|
|
|
|
|
|||||
| December 31, 2013 |
||||||||
| Commercial real estate: |
||||||||
| Nonfarm, nonresidential |
$ | 1,375 | $ | — | ||||
| Residential real estate: |
||||||||
| 1-4 family |
1,226 | — | ||||||
|
|
|
|
|
|||||
| Total |
$ | 2,601 | $ | — | ||||
|
|
|
|
|
|||||
Nonaccrual loans and loans past due 90 days still on accrual include both smaller balance homogeneous loans that are collectively evaluated for impairment and individually classified impaired loans.
The following table presents the aging of the recorded investment in past due loans as of September 30, 2014 and December 31, 2013 by class of loans, excluding PCI loans:
| 30-59 Days Past Due |
60-89 Days Past Due |
Greater Than 89 Days Past Due |
Total Past Due |
Loans Not Past Due |
Total | |||||||||||||||||||
| September 30, 2014 |
||||||||||||||||||||||||
| Construction and land development |
$ | — | $ | — | $ | 78 | $ | 78 | $ | 213,897 | $ | 213,975 | ||||||||||||
| Commercial real estate: |
||||||||||||||||||||||||
| Nonfarm, nonresidential |
— | — | 1,628 | 1,628 | 216,521 | 218,149 | ||||||||||||||||||
| Other |
— | — | 532 | 532 | 5,139 | 5,671 | ||||||||||||||||||
| Residential real estate: |
||||||||||||||||||||||||
| Closed-end 1-4 family |
861 | — | 748 | 1,609 | 127,084 | 128,693 | ||||||||||||||||||
| Other |
— | — | 42 | 42 | 72,695 | 72,737 | ||||||||||||||||||
| Commercial and industrial |
— | 32 | 328 | 360 | 68,333 | 68,693 | ||||||||||||||||||
| Consumer and other |
1 | — | — | 1 | 7,441 | 7,442 | ||||||||||||||||||
|
|
|
|
|
|
|
|
|
|
|
|
|
|||||||||||||
| $ | 862 | $ | 32 | $ | 3,356 | $ | 4,250 | $ | 711,110 | $ | 715,360 | |||||||||||||
|
|
|
|
|
|
|
|
|
|
|
|
|
|||||||||||||
F-18
Table of Contents
Index to Financial Statements
| 30-59 Days Past Due |
60-89 Days Past Due |
Greater Than 89 Days Past Due |
Total Past Due |
Loans Not Past Due |
Total | |||||||||||||||||||
| December 31, 2013 |
||||||||||||||||||||||||
| Construction and land development |
$ | — | $ | — | $ | — | $ | — | $ | 113,710 | $ | 113,710 | ||||||||||||
| Commercial real estate: |
||||||||||||||||||||||||
| Nonfarm, nonresidential |
1,985 | — | 1,375 | 3,360 | 111,492 | 114,852 | ||||||||||||||||||
| Other |
— | — | — | — | 10,350 | 10,350 | ||||||||||||||||||
| Residential real estate: |
||||||||||||||||||||||||
| Closed end 1-4 family |
245 | — | 1,226 | 1,471 | 97,144 | 98,615 | ||||||||||||||||||
| Other |
— | — | — | — | 39,851 | 39,851 | ||||||||||||||||||
| Commercial and industrial |
— | — | — | — | 36,397 | 36,397 | ||||||||||||||||||
| Consumer and other |
— | — | — | — | 8,250 | 8,250 | ||||||||||||||||||
|
|
|
|
|
|
|
|
|
|
|
|
|
|||||||||||||
| $ | 2,230 | $ | — | $ | 2,601 | $ | 4,831 | $ | 417,194 | $ | 422,025 | |||||||||||||
|
|
|
|
|
|
|
|
|
|
|
|
|
|||||||||||||
Credit Quality Indicators: The Company categorizes loans into risk categories based on relevant information about the ability of borrowers to service their debt such as: current financial information, historical payment experience, credit documentation, public information, and current economic trends, among other factors. The Company analyzes loans individually by classifying the loans as to credit risk. This analysis includes non-homogeneous loans, such as commercial and commercial real estate loans as well as non-homogeneous residential real estate loans. This analysis is performed on a quarterly basis. The Company uses the following definitions for risk ratings:
Special Mention. Loans classified as special mention have a potential weakness that deserves management’s close attention. If left uncorrected, these potential weaknesses may result in deterioration of the repayment prospects for the loan or of the institution’s credit position at some future date.
Substandard. Loans classified as substandard are inadequately protected by the current net worth and paying capacity of the obligor or of the collateral pledged, if any. Loans so classified have a well-defined weakness or weaknesses that jeopardize the liquidation of the debt. They are characterized by the distinct possibility that the institution will sustain some loss if the deficiencies are not corrected.
Loans not meeting the criteria above that are analyzed individually as part of the above described process are considered to be pass rated loans. Based on the most recent analysis performed, the risk category of loans by class of loans, excluding PCI loans, is as follows as of September 30, 2014 and December 31, 2013:
| Pass | Special Mention |
Substandard | Total | |||||||||||||
| September 30, 2014 | ||||||||||||||||
| Construction and land development |
$ | 213,772 | $ | 125 | $ | 78 | $ | 213,975 | ||||||||
| Commercial real estate: |
||||||||||||||||
| Nonfarm, nonresidential |
214,202 | 726 | 3,221 | 218,149 | ||||||||||||
| Other |
5,142 | — | 529 | 5,671 | ||||||||||||
| Residential real estate: |
||||||||||||||||
| Closed-end 1-4 family |
125,676 | 355 | 2,662 | 128,693 | ||||||||||||
| Other |
72,502 | 87 | 148 | 72,737 | ||||||||||||
| Commercial and industrial |
66,462 | 886 | 1,345 | 68,693 | ||||||||||||
| Consumer and other |
7,442 | — | — | 7,442 | ||||||||||||
|
|
|
|
|
|
|
|
|
|||||||||
| $ | 705,198 | $ | 2,179 | $ | 7,983 | $ | 715,360 | |||||||||
|
|
|
|
|
|
|
|
|
|||||||||
F-19
Table of Contents
Index to Financial Statements
| Pass | Special Mention |
Substandard | Total | |||||||||||||
| December 31, 2013 | ||||||||||||||||
| Construction and land development |
$ | 113,710 | $ | — | $ | — | $ | 113,710 | ||||||||
| Commercial real estate: |
||||||||||||||||
| Nonfarm, nonresidential |
110,938 | — | 3,914 | 114,852 | ||||||||||||
| Other |
10,350 | — | — | 10,350 | ||||||||||||
| Residential real estate: |
||||||||||||||||
| 1-4 family |
96,823 | — | 1,792 | 98,615 | ||||||||||||
| Other |
39,851 | — | — | 39,851 | ||||||||||||
| Commercial and industrial |
36,397 | — | — | 36,397 | ||||||||||||
| Consumer and other |
8,250 | — | — | 8,250 | ||||||||||||
|
|
|
|
|
|
|
|
|
|||||||||
| $ | 416,319 | $ | — | $ | 5,706 | $ | 422,025 | |||||||||
|
|
|
|
|
|
|
|
|
|||||||||
Purchased Credit-Impaired (“PCI”) Loans
Income is recognized on PCI loans pursuant to ASC Topic 310-30. A portion of the fair value discount has been recognized as an accretable yield that is accreted into interest income over the estimated remaining life of the loans. The remaining non-accretable difference represents cash flows not expected to be collected.
The table below summarizes the total contractually required principal and interest cash payments, management’s estimate of expected total cash payments and carrying value of the loans as of September 30, 2014. Contractually required principal and interest payments have been adjusted for estimated prepayments.
| September 30, 2014 |
||||
| Contractually required principal and interest |
$ | 7,535 | ||
| Non-accretable difference |
(1,629 | ) | ||
|
|
|
|||
| Cash flows expected to be collected |
5,906 | |||
| Accretable yield |
(1,118 | ) | ||
|
|
|
|||
| Carrying value of acquired loans |
4,788 | |||
| Allowance for loan losses |
— | |||
|
|
|
|||
| Carrying value less allowance for loan losses |
$ | 4,788 | ||
|
|
|
|||
For the three and nine months ended September 30, 2014, the Company recognized $120 in accretion income from the accretable yield related to acquired PCI loans.
Troubled Debt Restructurings
The Company’s loan portfolio contains no loans that have been modified in a troubled debt restructuring.
NOTE 5—LOAN SERVICING
Loans serviced for others are not reported as assets. The principal balances of these loans at September 30, 2014 and December 31, 2013 are as follows:
| September 30, 2014 |
December 31, 2013 |
|||||||
| Loan portfolios serviced for: |
||||||||
| Federal Home Loan Mortgage Corporation |
$ | 398,161 | $ | 348,121 | ||||
| Other |
4,473 | 5,088 | ||||||
F-20
Table of Contents
Index to Financial Statements
The components of net loan servicing fees for the three and nine months ended September 30, 2014 and 2013 were as follows:
| Three Months Ended September 30, |
Nine Months Ended September 30, |
|||||||||||||||
| 2014 | 2013 | 2014 | 2013 | |||||||||||||
| Loan servicing fees, net: |
||||||||||||||||
| Loan servicing fees |
$ | 253 | $ | 217 | $ | 720 | $ | 584 | ||||||||
| Amortization of loan servicing fees |
(180 | ) | (326 | ) | (547 | ) | (991 | ) | ||||||||
| Decrease in impairment |
— | 90 | — | 90 | ||||||||||||
|
|
|
|
|
|
|
|
|
|||||||||
| Total |
$ | 73 | $ | (19 | ) | $ | 173 | $ | (317 | ) | ||||||
|
|
|
|
|
|
|
|
|
|||||||||
The fair value of servicing rights was estimated by management to be approximately $4,104 at September 30, 2014. Fair value for 2014 was determined using a weighted average discount rate of 10.5% and a weighted average prepayment speed of 10.1%. At December 31, 2013, the fair value of servicing rights was estimated by management to be approximately $3,714. Fair value for 2013 was determined using weighted average discount rate of 10.5% and a weighted average prepayment speed of 8.8%.
The weighted average amortization period is 6.66 years. Estimated amortization expense for each of the next three years is:
| 2014 |
$ | 444 | ||
| 2015 |
444 | |||
| 2016 |
444 |
NOTE 6—SHARE-BASED PAYMENTS
In connection with the Company’s 2010 private offering, 32,425 warrants were issued to shareholders, one warrant for every twenty shares of common stock purchased. Each warrant allows the shareholders to purchase an additional share of common stock at $12.00 per share. The warrants were issued with an effective date of March 30, 2010 and will be exercisable in whole or in part up to seven years following the date of issuance. The warrants are detachable from the common stock. There were 2,500 warrants exercised during the nine months ended September 30, 2013, for which the Company received cash proceeds of $30. The exercised warrants had an intrinsic value of $3 at the date of exercise. No warrants have been exercised during 2014. At September 30, 2014, there were 31,877 outstanding warrants associated with the 2010 offering.
In the event the common stock of the Company is to be registered under the Securities Act or is traded on a national securities exchange at $15.00 or more for forty-five (45) consecutive days, the Company may redeem the 2010 warrants at any time thereafter with not less than thirty (30) days’ written notice to the holder of such 2010 warrant, in whole or in part, at a redemption price of $1.00 per warrant; provided, however, that the holder of the 2010 warrant may exercise the 2010 warrant, in whole or in part, during such thirty (30) day period.
Stock Option Plan: The Company’s 2007 Stock Option Plan (“stock option plan” or the “Plan”), which was shareholder-approved, permitted the grant of share options to its employees, organizers and directors for up to 551,250 shares of common stock. The Plan was amended during April 2010 to increase the number of shares available for issuance to 1,000,000. In April 2013, the Plan was amended to offer additional forms of equity compensation, to change the Plan’s name to the Franklin Financial Network, Inc. 2007 Omnibus Equity Incentive Plan, and to increase the number of authorized shares to 1,500,000. The Company believes that such awards better align the interests of its employees with those of its shareholders. In June 2014, shareholders approved to amend the Plan to increase the number of authorized shares to 2,000,000. At September 30, 2014, there were 604,551 authorized shares available for issuance.
F-21
Table of Contents
Index to Financial Statements
Employee, organizer and director awards are generally granted with an exercise price equal to the market price of the Company’s common stock at the date of grant; those option awards have a vesting period of 3 to 5 years and have a 10-year contractual term. The Company assigns discretion to its Board of Directors to make grants either as qualified incentive stock options or as non-qualified stock options. All employee grants are intended to be treated as qualified incentive stock options, if allowable. All other grants are expected to be treated as non-qualified.
During 2007, the Company granted 33,750 options to its organizers under the Plan. These options were granted in accordance with each organizer’s financial contribution to the Company during its organization period, and will vest over a five year period. No service element was included in the criteria used for determining grant awards. Accordingly, these options are not being expensed as stock-based compensation.
During 2013, the Company granted employees the option to acquire common shares of the Company, plus a cash award, in exchange for existing vested options held by the employee. Options that were exchanged were surrendered and considered cancelled. As part of this exchange, a total of 166,448 options were cancelled in exchange for 32,814 shares of common stock and cash awards totaling $142.
The fair value of each option award is estimated on the date of grant using a closed form option valuation (Black-Scholes) model that uses the assumptions noted in the table below. Expected stock price volatility is based on historical volatilities of a peer group. The Company uses historical data to estimate option exercise and post-vesting termination behavior.
The expected term of options granted represents the period of time that options granted are expected to be outstanding, which takes into account that the options are not transferable. The risk-free interest rate for the expected term of the option is based on the U.S. Treasury yield curve in effect at the time of the grant.
On the date of the acquisition, 322,300 MidSouth common stock options were converted into 137,280 options to purchase shares of FFN common stock with an exercise price of $8.57 per option pursuant to the terms of the merger agreement (see Note 2). Using the Black-Scholes option valuation model, the grant date fair value was estimated to be $6.31 per converted option based on the $14.50 fair value per share of FFN common stock at July 1, 2014.
The fair value of options granted was determined using the following weighted-average assumptions as of grant date.
| September 30, 2014 |
September 30, 2013 |
|||||||
| Risk-free interest rate |
1.81 | % | 1.65 | % | ||||
| Expected term |
5.9 years | 7.5 years | ||||||
| Expected stock price volatility |
10.85 | % | 12.63 | % | ||||
| Dividend yield |
0.23 | % | 0.99 | % | ||||
The weighted average fair value of options granted for the nine months ended September 30, 2014 and 2013 were $4.12 and $1.92, respectively.
F-22
Table of Contents
Index to Financial Statements
A summary of the activity in the stock option plans for the nine months ended September 30, 2014 follows:
| Shares | Weighted Average Exercise Price |
Weighted Average Remaining Contractual Term |
Aggregate Intrinsic Value |
|||||||||||||
| Outstanding at beginning of year |
946,644 | $ | 11.27 | 6.81 | $ | 1,635 | ||||||||||
| Granted |
316,960 | 11.36 | ||||||||||||||
| Exercised |
(6,508 | ) | 8.63 | |||||||||||||
| Forfeited, expired, or cancelled |
(19,134 | ) | 11.71 | |||||||||||||
|
|
|
|||||||||||||||
| Outstanding at period end |
1,237,962 | $ | 11.30 | 6.93 | $ | 2,076 | ||||||||||
|
|
|
|
|
|
|
|
|
|||||||||
| Vested or expected to vest |
1,176,064 | $ | 11.30 | 6.93 | $ | 1,972 | ||||||||||
| Exercisable at period end |
807,599 | $ | 10.61 | 6.10 | $ | 1,630 | ||||||||||
|
|
|
|
|
|
|
|
|
|||||||||
As of September 30, 2014, there was $740 of total unrecognized compensation cost related to non-vested stock options granted under the Plan. The cost is expected to be recognized over a weighted-average period of 1.7 years.
Restricted Share Award Plan: Additionally, the Company’s 2007 Omnibus Equity Incentive Plan provides for the granting of restricted share awards and other performance related incentives. During 2014, the Company awarded 87,374 restricted common shares to employees of the Company. When the restricted shares are awarded, a participant receives voting and dividend rights with respect to the shares, but is not able to transfer the shares until the restrictions have lapsed. These awards have a vesting period of three to five years and vest in equal annual installments on the anniversary date of the grant.
A summary of activity for non-vested restricted share awards for the nine months ended September 30, 2014 is as follows:
| Non-vested Shares |
Shares | Weighted-Average Grant-Date Fair Value |
||||||
| Non-vested at December 31, 2013 |
28,685 | $ | 13.00 | |||||
| Granted |
87,374 | 14.12 | ||||||
| Vested |
(9,166 | ) | 13.00 | |||||
| Forfeited |
(3,649 | ) | 14.32 | |||||
|
|
|
|||||||
| Non-vested at September 30, 2014 |
103,244 | $ | 13.91 | |||||
|
|
|
|||||||
Compensation expense associated with the restricted share awards is recognized on a straight-line basis over the time period that the restrictions associated with the awards lapse based on the total cost of the award at the grant date. As of September 30, 2014, there was $931 of total unrecognized compensation cost related to non-vested shares granted under the Plan. The cost is expected to be recognized over a weighted-average period of 4.02 years.
NOTE 7—REGULATORY CAPITAL MATTERS
Banks and bank holding companies are subject to regulatory capital requirements administered by federal banking agencies. Capital adequacy guidelines and, additionally for banks, prompt corrective action regulations, involve quantitative measures of assets, liabilities, and certain off-balance-sheet items calculated under regulatory accounting practices. Capital amounts and classifications are also subject to qualitative judgments by regulators. Failure to meet capital requirements can initiate regulatory action. Management believes as of September 30, 2014, the Company and Bank meet all capital adequacy requirements to which they are subject.
F-23
Table of Contents
Index to Financial Statements
Prompt corrective action regulations provide five classifications: well capitalized, adequately capitalized, undercapitalized, significantly undercapitalized, and critically undercapitalized, although these terms are not used to represent overall financial condition. If adequately capitalized, regulatory approval is required to accept brokered deposits. If undercapitalized, capital distributions are limited, as is asset growth and expansion, and capital restoration plans are required. At September 30, 2014, the most recent regulatory notifications categorized the Bank as well capitalized under the regulatory framework for prompt corrective action. There are no conditions or events since that notification that management believes have changed the institution’s category. Actual and required capital amounts and ratios are presented below as of September 30, 2014 and December 31, 2013 for the Company and Bank.
| Actual | Required For Capital Adequacy Purposes |
To Be Well Capitalized Under Prompt Corrective Action Regulations |
||||||||||||||||||||||
| Amount | Ratio | Amount | Ratio | Amount | Ratio | |||||||||||||||||||
| September 30, 2014 | ||||||||||||||||||||||||
| Company Total Capital to risk weighted assets |
$ | 110,328 | 13.05 | % | $ | 67,643 | 8.00 | % | N/A | N/A | ||||||||||||||
| Company Tier 1 (Core) Capital to risk weighted assets |
$ | 104,445 | 12.35 | % | $ | 33,821 | 4.00 | % | N/A | N/A | ||||||||||||||
| Company Tier 1 (Core) Capital to average assets |
$ | 104,445 | 8.83 | % | $ | 47,319 | 4.00 | % | N/A | N/A | ||||||||||||||
| Bank Total Capital to risk weighted assets |
$ | 109,810 | 12.99 | % | $ | 67,629 | 8.00 | % | $ | 84,537 | 10.00 | % | ||||||||||||
| Bank Tier 1 (Core) Capital to risk weighted assets |
$ | 103,927 | 12.29 | % | $ | 33,815 | 4.00 | % | $ | 50,722 | 6.00 | % | ||||||||||||
| Bank Tier 1 (Core) Capital to average assets |
$ | 103,927 | 8.79 | % | $ | 47,311 | 4.00 | % | $ | 59,139 | 5.00 | % | ||||||||||||
| December 31, 2013 | ||||||||||||||||||||||||
| Company Total Capital to risk weighted assets |
$ | 74,430 | 14.81 | % | $ | 40,209 | 8.00 | % | N/A | N/A | ||||||||||||||
| Company Tier 1 (Core) Capital to risk weighted assets |
$ | 69,530 | 13.83 | % | $ | 20,105 | 4.00 | % | N/A | N/A | ||||||||||||||
| Company Tier 1 (Core) Capital to average assets |
$ | 69,530 | 9.78 | % | $ | 28,449 | 4.00 | % | N/A | N/A | ||||||||||||||
| Bank Total Capital to risk weighted assets |
$ | 73,305 | 14.59 | % | $ | 40,192 | 8.00 | % | $ | 50,239 | 10.00 | % | ||||||||||||
| Bank Tier 1 (Core) Capital to risk weighted assets |
$ | 68,405 | 13.62 | % | $ | 20,096 | 4.00 | % | $ | 30,144 | 6.00 | % | ||||||||||||
| Tier 1 (Core) Capital to average assets |
$ | 68,405 | 9.62 | % | $ | 28,455 | 4.00 | % | $ | 35,569 | 5.00 | % | ||||||||||||
Dividend Restrictions: The Company’s principal source of funds for dividend payments is dividends received from the Bank. Banking regulations limit the amount of dividends that may be paid without prior approval of regulatory agencies. Under these regulations, the amount of dividends that may be paid in any calendar year is limited to the current year’s net profits, combined with the retained net profits of the preceding two years, subject to the capital requirements described above. During 2014 the Bank could declare, without prior approval, dividends of approximately $9,190 plus any 2014 net profits retained to the date of declaration.
NOTE 8—FAIR VALUE
Fair value is the exchange price that would be received for an asset or paid to transfer a liability (exit price) in the principal or most advantageous market for the asset or liability in an orderly transaction between market participants on the measurement date. There are three levels of inputs that may be used to measure fair values:
Level 1: Quoted prices (unadjusted) for identical assets or liabilities in active markets that the entity has the ability to access as of the measurement date.
Level 2: Significant other observable inputs other than Level 1 prices such as quoted prices for similar assets or liabilities; quoted prices in markets that are not active; or other inputs that are observable or can be corroborated by observable market data.
Level 3: Significant unobservable inputs that reflect a reporting entity’s own assumptions about the assumptions that market participants would use in pricing an asset or liability.
F-24
Table of Contents
Index to Financial Statements
The Company used the following methods and significant assumptions to estimate the fair value of each type of asset and liability:
Securities: The fair values for investment securities are determined by quoted market prices, if available (Level 1). For securities where quoted prices are not available, fair values are calculated based on market prices of similar securities (Level 2). For securities where quoted prices or market prices of similar securities are not available, fair values are calculated using discounted cash flows or other market indicators (Level 3).
Derivatives: The fair values of derivatives are based on valuation models using observable market data as of the measurement date (Level 2).
Impaired Loans: The fair value of impaired loans with specific allocations of the allowance for loan losses is generally based on recent real estate appraisals. These appraisals may utilize a single valuation approach or a combination of approaches including comparable sales and the income approach. Adjustments are routinely made in the appraisal process by the independent appraisers to adjust for differences between the comparable sales and income data available. Such adjustments are usually significant and typically result in a Level 3 classification of the inputs for determining fair value. Non-real estate collateral may be valued using an appraisal, net book value per the borrower’s financial statements, or aging reports, adjusted or discounted based on management’s historical knowledge, changes in market conditions from the time of the valuation, and management’s expertise and knowledge of the client and client’s business, resulting in a Level 3 fair value classification. Impaired loans are evaluated on a quarterly basis for additional impairment and adjusted accordingly. Appraisals for impaired loans are generally obtained annually but may be obtained more frequently based on changing circumstances as part of the aforementioned quarterly evaluation.
Foreclosed Assets: Assets acquired through or instead of loan foreclosure are initially recorded at fair value less costs to sell when acquired, establishing a new cost basis. These assets are subsequently accounted for at lower of cost or fair value less estimated costs to sell. Fair value is commonly based on recent real estate appraisals which are updated no less frequently than annually. These appraisals may utilize a single valuation approach or a combination of approaches including comparable sales and the income approach. Adjustments are routinely made in the appraisal process by the independent appraisers to adjust for differences between the comparable sales and income data available. Such adjustments are usually significant and typically result in a Level 3 classification of the inputs for determining fair value. Foreclosed assets are evaluated on a quarterly basis for additional impairment and adjusted accordingly.
Loans Held For Sale: During 2014 the Company elected the fair value option for loans held for sale to align with other accounting policies related to mortgage banking, such as mortgage banking derivatives. These loans are typically sold to an investor following loan origination and the fair value of such accounts are readily available based on direct quotes from investors or similar transactions experienced in the secondary loan market. Fair value adjustments, as well as realized gains and losses are recorded in current earnings. Fair value is determined by market prices for similar transactions adjusted for specific attributes of that loan.
F-25
Table of Contents
Index to Financial Statements
Assets and liabilities measured at fair value on a recurring basis, including financial assets and liabilities for which the Company has elected the fair value option, are summarized below:
| Fair Value Measurements at September 30, 2014 Using: |
||||||||||||
| Quoted Prices in Active Markets for Identical Assets (Level 1) |
Significant Other Observable Inputs (Level 2) |
Significant Unobservable Inputs (Level 3) |
||||||||||
| Financial Assets |
||||||||||||
| Securities available for sale |
||||||||||||
| U.S. government sponsored entities and agencies |
$ | 1,739 | $ | 18,073 | $ | — | ||||||
| U.S. Treasury Bills |
7,000 | — | — | |||||||||
| Mortgage-backed securities-residential |
— | 307,886 | — | |||||||||
| Mortgage-backed securities-commercial |
— | 6,467 | — | |||||||||
| State and political subdivisions |
— | 5,585 | — | |||||||||
|
|
|
|
|
|
|
|||||||
| Total securities available for sale |
$ | 8,739 | $ | 338,011 | $ | — | ||||||
|
|
|
|
|
|
|
|||||||
| Loans held for sale |
$ | — | $ | 25,652 | $ | — | ||||||
|
|
|
|
|
|
|
|||||||
| Mortgage banking derivatives |
$ | — | $ | 368 | $ | — | ||||||
|
|
|
|
|
|
|
|||||||
| Financial Liabilities |
||||||||||||
| Mortgage banking derivatives |
$ | — | $ | 54 | $ | — | ||||||
|
|
|
|
|
|
|
|||||||
| Fair Value Measurements at December 31, 2013 Using: |
||||||||||||
| Quoted Prices in Active Markets for Identical Assets (Level 1) |
Significant Other Observable Inputs (Level 2) |
Significant Unobservable Inputs (Level 3) |
||||||||||
| Financial Assets |
||||||||||||
| Securities available for sale |
||||||||||||
| U.S. government sponsored entities and agencies |
$ | — | $ | 14,724 | $ | — | ||||||
| Mortgage-backed securities-residential |
— | 253,791 | — | |||||||||
|
|
|
|
|
|
|
|||||||
| Total securities available for sale |
$ | — | $ | 268,515 | $ | — | ||||||
|
|
|
|
|
|
|
|||||||
| Mortgage banking derivatives |
$ | — | $ | 464 | $ | — | ||||||
|
|
|
|
|
|
|
|||||||
As of September 30, 2014, the unpaid principal balance of loans held for sale was $24,897 resulting in an unrealized gain of $755 included in gains on sale of loans. For the three and nine months ended September 30, 2014, the change in fair value related to loans held for sale, which is included in gain on sale of loans, has increased $217 and $755, respectively. None of these loans are 90 days or more past due or on nonaccrual as of September 30, 2014. There were no loans held for sale carried at fair value as of December 31, 2013.
There were no transfers between level 1 and 2 during 2014 and 2013.
F-26
Table of Contents
Index to Financial Statements
Assets measured at fair value on a non-recurring basis are summarized below:
| Fair Value Measurements at September 30, 2014 Using: |
||||||||||||
| Quoted Prices in Active Markets for Identical Assets (Level 1) |
Significant Other Observable Inputs (Level 2) |
Significant Unobservable Inputs (Level 3) |
||||||||||
| Impaired loans with specific allocations |
||||||||||||
| Commercial and industrial |
— | — | 20 | |||||||||
| Foreclosed assets |
||||||||||||
| Construction and land development |
— | — | 800 | |||||||||
| Fair Value Measurements at December 31, 2013 Using: |
||||||||||||
| Quoted Prices in Active Markets for Identical Assets (Level 1) |
Significant Other Observable Inputs (Level 2) |
Significant Unobservable Inputs (Level 3) |
||||||||||
| Impaired loans with specific allocations |
||||||||||||
| Real estate: |
||||||||||||
| Residential |
$ | — | $ | — | $ | 1,133 | ||||||
| Commercial |
— | — | 920 | |||||||||
Impaired loans with specific allocations, which are measured for impairment using the fair value of the collateral for collateral dependent loans, had a carrying amount of $59, with a valuation allowance of $39 at September 30, 2014, resulting in provision for loan losses totaling ($7) and $39 for the three and nine month periods ending September 30, 2014. At December 31, 2013, impaired loans with specific allocations had a carrying amount of $2,601, with a valuation allowance of $548. For the three and nine months ended September 30, 2013, no additional provision for loan losses was recorded related to impaired loans recorded at fair value of collateral.
Foreclosed assets measured at fair value less costs to sell, had a net carrying amount of $1,690 and $181 as of September 30, 2014 and December 31, 2013, respectively. There were no properties at September 30, 2014 that had required write-downs to fair value resulting in no write downs for the three and nine month periods ending September 30, 2014. Foreclosed assets measured at fair value less costs to sell were written down to fair value resulting in a write-down of $190 for the nine month period ending September 30, 3013. There were no write downs to fair value for the three month period ending September 30, 2013.
The following table presents quantitative information about non-recurring Level 3 fair value measurements at September 30, 2014:
| Fair Value |
Valuation Technique(s) |
Unobservable Input(s) |
Range (Weighted Average) |
|||||||||||
| Foreclosed assets |
||||||||||||||
| Construction and land development |
$ | 800 | Sales comparison | Adjustment for differences between comparable sales |
0%-40%(40% | ) | ||||||||
F-27
Table of Contents
Index to Financial Statements
The following table presents quantitative information about non-recurring Level 3 fair value measurements at December 31, 2013:
| Fair Value |
Valuation Technique(s) |
Unobservable Input(s) |
Range (Weighted Average) |
|||||||||||
| Impaired loans: |
||||||||||||||
| Residential real estate |
$ | 1,133 | Sales comparison | Adjustment for differences between comparable sales |
3%-27%(16% | ) | ||||||||
| Commercial real estate |
$ | 920 | Sales comparison | Adjustment for differences between comparable sales |
0%-16%(16% | ) | ||||||||
The carrying amounts and estimated fair values of financial instruments, at September 30, 2014 and December 31, 2013 are as follows:
| Carrying Amount |
Fair Value Measurements at September 30, 2014 Using: |
|||||||||||||||||||
| Level 1 | Level 2 | Level 3 | Total | |||||||||||||||||
| Financial assets |
||||||||||||||||||||
| Cash and cash equivalents |
$ | 36,657 | $ | 36,657 | $ | — | $ | — | $ | 36,657 | ||||||||||
| Securities available for sale |
346,750 | 8,739 | 338,011 | — | 346,750 | |||||||||||||||
| Certificates of deposit held at other financial institutions |
250 | — | 250 | — | 250 | |||||||||||||||
| Securities held to maturity |
56,293 | — | 55,904 | — | 55,904 | |||||||||||||||
| Loans held for sale |
25,652 | — | 25,652 | — | 25,652 | |||||||||||||||
| Net loans |
713,392 | — | — | 709,009 | 709,009 | |||||||||||||||
| Restricted equity securities |
5,349 | n/a | n/a | n/a | n/a | |||||||||||||||
| Servicing rights, net |
2,956 | — | 4,104 | — | 4,104 | |||||||||||||||
| Accrued interest receivable |
3,426 | 13 | 1,400 | 2,013 | 3,426 | |||||||||||||||
| Financial liabilities |
||||||||||||||||||||
| Deposits |
$ | 1,051,558 | $ | 719,293 | $ | 334,629 | $ | — | $ | 1,053,922 | ||||||||||
| Federal funds purchased and repurchase agreements |
34,238 | — | 34,238 | — | 34,238 | |||||||||||||||
| FHLB advances |
33,000 | — | 33,181 | — | 33,181 | |||||||||||||||
| Accrued interest payable |
437 | 35 | 402 | — | 437 | |||||||||||||||
| Carrying Amount |
Fair Value Measurements at December 31, 2013 Using: |
|||||||||||||||||||
| Level 1 | Level 2 | Level 3 | Total | |||||||||||||||||
| Financial assets |
||||||||||||||||||||
| Cash and cash equivalents |
$ | 18,217 | $ | 18,217 | $ | — | $ | — | $ | 18,217 | ||||||||||
| Securities available for sale |
268,515 | — | 268,515 | — | 268,515 | |||||||||||||||
| Securities held to maturity |
56,575 | — | 54,004 | — | 54,004 | |||||||||||||||
| Loans held for sale |
10,694 | — | 10,694 | — | 10,694 | |||||||||||||||
| Net loans |
416,404 | — | — | 415,515 | 415,515 | |||||||||||||||
| Restricted equity securities |
3,032 | n/a | n/a | n/a | n/a | |||||||||||||||
| Mortgage servicing rights |
2,640 | — | 3,714 | — | 3,714 | |||||||||||||||
| Accrued interest receivable |
2,396 | — | 1,145 | 1,251 | 2,396 | |||||||||||||||
| Financial liabilities |
||||||||||||||||||||
| Deposits |
$ | 681,300 | $ | 480,000 | $ | 202,300 | $ | — | $ | 682,300 | ||||||||||
| Federal funds purchased and repurchase agreements |
24,291 | — | 24,291 | — | 24,291 | |||||||||||||||
| FHLB advances |
23,000 | — | 23,023 | — | 23,023 | |||||||||||||||
| Accrued interest payable |
222 | 17 | 205 | — | 222 | |||||||||||||||
F-28
Table of Contents
Index to Financial Statements
The methods and assumptions not previously described used to estimate fair value are described as follows:
(a) Cash and Cash Equivalents: The carrying amounts of cash and short-term instruments approximate fair values and are classified as Level 1.
(b) Loans: Fair values of loans, excluding loans held for sale, are estimated as follows: For variable rate loans that reprice frequently and with no significant change in credit risk, fair values are based on carrying values resulting in a Level 3 classification. Fair values for other loans are estimated using discounted cash flow analyses, using interest rates currently being offered for loans with similar terms to borrowers of similar credit quality resulting in a Level 3 classification. Impaired loans are valued at the lower of cost or fair value as described previously. The methods utilized to estimate the fair value of loans do not necessarily represent an exit price.
The fair value of loans held for sale is estimated based upon binding contracts and quotes from third party investors resulting in a Level 2 classification.
(c) Restricted Equity Securities: It is not practical to determine the fair value of FHLB or Federal Reserve Bank stock due to restrictions placed on its transferability.
(d) Mortgage Servicing Rights: Fair value of mortgage servicing rights is based on valuation models that calculate the present value of estimated net cash flows based on industry market data. The valuation model incorporates assumptions that market participants would use in estimating future net cash flows resulting in a Level 2 classification.
(e) Deposits: The fair values disclosed for demand deposits (e.g., interest and non-interest checking, passbook savings, and certain types of money market accounts) are, by definition, equal to the amount payable on demand at the reporting date (i.e., their carrying amount) resulting in a Level 1 classification. The carrying amounts of fixed-term money market accounts approximate their fair values at the reporting date resulting in a Level 1 classification. Fair values for certificates of deposit are estimated using a discounted cash flows calculation that applies interest rates currently being offered on certificates to a schedule of aggregated expected monthly maturities on time deposits resulting in a Level 2 classification.
(f) Federal Funds Purchased and Repurchase Agreements: The carrying amounts of federal funds purchased, borrowings under repurchase agreements, and other short-term borrowings, generally maturing within ninety days, approximate their fair values resulting in a Level 2 classification.
(g) FHLB Advances: The fair values of the Company’s long-term borrowings are estimated using discounted cash flow analyses based on the current borrowing rates for similar types of borrowing arrangements resulting in a Level 2 classification.
(h) Accrued Interest Receivable/Payable: The carrying amounts of accrued interest approximate fair value resulting in a Level 1, Level 2 or Level 3 classification based on the asset/liability with which they are associated.
(i) Off-balance Sheet Instruments: Fair values for off-balance sheet, credit-related financial instruments are based on fees currently charged to enter into similar agreements, taking into account the remaining terms of the agreements and the counterparties’ credit standing. The fair value of commitments is not material.
F-29
Table of Contents
Index to Financial Statements
NOTE 9—EARNINGS PER SHARE
The two-class method is used in the calculation of basic and diluted earnings per share. Under the two-class method, earnings available to common shareholders for the period are allocated between common shareholders and participating securities according to dividends declared (or accumulated) and participation rights in undistributed earnings. The factors used in the earnings per share computation follow:
| Three Months Ended September 30, |
Nine Months Ended September 30, |
|||||||||||||||
| 2014 | 2013 | 2014 | 2013 | |||||||||||||
| Basic |
||||||||||||||||
| Net income available to common shareholders |
$ | 1,990 | $ | 985 | $ | 5,504 | $ | 3,075 | ||||||||
| Less: earnings allocated to participating securities |
(27 | ) | (8 | ) | (57 | ) | (11 | ) | ||||||||
|
|
|
|
|
|
|
|
|
|||||||||
| Net income allocated to common shareholders |
$ | 1,963 | $ | 977 | $ | 5,447 | $ | 3,064 | ||||||||
|
|
|
|
|
|
|
|
|
|||||||||
| Weighted average common shares outstanding including participating securities |
7,737,710 | 3,704,437 | 5,840,620 | 3,655,722 | ||||||||||||
| Less: Participating securities |
(105,129 | ) | (30,105 | ) | (60,840 | ) | (13,564 | ) | ||||||||
|
|
|
|
|
|
|
|
|
|||||||||
| Average shares |
7,632,581 | 3,674,332 | 5,779,780 | 3,642,158 | ||||||||||||
|
|
|
|
|
|
|
|
|
|||||||||
| Basic earnings per common share |
$ | 0.26 | $ | 0.27 | $ | 0.94 | $ | 0.84 | ||||||||
|
|
|
|
|
|
|
|
|
|||||||||
| Three Months Ended September 30, |
Nine Months Ended September 30, |
|||||||||||||||
| 2014 | 2013 | 2014 | 2013 | |||||||||||||
| Diluted |
||||||||||||||||
| Net income allocated to common shareholders |
$ | 1,963 | $ | 977 | $ | 5,447 | $ | 3,064 | ||||||||
| Weighted average common shares outstanding for basic earnings per common share |
7,632,581 | 3,674,332 | 5,840,620 | 3,642,158 | ||||||||||||
| Add: Dilutive effects of assumed exercises of stock options |
272,634 | 85,987 | 170,470 | 105,052 | ||||||||||||
| Add: Dilutive effects of assumed exercises of stock warrants |
7,559 | 2,485 | 5,033 | 2,490 | ||||||||||||
|
|
|
|
|
|
|
|
|
|||||||||
| Average shares and dilutive potential common shares |
7,912,774 | 3,762,804 | 6,016,123 | 3,749,700 | ||||||||||||
|
|
|
|
|
|
|
|
|
|||||||||
| Dilutive earnings per common share |
$ | 0.25 | $ | 0.26 | $ | 0.91 | $ | 0.82 | ||||||||
|
|
|
|
|
|
|
|
|
|||||||||
For the three months ended September 30, 2013, stock options for 57,952 shares of common stock were not considered in computing diluted earnings per common share because they were antidilutive. Stock options for 274,132 and 57,952 shares of common stock were not considered in computing diluted earnings per common share for the nine months ended September 30, 2014 and 2013 because they were antidilutive.
F-30
Table of Contents
Index to Financial Statements
FRANKLIN FINANCIAL NETWORK, INC.
AUDITED CONSOLIDATED FINANCIAL STATEMENTS
December 31, 2013 and 2012
F-31
Table of Contents
Index to Financial Statements
|
|
Crowe Horwath LLP Independent Member Crowe Horwath International |

REPORT OF INDEPENDENT REGISTERED PUBLIC ACCOUNTING FIRM
The Board of Directors
Franklin Financial Network, Inc.
Franklin, Tennessee
We have audited the accompanying consolidated balance sheets of Franklin Financial Network, Inc. as of December 31, 2013 and 2012, and the related consolidated statements of income, comprehensive income (loss), changes in shareholders’ equity, and cash flows for the years then ended. These financial statements are the responsibility of the Company’s management. Our responsibility is to express an opinion on these financial statements based on our audits.
We conducted our audits in accordance with the standards of the Public Company Accounting Oversight Board (United States). Those standards require that we plan and perform the audit to obtain reasonable assurance about whether the financial statements are free of material misstatement. The Company is not required to have, nor were we engaged to perform, an audit of its internal control over financial reporting. Our audit included consideration of internal control over financial reporting as a basis for designing audit procedures that are appropriate in the circumstances, but not for the purpose of expressing an opinion on the effectiveness of the Company’s internal control over financial reporting. Accordingly, we express no such opinion. An audit includes examining, on a test basis, evidence supporting the amounts and disclosures in the financial statements. An audit also includes assessing the accounting principles used and significant estimates made by management, as well as evaluating the overall financial statement presentation. We believe that our audits provide a reasonable basis for our opinion.
In our opinion, the consolidated financial statements referred to above present fairly, in all material respects, the financial position of Franklin Financial Network, Inc. as of December 31, 2013 and 2012, and the results of its operations and its cash flows for the years then ended, in conformity with U.S. generally accepted accounting principles.
/s/ Crowe Horwath LLP
Brentwood, Tennessee
March 26, 2014
F-32
Table of Contents
Index to Financial Statements
FRANKLIN FINANCIAL NETWORK, INC.
December 31, 2013 and 2012
(Dollar amounts in thousands, except share and per share data)
| 2013 | 2012 | |||||||
| ASSETS |
||||||||
| Cash and cash equivalents |
$ | 18,217 | $ | 24,977 | ||||
| Interest-bearing deposits in financial institutions |
— | 100 | ||||||
| Securities available for sale |
268,515 | 186,118 | ||||||
| Securities held to maturity (fair value 2013—$54,004 and 2012—$34,517) |
56,575 | 33,815 | ||||||
| Loans held for sale |
10,694 | 15,355 | ||||||
| Loans |
421,304 | 299,483 | ||||||
| Allowance for loan losses |
(4,900 | ) | (3,983 | ) | ||||
|
|
|
|
|
|||||
| Net loans |
416,404 | 295,500 | ||||||
|
|
|
|
|
|||||
| Restricted equity securities, at cost |
3,032 | 2,258 | ||||||
| Premises and equipment, net |
4,138 | 2,944 | ||||||
| Accrued interest receivable |
2,396 | 1,778 | ||||||
| Bank owned life insurance |
8,232 | 7,964 | ||||||
| Deferred tax asset |
3,995 | 210 | ||||||
| Foreclosed assets |
181 | 2,089 | ||||||
| Servicing rights, net |
2,640 | 2,401 | ||||||
| Mortgage banking derivative asset |
464 | 612 | ||||||
| Goodwill |
157 | 157 | ||||||
| Other assets |
734 | 1,484 | ||||||
|
|
|
|
|
|||||
| Total assets |
$ | 796,374 | $ | 577,762 | ||||
|
|
|
|
|
|||||
| LIABILITIES AND SHAREHOLDERS’ EQUITY |
||||||||
| Deposits |
||||||||
| Non-interest bearing |
$ | 52,686 | $ | 48,089 | ||||
| Interest bearing |
628,614 | 466,554 | ||||||
|
|
|
|
|
|||||
| Total deposits |
681,300 | 514,643 | ||||||
| Federal funds purchased and repurchase agreements |
24,291 | 1,602 | ||||||
| FHLB advances |
23,000 | 8,000 | ||||||
| Accrued interest payable |
222 | 308 | ||||||
| Other liabilities |
2,398 | 1,853 | ||||||
|
|
|
|
|
|||||
| Total liabilities |
731,211 | 526,406 | ||||||
| Shareholders’ equity |
||||||||
| Senior non-cumulative preferred stock, no par value, $10,000 liquidation value: Series A, 1,000,000 shares authorized; 10,000 shares issued and outstanding at December 31, 2013 and 2012 |
10,000 | 10,000 | ||||||
| Common stock, no par value; 10,000,000 shares authorized; 4,862,875 and 3,621,154 issued at December 31, 2013 and 2012, respectively |
51,776 | 36,792 | ||||||
| Additional paid-in capital |
862 | 1,029 | ||||||
| Retained earnings |
7,058 | 2,606 | ||||||
| Accumulated other comprehensive income (loss) |
(4,533 | ) | 929 | |||||
|
|
|
|
|
|||||
| Total shareholders’ equity |
65,163 | 51,356 | ||||||
|
|
|
|
|
|||||
| Total liabilities and shareholders’ equity |
$ | 796,374 | $ | 577,762 | ||||
|
|
|
|
|
|||||
See accompanying notes to consolidated financial statements.
F-33
Table of Contents
Index to Financial Statements
FRANKLIN FINANCIAL NETWORK, INC.
CONSOLIDATED STATEMENTS OF INCOME
Years ending December 31, 2013 and 2012
(Dollar amounts in thousands, except share and per share data)
| 2013 | 2012 | |||||||
| Interest income and dividends |
||||||||
| Loans, including fees |
$ | 20,094 | $ | 16,262 | ||||
| Securities |
||||||||
| Taxable |
4,655 | 3,532 | ||||||
| Tax-exempt |
67 | 40 | ||||||
| Dividends on restricted equity securities |
126 | 116 | ||||||
| Federal funds sold and other |
40 | 54 | ||||||
|
|
|
|
|
|||||
| 24,982 | 20,004 | |||||||
| Interest expense |
||||||||
| Deposits |
3,693 | 3,917 | ||||||
| Federal funds purchased and repurchase agreements |
144 | 43 | ||||||
| FHLB advances |
100 | 88 | ||||||
|
|
|
|
|
|||||
| 3,937 | 4,048 | |||||||
| Net interest income |
21,045 | 15,956 | ||||||
| Provision for loan losses |
907 | 1,548 | ||||||
|
|
|
|
|
|||||
| Net interest income after provision for loan losses |
20,138 | 14,408 | ||||||
| Noninterest income |
||||||||
| Service charges on deposit accounts |
52 | 48 | ||||||
| Other service charges and fees |
1,112 | 987 | ||||||
| Net gains on sale of loans |
4,403 | 5,550 | ||||||
| Loan servicing fees, net |
(365 | ) | (736 | ) | ||||
| Gain on bank owned life insurance |
— | 606 | ||||||
| Gain on sale of securities |
88 | 991 | ||||||
| Other |
1,529 | 1,199 | ||||||
|
|
|
|
|
|||||
| Total noninterest income |
6,819 | 8,645 | ||||||
| Noninterest expense |
||||||||
| Salaries and employee benefits |
13,142 | 11,020 | ||||||
| Occupancy and equipment |
2,731 | 2,496 | ||||||
| FDIC assessment expense |
354 | 441 | ||||||
| Loss on sale and write down of foreclosed assets |
223 | 44 | ||||||
| Marketing |
283 | 231 | ||||||
| Professional fees |
596 | 380 | ||||||
| Other |
2,333 | 2,245 | ||||||
|
|
|
|
|
|||||
| Total noninterest expense |
19,662 | 16,857 | ||||||
|
|
|
|
|
|||||
| Income before income tax expense |
7,295 | 6,196 | ||||||
| Income tax expense |
2,734 | 2,056 | ||||||
|
|
|
|
|
|||||
| Net income |
4,561 | 4,140 | ||||||
| Dividends paid on Series A preferred stock |
(109 | ) | (458 | ) | ||||
|
|
|
|
|
|||||
| Net income applicable to common shareholders |
$ | 4,452 | $ | 3,682 | ||||
|
|
|
|
|
|||||
| Earnings per share: |
||||||||
| Basic |
$ | 1.13 | $ | 1.03 | ||||
| Diluted |
1.10 | 1.02 | ||||||
See accompanying notes to consolidated financial statements.
F-34
Table of Contents
Index to Financial Statements
FRANKLIN FINANCIAL NETWORK, INC.
CONSOLIDATED STATEMENTS OF COMPREHENSIVE INCOME (LOSS)
Years ending December 31, 2013 and 2012
(Dollar amounts in thousands, except share and per share data)
| 2013 | 2012 | |||||||
| Net income |
$ | 4,561 | $ | 4,140 | ||||
|
|
|
|
|
|||||
| Other comprehensive income (loss), net of tax: |
||||||||
| Unrealized gains/losses on securities: |
||||||||
| Unrealized holding loss arising during the period |
(8,763 | ) | (24 | ) | ||||
| Reclassification adjustment for gains included in net income |
(88 | ) | (991 | ) | ||||
|
|
|
|
|
|||||
| Net unrealized losses |
(8,851 | ) | (1,015 | ) | ||||
| Tax effect |
3,389 | 177 | ||||||
|
|
|
|
|
|||||
| Total other comprehensive loss |
(5,462 | ) | (838 | ) | ||||
|
|
|
|
|
|||||
| Comprehensive income (loss) |
$ | (901 | ) | $ | 3,302 | |||
|
|
|
|
|
|||||
See accompanying notes to consolidated financial statements.
F-35
Table of Contents
Index to Financial Statements
FRANKLIN FINANCIAL NETWORK, INC.
CONSOLIDATED STATEMENTS OF CHANGES IN SHAREHOLDERS’ EQUITY
Years ending December 31, 2013 and 2012
(Dollar amounts in thousands, except share and per share data)
| Preferred Stock |
Common Stock |
Additional Paid-In Capital |
Retained Earnings (Accumulated Deficit) |
Accumulated Other Comprehensive Income (loss) |
Total Shareholders’ Equity |
|||||||||||||||||||
| Balance at January 1, 2012 |
$ | 10,000 | $ | 35,963 | $ | 725 | $ | (1,076 | ) | $ | 1,767 | $ | 47,379 | |||||||||||
| Exercise of common stock warrants, 54,958 shares |
— | 660 | — | — | — | 660 | ||||||||||||||||||
| Dividends paid on Series A preferred stock |
— | — | — | (458 | ) | — | (458 | ) | ||||||||||||||||
| Stock issued in conjunction with 401(k) employer match, 15,188 shares |
— | 169 | — | — | — | 169 | ||||||||||||||||||
| Stock based compensation expense |
— | — | 304 | — | — | 304 | ||||||||||||||||||
| Net income |
— | — | — | 4,140 | — | 4,140 | ||||||||||||||||||
| Other comprehensive loss |
— | — | — | — | (838 | ) | (838 | ) | ||||||||||||||||
|
|
|
|
|
|
|
|
|
|
|
|
|
|||||||||||||
| Balance at December 31, 2012 |
10,000 | 36,792 | 1,029 | 2,606 | 929 | 51,356 | ||||||||||||||||||
| Exercise of common stock warrants, 3,024 shares |
— | 36 | — | — | — | 36 | ||||||||||||||||||
| Dividends paid on Series A preferred stock |
— | — | — | (109 | ) | — | (109 | ) | ||||||||||||||||
| Stock issued in conjunction with 401(k) employer match, 17,596 shares |
— | 227 | — | — | — | 227 | ||||||||||||||||||
| Stock based compensation expense |
— | 46 | 318 | — | — | 364 | ||||||||||||||||||
| Exercise of common stock options, 5,755 shares |
— | 58 | — | — | — | 58 | ||||||||||||||||||
| Issuance of 1,153,847 shares of common stock, net of stock offering costs of $809 |
— | 14,191 | — | — | — | 14,191 | ||||||||||||||||||
| Issuance of common stock in conjunction with stock option exchange, 32,814 shares |
— | 426 | (568 | ) | — | — | (142 | ) | ||||||||||||||||
| Excess tax benefit from exchange of stock options |
83 | 83 | ||||||||||||||||||||||
| Net income |
— | — | — | 4,561 | — | 4,561 | ||||||||||||||||||
| Other comprehensive loss |
— | — | — | — | (5,462 | ) | (5,462 | ) | ||||||||||||||||
|
|
|
|
|
|
|
|
|
|
|
|
|
|||||||||||||
| Balance at December 31, 2013 |
$ | 10,000 | $ | 51,776 | $ | 862 | $ | 7,058 | $ | (4,533 | ) | $ | 65,163 | |||||||||||
|
|
|
|
|
|
|
|
|
|
|
|
|
|||||||||||||
See accompanying notes to consolidated financial statements.
F-36
Table of Contents
Index to Financial Statements
FRANKLIN FINANCIAL NETWORK, INC.
CONSOLIDATED STATEMENTS OF CASH FLOWS
Years ending December 31, 2013 and 2012
(Dollar amounts in thousands, except share and per share data)
| 2013 | 2012 | |||||||
| Cash flows from operating activities |
||||||||
| Net income |
$ | 4,561 | $ | 4,140 | ||||
| Adjustments to reconcile net income to net cash from operating activities |
||||||||
| Depreciation and amortization on premises and equipment |
653 | 717 | ||||||
| Net amortization of securities |
4,199 | 5,224 | ||||||
| Amortization of mortgage servicing right asset |
1,265 | 1,236 | ||||||
| Change in impairment of servicing asset |
(90 | ) | 90 | |||||
| Provision for loan losses |
907 | 1,548 | ||||||
| Deferred income tax benefit |
(396 | ) | (132 | ) | ||||
| Excess tax benefit related to the exchange of stock options |
(83 | ) | — | |||||
| Origination of loans held for sale |
(307,592 | ) | (204,995 | ) | ||||
| Proceeds from sale of loans held for sale |
315,242 | 200,755 | ||||||
| Net gain on sale of loans |
(4,403 | ) | (5,550 | ) | ||||
| Gain on sale of available for sale securities |
(88 | ) | (991 | ) | ||||
| Income from bank owned life insurance |
(268 | ) | (166 | ) | ||||
| Gain on life insurance benefits |
— | (606 | ) | |||||
| Loss on sale and write down of foreclosed assets |
223 | 44 | ||||||
| Stock-based compensation |
364 | 304 | ||||||
| Compensation expense related to common stock issued to 401(k) plan |
227 | 169 | ||||||
| Net change in: |
||||||||
| Accrued interest receivable and other assets |
249 | (1,408 | ) | |||||
| Accrued interest payable and other liabilities |
542 | 311 | ||||||
|
|
|
|
|
|||||
| Net cash from operating activities |
15,512 | 690 | ||||||
| Cash flows from investing activities |
||||||||
| Available for sale securities: |
||||||||
| Sales |
16,290 | 48,995 | ||||||
| Purchases |
(189,962 | ) | (139,419 | ) | ||||
| Maturities, prepayments and calls |
78,650 | 84,609 | ||||||
| Held to maturity securities: |
||||||||
| Purchases |
(28,937 | ) | (25,892 | ) | ||||
| Maturities, prepayments and calls |
5,840 | 1,650 | ||||||
| Net change in loans |
(122,572 | ) | (72,690 | ) | ||||
| Purchase of bank owned life insurance |
— | (4,000 | ) | |||||
| Purchase of restricted equity securities |
(774 | ) | (356 | ) | ||||
| Proceeds from sale of foreclosed assets |
2,477 | 475 | ||||||
| Purchases of premises and equipment, net |
(1,847 | ) | (956 | ) | ||||
| Decrease in interest bearing deposits in financial institutions |
100 | 100 | ||||||
|
|
|
|
|
|||||
| Net cash from investing activities |
(240,735 | ) | (107,484 | ) | ||||
| Cash flows from financing activities |
||||||||
| Increase in deposits |
166,657 | 109,037 | ||||||
| Increase (decrease) in federal funds purchased and repurchase agreements |
22,689 | (2,278 | ) | |||||
| Proceeds from FHLB advances |
40,000 | 1,500 | ||||||
| Repayment of FHLB advances |
(25,000 | ) | — | |||||
| Proceeds from exercise of common stock warrants |
36 | 660 | ||||||
| Proceeds from exercise of common stock options |
58 | — | ||||||
| Cash paid in conjunction with stock option exchange, including tax benefit |
(59 | ) | — | |||||
| Proceeds from issuance of common stock, net of offering costs |
14,191 | — | ||||||
| Dividends paid on preferred stock |
(109 | ) | (458 | ) | ||||
|
|
|
|
|
|||||
| Net cash from financing activities |
218,463 | 108,461 | ||||||
|
|
|
|
|
|||||
| Net change in cash and cash equivalents |
(6,760 | ) | 1,667 | |||||
| Cash and cash equivalents at beginning of period |
24,977 | 23,310 | ||||||
|
|
|
|
|
|||||
| Cash and cash equivalents at end of period |
$ | 18,217 | $ | 24,977 | ||||
|
|
|
|
|
|||||
| Supplemental information: |
||||||||
| Interest paid |
$ | 4,023 | $ | 4,106 | ||||
| Income taxes paid |
2,750 | 2,355 | ||||||
| Non-cash supplemental information: |
||||||||
| Transfers from loans to foreclosed assets |
$ | 761 | $ | 1,864 | ||||
| Transfer from available-for-sale securities to held-to-maturity securities |
— | 1,276 | ||||||
| Reclassification of receivable for death benefit from bank owned life insurance |
— | 878 | ||||||
| Transfer from additional paid-in capital to common stock |
426 | — | ||||||
F-37
Table of Contents
Index to Financial Statements
FRANKLIN FINANCIAL NETWORK, INC.
NOTES TO CONSOLIDATED FINANCIAL STATEMENTS
December 31, 2013 and 2012
(Dollar amounts in thousands, except share and per share data)
NOTE 1—SUMMARY OF SIGNIFICANT ACCOUNTING POLICIES
Nature of Operations and Principles of Consolidation: The consolidated financial statements include Franklin Financial Network, Inc. and its wholly owned subsidiaries, Franklin Synergy Bank and Banc Compliance Group, Inc., which sold substantially all its assets on December 31, 2014 together referred to as “the Company.” Intercompany transactions and balances are eliminated in consolidation.
Franklin Financial Network, Inc. was incorporated under the laws of the State of Tennessee on April 5, 2007. Franklin Synergy Bank was incorporated under the laws of the State of Tennessee and received its Certificate of Authority from the Tennessee Department of Financial Institutions and approval of FDIC insurance on November 2, 2007. Franklin Synergy Bank is also a Federal Reserve member bank.
The Company provides financial services through its offices in Franklin and Brentwood, TN. Its primary deposit products are checking, savings, and certificate of deposit accounts, and its primary lending products are commercial and residential construction, commercial, installment loans and lines secured by home equity. Substantially all loans are secured by specific items of collateral including commercial and residential real estate, business assets, and consumer assets. Commercial loans are expected to be repaid by cash flow from operations of businesses. There are no significant concentrations of loans to any one industry or customer. However, the customers’ ability to repay their loans is dependent on the real estate and general economic conditions in the area. The Company also focuses on electronic banking products such as Internet banking, remote deposit capture and lockbox services.
The Company purchased the assets of Banc Compliance Group LLC in May 2008 forming a wholly owned subsidiary, Banc Compliance Group, Inc., which provided bank compliance and consulting services to community banks.
Use of Estimates: To prepare financial statements in conformity with accounting principles generally accepted in the United States of America management makes estimates and assumptions based on available information. These estimates and assumptions affect the amounts reported in the financial statements and the disclosures provided, and actual results could differ. The allowance for loan losses and fair value of financial instruments are particularly subject to change.
Cash Flows: Cash and cash equivalents include cash, deposits with other financial institutions with maturities under 90 days, and federal funds sold. Net cash flows are reported for customer loan and deposit transactions, interest bearing deposits in other financial institutions and federal funds purchased.
Interest-Bearing Deposits in Financial Institutions: Interest-bearing deposits in other financial institutions mature within one year and are carried at cost.
Securities: Debt securities are classified as held to maturity and carried at amortized cost when management has the positive intent and ability to hold them to maturity. Debt securities are classified as available for sale when they might be sold before maturity. Securities available for sale are carried at fair value, with unrealized holding gains and losses reported in other comprehensive income, net of tax.
Interest income includes amortization of purchase premium or discount. Premiums and discounts on securities are amortized on the level-yield method without anticipating prepayments, except for mortgage backed securities where prepayments are anticipated. Gains and losses on sales are recorded on the trade date and determined using the specific identification method.
F-38
Table of Contents
Index to Financial Statements
FRANKLIN FINANCIAL NETWORK, INC.
NOTES TO CONSOLIDATED FINANCIAL STATEMENTS
December 31, 2013 and 2012
(Dollar amounts in thousands, except share and per share data)
NOTE 1—SUMMARY OF SIGNIFICANT ACCOUNTING POLICIES (Continued)
Management evaluates securities for other-than-temporary impairment (OTTI) at least on a quarterly basis, and more frequently when economic or market conditions warrant such an evaluation. Management assesses whether it intends to sell, or it is more likely than not that it will be required to sell, a security in an unrealized loss position before recovery of its amortized cost basis. If either of these criteria is met, the entire difference between amortized cost and fair value is recognized as impairment through earnings. For securities that do not meet the aforementioned criteria, the amount of impairment is split into two components as follows: 1) OTTI related to credit loss, which must be recognized in the income statement and 2) OTTI related to other factors, which is recognized in other comprehensive income. The credit loss is defined as the difference between the present value of the cash flows expected to be collected and the amortized cost basis.
Loans Held for Sale: Loans originated and intended for sale in the secondary market are carried at the lower of aggregate cost or fair value, as determined by outstanding commitments from investors. Net unrealized losses, if any, are recorded as a valuation allowance and charged to earnings.
Certain loans held for sale are sold with servicing rights retained. The carrying value of loans sold with retained servicing is reduced by the amount allocated to the servicing right. Gains and losses on sales of loans are based on the difference between the selling price and the carrying value of the related loan sold.
Loans: Loans that management has the intent and ability to hold for the foreseeable future or until maturity or payoff are reported at the principal balance outstanding, net of deferred loan fees and costs and an allowance for loan losses. Interest income is accrued on the unpaid principal balance. Loan origination fees, net of certain direct origination costs, are deferred and recognized in interest income using the level-yield method without anticipating prepayments.
Interest income on mortgage and commercial loans is discontinued at the time the loan is 90 days delinquent unless the loan is well-secured and in process of collection. Past due status is based on the contractual terms of the loan. In all cases, loans are placed on nonaccrual or charged-off at an earlier date if collection of principal or interest is considered doubtful. Nonaccrual loans and loans past due 90 days still on accrual include both smaller balance homogeneous loans that are collectively evaluated for impairment and individually classified impaired loans. A loan is moved to non-accrual status in accordance with the Company’s policy, typically after 90 days of non-payment.
All interest accrued but not received for loans placed on nonaccrual is reversed against interest income. Interest received on such loans is accounted for on the cash-basis or cost-recovery method, until qualifying for return to accrual. Loans are returned to accrual status when all the principal and interest amounts contractually due are brought current and future payments are reasonably assured.
Concentration of Credit Risk: Most of the Company’s business activity is with customers located within Williamson County. Therefore, the Company’s exposure to credit risk is significantly affected by changes in the economy in the Williamson County area.
Allowance for Loan Losses: The allowance for loan losses is a valuation allowance for probable incurred credit losses. Loan losses are charged against the allowance when management believes the uncollectibility of a loan balance is confirmed. Subsequent recoveries, if any, are credited to the allowance. Management estimates the allowance balance required using past loan loss experience, the nature and volume of
F-39
Table of Contents
Index to Financial Statements
FRANKLIN FINANCIAL NETWORK, INC.
NOTES TO CONSOLIDATED FINANCIAL STATEMENTS
December 31, 2013 and 2012
(Dollar amounts in thousands, except share and per share data)
NOTE 1—SUMMARY OF SIGNIFICANT ACCOUNTING POLICIES (Continued)
the portfolio, information about specific borrower situations and estimated collateral values, economic conditions, and other factors. Allocations of the allowance may be made for specific loans, but the entire allowance is available for any loan that, in management’s judgment, should be charged off.
The allowance consists of specific and general components. The specific component relates to loans that are individually classified as impaired. A loan is impaired when, based on current information and events, it is probable that the Company will be unable to collect all amounts due according to the contractual terms of the loan agreement. Loans for which the terms have been modified resulting in a concession, and for which the borrower is experiencing financial difficulties, are considered troubled debt restructurings and classified as impaired.
Factors considered by management in determining impairment include payment status, collateral value, and the probability of collecting scheduled principal and interest payments when due. Loans that experience insignificant payment delays and payment shortfalls generally are not classified as impaired. Management determines the significance of payment delays and payment shortfalls on case-by-case basis, taking into consideration all of the circumstances surrounding the loan and the borrower, including the length of the delay, the reasons for the delay, the borrower’s prior payment record, and the amount of the shortfall in relation to the principal and interest owed.
All loans classified by management as substandard or worse are individually evaluated for impairment. If a loan is impaired, a portion of the allowance is allocated so that the loan is reported, net, at the present value of estimated future cash flows using the loan’s existing rate or at the fair value of collateral if repayment is expected solely from the collateral.
Troubled debt restructurings are separately identified for impairment disclosures and are measured at the present value of estimated future cash flows using the loan’s effective rate at inception. If a troubled debt restructuring is considered to be a collateral dependent loan, the loan is reported, net, at the fair value of the collateral. For troubled debt restructurings that subsequently default, the Company determines the amount of reserve in accordance with the accounting policy for the allowance for loan losses.
The general component covers non-impaired loans and is based on historical loss experience adjusted for current factors. The historical loss experience is determined by portfolio segment and is based on a combination of the Bank’s loss history and loss history from the Bank’s peer group over the past three years. This actual loss experience is supplemented with other economic factors based on the risks present for each portfolio segment. These economic factors include consideration of the following: levels of and trends in delinquencies and impaired loans; levels of and trends in charge-offs and recoveries; trends in volume and terms of loans; effects of any changes in risk selection and underwriting standards; other changes in lending policies, procedures, and practices; experience, ability, and depth of lending management and other relevant staff; national and local economic trends and conditions; industry conditions; and effects of changes in credit concentrations. The following portfolio segments have been identified:
Construction and land development loans include loans to finance the process of improving loans preparatory to erecting new structures or the on-site construction of industrial, commercial, residential or farm buildings. Construction and land development loans also include loans secured by vacant land, except land known to be used or usable for agricultural purposes. Construction loans generally are made for relatively short terms. They generally are more vulnerable to changes in economic conditions. Further, the nature of these loans
F-40
Table of Contents
Index to Financial Statements
FRANKLIN FINANCIAL NETWORK, INC.
NOTES TO CONSOLIDATED FINANCIAL STATEMENTS
December 31, 2013 and 2012
(Dollar amounts in thousands, except share and per share data)
NOTE 1—SUMMARY OF SIGNIFICANT ACCOUNTING POLICIES (Continued)
is such that they are more difficult to evaluate and monitor. The risk of loss on a construction loan is dependent largely upon the accuracy of the initial estimate of the property’s value upon completion of the project and the estimated cost (including interest) of the project. Periodic site inspections are made on construction loans.
Commercial real estate loans include loans secured by non-residential real estate, including farmland and improvements thereon. Often these loans are made to single borrowers or groups of related borrowers, and the repayment of these loans largely depends on the results of operations and management of these properties. Adverse economic conditions may affect the repayment ability of these loans.
Residential real estate loans include loans secured by residential real estate, including single-family and multi-family dwellings. Mortgage title insurance and hazard insurance are normally required. Adverse economic conditions in the Company’s market area may reduce borrowers’ ability to repay these loans and may reduce the collateral securing these loans.
C&I loans include loans for commercial, industrial or agricultural purposes to business enterprises that are not secured by real estate. Commercial loans are typically made on the basis of the borrower’s ability to repay from the cash flow of the borrower’s business. Commercial and Agriculture loans are generally secured by accounts receivable, inventory and equipment. The collateral securing loans may depreciate over time, may be difficult to appraise and may fluctuate in value based on the success of the business.
Consumer and other loans include loans to individuals for household, family and other personal expenditures that are not secured by real estate. Consumer loans are generally secured by customer deposit accounts, vehicles and other household goods. The collateral securing consumer loans may depreciate over time.
Servicing Rights: When loans are sold with servicing retained, servicing rights are initially recorded at fair value with the income statement effect recorded in gain on sale of loans. Fair value is based on market prices for comparable servicing contracts. All classes of servicing assets are subsequently measured using the amortization method which requires servicing rights to be amortized into non-interest income in proportion to, and over the period of, the estimated future net servicing income of the underlying loans.
Servicing assets are evaluated for impairment based upon the fair value of the rights as compared to carrying amount. Impairment is determined by stratifying rights into groupings based on predominant risk characteristics, such as interest rate, loan type and investor type. Impairment is recognized through a valuation allowance for an individual grouping, to the extent that fair value is less than the carrying amount. If the Company later determines that all or a portion of the impairment no longer exists for a particular grouping, a reduction of the allowance may be recorded as an increase to income. Changes in valuation allowances are reported with loan servicing fees on the income statement. The fair values of servicing rights are subject to significant fluctuations as a result of changes in estimated and actual prepayment speeds and default rates and losses.
Servicing fee income, which is reported on the income statement as loan servicing fees, is recorded for fees earned for servicing loans. The fees are based on a contractual percentage of the outstanding principal; or a fixed amount per loan and are recorded as income when earned. The amortization of mortgage servicing rights is netted against mortgage loan servicing fee income. Late fees and ancillary fees related to loan servicing are not material.
F-41
Table of Contents
Index to Financial Statements
FRANKLIN FINANCIAL NETWORK, INC.
NOTES TO CONSOLIDATED FINANCIAL STATEMENTS
December 31, 2013 and 2012
(Dollar amounts in thousands, except share and per share data)
NOTE 1—SUMMARY OF SIGNIFICANT ACCOUNTING POLICIES (Continued)
Transfers of Financial Assets: Transfers of financial assets are accounted for as sales, when control over the assets has been relinquished. Control over transferred assets is deemed to be surrendered when the assets have been isolated from the Company, the transferee obtains the right (free of conditions that constrain it from taking advantage of that right) to pledge or exchange the transferred assets, and the Company does not maintain effective control over the transferred assets through an agreement to repurchase them before their maturity.
Foreclosed Assets: Assets acquired through or instead of loan foreclosure are initially recorded at fair value less costs to sell when acquired, establishing a new cost basis. If fair value declines subsequent to foreclosure, a valuation allowance is recorded through expense. Operating costs after acquisition are expensed.
Premises and Equipment: Premises and equipment are stated at cost less accumulated depreciation and are depreciated using the straight-line method. Depreciation periods are shorter of the asset’s useful life or lease period, ranging from three to fifteen years.
Restricted Equity Securities: The Bank is a member of the Federal Reserve System and the FHLB System. Members of the FHLB are required to own a certain amount of stock based on the level of borrowings and other factors, and may invest in additional amounts. The stock ownership in the Federal Reserve and FHLB are carried at cost, classified as a restricted securities, and periodically evaluated for impairment based on ultimate recovery of par value. Both cash and stock dividends are reported as income.
Goodwill: Goodwill resulting from business combinations prior to January 1, 2009 represents the excess of the purchase price over the fair value of the net assets of businesses acquired. Goodwill and intangible assets acquired in a purchase business combination and determined to have an indefinite useful life are not amortized, but tested for impairment at least annually. The Company has selected December 31 as the date to perform the annual impairment test. Intangible assets with definite useful lives are amortized over their estimated useful lives to their estimated residual values. Goodwill is the only intangible asset with an indefinite life on the balance sheet.
Long-Term Assets: Premises and equipment and other long-term assets are reviewed for impairment when events indicate their carrying amount may not be recoverable from future undiscounted cash flows. If impaired, the assets are recorded at fair value.
Loan Commitments and Related Financial Instruments: Financial instruments include off-balance sheet credit instruments, such as commitments to make loans and commercial letters of credit, issued to meet customer financing needs. The face amount for these items represents the exposure to loss, before considering customer collateral or ability to repay. Such financial instruments are recorded when they are funded.
Mortgage Banking Derivatives: Commitments to fund mortgage loans (interest rate locks) to be sold into the secondary market and forward commitments for the future delivery of these mortgage loans are accounted for as free standing derivatives. Fair values of these mortgage derivatives are estimated based on changes in mortgage interest rates from the date the interest on the loan is locked. The Company enters into forward commitments for the future delivery of mortgage loans when interest rate locks are entered into, in order to hedge the change in interest rates resulting from its commitments to fund the loans. Changes in the fair values of these derivatives are included in net gains on sale of mortgage loans.
F-42
Table of Contents
Index to Financial Statements
FRANKLIN FINANCIAL NETWORK, INC.
NOTES TO CONSOLIDATED FINANCIAL STATEMENTS
December 31, 2013 and 2012
(Dollar amounts in thousands, except share and per share data)
NOTE 1—SUMMARY OF SIGNIFICANT ACCOUNTING POLICIES (Continued)
Stock-Based Compensation: Compensation cost is recognized for stock options and restricted stock awards issued to employees, based on the fair value of these awards at the date of grant. A Black-Scholes model is utilized to estimate the fair value of stock options, while the market price of the Company’s common stock at the date of grant is used for restricted stock awards. Compensation cost is recognized over the required service period, generally defined as the vesting period. For awards with graded vesting, compensation cost is recognized on a straight-line basis over the requisite service period for the entire award.
Income Taxes: Income tax expense or benefit is the total of the current year income tax due or refundable and the change in deferred tax assets and liabilities. Deferred tax assets and liabilities are the expected future tax amounts for the temporary differences between carrying amounts and tax bases of assets and liabilities, computed using enacted tax rates. A valuation allowance, if needed, reduces deferred tax assets to the amount expected to be realized.
A tax position is recognized as a benefit only if it is “more likely than not” that the tax position would be sustained in a tax examination, with a tax examination being presumed to occur. The amount recognized is the largest amount of tax benefit that is greater than 50% likely of being realized on examination. For tax positions not meeting the “more likely than not” test, no tax benefit is recorded.
The Company recognizes interest and/or penalties related to income tax matters in income tax expense.
Retirement Plans: Employee 401(k) and profit sharing plan expense is the amount of matching contributions. The matching contributions are paid with employer stock. An annual stock valuation is performed for the employer stock match calculation.
Comprehensive Income: Comprehensive income consists of net income and other comprehensive income. Other comprehensive income includes unrealized gains and losses on securities available for sale which is recognized as a separate component of equity.
Earnings Per Common Share: Basic earnings per common share is net income available to common shareholders divided by the weighted average number of common shares outstanding during the period. All outstanding unvested share-based payment awards that contain rights to nonforfeitable dividends are considered participating securities for this calculation. Diluted earnings per common share includes the dilutive effect of additional potential common shares issuable under stock options and warrants. Earnings and dividends per share are restated for all stock splits and stock dividends through the date of issuance of the financial statements.
Loss Contingencies: Loss contingencies, including claims and legal actions arising in the ordinary course of business, are recorded as liabilities when the likelihood of loss is probable and an amount or range of loss can be reasonably estimated. Management does not believe there now are such matters that will have a material effect on the financial statements.
Restrictions on Cash: Cash on hand or on deposit with the Federal Reserve Bank was required to meet regulatory reserve and clearing requirements.
Dividend Restriction: Banking regulations require maintaining certain capital levels and may limit the dividends paid by the bank to the holding company or by the holding company to shareholders.
F-43
Table of Contents
Index to Financial Statements
FRANKLIN FINANCIAL NETWORK, INC.
NOTES TO CONSOLIDATED FINANCIAL STATEMENTS
December 31, 2013 and 2012
(Dollar amounts in thousands, except share and per share data)
NOTE 1—SUMMARY OF SIGNIFICANT ACCOUNTING POLICIES (Continued)
Fair Value of Financial Instruments: Fair values of financial instruments are estimated using relevant market information and other assumptions, as more fully disclosed in a separate note. Fair value estimates involve uncertainties and matters of significant judgment regarding interest rates, credit risk, prepayments, and other factors, especially in the absence of broad markets for particular items. Changes in assumptions or in market conditions could significantly affect the estimates.
Operating Segments: While the chief decision-makers monitor the revenue streams of the various products and services, operations are managed and financial performance is evaluated on a Company-wide basis. Operating segments are aggregated into one as operating results for all segments are similar. Accordingly, all of the financial service operations are considered by management to be aggregated in one reportable operating segment.
Reclassifications: Some items in the prior year financial statements were reclassified to conform to the current presentation. Reclassifications had no effect on prior year net income or shareholders’ equity.
NOTE 2—SECURITIES
The following table summarizes the amortized cost and fair value of the available for sale securities portfolio at December 31, 2013 and 2012 and the corresponding amounts of gross unrealized gains and losses recognized in accumulated other comprehensive income were as follows:
| Amortized Cost |
Gross Unrealized Gains |
Gross Unrealized Losses |
Fair Value |
|||||||||||||
| 2013 |
||||||||||||||||
| U.S. government sponsored entities and agencies |
$ | 16,029 | $ | — | $ | (1,305 | ) | $ | 14,724 | |||||||
| Mortgage-backed securities: residential |
259,831 | 1,560 | (7,600 | ) | 253,791 | |||||||||||
|
|
|
|
|
|
|
|
|
|||||||||
| Total |
$ | 275,860 | $ | 1,560 | $ | (8,905 | ) | $ | 268,515 | |||||||
|
|
|
|
|
|
|
|
|
|||||||||
| 2012 |
||||||||||||||||
| U.S. government sponsored entities and agencies |
$ | 4,020 | $ | 7 | $ | (5 | ) | $ | 4,022 | |||||||
| U.S. Treasury securities |
8,000 | — | — | 8,000 | ||||||||||||
| Mortgage-backed securities: residential |
169,902 | 2,074 | (543 | ) | 171,433 | |||||||||||
| State and political subdivision |
2,690 | — | (27 | ) | 2,663 | |||||||||||
|
|
|
|
|
|
|
|
|
|||||||||
| Total |
$ | 184,612 | $ | 2,081 | $ | (575 | ) | $ | 186,118 | |||||||
|
|
|
|
|
|
|
|
|
|||||||||
F-44
Table of Contents
Index to Financial Statements
FRANKLIN FINANCIAL NETWORK, INC.
NOTES TO CONSOLIDATED FINANCIAL STATEMENTS
December 31, 2013 and 2012
(Dollar amounts in thousands, except share and per share data)
NOTE 2—SECURITIES (Continued)
The amortized cost and fair value of the held to maturity securities portfolio at December 31, 2013 and 2012 and the corresponding amounts of gross unrecognized gains and losses were as follows:
| Amortized Cost |
Gross Unrecognized Gains |
Gross Unrecognized Losses |
Fair Value |
|||||||||||||
| 2013 |
||||||||||||||||
| U.S. government sponsored entities and agencies |
$ | 8,225 | $ | 12 | $ | (484 | ) | $ | 7,753 | |||||||
| Mortgage backed securities: residential |
39,043 | 293 | (2,061 | ) | 37,275 | |||||||||||
| State and political subdivision |
9,307 | 89 | (420 | ) | 8,976 | |||||||||||
|
|
|
|
|
|
|
|
|
|||||||||
| Total |
$ | 56,575 | $ | 394 | $ | (2,965 | ) | $ | 54,004 | |||||||
|
|
|
|
|
|
|
|
|
|||||||||
| 2012 |
||||||||||||||||
| U.S. government sponsored entities and agencies |
$ | 2,971 | $ | 30 | $ | — | $ | 3,001 | ||||||||
| Mortgage backed securities: residential |
24,686 | 485 | (38 | ) | 25,133 | |||||||||||
| State and political subdivision |
6,158 | 234 | (9 | ) | 6,383 | |||||||||||
|
|
|
|
|
|
|
|
|
|||||||||
| Total |
$ | 33,815 | $ | 749 | $ | (47 | ) | $ | 34,517 | |||||||
|
|
|
|
|
|
|
|
|
|||||||||
Sales of available for sale securities were as follows:
| 2013 | 2012 | |||||||
| Proceeds |
$ | 16,290 | $ | 48,995 | ||||
| Gross gains |
163 | 1,011 | ||||||
| Gross losses |
(75 | ) | (20 | ) | ||||
The amortized cost and fair value of the investment securities portfolio are shown by contractual maturity. Securities not due at a single maturity date, primarily mortgage-backed securities, are shown separately.
| December 31, 2013 | ||||||||
| Amortized Cost |
Fair Value |
|||||||
| Available for sale |
||||||||
| Due in one year or less |
$ | — | $ | — | ||||
| Beyond ten years |
16,029 | 14,724 | ||||||
| Mortgage-backed securities: residential |
259,831 | 253,791 | ||||||
|
|
|
|
|
|||||
| Total |
$ | 275,860 | $ | 268,515 | ||||
|
|
|
|
|
|||||
| Held to maturity |
||||||||
| One to five years |
$ | 1,492 | $ | 1,504 | ||||
| Five to ten years |
5,112 | 5,073 | ||||||
| Beyond ten years |
10,928 | 10,152 | ||||||
| Mortgage-backed securities: residential |
39,043 | 37,275 | ||||||
|
|
|
|
|
|||||
| Total |
$ | 56,575 | $ | 54,004 | ||||
|
|
|
|
|
|||||
F-45
Table of Contents
Index to Financial Statements
FRANKLIN FINANCIAL NETWORK, INC.
NOTES TO CONSOLIDATED FINANCIAL STATEMENTS
December 31, 2013 and 2012
(Dollar amounts in thousands, except share and per share data)
NOTE 2—SECURITIES (Continued)
Securities pledged at year end 2013 and 2012 had carrying amounts of $194,925 and $154,221 and were pledged to secure public deposits and repurchase agreements.
At year end 2013 and 2012, there were no holdings of securities of any one issuer, other than the U.S. government-sponsored entities and agencies, in an amount greater than 10% of shareholders’ equity.
The following table summarizes the securities with unrealized losses at December 31, 2013 and December 31, 2012 aggregated by major security type and length of time in a continuous unrealized loss position:
| Less Than 12 Months | 12 Months or Longer | Total | ||||||||||||||||||||||
| Fair Value |
Unrealized Losses |
Fair Value |
Unrealized Losses |
Fair Value |
Unrealized Losses |
|||||||||||||||||||
| December 31, 2013 |
||||||||||||||||||||||||
| Available for sale |
||||||||||||||||||||||||
| U.S. government sponsored entities and agencies |
$ | 12,983 | $ | (1,128 | ) | $ | 1,741 | $ | (177 | ) | $ | 14,724 | $ | (1,305 | ) | |||||||||
| Mortgage-backed securities: residential |
168,817 | (6,762 | ) | 11,721 | (838 | ) | 180,538 | (7,600 | ) | |||||||||||||||
|
|
|
|
|
|
|
|
|
|
|
|
|
|||||||||||||
| Total available for sale |
$ | 181,800 | $ | (7,890 | ) | $ | 13,462 | $ | (1,015 | ) | $ | 195,262 | $ | (8,905 | ) | |||||||||
|
|
|
|
|
|
|
|
|
|
|
|
|
|||||||||||||
| Held to maturity |
||||||||||||||||||||||||
| U.S. government sponsored entities and agencies |
$ | 6,168 | $ | (332 | ) | $ | 848 | $ | (152 | ) | $ | 7,016 | $ | (484 | ) | |||||||||
| Mortgage-backed securities: residential |
19,952 | (1,752 | ) | 4,042 | (309 | ) | 23,994 | (2,061 | ) | |||||||||||||||
| State and political subdivisions |
5,762 | (342 | ) | 422 | (78 | ) | 6,184 | (420 | ) | |||||||||||||||
|
|
|
|
|
|
|
|
|
|
|
|
|
|||||||||||||
| Total held to maturity |
$ | 31,882 | $ | (2,426 | ) | $ | 5,312 | $ | (539 | ) | $ | 37,194 | $ | (2,965 | ) | |||||||||
|
|
|
|
|
|
|
|
|
|
|
|
|
|||||||||||||
| Less Than 12 Months | 12 Months or Longer | Total | ||||||||||||||||||||||
| Fair Value |
Unrealized Losses |
Fair Value |
Unrealized Losses |
Fair Value |
Unrealized Losses |
|||||||||||||||||||
| December 31, 2012 |
||||||||||||||||||||||||
| Available for sale |
||||||||||||||||||||||||
| U.S. government sponsored entities and agencies |
$ | 2,015 | $ | (5 | ) | $ | — | $ | — | $ | 2,015 | $ | (5 | ) | ||||||||||
| Mortgage-backed securities: residential |
68,152 | (530 | ) | 1,392 | (13 | ) | 69,544 | (543 | ) | |||||||||||||||
| State and political subdivisions |
2,663 | (27 | ) | — | — | 2,663 | (27 | ) | ||||||||||||||||
|
|
|
|
|
|
|
|
|
|
|
|
|
|||||||||||||
| Total available for sale |
$ | 72,830 | $ | (562 | ) | $ | 1,392 | $ | (13 | ) | $ | 74,222 | $ | (575 | ) | |||||||||
|
|
|
|
|
|
|
|
|
|
|
|
|
|||||||||||||
| Held to maturity |
||||||||||||||||||||||||
| Mortgage-backed securities: residential |
$ | 4,842 | $ | (38 | ) | $ | — | $ | — | $ | 4,842 | $ | (38 | ) | ||||||||||
| State and political subdivisions |
2,842 | (9 | ) | — | — | 2,842 | (9 | ) | ||||||||||||||||
|
|
|
|
|
|
|
|
|
|
|
|
|
|||||||||||||
| Total held to maturity |
$ | 7,684 | $ | (47 | ) | $ | — | $ | — | $ | 7,684 | $ | (47 | ) | ||||||||||
|
|
|
|
|
|
|
|
|
|
|
|
|
|||||||||||||
F-46
Table of Contents
Index to Financial Statements
FRANKLIN FINANCIAL NETWORK, INC.
NOTES TO CONSOLIDATED FINANCIAL STATEMENTS
December 31, 2013 and 2012
(Dollar amounts in thousands, except share and per share data)
NOTE 2—SECURITIES (Continued)
Unrealized losses on debt securities have not been recognized into income because the issuers bonds are of high credit quality (rated AA or higher), management does not intend to sell and it is likely that management will not be required to sell the securities prior to their anticipated recovery, and the decline in fair value is largely due to changes in interest rates and other market conditions. The fair value is expected to recover as the bonds approach maturity.
NOTE 3—LOANS
Loans at year end were as follows:
| 2013 | 2012 | |||||||
| Construction and land development |
$ | 113,710 | $ | 83,767 | ||||
| Commercial real estate: |
||||||||
| Nonfarm, nonresidential |
114,852 | 68,042 | ||||||
| Other |
10,350 | 9,640 | ||||||
| Residential real estate: |
||||||||
| 1-4 family |
98,615 | 76,849 | ||||||
| Other |
39,851 | 29,740 | ||||||
| Commercial and industrial |
36,397 | 20,280 | ||||||
| Consumer and other |
8,250 | 11,758 | ||||||
|
|
|
|
|
|||||
| Subtotal |
422,025 | 300,076 | ||||||
| Deferred loan fees, net |
(721 | ) | (593 | ) | ||||
| Allowance for loan losses |
(4,900 | ) | (3,983 | ) | ||||
|
|
|
|
|
|||||
| Net loans |
$ | 416,404 | $ | 295,500 | ||||
|
|
|
|
|
|||||
The following table presents the activity in the allowance for loan losses by portfolio segment for the years ending December 31, 2013 and 2012:
| Construction and Land Development |
Commercial Real Estate |
Residential Real Estate |
Commercial and Industrial |
Consumer and Other |
Total | |||||||||||||||||||
| December 31, 2013 |
||||||||||||||||||||||||
| Allowance for loan losses: |
||||||||||||||||||||||||
| Beginning balance |
$ | 1,342 | $ | 1,267 | $ | 893 | $ | 275 | $ | 206 | $ | 3,983 | ||||||||||||
| Provision for loan losses |
155 | 299 | 480 | 81 | (108 | ) | 907 | |||||||||||||||||
| Loans charged-off |
— | — | (107 | ) | (19 | ) | — | (126 | ) | |||||||||||||||
| Recoveries |
— | — | 136 | — | — | 136 | ||||||||||||||||||
|
|
|
|
|
|
|
|
|
|
|
|
|
|||||||||||||
| Total ending allowance balance |
$ | 1,497 | $ | 1,566 | $ | 1,402 | $ | 337 | $ | 98 | 4,900 | |||||||||||||
|
|
|
|
|
|
|
|
|
|
|
|
|
|||||||||||||
| December 31, 2012 |
||||||||||||||||||||||||
| Allowance for loan losses: |
||||||||||||||||||||||||
| Beginning balance |
$ | 928 | $ | 1,151 | $ | 1,043 | $ | 188 | $ | 103 | $ | 3,413 | ||||||||||||
| Provision for loan losses |
381 | 691 | 279 | 87 | 110 | 1,548 | ||||||||||||||||||
| Loans charged-off |
(25 | ) | (575 | ) | (443 | ) | — | (7 | ) | (1,050 | ) | |||||||||||||
| Recoveries |
58 | — | 14 | — | — | 72 | ||||||||||||||||||
|
|
|
|
|
|
|
|
|
|
|
|
|
|||||||||||||
| Total ending allowance balance |
$ | 1,342 | $ | 1,267 | $ | 893 | $ | 275 | $ | 206 | 3,983 | |||||||||||||
|
|
|
|
|
|
|
|
|
|
|
|
|
|||||||||||||
F-47
Table of Contents
Index to Financial Statements
FRANKLIN FINANCIAL NETWORK, INC.
NOTES TO CONSOLIDATED FINANCIAL STATEMENTS
December 31, 2013 and 2012
(Dollar amounts in thousands, except share and per share data)
NOTE 3—LOANS (Continued)
The following table presents the balance in the allowance for loan losses and the recorded investment in loans by portfolio segment and based on impairment method as of December 31, 2013 and 2012. For purposes of this disclosure, recorded investment in loans excludes accrued interest receivable and loan fees, net due to immateriality.
| Construction and Land Development |
Commercial Real Estate |
Residential Real Estate |
Commercial and Industrial |
Consumer and Other |
Total | |||||||||||||||||||
| December 31, 2013 |
||||||||||||||||||||||||
| Allowance for loan losses: |
||||||||||||||||||||||||
| Ending allowance balance attributable to loans: |
||||||||||||||||||||||||
| Individually evaluated for impairment |
$ | — | $ | 455 | $ | 93 | $ | — | $ | — | $ | 548 | ||||||||||||
| Collectively evaluated for impairment |
1,497 | 1,111 | 1,309 | 337 | 98 | 4,352 | ||||||||||||||||||
|
|
|
|
|
|
|
|
|
|
|
|
|
|||||||||||||
| Total ending allowance balance |
$ | 1,497 | $ | 1,566 | $ | 1,402 | $ | 337 | $ | 98 | $ | 4,900 | ||||||||||||
|
|
|
|
|
|
|
|
|
|
|
|
|
|||||||||||||
| Loans: |
||||||||||||||||||||||||
| Individually evaluated for impairment |
$ | — | $ | 3,361 | $ | 1,262 | $ | — | $ | — | $ | 4,623 | ||||||||||||
| Collectively evaluated for impairment |
113,710 | 121,841 | 137,204 | 36,397 | 8,250 | 417,402 | ||||||||||||||||||
|
|
|
|
|
|
|
|
|
|
|
|
|
|||||||||||||
| Total ending loans balance |
$ | 113,710 | $ | 125,202 | $ | 138,466 | $ | 36,397 | $ | 8,250 | $ | 422,025 | ||||||||||||
|
|
|
|
|
|
|
|
|
|
|
|
|
|||||||||||||
| Construction and Land Development |
Commercial Real Estate |
Residential Real Estate |
Commercial and Industrial |
Consumer and Other |
Total | |||||||||||||||||||
| December 31, 2012 |
||||||||||||||||||||||||
| Allowance for loan losses: |
||||||||||||||||||||||||
| Ending allowance balance attributable to loans: |
||||||||||||||||||||||||
| Individually evaluated for impairment |
$ | 41 | $ | 375 | $ | 93 | $ | — | $ | — | $ | 509 | ||||||||||||
| Collectively evaluated for impairment |
1,301 | 892 | 800 | 275 | 206 | 3,474 | ||||||||||||||||||
|
|
|
|
|
|
|
|
|
|
|
|
|
|||||||||||||
| Total ending allowance balance |
$ | 1,342 | $ | 1,267 | $ | 893 | $ | 275 | $ | 206 | $ | 3,983 | ||||||||||||
|
|
|
|
|
|
|
|
|
|
|
|
|
|||||||||||||
| Loans: |
||||||||||||||||||||||||
| Individually evaluated for impairment |
$ | 76 | $ | 1,375 | $ | 1,263 | $ | — | $ | — | $ | 2,714 | ||||||||||||
| Collectively evaluated for impairment |
83,691 | 76,307 | 105,326 | 20,280 | 11,758 | 297,362 | ||||||||||||||||||
|
|
|
|
|
|
|
|
|
|
|
|
|
|||||||||||||
| Total ending loans balance |
$ | 83,767 | $ | 77,682 | $ | 106,589 | $ | 20,280 | $ | 11,758 | $ | 300,076 | ||||||||||||
|
|
|
|
|
|
|
|
|
|
|
|
|
|||||||||||||
F-48
Table of Contents
Index to Financial Statements
FRANKLIN FINANCIAL NETWORK, INC.
NOTES TO CONSOLIDATED FINANCIAL STATEMENTS
December 31, 2013 and 2012
(Dollar amounts in thousands, except share and per share data)
NOTE 3—LOANS (Continued)
The following table presents information related to impaired loans by class of loans as of and for the year ended December 31, 2013 and 2012:
| Unpaid Principal Balance |
Recorded Investment |
Allowance for Loan Losses Allocated |
Average Recorded Investment |
|||||||||||||
| December 31, 2013 |
||||||||||||||||
| With no allowance recorded: |
||||||||||||||||
| Commercial real estate: |
||||||||||||||||
| Nonfarm, nonresidential |
$ | 1,986 | $ | 1,986 | $ | — | $ | 1,986 | ||||||||
| Residential real estate: |
||||||||||||||||
| 1-4 family |
36 | 36 | — | 37 | ||||||||||||
|
|
|
|
|
|
|
|
|
|||||||||
| Subtotal |
2,022 | 2,022 | — | 2,023 | ||||||||||||
|
|
|
|
|
|
|
|
|
|||||||||
| With an allowance recorded: |
||||||||||||||||
| Commercial real estate: |
||||||||||||||||
| Nonfarm, nonresidential |
2,480 | 1,375 | 455 | 1,375 | ||||||||||||
| Residential real estate: |
||||||||||||||||
| 1-4 family |
1,687 | 1,226 | 93 | 1,226 | ||||||||||||
|
|
|
|
|
|
|
|
|
|||||||||
| Subtotal |
4,167 | 2,601 | 548 | 2,601 | ||||||||||||
|
|
|
|
|
|
|
|
|
|||||||||
| Total |
$ | 6,189 | $ | 4,623 | $ | 548 | $ | 4,624 | ||||||||
|
|
|
|
|
|
|
|
|
|||||||||
| December 31, 2012 |
||||||||||||||||
| With no allowance recorded: |
||||||||||||||||
| Residential real estate: |
||||||||||||||||
| 1-4 family |
$ | 37 | $ | 37 | $ | — | $ | 37 | ||||||||
|
|
|
|
|
|
|
|
|
|||||||||
| Subtotal |
37 | 37 | — | 37 | ||||||||||||
|
|
|
|
|
|
|
|
|
|||||||||
| With an allowance recorded: |
||||||||||||||||
| Construction and land development |
76 | 76 | 41 | 84 | ||||||||||||
| Commercial real estate: |
||||||||||||||||
| Nonfarm, nonresidential |
2,480 | 1,375 | 375 | 1,558 | ||||||||||||
| Residential real estate: |
||||||||||||||||
| 1-4 family |
1,687 | 1,226 | 93 | 1,271 | ||||||||||||
|
|
|
|
|
|
|
|
|
|||||||||
| Subtotal |
4,243 | 2,677 | 509 | 2,913 | ||||||||||||
|
|
|
|
|
|
|
|
|
|||||||||
| Total |
$ | 4,280 | $ | 2,714 | $ | 509 | $ | 2,950 | ||||||||
|
|
|
|
|
|
|
|
|
|||||||||
The impact on interest income for these loans was not material to the Bank’s results of operating during the years ending December 31, 2013 and 2012.
F-49
Table of Contents
Index to Financial Statements
FRANKLIN FINANCIAL NETWORK, INC.
NOTES TO CONSOLIDATED FINANCIAL STATEMENTS
December 31, 2013 and 2012
(Dollar amounts in thousands, except share and per share data)
NOTE 3—LOANS (Continued)
The following table presents the recorded investment in nonaccrual and loans past due over 90 days still on accrual by class of loans as of December 31, 2013 and 2012:
| Nonaccrual | Loans Past Due Over 90 Days |
|||||||
| December 31, 2013 |
||||||||
| Construction and land development |
$ | — | $ | — | ||||
| Commercial real estate: |
||||||||
| Nonfarm, nonresidential |
1,375 | — | ||||||
| Residential real estate: |
||||||||
| 1-4 family |
1,226 | — | ||||||
|
|
|
|
|
|||||
| Total |
$ | 2,601 | $ | — | ||||
|
|
|
|
|
|||||
| December 31, 2012 |
||||||||
| Construction and land development |
$ | 76 | $ | — | ||||
| Commercial real estate: |
||||||||
| Nonfarm, nonresidential |
1,375 | — | ||||||
| Residential real estate: |
||||||||
| 1-4 family |
1,226 | — | ||||||
|
|
|
|
|
|||||
| Total |
$ | 2,677 | $ | — | ||||
|
|
|
|
|
|||||
Nonaccrual loans and loans past due 90 days still on accrual include both smaller balance homogeneous loans that are collectively evaluated for impairment and individually classified impaired loans.
The following table presents the aging of the recorded investment in past due loans as of December 31, 2013 and 2012 by class of loans:
| 30-59 Days Past Due |
60-89 Days Past Due |
Greater Than 89 Days Past Due |
Total Past Due |
Loans Not Past Due |
Total | |||||||||||||||||||
| December 31, 2013 |
||||||||||||||||||||||||
| Construction and land development |
$ | — | $ | — | $ | — | $ | — | $ | 113,710 | $ | 113,710 | ||||||||||||
| Commercial real estate: |
||||||||||||||||||||||||
| Nonfarm, nonresidential |
1,985 | — | 1,375 | 3,360 | 111,492 | 114,852 | ||||||||||||||||||
| Other |
— | — | — | — | 10,350 | 10,350 | ||||||||||||||||||
| Residential real estate: |
||||||||||||||||||||||||
| 1-4 family |
245 | — | 1,226 | 1,471 | 97,144 | 98,615 | ||||||||||||||||||
| Other |
— | — | — | — | 39,851 | 39,851 | ||||||||||||||||||
| Commercial and industrial |
— | — | — | — | 36,397 | 36,397 | ||||||||||||||||||
| Consumer and other |
— | — | — | — | 8,250 | 8,250 | ||||||||||||||||||
|
|
|
|
|
|
|
|
|
|
|
|
|
|||||||||||||
| $ | 2,230 | $ | — | $ | 2,601 | $ | 4,831 | $ | 417,194 | $ | 422,025 | |||||||||||||
|
|
|
|
|
|
|
|
|
|
|
|
|
|||||||||||||
F-50
Table of Contents
Index to Financial Statements
FRANKLIN FINANCIAL NETWORK, INC.
NOTES TO CONSOLIDATED FINANCIAL STATEMENTS
December 31, 2013 and 2012
(Dollar amounts in thousands, except share and per share data)
NOTE 3—LOANS (Continued)
| 30-59 Days Past Due |
60-89 Days Past Due |
Greater Than 89 Days Past Due |
Total Past Due |
Loans Not Past Due |
Total | |||||||||||||||||||
| December 31, 2012 |
||||||||||||||||||||||||
| Construction and land development |
$ | — | $ | — | $ | — | $ | — | $ | 83,767 | $ | 83,767 | ||||||||||||
| Commercial real estate: |
||||||||||||||||||||||||
| Nonfarm, nonresidential |
— | — | 1,375 | 1,375 | 66,667 | 68,042 | ||||||||||||||||||
| Other |
— | — | — | — | 9,640 | 9,640 | ||||||||||||||||||
| Residential real estate: |
||||||||||||||||||||||||
| 1-4 family |
— | 37 | 1,226 | 1,263 | 75,586 | 76,849 | ||||||||||||||||||
| Other |
— | — | — | — | 29,740 | 29,740 | ||||||||||||||||||
| Commercial and industrial |
— | — | — | — | 20,280 | 20,280 | ||||||||||||||||||
| Consumer and other |
— | — | — | — | 11,758 | 11,758 | ||||||||||||||||||
|
|
|
|
|
|
|
|
|
|
|
|
|
|||||||||||||
| $ | — | $ | 37 | $ | 2,601 | $ | 2,638 | $ | 297,438 | $ | 300,076 | |||||||||||||
|
|
|
|
|
|
|
|
|
|
|
|
|
|||||||||||||
Credit Quality Indicators: The Company categorizes loans into risk categories based on relevant information about the ability of borrowers to service their debt such as: current financial information, historical payment experience, credit documentation, public information, and current economic trends, among other factors. The Company analyzes loans individually by classifying the loans as to credit risk. This analysis includes non-homogeneous loans, such as commercial and commercial real estate loans as well as non-homogeneous residential real estate loans. This analysis is performed on a quarterly basis. The Company uses the following definitions for risk ratings:
| • | Special Mention. Loans classified as special mention have a potential weakness that deserves management’s close attention. If left uncorrected, these potential weaknesses may result in deterioration of the repayment prospects for the loan or of the institution’s credit position at some future date. |
| • | Substandard. Loans classified as substandard are inadequately protected by the current net worth and paying capacity of the obligor or of the collateral pledged, if any. Loans so classified have a well-defined weakness or weaknesses that jeopardize the liquidation of the debt. They are characterized by the distinct possibility that the institution will sustain some loss if the deficiencies are not corrected. |
F-51
Table of Contents
Index to Financial Statements
FRANKLIN FINANCIAL NETWORK, INC.
NOTES TO CONSOLIDATED FINANCIAL STATEMENTS
December 31, 2013 and 2012
(Dollar amounts in thousands, except share and per share data)
NOTE 3—LOANS (Continued)
Loans not meeting the criteria above that are analyzed individually as part of the above described process are considered to be pass rated loans. Based on the most recent analysis performed, the risk category of loans by class of loans is as follows as of year-end 2013 and 2012:
| Pass | Special Mention |
Substandard | Total | |||||||||||||
| December 31, 2013 |
||||||||||||||||
| Construction and land development |
$ | 113,710 | $ | — | $ | — | $ | 113,710 | ||||||||
| Commercial real estate: |
||||||||||||||||
| Nonfarm, nonresidential |
110,938 | — | 3,914 | 114,852 | ||||||||||||
| Other |
10,350 | — | — | 10,350 | ||||||||||||
| Residential real estate: |
||||||||||||||||
| 1-4 family |
96,823 | — | 1,792 | 98,615 | ||||||||||||
| Other |
39,851 | — | — | 39,851 | ||||||||||||
| Commercial and industrial |
36,397 | — | — | 36,397 | ||||||||||||
| Consumer and other |
8,250 | — | — | 8,250 | ||||||||||||
|
|
|
|
|
|
|
|
|
|||||||||
| $ | 416,319 | $ | — | $ | 5,706 | $ | 422,025 | |||||||||
|
|
|
|
|
|
|
|
|
|||||||||
| December 31, 2012 |
||||||||||||||||
| Construction and land development |
$ | 83,691 | $ | — | $ | 76 | $ | 83,767 | ||||||||
| Commercial real estate: |
||||||||||||||||
| Nonfarm, nonresidential |
64,176 | 1,932 | 1,934 | 68,042 | ||||||||||||
| Other |
9,140 | — | 500 | 9,640 | ||||||||||||
| Residential real estate: |
||||||||||||||||
| 1-4 family |
71,236 | 3,400 | 2,213 | 76,849 | ||||||||||||
| Other |
29,141 | — | 599 | 29,740 | ||||||||||||
| Commercial and industrial |
20,000 | — | 280 | 20,280 | ||||||||||||
| Consumer and other |
11,758 | — | — | 11,758 | ||||||||||||
|
|
|
|
|
|
|
|
|
|||||||||
| $ | 289,142 | $ | 5,332 | $ | 5,602 | $ | 300,076 | |||||||||
|
|
|
|
|
|
|
|
|
|||||||||
NOTE 4—LOAN SERVICING
Loans serviced for others are not reported as assets. The principal balances of these loans at year end are as follows:
| 2013 | 2012 | |||||||
| Loan portfolios serviced for: |
||||||||
| Federal Home Loan Mortgage Corporation |
$ | 348,121 | $ | 274,841 | ||||
| Other |
5,088 | 2,139 | ||||||
Custodial escrow balances maintained in connection with serviced loans were $1,607 and $1,118 at year end 2013 and 2012.
F-52
Table of Contents
Index to Financial Statements
FRANKLIN FINANCIAL NETWORK, INC.
NOTES TO CONSOLIDATED FINANCIAL STATEMENTS
December 31, 2013 and 2012
(Dollar amounts in thousands, except share and per share data)
NOTE 4—LOAN SERVICING (Continued)
The related loan servicing rights activity for the years ending December 31, 2013 and 2012 were as follows:
| 2013 | 2012 | |||||||
| Servicing rights: |
||||||||
| Beginning of year |
$ | 2,401 | $ | 2,329 | ||||
| Additions |
1,414 | 1,398 | ||||||
| Amortized to expense |
(1,265 | ) | (1,236 | ) | ||||
| Change in impairment |
90 | (90 | ) | |||||
|
|
|
|
|
|||||
| End of year |
$ | 2,640 | $ | 2,401 | ||||
|
|
|
|
|
|||||
The components of loan servicing fees, net for the years ending December 31, 2013 and 2012 were as follows:
| 2013 | 2012 | |||||||
| Loan servicing fees, net: |
||||||||
| Loan servicing fees |
$ | 810 | $ | 590 | ||||
| Amortization of loan servicing fees |
(1,265 | ) | (1,236 | ) | ||||
| Change in impairment |
90 | (90 | ) | |||||
|
|
|
|
|
|||||
| Total |
$ | (365 | ) | $ | (736 | ) | ||
|
|
|
|
|
|||||
The fair value of servicing rights was estimated by management to be approximately $3,714 at year-end 2013. Fair value at year-end 2013 was determined using a weighted average discount rate of 10.5% and a weighted average prepayment speed of 8.8%. At year-end 2012, the fair value of servicing rights was estimated by management to be approximately $2,401. Fair value at year-end 2012 was determined using weighted average discount rate of 10.5% and a weighted average prepayment speed of 13.6%.
The weighted average amortization period is 2.85 years. Estimated amortization expense for each of the next three years is:
| 2014 |
$ | 927 | ||
| 2015 |
927 | |||
| 2016 |
786 |
F-53
Table of Contents
Index to Financial Statements
FRANKLIN FINANCIAL NETWORK, INC.
NOTES TO CONSOLIDATED FINANCIAL STATEMENTS
December 31, 2013 and 2012
(Dollar amounts in thousands, except share and per share data)
NOTE 5—PREMISES AND EQUIPMENT
Year end premises and equipment were as follows:
| 2013 | 2012 | |||||||
| Construction in progress |
$ | 1,044 | $ | 61 | ||||
| Leasehold improvement |
2,438 | 2,142 | ||||||
| Furniture, fixtures and equipment |
2,594 | 2,158 | ||||||
| Computer equipment and software |
1,688 | 1,561 | ||||||
| Automobile |
— | 27 | ||||||
|
|
|
|
|
|||||
| 7,764 | 5,949 | |||||||
| Accumulated depreciation |
(3,626 | ) | (3,005 | ) | ||||
|
|
|
|
|
|||||
| $ | 4,138 | $ | 2,944 | |||||
|
|
|
|
|
|||||
Depreciation expense was $653 and $717, for each of the years in the two year period ending December 31, 2013.
Operating Leases: The Company leases its branches, loan production and administrative offices under operating leases. Rent expense was $1,311 and $1,143 for 2013 and 2012. Rent commitments, over the initial lease terms and intended renewal periods, were as follows:
| Related Parties |
Other | Total | ||||||||||
| 2014 |
$ | 644 | $ | 656 | $ | 1,300 | ||||||
| 2015 |
653 | 223 | 876 | |||||||||
| 2016 |
662 | 130 | 792 | |||||||||
| 2017 |
671 | 34 | 705 | |||||||||
| 2018 |
680 | — | 680 | |||||||||
| Thereafter |
5,134 | — | 5,134 | |||||||||
|
|
|
|
|
|
|
|||||||
| Total |
$ | 8,444 | $ | 1,043 | $ | 9,487 | ||||||
|
|
|
|
|
|
|
|||||||
The Company has entered into lease agreements for additional branch and administration facilities that are expected to be completed during 2014. Estimated completion dates and total costs for leasehold improvements related to these properties are as follows:
| Estimated Completion Date |
Estimated Total Costs |
|||||||
| Franklin addition |
April 2014 | $ | 1,100 | |||||
| Brentwood branch |
May 2014 | 825 | ||||||
| Cool Springs branch |
June 2014 | 525 | ||||||
| Franklin addition |
December 2014 | 1,100 | ||||||
|
|
|
|||||||
| Total |
$ | 3,550 | ||||||
|
|
|
|||||||
F-54
Table of Contents
Index to Financial Statements
FRANKLIN FINANCIAL NETWORK, INC.
NOTES TO CONSOLIDATED FINANCIAL STATEMENTS
December 31, 2013 and 2012
(Dollar amounts in thousands, except share and per share data)
NOTE 5—PREMISES AND EQUIPMENT (Continued)
Estimated incremental rent commitments for the expected 2014 lease additions, over the initial lease terms, are as follows:
| Related Parties |
Other | Total | ||||||||||
| 2014 |
$ | 731 | $ | — | $ | 731 | ||||||
| 2015 |
1,416 | — | 1,416 | |||||||||
| 2016 |
1,437 | — | 1,437 | |||||||||
| 2017 |
1,459 | — | 1,459 | |||||||||
| 2018 |
1,481 | — | 1,481 | |||||||||
| Thereafter |
16,450 | — | 16,450 | |||||||||
|
|
|
|
|
|
|
|||||||
| Total |
$ | 22,974 | $ | — | $ | 22,974 | ||||||
|
|
|
|
|
|
|
|||||||
Total future commitments for related party leases and other parties was $31,418 and $1,043, respectively.
NOTE 6—DEPOSITS
Time deposits of $100 or more were $76,842 and $73,875 at year end 2013 and 2012. The Company had $40,401 and $3,366 of brokered deposits at December 31, 2013 and 2012.
Scheduled maturities of time deposits for the next five years were as follows:
| 2014 |
$ | 115,416 | ||
| 2015 |
34,307 | |||
| 2016 |
23,792 | |||
| 2017 |
14,373 | |||
| 2018 |
14,073 |
NOTE 7—FEDERAL FUNDS PURCHASED AND REPURCHASE AGREEMENTS
As of December 31, 2013 and 2012, the Bank had federal funds lines (or the equivalent thereof) with correspondent banks totaling $71,700 and $53,800. There was $20,825 and $20 outstanding at year end 2013 and 2012.
As of December 31, 2013 and 2012, securities sold under agreements to repurchase had an outstanding balance of $3,466 and $1,582 are secured by securities with a carrying amount of $8,418 and $4,941, respectively. Securities sold under agreements to repurchase are financing arrangements that mature daily. At maturity, the securities underlying the agreements are returned to the Company.
Information concerning securities sold under agreements to repurchase is summarized as follows:
| 2013 | 2012 | |||||||
| Average daily balance during the year |
$ | 3,525 | $ | 3,904 | ||||
| Average interest rate during the year |
0.71 | % | 0.71 | % | ||||
| Maximum month-end balance during the year |
$ | 5,077 | $ | 4,744 | ||||
| Weighted average interest rate at year end |
0.73 | % | 0.73 | % | ||||
F-55
Table of Contents
Index to Financial Statements
FRANKLIN FINANCIAL NETWORK, INC.
NOTES TO CONSOLIDATED FINANCIAL STATEMENTS
December 31, 2013 and 2012
(Dollar amounts in thousands, except share and per share data)
NOTE 8—FHLB ADVANCES
The Bank has established a line of credit with the FHBL of Cincinnati, which is secured by a blanket pledge of 1-4 family residential mortgage loans. The extent of the line is dependent, in part, on available collateral. The arrangement is structured so that the carrying value of the loans pledged amounts to 125% on residential 1-4 family loans of the principal balance of the advances from the FHLB.
At December 31, 2013 and 2012, the Company had received advances from the FHLB totaling $23,000 and $8,000, respectively. At December 31, 2013, the schedule maturities of these advances and interest rates were as follows:
| Scheduled Maturities |
Weighted Average Rates |
|||||||
| 2014 |
$ | 19,000 | 0.41 | % | ||||
| 2015 |
2,000 | 0.70 | % | |||||
| 2016 |
— | — | ||||||
| 2017 |
— | — | ||||||
| 2018 |
2,000 | 1.45 | % | |||||
| Thereafter |
— | — | ||||||
|
|
|
|||||||
| Total |
$ | 23,000 | 0.52 | % | ||||
|
|
|
|||||||
The advance is payable at its maturity date, with a prepayment penalty for fixed rate advances. Qualifying loans totaling approximately $107,533 were pledged as security under a blanket pledge agreement with the FHLB at December 31, 2013. Based on this collateral and the Company’s holdings of FHLB stock, the Bank is eligible to borrow up to an additional $46,120 as of December 31, 2013.
NOTE 9—BENEFIT PLANS
A 401(k) benefit plan was adopted to begin benefits on May 1, 2008. The 401(k) benefit plan allows employee contributions of their compensation subject to certain limitations. Employee contributions are matched in the Company’s common stock equal to 100% of the first 2% of the compensation contributed and 50% of the next 4% of the compensation contributed. Expense for the years ending December 31, 2013 and 2012 was $270 and $223, respectively.
F-56
Table of Contents
Index to Financial Statements
FRANKLIN FINANCIAL NETWORK, INC.
NOTES TO CONSOLIDATED FINANCIAL STATEMENTS
December 31, 2013 and 2012
(Dollar amounts in thousands, except share and per share data)
NOTE 10—INCOME TAXES
A reconciliation of the income tax expense for the years ended December 31, 2013 and 2012 to the “expected” tax expense computed by applying the statutory federal income tax rate of 34 percent to income before income tax expense is as follows:
| 2013 | 2012 | |||||||
| Computed “expected” tax expense |
$ | 2,480 | $ | 2,107 | ||||
| Increase (reduction) in tax expense resulting from: |
||||||||
| State tax expense, net of federal tax effect |
305 | 247 | ||||||
| Incentive stock options |
19 | 95 | ||||||
| Bank owned life insurance |
(92 | ) | (217 | ) | ||||
| Tax-exempt interest income, net of expense |
(40 | ) | (34 | ) | ||||
| Other |
62 | (142 | ) | |||||
|
|
|
|
|
|||||
| Income tax expense |
$ | 2,734 | $ | 2,056 | ||||
|
|
|
|
|
|||||
Income tax expense (benefit) was as follows:
| 2013 | 2012 | |||||||
| Current expense |
||||||||
| Federal |
$ | 2,613 | $ | 1,786 | ||||
| State |
517 | 402 | ||||||
| Deferred expense |
||||||||
| Federal |
(343 | ) | (104 | ) | ||||
| State |
(53 | ) | (28 | ) | ||||
|
|
|
|
|
|||||
| Income tax expense |
$ | 2,734 | $ | 2,056 | ||||
|
|
|
|
|
|||||
The sources of deferred income tax assets (liabilities) at December 31, 2013 and 2012 and the tax effect is as follows:
| 2013 | 2012 | |||||||
| Deferred tax assets: |
||||||||
| Organizational and start-up costs |
$ | 170 | $ | 189 | ||||
| Allowance for loan losses |
1,718 | 1,322 | ||||||
| Unrealized loss on securities |
2,812 | — | ||||||
| Accrued other expenses |
116 | 83 | ||||||
| Loan fees |
266 | 227 | ||||||
| Other |
607 | 385 | ||||||
|
|
|
|
|
|||||
| 5,689 | 2,206 | |||||||
|
|
|
|
|
|||||
| Deferred tax liabilities: |
||||||||
| Mortgage servicing rights |
(975 | ) | (903 | ) | ||||
| Premises and equipment |
(468 | ) | (427 | ) | ||||
| Prepaid expenses |
(71 | ) | (70 | ) | ||||
| Mortgage banking derivatives |
(123 | ) | — | |||||
| Unrealized gain on securities |
— | (577 | ) | |||||
| Other |
(57 | ) | (19 | ) | ||||
|
|
|
|
|
|||||
| (1,694 | ) | (1,996 | ) | |||||
|
|
|
|
|
|||||
| Net deferred tax asset |
$ | 3,995 | $ | 210 | ||||
|
|
|
|
|
|||||
F-57
Table of Contents
Index to Financial Statements
FRANKLIN FINANCIAL NETWORK, INC.
NOTES TO CONSOLIDATED FINANCIAL STATEMENTS
December 31, 2013 and 2012
(Dollar amounts in thousands, except share and per share data)
NOTE 10—INCOME TAXES (Continued)
The Company does not have any uncertain tax positions and does not have any interest and penalties recorded in the income statement for the years ended December 31, 2013 and 2012. The Company and its subsidiaries are subject to U.S. federal income tax as well as income tax of the state of Tennessee. The Company is no longer subject to examination by taxing authorities for years before 2010.
NOTE 11—RELATED PARTY TRANSACTIONS
The Company enters into various credit arrangements with its executive officers, directors and their affiliates. These arrangements generally take the form of commercial lines of credit, personal lines of credit, mortgage loans, term loans or revolving arrangements secured by personal residences.
Loans to principal officers, directors, and their affiliates during 2013 were as follows:
| Beginning balance |
$ | 5,947 | ||
| New loans |
1,635 | |||
| Effect of changes in composition of related parties |
— | |||
| Repayments |
(830 | ) | ||
|
|
|
|||
| Ending balance |
$ | 6,752 | ||
|
|
|
Deposits from principal officers, directors, and their affiliates at year end 2013 and 2012 were $7,047 and $5,577.
The Company entered into a fifteen year lease agreement for a branch and administrative facility in downtown Franklin, Tennessee on May 7, 2010. The Company also entered into a fifteen year lease for its Berry Farms branch in Franklin, Tennessee, on June 12, 2013 with certain outside directors of the Company. The branch opened during 2013. Rent expense attributable to the related party leases in 2013 and 2012, was $559 and $484, respectively. Rent commitments to related parties, before considering renewal options that generally are present, are disclosed in Note 5. Another of the Company’s outside directors was paid $1,088 and $375 for construction of leasehold improvements during 2013 and 2012. The Company also paid a company affiliated with an outside director $70 and $77 for the procurement of various insurance policies during the years ending December 31, 2013 and 2012.
The Bank agreed to sell the real estate of three of its branches in Rutherford County, Tennessee to Murfreesboro Branches, LLC (“Buyer”), an affiliate of Henry W. Brockman and Dr. David H. Kemp, each of whom are directors of the Bank and the Company, for a purchase price of $4,095,000 (the “Sale”). Consummation of the Sale is subject to customary closing conditions, including title insurance and other requirements. Buyer agreed to lease such real estate back to the Bank as of the date of the closing of the Sale, each lease having a term of 13 years.
NOTE 12—SHARE-BASED PAYMENTS
In connection with the offering in 2007, the Company’s original shareholders received as part of their initial investment 131,250 warrants, one for every twenty shares of common stock purchased. Each warrant allows the shareholders to purchase an additional share of common stock at $12.00 per share. The warrants were issued with an effective date of November 26, 2007 and will be exercisable in whole or in part up to five years
F-58
Table of Contents
Index to Financial Statements
FRANKLIN FINANCIAL NETWORK, INC.
NOTES TO CONSOLIDATED FINANCIAL STATEMENTS
December 31, 2013 and 2012
(Dollar amounts in thousands, except share and per share data)
NOTE 12—SHARE-BASED PAYMENTS (Continued)
following the date of issuance. In connection with an offering completed during 2010, 32,425 warrants were issued to shareholders, one warrant for every twenty shares of common stock purchased. Each warrant allows the shareholders to purchase an additional share of common stock at $12.00 per share. The warrants were issued with an effective date of March 30, 2010 and will be exercisable in whole or in part up to seven years following the date of issuance. The warrants are detachable from the common stock. There were 3,024 warrants exercised during 2013, for which the Company received cash proceeds of $36. The warrants exercised had an intrinsic value of $3 at exercise date. There were 54,958 warrants exercised during 2012, for which the Company received cash proceeds of $660. As of December 31, 2013, there were 31,877 outstanding warrants associated with the 2010 offering. All warrants issued in connection with the 2007 offering have expired.
In the event the Common Stock of the Corporation is to be registered with the Securities and Exchange Commission or is traded on a national securities exchange at $15.00 or more for forty-five (45) consecutive days, the Corporation may redeem the 2010 Warrants at any time thereafter with not less than thirty (30) days’ written notice to the holder of such 2010 Warrant, in whole or in part, at a redemption price of $1.00 per warrant; provided, however, that the holder of the 2010 Warrant may exercise the 2010 Warrant, in whole or in part, during such thirty (30) day period.
Stock Option Plan: The Company’s 2007 Stock Option Plan (stock option plan or the Plan), which is shareholder-approved, permits the grant of share options to its employees, organizers and directors for up to 551,250 shares of common stock. In April 2013, the Plan was amended to offer additional forms of equity compensation, to change the Plan’s name to the Franklin Financial Network, Inc. 2007 Omnibus Equity Incentive Plan, and to increase the number of authorized shares to 1,500,000. The Company believes that such awards better align the interests of its employees with those of its shareholders. Employee, organizer and director awards are generally granted with an exercise price equal to the market price of the Company’s common stock at the date of grant; those option awards have a vesting period of 3 to 5 years and have a 10-year contractual term. The Company assigns discretion to its Board of Directors to make grants either as qualified incentive stock options or as non-qualified stock options. All employee grants are intended to be treated as qualified incentive stock options, if allowable. All other grants are expected to be treated as non-qualified.
During 2007, the Company granted 33,750 options to its organizers under the Plan. These options were granted in accordance with each organizer’s financial contribution to the Company during its organization period, and vested over a five year period. No service element was included in the criteria used for determining grant awards. Accordingly, these options were not expensed as stock-based compensation.
During 2013, the Company granted employees the option to acquire common shares of the Company, plus a cash award, in exchange for existing vested options held by the employee. Options that were exchanged were surrendered and considered cancelled. As part of this exchange, a total of 166,448 options were cancelled in exchange for 32,814 shares of common stock and cash awards totaling $142. The Company recognized an excess tax benefit related to the exchange of $83 for the year ended December 31, 2013.
The fair value of each option award is estimated on the date of grant using a closed form option valuation (Black-Scholes) model that uses the assumptions noted in the table below. Expected stock price volatility is based on historical volatilities of a peer group. The Company uses historical data to estimate option exercise and post-vesting termination behavior.
F-59
Table of Contents
Index to Financial Statements
FRANKLIN FINANCIAL NETWORK, INC.
NOTES TO CONSOLIDATED FINANCIAL STATEMENTS
December 31, 2013 and 2012
(Dollar amounts in thousands, except share and per share data)
NOTE 12—SHARE-BASED PAYMENTS (Continued)
The expected term of options granted represents the period of time that options granted are expected to be outstanding, which takes into account that the options are not transferable. The risk-free interest rate for the expected term of the option is based on the U.S. Treasury yield curve in effect at the time of the grant.
The fair value of options granted was determined using the following weighted-average assumptions as of grant date.
| 2013 | 2012 | |||||||
| Risk-free interest rate |
1.65 | % | 0.93 | % | ||||
| Expected term |
7.5 years | 7 years | ||||||
| Expected stock price volatility |
12.63 | % | 12.35 | % | ||||
| Dividend yield |
0.99 | % | 1.61 | % | ||||
The weighted average fair value of options granted for the years ending December 31, 2013 and 2012 was $1.92 and $1.18, respectively.
A summary of the activity in the stock option plans for 2013 follows:
| Shares | Weighted Average Exercise Price |
Weighted Average Remaining Contractual Term (Years) |
Aggregate Intrinsic Value |
|||||||||||||
| Outstanding at beginning of year |
1,004,379 | $ | 10.88 | 7.17 | ||||||||||||
| Granted |
124,119 | 13.00 | ||||||||||||||
| Exercised |
(5,755 | ) | 10.05 | $ | 17 | |||||||||||
| Forfeited or canceled |
(176,099 | ) | 10.30 | |||||||||||||
|
|
|
|||||||||||||||
| Outstanding at end of year |
946,644 | $ | 11.27 | 6.81 | $ | 1,635 | ||||||||||
|
|
|
|
|
|
|
|
|
|||||||||
| Vested or expected to vest |
899,312 | $ | 11.27 | 6.81 | $ | 1,553 | ||||||||||
| Exercisable at end of year |
495,045 | $ | 10.77 | 5.58 | $ | 1,105 | ||||||||||
|
|
|
|
|
|
|
|
|
|||||||||
As of December 31, 2013, there was $591 of total unrecognized compensation cost related to nonvested stock options granted under the Plan. The cost is expected to be recognized over a weighted-average period of 2.0 years.
Restricted Share Award Plan: Additionally, the Company’s 2007 Omnibus Equity Incentive Plan provides for the granting of restricted share awards and other performance related incentives. During 2013, the Company awarded 30,105 of restricted common shares to employees of the Company. When the restricted shares are awarded, a participant receives voting and dividend rights with respect to the shares, but is not able to transfer the shares until the restrictions have lapsed. These awards have a vesting period of 5 years and vest in equal annual installments on the anniversary date of the grant. There were no outstanding restricted shares as of December 31, 2012.
F-60
Table of Contents
Index to Financial Statements
FRANKLIN FINANCIAL NETWORK, INC.
NOTES TO CONSOLIDATED FINANCIAL STATEMENTS
December 31, 2013 and 2012
(Dollar amounts in thousands, except share and per share data)
NOTE 12—SHARE-BASED PAYMENTS (Continued)
A summary of activity for nonvested restricted share awards as of December 31, 2013 is as follows:
| Nonvested Shares |
Shares | Weighted-Average Grant-Date Fair Value |
||||||
| Nonvested at January 1, 2013 |
— | $ | — | |||||
| Granted |
30,105 | 13.00 | ||||||
| Vested |
— | — | ||||||
| Forfeited |
(1,420 | ) | 13.00 | |||||
|
|
|
|||||||
| Nonvested at December 31, 2013 |
28,685 | $ | 13.00 | |||||
|
|
|
|||||||
Compensation expense associated with the restricted share awards is recognized on a straight-line basis over the time period that the restrictions associated with the awards lapse based on the total cost of the award at the grant date, and is recorded in equity as common stock. As of December 31, 2013, there was $329 of total unrecognized compensation cost related to nonvested shares granted under the Plan. The cost is expected to be recognized over a weighted-average period of 4.4 years.
NOTE 13—REGULATORY CAPITAL MATTERS
Banks and bank holding companies are subject to regulatory capital requirements administered by federal banking agencies. Capital adequacy guidelines and, additionally for banks, prompt corrective action regulations, involve quantitative measures of assets, liabilities, and certain off-balance-sheet items calculated under regulatory accounting practices. Capital amounts and classifications are also subject to qualitative judgments by regulators. Failure to meet capital requirements can initiate regulatory action. Management believes as of December 31, 2013, the Company and the Bank meet all capital adequacy requirements to which it is subject.
Prompt corrective action regulations provide five classifications: well capitalized, adequately capitalized, undercapitalized, significantly undercapitalized, and critically undercapitalized, although these terms are not used to represent overall financial condition. If adequately capitalized, regulatory approval is required to accept brokered deposits. If undercapitalized, capital distributions are limited, as is asset growth and expansion, and capital restoration plans are required. At year-end 2013, the most recent regulatory notifications categorized the Bank as well capitalized under the regulatory framework for prompt corrective action. There are no conditions or events since that notification that management believes have changed the institution’s category.
F-61
Table of Contents
Index to Financial Statements
FRANKLIN FINANCIAL NETWORK, INC.
NOTES TO CONSOLIDATED FINANCIAL STATEMENTS
December 31, 2013 and 2012
(Dollar amounts in thousands, except share and per share data)
NOTE 13—REGULATORY CAPITAL MATTERS (Continued)
Actual and required capital amounts and ratios are presented below at December 31, 2013 and December 31, 2012 for the Bank and at December 31, 2013 for the Company.
| Actual | Required For Capital Adequacy Purposes |
To Be Well Capitalized Under Prompt Corrective Action Regulations |
||||||||||||||||||||||
| Amount | Ratio | Amount | Ratio | Amount | Ratio | |||||||||||||||||||
| December 31, 2013 |
||||||||||||||||||||||||
| Company Total Capital to risk weighted assets |
$ | 74,430 | 14.81 | % | $ | 40,209 | 8.00 | % | N/A | N/A | ||||||||||||||
| Company Tier 1 (Core) Capital to risk weighted assets |
$ | 69,530 | 13.83 | % | $ | 20,105 | 4.00 | % | N/A | N/A | ||||||||||||||
| Company Tier 1 (Core) Capital to average assets |
$ | 69,530 | 9.78 | % | $ | 28,449 | 4.00 | % | N/A | N/A | ||||||||||||||
| Bank Total Capital to risk weighted assets |
$ | 73,305 | 14.59 | % | $ | 40,192 | 8.00 | % | $ | 50,239 | 10.00 | % | ||||||||||||
| Bank Tier 1 (Core) Capital to risk weighted assets |
$ | 68,405 | 13.62 | % | $ | 20,096 | 4.00 | % | $ | 30,144 | 6.00 | % | ||||||||||||
| Bank Tier 1 (Core) Capital to average assets |
$ | 68,405 | 9.62 | % | $ | 28,455 | 4.00 | % | $ | 35,569 | 5.00 | % | ||||||||||||
| December 31, 2012 |
||||||||||||||||||||||||
| Bank Total Capital to risk weighted assets |
$ | 53,138 | 15.45 | % | $ | 27,506 | 8.00 | % | $ | 34,382 | 10.00 | % | ||||||||||||
| Bank Tier 1 (Core) Capital to risk weighted assets |
$ | 49,155 | 14.29 | % | $ | 13,753 | 4.00 | % | $ | 20,629 | 6.00 | % | ||||||||||||
| Bank Tier 1 (Core) Capital to average assets |
$ | 49,155 | 9.27 | % | $ | 20,870 | 4.00 | % | $ | 26,087 | 5.00 | % | ||||||||||||
Dividend Restrictions: The Company’s principal source of funds for dividend payments is dividends received from the Bank. Banking regulations limit the amount of dividends that may be paid without prior approval of regulatory agencies. Under these regulations, the amount of dividends that may be paid in any calendar year is limited to the current year’s net profits, combined with the retained net profits of the preceding two years, subject to the capital requirements described above. During 2014, the Bank could, without prior approval, declare dividends of approximately $9,190 plus any 2014 net profits retained to the date of the dividend declaration.
NOTE 14—MORTGAGE BANKING DERIVATIVES
Commitments to fund certain mortgage loans (interest rate locks) to be sold into the secondary market and forward commitments for the future delivery of mortgage loans to third party investors are considered derivatives. It is the Company’s practice to enter into forward commitments for the future delivery of residential mortgage loans when interest rate lock commitments are entered into in order to economically hedge the effect of changes in interest rates resulting from its commitments to fund the loans. These mortgage banking derivatives are not designated in hedge relationships. At year-end 2013, the Company had approximately $26,000 of interest rate lock commitments and approximately $27,000 of forward commitments for the future delivery of residential mortgage loans. The fair value of these mortgage banking derivatives was reflected by a derivative asset of $464 at December 31, 2013. At year-end 2012, the Company had approximately $41,000 of interest rate lock commitments and approximately $30,000 of forward commitments for the future delivery of residential mortgage loans. The fair value of these mortgage banking derivatives was reflected by a derivative asset of $612 and a derivative liability of $42 at December 31, 2012. Fair values were estimated based on changes in mortgage interest rates from the date of the commitments. Changes in the fair values of these mortgage-banking derivatives are included in net gains on sale of loans.
F-62
Table of Contents
Index to Financial Statements
FRANKLIN FINANCIAL NETWORK, INC.
NOTES TO CONSOLIDATED FINANCIAL STATEMENTS
December 31, 2013 and 2012
(Dollar amounts in thousands, except share and per share data)
NOTE 14—MORTGAGE BANKING DERIVATIVES (Continued)
The net gains (losses) relating to free-standing derivative instruments used for risk management are summarized below:
| 2013 | 2012 | |||||||
| Forward contracts related to mortgage loans held for sale and interest rate contracts |
$ | 321 | $ | (46 | ) | |||
| Interest rate contracts for customers |
(427 | ) | 474 | |||||
The following table reflects the amount and market value of mortgage banking derivatives included in the consolidated balance sheet as of December 31:
| 2013 | 2012 | |||||||||||||||
| Notional Amount |
Fair Value |
Notional Amount |
Fair Value |
|||||||||||||
| Included in other assets (liabilities): |
||||||||||||||||
| Interest rate contracts for customers |
$ | 25,789 | $ | 185 | $ | 40,939 | $ | 612 | ||||||||
|
|
|
|
|
|
|
|
|
|||||||||
| Forward contracts related to mortgage loans held for sale |
$ | 27,288 | $ | 279 | $ | 30,479 | $ | (42 | ) | |||||||
|
|
|
|
|
|
|
|
|
|||||||||
NOTE 15—LOAN COMMITMENTS AND OTHER RELATED ACTIVITIES
Some financial instruments, such as loan commitments, credit lines, letters of credit, and overdraft protection, are issued to meet customer financing needs. These are agreements to provide credit or to support the credit of others, as long as conditions established in the contract are met, and usually have expiration dates. Commitments may expire without being used. Off-balance-sheet risk to credit loss exists up to the face amount of these instruments, although material losses are not anticipated. The same credit policies are used to make such commitments as are used for loans, including obtaining collateral at exercise of the commitment.
The contractual amounts of financial instruments with off-balance-sheet risk at year end were as follows:
| 2013 | 2012 | |||||||||||||||
| Fixed Rate |
Variable Rate |
Fixed Rate |
Variable Rate |
|||||||||||||
| Commitments to make loans |
$ | 25,189 | 600 | $ | 40,198 | $ | 741 | |||||||||
| Unused lines of credit |
53,052 | 76,166 | 30,692 | 48,835 | ||||||||||||
| Standby letters of credit |
688 | 4,961 | 1,007 | 4,019 | ||||||||||||
Commitments to make loans are generally made for periods of 90 to 120 days, but not longer than 1 year. The fixed rate loan commitments have interest rates ranging from 3.125% to 6.125% and maturities ranging from 15 years to 30 years.
NOTE 16—FAIR VALUE
Fair value is the exchange price that would be received for an asset or paid to transfer a liability (exit price) in the principal or most advantageous market for the asset or liability in an orderly transaction between market participants on the measurement date. There are three levels of inputs that may be used to measure fair values:
| • | Level 1: Quoted prices (unadjusted) for identical assets or liabilities in active markets that the entity has the ability to access as of the measurement date. |
F-63
Table of Contents
Index to Financial Statements
FRANKLIN FINANCIAL NETWORK, INC.
NOTES TO CONSOLIDATED FINANCIAL STATEMENTS
December 31, 2013 and 2012
(Dollar amounts in thousands, except share and per share data)
NOTE 16—FAIR VALUE (Continued)
| • | Level 2: Significant other observable inputs other than Level 1 prices such as quoted prices for similar assets or liabilities; quoted prices in markets that are not active; or other inputs that are observable or can be corroborated by observable market data. |
| • | Level 3: Significant unobservable inputs that reflect a reporting entity’s own assumptions about the assumptions that market participants would use in pricing an asset or liability. |
The Company used the following methods and significant assumptions to estimate the fair value of each type of asset and liability:
Securities: The fair values for securities are determined by quoted market prices, if available (Level 1). For securities where quoted prices are not available, fair values are calculated based on matrix pricing, which is a mathematical technique widely used in the industry to value debt securities without relying exclusively on quoted prices for the specific securities but rather by relying on the securities’ relationship to other benchmark quoted securities (Level 2).
Derivatives: The fair values of derivatives are based on valuation models using observable market data as of the measurement date (Level 2).
Impaired Loans: The fair value of impaired loans with specific allocations of the allowance for loan losses is generally based on recent real estate appraisals. These appraisals may utilize a single valuation approach or a combination of approaches including comparable sales and the income approach. Adjustments are routinely made in the appraisal process by the independent appraisers to adjust for differences between the comparable sales and income data available. Such adjustments are usually significant and typically result in a Level 3 classification of the inputs for determining fair value. Non-real estate collateral may be valued using an appraisal, net book value per the borrower’s financial statements, or aging reports, adjusted or discounted based on management’s historical knowledge, changes in market conditions from the time of the valuation, and management’s expertise and knowledge of the client and client’s business, resulting in a Level 3 fair value classification. Impaired loans are evaluated on a quarterly basis for additional impairment and adjusted accordingly.
Foreclosed Assets: Assets acquired through or instead of loan foreclosure are initially recorded at fair value less costs to sell when acquired, establishing a new cost basis. These assets are subsequently accounted for at lower of cost or fair value less estimated costs to sell. Fair value is commonly based on recent real estate appraisals which are updated no less frequently than annually. These appraisals may utilize a single valuation approach or a combination of approaches including comparable sales and the income approach. Adjustments are routinely made in the appraisal process by the independent appraisers to adjust for differences between the comparable sales and income data available. Such adjustments are usually significant and typically result in a Level 3 classification of the inputs for determining fair value. Foreclosed assets are evaluated on a quarterly basis for additional impairment and adjusted accordingly.
Loans Held For Sale: Loans held for sale are carried at the lower of cost or fair value, as determined by outstanding commitments, from third party investors (Level 2).
F-64
Table of Contents
Index to Financial Statements
FRANKLIN FINANCIAL NETWORK, INC.
NOTES TO CONSOLIDATED FINANCIAL STATEMENTS
December 31, 2013 and 2012
(Dollar amounts in thousands, except share and per share data)
NOTE 16—FAIR VALUE (Continued)
Assets and liabilities measured at fair value on a recurring basis, including financial assets and liabilities for which the Company has elected the fair value option, are summarized below:
| Fair Value Measurements at December 31, 2013 Using: |
||||||||||||
| Quoted Prices in Active Markets for Identical Assets (Level 1) |
Significant Other Observable Inputs (Level 2) |
Significant Unobservable Inputs (Level 3) |
||||||||||
| Financial Assets |
||||||||||||
| Securities available for sale |
||||||||||||
| U.S. government sponsored entities and agencies |
$ | — | $ | 14,724 | $ | — | ||||||
| Mortgage-backed securities—residential |
— | 253,791 | — | |||||||||
|
|
|
|
|
|
|
|||||||
| Total securities available for sale |
$ | — | $ | 268,515 | $ | — | ||||||
|
|
|
|
|
|
|
|||||||
| Mortgage banking derivatives |
$ | — | $ | 464 | $ | — | ||||||
|
|
|
|
|
|
|
|||||||
| Fair Value Measurements at December 31, 2012 Using: |
||||||||||||
| Quoted Prices in Active Markets for Identical Assets (Level 1) |
Significant Other Observable Inputs (Level 2) |
Significant Unobservable Inputs (Level 3) |
||||||||||
| Financial Assets |
||||||||||||
| Securities available for sale |
||||||||||||
| U.S. government sponsored entities and agencies |
$ | — | $ | 4,022 | $ | — | ||||||
| U.S. Treasury securities |
— | 8,000 | — | |||||||||
| Mortgage-backed securities—residential |
— | 171,433 | — | |||||||||
| State and political subdivision |
— | 2,663 | — | |||||||||
|
|
|
|
|
|
|
|||||||
| Total securities available for sale |
$ | — | $ | 186,118 | $ | — | ||||||
|
|
|
|
|
|
|
|||||||
| Mortgage banking derivatives—interest rate locks |
$ | — | $ | 612 | $ | — | ||||||
|
|
|
|
|
|
|
|||||||
| Financial Liabilities |
||||||||||||
| Mortgage banking derivatives—forward sales commitments |
$ | — | $ | 42 | $ | — | ||||||
|
|
|
|
|
|
|
|||||||
There were no transfers between level 1 and 2 during 2013 and 2012.
F-65
Table of Contents
Index to Financial Statements
FRANKLIN FINANCIAL NETWORK, INC.
NOTES TO CONSOLIDATED FINANCIAL STATEMENTS
December 31, 2013 and 2012
(Dollar amounts in thousands, except share and per share data)
NOTE 16—FAIR VALUE (Continued)
Assets measured at fair value on a non-recurring basis are summarized below:
| Fair Value Measurements at December 31, 2013 Using: |
||||||||||||
| Quoted Prices in Active Markets for Identical Assets (Level 1) |
Significant Other Observable Inputs (Level 2) |
Significant Unobservable Inputs (Level 3) |
||||||||||
| Impaired loans with specific allocations |
||||||||||||
| Real estate: |
||||||||||||
| Residential |
$ | — | $ | — | $ | 1,133 | ||||||
| Commercial |
— | — | 920 | |||||||||
| Fair Value Measurements at December 31, 2012 Using: |
||||||||||||
| Quoted Prices in Active Markets for Identical Assets (Level 1) |
Significant Other Observable Inputs (Level 2) |
Significant Unobservable Inputs (Level 3) |
||||||||||
| Impaired loans with specific allocations |
||||||||||||
| Real estate: |
||||||||||||
| Residential |
$ | — | $ | — | $ | 1,133 | ||||||
| Commercial |
— | — | 1,000 | |||||||||
| Construction and land development |
— | — | 35 | |||||||||
| Foreclosed assets |
||||||||||||
| Real estate: residential |
— | — | 399 | |||||||||
Impaired loans with specific allocations, which are measured for impairment using the fair value of the collateral for collateral dependent loans, had a carrying amount of $2,053, with a valuation allowance of $548 at December 31, 2013, resulting in $80 additional provision for loan losses for the year ending December 31, 2013. At December 31, 2012, impaired loans had a carrying amount of $2,168, with a valuation allowance of $509, resulting in no additional provision for loan losses for the year ending December 31, 2012.
Foreclosed assets measured at fair value less costs to sell, had a net carrying amount of $181 for the year ended December 31, 2013. There were no properties included in this amount that have required write-downs to fair value. Foreclosed assets measured at fair value less costs to sell, had a net carrying amount of $2,089 for the year ended December 31, 2012. Included in this amount were properties that were written down to fair value totaling $399, which is made up of the outstanding balance of $425, net of a valuation allowance of $26, resulting in a write-down of $26 for the year ending December 31, 2012.
F-66
Table of Contents
Index to Financial Statements
FRANKLIN FINANCIAL NETWORK, INC.
NOTES TO CONSOLIDATED FINANCIAL STATEMENTS
December 31, 2013 and 2012
(Dollar amounts in thousands, except share and per share data)
NOTE 16—FAIR VALUE (Continued)
The following table presents quantitative information about recurring Level 3 fair value measurements at December 31, 2013:
| Fair Value | Valuation Technique(s) |
Unobservable Input(s) |
Range (Weighted Average) |
|||||||||
| Impaired loans: |
||||||||||||
| Residential real estate |
$ | 1,133 | Sales comparison | Adjustment for differences between comparable sales |
3%-27% (16% | ) | ||||||
| Commercial real estate |
920 | Sales comparison | Adjustment for differences between comparable sales |
0%-16% (16% | ) | |||||||
The following table presents quantitative information about recurring Level 3 fair value measurements at December 31, 2012:
| Fair Value | Valuation Technique(s) |
Unobservable Input(s) |
Range (Weighted Average) |
|||||||||
| Impaired loans: |
||||||||||||
| Residential real estate |
$ | 1,133 | Sales comparison | Adjustment for differences between comparable sales |
0%-9% (9% | ) | ||||||
| Commercial real estate |
1,000 | Sales comparison | Adjustment for differences between comparable sales |
5%-16% (9% | ) | |||||||
| Construction and land development |
35 | Sales comparison | Adjustment for differences between comparable sales |
0%-44% (44% | ) | |||||||
| Foreclosed assets: |
||||||||||||
| Residential real estate |
$ | 399 | Sales comparison | Adjustment for differences between comparable sales |
6%-10% (9% | ) | ||||||
F-67
Table of Contents
Index to Financial Statements
FRANKLIN FINANCIAL NETWORK, INC.
NOTES TO CONSOLIDATED FINANCIAL STATEMENTS
December 31, 2013 and 2012
(Dollar amounts in thousands, except share and per share data)
NOTE 16—FAIR VALUE (Continued)
The carrying amounts and estimated fair values of financial instruments, at December 31, 2013 and December 31, 2012 are as follows:
| Carrying Amount |
Fair Value Measurements at December 31, 2013 Using: |
|||||||||||||||||||
| Level 1 | Level 2 | Level 3 | Total | |||||||||||||||||
| Financial assets |
||||||||||||||||||||
| Cash and cash equivalents |
$ | 18,217 | $ | 18,200 | $ | — | $ | — | $ | 18,200 | ||||||||||
| Interest bearing deposits in financial institutions |
— | — | — | — | — | |||||||||||||||
| Securities available for sale |
268,515 | — | 268,500 | — | 268,500 | |||||||||||||||
| Securities held to maturity |
56,575 | — | 54,000 | — | 54,000 | |||||||||||||||
| Loans held for sale |
10,694 | — | 10,700 | — | 10,700 | |||||||||||||||
| Net loans |
416,404 | — | — | 415,500 | 415,500 | |||||||||||||||
| Restricted equity securities |
3,032 | n/a | n/a | n/a | n/a | |||||||||||||||
| Mortgage servicing rights |
2,640 | — | 3,700 | — | 3,700 | |||||||||||||||
| Accrued interest receivable |
2,396 | — | 1,150 | 1,250 | 2,400 | |||||||||||||||
| Financial liabilities |
||||||||||||||||||||
| Deposits |
$ | 681,300 | $ | 480,000 | $ | 202,300 | $ | — | $ | 682,300 | ||||||||||
| Federal funds purchased and repurchase agreements |
24,291 | — | 24,300 | — | 24,300 | |||||||||||||||
| FHLB advances |
23,000 | — | 23,000 | — | 23,000 | |||||||||||||||
| Accrued interest payable |
222 | 20 | 205 | — | 225 | |||||||||||||||
| Carrying Amount |
Fair Value Measurements at December 31, 2012 Using: |
|||||||||||||||||||
| Level 1 | Level 2 | Level 3 | Total | |||||||||||||||||
| Financial assets |
||||||||||||||||||||
| Cash and cash equivalents |
$ | 24,977 | $ | 25,000 | $ | — | $ | — | $ | 25,000 | ||||||||||
| Interest bearing deposits in financial institutions |
100 | — | 100 | — | 100 | |||||||||||||||
| Securities available for sale |
186,118 | — | 186,100 | — | 186,100 | |||||||||||||||
| Securities held to maturity |
33,815 | — | 34,500 | — | 34,500 | |||||||||||||||
| Loans held for sale |
15,355 | — | 15,600 | — | 15,600 | |||||||||||||||
| Net loans |
295,500 | — | — | 298,300 | 298,300 | |||||||||||||||
| Restricted equity securities |
2,258 | n/a | n/a | n/a | n/a | |||||||||||||||
| Mortgage servicing rights |
2,401 | — | 2,400 | — | 2,400 | |||||||||||||||
| Accrued interest receivable |
1,778 | — | 800 | 1,000 | 1,800 | |||||||||||||||
| Financial liabilities |
||||||||||||||||||||
| Deposits |
$ | 514,643 | $ | 383,200 | $ | 128,700 | $ | — | $ | 511,900 | ||||||||||
| Federal funds purchased and repurchase agreements |
1,602 | — | 1,600 | — | 1,600 | |||||||||||||||
| FHLB advances |
8,000 | — | 8,000 | — | 8,000 | |||||||||||||||
| Accrued interest payable |
308 | 12 | 288 | — | 300 | |||||||||||||||
F-68
Table of Contents
Index to Financial Statements
FRANKLIN FINANCIAL NETWORK, INC.
NOTES TO CONSOLIDATED FINANCIAL STATEMENTS
December 31, 2013 and 2012
(Dollar amounts in thousands, except share and per share data)
NOTE 16—FAIR VALUE (Continued)
The methods and assumptions not previously described used to estimate fair value are described as follows:
(a) Cash and Cash Equivalents: The carrying amounts of cash and short-term instruments approximate fair values and are classified as Level 1.
(b) Loans: Fair values of loans, excluding loans held for sale, are estimated as follows: For variable rate loans that reprice frequently and with no significant change in credit risk, fair values are based on carrying values resulting in a Level 3 classification. Fair values for other loans are estimated using discounted cash flow analyses, using interest rates currently being offered for loans with similar terms to borrowers of similar credit quality resulting in a Level 3 classification. Impaired loans are valued at the lower of cost or fair value as described previously. The methods utilized to estimate the fair value of loans do not necessarily represent an exit price.
The fair value of loans held for sale is estimated based upon binding contracts and quotes from third party investors resulting in a Level 2 classification.
(c) Restricted Equity Securities: It is not practical to determine the fair value of FHLB stock due to restrictions placed on its transferability.
(d) Mortgage Servicing Rights: Fair value of mortgage servicing rights is based on valuation models that calculate the present value of estimated net cash flows based on industry market data. The valuation model incorporates assumptions that market participants would use in estimating future net cash flows resulting in a Level 2 classification.
(e) Deposits: The fair values disclosed for demand deposits (e.g., interest and non-interest checking, passbook savings, and certain types of money market accounts) are, by definition, equal to the amount payable on demand at the reporting date (i.e., their carrying amount) resulting in e a Level 1 classification. The carrying amounts of fixed-term money market accounts approximate their fair values at the reporting date resulting in either a Level 1 classification. Fair values for certificates of deposit are estimated using a discounted cash flows calculation that applies interest rates currently being offered on certificates to a schedule of aggregated expected monthly maturities on time deposits resulting in a Level 2 classification.
(f) Federal Funds Purchased and Repurchase Agreements: The carrying amounts of federal funds purchased, borrowings under repurchase agreements, and other short-term borrowings, generally maturing within ninety days, approximate their fair values resulting in a Level 2 classification.
(g) FHLB Advances: The fair values of the Company’s long-term borrowings are estimated using discounted cash flow analyses based on the current borrowing rates for similar types of borrowing arrangements resulting in a Level 2 classification.
(h) Accrued Interest Receivable/Payable: The carrying amounts of accrued interest approximate fair value resulting in a Level 1 or Level 2 classification based on the asset/liability that they are associated with.
F-69
Table of Contents
Index to Financial Statements
FRANKLIN FINANCIAL NETWORK, INC.
NOTES TO CONSOLIDATED FINANCIAL STATEMENTS
December 31, 2013 and 2012
(Dollar amounts in thousands, except share and per share data)
NOTE 16—FAIR VALUE (Continued)
(i) Off-balance Sheet Instruments: Fair values for off-balance sheet, credit-related financial instruments are based on fees currently charged to enter into similar agreements, taking into account the remaining terms of the agreements and the counterparties’ credit standing. The fair value of commitments is not material.
NOTE 17—PREFERRED STOCK
On September 27, 2011, as part of the SBLF, the Company entered into a Small Business Lending Fund Securities Purchase Agreement (“SBLF Purchase Agreement”) with the United States Department of the Treasury (“Treasury”). Under the SBLF Purchase Agreement, the Company issued 10,000 shares of preferred stock series A to the Treasury. The preferred stock series A shares qualify as Tier 1 capital and will pay quarterly dividends. The initial dividend is 3.96%. As of December 31, 2013, the dividend rate was 1.0%. The dividend rate can fluctuate between 1.0% and 5.0% during the next 8 quarters based on the growth in qualified small business loans. As of December 31, 2013 and 2012, the Company had dividends in arrears of $25 and $8, respectively.
NOTE 18—PARENT COMPANY ONLY CONDENSED FINANCIAL INFORMATION
Condensed financial information of Franklin Financial Network, Inc. follows:
CONDENSED BALANCE SHEETS,
December 31
| 2013 | 2012 | |||||||
| ASSETS |
||||||||
| Cash and cash equivalents |
$ | 718 | $ | 706 | ||||
| Investment in banking subsidiaries |
63,881 | 50,320 | ||||||
| Investment in and advances to other subsidiaries |
275 | 179 | ||||||
| Other assets |
348 | 274 | ||||||
|
|
|
|
|
|||||
| Total assets |
$ | 65,222 | $ | 51,479 | ||||
|
|
|
|
|
|||||
| LIABILITIES AND EQUITY |
||||||||
| Accrued expenses and other liabilities |
$ | 59 | $ | 123 | ||||
| Shareholders’ equity |
65,163 | 51,356 | ||||||
|
|
|
|
|
|||||
| Total liabilities and shareholders’ equity |
$ | 65,222 | $ | 51,479 | ||||
|
|
|
|
|
|||||
F-70
Table of Contents
Index to Financial Statements
FRANKLIN FINANCIAL NETWORK, INC.
NOTES TO CONSOLIDATED FINANCIAL STATEMENTS
December 31, 2013 and 2012
(Dollar amounts in thousands, except share and per share data)
NOTE 18—PARENT COMPANY ONLY CONDENSED FINANCIAL INFORMATION (Continued)
CONDENSED STATEMENTS OF INCOME AND COMPREHENSIVE INCOME (LOSS)
Years ended December 31
| 2013 | 2012 | |||||||
| Dividends from subsidiaries |
$ | 25 | $ | — | ||||
| Other income |
170 | 170 | ||||||
| Other expense |
725 | 610 | ||||||
|
|
|
|
|
|||||
| Loss before income tax and undistributed subsidiary income |
(530 | ) | (440 | ) | ||||
| Income tax benefit |
(175 | ) | (272 | ) | ||||
| Equity in undistributed subsidiary income |
4,916 | 4,308 | ||||||
|
|
|
|
|
|||||
| Net income |
$ | 4,561 | $ | 4,140 | ||||
| Other comprehensive income (loss), net of tax: |
||||||||
| Unrealized gains/losses on securities: |
||||||||
| Unrealized holding loss arising during the period |
$ | (8,763 | ) | $ | (24 | ) | ||
| Reclassification adjustment for gains included in net income |
(88 | ) | (991 | ) | ||||
|
|
|
|
|
|||||
| Net unrealized losses |
(8,851 | ) | (1,015 | ) | ||||
| Tax effect |
3,389 | 177 | ||||||
|
|
|
|
|
|||||
| Total other comprehensive loss |
(5,462 | ) | (838 | ) | ||||
|
|
|
|
|
|||||
| Comprehensive income (loss) |
$ | (901 | ) | $ | 3,302 | |||
|
|
|
|
|
|||||
F-71
Table of Contents
Index to Financial Statements
FRANKLIN FINANCIAL NETWORK, INC.
NOTES TO CONSOLIDATED FINANCIAL STATEMENTS
December 31, 2013 and 2012
(Dollar amounts in thousands, except share and per share data)
NOTE 18—PARENT COMPANY ONLY CONDENSED FINANCIAL INFORMATION (Continued)
CONDENSED STATEMENTS OF CASH FLOWS
Years ended December 31
| 2013 | 2012 | |||||||
| Cash flows from operating activities |
||||||||
| Net income |
$ | 4,561 | $ | 4,140 | ||||
| Adjustments: |
||||||||
| Equity in undistributed subsidiary income |
(4,916 | ) | (4,308 | ) | ||||
| Excess tax benefit related to the exchange of stock options |
(11 | ) | — | |||||
| Stock-based compensation |
81 | 63 | ||||||
| Compensation expense related to common stock issued to 401(k) plan |
10 | 11 | ||||||
| Change in other assets |
(74 | ) | (116 | ) | ||||
| Change in other liabilities |
(53 | ) | 87 | |||||
|
|
|
|
|
|||||
| Net cash from operating activities |
(402 | ) | (123 | ) | ||||
| Cash flows from investing activities |
||||||||
| Investments in subsidiaries |
(13,773 | ) | (1,188 | ) | ||||
|
|
|
|
|
|||||
| Net cash from investing activities |
(13,773 | ) | (1,188 | ) | ||||
| Cash flows from financing activities |
||||||||
| Proceeds from exercise of common stock warrants |
36 | 660 | ||||||
| Proceeds from exercise of common stock options |
58 | — | ||||||
| Stock option exchange, including tax benefit |
11 | — | ||||||
| Proceeds from issuance of common stock, net |
14,191 | — | ||||||
| Dividends paid on preferred stock |
(109 | ) | (458 | ) | ||||
|
|
|
|
|
|||||
| Net cash from financing activities |
14,187 | 202 | ||||||
|
|
|
|
|
|||||
| Net change in cash and cash equivalents |
12 | (1,109 | ) | |||||
| Beginning cash and cash equivalents |
706 | 1,815 | ||||||
|
|
|
|
|
|||||
| Ending cash and cash equivalents |
$ | 718 | $ | 706 | ||||
|
|
|
|
|
|||||
| Non-cash supplemental information: |
||||||||
| Transfers from subsidiary stock based compensation expense to parent company only additional paid-in capital |
$ | 430 | $ | 241 | ||||
F-72
Table of Contents
Index to Financial Statements
FRANKLIN FINANCIAL NETWORK, INC.
NOTES TO CONSOLIDATED FINANCIAL STATEMENTS
December 31, 2013 and 2012
(Dollar amounts in thousands, except share and per share data)
NOTE 19—EARNINGS PER SHARE
The two-class method is used in the calculation of basic and diluted earnings per share. Under the two-class method, earnings available to common shareholders for the period are allocated between common shareholders and participating securities according to dividends declared (or accumulated) and participation rights in undistributed earnings. The factors used in the earnings per share computation follow:
| 2013 | 2012 | |||||||
| Basic |
||||||||
| Net income available to common shareholders |
$ | 4,452 | $ | 3,682 | ||||
| Less: earnings allocated to participating securities |
(20 | ) | — | |||||
|
|
|
|
|
|||||
| Net income allocated to common shareholders |
$ | 4,432 | $ | 3,682 | ||||
|
|
|
|
|
|||||
| Weighted average common shares outstanding including participating securities |
3,933,731 | 3,560,959 | ||||||
| Less: Participating securities |
(17,563 | ) | — | |||||
|
|
|
|
|
|||||
| Average shares |
3,916,168 | 3,560,959 | ||||||
|
|
|
|
|
|||||
| Basic earnings per common share |
$ | 1.13 | $ | 1.03 | ||||
|
|
|
|
|
|||||
| Diluted |
||||||||
| Net income allocated to common shareholders |
$ | 4,432 | $ | 3,682 | ||||
|
|
|
|
|
|||||
| Weighted average common shares outstanding for basic earnings per common share |
3,916,168 | 3,560,959 | ||||||
| Add: Dilutive effects of assumed exercises of stock options |
102,027 | 63,181 | ||||||
| Add: Dilutive effects of assumed exercises of stock warrants |
2,481 | — | ||||||
|
|
|
|
|
|||||
| Average shares and dilutive potential common shares |
4,020,676 | 3,624,140 | ||||||
|
|
|
|
|
|||||
| Diluted earnings per common share |
$ | 1.10 | $ | 1.02 | ||||
|
|
|
|
|
|||||
Stock options and warrants for 124,869 and 513,623 shares of common stock were not considered in computing diluted earnings per common share for 2013 and 2012 because they were anti-dilutive.
NOTE 20—CAPITAL OFFERING
The Company initiated a Private Placement stock offering in September, 2013. The offering was priced at $13.00 per share and was completed during November 2013. Common shares issued as part of the offering totaled 1,153,847. Net proceeds were as follows:
| Gross proceeds |
$ | 15,000 | ||
| Stock offering costs |
(809 | ) | ||
|
|
|
|||
| Proceeds from issuance of common stock, net |
$ | 14,191 | ||
|
|
|
The proceeds of the offering were used primarily to provide the capital to Franklin Synergy Bank to support continued growth.
F-73
Table of Contents
Index to Financial Statements
FRANKLIN FINANCIAL NETWORK, INC.
NOTES TO CONSOLIDATED FINANCIAL STATEMENTS
December 31, 2013 and 2012
(Dollar amounts in thousands, except share and per share data)
NOTE 21—SUBSEQUENT EVENT
On November 20, 2013 Franklin Financial Network, Inc. entered into an “Agreement and Plan of Reorganization and Bank Merger” with MidSouth Bank, in which approximately 2.8 million shares of Company stock will be exchanged for 100% of MidSouth Bank’s common and preferred stock. The acquisition is subject to regulatory and shareholder approval for both companies.
Subsequent to December 31, 2013, the Company has declared cash dividends on preferred shares totaling $25.
F-74
Table of Contents
Index to Financial Statements
MIDSOUTH BANK
Condensed Consolidated Balance Sheets
June 30, 2014 and December 31, 2013
(Unaudited)
| June 30, 2014 |
December 31, 2013 |
|||||||
| (In thousands, except share amounts) |
||||||||
| Assets | ||||||||
| Loans, less allowance for loan losses of $3,296 and $2,799, respectively |
$ | 188,396 | $ | 168,111 | ||||
| Securities available-for-sale, at market (amortized cost of $57,515 and |
57,601 | 77,850 | ||||||
| Loans held for sale |
7,071 | 2,029 | ||||||
| Restricted equity securities |
1,572 | 1,549 | ||||||
| Certificates of deposit at other financial institutions |
250 | 1,732 | ||||||
| Interest-bearing accounts at other financial institutions |
10,946 | 9,355 | ||||||
|
|
|
|
|
|||||
| Total earning assets |
265,836 | 260,626 | ||||||
|
|
|
|
|
|||||
| Cash and due from banks |
1,369 | 2,041 | ||||||
| Bank premises and equipment, net |
8,427 | 8,642 | ||||||
| Bank owned life insurance |
3,144 | 3,090 | ||||||
| Accrued interest receivable |
728 | 851 | ||||||
| Foreclosed assets |
800 | 800 | ||||||
| Other assets |
747 | 570 | ||||||
|
|
|
|
|
|||||
| Total assets |
$ | 281,051 | $ | 276,620 | ||||
|
|
|
|
|
|||||
| Liabilities and Shareholders’ Equity | ||||||||
| Deposits |
$ | 244,242 | $ | 241,948 | ||||
| Securities sold under agreement to repurchase |
893 | 980 | ||||||
| FHLB advance |
6,000 | 5,000 | ||||||
| Accrued interest payable |
40 | 32 | ||||||
| Accounts payable and other liabilities |
1,388 | 993 | ||||||
|
|
|
|
|
|||||
| Total liabilities |
252,563 | 248,953 | ||||||
|
|
|
|
|
|||||
| COMMITMENTS AND CONTINGENCIES |
||||||||
| Shareholders’ equity: |
||||||||
| Preferred stock, par value $1 per share, authorized 20,000,000 shares, 1,259,907 and 1,259,907 issued and outstanding, respectively |
1,260 | 1,260 | ||||||
| Common stock, par value $1 per share, authorized 20,000,000 shares, 3,912,503 and 3,872,923 shares issued and outstanding, respectively |
3,913 | 3,873 | ||||||
| Additional paid-in capital |
39,992 | 39,850 | ||||||
| Deficit |
(16,763 | ) | (15,996 | ) | ||||
| Accumulated other comprehensive income (loss) |
86 | (1,320 | ) | |||||
|
|
|
|
|
|||||
| Total shareholders’ equity |
28,488 | 27,667 | ||||||
|
|
|
|
|
|||||
| Total liabilities and shareholders’ equity |
$ | 281,051 | $ | 276,620 | ||||
|
|
|
|
|
|||||
See accompanying notes to consolidated financial statements (unaudited).
F-75
Table of Contents
Index to Financial Statements
MIDSOUTH BANK
Condensed Consolidated Statements of Earnings (Loss)
Three and Six Months Ended June 30, 2014 and 2013
(Unaudited)
| Three Months Ended June 30, |
Six Months Ended June 30, |
|||||||||||||||
| 2014 | 2013 | 2014 | 2013 | |||||||||||||
| (In thousands, except per share amounts) | ||||||||||||||||
| Interest income: |
||||||||||||||||
| Interest and fees on loans |
$ | 2,331 | $ | 2,021 | $ | 4,538 | $ | 4,035 | ||||||||
| Interest and dividends on taxable securities |
379 | 317 | 827 | 637 | ||||||||||||
| Interest on balances due from depository institutions |
6 | 12 | 13 | 28 | ||||||||||||
| Interest and dividends on restricted equity securities |
19 | 21 | 39 | 41 | ||||||||||||
|
|
|
|
|
|
|
|
|
|||||||||
| Total interest income |
2,735 | 2,371 | 5,417 | 4,741 | ||||||||||||
|
|
|
|
|
|
|
|
|
|||||||||
| Interest expense: |
||||||||||||||||
| Interest on negotiable order of withdrawal accounts |
16 | 15 | 34 | 31 | ||||||||||||
| Interest on money market and other savings accounts |
60 | 55 | 120 | 108 | ||||||||||||
| Interest on certificates of deposit |
121 | 155 | 243 | 337 | ||||||||||||
| Interest on advances from FHLB |
1 | — | 3 | — | ||||||||||||
| Interest on securities sold under agreement to repurchase |
— | — | 1 | 1 | ||||||||||||
|
|
|
|
|
|
|
|
|
|||||||||
| Total interest expense |
198 | 225 | 401 | 477 | ||||||||||||
|
|
|
|
|
|
|
|
|
|||||||||
| Net interest income before provision for loan losses |
2,537 | 2,146 | 5,016 | 4,264 | ||||||||||||
| Provision for loan losses |
350 | — | 350 | — | ||||||||||||
|
|
|
|
|
|
|
|
|
|||||||||
| Net interest income after provision for loan losses |
2,187 | 2,146 | 4,666 | 4,264 | ||||||||||||
|
|
|
|
|
|
|
|
|
|||||||||
| Non-interest income: |
||||||||||||||||
| Service charges on deposits |
84 | 88 | 173 | 177 | ||||||||||||
| Other fees and commissions |
191 | 194 | 374 | 338 | ||||||||||||
| Gain on sale of foreclosed assets, net |
2 | 5 | 5 | 5 | ||||||||||||
| Gain (loss) on sale of available-for-sale securities |
(7 | ) | — | 115 | — | |||||||||||
| Gain on sale of other assets, net |
— | — | 21 | — | ||||||||||||
| Fees on mortgage originations, net |
809 | 495 | 1,012 | 886 | ||||||||||||
| Fees from brokerage operations, net |
193 | 162 | 372 | 312 | ||||||||||||
|
|
|
|
|
|
|
|
|
|||||||||
| Total non-interest income |
1,272 | 944 | 2,072 | 1,718 | ||||||||||||
|
|
|
|
|
|
|
|
|
|||||||||
| Non-interest expense: |
||||||||||||||||
| Employee salaries and benefits |
2,023 | 1,532 | 3,616 | 2,899 | ||||||||||||
| Occupancy expenses, net |
191 | 178 | 365 | 350 | ||||||||||||
| Furniture and equipment expense |
140 | 96 | 252 | 192 | ||||||||||||
| FDIC insurance |
48 | 53 | 102 | 106 | ||||||||||||
| Advertising expense |
56 | 41 | 85 | 76 | ||||||||||||
| Professional fees |
532 | 63 | 884 | 194 | ||||||||||||
| Data processing expense |
593 | 141 | 745 | 288 | ||||||||||||
| Directors fees |
39 | 33 | 72 | 66 | ||||||||||||
| Loss on disposal of fixed assets |
124 | — | 124 | — | ||||||||||||
| Other operating expenses |
726 | 472 | 1,260 | 843 | ||||||||||||
|
|
|
|
|
|
|
|
|
|||||||||
| Total non-interest expense |
4,472 | 2,609 | 7,505 | 5,014 | ||||||||||||
|
|
|
|
|
|
|
|
|
|||||||||
| Earnings (loss) before income taxes |
(1,013 | ) | 481 | (767 | ) | 968 | ||||||||||
| Income taxes |
— | — | — | — | ||||||||||||
|
|
|
|
|
|
|
|
|
|||||||||
| Earnings (loss) |
$ | (1,013 | ) | $ | 481 | $ | (767 | ) | $ | 968 | ||||||
|
|
|
|
|
|
|
|
|
|||||||||
| Basic earnings (loss) per common share |
$ | (0.26 | ) | $ | 0.12 | $ | (0.20 | ) | $ | 0.25 | ||||||
|
|
|
|
|
|
|
|
|
|||||||||
| Diluted earnings (loss) per common share |
$ | (0.15 | ) | $ | 0.07 | $ | (0.11 | ) | $ | 0.15 | ||||||
|
|
|
|
|
|
|
|
|
|||||||||
See accompanying notes to consolidated financial statements (unaudited).
F-76
Table of Contents
Index to Financial Statements
MIDSOUTH BANK
Condensed Consolidated Statements of Comprehensive Earnings (Loss)
Three and Six Months Ended June 30, 2014 and 2013
(Unaudited)
| Three Months Ended June 30, |
Six Months Ended June 30, |
|||||||||||||||
| 2014 | 2013 | 2014 | 2013 | |||||||||||||
| (In Thousands) | ||||||||||||||||
| Earnings (loss) |
$ | (1,013 | ) | $ | 481 | $ | (767 | ) | $ | 968 | ||||||
| Other comprehensive earnings (loss): |
||||||||||||||||
| Change in unrealized gains (losses) on available-for-sale securities arising during period |
700 | (2,003 | ) | 1,541 | (1,973 | ) | ||||||||||
| Less: Reclassification adjustment for losses (gains) included in earnings |
(13 | ) | — | (135 | ) | — | ||||||||||
|
|
|
|
|
|
|
|
|
|||||||||
| Other comprehensive earnings (loss) |
687 | (2,003 | ) | 1,406 | (1,973 | ) | ||||||||||
|
|
|
|
|
|
|
|
|
|||||||||
| Comprehensive earnings (loss) |
$ | (326 | ) | $ | (1,522 | ) | $ | 639 | $ | (1,005 | ) | |||||
|
|
|
|
|
|
|
|
|
|||||||||
See accompanying notes to consolidated financial statements (unaudited).
F-77
Table of Contents
Index to Financial Statements
MIDSOUTH BANK
Condensed Consolidated Statements of Cash Flows
Six Months Ended June 30, 2014 and 2013
Increase (Decrease) in Cash and Cash Equivalents
(Unaudited)
| 2014 | 2013 | |||||||
| (In Thousands) | ||||||||
| Cash flows from operating activities: |
||||||||
| Interest received |
$ | 6,057 | $ | 5,302 | ||||
| Fees received |
1,265 | 827 | ||||||
| Proceeds from sale of loans held for sale |
30,001 | 24,783 | ||||||
| Origination of loans held for sale |
(34,031 | ) | (25,695 | ) | ||||
| Interest paid |
(393 | ) | (480 | ) | ||||
| Cash paid to suppliers and employees |
(7,277 | ) | (4,538 | ) | ||||
|
|
|
|
|
|||||
| Net cash (used in) provided by operating activities |
(4,378 | ) | 199 | |||||
|
|
|
|
|
|||||
| Cash flows from investing activities: |
||||||||
| Purchase of available-for-sale securities |
(6,117 | ) | (8,014 | ) | ||||
| Sale of available-for-sale securities |
24,329 | — | ||||||
| Repayments of mortgage-backed securities |
3,041 | 8,627 | ||||||
| Purchase of restricted equity securities |
(33 | ) | (35 | ) | ||||
| Sale of restricted equity securities |
10 | — | ||||||
| Loans made to customers, net of repayments on loans |
(20,635 | ) | (10,624 | ) | ||||
| Net increases in certificates of deposit at other financial institutions |
— | (250 | ) | |||||
| Net decreases in certificates of deposit at other financial institutions |
1,503 | — | ||||||
| Proceeds from insurance claim on premises |
— | 35 | ||||||
| Purchase of bank-owned life insurance |
— | (3,000 | ) | |||||
| Purchase of premises and equipment |
(153 | ) | (152 | ) | ||||
|
|
|
|
|
|||||
| Net cash provided by (used in) investing activities |
1,945 | (13,413 | ) | |||||
|
|
|
|
|
|||||
| Cash flows from financing activities: |
||||||||
| Net increase in non-interest bearing, savings and NOW deposit accounts |
7,820 | 13,793 | ||||||
| Net decrease in time deposits |
(5,533 | ) | (6,270 | ) | ||||
| Net increase in mortgage escrow deposits |
7 | 24 | ||||||
| Decrease in securities sold under agreement to repurchase |
(87 | ) | (794 | ) | ||||
| Proceeds from FHLB advances |
36,000 | — | ||||||
| Repayments of FHLB advances |
(35,000 | ) | — | |||||
| Proceeds from sale of common stock |
145 | 22 | ||||||
|
|
|
|
|
|||||
| Net cash provided by financing activities |
3,352 | 6,775 | ||||||
|
|
|
|
|
|||||
| Net increase (decrease) in cash and cash equivalents |
919 | (6,439 | ) | |||||
| Cash and cash equivalents at beginning of period |
11,396 | 27,362 | ||||||
|
|
|
|
|
|||||
| Cash and cash equivalents at end of period |
$ | 12,315 | $ | 20,923 | ||||
|
|
|
|
|
|||||
See accompanying notes to consolidated financial statements (unaudited).
F-78
Table of Contents
Index to Financial Statements
MIDSOUTH BANK
Condensed Consolidated Statements of Cash Flows, Continued
Six Months Ended June 30, 2014 and 2013
Increase (Decrease) in Cash and Cash Equivalents
(Unaudited)
| 2014 | 2013 | |||||||
| (In Thousands) | ||||||||
| Reconciliation of (loss) earnings to net cash (used in) provided by operating activities: |
||||||||
| (Loss) earnings |
$ | (767 | ) | $ | 968 | |||
| Adjustments to reconcile earnings to net cash (used in) provided by operating activities: |
||||||||
| Depreciation |
244 | 244 | ||||||
| Provision for loan losses |
350 | — | ||||||
| Loss on disposal of fixed assets |
124 | — | ||||||
| Gain on sale of available-for-sale securities |
(115 | ) | — | |||||
| Gain on sale of certificates of deposit at other financial institutions |
(21 | ) | — | |||||
| Stock option compensation expense |
37 | 6 | ||||||
| Amortization and accretion, net |
517 | 650 | ||||||
| Increase in loans held for sale |
(5,042 | ) | (1,798 | ) | ||||
| Decrease (increase) in accrued interest receivable |
123 | (89 | ) | |||||
| (Increase) decrease in other assets |
(177 | ) | 208 | |||||
| Income from bank-owned life insurance |
(54 | ) | — | |||||
| Increase (decrease) in accrued interest payable |
8 | (3 | ) | |||||
| Increase in accounts payable and other liabilities |
400 | 13 | ||||||
| Deferred gain realized on foreclosed assets |
(5 | ) | — | |||||
|
|
|
|
|
|||||
| Total adjustments |
(3,611 | ) | (769 | ) | ||||
|
|
|
|
|
|||||
| Net cash (used in) provided by operating activities |
$ | (4,378 | ) | $ | 199 | |||
|
|
|
|
|
|||||
| Supplemental Schedule of Non-Cash Activities: |
||||||||
| Unrealized gain (loss) in value of securities available-for-sale |
$ | 1,406 | $ | (1,973 | ) | |||
|
|
|
|
|
|||||
See accompanying notes to consolidated financial statements (unaudited).
F-79
Table of Contents
Index to Financial Statements
MIDSOUTH BANK
Notes to Condensed Consolidated Financial Statements
(Unaudited)
Basis of Presentation
The accompanying consolidated financial statements have been prepared, without audit, pursuant to the rules and regulations of the Board of Governors of the Federal Reserve System. Certain information and footnote disclosures normally included in financial statements prepared in accordance with accounting principles generally accepted in the United States of America have been condensed or omitted pursuant to such rules and regulations. The consolidated financial statements include the financial results of MidSouth Bank and its wholly-owned subsidiary, MSB Services, Inc. (collectively, “the Bank”). All intercompany accounts have been eliminated in consolidation.
In the opinion of management, the consolidated financial statements contain all adjustments (consisting of only normal recurring adjustments) and disclosures necessary to summarize fairly the financial position of the Bank as of June 30, 2014 and December 31, 2013 and the results of operations for the three and six months ended June 30, 2014 and 2013, comprehensive earnings (loss) for the three and six months ended June 30, 2014 and 2013 and changes in cash flows for the six months ended June 30, 2014 and 2013. The interim consolidated financial statements should be read in conjunction with the notes to the consolidated financial statements for the year ended December 31, 2013 included in this prospectus. The results for interim periods are not necessarily indicative of results to be expected for the complete fiscal year.
Certain reclassifications have been made to 2013 financial information to conform to the 2014 presentation. In November 2013, the Bank entered into an Agreement and Plan of Reorganization and Bank Merger (the “Agreement”) with Franklin Financial Network, Inc. (“FFN”) and Franklin Synergy Bank (the “Bank”). The acquisition was announced on November 20, 2013. The acquisition was consummated effective July 1, 2014. At that time, the Bank was merged with the Bank and became part of the FFN holding company.
Critical Accounting Policies
Our accounting and reporting policies are in accordance with accounting principles generally accepted in the United States of America as defined by the Public Company Accounting Oversight Board and conform to general practices accepted within the banking industry. Our most significant accounting policies are presented in the Bank’s December 31, 2013 Form 10-K and the notes to the audited consolidated financial statements contained therein. Certain accounting policies require management to make significant estimates and assumptions that have a material effect on the carrying value of certain assets and liabilities, and we consider these to be critical accounting policies. The estimates and assumptions used are based on historical experience and other factors that management believes to be reasonable under the circumstances. Actual results could differ significantly from these estimates and assumptions, which could have a material impact on the carrying value of assets and liabilities at the balance sheet dates and on our results of operations for the reporting periods.
F-80
Table of Contents
Index to Financial Statements
MIDSOUTH BANK
Notes to Condensed Consolidated Financial Statements
(Unaudited)
Allowance for Loan Losses
The following table documents the activity in, and allocation of, the allowance for loan losses by portfolio segment at June 30, 2014, as follows:
| (In Thousands) |
Commercial, financial and agricultural |
Commercial Real Estate |
Residential Real Estate |
Construction and Land Development |
Multifamily Real Estate |
Consumer and Other |
Total | |||||||||||||||||||||
| Allowance for loan losses: |
||||||||||||||||||||||||||||
| Beginning balance (1/1/2014) |
$ | 174 | $ | 964 | $ | 462 | $ | 1,075 | $ | 13 | $ | 111 | $ | 2,799 | ||||||||||||||
| Charge-offs |
(3 | ) | — | — | — | — | (16 | ) | (19 | ) | ||||||||||||||||||
| Recoveries |
101 | — | 49 | 4 | — | 12 | 166 | |||||||||||||||||||||
| Provisions |
633 | (20 | ) | (323 | ) | 176 | (13 | ) | (103 | ) | 350 | |||||||||||||||||
|
|
|
|
|
|
|
|
|
|
|
|
|
|
|
|||||||||||||||
| Ending balance (6/30/2014) |
$ | 905 | $ | 944 | $ | 188 | $ | 1,255 | $ | — | $ | 4 | $ | 3,296 | ||||||||||||||
|
|
|
|
|
|
|
|
|
|
|
|
|
|
|
|||||||||||||||
| Specific reserves—impaired loans |
$ | 634 | $ | 81 | $ | 106 | $ | 21 | $ | — | $ | — | $ | 842 | ||||||||||||||
| General reserves |
271 | 863 | 82 | 1,234 | — | 4 | 2,454 | |||||||||||||||||||||
|
|
|
|
|
|
|
|
|
|
|
|
|
|
|
|||||||||||||||
| Total |
$ | 905 | $ | 944 | $ | 188 | $ | 1,255 | $ | — | $ | 4 | $ | 3,296 | ||||||||||||||
|
|
|
|
|
|
|
|
|
|
|
|
|
|
|
|||||||||||||||
| Loans individually evaluated for impairment |
$ | 4,019 | $ | 2,269 | $ | 814 | $ | 118 | $ | — | $ | — | $ | 7,220 | ||||||||||||||
| Loans collectively evaluated for impairment |
16,617 | 81,271 | 39,803 | 44,023 | 888 | 1,870 | 184,472 | |||||||||||||||||||||
|
|
|
|
|
|
|
|
|
|
|
|
|
|
|
|||||||||||||||
| Total |
$ | 20,636 | $ | 83,540 | $ | 40,617 | $ | 44,141 | $ | 888 | $ | 1,870 | $ | 191,692 | ||||||||||||||
|
|
|
|
|
|
|
|
|
|
|
|
|
|
|
|||||||||||||||
The following table documents the activity in, and allocation of, the allowance for loan losses by portfolio segment at December 31, 2013, as follows:
| (In Thousands) |
Commercial, financial and agricultural |
Commercial Real Estate |
Residential Real Estate |
Construction and Land Development |
Multifamily Real Estate |
Consumer and Other |
Total | |||||||||||||||||||||
| Allowance for loan losses: |
||||||||||||||||||||||||||||
| Beginning balance (1/1/2013) |
$ | 549 | $ | 964 | $ | 519 | $ | 1,006 | $ | 13 | $ | 37 | $ | 3,088 | ||||||||||||||
| Charge-offs |
(569 | ) | — | (96 | ) | (35 | ) | — | (16 | ) | (716 | ) | ||||||||||||||||
| Recoveries |
194 | — | 39 | 104 | — | 90 | 427 | |||||||||||||||||||||
| Provisions |
— | — | — | — | — | — | — | |||||||||||||||||||||
|
|
|
|
|
|
|
|
|
|
|
|
|
|
|
|||||||||||||||
| Ending balance (12/31/2013) |
$ | 174 | $ | 964 | $ | 462 | $ | 1,075 | $ | 13 | $ | 111 | $ | 2,799 | ||||||||||||||
|
|
|
|
|
|
|
|
|
|
|
|
|
|
|
|||||||||||||||
| Specific reserves—Impaired Loans |
$ | 136 | $ | 111 | $ | 34 | $ | 31 | $ | — | $ | — | $ | 312 | ||||||||||||||
| General reserves |
38 | 853 | 428 | 1,044 | 13 | 111 | 2,487 | |||||||||||||||||||||
|
|
|
|
|
|
|
|
|
|
|
|
|
|
|
|||||||||||||||
| Total |
$ | 174 | $ | 964 | $ | 462 | $ | 1,075 | $ | 13 | $ | 111 | $ | 2,799 | ||||||||||||||
|
|
|
|
|
|
|
|
|
|
|
|
|
|
|
|||||||||||||||
| Loans individually evaluated for impairment |
$ | 1,384 | $ | 1,534 | $ | 771 | $ | 1,042 | $ | — | $ | — | $ | 4,731 | ||||||||||||||
| Loans collectively evaluated for impairment |
19,724 | 77,947 | 39,156 | 25,344 | 2,419 | 1,589 | 166,179 | |||||||||||||||||||||
|
|
|
|
|
|
|
|
|
|
|
|
|
|
|
|||||||||||||||
| Total |
$ | 21,108 | $ | 79,481 | $ | 39,927 | $ | 26,386 | $ | 2,419 | $ | 1,589 | $ | 170,910 | ||||||||||||||
|
|
|
|
|
|
|
|
|
|
|
|
|
|
|
|||||||||||||||
F-81
Table of Contents
Index to Financial Statements
MIDSOUTH BANK
Notes to Condensed Consolidated Financial Statements
(Unaudited)
The provision for loan losses represents a charge to earnings necessary, after loan charge-offs and recoveries, to maintain the allowance for loan losses at an appropriate level which is adequate to absorb estimated losses inherent in the loan portfolio. Such estimated losses arise primarily from the loan portfolio but may also result from other sources, including commitments to extend credit and letters of credit. The level of the allowance is determined on a monthly basis using procedures which include: (1) categorizing commercial and commercial real estate loans into risk categories to estimate loss probabilities based primarily on the historical loss experience of those risk categories and current economic conditions; (2) analyzing significant commercial and commercial real estate credits and calculating specific reserves as necessary; (3) assessing various homogeneous consumer loan categories to estimate loss probabilities based primarily on historical loss experience; and (4) considering various other factors, such as changes in credit concentrations, loan mix, and economic conditions which may not be specifically quantified in the loan analysis process.
There was $350 in provision for loan losses recorded for the first six months of 2014, and no provision for loss losses was recorded for the first six months of 2013. Management’s calculation of the Bank’s allowance for loan losses shows the Bank’s allowance as being adequate, and management believes it has properly identified and handled deteriorating relationships during the past year. While troubled loan relationships continue to exist, the amount of troubled loans in the portfolio has continued to decrease. The Bank’s volume of recoveries has also reduced the need for additional loan loss provisions up until the second quarter of 2014, when the Bank’s loan growth and the change in the status of one significant loan relationship required management to record a provision.
There was $350 in loan loss provisions recorded for the three months ended June 30, 2014, and no provisions were recorded for the same period in 2013. As previously stated above, the calculation of the Bank’s allowance for loan losses at June 30, 2014 shows the Bank’s allowance as being adequate after recording $350 of provisions during the second quarter of 2014.
The allowance for loan losses consists of an allocated portion and an unallocated, or general, portion. The allocated portion is maintained to cover estimated losses applicable to specific relationships in the loan portfolio. The unallocated portion is maintained to absorb losses which probably exist as of the evaluation date but are not identified by the more objective processes used for the allocated portion of the allowance due to risk of errors or imprecision. While the total allowance consists of an allocated portion and an unallocated portion, these terms are primarily used to describe a process. Both portions of the allowance are available to provide for inherent loss in the entire portfolio.
The allowance for loan losses is increased by provisions for loan losses charged to expense and is reduced by loans charged off net of recoveries on loans previously charged off. The provision is based on management’s determination of the amount of the allowance necessary to provide for estimated loan losses based on its evaluation of the loan portfolio. Determining the appropriate level of the allowance and the amount of the provision involves uncertainties and matters of judgment and therefore cannot be determined with precision. At June 30, 2014 and at December 31, 2013, the allowance represented 1.72% and 1.64% of total loans, respectively.
Stock Option Arrangement
In October, 2004, the shareholders of the Bank approved the MidSouth Bank 2004 Stock Option Arrangement (the “Arrangement”). The Arrangement provides for the granting of stock options, and authorized the issuance of common stock upon the exercise of such options, for up to 380,000 shares of common stock to employees and organizers of the Bank and up to 143,080 shares of common stock for future use as decided by the
F-82
Table of Contents
Index to Financial Statements
MIDSOUTH BANK
Notes to Condensed Consolidated Financial Statements
(Unaudited)
Directors of the Bank. Under the Arrangement, stock option awards were granted in the form of incentive stock options or non-statutory stock options, and were generally exercisable for up to ten years following the date such option awards are granted. Exercise prices of incentive stock options must be equal to or greater than 100% of the fair market value of the common stock on the grant date and generally vest at the end of four years. Certain option awards provide for accelerated vesting if there is a change in control (as defined in the Arrangement).
During 2012, the Board of Directors of MidSouth Bank evaluated the Bank’s financial improvement since 2009, and to reward and incent the Bank’s personnel and directors for the progress made by the Bank during the recessionary period, the Board elected to modify the exercise price of the options that were outstanding at November 30, 2012 to $3.65 per share. This was done through the issuance of amendments to the original stock option agreements, and the value was based upon a valuation of the Bank’s stock that was conducted by an independent third party located outside the Bank’s local market. As of November 30, 2012, 334,800 stock options were repriced.
In addition to modifying the exercise price of the options, the outstanding options became non-qualifying stock options, and a new vesting schedule was established for the options. The new vesting schedule was established as 20% vesting each year on December 31, with the first vesting occurring on December 31, 2012 and the vesting period extending through December 31, 2016. The expiration date of the options was also modified to December 31, 2032.
As of June 30, 2014, 495,000 options had been granted of which 41,700 have been exercised and 131,000 have been forfeited. Options that are forfeited revert to the Arrangement and can be granted again in the future. As of June 30, 2014, 128,920 options were exercisable. The weighted average exercise prices for both outstanding and exercisable stock options as of June 30, 2014 were $3.65. The weighted average remaining contractual terms of outstanding and exercisable stock options as of June 30, 2014 were both 18.5 years. There was no intrinsic value of stock options exercised at June 30, 2014, since no options were exercised during the period. As of June 30, 2014, there were total no unrecognized compensation costs related to non-vested share-based compensation arrangements granted under the Arrangement due to immediate vesting of stock options related to the Bank’s impending acquisition by Franklin Synergy Bank effective July 1, 2014. Compensation expense related to stock options totaled $37 and $6 for the six months ended June 30, 2014 and 2013, respectively. Compensation expense related to stock options totaled $34 and $3 for the three months ended June 30, 2014 and 2013, respectively.
Preferred Stock
On December 31, 2009, the Bank initiated an offering of shares of non-cumulative convertible Series 2009A Preferred Stock. The sales of this series of preferred stock resulted in the issuance of 1,024,728 shares of Series 2009A Preferred Stock, which amounted to additional capital of $4,983, net of stock issuance costs. The liquidation preference for the Series 2009A Preferred Stock is $5.00 per share, and this series of preferred stock is non-redeemable. Each share of Series 2009A Preferred Stock is convertible into two shares of the Bank’s common stock by the shareholder at any time, but if not converted voluntarily by the shareholder, each share of this preferred stock will automatically convert into two shares of the Bank’s common stock on March 31, 2015, subject to certain limitations. To date, 7,171 shares of Series 2009A Preferred Stock has been converted into 14,342 shares of common stock. There were 1,017,557 shares of Series 2009A Preferred Stock outstanding as of June 30, 2014.
Additionally, anyone who purchased the Series 2009A Preferred Stock received one detachable warrant to purchase one share of the Bank’s common stock for every five shares of the Series 2009A Preferred Stock that they purchased. These detachable warrants and their related terms are discussed further below.
F-83
Table of Contents
Index to Financial Statements
MIDSOUTH BANK
Notes to Condensed Consolidated Financial Statements
(Unaudited)
On March 22, 2011, the Bank initiated an offering of shares of non-cumulative convertible Series 2011-A Preferred Stock that ended on June 30, 2011. The sales of this series of preferred stock resulted in the issuance of 242,350 shares of Series 2011-A Preferred Stock, which amounted to additional capital of $1,325, net of stock issuance costs. The liquidation preference for the Series 2011-A Preferred Stock is $5.00 per share, and this series of preferred stock is non-redeemable. Each share of Series 2011-A Preferred Stock is convertible into two shares of the Bank’s common stock by the shareholder at any time, but if not converted voluntarily by the shareholder, each share of this preferred stock will automatically convert into two shares of the Bank’s common stock on May 31, 2016, subject to certain limitations. To date, there have been no voluntary conversions of Series 2011-A Preferred Stock. There were 242,350 shares of Series 2011-A Preferred Stock outstanding as of June 30, 2014.
Anyone who purchased the Series 2011-A Preferred Stock received one detachable warrant to purchase one share of the Bank’s common stock for every five shares of the Series 2011-A Preferred Stock that they purchased. These detachable warrants and their related terms are discussed further below.
Stock Warrants
Detachable Warrants Issued with Preferred Stock
As part of the original offering of Series 2009A Preferred Stock, for every five shares of Series 2009A Preferred Stock purchased, the shareholder received one detachable warrant which provides the shareholder the ability to purchase one share of common stock. The purchase price for the common stock shares from these warrants is equal to 75% of the fully converted book value of the Bank’s common stock as of the previous quarter-end date (unaudited). The exercise price cannot, however, exceed $10.00 per share or be less than $2.50 per share. The exercise price for these warrants as of June 30, 2014 was $3.32 per share based on a fully converted book value of $4.43 as of June 30, 2014. For each recipient, the warrants received are required to be exercised by March 31, 2016. At that time the warrants will expire. A total of 204,939 warrants were issued with the Series 2009A Preferred Stock, and through June 30, 2014, 14,898 of the Series 2009A warrants have been exercised. There were 190,041 Series 2009A warrants outstanding as of June 30, 2014.
Also, as part of the offering of Series 2011-A Preferred Stock, for every five shares of Series 2011-A Preferred Stock purchased, the shareholder received one detachable warrant which provides the shareholder the ability to purchase one share of common stock. The purchase price for the common stock shares from these warrants is equal to 85% of the fully converted book value of the Bank’s common stock as of the previous quarter-end date (unaudited). The exercise price cannot, however, exceed $11.00 per share or be less than $2.75 per share. The purchase price for these warrants as of June 30, 2014 was $3.77 per share based on a fully converted book value of $4.43 as of June 30, 2014. For each recipient, the warrants received are required to be exercised by May 31, 2017. At that time the warrants will expire. A total of 48,469 warrants were issued with the Series 2011-A Preferred Stock, and through June 30, 2014, 41,328 of those warrants have been exercised. There were 7,141 Series 2011-A warrants outstanding as of June 30, 2014.
Upon consummation of the pending acquisition by FFN/the Bank, all outstanding Series 2009A and Series 2011-A warrants will receive merger consideration in the form of the number of shares of FFN Common Stock equal to: (1) $5.75 less the strike price of the warrants at the consummation date (2) divided by $13.50.
F-84
Table of Contents
Index to Financial Statements
MIDSOUTH BANK
Notes to Condensed Consolidated Financial Statements
(Unaudited)
Earnings Per Share
The following is a summary of the components comprising basic and diluted earnings per common share of stock (EPS):
| Three Months Ended | Six Months Ended | |||||||||||||||
| (In Thousands, except share and per share amounts) |
June 30, 2014 |
June 30, 2013 |
June 30, 2014 |
June 30, 2013 |
||||||||||||
| Basic EPS Computation: |
||||||||||||||||
| Numerator—Earnings (loss) for the period |
$ | (1,013 | ) | $ | 481 | $ | (767 | ) | $ | 968 | ||||||
| Denominator—Weighted average number of common shares outstanding |
3,910,784 | 3,864,951 | 3,898,539 | 3,860,572 | ||||||||||||
|
|
|
|
|
|
|
|
|
|||||||||
| Basic earnings (loss) per common share |
$ | (0.26 | ) | $ | 0.12 | $ | (0.20 | ) | $ | 0.25 | ||||||
|
|
|
|
|
|
|
|
|
|||||||||
| Three Months Ended | Six Months Ended | |||||||||||||||
| Diluted EPS Computation: |
||||||||||||||||
| Numerator—Earnings (loss) for the period |
$ | (1,013 | ) | $ | 481 | $ | (767 | ) | $ | 968 | ||||||
| Denominator—Weighted average number of common shares outstanding |
3,910,784 | 3,864,951 | 3,898,539 | 3,860,572 | ||||||||||||
| Dilutive effect of preferred stock conversions |
2,519,814 | 2,525,837 | 2,519,814 | 2,527,985 | ||||||||||||
| Dilutive effect of warrants |
104,359 | 53,147 | 109,744 | 53,437 | ||||||||||||
| Dilutive effect of stock options |
152,526 | 38,296 | 151,806 | 38,096 | ||||||||||||
|
|
|
|
|
|
|
|
|
|||||||||
| Denominator—Adjusted weighted average number of common shares outstanding |
6,687,483 | 6,482,231 | 6,679,903 | 6,480,090 | ||||||||||||
|
|
|
|
|
|
|
|
|
|||||||||
| Diluted earnings (loss) per common share |
$ | (0.15 | ) | $ | 0.07 | $ | (0.11 | ) | $ | 0.15 | ||||||
|
|
|
|
|
|
|
|
|
|||||||||
Fair Value Measurements and Fair Value of Financial Instruments
The Bank measures fair value in accordance with ASC 820, “Fair Value Measurements and Disclosures,” which establishes a fair value hierarchy and requires an entity to maximize the use of observable inputs and minimize the use of unobservable inputs when measuring fair value. The standard describes three levels of inputs that may be used to measure fair value:
| Level 1: | Quoted prices (unadjusted) or identical assets or liabilities in active markets that the entity has the ability to access as of the measurement date. | |
| Level 2: | Significant other observable inputs other than Level 1 prices such as quoted prices for similar assets or liabilities; quoted prices in markets that are not active; or other inputs that are observable or can be corroborated by observable market data. | |
| Level 3: | Significant unobservable inputs that reflect a reporting entity’s own assumptions about the assumptions that market participants would use in pricing an asset or liability. | |
F-85
Table of Contents
Index to Financial Statements
MIDSOUTH BANK
Notes to Condensed Consolidated Financial Statements
(Unaudited)
Assets and Liabilities Measured on a Recurring Basis
Assets and liabilities measured at fair value on a recurring basis are summarized below:
| Fair Value Measurements at June 30, 2014 Using | ||||||||||||||||
| (In Thousands) |
Carrying Value at June 30, 2014 |
Quoted Prices in Active Markets for Identical Assets (Level 1) |
Significant Other Observable Inputs (Level 2) |
Significant Unobservable Inputs (Level 3) |
||||||||||||
| Assets: |
||||||||||||||||
| Securities available-for-sale |
$ | 57,601 | — | 56,499 | 1,102 | |||||||||||
| Cash surrender value of bank-owned life insurance |
3,144 | — | — | 3,144 | ||||||||||||
| Fair Value Measurements at December 31, 2013 Using | ||||||||||||||||
| (In Thousands) |
Carrying Value at December 31, 2013 |
Quoted Prices in Active Markets for Identical Assets (Level 1) |
Significant Other Observable Inputs (Level 2) |
Significant Unobservable Inputs (Level 3) |
||||||||||||
| Assets: |
||||||||||||||||
| Securities available-for-sale |
$ | 77,850 | 13,134 | 64,716 | — | |||||||||||
| Cash surrender value of bank-owned life insurance |
3,090 | — | — | 3,090 | ||||||||||||
Available-for-sale securities are measured on a recurring basis and are obtained from an independent pricing service. The fair values are based on quoted market prices of comparable securities, broker quotes or comprehensive interest rate tables and pricing matrices.
The following table presents a reconciliation and income statement classification of gains and losses for all financial assets measured at fair value on a recurring basis using significant unobservable inputs (Level 3) for the six months ended June 30, 2014 and the year ended December 31, 2013:
Fair Value Measurements Using Significant Unobservable Inputs (Level 3)
| Carrying Value | ||||||||
| (In Thousands) |
Six Months Ended June 30, 2014 |
Year Ended December 31, 2013 |
||||||
| Opening Balance, January 1 |
$ | 3,090 | $ | — | ||||
| Total unrealized gains (losses) included in: |
||||||||
| Net Income |
54 | 90 | ||||||
| Other comprehensive income |
— | — | ||||||
| Purchases, sales, issuances and settlements, net |
— | 3,000 | ||||||
| Transfers in and (out) of level three |
1,102 | — | ||||||
|
|
|
|
|
|||||
| Ending Balance |
$ | 4,246 | $ | 3,090 | ||||
|
|
|
|
|
|||||
F-86
Table of Contents
Index to Financial Statements
MIDSOUTH BANK
Notes to Condensed Consolidated Financial Statements
(Unaudited)
Financial Assets and Liabilities Measured on a Non-Recurring Basis
The following tables present financial assets and liabilities measured at fair value on a non-recurring basis as of June 30, 2014 and December 31, 2013:
| Fair Value Measurements at June 30, 2014 Using | ||||||||||||||||
| (In Thousands) |
Carrying Value at June 30, 2014 |
Quoted Prices in Active Markets for Identical Assets (Level 1) |
Significant Other Observable Inputs (Level 2) |
Significant Unobservable Inputs (Level 3) |
||||||||||||
| Assets: |
||||||||||||||||
| Impaired loans, net |
$ | 6,378 | $ | — | $ | — | $ | 6,378 | ||||||||
| Loans held for sale |
7,071 | — | 7,071 | — | ||||||||||||
| Fair Value Measurements at December 31, 2013 Using | ||||||||||||||||
| (In Thousands) |
Carrying Value at December 31, 2013 |
Quoted Prices in Active Markets for Identical Assets (Level 1) |
Significant Other Observable Inputs (Level 2) |
Significant Unobservable Inputs (Level 3) |
||||||||||||
| Assets: |
||||||||||||||||
| Impaired loans, net |
$ | 4,419 | $ | — | $ | — | $ | 4,419 | ||||||||
| Loans held for sale |
2,029 | — | 2,029 | — | ||||||||||||
Impaired loan balances in the table above represent those collateral-dependent loans where management has estimated the credit loss by comparing the loans’ carrying values against the expected realized fair values of the collateral securing those loans. Impaired loans, which are measured for impairment using the fair value of the collateral for collateral dependent loans, had carrying amounts of $7,220 and $4,731 as of June 30, 2014 and December 31, 2013, respectively, with valuation allowances of $842 and $312 as of June 30, 2014 and December 31, 2013, respectively.
Loans held for sale, which are carried at the lower of cost or fair value, did not have an impairment charge for the first six months of 2014 or for the year ended December 31, 2013.
Non-Financial Assets and Liabilities Measured on a Non-Recurring Basis
The following tables represent nonfinancial assets and liabilities measured at fair value on a non-recurring basis as of June 30, 2014 and December 31, 2013. The valuation methodology used to measure the fair value of foreclosed assets is described below.
| Fair Value Measurements at June 30, 2014 Using | ||||||||||||||||
| (In Thousands) |
Carrying Value at June 30, 2014 |
Quoted Prices in Active Markets for Identical Assets (Level 1) |
Significant Other Observable Inputs (Level 2) |
Significant Unobservable Inputs (Level 3) |
||||||||||||
| Assets: |
||||||||||||||||
| Foreclosed assets |
$ | 800 | $ | — | $ | — | $ | 800 | ||||||||
F-87
Table of Contents
Index to Financial Statements
MIDSOUTH BANK
Notes to Condensed Consolidated Financial Statements
(Unaudited)
| Fair Value Measurements at December 31, 2013 Using | ||||||||||||||||
| (In Thousands) |
Carrying Value at December 31, 2013 |
Quoted Prices in Active Markets for Identical Assets (Level 1) |
Significant Other Observable Inputs (Level 2) |
Significant Unobservable Inputs (Level 3) |
||||||||||||
| Assets: |
||||||||||||||||
| Foreclosed assets |
$ | 800 | $ | — | $ | — | $ | 800 | ||||||||
Foreclosed assets are valued at the time the loan is foreclosed upon, and the asset is transferred to foreclosed assets. The value is based primarily on third party appraisals, less costs to sell. The appraisals are generally discounted based on management’s historical knowledge, changes in market conditions from the time of valuation, and/or management’s expertise and knowledge of the customer and the customer’s business. Such discounts are typically significant and result in a Level 3 classification of the inputs for determining fair value. Foreclosed assets are reviewed and evaluated on at least an annual basis for additional impairment and adjusted accordingly, based on the same factors identified above. Foreclosed assets had a carrying amount of $1,200 with a valuation allowance of $400 at June 30, 2014 and at December 31, 2013.
Fair Value of Financial Instruments
Fair value estimates, methods, and assumptions are set forth below for the Bank’s financial instruments.
Cash and short-term investments
For those short-term instruments, the carrying amount is a reasonable estimate of fair value.
Certificates of Deposit at Other Financial Institutions
Fair values for certificates of deposit at other financial institutions are estimated using a discounted cash flow analysis that applies interest currently being offered on certificates to a schedule of aggregated contractual maturities on such instruments.
Restricted Equity Securities
The carrying amount for these securities is a reasonable estimate of their fair value.
Securities
The carrying amounts for short-term securities approximate fair value because they mature in 90 days or less and do not present unanticipated credit concerns. The fair value of longer-term securities and mortgage-backed securities, except certain state and municipal securities, is estimated based on bid prices published in financial newspapers or bid quotations received from securities dealers. The fair value of certain state and municipal securities is not readily available through market sources other than dealer quotations, so fair value estimates are based on quoted market prices of similar instruments, adjusted for differences between the quoted instruments and the instruments being valued.
Fair values should be calculated based on the value of one unit without regard to any premium or discount that may result from concentrations of ownership of a financial instrument, possible tax ramifications, or estimated transaction costs. Accordingly, these considerations have not been incorporated into the fair value estimates.
F-88
Table of Contents
Index to Financial Statements
MIDSOUTH BANK
Notes to Condensed Consolidated Financial Statements
(Unaudited)
Loans
Fair values are estimated for portfolios of loans with similar financial characteristics. Loans are segregated by type such as commercial, mortgage and other consumer. Each loan category is further segmented into fixed and adjustable rate interest terms.
The fair value of the various categories of loans is estimated by discounting the future cash flows using the current rates at which similar loans would be made to borrowers with similar credit ratings and for the same remaining average estimated maturities.
The estimated maturity for mortgages is modified from the contractual terms to give consideration to management’s experience with prepayments. Management has made estimates of fair value discount rates that it believes to be reasonable. However, because there is no market for many of these financial instruments, management has no basis to determine whether the fair value presented below would be indicative of the value negotiated in an actual sale.
The value of the loan portfolio is also discounted in consideration of the credit quality of the loan portfolio as would be the case between willing buyers and sellers. Particular emphasis has been given to loans on the Bank’s internal watch list. Valuation of these loans is based upon borrower performance, collateral values (including external appraisals), and on comparable objective information and subjective internal assessments.
Loans Held for Sale
These instruments are carried in the consolidated balance sheets at the lower of cost or market value. The fair values of these instruments are based on subsequent liquidation values of the instruments which did not result in any significant gains or losses.
Deposit Liabilities
The fair value of demand deposits, savings accounts and certain money market deposits is the amount payable on demand at the reporting date. The fair value of fixed-maturity certificates of deposit is estimated using the rates currently offered for deposits of similar remaining maturities. The fair value estimates for deposits does not include the benefit that results from the low cost funding provided by the deposit liabilities compared to the cost of borrowing funds in the market.
Advances from FHLB
Short-Term Advances
The carrying amounts of short-term advances approximate fair value as they mature within 90 days.
Securities Sold Under Agreement to Repurchase
The carrying amounts approximate fair values as repurchase agreements are overnight instruments.
F-89
Table of Contents
Index to Financial Statements
MIDSOUTH BANK
Notes to Condensed Consolidated Financial Statements
(Unaudited)
Commitments to Extend Credit, Standby Letters of Credit and Financial Guarantees Written
Loan commitments are made to customers generally for a period not to exceed one year and at the prevailing interest rates in effect at the time the loan is closed. Commitments to extend credit related to construction loans are made for a period not to exceed one year with interest rates at the current market rate at the date of closing. In addition, standby letters of credit are issued for periods extending from one to two years with rates to be determined at the date the letter of credit is funded. Fees are only charged for the construction loans and the standby letters of credit and the amounts unearned at June 30, 2014, are insignificant. Accordingly, these commitments have no carrying value and management estimates the commitments to have no significant fair value.
The carrying values and estimated fair values of the Bank’s financial instruments at June 30, 2014 and December 31, 2013 are as follows:
| (In Thousands) |
Carrying amount |
Estimated fair value |
Quoted market prices in an active market (Level 1) |
Models with significant observable market parameters (Level 2) |
Models with Significant unobservable market Parameters (Level 3) |
|||||||||||||||
| June 30, 2014 |
||||||||||||||||||||
| Financial assets: |
||||||||||||||||||||
| Certificates of deposit at other financial institutions |
$ | 250 | $ | 254 | $ | — | $ | — | $ | 254 | ||||||||||
| Restricted equity securities |
1,572 | 1,572 | — | — | 1,572 | |||||||||||||||
| Loans, net of allowance |
188,396 | 184,345 | — | — | 184,345 | |||||||||||||||
| Financial liabilities: |
||||||||||||||||||||
| Deposits |
244,242 | 243,453 | — | — | 243,453 | |||||||||||||||
| Securities sold under agreement to repurchase |
893 | 893 | — | — | 893 | |||||||||||||||
| Off balance sheet instruments: |
||||||||||||||||||||
| Commitments to extend credit |
— | — | — | — | — | |||||||||||||||
| Standby letters of credit |
— | — | — | — | — | |||||||||||||||
| (In Thousands) |
Carrying amount |
Estimated fair value |
Quoted market prices in an active market (Level 1) |
Models with significant observable market parameters (Level 2) |
Models with Significant unobservable market Parameters (Level 3) |
|||||||||||||||
| December 31, 2013 |
||||||||||||||||||||
| Financial assets: |
||||||||||||||||||||
| Certificates of deposit at other financial institutions |
$ | 1,732 | $ | 1,763 | $ | — | $ | — | $ | 1,763 | ||||||||||
| Restricted equity securities |
1,549 | 1,549 | — | — | 1,549 | |||||||||||||||
| Loans, net of allowance |
168,111 | 169,933 | — | — | 169,933 | |||||||||||||||
| Financial liabilities: |
||||||||||||||||||||
| Deposits |
241,948 | 241,939 | — | — | 241,939 | |||||||||||||||
| FHLB advance |
5,000 | 5,000 | — | — | 5,000 | |||||||||||||||
| Securities sold under agreement to repurchase |
980 | 980 | — | — | 980 | |||||||||||||||
| Off balance sheet instruments: |
||||||||||||||||||||
| Commitments to extend credit |
— | — | — | — | — | |||||||||||||||
| Standby letters of credit |
— | — | — | — | — | |||||||||||||||
F-90
Table of Contents
Index to Financial Statements
MIDSOUTH BANK
Notes to Condensed Consolidated Financial Statements
(Unaudited)
Limitations
Fair value estimates are made at a specific point in time, based on relevant market information and information about the financial instruments. These estimates do not reflect any premium or discount that could result from offering for sale at one time the Bank’s entire holdings of a particular financial instrument. Because no market exists for a significant portion of the Bank’s financial instruments, fair value estimates are based on judgments regarding future expected loss experience, current economic conditions, risk characteristics of various financial instruments, and other factors. These estimates are subjective in nature and involve uncertainties and matters of significant judgment and therefore cannot be determined with precision. Changes in assumptions could significantly affect the estimates.
Estimated fair values are consistent with an exit-price concept. The assumptions used are intended to approximate those that a market-participant would realize in a hypothetical orderly transaction.
Fair value estimates are based on estimating on-and-off-balance sheet financial instruments without attempting to estimate the value of anticipated future business and the value of assets and liabilities that are not considered financial instruments. Other significant assets and liabilities that are not considered financial assets or liabilities include deferred tax assets and liabilities and property, plant and equipment. In addition, the tax ramifications related to the realization of the unrealized gains and losses can have a significant effect on fair value estimates and have not been considered in the estimates.
Recent Accounting Pronouncements
In January 2014, the Financial Accounting Standards Board (the “FASB”) issued ASU No. 2014-04, “Receivables—Troubled Debt Restructurings by Creditors (Subtopic 310-40): Reclassification of Residential Real Estate Collateralized Consumer Mortgage Loans upon Foreclosure.” The objective of this guidance is to clarify when an in substance repossession or foreclosure occurs, that is, when a creditor should be considered to have received physical possession of residential real estate property collateralizing a consumer mortgage loan such that the loan receivable should be derecognized and the real estate property recognized. ASU No. 2014-04 states that an in substance repossession or foreclosure occurs, and a creditor is considered to have received physical possession of residential real estate property collateralizing a consumer mortgage loan, upon either (1) the creditor obtaining legal title to the residential real estate property upon completion of a foreclosure or (2) the borrower conveying all interest in the residential real estate property to the creditor to satisfy that loan through completion of a deed in lieu of foreclosure or through a similar legal agreement. Additionally, ASU No. 2014-04 requires interim and annual disclosure of both (1) the amount of foreclosed residential real estate property held by the creditor and (2) the recorded investment in consumer mortgage loans collateralized by residential real estate property that are in the process of foreclosure according to local requirements of the applicable jurisdiction. ASU No. 2014-04 is effective for interim and annual reporting periods beginning after December 15, 2014. The adoption of ASU No. 2014-04 is not expected to have a material impact on the Bank’s consolidated financial statements.
F-91
Table of Contents
Index to Financial Statements
MIDSOUTH BANK
Consolidated Financial Statements
December 31, 2013, 2012 and 2011
(With Independent Auditor’s Report Thereon)
F-92
Table of Contents
Index to Financial Statements

Murfreesboro, Tennessee
Management Report on Internal Control Over Financial Reporting
The management of MidSouth Bank (the Bank) is responsible for establishing and maintaining adequate internal control over financial reporting. The Bank’s internal control system was designed to provide reasonable assurance to MidSouth Bank’s management and board of directors regarding the preparation and fair presentation of published financial statements. All internal control systems, no matter how well designed, have inherent limitations. Therefore, even those systems determined to be effective can provide only reasonable assurance with respect to financial statement preparation and presentation.
MidSouth Bank’s management assessed the effectiveness of the Bank’s internal control over financial reporting as of December 31, 2013. In making this assessment, it used the criteria set forth by the Committee of Sponsoring Organizations of the Treadway Commission (COSO) in “Internal Control—Integrated Framework (1992).” Based on our assessment we believe that, as of December 31, 2013, the Bank’s internal control over financial reporting is effective based on those criteria.
The Bank’s independent registered public accounting firm is not required to issue, and has not issued, any audit report on management’s assessment of the Bank’s internal control over financial reporting.
|
|

| |
| Lee M. Moss | Kevin D. Busbey | |
| Chairman & Chief Executive Officer | Chief Financial Officer (Principal financial and principal accounting officer) |

F-93
Table of Contents
Index to Financial Statements
| MAGGART & ASSOCIATES, P.C. | ||||
| Public Accountants | ||||
| Stephen M. Maggart, CPA, ABV, CFF Mark Allen, CPA James M. Lawson, CPA Todd Maggart, CPA, ABV, CFF |
A Tennessee Professional Corporation 150 FOURTH AVENUE, NORTH SUITE 2150 NASHVILLE, TENNESSEE 37219-2417 Telephone (615) 252-6100 Facsimile (615) 252-6105 |
Michael F. Murphy, CPA Jason Ricciardi, CPA David B. von Dohlen, CPA Keith Wilson, CPA, CITP |
The Board of Directors and
Shareholders of MidSouth Bank
We have audited the accompanying consolidated balance sheets of MidSouth Bank and subsidiary as of December 31, 2013 and 2012, and the related consolidated statements of earnings, comprehensive earnings (losses), changes in shareholders’ equity and cash flows for each of the three years in the period ended December 31, 2013. These financial statements are the responsibility of the Bank’s management. Our responsibility is to express an opinion on these financial statements based on our audits.
We conducted our audits in accordance with the standards of the Public Company Accounting Oversight Board in the United States. Those standards require that we plan and perform the audits to obtain reasonable assurance about whether the financial statements are free of material misstatement. The Company is not required to have, nor were we engaged to perform, an audit of its internal control over financial reporting. Our audit included consideration of internal control over financial reporting as a basis for designing audit procedures that are appropriate in the circumstances, but not for the purpose of expressing an opinion on the effectiveness of the Company’s internal control over financial reporting. Accordingly, we express no such opinion. An audit also includes examining, on a test basis, evidence supporting the amounts and disclosures in the financial statements, assessing the accounting principles used and significant estimates made by management, as well as evaluating the overall financial statement presentation. We believe that our audits provide a reasonable basis for our opinion.
In our opinion, the financial statements referred to above present fairly, in all material respects, the financial position of MidSouth Bank and subsidiary as of December 31, 2013 and 2012, and the results of their operations and their cash flows for each of the three years in the period ended December 31, 2013, in conformity with accounting principles generally accepted in the United States of America.

Nashville, Tennessee
March 14, 2014
F-94
Table of Contents
Index to Financial Statements
MIDSOUTH BANK
December 31, 2013 and 2012
| (In Thousands, Except Share Amounts) |
2013 | 2012 | ||||||
| ASSETS |
||||||||
| Loans, less allowance for loan losses of $2,799 and $3,088, respectively |
$ | 168,111 | $ | 137,790 | ||||
| Securities available-for-sale, at market (amortized cost of $79,170 and $68,703, respectively) |
77,850 | 69,925 | ||||||
| Loans held for sale |
2,029 | 2,841 | ||||||
| Restricted equity securities |
1,549 | 1,550 | ||||||
| Certificates of deposit at other financial institutions |
1,732 | 1,482 | ||||||
| Interest-bearing accounts at other financial institutions |
9,355 | 25,764 | ||||||
|
|
|
|
|
|||||
| Total earning assets |
260,626 | 239,352 | ||||||
|
|
|
|
|
|||||
| Cash and due from banks |
2,041 | 1,598 | ||||||
| Bank premises and equipment, net |
8,642 | 8,865 | ||||||
| Accrued interest receivable |
851 | 745 | ||||||
| Foreclosed assets |
800 | 800 | ||||||
| Bank-owned life insurance |
3,090 | — | ||||||
| Other assets |
570 | 939 | ||||||
|
|
|
|
|
|||||
| Total assets |
$ | 276,620 | $ | 252,299 | ||||
|
|
|
|
|
|||||
| LIABILITIES AND SHAREHOLDERS’ EQUITY |
||||||||
| Deposits |
$ | 241,948 | $ | 221,752 | ||||
| Securities sold under agreement to repurchase |
980 | 1,044 | ||||||
| FHLB advance |
5,000 | — | ||||||
| Accrued interest payable |
32 | 52 | ||||||
| Accounts payable and other liabilities |
993 | 783 | ||||||
|
|
|
|
|
|||||
| Total liabilities |
248,953 | 223,631 | ||||||
|
|
|
|
|
|||||
| COMMITMENTS AND CONTINGENCIES |
||||||||
| Shareholders’ equity: |
||||||||
| Preferred stock, par value $1 per share, authorized 20,000,000 shares, 1,259,907 and 1,265,078 shares issued and outstanding, respectively |
1,260 | 1,265 | ||||||
| Common stock, par value $1 per share, authorized 20,000,000 shares, 3,872,923 and 3,855,577 shares issued and outstanding, respectively |
3,873 | 3,856 | ||||||
| Additional paid-in capital |
39,850 | 39,825 | ||||||
| Deficit |
(15,996 | ) | (17,500 | ) | ||||
| Accumulated other comprehensive (loss) income |
(1,320 | ) | 1,222 | |||||
|
|
|
|
|
|||||
| Total shareholders’ equity |
27,667 | 28,668 | ||||||
|
|
|
|
|
|||||
| Total liabilities and shareholders’ equity |
$ | 276,620 | $ | 252,299 | ||||
|
|
|
|
|
|||||
See accompanying notes to consolidated financial statements.
F-95
Table of Contents
Index to Financial Statements
MIDSOUTH BANK
Consolidated Statements of Earnings
For the Three Years Ended December 31, 2013
| (In Thousands, Except Per Share Amounts) |
2013 | 2012 | 2011 | |||||||||
| Interest income: |
||||||||||||
| Interest and fees on loans |
$ | 8,296 | $ | 7,992 | $ | 8,518 | ||||||
| Interest and dividends on taxable securities |
1,388 | 1,462 | 1,456 | |||||||||
| Interest and dividends on restricted equity securities |
81 | 80 | 75 | |||||||||
| Interest on interest-bearing balances at other financial institutions |
64 | 40 | 32 | |||||||||
|
|
|
|
|
|
|
|||||||
| Total interest income |
9,829 | 9,574 | 10,081 | |||||||||
|
|
|
|
|
|
|
|||||||
| Interest expense: |
||||||||||||
| Interest on negotiable order of withdrawal accounts |
61 | 62 | 65 | |||||||||
| Interest on money market and other savings accounts |
231 | 223 | 237 | |||||||||
| Interest on certificates of deposit |
622 | 939 | 1,304 | |||||||||
| Interest on Fed funds purchased and securities sold under agreement to repurchase |
2 | 7 | 17 | |||||||||
| Interest on advances from FHLB |
— | — | 17 | |||||||||
|
|
|
|
|
|
|
|||||||
| Total interest expense |
916 | 1,231 | 1,640 | |||||||||
|
|
|
|
|
|
|
|||||||
| Net interest income before provision for loan losses |
8,913 | 8,343 | 8,441 | |||||||||
| Provision for loan losses |
— | (470 | ) | 400 | ||||||||
|
|
|
|
|
|
|
|||||||
| Net interest income after provision for loan losses |
8,913 | 8,813 | 8,041 | |||||||||
| Non-interest income |
3,151 | 2,251 | 1,962 | |||||||||
| Non-interest expense |
10,560 | 9,463 | 8,941 | |||||||||
|
|
|
|
|
|
|
|||||||
| Earnings before income taxes |
1,504 | 1,601 | 1,062 | |||||||||
| Income taxes |
— | — | — | |||||||||
|
|
|
|
|
|
|
|||||||
| Earnings |
$ | 1,504 | $ | 1,601 | $ | 1,062 | ||||||
|
|
|
|
|
|
|
|||||||
| Basic earnings per common share |
$ | 0.39 | $ | 0.42 | $ | 0.28 | ||||||
|
|
|
|
|
|
|
|||||||
| Diluted earnings per common share |
$ | 0.23 | $ | 0.24 | $ | 0.17 | ||||||
|
|
|
|
|
|
|
|||||||
See accompanying notes to consolidated financial statements.
F-96
Table of Contents
Index to Financial Statements
MIDSOUTH BANK
Consolidated Statements of Comprehensive Earnings (Losses)
For the Three Years Ended December 31, 2013
| (In Thousands) |
2013 | 2012 | 2011 | |||||||||
| Net earnings |
$ | 1,504 | $ | 1,601 | $ | 1,062 | ||||||
| Other comprehensive earnings (losses): |
||||||||||||
| Unrealized gains on available-for-sale securities arising during period |
(2,540 | ) | 343 | 1,033 | ||||||||
| Less: Reclassification adjustment for gains included in net earnings |
(2 | ) | (11 | ) | (144 | ) | ||||||
|
|
|
|
|
|
|
|||||||
| Other comprehensive earnings (losses) |
(2,542 | ) | 332 | 889 | ||||||||
|
|
|
|
|
|
|
|||||||
| Comprehensive earnings (losses) |
$ | (1,038 | ) | $ | 1,933 | $ | 1,951 | |||||
|
|
|
|
|
|
|
|||||||
See accompanying notes to consolidated financial statements.
F-97
Table of Contents
Index to Financial Statements
MIDSOUTH BANK
Consolidated Statements of Changes in Shareholders’ Equity
For the Three Years Ended December 31, 2013
| (In Thousands) |
Preferred Stock |
Common Stock |
Additional Paid-In Capital |
Deficit | Accumulated Other Comprehensive Income (Loss) |
Total | ||||||||||||||||||
| Balance December 31, 2010 |
$ | 1,025 | $ | 3,843 | $ | 38,697 | $ | (20,163 | ) | $ | 1 | $ | 23,403 | |||||||||||
| Issuance of 965 shares from exercise of detachable warrants |
— | 1 | 1 | — | — | 2 | ||||||||||||||||||
| Issuance of 242,350 shares from sales of Series 2011-A Preferred Stock |
242 | — | 1,083 | — | — | 1,325 | ||||||||||||||||||
| Conversion of 2,000 shares of Series 2009A Preferred Stock to 4,000 shares of common stock |
(2 | ) | 4 | (2 | ) | — | — | — | ||||||||||||||||
| Stock-based compensation expense |
— | — | 11 | — | — | 11 | ||||||||||||||||||
| Net change in unrealized gains on available-for-sale securities during the year |
— | — | — | — | 889 | 889 | ||||||||||||||||||
| Earnings for the period |
— | — | — | 1,062 | — | 1,062 | ||||||||||||||||||
|
|
|
|
|
|
|
|
|
|
|
|
|
|||||||||||||
| Balance December 31, 2011 |
1,265 | 3,848 | 39,790 | (19,101 | ) | 890 | 26,692 | |||||||||||||||||
| Issuance of 7,297 shares from exercise of detachable warrants |
— | 8 | 16 | — | — | 24 | ||||||||||||||||||
| Stock-based compensation expense |
— | — | 19 | — | — | 19 | ||||||||||||||||||
| Net change in unrealized gains on available-for-sale securities during the year |
— | — | — | — | 332 | 332 | ||||||||||||||||||
| Earnings for the period |
— | — | — | 1,601 | — | 1,601 | ||||||||||||||||||
|
|
|
|
|
|
|
|
|
|
|
|
|
|||||||||||||
| Balance December 31, 2012 |
1,265 | 3,856 | 39,825 | (17,500 | ) | 1,222 | 28,668 | |||||||||||||||||
| Issuance of 7,004 shares from exercise of detachable warrants |
— | 7 | 18 | — | — | 25 | ||||||||||||||||||
| Conversion of 5,171 shares of Series 2009A Preferred Stock to 10,342 shares of common stock |
(5 | ) | 10 | (5 | ) | — | — | — | ||||||||||||||||
| Stock-based compensation expense |
— | — | 12 | — | — | 12 | ||||||||||||||||||
| Net change in unrealized losses on available-for-sale securities during the year |
— | — | — | — | (2,542 | ) | (2,542 | ) | ||||||||||||||||
| Earnings for the period |
— | — | — | 1,504 | — | 1,504 | ||||||||||||||||||
|
|
|
|
|
|
|
|
|
|
|
|
|
|||||||||||||
| Balance December 31, 2013 |
$ | 1,260 | $ | 3,873 | $ | 39,850 | $ | (15,996 | ) | $ | (1,320 | ) | $ | 27,667 | ||||||||||
|
|
|
|
|
|
|
|
|
|
|
|
|
|||||||||||||
See accompanying notes to consolidated financial statements.
F-98
Table of Contents
Index to Financial Statements
MIDSOUTH BANK
Consolidated Statements of Cash Flows
For the Three Years Ended December 31, 2013
| (In Thousands) |
2013 | 2012 | 2011 | |||||||||
| Cash flows from operating activities: |
||||||||||||
| Interest received |
$ | 10,968 | $ | 10,650 | $ | 10,566 | ||||||
| Fees received |
1,640 | 1,598 | 1,496 | |||||||||
| Proceeds from sale of loans |
50,817 | 30,676 | 22,032 | |||||||||
| Origination of loans held for sale |
(48,592 | ) | (31,567 | ) | (20,617 | ) | ||||||
| Interest paid |
(936 | ) | (1,249 | ) | (1,700 | ) | ||||||
| Cash paid to suppliers and employees |
(9,465 | ) | (8,434 | ) | (7,152 | ) | ||||||
|
|
|
|
|
|
|
|||||||
| Net cash provided by operating activities |
4,432 | 1,674 | 4,625 | |||||||||
|
|
|
|
|
|
|
|||||||
| Cash flows from investing activities: |
||||||||||||
| Purchase of available-for-sale securities |
(42,299 | ) | (26,353 | ) | (35,894 | ) | ||||||
| Repayments of mortgage-backed securities |
14,498 | 15,239 | 9,546 | |||||||||
| Purchase of restricted equity securities |
(44 | ) | (49 | ) | (90 | ) | ||||||
| Proceeds from sales of available-for-sale securities |
15,591 | 4,556 | 13,761 | |||||||||
| Proceeds from sales of restricted equity securities |
45 | — | 18 | |||||||||
| Proceeds from maturities/calls of available-for-sales securities |
500 | 2,000 | — | |||||||||
| Net increases in certificates of deposit at other financial institutions |
(250 | ) | (1,482 | ) | — | |||||||
| Loans made to customers, net of repayments |
(30,321 | ) | (512 | ) | 15,165 | |||||||
| Purchases of bank-owned life insurance |
(3,000 | ) | — | — | ||||||||
| Purchases of premises and equipment |
(310 | ) | (540 | ) | (504 | ) | ||||||
| Capitalized costs related to foreclosed assets |
— | (62 | ) | — | ||||||||
| Proceeds from insurance claims |
35 | 38 | — | |||||||||
| Proceeds from sales of foreclosed assets |
— | 548 | 302 | |||||||||
|
|
|
|
|
|
|
|||||||
| Net cash (used in) provided by investing activities |
(45,555 | ) | (6,617 | ) | 2,304 | |||||||
|
|
|
|
|
|
|
|||||||
| Cash flows from financing activities: |
||||||||||||
| Net increase in non-interest-bearing, savings and NOW deposit accounts |
28,773 | 23,022 | 10,509 | |||||||||
| Net decrease in time deposits |
(8,577 | ) | (5,902 | ) | (10,767 | ) | ||||||
| Proceeds from (repayments of) advances from the FHLB |
5,000 | — | (941 | ) | ||||||||
| (Decrease) increase in securities sold under agreement to repurchase |
(64 | ) | (5,508 | ) | 2,493 | |||||||
| Proceeds from sale of common stock |
25 | 24 | 2 | |||||||||
| Proceeds from sale of preferred stock |
— | — | 1,325 | |||||||||
|
|
|
|
|
|
|
|||||||
| Net cash provided by financing activities |
25,157 | 11,636 | 2,621 | |||||||||
|
|
|
|
|
|
|
|||||||
| Net (decrease) increase in cash and cash equivalents |
(15,966 | ) | 6,693 | 9,550 | ||||||||
| Cash and cash equivalents at beginning of year |
27,362 | 20,669 | 11,119 | |||||||||
|
|
|
|
|
|
|
|||||||
| Cash and cash equivalents at end of year |
$ | 11,396 | $ | 27,362 | $ | 20,669 | ||||||
|
|
|
|
|
|
|
|||||||
See accompanying notes to consolidated financial statements.
F-99
Table of Contents
Index to Financial Statements
MIDSOUTH BANK
Consolidated Statements of Cash Flows, Continued
For the Three Years Ended December 31, 2013
| (In Thousands) |
2013 | 2012 | 2011 | |||||||||
| Reconciliation of earnings to net cash provided by operating activities: |
||||||||||||
| Earnings |
$ | 1,504 | $ | 1,601 | $ | 1,062 | ||||||
| Adjustments to reconcile earnings to net cash provided by operating activities: |
||||||||||||
| Depreciation |
497 | 446 | 542 | |||||||||
| Loss on sale/disposal of premises and equipment |
1 | 2 | 321 | |||||||||
| Gain on sale of available-for-sale securities |
(2 | ) | (11 | ) | (144 | ) | ||||||
| Loss on sale of foreclosed assets |
— | 19 | 148 | |||||||||
| Provision for loan losses |
— | (470 | ) | 400 | ||||||||
| Amortization and accretion, net |
1,245 | 1,151 | 535 | |||||||||
| Stock-based compensation expense |
12 | 19 | 11 | |||||||||
| Valuation adjustment on foreclosed assets |
— | 420 | — | |||||||||
| Deferred gain realized for foreclosed assets |
(6 | ) | (11 | ) | — | |||||||
| Decrease (increase) in loans held for sale |
812 | (1,533 | ) | 1,093 | ||||||||
| Increase in accrued interest receivable |
(106 | ) | (75 | ) | (50 | ) | ||||||
| Decrease in other assets |
369 | 56 | 544 | |||||||||
| Bank-owned life insurance income |
(90 | ) | — | — | ||||||||
| Decrease in accrued interest payable |
(20 | ) | (18 | ) | (59 | ) | ||||||
| Increase in accounts payable and other liabilities |
216 | 78 | 222 | |||||||||
|
|
|
|
|
|
|
|||||||
| Total adjustments |
2,928 | 73 | 3,563 | |||||||||
|
|
|
|
|
|
|
|||||||
| Net cash provided by operating activities |
$ | 4,432 | $ | 1,674 | $ | 4,625 | ||||||
|
|
|
|
|
|
|
|||||||
| Supplemental Schedule of Non-Cash Activities: |
||||||||||||
| Unrealized (loss) gain in value of securities available-for-sale |
$ | (2,542 | ) | $ | 332 | $ | 889 | |||||
|
|
|
|
|
|
|
|||||||
| Transfer of loans to foreclosed assets |
$ | — | $ | 335 | $ | 179 | ||||||
|
|
|
|
|
|
|
|||||||
| Transfer of foreclosed assets to loans |
$ | — | $ | — | $ | 550 | ||||||
|
|
|
|
|
|
|
|||||||
See accompanying notes to consolidated financial statements.
F-100
Table of Contents
Index to Financial Statements
MIDSOUTH BANK
Notes to Consolidated Financial Statements
December 31, 2013, 2012 and 2011
(1) SUMMARY OF SIGNIFICANT ACCOUNTING POLICIES
The accounting and reporting policies of MidSouth Bank and subsidiary (“the Bank”) are in accordance with accounting principles generally accepted in the United States of America and conform to general practices within the banking industry. The following is a brief summary of the more significant policies.
(a) Principles of Consolidation
The consolidated financial statements include the accounts of MidSouth Bank and its wholly-owned subsidiary, MSB Services, Inc. All significant intercompany accounts and transactions have been eliminated in consolidation.
(b) Nature of Operations
MidSouth Bank operates under a state bank charter and provides full banking services. As a state bank, the Bank is subject to regulations of the Tennessee Department of Financial Institutions and the Board of Governors of the Federal Reserve System. The area served by MidSouth Bank is Rutherford County and adjacent counties of Middle Tennessee. Services are provided at the main office and three branch offices located in Murfreesboro, Tennessee and one branch office located in Smyrna, Tennessee.
(c) Subsequent Events
The Bank has evaluated subsequent events for recognition and disclosure in the consolidated financial statements that occurred after the balance sheet date but before the consolidated financial statements are issued. During this period there were no material recognizable subsequent events that required recognition in our disclosures to the December 31, 2013 consolidated financial statements.
(d) Estimates
The preparation of financial statements in conformity with accounting principles generally accepted in the United States of America requires management to make estimates and assumptions that affect the reported amounts of assets and liabilities and disclosure of contingent assets and liabilities at the date of the financial statements and the reported amounts of revenues and expenses during the reporting period. Actual results could differ from those estimates. Material estimates that are particularly susceptible to significant change in the near term relate to determination of the allowance for loan losses, valuation of debt and equity securities, foreclosed assets and the fair value of financial instruments.
(e) Loans
Loans are stated at the principal amount outstanding. The allowance for loan losses is shown as a reduction of loans. Certain loan origination and commitment fees and certain loan-related costs are being deferred and the net amount amortized as an adjustment of the related loan’s yield over the contractual life of the loan. Interest income on loans is accrued based on the principal amount outstanding.
The Bank follows the provisions of ASC 310, Receivables, specifically ASC 310, in relation to impaired loans. These provisions apply to impaired loans except for large groups of smaller-balance homogeneous loans that are collectively evaluated for impairment including residential mortgage and consumer loans.
F-101
Table of Contents
Index to Financial Statements
MIDSOUTH BANK
Notes to Consolidated Financial Statements
December 31, 2013, 2012 and 2011
A loan is impaired when it is probable that the Bank will be unable to collect the scheduled payments of principal and interest due under the contractual terms of the loan agreement. Impaired loans are measured at the present value of expected future cash flows discounted at the loan’s effective interest rate, at the loan’s observable market price, or the fair value of the collateral if the loan is collateral dependent. If the measure of the impaired loan is less than the recorded investment in the loan, the Bank recognizes impairment by creating a valuation allowance with a corresponding charge to the provision for loan losses or by adjusting an existing valuation allowance for the impaired loan with a corresponding charge or credit to the provision for loan losses.
The Bank’s consumer and residential mortgage loans which total $1,370 and $39,927, respectively, at December 31, 2013, are divided into various groups of smaller-balance homogeneous loans that are collectively evaluated for impairment and, thus, are not subject to the provisions of ASC 310. In certain situations where consumer or residential mortgage loans are part of a larger relationship that is being evaluated for impairment, those loans are included in the ASC 310 provision calculation. Substantially all other loans of the Bank are evaluated for impairment under the provisions of ASC 310.
The Bank considers all loans subject to the provisions of ASC 310 that are on a nonaccrual status to be impaired. Loans are placed on nonaccrual status when doubt as to timely collection of principal or interest exists, or when principal or interest is past due 90 days or more unless such loans are well-secured and in the process of collection. Past due status of loans is based on the contractual terms of the loan. Delays or shortfalls in loan payments are evaluated along with various other factors to determine if a loan is impaired. Generally, delinquencies under 90 days are considered insignificant unless certain other factors are present which indicate impairment is probable. The decision to place a loan on nonaccrual status is also based on an evaluation of the borrower’s financial condition, collateral, liquidation value, and other factors that affect the borrower’s ability to pay.
Generally, at the time a loan is placed on nonaccrual status, all interest accrued and uncollected on the loan in the current fiscal year is reversed from income, and all interest accrued and uncollected from the prior year is charged off against the allowance for loan losses. Thereafter, interest on nonaccrual loans is recognized as interest income only to the extent that cash is received and future collection of principal is not in doubt. If the collectibility of outstanding principal is doubtful, such cash received is applied as a reduction of principal. A nonaccrual loan may be restored to an accruing status when principal and interest are no longer past due and unpaid and future collection of principal and interest on a timely basis is not in doubt.
Loans not on nonaccrual status are classified as impaired in certain cases when there is inadequate protection by the current net worth and financial capacity of the borrower or of the collateral pledged, if any. In those cases, such loans have a well-defined weakness or weaknesses that jeopardize the liquidation of the debt, and if such deficiencies are not corrected, there is a probability that the Bank will sustain some loss. In such cases, interest income continues to accrue as long as the loan does not meet the Bank’s criteria for nonaccrual status.
Generally, the Bank also classifies as impaired any loans the terms of which have been modified in a troubled debt restructuring. Interest is generally accrued on such loans that continue to meet the modified terms of their loan agreements.
The Bank’s charge-off policy for impaired loans is similar to its charge-off policy for all loans in that loans are charged off in the month when they are considered uncollectible.
F-102
Table of Contents
Index to Financial Statements
MIDSOUTH BANK
Notes to Consolidated Financial Statements
December 31, 2013, 2012 and 2011
(f) Allowance for Loan Losses
The provision for loan losses represents a charge to earnings necessary, after loan charge-offs and recoveries, to maintain the allowance for loan losses at an appropriate level which is adequate to absorb estimated losses inherent in the loan portfolio. Such estimated losses arise primarily from the loan portfolio but may also be derived from other sources, including commitments to extend credit and letters of credit (which are separately classified in other liabilities). The level of the allowance is determined on a quarterly basis using procedures which include: (1) categorizing commercial and commercial real estate loans into risk categories to estimate loss probabilities based primarily on the historical loss experience of those risk categories and current economic conditions; (2) analyzing significant commercial and commercial real estate credits and calculating specific reserves as necessary; (3) assessing various homogeneous consumer loan categories to estimate loss probabilities based primarily on historical loss experience; and (4) considering various other factors, such as changes in credit concentrations, loan mix, and economic conditions which may not be specifically quantified in the loan analysis process.
The allowance for loan losses consists of an allocated portion and an unallocated, or general, portion. The allocated portion is maintained to cover estimated losses applicable to specific segments of the loan portfolio. The unallocated portion is maintained to absorb losses which probably exist as of the evaluation date but are not identified by the more objective processes used for the allocated portion of the allowance due to risk of errors or imprecision. While the total allowance consists of an allocated portion and an unallocated portion, these terms are primarily used to describe a process. Both portions of the allowance are available to provide for inherent loss in the entire portfolio.
The allowance for loan losses is increased by provisions for loan losses charged to expense and is reduced by loans charged off net of recoveries on loans previously charged off. The provision is based on management’s determination of the amount of the allowance necessary to provide for estimated loan losses based on its evaluation of the loan portfolio. Determining the appropriate level of the allowance and the amount of the provision involves uncertainties and matters of judgment and therefore cannot be determined with precision.
(g) Securities
The Bank accounts for securities under the provisions of ASC 320, Investments—Debt and Equity Securities. Under these provisions, securities are classified in three categories and accounted for as follows:
| • | Securities Held-to-Maturity |
Debt securities that the Bank has the positive intent and ability to hold to maturity are classified as held-to-maturity securities and reported at amortized cost. Amortization of premiums and accretion of discounts are recognized by the interest method. No securities have been classified as held-to-maturity.
| • | Trading Securities |
Debt and equity securities that are bought and held principally for the purpose of selling them in the near term are classified as trading securities and reported at fair value, with unrealized gains and losses included in earnings. No securities have been classified as trading securities.
F-103
Table of Contents
Index to Financial Statements
MIDSOUTH BANK
Notes to Consolidated Financial Statements
December 31, 2013, 2012 and 2011
| • | Securities Available-for-Sale |
Debt and equity securities not classified as either held-to-maturity securities or trading securities are classified as available-for-sale securities and reported at estimated fair value, with unrealized gains and losses excluded from earnings and reported in a separate component of shareholders’ equity. Premiums and discounts are recognized by the interest method.
If a decline in the fair value of a security below its amortized cost is judged by management to be an other-than-temporary loss, the cost basis of the security is written down to fair value, and the amount of the write-down is included in the statements of earnings. In estimating other-than-temporary losses, management considers the following: the length of time and extent to which fair value has been less than cost, the financial condition and near-term prospects of the issue, whether the market decline was affected by macroeconomic conditions and whether the Bank has the intention to sell the debt security before its anticipated recovery. The assessment of whether an other-than-temporary loss exists involves a high degree of subjectivity and judgment and is based on the information available to management at a point in time.
The Bank has classified all its securities as available-for-sale. Realized gains or losses from the sale of securities are recognized based upon the specific identification method.
(h) Loans Held for Sale
Mortgage loans held for sale are reported at the lower of cost or market value determined by outstanding commitments from investors at the balance sheet date. These loans are valued on an aggregate basis.
(i) Bank Premises and Equipment
Premises and equipment are stated at cost, less accumulated depreciation. Depreciation is computed by the straight-line method over the estimated useful lives of the related assets. Gain or loss on items retired and otherwise disposed of is credited or charged to operations, and cost and related accumulated depreciation are removed from the asset and accumulated depreciation accounts.
Expenditures for major renewals and improvements of bank premises and equipment are capitalized and those for maintenance and repairs are charged to earnings as incurred.
(j) Foreclosed Assets
Assets acquired through, or in lieu of, loan foreclosure are held for sale and are initially recorded at the lower of cost or fair value less cost to sell at the date of foreclosure, establishing a new cost basis. Any write down at the time of transfer to foreclosed assets is charged to the allowance for loan losses. Subsequent to foreclosure, valuations are periodically performed by management, and the assets are carried at the lower of carrying amount or fair value less estimated retention and disposition costs. Revenue and expenses from operations and changes in the valuation allowance are included in non-interest expenses.
(k) Cash and Cash Equivalents
For purposes of reporting cash flows, cash and cash equivalents include cash on hand, amounts due from banks, Federal funds sold and interest-bearing deposits at other financial institutions. Generally, Federal funds sold are purchased and sold for one-day periods. The Bank, at times, maintains deposits in excess of the Federal insurance amounts with other financial institutions. Management makes deposits only with financial institutions it considers to be financially sound.
F-104
Table of Contents
Index to Financial Statements
MIDSOUTH BANK
Notes to Consolidated Financial Statements
December 31, 2013, 2012 and 2011
(l) Interest-Bearing Accounts at Other Financial Institutions
Interest-bearing accounts at other financial institutions mature within one year and are carried at cost.
(m) Long-Term Assets
Premises and equipment and other long-term assets are reviewed for impairment when events indicate their carrying amount may not be recoverable from future undiscounted cash flows. If impaired, the assets are recorded at the lower of cost or fair value.
(n) Stock Options
The Bank accounts for the MidSouth Bank 2004 Stock Option Arrangement (the “Arrangement”) using the provisions of ASC 718, Compensation—Stock Compensation. The Bank recognizes stock compensation cost for services received in a share-based payment transaction over the required write-down period, generally defined as the vesting period. For awards with graded vesting, compensation cost in recognized on a straight-line basis over the requisite service period for the entire award. The compensation cost of employee and director services received in exchange for stock awards is based on the grant date fair value of the award (as determined by using a Black-Scholes option valuation model). Stock compensation expense recognized reflects estimated forfeitures, adjusted as necessary for actual forfeitures.
The fair value of each option award is estimated on the date of grant using a Black-Scholes option valuation model that uses the following assumptions. Expected volatility is based on implied volatility from comparable publicly-traded banks. The Bank uses historical data to estimate option exercise and employee termination within the valuation model; separate groups of employees that have similar historical exercise behavior are considered separately for valuation purposes. The expected term of options granted is derived from the average of: 1) the weighted average vesting term; and 2) original contractual term. The risk-free rate is based on the U.S. Treasury yield in effect at the time of grant and the weighted average expected life of the grant.
(o) Income Taxes
Provisions for income taxes are based on taxes payable or refundable for the current year (after exclusion of non-taxable income such as interest on state and municipal securities) and deferred taxes on temporary differences between the amount of taxable and pretax financial income and between the tax bases of assets and liabilities and their reported amounts in the consolidated financial statements. Deferred tax assets and liabilities are included in the consolidated financial statements at currently enacted income tax rates applicable to the period in which the deferred tax asset and liabilities are expected to be realized or settled as prescribed in ASC 740, Income Taxes. As changes in tax laws or rates are enacted, deferred tax assets and liabilities are adjusted through the provision for income taxes.
When tax returns are filed, it is highly certain that some positions taken would be sustained upon examination by the taxing authorities, while others are subject to uncertainty about the merits of the position taken or the amount of the position that would be ultimately sustained. The benefit of a tax position is recognized in the consolidated financial statements in the period during which, based on all available evidence, management believes it is more likely than not that the position will be sustained upon examination, including the resolution of appeals or litigation processes, if any. Tax positions taken are not offset or aggregated with other positions. Tax positions that meet the more-likely-than-not recognition threshold are measured as the largest amount of tax benefit that is more than 50 percent likely of being realized upon settlement with the applicable taxing authority.
F-105
Table of Contents
Index to Financial Statements
MIDSOUTH BANK
Notes to Consolidated Financial Statements
December 31, 2013, 2012 and 2011
The portion of the benefits associated with tax positions taken that exceeds the amount measured as described above is reflected as a liability for unrecognized tax benefits in the accompanying consolidated balance sheets along with any associated interest and penalties that would be payable to the taxing authorities upon examination. Interest and penalties associated with unrecognized tax benefits are classified as additional income taxes in the consolidated statements of earnings, as applicable.
The Bank is currently open to audit under the statute of limitations by the Internal Revenue Service and by the State of Tennessee for the years ended December 31, 2010 through 2012. Once the Bank’s 2013 taxes are filed, the statute of limitations will change to the years ended December 31, 2011 through 2013.
(p) Advertising Costs
Advertising costs are expensed when incurred by the Bank.
(q) Off-Balance-Sheet Financial Instruments
In the ordinary course of business the Bank has entered into off-balance-sheet financial instruments consisting of commitments to extend credit, commercial letters of credit and standby letters of credit. Such financial instruments are recorded in the consolidated financial statements when they are funded or related fees are incurred or received.
(r) Derivative Financial Instruments
Derivative financial instruments are recognized as assets and liabilities in the consolidated financial statements and measured at fair value.
Derivative Loan Commitments
Mortgage loan commitments are referred to as derivative loan commitments if the loan that will result from exercise of the commitment will be held for sale upon funding. Loan commitments that are derivatives are recognized at fair value in the consolidated balance sheet with changes in their fair values recorded in fees on mortgage originations.
The Bank records a zero value for the loan commitment at inception (at the time the commitment is issued to a borrower (“the time of rate lock”), and accordingly, does not recognize the value of the expected normal servicing rights until the underlying loan is sold. Subsequent to inception, changes in fair values of the loan commitments are recognized based on changes in the fair values of the underlying mortgage loans due to interest rate changes, changes in the probability the derivative loan commitments will be exercised, and the passage of time. In estimating fair value, the Bank assigns a probability to a loan commitment based on an expectation that it will be exercised and the loan will be funded.
Forward Loan Sale Commitments
The Bank carefully evaluates each loan sales agreement to determine whether it meets the definition of a derivative as facts and circumstances may differ significantly for each agreement. If agreements qualify, to protect against the price risk inherent in derivative loan commitments, the Bank utilizes “best efforts” forward loan sales commitments to mitigate the risk of potential decreases in the values of loans that would result from
F-106
Table of Contents
Index to Financial Statements
MIDSOUTH BANK
Notes to Consolidated Financial Statements
December 31, 2013, 2012 and 2011
the exercise of the derivative loan commitments. Generally, the Bank’s best efforts contracts meet the definition of derivative instruments. Accordingly, forward loan sale commitments that economically hedge derivative loan commitments are recognized at fair value in the consolidated balance sheet with changes in their fair values recorded in fees on mortgage originations.
The Bank estimates the fair value of its forward loan sales commitments using a methodology similar to that used for derivative loan commitments.
(s) Impact of New Accounting Standards
In February 2013, the Financial Accounting Standards Board issued Accounting Standards Update 2013-02, “Comprehensive Income (Topic 220): Reporting of Amounts Reclassified Out of Accumulated Other Comprehensive Income”, which provides disclosure guidance on amounts reclassified out of accumulated other comprehensive income by component. This update did not have any impact on the Bank’s financial position or results of operations, nor did it have an impact on the Bank’s consolidated financial statements.
In January 2014, the Financial Accounting Standards Board (“FASB”) has issued Accounting Standards Update (“ASU”) No. 2014-04, “Receivables—Troubled Debt Restructurings by Creditors (Subtopic 310-40)—Reclassification of Residential Real Estate Collateralized Consumer Mortgage Loans upon Foreclosure.” The objective of the amendments in this ASU is to reduce diversity in practice by clarifying when an in substance repossession or foreclosure occurs, that is, when a creditor should be considered to have received physical possession of residential real estate property collateralizing a consumer mortgage loan such that the loan receivable should be derecognized and the real estate property recognized. Holding foreclosed real estate property presents different operational and economic risk to creditors compared with holding an impaired loan; therefore, consistency in the timing of loan derecognition and presentation of foreclosed real estate properties is of qualitative significance to users of the creditor’s financial statements. Additionally, the disclosure of the amount of foreclosed residential real estate properties and of the recorded investment in consumer mortgage loans secured by residential real estate properties that are in the process of foreclosure is expected to provide decision-useful information to many users of the creditor’s financial statements. The amendments in this ASU are effective for the Bank for annual periods, and interim periods within those annual periods, beginning after December 15, 2014. According to the ASU, an entity can elect to adopt the amendments in this ASU using either a modified retrospective transition method or a prospective transition method, and early adoption is permitted. The impact of the Bank’s adopting this ASU is not expected to be material.
(t) Reclassifications
Certain reclassifications have been made to the 2012 and 2011 amounts to conform to the presentation for 2013. Amounts provided in the narrative are shown in thousands, except for numbers of shares, per share amounts and as otherwise noted.
F-107
Table of Contents
Index to Financial Statements
MIDSOUTH BANK
Notes to Consolidated Financial Statements
December 31, 2013, 2012 and 2011
(2) LOANS AND ALLOWANCE FOR LOAN LOSSES
Loans
The classification of loans at December 31, 2013 and 2012 is as follows:
| (In Thousands) |
2013 | 2012 | ||||||
| Commercial, financial and agricultural |
$ | 21,108 | $ | 16,689 | ||||
| Real estate: |
||||||||
| Commercial |
79,481 | 61,322 | ||||||
| Residential |
39,927 | 40,567 | ||||||
| Construction and land development |
26,386 | 16,571 | ||||||
| Multifamily |
2,419 | 1,088 | ||||||
| Consumer and other |
1,589 | 4,641 | ||||||
|
|
|
|
|
|||||
| 170,910 | 140,878 | |||||||
| Allowance for loan losses |
(2,799 | ) | (3,088 | ) | ||||
|
|
|
|
|
|||||
| Net loans |
$ | 168,111 | $ | 137,790 | ||||
|
|
|
|
|
|||||
The Bank’s principal customers are generally in the Middle Tennessee area with a concentration in Rutherford and adjacent counties. Credit is extended to businesses and individuals and is evidenced by promissory notes. The terms and conditions of the loans, including collateral, vary depending upon the purpose of each credit and each borrower’s financial condition. At December 31, 2013, variable rate and fixed rate loans totaled $61,866 and $109,044 respectively. At December 31, 2012, variable rate and fixed rate loans totaled $44,499 and $96,379, respectively.
In 2013, 2012 and 2011, the Bank originated residential mortgage loans for sale in the secondary market of $48,592, $31,567, and $20,617, respectively. The Bank underwrites these mortgage loans and has recourse related to the mortgage loans sold that would occur if a borrower misrepresented their financial position to obtain the loan, and the Bank had knowledge of the misrepresentation but failed to act. The Bank’s recourse also extends to situations in which borrowers become more than 30 days past due on any of the first three payments due on their mortgage loans. As of December 31, 2013, the Bank had potential recourse for mortgage loans originated and sold during the fourth quarter of 2013 that totaled $8,832, for which a reserve of $15 was recorded as of December 31, 2013. The reserve was calculated based on industry historical loss factors adjusted for current environmental factors. The Bank has never been required to repurchase a loan previously sold for any such instances. The fees on mortgage loan originations totaled $1,413, $642 and $322 in 2013, 2012 and 2011, respectively.
In the normal course of business, the Bank has made loans at prevailing interest rates and terms to its executive officers, directors and their affiliates aggregating $12,491 and $10,564 at December 31, 2013 and 2012, respectively. During 2013 and 2012, $5,028 and $1,993, respectively, in loan advances were made, and $3,101 and $2,825, respectively, in repayments were made. During 2012, two of the Bank’s directors retired, resulting in a reduction in loans to insiders of $1,133. In addition, the Bank added three new directors in 2012, which added $559 to insider loans. As of December 31, 2013 and 2012, none of these loans were restructured, nor were any related party loans charged-off during the past three years.
F-108
Table of Contents
Index to Financial Statements
MIDSOUTH BANK
Notes to Consolidated Financial Statements
December 31, 2013, 2012 and 2011
Allowance for Loan Losses
Transactions in the allowance for loan losses of the Bank for the years ended December 31, 2013, 2012 and 2011 are summarized as follows:
| (In Thousands) |
2013 | 2012 | 2011 | |||||||||
| Balance—beginning of year |
$ | 3,088 | $ | 3,283 | $ | 4,447 | ||||||
| Provision (deducted from)/charged to operating expense |
— | (470 | ) | 400 | ||||||||
| Loans charged off |
(716 | ) | (554 | ) | (1,943 | ) | ||||||
| Recoveries |
427 | 829 | 379 | |||||||||
|
|
|
|
|
|
|
|||||||
| Balance—end of year |
$ | 2,799 | $ | 3,088 | $ | 3,283 | ||||||
|
|
|
|
|
|
|
|||||||
The following table documents the activity in the allowance for loan losses by portfolio segment for the year ended December 31, 2013:
| (In Thousands) |
Commercial, financial and agricultural |
Commercial Real Estate |
Residential Real Estate |
Construction and Land Development |
Multifamily Real Estate |
Consumer and Other |
Total | |||||||||||||||||||||
| Allowance for loan losses: |
||||||||||||||||||||||||||||
| Beginning balance (1/1/2013) |
$ | 549 | $ | 964 | $ | 519 | $ | 1,006 | $ | 13 | $ | 37 | $ | 3,088 | ||||||||||||||
| Charge-offs |
(569 | ) | — | (96 | ) | (35 | ) | — | (16 | ) | (716 | ) | ||||||||||||||||
| Recoveries |
194 | — | 39 | 104 | — | 90 | 427 | |||||||||||||||||||||
| Provisions |
— | — | — | — | — | — | — | |||||||||||||||||||||
|
|
|
|
|
|
|
|
|
|
|
|
|
|
|
|||||||||||||||
| Ending balance (12/31/2013) |
$ | 174 | $ | 964 | $ | 462 | $ | 1,075 | $ | 13 | $ | 111 | $ | 2,799 | ||||||||||||||
|
|
|
|
|
|
|
|
|
|
|
|
|
|
|
|||||||||||||||
The following table documents the activity in the allowance for loan losses by portfolio segment for the year ended December 31, 2012:
| (In Thousands) |
Commercial, financial and agricultural |
Commercial Real Estate |
Residential Real Estate |
Construction and Land Development |
Multifamily Real Estate |
Consumer and Other |
Total | |||||||||||||||||||||
| Allowance for loan losses: |
||||||||||||||||||||||||||||
| Beginning balance (1/1/2012) |
$ | 407 | $ | 1,012 | $ | 739 | $ | 1,068 | $ | 7 | $ | 50 | $ | 3,283 | ||||||||||||||
| Charge-offs |
(80 | ) | (257 | ) | (120 | ) | (78 | ) | — | (19 | ) | (554 | ) | |||||||||||||||
| Recoveries |
686 | — | 39 | 63 | — | 41 | 829 | |||||||||||||||||||||
| Provisions |
(464 | ) | 209 | (139 | ) | (47 | ) | 6 | (35 | ) | (470 | ) | ||||||||||||||||
|
|
|
|
|
|
|
|
|
|
|
|
|
|
|
|||||||||||||||
| Ending balance (12/31/2012) |
$ | 549 | $ | 964 | $ | 519 | $ | 1,006 | $ | 13 | $ | 37 | $ | 3,088 | ||||||||||||||
|
|
|
|
|
|
|
|
|
|
|
|
|
|
|
|||||||||||||||
F-109
Table of Contents
Index to Financial Statements
MIDSOUTH BANK
Notes to Consolidated Financial Statements
December 31, 2013, 2012 and 2011
The allocation of the allowance for loan losses by portfolio segment at December 31, 2013 was as follows:
| (In Thousands) |
Commercial, financial and agricultural |
Commercial Real Estate |
Residential Real Estate |
Construction and Land Development |
Multifamily Real Estate |
Consumer and Other |
Total | |||||||||||||||||||||
| Specific reserves—Impaired loans |
$ | 136 | $ | 111 | $ | 34 | $ | 31 | $ | — | $ | — | $ | 312 | ||||||||||||||
| General reserves |
38 | 853 | 428 | 1,044 | 13 | 111 | 2,487 | |||||||||||||||||||||
|
|
|
|
|
|
|
|
|
|
|
|
|
|
|
|||||||||||||||
| Total |
$ | 174 | $ | 964 | $ | 462 | $ | 1,075 | $ | 13 | $ | 111 | $ | 2,799 | ||||||||||||||
|
|
|
|
|
|
|
|
|
|
|
|
|
|
|
|||||||||||||||
| Loans individually evaluated for impairment |
$ | 1,384 | $ | 1,534 | $ | 771 | $ | 1,042 | $ | — | $ | — | $ | 4,731 | ||||||||||||||
| Loans collectively evaluated for impairment |
19,724 | 77,947 | 39,156 | 25,344 | 2,419 | 1,589 | 166,179 | |||||||||||||||||||||
|
|
|
|
|
|
|
|
|
|
|
|
|
|
|
|||||||||||||||
| Total |
$ | 21,108 | $ | 79,481 | $ | 39,927 | $ | 26,386 | $ | 2,419 | $ | 1,589 | $ | 170,910 | ||||||||||||||
|
|
|
|
|
|
|
|
|
|
|
|
|
|
|
|||||||||||||||
The allocation of the allowance for loan losses by portfolio segment at December 31, 2012 was as follows:
| (In Thousands) |
Commercial, financial and agricultural |
Commercial Real Estate |
Residential Real Estate |
Construction and Land Development |
Multifamily Real Estate |
Consumer and Other |
Total | |||||||||||||||||||||
| Specific reserves—Impaired Loans |
$ | 321 | $ | 263 | $ | 186 | $ | 163 | $ | — | $ | — | $ | 933 | ||||||||||||||
| General reserves |
228 | 701 | 333 | 843 | 13 | 37 | 2,155 | |||||||||||||||||||||
|
|
|
|
|
|
|
|
|
|
|
|
|
|
|
|||||||||||||||
| Total |
$ | 549 | $ | 964 | $ | 519 | $ | 1,006 | $ | 13 | $ | 37 | $ | 3,088 | ||||||||||||||
|
|
|
|
|
|
|
|
|
|
|
|
|
|
|
|||||||||||||||
| Loans individually evaluated for impairment |
$ | 2,037 | $ | 2,324 | $ | 1,967 | $ | 1,395 | $ | — | $ | — | $ | 7,723 | ||||||||||||||
| Loans collectively evaluated for impairment |
14,652 | 58,998 | 38,600 | 15,176 | 1,088 | 4,641 | 133,155 | |||||||||||||||||||||
|
|
|
|
|
|
|
|
|
|
|
|
|
|
|
|||||||||||||||
| Total |
$ | 16,689 | $ | 61,322 | $ | 40,567 | $ | 16,571 | $ | 1,088 | $ | 4,641 | $ | 140,878 | ||||||||||||||
|
|
|
|
|
|
|
|
|
|
|
|
|
|
|
|||||||||||||||
F-110
Table of Contents
Index to Financial Statements
MIDSOUTH BANK
Notes to Consolidated Financial Statements
December 31, 2013, 2012 and 2011
Impaired Loans
Impaired loans and related allowance for loan losses allocation amounts at December 31, 2013 were as follows:
| Impaired Loans With Allowance | Impaired Loans With No Allowance |
|||||||||||||||||||
| (In Thousands) |
Principal Balance |
Recorded Investment |
Allocated Allowance for Loan Losses |
Principal Balance |
Recorded Investment |
|||||||||||||||
| Commercial, financial and agricultural |
$ | 219 | $ | 219 | $ | 136 | $ | 1,165 | $ | 1,166 | ||||||||||
| Real estate—commercial |
625 | 625 | 111 | 909 | 911 | |||||||||||||||
| Real estate—residential: |
||||||||||||||||||||
| Open ended |
137 | 138 | 5 | — | — | |||||||||||||||
| Closed ended |
292 | 295 | 29 | 342 | 342 | |||||||||||||||
| Construction and land development |
490 | 491 | 31 | 552 | 552 | |||||||||||||||
| Real estate—multifamily |
— | — | — | — | — | |||||||||||||||
| Consumer and other |
— | — | — | — | — | |||||||||||||||
|
|
|
|
|
|
|
|
|
|
|
|||||||||||
| Total |
$ | 1,763 | $ | 1,768 | $ | 312 | $ | 2,968 | $ | 2,971 | ||||||||||
|
|
|
|
|
|
|
|
|
|
|
|||||||||||
Impaired loans and related allowance for loan losses allocation amounts at December 31, 2012 were as follows:
| Impaired Loans With Allowance | Impaired Loans With No Allowance |
|||||||||||||||||||
| (In Thousands) |
Principal Balance |
Recorded Investment |
Allocated Allowance for Loan Losses |
Principal Balance |
Recorded Investment |
|||||||||||||||
| Commercial, financial and agricultural |
$ | 1,220 | $ | 1,220 | $ | 321 | $ | 817 | $ | 817 | ||||||||||
| Real estate—commercial |
1,259 | 1,259 | 263 | 1,065 | 1,067 | |||||||||||||||
| Real estate—residential: |
||||||||||||||||||||
| Open ended |
138 | 139 | 15 | — | — | |||||||||||||||
| Closed ended |
926 | 931 | 171 | 903 | 905 | |||||||||||||||
| Construction and land development |
1,395 | 1,395 | 163 | — | — | |||||||||||||||
| Real estate—multifamily |
— | — | — | — | — | |||||||||||||||
| Consumer and other |
— | — | — | — | — | |||||||||||||||
|
|
|
|
|
|
|
|
|
|
|
|||||||||||
| Total |
$ | 4,938 | $ | 4,944 | $ | 933 | $ | 2,785 | $ | 2,789 | ||||||||||
|
|
|
|
|
|
|
|
|
|
|
|||||||||||
The average recorded investment in impaired loans for the year ended December 31, 2013 was $6,869. The related total amount of interest income recognized on the accrual basis for the period that such loans were impaired was $118 for 2013. The average recorded investment in impaired loans for the year ended December 31, 2012 was $10,396. The related total amount of interest income recognized on the accrual basis for the period that such loans were impaired was $157 for 2012. The average recorded investment in impaired loans for the year ended December 31, 2011 was $14,728. The related total amount of interest income recognized on the accrual basis for the period that such loans were impaired was $822 for 2011.
Credit Quality Indicators
The Bank categorizes loans into risk categories based on relevant information about the ability of borrowers to service their debt such as: current financial information, historical payment experience, credit documentation, public information, and current economic trends, among other factors. The Bank analyzes loans
F-111
Table of Contents
Index to Financial Statements
MIDSOUTH BANK
Notes to Consolidated Financial Statements
December 31, 2013, 2012 and 2011
individually by classifying the loans as to credit risk. Loans classified as substandard or special mention are reviewed regularly by the Bank to determine if appropriately classified or to determine if the loan is impaired. The Bank’s loan portfolio is reviewed for credit quality on a semi-annual basis, with samples being selected based on loan size, credit grades, etc., to ensure that the Bank’s management is properly applying credit risk management processes.
Loans excluded from the scope of the loan review process are generally classified as pass credits until: (a) they become past due; (b) management becomes aware of deterioration in the credit worthiness of the borrower; or (c) the customer contacts the Bank for a modification. In these circumstances, the customer relationship is specifically evaluated for potential classification as to special mention, substandard or doubtful, or could even be considered for charge-off. The Bank uses the following definitions for risk ratings:
| • | Pass/Watch (also known as “Special Mention”)—Loans included in this category are currently protected but are potentially weak. These loans constitute an undue and unwarranted credit risk but do not presently expose the Bank to a sufficient degree of risk to warrant adverse classification. Close management attention is required. New loans should not be made which will immediately be identified in this category. As a general rule, for the purposes of calculating a loan loss reserve, loans in this category will have the historical loss reserve percentage applied and will remain in a pool with loans that are considered acceptable or better when determining the general valuation reserve. Loans classified as special mention have potential weaknesses that deserve management’s close attention. If left uncorrected, these potential weaknesses may result in deterioration of the repayment prospects for the loan or of the institution’s credit position at some future date. |
| • | Substandard—Substandard loans are inadequately protected by the current net worth and financial capacity of the borrower or of the collateral pledged, if any. Loans so classified must have a well-defined weakness or weaknesses that jeopardize the liquidation of the debt. They are characterized by the distinct possibility that the Bank will sustain some loss if the deficiencies are not corrected. Loss potential, while existing in the aggregate amount of substandard assets, does not have to exist in individual assets classified as substandard. Loans in this category are evaluated individually as outlined in the Bank’s loan policy when determining the general valuation reserve. |
| • | Doubtful—Loans classified as doubtful have all the weaknesses inherent in those classified as substandard, with the added characteristic that the weaknesses make collection or liquidation in full highly questionable or improbable, based on currently existing facts, conditions, and values. |
The following table breaks down the Bank’s credit quality indicators by type of loan as of December 31, 2013:
Credit Risk Profile by Internally Assigned Grade
| (In Thousands) |
Commercial, financial and agricultural |
Commercial Real Estate |
Residential Real Estate |
Construction and Land Development |
Multifamily Real Estate |
Consumer and Other |
Total | |||||||||||||||||||||
| Grade |
||||||||||||||||||||||||||||
| Pass |
$ | 15,663 | $ | 76,304 | $ | 38,360 | $ | 25,267 | $ | 1,895 | $ | 1,555 | $ | 159,044 | ||||||||||||||
| Special Mention |
4,060 | 1,643 | 535 | 77 | 524 | 29 | 6,868 | |||||||||||||||||||||
| Substandard |
1,385 | 1,534 | 996 | 1,042 | — | 5 | 4,962 | |||||||||||||||||||||
| Doubtful |
— | — | 36 | — | — | — | 36 | |||||||||||||||||||||
|
|
|
|
|
|
|
|
|
|
|
|
|
|
|
|||||||||||||||
| Total |
$ | 21,108 | $ | 79,481 | $ | 39,927 | $ | 26,386 | $ | 2,419 | $ | 1,589 | $ | 170,910 | ||||||||||||||
|
|
|
|
|
|
|
|
|
|
|
|
|
|
|
|||||||||||||||
F-112
Table of Contents
Index to Financial Statements
MIDSOUTH BANK
Notes to Consolidated Financial Statements
December 31, 2013, 2012 and 2011
The following table breaks down the Bank’s credit quality indicators by type of loan as of December 31, 2012:
Credit Risk Profile by Internally Assigned Grade
| (In Thousands) |
Commercial, financial and agricultural |
Commercial Real Estate |
Residential Real Estate |
Construction and Land Development |
Multifamily Real Estate |
Consumer and Other |
Total | |||||||||||||||||||||
| Grade |
||||||||||||||||||||||||||||
| Pass |
$ | 10,519 | $ | 58,050 | $ | 36,343 | $ | 12,312 | $ | 545 | $ | 4,600 | $ | 122,369 | ||||||||||||||
| Special Mention |
4,133 | 734 | 1,300 | 2,864 | 543 | 35 | 9,609 | |||||||||||||||||||||
| Substandard |
2,037 | 2,538 | 2,878 | 1,395 | — | 6 | 8,854 | |||||||||||||||||||||
| Doubtful |
— | — | 46 | — | — | — | 46 | |||||||||||||||||||||
|
|
|
|
|
|
|
|
|
|
|
|
|
|
|
|||||||||||||||
| Total |
$ | 16,689 | $ | 61,322 | $ | 40,567 | $ | 16,571 | $ | 1,088 | $ | 4,641 | $ | 140,878 | ||||||||||||||
|
|
|
|
|
|
|
|
|
|
|
|
|
|
|
|||||||||||||||
Nonaccrual and Past Due Loans
The following table provides an aging analysis of the Bank’s past due loans as of December 31, 2013:
| (In Thousands) |
30-59 Days Past Due |
60-89 Days Past Due |
Greater than 90 Days or Nonaccrual |
Total Non-accrual and Past Due Loans |
Total Current Loans |
Total Loans |
Recorded Investment Past Due >90 Days and Still Accruing |
|||||||||||||||||||||
| Commercial, financial and agricultural |
$ | — | $ | — | $ | 1,256 | $ | 1,256 | $ | 19,852 | $ | 21,108 | $ | — | ||||||||||||||
| Real estate: |
||||||||||||||||||||||||||||
| Commercial |
— | — | 1,049 | 1,049 | 78,432 | 79,481 | — | |||||||||||||||||||||
| Residential |
— | — | 507 | 507 | 39,420 | 39,927 | — | |||||||||||||||||||||
| Construction and land development |
— | — | 673 | 673 | 25,713 | 26,386 | — | |||||||||||||||||||||
| Multifamily |
— | — | — | — | 2,419 | 2,419 | — | |||||||||||||||||||||
| Consumer and other |
— | — | — | — | 1,589 | 1,589 | — | |||||||||||||||||||||
|
|
|
|
|
|
|
|
|
|
|
|
|
|
|
|||||||||||||||
| Total |
$ | — | $ | — | $ | 3,485 | $ | 3,485 | $ | 167,425 | $ | 170,910 | $ | — | ||||||||||||||
|
|
|
|
|
|
|
|
|
|
|
|
|
|
|
|||||||||||||||
The following table provides an aging analysis of the Bank’s past due loans as of December 31, 2012:
| (In Thousands) |
30-59 Days Past Due |
60-89 Days Past Due |
Greater than 90 Days or Nonaccrual |
Total Non-accrual and Past Due Loans |
Total Current Loans |
Total Loans |
Recorded Investment Past Due >90 Days and Still Accruing |
|||||||||||||||||||||
| Commercial, financial and agricultural |
$ | — | $ | — | $ | 1,746 | $ | 1,746 | $ | 14,943 | $ | 16,689 | $ | — | ||||||||||||||
| Real estate: |
||||||||||||||||||||||||||||
| Commercial |
— | — | 1,820 | 1,820 | 59,502 | 61,322 | — | |||||||||||||||||||||
| Residential |
258 | — | 705 | 963 | 39,604 | 40,567 | — | |||||||||||||||||||||
| Construction and land development |
228 | — | 1,396 | 1,624 | 14,947 | 16,571 | — | |||||||||||||||||||||
| Multifamily |
— | — | — | — | 1,088 | 1,088 | — | |||||||||||||||||||||
| Consumer and other |
2 | — | 6 | 8 | 4,633 | 4,641 | — | |||||||||||||||||||||
|
|
|
|
|
|
|
|
|
|
|
|
|
|
|
|||||||||||||||
| Total |
$ | 488 | $ | — | $ | 5,673 | $ | 6,161 | $ | 134,717 | $ | 140,878 | $ | — | ||||||||||||||
|
|
|
|
|
|
|
|
|
|
|
|
|
|
|
|||||||||||||||
F-113
Table of Contents
Index to Financial Statements
MIDSOUTH BANK
Notes to Consolidated Financial Statements
December 31, 2013, 2012 and 2011
Troubled Debt Restructurings
The Bank’s loan portfolio includes certain loans that have been modified in a troubled debt restructuring (TDR), where economic concessions have been granted to borrowers who have experienced or are expected to experience financial difficulties. These concessions typically result from the Bank’s loss mitigation activities and could include reductions in the interest rate, payment extensions, forgiveness of principal, forbearance or other actions. Certain TDR’s are classified as nonperforming at the time of restructure and may only be returned to performing status after considering the borrower’s sustained repayment performance for a reasonable period, generally six months.
The following table summarizes the carrying balances of TDR’s at December 31, 2013 and 2012:
| Carrying Balance | ||||||||
| (In thousands) |
2013 | 2012 | ||||||
| Performing TDR’s |
$ | 1,073 | $ | 789 | ||||
| Nonperforming TDR’s |
1,887 | 3,207 | ||||||
|
|
|
|
|
|||||
| Total TDR’s |
$ | 2,960 | $ | 3,996 | ||||
|
|
|
|
|
|||||
Troubled debt restructurings may be removed from this status if both of the following conditions exist: (1) the restructuring agreement specifies an interest rate equal to or greater than the rate that the borrower was willing to accept at the time of the restructuring for a new loan with comparable risk; and (2) the loan is not impaired based on the terms specified by the restructuring agreement. Based on these criteria, there were no TDR’s removed from this classification during the years ended December 31, 2013 and 2012. During 2013, eight TDR’s were paid in full, three TDR’s were sold, and one TDR was charged off. During 2012, three TDR’s were paid in full, and one TDR was charged off. Any loans classified as TDR’s are evaluated for impairment by the Bank if they are not already impaired at the time of restructuring.
The following table summarizes loans that were modified as TDR’s during the periods indicated:
| For the year ended December 31, 2013 | ||||||||||||
| (In thousands, except number of contracts) |
Number of contracts |
Outstanding recorded investment before modification |
Outstanding recorded investment after modification |
|||||||||
| Commercial, financial and agricultural |
7 | $ | 1,045 | $ | 1,045 | |||||||
| Real estate: |
||||||||||||
| Commercial |
— | — | — | |||||||||
| Residential |
11 | 995 | 995 | |||||||||
| Construction and land development |
— | — | — | |||||||||
| Multifamily |
— | — | — | |||||||||
| Consumer and other |
— | — | — | |||||||||
|
|
|
|
|
|
|
|||||||
| Total |
18 | $ | 2,040 | $ | 2,040 | |||||||
|
|
|
|
|
|
|
|||||||
F-114
Table of Contents
Index to Financial Statements
MIDSOUTH BANK
Notes to Consolidated Financial Statements
December 31, 2013, 2012 and 2011
| For the year ended December 31, 2012 | ||||||||||||
| (In thousands, except number of contracts) |
Number of contracts |
Outstanding recorded investment before modification |
Outstanding recorded investment after modification |
|||||||||
| Commercial, financial and agricultural |
— | $ | — | $ | — | |||||||
| Real estate: |
||||||||||||
| Commercial |
— | — | — | |||||||||
| Residential |
3 | 433 | 433 | |||||||||
| Construction and land development |
— | — | — | |||||||||
| Multifamily |
— | — | — | |||||||||
| Consumer and other |
— | — | — | |||||||||
|
|
|
|
|
|
|
|||||||
| Total |
3 | $ | 433 | $ | 433 | |||||||
|
|
|
|
|
|
|
|||||||
(3) DEBT SECURITIES
Debt securities have been classified in the consolidated balance sheets according to management’s intent. The Bank’s classification of securities at December 31, 2013 and 2012 is as follows:
| 2013 | ||||||||||||||||
| Securities Available-for-Sale | ||||||||||||||||
| (In Thousands) |
Amortized Cost |
Gross Unrealized Gains |
Gross Unrealized Losses |
Estimated Market Value |
||||||||||||
| U.S. Treasury and other U.S. Government agencies and corporations |
$ | 5,877 | $ | 19 | $ | 1 | $ | 5,895 | ||||||||
| State and municipal securities |
26,097 | 4 | 1,562 | 24,539 | ||||||||||||
| Mortgage-backed securities |
47,196 | 401 | 181 | 47,416 | ||||||||||||
|
|
|
|
|
|
|
|
|
|||||||||
| $ | 79,170 | $ | 424 | $ | 1,744 | $ | 77,850 | |||||||||
|
|
|
|
|
|
|
|
|
|||||||||
| 2012 | ||||||||||||||||
| Securities Available-for-Sale | ||||||||||||||||
| (In Thousands) |
Amortized Cost |
Gross Unrealized Gains |
Gross Unrealized Losses |
Estimated Market Value |
||||||||||||
| U.S. Treasury and other U.S. Government agencies and corporations |
$ | 2,240 | $ | 21 | $ | 1 | $ | 2,260 | ||||||||
| State and municipal securities |
18,242 | 118 | 76 | 18,284 | ||||||||||||
| Mortgage-backed securities |
48,221 | 1,210 | 50 | 49,381 | ||||||||||||
|
|
|
|
|
|
|
|
|
|||||||||
| $ | 68,703 | $ | 1,349 | $ | 127 | $ | 69,925 | |||||||||
|
|
|
|
|
|
|
|
|
|||||||||
F-115
Table of Contents
Index to Financial Statements
MIDSOUTH BANK
Notes to Consolidated Financial Statements
December 31, 2013, 2012 and 2011
The amortized cost and estimated market value of available-for-sale securities at December 31, 2013, by contractual maturity, are shown below. Expected maturities will differ from contractual maturities because borrowers may have the right to call or prepay obligations with or without call or prepayment penalties.
| (In Thousands) |
Amortized Cost |
Estimated Market Value |
||||||
| Expected Maturity |
||||||||
| Due in one year or less |
$ | 1,220 | $ | 1,227 | ||||
| Due after one year through five years |
35,897 | 36,195 | ||||||
| Due after five years through ten years |
41,331 | 39,706 | ||||||
| Over ten years |
722 | 722 | ||||||
|
|
|
|
|
|||||
| $ | 79,170 | $ | 77,850 | |||||
|
|
|
|
|
|||||
There were gross proceeds of $15,591, gross gains of $194, and gross losses of $96 from sales of available-for-sale securities during 2013. There were gross proceeds of $500 and gross losses of $96 from one available-for-sale security called by the issuing agency during 2013. There were gross proceeds of $4,556, gross gains of $101, and gross losses of $90 from sales of available-for-sale securities during 2012. There were gross proceeds of $13,761, gross gains of $144, and no gross losses from sales of available-for-securities during 2011.
Securities carried in the consolidated balance sheets of approximately $6,362 (approximate book value of $6,332) and $7,244 (approximate book value of $7,022) at December 31, 2013 and 2012, respectively, were pledged to secure public deposits and for other purposes as required or permitted by law.
Securities that have rates that adjust prior to maturity totaled $2,035 (approximate market value of $2,059) and $2,408 (approximate market value of $2,440) at December 31, 2013 and 2012, respectively.
The following table shows the gross unrealized losses and fair values of the Bank’s investments aggregated by investment category and length of time that individual securities have been in continuous unrealized loss position, at December 31, 2013:
| In Thousands, Except Number of Securities | ||||||||||||||||||||||||||||||||
| Less than 12 Months | 12 Months or More | Total | ||||||||||||||||||||||||||||||
| Fair Value |
Unrealized Losses |
Number of Securities Included |
Fair Value |
Unrealized Losses |
Number of Securities Included |
Fair Value |
Unrealized Losses |
|||||||||||||||||||||||||
| U.S. Treasury and other U.S. Government agencies and corporations |
$ | 1,926 | $ | 1 | 2 | $ | — | $ | — | — | $ | 1,926 | $ | 1 | ||||||||||||||||||
| State and municipal securities |
21,564 | 1,469 | 31 | 1,224 | 93 | 3 | 22,788 | 1,562 | ||||||||||||||||||||||||
| Mortgage-backed securities |
16,856 | 181 | 15 | 158 | — | 1 | 17,014 | 181 | ||||||||||||||||||||||||
|
|
|
|
|
|
|
|
|
|
|
|
|
|
|
|
|
|||||||||||||||||
| Total temporarily impaired securities |
$ | 40,346 | $ | 1,651 | 48 | $ | 1,382 | $ | 93 | 4 | $ | 41,728 | $ | 1,744 | ||||||||||||||||||
|
|
|
|
|
|
|
|
|
|
|
|
|
|
|
|
|
|||||||||||||||||
These securities are considered high quality investments in line with normal industry investing practices. The unrealized losses are primarily the result of changes in the interest rate and sector environments. Consistent with the original classification as available-for-sale securities, the Bank does not intend to sell any of
F-116
Table of Contents
Index to Financial Statements
MIDSOUTH BANK
Notes to Consolidated Financial Statements
December 31, 2013, 2012 and 2011
the debt securities with unrealized losses and do not believe that it is more likely than not that the Bank will be required to sell a security in an unrealized loss position prior to a recovery in its value. Accordingly, the Bank has not recognized any other-than-temporary impairment in our consolidated statements of earnings.
The Bank may sell the above or other securities in the ordinary course of business in response to unexpected and significant changes in liquidity needs, unexpected and significant increases in interest rates and/or sector spreads that significantly extend the security’s holding period, or conducting a small volume of security transactions.
(4) RESTRICTED EQUITY SECURITIES
Restricted equity securities consist of stock of the Federal Reserve Bank and the FHLB of Cincinnati amounting to $840 and $709, respectively, at December 31, 2013. At December 31, 2012, restricted equity securities consisted of stock of the Federal Reserve Bank and the FHLB of Cincinnati amounting to $841 and $709, respectively. The stock can be sold back only at par or a value as determined by the issuing institution and only to the respective financial institution or to another member institution. These securities are recorded at cost.
During the year ended December 31, 2013, the Bank purchased restricted stock of the Federal Reserve Bank for $44 and sold a portion of its restricted stock of the Federal Reserve Bank for proceeds of $45, with no gain or loss realized. During the year ended December 31, 2012, the Bank purchased restricted stock of the Federal Reserve Bank for $49 and sold none of its restricted stock of the Federal Reserve Bank. During the year ended December 31, 2011, the Bank purchased restricted stock of the Federal Reserve Bank for $90 and sold a portion of its restricted stock of the Federal Reserve Bank for proceeds of $18, with no gain or loss realized.
(5) BANK PREMISES AND EQUIPMENT
The classification of premises and equipment at December 31, 2013 and 2012 are as follows:
| (In Thousands) |
2013 | 2012 | ||||||
| Land |
$ | 3,874 | $ | 3,874 | ||||
| Buildings |
5,691 | 5,637 | ||||||
| Furniture and equipment |
2,879 | 3,286 | ||||||
| Assets not in use |
12 | 13 | ||||||
| Construction in process |
139 | 126 | ||||||
|
|
|
|
|
|||||
| 12,595 | 12,936 | |||||||
| Less accumulated depreciation |
(3,953 | ) | (4,071 | ) | ||||
|
|
|
|
|
|||||
| $ | 8,642 | $ | 8,865 | |||||
|
|
|
|
|
|||||
Depreciation expense was $497, $446 and $542 for the years ended December 31, 2013, 2012 and 2011, respectively.
The Bank recorded a $1 loss on disposals of premises and equipment for the year ended December 31, 2013. The Bank recorded a $2 loss on disposals of premises and equipment for the year ended December 31, 2012. The Bank recorded a $321 loss on disposals of premises and equipment for the year ended December 31, 2011, which included abandonments and charges related to changes in the Bank’s plans related to its main office location.
F-117
Table of Contents
Index to Financial Statements
MIDSOUTH BANK
Notes to Consolidated Financial Statements
December 31, 2013, 2012 and 2011
(6) DEPOSITS
Deposits at December 31, 2013 and 2012 are summarized as follows:
| (In Thousands) |
2013 | 2012 | ||||||
| Demand deposits |
$ | 49,375 | $ | 38,901 | ||||
| Savings deposits |
2,791 | 2,487 | ||||||
| Negotiable order of withdrawal accounts |
44,085 | 35,747 | ||||||
| Money market deposit accounts |
69,728 | 60,071 | ||||||
| Certificates of deposit $100,000 or greater |
33,384 | 31,877 | ||||||
| Other certificates of deposit |
37,092 | 47,330 | ||||||
| Individual retirement accounts $100,000 or greater |
1,772 | 1,320 | ||||||
| Other individual retirement accounts |
3,721 | 4,019 | ||||||
|
|
|
|
|
|||||
| $ | 241,948 | $ | 221,752 | |||||
|
|
|
|
|
|||||
Principal maturities of certificates of deposit and individual retirement accounts at December 31, 2013 are as follows:
| (In Thousands) |
Total | |||
| 2014 |
$ | 57,026 | ||
| 2015 |
13,134 | |||
| 2016 |
3,472 | |||
| 2017 |
1,643 | |||
| 2018 |
681 | |||
| Thereafter |
13 | |||
|
|
|
|||
| $ | 75,969 | |||
|
|
|
|||
At December 31, 2013 and 2012, certificates of deposit and individual retirement accounts in denominations of $100,000 or more amounted to $35,156 and $33,197, respectively. Included in time deposits in denominations of $100,000 or more at December 31, 2013 and 2012, are approximately $32,544 and $31,070, respectively, of time deposits in denominations of $100,000 or greater through $250,000, as those qualify for expanded FDIC insurance coverage.
The aggregate amount of overdrafts reclassified as loans receivable was $43 and $9 at December 31, 2013 and 2012, respectively.
The Bank is required to maintain cash balances or balances with the Federal Reserve Bank or other correspondent banks based on certain percentages of deposit types. The average required amounts for the years ended December 31, 2013 and 2012 were approximately $1,997 and $1,491, respectively.
(7) SECURITIES SOLD UNDER AGREEMENT TO REPURCHASE
The following is a summary of information pertaining to securities sold under agreement to repurchase at December 31, 2013 and 2012:
| (In Thousands) |
2013 | 2012 | ||||||
| Ending balance |
$ | 980 | $ | 1,044 | ||||
| Weighted average interest rate at year-end |
0.25 | % | 0.22 | % | ||||
F-118
Table of Contents
Index to Financial Statements
MIDSOUTH BANK
Notes to Consolidated Financial Statements
December 31, 2013, 2012 and 2011
Securities sold under agreement to repurchase, which are classified as secured borrowings, generally mature within one to four days from the transaction date. Securities sold under agreement to repurchase are reflected at the amount of cash received in connection with the transaction. The Bank may be required to provide additional collateral based on the fair value of the underlying security. The securities sold under agreement to repurchase are collateralized by government agency and mortgage-backed securities held by the Bank.
Information concerning securities sold under agreement to repurchase is summarized below for the year ended December 31, 2013 and 2012:
| (In Thousands) |
2013 | 2012 | ||||||
| Average daily balance during the year |
$ | 685 | $ | 1,897 | ||||
| Maximum month-end balance during the year |
$ | 1,407 | $ | 3,903 | ||||
| Average interest rate during the year |
0.24 | % | 0.28 | % | ||||
(8) BORROWINGS
The Bank has executed a blanket pledge and security agreement with the FHLB of Cincinnati in the amount of $15,000 at December 31, 2013 and 2012, which encompasses certain types of loans as collateral for these borrowings. The maximum borrowing capacity for future borrowings, including term loans and the line of credit, was $11,507 and $15,000 at December 31, 2013 and 2012, respectively.
A summary of the Bank’s borrowings is as follows:
| (Dollars In Thousands) |
Principal | Interest rate |
Maturity date |
Total committed |
||||||||||||
| December 31, 2013 |
||||||||||||||||
| Short-term borrowings: |
||||||||||||||||
| FHLB cash management advance line |
$ | 5,000 | 0.11 | % | 1/7/2014 | $ | 15,000 | |||||||||
|
|
|
|
|
|||||||||||||
| Total short-term borrowings |
5,000 | 15,000 | ||||||||||||||
|
|
|
|
|
|||||||||||||
| Long-term borrowings: |
||||||||||||||||
| FHLB term note (fixed rate) |
— | — | % | |||||||||||||
|
|
|
|||||||||||||||
| Total long-term borrowings |
— | |||||||||||||||
|
|
|
|
|
|||||||||||||
| Total borrowings |
$ | 5,000 | $ | 15,000 | ||||||||||||
|
|
|
|
|
|||||||||||||
| December 31, 2012 |
||||||||||||||||
| Short-term borrowings: |
||||||||||||||||
| FHLB cash management advance line |
$ | — | — | % | $ | 15,000 | ||||||||||
|
|
|
|
|
|||||||||||||
| Total short-term borrowings |
— | 15,000 | ||||||||||||||
| Long-term borrowings: |
||||||||||||||||
| FHLB term note (fixed rate) |
— | — | % | |||||||||||||
|
|
|
|||||||||||||||
| Total long-term borrowings |
— | |||||||||||||||
|
|
|
|
|
|||||||||||||
| Total borrowings |
$ | — | $ | 15,000 | ||||||||||||
|
|
|
|
|
|||||||||||||
F-119
Table of Contents
Index to Financial Statements
MIDSOUTH BANK
Notes to Consolidated Financial Statements
December 31, 2013, 2012 and 2011
(9) NON-INTEREST INCOME AND NON-INTEREST EXPENSE
The significant components of non-interest income and non-interest expense for the years ended December 31 are presented below:
| (In Thousands) |
2013 | 2012 | 2011 | |||||||||
| Non-interest income: |
||||||||||||
| Service charges on deposit accounts |
$ | 356 | $ | 402 | $ | 400 | ||||||
| Fees on mortgage originations |
1,413 | 642 | 322 | |||||||||
| Fees from brokerage operations |
658 | 592 | 599 | |||||||||
| Other fees and commissions |
716 | 593 | 497 | |||||||||
| Gain on sales of foreclosed assets, net |
6 | 11 | — | |||||||||
| Gain on sale of available-for-sale securities |
2 | 11 | 144 | |||||||||
|
|
|
|
|
|
|
|||||||
| Total non-interest income |
$ | 3,151 | $ | 2,251 | $ | 1,962 | ||||||
|
|
|
|
|
|
|
|||||||
| (In Thousands) |
2013 | 2012 | 2011 | |||||||||
| Non-interest expense: |
||||||||||||
| Employee salaries and benefits |
$ | 5,985 | $ | 4,856 | $ | 4,399 | ||||||
| Occupancy expenses |
710 | 749 | 837 | |||||||||
| Furniture and equipment expense |
407 | 371 | 311 | |||||||||
| Professional fees |
900 | 571 | 467 | |||||||||
| Advertising expense |
148 | 151 | 170 | |||||||||
| Data processing expense |
582 | 499 | 441 | |||||||||
| Computer network expense |
162 | 141 | 101 | |||||||||
| Computer software amortization |
25 | 10 | 18 | |||||||||
| Loss on sales/disposals of premises and equipment |
1 | 2 | 321 | |||||||||
| Foreclosed asset expenses |
27 | 48 | 75 | |||||||||
| Loss on sales of foreclosed assets, net |
— | 8 | 148 | |||||||||
| Valuation losses on foreclosed assets |
— | 420 | — | |||||||||
| FDIC insurance |
194 | 213 | 501 | |||||||||
| Other operating expenses |
1,419 | 1,424 | 1,152 | |||||||||
|
|
|
|
|
|
|
|||||||
| Total non-interest expense |
$ | 10,560 | $ | 9,463 | $ | 8,941 | ||||||
|
|
|
|
|
|
|
|||||||
F-120
Table of Contents
Index to Financial Statements
MIDSOUTH BANK
Notes to Consolidated Financial Statements
December 31, 2013, 2012 and 2011
(10) INCOME TAXES
The components of the net deferred income tax asset at December 31, 2013 and 2012 were as follows:
| (In Thousands) |
2013 | 2012 | ||||||
| Deferred tax asset: |
||||||||
| Federal |
$ | 5,478 | $ | 5,654 | ||||
| State |
1,120 | 1,156 | ||||||
|
|
|
|
|
|||||
| 6,598 | 6,810 | |||||||
|
|
|
|
|
|||||
| Deferred tax liability: |
||||||||
| Federal |
114 | 626 | ||||||
| State |
24 | 128 | ||||||
|
|
|
|
|
|||||
| 138 | 754 | |||||||
|
|
|
|
|
|||||
| Total net deferred assets |
6,460 | 6,056 | ||||||
| Less valuation allowance |
(6,460 | ) | (6,056 | ) | ||||
|
|
|
|
|
|||||
| Net deferred assets |
$ | — | $ | — | ||||
|
|
|
|
|
|||||
The tax effects of each type of significant item that gave rise to deferred tax assets (liabilities) at December 31, 2013 and 2012 are:
| (In Thousands) |
2013 | 2012 | ||||||
| Financial statement allowance for loan losses in excess of the tax allowance |
$ | (4 | ) | $ | 335 | |||
| Net operating loss carry forward |
5,267 | 5,657 | ||||||
| Stock compensation expense recognized for financial statement purposes and deferred for tax purposes |
76 | 72 | ||||||
| Unrealized contributions carryovers |
7 | 7 | ||||||
| Stock dividends on FHLB stock recognized for financial statement purposes and deferred for tax purposes |
(9 | ) | (9 | ) | ||||
| Interest on non-accrual loans deferred for financial statement purposes and recognized for tax purposes |
135 | 132 | ||||||
| Capital loss carryover |
454 | 454 | ||||||
| Allowance for foreclosed assets recognized for financial statement purposes and deferred for tax purposes |
153 | 153 | ||||||
| Excess of depreciation deducted for tax purposes over the amounts deducted for financial statements |
(113 | ) | (264 | ) | ||||
| Loan fees recognized for tax purposes deferred for financial statements |
(12 | ) | (13 | ) | ||||
| Excess of estimated market value over amortized cost related to available-for-sale securities |
506 | (468 | ) | |||||
|
|
|
|
|
|||||
| 6,460 | 6,056 | |||||||
| Valuation allowance |
(6,460 | ) | (6,056 | ) | ||||
|
|
|
|
|
|||||
| $ | — | $ | — | |||||
|
|
|
|
|
|||||
Management reviews the Bank’s deferred tax assets for realization based upon historical taxable income, prudent and feasible tax planning strategies, the expected timing of the reversals of existing temporary differences and expected future taxable income. The Bank records a valuation allowance to reduce our deferred tax assets to the amount that management believes will more likely than not be realized.
F-121
Table of Contents
Index to Financial Statements
MIDSOUTH BANK
Notes to Consolidated Financial Statements
December 31, 2013, 2012 and 2011
The components of income tax expense (benefit) are summarized as follows:
| (In Thousands) |
2013 | 2012 | 2011 | |||||||||
| Current: |
||||||||||||
| Federal |
$ | — | $ | — | $ | — | ||||||
| State |
— | — | — | |||||||||
|
|
|
|
|
|
|
|||||||
| — | — | — | ||||||||||
|
|
|
|
|
|
|
|||||||
| Deferred: |
||||||||||||
| Federal |
473 | 524 | 353 | |||||||||
| State |
97 | 107 | 72 | |||||||||
|
|
|
|
|
|
|
|||||||
| 570 | 631 | 425 | ||||||||||
|
|
|
|
|
|
|
|||||||
| Change in valuation allowance related to realization of deferred tax assets |
(570 | ) | (631 | ) | (425 | ) | ||||||
|
|
|
|
|
|
|
|||||||
| Actual tax expense |
$ | — | $ | — | $ | — | ||||||
|
|
|
|
|
|
|
|||||||
A reconciliation of actual income tax expense (benefit) in the consolidated financial statements to the “expected” tax benefit (computed by applying the statutory Federal income tax rate of 34% to loss before income taxes) is as follows:
| (In Thousands) |
2013 | 2012 | 2011 | |||||||||
| Computed “expected” tax benefit |
$ | 511 | $ | 544 | $ | 361 | ||||||
| State income taxes, net of effect of Federal income taxes |
64 | 71 | 46 | |||||||||
| Disallowed deductions |
(5 | ) | 16 | 18 | ||||||||
| Benefit of book net operating losses not recognized |
— | — | — | |||||||||
| Reversal of valuation allowance related to deferred tax assets, net |
(570 | ) | (631 | ) | (425 | ) | ||||||
|
|
|
|
|
|
|
|||||||
| Actual tax expense |
$ | — | $ | — | $ | — | ||||||
|
|
|
|
|
|
|
|||||||
At December 31, 2013, the Bank has a net operating loss carry-forward for tax purposes of approximately $13,756 which are available to reduce Federal income taxes. Unused carry forwards begin to expire in 2025.
As of December 31, 2013 and December 31, 2012, the Bank did not have any unrecognized tax benefits. The Bank does not expect the total amount of unrecognized tax benefits to significantly increase or decrease in the next 12 months. The Bank recognizes interest related to income tax matters as interest expense and penalties related to income tax matters as other noninterest expense and did not have any accrued interest and/or penalties at December 31, 2013 or 2012. No interest or penalties related to tax matters was incurred during 2013 or 2012. The Bank and its subsidiary are subject to U.S. federal income tax as well as Tennessee state income tax.
(11) COMMITMENTS AND CONTINGENCIES
During November, 2004, the Bank entered into a ground lease for their branch location on Memorial Boulevard in Murfreesboro, Tennessee. The agreement provides for lease payments of $7 per month through November 2014. Thereafter, the lease payments will be adjusted every five years based on the change in the Consumer Price Index for the prior five-year lease term as provided by the Bureau of Labor Statistics of the United States Department of Labor. The ground lease expires in November 2024.
F-122
Table of Contents
Index to Financial Statements
MIDSOUTH BANK
Notes to Consolidated Financial Statements
December 31, 2013, 2012 and 2011
Future minimum payments under the remaining operating lease as of December 31, 2013 are as follows:
| (In Thousands) |
Total | |||
| Year Ending December 31, |
||||
| 2014 |
$ | 82 | ||
| 2015 |
82 | |||
| 2016 |
82 | |||
| 2017 |
82 | |||
| 2018 |
82 | |||
| Thereafter |
477 | |||
|
|
|
|||
| $ | 887 | |||
|
|
|
|||
Rental payments under all leases totaled $82 for each of the years ended December 31, 2013, 2012 and 2011, respectively.
The Bank has lines of credit with other financial institutions, including the FHLB, totaling $54,500. Included in these lines of credit is a fully-secured $25,000 reverse repurchase line of credit with one financial institution. At December 31, 2013, a $5,000 short-term advance from FHLB was outstanding under these lines of credit.
(12) FINANCIAL INSTRUMENTS WITH OFF-BALANCE-SHEET RISK
The Bank is party to financial instruments with off-balance-sheet risk in the normal course of business to meet the financing needs of its customers. These financial instruments consist primarily of commitments to extend credit. These instruments involve, to varying degrees, elements of credit risk in excess of the amount recognized in the consolidated balance sheets. The contract or notional amounts of those instruments reflect the extent of involvement the Bank has in particular classes of financial instruments.
The Bank’s exposure to credit loss in the event of nonperformance by the other party to the financial instrument for commitments to extend credit is represented by the contractual notional amount of those instruments. The Bank uses the same credit policies in making commitments and conditional obligations as it does for on-balance-sheet instruments.
| Contract or Notional Amount | ||||||||
| (In Thousands) |
2013 | 2012 | ||||||
| Financial instruments whose contract amount represent credit risk: |
||||||||
| Unused commitments to extend credit |
$ | 51,893 | $ | 41,391 | ||||
| Standby letters of credit |
1,008 | 677 | ||||||
|
|
|
|
|
|||||
| Total |
$ | 52,901 | $ | 42,068 | ||||
|
|
|
|
|
|||||
Commitments to extend credit are agreements to lend to a customer as long as there is no violation of any condition established in the contract. Commitments generally have fixed expiration dates or other termination clauses and may require payment of a fee. Since many of the commitments are expected to be drawn upon, the total commitment amounts generally represent future cash requirements. The Bank evaluates each customer’s credit-worthiness on a case-by-case basis. The amount of collateral, if deemed necessary by the Bank upon extension of credit, is based on management’s credit evaluation of the counterparty. Collateral normally consists of real property.
F-123
Table of Contents
Index to Financial Statements
MIDSOUTH BANK
Notes to Consolidated Financial Statements
December 31, 2013, 2012 and 2011
Standby letters of credit are conditional commitments issued by the Bank to guarantee the performance of a customer to a third party. Those guarantees are primarily issued to support public and private borrowing arrangements, including commercial paper, bond financing, and similar transactions. Most guarantees extend from one to two years. The credit risk involved in issuing letters of credit is essentially the same as that involved in extending loan facilities to customers. The fair value of standby letters of credit is estimated using the fees currently charged to enter into similar agreements, taking into account the remaining terms of the agreements, the likelihood of the counterparties drawing on such financial instruments and the present creditworthiness of such counterparties. Such commitments have been made on terms which are competitive in the markets in which the Bank operates, thus, the fair value of standby letters of credit equals the carrying value for the purposes of this disclosure. The maximum potential amount of future payments that the Bank could be required to make under the guarantees totaled $1,008 and $677 at December 31, 2013 and 2012, respectively.
(13) ON-BALANCE SHEET DERIVATIVE INSTRUMENTS AND HEDGING ACTIVITIES
Derivative Loan Commitments
Mortgage loan commitments are referred to as derivative loan commitments if the loans that will result from the exercise of the commitments will be held for sale upon funding. The Bank enters into commitments to fund residential mortgage loans at specified times in the future, with the intention that these loans will subsequently be sold in the secondary market. A mortgage loan commitment binds the Bank to lend funds to a potential borrower at a specified interest rate and within a specified period of time, generally up to 60 days after inception of the rate lock.
Outstanding derivative loan commitments expose the Bank to the risk that the price of the loans arising from exercise of the loan commitments might decline from inception of the rate locks to funding of the loans due to increases in mortgage interest rates. If interest rates increase, the values of these loan commitments decrease. Conversely, if interest rates decrease, the values of these loan commitments increases. The notional amount of undesignated mortgage loan commitments was $2,686 and $3,812 at December 31, 2013 and 2012, respectively. The total fair value of such commitments was immaterial as of December 31, 2013 and 2012.
Forward Loan Sale Commitments
To protect against the price risk inherent in derivative loan commitments, the Bank utilizes “best efforts” forward loan sale commitments to mitigate the risk of potential decreases in the values of loans that would result from the exercise of the derivative loan commitments.
With a “best efforts” contract, the Bank commits to deliver an individual mortgage loan of a specified principal amount and quality to an investor if the loan to the underlying borrower closes. Generally, the price the investor will pay the seller for an individual loan is specified prior to the loans being funded (e.g., on the same day the lender commits to lend funds to a potential borrower).
The Bank expects that these forward loan sales commitments will experience changes in fair values opposite to the change in fair values of derivative loan commitments. The notional amount of undesignated forward loan sale commitments was $2,029 and $2,841 at December 31, 2013 and 2012, respectively. The total fair value of such commitments was immaterial as of December 31, 2013 and 2012.
F-124
Table of Contents
Index to Financial Statements
MIDSOUTH BANK
Notes to Consolidated Financial Statements
December 31, 2013, 2012 and 2011
(14) CONCENTRATION OF CREDIT RISK
Practically all of the Bank’s loans, commitments, and commercial and standby letters of credit have been granted to customers in the Bank’s market area. Practically all such customers are depositors of the Bank. The concentrations of credit by type of loan are set forth in note 2 to the consolidated financial statements.
At December 31, 2013 and 2012, the Bank had no cash and due from banks included in commercial bank deposits in excess of the Federal Deposit Insurance Corporation limit of $250,000 per institution.
(15) REGULATORY MATTERS AND RESTRICTIONS ON DIVIDENDS
The Bank is subject to regulatory capital requirements administered by the Board of Governors of the Federal Reserve System and the Tennessee Department of Financial Institutions. Failure to meet capital requirements can initiate certain mandatory—and possibly additional discretionary—actions by regulators that could, in that event, have a direct material effect on the institution’s consolidated financial statements. The relevant regulations require the Bank to meet specific capital adequacy guidelines that involve quantitative measures of the Bank’s assets, liabilities and certain off-balance sheet items as calculated under regulatory accounting principles. The Bank’s capital classifications are also subject to qualitative judgments by the Regulators about components, risk weightings and other factors. Those qualitative judgments could also affect the Bank’s capital status and the amount of dividends the Bank may distribute.
Quantitative measures established by regulation to ensure capital adequacy require the Bank to maintain minimum amounts and ratios (set forth in the following table) of total and Tier 1 capital (as defined in the regulations) to risk-weighted assets (as defined) and of Tier 1 capital (as defined) to average assets (as defined). Management believes, as of December 31, 2013 and 2012, that the Bank meets all capital adequacy requirements to which they are subject.
As of December 31, 2012, the most recent notification from the Federal Deposit Insurance Corporation categorized the Bank as “well-capitalized” under the regulatory framework for prompt corrective action. To be categorized as “well-capitalized”, an institution must maintain minimum total risk-based, Tier 1 risk-based and Tier 1 leverage ratios set forth in the following tables. There are no conditions or events since the notification that management believes have changed the Bank’s category.
The Bank’s actual capital amounts and ratios as of December 31, 2013 and 2012 are also presented in the following table:
| Actual | Minimum Capital Requirement |
Minimum To Be Well- Capitalized Under Prompt Corrective Action Provisions |
||||||||||||||||||||||
| (Dollars In Thousands) |
Amount | Ratio | Amount | Ratio | Amount | Ratio | ||||||||||||||||||
| December 31, 2013: |
||||||||||||||||||||||||
| Total capital to risk weighted assets |
$ | 31,621 | 15.0 | % | $ | 16,840 | 8.0 | % | $ | 21,050 | 10.0 | % | ||||||||||||
| Tier 1 capital to risk weighted assets |
$ | 28,987 | 13.8 | % | $ | 8,420 | 4.0 | % | $ | 12,630 | 6.0 | % | ||||||||||||
| Tier 1 capital to average assets |
$ | 28,987 | 10.7 | % | $ | 10,807 | 4.0 | % | $ | 13,509 | 5.0 | % | ||||||||||||
| December 31, 2012: |
||||||||||||||||||||||||
| Total capital to risk weighted assets |
$ | 29,537 | 17.8 | % | $ | 13,302 | 8.0 | % | $ | 16,628 | 10.0 | % | ||||||||||||
| Tier 1 capital to risk weighted assets |
$ | 27,446 | 16.5 | % | $ | 6,651 | 4.0 | % | $ | 9,977 | 6.0 | % | ||||||||||||
| Tier 1 capital to average assets |
$ | 27,446 | 11.2 | % | $ | 9,789 | 4.0 | % | $ | 12,236 | 5.0 | % | ||||||||||||
F-125
Table of Contents
Index to Financial Statements
MIDSOUTH BANK
Notes to Consolidated Financial Statements
December 31, 2013, 2012 and 2011
(16) PREFERRED STOCK
Since December 2009, MidSouth Bank has issued non-cumulative convertible preferred stock through two separate offerings: 1) Series 2009A Preferred Stock; and 2) Series 2011-A Preferred Stock. Both of these issues of preferred stock are discussed in the paragraphs that follow.
During December 2009, the Bank issued 415,190 shares of non-cumulative convertible Series 2009A Preferred Stock. The issuance resulted in additional capital of $2,027, net of stock issuance costs. During 2010, the Bank issued an additional 609,538 shares of non-cumulative convertible Series 2009A Preferred Stock. The 2010 issuance resulted in additional capital of $2,956, net of stock issuance costs. During 2011, 2,000 shares of Series 2009A Preferred Stock were converted to 4,000 shares of the Bank’s common stock. During 2013, 5,171 shares of Series 2009A Preferred Stock were converted to 10,342 shares of the Bank’s common stock. There were no shares of Series 2009A Preferred Stock converted to common stock during 2012. Since each share of this series of preferred stock is convertible into two shares of common stock, there was no effect on the Bank’s total capital by either of the conversions noted in 2011 and 2013.
The liquidation preference for the Series 2009A Preferred Stock is $5.00 per share. The Series 2009A Preferred Stock is not redeemable. Each share of Series 2009A Preferred Stock will automatically convert into shares of the Bank’s common stock on March 31, 2015, subject to certain limitations. Each share of Series 2009A Preferred Stock is convertible into two shares of the Company’s common stock. Additionally, anyone who purchased the Series 2009A Preferred Stock received one detachable warrant to purchase one share of the Bank’s common stock for every five shares of the Series 2009A Preferred Stock that they purchased. These detachable warrants and their related terms are discussed further in Footnote 17.
As of December 31, 2013, 2012 and 2011, there were 1,017,557, 1,022,728, and 1,022,728 shares of Series 2009A Preferred Stock outstanding, respectively.
On March 22, 2011, the Bank initiated an offering of shares of non-cumulative convertible Series 2011-A Preferred Stock that ended on June 30, 2011. The sales of this series of preferred stock resulted in the issuance of 242,350 shares of Series 2011-A Preferred Stock, which amounted to additional capital of $1,325, net of issuance costs. The liquidation preference for the Series 2011-A Preferred Stock is $5.00 per share, and this series of preferred stock is non-redeemable. Each share of Series 2011-A Preferred Stock is convertible into two shares of the Bank’s common stock by the shareholder at any time, but if not converted voluntarily by the shareholder, each share of this preferred stock will automatically convert into two shares of the Bank’s common stock on May 31, 2016, subject to certain limitations. Additionally, anyone who purchased the Series 2011-A Preferred Stock received one detachable warrant to purchase one share of the Bank’s common stock for every five shares of the Series 2011-A Preferred Stock that they purchased. These detachable warrants and their related terms are discussed further in Footnote 17.
There were 242,350 shares of Series 2011-A Preferred Stock outstanding as of December 31, 2013, 2012, and 2011.
(17) STOCK WARRANTS
Detachable Warrants Issued with Preferred Stock
As part of the original offering of Series 2009A Preferred Stock, for every five shares of Series 2009A Preferred Stock purchased, a shareholder received one detachable warrant which provides the shareholder the
F-126
Table of Contents
Index to Financial Statements
MIDSOUTH BANK
Notes to Consolidated Financial Statements
December 31, 2013, 2012 and 2011
ability to purchase one share of common stock. The purchase price for the common stock shares from these warrants is equal to 75% of the fully converted book value of the Bank’s common stock as of the previous quarter-end date (unaudited). The exercise price cannot, however, exceed $10.00 per share or be less than $2.50 per share. The exercise price for these warrants as of December 31, 2013 was $3.25 per share based on a fully converted book value of $4.33 as of December 31, 2013. For each recipient, the warrants received are required to be exercised by March 31, 2016. At that time the warrants will expire. During 2013, there were 3,004 Series 2009A warrants exercised. During 2012, there were 6,369 Series 2009A warrants exercised. During 2011, there were 965 Series 2009A warrants exercised. There were 193,221, 196,225 and 202,594 Series 2009A warrants outstanding as of December 31, 2013, 2012 and 2011, respectively. As of December 31, 2013, 2012 and 2011, each Series 2009A detachable warrant had a fair value of $0.01 per share, $0.01 per share and $0.03 per share, respectively. The fair value of the outstanding detachable warrants that were issued in tandem with the Series 2009A Preferred Stock was determined to be approximately $10, $15 and $30 at December 31, 2013, 2012 and 2011, respectively.
In addition, as part of the offering of Series 2011-A Preferred Stock, for every five shares of Series 2011-A Preferred Stock purchased, the shareholder received one detachable warrant which provided the shareholder the ability to purchase one share of common stock. The purchase price for the common stock shares from these warrants is equal to 85% of the fully converted book value of the Bank’s common stock as of the previous quarter-end date (unaudited). The exercise price cannot, however, exceed $11.00 per share or be less than $2.75 per share. The exercise price for the Series 2011-A warrants as of December 31, 2013 was $3.68 per share based on a fully converted book value of $4.33 as of December 31, 2013. For each recipient, the warrants received are required to be exercised by May 31, 2017. At that time the warrants will expire. A total of 48,469 warrants were issued with the Series 2011-A Preferred Stock. During 2013, 4,000 Series 2011-A warrants were exercised, and during 2012, 928 Series 2011-A warrants were exercised. There were 43,541, 47,541 and 48,469 Series 2011-A warrants outstanding as of December 31, 2013, 2012 and 2011, respectively. As of December 31, 2013, each Series 2011-A detachable warrant had a fair value of $0.02, as of December 31, 2012 each Series 2011-A detachable warrant had a fair value of $0.02 per share and as of December 31, 2011, each Series 2011-A detachable warrant had a fair value of $0.04 per share. The fair value of the detachable warrants that were issued in tandem with the Series 2011-A Preferred Stock was determined to be approximately $5 at both December 31, 2013 and 2012.
The fair value of both series of the detachable warrants as of December 31, 2013 was estimated using the Black-Scholes warrant pricing model and the following assumptions:
| Series 2009A Warrants |
Series 2011-A Warrants |
|||||||
| Risk free interest rate |
2.10 | % | 2.10 | % | ||||
| Expected life of warrants |
2.25 years | 3.42 years | ||||||
| Expected dividend yield |
0.00 | % | 0.00 | % | ||||
| Expected volatility |
15 | % | 15 | % | ||||
As of December 31, 2013, each Series 2009A detachable warrant had a fair value of $0.011 per share. The fair value of the Series 2009A Preferred Stock and the fair value of the detachable warrants were summed, and the carrying amounts for the Series 2009A Preferred Stock and the detachable warrants were calculated based on an allocation of the two fair value components. The aggregate fair value result for both the Series 2009A Preferred Stock outstanding and the related detachable warrants was calculated to be $5,088, with 0.2% of this aggregate total allocated to the detachable warrants and 99.8% allocated to the Series 2009A Preferred Stock. As a result of this allocation, the detachable warrants had a fair value of $10, and the Series 2009A Preferred Stock had a fair value of $5,078 as of December 31, 2013.
F-127
Table of Contents
Index to Financial Statements
MIDSOUTH BANK
Notes to Consolidated Financial Statements
December 31, 2013, 2012 and 2011
As of December 31, 2013, each Series 2011-A detachable warrant had a fair value of $0.021 per share. The fair value of the Series 2011-A Preferred Stock and the fair value of the detachable warrants were summed, and the carrying amounts for the Series 2011-A Preferred Stock and the detachable warrants were calculated based on an allocation of the two fair value components. The aggregate fair value result for both the Series 2011-A Preferred Stock and the related detachable warrants was calculated to be $1,333, with 0.4% of this aggregate total allocated to the detachable warrants and 99.6% allocated to the Series 2011-A Preferred Stock. As a result of this allocation, the detachable warrants had a fair value of $5, and the Series 2011-A Preferred Stock had a fair value of $1,328 as of December 31, 2013.
(18) STOCK OPTION ARRANGEMENT
In October, 2004, the shareholders of the Bank approved the MidSouth Bank 2004 Stock Option Arrangement (the “Arrangement”). The Arrangement provided for the granting of stock options, and authorized the issuance of common stock upon the exercise of such options, for up to 380,000 shares of common stock to employees and organizers of the Bank and up to 143,080 shares of common stock for future use as decided by the Board of Directors.
Under the Arrangement, stock option awards were granted in the form of incentive stock options or non-statutory stock options, and were generally exercisable for up to ten years following the date such option awards are granted. Exercise prices of incentive stock options must be equal to or greater than 100% of the fair market value of the common stock on the grant date and generally vest at the end of four years. Certain option awards provide for accelerated vesting if there is a change in control (as defined in the Arrangement).
The fair value of each option award is estimated on the date of grant using the Black-Scholes option pricing model that uses the assumptions noted in the following table. Expected volatility is based on the historical volatility of the Bank’s common stock and other factors. The Bank uses historical data to estimate option exercise and employee termination with the valuation model. The expected term of options granted represents the period of time that options granted are expected to be outstanding. The risk-free rate for periods within the contractual life of the option is based on the U.S. Treasury yield curve in effect at the time of grant. No options were granted during 2013, 2012 or 2011.
During 2012, the Board of Directors of MidSouth Bank evaluated the Bank’s financial improvement since 2009, and to reward and incent the Bank’s personnel and directors for the progress made by the Bank during the recessionary period, the Board elected to change the exercise price of the options that were outstanding at November 30, 2012 to $3.65 per share. This was done through the issuance of amendments to the original stock option agreements, and the value was based upon a valuation of the Bank’s stock that was conducted by an independent third party located outside the Bank’s local market. As of November 30, 2012, there were 334,800 stock options repriced, and the options outstanding and exercisable at December, 31, 2012 are shown in the table below.
In addition to changing the exercise price of the options, the outstanding options became non-incentive stock options, and a new vesting schedule was established for the options. The new vesting schedule was established as 20% vesting each year on December 31, with the first vesting occurring on December 31, 2012 and the vesting period extending through December 31, 2016. The expiration date of the options was also changed to December 31, 2032.
F-128
Table of Contents
Index to Financial Statements
MIDSOUTH BANK
Notes to Consolidated Financial Statements
December 31, 2013, 2012 and 2011
The following table is a summary of the Bank’s stock options as of December 31, 2013:
| Option Activity |
Shares | Weighted Average Exercise Price Per Share |
Weighted Average Remaining Contractual Maturity In Years |
Aggregate Intrinsic Value (In 000’s) |
||||||||||||
| Outstanding at December 31, 2010 |
384,800 | $ | 9.71 | |||||||||||||
| Granted |
— | — | ||||||||||||||
| Exercised |
— | — | ||||||||||||||
| Forfeited |
(19,000 | ) | 9.47 | |||||||||||||
|
|
|
|
|
|||||||||||||
| Outstanding at December 31, 2011 |
365,800 | 9.72 | ||||||||||||||
| Granted |
— | — | ||||||||||||||
| Exercised |
— | — | ||||||||||||||
| Forfeited |
(31,000 | ) | 10.00 | |||||||||||||
|
|
|
|
|
|||||||||||||
| Outstanding at December 31, 2012 |
334,800 | 3.65 | ||||||||||||||
| Granted |
— | — | ||||||||||||||
| Exercised |
— | — | ||||||||||||||
| Forfeited |
(8,500 | ) | 3.65 | |||||||||||||
|
|
|
|
|
|
|
|
|
|||||||||
| Outstanding at December 31, 2013 |
326,300 | $ | 3.65 | 19.0 | $ | 244 | ||||||||||
|
|
|
|
|
|
|
|
|
|||||||||
| Exercisable at December 31, 2013 |
130,520 | $ | 3.65 | 19.0 | $ | 49 | ||||||||||
|
|
|
|
|
|
|
|
|
|||||||||
There was no intrinsic value in stock options exercised during the years ended December 31, 2013 and 2012 since there were no options exercised during these periods. The weighted average grant-date fair value of options at December 31, 2013 was $0.73. As of December 31, 2013, there were 155,080 stock options that were available to issue under the Arrangement.
As of December 31, 2013, there was $37 of total unrecognized compensation cost related to non-vested share-based compensation granted under the Arrangement. The cost is expected to be recognized over a weighted-average period of 2.0 years. The total fair value of shares vested during the years ended December 31, 2013 and 2012 was $47 and $49, respectively. Compensation cost recognized for the years ended December 31, 2013, 2012 and 2011 totaled $12, $19 and $11, respectively.
(19) ADDITIONAL RELATED PARTY TRANSACTIONS
In the normal course of business, the Bank utilizes legal and landscaping services which are provided by companies with board member relationships. During 2013, 2012 and 2011, the fees paid to these companies were insignificant.
(20) RETIREMENT PLAN
The Bank has in effect a 401(k) retirement plan that covers eligible employees. To participate in the plan an employee must have reached the age of 18. The provisions of the plan provide for both employee and employer contributions; however, the employer match was suspended beginning in April 2009 as part of the bank’s expense reduction initiative, and the suspension of the employer match continued through the year ended December 31, 2012. During 2013, the employer match was reinstated, and as a result, the Bank contributed $121 to this plan during the year ended December 31, 2013. The Bank made no contributions to this plan during the years ended December 31, 2012 and 2011.
F-129
Table of Contents
Index to Financial Statements
MIDSOUTH BANK
Notes to Consolidated Financial Statements
December 31, 2013, 2012 and 2011
(21) EARNINGS PER COMMON SHARE
ASC 260, Earnings Per Share, establishes uniform standards for computing and presenting earnings per share. The computation of basic earnings per share is based on the weighted average number of common shares outstanding during the period. For the Bank the computation of diluted earnings per share begins with basic earnings per share plus the effect of common shares contingently issuable from convertible preferred stock, stock options and warrants.
The following is a summary of the components comprising basic and diluted earnings per common share (EPS):
| (In Thousands, Except Share and Per Share Amounts) |
2013 | 2012 | 2011 | |||||||||
| Basic EPS Computation: |
||||||||||||
| Numerator—Earnings for the year |
$ | 1,504 | $ | 1,601 | $ | 1,062 | ||||||
| Denominator—Weighted average number of common shares outstanding |
3,866,283 | 3,853,321 | 3,846,611 | |||||||||
|
|
|
|
|
|
|
|||||||
| Basic earnings per common share |
$ | 0.39 | $ | 0.42 | $ | 0.28 | ||||||
|
|
|
|
|
|
|
|||||||
| Diluted EPS Computation: |
||||||||||||
| Numerator—Earnings for the year |
$ | 1,504 | $ | 1,601 | $ | 1,062 | ||||||
| Denominator: |
||||||||||||
| Weighted average number of common shares outstanding |
3,866,283 | 3,853,321 | 3,846,611 | |||||||||
| Dilutive effect of preferred stock |
2,523,866 | 2,530,156 | 2,392,057 | |||||||||
| Dilutive effect of stock options |
45,127 | 93,088 | — | |||||||||
| Dilutive effect of warrants |
57,469 | 76,195 | — | |||||||||
|
|
|
|
|
|
|
|||||||
| 6,492,745 | 6,552,760 | 6,238,668 | ||||||||||
|
|
|
|
|
|
|
|||||||
| Diluted earnings per common share |
$ | 0.23 | $ | 0.24 | $ | 0.17 | ||||||
|
|
|
|
|
|
|
|||||||
The effects of stock option exercises and warrant purchases in the diluted earnings per share calculation were considered to be zero for 2011 since the impact of the exercise of these derivative securities would be accretive and, thus, anti-dilutive due to average exercise prices exceeding the market values in the cases of both the stock options and the warrants.
(22) FAIR VALUE
The Bank applies ASC 820, Fair Value Measurements and Disclosures, which defines fair value as an exit price, representing the amount that would be received to sell an asset or paid to transfer a liability in an orderly transaction between market participants. Under ASC 820, fair value measurements are not adjusted for transaction costs. ASC 820 establishes a fair value hierarchy that prioritizes the inputs to valuation techniques used to measure fair value. The hierarchy gives the highest priority to unadjusted quoted prices in active markets for identical assets or liabilities (level 1 measurements) and the lowest priority to unobservable inputs (level 3 measurements). The three levels of the fair value hierarchy under ASC 820 are described below:
Basis of Fair Value Measurement:
Level 1—Unadjusted quoted prices in active markets that are accessible at the measurement date for identical, unrestricted assets.
F-130
Table of Contents
Index to Financial Statements
MIDSOUTH BANK
Notes to Consolidated Financial Statements
December 31, 2013, 2012 and 2011
Level 2—Significant other observable inputs other than Level 1 prices such as quoted prices in markets that are not active, quoted prices for similar assets, or other inputs that are observable, either directly or indirectly, for substantially the full term of the asset.
Level 3—Significant unobservable inputs that reflect a reporting entity’s own assumptions about the assumptions that market participants would use in pricing an asset or liability.
A financial instrument’s level within the fair value hierarchy is based on the lowest level of input that is significant to the fair value measurement.
The fair values of securities available-for-sale are generally determined by matrix pricing, which is a mathematical technique widely used in the industry to value debt securities without relying exclusively on quoted prices for the specific securities but rather by relying on the securities’ relationship to other benchmark quoted securities (Level 2 inputs).
The carrying value of bank-owned life insurance is determined using financial information received from insurance carriers indicating the performance of the insurance policies and cash surrender values. The Bank reflects this asset within Level 3 of the valuation hierarchy due to the unobservable inputs included in the valuation of these items. The Bank does not consider the fair values of these policies to be materially sensitive to changes in these unobservable inputs.
The fair value of loans held for sale is based upon binding contracts and quotes from third party investors (Level 2 inputs).
Impaired loans are evaluated and valued at the time the loan is identified as impaired, at the lower of cost or fair value. Fair value is measured based on the value of the collateral securing these loans and is classified at a level 3 in the fair value hierarchy. Collateral may be real estate and/or business assets including equipment, inventory and/or accounts receivable and is determined based on appraisals performed by qualified licensed appraisers hired by the Bank. Appraised and reported values may be discounted based on management’s historical knowledge, changes in market conditions from the time of valuation, and/or management’s expertise and knowledge of the client and client’s business. Such discounts are typically significant and result in a Level 3 classification of the inputs for determining fair value. Impaired loans are reviewed and evaluated on at least a quarterly basis for additional impairment and adjusted accordingly, based on the same factors identified above.
Level 3 is for positions that are not traded in active markets or are subject to transfer restrictions, and/or where valuations are adjusted to reflect illiquidity and/or non-transferability. Such adjustments are generally based on available market evidence. In the absence of such evidence, management’s best estimate is used.
F-131
Table of Contents
Index to Financial Statements
MIDSOUTH BANK
Notes to Consolidated Financial Statements
December 31, 2013, 2012 and 2011
Financial Assets and Liabilities Measured at Fair Value on a Recurring Basis
Financial assets and liabilities measured at fair value on a recurring basis at December 31, 2013 are summarized below:
| Quoted Prices in Active Markets for Identical Assets (Level 1) |
Significant Other Observable Inputs (Level 2) |
Significant Unobservable Inputs (Level 3) |
Carrying Value as of December 31, 2013 |
|||||||||||||
| (In thousands) | ||||||||||||||||
| Assets at December 31, 2013 |
||||||||||||||||
| Securities available-for-sale |
$ | 13,134 | $ | 64,716 | $ | — | $ | 77,850 | ||||||||
| Cash surrender value of bank-owned life insurance |
— | — | 3,090 | 3,090 | ||||||||||||
Financial assets and liabilities measured at fair value on a recurring basis at December 31, 2012 are summarized below:
| Quoted Prices in Active Markets for Identical Assets (Level 1) |
Significant Other Observable Inputs (Level 2) |
Significant Unobservable Inputs (Level 3) |
Carrying Value as of December 31, 2012 |
|||||||||||||
| (In thousands) | ||||||||||||||||
| Assets at December 31, 2012 |
||||||||||||||||
| Securities available-for-sale |
$ | 2,260 | $ | 67,665 | $ | — | $ | 69,925 | ||||||||
The table below presents a reconciliation and income statement classification of gains and losses for all financial assets measured at fair value on a recurring basis using significant unobservable inputs (Level 3) for the year ended December 31, 2013 and 2012:
Fair Value Measurements Using Significant Unobservable Inputs (Level 3)
| Carrying Value | ||||||||
| (In Thousands) |
2013 | 2012 | ||||||
| Opening Balance, January 1 |
$ | — | $ | 2,221 | ||||
| Total unrealized gains (losses) included in: |
||||||||
| Net Income |
90 | — | ||||||
| Other comprehensive income |
— | 49 | ||||||
| Purchases, sales, issuances and settlements, net |
3,000 | — | ||||||
| Transfers in and (out) of level three |
— | (2,270 | ) | |||||
|
|
|
|
|
|||||
| Ending Balance, December 31 |
$ | 3,090 | $ | — | ||||
|
|
|
|
|
|||||
F-132
Table of Contents
Index to Financial Statements
MIDSOUTH BANK
Notes to Consolidated Financial Statements
December 31, 2013, 2012 and 2011
Financial Assets and Liabilities Measured at Fair Value on a Non-Recurring Basis
The following table represents financial assets and liabilities measured at fair value on a non-recurring basis as of December 31, 2013. The valuation methodology used to measure the fair value of these loans is described earlier in this footnote.
| (In thousands) |
Quoted Prices in Active Markets for Identical Assets (Level 1) |
Significant Other Observable Inputs (Level 2) |
Significant Unobservable Inputs (Level 3) |
Carrying Value as of December 31, 2013 |
||||||||||||
| (In thousands) | ||||||||||||||||
| Assets at December 31, 2013 |
||||||||||||||||
| Impaired loans, net |
$ | — | $ | — | $ | 4,419 | $ | 4,419 | ||||||||
| Loans held for sale |
$ | — | $ | 2,029 | $ | — | $ | 2,029 | ||||||||
The following table represents financial assets and liabilities measured at fair value on a non-recurring basis as of December 31, 2012. The valuation methodology used to measure the fair value of these loans is described earlier in this footnote.
| Quoted Prices in Active Markets for Identical Assets (Level 1) |
Significant Other Observable Inputs (Level 2) |
Significant Unobservable Inputs (Level 3) |
Carrying Value as of December 31, 2012 |
|||||||||||||
| (In thousands) | ||||||||||||||||
| Assets at December 31, 2012 |
||||||||||||||||
| Impaired loans, net |
$ | — | $ | — | $ | 6,790 | $ | 6,790 | ||||||||
| Loans held for sale |
$ | — | $ | 2,841 | $ | — | $ | 2,841 | ||||||||
Loans held for sale, which are carried at the lower of cost or fair value, did not have an impairment charge for 2013 or 2012.
Impaired loans, which are measured for impairment using the fair value of the collateral for collateral dependent loans, had carrying amounts of $4,731 and $7,723 as of December 31, 2013 and 2012, respectively, with valuation allowances of $312 and $933 as of December 31, 2013 and 2012, respectively.
Non-financial Assets and Liabilities Measured at Fair Value on a Non-Recurring Basis
The following represent nonfinancial assets and liabilities measured at fair value on a non-recurring basis as of December 31, 2013. The valuation methodology used to measure the fair value of foreclosed assets is described below.
| Quoted Prices in Active Markets for Identical Assets (Level 1) |
Significant Other Observable Inputs (Level 2) |
Significant Unobservable Inputs (Level 3) |
Carrying Value as of December 31, 2013 |
|||||||||||||
| (In thousands) | ||||||||||||||||
| Assets at December 31, 2013 |
||||||||||||||||
| Foreclosed assets |
$ | — | $ | — | $ | 800 | $ | 800 | ||||||||
F-133
Table of Contents
Index to Financial Statements
MIDSOUTH BANK
Notes to Consolidated Financial Statements
December 31, 2013, 2012 and 2011
The following represent nonfinancial assets and liabilities measured at fair value on a non-recurring basis as of December 31, 2012. The valuation methodology used to measure the fair value of foreclosed assets is described below.
| Quoted Prices in Active Markets for Identical Assets (Level 1) |
Significant Other Observable Inputs (Level 2) |
Significant Unobservable Inputs (Level 3) |
Carrying Value as of December 31, 2012 |
|||||||||||||
| (In thousands) | ||||||||||||||||
| Assets at December 31, 2012 |
||||||||||||||||
| Foreclosed assets |
$ | — | $ | — | $ | 800 | $ | 800 | ||||||||
Foreclosed assets are valued at the time the loan is foreclosed upon and the asset is transferred to foreclosed assets. The value is based primarily on third party appraisals, less costs to sell. The appraisals are generally discounted based on management’s historical knowledge, changes in market conditions from the time of valuation, and/or management’s expertise and knowledge of the client and the client’s business. Such discounts are typically significant and result in a Level 3 classification of inputs for determining fair value. Foreclosed assets are reviewed and evaluated on at least an annual basis for additional impairment and adjusted accordingly, based on the same factors identified above. Foreclosed assets had a carrying amount of $800 at both December 31, 2013 and 2012, which is made up of an outstanding balance of $1,200 with a $400 valuation allowance. Changes in the valuation allowance on foreclosed assets outstanding at December 31, 2012 resulted in a write-down of $400 in addition to a write-down of $20 that had been recorded earlier in 2012.
Cash and short-term investments
For those short-term instruments, the carrying amount is a reasonable estimate of fair value.
Certificates of Deposit at Other Financial Institutions
Fair values for certificates of deposit at other financial institutions are estimated using a discounted cash flow analysis that applies interest currently being offered on certificates to a schedule of aggregated contractual maturities on such instruments.
Restricted Equity Securities
The carrying amount for these securities is a reasonable estimate of their fair value.
Securities
The carrying amounts for short-term securities approximate fair value because they mature in 90 days or less and do not present unanticipated credit concerns. The fair value of longer-term securities and mortgage-backed securities is estimated based on bid prices published in financial newspapers or bid quotations received from securities dealers. The fair value of certain state and municipal securities is not readily available through market sources other than dealer quotations, so fair value estimates are based on quoted market prices of similar instruments, adjusted for differences between the quoted instruments and the instruments being valued.
Accounting standards specify that fair values should be calculated based on the value of one unit without regard to any premium or discount that may result from concentrations of ownership of a financial instrument, possible tax ramifications, or estimated transaction costs. Accordingly, these considerations have not been incorporated into the fair value estimates.
F-134
Table of Contents
Index to Financial Statements
MIDSOUTH BANK
Notes to Consolidated Financial Statements
December 31, 2013, 2012 and 2011
Loans
Fair values are estimated for portfolios of loans with similar financial characteristics. Loans are segregated by type such as commercial, mortgage and other consumer. Each loan category is further segmented into fixed and adjustable rate interest terms.
The fair value of the various categories of loans is estimated by discounting the future cash flows using the current rates at which similar loans would be made to borrowers with similar credit ratings and for the same remaining average estimated maturities.
The estimated maturity for mortgages is modified from the contractual terms to give consideration to management’s experience with prepayments. Management has made estimates of fair value discount rates that it believes to be reasonable. However, because there is no market for many of these financial instruments, management has no basis to determine whether the fair value presented below would be indicative of the value negotiated in an actual sale.
The value of the loan portfolio is also discounted in consideration of the credit quality of the loan portfolio as would be the case between willing buyers and sellers. Particular emphasis has been given to loans on the Bank’s internal watch list. Valuation of these loans is based upon borrower performance, collateral values (including external appraisals), etc.
Loans Held for Sale
These instruments are carried in the consolidated balance sheet at the lower of cost or market value. The fair values of these instruments are based on subsequent liquidation values of the instruments which did not result in any significant gains or losses.
Deposit Liabilities
The fair value of demand deposits, savings accounts and certain money market deposits is the amount payable on demand at the reporting date. The fair value of fixed-maturity certificates of deposit is estimated using the rates currently offered for deposits of similar remaining maturities. Under accounting standards the fair value estimates for deposits do not include the benefit that results from the low cost funding provided by the deposit liabilities compared to the cost of borrowing funds in the market.
Federal Funds Purchased and Sold
The carrying amounts approximate fair values as Federal funds are overnight borrowings or investments.
Advances from FHLB
Short-Term Advances
The carrying amounts of short-term advances approximate fair value as they mature within 90 days.
Long-Term Advances
The fair values of the Bank’s long-term advances are estimated using discounted cash flow analyses based on the Bank’s current incremental borrowing rates for similar types of borrowing arrangements.
F-135
Table of Contents
Index to Financial Statements
MIDSOUTH BANK
Notes to Consolidated Financial Statements
December 31, 2013, 2012 and 2011
Securities Sold Under Agreement to Repurchase
The carrying amounts approximate fair values as repurchase agreements are overnight instruments.
Commitments to Extend Credit, Standby Letters of Credit and Financial Guarantees Written
Loan commitments are made to customers generally for a period not to exceed one year and at the prevailing interest rates in effect at the time the loan is closed. Commitments to extend credit related to construction loans are made for a period not to exceed one year with interest rates at the current market rate at the date of closing. In addition, standby letters of credit are issued for periods extending from one to two years with rates to be determined at the date the letter of credit is funded. Fees are only charged for the construction loans and the standby letters of credit and the amounts unearned at December 31, 2013, are insignificant. Accordingly, these commitments have no carrying value and management estimates the commitments to have no significant fair value.
The carrying values and estimated fair values of the Bank’s remaining financial instruments at December 31, 2013 and 2012 are as follows:
| (In Thousands) |
Carrying amount |
Estimated fair value |
Quoted market prices in an active market (Level 1) |
Models with significant observable market parameters (Level 2) |
Models with Significant unobservable market Parameters (Level 3) |
|||||||||||||||
| December 31, 2013 |
||||||||||||||||||||
| Financial assets: |
||||||||||||||||||||
| Certificates of deposit at other financial institutions |
$ | 1,732 | $ | 1,763 | $ | — | $ | — | $ | 1,763 | ||||||||||
| Restricted equity securities |
1,549 | 1,549 | — | — | 1,549 | |||||||||||||||
| Loans, net of allowance |
168,111 | 169,933 | — | — | 169,933 | |||||||||||||||
| Financial liabilities: |
||||||||||||||||||||
| Deposits |
241,948 | 241,939 | — | — | 241,939 | |||||||||||||||
| FHLB advance |
5,000 | 5,000 | — | — | 5,000 | |||||||||||||||
| Securities sold under agreement to repurchase |
980 | 980 | — | — | 980 | |||||||||||||||
| Off balance sheet instruments: |
||||||||||||||||||||
| Commitments to extend credit |
— | — | — | — | — | |||||||||||||||
| Standby letters of credit |
— | — | — | — | — | |||||||||||||||
| December 31, 2012 |
||||||||||||||||||||
| Financial assets: |
||||||||||||||||||||
| Certificates of deposit at other financial institutions |
$ | 1,482 | $ | 1,536 | $ | — | $ | — | $ | 1,536 | ||||||||||
| Restricted equity securities |
1,550 | 1,550 | — | — | 1,550 | |||||||||||||||
| Loans, net of allowance |
137,790 | 137,762 | — | — | 137,762 | |||||||||||||||
| Financial liabilities: |
||||||||||||||||||||
| Deposits |
221,752 | 221,949 | — | — | 221,949 | |||||||||||||||
| Securities sold under agreement to repurchase |
1,044 | 1,044 | — | — | 1,044 | |||||||||||||||
| Off balance sheet instruments: |
||||||||||||||||||||
| Commitments to extend credit |
— | — | — | — | — | |||||||||||||||
| Standby letters of credit |
— | — | — | — | — | |||||||||||||||
F-136
Table of Contents
Index to Financial Statements
MIDSOUTH BANK
Notes to Consolidated Financial Statements
December 31, 2013, 2012 and 2011
Limitations
Fair value estimates are made at a specific point in time, based on relevant market information and information about the financial instruments. These estimates do not reflect any premium or discount that could result from offering for sale at one time the Bank’s entire holdings of a particular financial instrument. Because no market exists for a significant portion of the Bank’s financial instruments, fair value estimates are based on judgments regarding future expected loss experience, current economic conditions, risk characteristics of various financial instruments, and other factors. These estimates are subjective in nature and involve uncertainties and matters of significant judgment and therefore cannot be determined with precision. Changes in assumptions could significantly affect the estimates.
Fair value estimates are based on estimating on-and-off-balance sheet financial instruments without attempting to estimate the value of anticipated future business and the value of assets and liabilities that are not considered financial instruments. Other significant assets and liabilities that are not considered financial assets or liabilities include deferred tax assets and liabilities and property, plant and equipment. In addition, the tax ramifications related to the realization of the unrealized gains and losses can have a significant effect on fair value estimates and have not been considered in the estimates.
(23) QUARTERLY FINANCIAL DATA (UNAUDITED)
Selected quarterly results of operations for the four quarters ended December 31, 2013 and 2012 are as follows:
| (In Thousands, except per share data) | ||||||||||||||||||||||||||||||||
| 2013 | 2012 | |||||||||||||||||||||||||||||||
| Fourth Quarter |
Third Quarter |
Second Quarter |
First Quarter |
Fourth Quarter |
Third Quarter |
Second Quarter |
First Quarter |
|||||||||||||||||||||||||
| Interest income |
$ | 2,582 | $ | 2,506 | $ | 2,371 | $ | 2,370 | $ | 2,388 | $ | 2,458 | $ | 2,388 | $ | 2,340 | ||||||||||||||||
| Net interest income |
2,363 | 2,286 | 2,146 | 2,118 | 2,112 | 2,161 | 2,070 | 2,000 | ||||||||||||||||||||||||
| Provision for loan losses |
— | — | — | — | (470 | ) | — | — | — | |||||||||||||||||||||||
| Earnings before income taxes |
22 | 514 | 481 | 487 | 388 | 443 | 394 | 376 | ||||||||||||||||||||||||
| Net earnings |
22 | 514 | 481 | 487 | 388 | 443 | 394 | 376 | ||||||||||||||||||||||||
| Basic earnings per common share |
0.01 | 0.13 | 0.12 | 0.13 | 0.11 | 0.11 | 0.10 | 0.10 | ||||||||||||||||||||||||
| Diluted earnings per common share |
0.01 | 0.08 | 0.07 | 0.07 | 0.05 | 0.07 | 0.06 | 0.06 | ||||||||||||||||||||||||
(24) PENDING ACQUISITION
In November 2013, the Bank entered into an Agreement and Plan of Reorganization and Bank Merger with Franklin Financial Network, Inc. and Franklin Synergy Bank (the “Agreement”). The acquisition was announced on November 20, 2013, and the Bank filed a Form 8-K with the Board of Governors of the Federal Reserve System on November 20, 2013. Once the acquisition is consummated, the Bank will be merged with Franklin Synergy Bank and will become part of the Franklin Financial Network, Inc. holding company. Please refer to the Agreement as reported on Form 8-K, which is included on the Bank’s website at www.midsouthbanking.com under the “Federal Reports” tab of the Bank’s “Shareholder Information” page.
F-137
Table of Contents
Index to Financial Statements
Until (25 days after the date of this prospectus), all dealers that buy, sell or trade shares of our common stock, whether or not participating in our initial public offering, may be required to deliver a prospectus. This delivery requirement is in addition to the obligation of dealers to deliver a prospectus when acting as underwriters and with respect to their unsold allotments or subscriptions.
Shares
Franklin Financial Network, Inc.
Common Stock

PROSPECTUS
BofA Merrill Lynch
, 2015
Table of Contents
Index to Financial Statements
PART II
INFORMATION NOT REQUIRED IN PROSPECTUS
Item 13. Other Expenses of Issuance and Distribution
Estimated expenses, other than underwriting discounts and commissions, of the sale of the Registrant’s common stock, no par value, are as follows:
| SEC registration fee |
$ | 5,810 | ||
| FINRA filing fee |
$ | 8,000 | ||
| Listing fees and expenses |
$ | * | ||
| Transfer agent and registrar fees and expenses |
$ | * | ||
| Printing fees and expenses |
$ | * | ||
| Legal fees and expenses |
$ | * | ||
| Accounting expenses |
$ | * | ||
| Miscellaneous expenses |
$ | * | ||
| Total |
$ | * |
| * | To be furnished by amendment. |
Item 14. Indemnification of Directors and Officers
The Tennessee Business Corporation Act (“TBCA”) allows a Tennessee corporation’s charter to contain a provision eliminating or limiting, with certain exceptions, the personal liability of a director to the corporation or its shareholders for monetary damages for breach of the director’s fiduciary duty as a director. Under the TBCA, a Tennessee business corporation may not eliminate or limit director monetary liability for (i) breaches of the director’s duty of loyalty to the corporation or its shareholders; (ii) acts or omissions not in good faith or involving intentional misconduct or a knowing violation of law; or (iii) unlawful distributions. This provision also may not limit a director’s liability for violation of, or otherwise relieve a corporation or its directors from the necessity of complying with, federal or state securities laws, or affect the availability of non-monetary remedies such as injunctive relief or rescission. The Registrant’s charter contains a provision stating that directors shall not be personally liable for monetary damage to the corporation or its shareholders for breach of fiduciary duty as a director, except to the extent required by the TBCA in effect from time to time.
The TBCA provides that a corporation may indemnify any of its directors, officers, employees and agents against liability incurred in connection with a proceeding if (a) such person acted in good faith; (b) in the case of conduct in an official capacity with the corporation, he reasonably believed such conduct was in the corporation’s best interests; (c) in all other cases, he reasonably believed that his conduct was at least not opposed to the best interests of the corporation; and (d) in connection with any criminal proceeding, such person had no reasonable cause to believe his conduct was unlawful. In actions brought by or in the right of the corporation, however, the TBCA provides that no indemnification may be made if the director or officer was adjudged to be liable to the corporation. The TBCA also provides that in connection with any proceeding charging improper personal benefit to an officer or director, no indemnification may be made if such officer or director is adjudged liable on the basis that such personal benefit was improperly received. In cases where the director or officer is wholly successful, on the merits or otherwise, in the defense of any proceeding instigated because of his or her status as a director or officer of a corporation, the TBCA mandates that the corporation indemnify the director or officer against reasonable expenses incurred in the proceeding. The TBCA provides that a court of competent jurisdiction, unless the corporation’s charter provides otherwise, upon application, may order that an officer or director be indemnified for reasonable expenses if, in consideration of all relevant circumstances, the court determines that such individual is fairly and reasonably entitled to indemnification, notwithstanding the fact that (a) such officer or director was adjudged liable to the corporation in a proceeding by or in the right of the corporation; (b) such officer or director was adjudged liable on the basis that personal benefit was improperly received by him; or (c) such officer or director breached his duty of care to the corporation.
II-1
Table of Contents
Index to Financial Statements
Under the Registrant’s Bylaws, any person, his heirs, executors, administrators, successors and assigns may be indemnified or reimbursed by the Registrant for expenses actually incurred in connection with any action, claim, suit, or proceeding to which he or they shall be made a party or potential party by reason of his being or having been a director or officer, or director of officer of another corporation in which the corporation at such time owned or may own shares of stock or of which it was or may be a creditor, which he served at the request of the Registrant’s board of directors; provided, however, that no person shall be so indemnified in relation to any matter in such action, claim, suit, or proceeding as to which he shall finally be adjudged to have been liable for his own negligence or misconduct in the performance of his duties to the Registrant.
Under the Registrant’s Bylaws, the foregoing right of indemnification shall not be exclusive of other rights to which such person, his heirs, executors, administrators, successors or assigns may be entitled under any law, bylaw, agreement, vote of shareholders or otherwise.
Insofar as indemnification for liabilities arising under the Securities Act may be permitted to directors, officers, and controlling persons of the Registrant pursuant to the Bylaws, or otherwise, the Registrant has been advised that, in the opinion of the SEC, such indemnification is against public policy as expressed in the Securities Act and is, therefore, unenforceable.
The Registrant carries standard directors’ and officers’ liability insurance covering its directors and officers.
Item 15. Recent Sales of Unregistered Securities
Within the past three years, the Registrant has engaged in the following transactions that were not registered under the Securities Act:
On December 19, 2014, the Registrant issued the following shares of common stock at the following exercise prices per share for an aggregate purchase price of $180,081: (i) 1,902 shares at an exercise price of $11.75 per share; (ii) 3,945 shares at an exercise price of $10.00 per share; (iii) 7,485 shares at an exercise price of $10.50 per share; and (iv) 3,969 shares at an exercise price of $1000 per share. Neither the exercise of the warrant nor its original issuance involved any underwriters, underwriting discounts or commissions, or any public offering, and the Registrant believes that such transactions were exempt from the registration requirements of the Securities Act in reliance on Section 4(a)(2) of the Securities Act (or Rule 506 of Regulation D promulgated thereunder) as transactions by an issuer not involving a public offering.
On August 25, 2014, the Registrant issued 6,389 shares of common stock upon the exercise of stock options at an exercise price of $8.57 per share, for an aggregate purchase price of $54,753.73. Neither the exercise of the warrant nor its original issuance involved any underwriters, underwriting discounts or commissions, or any public offering, and the Registrant believes that such transactions were exempt from the registration requirements of the Securities Act in reliance on Section 4(a)(2) of the Securities Act (or Rule 506 of Regulation D promulgated thereunder) as transactions by an issuer not involving a public offering.
On March 26, 2014, the Registrant issued 119 shares of common stock upon the exercise of stock options at an exercise price of $12.00 per share, for an aggregate purchase price of $1,428. Neither the exercise of the warrant nor its original issuance involved any underwriters, underwriting discounts or commissions, or any public offering, and the Registrant believes that such transactions were exempt from the registration requirements of the Securities Act in reliance on Section 4(a)(2) of the Securities Act (or Rule 506 of Regulation D promulgated thereunder) as transactions by an issuer not involving a public offering.
In November 2013, the Registrant issued an aggregate of 1,153,847 shares of the Registrant’s common stock at $13.00 per share in a private placement. Raymond James & Associates, Inc. served as placement agent for the offering and received a commission equal to 5% of the gross proceeds raised in the offering, except that the commission equaled 2.5% of the gross proceeds from sales made to certain existing shareholders of the
II-2
Table of Contents
Index to Financial Statements
Registrant. The Registrant believes that the issuances were exempt from the registration requirements of the Securities Act in reliance on Section 4(a)(2) of the Securities Act (or Rule 506 of Regulation D promulgated thereunder) as transactions by an issuer not involving a public offering.
The proceeds of these issuances were used primarily for working capital purposes to support Franklin Synergy Bank’s growth.
Item 16. Exhibits and Financial Statement Schedules
(a) Exhibits
See the Exhibit Index on the page immediately following the signature page for a list of exhibits filed as part of this Registration Statement on Form S-1, which Exhibit Index is incorporated herein by reference.
(b) Financial Statement Schedules
All schedules are omitted because the required information is either not present, not present in material amounts or is presented within the consolidated financial statements included in the prospectus that is part of this Registration Statement.
Item 17. Undertakings
The undersigned Registrant hereby undertakes to provide to the underwriters at the closing specified in the underwriting agreement, certificates in such denominations and registered in such names as required by the underwriters to permit prompt delivery to each purchaser.
Insofar as indemnification for liabilities arising under the Securities Act may be permitted to the directors, officers and controlling persons of the Registrant pursuant to the foregoing provisions, or otherwise, the Registrant has been advised that in the opinion of the SEC such indemnification is against public policy as expressed in the Securities Act and is, therefore, unenforceable. In the event that a claim for indemnification against such liabilities (other than the payment by the Registrant of expenses incurred or paid by a director, officer or controlling person of the Registrant in the successful defense of any action, suit or proceeding) is asserted by such director, officer or controlling person in connection with the securities being registered, the Registrant will, unless in the opinion of its counsel the matter has been settled by controlling precedent, submit to a court of appropriate jurisdiction the question whether such indemnification by it is against public policy as expressed in the Securities Act and will be governed by the final adjudication of such issue.
The undersigned Registrant hereby undertakes that:
(i) for purposes of determining any liability under the Securities Act, the information omitted from the form of prospectus filed as part of this Registration Statement in reliance upon Rule 430A and contained in a form of prospectus filed by the Registrant pursuant to Rule 424(b)(1) or (4) or 497(h) under the Securities Act shall be deemed to be part of this Registration Statement as of the time it was declared effective.
(ii) for the purpose of determining any liability under the Securities Act, each post-effective amendment that contains a form of prospectus shall be deemed to be a new Registration Statement relating to the securities offered therein, and the offering of such securities at that time shall be deemed to be the initial bona fide offering thereof.
II-3
Table of Contents
Index to Financial Statements
SIGNATURES
Pursuant to the requirements of the Securities Act, the Registrant has duly caused this Registration Statement to be signed on its behalf by the undersigned, hereunto duly authorized, in the City of Franklin, State of Tennessee on January 15, 2015.
| FRANKLIN FINANCIAL NETWORK, INC. | ||
| By: | /s/Richard E. Herrington | |
| Name: | Richard E. Herrington | |
| Title: | President and Chief Executive Officer | |
KNOW ALL MEN BY THESE PRESENTS, that each of the persons whose signature appears below appoints and constitutes Richard E. Herrington and Sally P. Kimble, or either of them, his or her true and lawful attorney-in-fact and agent, acting alone, with full power of substitution and resubstitution, for him or her and in his or her name, place and stead, in any and all capacities, to execute any and all amendments (including post-effective amendments) to the within registration statement (as well as any registration statement for the same offering covered by this registration statement that is to be effective upon filing pursuant to Rule 462(b) under the Securities Act of 1933), and to file the same, together with all exhibits thereto and all other documents in connection therewith, with the Securities and Exchange Commission and such other agencies, offices and persons as may be required by applicable law, granting unto said attorneys-in-fact and agents, or either of them, full power and authority to do and perform each and every act and thing requisite or necessary to be done in and about the premises, as fully to all intents and purposes as he or she might or could do in person, hereby ratifying and confirming all that said attorneys-in-fact and agents, or either of them, may lawfully do or cause to be done by virtue hereof.
Pursuant to the requirements of the Securities Act of 1933, this Registration Statement has been signed by the following persons in the capacities and on the dates indicated.
| Signature |
Title |
Date | ||
| /s/Richard E. Herrington Richard E. Herrington |
Chairman, President & CEO (Principal Executive Officer) | January 15, 2015 | ||
| /s/Sally P. Kimble Sally P. Kimble |
Executive Vice President and Chief Financial Officer (Principal Financial and Accounting Officer) | January 15, 2015 | ||
| /s/Jimmy E. Allen Jimmy E. Allen |
Director | January 15, 2015 | ||
| /s/Henry W. Brockman, Jr. Henry W. Brockman, Jr. |
Director | January 15, 2015 | ||
| /s/James W. Cross, IV James W. Cross, IV |
Director | January 15, 2015 | ||
| /s/David H. Kemp David H. Kemp |
Director | January 15, 2015 | ||
| /s/Lee M. Moss Lee M. Moss |
Director | January 15, 2015 | ||
II-4
Table of Contents
Index to Financial Statements
| Signature |
Title |
Date | ||
| /s/Paul M. Pratt, Jr. Paul M. Pratt, Jr. |
Director | January 15, 2015 | ||
| /s/Pamela J. Stephens Pamela J. Stephens |
Director | January 15, 2015 | ||
| /s/Melody Sullivan Melody Sullivan |
Director | January 15, 2015 | ||
II-5
Table of Contents
Index to Financial Statements
Exhibit Index
| Exhibit No. |
Description of Exhibit | |
| 1.1* | Form of Underwriting Agreement between Franklin Financial Network, Inc. and Bank of America Merrill Lynch. | |
| 2.1 | Agreement and Plan of Reorganization and Bank Merger, dated as of November 21, 2013, between Franklin Financial Network, Inc. and MidSouth Bank (incorporated herein by reference to Appendix A to Form S-4 (File No. 14614745) filed with the Securities and Exchange Commission on February 14, 2014) (schedules and exhibits to which have been omitted pursuant to Items 601(b)(2) of Regulations S-K). | |
| 3.1 | Charter of Franklin Financial Network, Inc. (incorporated herein by reference to Exhibit 3.1 to Form S-4 (File No. 14614745) filed with the Securities and Exchange Commission on February 14, 2014). | |
| 3.2 | Articles of Amendment to the Charter of Franklin Financial Network, Inc., dated November 15, 2007 (incorporated herein by reference to Exhibit 3.2 to Form S-4 (File No. 14614745) filed with the Securities and Exchange Commission on February 14, 2014). | |
| 3.3 | Articles of Amendment to the Charter of Franklin Financial Network, Inc., dated June 17, 2010 (incorporated herein by reference to Exhibit 3.3 to Form S-4 (File No. 14614745) filed with the Securities and Exchange Commission on February 14, 2014). | |
| 3.4 | Articles of Amendment to the Charter of Franklin Financial Network, Inc., dated September 27, 2011 (incorporated herein by reference to Exhibit 3.4 to Form S-4 (File No. 14614745) filed with the Securities and Exchange Commission on February 14, 2014). | |
| 3.5 | Articles of Amendment to the Charter Designating Senior Non-Cumulative Perpetual Preferred Stock, Series A of Franklin Financial Network, Inc., dated September 27, 2011 (incorporated herein by reference to Exhibit 3.5 to Form S-4 (File No. 14614745) filed with the Securities and Exchange Commission on February 14, 2014). | |
| 3.6 | By-Laws of Franklin Financial Network, Inc. (incorporated herein by reference to Exhibit 3.6 to Form S-4 (File No. 14614745) filed with the Securities and Exchange Commission on February 14, 2014). | |
| 4.1 | Specimen Stock Certificate of Franklin Financial Network, Inc. (incorporated herein by reference to Exhibit 4.1 to Form S-4 (File No. 14614745) filed with the Securities and Exchange Commission on February 14, 2014). | |
| 4.2 | See Exhibits 3.1 and 3.2 for provisions of the Charter and Bylaws defining rights of holders of the Registrant’s Common Stock. | |
| 5.1* | Opinion of Baker, Donelson, Bearman, Caldwell & Berkowitz, PC. | |
| 10.1 | Retail Lease Agreement, dated as of December 21, 2011 by and between Westhaven Town Center Fund I, LLC and Franklin Synergy Bank (incorporated herein by reference to Exhibit 10.1 to Form S-4 (File No. 14614745) filed with the Securities and Exchange Commission on February 14, 2014). | |
| 10.2 | Triple Net Office Lease Agreement, dated as of June 12, 2012 by and between Berry Farms Real Estate Partners, LLC and Franklin Synergy Bank (incorporated herein by reference to Exhibit 10.2 to Form S-4 (File No. 14614745) filed with the Securities and Exchange Commission on February 14, 2014). | |
| 10.3 | Lease Agreement, dated as of December 12, 2012 by and between First Farmers and Merchants Bank and Franklin Synergy Bank (incorporated herein by reference to Exhibit 10.3 to Form S-4 (File No. 14614745) filed with the Securities and Exchange Commission on February 14, 2014). | |
Table of Contents
Index to Financial Statements
| Exhibit No. |
Description of Exhibit | |
| 10.4 | Office Lease Agreement, dated as of May 11, 2007 by and between PCC Investments II, LLC and Franklin Financial Network, Inc. (Aspen Brook Village Suites 201, 202 and 203) (incorporated herein by reference to Exhibit 10.4 to Form S-4 (File No. 14614745) filed with the Securities and Exchange Commission on February 14, 2014). | |
| 10.5 | Triple Net Office Lease Agreement, dated as of May 4, 2010 by and between Columbia Avenue Partners, LLC and Franklin Synergy Bank (incorporated herein by reference to Exhibit 10.5 to Form S-4 (File No. 14614745) filed with the Securities and Exchange Commission on February 14, 2014). | |
| 10.6 | Lease, dated as of May 21, 2012 by and between CHHM Properties and Franklin Synergy Bank (incorporated herein by reference to Exhibit 10.6 to Form S-4 (File No. 14614745) filed with the Securities and Exchange Commission on February 14, 2014). | |
| 10.7 | Amendment No. 4 to Lease Agreement, dated June 19, 2013 by and between Cherokee Equities Corporation and Banc Compliance Group, Inc. (incorporated herein by reference to Exhibit 10.7 to Form S-4 (File No. 14614745) filed with the Securities and Exchange Commission on February 14, 2014). | |
| 10.8 | Lease Agreement, effective October 8, 2008 by and between UCM/ProVenture-Synergy Business Park, LLC and Franklin Synergy Bank (incorporated herein by reference to Exhibit 10.12 to Form S-4 (File No. 14614745) filed with the Securities and Exchange Commission on February 14, 2014). | |
| 10.9 | Lease Amendment No. 1, dated as of June 11, 2013 by and between Mooreland Investors, LP, successor in interest to UCM/ProVenture-Synergy Business Park, LLC, and Franklin Synergy Bank (incorporated herein by reference to Exhibit 10.13 to Form S-4 (File No. 14614745) filed with the Securities and Exchange Commission on February 14, 2014). | |
| 10.10 | Office Lease Agreement, dated as of May 11, 2007 by and between PCC Investments II, LLC and Franklin Financial Network, Inc. (Aspen Brook Village Suites 106, 107 and 108) (incorporated herein by reference to Exhibit 10.14 to Form S-4 (File No. 14614745) filed with the Securities and Exchange Commission on February 14, 2014). | |
| 10.11 | Lease dated as of April 20, 2010 by and between Edwin B. Raskin Company, as agent for SIG, LLC, and Franklin Synergy Bank (incorporated herein by reference to Exhibit 10.15 to Form S-4 (File No. 14614745) filed with the Securities and Exchange Commission on February 14, 2014). | |
| 10.12 | Form of Franklin Financial Network, Inc.’s Organizers’ Warrant Agreement (incorporated herein by reference to Exhibit 10.16 to Form S-4 (File No. 14614745) filed with the Securities and Exchange Commission on February 14, 2014). | |
| 10.13 | Form of Franklin Financial Network, Inc. Award Agreement for Non-Qualified Stock Options (incorporated herein by reference to Exhibit 10.49 to Form S-4/A (File No. 14795094) filed with the Securities and Exchange Commission on April 29, 2014). | |
| 10.14 | Form of Franklin Financial Network, Inc. Award Agreement for Restricted Stock (incorporated herein by reference to Exhibit 10.50 to Form S-4/A (File No. 14795094) filed with the Securities and Exchange Commission on April 29, 2014). | |
| 10.15 | Form of Franklin Financial Network, Inc. Award Agreement for Incentive Stock Options (incorporated herein by reference to Exhibit 10.51 to Form S-4/A (File No. 14795094) filed with the Securities and Exchange Commission on April 29, 2014). | |
| 10.16 | Employment Agreement, dated as of January 29, 2014 by and between Franklin Synergy Bank and Richard E. Herrington (incorporated herein by reference to Exhibit 10.17 to Form S-4 (File No. 14614745) filed with the Securities and Exchange Commission on February 14, 2014). | |
Table of Contents
Index to Financial Statements
| Exhibit No. |
Description of Exhibit | |
| 10.17 | Employment Agreement, dated as of January 29, 2014 by and between Franklin Synergy Bank and Kevin A. Herrington (incorporated herein by reference to Exhibit 10.18 to Form S-4 (File No. 14614745) filed with the Securities and Exchange Commission on February 14, 2014). | |
| 10.18 | Employment Agreement, dated as of January 29, 2014 by and between Franklin Synergy Bank and Sally E. Bowers (incorporated herein by reference to Exhibit 10.19 to Form S-4 (File No. 14614745) filed with the Securities and Exchange Commission on February 14, 2014). | |
| 10.19 | Employment Agreement, dated as of January 29, 2014 by and Franklin Synergy Bank and Ashley P. Hill, III (incorporated herein by reference to Exhibit 10.20 to Form S-4 (File No. 14614745) filed with the Securities and Exchange Commission on February 14, 2014). | |
| 10.20 | Employment Agreement, dated as of January 29, 2014 by and between Franklin Synergy Bank and J. Myers Jones, III (incorporated herein by reference to Exhibit 10.21 to Form S-4 (File No. 14614745) filed with the Securities and Exchange Commission on February 14, 2014). | |
| 10.21 | Employment Agreement, dated as of January 29, 2014 by and between Franklin Synergy Bank and David J. McDaniel (incorporated herein by reference to Exhibit 10.22 to Form S-4 (File No. 14614745) filed with the Securities and Exchange Commission on February 14, 2014). | |
| 10.22 | Employment Agreement dated as of January 29, 2014 by and between Franklin Synergy Bank and Sally P. Kimble (incorporated herein by reference to Exhibit 10.23 to Form S-4 (File No. 14614745) filed with the Securities and Exchange Commission on February 14, 2014). | |
| 10.23 | Confidentiality, Non-Competition Agreement and Non-Solicitation Agreement, dated as of January 29, 2014 by and between Franklin Synergy Bank and Richard E. Herrington (incorporated herein by reference to Exhibit 10.24 to Form S-4 (File No. 14614745) filed with the Securities and Exchange Commission on February 14, 2014). | |
| 10.24 | Confidentiality, Non-Competition Agreement and Non-Solicitation Agreement, dated as of January 29, 2014 by and between Franklin Synergy Bank and Kevin A. Herrington (incorporated herein by reference to Exhibit 10.25 to Form S-4 (File No. 14614745) filed with the Securities and Exchange Commission on February 14, 2014). | |
| 10.25 | Confidentiality, Non-Competition Agreement and Non-Solicitation Agreement, dated as of January 29, 2014 by and between Franklin Synergy Bank and Sally E. Bowers (incorporated herein by reference to Exhibit 10.26 to Form S-4 (File No. 14614745) filed with the Securities and Exchange Commission on February 14, 2014). | |
| 10.26 | Confidentiality, Non-Competition Agreement and Non-Solicitation Agreement, dated as of January 29, 2014 by and Franklin Synergy Bank and Ashley P. Hill, III (incorporated herein by reference to Exhibit 10.27 to Form S-4 (File No. 14614745) filed with the Securities and Exchange Commission on February 14, 2014). | |
| 10.27 | Confidentiality, Non-Competition Agreement and Non-Solicitation Agreement, dated as of January 29, 2014 by and between Franklin Synergy Bank and J. Myers Jones, III (incorporated herein by reference to Exhibit 10.28 to Form S-4 (File No. 14614745) filed with the Securities and Exchange Commission on February 14, 2014). | |
| 10.28 | Confidentiality, Non-Competition Agreement and Non-Solicitation Agreement, dated as of January 29, 2014 by and between Franklin Synergy Bank and David J. McDaniel (incorporated herein by reference to Exhibit 10.29 to Form S-4 (File No. 14614745) filed with the Securities and Exchange Commission on February 14, 2014). | |
| 10.29 | Confidentiality, Non-Competition Agreement and Non-Solicitation Agreement, dated as of January 29, 2014 by and between Franklin Synergy Bank and Sally P. Kimble (incorporated herein by reference to Exhibit 10.30 to Form S-4 (File No. 14614745) filed with the Securities and Exchange Commission on February 14, 2014). | |
Table of Contents
Index to Financial Statements
| Exhibit No. |
Description of Exhibit | |
| 10.30 | Employment Agreement, dated as of May 29, 2008 by and between Franklin Synergy Bank and Constance E. Edwards (incorporated herein by reference to Exhibit 10.31 to Form S-4 (File No. 14614745) filed with the Securities and Exchange Commission on February 14, 2014). | |
| 10.31 | Employment Agreement dated as of September 25, 2008 by and between Franklin Synergy Bank and Joseph H. Bowman (incorporated herein by reference to Exhibit 10.32 to Form S-4 (File No. 14614745) filed with the Securities and Exchange Commission on February 14, 2014). | |
| 10.32 | Employment Agreement dated as of September 25, 2008 by and between Franklin Synergy Bank and Jere D. Pewitt (incorporated herein by reference to Exhibit 10.33 to Form S-4 (File No. 14614745) filed with the Securities and Exchange Commission on February 14, 2014). | |
| 10.33 | Form of Lee M. Moss Employment Agreement (incorporated herein by reference to Exhibit 10.34 to Form S-4 (File No. 14614745) filed with the Securities and Exchange Commission on February 14, 2014). | |
| 10.34 | Form of Lee M. Moss Confidentiality, Non-Competition Agreement and Non-Solicitation Agreement (incorporated herein by reference to Exhibit 10.35 to Form S-4 (File No. 14614745) filed with the Securities and Exchange Commission on February 14, 2014). | |
| 10.35 | Form of Lee M. Moss Retention Agreement (incorporated herein by reference to Exhibit 10.36 to Form S-4 (File No. 14614745) filed with the Securities and Exchange Commission on February 14, 2014). | |
| 10.36 | Form of Kevin D. Busbey Employment Agreement (incorporated herein by reference to Exhibit 10.37 to Form S-4 (File No. 14614745) filed with the Securities and Exchange Commission on February 14, 2014). | |
| 10.37 | Form of Kevin D. Busbey Confidentiality, Non-Competition Agreement and Non-Solicitation Agreement (incorporated herein by reference to Exhibit 10.38 to Form S-4 (File No. 14614745) filed with the Securities and Exchange Commission on February 14, 2014). | |
| 10.38 | Form of Kevin D. Busbey Retention Agreement (incorporated herein by reference to Exhibit 10.39 to Form S-4 (File No. 14614745) filed with the Securities and Exchange Commission on February 14, 2014). | |
| 10.39 | Form of Dallas G. Caudle Employment Agreement (incorporated herein by reference to Exhibit 10.40 to Form S-4 (File No. 14614745) filed with the Securities and Exchange Commission on February 14, 2014). | |
| 10.40 | Form of Dallas G. Caudle Confidentiality, Non-Competition Agreement and Non-Solicitation Agreement (incorporated herein by reference to Exhibit 10.41 to Form S-4 (File No. 14614745) filed with the Securities and Exchange Commission on February 14, 2014). | |
| 10.41 | Form of Dallas G. Caudle Retention Agreement (incorporated herein by reference to Exhibit 10.42 to Form S-4 (File No. 14614745) filed with the Securities and Exchange Commission on February 14, 2014). | |
| 10.42 | Form of D. Edwin Jernigan, Jr. Retention Agreement (incorporated herein by reference to Exhibit 10.43 to Form S-4 (File No. 14614745) filed with the Securities and Exchange Commission on February 14, 2014). | |
| 10.43 | Form of D. Edwin Jernigan, Jr. Stock Option Award Agreement (incorporated herein by reference to Exhibit 10.44 to Form S-4 (File No. 14614745) filed with the Securities and Exchange Commission on February 14, 2014). | |
| 10.44 | Franklin Financial Network, Inc. 2007 Omnibus Equity Incentive Plan (incorporated herein by reference to Exhibit 10.45 to Form S-4 (File No. 14614745) filed with the Securities and Exchange Commission on February 14, 2014). | |
Table of Contents
Index to Financial Statements
| Exhibit No. |
Description of Exhibit | |
| 10.45 | Form of Split Dollar Life Insurance Agreement (incorporated herein by reference to Exhibit 10.48 to Form S-4 (File No. 14614745) filed with the Securities and Exchange Commission on February 14, 2014). | |
| 10.46 | Contract for Sale of Real Estate, dated as of December 5, 2014, by and between Franklin Synergy Bank and Murfreesboro Branches, LLC (incorporated herein by reference to Exhibit 10.1 to Form 8-K (File No. 333-193951) filed with the Securities and Exchange Commission on December 11, 2014). | |
| 10.47 | Triple Net Office Lease Agreement, dated as of December 5, 2014 by and between Murfreesboro Branches, LLC and Franklin Synergy Bank (incorporated herein by reference to Exhibit 10.2 to Form 8-K (File No. 333-193951) filed with the Securities and Exchange Commission on December 11, 2014). | |
| 10.48 | Triple Net Office Lease Agreement, dated as of December 5, 2014 by and between Murfreesboro Branches, LLC and Franklin Synergy Bank (incorporated herein by reference to Exhibit 10.3 to Form 8-K (File No. 333-193951) filed with the Securities and Exchange Commission on December 11, 2014). | |
| 10.49 | Triple Net Office Lease Agreement, dated as of December 5, 2014 by and between Murfreesboro Branches, LLC and Franklin Synergy Bank (incorporated herein by reference to Exhibit 10.4 to Form 8-K (File No. 333-193951) filed with the Securities and Exchange Commission on December 11, 2014). | |
| 10.50 | Asset Purchase and Sale Agreement, by and between BCG Consulting, LLC, Banc Compliance Group, Inc. and Franklin Financial Network, Inc. (incorporated by reference to Exhibit 10.1 to Form 8-K (File No. 333-193951) filed with the Securities and Exchange Commission on January 2, 2015). | |
| 21.1 | Subsidiaries of the Registrant (incorporated herein by reference to Exhibit 21.1 to Form S-4 (File No. 14614745) filed with the Securities and Exchange Commission on February 14, 2014). | |
| 23.1 | Consent of Crowe Horwath LLP | |
| 23.2* | Consent of Baker, Donelson, Bearman, Caldwell & Berkowitz, PC (included as part of Exhibit 5.1). | |
| 23.3 | Consent of Maggart & Associates, P.C., relating to MidSouth Bank. | |
| 24.1 | Power of Attorney (included on the signature page). | |
| * | To be filed by amendment |