Attached files
| file | filename |
|---|---|
| 8-K - 8-K - Northwest Bancshares, Inc. | a14-26172_18k.htm |
| EX-99.1 - EX-99.1 - Northwest Bancshares, Inc. | a14-26172_1ex99d1.htm |
| EX-99.3 - EX-99.3 - Northwest Bancshares, Inc. | a14-26172_1ex99d3.htm |
| EX-2.1 - EX-2.1 - Northwest Bancshares, Inc. | a14-26172_1ex2d1.htm |
| EX-99.4 - EX-99.4 - Northwest Bancshares, Inc. | a14-26172_1ex99d4.htm |
Exhibit 99.2
|
|
December 16, 2014 The Merger of with |

|
|
Daniel E. Klimas – President & CEO James H. Nicholson – Senior VP & CFO Presented by: William J. Wagner – Chairman, President & CEO William W. Harvey Jr. – Senior EVP & CFO |

|
|
Additional Information for Shareholders of LNB Bancorp, Inc. Communications in this document do not constitute an offer to sell or the solicitation of an offer to buy any securities or a solicitation of any vote or approval. In connection with the proposed merger, Northwest Bancshares, Inc. (“Northwest”) will file with the Securities and Exchange Commission (SEC) a Registration Statement on Form S-4 that will include a Proxy Statement of LNB Bancorp, Inc. (“LNB”), as well as other relevant documents concerning the proposed transaction. Shareholders are urged to read the Registration Statement and the Proxy Statement/Prospectus regarding the merger when it becomes available and any other relevant documents filed with the SEC, as well as any amendments or supplements to those documents, because they will contain important information. A free copy of the Proxy Statement/Prospectus, as well as other filings containing information about Northwest and LNB, may be obtained at the SEC’s Internet site (http://www.sec.gov). You will also be able to obtain these documents, free of charge, from Northwest at www.northwestsavingsbank.com or from LNB by accessing LNB’s website at www.4lnb.com. LNB and certain of its directors and executive officers may be deemed to be participants in the solicitation of proxies from the shareholders of LNB in connection with the proposed merger. Information about the directors and executive officers of LNB is set forth in the proxy statement for LNB’s 2014 annual meeting of shareholders, as filed with the SEC on a Schedule 14A on March 11, 2014. Additional information regarding the interests of those participants and other persons who may be deemed participants in the transaction may be obtained by reading the Proxy Statement/Prospectus regarding the proposed merger when it becomes available. Free copies of this document may be obtained as described in the preceding paragraph. 3 Disclosures |

|
|
Disclosures Forward-Looking Statement This presentation contains certain forward-looking statements within the meaning of the Private Securities Litigation Reform Act of 1995. These statements include, but are not limited to, descriptions of Northwest’s financial condition, results of operations, asset and credit quality trends and profitability and statements about the expected timing, completion, financial benefit and other effects of the proposed mergers. Forward-looking statements can be identified by the use of the words “anticipate,” “believe,” “expect,” “intend,” “could” and “should,” and other words of similar meaning. These forward-looking statements express management’s current expectations or forecasts of future events and, by their nature, are subject to risks and uncertainties and there are a number of factors that could cause actual results to differ materially from those in such statements. Factors that might cause such a difference include, but are not limited to: market, economic, operational, liquidity, credit and interest rate risks associated with Northwest’s business; competition; government legislation and policies (including the impact of the Dodd-Frank Wall Street Reform and Consumer Protection Act and its related regulations); ability of Northwest to execute its business plan, including the proposed acquisition of LNB Bancorp; changes in the economy which could materially impact credit quality trends and the ability to generate loans and gather deposits; failure or circumvention of Northwest’s internal controls; failure or disruption of our information systems; failure to adhere to or significant changes in accounting, tax or regulatory practices or requirements; new legal obligations or liabilities or unfavorable resolutions of litigations; other matters discussed in this presentation and other factors identified in Northwest’s Annual Report on Form 10-K and other periodic filings with the Securities and Exchange Commission. These forward-looking statements are made only as of the date of this presentation, and Northwest undertakes no obligation to release revisions to these forward-looking statements to reflect events or conditions after the date of this presentation. Non-GAAP Financial Measures These slides contain non-GAAP financial measures. For purposes of Regulation G, a non-GAAP financial measure is a numerical measure of the registrant's historical or future financial performance, financial position or cash flows that excludes amounts, or is subject to adjustments that have the effect of excluding amounts, that are included in the most directly comparable measure calculated and presented in accordance with GAAP in the statement of income, balance sheet or statement of cash flows (or equivalent statements) of the issuer; or includes amounts, or is subject to adjustments that have the effect of including amounts, that are excluded from the most directly comparable measure so calculated and presented. In this regard, GAAP refers to generally accepted accounting principles in the United States. Pursuant to the requirements of Regulation G, Northwest has provided reconciliations within the slides, as necessary, of the non-GAAP financial measure to the most directly comparable GAAP financial measure. 4 |
|
|
Transaction Highlights 5 Key Terms Consideration: 1.461 shares of NWBI stock or $18.70 in cash for each share of LNBB stock as elected by each holder of stock Elections subject to 50% of outstanding LNBB shares being exchanged for NWBI stock Deal value = $18.64 per LNBB share and $183.3 million in the aggregate, assuming average of NWBI’s last 20 closing prices of $12.72 Price / 2016E EPS of 18.0x; Price / 2016E EPS with synergies of 11.0x Price to tangible book of 197.7% One member of LNBB Board of Directors to join NWBI Board Financial Impact Expected to be immediately accretive to EPS in 2015, excluding acquisition charges of approximately $15.0 million Expected EPS accretion of approximately $0.12 in 2016 (first full year of combined operations, cost savings fully phased in) Approximate TBV dilution of 7% earned back in approximately 4.9 years Cost saves estimated at 28% of LNBB’s noninterest expense Loan credit mark estimated at $17.5 million, or 1.9% of total gross loans Loan interest rate mark estimated at $8.0 million Expected to create goodwill of approximately $81 million No additional capital raise needed Closing Transaction anticipated to close late in the 2nd quarter of 2015, subject to regulatory and LNBB shareholder approval and other customary closing conditions Pro forma ownership: 93.1% NWBI / 6.9% LNBB Note: Deal value is calculated using the 20 day average closing stock price of Northwest Bancshares, Inc. as of Friday, December 12, 2014. |

|
|
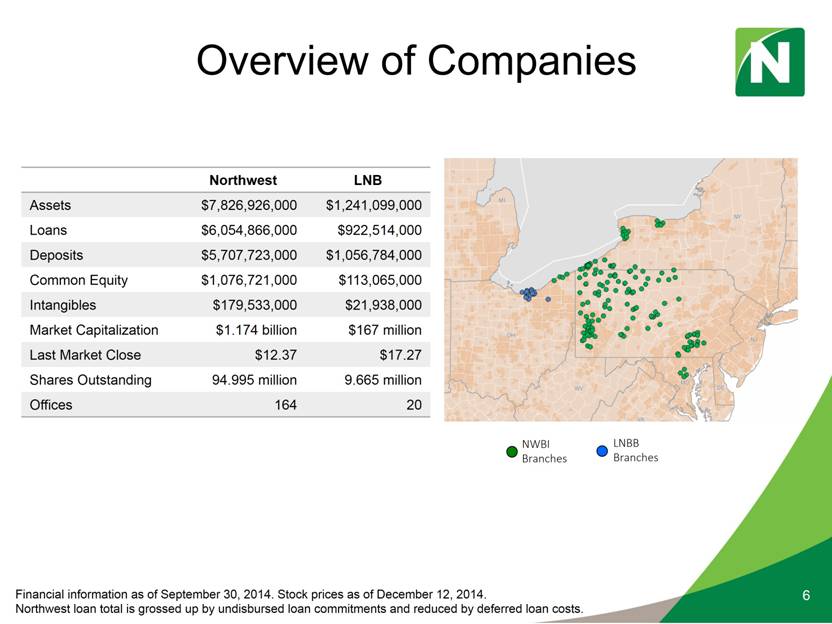
Overview of Companies Northwest LNB Assets $7,826,926,000 $1,241,099,000 Loans $6,054,866,000 $922,514,000 Deposits $5,707,723,000 $1,056,784,000 Common Equity $1,076,721,000 $113,065,000 Intangibles $179,533,000 $21,938,000 Market Capitalization $1.174 billion $167 million Last Market Close $12.37 $17.27 Shares Outstanding 94.995 million 9.665 million Offices 164 20 LNBB Branches NWBI Branches Financial information as of September 30, 2014. Stock prices as of December 12, 2014. Northwest loan total is grossed up by undisbursed loan commitments and reduced by deferred loan costs. 6 |
|
|
LNB – An Attractive Franchise Northwest targets acquisitions that add franchise value as well as shareholder value. 7 |

|
|
Talented Management and Staff Dan Klimas, CEO of LNB Bancorp, Inc. and Lorain National Bank is a talented and driven leader. Dan has assembled a successful and loyal management team. We are pleased that he has agreed to stay on as Northwest’s Regional President and market leader in Ohio. We are pleased to be offering continued employment to all of LNB’s lenders, business development and customer-facing personnel. Northwest’s regional management team will remain located at their current company headquarters in Lorain. This strong, talented, experienced and cohesive management team represents Northwest’s foundation for future growth in Ohio. 8 |
|
|
An Attractive Deposit Mix Northwest (deposits in millions) % of Total Non-interest Checking 884.8 15.5% Interest Checking 895.3 15.7% Savings 1,214.3 21.3% Money Market 1,180.5 20.7% Time 1,532.8 26.8% 5,707.7 100% Cost of Deposits 0.44% Northwest’s and LNB’s deposit mixes are quite similar with a solid base of checking accounts and strong core deposits. The core deposit premium being paid, based on deal pricing, is 8.7%. 9 September 30, 2014 LNB (deposits in millions) % of Total Non-interest Checking 154.0 14.6% Interest Checking 179.9 17.0% Savings 127.3 12.0% Money Market 143.9 13.6% Time 451.7 42.8% 1,056.8 100% Cost of Deposits 0.49% Combined (deposits in millions) % of Total Non-interest Checking 1,038.8 15.4% Interest Checking 1,075.2 15.9% Savings 1,341.6 19.8% Money Market 1,324.4 19.6% Time 1,984.5 29.3% 6,764.5 100% Cost of Deposits 0.45% |

|
|
A Diversified Loan Mix A diverse, high-quality loan portfolio provides additional balance to Northwest’s current portfolio mix. Our combined entity can capitalize on Northwest’s mortgage and home equity expertise in the Cleveland market and on LNB’s consumer lending expertise across Northwest’s vast footprint. Northwest’s size and capital strength will allow our Ohio team to increase their targeted loan size and gain access to a base of businesses with higher borrowing needs. The deal premium as a percentage of loans is just 8.8%. In this environment, loans are as important as deposits. LNB’s loan to deposit ratio is 87.3%. 10 September 30, 2014 Northwest (loans in millions) % of Total Residential RE 2,519.4 41.6% Home Equity 1,071.5 17.7% Consumer 238.7 4.0% Commercial RE 1,787.9 29.5% Commercial 437.4 7.2% 6,054.9 100% Portfolio Yield 4.78% LNB (loans in millions) % of Total Residential RE 70.9 7.7% Home Equity 125.3 13.6% Consumer 227.2 24.6% Commercial RE 413.6 44.8% Commercial 85.5 9.3% 922.5 100% Portfolio Yield 3.91% Combined (loans in millions) % of Total Residential RE 2,590.3 37.1% Home Equity 1,196.8 17.2% Consumer 465.9 6.6% Commercial RE 2,201.5 31.6% Commercial 522.9 7.5% 6,977.4 100% Portfolio Yield 4.66% Northwest loan total is grossed up by undisbursed loan commitments and reduced by deferred loan costs. |

|
|
Solid Core Earnings 11 Annualized for Quarter Ended September 30, 2014 % of Average Assets Northwest LNB Net Interest Income 3.16% 2.89% Provision for Loan Losses 0.18% 0.23% Non-interest Income 0.93% 1.08% Non-interest Expense 2.73% 2.84% Net Income Before Tax 1.18% 0.90% Federal and State Income Tax 0.30% 0.23% Net Income After Tax 0.88% 0.67% The LNB franchise brings a respectable net interest margin and exceptional fee income. Assuming cost saves of 28%, the efficiency ratio of the Ohio Region of Northwest after the merger would be approximately 51%, thereby lowering Northwest’s current efficiency ratio of 65%. |

|
|
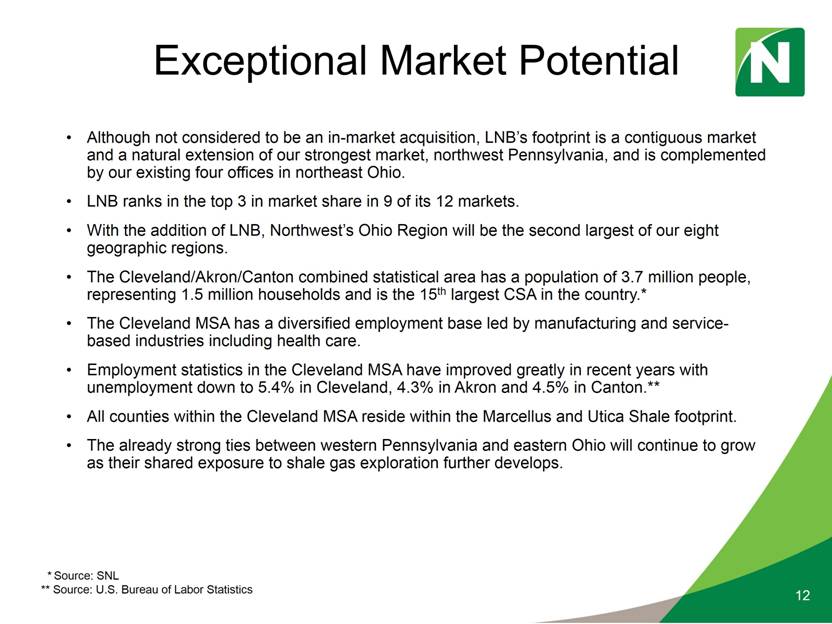
Exceptional Market Potential Although not considered to be an in-market acquisition, LNB’s footprint is a contiguous market and a natural extension of our strongest market, northwest Pennsylvania, and is complemented by our existing four offices in northeast Ohio. LNB ranks in the top 3 in market share in 9 of its 12 markets. With the addition of LNB, Northwest’s Ohio Region will be the second largest of our eight geographic regions. The Cleveland/Akron/Canton combined statistical area has a population of 3.7 million people, representing 1.5 million households and is the 15th largest CSA in the country.* The Cleveland MSA has a diversified employment base led by manufacturing and service-based industries including health care. Employment statistics in the Cleveland MSA have improved greatly in recent years with unemployment down to 5.4% in Cleveland, 4.3% in Akron and 4.5% in Canton.** All counties within the Cleveland MSA reside within the Marcellus and Utica Shale footprint. The already strong ties between western Pennsylvania and eastern Ohio will continue to grow as their shared exposure to shale gas exploration further develops. 12 * Source: SNL ** Source: U.S. Bureau of Labor Statistics |
|
|
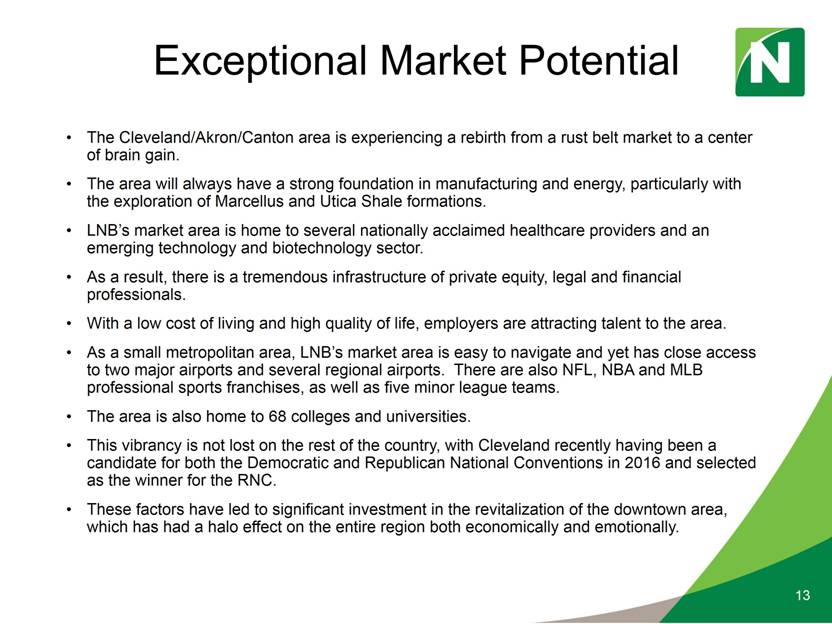
Exceptional Market Potential The Cleveland/Akron/Canton area is experiencing a rebirth from a rust belt market to a center of brain gain. The area will always have a strong foundation in manufacturing and energy, particularly with the exploration of Marcellus and Utica Shale formations. LNB’s market area is home to several nationally acclaimed healthcare providers and an emerging technology and biotechnology sector. As a result, there is a tremendous infrastructure of private equity, legal and financial professionals. With a low cost of living and high quality of life, employers are attracting talent to the area. As a small metropolitan area, LNB’s market area is easy to navigate and yet has close access to two major airports and several regional airports. There are also NFL, NBA and MLB professional sports franchises, as well as five minor league teams. The area is also home to 68 colleges and universities. This vibrancy is not lost on the rest of the country, with Cleveland recently having been a candidate for both the Democratic and Republican National Conventions in 2016 and selected as the winner for the RNC. These factors have led to significant investment in the revitalization of the downtown area, which has had a halo effect on the entire region both economically and emotionally. 13 |
|
|
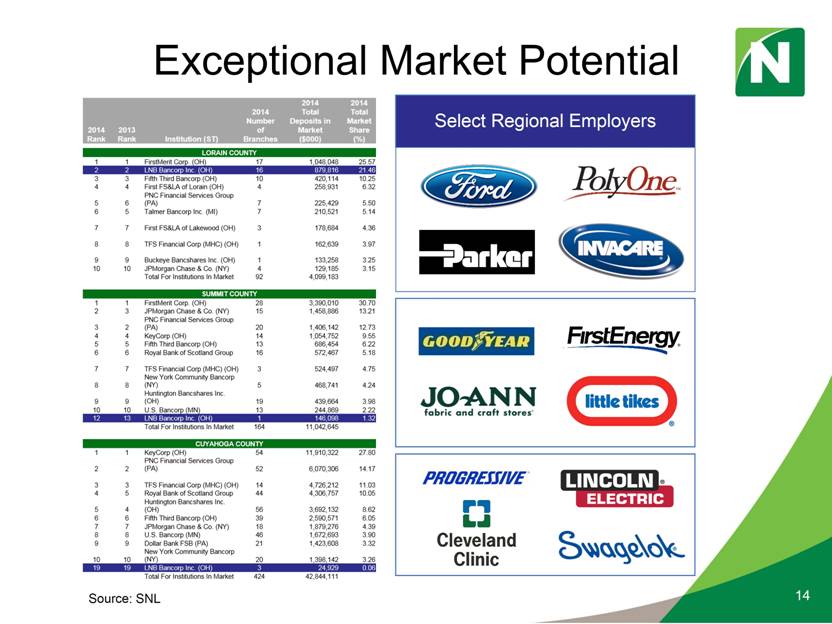
Exceptional Market Potential 14 Source: SNL |
|
|
Exceptional Market Potential 15 Source: SNL Market 2014 Population (#) Ann. 5-Yr Projected Pop Chg (%) 2014 Households (#) Ann. 5-Yr Projected HH Chg (%) 2014 Median HH Income ($) Ann. 5-Yr Projected HH Inc Chg (%) Markets where LNBB has an office Amherst, OH 11,324 (0.41) 4,620 (0.17) 49,360 (0.27) Avon Lake, OH 23,150 0.50 9,165 0.58 71,889 0.06 Avon, OH 22,685 1.32 7,968 1.14 73,533 0.04 Elyria, OH 53,826 (0.33) 22,655 (0.12) 41,299 0.28 Hudson, OH 21,986 (0.28) 7,563 (0.20) 95,974 (0.47) Lagrange, OH 2,074 (0.28) 763 (0.11) 65,487 (0.07) Lorain, OH 62,813 (0.47) 25,603 (0.15) 31,767 0.16 North Ridgeville, OH 30,872 0.90 12,022 0.82 63,666 0.31 Oberlin, OH 8,106 (0.72) 2,816 0.09 51,433 1.05 Olmsted Falls, OH 9,195 0.11 3,714 (0.02) 65,127 0.60 Stow, OH 35,122 0.18 14,379 0.21 59,632 (0.07) Vermilion, OH 10,215 (0.37) 4,105 (0.23) 51,913 0.01 Westlake, OH 32,812 0.09 13,997 0.19 66,446 0.32 Median 22,685 (0.28) 7,968 (0.02) 63,666 0.06 Markets that LNBB touches Bay Village, OH 15,338 (0.42) 6,122 (0.30) 76,008 0.29 Grafton, OH 6,252 (1.00) 1,299 (0.06) 60,338 0.55 Rocky River, OH 19,982 (0.24) 9,288 (0.05) 59,977 (0.14) Sheffield Lake, OH 9,019 (0.33) 3,747 (0.03) 43,164 (0.53) Sheffield Village, OH 4,105 0.61 1,621 0.51 56,926 0.01 Twinsburg, OH 19,173 0.63 7,493 0.51 65,275 0.02 Median 12,179 (0.29) 4,935 (0.04) 60,158 0.02 Market 2014 Population (#) Ann. 5-Yr Projected Pop Chg (%) 2014 Households (#) Ann. 5-Yr Projected HH Chg (%) 2014 Median HH Income ($) Ann. 5-Yr Projected HH Inc Chg (%) Nearby markets representing expansion potential Eastern Beachwood, OH 11,819 (0.15) 5,054 (0.02) 65,428 (0.04) Chagrin Falls, OH 4,158 0.03 1,901 0.22 54,190 (1.08) Highland Heights, OH 8,467 0.34 3,294 0.55 90,301 0.19 Lyndhurst, OH 13,713 (0.43) 6,423 (0.15) 60,840 0.06 Pepper Pike, OH 5,911 (0.19) 2,185 0.06 99,013 (0.79) Shaker Heights, OH 27,949 (0.37) 11,731 (0.24) 62,920 (0.04) Solon, OH 23,525 0.17 8,423 0.20 85,197 (0.41) Western Fairview Park, OH 16,513 (0.40) 7,503 (0.22) 50,942 0.38 North Olmsted, OH 32,072 (0.41) 13,547 (0.19) 53,237 0.20 Southern Brecksville, OH 13,567 (0.11) 5,343 (0.03) 82,970 (0.24) Broadview Heights, OH 19,803 0.45 7,783 0.36 73,975 (0.18) Fairlawn, OH 7,317 (0.13) 3,208 (0.08) 56,735 0.52 Independence, OH 7,033 (0.30) 2,741 (0.24) 65,667 (0.38) Macedonia, OH 11,627 0.58 4,442 0.51 80,892 0.20 North Royalton, OH 30,900 0.34 13,230 0.46 57,897 0.03 Seven Hills, OH 11,606 (0.36) 4,933 (0.26) 63,643 0.60 Strongsville, OH 44,743 0.01 17,730 0.10 69,806 0.20 Median 13,567 (0.13) 5,343 (0.02) 65,428 0.03 |

|
|
An Attractive Branch Network 16 Northwest LNB Branches 164 20 Deposits $5,707,723,000 $1,056,784,000 Deposits/Branch $34,803,000 $52,839,000 Excluding Retirement Village Branches Branches 16 Deposits $1,042,085,000 Deposits/Branch $65,130,000 Ten of LNB’s non-retirement village branches have over $50 million of deposits. The strength of LNB’s branch network lies in small and mid-sized northeastern Ohio communities. Small-town banking is Northwest’s strongest niche. Attractive facilities which are in good locations with good access, drive-ups and little deferred maintenance. Financial data as of September 30, 2014 |

|
|
Access to New Customers 17 Northwest LNB Combined Number of Households 294,629 44,280 338,909 Number of Customers 537,500 66,420 603,920 Number of Accounts 1,206,540 122,000 1,328,540 A strategic challenge of the banking industry is expanding our existing customer base. The merger with LNB brings Northwest access to a significant number of new households and new customers. |

|
|
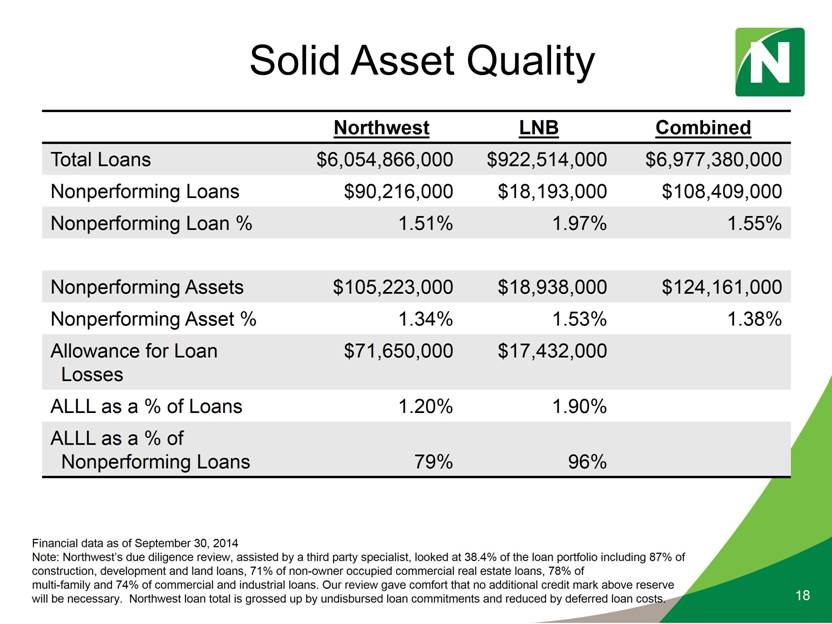
Solid Asset Quality 18 Financial data as of September 30, 2014 Note: Northwest’s due diligence review, assisted by a third party specialist, looked at 38.4% of the loan portfolio including 87% of construction, development and land loans, 71% of non-owner occupied commercial real estate loans, 78% of multi-family and 74% of commercial and industrial loans. Our review gave comfort that no additional credit mark above reserve will be necessary. Northwest loan total is grossed up by undisbursed loan commitments and reduced by deferred loan costs. Northwest LNB Combined Total Loans $6,054,866,000 $922,514,000 $6,977,380,000 Nonperforming Loans $90,216,000 $18,193,000 $108,409,000 Nonperforming Loan % 1.51% 1.97% 1.55% Nonperforming Assets $105,223,000 $18,938,000 $124,161,000 Nonperforming Asset % 1.34% 1.53% 1.38% Allowance for Loan Losses $71,650,000 $17,432,000 ALLL as a % of Loans 1.20% 1.90% ALLL as a % of Nonperforming Loans 79% 96% |
|
|
Transaction Overview 19 |
|
|
Strong Pro Forma Financial Metrics 20 Northwest Bancshares LNB Bancorp Pro Forma ($ in thousands) 3Q 2014 3Q 2014 Branches 164 20 184 Total Assets $7,826,926 $1,241,099 $9,036,129 Total Loans, net 5,885,451 906,579 6,800,005 Total Deposits 5,707,723 1,056,784 6,766,314 TCE / TA 11.77% 7.47% 10.30% NPAs / Loans + OREO 2.43% 2.49% 2.44% Market Capitalization $1,208,334 $166,921 $1,298,145 Price / Total Book Value 112% 148% 111% Price / Tangible Book Value 135% 183% 144% Price / 2016E 18.9x 15.5x 16.1x Note: Forward earnings estimates are based on analyst consensus for LNB’s 2016 net income. Deal value is calculated using the 20 day average closing stock price of Northwest Bancshares, Inc. as of Friday, December 12, 2014. |

|
|
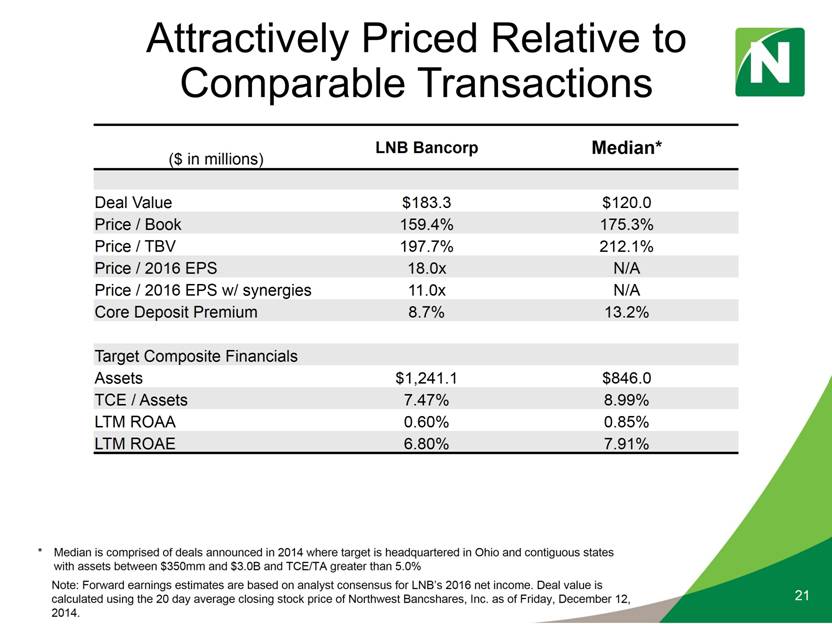
Attractively Priced Relative to Comparable Transactions 21 ($ in millions) LNB Bancorp Median* Deal Value $183.3 $120.0 Price / Book 159.4% 175.3% Price / TBV 197.7% 212.1% Price / 2016 EPS 18.0x N/A Price / 2016 EPS w/ synergies 11.0x N/A Core Deposit Premium 8.7% 13.2% Target Composite Financials Assets $1,241.1 $846.0 TCE / Assets 7.47% 8.99% LTM ROAA 0.60% 0.85% LTM ROAE 6.80% 7.91% * Median is comprised of deals announced in 2014 where target is headquartered in Ohio and contiguous states with assets between $350mm and $3.0B and TCE/TA greater than 5.0% Note: Forward earnings estimates are based on analyst consensus for LNB’s 2016 net income. Deal value is calculated using the 20 day average closing stock price of Northwest Bancshares, Inc. as of Friday, December 12, 2014. |
|
|
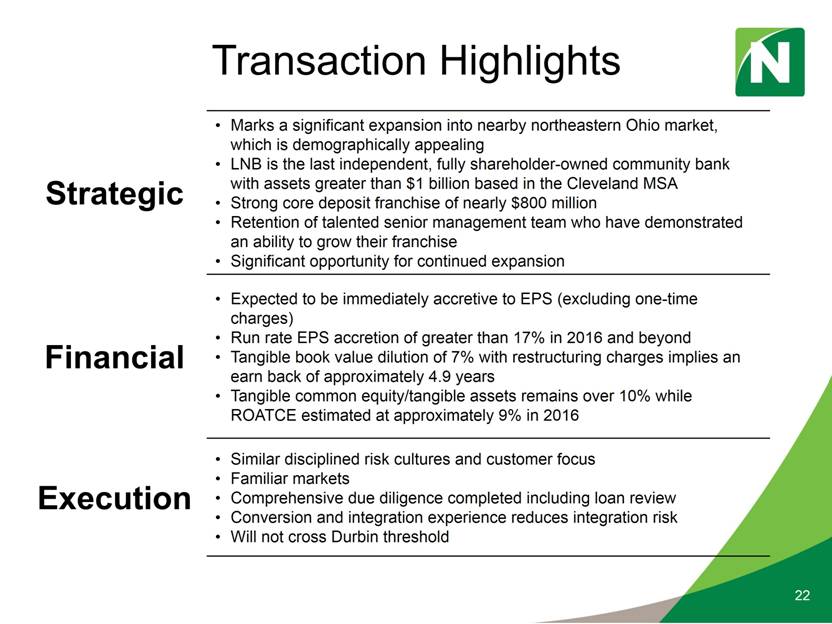
Transaction Highlights Strategic Marks a significant expansion into nearby northeastern Ohio market, which is demographically appealing LNB is the last independent, fully shareholder-owned community bank with assets greater than $1 billion based in the Cleveland MSA Strong core deposit franchise of nearly $800 million Retention of talented senior management team who have demonstrated an ability to grow their franchise Significant opportunity for continued expansion Financial Expected to be immediately accretive to EPS (excluding one-time charges) Run rate EPS accretion of greater than 17% in 2016 and beyond Tangible book value dilution of 7% with restructuring charges implies an earn back of approximately 4.9 years Tangible common equity/tangible assets remains over 10% while ROATCE estimated at approximately 9% in 2016 Execution Similar disciplined risk cultures and customer focus Familiar markets Comprehensive due diligence completed including loan review Conversion and integration experience reduces integration risk Will not cross Durbin threshold 22 |
|
|
Appendix 23 |
|
|
Non-GAAP Reconciliation 24 Efficiency Ratio ($000, data is LTM as of 9/30/14) Northwest LNB Noninterest Expense $214,500 $35,407 Less: Amortization of Intangibles & Goodwill Impairment (1,214) (136) Less: Foreclosure & Repo Expense (3,888) (117) Adjusted Noninterest Expense $209,398 $35,154 Net Interest Income (FTE) $254,260 $36,840 Noninterest Income 67,789 12,734 Total Income $322,049 $49,574 Efficiency Ratio 65.02% 70.91% (Adjusted Noninterest Expense / Total Income) Source: SNL Financial. |

|
|
Non-GAAP Reconciliation 25 Tangible Common Equity/Tangible Assets ($000, data is LTM as of 9/30/14) Northwest LNB Total Common Shareholders' Equity $1,076,721 $113,065 Less: Goodwill & Other Intangibles, net (179,533) (21,938) Tangible Common Equity $897,188 $91,127 Total Assets $7,826,926 $1,241,099 Less: Goodwill & Other Intangibles, net (179,533) (21,938) Tangible Assets $7,647,393 $1,219,161 Tangible Common Equity / Tangible Assets 11.73% 7.47% Source: SNL Financial. |

|
|
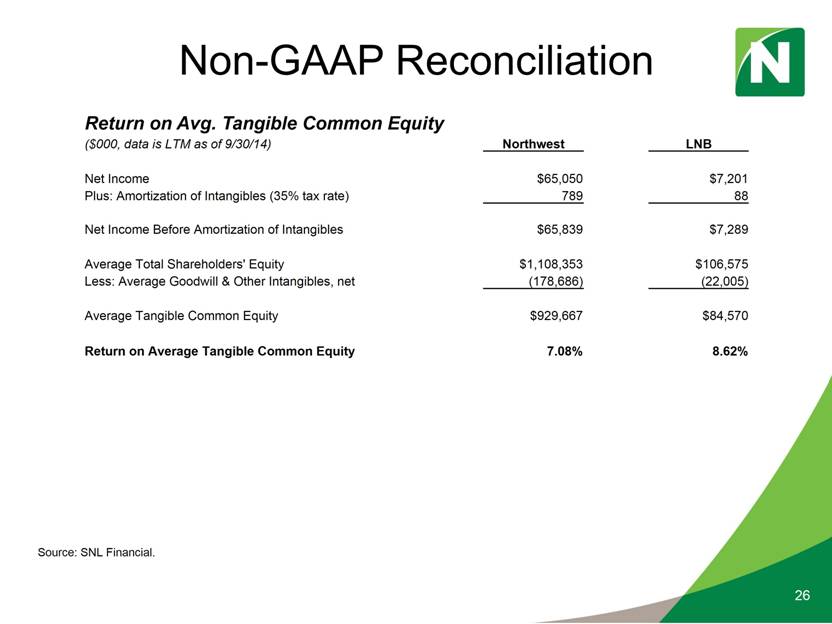
Non-GAAP Reconciliation 26 Return on Avg. Tangible Common Equity ($000, data is LTM as of 9/30/14) Northwest LNB Net Income $65,050 $7,201 Plus: Amortization of Intangibles (35% tax rate) 789 88 Net Income Before Amortization of Intangibles $65,839 $7,289 Average Total Shareholders' Equity $1,108,353 $106,575 Less: Average Goodwill & Other Intangibles, net (178,686) (22,005) Average Tangible Common Equity $929,667 $84,570 Return on Average Tangible Common Equity 7.08% 8.62% Source: SNL Financial. |