Attached files
| file | filename |
|---|---|
| 8-K - 8-K - CU Bancorp | d830918d8k.htm |
 CU
Bancorp Investor Presentation
as of September 30, 2014
Exhibit 99.1
…
a better banking experience |
 2
Forward-Looking Statements
This
press
release
contains
certain
forward-looking
information
about
CU
Bancorp
(the
“Company”),
1 Enterprise
Bank
and
the
combined company after the close of the transaction that is intended to be
covered by the safe harbor for “forward looking statements”
provided by the Private Securities Litigation Reform Act of 1995. All statements
other than statements of historical fact are forward- looking
statements. Such statements involve inherent risks and uncertainties, many of which are difficult to predict and are generally
beyond the control of the Company. Forward-looking statements speak only as
of the date they are made and we assume no duty to update such
statements. We caution readers that a number of important factors could cause actual results to differ materially from
those
expressed
in,
implied
or
projected
by,
such
forward-looking
statements.
Risks
and
uncertainties
include,
but
are
not
limited
to:
lower than expected revenues; credit quality deterioration or a reduction in real
estate values could cause an increase in the allowance for credit losses
and a reduction in net earnings; increased competitive pressure among depository institutions; the Company’s ability to
complete future acquisitions, successfully integrate such acquired entities, or
achieve expected beneficial synergies and/or operating efficiencies within
expected time-frames or at all; the possibility that personnel changes will not proceed as planned; the cost of
additional capital is more than expected; a change in the interest rate
environment reduces net interest margins; asset/liability repricing risks
and liquidity risks; legal matters could be filed against the Company and could take longer or cost more than expected to
resolve or may be resolved adversely to the Company; general economic conditions,
either nationally or in the market areas in which the Company does or
anticipates doing business, are less favorable than expected; environmental conditions, including natural disasters
and drought, may disrupt our business, impede our operations, negatively impact
the values of collateral securing the Company’s loans and leases or
impair the ability of our borrowers to support their debt obligations; the economic and regulatory effects of the continuing
war on terrorism and other events of war, including the conflicts in the Middle
East; legislative or regulatory requirements or changes adversely
affecting the Company’s business; changes in the securities markets; regulatory approvals for any capital activities cannot be
obtained on the terms expected or on the anticipated schedule; and, other risks
that are described in CU Bancorp’s public filings with the U.S.
Securities and Exchange Commission (the “SEC”). Additional risks and uncertainties relating to the proposed transaction with 1st
Enterprise Bank include, but are not limited to: the ability to complete the
proposed transaction, including obtaining regulatory approvals and
approvals by the shareholders of CU Bancorp and 1st Enterprise Bank; the length of time necessary to consummate the
proposed transaction; the ability to successfully integrate the two institutions
and achieve expected synergies and operating efficiencies on the expected
timeframe; unexpected costs relating to the proposed transaction; and the potential impact on the institutions’
respective
businesses
as
a
result
of
uncertainty
surrounding
the
proposed
transaction.
If
any
of
these
risks
or
uncertainties
materializes
or if any of the assumptions underlying such forward-looking statements
proves to be incorrect, CU Bancorp’s results could differ
materially
from
those
expressed
in,
implied
or
projected
by
such
forward-looking
statements.
CU
Bancorp
assumes
no
obligation
to
update
such
forward-looking
statements.
For
a
more
complete
discussion
of
risks
and
uncertainties,
investors
and
security
holders
are
urged to read CU Bancorp’s annual report on Form 10-K, quarterly reports
on Form 10-Q and other reports filed by CU Bancorp with the SEC.
The
documents
filed
by
CU
Bancorp
with
the
SEC
may
be
obtained
at
CU
Bancorp’s
website
at
www.cubancorp.com
or
at
the
SEC’s
website at www.sec.gov. These documents may also be obtained free of charge from
CU Bancorp by directing a request to: CU Bancorp c/o California United
Bank, 15821 Ventura Boulevard, Suite 100, Encino, CA 91436. Attention: Investor Relations. Telephone 818-257-
7700.
st |
 3
Investment Highlights
……….……………….……… Merger
Overview.……………………..………………
Third Quarter
Highlights……….....……………………
Appendix
...…………………….....……………………
25
24
14
4 |
 4
Investment Highlights
Premier community-based business banking
franchise serving large and diverse market
Strong organic loan growth
Attractive low-cost core deposit base
Exceptional credit quality
Growing visibility in the investment community
November 30, 2014, merger with 1
st
Enterprise
Bank,
creating
a
$2.3
billion
“pure
play”
business
bank in attractive Southern California market |
 5
Premier Business Banking Franchise
$1.5 billion in assets, achieved by experienced management
team in nine years, through organic growth and two successful
acquisitions
17
th
largest publicly-owned bank by assets in combined Los Angeles, Orange and
Ventura counties*
280
th
largest publicly-owned bank by assets in U.S.*
Asset CAGR of 39% since inception in 2005 through 12/31/13
Footprint
includes
eight
branches
covering
L.A.,
Orange,
Ventura
and
San
Bernardino
counties
*Source: SNL Financial |
 6
LA Basin is Robust Market
Source: The World Bank and Center for the Continuing Study of the California Economy
The LA Basin is the 16
th
largest economy in the world; it includes Los
Angeles, Orange, Riverside, San Bernardino and Ventura counties
Rank in
World
Country
2013 GDP in
$billions
14
South Korea
1,305
15
Mexico
1,261
LA Basin
995
16
Indonesia
868
17
Turkey
820
18
Netherlands
800
19
Saudi Arabia
745
20
Switzerland
650
.
.
.
53
San Diego
191 |
 7
Sophisticated Relationship Management Team offers
Solutions for Small-
and Medium-Sized Businesses
Sophisticated relationship management team offers personalized and
responsive
service
focused
on
small-
and
medium-sized
businesses
in
Los
Angeles, Orange and Ventura counties
Los Angeles County is the largest manufacturing center in the U.S. and would be
9
th
largest state in U.S.
L.A.
County
expected
to
add
more
than
150,000
jobs
over
the
next
two
years;
June
2014
unemployment
rate
of
7.8%
projected
to
fall
to
7.2%
by
end
of
2015*
Orange County would be 31
st
largest state in U.S.
Orange County unemployment rate is 5.1% as of September 2014**
Three-county
area
is
home
to
more
than
532,000
small-
and
middle-market
business** (defined as employing 1 to 499 workers)
*Source: Forecast by Beacon Economics, February 2014; actual unemployment rate from
Bureau of Labor and Statistics (BLS)
**Source: County data from Los Angeles Economic Development Corporation and California
EDD, as of 2012; actual unemployment rate from BLS
|
 8
Franchise Growth Strategies
Organic Growth
Offer expertise in C&I and commercial real estate lending to small and
middle- market businesses
Provide customers with sophisticated products and solutions
Leverage relationship-based banking approach and superior service
SBA lending platform expertise acquired with Premier Commercial Bank
Continue recruiting “in market”
talent from competitors
Growth by Merger/Acquisition
Strong management team experienced with successful, accretive acquisitions
California Oaks State Bank (12/31/10)
Premier Commercial Bank (7/31/12)
1
st
Enterprise Bank (11/30/14) |
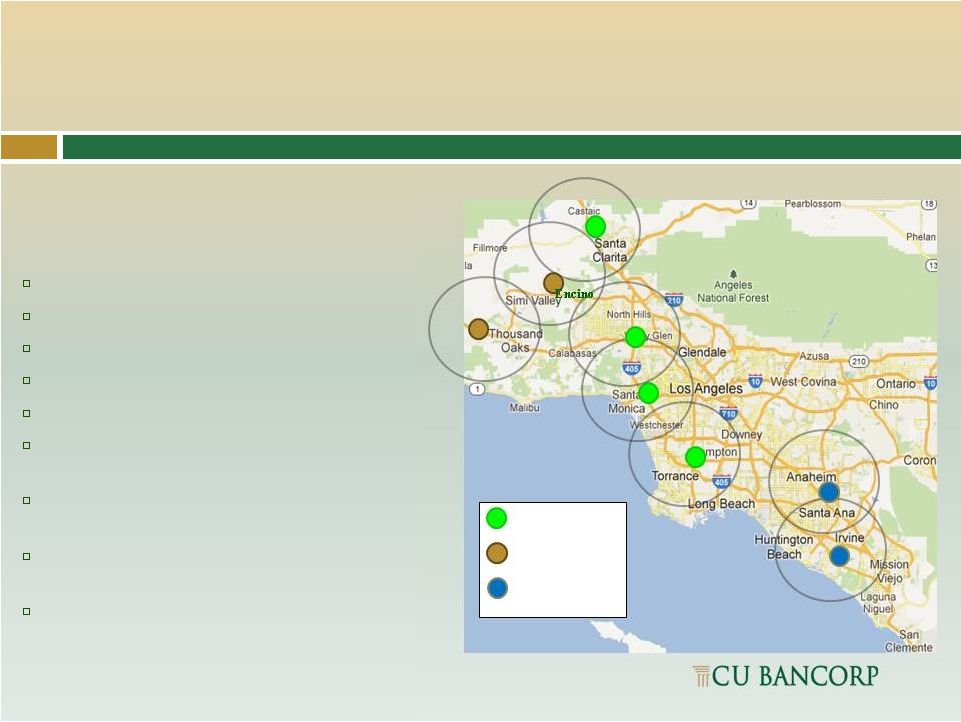 Strategic
Geographic Locations Encino (2005) –
Headquarters
Los Angeles (2006)
Santa Clarita Valley (2007)
South
Bay
(2009)
–
Converted
to
a
branch
in
2010
Orange County (2010) –
Loan Production Office*
Simi Valley (2010) –
Acquired from California Oaks
State Bank
Thousand Oaks (2010) –
Acquired from California Oaks
State Bank
Anaheim (2012) –
Acquired from Premier Commercial
Bank
Irvine/Newport Beach (2012) –
Acquired from Premier
Commercial Bank*
*Combined location (August 2013)
9
CUB Branch
Former COSB
Branch
Former PCB Branch
California
United Bank has a footprint
that spans the most attractive markets in
Southern
California: |
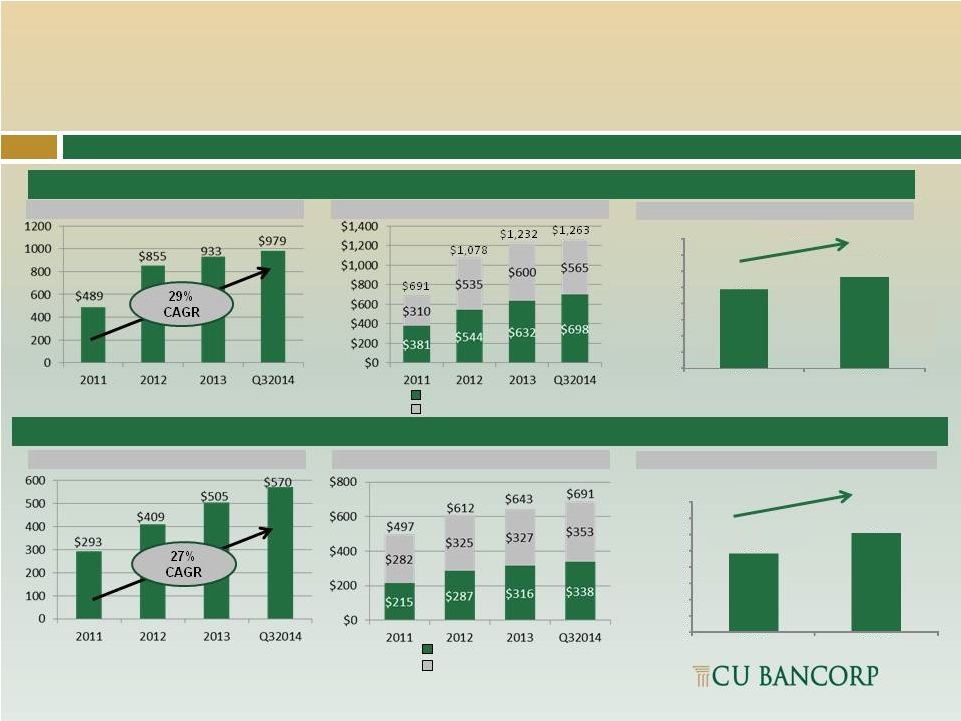
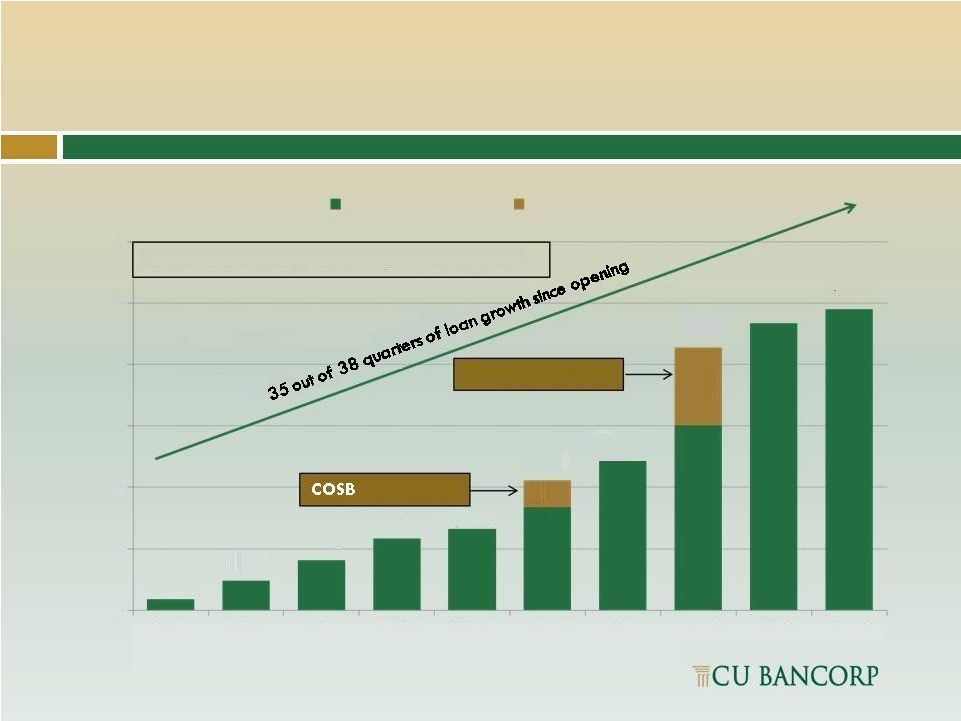 COSB
Loan Growth
$35
$96
$162
$232
$263
$334
$489
$600
$933
$979
$0
$200
$400
$600
$800
$1,000
$1,200
2005
2006
2007
2008
2009
2010
2011
2012
2013
3Q14
CUB Organic
Acquisitions
$855
$421
PCB acquisition
Loan Growth from 3Q13 = $69MM or 8%
$87
$255
acquisition
10 |
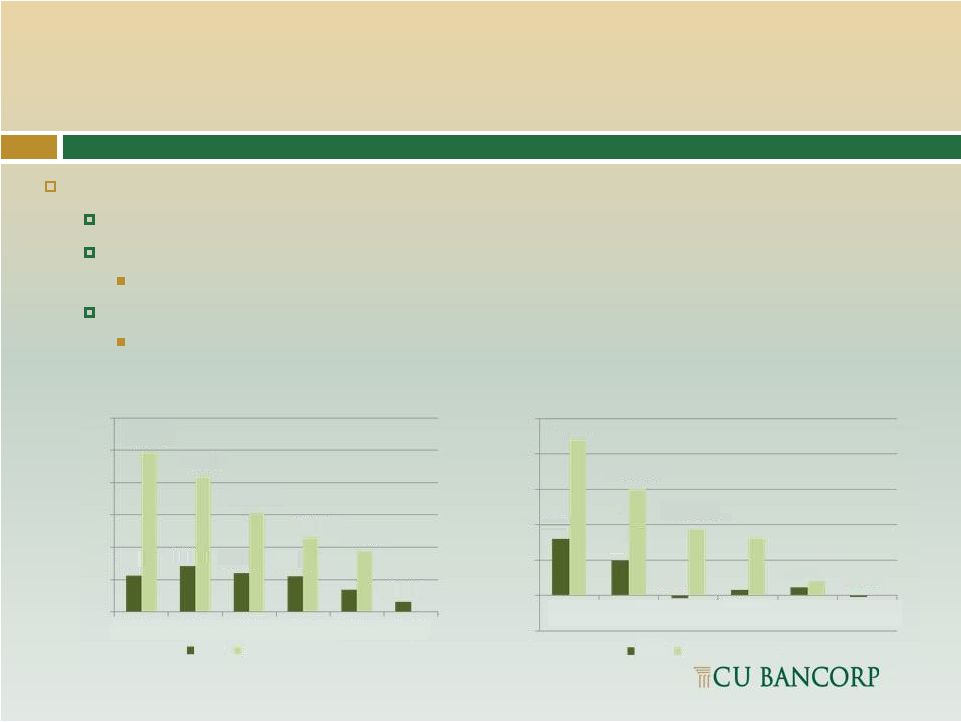 11
Strong Credit Quality Trend Continues
CUB credit quality at Sept. 30, 2014:
Total nonaccrual loans of $4.4 million or 0.44% of total loans
NPAs to total assets of 0.30%
NPAs at lowest level in five years
Net recoveries year to date of $227 thousand
Net recoveries in first three quarters of 2014
Peer group includes California banks or bank holding companies with total
assets between $1.0-2.0 billion; source: SNL.
NPAs to total assets
Net charge-offs
0.80%
0.49%
-0.04%
0.08%
0.12%
-
0.02%
2.20%
1.50%
0.94%
0.82%
0.21%
-0.50%
0.00%
0.50%
1.00%
1.50%
2.00%
2.50%
2009
2010
2011
2012
2013
3Q14
CUB
Peer Group Avg.
1.12%
1.42%
1.19%
1.09%
0.68%
0.30%
4.94%
4.19%
3.06%
2.31%
1.89%
0.00%
1.00%
2.00%
3.00%
4.00%
5.00%
6.00%
2009
2010
2011
2012
2013
3Q14
CUB
Peer Group Avg. |
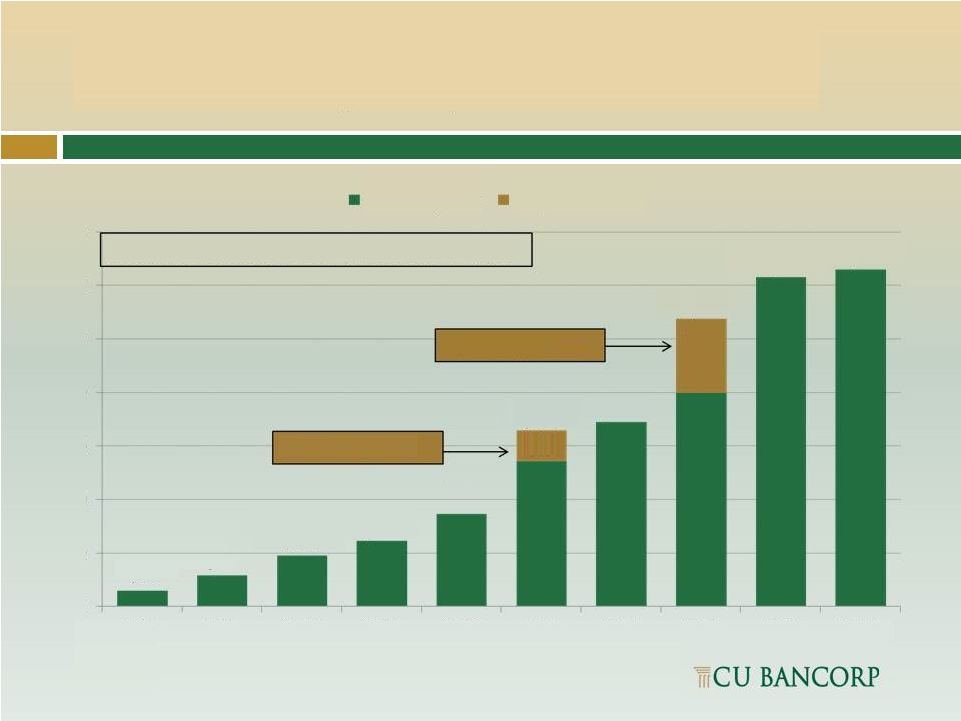 Quality
Deposit Growth $60
$116
$191
$246
$346
$545
$691
$800
$1,232
$1,262
$113
$278
$0
$200
$400
$600
$800
$1,000
$1,200
$1,400
2005
2006
2007
2008
2009
2010
2011
2012
2013
3Q14
CUB Organic
Acquisitions
$1,078
PCB acquisition
$658
COSB acquisition
Non
-
Interest Bearing Grew $89MM from 3Q13
12 |
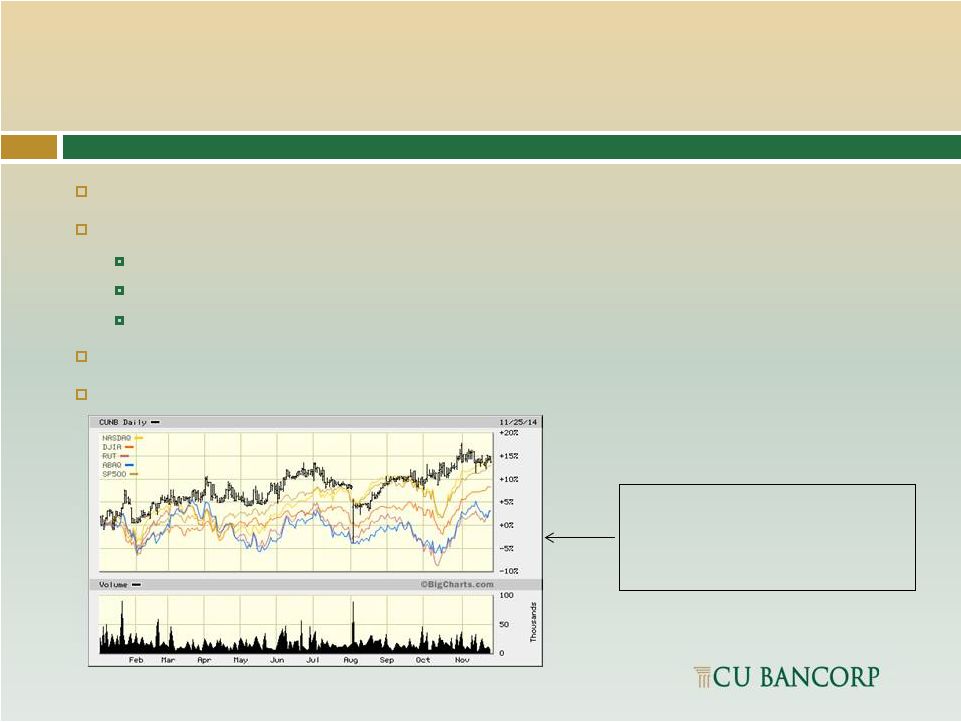 Growing
Visibility in the Investment Community Surpassed $1 billion in assets in July
2012 Transferred listing to Nasdaq Capital Market in October 2012 (CUNB)
43% institutional ownership per 3Q14 13-f filings
11.2 million shares outstanding at 9/30/14
$219 million market cap at 11/25/14
Added to Russell Indexes in June 2013
Analyst coverage by five Wall Street brokerage firms
Year to date CUNB has outperformed the
KBW Bank Index (BKX), ABA NASDAQ
Bank Index (ABAQ), the Russell 2000
Index (RUT), and is just about even with
the NASDAQ
Composite (NASDAQ).
13 |
 14
Merger is a Great Fit of People and Culture
Blending the best of two high performing
organizations
Complementary branch locations and customer-first
cultures fit like a glove
Brings together some of the top bankers and banking
support staff in Southern California
Larger organization provides increased opportunities
for continued professional growth |
 Merger
with
1
st
Enterprise
Bank
Has
Attractive
Footprint
and
Large
Branch
Size
CUNB (8 branches)
FENB (3 branches; 1 LPO)
Inland Empire:
FENB: $76 million
Downtown LA:
FENB: $312 million
Irvine/Newport Beach:
CUNB: $147 million
FENB: $290 million
Pro Forma: $437 million
Santa Clarita Valley:
CUNB: $77 million
Simi Valley:
CUNB: $12 million
West LA:
San Fernando Valley:
CUNB: $235 million
Anaheim:
CUNB: $199 million
$100 Million+ Branches
Woodland Hills LPO
South Bay:
CUNB: $69 million
Conejo Valley:
CUNB: $219 million
Source: CUNB and FENB; branch deposits data as of Sept. 30, 2014
CUNB:
$279
million
15 |
 16
Summary of Merger Terms
Name:
CU Bancorp / California United Bank
Headquarters:
Downtown
Los
Angeles
(Current
FENB
headquarters)
Management:
Chairman
and
CEO,
David
I.
Rainer
(current
Chairman,
President
and
CEO
of
CUNB)
Board
Composition:
8
CUNB
/
4
FENB
Ownership:
68%
CUNB
/
32%
FENB
Consideration:
1.3450
shares
of
CUNB
stock
for
each
FENB
share
100% stock consideration; fixed exchange ratio
Equivalent
to
$26.27
per
FENB
share
4
13% premium to FENB’s last closing price
2
Deal value of approximately $103 million
1
16.9x 2014 analyst EPS estimate
172% of tangible book value per share
3
Timing:
Closed
on
November
30,
2014
1
Based on CUNB closing price of $18.19 on June 2, 2014
2
Based on FENB closing price of $21.75 on June 2, 2014
3
As of March 31, 2014
4
Based on CUNB closing price of $19.53 on November 25, 2014
President, K. Brian Horton (current President of FENB) |
 Noninterest bearing deposits
Interest bearing deposits
Noninterest bearing deposits
Interest bearing deposits
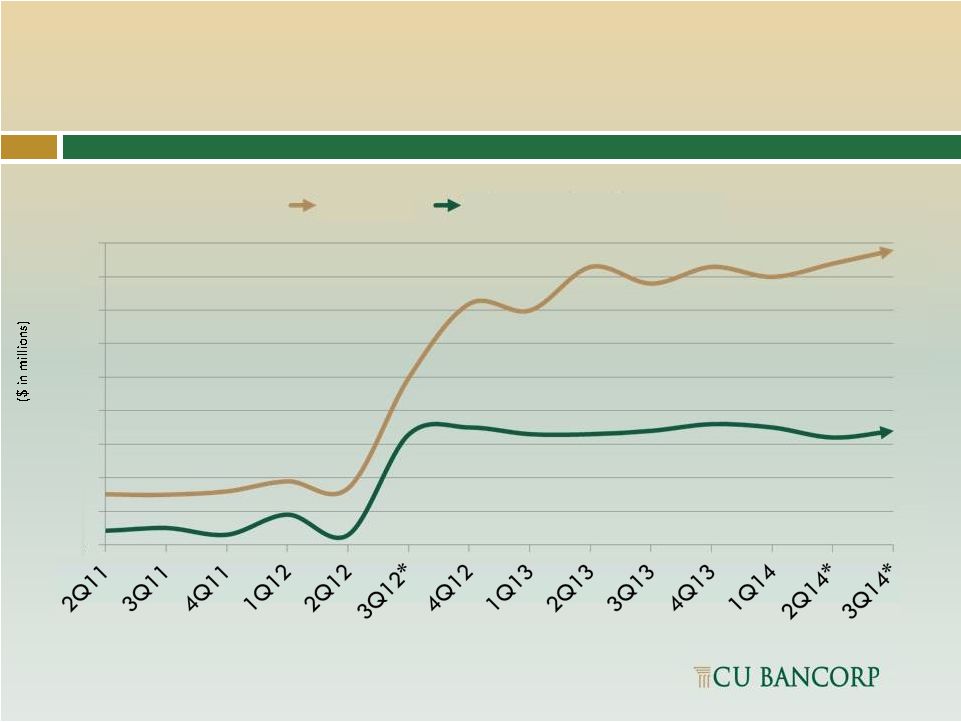
Combination of Two Growth-Oriented Franchises
Source: SNL Financial
1
Mean analyst estimate as of June 2, 2014
2
Analyst estimate as of June 2, 2014
1
Gross Loans ($mm)
CUNB Performance
Net Income to Common ($mm)
FENB Performance
Total Deposits ($mm)
Gross Loans ($mm)
Total Deposits ($mm)
Net Income to Common ($mm)
$9.8
$11.3
$0.0
$2.0
$4.0
$6.0
$8.0
$10.0
$12.0
$14.0
$16.0
2013
2014E
$4.8
$6.1
$0.0
$1.0
$2.0
$3.0
$4.0
$5.0
$6.0
$7.0
$8.0
2013
2014E²
26%
16%
17 |
 18
Pro Forma Financial Profile
1
Based on financial information as of Sept. 30, 2014, unless otherwise noted
2
Based on market data as of Nov. 3, 2014
3
Projected at close
4
Source: SNL Financial
5
Projected 2016 results with fully phased-in cost savings
$324mm
2
0.9-1.1%
5
11-12%
5
Total assets
$1.5bn
$0.8bn
$2.3bn
Total loans
$1.0bn
$0.6bn
$1.6bn
Total deposits
$1.3bn
$0.7bn
$2.0bn
Market capitalization
$222mm
2
$102mm
2
Number of branches
8
3 + LPO
10 + LPO
Tang. common equity ratio
9.3%
7.3%
8.1%
3
Tier I leverage ratio
10.1%
9.5%
9.6%
3
Total risk-based ratio
12.8%
11.4%
11.5%
3
Cost of deposits (Q3 2014) (%)
0.11%
0.12%
0.11%
Nonperforming assets/total assets (%)
0.30%
0.00%
0.19%
LTM Core ROAA (%)
0.80%
4
0.86%
4
LTM ROATCE (%)
8.3%
4
10.8%
4
Pro Forma
1 |
 19
Uniquely Attractive Southern California Franchise
1
Market cap based on CUNB closing price on Nov. 4, 2014; balance sheet and deposit
franchise data as of Sept. 30, 2014
Source: SNL Financial; peer data based on Sept. 30, 2014 financial data
Business banking focus
Growth profile (balance sheet and EPS)
Stellar funding base (loan/deposit ratio, deposit composition and deposit cost)
Large branch size
Balance Sheet
Loan Portfolio
Deposit Franchise
Company
Market
Cap.
($mm)
Total
Assets
($bn)
Loans/
Deposits
(%)
C&I + OO
CRE
(%)
CRE
NOO
(%)
MRQ
Cost of
Deposits
(%)
Non-
Interest
Bearing
(%)
CVB Financial Corp.
1,518
7.4
64
30
41
0.09
53
121
BBCN Bancorp, Inc.
1,160
6.9
99
48
44
0.54
27
107
Opus Bank
861
4.7
106
20
15
0.57
17
54
Banc of California, Inc.
333
4.4
75
13
10
0.70
13
120
Wilshire Bancorp, Inc.
723
3.7
99
41
45
0.53
29
83
Hanmi Financial Corporation
672
3.1
92
51
39
0.50
36
75
Pro Forma CUNB
324
2.3
79
55
29
0.11
53
177
Avg.
Branch
Deposits
($mm)
1
Pro forma company will be 1 of 7 commercial banks headquartered in Southern
California and traded on NASDAQ or NYSE with total assets of $2.0 - $10.0 billion
Pro forma Company is a uniquely attractive franchise within this market |
 20
Benefits to all Stakeholders
Scarcity value of $2.3 billion asset SoCal business banking platform
Financially compelling projected pro forma results
Enhanced trading liquidity with larger pro forma market capitalization
Broadened investor base
Shared high standard for the quality of customer service
Expanded footprint and market reach
Larger lending base
Broader product offerings
Partnership approach to forming pro forma management team
Partnership of both boards of directors with strong ties to community
Branch consolidation in Irvine
Shareholders
Customers
Employees |
 21
Third Quarter 2014 Highlights
Net
income
of
$2.55
million,
2.9%
increase
from
$2.48
million
in
3Q13
Core net income of $3.2 million, 28% increase from $2.5 million in 3Q13
Core EPS of $0.28, 22% increase from $0.23 in 3Q13
Continued strong credit quality
NPAs to total assets of 0.30%
Net recoveries of $29 thousand in 3Q14 |
 22
2014 Highlights
For the Nine Months Ended
Income Statement
2014
2013
% change
EPS
$0.70
$0.66
6%
Net income
7,601
6,953
9%
Core net income
8,729
6,996
25%
Balance Sheet, as of September 30,
2014
2013
Total loans
978,800
909,642
8%
Total deposits
1,262,947
1,176,349
7%
Total loans increased $69 million or 8%, from 3Q13
Total deposits increased $87 million or 7%, from 3Q13
Non-interest bearing deposits increased $89 million or 15%, from 3Q13
|
 23
Improving Operating Leverage
*3Q12 operating expenses excludes $2.5 million in merger-related expenses; 2Q14
excludes $497 thousand in merger-related expenses; 3Q14 excludes $631 thousand
in merger-related expenses. $6
$7
$8
$9
$10
$11
$12
$13
$14
$15
Revenue
Operating Expenses |
 24
CU Bancorp is Well Capitalized
by All Regulatory Ratios
Regulatory Ratios
"Well
Capitalized"
3Q14
Tier 1 Leverage
5%
10.12%
Tier 1 Risk-based Capital
6%
11.88%
Total Risk-based Capital
10%
12.83% |
 25
Appendix |
 26
Reconciliation of Non-GAAP Measures
Core Net Income
(Unaudited)
The Company utilizes the term Core Net Income, a non-GAAP financial
measure. CU Bancorp’s management believes Core Net Income is useful because it is a measure
utilized by management and market analysts to understand the effects of
merger expenses and provides an alternative view of the Company’s performance over time and in
comparison to the Company’s competitors. Core net income
should not be viewed as a substitute for net income. A reconciliation of CU Bancorp’s Net Income to Core Net
Income is presented in the tables below for the periods
indicated: (Dollars in thousands except per share data)
Nine Months Ended
September 30, 2014
September 30, 2013
Net Income
$
7,601
$
6,953
Add back: Merger related expenses
1,128
43
Core Net Income
$
8,729
$
6,996
Three Months Ended
September 30, 2014
September 30, 2013
Net Income
$
2,549
$
2,477
Add back: Merger related expenses
631
–
Core Net Income
$
3,180
$
2,477
Diluted Average Shares Outstanding
11,190,000
10,848,000
Diluted Earnings Per Share
$
0.23
$
0.23
Diluted Core Earnings Per Share*
$
0.28
$
0.23
*Diluted Core Earnings Per Share: Annualized core net income/diluted average
shares outstanding |