Attached files
| file | filename |
|---|---|
| 8-K - 8-K - TOYS R US INC | d827929d8k.htm |
 EASY
EXPERT
FAIR
Bank of America Merrill Lynch
Leveraged Finance Conference 2014
Exhibit 99.1 |
 EASY
EXPERT
FAIR
2
This
presentation
and
the
documents
filed
by
TOYS“R”US,
INC.
with
the
Securities
and
Exchange
Commission
contain
“forward
looking”
statements
within
the
meaning
of
the
federal
securities
laws
and
such
statements
are
intended
to
be
covered
by
the
safe
harbors
created
thereby.
These
forward
looking
statements
reflect
our
current
views
with
respect
to,
among
other
things,
our
operations
and
financial
performance.
All
statements
herein
or
therein
that
are
not
historical
facts,
including
statements
about
our
beliefs
or
expectations,
are
forward-looking
statements.
We
generally
identify
these
statements
by
words
or
phrases,
such
as
“anticipate,”
“estimate,”
“plan,”
“project,”
“expect,”
“believe,”
“intend,”
“foresee,”
“forecast,”
“will,”
“may,”
“outlook”
or
the
negative
version
of
these
words
or
other
similar
words
or
phrases.
These
statements
discuss,
among
other
things,
our
strategy,
store
openings,
integration
and
remodeling,
the
development,
implementation
and
integration
of
our
Internet
business,
future
financial
or
operational
performance,
projected
sales
for
certain
periods,
comparable
store
net
sales
from
one
period
to
another,
cost
savings,
results
of
store
closings
and
restructurings,
outcome
or
impact
of
pending
or
threatened
litigation,
domestic
or
international
developments,
amount
and
allocation
of
future
capital
expenditures,
growth
initiatives,
inventory
levels,
cost
of
goods,
selection
and
type
of
merchandise,
marketing
positions,
implementation
of
safety
standards,
future
financings,
estimates
regarding
future
effective
tax
rates,
and
other
goals
and
targets
and
statements
of
the
assumptions
underlying
or
relating
to
any
such
statements.
These
statements
are
subject
to
risks,
uncertainties
and
other
factors,
including,
among
others,
the
seasonality
of
our
business,
competition
in
the
retail
industry,
changes
in
our
product
distribution
mix
and
distribution
channels,
general
economic
factors
in
the
United
States
and
other
countries
in
which
we
conduct
our
business,
consumer
spending
patterns,
live
birth
trends,
our
ability
to
implement
our
strategy,
including
implementing
initiatives
for
season,
our
ability
to
recognize
cost
savings,
marketing
strategies,
the
availability
of
adequate
financing,
access
to
trade
credit,
changes
in
consumer
preferences,
changes
in
employment
legislation,
our
dependence
on
key
vendors
for
our
merchandise,
political
and
other
developments
associated
with
our
international
operations,
costs
of
goods
that
we
sell,
labor
costs,
transportation
costs,
domestic
and
international
events
affecting
the
delivery
of
toys
and
other
products
to
our
stores,
product
safety
issues
including
product
recalls,
the
existence
of
adverse
litigation,
changes
in
laws
that
impact
our
business,
our
substantial
level
of
indebtedness
and
related
debt-service
obligations,
restrictions
imposed
by
covenants
in
our
debt
agreements
and
other
risks,
uncertainties
and
factors
set
forth
under
Item
1A
entitled
“RISK
FACTORS”
of
TOYS“R”US,
INC.’s
Annual
Report
on
Form
10-K
for
the
fiscal
year
ended
February
1,
2014
and
in
its
other
reports
and
documents
filed
with
the
Securities
and
Exchange
Commission.
In
addition,
we
typically
earn
a
disproportionate
part
of
our
annual
operating
earnings
in
the
fourth
quarter
as
a
result
of
seasonal
buying
patterns
and
these
buying
patterns
are
difficult
to
forecast
with
certainty.
These
factors
should
not
be
construed
as
exhaustive,
and
should
be
read
in
conjunction
with
the
other
cautionary
statements
that
are
included
in
those
reports
and
documents.
We
believe
that
all
forward-looking
statements
are
based
on
reasonable
assumptions
when
made;
however,
we
caution
that
it
is
impossible
to
predict
actual
results
or
outcomes
or
the
effects
of
risks,
uncertainties
or
other
factors
on
anticipated
results
or
outcomes
and
that,
accordingly,
one
should
not
place
undue
reliance
on
these
statements.
Forward-looking
statements
speak
only
as
of
the
date
they
were
made,
and
we
undertake
no
obligation
to
update
these
statements
in
light
of
subsequent
events
or
developments
unless
required
by
the
Securities
and
Exchange
Commission’s
rules
and
regulations.
Actual
results
and
outcomes
may
differ
materially
from
anticipated
results
or
outcomes
discussed
in
any
forward-looking
statement.
FORWARD LOOKING STATEMENTS
PRELIMINARY ESTIMATES
The
financial
information
for
the
third
quarter
of
fiscal
2014
contained
in
this
presentation
are
preliminary
estimates
and
are
derived
from
preliminary
internal
financial
reports
and
are
subject
to
revision
based
on
the
completion
of
quarter-end
accounting
and
financial
reporting
processes.
Accordingly,
our
actual
results
may
differ
from
these
estimates
and
such
differences
may
be
material. |
 EASY
EXPERT
FAIR
3
•
Promotional discipline reflected in revenues of
$2.5 billion
•
(1.0%) decrease in Domestic SFS sales
•
1.1% increase in International SFS sales
•
Successful refinancing of Toys “R”
Us-Delaware,
Inc. (“Toys Delaware”) 2016 maturities and a
significant portion of 2018 maturities provides the
management team runway to execute on its
operating strategy
•
Next large debt tower in 2017
•
Disciplined approach to promotions reflected in
Q3 margins
•
Gross margin of $908 million up $12 million or 96
bps from previous year
•
Positive adjusted EBITDA in Q3 reflecting a $43
million improvement
•
Global liquidity of $1,407 million
Q3 UPDATE
Continued Progress in Q3
Focus on Margin
1
See reconciliation of Adjusted EBITDA to Operating loss of $140 million and $93 million for Q3
2013 and Q3 2014, respectively provided in the Appendix Consistent with our past practices
we will not be commenting on any post Q3 2014 events or results Toys"R"Us
Inc. Q3
($'s in millions)
2013
2014
B/(P)
(bps)
Sales
$2,491
$2,459
(128)
Gross Margin
896
908
134
Adjusted EBITDA
1
(37)
6
n/a
Margin %
36.0%
36.9%
96
Adjusted EBITDA %
(1.5%)
0.2%
173 |
 EASY
EXPERT
FAIR
4
Q3 SNAPSHOT -
DOMESTIC
1
Adjusted for an out of period item. Previously reported comparable store net sales were
(8.4%), (3.5%), (4.1%) and 4.0% for Q1 2013, Q2 2013, Q4 2013 and Q1 2014,
respectively
2
Excludes ($51M) charge (+1.5% impact) in Q4 2013, $11M benefit (-0.7% impact) in Q1 2014
and ($19M) charge (+1.3% impact) in Q2 2014 related to excess and obsolete inventory
identified in Q4 2013 Domestic Margin Rate²
Domestic Comparable Store Net Sales¹
“TRU Transformation”
Disciplined
promotion
strategy
leading
to
180bps
improvement
in
domestic
gross
margin
Initiatives drove margin |
 EASY
EXPERT
FAIR
5
DEBT MATURITIES AND GLOBAL LIQUIDITY
$’s in millions | as of November 1, 2014
Excludes North American ABL, European and Australian ABL, Japan
Committed Credit Lines, and Uncommitted Credit Lines related to the Asia
JV as well as capital lease and finance obligations associated with capital
projects; face values as of Q3 2014
Global Liquidity
Funded Debt Maturities
1
Toys Delaware ABL Excess Availability is presented net of the $125
minimum excess availability covenant
Q3
($'s in millions)
2014
Toys Delaware
Toys Delaware ABL Excess Availability
1
$777
Toys Delaware Cash
151
Total Toys Delaware Liquidity
928
International
Euro ABL/Japan Revolver Excess Availability
224
Non-Toys Delaware Cash
255
Total Inc/Int'l Liquidity
479
Total ABL/Revolver Excess Availability
1,001
Total Cash
406
Total Global Liquidity
$1,407 |
 EASY
EXPERT
FAIR
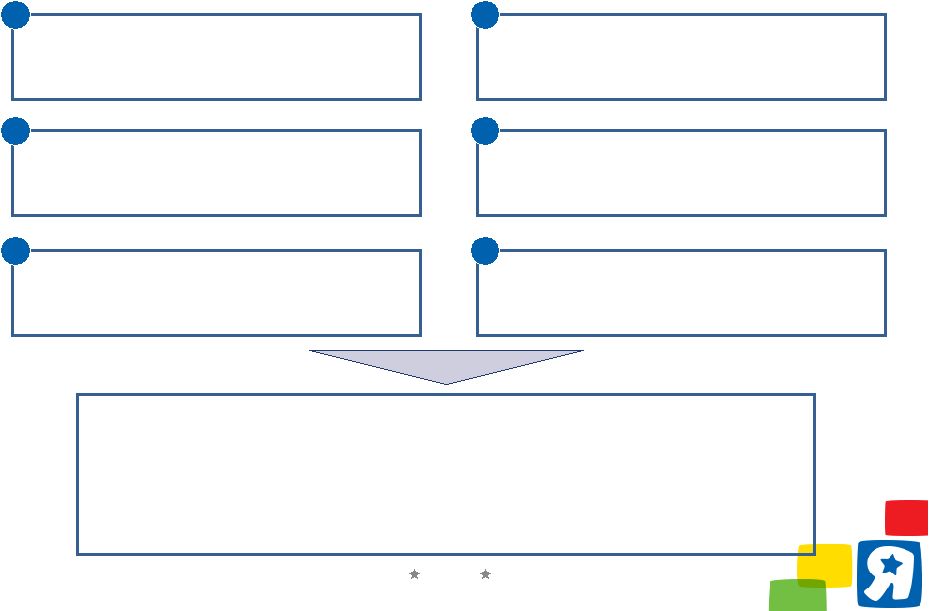
6
PROGRESS TO DATE
Realized Results
2014 Initiatives Taken
Store
Experience:
Digital &
Omnichannel:
Fair Prices &
Promotions:
Strengthening
Talent:
Inventory
Management:
•
Shortened customer checkout time
•
Enhanced lighting in approximately 218
domestic stores
•
Refreshed desktop site and cart to improve
conversion
•
Launched new tablet site in U.S.
•
Maintained competitive shipping offer
•
Refocused Key Value Items initiative
•
Integrated pricing and promotion strategy
•
Increased visibility of Price Match message
•
Recruited top talent for executive roles
•
Implemented separate field structures for
Toys“R”Us and Babies“R”Us stores
•
2014 obsolete clearance event successfully
completed
•
Focused on improving in-stocks
•
Instituted life cycle management process
Customer satisfaction for “checkout speed”
and
“clean and neat”
categories improved
Increase in Domestic eCommerce revenue
Continue to narrow the gap between our
average shelf price vs. competitors on KVIs
Filled key roles within executive team
In-stock position significantly improved
over
2011-2013 average |
 EASY
EXPERT
FAIR
7
STRENGTHENING THE LEADERSHIP TEAM: KEY HIRES IN 2014
Mike Short
Executive Vice President,
Chief Financial Officer
AutoNation, Universal Orlando,
Seagram Inc.,
IBM Corporation
Experience
Senior Vice President,
Store Operations
Position
Name
Joe Venezia
Richard Lennox
Chetan Bhandari
Debbie Lentz
Senior Vice President,
Chief Supply Chain Officer
Senior Vice President,
Chief Marketing Officer
Senior Vice President,
Corporate Finance and Treasurer
GLC Advisors & Co. LLC,
Goldman Sachs & Co.,
UBS Securities LLC
Zales Corporation,
J. Walter Thompson
Kraft Foods Group,
Nabisco Foods Group
Walmart, The Pantry,
Wells Fargo Merchant Services,
Procter & Gamble
Senior Vice President, Human
Resources
Saks Incorporated,
AT&T Corporation
Christine Morena
Vice President, Procurement
The Great Atlantic &
Pacific Tea Company
Gary McQuillan |
 EASY
EXPERT
FAIR
8
Assembled internal project management team
led by CFO and supported by sponsors to assist in
all phases of the initiative
Retained AlixPartners, an advisor with an
established track record in Retail operations
rationalization efforts
1
Benchmarked operations / headcount /
cost categories against TRU’s peer group to
identify high priority focus areas for cost reduction
2
3
Performed a six-week comprehensive study of
high priority focus areas with functional heads to
evaluate cost takeout potential
4
Identified specific areas for cost savings and
quantified the scope of the potential savings
•
Process with AlixPartners and TRU managers identified significant cost reduction
opportunities across both COGS and SG&A
•
Work plans in place; implementation underway
•
As
a
result,
we
are
targeting
at
least
$150
-
$200
million
in
annualized
cost
reduction,
which we expect will be fully achieved by the end of 2016
•
In addition, AlixPartners engaged to expand assignment internationally
5
Reviewed cost takeout estimates with TRU
departmental executives and reached agreement
on scope of cost reduction to be implemented
6
$150 –
$200 MILLION IN COST SAVINGS OPPORTUNITIES IDENTIFIED |
 EASY
EXPERT
FAIR
9
KEY INITIATIVES OF COST REDUCTIONS
TOTAL COST REDUCTION BY 2016
AREAS OF OPPORTUNITY FOR COST REDUCTION
Private Label and
Other COGS:
Marketing
Effectiveness:
In-Store
Operations:
Not-For-Resale
Categories /
Other:
Supply Chain:
Inventory
Management:
Organizational
Effectiveness:
•
Consolidation of sourcing efforts for private label products at TRU
Shenzhen office
•
Improved promotion planning on catalogs / inserts to increase margins
•
Optimize digital vs traditional media mix
•
Back of house –
Improve forecast accuracy, truck deliveries to capitalize on
lower inventory levels and higher in-stocks to increase labor efficiency
•
Front of house –
Improve speed of checkout and pricing processes
•
Reducing marketing spend and other indirect purchasing costs (e.g.
professional services, operating supplies, travel and expenses)
•
Optimize frequency of outbound shipments, improve distribution center
labor efficiency
•
Implement product lifecycle management to reduce clearance margin risk
•
Improve seasonal forecast and ordering strategy for high risk items
•
Reposition organizational structure, reducing demand/work volume
and
streamlining activities
Cost Area
Selected Key Initiatives |
 EASY
EXPERT
FAIR
10
Financial Data
Q3
Q3
($'s in millions)
2013
2014
B/(P)
LTM
Sales
Domestic
$1,461
$1,440
(1.4%)
$7,686
International
1,030
1,019
(1.1%)
4,959
Total Sales
2,491
2,459
(1.3%)
12,645
Gross Margin
Domestic
1
489
508
3.9%
2,554
International
407
400
(1.7%)
1,920
Total Gross Margin
1
896
908
1.3%
4,474
SG&A (Incl. Other Income & Non-Controlling Interest)
2
933
902
3.3%
3,861
Adjusted Inc. EBITDA
1,2
($37)
$6
n/a
$613
Other Data
Inventory
Domestic
$2,350
$2,168
7.7%
$2,168
International
1,229
1,156
5.9%
1,156
Total
$3,579
$3,324
7.1%
$3,324
Capex
$65
$53
18.5%
$202
Comp Store Sales Growth
Domestic
(5.2%)
(1.0%)
4.2%
n/a
International
(3.0%)
1.1%
4.1%
n/a
Gross Margin % of Sales
36.0%
36.9%
1.0%
35.4%
SG&A % of Sales
37.5%
36.7%
0.8%
30.5%
Adjusted EBITDA Margin
(1.5%)
0.2%
1.7%
4.8%
TOYS“R”US INC. FINANCIALS
1
Excludes
the
impact
of
one-time
adjustments
of
$59
in
Domestic
LTM;
including
the
impact
of
one-time
adjustments
Domestic
LTM
was
$2,495
and
Total
LTM
was $4,415
2
Excludes the impact of one-time adjustments of $11, $14 and $112 in Q3 2013, Q3 2014 and
LTM, respectively; including the impact of one-time adjustments LTM was $3,973. See
appendix for adjustments. Marginally
lower
sales
Higher
gross
margin
Reduced
SG&A
Results
in
positive
adjusted
EBITDA
Healthier
Inventory
Improved
margin
structure
1
1
2
2
3
3
4
4
5
5
6
6 |
 EASY
EXPERT
FAIR
11
TOYS“R”US DELAWARE FINANCIALS
1
Excludes
the
impact
of
one-time
adjustments
of
$59
in
Domestic
LTM;
including
the
impact
of
one-time
adjustments
Domestic
LTM
was
$2,597
and
Total
LTM
was $2,919
2
Excludes the impact of one-time adjustments of $10, $15 and $87 in Q3 2013, Q3 2014 and
LTM, respectively; including the impact of one-time adjustments LTM was $2,809. See
appendix for adjustments. Marginally lower
sales
Higher gross margin
Reduced SG&A
Results in improved
adjusted EBITDA
Healthier Inventory
Improved margin structure
1
2
3
4
5
6
1
2
3
4
5
6
Financial Data
Q3
Q3
($'s in millions)
2013
2014
B/(P)
LTM
Sales
Domestic
$1,484
$1,462
(1.5%)
$7,789
Canada
185
171
(7.6%)
860
Total Sales
1,669
1,633
(2.2%)
8,649
Gross Margin
Domestic
1
513
529
3.1%
2,656
Canada
73
66
(9.6%)
322
Total Gross Margin
1
586
595
1.5%
2,978
SG&A (Incl. Other Income)
2
659
630
4.4%
2,722
Adjusted Delaware EBITDA
1,2
($73)
($35)
n/a
$256
Other Data
Inventory
Domestic
$2,350
$2,168
7.7%
$2,168
Canada
277
266
4.0%
266
Total
$2,627
$2,434
7.3%
$2,434
Capex
$45
$38
15.6%
$131
Comp Store Sales Growth
Domestic
(5.2%)
(1.0%)
4.2%
n/a
Canada
(0.4%)
(2.8%)
(2.4%)
n/a
Gross Margin % of Sales
35.1%
36.4%
1.3%
34.4%
SG&A % of Sales
39.5%
38.6%
0.9%
31.5%
Adjusted EBITDA Margin
(4.4%)
(2.1%)
2.2%
3.0% |
 EASY
EXPERT
FAIR
12
APPENDIX |
 EASY
EXPERT
FAIR
13
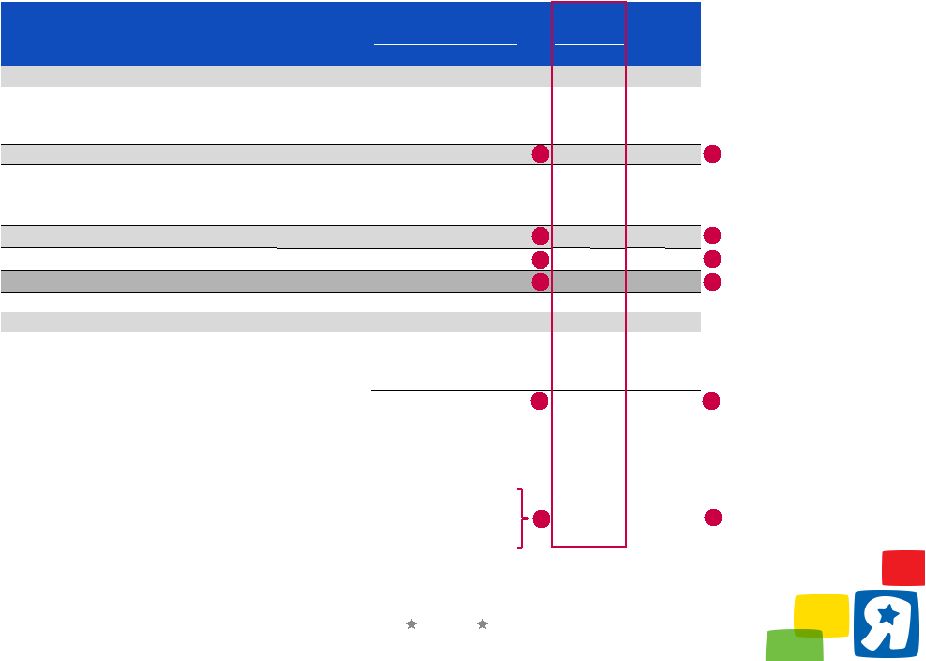
SIMPLIFIED ORGANIZATIONAL STRUCTURE
Guaranty of
B-4 Term Loan
8.500% Senior Notes due 2017 $725
PropCo I Term Loan due 2019 $975
Total Funded Debt¹
Revolving Credit Facilities
$631
125
10.375% Senior Notes due 2017
$450
7.375% Senior Notes due 2018
400
Note: Chart has been simplified and does not include all entities; debt balances
presented at face value and excludes capital leases and finance obligations associated
with capital projects 1
Includes Spanish PropCo Loan, French PropCo Loan, UK PropCo Loans, Japan Bank Loans and Toys
Asia Debt 65% Pledge of Canadian
Subsidiary Stock
$’s in millions | as of November 1, 2014 |
 EASY
EXPERT
FAIR
14
TOYS“R”US INC. –
ADJUSTED EBITDA RECONCILIATION
1
The impact of these one-time adjustments are excluded from the Gross Margin balances on
Toys“R”Us Inc. financials 2
The impact of these one-time adjustments are excluded from the SG&A (Incl. Other
Income & Non-Controlling Interest) balances on Toys“R”Us Inc. financials
FYE
LTM
($'s in millions)
11/2/2013
11/1/2014
11/2/2013
11/1/2014
2/1/2014
11/1/2014
Operating Loss
($140)
($93)
($259)
($226)
($350)
($317)
Add:
Non-controlling interest
-
(1)
-
(2)
(3)
(5)
Depreciation and amortization
92
86
287
285
388
386
EBITDA
(48)
(8)
28
57
35
64
Adjustments:
Obsolete inventory clearance
1
-
-
-
8
51
59
Prior period adjustments
1
-
-
(1)
-
(1)
-
Sponsors’
management and advisory fees
2
6
2
17
14
22
19
Litigation expense
2
-
-
20
-
23
3
Severance
-
1
13
10
13
10
Store closure costs
-
3
-
7
2
9
Impairment of long-lived assets
2
4
1
7
8
44
45
Net gains on sales of properties
2
(1)
(2)
(8)
(5)
(8)
(5)
Compensation expense
2
2
10
1
15
3
17
Property losses, net of insurance recoveries
2
-
(2)
-
(9)
-
(9)
Prior period adjustments
2
-
-
-
-
17
17
Other
2
-
1
1
3
4
6
Goodwill Impairment
-
-
-
-
378
378
Adjusted EBITDA
($37)
$6
$78
$108
$583
$613
13 weeks ended
39 weeks ended
2
2 |
 EASY
EXPERT
FAIR
15
TOYS“R”US DELAWARE –
ADJUSTED EBITDA RECONCILIATION
1
The impact of these one-time adjustments are excluded from the Gross Margin balances on
Toys“R”Us Delaware financials 2
The
impact
of
these
one-time
adjustments
are
excluded
from
the
SG&A
(Incl.
Other
Income)
balances
on
Toys“R”Us
Delaware
financials
FYE
LTM
($'s in millions)
11/2/2013
11/1/2014
11/2/2013
11/1/2014
2/1/2014
11/1/2014
Operating Loss
($142)
($105)
($233)
($253)
($489)
($509)
Add:
Depreciation and amortization
59
55
186
192
252
258
EBITDA
(83)
(50)
(47)
(61)
(237)
(251)
Adjustments:
Obsolete inventory clearance
1
-
-
-
8
51
59
Prior period adjustments
1
-
-
(1)
-
(1)
Sponsors’
management and advisory fees
2
3
2
11
13
15
17
Litigation expense
2
-
-
20
-
23
3
Severance
2
-
1
3
7
3
7
Store closure costs
2
5
7
7
11
13
17
Impairment of long-lived assets
2
2
-
3
6
20
23
Net gains on sales of properties
2
(1)
-
(2)
(1)
(2)
(1)
Compensation expense
2
1
7
3
11
4
12
Property losses, net of insurance recoveries
2
-
(2)
-
(9)
-
(9)
Prior period adjustments
2
-
-
-
-
17
17
Other
2
-
-
-
1
-
1
Goodwill Impairment
-
-
-
-
361
361
Adjusted EBITDA
($73)
($35)
($3)
($14)
$267
$256
13 weeks ended
39 weeks ended
- |