Attached files
| file | filename |
|---|---|
| EXCEL - IDEA: XBRL DOCUMENT - MTS SYSTEMS CORP | Financial_Report.xls |
| EX-21 - SUBSIDIARIES OF THE COMPANY - MTS SYSTEMS CORP | mts144295_ex21.htm |
| EX-31.1 - CERTIFICATION OF CEO PURSUANT TO SECTION 302 - MTS SYSTEMS CORP | mts144295_ex31-1.htm |
| EX-32.1 - CERTIFICATION OF CEO PURSUANT TO SECTION 906 - MTS SYSTEMS CORP | mts144295_ex32-1.htm |
| EX-23 - CONSENT OF INDEPENDENT REGISTERED PUBLIC ACCOUNTING FIRM - MTS SYSTEMS CORP | mts144295_ex23.htm |
| EX-32.2 - CERTIFICATION OF CFO PURSUANT TO SECTION 906 - MTS SYSTEMS CORP | mts144295_ex32-2.htm |
| EX-31.2 - CERTIFICATION OF CFO PURSUANT TO SECTION 302 - MTS SYSTEMS CORP | mts144295_ex31-2.htm |

Annual Report on Form 10-K
For the Fiscal Year Ended September 27, 2014
MTS Systems Corporation
Washington, D.C. 20549
FORM 10-K
(Mark One)
SECURITIES EXCHANGE ACT OF 1934
For the fiscal year ended September 27, 2014
OR
SECURITIES EXCHANGE ACT OF 1934
For the Transition Period from _____________ to ______________
Commission File No. 0-2382
MTS SYSTEMS
CORPORATION
(Exact Name of Registrant as Specified in its Charter)
|
|
|
|
|
|
|
|
Minnesota |
|
41-0908057 |
|
|
|
(State or other jurisdiction of incorporation or organization) |
|
(I.R.S. Employer Identification No.) |
|
|
|
|
|
|
|
|
|
14000 Technology Drive |
|
55344 |
|
|
|
(Address of Principal Executive Offices) |
|
(Zip Code) |
|
Registrant’s telephone number, including area code: (952) 937-4000
Securities registered pursuant to Section 12(b) of the Act:
|
|
|
|
|
|
|
|
Title of each class |
|
Name of each exchange on which registered |
|
|
|
Common Stock, $0.25 par value per share |
|
The NASDAQ Stock Market LLC |
|
Securities registered pursuant to Section 12(g) of the Act: None
Indicate by check mark if the registrant is a well-known seasoned issuer, as defined by Rule 405 of the Securities Act. Yes o No x
Indicate by check mark if the registrant is not required to file reports pursuant to Section 13 or Section 15(d) of the Act. Yes o No x
Indicate by check mark whether the registrant (1) has filed all reports required to be filed by Section 13 or 15(d) of the Securities Exchange Act of 1934 during the preceding 12 months (or for such shorter period that the registrant was required to file such reports), and (2) has been subject to such filing requirements for the past 90 days. Yes x No o
Indicate by check mark whether the registrant has submitted electronically and posted on its corporate Website, if any, every Interactive Data File required to be submitted and posted pursuant to Rule 405 of Regulation S-T (Section 229.405 of this chapter) during the preceding 12 months (or for such shorter period that the registrant was required to submit and post such files). Yes x No o
Indicate by check mark if disclosure of delinquent filers pursuant to Item 405 of Regulation S-K (§229.405 of this chapter) is not contained herein, and will not be contained, to the best of registrant’s knowledge, in definitive proxy or information statements incorporated by reference in Part III of this Form 10-K or any amendment to this Form 10-K. x
Indicate by check mark whether the registrant is a large accelerated filer, an accelerated filer, a non-accelerated filer, or a smaller reporting company. See the definitions of “large accelerated filer,” “accelerated filer” and “smaller reporting company” in Rule 12b-2 of the Exchange Act).
|
|
|
|
|
|
Large accelerated filer x |
Accelerated filer o |
Non-accelerated filer o |
Smaller reporting company o |
Indicate by check mark whether the registrant is a shell company (as defined in Rule 12b-2 of the Exchange Act). Yes o No x
State the aggregate market value of the voting and non-voting common equity held by non-affiliates computed by reference to the price at which the common equity last sold, or the average bid and asked price of such common equity, as of the last business day of the registrant’s most recently completed second fiscal quarter: $1,031,554,077.
As of November 21, 2014, the Registrant had outstanding 15,096,366 shares of Common Stock.
DOCUMENTS INCORPORATED BY REFERENCE: Portions of the Proxy Statement for the Registrant’s Annual Meeting of Shareholders to be held February 10, 2015 are incorporated by reference into Part III of this Form 10-K, to the extent described in such Part.
MTS Systems Corporation
Annual Report on Form 10-K
Table of Contents
|
|
|
|
|
|
PART I |
|||
|
|
|||
|
|
1 |
||
|
|
|
1 |
|
|
|
|
3 |
|
|
|
|
3 |
|
|
|
|
3 |
|
|
|
|
4 |
|
|
|
|
4 |
|
|
|
|
4 |
|
|
|
|
4 |
|
|
|
|
4 |
|
|
|
|
5 |
|
|
|
|
5 |
|
|
|
|
5 |
|
|
|
|
5 |
|
|
|
|
5 |
|
|
|
|
6 |
|
|
|
|
6 |
|
|
|
6 |
||
|
|
9 |
||
|
|
10 |
||
|
|
11 |
||
|
|
11 |
||
|
|
|||
|
|
|||
|
|
11 |
||
|
|
14 |
||
|
Management’s Discussion and Analysis of Financial Condition and Results of Operations |
|
15 |
|
|
|
39 |
||
|
|
40 |
||
|
Changes in and Disagreements With Accountants on Accounting and Financial Disclosure |
|
40 |
|
|
|
40 |
||
|
|
41 |
||
|
|
|||
|
|
|||
|
|
42 |
||
|
|
42 |
||
|
Security Ownership of Certain Beneficial Owners and Management and Related Stockholder Matters |
|
42 |
|
|
Certain Relationships and Related Transactions, and Director Independence |
|
42 |
|
|
|
42 |
||
|
|
|||
|
|
|||
|
|
43 |
||
|
|
|
|
Item 1. |
MTS Systems Corporation (the “Company” or “MTS”) is a leading global supplier of high-performance test systems and position sensors. Our operations are organized and managed in two business segments, the Test segment and the Sensors segment, based upon global similarities within their markets, products, operations and distribution. The Test and Sensors segments represent approximately 81% and 19% of Company revenue, respectively. The Company was incorporated under Minnesota law in 1966.
Terms
When we use the terms “we,” “us,” the “Company,” or “our” in this report, unless the context otherwise requires, we are referring to MTS Systems Corporation.
Fiscal year 2014 refers to the fiscal year ended September 27, 2014; fiscal year 2013 refers to the fiscal year ended September 28, 2013; and fiscal year 2012 refers to the fiscal year ended September 29, 2012.
Products and Markets by Business Segment
Test Segment: The Test segment (“Test”) provides testing solutions including hardware, software and service. Our testing solutions are used by customers in their development of new products to characterize the product’s mechanical properties. Our solutions simulate forces and motions that these customers expect their products to encounter in use. Mechanical testing in a lab setting is an accepted method to accelerate product development compared to reliance on full physical prototypes in real-world settings, proving ground testing and virtual testing because it provides more controlled simulation and accurate measurement. The need for mechanical simulation increases in proportion to the cost of a product, the range and complexity of the physical environment in which the product will be used, expected warranty or recall risk and expense, governmental regulation and potential legal liability. Since a significant portion of the products in Test are considered by our customers to be capital expenditures, we believe the timing of purchases may be impacted by interest rates, customer capital spending, and product development cycles.
A typical test system includes a reaction frame to hold the prototype specimen, a hydraulic pump or electro-mechanical power source, piston actuators to create the force or motion, and a computer controller with specialized software to coordinate the actuator movement and record and manipulate results. Lower force and less dynamic testing can usually be accomplished with electro-mechanical power sources, which are generally less expensive than hydraulic systems. In addition to these basic components, Test sells a variety of accessories and spare parts, as well as services, including installation, calibration, maintenance, training and consulting.
Test has a diverse set of customers by industry and geography. Regionally, the Americas, Europe and Asia represent approximately 30%, 30% and 40% of orders, respectively, based upon customer location.
Products and customers are grouped into the following three global markets:
|
|
|
|
|
• |
Ground Vehicles: This market consists of automobile, truck, motorcycle, motorsports vehicles, construction equipment, agricultural equipment, rail, and off-road vehicle manufacturers and their suppliers. Our products are used to measure and simulate solutions to assess durability, vehicle dynamics and aerodynamics of vehicles, sub-systems and components. Test systems are utilized in customer testing of vehicles, subsystems and components. Our offering examples include: |
|
|
|
○ |
Road simulators for the purpose of durability simulation; |
|
|
○ |
Tire performance and rolling resistance measurement systems; and |
|
|
○ |
Moving road-plane systems and balances used for aerodynamic measurements in wind tunnels. |
|
|
||
|
|
Ground Vehicles is the largest Test market, representing approximately 53% of Test orders. |
|
1
|
|
|
|
• |
Materials: This market covers diverse industries such as power generation, aerospace, vehicles, and bio-medical. Our products and services support customers in the research and development of products through the physical characterization of material properties, such as ceramics, composites and steel. Bio-medical applications include systems to test durability and performance of implants, prostheses, and other medical and dental materials and devices. The materials market represents approximately 31% of Test orders. |
|
|
|
|
• |
Structures: This market serves the structural testing needs in the fields of aerospace, wind energy, oil and gas, and structural engineering, among others. The aerospace structural testing market consists of manufacturers of commercial, military, and private aircraft and their suppliers, who use our products, systems, and software to perform static and fatigue testing of aircraft and space vehicles. The wind energy market consists of wind turbine manufacturers and their component suppliers who use our products to reduce the cost and improve the reliability of blades, bearings, and entire wind turbines. Systems for structural engineering include high force static and dynamic testing, as well as seismic simulation tables used around the world to test the design of structures, such as bridges and buildings, and to help governments establish building codes. Structural engineering customers include construction companies, government agencies, universities, and the manufacturers of building materials. The structures market represents approximately 16% of Test orders. |
Sensors Segment: The Sensors segment (“Sensors”) products are used by industrial machinery and mobile equipment manufacturers to automate the operation of their products for improved safety and end-user productivity. Examples of customer industries include manufacturers of plastic injection molding machines, steel mills, fluid power, oil and gas, medical, wood product processing equipment, mobile equipment, and energy. Our products are also used to measure fluid displacement, such as liquid levels for customers in the process industries.
Sensors manufactures products utilizing magnetostriction technology. We have developed a unique implementation of the technology, known as Temposonics®. This technology offers high speed and precise non-contact position sensing and is ideal for use in harsh operating environments.
Sensors customers are also diverse by industry and geography. Regionally, the Americas, Europe and Asia represent approximately 30%, 50% and 20% of orders, respectively, based upon customer location.
Industrial Machinery: This market consists of a wide range of industrial machinery original equipment manufacturers (“OEM’s”) and their end use customers with applications in all areas of manufacturing, including plastics, steel, wood and other forms of factory automation. Temposonics® sensors provide position feedback for motion control systems, improving productivity by enabling high levels of automation, as well as driving improved quality of manufactured parts. Temposonics® Technology is known for ruggedness in harsh manufacturing environments, which maximizes machine up-time and lowers overall manufacturing costs of our customers. The industrial machinery market represents approximately 78% of Sensors orders.
Mobile Hydraulics: This market consists of mobile equipment OEM’s with applications in construction, agriculture, material handling, mining and other heavy vehicle markets. Our sensors provide feedback for both motion control and implement positioning, enabling improved productivity while also enhancing safe operation of the machines. The overall ruggedness and reliability of our technology in high shock and vibration applications makes it especially suitable to the market. The mobile hydraulics market represents approximately 18% of Sensors orders.
Liquid Level: This market encompasses a wide range of liquid level storage tank applications in oil and gas, chemical processing, food and beverage, and pharmaceutical companies. Our technology provides precise measurements over long distances (tanks up to seventy feet tall). Our sensor products provide for a value by incorporating the measurement of the target liquid, a second measurement, and also temperature, all in a single package. The liquid level market represents approximately 4% of Sensors orders.
Financial and geographical information about our segments is included in Item 7 of this Annual Report on Form 10-K and Note 4 of the Notes to Consolidated Financial Statements under Item 8 of this Annual Report on Form 10-K.
2
Test Segment: Test products are sold worldwide through a direct field sales and service organization, independent representatives and distributors, and to a much lesser extent, catalogs for standard products and accessories. Direct field sales and service personnel are compensated through salary and order incentive programs. Independent representatives and distributors are either compensated through commissions based upon orders or discounts off list prices.
In addition to field sales and service personnel throughout the United States and China, Test has sales and service subsidiaries in Toronto, Canada; Berlin, Germany; Paris, France; Cirencester, United Kingdom; Turin, Italy; Gothenburg, Sweden; Tokyo and Nagoya, Japan; Seoul, South Korea; Moscow, Russia and Shanghai and Shenzhen, China.
In fiscal year 2014, product orders in Test ranged in value from a few hundred dollars to approximately $12 million on an equivalent United States dollar basis. The average order size was approximately $131,000. Test also markets services to customers on a per-call and contract basis, accounting for virtually all of our Service Revenue in the Consolidated Statements of Income for the fiscal years ended September 27, 2014, September 28, 2013, and September 29, 2012. Service orders in fiscal year 2014 ranged from $100 to over $1,500,000 on a United States dollar-equivalent basis.
The timing and volume of large orders valued at $5 million or greater on a United States dollar-equivalent basis may produce volatility in orders, backlog, and quarterly operating results. Most customer orders are based on fixed-price quotations and typically have an average sales cycle of three to nine months due to the technical nature of the test systems and customer capital expenditure approval processes. The sales cycle for larger, more complex test systems may be two years or longer.
Sensors Segment: Sensors products are sold worldwide through a direct sales organization as well as through independent distributors. The direct sales organization is compensated through salary and commissions based upon revenue. The independent distributors pay us a wholesale price and re-sell the product to their customers. Our products are sold at unit prices ranging from a few dollars to $10 thousand, with an average sales price of approximately $500 on a United States dollar-equivalent basis. While the average sales cycle for Sensors is approximately one week to one month for existing customers purchasing standard products, the sales cycle for a new account can range from three months to two years depending on customer testing and specification requirements.
Test Segment: Test systems are largely built to order and primarily engineered and assembled at our headquarters in Eden Prairie, Minnesota. We also operate manufacturing facilities in Shenzhen and Shanghai, China, which manufacture test systems serving the materials market, and in Lexington, North Carolina, which manufactures test systems serving the ground vehicles market. Some smaller system assembly is performed at Company locations in Berlin, Germany and Seoul, South Korea. Installation of systems, training, service and consulting services are primarily delivered at customer sites. The engineering and assembly cycle for a typical Test system ranges from one to twelve months, depending on the complexity of the system and the availability of components. The engineering and assembly cycle for larger, more complex systems may be up to three years.
Sensors Segment: Sensors are primarily built to order, engineered and assembled regionally at facilities located in Cary, North Carolina; Lüdenscheid, Germany; and Machida, Japan. Assembly cycles generally vary from several days to several weeks, depending on the degree of product customization, the size of the order and manufacturing capacity.
Sources and Availability of Raw Materials and Components
A significant portion of Test systems and Sensors products consist of materials and component parts purchased from independent vendors. We are dependent, in certain situations, on a limited number of vendors to provide raw materials and components, such as mechanical and electronic components. However, we have not experienced any recent issues in procuring certain materials, parts, or components needed in our engineering or production processes.
3
As Test generally sells products and services based on fixed-price contracts, fluctuations in the cost of materials and components between the date of the order and the delivery date may impact the expected profitability. The material and component cost variability is considered in the estimation and customer negotiation process. We believe fluctuations in the cost of raw materials and components have not had a significant impact on operating results during any of the fiscal years ended September 27, 2014, September 28, 2013, or September 29, 2012.
We specialize in the control and measurement of forces and motion. Technologies include precise actuation and measurement solutions, motion and force control, application expertise codified in user software and magnetostriction technology in the sensors market.
We rely on a combination of patents, copyrights, trademarks and proprietary trade secrets to protect our proprietary technology, some of which are material to the Test and Sensors segments. We have obtained numerous patents and trademarks worldwide, and actively file and renew patents and trademarks on a global basis to establish and protect our proprietary technology. We are also party to exclusive and non-exclusive license and confidentiality agreements relating to our own and third-party technologies. We aggressively protect certain of our processes, products, and strategies as proprietary trade secrets. Our efforts to protect intellectual property and avoid disputes over proprietary rights include ongoing review of third-party patents and patent applications.
On June 17, 2014, the Company acquired Roehrig Engineering, Inc. (“REI”) for a total purchase price of $14.8 million. REI is a leader in testing systems utilizing electric and electromagnetic actuation technology and is based in Lexington, North Carolina. The acquisition is part of the Company’s continued investment to expand the Company’s technology base in its Test segment and supplement its organic growth initiatives.
There is no significant seasonality to Test or Sensors orders or revenue.
Neither Test nor Sensors has significant finished product inventory, but each maintains inventories of materials and components to facilitate on-time product delivery. Test may have varying levels of work-in-process projects that are classified as inventory or unbilled receivables, depending upon the manufacturing cycle, timing of orders, project revenue recognition and shipments to customers.
In Test, payments are often received from customers upon order or at milestones during the fulfillment of the order, depending upon the size and customization of the system. These are recorded as “Advance Payments from Customers” on our Consolidated Balance Sheets and reduced as revenue is recognized. Conversely, if revenue is recognized on a project prior to customer billing, an Unbilled Accounts Receivable is recorded on our Consolidated Balance Sheets until the customer is billed. Upon billing, it is recorded as Accounts Receivable. Changes in the average size, payment terms and revenue recognition for orders in Test may have a significant impact on Accounts Receivable, Unbilled Accounts Receivable, Advance Payments from Customers and Inventory. It has not been our practice to provide rights of return for our products. Payment terms vary and are subject to negotiation.
We do not have a significant concentration of sales with any individual customer. Therefore, the loss of any one customer would not have a material impact on us.
4
Most of our products are built to order. Our backlog of orders, defined as firm orders from customers that remain unfulfilled, totaled approximately $326.5 million, $290.2 million, and $298.4 million at September 27, 2014, September 28, 2013, and September 29, 2012, respectively. The majority of this backlog is related to Test. Based on anticipated manufacturing schedules, we estimate that approximately $253 million of the backlog at September 27, 2014 will be converted to revenue during fiscal year 2015. Delays may occur in the conversion of backlog into revenue as a result of export licensing compliance, technical difficulties, specification changes, manufacturing capacity, supplier issues, or access to the customer site for installation. While the backlog is subject to order cancellations, we have not historically experienced a significant number of order cancellations. During fiscal year 2014, one custom order in Test totaling approximately $11.1 million was cancelled. This cancelled order was booked in a previous fiscal year. During fiscal year 2013, one custom order in Test totaling approximately $2 million was cancelled. This cancelled order was booked in a previous fiscal year. During fiscal year 2012, two custom orders in Test totaling approximately $9 million were cancelled. These orders were booked in a previous fiscal year and were associated with a Test product line that was sold during fiscal year 2012.
Revenue from U.S. Government contracts varies by year. A portion of our government business is subject to renegotiation of profits or termination of contracts or subcontracts at the election of the U.S. Government. In addition to contract terms, we must comply with procurement laws and regulations relating to the formation, administration, and performance of U.S. Government contracts. Failure to comply with these laws and regulations could lead to the termination of contracts at the election of the government or the suspension or debarment from U.S. Government contracting or subcontracting. U.S. Government revenue as a percentage of our total revenue was approximately 5%, 5% and 3% for fiscal years 2014, 2013 and 2012, respectively.
Test Segment: For relatively simple and inexpensive mechanical testing applications, customers may satisfy their needs internally by building their own test systems or using any of a number of our competitors who compete on price, performance, quality, and service. For larger and more complex mechanical test systems, Test competes directly with several companies throughout the world based upon customer value including application knowledge, engineering capabilities, technical features, price, quality and service.
Sensors Segment: Sensors primarily competes on factors that include technical performance, price and service in new applications or in situations in which other position sensing technologies have been used. Competitors of Sensors are typically either larger companies that carry multiple sensor product lines or smaller, privately held companies throughout the world.
We invest in significant product, system, and software application development. We also occasionally contract with our customers to advance the state of technology and increase product functionality. Costs associated with R&D were expensed as incurred, totaling $23.8 million, $22.8 million, and $21.9 million for the fiscal years ended September 27, 2014, September 28, 2013 and September 29, 2012, respectively. During fiscal year 2014 and 2012, we allocated certain of our resources towards capitalized software development activities. Total software development costs capitalized during fiscal year 2014 and 2012 was $0.9 million and $0.5 million, respectively.
We believe our operations are in compliance with all applicable material environmental regulations within the jurisdictions in which we operate.
5
We had 2,180 employees as of September 27, 2014, including 1,153 employees located outside the United States.
Our annual reports on Form 10-K, quarterly reports on Form 10-Q, current reports on Form 8-K, and amendments to those reports filed or furnished pursuant to Section 13(a) or 15(d) of the Exchange Act are available on the “Investor Relations” pages of our website, www.mts.com, as soon as reasonably practicable after we file such material with, or furnish it to, the Securities and Exchange Commission (“SEC”). The MTS Systems Corporation Code of Conduct (the “Code”), any waivers from and amendments to the Code, and our Corporate Governance Guidelines, Articles of Incorporation and Bylaws, as well as the Charters for the Audit, Compensation, and Governance and Nominating Committees of our Board of Directors are also available free of charge on the “Investor Relations” pages at www.mts.com. Our SEC filings are also available at the SEC online EDGAR database at www.sec.gov, as well as the SEC’s Public Reference Room at 100 F Street, N.E., Washington, D.C. 20549. The public may obtain information on the operation of the Public Reference Room by calling the SEC at 1-800-SEC-0330.
|
|
|
|
Item 1A. |
Risk Factors |
The following summarizes, in no particular order, certain risks facing us that could adversely impact our businesses, financial condition and operating results. This list is not intended to be comprehensive or to predict in detail which risks could or will occur. All statements, other than statements of historic fact, in each of our public announcements and filings with the SEC are “forward-looking statements” within the meaning of the U.S. securities laws and should be read in light of these risk factors.
We may not achieve our growth plans for the expansion of the business. In addition to market penetration, our long-term success depends on our ability to expand our business through (a) new product development and service offerings; (b) mergers and acquisitions; and/or (c) geographic expansion.
New product development and service offerings require that we maintain our ability to improve existing products, continue to bring innovative products and services to market in a timely fashion and adapt products and services to the needs and standards of current and potential customers. Our products and services may become less competitive or eclipsed by technologies to which we do not have access or which render our solutions obsolete.
Mergers and acquisitions will be accompanied by risks that may include:
|
|
|
|
• |
suitable candidates may not exist or may not be available at acceptable costs; |
|
• |
failure to achieve the financial and strategic goals for the acquired and combined businesses; |
|
• |
difficulty integrating the operations and personnel of the acquired businesses; |
|
• |
disruption of ongoing business and distraction of management from the ongoing business; |
|
• |
dilution of existing stockholders and earnings per share; |
|
• |
unanticipated, undisclosed or inaccurately assessed liabilities, legal risks and costs; and |
|
• |
difficulties retaining the key vendors, customers or employees of the acquired business. |
Acquisitions of businesses having a significant presence outside the U.S. will increase our exposure to the risks of international operations discussed in these Risk Factors.
Geographic expansion will be primarily outside of the U.S., and hence will be disproportionately subject to the risks of international operations discussed in these Risk Factors.
The changes we are making in our Test segment processes and operating systems may not deliver the results we require for growth of the business. We are investing in a new operating model and changing business processes and systems in the Test segment and we are restructuring the business to make it a more scalable business model. Successful implementation of these initiatives is critical to our growth.
6
Our business operations may be affected by government contracting risks. Government business is important to us. Revenue from U.S. Government contracts varies by year. Such revenue as a percent of our total revenue was approximately 5%, 5%, and 3% for fiscal years 2014, 2013 and 2012, respectively.
We must comply with procurement laws and regulations relating to the formation, administration, and performance of U.S. Government contracts. Failure to comply with these laws and regulations could lead to suspension or debarment from U.S. Government contracting or subcontracting and result in administrative, civil or criminal penalties. Failure to comply could also have a material adverse effect on our reputation, our ability to secure future U.S. Government contracts and export control licenses, and our results of operations and financial condition. These laws and regulations also create compliance risks and affect how we do business with federal agency clients. U.S. Government contracts, as well as contracts with certain foreign governments with which we do business, are also subject to modification or termination by the government, either for the convenience of the government or for default as a result of our failure to perform under the applicable contract. Further, any investigation relating to, or suspension or debarment from, U.S. Government contracting could have a material impact on our results of operations as, during the duration of any suspension or debarment, we would be prohibited or otherwise limited in our ability to enter into prime contracts or subcontracts with U.S. Government agencies (to the extent that such contracts exceed $30,000), certain entities that receive U.S. Government funds or that are otherwise subject to the Federal Acquisition Regulations (FAR), and certain state government or commercial customers who decline to contract with suspended or debarred entities. A federal suspension could also impact our ability to obtain export control licenses, which have material importance to our business.
Our business is significantly international in scope, which poses multiple risks. Sales outside of the United States, including export sales from U.S. business locations, accounted for approximately 75% of our revenue in fiscal year 2014. Accordingly, our business is subject to the political, economic and other risks that are inherent in operating in foreign countries. These risks include, but are not limited to:
|
|
|
|
• |
exposure to the risk of currency value fluctuations, where payment for products is denominated in a currency other than U.S. dollars; |
|
• |
variability in the U.S. dollar value of foreign currency-denominated assets, earnings and cash flows; |
|
• |
difficulty enforcing agreements, including patent and trademarks, and collecting receivables through foreign legal systems; |
|
• |
trade protection measures and import or export licensing requirements; |
|
• |
tax rates in certain foreign countries that exceed those in the U.S. and the imposition of withholding requirements on foreign earnings; |
|
• |
higher danger of terrorist activity, war or civil unrest, compared to domestic operations; |
|
• |
imposition of tariffs, exchange controls or other restrictions; |
|
• |
difficulty in staffing and managing global operations; |
|
• |
required compliance with a variety of foreign laws and regulations and U.S. laws and regulations, such as the Foreign Corrupt Practices Act applicable to our international operations; and |
|
• |
changes in general economic and political conditions in countries where we operate, particularly in emerging markets. |
We may be required to recognize impairment charges for long-lived assets. As of September 27, 2014, the net carrying value of long-lived assets (property, plant and equipment, goodwill and other intangible assets) totaled approximately $128.9 million. In accordance with generally accepted accounting principles, we periodically assess these assets to determine if they are impaired. Significant negative industry or economic trends, disruptions to our businesses, significant unexpected or planned changes in use of the assets, divestitures and market capitalization declines may result in impairments to goodwill and other long-lived assets. Future impairment charges could significantly affect results of operations in the periods recognized.
Volatility in the global economy and foreign currency could adversely affect results. Long-term disruptions in the capital and credit markets would likely adversely affect our customers’ operations and financing of both our international and U.S. customers and could therefore result in a decrease in orders. In addition, during periods of economic uncertainty, our customers’ spending patterns and financing availability could be negatively impacted, reducing demand for our products and services.
7
Our business is subject to strong competition. Our products are sold in competitive markets throughout the world. Competition is based on application knowledge, product features and design, brand recognition, reliability, technology, breadth of product offerings, price, delivery, customer relationships, and after-market support. If we are not perceived as competitive in overall value as measured by these criteria, our customers would likely choose solutions offered by our competitors or developed internally.
We are subject to risks because we design and manufacture first-of-a-kind products. We design and build systems that are unique and innovative and, in some cases, the first created to address complex and unresolved issues. The design, manufacture and support of these systems may involve higher than planned costs. If we are unable to meet our customers’ expectations, our reputation and ability to extend our expertise will likely be damaged.
We may experience difficulties obtaining the services of skilled employees. We rely on knowledgeable, experienced and skilled technical personnel, particularly engineers, sales management, and service personnel, to design, assemble, sell and service our products. We may be unable to attract, retain and motivate sufficient numbers of such people which could adversely affect our business.
We may fail to protect our intellectual property effectively, or may infringe upon the intellectual property of others. We have developed significant proprietary technology and other rights that are used in our businesses. We rely on trade secret, copyright, trademark and patent laws and contractual provisions to protect our intellectual property. While we take enforcement of these rights seriously, other companies such as competitors or others in markets in which we do not participate, may attempt to copy or use our intellectual property for their own benefit.
In addition, the intellectual property of others also has an impact on our ability to offer some of our products and services for specific uses or at competitive prices. Competitors’ patents or other intellectual property may limit our ability to offer products and services to our customers. Any infringement on the intellectual property rights of others could result in litigation and adversely affect our ability to continue to provide, or could increase the cost of providing, products and services.
Intellectual property litigation is very costly and could result in substantial expense and diversions of our resources, both of which could adversely affect our businesses, financial condition and results. In addition, there may be no effective legal recourse against infringement of our intellectual property by third parties, whether due to limitations on enforcement of rights in foreign jurisdictions or as a result of other factors.
The business could be adversely affected by product liability and commercial litigation. Our products or services may be claimed to cause or contribute to personal injury or property damage to our customers’ facilities. Additionally, we are, at times, involved in commercial disputes with third parties, such as customers, vendors and others. The ensuing claims may arise singularly, in groups of related claims, or in class actions involving multiple claimants. Such claims and litigation are frequently expensive and time-consuming to resolve, may result in substantial liability to us, which liability and related costs and expenses may not be recoverable through insurance or other forms of reimbursement.
We may experience difficulty obtaining materials or components for our products, or the cost of materials or components may increase. We purchase materials and components from third-party suppliers, some of whom may be competitors. Other materials and components may be provided by a limited number of suppliers or by sole sources and could only be replaced with difficulty or at significant added cost. Additionally, some materials or components may become scarce or difficult to obtain in the market, or they may increase in price. This could adversely affect the lead-time within which we receive the materials or components, and in turn affect our commitments to our customers, or could adversely affect the material cost or quality.
8
Government regulation imposes significant costs and other constraints. Our manufacturing operations and past and present ownership and operations of real property are subject to extensive and changing federal, state, local and foreign laws and regulations, including laws and regulations pertaining to health and safety matters, as well as the handling or discharge of hazardous materials into the environment. We expect to continue to incur costs to comply with these laws, and may incur penalties for any failure to do so. We may also be identified as a responsible party and be subject to liability relating to any investigation and clean-up of properties used for industrial purposes or the generation or disposal of hazardous substances. Some of our export sales require approval from the U.S. government. Changes in political relations between the U.S. and foreign countries and/or specific potential customers for which export licenses may be required, may cause a license application to be delayed or denied, or a previously issued license withdrawn, rendering us unable to complete a sale, or vulnerable to competitors who do not operate under such restrictions.
The backlog, sales, delivery and acceptance cycle for many of our products is irregular and may not develop as anticipated. Many of our products have a long sales, delivery and acceptance cycle. In addition, our backlog is subject to order cancellations and our sales arrangements typically do not include specific cancellation provisions. If an order is cancelled, we typically would only be entitled to receive reimbursement from the customer for actual costs incurred under the arrangement plus a reasonable margin. Events may cause recognition of orders, backlog and results of operations to be aberrant over shorter periods of time. These factors include the timing of individual large orders which may be impacted by interest rates, customer capital spending and product development cycles, design and manufacturing problems, capacity constraints, delays in product readiness, damage or delays in transit, problems in achieving technical performance requirements, and various customer-initiated delays. Any such delay may cause fluctuation in our reported periodic financial results.
Our customers are in cyclical industries. For many of our products, orders are subject to customers’ procurement cycles and their willingness and ability to invest in capital, especially in the cyclical automotive, aircraft and machine tool industries. Any event that adversely impacts those customers’ new product development activities may reduce their demand for our products.
We have been required to conduct a good faith reasonable country of origin analysis on our use of “conflict minerals,” which has imposed and may impose additional costs on us and could raise reputational and other risks. The SEC has promulgated final rules in connection with the Dodd-Frank Wall Street reform and Consumer Protection Act regarding disclosure of the use of certain minerals, known as conflict minerals, mined from the Democratic Republic of the Congo and adjoining countries. We filed our first Form SD in fiscal year 2014 and there have been, and will continue to be, costs associated with complying with these disclosure requirements, including costs to determine the source of any conflict minerals used in our products. We have adopted a policy relating to conflict minerals, incorporating the standards set forth in the Organisation for Economic Co-Operation and Development Due Diligence Guidance, which affect the sourcing, supply, and pricing of materials used in our products. As we continue our due diligence, we may face reputational challenges if we are unable to verify the origins for all metals used in our products through the procedures we have and may continue to implement. We may also encounter challenges in our efforts to satisfy customers that may require all of the components of products purchased to be certified as conflict free. If we are not able to meet customer requirements, customers may choose to disqualify us as a supplier.
Interest rate fluctuations could adversely affect results. Significant changes in interest rates may affect our business in several ways, depending on our financial position and short-term financing needs. We may, at times, use debt to purchase shares of our common stock, finance working capital needs or finance the growth of the business through acquisitions. Fluctuations in interest rates can increase borrowing costs and we have not elected to mitigate this risk since our borrowings are typically outstanding for a short period of time.. Increases in short-term interest rates may directly impact the amount of interest we are required to pay and reduce earnings accordingly. Conversely, lower interest rates will adversely impact the interest we earn on cash and short-term investments.
|
|
|
|
Item 1B. |
|
|
|
|
|
None. |
|
9
|
|
|
|
Item 2. |
Our primary owned and leased facilities at September 27, 2014 were as follows:
|
|
|
|
|
|
|
|
|
|
|
|
|
Square |
|
|
|
Location |
|
Use of Facility |
|
Footage |
|
|
|
Eden Prairie, Minnesota, USA |
|
Corporate headquarters and primary Test manufacturing and research |
|
|
420,000 |
|
|
Cary, North Carolina, USA |
|
Sensors manufacturing, research and North American sales and service administration |
|
|
65,000 |
|
|
Berlin, Germany |
|
Test manufacturing and European sales and service administration |
|
|
72,000 |
|
|
Shenzhen, China |
|
Test manufacturing, research and sales and service administration |
|
|
75,000 |
|
|
Shanghai, China |
|
Test manufacturing and sales and service administration |
|
|
129,000 |
|
|
|
|
|
|
|
|
|
|
|
|
|
|
|
|
|
Square |
|
Lease |
|
||
|
Location |
|
Use of Facility |
|
Footage |
|
Expires |
|
||
|
Lexington, North Carolina, USA |
|
Test manufacturing |
|
|
12,000 |
|
|
2019 |
|
|
Ludenscheid, Germany |
|
Sensors manufacturing, research and European |
|
|
55,000 |
|
|
2017 |
|
|
|
|
sales and service administration |
|
|
10,000 |
|
|
2014 |
|
|
Creteil, France |
|
Test sales and service administration |
|
|
16,000 |
|
|
2015 |
|
|
Tokyo, Japan |
|
Test sales and service administration |
|
|
7,000 |
|
|
2018 |
|
|
|
|
Sensors manufacturing and Asia sales and service administration |
|
|
6,000 |
|
|
2015 |
|
|
Seoul, South Korea |
|
Test sales, service administration and assembly |
|
|
8,000 |
|
|
2019 |
|
|
Cary, North Carolina, USA |
|
Sensors manufacturing |
|
|
8,000 |
|
|
2020 |
|
|
Shanghai, China |
|
Test sales, service administration and assembly |
|
|
13,000 |
|
|
2015 |
|
|
|
|
|
|
|
7,000 |
|
|
2016 |
|
|
Shenzhen, China |
|
Test manufacturing |
|
|
13,000 |
|
|
2016 |
|
|
|
|
|
|
|
16,000 |
|
|
2016 |
|
|
Berlin, Germany |
|
Land under Berlin facility |
|
|
97,000 |
|
|
2052 |
|
|
Shenzhen, China |
|
Land under Shenzhen facility |
|
|
155,000 |
|
|
2047 |
|
|
Shanghai, China |
|
Land under Shanghai facility |
|
|
161,000 |
|
|
2056 |
|
We also lease space in the United States, Europe and Asia for sales and service administration for Test, including locations in Germany, France, United Kingdom, Sweden, Italy, Russia, China and various other locations in the United States. Neither the amount of leased space nor the rental obligations in these locations is significant individually or in aggregate. Additional information relative to lease obligations is included in Management’s Discussion and Analysis of Financial Condition and Results of Operations, appearing under Item 7 of this Annual Report on Form 10-K.
We consider our current facilities adequate to support our operations during fiscal year 2015.
10
|
|
|
|
Item 3. |
The information required hereunder is incorporated by reference from Note 13 of the Notes to consolidated financial Statements under Item 8 of this Annual Report on Form 10-K.
|
|
|
|
Item 4. |
Not applicable.
|
|
|
|
Item 5. |
Market for Registrant’s Common Equity, Related Stockholder Matters and Issuer Purchases of Equity Securities |
Shares of our Company’s common stock are traded on the NASDAQ Global Select MarketSM under the symbol MTSC.
The following table sets forth the low and high share prices for the fiscal quarters indicated. *
|
|
|
|
|
|
|
|
|
|
|
Quarter Ended |
|
|
Low |
|
High |
|
||
|
December 29, 2012 |
|
$ |
41.42 |
|
$ |
55.00 |
|
|
|
March 30, 2013 |
|
$ |
49.51 |
|
$ |
59.76 |
|
|
|
June 29, 2013 |
|
$ |
53.80 |
|
$ |
62.91 |
|
|
|
September 28, 2013 |
|
$ |
56.72 |
|
$ |
65.47 |
|
|
|
December 28, 2013 |
|
$ |
62.01 |
|
$ |
72.62 |
|
|
|
March 29, 2014 |
|
$ |
65.00 |
|
$ |
78.90 |
|
|
|
June 28, 2014 |
|
$ |
56.87 |
|
$ |
71.20 |
|
|
|
September 27, 2014 |
|
$ |
59.97 |
|
$ |
72.97 |
|
|
At November 21, 2014, there were 782 holders of record of the Company’s common stock. This number does not reflect shareholders who hold their shares in the name of broker-dealers or other nominees.
11
Purchases of Company Equity Securities
|
|
|
|
|
|
|
|
|
|
|
|
|
|
|
|
Fiscal Period |
|
Total Number |
|
Average |
|
Total Number |
|
Maximum |
|
||||
|
Fourth Quarter |
|
|
|
|
|
|
|
|
|
|
|
|
|
|
June 29, 2014 - |
|
|
|
|
|
|
|
|
|
|
|
|
|
|
August 2, 2014 |
|
|
- |
|
$ |
- |
|
|
- |
|
|
1,131,162 |
|
|
August 3, 2014 - |
|
|
|
|
|
|
|
|
|
|
|
|
|
|
August 30, 2014 |
|
|
- |
|
$ |
- |
|
|
- |
|
|
1,131,162 |
|
|
August 31, 2014 - |
|
|
|
|
|
|
|
|
|
|
|
|
|
|
September 27, 2014 |
|
|
- |
|
$ |
- |
|
|
- |
|
|
1,131,162 |
|
|
|
|
|
|
|
|
|
|
|
|
|
|
|
|
|
Fourth Quarter |
|
|
- |
|
$ |
- |
|
|
- |
|
|
1,131,162 |
|
We purchase common stock to mitigate dilution related to new shares issued as employee equity compensation such as stock option, restricted stock, and employee stock purchase plan awards, as well as to return to shareholders capital not immediately required to fund ongoing operations.
Our Board of Directors approved, and on February 11, 2011 announced, a 2.0 million share purchase authorization. Authority over pricing and timing under this authorization has been delegated to management. The share purchase authorization has no expiration date. At September 27, 2014, there were approximately 1.1 million shares available for purchase under the existing authorization.
Dividend Policy
Our dividend policy is to maintain a payout ratio that allows dividends to increase with the long-term growth of earnings per share, while sustaining dividends through economic cycles. Our dividend practice is to target, over time, a payout ratio of approximately 25% of net earnings per share. During fiscal year 2014, we declared quarterly cash dividends of $0.30 per share to holders of our common stock, which resulted in a payout ratio of approximately 44%. During fiscal year 2013, we declared quarterly cash dividends of $0.30 per share to holders of our common stock, which resulted in a payout ratio of approximately 33% of net earnings per share.
Debt Covenants
Our unsecured credit facility includes certain financial covenants, including the ratio of consolidated total indebtedness to consolidated EBITDA, as well as the ratio of consolidated EBITDA to consolidated interest expense. These financial covenants may restrict our ability to pay dividends and purchase outstanding shares of our common stock. At September 27, 2014 and September 28, 2013, we were in compliance with these financial covenants. Information on our debt agreements is included in Item 7 of this Annual Report on Form 10-K.
12
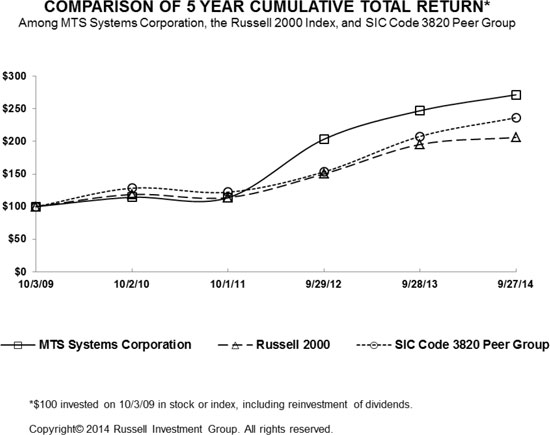
Shareholder Return Performance
The graph and table below set forth a comparison of the cumulative total return of our common stock over the last five fiscal years. Assuming a $100 investment on October 3, 2009 and reinvestment of dividends, the total return over the same periods is compared to the Russell 2000 Index and a peer group of companies in the Laboratory Apparatus and Analytical, Optical, Measuring, and Controlling Instruments Standard Industrial Code (SIC Code 3820) that are traded on the NASDAQ, NYSE and NYSE MKT exchanges. The table and graph are not necessarily indicative of future investment performance.
|
|
|
|
|
|
|
|
|
|
|
|
|
|
|
|
|
|
|
|
|
|
|
|
|
|
|
|
|
|
|
FISCAL YEAR ENDED |
|
|||||||||||||||||||||
|
|
|
|
10/3/09 |
|
|
10/2/10 |
|
|
10/1/11 |
|
|
9/29/12 |
|
|
9/28/13 |
|
|
9/27/14 |
|
||||||
|
MTS Systems Corporation |
|
|
$ |
100.00 |
|
|
$ |
114.36 |
|
|
$ |
113.71 |
|
|
$ |
203.50 |
|
|
$ |
247.19 |
|
|
$ |
271.69 |
|
|
Russell 2000 Index |
|
|
|
100.00 |
|
|
|
118.60 |
|
|
|
113.88 |
|
|
|
150.22 |
|
|
|
195.44 |
|
|
|
206.28 |
|
|
*SIC Code 3820 Peer Group (Modified to remove non-exchnage traded companies) |
|
|
|
100.00 |
|
|
|
128.36 |
|
|
|
122.18 |
|
|
|
153.31 |
|
|
|
207.82 |
|
|
|
236.50 |
|
13
|
|
|
|
Item 6. |
The table below provides selected historical financial data which should be read in conjunction with the Consolidated Financial Statements, the Notes to the Consolidated Financial Statements, and “Management’s Discussion and Analysis of Financial Condition and Results of Operations,” which are included in Items 7 and 8 of this Annual Report on Form 10-K. The statement of income data for each of the three fiscal years ended September 27, 2014, September 28, 2013, and September 29, 2012 and the balance sheet data at September 27, 2014 and September 28, 2013 are derived from the audited Consolidated Financial Statements included elsewhere in this report. The statement of income data for the fiscal years ended October 1, 2011 and October 2, 2010 and the balance sheet data at September 29, 2012, October 1, 2011 and October 2, 2010 are derived from our audited financial statements that are not included in this Annual Report on Form 10-K.
|
|
|
|
|
|
|
|
|
|
|
|
|
|
|
|
|
|
|
Five-Year Financial Summary |
|
|||||||||||||||
|
(For the Fiscal Years Ended September 27, 2014; September 28, 2013; September 29, 2012; October 1, 2011; October 2, 2010) |
|
|||||||||||||||
|
(expressed in thousands, except per share data and numbers of shareholders and employees) |
|
|||||||||||||||
|
|
|
|
|
|
|
|
|
|
|
|
|
|
|
|
|
|
|
|
|
2014 |
|
2013 |
|
2012 |
|
2011 |
|
2010 |
|
|||||
|
Operations |
|
|
|
|
|
|
|
|
|
|
|
|
|
|
|
|
|
Revenue |
|
$ |
564,328 |
|
$ |
569,439 |
|
$ |
542,256 |
|
$ |
467,368 |
|
$ |
374,053 |
|
|
Gross profit |
|
|
223,643 |
|
|
231,939 |
|
|
236,192 |
|
|
201,990 |
|
|
151,794 |
|
|
Gross profit as a % of revenue |
|
|
39.6 |
% |
|
40.7 |
% |
|
43.6 |
% |
|
43.2 |
% |
|
40.6 |
% |
|
Research and development expense |
|
$ |
23,844 |
|
$ |
22,812 |
|
$ |
21,893 |
|
$ |
14,785 |
|
$ |
14,945 |
|
|
Research and development as a % of revenue |
|
|
4.2 |
% |
|
4.0 |
% |
|
4.0 |
% |
|
3.2 |
% |
|
4.0 |
% |
|
Effective income tax rate |
|
|
28.1 |
% |
|
27.1 |
% |
|
35.4 |
% |
|
30.5 |
% |
|
31.7 |
% |
|
Net income |
|
$ |
42,009 |
|
$ |
57,806 |
|
$ |
51,556 |
|
$ |
50,942 |
|
$ |
18,576 |
|
|
Net income as a % of revenue |
|
|
7.4 |
% |
|
10.2 |
% |
|
9.5 |
% |
|
10.9 |
% |
|
5.0 |
% |
|
Diluted earnings per share of common stock |
|
$ |
2.73 |
|
$ |
3.64 |
|
$ |
3.21 |
|
$ |
3.24 |
|
$ |
1.14 |
|
|
Weighted average dilutive shares outstanding during the year2 |
|
|
15,397 |
|
|
15,861 |
|
|
16,077 |
|
|
15,739 |
|
|
16,347 |
|
|
Net interest expense |
|
$ |
(692 |
) |
$ |
(334 |
) |
$ |
(305 |
) |
$ |
(915 |
) |
$ |
(1,052 |
) |
|
Depreciation and amortization |
|
|
19,279 |
|
|
16,589 |
|
|
13,782 |
|
|
12,894 |
|
|
12,751 |
|
|
|
|
|
|
|
|
|
|
|
|
|
|
|
|
|
|
|
|
Financial Position |
|
|
|
|
|
|
|
|
|
|
|
|
|
|
|
|
|
Cash, cash equivalents and short-term investments |
|
$ |
60,397 |
|
$ |
48,333 |
|
$ |
79,852 |
|
$ |
104,095 |
|
$ |
76,611 |
|
|
Property and equipment, net |
|
|
81,575 |
|
|
78,399 |
|
|
61,653 |
|
|
56,252 |
|
|
56,444 |
|
|
Total assets |
|
|
487,408 |
|
|
451,277 |
|
|
409,438 |
|
|
427,859 |
|
|
346,405 |
|
|
Interest-bearing debt3 |
|
|
60,000 |
|
|
35,000 |
|
|
- |
|
|
40,000 |
|
|
40,000 |
|
|
Total shareholders’ investment |
|
|
258,127 |
|
|
256,537 |
|
|
226,719 |
|
|
210,848 |
|
|
166,106 |
|
|
Interest-bearing debt as a % of shareholders’ investment |
|
|
23.2 |
% |
|
13.6 |
% |
|
0.0 |
% |
|
19.0 |
% |
|
24.1 |
% |
|
Return on equity4 |
|
|
16.4 |
% |
|
25.5 |
% |
|
24.5 |
% |
|
30.7 |
% |
|
9.1 |
% |
|
Return on invested capital5 |
|
|
15.4 |
% |
|
22.5 |
% |
|
25.1 |
% |
|
22.6 |
% |
|
8.7 |
% |
|
|
|
|
|
|
|
|
|
|
|
|
|
|
|
|
|
|
|
Other Statistics |
|
|
|
|
|
|
|
|
|
|
|
|
|
|
|
|
|
Number of common shareholders of record at year-end6 |
|
|
789 |
|
|
836 |
|
|
881 |
|
|
926 |
|
|
981 |
|
|
Number of employees at year-end |
|
|
2,180 |
|
|
2,299 |
|
|
2,147 |
|
|
2,003 |
|
|
1,948 |
|
|
Orders |
|
$ |
615,586 |
|
$ |
567,418 |
|
$ |
565,327 |
|
$ |
540,023 |
|
$ |
423,525 |
|
|
Backlog of orders at year-end |
|
|
326,473 |
|
|
290,151 |
|
|
298,363 |
|
|
287,916 |
|
|
214,770 |
|
|
Dividends declared per share |
|
|
1.20 |
|
|
1.20 |
|
|
1.05 |
|
|
0.85 |
|
|
0.60 |
|
|
Capital expenditures |
|
|
20,038 |
|
|
29,690 |
|
|
15,625 |
|
|
10,145 |
|
|
11,214 |
|
14
1 All
fiscal years presented were 52-week
2 Assumes
the conversion of potential common shares using the treasury stock method.
3 Consists
of short-term borrowings.
4 Calculated
by dividing net income by beginning shareholders’ investment.
5The
measure “Return on Invested Capital” (“ROIC”) is not a measure of performance
presented in accordance with U.S. Generally Accepted Accounting Principles
(“GAAP”). ROIC is calculated by dividing adjusted net income by average
invested capital. Adjusted net income is calculated by excluding after-tax
interest expense from reported net income. In addition, for the fiscal year
ended September 29, 2012, adjusted net income also excludes the cost related to
the settlement of the U.S. Government investigation. Average invested capital is defined as the aggregate
of average interest-bearing debt and average shareholders’ investment and is
calculated as the sum of current and prior year ending amounts divided by two. Because
the ratio is not prescribed or authorized by GAAP, the ROIC percentage is a
non-GAAP financial measure. We believe
ROIC is useful to investors as a measure of operating performance and of the
effectiveness of the use of capital in our operations. We use ROIC as one
measure to monitor and evaluate operating performance relative to our
invested capital. This measure should not be construed as an alternative to
return on equity or any other measure determined in accordance with GAAP.
6 Does not include shareholders whose stock
is held in the name of broker dealers or other nominees.
Reconciliation of the non-GAAP financial measure to the nearest GAAP measure:
|
|
|
|
|
|
|
|
|
|
|
|
|
|
|
|
|
|
|
|
|
2014 |
|
2013 |
|
2012 |
|
2011 |
|
2010 |
|
|||||
|
|
|
|
|
|
|
|
|
|
|
|
|
|
|
|
|
|
|
Net income |
|
$ |
42,009 |
|
$ |
57,806 |
|
$ |
51,556 |
|
$ |
50,942 |
|
$ |
18,576 |
|
|
Expense to settle U.S. Government investigation |
|
|
- |
|
|
- |
|
|
7,750 |
|
|
- |
|
|
- |
|
|
Restructuring expense, net of tax |
|
|
4,376 |
|
|
- |
|
|
- |
|
|
- |
|
|
- |
|
|
After-tax interest expense |
|
|
637 |
|
|
372 |
|
|
535 |
|
|
808 |
|
|
893 |
|
|
Adjusted net income * |
|
$ |
47,022 |
|
$ |
58,178 |
|
$ |
59,841 |
|
$ |
51,750 |
|
$ |
19,469 |
|
|
|
|
|
|
|
|
|
|
|
|
|
|
|
|
|
|
|
|
Total beginning shareholders’ investment |
|
$ |
256,537 |
|
$ |
226,719 |
|
$ |
210,848 |
|
$ |
166,106 |
|
$ |
203,965 |
|
|
Total ending shareholders’ investment |
|
|
258,127 |
|
|
256,537 |
|
|
226,719 |
|
|
210,848 |
|
|
166,106 |
|
|
Total beginning interest bearing debt |
|
|
35,000 |
|
|
- |
|
|
40,000 |
|
|
40,000 |
|
|
40,000 |
|
|
Total ending interest bearing debt |
|
|
60,000 |
|
|
35,000 |
|
|
- |
|
|
40,000 |
|
|
40,000 |
|
|
Sum of invested capital |
|
$ |
609,664 |
|
$ |
518,256 |
|
$ |
477,567 |
|
$ |
456,954 |
|
$ |
450,071 |
|
|
|
|
|
|
|
|
|
|
|
|
|
|
|
|
|
|
|
|
Average invested capital* |
|
$ |
304,832 |
|
$ |
259,128 |
|
$ |
238,784 |
|
$ |
228,477 |
|
$ |
225,036 |
|
|
|
|
|
|
|
|
|
|
|
|
|
|
|
|
|
|
|
|
Return on invested capital * |
|
|
15.4 |
% |
|
22.5 |
% |
|
25.1 |
% |
|
22.6 |
% |
|
8.7 |
% |
* Denotes Non-GAAP financial measure
|
|
|
|
Management’s Discussion and Analysis of Financial Condition and Results of Operations |
About MTS Systems Corporation
MTS Systems Corporation is a leading global supplier of high-performance test
systems and position sensors. Our testing hardware and software solutions help
customers accelerate and improve their design, development, and manufacturing
processes and are used for determining the mechanical behavior of materials,
products, and structures. Our high-performance position sensors provide
controls for a variety of industrial and vehicular applications. We had 2,180
employees and revenue of $564 million for the fiscal year ended September 27,
2014.
Company Strategy
Our goal is to grow profitably, generate strong cash flow, and deliver a strong
return on invested capital to our shareholders by leveraging our leadership
position in the research and development, product development and industrial and mobile equipment global end markets. Our desire is
to be the innovation leader in creating test and measurement solutions to
enable our customers’ success. Through innovation we believe we can create
value for our customers which will drive our growth. There are four global
macro-trends that will help enable this growth: energy scarcity; environmental
concerns; globalization and the development of the emerging markets; and global
demographics. These macro-trends have significant implications for our
customers, such as increasing the demand for new and more innovative products
and increasing our customers’ organizational complexity. We believe we have an
excellent geographic footprint and are well positioned in both Test and Sensors
to take advantage of these macro-trends and deliver significant profitable
growth in the years ahead.
15
We are working toward our previously communicated goal of achieving $1 billion in annual revenue, margin expansion and top quartile Return on Invested Capital (“ROIC”). Economic conditions and the competitive environment will impact the timing of when the $1 billion goal is achieved. Our three priorities to achieve this goal are:
|
|
|
|
|
|
• |
Accelerating innovation; |
|
|
|
|
|
|
• |
Capturing opportunities in the rapidly emerging markets; and |
|
|
|
|
|
|
• |
Realizing the potential of the Test service business |
Our business model supports achieving our $1 billion revenue milestone through both organic growth and strategic acquisitions, assuming we continue to move aggressively to build our infrastructure, expand our offerings and execute on our opportunities with our key customers around the world. In order to accelerate our revenue growth over the next few years, investments in infrastructure, sales support and field service capacity and capability are essential. We invested in earnest in fiscal year 2013 and will continue to moderately invest in future fiscal years.
Fiscal Year
Our fiscal year ends on the Saturday closest to September 30. The
fiscal years ended September 27, 2014, September 28, 2013 and September 29,
2012 each consisted of 52 weeks.
Financial Results
Fiscal Year 2014 Compared to Fiscal Year 2013
Total Company
Orders and Backlog
The following is a comparison of fiscal year 2014 and fiscal year 2013 orders, separately identifying the estimated impact of currency translation:
|
|
|
|
|
|
|
|
|
|
|
|
|
|
|
|
|
|
|
|
|
|
|
|
Estimated |
|
|
|
|
|||||||
|
|
|
2014 |
|
Business |
|
REI |
|
Currency |
|
2013 |
|
|||||
|
|
|
|
|
|
(expressed in millions) |
|
|
|
|
|||||||
|
Orders |
|
$ |
615.6 |
|
$ |
48.1 |
|
$ |
2.1 |
|
$ |
(2.0 |
) |
$ |
567.4 |
|
Orders totaled $615.6 million, an increase of $48.2 million, or 8.5%, compared to orders of $567.4 million for fiscal year 2013. Fiscal year 2014 orders included eight large orders (equal to or in excess of $5.0 million) totaling $61.3 million. The large orders were comprised of six large Asian and two large Americas’ Test orders totaling $42.3 million and $19.0 million, respectively. Fiscal year 2013 orders included five large orders totaling $37.4 million, and included three large European and two large Americas’ Test orders totaling $22.2 million and $15.2 million, respectively. Excluding the large orders and currency, base orders increased 4.6%, reflecting 3.1% growth in Test, primarily in the Americas and Asia, as well as 11.3% growth in Sensor which experienced growth across all geographies.
16
The following is a comparison of fiscal year 2014 and fiscal year 2013 orders by geography:
|
|
|
|
|
|
|
|
|
|
|
|
|
|
|
|
Geography |
|
2014 |
|
2013 |
|
Variance |
|
% Variance |
|
||||
|
|
|
(expressed in millions) |
|
||||||||||
|
Americas |
|
$ |
188.7 |
|
$ |
169.0 |
|
$ |
19.7 |
|
|
11.7 |
% |
|
Europe |
|
|
170.6 |
|
|
181.8 |
|
|
(11.2 |
) |
|
-6.2 |
% |
|
Asia |
|
|
256.3 |
|
|
216.6 |
|
|
39.7 |
|
|
18.3 |
% |
|
Total Orders |
|
$ |
615.6 |
|
$ |
567.4 |
|
$ |
48.2 |
|
|
8.5 |
% |
Backlog of undelivered orders at September 27, 2014 was $326.5 million, an increase of $36.3 million, or 12.5%, compared to backlog of $290.2 million at September 28, 2013. We believe backlog is not an absolute indicator of future revenue because a portion of the orders in backlog could be cancelled at the customer’s discretion. While the backlog is subject to order cancellations, we have not historically experienced a significant number of order cancellations. During fiscal year 2014, one custom order in Test totaling approximately $11.1 million was cancelled. This order was booked in a previous fiscal year. During fiscal year 2013, one custom order in Test totaling approximately $2 million was cancelled. This order was booked in a previous fiscal year.
Results of Operations
The following is a comparison of fiscal year 2014 and fiscal year 2013 statements of operations (in millions, except per share data):
|
|
|
|
|
|
|
|
|
|
|
|
|
|
|
|
|
|
2014 |
|
2013 |
|
Variance |
|
% Variance |
|
||||
|
Revenue |
|
$ |
564.3 |
|
$ |
569.4 |
|
$ |
(5.1 |
) |
|
-0.9 |
% |
|
Cost of sales |
|
|
340.7 |
|
|
337.5 |
|
|
3.2 |
|
|
0.9 |
% |
|
Gross profit |
|
|
223.6 |
|
|
231.9 |
|
|
(8.3 |
) |
|
-3.6 |
% |
|
Gross margin |
|
|
39.6 |
% |
|
40.7 |
% |
|
-1.1 |
% |
|
pts |
|
|
|
|
|
|
|
|
|
|
|
|
|
|
|
|
|
Operating expenses: |
|
|
|
|
|
|
|
|
|
|
|
|
|
|
Selling and marketing |
|
|
88.1 |
|
|
81.0 |
|
|
7.1 |
|
|
8.8 |
% |
|
General administrative |
|
|
51.4 |
|
|
48.1 |
|
|
3.3 |
|
|
6.9 |
% |
|
Research and development |
|
|
23.8 |
|
|
22.8 |
|
|
1.0 |
|
|
4.4 |
% |
|
Total operating expenses |
|
|
163.3 |
|
|
151.9 |
|
|
11.4 |
|
|
7.5 |
% |
|
Income from operations |
|
|
60.3 |
|
|
80.0 |
|
|
(19.7 |
) |
|
-24.6 |
% |
|
Interest expense, net |
|
|
(0.7 |
) |
|
(0.3 |
) |
|
(0.4 |
) |
|
133.3 |
% |
|
Other expense, net |
|
|
(1.2 |
) |
|
(0.4 |
) |
|
(0.8 |
) |
|
200.0 |
% |
|
|
|
|
|
|
|
|
|
|
|
|
|
|
|
|
Income before income taxes |
|
|
58.4 |
|
|
79.3 |
|
|
(20.9 |
) |
|
-26.4 |
% |
|
Provision for income taxes |
|
|
16.4 |
|
|
21.5 |
|
|
(5.1 |
) |
|
-23.7 |
% |
|
Net income |
|
$ |
42.0 |
|
$ |
57.8 |
|
$ |
(15.8 |
) |
|
-27.3 |
% |
|
|
|
|
|
|
|
|
|
|
|
|
|
|
|
|
Diluted earnings per share |
|
$ |
2.73 |
|
$ |
3.64 |
|
$ |
(0.91 |
) |
|
-25.0 |
% |
17
The following is a comparison of fiscal year 2014 and fiscal year 2013 results of operations, separately identifying the estimated impact of currency translation:
|
|
|
|
|
|
|
|
|
|
|
|
|
|
|
|
|
|
|
|
|
|
|
|
Estimated |
|
|
|
|
|||||||
|
|
|
2014 |
|
Business |
|
REI |
|
Currency |
|
2013 |
|
|||||
|
|
|
|
|
|
(expressed in millions) |
|
|
|
|
|||||||
|
Revenue |
|
$ |
564.3 |
|
$ |
(7.3 |
) |
$ |
2.3 |
|
$ |
(0.1 |
) |
$ |
569.4 |
|
|
Cost of sales |
|
|
340.7 |
|
|
0.8 |
|
|
1.8 |
|
|
0.6 |
|
|
337.5 |
|
|
Gross profit |
|
|
223.6 |
|
|
(8.1 |
) |
|
0.5 |
|
|
(0.7 |
) |
|
231.9 |
|
|
Gross margin |
|
|
39.6 |
% |
|
|
|
|
23.0 |
% |
|
|
|
|
40.7 |
% |
|
|
|
|
|
|
|
|
|
|
|
|
|
|
|
|
|
|
|
Operating expenses: |
|
|
|
|
|
|
|
|
|
|
|
|
|
|
|
|
|
Selling and marketing |
|
|
88.1 |
|
|
6.8 |
|
|
0.2 |
|
|
0.1 |
|
|
81.0 |
|
|
General administrative |
|
|
51.4 |
|
|
2.8 |
|
|
0.3 |
|
|
0.2 |
|
|
48.1 |
|
|
Research and development |
|
|
23.8 |
|
|
0.9 |
|
|
- |
|
|
0.1 |
|
|
22.8 |
|
|
Total operating expenses |
|
|
163.3 |
|
|
10.5 |
|
|
0.5 |
|
|
0.4 |
|
|
151.9 |
|
|
Income from operations |
|
$ |
60.3 |
|
$ |
(18.6 |
) |
$ |
- |
|
$ |
(1.1 |
) |
$ |
80.0 |
|
Revenue
Revenue was $564.3 million, a decrease of
$5.1 million, or 0.9%, compared to revenue of $569.4 million for fiscal year
2013. This decrease was driven by lower beginning of period backlog and a
higher content of slower turning backlog in Test, partially offset by higher
beginning of period backlog and increased order volume in Sensors and increased
service revenue in Test. Test revenue decreased 3.4% to $458.1 million, while
Sensors revenue increased 11.4% to $106.2 million.
The following is a comparison of fiscal year 2014 and fiscal year 2013 revenue by geography:
|
|
|
|
|
|
|
|
|
|
|
|
|
|
|
|
Geography |
|
2014 |
|
2013 |
|
Variance |
|
% Variance |
|
||||
|
|
|
(expressed in millions) |
|
||||||||||
|
Americas |
|
$ |
176.1 |
|
$ |
165.6 |
|
$ |
10.5 |
|
|
6.3 |
% |
|
Europe |
|
|
179.1 |
|
|
178.6 |
|
|
0.5 |
|
|
0.3 |
% |
|
Asia |
|
|
209.1 |
|
|
225.2 |
|
|
(16.1 |
) |
|
-7.1 |
% |
|
Total Revenue |
|
$ |
564.3 |
|
$ |
569.4 |
|
$ |
(5.1 |
) |
|
-0.9 |
% |
Although selective product price changes were implemented during each of these fiscal years, the overall impact of pricing changes did not have a material effect on revenue.
As previously disclosed, productivity benefits from investments in Test business processes were expected to result in $4 to $5 million of cost savings during fiscal year 2014, with such cost savings reinvested primarily in the Test business to enable our long-term growth objectives. We achieved cost savings substantially in line with the Company’s expectations. Associated with these savings, we initiated workforce reduction and other cost reduction actions throughout fiscal year 2014. As a result of these cost reduction actions, we incurred severance and related costs. During fiscal year 2014, we incurred severance and related costs of $6.3 million, of which $3.5 million, $1.8 million, and $1.0 million were reported in Cost of Sales, Selling and Marketing, and General and Administrative expense, respectively.
18
Gross
profit
Gross profit was
$223.6 million, a decrease of $8.3 million, or 3.6%, compared to gross profit
of $231.9 million for fiscal year 2013. Gross profit as a percentage of revenue
was 39.6%, a decrease of 1.1 percentage points from 40.7% for fiscal year 2013.
The previously mentioned severance and related costs of $3.5 million
unfavorably impacted gross profit as a percentage of revenue by 0.6 percentage
points. In addition, unfavorable product mix from a higher proportion of revenue
from lower margin products decreased our gross margin percent by 1.2 percentage
points. These unfavorable factors were partially offset by a 0.5 percentage
point increase in gross margin primarily driven by the favorable impact of an
increase in Sensors revenue, which is higher margin, compared to total Company
revenue and a reduction in various miscellaneous manufacturing expenses.
Selling
and Marketing Expense
Selling
and marketing expense was $88.1 million, an increase of $7.1 million, or 8.8%,
compared to $81.0 million for fiscal year 2013. The increase was driven by
higher compensation and benefits resulting from increased headcount, higher
sales commissions based on the increase in orders, as well as the previously
mentioned severance and related costs of $1.8 million during fiscal year 2014.
Selling and marketing expense as a percentage of revenue was 15.6%, compared to
14.2% fiscal year 2013.
General
and Administrative Expense
General
and administrative expense was $51.4 million, an increase of $3.3 million, or
6.9%, compared to $48.1 million for fiscal year 2013. The increases were
primarily driven by higher compensation and benefits driven by increased
headcount of $2.6 million, higher legal expenses of $1.8 million, as well the
previously mentioned severance and related costs of $1.0 million which was
partially offset by lower consulting fees of $1.7 million and other
miscellaneous expenses of $0.5 million in fiscal year 2014. General and
administrative expense as a percentage of revenue was 9.1%, compared to 8.4%
for fiscal year 2013.
Research
and Development Expense
Research
and development expense was $23.8 million, an increase of $1.0 million, or
4.4%, compared to $22.8 million for fiscal year 2013. This increase was driven
by higher compensation and benefits resulting from increased headcount in both
Test and Sensors. Research and development expense as a percentage of revenue
for fiscal year 2014 was 4.2%, compared to 4.0% for fiscal year 2013.
Income from Operations
Income from operations was $60.3 million, a decrease of $19.7
million, or 24.6%, compared to income from operations of $80.0 million for
fiscal year 2013. Excluding the previously mentioned severance and related
costs of $6.3 million, income from operations decreased 16.8% for fiscal year
2014, driven by the $8.3 million decrease in gross profit and a $5.1 million
increase in operating expenses resulting from ongoing investments for growth in
sales and research and development. Operating income as a percentage of revenue
was 10.7%, compared to 14.0% for fiscal year 2013.
Historically, our operating costs have been impacted by a level of inflation ranging from -1% to 4%. We use a number of strategies to mitigate the effects of cost inflation including cost productivity initiatives such as global procurement strategies, as well as price increases. However, if our operating costs were to become subject to significant inflationary pressures, we may not be able to fully offset such higher costs.
Interest
Expense, net
Net interest expense was $0.7 million, compared to net interest expense of $0.3
million for fiscal year 2013. The increase was driven by a relatively higher
level of outstanding borrowings under the Company’s credit facility during
fiscal year 2014 compared to fiscal year 2013.
Other (Expense) Income, net
Other expense, net was $1.2 million of net other expense, compared to net other
expense of $0.4 million for fiscal year 2013. This increase in net expense was
primarily driven by $0.6 million of royalty income in fiscal year 2013 that we
did not receive in fiscal year 2014.
19
Provision for Income Taxes
Provision
for income taxes totaled $16.4 million, a decrease of $5.1 million, compared to $21.5 million for fiscal year 2013.
The decrease was primarily due to decreased income before income taxes. The effective tax rate for the fiscal year was 28.1%,
an increase of 1.0 percentage point compared to 27.1% for fiscal year 2013. The tax rate was unfavorably impacted by
lower R&D tax credits in the current year due to the expiration of the R&D tax credit. Both fiscal years 2013 and
2014 had one-time tax benefits associated with R&D tax credits that caused the Company’s effective tax rate to be
lower than it has been historically.
Net Income
Net income was $42.0 million, a decrease of $15.8 million, compared to $57.8
million for fiscal year 2013. The decrease was primarily driven by lower income
from operations. Earnings per
diluted share were $2.73, a decrease of $0.91 per share, or 25.0%, compared to
$3.64 per share for fiscal year 2013. The previously mentioned $6.3 million
charge for severance and related costs in fiscal year 2014 negatively impacted
earnings per diluted share by $0.28.
Segment Results
Test Segment
Orders and Backlog
The following is a comparison of fiscal year 2014 and fiscal year 2013 orders for Test, separately identifying the estimated impact of currency translation:
|
|
|
|
|
|
|
|
|
|
|
|
|
|
|
|
|
|
|
|
|
|
|
|
Estimated |
|
|
|
|
|||||||
|
|
|
2014 |
|
Business |
|
REI |
|
Currency |
|
2013 |
|
|||||
|
|
|
|
|
|
(expressed in millions) |
|
|
|
|
|||||||
|
Orders |
|
$ |
507.2 |
|
$ |
36.9 |
|
$ |
2.1 |
|
$ |
(1.8 |
) |
$ |
470.0 |
|
Orders totaled $507.2 million, an increase of $37.2 million, or 7.9% compared to orders of $470.0 million for fiscal year 2013, primarily driven by 3.1% growth in base orders as well as variability in large orders. Large orders for fiscal year 2014 were $61.3 million. There were six large orders in Asia and two large orders in the Americas totaling $42.3 million and $19.0 million, respectively. Orders in Asia consisted of two orders totaling $17.2 million in the structures market and four orders totaling $25.1 million in the ground vehicles market. Orders in Americas consisted of two orders totaling $19.0 million, one of which was a $12.2 million order in the ground vehicles market and the other was a $6.8 million order in the structures market. Large orders in fiscal year 2013 totaled $37.4 million and included three large European orders in the ground vehicles market totaling approximately $22.2 million. In addition, fiscal year 2013 orders included two large Americas’ orders in the ground vehicles market totaling approximately $15.2 million. Currency translation unfavorably impacted orders by approximately $1.8 million. Test accounted for 82.4% of total Company orders, compared to 82.8% for fiscal year 2013.
The following is a comparison of fiscal year 2014 and fiscal year 2013 orders for Test by geography:
|
|
|
|
|
|
|
|
|
|
|
|
|
|
|
|
Geography |
|
2014 |
|
2013 |
|
Variance |
|
% Variance |
|
||||
|
|
|
(expressed in millions) |
|
||||||||||
|
Americas |
|
$ |
157.3 |
|
$ |
140.4 |
|
$ |
16.9 |
|
|
12.0 |
% |
|
Europe |
|
|
116.1 |
|
|
133.9 |
|
|
(17.8 |
) |
|
-13.3 |
% |
|
Asia |
|
|
233.8 |
|
|
195.7 |
|
|
38.1 |
|
|
19.5 |
% |
|
Total Orders |
|
$ |
507.2 |
|
$ |
470.0 |
|
$ |
37.2 |
|
|
7.9 |
% |
20
Backlog of undelivered orders at September 27, 2014 was $310.0 million, an increase of 12.7% from backlog of $275.0 million at September 28, 2013. As previously mentioned, backlog at the end of fiscal year 2014 was negatively impacted by a custom order in Test totaling approximately $11.1 million that was cancelled during the Second Quarter of fiscal year 2014. Also, as previously mentioned, backlog at the end of fiscal year 2013 was negatively impacted by the cancellation of one custom order totaling approximately $2.0 million.
Results of Operations
The following is a comparison of fiscal year 2014 and fiscal year 2013 results of operations for Test separately identifying the estimated impact of currency translation and the impact of the REI acquisition completed in fiscal year 2014:
|
|
|
|
|
|
|
|
|
|
|
|
|
|
|
|
|
|
|
|
|
|
|
|
Estimated |
|
|
|
|
|||||||
|
|
|
2014 |
|
Business |
|
REI |
|
Currency |
|
2013 |
|
|||||
|
|
|
(expressed in millions) |
|
|||||||||||||
|
Revenue |
|
$ |
458.1 |
|
$ |
(18.5 |
) |
$ |
2.3 |
|
$ |
0.2 |
|
$ |
474.1 |
|
|
Cost of sales |
|
|
292.7 |
|
|
(5.8 |
) |
|
1.8 |
|
|
0.6 |
|
|
296.1 |
|
|
Gross profit |
|
|
165.4 |
|
|
(12.7 |
) |
|
0.5 |
|
|
(0.4 |
) |
|
178.0 |
|
|
Gross margin |
|
|
36.1 |
% |
|
|
|
|
23.0 |
% |
|
|
|
|
37.5 |
% |
|
|
|
|
|
|
|
|
|
|
|
|
|
|
|
|
|
|
|
Operating expenses: |
|
|
|
|
|
|
|
|
|
|
|
|
|
|
|
|
|
Selling and marketing |
|
|
68.4 |
|
|
4.5 |
|
|
0.2 |
|
|
0.3 |
|
|
63.4 |
|
|
General administrative |
|
|
40.0 |
|
|
3.2 |
|
|
0.3 |
|
|
0.2 |
|
|
36.3 |
|
|
Research and development |
|
|
17.1 |
|
|
(0.2 |
) |
|
- |
|
|
- |
|
|
17.3 |
|
|
Total operating expenses |
|
|
125.5 |
|
|
7.5 |
|
|
0.5 |
|
|
0.5 |
|
|
117.0 |
|
|
Income from operations |
|
$ |
39.9 |
|
$ |
(20.2 |
) |
$ |
- |
|
$ |
(0.9 |
) |
$ |
61.0 |
|
Revenue
Revenue was $458.1 million, a decrease of
$16.0 million, or 3.4%, compared to revenue of $474.1 million for fiscal year
2013, including an estimated $0.2 million favorable impact of currency
translation. This decrease was primarily driven by lower beginning of period
backlog as well as the timing of conversion of custom order backlog, partially
offset by growth in service and standard products.
The following is a comparison of fiscal year 2014 and fiscal year 2013 revenue for Test by geography:
|
|
|
|
|
|
|
|
|
|
|
|
|
|
|
|
Geography |
|
2014 |
|
2013 |
|
Variance |
|
% Variance |
|
||||
|
|
|
(expressed in millions) |
|
||||||||||
|
Americas |
|
$ |
144.6 |
|
$ |
138.3 |
|
$ |
6.3 |
|
|
4.6 |
% |
|
Europe |
|
|
126.9 |
|
|
131.2 |
|
|
(4.3 |
) |
|
-3.3 |
% |
|
Asia |
|
|
186.6 |
|
|
204.6 |
|
|
(18.0 |
) |
|
-8.8 |
% |
|
Total Revenue |
|
$ |
458.1 |
|
$ |
474.1 |
|
$ |
(16.0 |
) |
|
-3.4 |
% |
Gross
Profit
Gross profit was $165.4 million, a
decrease of $12.6 million, or 7.1%, compared to gross profit of $178.0 million
for fiscal year 2013. Gross profit as a percentage of revenue was 36.1%, a
decrease of 1.4 percentage points from 37.5% for fiscal year 2013. The
previously mentioned severance and related costs of $3.5 million unfavorably
impacted gross profit as a percentage of revenue by 0.8 percentage points.
Excluding these costs, the gross margin rate decreased by 0.6 percentage
points. The decreased gross profit rate was driven by decreased Test volume,
unfavorable product mix from a higher content of custom projects partially
offset by reductions in compensation and benefits from lower than expected
variable rate compensation and discretionary contributions related to an
employee retirement plan.
21
Selling and Marketing Expense
Selling and marketing expense was $68.4 million, an
increase of $5.0 million, or 7.9%, compared to $63.4 million for fiscal year
2013. The increase was driven by continued investment in sales expansion to
drive future revenue growth, higher sales commissions due to the increase in
orders, as well as the previously mentioned severance and related costs of $1.8
million in fiscal year 2014. The continued investment in sales expansion
primarily consists of higher compensation and benefits resulting from increased
headcount. Selling and marketing expense as a percentage of revenue was 14.9%,
compared to 13.4% for fiscal year 2013.
General and Administrative Expense
General and administrative expense was $40.0 million,
an increase of $3.7 million, or 10.2%, compared to $36.3 million for fiscal
year 2013. This increase was primarily driven by higher legal expenses, higher
compensation and benefits driven by increased headcount, as well as the
previously mentioned severance and related costs of $1.0 million in fiscal year
2014. These increases were partially offset by a lower level of investment in
productivity and infrastructure initiatives. General and administrative expense
as a percentage of revenue was 8.7%, compared to 7.7% for fiscal year 2013.
Research and Development Expense
Research and development expense was $17.1 million, a
decrease of $0.2 million, or 1.2%, compared to $17.3 million for fiscal year
2013. This decrease was primarily driven by the re-allocation of certain engineering
resources to work on backlog conversion. Research and development expense as a
percentage of revenue was 3.7% on lower volume, compared to 3.6% for fiscal
year 2013.
Income from Operations
Income from operations was $39.9 million, a decrease
of $21.1 million, or 34.6%, compared to income from operations of $61.0 million
for fiscal year 2013. Excluding the previously mentioned severance and related
costs of $6.3 million, income from operations decreased 24.3%, driven by
decreased gross profit as well as an $8.5 million increase in operating
expenses. Operating income as a percentage of revenue was 8.7%, compared to
12.9% for fiscal year 2013.
Sensors Segment
Orders and Backlog
The following is a comparison of fiscal year 2014 and fiscal year 2013 orders for Sensors, separately identifying the estimated impact of currency translation:
|
|
|
|
|
|
|
|
|
|
|
|
|
|
|
|
|
|
|
|
|
Estimated |
|
|
|
|
||||
|
|
|
2014 |
|
Business |
|
Currency |
|
2013 |
|
||||
|
|
|
(expressed in millions) |
|||||||||||
|
Orders |
|
$ |
108.4 |
|
$ |
11.2 |
|
$ |
(0.2 |
) |
$ |
97.4 |
|
Orders totaled $108.4 million, an increase of $11.0 million, or 11.3% compared to orders of $97.4 million for fiscal year 2013. The industrial and mobile hydraulic markets were up 9.0% and 26.0%, respectively, driven by strong demand in all geographic regions. Sensors accounted for 17.6% of total Company orders, compared to 17.2% for fiscal year 2013.
22
The following is a comparison of fiscal year 2014 and fiscal year 2013 orders for Sensors by geography:
|
|
|
|
|
|
|
|
|
|
|
|
|
|
|
|
Geography |
|
2014 |
|
2013 |
|
Variance |
|
% Variance |
|
||||
|
|
|
(expressed in millions) |
|||||||||||
|
Americas |
|
$ |
31.4 |
|
$ |
28.6 |
|
$ |
2.8 |
|
|
9.8 |
% |
|
Europe |
|
|
54.5 |
|
|
47.9 |
|
|
6.6 |
|
|
13.8 |
% |
|
Asia |
|
|
22.5 |
|
|
20.9 |
|
|
1.6 |
|
|
7.7 |
% |
|
Total Orders |
|
$ |
108.4 |
|
$ |
97.4 |
|
$ |
11.0 |
|
|
11.3 |
% |
Backlog of undelivered orders at September 27, 2014 was $16.5 million, an increase of 8.6% compared to backlog of $15.2 million at September 28, 2013.
Results of Operations
The following is a comparison of fiscal year 2014 and fiscal year 2013 results of operations for the Sensors segment, separately identifying the estimated impact of currency translation:
|
|
|
|
|
|
|
|
|
|
|
|
|
|
|
|
|
|
|
|
|
Estimated |
|
|
|
|
||||
|
|
|
2014 |
|
Business |
|
Currency |
|
2013 |
|
||||
|
|
|
(expressed in millions) |
|||||||||||
|
Revenue |
|
$ |
106.2 |
|
$ |
11.2 |
|
$ |
(0.3 |
) |
$ |
95.3 |
|
|
Cost of sales |
|
|
48.0 |
|
|
6.6 |
|
|
- |
|
|
41.4 |
|
|
Gross profit |
|
|
58.2 |
|
|
4.6 |
|
|
(0.3 |
) |
|
53.9 |
|
|
Gross margin |
|
|
56.6 |
% |
|
|
|
|
0.0 |
% |
|
56.6 |
% |
|
|
|
|
|
|
|
|
|
|
|
|
|
|
|
|
Operating expenses: |
|
|
|
|
|
|
|
|
|
|
|
|
|
|
Selling and marketing |
|
|
19.7 |
|
|
2.3 |
|
|
(0.2 |
) |
|
17.6 |
|
|
General administrative |
|
|
11.4 |
|
|
(0.4 |
) |
|
- |
|
|
11.8 |
|
|
Research and development |
|
|
6.7 |
|
|
1.1 |
|
|
0.1 |
|
|
5.5 |
|
|
Total operating expenses |
|
|
37.8 |
|
|
3.0 |
|
|
(0.1 |
) |
|
34.9 |
|
|
Income from operations |
|
$ |
20.4 |
|
$ |
1.6 |
|
$ |
(0.2 |
) |
$ |
19.0 |
|
Revenue
Revenue
was $106.2 million, an increase of $10.9 million, or 11.4%, compared to revenue
of $95.3 million for fiscal year 2013. The increase was primarily driven
by higher beginning of period backlog and increased order volume.
The following is a comparison of fiscal year 2014 and fiscal year 2013 revenue for the Sensors segment by geography:
|
|
|
|
|
|
|
|
|
|
|
|
|
|
|
|
Geography |
|
2014 |
|
2013 |
|
Variance |
|
% Variance |
|
||||
|
|
|
(expressed in millions) |
|
||||||||||
|
Americas |
|
$ |
31.5 |
|
$ |
27.3 |
|
$ |
4.2 |
|
|
15.4 |
% |
|
Europe |
|
|
52.2 |
|
|
47.4 |
|
|
4.8 |
|
|
10.1 |
% |
|
Asia |
|
|
22.5 |
|
|
20.6 |
|
|
1.9 |
|
|
9.2 |
% |
|
Total Revenue |
|
$ |
106.2 |
|
$ |
95.3 |
|
$ |
10.9 |
|
|
11.4 |
% |
23
Gross Profit
Gross profit was $58.2 million, an increase of $4.3 million, or 8.0%,
compared to gross profit of $53.9 million for fiscal year 2013. Gross profit as
a percentage of revenue was 56.6%, flat compared to fiscal year 2013.
Selling and Marketing Expense
Selling and marketing expense was $19.7 million, an
increase of $2.1 million, or 11.9%, compared to $17.6 million for fiscal year
2013. This increase was primarily due to higher compensation and benefits
driven by increased headcount to support future sales growth. Selling and
marketing expense as a percentage of revenue was 18.5%, flat compared to fiscal
year 2013.
General and Administrative Expense
General and administrative expense was $11.4 million,
a decrease of $0.4 million, or 3.4%, compared to $11.8 million for fiscal year
2013. This decrease was primarily driven by expenses recognized in fiscal year
2013 related to senior management transition. General and administrative
expense as a percentage of revenue was 10.7%, compared to 12.4% for fiscal year
2013.
Research and Development Expense
Research and development expense was $6.7 million, an
increase of $1.2 million, or 21.8%, compared to $5.5 million for fiscal year
2013. This increase was primarily driven by higher compensation and benefits
resulting from increased headcount. Research and development expense as a
percentage of revenue was 6.3%, compared to 5.8% for fiscal year 2013.
Income from Operations
Income from
operations was $20.4 million, an increase of $1.4 million, or 7.4%,
compared to income from operations of $19.0 million for fiscal year 2013. The
increase was driven by higher gross profit, partially offset by increased
operating expenses. Operating income as a percentage of revenue was 19.2% on
higher volume of sales, compared to 19.9% for fiscal year 2013.
Fiscal Year 2013 Compared to Fiscal Year 2012
Financial Results
Total Company
Orders and Backlog
The following is a comparison of fiscal year 2013 and fiscal year 2012 orders, separately identifying the estimated impact of currency translation:
|
|
|
|
|
|
|
|
|
|
|
|
|
|
|
|
|
|
|
|
|
Estimated |
|
|
|
|
||||
|
|
|
2013 |
|
Business |
|
Currency |
|
2012 |
|
||||
|
|
|
(expressed in millions) |
|||||||||||
|
Orders |
|
$ |
567.4 |
|
$ |
8.6 |
|
$ |
(6.5 |
) |
$ |
565.3 |
|
Orders totaled $567.4 million, an increase of $2.1 million, or 0.4%, including an estimated 1.1% unfavorable impact of currency translation, compared to orders of $565.3 million for fiscal year 2012. Fiscal year 2013 orders included three large (equal to or in excess of $5.0 million) European and two large Americas’ Test orders totaling approximately $22 million and $15 million, respectively. Fiscal year 2012 orders included two large Asian and two large European Test orders totaling approximately $32 million and $14 million, respectively. Excluding the large orders and currency, base orders increased 3.4%, reflecting 3.4% growth in Test, primarily in Europe and Asia, as well as 3.1% growth in Sensors, primarily in the Americas and Asia.
24
The following is a comparison of fiscal year 2013 and fiscal year 2012 orders by geography:
|
|
|
|
|
|
|
|
|
|
|
|
|
|
|
|
Geography |
|
2013 |
|
2012 |
|
Variance |
|
% Variance |
|
||||
|
|
|
(expressed in millions) |
|
||||||||||
|
Americas |
|
$ |
169.0 |
|
$ |
153.4 |
|
$ |
15.6 |
|
|
10.2 |
% |
|
Europe |
|
|
181.8 |
|
|
170.8 |
|
|
11.0 |
|
|
6.4 |
% |
|
Asia |
|
|
216.6 |
|
|
241.1 |
|
|
(24.5 |
) |
|
-10.2 |
% |
|
Total Orders |
|
$ |
567.4 |
|
$ |
565.3 |
|
$ |
2.1 |
|
|
0.4 |
% |
Backlog of undelivered orders at September 28, 2013 was $290.2 million, a decrease of $8.2 million, or 2.7%, compared to backlog of $298.4 million at September 29, 2012. We believe backlog is not an absolute indicator of future revenue because a portion of the orders in backlog could be cancelled at the customer’s discretion. While the backlog is subject to order cancellations, we have not historically experienced a significant number of order cancellations. During fiscal year 2013, one custom order in Test totaling approximately $2 million was cancelled. This order was booked in a previous fiscal year. The cancellation reflects a decision made by the customer to postpone the order until such time as the design phase of a testing system project has been completed. During fiscal year 2012, two custom orders in Test totaling approximately $9 million were cancelled. These orders were booked in a previous fiscal year and were associated with a Test product line that was sold during fiscal year 2012.
Results of Operations
The following is a comparison of fiscal year 2013 and fiscal year 2012 statements of operations (in millions, except per share data):
|
|
|
|
|
|
|
|
|
|
|
|
|
|
|
|
|
|
2013 |
|
2012 |
|
Variance |
|
% Variance |
|
||||
|
Revenue |
|
$ |
569.4 |
|
$ |
542.3 |
|
$ |
27.1 |
|
|
5.0 |
% |
|
Cost of sales |
|
|
337.5 |
|
|
306.1 |
|
|
31.4 |
|
|
10.3 |
% |
|
Gross profit |
|
|
231.9 |
|
|
236.2 |
|
|
(4.3 |
) |
|
-1.8 |
% |
|
Gross margin |
|
|
40.7 |
% |
|
43.6 |
% |
|
-2.9 |
% |
pts |
|
|
|
|
|
|
|
|
|
|
|
|
|
|
|
|
|
|
Operating expenses: |
|
|
|
|
|
|
|
|
|
|
|
|
|
|
Selling and marketing |
|
|
81.0 |
|
|
74.6 |
|
|
6.4 |
|
|
8.6 |
% |
|
General administrative |
|
|
48.1 |
|
|
51.4 |
|
|
(3.3 |
) |
|
-6.4 |
% |
|
Research and development |
|
|
22.8 |
|
|
21.9 |
|
|
0.9 |
|
|
4.1 |
% |
|
U.S. Government settlement |
|
|
- |
|
|
7.8 |
|
|
(7.8 |
) |
|
NM |
|
|
Total operating expenses |
|
|
151.9 |
|
|
155.7 |
|
|
(3.8 |
) |
|
-2.4 |
% |
|
Income from operations |
|
|
80.0 |
|
|
80.5 |
|
|
(0.5 |
) |
|
-0.6 |
% |
|
Interest expense, net |
|
|
(0.3 |
) |
|
(0.3 |
) |
|
- |
|
|
0.0 |
% |
|
Other (expense) income, net |
|
|
(0.4 |
) |
|
(0.4 |
) |
|
- |
|
|
NM |
|
|
|
|
|
|
|
|
|
|
|
|
|
|
|
|
|
Income before income taxes |
|
|
79.3 |
|
|
79.8 |
|
|
(0.5 |
) |
|
-0.6 |
% |
|
Provision for income taxes |
|
|
21.5 |
|
|
28.2 |
|
|
(6.7 |
) |
|
-23.8 |
% |
|
Net income |
|
$ |
57.8 |
|
$ |
51.6 |
|
$ |
6.2 |
|
|
12.0 |
% |
|
|
|
|
|
|
|
|
|
|
|
|
|
|
|
|
Diluted earnings per share |
|
$ |
3.64 |
|
$ |
3.21 |
|
$ |
0.43 |
|
|
13.4 |
% |
25
The following is a comparison of fiscal year 2013 and fiscal year 2012 results of operations, separately identifying the estimated impact of currency translation:
|
|
|
|
|
|
|
|
|
|
|
|
|
|
|
|
|
|
|
|
|
Estimated |
|
|
|
|
||||
|
|
|
2013 |
|
Business |
|
Currency |
|
2012 |
|
||||
|
|
|
(expressed in millions) |
|||||||||||
|
Revenue |
|
$ |
569.4 |
|
$ |
35.2 |
|
$ |
(8.1 |
) |
$ |
542.3 |
|
|
Cost of sales |
|
|
337.5 |
|
|
37.1 |
|
|
(5.7 |
) |
|
306.1 |
|
|
Gross profit |
|
|
231.9 |
|
|
(1.9 |
) |
|
(2.4 |
) |
|
236.2 |
|
|
Gross margin |
|
|
40.7 |
% |
|
|
|
|
0.0 |
% |
|
43.6 |
% |
|
|
|
|
|
|
|
|
|
|
|
|
|
|
|
|
Operating expenses: |
|
|
|
|
|
|
|
|
|
|
|
|
|
|
Selling and marketing |
|
|
81.0 |
|
|
7.4 |
|
|
(1.0 |
) |
|
74.6 |
|
|
General administrative |
|
|
48.1 |
|
|
(3.2 |
) |
|
(0.1 |
) |
|
51.4 |
|
|
Research and development |
|
|
22.8 |
|
|
0.9 |
|
|
- |
|
|
21.9 |
|
|
U.S. Government settlement |
|
|
- |
|
|
(7.8 |
) |
|
- |
|
|
7.8 |
|
|
Total operating expenses |
|
|
151.9 |
|
|
(2.7 |
) |
|
(1.1 |
) |
|
155.7 |
|
|
Income from operations |
|
$ |
80.0 |
|
$ |
0.8 |
|
$ |
(1.3 |
) |
$ |
80.5 |
|
Revenue
Revenue
was $569.4 million, an increase of $27.1 million, or 5.0%, compared to revenue
of $542.3 million for fiscal year 2012. This increase was driven by higher
beginning backlog as well as a higher rate of backlog conversion into revenue
in Test, partially offset by lower volume in Sensors, as well as an estimated
$8.1 million unfavorable impact of currency translation. Test revenue increased
7.3% to $474.1 million, while Sensors revenue decreased 5.0% to $95.3 million.
The following is a comparison of fiscal year 2013 and fiscal year 2012 revenue by geography:
|
|
|
|
|
|
|
|
|
|
|
|
|
|
|
|
Geography |
|
2013 |
|
2012 |
|
Variance |
|
% Variance |
|
||||
|
|
|
(expressed in millions) |
|
||||||||||
|
Americas |
|
$ |
165.6 |
|
$ |
169.5 |
|
$ |
(3.9 |
) |
|
-2.3 |
% |
|
Europe |
|
|
178.6 |
|
|
167.8 |
|
|
10.8 |
|
|
6.4 |
% |
|
Asia |
|
|
225.2 |
|
|
205.0 |
|
|
20.2 |
|
|
9.9 |
% |
|
Total Revenue |
|
$ |
569.4 |
|
$ |
542.3 |
|
$ |
27.1 |
|
|
5.0 |
% |
Although selective product price changes were implemented during each of these fiscal years, the overall impact of pricing changes did not have a material effect on revenue.
Gross profit
Gross profit was $231.9 million, a decrease of $4.3 million, or 1.8%,
compared to gross profit of $236.2 million for fiscal year 2012. Gross profit
as a percentage of revenue was 40.7%, a decrease of 2.9 percentage points from
43.6% for fiscal year 2012. This decrease reflects an unfavorable mix,
primarily resulting from a higher proportion of lower-margin custom development
products in Test. The gross profit rate was also negatively impacted by approximately
1 percentage point from continued investment in productivity and infrastructure
initiatives in Test, and 1 percentage point from lower engineering labor
utilization and higher warranty expense in Test. The productivity and
infrastructure initiatives that impact gross profit are focused on the building of a
scalable enterprise and include investments in our operating system and service
delivery system. These investments continued into fiscal year 2014.
26
Selling and Marketing Expense
Selling and marketing expense was $81.0 million, an
increase of $6.4 million, or 8.6%, compared to $74.6 million for fiscal year
2012. This increase was primarily due to higher travel and other discretionary
expenses to support current sales efforts, as well as higher compensation and
benefits resulting from increased headcount, partially offset by an estimated
$1.0 million favorable impact of currency translation. Selling and marketing
expense as a percentage of revenue was 14.2%, compared to 13.8% for fiscal year
2012.
General and Administrative Expense
General and administrative expense was $48.1 million,
a decrease of $3.3 million, or 6.4%, compared to $51.4 million for fiscal year
2012. This decrease was primarily driven by a lower level of investment in
strategic and compliance initiatives, as well as expenses recognized in fiscal
year 2012 related to a CEO transition, partially offset by higher compensation
and benefits driven by increased headcount, as well as expenses associated with
a senior management transition in Sensors. General and administrative expense
as a percentage of revenue was 8.4%, compared to 9.5% for fiscal year 2012.
Research and Development Expense
Research and development expense was $22.8 million, an
increase of $0.9 million, or 4.1%, compared to $21.9 million for fiscal year
2012. This increase was primarily driven by timing of planned expenditures in
Test and higher compensation and benefits in Sensors resulting from increased
headcount. In addition, we allocated certain of our resources to capitalized
software development activities during fiscal year 2012. Total software
development costs capitalized during fiscal year 2012 were $0.5 million. No
software development costs were capitalized during fiscal year 2013. Research
and development expense as a percentage of revenue was 4.0% on higher volume,
flat compared to fiscal year 2012.
U.S. Government Settlement Expense
As previously disclosed in the fourth quarter of
fiscal year 2012, we reached an agreement with the U.S. Department of Commerce
(“DOC”) and the U.S. Attorney’s Office for the District of Minnesota (“USAO”),
settling for $7.8 million the DOC and USAO’s investigation into our past
disclosures on our government certifications and our government contracting
compliance policies, general compliance record and practices in areas including
export controls and government contracts. During fiscal year 2012, we accrued a
loss contingency equal to the settlement amount. U.S. Government settlement
expense as a percentage of revenue was 1.4% for fiscal year 2012.
For a more detailed discussion of the investigation by the DOC and USAO and the settlement agreement, please refer to Note 11 of the Notes to Consolidated Financial Statements under Item 8 of this Annual Report on Form 10-K.
Income from
Operations
Income from
operations was $80.0 million, a decrease of $0.5 million, or 0.6%,
compared to income from operations of $80.5 million for fiscal year 2012.
Operating income for fiscal year 2012 included the previously mentioned $7.8
million of costs related to the U.S. Government matter. Excluding these costs,
income from operations decreased $8.3 million, driven by lower gross profit and
$4.1 million higher operating expenses. Operating income as a percentage of
revenue was 14.0%, compared to 14.8% for fiscal year 2012.
Historically, our operating costs have been impacted by a level of inflation ranging from -1% to 4%. We use a number of strategies to mitigate the effects of cost inflation including cost productivity initiatives such as global procurement strategies, as well as price increases. However, if our operating costs were to become subject to significant inflationary pressures, we may not be able to fully offset such higher costs.
Interest Expense, net
Interest expense, net was $0.3 million, flat compared to fiscal year 2012.
Interest expense declined $0.3 million due to lower interest rates incurred on
short-term borrowings as well as a relatively lower level of outstanding
borrowings during fiscal year 2013. Interest income decreased $0.3 million
primarily due to lower average cash balances maintained in interest-bearing
accounts during fiscal year 2013.
27
Other
Expense, net
Other expense, net was $0.4 million of net other expense, flat
compared to fiscal year 2012.
Provision
for Income Taxes
Provision for income taxes totaled $21.5 million, a decrease of $6.7 million,
compared to $28.2 million for fiscal year 2012. This decrease was primarily due
to a lower effective tax rate. The effective tax rate for the fiscal year was 27.1%, a decrease of 8.3 percentage points
compared to 35.4% for fiscal year 2012. During fiscal year 2013, the tax
rate was favorably impacted by approximately 3.7 percentage points due to new
favorable guidance and legislation related to the U.S. R&D tax credit. Also,
the effective tax rate for fiscal year
2012 was unfavorably impacted by approximately 3.6 percentage points due to the
recognition of the previously mentioned $7.8 million of costs related to
the U.S. Government settlement which were nondeductible for income tax purposes.
Net
Income
Net
income was $57.8 million, an increase of $6.2 million, compared to $51.6
million for fiscal year 2012. The increase was primarily driven by a lower
effective tax rate, partially offset by lower income from operations. Earnings
per diluted share increased $0.43 to $3.64, compared to $3.21 for fiscal year
2012. Earnings per share for fiscal year 2012 included a $0.48 per diluted
share negative impact from the previously mentioned settlement costs related to
the U.S. Government matters. Additionally, the decrease in shares outstanding
positively impacted earnings per diluted share by $0.04.
Segment Results
Test Segment
Orders and Backlog
The following is a comparison of fiscal year 2013 and fiscal year 2012 orders for Test, separately identifying the estimated impact of currency translation:
|
|
|
|
|
|
|
|
|
|
|
|
|
|
|
|
|
|
|
|
|
Estimated |
|
|
|
|
||||
|
|
|
2013 |
|
Business |
|
Currency |
|
2012 |
|
||||
|
|
|
(expressed in millions) |
|
||||||||||
|
Orders |
|
$ |
470.0 |
|
$ |
5.5 |
|
$ |
(3.5 |
) |
$ |
468.0 |
|
Orders totaled $470.0 million, an increase of $2.0 million, or 0.4%, including an estimated 0.7% unfavorable impact of currency translation, compared to orders of $468.0 million for fiscal year 2012. Fiscal year 2013 orders included three large European orders in the ground vehicles market totaling approximately $22 million, one of which was for a rolling road wind tunnel measurement system, one was for a transmission test system and the other was for a tire testing system. In addition, fiscal year 2013 orders included two large Americas’ orders totaling approximately $15 million, one of which was for a vehicle motion simulator in the structures market and the other for an aerodynamic test system in the ground vehicles market. Fiscal year 2012 orders included two large Asian orders in the structures market totaling approximately $32 million. In addition, fiscal year 2012 orders included two large European orders totaling approximately $14 million, one of which was in the ground vehicles market and the other was in the structures market. Excluding the large orders and currency, base orders increased 3.4%, driven by strong ground vehicles orders in Asia and Europe. Test accounted for 82.8% of our total orders, flat compared to fiscal year 2012.
28
The following is a comparison of fiscal year 2013 and fiscal year 2012 orders for Test by geography:
|
|
|
|
|
|
|
|
|
|
|
|
|
|
|
|
Geography |
|
2013 |
|
2012 |
|
Variance |
|
% Variance |
|
||||
|
|
|
(expressed in millions) |
|
||||||||||
|
Americas |
|
$ |
140.4 |
|
$ |
127.4 |
|
$ |
13.0 |
|
|
10.2 |
% |
|
Europe |
|
|
133.9 |
|
|
121.9 |
|
|
12.0 |
|
|
9.8 |
% |
|
Asia |
|
|
195.7 |
|
|
218.7 |
|
|
(23.0 |
) |
|
-10.5 |
% |
|
Total Orders |
|
$ |
470.0 |
|
$ |
468.0 |
|
$ |
2.0 |
|
|
0.4 |
% |
Backlog of undelivered orders at September 28, 2013 was $275.0 million, a decrease of 3.6% from backlog of $285.3 million at September 29, 2012. As previously mentioned, backlog at the end of fiscal year 2013 was negatively impacted by the cancellation of one custom order totaling approximately $2 million. Also, as previously mentioned, backlog at the end of fiscal year 2012 was negatively impacted by the cancellation of two custom orders totaling approximately $9 million.
Results of Operations
The following is a comparison of fiscal year 2013 and fiscal year 2012 results of operations for Test separately identifying the estimated impact of currency translation:
|
|
|
|
|
|
|
|
|
|
|
|
|
|
|
|
|
|
|
|
|
Estimated |
|
|
|
|
||||
|
|
|
2013 |
|
Business |
|
Currency |
|
2012 |
|
||||
|
|
|
(expressed in millions) |
|
||||||||||
|
Revenue |
|
$ |
474.1 |
|
$ |
37.4 |
|
$ |
(5.3 |
) |
$ |
442.0 |
|
|
Cost of sales |
|
|
296.1 |
|
|
38.6 |
|
|
(4.6 |
) |
|
262.1 |
|
|
Gross profit |
|
|
178.0 |
|
|
(1.2 |
) |
|
(0.7 |
) |
|
179.9 |
|
|
Gross margin |
|
|
37.5 |
% |
|
|
|
|
0.0 |
% |
|
40.7 |
% |
|
|
|
|
|
|
|
|
|
|
|
|
|
|
|
|
Operating expenses: |
|
|
|
|
|
|
|
|
|
|
|
|
|
|
Selling and marketing |
|
|
63.4 |
|
|
4.2 |
|
|
(0.4 |
) |
|
59.6 |
|
|
General administrative |
|
|
36.3 |
|
|
(3.0 |
) |
|
0.2 |
|
|
39.1 |
|
|
Research and development |
|
|
17.3 |
|
|
0.5 |
|
|
- |
|
|
16.8 |
|
|
U.S. Government settlement |
|
|
- |
|
|
(6.1 |
) |
|
- |
|
|
6.1 |
|
|
Total operating expenses |
|
|
117.0 |
|
|
(4.4 |
) |
|
(0.2 |
) |
|
121.6 |
|
|
Income from operations |
|
$ |
61.0 |
|
$ |
3.2 |
|
$ |
(0.5 |
) |
$ |
58.3 |
|
Revenue
Revenue was $474.1 million, an increase of $32.1
million, or 7.3%, compared to revenue of $442.0 million for fiscal year 2012.
The increase was primarily driven by a higher beginning backlog and a higher
rate of backlog conversion into revenue, partially offset by an estimated $5.3
million unfavorable impact of currency translation. The backlog conversion rate
benefited from the implementation of operational process improvements.
29
The following is a comparison of fiscal year 2013 and fiscal year 2012 revenue for Test by geography:
|
|
|
|
|
|
|
|
|
|
|
|
|
|
|
|
Geography |
|
2013 |
|
2012 |
|
Variance |
|
% Variance |
|
||||
|
|
|
(expressed in millions) |
|
||||||||||
|
Americas |
|
$ |
138.3 |
|
$ |
141.0 |
|
$ |
(2.7 |
) |
|
-1.9 |
% |
|
Europe |
|
|
131.2 |
|
|
119.1 |
|
|
12.1 |
|
|
10.2 |
% |
|
Asia |
|
|
204.6 |
|
|
181.9 |
|
|
22.7 |
|
|
12.5 |
% |
|
Total Revenue |
|
$ |
474.1 |
|
$ |
442.0 |
|
$ |
32.1 |
|
|
7.3 |
% |
Gross Profit
Gross profit was $178.0 million, a decrease of $1.9 million,
or 1.1%, compared to gross profit of $179.9 million for fiscal year 2012. Gross
profit as a percentage of revenue was 37.5%, a decrease of 3.2 percentage
points from 40.7% for fiscal year 2012. Of the reduced gross profit rate, approximately
2 percentage points resulted from an unfavorable mix of lower-margin products
and services, 1 percentage point resulted from increased warranty expense, and
1 percentage point resulted from continued investment in productivity and
infrastructure initiatives. These decreases were partially offset by increased
leverage on higher volume. As previously mentioned, the productivity and
infrastructure initiatives that impact gross profit are focused on the building
of a scalable enterprise and include investments in our operating system and
service delivery system. These investments continued into fiscal year 2014.
Selling and Marketing Expense
Selling and marketing
expense was $63.4 million, an increase of $3.8 million, or 6.4%, compared to
$59.6 million for fiscal year 2012. This increase was primarily driven by
higher compensation and benefits resulting from increased headcount, as well as
increased travel and other discretionary expenses to support selling efforts,
partially offset by reduced bad debt expense. Selling and marketing expense as
a percentage of revenue was 13.4% on higher volume, compared to 13.5% for
fiscal year 2012.
General and Administrative Expense
General and
administrative expense was $36.3 million, a decrease of $2.8 million, or 7.2%,
compared to $39.1 million for fiscal year 2012. This decrease was primarily
driven by a lower level of investment in strategic and compliance initiatives,
as well as expenses recognized in fiscal year 2012 related to a CEO transition,
partially offset by higher compensation and benefits resulting from increased
headcount. General and administrative expense as a percentage of revenue was
7.7%, compared to 8.8% for fiscal year 2012.
Research and Development Expense
Research and
development expense was $17.3 million, an increase of $0.5 million, or 3.0%,
compared to $16.8 million for fiscal year 2012. As previously mentioned, $0.5
million of costs associated with software development activities were
capitalized in fiscal year 2012. No software development costs were capitalized
during fiscal year 2013. Research and development expense as a percentage of
revenue was 3.6% on higher volume, compared to 3.8% for fiscal year 2012.
U.S. Government Settlement Expense
U.S. Government
settlement expense in fiscal year 2012 includes $6.1 million of the $7.8
million costs related to the previously mentioned U.S. Government matter that
was settled during fiscal year 2012. U.S. Government settlement expense as a
percentage of revenue was 1.4% for fiscal year 2012.
Income from Operations
Income from
operations was $61.0 million, an increase of $2.7 million, or 4.6%, compared to
income from operations of $58.3 million for fiscal year 2012. Operating income
for fiscal year 2012 included the previously mentioned $6.1 million of costs
related to the U.S. Government matter. Excluding these costs, income from operations decreased $3.4 million, driven by
lower gross profit and $1.5 million higher operating expenses. Operating income
as a percentage of revenue was 12.9% on higher volume, compared to 13.2% for
fiscal year 2012.
30
Sensors Segment
Orders and Backlog
The following is a comparison of fiscal year 2013 and fiscal year 2012 orders for Sensors, separately identifying the estimated impact of currency translation:
|
|
|
|
|
|
|
|
|
|
|
|
|
|
|
|
|
|
|
|
|
Estimated |
|
|
|
|
||||
|
|
|
2013 |
|
Business |
|
Currency |
|
2012 |
|
||||
|
|
|
(expressed in millions) |
|
||||||||||
|
Orders |
|
$ |
97.4 |
|
$ |
3.1 |
|
$ |
(3.0 |
) |
$ |
97.3 |
|
Orders totaled $97.4 million, flat compared to orders of $97.3 million for fiscal year 2012, including an estimated 3.1% unfavorable impact of currency translation. Excluding currency, orders increased 3.2%, driven by stronger demand in the global industrial markets. Sensors accounted for 17.2% of our total orders, flat compared to fiscal year 2012.
The following is a comparison of fiscal year 2013 and fiscal year 2012 orders for Sensors by geography:
|
|
|
|
|
|
|
|
|
|
|
|
|
|
|
|
Geography |
|
2013 |
|
2012 |
|
Variance |
|
% Variance |
|
||||
|
|
|
(expressed in millions) |
|
||||||||||
|
Americas |
|
$ |
28.6 |
|
$ |
26.0 |
|
$ |
2.6 |
|
|
10.0 |
% |
|
Europe |
|
|
47.9 |
|
|
48.9 |
|
|
(1.0 |
) |
|
-2.0 |
% |
|
Asia |
|
|
20.9 |
|
|
22.4 |
|
|
(1.5 |
) |
|
-6.7 |
% |
|
Total Orders |
|
$ |
97.4 |
|
$ |
97.3 |
|
$ |
0.1 |
|
|
0.1 |
% |
Backlog of undelivered orders at September 28, 2013 was $15.2 million, an increase of 16.0% from backlog of $13.1 million at September 29, 2012.
31
Results of Operations
The following is a comparison of fiscal year 2013 and fiscal year 2012 results of operations for the Sensors segment, separately identifying the estimated impact of currency translation:
|
|
|
|
|
|
|
|
|
|
|
|
|
|
|
|
|
|
|
|
|
Estimated |
|
|
|
|
||||
|
|
|
2013 |
|
Business |
|
Currency |
|
2012 |
|
||||
|
|
|
(expressed in millions) |
|
||||||||||
|
Revenue |
|
$ |
95.3 |
|
$ |
(2.2 |
) |
$ |
(2.8 |
) |
$ |
100.3 |
|
|
Cost of sales |
|
|
41.4 |
|
|
(1.5 |
) |
|
(1.1 |
) |
|
44.0 |
|
|
Gross profit |
|
|
53.9 |
|
|
(0.7 |
) |
|
(1.7 |
) |
|
56.3 |
|
|
Gross margin |
|
|
56.6 |
% |
|
|
|
|
|
|
|
56.2 |
% |
|
|
|
|
|
|
|
|
|
|
|
|
|
|
|
|
Operating expenses: |
|
|
|
|
|
|
|
|
|
|
|
|
|
|
Selling and marketing |
|
|
17.6 |
|
|
3.2 |
|
|
(0.6 |
) |
|
15.0 |
|
|
General administrative |
|
|
11.8 |
|
|
(0.2 |
) |
|
(0.3 |
) |
|
12.3 |
|
|
Research and development |
|
|
5.5 |
|
|
0.4 |
|
|
- |
|
|
5.1 |
|
|
U.S. Government settlement |
|
|
- |
|
|
(1.7 |
) |
|
- |
|
|
1.7 |
|
|
Total operating expenses |
|
|
34.9 |
|
|
1.7 |
|
|
(0.9 |
) |
|
34.1 |
|
|
Income from operations |
|
$ |
19.0 |
|
$ |
(2.4 |
) |
$ |
(0.8 |
) |
$ |
22.2 |
|
Revenue
Revenue was $95.3 million, a decrease of $5.0
million, or 5.0%, compared to revenue of $100.3 million for the fiscal year
2012. This decrease was primarily driven by lower beginning backlog of 21.6%
and an estimated $2.8 million unfavorable impact of currency translation.
The following is a comparison of fiscal year 2013 and fiscal year 2012 revenue for the Sensors segment by geography:
|
|
|
|
|
|
|
|
|
|
|
|
|
|
|
|
Geography |
|
2013 |
|
2012 |
|
Variance |
|
% Variance |
|
||||
|
|
|
(expressed in millions) |
|
||||||||||
|
Americas |
|
$ |
27.3 |
|
$ |
28.5 |
|
$ |
(1.2 |
) |
|
-4.2 |
% |
|
Europe |
|
|
47.4 |
|
|
48.7 |
|
|
(1.3 |
) |
|
-2.7 |
% |
|
Asia |
|
|
20.6 |
|
|
23.1 |
|
|
(2.5 |
) |
|
-10.8 |
% |
|
Total Revenue |
|
$ |
95.3 |
|
$ |
100.3 |
|
$ |
(5.0 |
) |
|
-5.0 |
% |
Gross Profit
Gross profit was
$53.9 million, a decrease of $2.4 million, or 4.3%, compared to gross profit of
$56.3 million for fiscal year 2012. Gross profit as a percentage of revenue was
56.6%, an increase of 0.4 percentage points from 56.2% for fiscal year 2012.
Selling and Marketing Expense
Selling and
marketing expense was $17.6 million, an increase of $2.6 million, or 17.3%,
compared to $15.0 million for fiscal year 2012. The increase was primarily due
to higher compensation and benefits driven by increased headcount to support
future sales growth, as well as increased discretionary expenses to support current sales efforts, partially offset by
an estimated $0.6 million favorable impact of currency translation. Selling and
marketing expense as a percentage of revenue was 18.5%, compared to 15.0% for
fiscal year 2012.
32
General and Administrative Expense
General and administrative expense was $11.8 million, a decrease of $0.5
million, or 4.1%, compared to $12.3 million for fiscal year 2012, as a
relatively lower level of investment in strategic and compliance initiatives,
as well as a favorable impact of currency translation was partially offset by
higher compensation and benefits driven by increased headcount, as well as
expenses associated with a senior management transition. General and
administrative expense as a percentage of revenue was 12.4%, compared to 12.3%
for fiscal year 2012.
Research and Development Expense
Research and
development expense was $5.5 million, an increase of $0.4 million, or 7.8%,
compared to $5.1 million for fiscal year 2012, due to a higher level of planned
expenditures. Research and development expense as a percentage of revenue was
5.8%, compared to 5.1% for fiscal year 2012.
U.S. Government Settlement Expense
U.S. Government
settlement expense in fiscal year 2012 includes $1.7 million of the $7.8
million costs related to the previously mentioned U.S. Government matter that
was settled during fiscal year 2012. U.S. Government settlement expense as a
percentage of revenue was 1.7% for fiscal year 2012.
Income from Operations
Income from operations was
$19.0 million, a decrease of $3.2 million, or 14.4%, compared to income from
operations of $22.2 million for fiscal year 2012. Operating income for fiscal
year 2012 included the previously mentioned $1.7 million of costs related to
the U.S. Government matter. Excluding these costs, income from operations
decreased $4.9 million, driven by lower gross profit and $2.5 million higher
operating expenses. Operating income as a percentage of revenue was 19.9%,
compared to 22.1% for fiscal year 2012.
Cash Flow Comparison - Fiscal Years 2014, 2013 and 2012
Total cash and cash equivalents increased $12.1 million during fiscal year 2014. This increase was driven by earnings of $61.9 million, $25.0 million in proceeds received from borrowings on the credit facility and $7.6 million of proceeds from the exercise of stock options and stock purchases under our employee stock purchase plan. These increases were partially offset by purchases of our common stock of $31.0 million, investment in property and equipment of $20.0 million, dividend payments of $18.3 million, $14.2 million in cash payments associated with the acquisition of REI and $7.5 million for increased working capital requirements.
Total cash and cash equivalents decreased $31.5 million during fiscal year 2013. This decrease was driven by $77.9 million for increased working capital requirements, investment in property and equipment of $29.7 million, purchases of our common stock of $24.8 million, and dividend payments of $19.1 million. These decreases were partially offset by earnings of $76.4 million, $35.0 million in proceeds received from borrowings on the credit facility and $8.6 million of proceeds from the exercise of stock options.
Total cash and cash equivalents decreased $24.2 million during fiscal year 2012. This decrease was driven by the repayment of interest-bearing debt of $40.0 million, purchases of our common stock of $35.3 million, dividend payments of $15.9 million, and investment in property and equipment of $15.6 million. These decreases were partially offset by earnings of $69.1 million and $17.9 million of proceeds from the exercise of stock options.
Cash flow from operating activities provided cash totaling $64.7 million during fiscal year 2014, compared to cash use of $2.1 million in fiscal year 2013 and cash provided of $65.0 million in fiscal year 2012. Fiscal year 2014 cash flow from operating activities was primarily driven by earnings of $42.0 million.
Fiscal year 2013 cash flow from operating activities was primarily driven by $43.2 million increased accounts and unbilled receivables resulting from higher volume as well as the general timing of billing and collections, $21.1 million decreased advance payments received from customers driven by timing of customer orders and relatively unfavorable customer payment terms, $9.6 million increased inventories to support future revenue, and $4.0 million decreased accounts payable resulting from general timing of purchases and payments. These decreases were partially offset by earnings of $76.4 million.
33
Fiscal year 2012 cash flow from operating activities was primarily driven by earnings.
Cash flow from investing activities required the use of cash totaling $34.2 million during fiscal year 2014, compared to the use of cash totaling $29.7 million and $15.6 million during fiscal year 2013 and 2012, respectively. The cash usage for fiscal year 2014 was due to $14.2 million in payments associated with the acquisition of REI and a $20.0 million investment in property and equipment. The cash usage for fiscal years 2013 and 2012 represents investment in property and equipment.
Cash flow from financing activities used cash totaling $15.9 million during fiscal year 2014, compared to cash provided of $1.3 million in fiscal year 2013 and the use of cash totaling $72.5 million in fiscal year 2012. The cash usage for fiscal year 2014 was primarily due to use of $31.0 million to purchase approximately 450,000 shares of our common stock, including purchases of stock related to stock-based compensation arrangements of $0.4 million and cash dividend payments totaling $18.3 million, partially offset by $24.6 million in proceeds from short-term borrowings and $7.6 million received from stock option exercises and stock purchases under our employee stock purchase plan.
The cash provided for fiscal year 2013 was primarily due to $35.0 million of borrowings on our credit facility and $8.6 million received from stock option exercises and stock purchases under our employee stock purchase plan, partially offset by purchases of our common stock in an amount of $24.8 million, including purchases of stock related to stock-based compensation arrangements of $0.5 million, and payment of cash dividends of $19.1 million.
During fiscal year 2012, our cash usage primarily resulted from a $40.0 million repayment of all outstanding borrowings on our credit facility, purchases of our common stock of $35.3 million, including purchases of stock related to stock-based compensation arrangements of $0.3 million, and payment of cash dividends of $15.9 million. These cash usages were partially offset by $17.9 million received from stock option exercises and stock purchases under our employee stock purchase plan.
Liquidity
and Capital Resources
We had cash and cash equivalents of $60.4 million at September 27, 2014.
Of this amount, approximately $20.3 million was located in North America, $22.0
million in Europe, and $18.1 million in Asia. Of the $42.9 million of cash
located outside of the U.S., approximately $22.6 million is not available for
use in the U.S. without the incurrence of U.S. federal and state income tax
consequences.
The North American balance was primarily invested in bank deposits. In Europe and Asia, the balances were primarily invested in money market funds and bank deposits. In accordance with our investment policy, we place cash equivalent investments with issuers who have high-quality investment credit ratings. In addition, we limit the amount of investment exposure we have with any particular issuer. Our investment objectives are to preserve principal, maintain liquidity, and achieve the best available return consistent with our primary objectives of safety and liquidity. At September 27, 2014, we held no short-term investments.
At September 27, 2014, our capital structure was comprised of $60.0 million in short-term debt and $258.1 million in Shareholders’ Investment. Total interest-bearing debt at September 27, 2014 was $60.0 million. The borrowings on the credit facility include, at our discretion, optional month-to-month term renewals and loan repricing until September 2019. Under the terms of the credit facility, we have agreed to certain financial covenants, including, among other covenants, the ratio of consolidated total indebtedness to consolidated earnings before interest, taxes, depreciation, and amortization (“EBITDA”), and the ratio of consolidated EBITDA to consolidated interest expense. These covenants may restrict our ability to pay dividends and purchase outstanding shares of our common stock. At September 27, 2014, we were in compliance with these financial covenants.
Shareholders’ Investment increased by $29.8 million during fiscal year 2014, primarily due to higher net income of $42.0 million and $7.6 million received from stock option exercises and stock purchases under our employee stock purchase plan, partially offset by $31.0 million in purchases of our common stock and $18.3 million in dividends declared and paid.
34
We believe that our liquidity, represented by funds available from cash, cash equivalents, credit facility, and anticipated cash from operations are adequate to fund ongoing operations for the short-term and long-term internal growth opportunities, capital expenditures, dividends and share purchases, as well as to fund strategic acquisitions.
At September 27, 2014, our contractual obligations were as follows:
|
|
|
|
|
|
|
|
|
|
|
|
|
|
|
|
|
|
|
|
|
|
|
|
|
|
|
|
|
|
|
|
|
Payments Due by Period |
||||||||||||||
|
|
Contractual Obligations(1) |
|
|
Total |
|
|
Less than 1 |
|
|
1 - 3 years |
|
|
3 - 5 years |
|
|
More than 5 |
|
|||||
|
|
Operating Lease Obligations |
|
|
$ |
10,474 |
|
|
$ |
4,208 |
|
|
$ |
4,253 |
|
|
$ |
1,106 |
|
|
$ |
907 |
|
|
|
Other Long-Term Obligations(2) |
|
|
|
14,740 |
|
|
|
2,185 |
|
|
|
2,893 |
|
|
|
2,592 |
|
|
|
7,070 |
|
|
|
Total |
|
|
$ |
25,214 |
|
|
$ |
6,393 |
|
|
$ |
7,146 |
|
|
$ |
3,698 |
|
|
$ |
7,977 |
|
|
|
|
|
|
|
(1) |
Long-term income tax liabilities for uncertain tax positions have been excluded from the contractual obligations table as we are not able to make a reasonably reliable estimate of the amount and period of related future payments. At September 27, 2014, our long-term liability for uncertain tax positions was $6.0 million. |
|
|
|
|
|
|
(2) |
Other long-term obligations include liabilities under pension and other retirement plans as well as $0.7 million for the REI contingent consideration earn-out. Refer to footnote 11 regarding this estimated contingent consideration. |
At September 27, 2014, we had letters of credit and guarantees outstanding totaling $21.2 million and $24.7 million, respectively, primarily to bond advance payments and performance guarantees related to customer contracts in Test. Our operating leases are primarily for office space and automobiles.
Off-Balance Sheet Arrangements
At the end of fiscal year 2014, we did not have any
off-balance sheet arrangements, as such term is defined in rules promulgated by
the SEC, that have or are reasonably likely to have a current or future effect
on our financial condition, changes in financial condition, revenues or
expenses, results of operations, liquidity, capital expenditures or capital
resources that are material to investors.
Critical Accounting Policies
The Consolidated Financial Statements are prepared in accordance with
GAAP, which require us to make estimates and assumptions in certain
circumstances that affect amounts reported. In preparing these financial
statements, we have made our best estimates and judgments of certain amounts,
giving due consideration to materiality. We believe that of our significant
accounting policies, the following are particularly important to the portrayal
of the Company’s results of operations and financial position, may require the
application of a higher level of judgment by us, and as a result, are subject
to an inherent degree of uncertainty. For further information see “Summary of Significant
Accounting Policies” under Note 1 to the Consolidated Financial Statements,
included in Item 8 of this Annual Report on Form 10-K.
Revenue Recognition: We are required to comply with a variety of technical accounting requirements in order to achieve consistent and accurate revenue recognition. The most significant area of judgment and estimation is percentage of completion contract accounting. We develop cost estimates that include materials, component parts, labor and overhead costs. Detailed costs plans are developed for all aspects of the contracts during the bidding phase of the contract. Cost estimates are largely based on actual historical performance of similar projects combined with current knowledge of the projects in progress. Significant factors that impact the cost estimates include technical risk, inflationary cost of materials and labor, changes in scope and schedule, and internal and subcontractor performance. Actual costs incurred during the project phase are monitored and compared to the estimates on a monthly basis. Cost estimates are revised based on changes in circumstances. Anticipated losses on long-term contracts are recognized when such losses become evident.
35
Inventories: We maintain a material amount of inventory to support our engineering and manufacturing operations. This inventory is stated at the lower of cost or market. On a regular basis, we review our inventory and identify that which is excess, slow moving, and obsolete by considering factors such as inventory levels, expected product life, and forecasted sales demand. Any identified excess, slow moving, and obsolete inventory is written down to its market value through a charge to income from operations. It is possible that additional inventory write-down charges may be required in the future if there is a significant decline in demand for our products and we do not adjust our manufacturing production accordingly.
Impairment of Long-Lived Assets: We review the carrying value of long-lived assets or asset groups, such as property and equipment and intangibles subject to amortization, when events or changes in circumstances such as asset utilization, physical change, legal factors, or other matters indicate that the carrying value may not be recoverable. When this review indicates the carrying value of an asset or asset group exceeds the sum of the undiscounted cash flows expected to result from the use and eventual disposition of the asset or asset group, we recognize an asset impairment charge against operations. The amount of the impairment loss recorded is the amount by which the carrying value of the impaired asset or asset group exceeds its fair value.
Goodwill: We test goodwill at least annually for impairment. Goodwill is also tested for impairment as changes in circumstances occur indicating that the carrying value may not be recoverable. Goodwill impairment testing first requires a comparison of the fair value of each reporting unit to the carrying value. If the carrying value of the reporting unit exceeds fair value, goodwill is considered impaired.
As of September 27, 2014, the Company has three reporting units, all of which are assigned goodwill. At September 27, 2014, the Test reporting unit was assigned $15.0 million of goodwill which includes the former SANS reporting unit, REI was assigned $9.6 million as a result of the June 17,, 2014 acquisition and the Sensors reporting unit was assigned $1.5 million of goodwill. At September 28, 2013, we had three reporting units, of which the SANS reporting unit and the Sensors reporting unit were assigned goodwill. There was no goodwill assigned to the Test reporting unit. During the fourth quarter of fiscal year 2014, we determined the former SANS reporting unit should be aggregated with the Test reporting unit as it has become fully integrated within our Test reporting unit. Prior to aggregating the former reporting unit, we performed a test to determine whether or not there was any impairment of the $15.0 million in goodwill assigned to SANS and determined that no impairment exists. The fair value of a reporting unit is estimated using a discounted cash flow model that requires input of certain estimates and assumptions requiring our judgment, including projections of economic conditions and customer demand, revenue and margins, changes in competition, operating costs, and new product introductions.
Software Development Costs: We incur costs associated with the development of software to be sold, leased, or otherwise marketed. Software development costs are expensed as incurred until technological feasibility has been established, at which time future costs incurred are capitalized until the product is available for general release to the public. A certain amount of judgment and estimation is required to assess when technological feasibility is established, as well as the ongoing assessment of the recoverability of capitalized costs. In evaluating the recoverability of capitalized software costs, we compare expected product performance, utilizing forecasted revenue amounts, to the total costs incurred to date and estimates of additional costs to be incurred. If revised forecasted product revenue is less than, and/or revised forecasted costs are greater than, the previously forecasted amounts, the net realizable value may be lower than previously estimated, which could result in the recognition of an impairment charge in the period in which such a determination is made.
Warranty Obligations: We are subject to warranty obligations on sales of our products. We record general warranty provisions based on an estimated warranty expense percentage applied to current period revenue. The percentage applied reflects historical warranty claims experience over the preceding twelve-month period. Both the experience percentage and the warranty liability are evaluated on an ongoing basis for adequacy. In addition, warranty provisions are also recognized for certain nonrecurring product claims that are individually significant. A certain amount of judgment is required in determining appropriate reserve levels for anticipated warranty claims. While these reserve levels are based on historical warranty experience, they may not reflect the actual claims that will occur over the upcoming warranty period, and additional warranty reserves may be required.
36
Income Taxes: The Company records a tax provision for the anticipated tax consequences of the reported results of operations. Deferred tax assets and liabilities are measured using the currently enacted tax rates that apply to taxable income in effect for the years in which those deferred tax assets and liabilities are expected to be realized or settled. The Company records a valuation allowance to reduce deferred tax assets to the amount that is believed more likely than not to be realized. The Company believes it is more likely than not that forecasted income, including income that may be generated as a result of certain tax planning strategies, together with the tax effects of the deferred tax liabilities, will be sufficient to fully recover the remaining net realizable value of its deferred tax assets. In the event that all or part of the net deferred tax assets are determined not to be realizable in the future, an adjustment to the valuation allowance would be charged to earnings in the period such determination is made. In addition, the calculation of tax liabilities involves significant judgment in estimating the impact of uncertainties in the application of complex tax laws. Resolution of these uncertainties in a manner inconsistent with management’s expectations could have a material impact on the Company’s financial condition and operating results. See Note 8 to the Consolidated Financial Statements for additional information on income taxes.
Recent Accounting Pronouncements
Recently Adopted Accounting Pronouncements
In December 2011, the Financial Accounting Standards Board (“FASB”) issued ASU No. 2011-11, “Balance Sheet (Topic 210): Disclosures about Offsetting Assets and Liabilities” (“ASU 2011011”), which requires an entity to disclose information about derivatives subject to enforceable master netting arrangements, including rights of offset, to enable users of its financial statements to understand the effect of those arrangements on its financial position. Subsequently, in January 2013, the FASB issued ASU 2013-01, “Balance Sheet (Topic 210): Clarifying the Scope of Disclosures about Offsetting Assets and Liabilities” (“ASU 2013-01”), which clarifies the instruments and transactions that are subject to the offsetting disclosure requirements established by ASU 2011-11. The Company adopted ASU 2011-11 and ASU 2013-01 during the first quarter of fiscal year 2014, and the presentation and disclosure requirements were applied retrospectively. Other than the enhanced disclosures, the adoption of these pronouncements did not impact the Company’s financial position, results of operations or cash flows.
Recently Issued Accounting Pronouncements
In May 2014, FASB issued ASU No. 2014-09, “Revenue from Contracts with customers (Topic 606)”. This update clarifies the principles for revenue recognition in transactions involving contracts with customers. The new revenue recognition model provides a five-step analysis in determining when and how revenue is recognized. The new model will require revenue recognition to depict the transfer of promised goods or services to a customer in an amount that reflects the consideration a company expects to receive in exchange for those goods or services. The guidance will be effective for the Company’s interim and annual reporting periods beginning after December 15, 2016, which is the Company’s fiscal year 2018. Early adoption is not permitted. The Company has not yet evaluated what impact, if any, the adoption of this guidance may have on the Company’s financial condition, results of operations, or disclosures.
Quarterly Financial
Information
Revenue and
operating results reported on a quarterly basis do not necessarily reflect
trends in demand for our products or our operating efficiency. Revenue and
operating results in any quarter may be significantly affected by customer
shipments, installation timing, or the timing of the completion of one or more
contracts where revenue is recognized upon shipment or customer acceptance
rather than on the percentage-of-completion method of revenue recognition. Our
use of the percentage-of-completion revenue recognition method for large,
long-term projects generally has the effect of minimizing significant
fluctuations from quarter to quarter. See Note 1 to the Consolidated Financial Statements
included in Item 8 of this Annual Report on Form 10-K for additional
information on our revenue recognition policy. Quarterly earnings also vary as
a result of the use of estimates including, but not limited to, the rates used
in recording federal, state, and foreign income tax expense. See Notes 1 and 8
to the Consolidated Financial Statements included in Item 8 of this Annual
Report on Form 10-K for additional information on the Company’s use of
estimates and income tax related matters, respectively.
37
Selected quarterly financial information for the fiscal years ended September 27, 2014 and September 28, 2013 was as follows:
|
|
|
|
|
|
|
|
|
|
|
|
|
|
|
|
|
|
|
|
|
First
|
|
Second
|
|
Third
|
|
Fourth
|
|
Total
|
|
|||||
|
|
|
(expressed in thousands, except per share data) |
|
|||||||||||||
|
2014 |
|
|
|
|
|
|
|
|
|
|
|
|
|
|
|
|
|
Revenue |
|
$ |
138,410 |
|
$ |
137,343 |
|
$ |
145,471 |
|
$ |
143,104 |
|
$ |
564,328 |
|
|
Gross profit |
|
|
54,539 |
|
|
55,534 |
|
|
57,695 |
|
|
55,875 |
|
|
223,643 |
|
|
Income before income taxes |
|
|
13,695 |
|
|
11,938 |
|
|
17,193 |
|
|
15,617 |
|
|
58,443 |
|
|
Net income |
|
$ |
9,145 |
|
$ |
7,779 |
|
$ |
14,144 |
|
$ |
10,941 |
|
$ |
42,009 |
|
|
Earnings per share: |
|
|
|
|
|
|
|
|
|
|
|
|
|
|
|
|
|
Basic |
|
$ |
0.60 |
|
$ |
0.51 |
|
$ |
0.93 |
|
$ |
0.72 |
|
$ |
2.76 |
|
|
Diluted |
|
$ |
0.59 |
|
$ |
0.50 |
|
$ |
0.93 |
|
$ |
0.71 |
|
$ |
2.73 |
|
|
|
|
|
|
|
|
|
|
|
|
|
|
|
|
|
|
|
|
2013 |
|
|
|
|
|
|
|
|
|
|
|
|
|
|
|
|
|
Revenue |
|
$ |
142,668 |
|
$ |
136,917 |
|
$ |
135,059 |
|
$ |
154,795 |
|
$ |
569,439 |
|
|
Gross profit |
|
|
56,602 |
|
|
53,905 |
|
|
54,596 |
|
|
66,836 |
|
|
231,939 |
|
|
Income before income taxes |
|
|
20,515 |
|
|
14,519 |
|
|
16,783 |
|
|
27,437 |
|
|
79,254 |
|
|
Net income |
|
$ |
13,783 |
|
$ |
11,061 |
|
$ |
11,547 |
|
$ |
21,415 |
|
$ |
57,806 |
|
|
Earnings per share: |
|
|
|
|
|
|
|
|
|
|
|
|
|
|
|
|
|
Basic |
|
$ |
0.88 |
|
$ |
0.70 |
|
$ |
0.73 |
|
$ |
1.38 |
|
$ |
3.69 |
|
|
Diluted |
|
$ |
0.87 |
|
$ |
0.69 |
|
$ |
0.72 |
|
$ |
1.36 |
|
$ |
3.64 |
|
Forward Looking
Statements
Statements
contained in this Annual Report on Form 10-K including, but not limited to, the
discussion under Item 7. Management’s Discussion and Analysis of Financial
Condition and Results of Operations, that are not statements of historical fact
are forward-looking statements within the meaning of the Private Securities
Litigation Reform Act of 1995 (the “Act”). In addition, certain statements in
our future filings with the Securities and Exchange Commission (“SEC”), in
press releases, and in oral and written statements made by us or with our
approval that are not statements of historical fact constitute forward-looking
statements within the meaning of the Act. Examples of forward-looking
statements include, but are not limited to: (i) projections of revenue, income
or loss, earnings or loss per share, the payment or nonpayment of dividends, capital
structure, the adequacy of our liquidity and reserves and other statements
concerning future financial performance; (ii) statements of our plans and
objectives by our management or Board of Directors, including those relating to
products or services; (iii) statements of assumptions underlying such
statements; (iv) statements regarding business relationships with vendors,
customers or collaborators; and (v) statements regarding products, their
characteristics, performance, sales potential or effect in the hands of
customers. Words such as “believes,” “anticipates,” “expects,” “intends,”
“targeted,” “should,” “potential,” “goals,” “strategy,” and similar expressions
are intended to identify forward-looking statements, but are not the exclusive
means of identifying such statements.
Forward-looking statements involve risks and uncertainties that may cause actual results to differ materially from those in such statements. Factors that could cause actual results to differ from those discussed in the forward-looking statements include, but are not limited to, those described in Item 1A, Risk Factors. The performance of our business and our securities may be adversely affected by these factors and by other factors common to other businesses and investments, or to the general economy. Forward-looking statements are qualified by some or all of these risk factors. Therefore, you should consider these forward looking statements with caution and form your own critical and independent conclusions about the likely effect of these risk factors on our future performance. Forward-looking statements speak only as of the date on which statements are made, and we undertake no obligation to update any forward-looking statement to reflect events or circumstances after the date on which such statement is made to reflect the occurrence of unanticipated events or circumstances. Readers should carefully review the disclosures and the risk factors described in this and other documents we file from time to time with the SEC, including our reports on Forms 10-Q and 8-K.
38
|
|
|
|
Quantitative and Qualitative Disclosures about Market Risk |
Foreign Currency Exchange Risk
Approximately
74% of our revenue has
historically been derived from customers outside of the United States and about
68% of this revenue (approximately 50% of our total revenue) is denominated in
currencies other than the U.S. dollar. Our international subsidiaries
have functional currencies other than our U.S. dollar reporting currency and,
occasionally, transact business in currencies other than their functional
currencies. These non-functional currency transactions expose us to market risk
on assets, liabilities and cash flows recognized on these transactions.
The strengthening of the U.S. dollar relative to foreign currencies decreases the value of foreign currency-denominated revenue and earnings when translated into U.S. dollars. Conversely, a weakening of the U.S. dollar increases the value of foreign currency-denominated revenue and earnings. The following table illustrates financial results utilizing currency exchange rates from the prior year to estimate the impact of currency on the following financial items:
Foreign Currency Exchange Rates
|
|
|
|
|
|
|
|
|
|
|
|
|
|
|
2014 |
|
2013 |
|
2012 |
|
|||
|
|
|
(expressed in thousands) |
|
|||||||
|
(Decrease) increase from currency translation on: |
|
|
|
|
|
|
|
|
|
|
|
Orders |
|
$ |
(1,994 |
) |
$ |
(6,460 |
) |
$ |
(10,006 |
) |
|
Revenue |
|
|
(85 |
) |
|
(8,091 |
) |
|
(8,453 |
) |
|
Net Income |
|
$ |
(736 |
) |
$ |
(920 |
) |
$ |
(697 |
) |
The estimated net effect of currency translation on orders, revenue, and net income was unfavorable in fiscal year 2014 in comparison to fiscal year 2013, primarily driven by the unfavorable translation impact associated with the relative strengthening in the value of the U.S. dollar against the Japanese Yen throughout fiscal year 2014 compared to fiscal year 2013. This was partially offset by a favorable translation impact associated with the relative weakening in the value of the U.S. dollar against the Euro, Great British Pound, and Chinese Yuan throughout fiscal year 2014 as compared to fiscal year 2013.
A hypothetical 10% appreciation or depreciation in foreign currencies against the U.S. dollar, assuming all other variables are held constant, would result in an increase or decrease in fiscal year 2014 revenue of approximately $25.0 million.
We have operational procedures to mitigate these non-functional currency exposures. We also utilize foreign currency exchange contracts to exchange currencies at set exchange rates on future dates to offset expected gains or losses on specifically identified exposures.
Mark-to-market gains and losses on derivatives designated as cash flow hedges in our currency hedging program are recorded within Accumulated Other Comprehensive Income in the Consolidated Balance Sheet. We recognize gains and losses associated with the fair value of cash flow hedges at the time a gain or loss is recognized on the hedged exposure in the Consolidated Statement of Income, or at the time the cash flow hedge is determined to be ineffective. The associated mark-to-market gains and losses are reclassified from Accumulated Other Comprehensive Income to the same line item in the Consolidated Statements of Income upon which the underlying hedged transaction is reported. Net gains and losses on foreign currency transactions, included in the accompanying Consolidated Statements of Income, were a net loss of $1.4 million in fiscal year 2014, a net loss of $1.7 million in fiscal year 2013, and a net loss of $1.8 million in fiscal year 2012. See Note 5 to the Consolidated Financial Statements included in Item 8 of this Annual Report on Form 10-K.
39
Interest Rates
We
are also directly exposed to changes in market interest rates on cash, cash
equivalents, short-term investments and debt and are indirectly exposed to the
impact of market interest rates on overall business activity.
On floating-rate investments, increases and decreases in market interest rates will increase or decrease future interest income, respectively. On floating-rate debt, increases or decreases in market interest rates will increase or decrease future interest expense, respectively. On fixed-rate investments, increases or decreases in market interest rates do not impact future interest income but may decrease or increase the fair market value of the investments, respectively.
At September 27, 2014, we had cash and cash equivalents of $60.4 million, most of which was invested in interest-bearing bank deposits or money market funds, with interest rates that are reset every 1-89 days. A hypothetical increase or decrease of 1% in market interest rates, assuming all other variables were held constant, would increase or decrease interest income by approximately $0.6 million on an annualized basis.
Our short-term borrowings outstanding at the end of fiscal year 2014 consisted of $60.0 million utilization of the revolving credit facility. Borrowings under the credit facility require interest payments calculated at a floating rate and, therefore, are impacted by the effect of increases or decreases in market interest rates. Because we anticipate the borrowing to be outstanding for only a short period of time, we have elected not to mitigate this risk. A hypothetical increase or decrease of 1 percentage point in interest rates, assuming all other variables were held constant, would increase or decrease interest expense by approximately $0.3 million on an annualized basis.
At September 27, 2014, a discount rate of 2.5% and an expected rate increase in future compensation levels of 3.4% was used in the calculation of the pension liability related to the non-contributory, defined benefit pension plan of one of the Company’s international subsidiaries.
|
|
|
|
Financial Statements and Supplementary Data |
The Company’s audited financial statements and notes thereto described in Item 15 of this Annual Report on Form 10-K, and appearing on pages F-1 through F-39 of this report, are incorporated by reference herein. See also “Quarterly Financial Data” in Management’s Discussion and Analysis under Item 7 of this Annual Report on Form 10-K, which is incorporated herein by reference.
|
|
|
|
Changes in and Disagreements With Accountants on Accounting and Financial Disclosure |
None.
|
|
|
|
Controls and Procedures |
Our management, including our Chief Executive Officer and Chief Financial Officer, have conducted an evaluation of the effectiveness of design and operation of our disclosure controls and procedures (as defined in Rule 13a-15(e) under The Securities Exchange Act of 1934 (the “Exchange Act”,). Based on that evaluation, our Chief Executive Officer and Chief Financial Officer concluded that, as of September 27, 2014, our disclosure controls and procedures were effective. MTS acquired REI during 2014, and management excluded REI from its assessment of internal control over financial reporting as of September 17, 2014.
There were no changes that occurred during the fiscal quarter ended September 27, 2014 that have materially affected, or are reasonably likely to materially affect, our internal control over financial reporting.
40
Management’s Report on Internal Control Over
Financial Reporting
Our
management is responsible for establishing and maintaining adequate internal
control over financial reporting, as such term is defined in Rule 13a-15(f)
under the Exchange Act. Our internal control over financial reporting is
designed to provide reasonable assurance regarding the reliability of financial
reporting and the preparation of financial statements. Under the supervision
and with the participation of management, including our Chief Executive Officer
and Chief Financial Officer, we conducted an evaluation of the effectiveness of
internal controls over financial reporting as of September 27, 2014. In making
this assessment, management used the criteria set forth by the Committee of
Sponsoring Organizations of the Treadway Commission in Internal Control – Integrated Framework (1992).
Based on management’s assessment using this framework, management concluded
that our internal control over financial reporting is effective as of September
27, 2014.
KPMG LLP, an independent registered public accounting firm, has audited the consolidated financial statements included in this Annual Report on Form 10-K and, as part of this audit, has issued its report, included in the financial statements incorporated by reference into Item 8, on the effectiveness of our internal control over financial reporting.
Report of Independent Registered Public Accounting Firm
The Board of Directors and Shareholders
MTS Systems Corporation:
We have audited MTS Systems Corporation’s internal control over financial reporting as of September 27, 2014, based on criteria established in Internal Control – Integrated Framework (1992) issued by the Committee of Sponsoring Organizations of the Treadway Commission (COSO). MTS Systems Corporation’s management is responsible for maintaining effective internal control over financial reporting and for its assessment of the effectiveness of internal control over financial reporting, included in the accompanying ”Management’s Report on Internal Control over Financial Reporting” appearing under Item 9A(b) of the Company’s September 27, 2014 Annual Report on Form 10-K. Our responsibility is to express an opinion on the Company’s internal control over financial reporting based on our audit.
We conducted our audit in accordance with the standards of the Public Company Accounting Oversight Board (United States). Those standards require that we plan and perform the audit to obtain reasonable assurance about whether effective internal control over financial reporting was maintained in all material respects. Our audit included obtaining an understanding of internal control over financial reporting, assessing the risk that a material weakness exists, and testing and evaluating the design and operating effectiveness of internal control based on the assessed risk. Our audit also included performing such other procedures as we considered necessary in the circumstances. We believe that our audit provides a reasonable basis for our opinion.
A company’s internal control over financial reporting is a process designed to provide reasonable assurance regarding the reliability of financial reporting and the preparation of financial statements for external purposes in accordance with generally accepted accounting principles. A company’s internal control over financial reporting includes those policies and procedures that (1) pertain to the maintenance of records that, in reasonable detail, accurately and fairly reflect the transactions and dispositions of the assets of the company; (2) provide reasonable assurance that transactions are recorded as necessary to permit preparation of financial statements in accordance with generally accepted accounting principles, and that receipts and expenditures of the company are being made only in accordance with authorizations of management and directors of the company; and (3) provide reasonable assurance regarding prevention or timely detection of unauthorized acquisition, use, or disposition of the company’s assets that could have a material effect on the financial statements.
Because of its inherent limitations, internal control over financial reporting may not prevent or detect misstatements. Also, projections of any evaluation of effectiveness to future periods are subject to the risk that controls may become inadequate because of changes in conditions, or that the degree of compliance with the policies or procedures may deteriorate.
In our opinion, MTS Systems Corporation maintained, in all material respects, effective internal control over financial reporting as of September 27, 2014, based on criteria established in Internal Control – Integrated Framework (1992) issued by the Committee of Sponsoring Organizations of the Treadway Commission (COSO).
MTS Systems Corporation acquired Roehrig Engineering, Inc. during 2014, and management excluded from its assessment of the effectiveness of MTS Systems Corporation’s internal control over financial reporting as of September 27, 2014, Roehrig Engineering, Inc.’s internal control over financial reporting associated with total assets of $17,293,000 and total revenues of $2,294,000 included in the consolidated financial statements of MTS Systems Corporation and subsidiaries as of and for the year ended September 27, 2014. Our audit of internal control over financial reporting of MTS Systems Corporation also excluded an evaluation of the internal control over financial reporting of Roehrig Engineering, Inc.
We also have audited, in accordance with the standards of the Public Company Accounting Oversight Board (United States), the consolidated balance sheets of MTS Systems Corporation and subsidiaries as of September 27, 2014, and September 28, 2013, and the related consolidated statements of income, comprehensive income, shareholders’ investment, and cash flows for each of the years in the three-year period ended September 27, 2014, and our report dated November 26, 2014 expressed an unqualified opinion on those consolidated financial statements and financial statement schedule
/s/ KPMG LLP
Minneapolis, Minnesota
November 26, 2014
|
|
|
|
Other Information |
None.
41
|
|
|
|
Directors, Executive Officers and Corporate Governance |
The required information with respect to our directors, our Code of Conduct, compliance with Section 16(a) of the Securities Exchange Act of 1934, and our Audit Committee, including our Audit Committee financial experts, is incorporated by reference to the information set forth under the headings “Election of Directors” and “Other Information – Section 16(a) Beneficial Ownership Reporting Compliance” in our Proxy Statement for the Annual Meeting of Shareholders scheduled to be held on February 10, 2015.
Executive Officers serve at the discretion of and are elected by our Board of Directors. The business experience of the Executive Officers over the last five years, their age and the year in which such person became an Executive Officer are as follows:
|
|
|
|
|
|
|
|
|
Officer |
|
Business Experience |
|
Age |
|
Executive |
|
|
|
|
|
|
|
|
|
Jeffrey A. Graves, |
|
President and Chief Executive Officer since May 2012. President and Chief Executive Officer of C&D Technologies, Inc., a global manufacturer of energy storage systems, from July 2005 to May 2012. |
|
53 |
|
2012 |
|
|
|
|
|
|
|
|
|
Susan E. Knight, |
|
Senior Vice President and Chief Financial Officer since November 2011. Vice President and Chief Financial Officer from October 2001 to October 2011. |
|
60 |
|
2001 |
|
|
|
|
|
|
|
|
|
William E. Bachrach, |
|
Senior Vice President and General Manager of Sensors and Test since October 2014. Senior Vice President, Sensors from March 2013 to October 2014. Chief Operating Officer of ROAM Data, a global payment solutions provider, from 2010 to March 2013; and President of Murata Power Solutions (formerly C&D Technologies Power Systems) from 2005 to 2009. |
|
55 |
|
2013 |
|
|
|
|
|
|
|
|
|
Steven G. Mahon, |
|
Senior Vice President, General Counsel and Chief Compliance Officer since October 2011; Corporate Secretary since August 2012. Vice President & Assistant General Counsel for Alliant Techsystems Inc., an aerospace, defense and sporting goods manufacturer, from January 2003 to September 2011. |
|
53 |
|
2011 |
|
|
|
|
|
|
|
|
|
Kristin E. Trecker, |
|
Senior Vice President and Chief Human Resources Officer since August 2012. Vice President and Chief Human Resources Officer from February 2012 to August 2012. Senior Vice President of Human Resources for Lawson Software, Inc., an enterprise software provider, from 2006 to July 2011. |
|
49 |
|
2012 |
|
|
|
|
|
|
|
|
|
Mark D. Losee, |
|
Senior Vice President and Chief Information Officer since September 2012. Director of IT from January 2012 to September 2012. Global Account Executive for Johnson Controls, Inc., a global diversified technology and industrial business developer, from August 2009 to January 2012. Vice President, IT and Shared Services for Medtronic, Inc. for more than five years prior to his departure in August 2009. |
|
57 |
|
2012 |
|
|
|
|
Executive Compensation |
The information required by this Item is incorporated by reference to the information set forth under headings “Executive Compensation,” “Election of Directors – Non-Employee Director Compensation,” and “Other Information – Compensation Committee Interlocks and Insider Participation” in our Proxy Statement for the Annual Meeting of Shareholders scheduled to be held on February 10, 2015.
|
|
|
|
Security Ownership of Certain Beneficial Owners and Management and Related Stockholder Matters |
The information required by this Item is incorporated by reference to the information set forth under the heading “Other Information - Security Ownership of Principal Shareholders and Management” and “- Information Regarding Equity Compensation Plans” in our Proxy Statement for the Annual Meeting of Shareholders scheduled to be held on February 10, 2015.
|
|
|
|
Certain Relationships and Related Transactions, and Director Independence |
The information required by this Item is incorporated by reference to the information set forth under the headings “Election of Directors – Other Information Regarding the Board” and “Other Information – Related Party Transactions” in our Proxy Statement for the Annual Meeting of Shareholders scheduled to be held February 10, 2015.
|
|
|
|
Principal Accountant Fees and Services |
The information required by this Item is incorporated by reference to the information set forth under the heading “Ratification of Appointment of Independent Registered Public Accounting Firm” in our Proxy Statement for the Annual Meeting of Shareholders scheduled to be held on February 10, 2015.
42
|
|
|
|
Exhibits and Financial Statement Schedules |
|
|
|
|
|
|
|
|
The following documents are filed as part of this report: |
|||
|
|
|
|
|
|
|
|
|
(1) |
Consolidated Financial Statements: |
|
|
|
|
|
|
|
|
|
|
|
|
Report of Independent Registered Public Accounting Firm |
|
|
|
|
|
|
|
|
|
|
|
Consolidated Balance Sheets – September 27, 2014 and September 28, 2013 |
|
|
|
|
|
|
|
|
|
|
|
Consolidated Statements of Income for the Fiscal Years Ended September 27, 2014, September 28, 2013 and September 29, 2012 |
|
|
|
|
|
|
|
|
|
|
|
Consolidated Statements of Comprehensive Income for the Fiscal Years Ended September 27, 2014, September 28, 2013 and September 29, 2012 |
|
|
|
|
|
|
|
|
|
|
|
Consolidated Statements of Shareholders’ Investment for the Fiscal Years Ended September 27, 2014, September 28, 2013 and September 29, 2012 |
|
|
|
|
|
|
|
|
|
|
|
Consolidated Statements of Cash Flows for the Fiscal Years Ended September 27, 2014, September 28, 2013 and September 29, 2012 |
|
|
|
|
|
|
|
|
|
|
|
Notes to Consolidated Financial Statements |
|
|
|
|
|
|
|
|
|
(2) |
Financial Statement Schedules: |
|
|
|
|
|
|
|
|
|
|
|
|
See accompanying Index to Financial Statements on page F-1. |
|
|
|
|
|
|
|
|
|
(3) |
Exhibits: |
|
|
|
|
|
|
Exhibit Number |
|
Description |
|
|
|
|
|
3.1 |
|
Restated and Amended Articles of Incorporation, incorporated by reference to Exhibit 3.a of the Company’s Form 10-K for the fiscal year ended September 29, 2012. |
|
|
|
|
|
3.2 |
|
Amended and Restated Bylaws, incorporated by reference to Exhibit 3.b of the Company’s Current Report on Form 8-K filed November 28, 2011. |
|
|
|
|
|
10.1 |
|
Executive Variable Compensation Plan, incorporated by reference to Exhibit 5.02 of the Company’s Current Report on Form 8-K filed February 12, 2010. |
|
|
|
|
|
10.2 |
|
2012 Employee Stock Purchase Plan, incorporated by reference to Appendix B of the Company’s Proxy Statement filed on December 28, 2010. |
|
|
|
|
|
10.3 |
|
2006 Stock Incentive Plan, incorporated by reference to Exhibit 99.1 of the Company’s Current Report on Form 8-K filed February 7, 2006. |
|
|
|
|
|
10.4 |
|
First Amendment to the Company’s 2006 Stock Incentive Plan, First Amendment to the Company’s Executive Variable Compensation Plan, amendments to the Company’s Executive Deferred Compensation Plan (2005), and incorporated by reference to Exhibits 10.1, 10.2and 10.3 and 10.4 of the Company’s Current Report on Form 8-K filed October 27, 2008. |
|
|
|
|
|
10.5 |
|
Form of Notice of Grant of Restricted Stock (Director) under 2006 Stock Incentive Plan, incorporated by reference to Exhibit 99.2 of the Company’s Current Report on Form 8-K filed February 7, 2006. |
43
|
|
|
|
|
|
|
|
|
10.6 |
|
Uniform Terms and Conditions to Restricted Stock Awards (Director) under 2006 Stock Incentive Plan, incorporated by reference to Exhibit 99.3 of Company’s Current Report on Form 8-K filed February 7, 2006. |
|
|
|
|
|
10.7 |
|
Form of Notice of Grant of Employee Restricted Stock Units under 2006 Stock Incentive Plan, incorporated by reference to Exhibit 10.1 of the Company’s Current Report on Form 8-K filed June 29, 2009. |
|
|
|
|
|
10.8 |
|
Uniform Terms and Conditions to Employee Restricted Stock Units under 2006 Stock Incentive Plan, incorporated by reference to Exhibit 10.2 of Company’s Current Report on Form 8-K filed June 29, 2009. |
|
|
|
|
|
10.9 |
|
2011 Stock Incentive Plan, as amended by the First Amendment, incorporated by reference to Exhibit 4.1 to the Company’s Registration Statement on Form S-8 filed February 9, 2011. |
|
|
|
|
|
10.10 |
|
Second Amendment to 2011 Stock Incentive Plan, incorporated by reference to Exhibit 99.2 of the Company’s Registration Statement on Form S-8 filed March 15, 2013. |
|
|
|
|
|
10.11 |
|
Form of Notice of Grant and Terms and Conditions of Employee Options under 2011 Stock Incentive Plan, incorporated by reference to Exhibit 99.1 of the Company’s Registration Statement on Form S-8 filed February 9, 2011. |
|
|
|
|
|
10.12 |
|
Form of Notice of Grant and Terms and Conditions of Employee Restricted Stock Units under 2011 Stock Incentive Plan, incorporated by reference to Exhibit 99.2 of the Company’s Registration Statement on Form S-8 filed February 9, 2011. |
|
|
|
|
|
10.13 |
|
Form of Notice of Grant and Terms and Conditions of Employee Restricted Stock under 2011 Stock Incentive Plan, incorporated by reference to Exhibit 99.3 of the Company’s Registration Statement on Form S-8 filed February 9, 2011. |
|
|
|
|
|
10.14 |
|
Form of Notice of Grant and Terms and Conditions of Restricted Stock for Directors under 2011 Stock Incentive Plan, incorporated by reference to Exhibit 99.4 of the Company’s Registration Statement on Form S-8 filed February 9, 2011. |
|
|
|
|
|
10.15 |
|
Form of Notice of Grant of Restricted Stock and Restricted Stock Agreement – Director under the 2011 Stock Incentive Plan, incorporated by reference to Exhibit 10.1 of the Company’s Form 10-Q for the fiscal quarter ended December 28, 2013. |
|
|
|
|
|
10.16 |
|
Form of Notice of Grant of Restricted Stock Units and Restricted Stock Agreement – Non-Employee Director under the 2011 Stock Incentive Plan, incorporated by reference to Exhibit 10.2 of the Company’s Form 10-Q for the fiscal quarter ended December 28, 2013. |
|
|
|
|
|
10.17 |
|
Uniform Terms and Conditions Applicable to Non-Employee Director Restricted Stock Unit Grants under the 2011 Stock Incentive Plan, incorporated by reference to Exhibit 10.3 of the Company’s Form 10-Q for the fiscal quarter ended December 28, 2013. |
|
|
|
|
|
10.18 |
|
Form of Notice of Grant of Restricted Stock Units and Restricted Stock Unit Agreement – Employee under the 2011 Stock Incentive Plan, incorporated by reference to Exhibit 10.4 of the Company’s Form 10-Q for the fiscal quarter ended December 28, 2013. |
|
|
|
|
|
10.19 |
|
Uniform Terms and Conditions Applicable to Employee Restricted Stock Unit Grants under the 2011 Stock Incentive Plan, incorporated by reference to Exhibit 10.5 of the Company’s Form 10-Q for the fiscal quarter ended December 28, 2013. |
44
|
|
|
|
|
10.20 |
|
Notice of Grant of Non-Qualified Stock Options and Option Agreement – Employee under the 2011 Stock Incentive Plan, incorporated by reference to Exhibit 10.6 of the Company’s Form 10-Q for the fiscal quarter ended December 28, 2013. |
|
|
|
|
|
10.21 |
|
Uniform Terms and Conditions Applicable to Employee Option Grants under the 2011 Stock Incentive Plan, incorporated by reference to Exhibit 10.7 of the Company’s Form 10-Q for the fiscal quarter ended December 28, 2013. |
|
|
|
|
|
10.22 |
|
Letter Agreement, dated as of March 31, 2012, between the Company and Jeffrey A. Graves, incorporated by reference to Exhibit 10.1 of the Company’s Current Report on Form 8-K filed April 9, 2012. |
|
|
|
|
|
10.23 |
|
Description of the terms of employment of Susan E. Knight, pursuant to an offer letter, incorporated by reference to Exhibit 10.r of the Company’s Form 10-Q/A for the fiscal quarter ended December 31, 2001. |
|
|
|
|
|
10.24 |
|
Letter Agreement, dated February 25, 2013, between the Company and William E. Bachrach, incorporated by reference to Exhibit 10.2 of the Company’s Form 10-Q for the fiscal quarter ended March 30, 2013. |
|
|
|
|
|
10.25 |
|
Form of Indemnification Agreement between the Company and each of its directors and executive officers, incorporated by reference to Exhibit 10.1 of the Company’s Current Report on Form 8-K filed September 1, 2006. |
|
|
|
|
|
10.26 |
|
Executive Severance Plan, incorporated by reference to Exhibit 10.1 of the Company’s Current Report on Form 8-K filed October 3, 2013. |
|
|
|
|
|
10.27 |
|
Executive Change in Control Severance Plan, incorporated by reference to Exhibit 10.2 of the Company’s Current Report on Form 8-K filed October 3, 2013. |
|
|
|
|
|
10.28 |
|
Credit Agreement, dated as of September 24, 2014, among the Company; U.S. Bank National Association; HSBC Bank USA, National Association; Wells Fargo Bank, National Association; JPMorgan Chase Bank, N.A.; J.P. Morgan Securities LLC; and Wells Fargo Securities LLC, incorporated by reference to Exhibit 10.1 of the Company’s Current Report on Form 8-K filed September 25, 2014. |
|
|
|
|
|
21 |
|
Subsidiaries of the Company (filed herewith). |
|
|
|
|
|
23 |
|
Consent of Independent Registered Public Accounting Firm (filed herewith). |
|
|
|
|
|
31.1 |
|
Certification of the Chief Executive Officer Pursuant to Section 302 of the Sarbanes-Oxley Act of 2002 (filed herewith). |
|
|
|
|
|
31.2 |
|
Certification of the Chief Financial Officer Pursuant to Section 302 of the Sarbanes-Oxley Act of 2002 (filed herewith). |
|
|
|
|
|
32.1 |
|
Certification of the Chief Executive Officer Pursuant to Section 906 of the Sarbanes-Oxley Act of 2002 (filed herewith). |
|
|
|
|
|
32.2 |
|
Certification of the Chief Financial Officer Pursuant to Section 906 of the Sarbanes-Oxley Act of 2002 (filed herewith). |
45
|
|
|
|
|
|
|
|
|
101.INS ** |
|
XBRL Instance Document (filed herewith). |
|
|
|
|
|
101.SCH ** |
|
XBRL Taxonomy Extension Schema Document (filed herewith). |
|
|
|
|
|
101.CAL ** |
|
XBRL Taxonomy Extension Calculation Linkbase Document (filed herewith). |
|
|
|
|
|
101.DEF ** |
|
XBRL Taxonomy Extension Definition Linkbase Document (filed herewith). |
|
|
|
|
|
101.LAB ** |
|
XBRL Taxonomy Extension Label Linkbase Document (filed herewith). |
|
|
|
|
|
101.PRE ** |
|
XBRL Taxonomy Extension Presentation Linkbase Document (filed herewith). |
|
|
|
|
|
|
** |
XBRL (Extensible Business Reporting Language) information is furnished and not filed or a part of a registration statement or prospectus for purposes of Sections 11 or 12 of the Securities Act of 1933, as amended, is deemed not filed for purposes of Section 18 of the Securities Exchange Act of 1934, as amended, and otherwise is not subject to liability under these sections. |
46
SIGNATURES
Pursuant to the requirements of Section 13 or 15(d) of the Securities Exchange Act of 1934, the registrant has duly caused this report to be signed on its behalf by the undersigned, thereunto duly authorized.
|
|
|
|
|
|
MTS SYSTEMS CORPORATION |
|
|
|
|
|
|
|
By: |
/s/ JEFFREY A. GRAVES |
|
|
|
Jeffrey A. Graves |
|
|
|
President and Chief Executive Officer |
|
|
|
|
|
Date: November 26, 2014 |
|
|
Pursuant to the requirements of the Securities Exchange Act of 1934, this report has been signed below by the following persons on behalf of the registrant and in the capacities and on the dates indicated.
|
|
|
|
|
|
|
Signatures |
|
Title |
|
Date |
|
|
|
|
|
|
|
/s/ JEFFREY A. GRAVES |
|
President and |
|
November 26, 2014 |
|
Jeffrey A. Graves |
|
Chief Executive Officer |
|
|
|
|
|
and Director |
|
|
|
|
|
(Principal Executive Officer) |
|
|
|
|
|
|
|
|
|
|
|
|
|
|
|
/s/ SUSAN E. KNIGHT |
|
Chief Financial Officer |
|
November 26, 2014 |
|
Susan E. Knight |
|
and Senior Vice President |
|
|
|
|
|
(Principal Financial Officer and |
|
|
|
|
|
Principal Accounting Officer) |
|
|
|
|
|
|
|
|
|
|
|
|
|
|
|
/s/ DAVID J. ANDERSON |
|
Non-Executive |
|
November 26, 2014 |
|
David J. Anderson |
|
Chair of the Board |
|
|
|
|
|
|
|
|
|
|
|
|
|
|
|
/s/ JEAN-LOU CHAMEAU |
|
Director |
|
November 26, 2014 |
|
Jean-Lou Chameau |
|
|
|
|
|
|
|
|
|
|
|
|
|
|
|
|
|
/s/ DAVID D. JOHNSON |
|
Director |
|
November 26, 2014 |
|
David D. Johnson |
|
|
|
|
|
|
|
|
|
|
|
|
|
|
|
|
|
/s/ EMILY M. LIGGETT |
|
Director |
|
November 26, 2014 |
|
Emily M. Liggett |
|
|
|
|
|
|
|
|
|
|
|
|
|
|
|
|
|
/s/ RANDY J. MARTINEZ |
|
Director |
|
November 26, 2014 |
|
Randy J. Martinez |
|
|
|
|
|
|
|
|
|
|
|
|
|
|
|
|
|
/s/ BARB J. SAMARDZICH |
|
Director |
|
November 26, 2014 |
|
Barb J. Samardzich |
|
|
|
|
|
|
|
|
|
|
|
/s/ MICHAEL V. SCHROCK |
|
Director |
|
November 26, 2014 |
|
Michael V. Schrock |
|
|
|
|
|
|
|
|
|
|
|
/s/ GAIL P. STEINEL |
|
Director |
|
November 26, 2014 |
|
Gail P. Steinel |
|
|
|
|
|
|
|
|
|
|
|
/s/ CHUN HUNG (KENNETH) YU |
|
Director |
|
November 26, 2014 |
|
Chun Hung (Kenneth) Yu |
|
|
|
|
47
MTS Systems Corporation and Subsidiaries
Index to Financial Statements
|
|
|
|
|
CONSOLIDATED FINANCIAL STATEMENTS |
|
Page |
|
|
|
|
|
|
F-2 |
|
|
|
|
|
|
Consolidated Balance Sheets – September 27, 2014 and September 28, 2013 |
|
F-3 |
|
|
|
|
|
|
F-4 |
|
|
|
|
|
|
|
F-5 |
|
|
|
|
|
|
|
F-6 |
|
|
|
|
|
|
|
F-7 |
|
|
|
|
|
|
|
F-8 through F-38 |
|
|
|
|
|
|
Financial Statement Schedule |
|
|
|
|
|
|
|
|
|
Schedule |
|
Description |
|
|
|
|
|
|
|
|
|
II |
|
|
F-39 |
F-1
Report of Independent Registered Public Accounting Firm
The Board of Directors and Shareholders
MTS Systems Corporation:
We have audited the accompanying consolidated balance sheets of MTS Systems Corporation and subsidiaries as of September 27, 2014 and September 28, 2013, and the related consolidated statements of income, comprehensive income, shareholders’ investment, and cash flows for each of the fiscal years in the three-year period ended September 27, 2014. In connection with our audits of the consolidated financial statements, we also have audited financial statement schedule II. These consolidated financial statements and financial statement schedule are the responsibility of the Company’s management. Our responsibility is to express an opinion on these consolidated financial statements and financial statement schedule based on our audits.
We conducted our audits in accordance with the standards of the Public Company Accounting Oversight Board (United States). Those standards require that we plan and perform the audit to obtain reasonable assurance about whether the financial statements are free of material misstatement. An audit includes examining, on a test basis, evidence supporting the amounts and disclosures in the financial statements. An audit also includes assessing the accounting principles used and significant estimates made by management, as well as evaluating the overall financial statement presentation. We believe that our audits provide a reasonable basis for our opinion.
In our opinion, the consolidated financial statements referred to above present fairly, in all material respects, the financial position of MTS Systems Corporation and subsidiaries as of September 27, 2014 and September 28, 2013, and the results of their operations and their cash flows for each of the fiscal years in the three-year period ended September 27, 2014, in conformity with U.S. generally accepted accounting principles. Also, in our opinion, the related financial statement schedule, when considered in relation to the basic consolidated financial statements taken as a whole, present fairly, in all material respects, the information set forth therein.
We also have audited, in accordance with the standards of the Public Company Accounting Oversight Board (United States), MTS Systems Corporation internal control over financial reporting as of September 27, 2014, based on criteria established in Internal Control – Integrated Framework (1992) issued by the Committee of Sponsoring Organizations of the Treadway Commission (COSO), and our report dated November 26, 2014 expressed an unqualified opinion on the effectiveness of the Company’s internal control over financial reporting.
Our report dated November 26, 2014 on internal control over financial reporting as of September 27, 2014, contains an explanatory paragraph that states management excluded from its assessment of the effectiveness of internal control over financial reporting as of September 27, 2014, Roehrig Engineering, Inc.’s internal control over financial reporting associated with total assets of $17,293,000, and total revenues of $2,294,000, included in the consolidated financial statements of MTS Systems Corporation and subsidiaries as of and for the year ended September 27, 2014. Our audit of internal control over financial reporting of MTS Systems Corporation also excluded an evaluation of the internal control over financial reporting of Roehrig Engineering, Inc.
/s/ KPMG LLP
Minneapolis, Minnesota
November 26, 2014
F-2
Consolidated Balance Sheets
(September 27 and September
28, respectively)
|
|
|
|
|
|
|
|
|
|
Assets |
|
2014 |
|
2013 |
|
||
|
|
|
(expressed
in thousands, |
|
||||
|
Current Assets: |
|
|
|
|
|
|
|
|
Cash and cash equivalents |
|
$ |
60,397 |
|
$ |
48,333 |
|
|
Accounts receivable, net of allowance for doubtful accounts of $2,609 and $1,998 respectively |
|
|
104,399 |
|
|
102,860 |
|
|
Unbilled accounts receivable |
|
|
75,762 |
|
|
75,988 |
|
|
Inventories |
|
|
83,557 |
|
|
77,989 |
|
|
Prepaid expenses and other current assets |
|
|
13,937 |
|
|
12,837 |
|
|
Deferred income taxes |
|
|
12,930 |
|
|
11,256 |
|
|
Total current assets |
|
|
350,982 |
|
|
329,263 |
|
|
Property and equipment, net |
|
|
81,575 |
|
|
78,399 |
|
|
Goodwill |
|
|
26,123 |
|
|
16,624 |
|
|
Other intangible assets, net |
|
|
21,178 |
|
|
19,656 |
|
|
Other assets |
|
|
3,694 |
|
|
4,539 |
|
|
Deferred income taxes |
|
|
3,856 |
|
|
2,796 |
|
|
Total assets |
|
$ |
487,408 |
|
$ |
451,277 |
|
|
|
|
|
|
|
|
|
|
|
Liabilities and Shareholders’ Investment |
|
|
|
|
|
|
|
|
|
|
|
|
|
|
|
|
|
Current Liabilities: |
|
|
|
|
|
|
|
|
Short-term borrowings |
|
$ |
60,000 |
|
$ |
35,000 |
|
|
Accounts payable |
|
|
27,189 |
|
|
29,816 |
|
|
Accrued payroll and related costs |
|
|
30,009 |
|
|
33,528 |
|
|
Advance payments from customers |
|
|
52,335 |
|
|
44,929 |
|
|
Accrued warranty costs |
|
|
4,286 |
|
|
4,694 |
|
|
Accrued income taxes |
|
|
6,041 |
|
|
3,350 |
|
|
Deferred income taxes |
|
|
1,641 |
|
|
3,037 |
|
|
Accrued dividends |
|
|
4,476 |
|
|
4,544 |
|
|
Other accrued liabilities |
|
|
17,004 |
|
|
15,265 |
|
|
Total current liabilities |
|
|
202,981 |
|
|
174,163 |
|
|
Deferred income taxes |
|
|
6,045 |
|
|
8,011 |
|
|
Non-current accrued income taxes |
|
|
5,990 |
|
|
4,311 |
|
|
Defined benefit pension plan obligation |
|
|
7,654 |
|
|
4,434 |
|
|
Other long-term liabilities |
|
|
6,611 |
|
|
3,821 |
|
|
Total liabilities |
|
|
229,281 |
|
|
194,740 |
|
|
|
|
|
|
|
|
|
|
|
Shareholders’ Investment: |
|
|
|
|
|
|
|
|
Common stock, $0.25 par value; 64,000 shares authorized: 15,180 and 15,408 shares issued and outstanding as of September 27, 2014 and September 28, 2013, respectively |
|
|
3,795 |
|
|
3,852 |
|
|
Additional paid-in capital |
|
|
6,112 |
|
|
- |
|
|
Retained earnings |
|
|
242,396 |
|
|
240,348 |
|
|
Accumulated other comprehensive income |
|
|
5,824 |
|
|
12,337 |
|
|
Total shareholders’ investment |
|
|
258,127 |
|
|
256,537 |
|
|
Total liabilities and shareholders’ investment |
|
$ |
487,408 |
|
$ |
451,277 |
|
The accompanying Notes to Consolidated Financial Statements are an integral part of these consolidated financial statements.
F-3
Consolidated Statements of Income
(For the
Fiscal Years Ended September 27, September 28 and September 29, respectively)
|
|
|
|
|
|
|
|
|
|
|
|
|
|
|
2014 |
|
2013 |
|
2012 |
|
|||
|
|
|
(expressed in thousands, except per share data) |
|
|||||||
|
|
|
|
|
|
|
|
|
|
|
|
|
Revenue: |
|
|
|
|
|
|
|
|
|
|
|
Product |
|
$ |
487,011 |
|
$ |
497,620 |
|
$ |
476,306 |
|
|
Service |
|
|
77,317 |
|
|
71,819 |
|
|
65,950 |
|
|
Total Revenue |
|
|
564,328 |
|
|
569,439 |
|
|
542,256 |
|
|
Cost of Sales: |
|
|
|
|
|
|
|
|
|
|
|
Product |
|
|
296,449 |
|
|
296,256 |
|
|
272,706 |
|
|
Service |
|
|
44,236 |
|
|
41,244 |
|
|
33,358 |
|
|
Total Cost of Sales |
|
|
340,685 |
|
|
337,500 |
|
|
306,064 |
|
|
Gross Profit |
|
|
223,643 |
|
|
231,939 |
|
|
236,192 |
|
|
Operating Expenses: |
|
|
|
|
|
|
|
|
|
|
|
Selling and marketing |
|
|
88,136 |
|
|
81,009 |
|
|
74,637 |
|
|
General and administrative |
|
|
51,407 |
|
|
48,163 |
|
|
51,401 |
|
|
Research and development |
|
|
23,844 |
|
|
22,812 |
|
|
21,893 |
|
|
U.S. Government settlement |
|
|
- |
|
|
- |
|
|
7,750 |
|
|
Total Operating Expenses |
|
|
163,387 |
|
|
151,984 |
|
|
155,681 |
|
|
Income From Operations |
|
|
60,256 |
|
|
79,955 |
|
|
80,511 |
|
|
Interest expense, net |
|
|
(692 |
) |
|
(334 |
) |
|
(305 |
) |
|
Other expense, net |
|
|
(1,121 |
) |
|
(367 |
) |
|
(426 |
) |
|
Income Before Income Taxes |
|
|
58,443 |
|
|
79,254 |
|
|
79,780 |
|
|
Provision for income taxes |
|
|
16,434 |
|
|
21,448 |
|
|
28,224 |
|
|
Net Income |
|
$ |
42,009 |
|
$ |
57,806 |
|
$ |
51,556 |
|
|
Earnings Per Share |
|
|
|
|
|
|
|
|
|
|
|
Basic |
|
$ |
2.76 |
|
$ |
3.69 |
|
$ |
3.24 |
|
|
Diluted |
|
$ |
2.73 |
|
$ |
3.64 |
|
$ |
3.21 |
|
|
|
|
|
|
|
|
|
|
|
|
|
|
Dividends declared per share |
|
$ |
1.20 |
|
$ |
1.20 |
|
$ |
1.05 |
|
The accompanying Notes to Consolidated Financial Statements are an integral part of these consolidated financial statements.
F-4
Consolidated Statements of Comprehensive Income
(For the
Fiscal Years Ended September 27, September 28 and September 29, respectively)
|
|
|
|
|
|
|
|
|
|
|
|
|
|
|
2014 |
|
2013 |
|
2012 |
|
|||
|
|
|
(expressed in thousands) |
|
|||||||
|
Net income |
|
$ |
42,009 |
|
$ |
57,806 |
|
$ |
51,556 |
|
|
Other comprehensive income (loss), net of tax: |
|
|
|
|
|
|
|
|
|
|
|
Foreign currency translation adjustments |
|
|
(5,099 |
) |
|
585 |
|
|
(2,123 |
) |
|
Derivative instruments: |
|
|
|
|
|
|
|
|
|
|
|
Unrealized net gain (loss) |
|
|
1,112 |
|
|
1,349 |
|
|
(291 |
) |
|
Net (gain) loss reclassified to earnings |
|
|
(691 |
) |
|
(464 |
) |
|
499 |
|
|
Defined benefit pension plan: |
|
|
|
|
|
|
|
|
|
|
|
Unrealized net (loss) gain |
|
|
(2,553 |
) |
|
(128 |
) |
|
(3,654 |
) |
|
Net loss reclassified to earnings |
|
|
324 |
|
|
363 |
|
|
54 |
|
|
Currency exchange rate change |
|
|
394 |
|
|
(269 |
) |
|
127 |
|
|
Other comprehensive (loss) income |
|
|
(6,513 |
) |
|
1,436 |
|
|
(5,388 |
) |
|
Comprehensive income |
|
$ |
35,496 |
|
$ |
59,242 |
|
$ |
46,168 |
|
The accompanying Notes to Consolidated Financial Statements are an integral part of these consolidated financial statements.
F-5
Consolidated
Statements of Shareholders’ Investment
(For the Fiscal Years Ended September 27, September 28 and September 29,
respectively, expressed in thousands)
|
|
|
|
|
|
|
|
|
|
|
|
|
|
|
|
|
|
|
|
|
|
|
|
|
|
Additional |
|
Retained |
|
Accumulated |
|
|
|
||||||||
|
|
|
Common Stock |
|
|
|
|
Total |
|
|||||||||||
|
|
|
Shares |
|
Amount |
|
|
|
|
|
||||||||||
|
|
|
|
|
|
|
|
|
||||||||||||
|
Balance, October 1, 2011 |
|
|
15,632 |
|
|
3,908 |
|
|
5,319 |
|
|
185,332 |
|
|
16,289 |
|
|
210,848 |
|
|
Total comprehensive income |
|
|
- |
|
|
- |
|
|
- |
|
|
51,556 |
|
|
(5,388 |
) |
|
46,168 |
|
|
Exercise of stock options |
|
|
491 |
|
|
123 |
|
|
17,132 |
|
|
- |
|
|
- |
|
|
17,255 |
|
|
Stock-based compensation |
|
|
40 |
|
|
10 |
|
|
3,422 |
|
|
- |
|
|
- |
|
|
3,432 |
|
|
Tax shortfall from equity compensation |
|
|
- |
|
|
- |
|
|
521 |
|
|
- |
|
|
- |
|
|
521 |
|
|
Issuance for employee stock purchase plan |
|
|
19 |
|
|
5 |
|
|
626 |
|
|
- |
|
|
- |
|
|
631 |
|
|
Common stock purchased and retired |
|
|
(542 |
) |
|
(136 |
) |
|
(26,368 |
) |
|
(8,819 |
) |
|
- |
|
|
(35,323 |
) |
|
Dividends, $1.05 per share |
|
|
- |
|
|
- |
|
|
- |
|
|
(16,813 |
) |
|
- |
|
|
(16,813 |
) |
|
Balance, September 29, 2012 |
|
|
15,640 |
|
|
3,910 |
|
|
652 |
|
|
211,256 |
|
|
10,901 |
|
|
226,719 |
|
|
Total comprehensive income |
|
|
- |
|
|
- |
|
|
- |
|
|
57,806 |
|
|
1,436 |
|
|
59,242 |
|
|
Exercise of stock options |
|
|
243 |
|
|
61 |
|
|
7,833 |
|
|
- |
|
|
- |
|
|
7,894 |
|
|
Stock-based compensation |
|
|
40 |
|
|
10 |
|
|
3,653 |
|
|
- |
|
|
- |
|
|
3,663 |
|
|
Tax benefit from equity compensation |
|
|
- |
|
|
- |
|
|
1,835 |
|
|
- |
|
|
- |
|
|
1,835 |
|
|
Issuance for employee stock purchase plan |
|
|
20 |
|
|
5 |
|
|
746 |
|
|
- |
|
|
- |
|
|
751 |
|
|
Common stock purchased and retired |
|
|
(535 |
) |
|
(134 |
) |
|
(14,719 |
) |
|
(9,914 |
) |
|
- |
|
|
(24,767 |
) |
|
Dividends, $1.20 per share |
|
|
- |
|
|
- |
|
|
- |
|
|
(18,800 |
) |
|
- |
|
|
(18,800 |
) |
|
Balance, September 28, 2013 |
|
|
15,408 |
|
|
3,852 |
|
|
- |
|
|
240,348 |
|
|
12,337 |
|
|
256,537 |
|
|
Total comprehensive income |
|
|
- |
|
|
- |
|
|
- |
|
|
42,009 |
|
|
(6,513 |
) |
|
35,496 |
|
|
Exercise of stock options |
|
|
182 |
|
|
46 |
|
|
6,680 |
|
|
- |
|
|
- |
|
|
6,726 |
|
|
Stock-based compensation |
|
|
31 |
|
|
7 |
|
|
6,045 |
|
|
- |
|
|
- |
|
|
6,052 |
|
|
Tax benefit from equity compensation |
|
|
- |
|
|
- |
|
|
1,727 |
|
|
- |
|
|
- |
|
|
1,727 |
|
|
Issuance for employee stock purchase plan |
|
|
16 |
|
|
4 |
|
|
860 |
|
|
- |
|
|
- |
|
|
864 |
|
|
Common stock purchased and retired |
|
|
(457 |
) |
|
(114 |
) |
|
(9,200 |
) |
|
(21,699 |
) |
|
- |
|
|
(31,013 |
) |
|
Dividends, $1.20 per share |
|
|
- |
|
|
- |
|
|
- |
|
|
(18,262 |
) |
|
- |
|
|
(18,262 |
) |
|
Balance, September 27, 2014 |
|
|
15,180 |
|
$ |
3,795 |
|
$ |
6,112 |
|
$ |
242,396 |
|
$ |
5,824 |
|
$ |
258,127 |
|
|
The accompanying Notes to Consolidated Financial Statements are an integral part of these consolidated financial statements. |
|
||||||||||||||||||
F-6
Consolidated
Statements of Cash Flows
(For the Fiscal Years Ended September 27, September 28, September 29,
respectively)
|
|
|
|
|
|
|
|
|
|
|
|
|
|
|
2014 |
|
2013 |
|
2012 |
|
|||
|
|
|
(expressed in thousands) |
|
|||||||
|
Cash Flows from Operating Activities: |
|
|
|
|
|
|
|
|
|
|
|
Net income |
|
$ |
42,009 |
|
$ |
57,806 |
|
$ |
51,556 |
|
|
Adjustments to reconcile net income to net cash provided by (used in) operating activities: |
|
|
|
|
|
|
|
|
|
|
|
Stock-based compensation |
|
|
5,761 |
|
|
3,736 |
|
|
3,372 |
|
|
Excess tax benefits from stock-based compensation |
|
|
(1,723 |
) |
|
(1,807 |
) |
|
(1,228 |
) |
|
Fair value adjustment to aquired inventory and deferred revenue |
|
|
564 |
|
|
- |
|
|
- |
|
|
Net periodic pension benefit cost |
|
|
1,098 |
|
|
1,288 |
|
|
664 |
|
|
Depreciation and amortization |
|
|
19,279 |
|
|
16,589 |
|
|
13,782 |
|
|
Deferred income taxes |
|
|
(5,912 |
) |
|
(1,010 |
) |
|
29 |
|
|
Bad debt provision (recovery) |
|
|
810 |
|
|
(160 |
) |
|
896 |
|
|
Changes in operating assets and liabilities: |
|
|
|
|
|
|
|
|
|
|
|
Accounts and unbilled contracts receivable |
|
|
(6,245 |
) |
|
(43,179 |
) |
|
(398 |
) |
|
Inventories |
|
|
(4,623 |
) |
|
(9,616 |
) |
|
(2,104 |
) |
|
Prepaid expenses |
|
|
805 |
|
|
(1,587 |
) |
|
(919 |
) |
|
Accounts payable |
|
|
(2,777 |
) |
|
(3,973 |
) |
|
5,922 |
|
|
Accrued payroll and related costs |
|
|
67 |
|
|
1,366 |
|
|
(2,257 |
) |
|
Advance payments from customers |
|
|
6,171 |
|
|
(21,082 |
) |
|
2,251 |
|
|
Accrued warranty costs |
|
|
(406 |
) |
|
632 |
|
|
(1,223 |
) |
|
Contributions to pension benefit plan |
|
|
(638 |
) |
|
(4,575 |
) |
|
(524 |
) |
|
Other assets and liabilities |
|
|
10,429 |
|
|
3,513 |
|
|
(4,794 |
) |
|
Net Cash Provided by (Used in) Operating Activities |
|
|
64,669 |
|
|
(2,059 |
) |
|
65,025 |
|
|
Cash Flows from Investing Activities: |
|
|
|
|
|
|
|
|
|
|
|
Purchases of property and equipment |
|
|
(20,038 |
) |
|
(29,690 |
) |
|
(15,625 |
) |
|
Purchases of business, net of acquired cash |
|
|
(14,192 |
) |
|
- |
|
|
- |
|
|
Net Cash Used in Investing Activities |
|
|
(34,230 |
) |
|
(29,690 |
) |
|
(15,625 |
) |
|
Cash Flows from Financing Activities: |
|
|
|
|
|
|
|
|
|
|
|
Net receipts (payments) under short-term borrowings |
|
|
24,102 |
|
|
34,708 |
|
|
(40,458 |
) |
|
Excess tax benefits from stock-based compensation |
|
|
1,723 |
|
|
1,807 |
|
|
1,228 |
|
|
Cash dividends |
|
|
(18,330 |
) |
|
(19,113 |
) |
|
(15,874 |
) |
|
Proceeds from exercise of stock options and employee stock purchase plan |
|
|
7,590 |
|
|
8,645 |
|
|
17,886 |
|
|
Payments to purchase and retire common stock |
|
|
(31,013 |
) |
|
(24,767 |
) |
|
(35,323 |
) |
|
Net Cash (Used in) Provided by Financing Activities |
|
|
(15,928 |
) |
|
1,280 |
|
|
(72,541 |
) |
|
Effect of Exchange Rate Changes on Cash and Cash Equivalents |
|
|
(2,447 |
) |
|
(1,050 |
) |
|
(1,102 |
) |
|
Cash and Cash Equivalents: |
|
|
|
|
|
|
|
|
|
|
|
Increase (decrease) during the year |
|
|
12,064 |
|
|
(31,519 |
) |
|
(24,243 |
) |
|
Balance, beginning of year |
|
|
48,333 |
|
|
79,852 |
|
|
104,095 |
|
|
Balance, end of year |
|
$ |
60,397 |
|
$ |
48,333 |
|
$ |
79,852 |
|
|
Supplemental Disclosures of Cash Flows: |
|
|
|
|
|
|
|
|
|
|
|
Cash paid during the year for: |
|
|
|
|
|
|
|
|
|
|
|
Interest |
|
$ |
594 |
|
$ |
146 |
|
$ |
947 |
|
|
Income taxes |
|
$ |
15,628 |
|
$ |
22,565 |
|
$ |
33,789 |
|
|
Non-cash financing activities: |
|
|
|
|
|
|
|
|
|
|
|
Accrued contingent consideration |
|
$ |
650 |
|
$ |
- |
|
$ |
- |
|
|
Dividends declared not yet paid |
|
$ |
4,476 |
|
$ |
4,545 |
|
$ |
4,858 |
|
|
The accompanying Notes to Consolidated Financial Statements are an integral part of these consolidated financial statements. |
||||||||||
F-7
Notes to Consolidated Financial Statements
1. Summary of Significant Accounting Policies:
Nature of Operations
MTS Systems Corporation is a leading global supplier
of high-performance test systems and position sensors. The Company’s testing
hardware and software solutions help customers accelerate and improve their
design, development, and manufacturing processes and are used for determining
the mechanical behavior of materials, products, and structures. MTS’
high-performance position sensors provide controls for a variety of industrial
and vehicular applications.
Fiscal Year
The Company’s fiscal year ends on the Saturday closest
to September 30. The Company’s fiscal years ended September 27, 2014, September
28, 2013 and September 29, 2012 consisted of 52 weeks.
Consolidation
The Consolidated Financial Statements include the accounts of MTS Systems
Corporation and its wholly owned subsidiaries (the “Company”). Significant
intercompany balances and transactions have been eliminated.
Revenue Recognition
The Company recognizes revenue on a sales arrangement when it is realized or
realizable and earned, which occurs when all of the following criteria have
been met: persuasive evidence of an arrangement exists; delivery and title
transfer has occurred or services have been rendered; the sales price is fixed
and determinable; collectability is reasonably assured; and all significant
obligations to the customer have been fulfilled.
Orders that are manufactured and delivered in less than six months with routine installations and no special acceptance protocols may contain multiple elements for revenue recognition purposes. The Company considers each deliverable that provides value to the customer on a standalone basis a separable element. Separable elements in these arrangements may include the design and manufacture of hardware and essential software, installation services, training and/or post contract software maintenance and support. The Company initially allocates consideration to each separable element using the relative selling price method. Selling prices are determined by the Company based on either vendor-specific objective evidence (“VSOE”) (the actual selling prices of similar products and services sold on a standalone basis) or, in the absence of VSOE, the Company’s best estimate of the selling price. Factors considered by the Company in determining estimated selling prices for applicable elements generally include overall economic conditions, customer demand, costs incurred by the Company to provide the deliverable, as well as the Company’s historical pricing practices. Under these arrangements, revenue associated with each delivered element is recognized in an amount equal to the lesser of the consideration initially allocated to the delivered element or the amount for which payment is not deemed contingent upon future delivery of other elements in the arrangement. Under arrangements where special acceptance protocols exist, installation services and training are not considered separable. Accordingly, revenue for the entire arrangement is recognized upon the completion of installation, training and fulfillment of any other significant obligations specific to the terms of the arrangement. Arrangements that do not contain any separable elements are typically recognized when the products are shipped and title has transferred to the customer.
Certain contractual arrangements require longer production periods, generally longer than six months (long-term contracts), and may contain non-routine installations and special acceptance protocols. These arrangements often include hardware and essential software, installation services, training and support. Long-term contractual arrangements involving essential software typically include significant production, modification, and customization. For long-term arrangements with essential software and all other long-term arrangements with complex installations and/or unusual acceptance protocols, revenue is recognized using the percentage-of-completion method, based on the cost incurred to-date relative to estimated total cost of the contract. Elements of an arrangement that do not separately fall within the scope of the percentage of completion method (e.g. training and post contract software maintenance and support) are recognized as the service is provided in amounts determined based on VSOE, or in the absence of VSOE, the Company’s best estimate of the selling price.
F-8
Under the terms of the Company’s long-term contracts, revenue recognized using the percentage-of-completion method may not, in certain circumstances, be invoiced until completion of contractual milestones, upon shipment of the equipment, or upon installation and acceptance by the customer. Unbilled amounts for these contracts appear in the Consolidated Balance Sheets as Unbilled Accounts Receivable.
Revenue from arrangements for services such as maintenance, repair, consulting and technical support are recognized either as the service is performed or ratably over the defined contractual period for service maintenance contracts. Revenue from post contract software maintenance and support services is recognized ratably over the defined contractual period of the maintenance agreement.
The Company’s sales arrangements typically do not include specific performance-, cancellation-, termination-, or refund-type provisions. In the event a customer cancels a contractual arrangement, the Company would typically be entitled to receive reimbursement from the customer for actual costs incurred under the arrangement plus a reasonable margin.
Revenue is recorded net of taxes collected from customers that are remitted to governmental authorities, with the collected taxes recorded as current liabilities until remitted to the relevant government authority.
Shipping and Handling
Freight revenue billed to customers is reported within
Revenue on the Consolidated Statements of Income, and expenses incurred for
shipping products to customers are reported within Cost of Sales on the
Consolidated Statements of Income.
Research and Development
Research and development costs associated with new products are charged to
operations as incurred.
Foreign Currency
The financial position and results of operations of
the Company’s foreign subsidiaries are measured using local currency as the
functional currency. Assets and liabilities are translated using fiscal
period-end exchange rates, and monthly statements of income are translated
using average exchange rates applicable to each month, with the resulting
translation adjustments recorded as a separate component of Shareholders’
Investment. Gains and losses from foreign currency transactions are recognized
in the Consolidated Statements of Income. The Company recorded net foreign
currency transaction losses of ($1.4) million, ($1.7) million, and ($1.8)
million during the fiscal year ended September 27, 2014, September 28, 2013,
and September 29, 2012, respectively.
Cash and Cash Equivalents
Cash and cash equivalents represent cash, demand
deposits, and highly liquid investments with original maturities of three
months or less. Cash equivalents are recorded at cost, which approximates fair
value. Cash equivalents, both inside and outside the United States, are
invested in bank deposits and/or money market funds and are held in local
currency denominations.
Accounts Receivable and Long-Term Contracts
The Company grants credit to customers, but it
generally does not require collateral or other security from domestic
customers. When deemed appropriate, receivables from customers located outside
the United States are supported by letters of credit from financial
institutions. The allowance for doubtful accounts is based on management’s
assessment of the collectability of specific customer accounts and includes
consideration of the credit worthiness and financial condition of those specific
customers. The Company records an allowance to reduce receivables to the amount
that is reasonably believed to be collectible and considers
factors such as the financial condition of the customer and the aging of the
receivables. If there is a deterioration of a customer’s financial condition,
if the Company becomes aware of additional information related to the credit
worthiness of a customer, or if future actual default rates on trade
receivables in general differ from those currently anticipated, the Company may
have to adjust its allowance for doubtful accounts, which would affect earnings
in the period the adjustments were made.
F-9
The Company enters into long-term contracts for customized equipment sold to its customers. Under the terms of such contracts, revenue recognized using the percentage-of-completion method may be invoiced upon completion of contractual milestones, shipment to the customer, or installation and customer acceptance. Unbilled amounts relating to these contracts are reflected as Unbilled Accounts Receivable in the accompanying Consolidated Balance Sheets. Amounts unbilled at September 27, 2014 are expected to be invoiced during fiscal year 2015.
Inventories
Inventories consist of material, labor, and overhead costs and are stated at
the lower of cost or market value, determined under the first-in, first-out
accounting method. Inventories at September 27, 2014 and September 28, 2013
were as follows:
|
|
|
|
|
|
|
|
|
|
|
|
2014 |
|
2013 |
|
||
|
|
|
(expressed in thousands) |
|
||||
|
Customer projects in various stages of completion |
|
$ |
22,559 |
|
$ |
19,194 |
|
|
Components, assemblies and parts |
|
|
60,998 |
|
|
58,795 |
|
|
Total |
|
$ |
83,557 |
|
$ |
77,989 |
|
Software Development Costs
The Company capitalizes certain software development costs related to software
to be sold, leased, or otherwise marketed. Capitalized software development
costs include purchased materials and services, salary and benefits of the
Company’s development and technical support staff, and other costs associated
with the development of new products and services. Software development costs
are expensed as incurred until technological feasibility has been established,
at which time future costs incurred are capitalized until the product is
available for general release to the public. Based on the Company’s product
development process, technological feasibility is generally established once
product and detailed program designs have been completed, uncertainties related
to high-risk development issues have been resolved through coding and testing,
and the Company has established that the necessary skills, hardware, and
software technology are available for production of the product. Once a
software product is available for general release to the public, capitalized development
costs associated with that product will begin to be amortized to cost of sales
over the product’s estimated economic life, using the greater of straight-line
or a method that results in cost recognition in future periods that is
consistent with the anticipated timing of product revenue recognition.
The Company’s capitalized software development costs are subject to an ongoing assessment of recoverability, which is impacted by estimates and assumptions of future revenues and expenses for these software products, as well as other factors such as changes in product technologies. Any portion of unamortized capitalized software development costs that are determined to be in excess of net realizable value will be expensed in the period such a determination is made. The Company capitalized $0.9 million and $0.5 million of software development costs during the fiscal years ended September 27, 2014 and September 29, 2012. No software development costs were capitalized during the fiscal year ended September 28, 2013. Amortization expense for software development costs was $2.8 million, $2.8 million and $2.6 million for the fiscal years ended September 27, 2014, September 28, 2013 and September 29, 2012, respectively. See Note 3 to the Consolidated Financial Statements for additional information on capitalized software development costs.
F-10
Impairment of Long-lived Assets
The Company reviews the carrying value of long-lived
assets or asset groups, such as property and equipment and intangibles subject
to amortization, when events or changes in circumstances such as asset utilization,
physical change, legal factors, or other matters indicate that the carrying
value may not be recoverable. When this review indicates the carrying value of
an asset or asset group exceeds the sum of the undiscounted cash flows expected
to result from the use and eventual disposition of the asset or asset group,
the Company recognizes an asset impairment charge against operations. The
amount of the impairment loss recorded is the amount by which the carrying
value of the impaired asset or asset group exceeds its fair value.
Property and Equipment
Property and equipment is stated at cost. Additions,
replacements, and improvements are capitalized at cost, while maintenance and
repairs are charged to operations as incurred. Depreciation is recorded over
the following estimated useful lives of the property:
Buildings
and improvements: 10 to 40 years
Machinery and
equipment: 3 to 10 years
Building and equipment additions are generally depreciated on a straight-line basis for financial reporting purposes and on an accelerated basis for income tax purposes. See Note 3 to the Consolidated Financial Statements for additional information on property and equipment.
Goodwill and Intangible Assets
Goodwill represents the excess of acquisition costs
over the fair value of the net assets of businesses acquired. Goodwill is not
amortized, but instead tested at least annually for impairment. Goodwill is
also tested for impairment as changes in circumstances occur indicating that
the carrying value may not be recoverable. Goodwill impairment testing first
requires a comparison of the fair value of each reporting unit to the carrying
value. If the carrying value of the reporting unit exceeds fair value, goodwill
is considered impaired.
As of September 27, 2014, the Company has three reporting units, all of which are assigned goodwill. At September 27, 2014, the Test reporting unit was assigned $15.0 million of goodwill which includes the former SANS reporting unit, REI was assigned $9.6 million as a result of the June 17, 2014 acquisition and the Sensors reporting unit was assigned $1.5 million of goodwill. At September 28, 2013, we had three reporting units, of which the SANS reporting unit and the Sensors reporting unit were assigned goodwill. There was no goodwill assigned to the Test reporting unit. During the fourth quarter of fiscal year 2014, we determined the former SANS reporting unit should be aggregated with the Test reporting unit as it has become fully integrated within our Test reporting unit. Prior to aggregating the former reporting unit, we performed a test to determine whether or not there was any impairment of the $15.0 million in goodwill assigned to SANS and determined that no impairment exists. The fair value of a reporting unit is estimated using a discounted cash flow model that requires input of certain estimates and assumptions requiring our judgment, including projections of economic conditions and customer demand, revenue and margins, changes in competition, operating costs, and new product introductions.
At September 27, 2014 the estimated fair value of the reporting units assigned $15.0 million and $1.5 million are substantially in excess of the respective carrying values and the fair value of the reporting unit assigned $9.6 million of goodwill approximates its purchase price due to its recent acquisition. While we believe the estimates and assumptions used in determining the fair value of our reporting units are reasonable, significant changes in estimates of future cash flows, such as those caused by unforeseen events or changes in market conditions, could materially impact the fair value of a reporting unit which could result in the recognition of a goodwill impairment charge.
Intangible assets with finite lives are amortized on a straight-line basis over the expected period to be benefited by future cash flows, and reviewed for impairment. Fair values of goodwill and intangible assets are primarily determined using discounted cash flow analyses. At both September 27, 2014 and September 28, 2013, the Company determined there was no impairment of its goodwill or intangible assets. See Note 3 to the Consolidated Financial Statements for additional information on goodwill and intangible assets.
Other Assets
Other assets at September 27, 2014 and September 28,
2013 primarily consisted of security deposits paid on leased property and cash
redemption values on group insurance policies.
F-11
Warranty Obligations
Sales of the Company’s products and systems are subject to limited warranty
obligations that are included in customer contracts. For sales that include
installation services, warranty obligations typically extend for a period of
twelve to twenty-four months from the date of either shipment or acceptance.
Product obligations typically
extend for a period of twelve to twenty-four months from the date of purchase.
Under the terms of these warranties, the Company is obligated to repair or
replace any components or assemblies it deems defective due to workmanship or
materials. The Company reserves the right to reject warranty claims where it
determines that failure is due to normal wear, customer modifications, improper
maintenance, or misuse. The Company records general warranty provisions based
on an estimated warranty expense percentage applied to current period revenue.
The percentage applied reflects historical warranty claims experience over the
preceding twelve-month period. Both the experience percentage and the warranty
liability are evaluated on an ongoing basis for adequacy. In addition, warranty
provisions are also recognized for certain nonrecurring product claims that are
individually significant.
Warranty provisions and claims for the years ended September 27, 2014 and September 28, 2013, were as follows:
|
|
|
|
|
|
|
|
|
|
|
|
2014 |
|
2013 |
|
||
|
|
|
(expressed in thousands) |
|
||||
|
Beginning balance |
|
$ |
4,694 |
|
$ |
3,984 |
|
|
Warranty claims |
|
|
(6,973 |
) |
|
(6,267 |
) |
|
Warranty provisions |
|
|
6,352 |
|
|
6,748 |
|
|
Adjustments to preexisting warranties |
|
|
220 |
|
|
151 |
|
|
Currency Translation |
|
|
(7 |
) |
|
78 |
|
|
Ending balance |
|
$ |
4,286 |
|
$ |
4,694 |
|
Derivative Financial Instruments
The Company’s results of operations could be materially impacted by changes in
foreign currency exchange rates, as well as interest rates on its floating rate
indebtedness. In an effort to manage exposure to these risks, the Company
periodically enters into forward and option currency exchange contracts,
interest rate swaps and forward interest rate swaps. Since the market value of
these hedging contracts is derived from current market rates, they are
classified as derivative financial instruments. The Company does not use
derivatives for speculative or trading purposes. The derivative contracts
contain credit risk to the extent that the Company’s bank counterparties may be
unable to meet the terms of the agreements. The amount of such credit risk is
generally limited to the unrealized gains, if any, in such contracts. Such risk
is minimized by limiting those counterparties to major financial institutions
of high credit quality. For derivative instruments executed under master
netting arrangements, the Company has the contractual right to offset fair
value amounts recognized for the right to reclaim cash collateral with
obligations to return cash collateral. The Company does not offset fair value
amounts recognized on these derivative instruments. At both September 27, 2014
and September 28, 2013, the Company did not have any foreign exchange contracts
with credit-risk related contingent features. See Note 5 to the Consolidated
Financial Statements for additional information on derivatives and hedging activities.
Income Taxes
The Company records a tax provision for the
anticipated tax consequences of the reported results of operations. Deferred
tax assets and liabilities are measured using the currently enacted tax rates
that apply to taxable income in effect for the years in which those deferred
tax assets and liabilities are expected to be realized or settled. The Company
records a valuation allowance to reduce deferred tax assets to the amount that
is believed more likely than not to be realized. The Company believes it is
more likely than not that forecasted income, including income that may be
generated as a result of certain tax planning strategies, together with the tax
effects of the deferred tax liabilities, will be sufficient to fully recover
the remaining net realizable value of its deferred tax assets. In the event
that all or part of the net deferred tax assets are determined not to be
realizable in the future, an adjustment to the valuation allowance would be
charged to earnings in the period such determination is made. In addition, the
calculation of tax liabilities involves significant judgment in estimating the
impact of uncertainties in the application of complex tax laws. Resolution of
these uncertainties in a manner inconsistent with management’s expectations
could have a material
impact on the Company’s financial condition and operating results. See Note 8
to the Consolidated Financial Statements for additional information on income
taxes.
F-12
Earnings Per Common Share
Basic earnings per share are computed by dividing net earnings by the daily
weighted average number of common shares outstanding during the applicable
periods. Using the treasury stock method, diluted earnings per share includes
the potentially dilutive effect of common shares issued in connection with
outstanding stock-based compensation options and grants. Under the treasury
stock method, shares associated with certain stock options have been excluded
from the diluted weighted average shares outstanding calculation because the
exercise of those options would lead to a net reduction in common shares
outstanding. As a result, stock options to acquire 0.3 million, less than 0.1
million, and 0.4 million weighted common shares have been excluded from the
diluted weighted shares outstanding calculation for the fiscal year ended
September 27, 2014, September 28, 2013, and September 29, 2012, respectively.
The potentially dilutive effect of common shares issued in connection with
outstanding stock options is determined based on net income. A reconciliation
of these amounts is as follows:
|
|
|
|
|
|
|
|
|
|
|
|
|
|
|
2014 |
|
2013 |
|
2012 |
|
|||
|
|
|
(expressed in thousands, except per share data) |
|
|||||||
|
Net income |
|
$ |
42,009 |
|
$ |
57,806 |
|
$ |
51,556 |
|
|
Weighted average common shares outstanding |
|
|
15,218 |
|
|
15,664 |
|
|
15,913 |
|
|
Dilutive potential common shares |
|
|
179 |
|
|
197 |
|
|
164 |
|
|
Weighted average dilutive common shares outstanding |
|
|
15,397 |
|
|
15,861 |
|
|
16,077 |
|
|
Earnings per share: |
|
|
|
|
|
|
|
|
|
|
|
Basic |
|
$ |
2.76 |
|
$ |
3.69 |
|
$ |
3.24 |
|
|
Diluted |
|
$ |
2.73 |
|
$ |
3.64 |
|
$ |
3.21 |
|
Stock Purchases
During fiscal year 2012, the Company entered into an accelerated share purchase
agreement with an unrelated third-party investment bank. In connection with the
agreement, the Company made an initial $35.0 million payment to the investment
bank and immediately received an initial delivery of approximately 0.5 million
shares of its common stock with a fair value of $28.0 million as of the
purchase date. Effective as of the date of the initial 0.5 million stock
purchase, the transaction was accounted for as a share retirement, resulting in
a reduction of common stock, additional paid-in capital and retained earnings
of $0.1 million, $26.1 million and $1.8 million, respectively. The remaining
$7.0 million of the Company’s initial payment to the investment bank was
reported as a reduction in retained earnings. The agreement specified that the
Company had the option to settle any obligation that it may have at the conclusion
of the contract in either cash or shares of the Company’s common stock. These
settlement alternatives had the same economic value to the Company. Based on
the facts, during the entire term of the agreement, the forward contract met
the requirements of ASC 480-10 and ASC 815-40 to be classified as permanent
equity.
During fiscal year 2013, the Company received approximately 0.1 million shares of its common stock from the bank pursuant to the settlement of the accelerated share purchase program. The amount of shares received at settlement was determined based on the volume weighted average price of the Company’s stock during the purchase period. Upon settlement of the contract, the Company accounted for the 0.1 million shares received as a share retirement, resulting in a less than $0.1 million reduction and corresponding increase in common stock and paid-in capital, respectively.
Stock-Based Compensation
The Company measures the cost of employee services
received in exchange for the award of equity instruments based on the fair
value of the award at the date of grant, and recognizes the cost over the
period during which an employee is required to provide services in exchange for
the award.
F-13
For purposes of determining estimated fair value of stock-based payment awards, the Company utilizes a Black-Scholes option pricing model, which requires the input of certain assumptions requiring management judgment. Because the Company’s employee stock option awards have characteristics significantly different from those of traded options, and because changes in the input assumptions can materially affect fair value estimates, existing models may not provide a reliable single measure of the fair value of employee stock options. Management will continue to assess the assumptions and methodologies used to calculate estimated fair value of stock-based compensation. Circumstances may change and additional data may become available over time that could result in changes to these assumptions and methodologies and thereby materially impact the fair value determination of future grants of stock-based payment awards. If factors change and the Company employs different assumptions in future periods, the compensation expense recorded may differ significantly from the stock-based compensation expense recorded in the current period. See Note 2 to the Consolidated Financial Statements for additional information on stock-based compensation.
Loss Contingencies
The Company establishes an accrual for loss contingencies when it is both
probable that an asset has been impaired or a liability has been incurred, and
the amount of the loss can be reasonably estimated. When loss contingencies are
not probable and cannot be reasonably estimated, the Company does not establish
an accrual. However, when there is at least a reasonable possibility that a
loss has been incurred, but it is not probable or reasonably estimated, the
Company discloses the nature of the loss contingency and an estimate of the
possible loss or range of loss, as applicable. Any adjustment made to a loss
contingency accrual during an accounting period affects the earnings of the
period.
Use of Estimates
The preparation of financial statements in accordance with U.S. generally
accepted accounting principles requires management to make estimates and
assumptions that affect the reported amounts of assets and liabilities,
disclosure of contingent assets and liabilities as of the date of the financial
statements, and reported amounts of revenue and expense during the reporting
period. Additionally, the Company frequently undertakes significant
technological innovation on certain of its long-term contracts, involving
performance risk that may result in delayed delivery of product and/or revenue
and gross profit variation due to changes in the ultimate costs of these
contracts versus estimates. On an ongoing basis the Company evaluates its
estimates including those related to receivables, inventory, property plant and
equipment, intangible assets, warranties, accrued expenses, share-based
compensation, income taxes, capitalized software among others. Actual results
could differ from those estimates.
Recent Accounting Pronouncements
In December 2011, the Financial Accounting Standards Board (“FASB”) issued ASU
No. 2011-11, “Balance Sheet (Topic 210): Disclosures about Offsetting Assets
and Liabilities” (“ASU 2011011”), which requires an entity to disclose
information about derivatives subject to enforceable master netting
arrangements, including rights of offset, to enable users of its financial
statements to understand the effect of those arrangements on its financial
position. Subsequently, in January 2013, the FASB issued ASU 2013-01, “Balance
Sheet (Topic 210): Clarifying the Scope of Disclosures about Offsetting Assets and
Liabilities” (“ASU 2013-01”), which clarifies the instruments and transactions
that are subject to the offsetting disclosure requirements established by ASU
2011-11. The Company adopted ASU 2011-11 and ASU 2013-01 during the first
quarter of fiscal year 2014, and the presentation and disclosure requirements
were applied retrospectively. Other than the enhanced disclosures, the adoption
of these pronouncements did not impact the Company’s financial position,
results of operations or cash flows.
In May 2014, FASB issued ASU No. 2014-09, “Revenue from Contracts with customers (Topic 606)”. This update clarifies the principles for revenue recognition in transactions involving contracts with customers. The new revenue recognition model provides a five-step analysis in determining when and how revenue is recognized. The new model will require revenue recognition to depict the transfer of promised goods or services to a customer in an amount that reflects the consideration a company expects to receive in exchange for those goods or services. The guidance will be effective for the Company’s interim and annual reporting periods beginning after December 15, 2016, which is the Company’s fiscal year 2018. Early adoption is not permitted. The Company has not yet evaluated what impact, if any, the adoption of this guidance may have on the Company’s financial condition, results of operations, or disclosures.
F-14
2. Stock-Based Compensation:
The Company compensates its officers, directors, and employees with stock-based compensation under the stock plan approved by the Company’s shareholders in 2011, and administered under the supervision of the Company’s Board of Directors. During fiscal year 2013, the Company’s shareholders approved a 1.3 million increase in the number of shares that can be issued under the 2011 stock plan, bringing the aggregate total to 2.3 million. During the years ended September 27, 2014, September 28, 2013 and September 29, 2012, the Company awarded stock options and restricted stock units under the 2011 plan. During the years ended September 28, 2013 and September 29, 2012, the Company awarded restricted stock grants under the 2011 plan. At September 27, 2014, a total of 1,288,160 shares were available for future grant under the 2011 plan. Shares will be available for issuance under the 2011 stock plan until January 31, 2018.
During the fiscal year ended October 1, 2011, the Company’s shareholders approved a 2012 Employee Stock Purchase Program (“ESPP”) which was effective on January 1, 2012. The 2002 ESPP expired, and no further share issuances occurred after December 31, 2011. During the years ended September 27, 2014, September 28, 2013 and September 29, 2012, the Company issued shares of its common stock to participants under the 2012 ESPP. At September 27, 2014, a total of 703,890 shares were available for ESPP share issuances under the 2012 stock plan. Shares will be available for issuance under the 2012 ESPP until December 31, 2021.
Stock-Based Compensation Expense
Stock-based compensation expense for the fiscal years
ended September 27, 2014, September 28, 2013, and September 29, 2012 was as
follows (in thousands):
|
|
|
|
|
|
|
|
|
|
|
|
|
|
|
2014 |
|
2013 |
|
2012 |
|
|||
|
|
|
|
|
|
|
|
|
|
|
|
|
Stock-based compensation expense by type of award: |
|
|
|
|
|
|
|
|
|
|
|
Employee stock options |
|
$ |
2,769 |
|
$ |
1,811 |
|
$ |
1,599 |
|
|
Employee stock purchase plan (ESPP) |
|
|
212 |
|
|
199 |
|
|
184 |
|
|
Restricted stock and restricted stock units |
|
|
3,073 |
|
|
1,653 |
|
|
1,650 |
|
|
Amounts capitalized as inventory |
|
|
(1,608 |
) |
|
(806 |
) |
|
(742 |
) |
|
Amounts recognized in income for amounts previously capitalized as inventory |
|
|
1,315 |
|
|
879 |
|
|
681 |
|
|
|
|
|
|
|
|
|
|
|
|
|
|
Total stock-based compensation included in income from operations |
|
|
5,761 |
|
|
3,736 |
|
|
3,372 |
|
|
Income tax benefit on stock-based compensation |
|
|
(1,999 |
) |
|
(1,277 |
) |
|
(1,161 |
) |
|
Net compensation expense included in net income |
|
$ |
3,762 |
|
$ |
2,459 |
|
$ |
2,211 |
|
At September 27, 2014, there was $2.9 million of total stock option expense related to non-vested awards not yet recognized, which is expected to be recognized over a weighted average period of approximately 1.1 years. At September 27, 2014, there was $2.9 million and $0.1 million of total restricted stock expense related to non-vested awards of restricted stock units and restricted stock, respectively, not yet recognized, each of which is expected to be recognized over a weighted average period of approximately 1.1 years.
F-15
The fair value of stock options granted under stock-based compensation programs has been estimated as of the date of each grant using the multiple option form of the Black-Scholes valuation model, based on the grant price and assumptions regarding the expected grant life, stock price volatility, dividends, and risk-free interest rates. Each vesting period of an option award is valued separately, with this value being recognized evenly over the vesting period. The weighted average per share fair value of stock options granted during the fiscal years ended September 27, 2014, September 28, 2013, and September 29, 2012 was $14.32, $10.25 and $8.36, respectively. The weighted average assumptions used to determine fair value of stock options granted during those fiscal years were as follows:
|
|
|
|
|
|
|
|
|
|
|
|
|
|
|
2014 |
|
2013 |
|
2012 |
|
|||
|
Expected life (in years) |
|
|
4.1 |
|
|
3.1 |
|
|
3.5 |
|
|
Risk-free interest rate |
|
|
1.1 |
% |
|
0.4 |
% |
|
0.5 |
% |
|
Expected volatility |
|
|
31.3 |
% |
|
33.8 |
% |
|
34.5 |
% |
|
Dividend yield |
|
|
1.8 |
% |
|
2.3 |
% |
|
2.5 |
% |
The expected life represents the period that the stock option awards are expected to be outstanding and was determined based on historical and anticipated future exercise and expiration patterns. The risk-free interest rate used is based on the yield of constant maturity U.S. Treasury bonds on the grant date with a remaining term equal to the expected life of the grant. The Company estimates stock price volatility based on a historical weekly price observation. The dividend yield assumption is based on the annualized current dividend divided by the share price on the grant date.
Awards of both restricted stock and restricted stock units are valued based on the market value of the Company’s shares at the date of grant. The value of restricted stock and restricted stock units is allocated to expense evenly over the restricted period. Employee stock purchase plan share awards are valued based on the value of the discount feature plus the fair value of the optional features, which is determined as of the date of grant using the Black-Scholes valuation model. The value of these share awards is allocated to expense evenly over each purchase period.
Stock Options
Stock options are granted at exercise prices equal to
the closing market price of the Company’s stock on the date of grant.
Generally, options vest proportionally on the first three anniversaries of the
grant date and expire five years from the grant date.
Stock option activity for the fiscal years ended September 27, 2014, September 28, 2013, and September 29, 2012 was as follows (in thousands, except per share amounts):
|
|
|
|
|
|
|
|
|
|
|
|
|
|
|
|
|
|
|
|
|
|
|
|
2014 |
|
2013 |
|
2012 |
|
||||||||||||
|
|
|
Shares |
|
WAEP* |
|
Shares |
|
WAEP* |
|
Shares |
|
WAEP* |
|
||||||
|
Options outstanding at beginning of year |
|
|
518 |
|
$ |
39.52 |
|
|
754 |
|
$ |
36.84 |
|
|
1,048 |
|
$ |
35.80 |
|
|
Granted |
|
|
355 |
|
$ |
65.34 |
|
|
24 |
|
$ |
52.81 |
|
|
324 |
|
$ |
40.14 |
|
|
Exercised |
|
|
(182 |
) |
$ |
37.01 |
|
|
(243 |
) |
$ |
32.51 |
|
|
(491 |
) |
$ |
35.17 |
|
|
Forfeited or expired |
|
|
(57 |
) |
$ |
51.45 |
|
|
(17 |
) |
$ |
39.21 |
|
|
(127 |
) |
$ |
43.79 |
|
|
Options outstanding at end of year |
|
|
634 |
|
$ |
53.72 |
|
|
518 |
|
$ |
39.52 |
|
|
754 |
|
$ |
36.84 |
|
|
Options eligible for exercise at year-end |
|
|
194 |
|
$ |
40.36 |
|
|
226 |
|
$ |
36.45 |
|
|
249 |
|
$ |
31.02 |
|
|
*Weighted Average Exercise Price |
|
|
|
|
|
|
|
|
|
|
|
|
|
|
|
|
|
|
|
Prior to the fiscal year ended September 28, 2013 the Company’s historical practice was to grant an annual Company-wide award of stock options to officers and employees in July. The timing of the Company-wide award was changed from July to December beginning in December 2013 and for each subsequent fiscal year thereafter so that the grants will be aligned with a review of individual and Company performance. As a consequence of this timing shift, the only stock option awards granted during the fiscal year ended September 28, 2013 were related to inducement grants for a new officer as well as other new employees. During fiscal year 2014 the annual grant was adjusted to make grantees whole as a result of the delay in the grant.
F-16
Options outstanding at September 27, 2014 had a weighted average remaining contractual term of 4.3 years, and an aggregate intrinsic value of $9.6 million. Options eligible for exercise at September 27, 2014 had a weighted average remaining contractual term of 2.2 years, and an aggregate intrinsic value of $5.5 million.
The total intrinsic value of stock options exercised during the fiscal years ended September 27, 2014, September 28, 2013, and September 29, 2012 was $5.8 million, $6.2 million and $5.8 million, respectively.
Restricted Stock
The Company awards directors and key employees
restricted stock units. Directors vest in the restricted stock units over one
year, and they are entitled to cash dividend equivalents on unvested shares,
but they do not receive voting right on the unvested shares and the sale and
transfer of these units is restricted during the vesting period. Restricted
stock units awarded to employees vest over three years and participants are not
entitled to cash dividends and voting rights on unvested units. Additionally,
in fiscal years 2012 and 2013 the Company awarded restricted stock to its
directors also with a vesting period of three years. For restricted stock
awarded to directors, participants are entitled to cash dividends and voting
rights on unvested shares, but the sale and transfer of these shares is
restricted during the vesting period.
Restricted stock activity for the fiscal years ended September 27, 2014, September 28, 2013, and September 29, 2012 was as follows (in thousands, except per share amounts):
|
|
|
|
|
|
|
|
|
|
|
|
|
|
|
|
|
|
|
|
|
|
|
|
2014 |
|
2013 |
|
2012 |
|
||||||||||||
|
|
|
Shares |
|
WAGDFV* |
|
Shares |
|
WAGDFV* |
|
Shares |
|
WAGDFV* |
|
||||||
|
Unvested shares at beginning of year |
|
|
24 |
|
$ |
51.68 |
|
|
27 |
|
$ |
41.52 |
|
|
30 |
|
$ |
33.61 |
|
|
Granted |
|
|
- |
|
$ |
- |
|
|
12 |
|
$ |
56.44 |
|
|
12 |
|
$ |
49.03 |
|
|
Vested |
|
|
(14 |
) |
$ |
49.71 |
|
|
(15 |
) |
$ |
37.20 |
|
|
(15 |
) |
$ |
31.26 |
|
|
Forfeited |
|
|
(1 |
) |
$ |
53.99 |
|
|
- |
|
$ |
- |
|
|
- |
|
$ |
- |
|
|
Unvested shares at end of year |
|
|
9 |
|
$ |
54.16 |
|
|
24 |
|
$ |
51.68 |
|
|
27 |
|
$ |
41.52 |
|
|
*Weighted Average Grant Date Fair Value |
|
||||||||||||||||||
Restricted stock unit activity for the fiscal years ended September 27, 2014, September 28, 2013, and September 29, 2012 was as follows (in thousands, except per share amounts):
|
|
|
|
|
|
|
|
|
|
|
|
|
|
|
|
|
|
|
|
|
|
|
|
2014 |
|
2013 |
|
2012 |
|
||||||||||||
|
|
|
Shares |
|
WAGDFV* |
|
Shares |
|
WAGDFV* |
|
Shares |
|
WAGDFV* |
|
||||||
|
Outstanding at beginning of year |
|
|
38 |
|
$ |
40.91 |
|
|
62 |
|
$ |
38.90 |
|
|
37 |
|
$ |
33.37 |
|
|
Granted |
|
|
88 |
|
$ |
63.86 |
|
|
3 |
|
$ |
55.38 |
|
|
60 |
|
$ |
39.26 |
|
|
Vested |
|
|
(17 |
) |
$ |
41.01 |
|
|
(26 |
) |
$ |
37.61 |
|
|
(26 |
) |
$ |
32.68 |
|
|
Forfeited |
|
|
(11 |
) |
$ |
50.10 |
|
|
(1 |
) |
$ |
40.79 |
|
|
(9 |
) |
$ |
29.90 |
|
|
Outstanding at end of year |
|
|
98 |
|
$ |
60.51 |
|
|
38 |
|
$ |
40.91 |
|
|
62 |
|
$ |
38.90 |
|
|
*Weighted Average Grant Date Fair Value |
|||||||||||||||||||
Prior to the fiscal year ended September 28, 2013 the Company’s historical practice was to grant an annual Company-wide award of restricted stock units to officers and employees in July. The timing of the Company-wide award was changed from July to December so that the grants will be aligned with a review of individual and Company performance. As a consequence of this timing shift, the only restricted stock units granted during the fiscal year ended September 28, 2013 were related to inducement grants for a new officer as well as other new employees.
F-17
Employee Stock Purchase Plan
The Company’s U.S. employees are eligible to
participate in the Company’s Employee Stock Purchase Plan (“ESPP”). Employee
purchases of Company stock are funded by payroll deductions over calendar
six-month periods. The purchase price is 85% of the lower of the market price
at either the beginning or end of the six-month period. The shares are required
to be held by the employee for at least eighteen months subsequent to the
purchase. Two purchase periods closed in fiscal year 2014 with the combined
issuance of 16,295 shares at a weighted average price of $53.01. In fiscal
years 2013 and 2012, purchases were 19,937 and 18,734 shares, respectively,
with weighted average share prices of $37.68 and $33.65, respectively.
3. Capital Assets:
Property and Equipment
Property and equipment at September 27, 2014 and
September 28, 2013 consist of the following:
|
|
|
|
|
|
|
|
|
|
|
|
2014 |
|
2013 |
|
||
|
|
|
(expressed in thousands) |
|
||||
|
Land and improvements |
|
$ |
1,710 |
|
$ |
1,713 |
|
|
Buildings and improvements |
|
|
54,271 |
|
|
54,823 |
|
|
Machinery and equipment |
|
|
150,917 |
|
|
145,785 |
|
|
Total |
|
|
206,898 |
|
|
202,321 |
|
|
Less accumulated depreciation |
|
|
(125,323 |
) |
|
(123,922 |
) |
|
Property and equipment, net |
|
$ |
81,575 |
|
$ |
78,399 |
|
Goodwill
Goodwill at September 27, 2014 and September 28, 2013
was $26.1 million and $16.6 million, respectively. The change in goodwill
during the year ended September 27, 2014 was due to an increase of $9.6 million
as a result of the Roehrig Engineering, Inc. (“REI”) acquisition, partially
offset by currency translation. Refer to footnote 11 for details regarding this
acquisition. The change in goodwill during the year ended September 28, 2013
was due to currency translation.
F-18
Other Intangible Assets
Other intangible assets consist of the following:
|
|
|
|
|
|
|
|
|
|
|
|
|
|
|
|
|
|
September 27, 2014 |
|
||||||||||
|
|
|
Gross Carrying |
|
Accumulated |
|
Net Carrying |
|
Weighted |
|
||||
|
|
|
(dollar amounts expressed in thousands) |
|
||||||||||
|
Software development costs |
|
$ |
16,713 |
|
$ |
(11,644 |
) |
$ |
5,069 |
|
|
5.7 |
|
|
Patents |
|
|
12,204 |
|
|
(4,453 |
) |
|
7,751 |
|
|
14.4 |
|
|
Trademarks and trade names |
|
|
6,349 |
|
|
(1,458 |
) |
|
4,891 |
|
|
29.3 |
|
|
Customer lists |
|
|
2,485 |
|
|
(134 |
) |
|
2,351 |
|
|
8.1 |
|
|
Land-use rights |
|
|
1,269 |
|
|
(153 |
) |
|
1,116 |
|
|
47.8 |
|
|
Total |
|
$ |
39,020 |
|
$ |
(17,842 |
) |
$ |
21,178 |
|
|
13.4 |
|
|
|
|
|
|
|
|
|
|
|
|
|
|
|
|
|
|
|
September 28, 2013 |
|
||||||||||
|
|
|
Gross Carrying |
|
Accumulated |
|
Net Carrying |
|
Weighted |
|
||||
|
|
|
(dollar amounts expressed in thousands) |
|
||||||||||
|
Software development costs |
|
$ |
15,860 |
|
$ |
(8,885 |
) |
$ |
6,975 |
|
|
5.7 |
|
|
Patents |
|
|
10,308 |
|
|
(3,676 |
) |
|
6,632 |
|
|
15.3 |
|
|
Trademarks and trade names |
|
|
6,149 |
|
|
(1,244 |
) |
|
4,905 |
|
|
30.2 |
|
|
Land-use rights |
|
|
1,270 |
|
|
(126 |
) |
|
1,144 |
|
|
47.8 |
|
|
Total |
|
$ |
33,587 |
|
$ |
(13,931 |
) |
$ |
19,656 |
|
|
14.3 |
|
Amortization expense recognized during the fiscal years ended September 27, 2014, September 28, 2013, and September 29, 2012 was $3.9 million, $3.7 million, and $3.5 million, respectively. The estimated future amortization expense related to other intangible assets for the next five fiscal years is as follows:
|
|
|
|
|
|
|
Fiscal Year |
|
Amortization
|
|
|
|
|
|
(expressed
in |
|
|
|
2015 |
|
$ |
4,564 |
|
|
2016 |
|
$ |
2,847 |
|
|
2017 |
|
$ |
1,578 |
|
|
2018 |
|
$ |
1,370 |
|
|
2019 |
|
$ |
1,359 |
|
Future amortization amounts presented above are estimates. Actual future amortization expense may be different, due to future acquisitions, impairments, changes in amortization periods, or other factors.
F-19
4. Business Segment Information:
The Company’s Chief Executive Officer (the Chief Operating Decision Maker) regularly reviews financial information for the Company’s two operating segments, “Test” and “Sensors.” Test provides testing equipment, systems, and services to the ground vehicles, materials and structures markets. Sensors provides high-performance position sensors for a variety of industrial and mobile hydraulic applications.
In evaluating each segment’s performance, the Company’s Chief Executive Officer focuses on income from operations. This measure excludes interest income and expense, income taxes and other non-operating items. Corporate expenses, including costs associated with various support functions such as human resources, information technology, legal, finance and accounting, and general and administrative costs, are allocated to the reportable segments on the basis of revenue.
Financial information by reportable segment for the fiscal years ended September 27, 2014, September 28, 2013, and September 29, 2012 were as follows:
|
|
|
|
|
|
|
|
|
|
|
|
|
|
|
2014 |
|
2013 |
|
2012 |
|
|||
|
|
|
(expressed in thousands) |
|
|||||||
|
Revenue |
|
|
|
|
|
|
|
|
|
|
|
Test |
|
$ |
458,153 |
|
$ |
474,119 |
|
$ |
442,012 |
|
|
Sensors |
|
|
106,175 |
|
|
95,320 |
|
|
100,244 |
|
|
Total Revenue |
|
$ |
564,328 |
|
$ |
569,439 |
|
$ |
542,256 |
|
|
|
|
|
|
|
|
|
|
|
|
|
|
Income from Operations |
|
|
|
|
|
|
|
|
|
|
|
Test |
|
$ |
39,847 |
|
$ |
60,984 |
|
$ |
58,344 |
|
|
Sensors |
|
|
20,409 |
|
|
18,971 |
|
|
22,167 |
|
|
Total Income from Operations |
|
$ |
60,256 |
|
$ |
79,955 |
|
$ |
80,511 |
|
|
|
|
|
|
|
|
|
|
|
|
|
|
Identifiable Assets |
|
|
|
|
|
|
|
|
|
|
|
Test |
|
$ |
392,825 |
|
$ |
360,037 |
|
$ |
357,196 |
|
|
Sensors |
|
|
94,583 |
|
|
91,240 |
|
|
94,081 |
|
|
Total Assets |
|
$ |
487,408 |
|
$ |
451,277 |
|
$ |
451,277 |
|
|
|
|
|
|
|
|
|
|
|
|
|
|
Other Segment Data |
|
|
|
|
|
|
|
|
|
|
|
Test: |
|
|
|
|
|
|
|
|
|
|
|
Goodwill |
|
$ |
24,584 |
|
$ |
15,028 |
|
$ |
14,688 |
|
|
Capital expenditures |
|
|
16,553 |
|
|
26,775 |
|
|
12,551 |
|
|
Depreciation and amortization |
|
$ |
16,560 |
|
$ |
14,325 |
|
$ |
11,567 |
|
|
Sensors: |
|
|
|
|
|
|
|
|
|
|
|
Goodwill |
|
$ |
1,539 |
|
$ |
1,596 |
|
$ |
1,551 |
|
|
Capital expenditures |
|
|
3,485 |
|
|
2,915 |
|
|
3,074 |
|
|
Depreciation and amortization |
|
$ |
2,719 |
|
$ |
2,264 |
|
$ |
2,215 |
|
F-20
|
|
|
|
|
|
|
|
|
|
|
|
|
Geographic information was as follows: |
|
|
|
|
|
|
|
|
|
|
|
|
|
|
|
|
|
|
|
|
|
|
|
|
|
2014 |
|
2013 |
|
2012 |
|
|||
|
|
|
(expressed in thousands) |
|
|||||||
|
Revenue |
|
|
|
|
|
|
|
|
|
|
|
United States |
|
$ |
144,239 |
|
$ |
137,750 |
|
$ |
140,305 |
|
|
Europe |
|
|
179,043 |
|
|
178,610 |
|
|
167,828 |
|
|
China |
|
|
117,952 |
|
|
127,368 |
|
|
103,977 |
|
|
Asia, excluding China |
|
|
90,242 |
|
|
96,653 |
|
|
100,166 |
|
|
Other |
|
|
32,852 |
|
|
29,058 |
|
|
29,980 |
|
|
Total Revenue |
|
$ |
564,328 |
|
$ |
569,439 |
|
$ |
542,256 |
|
|
|
|
|
|
|
|
|
|
|
|
|
|
Property and Equipment, Net |
|
|
|
|
|
|
|
|
|
|
|
United States |
|
$ |
58,911 |
|
$ |
55,509 |
|
|
40,522 |
|
|
Europe |
|
|
13,573 |
|
|
13,838 |
|
|
12,059 |
|
|
China |
|
|
7,034 |
|
|
7,661 |
|
|
7,377 |
|
|
Asia, excluding China |
|
|
2,057 |
|
|
1,391 |
|
|
1,695 |
|
|
Total Property and Equipment, Net |
|
$ |
81,575 |
|
$ |
78,399 |
|
$ |
61,653 |
|
Revenue by geographic area is presented based on customer location. No countries other than the United States and China had revenue in excess of 10% of the Company’s total revenue during any of the periods presented. No single customer accounted for 10% or more of the Company’s consolidated revenue for any of the periods presented. Revenue is not reported for each of the Company’s products and services because it is impracticable to do so.
5. Derivative Instruments and Hedging Activities
The Company’s currency exchange and interest rate swaps are designated as cash flow hedges and qualify as hedging instruments pursuant to ASC 815. The Company also has derivatives which are not designated as cash flow hedges and, therefore, are accounted for and reported under the guidance of ASC 830. Regardless of designation for accounting purposes, the Company believes that all of its derivative instruments are hedges of transactional risk exposures. The fair value of the Company’s outstanding designated and undesignated derivative assets and liabilities are reported in the September 27, 2014 and September 28, 2013 Consolidated Balance Sheet as follows:
|
|
|
|
|
|
|
|
|
|
|
|
September 27, 2014 |
|
||||
|
|
|
Prepaid Expenses |
|
Other Accrued |
|
||
|
Designated hedge derivatives: |
|
(expressed in thousands) |
|
||||
|
Foreign exchange cash flow hedges |
|
$ |
1,750 |
|
$ |
178 |
|
|
Total designated hedge derivatives |
|
|
1,750 |
|
|
178 |
|
|
|
|
|
|
|
|
|
|
|
Derivatives not designated as hedges: |
|
|
|
|
|
|
|
|
Foreign exchange balance sheet derivatives |
|
|
641 |
|
|
- |
|
|
Total hedge and other derivatives |
|
$ |
2,391 |
|
$ |
178 |
|
F-21
|
|
|
|
|
|
|
|
|
|
|
|
September 28, 2013 |
|
||||
|
|
|
Prepaid Expenses |
|
Other Accrued |
|
||
|
Designated hedge derivatives: |
|
(expressed in thousands) |
|
||||
|
Foreign exchange cash flow hedges |
|
$ |
1,091 |
|
$ |
1,307 |
|
|
Total designated hedge derivatives |
|
|
1,091 |
|
|
1,307 |
|
|
|
|
|
|
|
|
|
|
|
Derivatives not designated as hedges: |
|
|
|
|
|
|
|
|
Foreign exchange balance sheet derivatives |
|
|
- |
|
|
167 |
|
|
Total hedge and other derivatives |
|
$ |
1,091 |
|
$ |
1,474 |
|
Cash
Flow Hedging – Currency Risks
Currency exchange contracts utilized to maintain the
functional currency value of expected financial transactions denominated in
foreign currencies are designated as cash flow hedges. Qualifying gains and
losses related to changes in the market value of these contracts are reported
as a component of Accumulated Other Comprehensive Income (“AOCI”) within Shareholders’
Investment on the Consolidated Balance Sheets and reclassified into earnings in
the same period during which the underlying hedged transaction affects
earnings. The effective portion of the cash flow hedges represents the change
in fair value of the hedge that offsets the change in the functional currency
value of the hedged item. The Company periodically assesses whether its
currency exchange contracts are effective and, when a contract is determined to
be no longer effective as a hedge, the Company discontinues hedge accounting
prospectively. Subsequent changes in the market value of ineffective currency
exchange contracts are recognized as an increase or decrease in Revenue on the
Consolidated Statement of Income, because that is the same line item in which
the underlying hedged transaction is reported.
At September 27, 2014 and September 28, 2013, the Company had outstanding cash flow hedge currency exchange contracts with gross notional U.S. dollar equivalent amounts of $46.8 million and $65.7 million, respectively. Upon netting offsetting contracts to sell foreign currencies against contracts to purchase foreign currencies, irrespective of contract maturity dates, the net notional U.S. dollar equivalent amount of contracts outstanding were $39.6 million and $48.0 million at September 27, 2014 and September 28, 2013, respectively. At September 27, 2014, the net market value of the foreign currency exchange contracts was a net asset of $1.6 million, consisting of $1.8 million in asset and $0.2 million in liabilities. At September 28, 2013, the net market value of the foreign currency exchange contracts was a net liability of $0.2 million, consisting of $1.3 million in liabilities and $1.1 million in assets.
The pretax amounts recognized in AOCI on currency exchange contracts for the fiscal years ended September 27, 2014 and September 28, 2013, including gains (losses) reclassified into earnings in the Consolidated Statements of Income and gains (losses) recognized in other comprehensive income (“OCI”), are as follows:
|
|
|
|
|
|
|
|
|
|
|
|
2014 |
|
2013 |
|
||
|
|
|
(expressed in thousands) |
|
||||
|
Beginning unrealized net loss in AOCI |
|
$ |
754 |
|
$ |
(648 |
) |
|
Net gain reclassified into Revenue (effective portion) |
|
|
(1,089 |
) |
|
(733 |
) |
|
Net gain recognized in OCI (effective portion) |
|
|
1,749 |
|
|
2,135 |
|
|
Ending unrealized net gain (loss) in AOCI |
|
$ |
1,414 |
|
$ |
754 |
|
F-22
The amount recognized in earnings as a result of the ineffectiveness of cash flow hedges was less than $0.1 million in each of the fiscal years ended September 27, 2014, September 28, 2013 and September 29, 2012. At September 27, 2014, the amount projected to be reclassified from AOCI into earnings in the next 12 months was a net gain of $1.4 million. The maximum remaining maturity of any forward or optional contract at September 27, 2014 was 2.7 years.
Foreign
Currency Balance Sheet Derivatives
The Company also uses foreign currency derivative
contracts to maintain the functional currency value of monetary assets and
liabilities denominated in non-functional foreign currencies. The gains and
losses related to the changes in the market value of these derivative contracts
are included in Other (Expense) Income, net on the Consolidated Statements of
Income.
At September 27, 2014 and September 28, 2013, the Company had outstanding foreign currency balance sheet derivative contracts with gross notional U.S. dollar equivalent amounts of $58.3 million and $26.7 million, respectively. Upon netting offsetting contracts by counterparty banks to sell foreign currencies against contracts to purchase foreign currencies, irrespective of contract maturity dates, the net notional U.S. dollar equivalent amount of contracts outstanding at September 27, 2014 and September 28, 2013 was $12.2 and $8.6 million, respectively. At September 27, 2014 and September 28, 2013, the net market value of the foreign exchange balance sheet derivative contracts was a net asset of $0.6 million and a net liability of $0.2 million, respectively.
The net losses recognized in the Consolidated Statements of Income on foreign exchange balance sheet derivative contracts for the fiscal years ended September 27, 2014, September 28, 2013 and September 29, 2012 are as follows:
|
|
|
|
|
|
|
|
|
|
|
|
|
|
|
2014 |
|
2013 |
|
2012 |
|
|||
|
|
|
(expressed in thousands) |
|
|||||||
|
Net gain (loss) recognized in Other (expense) income, net |
|
$ |
1,267 |
|
$ |
(258 |
) |
$ |
(294 |
) |
6. Fair Value Measurements
In determining the fair value of financial assets and liabilities, the Company currently utilizes market data or other assumptions that it believes market participants would use in pricing the asset or liability in the principal or most advantageous market, and adjusts for non-performance and/or other risk associated with the Company as well as counterparties, as appropriate. When considering market participant assumptions in fair value measurements, the following fair value hierarchy distinguishes between observable and unobservable inputs, which are categorized in one of the following levels:
|
|
|
|
|
Level 1 Inputs: Unadjusted quoted prices which are available in active markets for identical assets or liabilities accessible to the Company at the measurement date. |
|
|
|
|
|
Level 2 Inputs: Inputs other than quoted prices included in Level 1 inputs that are observable for the asset or liability, either directly or indirectly, for substantially the full term of the asset or liability. |
|
|
|
|
|
Level 3 Inputs: Unobservable inputs for the asset or liability used to measure fair value to the extent that observable inputs are not available, thereby allowing for situations in which there is little, if any, market activity for the asset or liability at measurement date. |
The hierarchy gives the highest priority to Level 1, as this level provides the most reliable measure of fair value, while giving the lowest priority to Level 3.
F-23
Financial Instruments Measured at Fair Value
on a Recurring Basis
Financial assets and liabilities subject to fair value
measurements on a recurring basis are as follows:
|
|
|
|
|
|
|
|
|
|
|
|
|
|
|
|
|
|
September 27, 2014 |
|
||||||||||
|
|
|
Level 1 |
|
Level 2 |
|
Level 3 |
|
Total |
|
||||
|
Assets: |
|
(expressed in thousands) |
|
||||||||||
|
Currency contracts(1) |
|
$ |
- |
|
$ |
2,391 |
|
$ |
- |
|
$ |
2,391 |
|
|
Total assets |
|
$ |
- |
|
$ |
2,391 |
|
$ |
- |
|
$ |
2,391 |
|
|
|
|
|
|
|
|
|
|
|
|
|
|
|
|
|
Liabilities: |
|
|
|
|
|
|
|
|
|
|
|
|
|
|
Currency contracts(1) |
|
$ |
- |
|
$ |
178 |
|
$ |
- |
|
$ |
178 |
|
|
Total liabilities |
|
$ |
- |
|
$ |
178 |
|
$ |
- |
|
$ |
178 |
|
|
|
|
|
|
|
|
|
|
|
|
|
|
|
|
|
|
|
September 28, 2013 |
|
||||||||||
|
|
|
Level 1 |
|
Level 2 |
|
Level 3 |
|
Total |
|
||||
|
Assets: |
|
(expressed in thousands) |
|
||||||||||
|
Currency contracts(1) |
|
$ |
- |
|
$ |
1,091 |
|
$ |
- |
|
$ |
1,091 |
|
|
Total assets |
|
$ |
- |
|
$ |
1,091 |
|
$ |
- |
|
$ |
1,091 |
|
|
|
|
|
|
|
|
|
|
|
|
|
|
|
|
|
Liabilities: |
|
|
|
|
|
|
|
|
|
|
|
|
|
|
Currency contracts(1) |
|
$ |
- |
|
$ |
1,474 |
|
$ |
- |
|
$ |
1,474 |
|
|
Total liabilities |
|
$ |
- |
|
$ |
1,474 |
|
$ |
- |
|
$ |
1,474 |
|
|
|
|
|
|
|
(1) |
Based on observable market transactions of spot currency rates and forward currency rates on equivalently-termed instruments. |
Nonfinancial Assets Measured at Fair Value on
a Nonrecurring Basis
The Company’s goodwill, intangible assets and other
long-lived assets are nonfinancial assets that were acquired either as part of
a business combination, individually or with a group of other assets. These
nonfinancial assets were initially, and are currently, measured and recognized
at amounts equal to the fair value determined as of the date of acquisition.
Periodically, these nonfinancial assets are tested for impairment, by comparing
their respective carrying values to the estimated fair value of the reporting
unit or asset group in which they reside. In the event any of these
nonfinancial assets were to become impaired, the Company would recognize an
impairment loss equal to the amount by which the carrying value of the
reporting unit, impaired asset or asset group exceeds its estimated fair value.
Fair value measurements of reporting units are estimated using an income
approach involving discounted or undiscounted cash flow models that contain
certain Level 3 inputs requiring management judgment, including projections of
economic conditions and customer demand, revenue and margins, changes in
competition, operating costs, working capital requirements, and new product
introductions. Fair value measurements of the reporting units associated with
the Company’s goodwill balances are estimated at least annually in the fourth
quarter of each fiscal year for purposes of impairment testing. Fair value
measurements associated with the Company’s intangible assets and other
long-lived assets are estimated when events or changes in circumstances
such as market value, asset utilization, physical change, legal factors, or
other matters indicate that the carrying value may not be recoverable.
F-24
Financial Instruments not Measured at Fair
Value
Certain of the Company’s financial instruments are not
measured at fair value but nevertheless are recorded at carrying amounts
approximating fair value, based on their short-term nature or variable interest
rate. These financial instruments include cash and cash equivalents, accounts
receivable, accounts payable and short-term borrowings.
7. Financing:
Short-term borrowings at September 27, 2014 and September 28, 2013 consist of the following:
|
|
|
|
|
|
|
|
|
|
|
|
2014 |
|
2013 |
|
||
|
|
|
(expressed in thousands) |
|
||||
|
|
|
|
|
|
|
|
|
|
Bank line of credit, monthly U.S. LIBOR plus 87.5 basis points, retired in September 2014 |
|
$ |
- |
|
$ |
35,000 |
|
|
Bank line of credit, monthly U.S. LIBOR plus 100 basis points, in effect at September 27, 2014, maturing October 2014, with optional month-to-month term renewal and loan repricing until September 2019 |
|
$ |
60,000 |
|
$ |
- |
|
|
Total Short-Term Borrowings |
|
$ |
60,000 |
|
$ |
35,000 |
|
On September 27, 2014, the Company entered into a credit agreement (“Credit Agreement”) with JPMorgan Chase Bank, N.A. as administrative agent, and other financial institutions that may become parties to the Credit Agreement from time to time. This agreement amended and extended the $100 million senior unsecured credit facility that was scheduled to expire in September 2017. The Credit Agreement provides for a five-year, $200 million senior unsecured revolving credit facility (“Credit Facility”) maturing September 24, 2019. The Company may use the Credit Facility for working capital financing, permitted acquisitions, share purchases, or other lawful corporate purposes. At September 27, 2014, outstanding borrowings under the Credit Facility were $60.0 million. At September 28, 2013, outstanding borrowings under the prior Credit Facility were $35.0 million. At September 27, 2014, the Company had outstanding letters of credit drawn from the Credit Facility totaling $9.4 million, leaving approximately $130.6 million of unused borrowing capacity. At September 28, 2013, the Company had outstanding letters of credit drawn from the Credit Facility totaling $14.3 million, leaving approximately $50.7 million of unused borrowing capacity.
The weighted average interest rate on outstanding borrowings under the Credit Facility during the fiscal years ended September 27, 2014 and September 28, 2013 was 1.15% and 1.57%, respectively. At September 27, 2014 the interest rate applicable to outstanding variable rate credit facility borrowings was 1.15%, which was the monthly U.S. LIBOR plus 100 basis points. At September 28, 2013, the interest rate applicable to outstanding variable rate credit facility borrowings was 1.07%, which was the monthly U.S. LIBOR plus 87.5 basis points.
The primary categories of borrowing include Eurocurrency Borrowing, Alternate Base Rate (“ABR”) Borrowing, and Swingline Loans. ABR Borrowings and Swingline Loans made in U.S. Dollars under the Credit Agreement bear interest at a rate per annum equal to the Alternate Base Rate (defined as the greater of (a) the Prime Rate (as defined in the Credit Agreement) in effect on such day, (b) the Federal Funds Effective Rate (as defined in the Credit Agreement) in effect on such day plus ½ of 1%, or (c) the Adjusted LIBO Rate (as defined in the Credit Agreement) for a one month Interest Period on such day plus 1%), plus the ABR Spread, as defined in the Credit Agreement, based upon the Leverage Ratio, as defined in the Credit Agreement, applicable on such date. Eurocurrency Borrowings made under the Credit Agreement bear interest at a rate per annum equal to the Adjusted LIBO Rate, as defined in the Credit Agreement, for the interest period in effect for such Eurocurrency Borrowing plus the Eurocurrency Spread, as defined in the Credit Agreement, based upon the Leverage Ratio applicable on such date. At September 27, 2014, the prime rate of 3.25% was the applicable Alternate Base Rate, plus ABR Spread ranging from 0% to 0.625% based on the Leverage Ratio. At September 27, 2014, the applicable Adjusted LIBO rate was 0.15%, plus Eurocurrency Spread ranging from 1.00% to 1.625% based on the Leverage Ratio. Commitment fees are payable on the unused portion of the Credit Facility at rates between 0.15% and 0.30%, based on the Leverage Ratio. During each of the fiscal years ended September 27, 2014 and September 28, 2013, commitment fees incurred on the Credit Facility were $0.1 million and $0.1 million, respectively.
F-25
Under the Credit Agreement, the Company and its subsidiaries are subject to customary affirmative and negative covenants, including restrictions on their ability to incur debt, create liens, dispose of assets, make investments, loans, advances, guarantees and acquisitions, enter into transactions with affiliates, and enter into any restrictive agreements, and customary events of default (including payment defaults, covenant defaults, change of control defaults and bankruptcy defaults). The Credit Agreement also contains financial covenants, including the ratio of consolidated total indebtedness to consolidated EBITDA, as well as the ratio of consolidated EBITDA to consolidated interest expense. These covenants restrict the Company’s ability to pay dividends and purchase outstanding shares of common stock. At September 27, 2014 and September 28, 2013, the Company was in compliance with these financial covenants.
At September 27, 2014, the Company had outstanding letters of credit and guarantees totaling $21.2 million and $24.7 million, respectively, primarily to bond advance payments and performance related to customer contracts in Test.
8. Income Taxes:
The components of income before income taxes for the fiscal years ended September 27, 2014, September 28, 2013, and September 29, 2012 were as follows:
|
|
|
|
|
|
|
|
|
|
|
|
|
|
|
2014 |
|
2013 |
|
2012 |
|
|||
|
|
|
(expressed in thousands) |
|
|||||||
|
Income before income taxes: |
|
|
|
|
|
|
|
|
|
|
|
Domestic |
|
$ |
32,867 |
|
$ |
49,921 |
|
$ |
45,152 |
|
|
Foreign |
|
|
25,576 |
|
|
29,333 |
|
|
34,628 |
|
|
Total |
|
$ |
58,443 |
|
$ |
79,254 |
|
$ |
79,780 |
|
The provision for income taxes for the fiscal years ended September 27, 2014, September 28, 2013, and September 29, 2012 was as follows:
|
|
|
|
|
|
|
|
|
|
|
|
|
|
|
2014 |
|
2013 |
|
2012 |
|
|||
|
|
|
(expressed in thousands) |
|
|||||||
|
Current provision (benefit): |
|
|
|
|
|
|
|
|
|
|
|
Federal |
|
$ |
7,503 |
|
$ |
13,241 |
|
$ |
16,834 |
|
|
State |
|
|
842 |
|
|
781 |
|
|
1,058 |
|
|
Foreign |
|
|
13,056 |
|
|
8,618 |
|
|
11,575 |
|
|
Deferred |
|
|
(4,967 |
) |
|
(1,192 |
) |
|
(1,243 |
) |
|
Total provision |
|
$ |
16,434 |
|
$ |
21,448 |
|
$ |
28,224 |
|
F-26
A reconciliation from the federal statutory income tax rate to the Company’s effective income tax rate for the fiscal years ended September 27, 2014, September 28, 2013, and September 29, 2012 is as follows:
|
|
|
|
|
|
|
|
|
|
|
|
|
|
|
2014 |
|
2013 |
|
2012 |
|
|||
|
|
|
|
|
|
|
|
|
|
|
|
|
United States federal statutory income tax rate |
|
|
35 |
% |
|
35 |
% |
|
35 |
% |
|
Impact from foreign operations |
|
|
(1 |
) |
|
(1 |
) |
|
(2 |
) |
|
State income taxes, net of federal benefit |
|
|
1 |
|
|
1 |
|
|
1 |
|
|
Research and development tax credits |
|
|
(5 |
) |
|
(5 |
) |
|
(1 |
) |
|
Domestic production activities deduction |
|
|
(2 |
) |
|
(2 |
) |
|
(2 |
) |
|
Foreign tax credits |
|
|
(2 |
) |
|
- |
|
|
- |
|
|
Change in valuation allowances |
|
|
- |
|
|
- |
|
|
(1 |
) |
|
Nondeductible expense to settle U.S. Government investigation |
|
|
- |
|
|
- |
|
|
4 |
|
|
Nondeductible stock option expense and other permanent items |
|
|
2 |
|
|
(1 |
) |
|
1 |
|
|
Effective income tax rate |
|
|
28 |
% |
|
27 |
% |
|
35 |
% |
A summary of the deferred tax assets and liabilities for the fiscal years ended September 27, 2014 and September 28, 2013 is as follows:
|
|
|
|
|
|
|
|
|
|
|
|
2014 |
|
2013 |
|
||
|
|
|
(expressed in thousands) |
|
||||
|
Deferred Tax Assets: |
|
|
|
|
|
|
|
|
Accrued compensation and benefits |
|
$ |
11,604 |
|
$ |
8,826 |
|
|
Inventory reserves |
|
|
5,060 |
|
|
4,264 |
|
|
Intangible and other assets |
|
|
2,684 |
|
|
3,081 |
|
|
Allowance for doubtful accounts |
|
|
644 |
|
|
380 |
|
|
Net operating loss carryovers |
|
|
277 |
|
|
376 |
|
|
Research and development tax credit carryovers |
|
|
326 |
|
|
- |
|
|
Other |
|
|
314 |
|
|
320 |
|
|
Total deferred tax asset before valuation allowance |
|
|
20,909 |
|
|
17,247 |
|
|
Less valuation allowance |
|
|
(442 |
) |
|
(105 |
) |
|
Total Deferred Tax Assets |
|
$ |
20,467 |
|
$ |
17,142 |
|
|
|
|
|
|
|
|
|
|
|
Deferred Tax Liabilities: |
|
|
|
|
|
|
|
|
Property and equipment |
|
$ |
8,557 |
|
$ |
10,222 |
|
|
Foreign deferred revenue and other |
|
|
2,541 |
|
|
3,246 |
|
|
Unrealized derivative instrument gains |
|
|
269 |
|
|
670 |
|
|
Total Deferred Tax Liabilities |
|
$ |
11,367 |
|
$ |
14,138 |
|
|
Net Deferred Tax Assets |
|
$ |
9,100 |
|
$ |
3,004 |
|
As of September 27, 2014, the Company’s German and Swiss subsidiaries had net operating loss carryovers of $0.2 million, and $0.5 million respectively. The German net operating loss carryovers will not expire under local tax law. Switzerland has a seven year net operating loss limitation. The Company has determined that the benefit of the Swiss subsidiary’s $0.5 million net operating loss is not likely to be realized. Accordingly, as of September 27, 2014, the Company had a full valuation against the carryover in the amount of $0.1 million.
F-27
As of September 27, 2014, the Company had a Minnesota R&D tax credit carryover of $0.3 million which may be carried forward fifteen years. The Company has recorded a full valuation allowance against this carryover based on its expectation that the credits will expire prior to utilization.
During fiscal year 2014, the Company repatriated $9.6 million of current earnings from its German, Japanese and Korean subsidiaries. The Company recorded $0.1 million tax expense during fiscal year 2014 related to these repatriations. Also during fiscal year 2014, the Company recognized additional federal and state research and development tax credit benefits of $2.6 million related to prior fiscal years due to favorable guidance related to the United States Research and Development tax credit that was issued during the fourth quarter of fiscal year 2013. The Company was only allowed to recognize federal research and development credits on applicable spending during the first fiscal quarter, as the provision in the U.S. tax law allowing for these credits expired on December 31, 2013.
During fiscal year 2013, the Company repatriated $14.5 million of current earnings from its German, and Japanese subsidiaries. The Company recorded $0.5 million tax benefit during fiscal year 2013 related to these repatriations. On January 2, 2013, the American Taxpayer Relief Act (the “Act”) of 2012 was signed into law. The Act included legislation which reinstated the United States (“U.S.”) Research and Development (“R&D”) tax credit retroactively from January 1, 2012 and extended it through December 31, 2013. Also, during the fourth quarter of fiscal year 2013, new favorable guidance was issued related to the U.S. R&D tax credit. As a result of these events, during fiscal year 2013, the Company recognized a retroactive tax benefit of approximately $2.4 million for R&D tax credits associated with prior fiscal years.
During fiscal year 2012, the Company repatriated $20.2 million of current earnings from its German, Japanese and Korean subsidiaries. The Company recorded a $0.5 million tax expense during fiscal year 2012 related to these repatriations. Also during fiscal year 2012, the Company was only allowed to recognize research and development credits on applicable spending during the first fiscal quarter, as the provision in the U.S. tax law allowing for these credits expired on December 31, 2011. As was previously disclosed, in the fourth quarter of fiscal year 2012, the Company reached an agreement with the DOC and the USAO, settling for $7.8 million the DOC and USAO’s investigation into the Company’s past disclosures on its government certifications and its government contracting compliance policies, general compliance record and practices in areas including export controls and government contracts. During the third quarter of fiscal year 2012, the Company accrued a loss contingency equal to the settlement amount. The $7.8 million settlement costs were non-deductible for income tax purposes.
In accordance with ASC 740-30, the Company has not recognized a deferred tax liability for the undistributed earnings of certain of its foreign operations because those subsidiaries have invested or will invest the undistributed earnings indefinitely. At September 27, 2014, undistributed earnings were approximately $81 million. Because of the availability of U.S. foreign tax credits, it is impractical for the Company to determine the amount of U.S. federal tax liability that would be payable if these earnings were not indefinitely reinvested. Deferred taxes are recorded for earnings of foreign operations when the Company determines that such earnings are no longer indefinitely reinvested.
A summary of changes in the Company’s liability for unrecognized tax benefits for the fiscal years ended September 27, 2014 and September 28, 2013 is as follows:
|
|
|
|
|
|
|
|
|
|
|
|
2014 |
|
2013 |
|
||
|
|
|
(expressed in thousands) |
|
||||
|
Beginning balance |
|
$ |
4,311 |
|
$ |
1,666 |
|
|
Increase due to tax positions related to the current year |
|
|
659 |
|
|
913 |
|
|
Increase (decrease) due to tax positions related to prior years |
|
|
1,068 |
|
|
1,726 |
|
|
Decrease due to lapse of statute of limitations |
|
|
(47 |
) |
|
- |
|
|
Exchange rate change |
|
|
(1 |
) |
|
6 |
|
|
Ending balance |
|
$ |
5,990 |
|
$ |
4,311 |
|
F-28
Included in the balance of unrecognized tax benefits at September 27, 2014 are potential benefits of $3.8 million that, if recognized, would affect the effective tax rate.
At both September 27, 2014 and September 28, 2013, the Company had accrued interest related to uncertain income tax positions of approximately $0.2 million and $0.1 million, respectively. At September 27, 2014 and September 28, 2013, no accrual for penalties related to uncertain tax positions existed. Interest and penalties related to uncertain tax positions are included in Interest Expense, net and General and Administrative Expense, respectively, on the Consolidated Statements of Income.
The Company is subject to U.S. federal income tax as well as income tax of numerous state and foreign jurisdictions. The Company is no longer subject to U.S. federal tax examinations for fiscal years before 2011 and with limited exceptions, state and foreign income tax examinations for fiscal years before 2009. During 2012, the Internal Revenue Service (“IRS”) completed the audit of the Company’s consolidated income tax returns for fiscal years 2009 and 2010. Also during 2012, the Minnesota Department of Revenue completed the audit of fiscal years 2006 through 2008. The IRS is currently auditing the Company’s fiscal tax years ending October 1, 2011 and September 29, 2012. As of September 27, 2014, the IRS has not proposed any significant adjustments to the company’s tax positions for which the Company is not adequately reserved. The Company believes that it is reasonably possible that its liability for unrecognized tax positions may change upon conclusion of the IRS audit. However, an estimate of the amount or range of the change cannot be made at this time.
The Company’s German tax returns have been examined by the tax authorities through fiscal year 2008. The Company’s Japanese tax returns have been examined by the tax authorities through fiscal year 2010. The Company’s Chinese tax returns for calendar years 2009 through 2011 and 2013 have not been examined by the tax authorities. The Company’s Chinese tax return for calendar year 2012 is currently being examined. As of September 27, 2014, the Company does not expect significant changes in the amount of unrecognized tax benefits for its foreign subsidiaries during the next twelve months.
At September 27, 2014 and September 28, 2013, the Company and certain of its foreign subsidiaries were expected to receive income tax refunds within the next fiscal year. As a result, at September 27, 2014 and September 28, 2013, the Company recognized a current income tax receivable of $6.5 million and $5.9 million, respectively, which is included in Prepaid Expenses and Other Current Assets on the Consolidated Balance Sheets.
9. Employee Benefit Plans:
The 401(k) component of the retirement savings plan allows eligible U.S. employees to contribute a portion of their pre-tax income to the plan each pay period. The Company matches 50% of employees’ pre-tax contributions (excluding “catch-up” contributions that employees age 50 or older may make to the plan), up to 6% of compensation, subject to limitations imposed by federal law. The Company’s matching contributions were $2.6 million, $2.4 million, and $2.2 million in fiscal years 2014, 2013, and 2012, respectively. Employees may also contribute a percentage of their salary to the plan on an after-tax basis.
The Company also provides, on an annual fiscal year basis, a discretionary contribution to the retirement plan for eligible U.S. employees. Employees who are active as of the end of the fiscal year and whom have been paid for 1,000 hours or more of service during a plan year are eligible for a fiscal year contribution. After three years as a participant, employees have a vested interest equal to 100% of the total Company’s fiscal year contributions. The plan provides for a minimum fiscal year contribution of 3% of participant compensation below the Social Security taxable wage base and 6% of participant compensation in excess of the Social Security taxable wage base, up to the maximum contribution allowed by federal law. The Company’s Board of Directors approves any changes to the contribution levels under the plan. The Company’s fiscal year contributions under the plan totaled $0.0 million, $3.0 million, and $2.7 million in fiscal years 2014, 2013, and 2012, respectively.
F-29
The Company recognizes the funded status of the defined benefit pension in its statement of financial position, recognizes changes in that funded status in the year in which the changes occur through comprehensive income, and measures the plan’s assets and its obligations that determine its funded status as of the end of the Company’s fiscal year.
The pretax amount recognized in Accumulated Other Comprehensive Income as of September 27, 2014 and September 28, 2013 consists of the following:
|
|
|
|
|
|
|
|
|
|
|
|
2014 |
|
2013 |
|
||
|
|
|
(expressed in thousands) |
|
||||
|
Actuarial net loss |
|
$ |
10,469 |
|
$ |
7,819 |
|
The portion of the pretax amount in Accumulated Other Comprehensive Income at September 28, 2013 that was recognized in earnings during the fiscal year ended September 27, 2014 was $0.5 million. The portion of the pretax amount in Accumulated Other Comprehensive Income at September 27, 2014 that is expected to be recognized as a component of net periodic retirement cost during the next fiscal year is $0.6 million. The actuarial gain in fiscal year 2014 of $5.8 million was primarily a result of the change in the discount rate from 3.56% in fiscal year 2013 to 2.48% in fiscal year 2014.
The following is a summary of the changes in benefit obligations and plan assets during the fiscal years ended September 27, 2014 and September 28, 2013:
|
|
|
|
|
|
|
|
|
|
|
|
2014 |
|
2013 |
|
||
|
|
|
(expressed in thousands) |
|
||||
|
Change in benefit obligation: |
|
|
|
|
|
|
|
|
Projected benefit obligation, beginning of year |
|
$ |
23,691 |
|
$ |
21,397 |
|
|
Service cost |
|
|
800 |
|
|
690 |
|
|
Interest cost |
|
|
833 |
|
|
768 |
|
|
Actuarial gain |
|
|
5,762 |
|
|
269 |
|
|
Exchange rate change |
|
|
(1,830 |
) |
|
1,130 |
|
|
Benefits paid |
|
|
(638 |
) |
|
(563 |
) |
|
Projected benefit obligation, end of year |
|
$ |
28,618 |
|
$ |
23,691 |
|
|
|
|
|
|
|
|
|
|
|
Change in plan assets: |
|
|
|
|
|
|
|
|
Fair value of plan assets, beginning of year |
|
$ |
18,589 |
|
$ |
13,058 |
|
|
Actual return on plan assets |
|
|
2,978 |
|
|
775 |
|
|
Employer contributions |
|
|
638 |
|
|
4,575 |
|
|
Exchange rate change |
|
|
(1,298 |
) |
|
744 |
|
|
Benefits paid |
|
|
(638 |
) |
|
(563 |
) |
|
Fair value of plan assets, end of year |
|
$ |
20,269 |
|
$ |
18,589 |
|
F-30
The following is a summary of the funded status of the defined benefit retirement plan and amounts recognized in the Company’s Consolidated Balance Sheets at September 27, 2014 and September 28, 2013:
|
|
|
|
|
|
|
|
|
|
|
|
2014 |
|
2013 |
|
||
|
|
|
(expressed in thousands) |
|
||||
|
Funded status: |
|
|
|
|
|
|
|
|
Funded status, end of year |
|
$ |
(8,349 |
) |
$ |
(5,102 |
) |
|
Accumulated other comprehensive loss |
|
|
10,469 |
|
|
7,819 |
|
|
Net amount recognized |
|
$ |
2,120 |
|
$ |
2,717 |
|
|
|
|
|
|
|
|
|
|
|
Amounts recognized in consolidated balance sheets: |
|
|
|
|
|
|
|
|
Accrued payroll and related costs |
|
$ |
(695 |
) |
$ |
(668 |
) |
|
Pension benefit plan obligation |
|
|
(7,654 |
) |
|
(4,434 |
) |
|
Deferred income taxes |
|
|
3,175 |
|
|
2,360 |
|
|
Accumulated other comprehensive income, net of tax |
|
|
7,294 |
|
|
5,459 |
|
|
Net amount recognized |
|
$ |
2,120 |
|
$ |
2,717 |
|
The weighted average assumptions used to determine the defined benefit retirement plan obligation at September 27, 2014 and September 28, 2013, and also the net periodic benefit cost for the following fiscal year, were as follows:
|
|
|
|
|
|
|
|
|
|
|
|
2014 |
|
2013 |
|
||
|
Discount rate |
|
|
2.5 |
% |
|
3.6 |
% |
|
Expected rate of return on plan assets |
|
|
5.5 |
% |
|
5.5 |
% |
|
Expected rate of increase in future compensation levels |
|
|
3.4 |
% |
|
2.8 |
% |
The discount rate is calculated based on zero-coupon bond yields published by the Deutsche Bundesbank for maturities that match the weighted average duration of the pension liability, adjusted for the average credit spread of corporate bond rates above the government bond yields.
The expected rate of return on plan assets represents the weighted average of the expected returns on individual asset categories in the portfolio. The Company uses investment services to assist with determining the overall expected rate of return on pension plan assets. Factors considered in the Company’s determination include historical long-term investment performance and estimates of future long-term returns by asset class.
The overall objective of the Company’s investment policy and strategy for the defined benefit retirement plan is to maintain sufficient liquidity to pay benefits and minimize the volatility of returns while earning the highest possible rate of return over time to satisfy the benefit obligations. The plan fiduciaries assist the Company with setting the long-term strategic investment objectives for the defined benefit retirement plan assets. The objectives include preserving the funded status of the trust and balancing risk and return. Investment performance and plan asset mix are reviewed periodically.
F-31
At both September 27, 2014 and September 28, 2013, plan assets were invested in a single mutual fund, the underlying assets of which are allocated to fixed income, and cash and cash equivalents categories (see table below). During the fourth quarter of fiscal year 2014, in an effort to increase the long-term expected return, the plan assets were transferred from one single mutual fund to another through a sale and simultaneous purchase, respectively. The new mutual fund targets a higher exposure to equity markets and is able to generate a higher overall return on a long-term basis. Any decisions to change the asset allocation are made by the plan fiduciaries. However, investment into equity and fixed income securities is limited to a maximum of 65% of total plan assets with a targeted allocation of assets of 50% equity and 50% fixed income.
The actual defined benefit retirement plan asset allocations within the balanced mutual fund at September 27, 2014 and September 28, 2013 are as follows:
|
|
|
|
|
|
|
|
|
|
|
|
Percentage of Plan Assets |
|
||||
|
|
|
2014 |
|
2013 |
|
||
|
Fixed income securities(1) |
|
|
49.0 |
% |
|
53.0 |
% |
|
Cash and cash equivalents(2) |
|
|
51.0 |
% |
|
47.0 |
% |
|
|
|
|
100.0 |
% |
|
100.0 |
% |
|
|
|
|
|
|
(1) |
Fixed income securities are comprised primarily of international government agency and international corporate bonds with investment grade ratings. |
|
|
|
|
|
|
(2) |
At September 27, 2014 and September 28, 2013, cash and cash equivalents include deposit accounts holding cash in Euros and other currencies and term deposits primarily held as collateral for equity futures. The market values of the equity and futures are linked to the values of equity indexes of developed country markets, including U.S., Great Britain, Europe, Canada, Switzerland and Japan. |
As of September 27, 2014 and September 28, 2013, the fair value of the defined benefit retirement plan assets, which are subject to fair value measurements as described in Note 6 to the Consolidated Financial Statements, are as follows:
|
|
|
|
|
|
|
|
|
|
|
|
|
|
|
|
|
|
September 27, 2014 |
|
||||||||||
|
|
|
Level 1 |
|
Level 2 |
|
Level 3 |
|
Total |
|
||||
|
|
|
(expressed in thousands) |
|
||||||||||
|
Mutual fund(1) |
|
$ |
- |
|
$ |
20,269 |
|
$ |
- |
|
$ |
20,269 |
|
|
|
|
|
|
|
|
|
|
|
|
|
|
|
|
|
|
|
September 28, 2013 |
|
||||||||||
|
|
|
Level 1 |
|
Level 2 |
|
Level 3 |
|
Total |
|
||||
|
|
|
(expressed in thousands) |
|
||||||||||
|
Mutual fund(1) |
|
$ |
- |
|
$ |
18,589 |
|
$ |
- |
|
$ |
18,589 |
|
|
|
|
|
|
|
(1) |
The fair value of the mutual fund is generally valued based on closing prices from national exchanges, if the underlying securities are traded on an active market, or fixed income pricing models that use observable market inputs. |
F-32
Net periodic benefit cost for the Company’s defined benefit retirement plan for the fiscal years ended September 27, 2014, September 28, 2013, and September 29, 2012 included the following components:
|
|
|
|
|
|
|
|
|
|
|
|
|
|
|
2014 |
|
2013 |
|
2012 |
|
|||
|
|
|
(expressed in thousands) |
|
|||||||
|
Service cost |
|
$ |
800 |
|
$ |
690 |
|
$ |
412 |
|
|
Interest cost |
|
|
833 |
|
|
768 |
|
|
835 |
|
|
Expected return on plan assets |
|
|
(1,024 |
) |
|
(690 |
) |
|
(660 |
) |
|
Net amortization and deferral |
|
|
463 |
|
|
520 |
|
|
77 |
|
|
Special termination benefits |
|
|
26 |
|
|
- |
|
|
- |
|
|
Net periodic benefit cost |
|
$ |
1,098 |
|
$ |
1,288 |
|
$ |
664 |
|
The accumulated benefit obligation of the Company’s defined benefit retirement plan as of September 27, 2014 and September 28, 2013 was $25.6 million and $21.7 million, respectively.
The future pension benefit payments, which reflect expected future service, for the next five fiscal years, and the combined five fiscal years thereafter, are as follows:
|
|
|
|
|
|
|
|
|
|
Pension |
|
|
Fiscal Year |
|
|
Benefits |
|
|
|
|
|
(expressed in |
|
|
|
|
|
thousands) |
|
|
2015 |
|
$ |
695 |
|
|
2016 |
|
|
789 |
|
|
2017 |
|
|
847 |
|
|
2018 |
|
|
882 |
|
|
2019 |
|
|
940 |
|
|
2020 through 2024 |
|
|
5,727 |
|
|
|
|
$ |
9,880 |
|
Other Retirement
Plans
Certain of the Company’s international subsidiaries have
non-contributory, unfunded post-retirement benefit plans that provide
retirement benefits for eligible employees and managing directors. Generally,
these postretirement plans provide benefits that accumulate based on years of
service and compensation levels. At September 27, 2014 and September 28, 2013,
the aggregate liabilities associated with these post-retirement benefit plans
was $4.2 million and $4.4 million, respectively.
F-33
10. Other Comprehensive Income:
Other Comprehensive Income (Loss), a component of Shareholders’ Investment, consists of foreign currency translation adjustments, gains or losses on derivative instruments, and defined benefit pension plan adjustments.
Income tax expense or benefit allocated to each component of Other Comprehensive Income (Loss) for the fiscal years ended September 27, 2014, September 28, 2013, and September 29, 2012 was as follows:
|
|
|
|
|
|
|
|
|
|
|
|
|
|
|
|
|
|
|
|
|
|
|
|
|
|
|
|
|
|
|
|
|
|
2014 |
|
2013 |
|
2012 |
|
||||||||||||||||||||||
|
|
|
|
|
Tax |
|
Net of |
|
|
|
Tax |
|
Net of |
|
|
|
Tax |
|
Net of |
|
||||||||||
|
|
|
Pretax |
|
(Expense) |
|
Tax |
|
Pretax |
|
(Expense) |
|
Tax |
|
Pretax |
|
(Expense) |
|
Tax |
|
||||||||||
|
|
|
Amount |
|
or Benefit |
|
Amount |
|
Amount |
|
or Benefit |
|
Amount |
|
Amount |
|
or Benefit |
|
Amount |
|
||||||||||
|
|
|
(expressed in thousands) |
|
||||||||||||||||||||||||||
|
Foreign currency translation adjustments |
|
$ |
(5,099 |
) |
$ |
- |
|
$ |
(5,099 |
) |
$ |
585 |
|
$ |
- |
|
$ |
585 |
|
$ |
(2,123 |
) |
$ |
- |
|
$ |
(2,123 |
) |
|
|
Derivative instruments: |
|
|
|
|
|
|
|
|
|
|
|
|
|
|
|
|
|
|
|
|
|
|
|
|
|
|
|
|
|
|
Unrealized net gain (loss) |
|
|
1,749 |
|
|
(637 |
) |
|
1,112 |
|
|
2,135 |
|
|
(786 |
) |
|
1,349 |
|
|
(458 |
) |
|
167 |
|
|
(291 |
) |
|
|
Net (gain) loss reclassified to earnings |
|
|
(1,088 |
) |
|
397 |
|
|
(691 |
) |
|
(733 |
) |
|
269 |
|
|
(464 |
) |
|
792 |
|
|
(293 |
) |
|
499 |
|
|
|
Defined benefit pension plan: |
|
|
|
|
|
|
|
|
|
|
|
|
|
|
|
|
|
|
|
|
|
|
|
|
|
|
|
|
|
|
Unrealized net (loss) gain |
|
|
(3,656 |
) |
|
1,103 |
|
|
(2,553 |
) |
|
(184 |
) |
|
56 |
|
|
(128 |
) |
|
(5,233 |
) |
|
1,579 |
|
|
(3,654 |
) |
|
|
Net loss reclassified to earnings |
|
|
464 |
|
|
(140 |
) |
|
324 |
|
|
520 |
|
|
(157 |
) |
|
363 |
|
|
77 |
|
|
(23 |
) |
|
54 |
|
|
|
Currency exchange rate change |
|
|
394 |
|
|
- |
|
|
394 |
|
|
(269 |
) |
|
- |
|
|
(269 |
) |
|
127 |
|
|
- |
|
|
127 |
|
|
|
Other comprehensive (loss) income |
|
$ |
(7,236 |
) |
$ |
723 |
|
$ |
(6,513 |
) |
$ |
2,054 |
|
$ |
(618 |
) |
$ |
1,436 |
|
$ |
(6,818 |
) |
$ |
1,430 |
|
$ |
(5,388 |
) |
|
The changes in the net-of-tax balances of each component of AOCI during the fiscal years ended September 27, 2014, September 28, 2013, and September 29, 2012 were as follows:
|
|
|
|
|
|
|
|
|
|
|
|
|
|
|
|
|
|
|
|
|
|
|
|
|
|
|
|
|
|
|
|
|
|
|
|
|
|
|
|
|
|
2014 |
|
2013 |
|
2012 |
|
||||||||||||||||||||||||||||||
|
|
|
Foreign |
|
Unrealized |
|
Defined |
|
Total |
|
Foreign |
|
Unrealized |
|
Defined |
|
Total |
|
Foreign |
|
Unrealized |
|
Defined |
|
Total |
|
||||||||||||
|
|
|
(expressed in thousands) |
|
||||||||||||||||||||||||||||||||||
|
Beginning balance |
|
$ |
17,319 |
|
$ |
477 |
|
$ |
(5,459 |
) |
$ |
12,337 |
|
$ |
16,734 |
|
$ |
(408 |
) |
$ |
(5,425 |
) |
$ |
10,901 |
|
$ |
18,857 |
|
$ |
(616 |
) |
$ |
(1,952 |
) |
$ |
16,289 |
|
|
Other comprehensive income (loss) before reclassifications |
|
|
(5,099 |
) |
|
1,112 |
|
|
(2,159 |
) |
|
(6,146 |
) |
|
585 |
|
|
1,349 |
|
|
(397 |
) |
|
1,537 |
|
|
(2,123 |
) |
|
(291 |
) |
|
(3,527 |
) |
|
(5,941 |
) |
|
Amounts reclassified to earnings |
|
|
- |
|
|
(692 |
) |
|
324 |
|
|
(368 |
) |
|
- |
|
|
(464 |
) |
|
363 |
|
|
(101 |
) |
|
- |
|
|
499 |
|
|
54 |
|
|
553 |
|
|
Other comprehensive income (loss) |
|
|
(5,099 |
) |
|
420 |
|
|
(1,835 |
) |
|
(6,514 |
) |
|
585 |
|
|
885 |
|
|
(34 |
) |
|
1,436 |
|
|
(2,123 |
) |
|
208 |
|
|
(3,473 |
) |
|
(5,388 |
) |
|
Ending balance |
|
$ |
12,220 |
|
$ |
897 |
|
$ |
(7,294 |
) |
$ |
5,823 |
|
$ |
17,319 |
|
$ |
477 |
|
$ |
(5,459 |
) |
$ |
12,337 |
|
$ |
16,734 |
|
$ |
(408 |
) |
$ |
(5,425 |
) |
$ |
10,901 |
|
F-34
The effect on certain line items in the Consolidated Statements of Income of amounts reclassified out of AOCI for the fiscal years ended September 27, 2014, September 28, 2013, and September 29, 2012 was as follows:
|
|
|
|
|
|
|
|
|
|
|
|
|
|
|
|
|
|
2014 |
|
2013 |
|
2012 |
|
Affected Line Item in the |
|
||||
|
Derivative instruments: |
|
(expressed in thousands) |
|
|
|
|
|||||||
|
Currency exchange contracts |
|
$ |
1,088 |
|
$ |
733 |
|
$ |
(162 |
) |
|
Revenue |
|
|
Interest rate swaps |
|
|
- |
|
|
- |
|
|
(630 |
) |
|
Interest expense, net |
|
|
Total net gains (losses) included in income before income taxes |
|
|
1,088 |
|
|
733 |
|
|
(792 |
) |
|
|
|
|
Income tax (expense) benefit |
|
|
(397 |
) |
|
(269 |
) |
|
293 |
|
|
|
|
|
Total net gains (losses) included in net income |
|
|
691 |
|
|
464 |
|
|
(499 |
) |
|
|
|
|
|
|
|
|
|
|
|
|
|
|
|
|
|
|
|
Defined benefit pension plan: |
|
|
|
|
|
|
|
|
|
|
|
|
|
|
Actuarial losses |
|
|
(253 |
) |
|
(171 |
) |
|
(25 |
) |
|
Cost of sales |
|
|
Actuarial losses |
|
|
(131 |
) |
|
(155 |
) |
|
(23 |
) |
|
Selling and marketing |
|
|
Actuarial losses |
|
|
(80 |
) |
|
(194 |
) |
|
(29 |
) |
|
General and administrative |
|
|
Total losses included in income before income taxes |
|
|
(464 |
) |
|
(520 |
) |
|
(77 |
) |
|
|
|
|
Income tax benefit |
|
|
140 |
|
|
157 |
|
|
23 |
|
|
|
|
|
Total net losses included in net income |
|
|
(324 |
) |
|
(363 |
) |
|
(54 |
) |
|
|
|
|
|
|
|
|
|
|
|
|
|
|
|
|
|
|
|
Total net-of-tax reclassifications out of accumulated other comprehensive income included in net income |
|
$ |
367 |
|
$ |
101 |
|
$ |
(553 |
) |
|
|
|
11. Business Acquisition:
On June 17, 2014, the Company acquired Roehrig Engineering, Inc. (“REI”) for a total estimated purchase price of $14.8 million. REI is a leader in testing systems utilizing electric and electromagnetic actuation technology and is based in Lexington, North Carolina. The acquisition is part of the Company’s continued investment to expand the Company’s technology base and supplement its organic growth initiatives.
The transaction was accounted for under the acquisition method of accounting and the results of operations of the entity are included in the Company’s Consolidated Statements of Income as of and since June 17, 2014, the date of acquisition, and are reported in the Company’s Test segment. The acquisition of REI’s assets and liabilities does not constitute a material business combination and accordingly, pro forma results have not been included.
The purchase price of REI consists of the following:
|
|
|
|
|
|
|
(expressed in thousands): |
|
Amount |
|
|
|
Cash paid at closing, net of cash acquired |
|
$ |
14,192 |
|
|
Estimated contingent consideration |
|
|
650 |
|
|
Total purchase price, net of cash acquired |
|
$ |
14,842 |
|
F-35
The purchase price for REI includes cash consideration of $14.2 million funded from our existing credit facility and an earn-out-based contingent consideration of up to a maximum of $2.0 million based on customer orders obtained by REI during the calendar years of 2014 and 2015. The Company determined that the 2014 earn-out milestone would not be achieved and as a result, $1.0 million of the estimated earn-out was adjusted to goodwill. During the fourth quarter, the Company completed its preliminary allocation of intangibles and adjusted the contingent consideration of $2.0 million recorded in the third quarter to $0.7 million. After the provisional period, subsequent changes in the fair value of this obligation will be recognized as adjustments to contingent consideration and reflected within the Company’s Consolidated Statements of Income. Of the $14.2 million paid, $2.0 million is held in escrow until certain conditions of the escrow agreement are fulfilled. The escrow will be settled by no later than June 30, 2017. Costs associated with the acquisition of REI were not significant and were expensed as incurred.
The purchase price of REI has been preliminarily allocated and exceeds the net of the acquisition-date amount of the identifiable assets acquired and the liabilities assumed by $9.6 million. Cash flows used to determine the purchase price included strategic and synergistic benefits (investment value) specific to the Company, which resulted in a purchase price in excess of the fair value of identifiable net liabilities. The purchase price also included the fair values of other assets that were not identifiable, not separately recognizable under accounting rules (e.g. assembled workforce) of immaterial value in addition to a going-concern element that represents the Company’s ability to earn a higher rate of return on the group of assets than would be expected on the separate assets as determined during the valuation process. This additional investment value resulted in goodwill which is not expected to be deductible for income tax purposes.
The following table summarizes the preliminary provisional allocation of the purchase price to the fair values assigned to the assets acquired and liabilities assumed at the date of acquisition:
|
|
|
|
|
|
|
(expressed in thousands): |
|
Amount |
|
|
|
Accounts receivable and inventory |
|
$ |
1,763 |
|
|
Machinery and equipment |
|
|
477 |
|
|
Deferred tax asset |
|
|
289 |
|
|
Current liabilities |
|
|
(1,900 |
) |
|
Identifiable intangible assets |
|
|
4,593 |
|
|
Net Assets acquired |
|
|
5,222 |
|
|
Goodwill |
|
|
9,620 |
|
|
Total purchase price consideration |
|
$ |
14,842 |
|
As of September 27, 2014, the Company has not completed its fair value determination for all of the elements of the REI acquisition due to the timing of the closing date and the time required to complete certain valuations. The Company expects to complete the valuation in the first quarter of fiscal year 2015.
12. Severance and Related Costs:
During fiscal year 2014, the Company announced that it expects to realize productivity improvements in Test segment business processes gained through investments in infrastructure and IT technology. Associated with these savings, the Company initiated workforce and other cost reduction actions at certain of its locations in the U.S. and Europe during fiscal year 2014. As a result of these cost reduction actions, the Company incurred severance and related costs of $6.3 million and $3.4 million of the severance cost was unpaid as of September 27, 2014.
F-36
The following table summarizes the severance and related costs included in the Company’s Consolidated Statements of Income for the fiscal year ended September 27, 2014:
|
|
|
|
|
|
|
|
|
2014 |
|
|
|
|
|
(expressed in thousands) |
|
|
|
|
|
|
|
|
|
Cost of sales |
|
$ |
3,507 |
|
|
Selling and marketing |
|
|
1,805 |
|
|
General and administrative |
|
|
1,024 |
|
|
Total severance and related costs |
|
$ |
6,336 |
|
The following table summarizes the severance and related costs included in the Company’s September 27, 2014 Consolidated Balance Sheet:
|
|
|
|
|
|
|
|
|
2014 |
|
|
|
|
|
(expressed in thousands) |
|
|
|
|
|
|
|
|
|
Accrued payroll and related costs |
|
$ |
1,567 |
|
|
Defined benefit pension plan obligation |
|
|
26 |
|
|
Other long-term liabilities |
|
|
1,783 |
|
|
Total severance and related costs |
|
$ |
3,376 |
|
13. Commitments and Contingencies:
Government Investigation
As previously reported by the Company with disclosures
starting in March 2012, the Company investigated certain gift, travel,
entertainment and other expenses incurred in connection with some of the
Company operations in the Asia Pacific region. This investigation focused on
possible violations of Company policy, corresponding internal control issues
and possible violations of applicable law, including the Foreign Corrupt
Practices Act. Substantial investigative work was completed on this matter and
the Company took remedial actions, including changes to internal control
procedures and removing certain persons formerly employed in the Company’s Korea office. The Company voluntarily
disclosed this matter to the Department of Justice and the SEC (the
“Agencies”). The Company presented the results of the Company’s investigation
and the Company’s corrective actions to representatives of the Agencies on January
16, 2013. The Company is now investigating certain business practices in China.
This investigation has a similar focus to the prior investigation as described
above. The Company has updated the Agencies regarding this investigation and
the Company has taken certain initial remedial actions, including changes to
internal control procedures and removing certain persons formerly employed by
the Company in the China business. The Company is in regular communication with
the Agencies regarding these investigations. The Company cannot predict the
outcome of the matters described in this paragraph at this time or whether
these matters will have a material adverse impact on the Company’s business
prospects, financial condition, operating results or cash flows.
Litigation
The Company is subject to
various claims, legal actions, and complaints arising in the ordinary course of
business. Management believes the final resolution of legal matters
outstanding as of September 27, 2014 will not have a material adverse effect on
the consolidated financial position or results of operations of the Company. The Company expenses legal costs
as incurred.
F-37
Leases
Total lease expense was $5.7 million, $5.6 million, and $5.3 million for fiscal
years 2014, 2013, and 2012, respectively. The Company has operating lease
commitments for equipment, land, and facilities that expire on various dates
through 2056. Minimum annual rental commitments for the next five fiscal years
and thereafter are as follows:
|
|
|
|
|
|
|
Year |
|
Payments |
|
|
|
|
|
(expressed in |
|
|
|
|
|
thousands) |
|
|
|
2015 |
|
$ |
4,208 |
|
|
2016 |
|
|
2,590 |
|
|
2017 |
|
|
1,663 |
|
|
2018 |
|
|
748 |
|
|
2019 |
|
|
358 |
|
|
Thereafter |
|
|
907 |
|
|
|
|
$ |
10,474 |
|
F-38
MTS SYSTEMS CORPORATION AND SUBSIDIARIES
SCHEDULE II - SUMMARY OF CONSOLIDATED ALLOWANCES
FOR DOUBTFUL ACCOUNTS
FOR THE FISCAL
YEARS ENDED SEPTEMBER 27, 2014, SEPTEMBER 28, 2013, AND
SEPTEMBER 29, 2012,
(expressed in thousands)
|
|
|
|
|
|
|
|
|
|
|
|
|
|
|
|
|
|
Balance Beginning |
|
Provisions/ |
|
Amounts Written- |
|
Balance End of |
|
||||
|
|
|
|
|
|
|
|
|
|
|
|
|
|
|
|
Allowance for Doubtful Accounts: |
|
|
|||||||||||
|
|
|
|
|
|
|
|
|
|
|
|
|
|
|
|
2014 |
|
$ |
1,998 |
|
$ |
810 |
|
$ |
(199 |
) |
$ |
2,609 |
|
|
|
|
|
|
|
|
|
|
|
|
|
|
|
|
|
2013 |
|
|
2,247 |
|
$ |
(160 |
) |
$ |
(89 |
) |
|
1,998 |
|
|
|
|
|
|
|
|
|
|
|
|
|
|
|
|
|
2012 |
|
|
1,534 |
|
|
896 |
|
|
(183 |
) |
|
2,247 |
|
F-39