Attached files
| file | filename |
|---|---|
| 8-K - 8-K - Nimble Storage Inc | d826980d8k.htm |
| EX-99.2 - EX-99.2 - Nimble Storage Inc | d826980dex992.htm |
Exhibit 99.1

Nimble Storage, Inc. Q3FY15 Shareholder Letter
Executive Summary
Our founding thesis was based on a belief that the storage systems and associated software markets, together accounting for ~$40B in annual revenue, are going through major architectural changes. We believe that our adaptive flash platform is the broadest architectural approach and is superior to the approach of major incumbents as well as emerging companies in our industry.
This is our fourth quarter of reporting results as a public company – a year where we have made major strides towards our goal of becoming the market leader. During the last year, we have had a very strong track record for delivering innovation culminating in the early delivery of our Fibre Channel product that expands the market opportunity four-fold. Our Adaptive Flash platform, comprising CASL, which is our flash-optimized file system and InfoSight, our cloud-based management software, delivers a compelling value proposition to customers. The value proposition of our platform, strong partnerships with industry leading eco-system partners, a vibrant installed base of satisfied customers and a rapidly maturing channel partner base have all allowed us to drive a rapid pace of customer adoption across enterprises of all sizes and cloud service providers.
Our performance during the third quarter demonstrates our strong execution track record:
| • | The most exciting highlight of the quarter was the release of our Fibre Channel SAN capability and the extremely positive feedback from over 40 beta customer deployments, several of which have already converted into orders |
| • | Rapid growth in bookings from deals over $100K, which in turn drove a double-digit sequential increase in new customer ASPs to all-time highs |
| • | Very strong contribution from international markets that accounted for 20% of total revenue |
| • | A smooth roll-out of an entirely new family of storage models that accounted for over 50% of the bookings mix during the quarter |
| • | Launch of our Storage on Demand pricing model, our integration with Cisco UCS Director and OpenStack – all aimed at continued innovation for our cloud service provider (CSP) customers |
Key financial highlights for the quarter include:
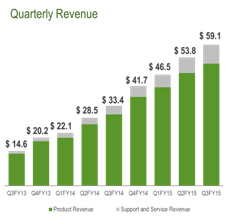
| • | Revenue of $59.1M was up 77% from previous year Q3 |
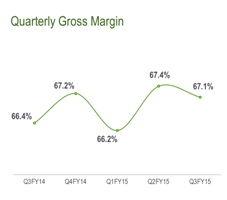
| • | Non-GAAP gross margin of 67.1% |
| • | Non-GAAP operating margin of negative 16% compared to negative 24% during Q3 of the previous year |
| • | Non-GAAP net loss of $0.15 per share, based on 73 million weighted average basic and diluted shares during Q3 |
| • | Foreign exchange loss was $1.1 million, which had a $0.01 per share impact on basic and diluted loss per share |
| • | Cash burn of $0.8 million during Q3, already close to breakeven cash burn levels |
| NIMBLE STORAGE Q3FY15 SHAREHOLDER LETTER | 1 |
Well Positioned to Gain as the Storage Market Goes Through a Major Transition
The storage systems and associated software markets, together accounting for ~$40B in annual revenues, are going through major architectural changes that are causing slow to non-existent revenue growth for the storage market as a whole, negatively impacting traditional incumbents. We believe these architectural changes are driving unprecedented gains in efficiency, and could cause the storage market to contract to a new baseline before growth resumes driven by underlying data growth.
As the overall market growth slows, the underlying dynamics are that traditional incumbents are losing market share to younger, more nimble companies that are better able to leverage or drive those architectural changes. Specifically, there are three major disruptive changes underway, and we believe we are uniquely positioned to leverage those architectural changes and emerge as the market leader:
Flash. Modern architectures that are able to leverage flash effectively can eliminate the traditional penalties of having to over-provision capacity to deliver the performance that applications require. Because of the breadth of our Adaptive Flash platform and the underlying flash-optimized CASL file-system, we are able to address and consolidate storage for the widest range of enterprise workloads. This stands in sharp contrast to all-flash arrays that only target high performance computing applications or traditional tiered hybrid arrays that are inefficient in their use of flash and disk resources.
Converged Infrastructure. Converged infrastructure is emerging as a “higher level” building block as customers look to expedite and simplify the manner in which they deploy and manage infrastructure for their business-enabling applications. Our strategy to address this need is to build SmartStack solutions through partnerships with industry leaders such as Cisco, Citrix, Microsoft and VMware. SmartStack is much more efficient than competing solutions such as FlexPod or Vblock and combines the benefits of best of breed infrastructure along with integration into management frameworks such as vCenter, Microsoft System Center, Cisco UCS Director and OpenStack.
Cloud. Cloud service providers (CSPs), companies delivering infrastructure or software as a cloud service, are increasingly displacing some of the demand from end customers – whether the CSPs are public cloud companies, SaaS companies or IaaS companies. Our strategy has been to focus on serving CSPs by leveraging the superior efficiency and modular scalability of our storage systems and the administrative cost savings provided by InfoSight – all of which could enhance profitability for CSPs. This strategy has resulted in CSPs being one of our fastest growing segments and a significant contributor to our overall growth.
Driving Revenue Growth
| Our strategy for growth remains focused on four broad themes: (i) New customer acquisition; (ii) Expanding into Global 5000 enterprises and cloud service providers; (iii) International expansion; and (iv) Driving repeat bookings through our “land and expand” model.
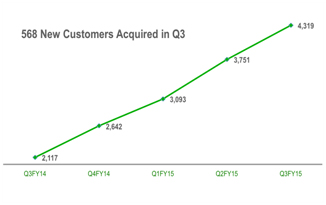
New Customer Acquisition. We more than doubled our customer base over the last year, having added 568 new customers during the quarter to end Q3 with over 4,300 customers in our installed base. |
|
| NIMBLE STORAGE Q3FY15 SHAREHOLDER LETTER | 2 |
|
Even as we grew our customer base significantly, the average new customer transaction size saw a sizeable increase as the proportion of bookings from deals over $100K represented an all-time high. This is a continuation of the trend we saw last quarter with the introduction of our high-end CS700 platform that allows us to compete very successfully in petabyte-scale deployments against traditional modular storage arrays as well as in high performance computing applications against all-flash arrays. | |
|
|
The channel remains a key element in driving new customer acquisitions. We again saw that the number of unique partner account executives that closed deals increased by 79% from a year ago, and the base of accredited engineers within our partner base more than doubled from a year ago. The channel also continues to drive leverage for us as deals where our channel partner contribution was deemed to have been 75% or greater increased by 87% from a year ago. |
| Expanding into Global 5000 enterprises and CSPs. Our third quarter saw the fastest pace of customer acquisition across these two strategic growth segments, the combined bookings from these two segments was at an all-time high as a proportion of our overall total bookings.
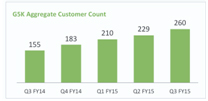
We ended the quarter with 260 Global 5000 enterprise customers, including 15 that are within the Global 100. Our value proposition as a platform that can consolidate a large number of varied workloads cost-effectively, with vastly better performance, superior data protection and radically lower complexity is allowing us to maintain a high win rate against the leading incumbent platforms. |
Case Example: Yahoo! JAPAN
The largest web portal in Japan, Yahoo! JAPAN, decided to migrate their infrastructure systematically to an OpenStack managed environment.
In that process, their key business challenges were to reduce the capital cost of infrastructure, lower the facilities cost associated with rapid data growth, and most importantly, lower the management complexity. From a technical perspective, they also needed to be able to rapidly provision and boot hundreds of OpenStack instances which was a time-consuming process
They chose Nimble as one of their two storage platforms:
• Our platform was extremely efficient at delivering capacity as well as performance at a lower cost with a substantially smaller facilities footprint
• We reduced the time to boot OpenStack instances radically through the integration of our cloning features into OpenStack
• Perhaps the most significant benefit they saw was that InfoSight could lower their day-to-day operational burden significantly |
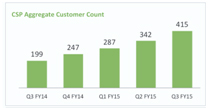
| Our pace of acquisition of CSPs, including SaaS companies and IaaS companies, further accelerated during the quarter as we added 73 new customers during the quarter. Bookings from CSPs grew faster than our overall bookings as our product value proposition continues to resonate very strongly in this segment. During the quarter, we introduced our Storage on Demand pricing model that allows service providers to procure storage as a utility and the largest deal in the quarter was with a service provider deploying over a petabyte of storage leveraging this new model. |
Case Example: Xtium
Xtium provides managed cloud hosting, online backup and virtual disaster recovery services to mid-sized businesses.
Xtium chose Nimble for a project to refresh over 1PB of storage over their incumbent storage vendor and two large alternative storage vendors. This choice was driven by our simplicity, efficiency in delivering capacity and performance, snapshot based backups and the ease of scaling the infrastructure as Xtium acquires new end-customers.
An additional key consideration that Xtium had was to match their costs as closely as possible to their monthly recurring revenues. Our ability to deliver a storage on demand utility pricing model, which in turn is enabled by our ability to scale granularly rather than in monolithic chunks, coupled with the ability to monitor the infrastructure using InfoSight was an additional key enabler. |
International expansion. International bookings more than doubled on a year over year basis, with particularly strong performance in the UK, Australia, Japan and South East Asia. Investments that we have made over the last several quarters are beginning to pay off as our distribution and channel relationships mature and as we have built a significant base of reference customers. We are particularly pleased to have been selected by CRN as the storage vendor of the year in the UK. With the ability to distribute products in 48 countries globally, we see international growth as a continued priority.
| NIMBLE STORAGE Q3FY15 SHAREHOLDER LETTER | 3 |
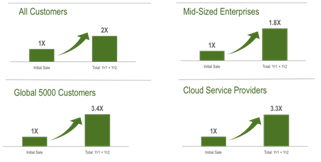
| Land and expand model. The integrity of our land and expand model remains in place, with initial customer deployments translating into repeat deployments as customers migrate additional workloads onto our platforms. Our product value proposition, our scalability and the quality of our support remain key drivers of repeat bookings. |
|
Extending our Technology Leadership
Our Adaptive Flash platform, comprising the CASL file system and InfoSight cloud-based management, is enabling us to drive high win rates against traditional incumbents as well as younger storage companies because of the compelling value proposition we bring to bear:
| • | Substantially lower cost of capacity and cost of performance, whether we are compared with traditional disk arrays, hybrid flash and disk arrays, or all-flash arrays |
| • | Flexible scaling in that we can start small and grow in granular increments non-disruptively to petabytes of capacity or hundreds of thousands of IOPS |
| • | Better application data protection |
| • | Radically simpler manageability and supportability |
We started 2014 with a very ambitious innovation agenda aimed at addressing a vastly broader set of enterprise workloads and enhancing our competitive differentiation by an even wider margin.
In Q1 of this year we made scale-out clustering generally available to our entire installed base and scale-out capability is now included in our default shipping releases. We introduced our high-end CS700 platform and all-flash shelves as part of our Adaptive Flash platform during Q2 of this year – effectively addressing all-flash workloads as well as petabyte-scale deployments with a single compact platform.
During Q3, we refreshed our entire platform portfolio to improve price-performance by more than 50%. We are pleased at the smooth transition of our entire controller family to a new set of controllers – a major undertaking that was executed very well as we ended the quarter with over 50% of our bookings coming from these new models. As part of the release accompanying the new platforms, we also introduced a host of software enhancements (e.g., multi-tenancy features, deeper VMware integration, triple parity RAID, CommVault integration, etc.) that have collectively fortified our value proposition.
| The most significant step this year was the availability of Fibre Channel SAN functionality at the end of Q3. The broad availability of our SAN solution was a full quarter ahead of schedule. In large measure, this was a reflection of the successful beta program that we ran for Fibre Channel. We had 40 deployments as part of our beta program and the initial feedback was overwhelmingly positive as customers realized the full benefits of our core platform. Several of our beta customers have already become customers. We have hundreds of channel partners trained and ready to sell our SAN solution and all are highly enthusiastic about the rapid expansion of our market opportunity. |
Fibre Channel Win at Public Sector Managed Care Health Plan
The largest health plan in Kern County has hundreds of virtual servers running a variety of workloads including MS SQL databases, Oracle databases, Exchange and windows file servers. They were facing performance bottlenecks in their environment with databases consuming as much as 75% of the available IOPS and causing email performance degradation during maintenance windows. They were concerned that addition of new Microsoft servers would pose further challenges.
They deployed the Nimble Fibre Channel SAN solution and compared us to their incumbent and to an alternate tiered hybrid storage array. They chose the Nimble platform because of our consistent sub-millisecond latency, excellent write performance and the fact that managing our system was dramatically simpler than the alternate tiered hybrid array and their incumbent SAN solution. They replaced 1.3 racks of a competitors system with 12U Nimble SAN systems – an 80% reduction in footprint. |
| NIMBLE STORAGE Q3FY15 SHAREHOLDER LETTER | 4 |
| During Q3, we continued to build on our SmartStack converged infrastructure solution portfolio as we released integration with UCS Director and also announced SmartStack solutions to accelerate migration to Oracle’s JD Edwards ERP software and for remote office desktop virtualization deployments. During the quarter, we also announced the availability of our integration into OpenStack.
Q3FY15 Financial Results
As a reminder, all results presented in this letter are on a non-GAAP basis except for revenue and the balance sheet. Non-GAAP results exclude the impact of stock-based compensation. |
Grant Street Group Displaces All-Flash Array
Grant street group, a leading provider of solutions for high-volume online auctions had already deployed Nimble Storage arrays for their back-office applications.
However, for their performance intensive online application, they were proceeding down the path of deploying an all-flash array. When we announced our high-end CS700 controller and our all-flash shelf, they tested our solution and decided to deploy us for the following main reasons:
• The latency they experienced was extremely low allowing them to match the needs of the online auction application
• They were able to combine high performance with the resilience and data protection that they had already experienced with Nimble
• They were keen on leveraging InfoSight to simplify the management of all of their storage |
| Q3 FY15 was a strong financial quarter for us. We achieved revenue of $59.1 million, which was above our guidance of $56 million to $58 million. Q3 revenue grew 77% from prior year. Our gross margin remained very strong at 67.1% and above our long-term financial model of 63% to 65%. Our operating loss was $9.7 million, better than our projected operating loss of $11 million to $12 million, due to higher than expected revenue and gross margins. Adjusted EBITDA for the quarter was negative $8.6 million. During Q3, due to the appreciation of the USD against most major currencies, we reported a loss on foreign exchange of $1.1 million in non-operating expenses, which had a $0.01 per share impact on basic and diluted net loss per share. In addition, we estimate that at constant Q2 exchange rates, our Q3 revenue would have been approximately $0.3 million higher, and our Q3 operating loss would have been $0.1 million lower. Q3 non-GAAP EPS was a loss of $0.15 per share compared to our financial guidance of $0.16 to $0.17 loss per share.
Product revenue for Q3 was $51.1 million, representing 87% of total revenue and an |
| |
| increase of 71% from Q3 of the prior year. Support and service revenue for Q3, which includes our maintenance entitlement and InfoSight service, was $8.0 million, representing 13% of total revenue and an increase of 126% from Q3 of the prior year. Our international business contributed 20% of total revenue during Q3 and grew by 135% from Q3 of the prior year. We ended Q3 with total deferred revenue of $60.5 million, an increase of $34.1 million or 129% from Q3 last year. Our deferred revenue consists primarily of payments received for support and service agreements, which have an average life of approximately three years. | ||
|
Gross margin was 67.1% in Q3, up by 0.7 percentage points from 66.4% last year. Our gross margin improvement from prior year was driven mainly by an increase in our support and service margin. Our long-term target for overall gross margin remains 63% to 65%, even though we expect to be at the high end of this range in the near term.
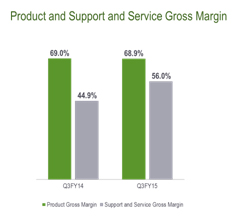
Product gross margin in Q3 was 68.9%, consistent with prior year, and 0.5 percentage points lower than the all-time high of 69.4% we reported in Q2. Our strong product gross margin continues to reflect the efficiencies of our Adaptive Flash platform. We expect our long-term target product gross margin to be approximately 66%-67% as we continue to expand our market share in a highly competitive environment. |
| |
| NIMBLE STORAGE Q3FY15 SHAREHOLDER LETTER | 5 |
| Support and service gross margin in Q3 was 56%, up by 11.1 percentage points from 44.9% last year and 3.1 percentage points higher than the 52.9% we reported in Q2. The improvements in support and service gross margin from prior year and from prior quarter were driven by increased revenue from our larger base of customers and economies of scale from our support organization, enabled by the automation capabilities of InfoSight. As we recognize the deferred revenue from our support and service agreements over their average 3-year life, we expect our support and service gross margin to increase towards the long-term target of greater than 60%.
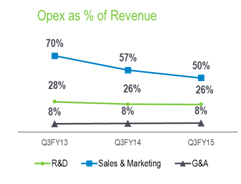
Q3 total non-GAAP operating expenses were $49.4 million or 84% of revenue compared to Q3 last year operating expenses of $30.3 million or 91% of revenue. We saw an improvement in overall operating expense leverage by 7 percentage points, driven by sales and marketing productivity gains. |
|
| • Research and development (R&D) spending in Q3 was $15.1 million or 26% of revenue compared to last year when spending was $8.6 million or 26% of total revenue. Leverage in R&D was flat compared to prior year as we continued to invest in our rich product roadmap. Our long-term target for R&D spending is 11% to 13% of total revenue. | ||
|
• Sales and marketing (S&M) spending was $29.4 million or 50% of revenue compared to Q3 last year spending of $19.1 million or 57% of revenue. Our S&M operating expenses as a percentage of revenue improved by 7 percentage points vs. prior year as we continued to achieve leverage in our go to market efforts. We expect our long-term target for S&M spending to be 28% to 31% of revenue. | ||
|
• General and administrative (G&A) spending was $4.9 million or 8% of revenue compared to Q3 last year spending of $2.7 million or 8% of revenue. G&A as a percentage of revenue was flat compared to prior year due to increased costs of operating as a public company and higher facilities expenses. As we continue to benefit from economies of scale, we expect over time to achieve our long-term target of G&A spending at 5% to 6% of total revenue. |
| |
Our Q3 non-GAAP operating loss was $9.7 million, better than our guidance for an operating loss of $11 million to $12 million. Q3 non-GAAP operating margin improved to negative 16% compared to negative 24% in Q3 last year, an 8-percentage point improvement. Our Adjusted EBITDA was negative $8.6 million or negative 15% of revenue in Q3 compared to negative 21% in Q3 of last year, a 6-percentage point improvement. Excluding the F/X loss of $1.1 million, our Adjusted EBITDA loss would have been $7.5 million or negative 13% of revenue. As we previously discussed, while operating margin and adjusted EBITDA may fluctuate on a quarterly basis, we currently expect to continue to deliver sequential improvement in these metrics every fiscal year. We remain on track to achieve break-even on a non-GAAP basis around the end of our next fiscal year (FY16).
Q3 non-GAAP EPS was a loss of $0.15 per share on approximately 73 million weighted average basic and diluted shares outstanding compared to a loss of $0.13 per share in Q3 last year. This was better than our guidance for a loss of $0.16 to $0.17 per share. Foreign exchange loss of $1.1 million had a $0.01 per share impact on basic and diluted loss per share.
| NIMBLE STORAGE Q3FY15 SHAREHOLDER LETTER | 6 |
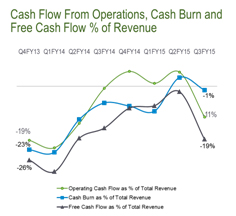
Balance Sheet and Cash Flow
| We ended Q3 with cash and cash equivalents of $205 million. During Q3, our cash balance decreased by $0.8 million and our cash conversion cycle was 3 days. During the last 9 months of this fiscal year, our total cash burn was $3.5 million, approximately $1.1 million per quarter. We expect our cash burn to be immaterial on a go forward basis.
In Q3, we achieved a cash conversion cycle of 3 days, consistent with the past few quarters, and well ahead of our target of 20 days. Days sales outstanding (DSO) was 43 days compared to 37 days in Q3 last year, days sales in inventory (DSI) was 47 days compared to 50 days in Q3 last year, and days payable outstanding (DPO) was 87 days compared to 78 days in Q3 last year. |
|
Our Q3 cash flow from operations was negative $6.5 million; due to $9.2 million of employee stock plan purchases (ESPP) at the end of the first extended purchase period since our IPO in December of last year. The issuance of shares for ESPP on the cash flow statement resulted in negative cash outflow from operations during the quarter, which was offset by positive cash inflow from financing activities.
Capex spend during Q3 was $4.9 million, resulting in negative free cash flow (FCF) of ($11.5 million) for the quarter. We expect our FCF margins to break even ahead of our operating margin since we bill for the full value of support and service upfront even as we recognize revenue over the contractual period. For the full year FY15, we expect our total capex spend to be approximately 10% of total revenue, as we complete the leasehold improvements in our new North Carolina facilities during the rest of this year. This is roughly in line with our prior fiscal year capex spend as a percentage of revenue.
Q4FY15 Financial Outlook
As we enter into Q4, we remain very pleased with the progress we are making towards achieving our long-term financial and strategic objectives.
Our Q4 FY15 financial guidance is as follows:
| • | Total revenue of $65 to $67 million |
| • | Non-GAAP operating loss of $9.5 to $10.5 million |
| • | Adjusted EBITDA loss of $7.0 to $8.0 million |
| • | Non-GAAP net loss of $0.14 to $0.15 per share |
| • | Weighted average basic shares outstanding of approximately 74 million |
Our financial objectives remain (1) driving strong revenue growth and increasing our market share (2) maintaining strong gross margins and (3) steadily progressing towards our long term target financial model of 16%-20% operating margin by delivering sequential improvement in operating margin every year. We remain on track to achieve our goal of non-GAAP P&L break-even by the end of FY16, with FCF break even achieved ahead of that timeline.
We want to thank our partners and customers once again for embracing us, our investors for their confidence in us, and our employees for their dedication and flawless execution.
|
|

| |
| Suresh Vasudevan, CEO | Anup Singh, CFO | |

| NIMBLE STORAGE Q3FY15 SHAREHOLDER LETTER | 7 |
Conference Call Information:
As previously announced, Nimble Storage will host a live question & answer conference call and webcast today at 5:00 p.m. ET (2:00 p.m. PT) to discuss its financial results for the fiscal third quarter 2015.
To access the conference call, dial (877) 741-4248 in the U.S. or (719) 325-4753 from international locations. In addition, a live audio webcast of the conference call will be available on the Nimble Storage Investor Relations website at http://investors.nimblestorage.com.
A replay of the conference call will be available for 45 days. To access the replay, please dial 888-203-1112 and enter pass code 9075266. Callers outside the U.S. and Canada should dial 719-457-0820 and enter pass code 9075266.
Non-GAAP Financial Measures
To provide investors with additional information regarding our financial results, Nimble Storage has disclosed in this release non-GAAP financial measures that are not calculated in accordance with generally accepted accounting principles in the United States, or GAAP. The Company provides non-GAAP gross margin, non-GAAP operating margin, non-GAAP net loss, non-GAAP net loss per basic and diluted share, free cash flow and adjusted EBITDA. In computing many of these non-GAAP financial measures, the Company excludes the effects of stock-based compensation, which is a recurring expense for the Company. The Company has provided reconciliation below of non-GAAP financial measures to the most directly comparable GAAP financial measures.
The Company discloses these non-GAAP financial measures because they are key measures used by the Company’s management and board of directors to understand and evaluate operating performance and trends, to prepare and approve the annual budget and to develop short-term and long-term operational and compensation plans. In particular, the exclusion of certain expenses in calculating non-GAAP financial measures can provide a useful measure for period-to-period comparisons of the Company’s business. Accordingly, the Company believes that these non-GAAP financial measures provide useful information to investors and others in understanding and evaluating the Company’s operating results in the same manner as the Company’s management and board of directors.
Non-GAAP financial measures have limitations as analytical tools and, as such, should not be considered in isolation or as substitutes for analysis of the Company’s results as reported under GAAP. Some of these limitations are:
| • | Non-GAAP financial measures do not consider the potentially dilutive impact of equity-based compensation, which is an ongoing expense for the Company; and |
| • | Other companies, including companies in our industry, may calculate non-GAAP financial measures differently, which reduces their usefulness as comparative measures. |
| NIMBLE STORAGE Q3FY15 SHAREHOLDER LETTER | 8 |
Nimble Storage, Inc.
Reconciliation of GAAP to Non-GAAP Financial Measures
(In thousands, except per share amounts)
(Unaudited)
| Three Months Ended October 31, |
Nine Months Ended October 31, |
|||||||||||||||
| 2014 | 2013 | 2014 | 2013 | |||||||||||||
| GAAP gross margin |
$ | 38,432 | $ | 22,022 | $ | 103,889 | $ | 53,783 | ||||||||
| Stock-based compensation |
1,235 | 179 | 2,826 | 388 | ||||||||||||
|
|
|
|
|
|
|
|
|
|||||||||
| Non-GAAP gross margin |
$ | 39,667 | $ | 22,201 | $ | 106,715 | $ | 54,171 | ||||||||
|
|
|
|
|
|
|
|
|
|||||||||
| GAAP operating margin |
$ | (27,128 | ) | $ | (10,371 | ) | $ | (72,684 | ) | $ | (29,756 | ) | ||||
| Stock-based compensation |
17,406 | 2,265 | 42,132 | 5,047 | ||||||||||||
|
|
|
|
|
|
|
|
|
|||||||||
| Non-GAAP operating margin |
$ | (9,722 | ) | $ | (8,106 | ) | $ | (30,552 | ) | $ | (24,709 | ) | ||||
|
|
|
|
|
|
|
|
|
|||||||||
| GAAP net loss |
$ | (28,389 | ) | $ | (10,136 | ) | $ | (74,101 | ) | $ | (29,970 | ) | ||||
| Stock-based compensation |
17,406 | 2,265 | 42,132 | 5,047 | ||||||||||||
|
|
|
|
|
|
|
|
|
|||||||||
| Non-GAAP net loss |
$ | (10,983 | ) | $ | (7,871 | ) | $ | (31,969 | ) | $ | (24,923 | ) | ||||
|
|
|
|
|
|
|
|
|
|||||||||
| Interest income, net |
(71 | ) | (5 | ) | (89 | ) | (27 | ) | ||||||||
| Provision for income taxes |
219 | 76 | 537 | 252 | ||||||||||||
| Depreciation |
2,213 | 940 | 6,041 | 2,448 | ||||||||||||
|
|
|
|
|
|
|
|
|
|||||||||
| Adjusted EBITDA |
$ | (8,622 | ) | $ | (6,860 | ) | $ | (25,480 | ) | $ | (22,250 | ) | ||||
|
|
|
|
|
|
|
|
|
|||||||||
| GAAP net loss per share, basic and diluted |
$ | (0.39 | ) | $ | (0.48 | ) | $ | (1.04 | ) | $ | (1.46 | ) | ||||
| Stock-based compensation |
0.24 | 0.11 | 0.59 | 0.25 | ||||||||||||
| Impact of difference in number of GAAP and non-GAAP shares |
— | 0.24 | — | 0.79 | ||||||||||||
|
|
|
|
|
|
|
|
|
|||||||||
| Non-GAAP net loss per share |
$ | (0.15 | ) | $ | (0.13 | ) | $ | (0.45 | ) | $ | (0.42 | ) | ||||
|
|
|
|
|
|
|
|
|
|||||||||
| Shares used to compute GAAP net loss per share attributable to common stockholders, basic and diluted |
72,960 | 21,258 | 71,561 | 20,537 | ||||||||||||
| Weighted average effect of the assumed conversion of convertible preferred stock from the date of issuance |
— | 38,868 | — | 38,868 | ||||||||||||
|
|
|
|
|
|
|
|
|
|||||||||
| Shares used to compute Non-GAAP net loss per share |
72,960 | 60,126 | 71,561 | 59,405 | ||||||||||||
|
|
|
|
|
|
|
|
|
|||||||||
Forward-Looking Statements
This press release contains “forward-looking” statements that are based on our management’s beliefs and assumptions and on information currently available to management. We intend for such forward-looking statements to be covered by the safe harbor provisions for forward-looking statements contained in the U.S. Private Securities Litigation Reform Act of 1995. Forward-looking statements include all statements other than statements of historical fact contained in this letter, including information concerning our future financial results, timing of product releases or enhancements, business plans and objectives, potential growth opportunities, competitive position, industry trends and environment and potential market opportunities.
Forward-looking statements are subject to known and unknown risks, uncertainties, assumptions and other factors including, but not limited to, those related to our future financial performance which is inherently uncertain, unforeseen delays in product development or introduction, uncertainty around market acceptance of our solutions, our ability to increase sales of our solutions, our ability to attract and retain customers and to selling additional solutions to our existing customers, our ability to develop new solutions and bring them to market in a timely manner, pricing pressure (as a result of competition or otherwise), introduction of new technologies and products by other companies, our ability to maintain, protect and enhance our brand and intellectual property, the effectiveness of our channel partners and sales team and our ability to continue to expand our business and manage our growth. Moreover, we operate in very competitive and rapidly changing environments, and new risks may emerge from time to time. It is not possible for our management to predict all risks, nor can we assess the impact of all factors on our business or the extent to which any
| NIMBLE STORAGE Q3FY15 SHAREHOLDER LETTER | 9 |
factor, or combination of factors, may cause actual results to differ materially from those contained in any forward-looking statements we may make. Further information on these and other factors that could affect our financial results are included in our filings with the Securities and Exchange Commission, and may cause our actual results, performance or achievements to differ materially and adversely from those anticipated or implied by our forward-looking statements.
You should not rely upon forward-looking statements as predictions of future events. Although our management believes that the expectations reflected in our forward-looking statements are reasonable, we cannot guarantee that the future results, levels of activity, performance or events and circumstances described in the forward-looking statements will be achieved or occur. Moreover, neither we, nor any other person, assume responsibility for the accuracy and completeness of the forward-looking statements. We undertake no obligation to publicly update any forward-looking statements for any reason after the date of this presentation to conform these statements to actual results or to changes in our expectations, except as required by law.
Any unreleased services, features or functions referenced in this document, Nimble Storage’s website or other press releases or public statements that are not currently available are subject to change at Nimble Storage’s discretion and may not be delivered as planned or at all. Customers who purchase Nimble Storage’s products and services should make their purchase decisions based upon services, features and functions that are currently available.
“Customer” or “Customers” referenced above are Nimble Storage’s end customers. It is Nimble Storage’s practice to identify an end-customer from our channel partners prior to shipment and before any support and services are provided. Products are typically shipped directly to the end-customers of our channel partners. Assuming all other revenue recognition criteria have been met, Nimble Storage generally recognizes product revenue on sales upon shipment, as title and risk of loss are transferred at that time. Nimble Storage recognizes revenue from support and service contracts over the contractual service period.
Nimble Storage, the Nimble Storage logo, CASL, InfoSight, SmartStack, and NimbleConnect are trademarks or registered trademarks of Nimble Storage. Other trade names or words used in this document are the properties of their respective owners.
Press Contact:
Kristalle Cooks
408-314-3313
kristalle@nimblestorage.com
Investor Relations Contact:
Edelita Tichepco
408-514-3379
IR@nimblestorage.com
| NIMBLE STORAGE Q3FY15 SHAREHOLDER LETTER | 10 |