Attached files
| file | filename |
|---|---|
| EXCEL - IDEA: XBRL DOCUMENT - INTERNATIONAL GAME TECHNOLOGY | Financial_Report.xls |
| EX-32.1 - CEO CERTIFICATION - INTERNATIONAL GAME TECHNOLOGY | exhibit32-1.htm |
| EX-10.50 - RESTRICTED STOCK UNIT AWARD - INTERNATIONAL GAME TECHNOLOGY | exhibit10-50.htm |
| EX-23.1 - CONSENT OF PWC - INTERNATIONAL GAME TECHNOLOGY | exhibit23.htm |
| EX-2.3 - AMENDMENT NO. 1 TO THE GTECH MERGER AGREEMENT (REVISED) - INTERNATIONAL GAME TECHNOLOGY | exhibit2-3.htm |
| EX-32.2 - CFO CERTIFICATION - INTERNATIONAL GAME TECHNOLOGY | exhibit32-2.htm |
| EX-21 - SUBSIDIARIES - INTERNATIONAL GAME TECHNOLOGY | exhibit21.htm |
| EX-99.1 - GOVERNMENT GAMING REGULATIONS - INTERNATIONAL GAME TECHNOLOGY | exhibit99-1.htm |
| EX-31.2 - CFO CERTIFICATION - INTERNATIONAL GAME TECHNOLOGY | exhibit31-2.htm |
| EX-31.1 - CEO CERTIFICATION - INTERNATIONAL GAME TECHNOLOGY | exhibit31-1.htm |
United States Securities and Exchange Commission
Washington, D.C. 20549
FORM 10-K
[X] ANNUAL REPORT PURSUANT TO SECTION 13 OR 15(d) OF THE SECURITIES EXCHANGE ACT OF 1934
For the Fiscal Year Ended September 27, 2014
(presented as September 30, 2014)
OR
[ ] TRANSITION REPORT PURSUANT TO SECTION 13 OR 15 (d) OF THE SECURITIES EXCHANGE ACT OF 1934
For the transition period from ____ to ____
Commission File Number 001-10684
International Game Technology
|
Nevada
|
|
88-0173041
|
|
(State or other jurisdiction of incorporation or organization)
|
|
(I.R.S. Employer Identification No.)
|
6355 South Buffalo Drive, Las Vegas, Nevada 89113
(Address of principal executive offices)(Zip Code)
Registrant's telephone number, including area code: (702) 669-7777
Securities registered pursuant to Section 12(b) of the Act:
|
Title of each class
|
|
Name of each exchange on which registered
|
|
Common Stock, Par Value $.00015625
|
|
New York Stock Exchange
|
Securities registered pursuant to Section 12(g) of the Act: None
Indicate by check mark if the registrant is a well-known seasoned issuer, as defined in Rule 405 of the Securities Act. Yes [X] No [ ]
Indicate by check mark if registrant is not required to file reports pursuant to Section 13 or 15(d) of the Act. Yes [ ] No [X]
Indicate by check mark whether the registrant (1) has filed all reports required to be filed by Section 13 or 15(d) of the Securities Exchange Act of 1934 during the preceding 12 months (or for such shorter period that the registrant was required to file such reports), and (2) has been subject to such filing requirements for the past 90 days. Yes [X] No [ ]
Indicate by check mark whether the registrant has submitted electronically and posted on its corporate Web site, if any, every Interactive Data File required to be submitted and posted pursuant to Rule 405 of Regulation S-T (§229.405 of this chapter) during the preceding 12 months (or for such shorter period that the registrant was required to submit and post such files). Yes [X] No [ ]
Indicate by check mark if disclosure of delinquent filers pursuant to Item 405 of Regulation S-K (§229.405 of this chapter) is not contained herein, and will not be contained, to the best of registrant's knowledge, in definitive proxy or information statements incorporated by reference in Part III of this Form 10-K or any amendment to this Form 10-K: [ ]
Indicate by check mark whether the registrant is a large accelerated filer, an accelerated filer, a non-accelerated filer, or a smaller reporting company. See the definitions of "large accelerated filer," "accelerated filer," and "smaller reporting company" in Rule 12b-2 of the Exchange Act:
|
Large accelerated filer [X]
|
Accelerated filer [ ]
|
|
Non-accelerated filer [ ] (Do not check if a smaller reporting company)
|
Smaller reporting company [ ]
|
Indicate by check mark whether the registrant is a shell company (as defined in Rule 12b-2 of the Act). Yes [ ] No [X]
The aggregate market value of voting stock held by non-affiliates of the registrant on March 31, 2014: $3.4 billion.
The number of shares outstanding of each of the registrant's classes of common stock, as of November 20, 2014:
247.4 million shares of common stock at $.00015625 par value
DOCUMENTS INCORPORATED BY REFERENCE: An amendment to this Annual Report on Form 10-K to be filed with the Securities and Exchange Commission not later than 120 days after the conclusion of the registrant's fiscal year ended September 27, 2014 is incorporated by reference in Part III.
|
3
|
||
|
|
|
|
|
PART I
|
|
|
|
|
|
|
|
Item 1.
|
5
|
|
|
|
|
|
|
Item 1A.
|
16
|
|
|
|
|
|
|
Item 1B.
|
28
|
|
|
|
|
|
|
Item 2.
|
28
|
|
|
|
|
|
|
Item 3.
|
28
|
|
|
|
|
|
|
Item 4.
|
28
|
|
|
|
|
|
|
PART II
|
|
|
|
|
|
|
|
Item 5.
|
29
|
|
|
|
|
|
|
Item 6.
|
31
|
|
|
|
|
|
|
Item 7.
|
32
|
|
|
|
|
|
|
Item 7A.
|
53
|
|
|
|
|
|
|
Item 8.
|
55
|
|
|
|
|
|
|
Item 9.
|
98
|
|
|
|
|
|
|
Item 9A.
|
98
|
|
|
|
|
|
|
Item 9B.
|
99
|
|
|
|
|
|
|
PART III
|
|
|
|
|
|
|
|
Item 10.
|
99
|
|
|
|
|
|
|
Item 11.
|
99
|
|
|
|
|
|
|
Item 12.
|
99
|
|
|
|
|
|
|
Item 13.
|
99
|
|
|
|
|
|
|
Item 14.
|
99
|
|
|
|
|
|
|
PART IV
|
|
|
|
|
|
|
|
Item 15.
|
100
|
|
2
GLOSSARY OF TERMS AND ABBREVIATIONS (as used in this document)
|
Abbreviation/term
|
Definition
|
|
Fiscal dates—as presented:
|
Fiscal dates—actual:
|
|
September 30, 2014
|
September 27, 2014
|
|
September 30, 2013
|
September 28, 2013
|
|
September 30, 2012
|
September 29, 2012
|
|
September 30, 2011
|
October 1, 2011
|
|
September 30, 2010
|
October 2, 2010
|
|
|
|
|
Abbreviation/term
|
Definition
|
|
aka
|
also known as
|
|
AOCI
|
accumulated other comprehensive income (loss)
|
|
APIC
|
additional paid-in-capital
|
|
ASP
|
average sales price per machine unit
|
|
ASR
|
accelerated share repurchase transaction
|
|
ASU
|
Accounting Standards Update
|
|
bps
|
basis points
|
|
CDS
|
central determination system
|
|
CEO
|
chief executive officer
|
|
CFO
|
chief financial officer
|
|
DAU
|
Daily Active Users
|
|
DCF
|
discounted cash flow
|
|
DoubleDown
|
Double Down Interactive LLC
|
|
EBITDA
|
earnings before interest, taxes, depreciation, and amortization
|
|
Entraction
|
Entraction Holding AB
|
|
EPS
|
earnings per share
|
|
Exchange Act
|
Securities Exchange Act of 1934, as amended
|
|
FASB
|
Financial Accounting Standards Board
|
|
FV
|
fair value
|
|
GAAP
|
generally accepted accounting principles
|
|
GTECH
|
GTECH S.p.A.
|
|
HoldCo F-4
|
Registration Statement on Form F-4, as amended, filed by HoldCo under the registrant name of Georgia Worldwide PLC (file no. 333-199096) with the SEC on October 1, 2014 and November 21, 2014
|
|
IGT, we, our, the Company
|
International Game Technology and its consolidated entities
|
|
IGT rgs®
|
IGT Remote Game ServerTM
|
|
IP
|
intellectual property
|
|
IRS
|
Internal Revenue Service
|
|
JAMS
|
Judicial Arbitration Mediation Services
|
|
LBG
|
Lightning Box Games Pty
|
|
LIBOR
|
London inter-bank offered rate
|
|
MAU
|
Monthly Active Users
|
|
MDA
|
Management's Discussion and Analysis of Financial Condition and Results of Operations
|
|
pp
|
percentage points
|
|
R&D
|
research and development
|
|
SEC
|
Securities and Exchange Commission
|
|
SIP
|
International Game Technology 2002 Stock Incentive Plan, as amended
|
|
SG&A
|
sales, general and administrative
|
|
SPA
|
sale and purchase agreement (dated April 26, 2011)
|
|
TITO
|
Ticket-In-Ticket-Out
|
|
UK
|
United Kingdom
|
|
US
|
United States
|
|
VAT
|
value added tax
|
|
VIE
|
variable interest entity
|
|
VSOE
|
vendor specific objective evidence
|
|
VWAP
|
average daily volume weighted average price
|
|
VLT
|
video lottery terminal
|
|
WAP
|
wide area progressive
|
|
WMS
|
WMS Gaming, Inc.
|
|
Yield
|
average revenue per unit per day
|
|
*
|
not meaningful (in tables)
|
3
FORWARD LOOKING STATEMENTS
This report contains statements that do not relate to historical or current facts, but are "forward looking" statements within the meaning of the Private Securities Litigation Reform Act of 1995. These statements relate to analyses and other information based on forecasts of future results and estimates of amounts not yet determinable. These statements may also relate to future events or trends, our future prospects and proposed new products, services, developments, or business strategies, among other things. These statements can generally (although not always) be identified by their use of terms and phrases such as anticipate, appear, believe, could, would, estimate, expect, indicate, intend, may, plan, predict, project, pursue, will, continue, and other similar terms and phrases, as well as the use of the future tense.
|
Examples of forward looking statements in this report include, but are not limited to, the following categories of expectations about:
|
||
|
●
|
statements as to the expected timing, completion and effects of the proposed merger transaction with GTECH
|
|
|
|
●
|
our ability to successfully introduce new products and their impact on replacement demand
|
|
|
●
|
the timing, features, benefits, and continued or future success of new product introductions and ongoing product, marketing, and strategic initiatives
|
|
|
●
|
our future financial and operational performance
|
|
|
●
|
our strategic and operational plans, including our ability to manage and leverage cost reduction initiatives (including our March 2014 business realignment)
|
|
|
●
|
our leadership position in the gaming industry or in online casino-style social gaming
|
|
|
●
|
the advantages offered to customers by our anticipated products and product features
|
|
|
●
|
economic conditions and other factors affecting the gaming industry
|
|
|
●
|
gaming growth, expansion, and new market opportunities
|
|
|
●
|
future trends in the demand for our products
|
|
|
●
|
developments with respect to economic, political, regulatory and other conditions affecting our international operations
|
|
|
●
|
mergers, acquisitions and divestitures, including the anticipated benefits of completed acquisitions and possible acquisitions of, or investments in, businesses, products, and technologies
|
|
|
●
|
research and development activities, including anticipated benefits from such activities
|
|
|
●
|
fluctuations in future gross margins, tax rates, and liabilities
|
|
|
●
|
future product sales or machine placements
|
|
|
●
|
legislative, legal or regulatory developments and related market opportunities
|
|
|
●
|
available capital resources to fund future operating requirements, capital expenditures, payment obligations, acquisitions, dividends, and share repurchases
|
|
|
●
|
losses from off-balance sheet arrangements
|
|
|
●
|
financial returns to shareholders related to management of our costs
|
|
|
●
|
the impact of recently adopted accounting pronouncements
|
|
|
●
|
the outcome and expense of litigation
|
Actual results could differ materially from those expressed or implied in our forward looking statements. Our future financial condition, results of operations and business, as well as any forward looking statements, are subject to change and to inherent known and unknown risks, uncertainties and other factors. For a discussion of additional risks and uncertainties relating to the proposed merger transaction with GTECH, see "Risk Factors Relating to the Mergers" in the Registration Statement on the HoldCo F-4. See Item 1A, Risk Factors, in this report for a discussion of risks and uncertainties. You should not assume at any point in the future that the forward looking statements in this report are still valid. We do not intend, and undertake no obligation, to update our forward looking statements to reflect future events or circumstances.
4
PART I
Item 1. BUSINESS
International Game Technology is a global gaming company specializing in the design, development, manufacture, and marketing of casino-style gaming equipment, systems technology, and game content across multiple platforms—land-based, online real-money and online social gaming. We are a leading supplier of gaming entertainment products worldwide and provide a diverse offering of quality products and services at competitive prices, designed to enhance the gaming player experience.
International Game Technology was incorporated in Nevada in December 1980 to facilitate our initial public offering in 1981. Principally serving the US gaming markets when founded, we expanded into jurisdictions outside of the US beginning in 1986.
Our fiscal year is reported on a 52/53-week period that ends on the Saturday nearest to September 30. For simplicity, this report presents all fiscal years using the calendar month end as outlined in the table below.
|
Fiscal Year
|
Date Ended
|
Weeks
|
||||
|
Presented as
|
Actual
|
|||||
|
2014
|
September 30, 2014
|
September 27, 2014
|
52
|
|||
|
2013
|
|
September 30, 2013
|
|
September 28, 2013
|
|
52
|
|
2012
|
|
September 30, 2012
|
|
September 29, 2012
|
|
52
|
|
2011
|
|
September 30, 2011
|
|
October 1, 2011
|
|
52
|
|
2010
|
|
September 30, 2010
|
|
October 2, 2010
|
|
52
|
|
Unless otherwise indicated in this report:
|
||
|
|
●
|
International Game Technology, IGT, we, our, or the Company refers to International Game Technology and its consolidated entities
|
|
|
●
|
italicized text with an attached superscript trademark or copyright notation indicates trademarks of IGT or its licensors, and additional IGT trademark information is available on our website at IGT.com
|
|
|
●
|
references to years relate to our fiscal years ending September 30
|
|
|
●
|
current refers to our fiscal year ended September 30, 2014
|
|
|
●
|
Note refers to the Notes of our Consolidated Financial Statements in Item 8 of this report
|
|
|
●
|
references to EPS are on a diluted basis
|
|
|
●
|
table amounts are presented in millions, except units and EPS
|
|
|
●
|
discussion and analysis relates to results for continuing operations of the current year as compared with the prior year
|
|
|
●
|
information posted on our website is not incorporated into this Form 10-K
|
5
BUSINESS SEGMENTS
We derive our revenues from the distribution of casino-style gaming equipment, systems technology, and game content for land-based, online real-money and social gaming markets. Operating results reviewed by our CEO encompass all revenue sources within each geographical region.
We view our business in two operating segments, North America and International, each incorporating all revenue categories—Gaming Operations, Product Sales, and Interactive.
NORTH AMERICA, comprising 79% of consolidated revenues in 2014, 78% in 2013 and 76% in 2012, includes operations associated with our land-based and online real-money customers located in the US and Canada, as well as all customers serviced by our US-based social gaming operations.
INTERNATIONAL, comprising 21% of consolidated revenues in 2014, 22% in 2013, and 24% in 2012, consists of our land-based and online real-money customers located in all other jurisdictions worldwide.
We measure segment profit on the basis of operating income. Certain income and expenses related to company-wide initiatives, primarily comprised of general and administrative costs and other income (expense), are managed at the corporate level and not allocated to an operating segment. Other segment and financial information is discussed in our MDA—BUSINESS SEGMENT RESULTS and Note 19 is incorporated here by this reference.
We recognized revenues in three major categories — Gaming Operations, Product Sales and Interactive. See Note 1 for additional information about our revenue accounting policies.
GAMING OPERATIONS
Comprising 43% of consolidated revenues in 2014, 42% in 2013, and 48% in 2012, gaming operations generates recurring revenue by providing customers with proprietary land-based casino gaming equipment, systems, content licensing, and services under a variety of arrangements. These pricing arrangements are largely variable where the casino customer pays service fees to IGT based on a percentage of amounts wagered (aka coin-in or play) or net win. Variable fee units comprised 83% of our IGT-owned gaming operations installed base at September 30, 2014. Fixed fee units (priced on a daily or monthly fee basis) comprised 17% of our IGT-owned gaming operations installed base at September 30, 2014.
Casinos with IGT WAP machines pay a percentage of the coin-in for IGT services related to the design, assembly, installation, operation, maintenance, and marketing of the WAP systems, as well as funding and administration of the progressive jackpot. The cost of funding progressive jackpots is subject to interest rate volatility as further described in Note 1 and MDA—CRITICAL ACCOUNTING ESTIMATES, and related risks are described in Item 1A—Risk Factors.
Gaming operations revenues are affected by variations in the number and type of machines in service, levels and frequency of player wagers, and pricing arrangement terms. Levels of play are dependent on game popularity, casino seasonality trends, economic conditions, and other player preferences. Seasonal trends generally show higher play levels in the spring and summer months and lower in the fall and winter months. We monitor the productive life cycles of our gaming operations machines and systematically upgrade units experiencing declining play levels.
6
The IGT-owned gaming operations installed base is comprised of MegaJackpots® premium branded gaming machines, including WAP and stand-alone units, as well as other lease or rental units, including CDS and racino machines. IGT-owned units are recorded in property, plant and equipment on our balance sheet. Casino-owned units represent machines sold to customers that also carry an additional recurring royalty fee. Gaming operations revenues are generated from the units reflected in the table below, as well as from other service fees for systems access, game content, and other gaming equipment lease or rental.
|
Gaming Operations Units (in thousands)
|
2014
|
|
2013
|
|
2012
|
|||
|
Total
|
|
70.7
|
|
|
76.7
|
|
|
78.7
|
|
IGT installed base (IGT-owned)
|
|
47.6
|
|
|
54.6
|
|
|
57.1
|
|
MegaJackpots® (premium brand)
|
|
22.1
|
|
|
25.1
|
|
|
27.1
|
|
Lease (CDS, racino, other)
|
|
25.5
|
|
|
29.5
|
|
|
30.0
|
|
Casino-owned
|
|
23.1
|
|
|
22.1
|
|
|
21.6
|
PRODUCT SALES
Comprising 41% of consolidated revenues in 2014, 46% in 2013, and 45% in 2012, product sales revenues are generated from the sales of land-based gaming machines (equipment and game content), systems, license fees, component parts (including kit conversions), other equipment and services. The composition of non-machine revenues in the table below has been recast for 2013 and 2012 to reflect the current year presentation.
|
Product Sales Composition
|
2014
|
|
2013
|
|
2012
|
|||
|
Gaming machines (equipment and content)
|
|
58%
|
|
|
69%
|
|
|
67%
|
|
Non-machine
|
|
42%
|
|
|
31%
|
|
|
33%
|
|
Systems
|
|
18%
|
|
|
13%
|
|
|
14%
|
|
License fees (aka royalties)
|
|
9%
|
|
|
6%
|
|
|
6%
|
|
Parts, service, and other fees
|
|
15%
|
|
|
12%
|
|
|
13%
|
INTERACTIVE
Comprising 16% of consolidated revenues in 2014, 12% in 2013, and 7% in 2012, interactive revenues are generated from online social gaming and online real-money gaming products and services, presented in the following two groups.
Social Gaming
Our North America based online social gaming casino generates revenues from the sale of virtual casino chips to players for use within the DoubleDown Casino for additional play or game enhancements. Costs of revenues are comprised mainly of payment processing fees like those paid to Facebook, Apple, Google or land-based casino hosts on a revenue participation basis. Social gaming metrics include:
DAU which measures the number of active users that play games at the DoubleDown Casino each day. Average DAU is the average of the DAUs for each day during the period.
MAU which measures the number of active users that played games at the DoubleDown Casino at least once in the last 30 days. Average MAU is the average of the MAUs each day during the period.
Bookings which represent the total amount of virtual casino chips sold during the period, as opposed to revenues, which include deferral adjustments based on the estimated period of service or chip consumption.
7
Unlike many other online casino-style social games where each game is a unique application, DoubleDown operates as a single casino application with multiple games where all games are available to the player within a single application. As a result, DoubleDown's reported number of active users is the equivalent of the number of unique users reported by many other online social casino-style game operators. Our DoubleDown strategy focuses on increasing DAU as an indicator of user engagement and average bookings per DAU. DoubleDown averaged DAU of 1.8 million and bookings per DAU of $0.43 in 2014 compared to DAU of 1.6 million and bookings per DAU of $0.37 in 2013.
IGTi
IGTi encompasses our online real-money casino and mobile gaming systems infrastructure and applications, content licensing, and back office operational support services, including WAP jackpot funding and administration. IGTi solutions are generally provided under revenue sharing arrangements based on a percentage of net win. IGTi solutions are provided primarily in business-to-business arrangements where IGTi provides content and services to a partnering business, which then connects to the player through the partner's own site. IGTi costs of revenue includes transaction costs incurred to run the sites, including player verification checks, banking transaction fees, data center costs to host servers, internet bandwidth fees, royalties, and server support/maintenance fees.
We aim to complement our internal resources through strategic alliances, investments, business acquisitions, and mergers that diversify our geographic reach, expand our product lines and customer base, and leverage our technological and manufacturing infrastructure to increase our rates of return. Risks related to business combinations, investments, and the proposed merger below are described in Item 1A—Risk Factors.
Proposed Merger (See Note 1)
On July 15, 2014, we entered into a definitive merger agreement with GTECH S.p.A. for the acquisition of IGT by GTECH for $6.4 billion, comprised of $4.7 billion in cash and stock, along with the assumption of $1.7 billion in net debt. Under the terms of the merger agreement, as amended on September 23, 2014, IGT and GTECH will combine under a newly formed holding company (HoldCo) domiciled in the UK that will apply for listing solely on the NYSE.
At the closing of the transaction, IGT shares will cease trading on the NYSE and GTECH shares will cease trading on the Borsa Italiana (MSE). IGT will survive as a wholly owned subsidiary of HoldCo, currently named Georgia Worldwide PLC, which will be renamed to a name to be identified by GTECH. HoldCo will maintain corporate headquarters in the UK and operating headquarters in Las Vegas, NV, Providence, RI and Rome, Italy.
At the effective time of the merger, each share of IGT common stock will be converted into the right to receive a combination of $13.69 in cash, plus a number of ordinary shares of HoldCo equal to $4.56 divided by the dollar value of a GTECH share prior to the transaction closing, subject to calculation adjustments and limitations set forth in the merger agreement.
The merger agreement contains certain limitations on IGT's business with respect to equity interests and new debt during the period prior to the transaction closing. Consummation of the merger is expected in the first half of calendar 2015, subject to certain closing conditions. Additional information regarding the proposed merger transaction is available in HoldCo Form F-4, which includes the preliminary proxy statement of IGT that also constitutes a prospectus of HoldCo.
8
Acquisition (See Note 21)
In January 2012, we acquired Seattle based Double Down Interactive LLC., developer and operator of the online social gaming DoubleDown Casino found on Facebook and www.DoubleDownCasino.com. DoubleDown has a broad and expanding game portfolio, offering blackjack, slots, slot tournaments, video poker, bingo, and roulette to social gamers around the world. This strategic acquisition has established IGT's position in social casino-style gaming and strengthened our core business with added distribution channels for IGT game content. DoubleDown is a component of our North America segment.
PRODUCTS
We provide a broad range of casino-style game content, equipment and systems technology for land-based and online social and online real-money gaming markets under for-sale, revenue sharing, and other leasing arrangements. Concentrating on game content development and distribution across multiple channels, IGT is making meaningful inroads into achieving convergence between and amongst the online and land-based gaming worlds.
GAMES
We combine elements of math, play mechanics, sound, art, and technological advancements with our library of entertainment licenses and IP portfolio to provide gaming products designed to provide a high degree of player appeal. We continuously expand our game library with new content, popular brands, and appealing bonuses to address player preferences and other market trends.
We offer a wide array of casino-style games in a variety of multi-line, multi-coin and multi-currency configurations.
|
Land-Based
|
Multi-Player
|
|
Premier (MegaJackpots®)
|
Electronic Table
|
|
Multi-Level Progressive
|
Virtual Racing
|
|
Wide-Area Progressive
|
|
|
Powerbucks Interstate Progressive
|
Interactive (includes mobile)
|
|
Stand-Alone
|
Online Social
|
|
Bonusing
|
Slots
|
|
Core
|
Video Poker
|
|
Video Reel
|
Table Games
|
|
Spinning Reel
|
Bingo
|
|
Video Poker
|
Online Real-money
|
|
Multi-Game (Game King®)
|
MegaJackpots®
|
|
Game Families
|
Slots
|
|
Game Hardware Series
|
Table Games
|
|
Central Determination System
|
Fixed Odds
|
|
Bingo (Class II)
|
Video Poker
|
|
VLT
|
Bingo & Keno
|
9
MACHINE CONFIGURATIONS
Land-based customers can combine our extensive library of games with several gaming machine cabinets designed to maximize functionality, flexibility, and player comfort. We use G2S open industry standards for server-based gaming machines. IGT gaming machine configurations vary by jurisdiction and may include:
Stand-alone casino-style slot machines that determine the game play outcome at the machine, known as Class III in tribal jurisdictions.
WAP jackpot systems with machines linked across several casinos.
CDS machines connected to a central server that determines the game outcome, encompassing VLTs used primarily in government-sponsored applications and electronic or video bingo machines, known as Class II in tribal jurisdictions.
SYSTEMS
IGT systems products include infrastructure and applications for casino management, customer relationship management, player management, and server-based gaming. Our casino and customer relationship management solutions include integrated modules for:
|
-
|
Machine Accounting
|
-
|
Bonusing (jackpots and promotions)
|
|
-
|
Patron Management
|
-
|
Table Game Automation
|
|
-
|
Cage Accounting
|
-
|
Payment Processing
|
|
-
|
Table Accounting
|
-
|
Reporting
|
|
-
|
Ticket-in/Ticket-out
|
-
|
Regulatory Compliance
|
Our player management solutions feature customized player messaging, tournament management, and integrated marketing and business intelligence modules that provide analytical, predictive, and management tools for maximizing casino operational effectiveness. Our server-based solutions enable electronic game delivery and configuration for slot machines, as well as providing casino operators with opportunities to increase profits by enhancing the players' experience, connecting with players interactively, and creating operational efficiencies.
INTERACTIVE
IGT's Double Down online casino-style social gaming operation provides a unique opportunity for casino entertainment to reach a broader audience, while complementing IGT's other existing offerings and the core casino audience. DoubleDown Casino is available online through Facebook and www.DoubleDownCasino.com on a variety of personal computer and mobile devices. Additionally, our land-based casino customers can integrate the DoubleDown Casino link into their own website providing players with access to a large portfolio of popular social casino-style games. The DoubleDown Casino link provides casino operators with an opportunity to engage players when they are not physically present in the land-based casino.
IGT also provides real-money online casino and mobile gaming systems infrastructure and applications, content licensing, and back office operational support services. IGT rgs® seamlessly integrates onto an operator's interactive platform, allowing access to our portfolio of game content that allows for online real-money gaming in legalized jurisdictions. These systems are primarily focused on the management of digital patron wallets, responsible gaming functionality, fraud detection and prevention, patron credentials, customer relationship management, player accounting, and player analytics. With these solutions, we deploy a full service platform capable of supporting the main games associated with online real-money gaming, including casino games, sports betting, multi-player poker and bingo.
10
RESEARCH & DEVELOPMENT
We support our product development efforts through a considerable emphasis and investment in the R&D of emerging technology trends, which we believe enables us to maintain a leadership position in the industry. Our product innovation reflects a combination of customer research, design experience and engineering excellence utilizing our game design resources, IP portfolio, and next-generation game development tools. The focus of our product development is to enhance the player experience through interactive networked gaming, information technology, innovative game design, and customer relationship services, thereby maximizing the potential for player entertainment and casino operator profitability.
We dedicate approximately 1,700 employees worldwide to R&D efforts covering multiple engineering disciplines, including hardware, electrical, systems and software for land-based, online social, and online real-money applications. We specialize in progressive creative game development including design, math, graphics and audio. Our primary development facilities are located in Nevada (Reno and Las Vegas), California (San Francisco), Washington (Seattle), China (Beijing), and Australia (Sydney). Additional global design centers provide local community presence, customized products, and regional production where beneficial or required.
Our games are created primarily by employee designers, engineers, and artists, as well as third-party content creators. We also use third-party technologies to improve the yield from our development investment and concentrate increased resources on product differentiation engineering. A significant amount of our R&D efforts during 2014 continued to focus on expanding interactive online opportunities through content development synergies related to the convergence of land-based, online social, and online real-money channels. Our investment in R&D totaled $224.8 million in 2014, $235.0 million in 2013, and $217.0 million in 2012.
Intellectual Property
Our IP portfolio of patents, trademarks, copyrights, and other licensed rights are significant to our business. At September 30, 2014, we held approximately 5,400 patents or patent applications and approximately 4,400 trademarks filed and registered worldwide. The weighted average remaining useful life of our capitalized patent costs at September 30, 2014 was approximately 1.6 years. Our brand licensing arrangements have various expiration dates through 2024 and commonly contain options to extend.
We seek to protect our investment in R&D and the new and original features of our products by perfecting and maintaining our IP rights. We obtain patent protection covering many of our products and have a significant number of US and foreign patent applications pending. Our portfolio is widely diversified with patents related to a variety of gaming products, including game designs, bonus and secondary imbedded game features, device components, and online or mobile functionality.
We market most of our products under trademarks and copyrights that provide product recognition and promote widespread acceptance. We seek protection for our copyrights and trademarks in the US and various foreign countries, where applicable. We use IP assets offensively and defensively to protect our innovation and license it to others under terms designed to promote standardization in the gaming industry. IP litigation is described in Note 13 and related risk factors are discussed in Item 1A.
11
Manufacturing and Suppliers
Our main manufacturing facilities are located in Nevada. We currently devote approximately 629,000 square feet in our Reno, NV facilities and approximately 218,000 square feet in our Las Vegas, NV facility to product development, manufacturing, warehousing, shipping, and receiving. Our manufacturing operations primarily involve the configuration and assembly of electronic components, cables, harnesses, video monitors, and prefabricated parts purchased from outside sources. We also operate facilities for silkscreen manufacturing and digital design.
We use a variety of raw materials to manufacture our gaming devices including metals, wood, plastics, glass, electronic components, and LCD screens. We have global material suppliers and utilize multi-sourcing practices to promote component availability. We believe the availability of materials used to manufacture our products is adequate and we are not substantially dependent on any single supplier.
Maintaining our commitment to quality, we recertified our ISO 9001.2008 Quality Management System certification at our Reno, Las Vegas, Bozeman (Montana), Hoofddorp (Netherlands), and China facilities during 2014. ISO standards represent an international consensus with respect to the design, manufacture, and use of practices intended to ensure ongoing customer satisfaction with consistent delivery of products and services.
We generally carry a sufficient amount of inventory related to the breadth of our product lines. We reasonably expect to fill our manufacturing product order backlog for both gaming operations and product sales within the next fiscal year. Backlog for gaming operations machine units totaled 2,800 at October 31, 2014 and 2,400 at October 31, 2013. Product sales backlog totaled approximately $111.0 million at October 31, 2014 and $151.6 million at October 31, 2013.
Employees
As of September 30, 2014, we employed over 4,400 individuals worldwide, with approximately 3,600 in our North America segment and 800 in our International segment. We continue to review our costs and organizational structure to maximize efficiency and align expenses with the current and long-term business outlook.
SALES MARKETS
IGT markets gaming products and services worldwide, with a substantial share of US and Canada gaming markets and a significant international presence. IGT gaming products and services are promoted through a worldwide network of sales associates, as well as third-party distributors and agents in certain markets under arrangements that generally specify no minimum purchase and require specified performance standards be maintained. We offer product-related contract financing for qualified customers and development financing loans to select customers for new or expanding gaming facilities.
As of September 30, 2014, IGT maintained 60 offices worldwide to respond to local customer needs and a Global Support Center staffed with experts in technical issue resolution. Access to product information and 24-hour customer service is provided through our website and training is offered to ensure customer success in using IGT products and services to full potential.
North America
Legalized gaming growth is largely driven by new jurisdictions considering gaming tax revenues as a means to address budget shortfalls. Sales or placements of gaming machines are also affected by new openings or expansion of existing gaming properties, the machine replacement cycle, and economic conditions. The industry installed base of land-based slot machines in North America rests at approximately 948,000 legal gaming devices by our estimate. Growth has been limited over the past year by the saturation of the US land-based casino market and replacement activity has been soft.
12
IGT's growing online social gaming casino, DoubleDown, is helping to offset limited growth opportunities in North America land-based gaming. The legalization of online real-money gaming in certain US states is also beginning to make a contribution.
International
With the saturation of the North America land-based casino market, international land-based market opportunities are expected to be of greater significance in terms of future growth. However, economic challenges and regulatory hindrances persist. We continue to localize our sales presence internationally and increase scalability in preparation for new opportunities. Our global strategy capitalizes on our North America experience, while customizing products for foreign languages, unique local preferences, and regulatory requirements. Legalized online real-money gaming in certain regulated international markets also continue to make a contribution.
Our international gaming markets include the following customer regions as of September 30, 2014:
EMEA—Europe (including the UK), the Middle East, and Africa
LAC—Latin America (Mexico, South and Central America) and the Caribbean
APAC—Asia, Australia, New Zealand, and the Pacific
COMPETITION AND PRODUCT DEMAND
IGT continues to operate in a highly competitive industry. Gaming products and services are constantly evolving with the rapid introduction of new hardware, platforms, game content, systems, and interactive options. Technological advances have reduced barriers to entry, thus making it easier for new competitors to enter the market. Our competitors range from small, localized companies to large, multi-national corporations in every jurisdiction where we conduct business. Our most significant competitors include Ainsworth Game Technology Ltd, Aristocrat Leisure Limited, Aruze Gaming, Bally Technologies, Inc. (Scientific Games Corporation announced on August 1, 2014, that it intends to acquire Bally Technologies ), Konami Gaming Inc., the Novomatic Group of Companies, and Scientific Games Corporation.
We compete primarily on the basis of game quality, player response to content and overall value to our customers. We believe replacement sales are driven by operator strategies to upgrade the casino floor with new game content to attract players and implement technologies that increase yields, cost savings, convenience, and other benefits. The replacement cycle can be accelerated by emerging technologies that improve an operator's profitability, such as online and mobile delivery mechanisms that increase cross-functionality, game features that increase player appeal, or application modules that increase operator efficiencies.
New or expanding casinos and new jurisdictions establishing legalized gaming can create further product demand and grow the overall installed base of gaming devices. As the growth rate of new casinos and jurisdictions slows, we have a heightened focus on providing gaming products that maximize an operator's return on investment.
We focus our development efforts on the creation of game content designed for distribution convergence across multiple channels, with superior functionality and features. We use innovative architecture and technologies, which we believe result in a high degree of customer appeal and player preference. We also strive to maintain an edge in our quality of customer support and efficient product implementation. The breadth of our gaming products and diversity of our innovative game library contribute to our competitive advantage.
We believe IGT also has competitive advantages resulting from broad alliances and well-established business relationships with customers, the financial strength to strategically invest in R&D, and an extensive IP portfolio. Our history of high level customer service, comprehensive sales and manufacturing infrastructure, worldwide brands and consumer recognition, and geographic diversity are competitive assets as well. We believe our reputation for consistently delivering and supporting quality products will encourage operators to select our products and enable us to maintain a substantial market position.
13
AVAILABLE INFORMATION
IGT's principal corporate executive offices are located at:
6355 South Buffalo Drive
Las Vegas, Nevada 89113
(702) 669-7777
All reporting information filed with or furnished to the SEC is available free of charge through the Investor Relations link on our website at IGT.com/investors as soon as reasonably practicable after we electronically file or furnish such information to the SEC.
The public may read and copy any materials filed by the company with the SEC at the SEC's Public Reference Room at 100 F Street, NE, Washington, DC 20549. The public may obtain information on the operation of the Public Reference Room by calling the SEC at 1-800-SEC-0330. The SEC maintains a website at sec.gov that contains reports, proxy and information statements, and other information regarding issuers that file electronically with the SEC.
Additionally, the following IGT information is available at IGT.com/investors and will be mailed in print form free of charge to any shareholder upon request:
Code of conduct
Corporate governance guidelines
Code of ethics for our principal executive officer and senior financial officers
Conflict of interest guidelines for members of our board of directors
Charters for our Board Committees —
Audit, Capital Deployment, Compensation, and Nominating & Corporate Governance
14
GOVERNMENT GAMING REGULATION
The gaming industry is subject to extensive governmental regulation by US federal, state and local governments, as well as tribal officials or organizations and foreign governments. While the regulatory requirements vary by jurisdiction, most require:
| (i) | licenses and/or permits |
| (ii) | findings of suitability for the company, as well as individual officers, directors, major shareholders, and key employees |
| (iii) | documentation of qualifications, including evidence of financial stability |
| (iv) | other required approvals for companies that manufacture or distribute gaming equipment and services, including but not limited to new product approvals |
Our operating entities and key personnel have obtained or applied for all required government licenses, permits, registrations, findings of suitability, and approvals necessary to manufacture and distribute gaming products in all jurisdictions where we do business. Although many regulations at each level are similar or overlapping, we must satisfy all conditions individually for each jurisdiction.
Gaming laws and regulations serve to protect the public and ensure that gaming related activity is conducted honestly, competitively, and free of corruption. Regulatory oversight additionally ensures that the local authorities receive the appropriate amount of gaming tax revenues. As such, our financial systems and reporting functions must demonstrate high levels of detail and integrity.
Certain regulators not only govern the activities within their jurisdiction, but also monitor our activities in other jurisdictions to ensure that we comply with local standards on a worldwide basis. As a Nevada licensee, state regulatory authorities require us to maintain Nevada standards for all operations worldwide. Violations of laws in one jurisdiction could result in disciplinary action in other jurisdictions. A more detailed description of the regulations to which we are subject is provided in Exhibit 99.1 of this Annual Report on Form 10-K, incorporated herein by reference.
The nature of the industry and our worldwide operations make this process very time consuming and require extensive resources. We employ additional community staff members and legal resources familiar with local customs in certain jurisdictions to assist in keeping us compliant with applicable regulations worldwide. Through this process, we seek to assure both regulators and investors that all our operations maintain the highest levels of integrity and avoid any appearance of impropriety. We have never been denied a gaming related license, nor have our licenses ever been suspended or revoked.
Risk factors related to gaming regulation are discussed in Item 1A. Changes in or new interpretations of existing gaming laws and regulations may hinder or prevent us from continuing to operate in certain jurisdictions. Regulatory challenges related to our interactive operations in Europe are discussed in our MDA—CONSOLIDATED RESULTS, MDA—BUSINESS SEGMENT RESULTS, and Note 20.
15
Item 1A. RISK FACTORS
RISKS RELATED TO OUR BUSINESS
Our business is vulnerable to changing economic conditions and to other factors that adversely affect the gaming industry, which have negatively impacted and could continue to negatively impact the play levels of our participation games, our product sales, and our ability to collect outstanding receivables.
Demand for our products and services depends largely upon favorable conditions in the gaming industry, which is highly sensitive to players' disposable incomes and gaming activities. Discretionary spending on entertainment activities could further decline for reasons beyond our control, such as a continued slow economic recovery and negative economic conditions, sustained levels of unemployment, natural disasters, acts of war or terrorism, transportation costs or disruptions, severe weather conditions or health epidemics. Any prolonged or significant decrease in consumer spending on entertainment activities could result in reduced play levels on our participation games, causing our cash flows and revenues from a large share of our recurring revenue products to decline. Recent unfavorable economic conditions resulted in a tightening in the credit markets, decreased liquidity in many financial markets, significant volatility in the credit and equity markets, and uncertainty about continuing economic stability remains.
A decline in the relative health of the gaming industry and any difficulty or inability of our customers to obtain adequate levels of capital to finance their ongoing operations may reduce their resources available to purchase our products and services or affect our ability to collect outstanding receivables, which adversely affects our revenues. If we experience a significant unexpected decrease in demand for our products, we could also be required to increase our inventory obsolescence and other asset impairment charges.
Furthermore, an extended economic downturn could impact the ability of our customers to make timely payments to us which could adversely affect our results of operations. We may incur additional provisions for bad debt related to credit concerns on certain receivables, including in connection with customer financing we provide.
Our ability to operate in our existing land-based or online jurisdictions or expand into new land-based or online jurisdictions could be adversely affected by new or changing laws or regulations, new interpretations of existing laws or regulations, and difficulties or delays in obtaining or maintaining needed licenses or product approvals.
The gaming industry is subject to extensive governmental regulation by US federal, state and local governments, as well as tribal officials or organizations and foreign governments. While the regulatory requirements vary by jurisdiction, most require:
|
●
|
licenses and/or permits
|
|
●
|
findings of suitability for the company, as well as individual suitability of officers, directors, major shareholders and key employees
|
|
●
|
documentation of qualifications, including evidence of financial stability
|
|
●
|
other required approvals for companies that manufacture or distribute gaming equipment and services, including but not limited to approvals for new products
|
Any license, permit, approval or finding of suitability may be revoked, suspended or conditioned at any time. We may be unable to obtain or maintain all necessary registrations, licenses, permits or approvals, and could incur fines or experience delays related to the licensing process which could adversely affect our operations and our ability to retain key employees.
16
To expand into new jurisdictions, we may need to be licensed, obtain approvals of our products and/or seek licensure of our officers, directors, major stockholders, key employees or business partners. If we fail to seek, do not receive, or receive a revocation of a license in a particular jurisdiction, we cannot sell, service or place on a participation or leased basis our products in that jurisdiction and our issued licenses in other jurisdictions may be impacted. Any delays in obtaining or difficulty in maintaining regulatory approvals needed for expansion within existing markets or into new jurisdictions can negatively affect our opportunities for growth or delay our ability to recognize revenue from the sale or installation of products in any such jurisdictions.
Public opinion can also exert a significant influence over the regulation of the gaming industry. A negative shift in the public's perception of gaming could affect future legislation in individual jurisdictions. Among other things, such a shift could cause jurisdictions to abandon proposals to legalize gaming, thereby limiting the number of new jurisdictions into which we could expand. Negative public perception could also lead to new restrictions on or the prohibition of gaming in jurisdictions in which we currently operate.
Further, changes in existing gaming laws or regulations, new interpretations of existing gaming laws or regulations or changes in the manner in which existing laws and regulations are enforced, all with respect to land-based and online gaming activities, may hinder or prevent us from continuing to operate in those jurisdictions where we currently do business, which would harm our operating results. In particular, the enactment of unfavorable legislation or government efforts affecting or directed at manufacturers or gaming operators, such as referendums to increase gaming taxes or requirements to use local distributors, would likely have a negative impact on our operations. Additionally, evolving laws and regulations regarding data privacy, cybersecurity and anti-money laundering could adversely impact opportunities for growth in our online business, and could result in additional compliance-related costs.
Slow growth in the establishment of new gaming jurisdictions or the number of new casinos, declines in the rate of replacement of existing gaming machines and ownership changes and consolidation in the casino industry could limit or reduce our future profits.
Demand for our products is driven substantially by the establishment of new land-based and/or online gaming jurisdictions, the addition of new casinos or expansion of existing casinos within existing gaming jurisdictions and the replacement of existing gaming machines. The establishment or expansion of gaming in any jurisdiction, whether land-based or online, typically requires a public referendum or other legislative action. As a result, gaming continues to be the subject of public debate, and there are numerous active organizations that oppose gaming. Opposition to gaming could result in restrictions on, or even prohibitions of, gaming operations or the expansion of operations in any jurisdiction.
In addition, the construction of new casinos or expansion of existing casinos fluctuates with demand, general economic conditions and the availability of financing. Slow growth in the establishment of new gaming jurisdictions, delays in the opening of new or expanded casinos and declines in, or low levels of demand for, machine replacements could reduce the demand for our products and our future profits. Because a substantial portion of our sales come from repeat customers, our business could be affected if one or more of our customers consolidates with another entity that utilizes more of the products and services of our competitors or that reduces spending on our products or causes downward pricing pressures. Such consolidations could lead to order cancellations, a slowing in the rate of gaming machine replacements, or require our current customers to switch to our competitors' products, any of which could negatively impact our results of operations.
17
Demand for our products and the level of play of our products could be adversely affected by changes in player and operator preferences.
As a supplier of gaming machines, we must offer themes and products that appeal to gaming operators and players. There is constant pressure to develop and market new game content and technologically innovative products. Our revenues are dependent on the earning power and life span of our games. We therefore face continuous pressure to design and deploy new and successful game themes to maintain our revenue and remain competitive. If we are unable to anticipate or react in a timely manner to any significant changes in player preferences, such as a negative change in the level of acceptance of our newest systems innovations or jackpot fatigue (i.e., declining play levels on smaller jackpots), the demand for and level of play of our gaming products could decline. Further, our products could suffer a loss of floor space to table games or competitors' products, or operators may reduce revenue sharing arrangements, each of which would harm our sales and financial results. In addition, general changes in consumer behavior, such as reduced travel activity or redirection of entertainment dollars to other venues, could result in reduced demand and reduced play levels for our gaming products.
The gaming industry is intensely competitive. We face competition from a growing number of companies and, if we are unable to compete effectively, our business could be negatively impacted.
Competition is intense among gaming and systems providers, including manufacturers of electronic gaming equipment and systems products. Competition in our industry is primarily based on the amount of profit our products generate for our customers, together with cost savings, convenience, and other benefits. Additionally, we compete on the basis of price, pricing models, and financing terms made available to customers, the appeal of game content and features to the end player, and the features and functionality of our hardware and software products. Our competitors range from small, localized companies to large, multi-national corporations, several of which have substantial resources.
Competition in the gaming industry has accelerated due to the increasing number of providers, combined with the limited number of operators and jurisdictions in which they operate. In particular, we have observed an influx of small gaming equipment manufacturers entering the market over the last few years. In addition, several casinos have recently ceased operations due to unfavorable economic conditions. This combination of a growing number of providers and a limited number of operators has resulted in an increased focus on price to value. To compete effectively, providers must offer innovative products, with increasing features and functionality benefiting the operators along with game content appealing to the end player, at prices and, in certain cases, financing terms that are attractive to operators.
There has also been consolidation recently in the gaming industry among our competitors. Such consolidation could alter the competitive landscape by resulting in the formation of larger competitors with increased financial resources and altered cost structures, which may enable them to offer more competitive pricing models and gain a larger market share of customers, as well as expanded product offerings and broader geographic scope of operations.
Obtaining space and favorable placement on casino gaming floors is also a competitive factor in our industry. In addition, the level of competition among equipment providers has increased significantly due to consolidation among casino operators and cutbacks in capital spending by casino operators resulting from the economic downturn and resulting decreased player spend.
Our online social gaming and online real-money gaming operations are also subject to intense competition. In particular, the online social gaming casino operated by DoubleDown is relatively new and has lower barriers to entry. Several companies have launched social casino offerings, and new competitors are likely to continue to emerge, some of which may be operated by social gaming companies with a larger base of existing users, or by casino operators with more experience in operating a casino. If the products offered through our online businesses do not maintain their popularity, or fail to grow in a manner that meets our expectations, our results of operations and financial condition could be harmed.
18
Our success in the competitive gaming industry depends in large part on our ability to develop and manage frequent introductions of innovative products.
The gaming industry is characterized by dynamic customer demand and technological advances, both for land-based and online gaming products. As a result, we must continually introduce and successfully market new themes and technologies in order to remain competitive and effectively stimulate customer demand. The process of developing new products and systems is inherently complex and uncertain. It requires accurate anticipation of changing customer needs and end user preferences as well as emerging technological trends. If our competitors develop new game content and technologically innovative products and we fail to keep pace, our business could be adversely affected. To remain competitive, we invest resources towards our research and development efforts to introduce new and innovative games with dynamic features to attract new customers and retain existing customers. If we fail to accurately anticipate customer needs and end-user preferences through the development of new products and technologies, we could lose business to our competitors, which would adversely affect our results of operations and financial position.
We intend to continue investing resources toward our research and development efforts. There is no assurance that our investments in research and development will lead to successful new technologies or timely new products. We invest heavily in product development in various disciplines: platform hardware, platform software, online services, content (game) design and casino software systems. Because our newer products are generally more technologically sophisticated than those we have produced in the past, we must continually refine our design, development and delivery capabilities across all channels to meet the needs of our product innovation. If we cannot efficiently adapt our processes and infrastructure to meet the needs of our product innovations, our business could be negatively impacted.
Our customers will accept a new game product only if it is likely to increase operator profits more than competitors' products. The amount of operator profits primarily depends on consumer play levels, which are influenced by player demand for our product. There is no certainty that our new products will attain this market acceptance or that our competitors will not more effectively anticipate or respond to changing customer preferences. In addition, any delays by us in introducing new products could negatively impact our operating results by providing an opportunity for our competitors to introduce new products and gain market share ahead of us.
The risks related to operations in foreign countries and outside of traditional US jurisdictions could negatively affect our results.
We operate in many countries outside of the US and in tribal jurisdictions with sovereign immunity which subjects us to certain inherent risks. A significant portion of our revenues is derived from our International business segment. In addition, certain aspects of our domestic business, such as our supply chain, may be impacted by events and conditions internationally.
19
Developments such as noted below could adversely affect our financial condition and results of operations:
|
●
|
social, political or economic instability
|
|
●
|
additional costs of compliance with international laws or unexpected changes in regulatory requirements
|
|
●
|
the effects that evolving regulations regarding data privacy may have on our online operations
|
|
●
|
tariffs and other trade barriers
|
|
●
|
volatility of international financial markets and fluctuations in currency exchange rates
|
|
●
|
adverse changes in the creditworthiness of parties with whom we have significant receivables or forward currency exchange contracts
|
|
●
|
longer receivables collection periods and increased difficulty in collecting accounts receivables
|
|
●
|
expropriation, nationalization and restrictions on repatriation of funds or assets
|
|
●
|
difficulty protecting our intellectual property, especially in countries with fewer intellectual property protections
|
|
●
|
recessions in foreign economies
|
|
●
|
difficulties in maintaining, managing and financing foreign operations
|
|
●
|
changes in consumer tastes and trends across different jurisdictions
|
|
●
|
acts of war or terrorism
|
|
●
|
US government requirements for export
|
We may be unable to protect our IP.
A significant portion of our revenues is generated from products using certain IP rights, and our operating results would be negatively impacted if we are unsuccessful in licensing certain of those rights and/or protecting those rights from infringement, including losses of proprietary information from breaches of our cybersecurity efforts. In addition, some of our most popular games and features are based on trademarks, patents, and other IP licensed from third parties. Our future success may depend upon our ability to obtain, retain and/or expand licenses for popular IP rights with reasonable terms in a competitive market. In the event that we cannot renew and/or expand existing licenses, we may be required to discontinue or limit our use of the games or gaming machines that use the licensed technology or bear the licensed marks.
Our success may depend in part on our ability to obtain trademark protection for the names or symbols under which we market our products and to obtain copyright protection and patent protection of our proprietary technologies, intellectual property and other game innovations. We may not be able to build and maintain goodwill in our trademarks or obtain trademark or patent protection, and there can be no assurance that any trademark, copyright or issued patent will provide competitive advantages for us or that our intellectual properties will not be successfully challenged or circumvented by competitors.
We also rely on trade secrets and proprietary know-how to protect certain proprietary knowledge and have entered into confidentiality agreements with our employees and independent contractors regarding our trade secrets and proprietary information. However, there can be no guarantees that our employees and consultants will not breach these agreements, especially in light of increased social media use and the risk that proprietary information will not be adequately protected. If these agreements are breached, it is unlikely that the remedies available to us will be sufficient to compensate us for the damages suffered. Additionally, despite various confidentiality agreements and other trade secret protections, our trade secrets and proprietary know-how could become known to, or independently developed by, competitors.
20
We may be subject to claims of IP infringement or invalidity and adverse outcomes of litigation could unfavorably affect our operating results.
Competitors and others may infringe on our intellectual property rights, or may allege that we have infringed on theirs. Monitoring infringement and misappropriation of intellectual property can be difficult and expensive, and we may not be able to detect infringement or misappropriation of our proprietary rights. We may also incur significant litigation costs and other expenses protecting our intellectual property or defending our use of intellectual property, reducing our ability to bring new products to market in the future. These expenses could have an adverse effect on our future cash flows and results of operations. Our assessment of current IP litigation could change in light of the discovery of facts not presently known to us, or determinations by judges, juries or others that do not agree with our evaluation of the possible liability or outcome of such litigation. If we are found to infringe on the rights of others we could be required to discontinue offering certain products or systems, to pay damages, or purchase a license to use the intellectual property in question from its owner. Litigation can also distract management from the day-to-day operations of the business. There can be no assurances that certain of our products, including those with currently pending patent applications, will not be determined to have infringed upon an existing third party patent.
In addition, intellectual property rights of others, including our competitors, may prevent us from taking advantage of innovative technologies by restricting our ability to develop these technologies ourselves, incorporate new technologies into our systems, or enter new markets created by these technologies, all of which may adversely affect our competitive position and results of operations.
Our online social gaming casino offering is conducted largely through Facebook and Apple's IOS platform, and our business and our growth prospects would suffer if we fail to maintain good relationships with Facebook and Apple, or if Facebook or Apple were to alter the terms of our relationship.
DoubleDown Casino, which is our online social gaming casino offering, operates largely through Facebook and Apple's IOS platform. Consequently, our operating platform, growth prospects and future revenues from this online offering are dependent on our continued relationships with Facebook and Apple. While DoubleDown has historically maintained good relationships with Facebook and Apple, our online social gaming casino offering would suffer if we are unable to continue these relationships in the future.
In addition, our relationships with Facebook and Apple are not governed by a contract, but rather by Facebook and Apple's standard terms and conditions for application developers. Facebook and Apple each modify these terms and conditions as well as their respective privacy policies from time to time, and any future changes, including any changes required as a result of government regulation, could have a material adverse impact on our business. For example, if Facebook and Apple were to increase the fees they charge application developers, our gross profit and operating income would suffer. Additionally, if users were to limit our ability to use their personal information, if Facebook and Apple were to develop competitive offerings, either on its own or in cooperation with another competitor, or if Facebook and Apple were to alter their operating platform to our detriment, our growth prospects would be negatively impacted.
Business combinations and investments in intellectual properties or affiliates present risk, and we may not be able to realize the financial and strategic goals that were contemplated at the time of the transaction, which could materially affect our financial results.
We have invested and may continue to invest in strategic business combinations and acquisitions of important technologies and IP that we believe will expand our geographic reach, product lines, and/or customer base. We may encounter difficulties in the assimilation of acquired operations, technologies and/or products, or an acquisition may prove to be less valuable than the price we paid, or we may otherwise not realize the anticipated benefits of an acquisition. We also may encounter difficulties applying our internal controls to an acquired business. Any of these events or circumstances may have an adverse effect on our business by requiring us to, among other things, record substantial impairment charges on goodwill and other intangible assets, resulting in a negative impact on our operating results.
21
Moreover, as we continue the process of evaluating our business in conjunction with an assessment of our long-term strategic goals, we will also further evaluate past and potential investments to determine if and how they will fit into our organizational structure going forward. If an event or change occurs in affiliate relationships or agreements associated with business combinations, we may be required to reassess cash flows, recoverability, useful lives, and FV measurements, which may result in material impairment charges.
As we enter into new lines of business and expand our online offerings, there may be unintended adverse effects on our land-based business. For example, our online social gaming DoubleDown Casino may be offered on Facebook alongside existing or planned online social gaming casino offerings by one or more of our casino customers. One or more of such casino customers could view our online social gaming casino offering as competing with its offering. If, as a result of this view, one or more of such customers modifies, reduces or terminates its business relationship with us with respect to our land-based products and services, it could have a negative impact on our business and our operating results.
Failure to attract, retain and motivate key employees may adversely affect our ability to compete.
Our success depends largely on recruiting and retaining talented employees. Our ability to attract and retain key management, game development, finance, marketing, and research and development personnel is directly linked to our continued success. The market for qualified executives and highly-skilled technical workers is intensely competitive. The loss of key employees or an inability to hire a sufficient number of technical staff could limit our ability to develop successful products and could cause delays in getting new products to market.
Our gaming machines and online operations may experience losses due to technical problems or fraudulent activities.
Our success depends on our ability to avoid, detect, replicate and correct software and hardware anomalies and fraudulent manipulation of our gaming machines, systems, and online offerings. We incorporate security features into the design of our gaming machines and other systems, including those features responsible for our online operations, which are designed to prevent us and our patrons from being defrauded. We also monitor our software and hardware to avoid, detect and correct any technical errors. However, there can be no guarantee that our security features or technical efforts will continue to be effective in the future. If our security systems fail to prevent fraud or if we experience any significant technical difficulties, our operating results could be adversely affected. Additionally, if third parties breach our security systems and defraud our patrons, or if our hardware or software experiences any technical anomalies, the public may lose confidence in our gaming products and online operations or we could become subject to legal claims by our customers or to investigation by gaming authorities.
Our gaming machines and online offerings have experienced anomalies and fraudulent manipulation in the past. Games and gaming machines may be replaced by casinos and other gaming machine operators if they do not perform according to expectations, or may be shut down by regulators. The occurrence of anomalies in, or fraudulent manipulation of, our games, gaming machines, systems, or online games and systems may give rise to claims for lost revenues and related litigation by our customers and may subject us to investigation or other action by gaming regulatory authorities, including suspension or revocation of our gaming licenses, or other disciplinary action.
Our online offerings are part of a new and evolving industry, which presents significant uncertainty and business risks.
Online gaming, including social casino-style gaming, is a relatively new industry that continues to evolve. The success of this industry and our online business will be affected by future developments in social networks, mobile platforms, legal or regulatory developments (such as the passage of new laws or regulations or the extension of existing laws or regulations to social casino-style gaming activities), taxation of gaming activities, data privacy and cybersecurity laws and regulations, and other factors that we are unable to predict, and are beyond our control. This environment can make it difficult to plan strategically and can provide opportunities for competitors to grow revenues at our expense. Consequently, our future operating results relating to our online offerings may be difficult to predict and we cannot provide assurance that our online offerings will grow at the rates we expect, or be successful in the long term.
22
In addition, we use social media platforms, such as Facebook, YouTube and Twitter, as marketing tools. These platforms allow individuals access to a broad audience of consumers and other interested persons. Negative commentary regarding us or the products we sell may be posted on social media platforms and similar devices at any time and may be adverse to our reputation or business. As laws and regulations rapidly evolve to govern the use of these platforms and mobile devices, the failure by us, our employees or third parties acting at our direction to abide by applicable laws and regulations in the use of these platforms and devices could adversely impact our business, financial condition and results of operations or subject us to fines or other penalties.
Systems, network or telecommunications failures or cyber-attacks may disrupt our business and have an adverse effect on our results of operations.
Any disruption in our network or telecommunications services, or those of third parties that we utilize in our operations, could affect our ability to operate our games or financial systems, which would result in reduced revenues and customer down time. Our network and databases of business and customer information, including intellectual property, trade secrets, and other proprietary business information and those of third parties we utilize, are susceptible to outages due to fire, floods, power loss, break-ins, cyber-attacks, network penetration, data privacy or security breaches, denial of service attacks, and similar events, including inadvertent dissemination of information due to increased use of social media. Despite the implementation by us and third parties we utilize of network security measures and data protection safeguards, including a disaster recovery strategy for back office systems, our servers and computer resources, and those of third parties we utilize, are vulnerable to viruses, malicious software, hacking, break-ins or theft, third-party security breaches, employee error or malfeasance, and other potential compromises. Disruptions from unauthorized access to or tampering with our computer systems, or those of third parties we utilize, in any such event could result in a wide range of negative outcomes, including devaluation of our intellectual property, increased expenditures on data security, and costly litigation, each of which could have a material adverse effect on our business, reputation, operating results and financial condition.
Any disruption in our network or telecommunications services could affect our ability to operate our games or financial systems, which would result in reduced revenues and customer down time. Our network and databases of business and customer information, including intellectual property, trade secrets, and other proprietary business information, are susceptible to outages due to fire, floods, power loss, break-ins, cyber-attacks, network penetration, data privacy or security breaches, denial of service attacks, and similar events, including inadvertent dissemination of information due to increased use of social media. Despite our implementation of network security measures and data protection safeguards, including a disaster recovery strategy for back office systems, our servers and computer resources are vulnerable to viruses, malicious software, hacking, break-ins or theft, third-party security breaches, employee error or malfeasance, and other potential compromises. Disruptions from unauthorized access to or tampering with our computer systems in any such event could result in a wide range of negative outcomes, including devaluation of our intellectual property, increased expenditures on data security, and costly litigation, adverse publicity or regulatory action, each of which could have a material adverse effect on our business, reputation, operating results and financial condition. In addition, sophisticated hardware and operating system software and applications that we procure from third parties may contain defects in design or manufacture that could unexpectedly interfere with our operations. The cost to alleviate security risks, defects in software and hardware and address any problems that occur could negatively impact our sales, distribution and other critical functions, as well as our financial results.
Our outstanding domestic credit facility subjects us to financial covenants which may limit our flexibility.
Our domestic credit facility subjects us to a number of financial covenants, including a minimum ratio of adjusted EBITDA to interest expense minus interest on jackpot liabilities and a maximum ratio of net funded debt to adjusted EBITDA. Our failure or inability to comply with these covenants will cause an event of default that, if not cured, could cause the entire outstanding borrowings under our domestic credit facility and outstanding bonds to become immediately due and payable. In addition, our interest rate under the domestic credit facility can vary based on our public credit rating or our net funded debt to adjusted EBITDA ratio. Each of these measures may be adversely impacted by unfavorable economic conditions. The domestic credit facility also includes restrictions that may limit our flexibility in planning for, or reacting to, changes in our business and the industry.
23
A decline in and/or sustained low interest rates causes an increase in our jackpot expense which could limit or reduce our future profits.
Changes in prime and/or treasury and agency interest rates during a given period cause fluctuations in jackpot expense largely due to the revaluation of future winner liabilities. When rates increase, jackpot liabilities are reduced as it costs less to fund the liability. However, when interest rates decline, the value of the liability (and related jackpot expense) increases because the cost to fund the liability increases. Our results may continue to be negatively impacted by a continued low interest rate environment or any or further decline in interest rates, resulting in increased jackpot expense and a reduction of our investment income, which could limit or reduce our future profits.
We may not be able to generate sufficient cash flows to meet our debt service obligations.
Our ability to make payments on and to refinance our indebtedness and to fund planned capital expenditures will depend on our operating performance, financial results and ability to generate cash from our operations. These variables, to a certain extent, are subject to general economic, financial, competitive, legislative, regulatory and other factors that are beyond our control. Our business may not generate sufficient cash flow from operations and future sources of capital under our credit facilities or otherwise may not be available to us in an amount sufficient to enable us to pay our indebtedness or to fund our other liquidity needs. Any default on our debt obligations would have a material adverse effect on our business, operating results and financial condition, including possible credit rating downgrades.
New products may be subject to complex and dynamic revenue recognition standards, which could materially affect our financial results.
As we introduce new products and as transactions become increasingly complex, additional analysis and judgment is required to account for and recognize revenues in accordance with generally accepted accounting principles. Transactions may include multiple element arrangements, software components, and/or unique new product offerings, and applicable accounting principles or regulatory product approval delays could further change the timing of revenue recognition, which could adversely affect our financial results for any given period. Fluctuations may occur in our deferred revenues and reflect our continued shift toward more multiple element contracts that include both systems and software.
Our results of operations could be affected by natural events in the locations in which we or our customers or suppliers operate.
We, our customers, and our suppliers have operations in locations subject to natural occurrences such as severe weather and other geological events, including hurricanes, earthquakes, floods, or tsunamis that could disrupt operations. Any serious disruption at any of our facilities or the facilities of our customers or suppliers due to a natural disaster could have a material adverse effect on our revenues and increase our costs and expenses. If there is a natural disaster or other serious disruption at any of our facilities, it could impair our ability to adequately supply our customers, cause a significant disruption to our operations, cause us to incur significant costs to relocate or reestablish these functions and negatively impact our operating results. While we insure against certain business interruption risks, such insurance may not adequately compensate us for any losses incurred as a result of natural or other disasters. In addition, any natural disaster that results in a prolonged disruption to the operations of our customers or suppliers may adversely affect our business, results of operations or financial condition.
New conflict minerals regulations may cause us to incur additional expenses and could limit the supply and increase the cost of certain metals used in manufacturing our products.
On August 22, 2012, the SEC adopted a new rule requiring disclosures of specific minerals, known as conflict minerals, that are necessary to the functionality or production of products manufactured, or contracted to be manufactured, by public companies. The new rule requires companies to verify and disclose whether or not such minerals originate from the Democratic Republic of Congo or an adjoining country. The first disclosure report, relating to the calendar year of 2013 was filed with the SEC on June 2, 2014.
24
There are costs associated with complying with these disclosure requirements, including the diligence to determine the sources of conflict minerals used in our products and other potential changes to products, processes or sources of supply as a consequence of such verification activities. The implementation of this rule could adversely affect the sourcing, supply and pricing of materials used in our products. The new rule could affect the availability in sufficient quantities and at competitive prices of certain minerals used in the manufacture of our products, given that there may be only a limited number of 'conflict-free' minerals, which could result in increased material and component costs and additional costs associated with changes in our supply chain. We may also face reputational challenges if we determine that certain of our products contain minerals not determined to be conflict free or if we are unable to sufficiently verify the origins for all conflict minerals used in our products through the procedures we may implement.
Litigation costs and the outcome of litigation could have a material adverse effect on our business.
From time to time we may be subject to litigation claims through the ordinary course of our business operations regarding, but not limited to, employment matters, security of consumer and employee personal information, contractual relations with suppliers, marketing and infringement of trademarks and other intellectual property rights. Litigation to defend ourselves against claims by third parties, or to enforce any rights that we may have against third parties, may be necessary, which could result in substantial costs and diversion of our resources, causing a material adverse effect on our business, financial condition and results of operations.
Investments and development financing loans could adversely impact liquidity or cause us to incur loan losses or record a charge to earnings if our investments become impaired.
We invest in and/or provide financing for expansion or construction of gaming locations and other business purposes, particularly in our international operations. Such investment and financing activities subject us to increased credit risk in certain regions, which could be exacerbated by unfavorable economic conditions or other political or economic instability in those regions. We monitor our investments and financing activities to assess impairment on a quarterly basis.
We have in the past and may in the future incur losses on these types of investments and loans. Our results of operations, liquidity or financial position may be negatively impacted if we are unable to collect on loans or derive benefit from our investments.
Our share repurchase program could affect the price of our common stock and increase volatility.
Repurchases of our common stock pursuant to our stock repurchase program could affect our stock price and increase its volatility. The existence of a stock repurchase program could also cause our stock price to be higher than it would be in the absence of such a program and could potentially reduce the market liquidity for our stock. There can be no assurance that any stock repurchases will enhance stockholder value because the market price of our common stock may decline below the levels at which we repurchased shares of common stock. Although our stock repurchase program is intended to enhance long-term shareholder value, short-term stock price fluctuations could reduce the program's effectiveness.
Current environmental laws and regulations, or those enacted in the future, could result in additional liabilities and costs.
The manufacturing of our products may require the use of materials that are subject to a variety of environmental, health and safety laws and regulations (such as climate change legislation). Compliance with these laws could increase our costs and impact the availability of components required to manufacture our products. Violation of these laws may subject us to significant fines, penalties or disposal costs, which could negatively impact our results of operations, financial position or cash flows.
25
Actions taken under our business realignment plan may not produce the expected cost savings.
In March 2014, we announced a business realignment plan designed to realign our cost structure for long-term earnings growth. As part of this realignment plan, we implemented cost reduction initiatives, including workforce reductions and other measures. We have forecasted substantial cost savings from these initiatives based on a number of assumptions and expectations which, if achieved, would improve our profitability and cash flows from operating activities. There can be no assurance that actual results achieved will not vary materially from what we have assumed and forecasted, which could have a material adverse impact on our results of operations, liquidity and financial position.
RISKS RELATED TO THE MERGER TRANSACTIONS WITH GTECH
Completion of the merger transaction with GTECH is subject to certain conditions, and if these conditions are not satisfied or waived, the mergers will not be completed.
The obligations of GTECH and IGT to complete the mergers are subject to satisfaction or waiver (if permitted) of a number of conditions, including, among other conditions, (i) IGT and GTECH obtaining shareholder approvals, (ii) the receipt of certain antitrust approvals, (iii) obtaining certain gaming regulatory approvals, (iv) effectiveness of the registration statement for the HoldCo shares, (v) NYSE listing approval for the HoldCo shares, (vi) the expiration or early termination of a sixty-day GTECH creditor opposition period, (vii) the absence of any order prohibiting or restraining the mergers, (viii) subject to certain materiality exceptions, the accuracy of each party's representations and warranties in the merger agreement and performance by each party of their respective obligations under the merger agreement, (ix) the receipt of a merger order relating to the HoldCo merger from the High Court of England and Wales and (x) in the case of IGT's obligation to close the IGT merger, IGT's receipt of a tax opinion.
On November 4, 2014, the extraordinary shareholders' meeting of GTECH approved the merger plan regarding the merger of GTECH with and into HoldCo.
The satisfaction of all of the required conditions could delay the completion of the mergers for a significant period of time or prevent it from occurring. Any delay in completing the mergers could cause the combined company not to realize some or all of the benefits that the combined company expects to achieve if the mergers are successfully completed within its expected timeframe. Further, there can be no assurance that the conditions to the closing of the mergers will be satisfied or waived or that the mergers will be completed.
In addition, if the mergers are not completed on or before July 15, 2015 (subject to certain extension rights), either GTECH or IGT may choose not to proceed with the mergers. IGT may also terminate the merger agreement under certain circumstances, including among others in order to enter into an agreement with respect to a proposal that is determined by the IGT board of directors to be superior to the merger agreement, subject to the terms and conditions of the merger agreement (including an opportunity for GTECH to match any such proposal). GTECH may also terminate the merger agreement under certain circumstances, including among others (i) if GTECH shareholders exercise rescission rights under Italian law in respect of more than 20% of GTECH's shares outstanding as of the date of the merger agreement, (ii) if HoldCo would, as a result of a change in applicable law, be treated as a domestic corporation for U.S. federal income tax purposes as of or after the closing or (iii) if the special voting shares provided for by the HoldCo articles of association cannot be implemented under certain circumstances.
26
Failure to complete the mergers could negatively impact the stock price and the future business and financial results of IGT.
If the mergers are not completed for any reason, including as a result of IGT stockholders failing to approve the merger agreement, the ongoing businesses of IGT may be adversely affected and, without realizing any of the benefits of having completed the mergers, IGT would be subject to a number of risks, including the following:
|
●
|
under the merger agreement, IGT may be required, under certain circumstances, to pay GTECH a termination fee of approximately $135.3 million or reimburse GTECH for certain expenses;
|
|
●
|
under the merger agreement, IGT is subject to certain restrictions on the conduct of its business prior to completing the transaction, which may adversely affect its ability to execute certain of its business strategies;
|
|
●
|
IGT has incurred and will continue to incur significant costs and fees associated with the proposed transaction;
|
|
●
|
IGT may experience negative reactions from the financial markets, including negative impacts on its stock price;
|
|
●
|
IGT may experience negative reactions from its customers, regulators and employees; and
|
|
●
|
matters relating to the mergers (including integration planning) will require substantial commitments of time and resources by IGT management, which would otherwise have been devoted to day-to-day operations and other opportunities that may have been beneficial to IGT as an independent company.
|
In addition, IGT could be subject to litigation related to any failure to complete the mergers or related to any enforcement proceeding commenced against IGT to perform its obligations under the merger agreement. If the mergers are not completed, these risks may materialize and may adversely affect IGT's businesses, financial condition, financial results and stock price.
Legal proceedings in connection with the mergers, the outcomes of which are uncertain, could delay or prevent the completion of the mergers.
IGT, the members of the IGT board of directors, GTECH, HoldCo and its subsidiary, Georgia Worldwide Corporation, are named as defendants in a consolidated class action lawsuit brought by purported IGT stockholders challenging the proposed mergers. The action alleges that members of the IGT board of directors breached their fiduciary duties by agreeing to sell IGT for inadequate consideration and pursuant to an inadequate process, and that GTECH, HoldCo and Georgia Worldwide Corporation aided and abetted these alleged breaches. Among other remedies, the plaintiffs seek to enjoin the mergers.
One of the conditions to the closing of the mergers is that no temporary restraining order, preliminary or permanent injunction or other order issued by any court of competent jurisdiction or other legal restraint or prohibition preventing the consummation of the mergers shall be in effect. As such, if the plaintiffs are successful in obtaining an injunction prohibiting the defendants from consummating the mergers on the agreed upon terms, then such injunction may prevent the mergers from becoming effective, or from becoming effective within the expected timeframe.
IGT's business relationships may be subject to disruption due to uncertainty associated with the mergers.
Parties with which IGT does business may experience uncertainty associated with the transaction, including with respect to current or future business relationships with GTECH, IGT or the combined company. IGT's business relationships may be subject to disruption as customers, distributors, suppliers, vendors and others may attempt to negotiate changes in existing business relationships or consider entering into business relationships with parties other than GTECH, IGT or the combined company. These disruptions could have an adverse effect on the businesses, financial condition, results of operations or prospects of the combined company, including an adverse effect on the combined company's ability to realize the anticipated benefits of the mergers. The risk and adverse effect of such disruptions could be exacerbated by a delay in completion of the mergers or termination of the merger agreement. In addition, employee retention may be particularly challenging during the pendency of the mergers, as employees of IGT may experience uncertainty about their future roles with the combined company.
27
Item 1B. UNRESOLVED STAFF COMMENTS
None
Item 2. PROPERTIES
Our properties consist primarily of facilities worldwide used for manufacturing, engineering, sales, corporate administration, customer service and technical support. We own our corporate headquarters in Las Vegas, Nevada, which serves as our primary sales and service facility. We also own a Reno, Nevada campus, which serves as our primary manufacturing, engineering and warehousing facility. Additional sales and service facilities worldwide are occupied under leases that expire at various times through 2023. We believe our current properties will be adequate for our near-term business needs.
Square Footage (in thousands) Of Facilities At September 30, 2014
|
|
Owned
|
|
Leased
|
||
|
North America
|
|
1,840
|
|
|
404
|
|
International
|
|
15
|
|
|
378
|
Item 3. LEGAL PROCEEDINGS
IGT has been named in and has brought lawsuits in the normal course of business. A description of certain of these matters is contained in Note 13 and incorporated herein by this reference.
Item 4. MINE SAFETY DISCLOSURES
Not Applicable
28
PART II
Item 5. MARKET FOR REGISTRANT'S COMMONG EQUITY, RELATED STOCK-HOLDER MATTERS, AND ISSUER PURCHASES OF EQUITY SECURITIES
Our common stock is listed and traded on the New York Stock Exchange under the symbol "IGT." As of November 20, 2014, there were 1,747 record holders of IGT's common stock and the closing price was $17.16.
|
|
Quarters
|
|||||||||||||||
|
|
First
|
Second
|
Third
|
Fourth
|
||||||||||||
|
2014
|
||||||||||||||||
|
Stock price - high
|
$
|
19.91
|
$
|
18.29
|
$
|
16.38
|
$
|
17.55
|
||||||||
|
Stock price - low
|
16.39
|
13.31
|
12.14
|
15.02
|
||||||||||||
|
Dividends declared
|
$
|
0.11
|
$
|
0.11
|
$
|
0.11
|
$
|
0.11
|
||||||||
|
|
||||||||||||||||
|
2013
|
||||||||||||||||
|
Stock price - high
|
$
|
14.70
|
$
|
17.49
|
$
|
18.81
|
$
|
21.20
|
||||||||
|
Stock price - low
|
12.37
|
13.58
|
15.64
|
16.55
|
||||||||||||
|
Dividends declared
|
$
|
0.07
|
$
|
0.08
|
$
|
0.09
|
$
|
0.10
|
||||||||
In our 2015 first quarter, we declared a cash dividend of $0.11 per share, payable on January 2, 2015 to shareholders of record on December 18, 2014.
IGT transfer agent and registrar
Wells Fargo Shareowner Services
1110 Centre Pointe Curve, Suite 101
MAC N9173-010
Mendota Heights, MN 55120
(800) 468-9716
www.wellsfargo.com/contactshareownerservices
Share Repurchases
The purpose of our common stock repurchase plan is to increase shareholder value and to reduce outstanding share count dilution. On June 13, 2012, our Board of Directors authorized share repurchases of up to $1.0 billion with no expiration date specified. We may use open market or privately negotiated transactions, as well as Rule 10b5-1 trading plans, depending on market conditions and other factors. See Note 1 about share repurchase restrictions related to the proposed GTECH merger. Total shares purchased during the 2014 fourth quarter included 10,300 net shares tendered by employees at vesting for tax withholding obligations.
|
2014 Fourth Quarter (in millions, except price per share)
|
|
Total
Number
of Shares
Purchased
|
|
|
Average
Price
Paid
Per
Share
|
|
|
Total Number
of Shares Purchased
as Part of a Publicly
Announced Plan
|
|
|
Approximate
Dollar
Value
of Shares
Still Available
For Purchase
Under the Plan
|
|
||||
|
June 29 - July 26, 2014
|
|
|
-
|
|
|
-
|
|
|
|
-
|
|
|
209.7
|
|
||
|
July 27 - August 23, 2014
|
|
|
-
|
|
|
|
-
|
|
|
|
-
|
|
|
|
209.7
|
|
|
August 24 - September 27, 2014
|
|
|
-
|
|
|
|
-
|
|
|
|
-
|
|
|
209.7
|
|
|
29
Stock Performance Graph
The following graph reflects the cumulative total return (change in stock price plus reinvested dividends) of a $100 investment in our common stock for five fiscal years ended September 30, 2014, relative to the following:
S&P 500 - Standard and Poor's 500 Composite Index
S&P Midcap 400 - Standard and Poor's Midcap 400 Composite Index, as IGT moved to this index from the S&P 500 in June 2014
Peer Group of two companies that includes Bally Technologies, Inc., and Scientific Games Corporation
WMS Industries, Inc. (acquired by Scientific Games Corporation in October 2013) and SHFL Entertainment, Inc. (acquired by Bally Technologies, Inc. in November 2013) from the prior year peer group have been delisted.
The following graph is not "soliciting material," is not deemed filed with the SEC and is not to be incorporated by reference in any filing by us under the Exchange Act, whether made before or after the date hereof and irrespective of any general incorporation language in any such filing. The stock price performance included in this graph is not necessarily indicative of future stock price performance.
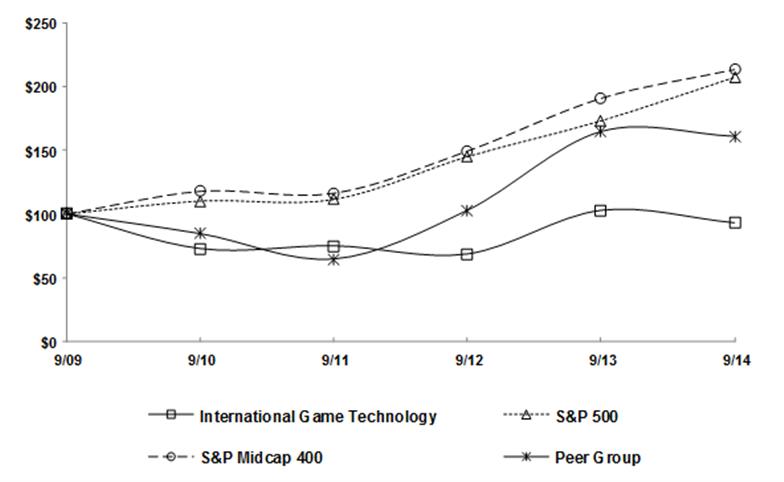
30
Item 6. SELECTED FINANCIAL DATA
The following selected financial highlights should be read in conjunction with Item 7, MDA, and Item 8, Financial Statements and Supplementary Data.
|
As of and for Years Ended September 30,
|
2014
|
2013
|
2012
|
2011
|
2010
|
|||||||||||||||
|
Revenues
|
$
|
2,058.1
|
$
|
2,341.6
|
$
|
2,150.7
|
$
|
1,957.0
|
$
|
1,917.2
|
||||||||||
|
Gross profit
|
1,214.6
|
1,344.4
|
1,237.6
|
1,138.4
|
1,087.3
|
|||||||||||||||
|
Operating income (1)
|
408.6
|
494.1
|
421.7
|
504.9
|
424.8
|
|||||||||||||||
|
Income from continuing operations, before tax (1)
|
321.3
|
402.3
|
342.8
|
427.9
|
304.9
|
|||||||||||||||
|
Income from continuing operations, net of tax
|
247.9
|
272.7
|
249.7
|
292.3
|
219.6
|
|||||||||||||||
|
Discontinued operations, net of tax
|
-
|
-
|
(3.8
|
)
|
(8.7
|
)
|
(33.6
|
)
|
||||||||||||
|
Net income
|
247.9
|
272.7
|
245.9
|
283.6
|
186.0
|
|||||||||||||||
|
Basic earnings per share
|
||||||||||||||||||||
|
Continuing operations
|
$
|
1.00
|
$
|
1.04
|
$
|
0.86
|
$
|
0.98
|
$
|
0.73
|
||||||||||
|
Discontinued operations
|
-
|
-
|
(0.01
|
)
|
(0.03
|
)
|
(0.11
|
)
|
||||||||||||
|
Net income
|
1.00
|
1.04
|
0.85
|
0.95
|
0.62
|
|||||||||||||||
|
Diluted earnings per share
|
||||||||||||||||||||
|
Continuing operations
|
$
|
0.99
|
$
|
1.03
|
$
|
0.86
|
$
|
0.97
|
$
|
0.73
|
||||||||||
|
Discontinued operations
|
-
|
-
|
(0.01
|
)
|
(0.03
|
)
|
(0.11
|
)
|
||||||||||||
|
Net income
|
0.99
|
1.03
|
0.85
|
0.94
|
0.62
|
|||||||||||||||
|
Weighted average shares outstanding
|
||||||||||||||||||||
|
Basic
|
248.6
|
262.6
|
288.8
|
298.2
|
296.3
|
|||||||||||||||
|
Diluted
|
250.5
|
265.2
|
290.4
|
299.8
|
297.8
|
|||||||||||||||
|
Cash dividends declared per share
|
$
|
0.44
|
$
|
0.34
|
$
|
0.24
|
$
|
0.24
|
$
|
0.24
|
||||||||||
|
Net operating cash flows
|
$
|
199.2
|
$
|
462.6
|
$
|
446.5
|
$
|
612.4
|
$
|
591.0
|
||||||||||
|
Net investing cash flows
|
35.0
|
(36.1
|
)
|
(308.8
|
)
|
(118.3
|
)
|
(117.7
|
)
|
|||||||||||
|
Net financing cash flows
|
(685.5
|
)
|
84.0
|
(392.6
|
)
|
(190.8
|
)
|
(462.1
|
)
|
|||||||||||
|
Capital expenditures
|
88.3
|
127.8
|
208.7
|
205.1
|
240.2
|
|||||||||||||||
|
Cash used for share repurchases
|
211.6
|
190.5
|
475.2
|
50.1
|
-
|
|||||||||||||||
|
Cash and short-term investment securities (2)
|
$
|
314.4
|
$
|
809.1
|
$
|
288.2
|
$
|
552.0
|
$
|
248.9
|
||||||||||
|
Working capital
|
676.3
|
267.5
|
633.0
|
875.2
|
620.1
|
|||||||||||||||
|
Total assets
|
3,989.5
|
4,612.8
|
4,285.1
|
4,154.4
|
4,007.0
|
|||||||||||||||
|
Debt, net (current and non-current)
|
1,878.6
|
2,192.9
|
1,846.4
|
1,646.3
|
1,674.3
|
|||||||||||||||
|
Jackpot liabilities (current and non-current)
|
379.1
|
425.0
|
481.0
|
508.4
|
570.9
|
|||||||||||||||
|
Non-current liabilities
|
2,247.1
|
1,850.2
|
2,457.0
|
2,174.9
|
2,190.4
|
|||||||||||||||
|
Total equity (3)
|
1,197.6
|
1,254.1
|
1,197.8
|
1,444.8
|
1,234.3
|
|||||||||||||||
|
(1)
|
See Note 20 about significant impairment and restructuring charges in 2014 and 2012. Impairment in 2010 included $61.3 million associated with notes receivable in Alabama.
|
|
(2)
|
Cash and short-term investments include restricted amounts. See Note 1.
|
|
(3)
|
Equity was significantly reduced in 2012 by share repurchases.
|
31
Item 7. MANAGEMENT'S DISCUSSION AND ANALYSIS OF FINANCIAL CONDITION AND RESULTS OF OPERATIONS
The following MDA is intended to enhance the reader's understanding of our company operations and current business environment from management's perspective. MDA is provided as a supplement to, and should be read in conjunction with, the accompanying Item 1, Business and Item 8, Financial Statements and Notes.
|
Our MDA is organized into the following sections:
|
||
|
|
●
|
OVERVIEW
|
|
|
●
|
CONSOLIDATED RESULTS
|
|
|
●
|
BUSINESS SEGMENT RESULTS
|
|
|
●
|
LIQUIDITY AND CAPITAL RESOURCES
|
|
|
●
|
RECENTLY ISSUED ACCOUNTING STANDARDS
|
|
|
●
|
CRITICAL ACCOUNTING ESTIMATES
|
International Game Technology is a global gaming company specializing in the design, development, manufacture, and marketing of casino-style gaming equipment, systems technology, and game content across multiple platforms—land-based, online real-money and online social. We are a leading supplier of gaming entertainment products worldwide and provide a diverse offering of quality products and services at competitive prices, designed to enhance the gaming player experience.
Operating results reviewed by our CEO encompass all revenue sources within each geographical region. We currently view our business in two operating segments, North America and International, each incorporating all revenue categories—Gaming Operations, Product Sales, and Interactive. We measure segment profit on the basis of operating income. Certain income and expenses are managed at the corporate level and not allocated to an operating segment. Other segment and financial information is contained in our BUSINESS SEGMENT RESULTS below and Note 19.
We sometimes refer to the impact of changes in foreign currency exchange rates, which results from the translation of foreign functional currencies into US dollars and foreign currency transactions remeasurement. The impact of foreign currency exchange rate fluctuations represents the difference between current rates and prior period rates applied to current period activity.
BUSINESS TRENDS
Lower gross gaming revenue in many US regional markets during 2014 has adversely impacted our financial results. These declines have negatively affected our gaming operations yields and are inhibiting casino operators' willingness to purchase gaming machines. Furthermore, the absence of a replacement opportunity in size similar to the 10,100 replacement units sold under Canadian government lottery contracts in 2013 significantly contributed to lower machine sales for 2014. Finally, an increasing number of gaming machine competitors in the market place, combined with limited casino operator capital and recent casino closures, continues to challenge our results.
Our international operations have also been impacted by worsening regulatory compliance delays and import restrictions, which continue to impede our ability to satisfy market demand for products in certain foreign jurisdictions. Notwithstanding these market conditions, we continue to believe that long-term growth opportunities exist internationally, particularly in Asian markets.
We expect that our interactive business, particularly online social gaming, will continue to provide growth opportunities. The dynamic progression of social networking and entertainment consumption on mobile devices, such as smart phones and tablets, continues to fuel growth in online social gaming. We believe that online gaming appeals to a broader consumer demographic than land-based gaming.
32
STRATEGIC OBJECTIVES
We continue to partner with our customers to build stronger relationships and deliver innovative gaming products and services. We remain focused on the following strategic objectives for 2015, designed to improve our business and increase shareholder value, with adjustments as new opportunities arise and the industry evolves:
|
●
|
Assembling the most compelling and highest performing game library available—serving both operators and players
|
|
●
|
Expanding and managing the broadest distribution network globally
|
|
●
|
Maximizing shareholder value through the efficient operation of our business, the optimal generation of cash flow, and the responsible, dependable return of capital
|
PROPOSED MERGER (See Note 1)
On July 15, 2014, we entered into a definitive merger agreement with GTECH S.p.A. for the acquisition of IGT by GTECH for $6.4 billion, comprised of $4.7 billion in cash and stock, along with the assumption of $1.7 billion in net debt. Under the terms of the merger agreement, as amended on September 23, 2014, IGT and GTECH will combine under a newly formed holding company (HoldCo) domiciled in the UK that will apply for listing solely on the NYSE.
At the closing of the transaction, IGT shares will cease trading on the NYSE and GTECH shares will cease trading on the Borsa Italiana (MSE). IGT will survive as a wholly owned subsidiary of HoldCo, currently named Georgia Worldwide PLC, which will be renamed to a name to be identified by GTECH. HoldCo will maintain corporate headquarters in the UK and operating headquarters in Las Vegas, NV, Providence, RI and Rome, Italy.
At the effective time of the merger, each share of IGT common stock will be converted into the right to receive a combination of $13.69 in cash, plus a number of ordinary shares of HoldCo equal to $4.56 divided by the dollar value of a GTECH share prior to the transaction closing, subject to the calculation adjustments and limitations set forth in the merger agreement, as amended.
The merger agreement contains certain customary covenants regarding the operation of IGT's business during the period prior to the transaction closing, including, among others, limitations on IGT's ability to: (i) issue or grant shares of capital stock or other equity interests in IGT; (ii) acquire shares of capital stock or other equity interests in IGT; and (iii) incur new indebtedness or issue debt securities, in each case subject to certain exceptions.
Consummation of the merger is expected in the first half of calendar 2015, subject to certain closing conditions, including, among others: (i) IGT and GTECH shareholder approvals; (ii) expiration or termination of the waiting period under the Hart-Scott-Rodino Antitrust Improvements Act of 1976, as amended, and certain other antitrust approvals; (iii) certain gaming regulatory approvals; and (iv) effectiveness of the HoldCo F-4 and (v) NYSE listing approval for the HoldCo shares.
The merger agreement also contains certain termination rights for IGT and GTECH, such that under certain circumstances, IGT may be required to pay a termination fee of $135.3 million or reimburse certain regulatory expenses incurred by GTECH, and GTECH may be required to pay a termination fee of up to $270.6 million.
For additional details about the terms and conditions of the merger agreement and related matters, refer to the Agreement and Plan of Merger, Support Agreement, and Voting Agreement, all dated July 15, 2014 and filed as Exhibit 2.1, 10.1, and 10.2, respectively, to our Current Report on Form 8-K filed with the SEC on July 18, 2014, along with Amendment No. 1 to Agreement and Plan of Merger dated as of September 23, 2014 and filed as Exhibit 2.1 to our Current Report on Form 8-K filed with the SEC on September 23, 2014. Additional information regarding the proposed merger transaction is available in the HoldCo F-4, which includes the preliminary proxy statement of IGT that also constitutes a prospectus of HoldCo.
33
SUMMARY RESULTS
|
C h a n g e
|
||||||||||||||||||||||||||||
|
Years Ended September 30,
|
2014
|
2013
|
2012
|
14 vs 13
|
13 vs 12
|
|||||||||||||||||||||||
|
Revenues
|
$
|
2,058.1
|
$
|
2,341.6
|
$
|
2,150.7
|
$
|
(283.5
|
)
|
-12
|
%
|
$
|
190.9
|
9
|
%
|
|||||||||||||
|
Operating income
|
408.6
|
494.1
|
421.7
|
(85.5
|
)
|
-17
|
%
|
72.4
|
17
|
%
|
||||||||||||||||||
|
Income from continuing operations
|
247.9
|
272.7
|
249.7
|
(24.8
|
)
|
-9
|
%
|
23.0
|
9
|
%
|
||||||||||||||||||
|
EPS from continuing operations
|
0.99
|
1.03
|
0.86
|
(0.04
|
)
|
-4
|
%
|
0.17
|
20
|
%
|
||||||||||||||||||
2014 Compared With 2013
Revenue decline for the year was due to a decrease of $215.9 million or 12% in North America and $67.6 million or 13% in International. Product sales decreased $238.2 million or 22% due to lower machine unit volume and gaming operations decreased $104.5 million or 11% primarily due to installed base decline. These decreases were partially offset by an increase of $59.2 million or 22% in interactive revenue due to growing contributions from social gaming. Changes in foreign currency rates negatively impacted revenues by approximately $14.3 million.
Operating income, as well as income and EPS from continuing operations, decreased primarily due to lower revenues. The decrease to income from continuing operations and EPS was partially offset by a lower effective tax rate of 22.8% versus 32.2% in the prior year, primarily due to a reduction of $39.0 million in our income tax provision related to discrete tax items. EPS benefitted from fewer shares outstanding due to share repurchases (see Note 17).
To address challenges facing the gaming industry and their impact on IGT, we implemented a plan in March 2014 to realign our operating structure and reduced our global workforce by 7%. Cost savings of approximately $30.0 million were realized in the 2014 second half and we estimate approximately $50.0 million in cost savings on an annualized basis in 2015. During 2014, we recorded charges of $15.6 million related to the business realignment, including $6.8 million for the impairment of abandoned software.
2013 Compared With 2012
Revenues improved due to an increase of $191.0 million in North America revenues, attributable to an increase of $133.0 million in interactive, mostly from the growing social gaming revenues of DoubleDown acquired in late January 2012, and $111.6 million in product sales. These increases were partially offset by a decrease in North America gaming operations revenues of $53.6 million. Changes in foreign currency rates negatively impacted revenues by approximately $9.9 million.
Operating income improved because revenue growth outpaced increased operating expenses. Income and EPS from continuing operations was negatively impacted by a higher effective tax rate primarily due to a $44.7 million benefit realized in the prior year related to Entraction. EPS additionally benefitted from fewer shares outstanding due to share repurchases (see Note 17).
34
CONSOLIDATED RESULTS – A YEAR OVER YEAR COMPARITIVE ANALYSIS
GAMING OPERATIONS
|
C h a n g e
|
||||||||||||||||||||||||||||
|
Years Ended September 30,
|
2014
|
2013
|
2012
|
14 vs 13
|
13 vs 12
|
|||||||||||||||||||||||
|
Revenues
|
$
|
886.9
|
$
|
991.4
|
$
|
1,040.0
|
$
|
(104.5
|
)
|
-11
|
%
|
$
|
(48.6
|
)
|
-5
|
%
|
||||||||||||
|
Gross margin
|
62
|
%
|
62
|
%
|
61
|
%
|
-
|
pp
|
1
|
pp
|
||||||||||||||||||
|
Installed base units - '000
|
47.6
|
54.6
|
57.1
|
(7.0
|
)
|
-13
|
%
|
(2.5
|
)
|
-4
|
%
|
|||||||||||||||||
|
MegaJackpots® (premium brand)
|
22.1
|
25.1
|
27.1
|
(3.0
|
)
|
-12
|
%
|
(2.0
|
)
|
-7
|
%
|
|||||||||||||||||
|
Lease (CDS, Racino, other)
|
25.5
|
29.5
|
30.0
|
(4.0
|
)
|
-14
|
%
|
(0.5
|
)
|
-2
|
%
|
|||||||||||||||||
|
Yield ($0.00)
|
$
|
47.69
|
$
|
48.74
|
$
|
51.49
|
$
|
(1.05
|
)
|
-2
|
%
|
$
|
(2.75
|
)
|
-5
|
%
|
||||||||||||
2014 Compared With 2013
Lower gaming operations revenue was driven primarily by installed base decline and, to a lesser extent, lower yields. Nonetheless, gross margins were maintained through cost efficiencies, including lower depreciation and service costs. Lease installed base decline was largely due to conversion units in Mexico and MegaJackpots® installed base decline was most significant in North America. Yield decline was driven by reduced play levels and was most significant in MegaJackpots®.
2013 Compared With 2012
Gaming operations revenues decreased primarily driven by lower yields, as well as installed base decline. The installed base decline was primarily from North America MegaJackpots® units, and to a lesser extent from International lease units. Gross margin improvement was primarily due to lower jackpot expense in correlation with lower WAP revenues and lower depreciation related to fewer machine builds. Yield decreased primarily due to lower play levels, most significant in North America MegaJackpots® WAP games, and continued installed base shift into lower-yield lease units.
PRODUCT SALES
|
C h a n g e
|
||||||||||||||||||||||||||||
|
Years Ended September 30,
|
2014
|
2013
|
2012
|
14 vs 13
|
13 vs 12
|
|||||||||||||||||||||||
|
Revenues
|
$
|
847.0
|
$
|
1,085.2
|
$
|
966.8
|
$
|
(238.2
|
)
|
-22
|
%
|
$
|
118.4
|
12
|
%
|
|||||||||||||
|
Machines
|
493.5
|
755.5
|
653.5
|
(262.0
|
)
|
-35
|
%
|
102.0
|
16
|
%
|
||||||||||||||||||
|
Non-machine (1)
|
353.5
|
329.7
|
313.3
|
23.8
|
7
|
%
|
16.4
|
5
|
%
|
|||||||||||||||||||
|
Gross margin
|
55
|
%
|
52
|
%
|
54
|
%
|
3
|
pp
|
(2
|
)
|
pp
|
|||||||||||||||||
|
Machine units recognized - '000 (2)
|
37.8
|
57.2
|
43.6
|
(19.4
|
)
|
-34
|
%
|
13.6
|
31
|
%
|
||||||||||||||||||
|
Machine ASP - '000
|
$
|
13.0
|
$
|
13.2
|
$
|
15.0
|
$
|
(0.2
|
)
|
-2
|
%
|
$
|
(1.8
|
)
|
-12
|
%
|
||||||||||||
|
Machine units shipped - '000 (3)
|
37.7
|
55.6
|
44.2
|
(17.9
|
)
|
-32
|
%
|
11.4
|
26
|
%
|
||||||||||||||||||
|
New/expansion
|
11.2
|
13.6
|
12.9
|
(2.4
|
)
|
-18
|
%
|
0.7
|
5
|
%
|
||||||||||||||||||
|
Replacement
|
26.5
|
42.0
|
31.3
|
(15.5
|
)
|
-37
|
%
|
10.7
|
34
|
%
|
||||||||||||||||||
|
(1) systems, licensing and parts/other;(2) correlates with revenues recognized; (3) includes deferred revenue units
|
||||||||||||||||||||||||||||
2014 Compared With 2013
Product sales revenue decreased primarily due to lower replacement units in North America. This decrease was largely the result of 9,800 fewer VLT units provided under government contracts in Canada, as well as 2,300 fewer poker units sold under a multi-property corporate contract, and lower machine demand overall. The decrease in new/expansion units was driven by lower International units. A decrease of 1,800 new VLT units in Illinois was offset by new units in other North America jurisdictions.
Non-machine revenue increases included $11.3 million in North America IP licensing fees, primarily related to arrangements that changed from periodic to fully paid-up licenses, and $8.9 million in International systems sales. ASP decline was attributed to a greater mix of lower-price lease conversion units. Gross margin improvement was due to a greater mix of higher-margin product, largely lease conversions and IP licensing fees.
35
2013 Compared With 2012
Product sales revenue grew primarily due to increased North America machines and systems sales. Machine units recognized increased primarily driven by 6,000 additional VLT replacement units in Canada, 4,400 new VLT units in Illinois, and 4,600 poker replacement units sold under a multi-property corporate contract. ASP decreased primarily due to promotional discounting and a higher mix of lower-priced VLT and poker units. Non-machine revenue increase was primarily due to an increase of $14.0 million in systems sales and higher IP license fees, primarily due to a patent royalty settlement of $5.0 million. Gross margin decreased primarily due to increased promotional discounting.
INTERACTIVE
|
C h a n g e
|
||||||||||||||||||||||||||||
|
Years Ended September 30,
|
2014
|
2013
|
2012
|
14 vs 13
|
13 vs 12
|
|||||||||||||||||||||||
|
Revenues
|
$
|
324.2
|
$
|
265.0
|
$
|
143.9
|
$
|
59.2
|
22
|
%
|
$
|
121.1
|
84
|
%
|
||||||||||||||
|
Social gaming
|
280.5
|
218.5
|
87.0
|
62.0
|
28
|
%
|
131.5
|
151
|
%
|
|||||||||||||||||||
|
IGTi
|
43.7
|
46.5
|
56.9
|
(2.8
|
)
|
-6
|
%
|
(10.4
|
)
|
-18
|
%
|
|||||||||||||||||
|
Gross margin
|
62
|
%
|
61
|
%
|
56
|
%
|
1
|
pp
|
5
|
pp
|
||||||||||||||||||
|
DoubleDown average user metrics (as a single application with multiple games, active users equal unique users)
|
||||||||||||||||||||||||||||
|
DAU ('000)
|
1,785
|
1,636
|
1,372
|
149
|
9
|
%
|
264
|
19
|
%
|
|||||||||||||||||||
|
MAU ('000)
|
6,027
|
6,141
|
5,097
|
(114
|
)
|
-2
|
%
|
1,044
|
20
|
%
|
||||||||||||||||||
|
Bookings per DAU ($0.00)
|
$
|
0.43
|
$
|
0.37
|
$
|
0.26
|
$
|
0.06
|
16
|
%
|
$
|
0.11
|
42
|
%
|
||||||||||||||
2014 Compared With 2013
Interactive revenue increased due to growth in our DoubleDown Casino. Social gaming revenue continued to build with increases in both DAU and bookings per DAU. Mobile applications comprised 33% of social bookings compared to 22% in the prior year. These increases were driven primarily by the ongoing roll-out of IGT content to the DoubleDown Casino and effective player marketing strategies.
IGTi revenue decreased primarily due to discontinued under-performing product offerings, partially offset by growth in our IGT rgs® customer base. Mobile generated 34% of IGTi revenue compared to 21% in the prior year.
Interactive gross margin improvement was primarily due to higher social gaming revenue.
2013 Compared With 2012
Interactive revenue grew primarily as a result of growth in our DoubleDown Casino. Social gaming revenue continued to improve as a result of increases in both bookings per DAU and DAU. These improvements were driven primarily by the introduction of IGT content to the DoubleDown Casino and overall growth in desktop and mobile platform applications.
IGTi revenue decreased $14.3 million related to the closures of certain European online turnkey and poker operations and $7.4 million due to the prior year VAT settlement. These decreases were partially offset by an increase of $11.3 million in online casino revenues, primarily due to a 36% increase in the number of IGT rgs® customers. Additionally, mobile applications generated 21% of IGTi online casino revenues compared to 10% in the prior year.
Gross margin improvement was primarily due to the favorable contribution from social gaming. Amortization in cost of sales for DoubleDown acquired developed technology totaled $9.2 million in 2013 and $5.0 million in 2012.
36
OPERATING EXPENSES
|
C h a n g e
|
||||||||||||||||||||||||||||
|
Years Ended September 30,
|
2014
|
2013
|
2012
|
14 vs 13
|
13 vs 12
|
|||||||||||||||||||||||
|
Selling, general and administrative
|
$
|
455.2
|
$
|
460.4
|
$
|
410.4
|
$
|
5.2
|
1
|
%
|
$
|
(50.0
|
)
|
-12
|
%
|
|||||||||||||
|
Research and development
|
224.8
|
235.0
|
217.0
|
10.2
|
4
|
%
|
(18.0
|
)
|
-8
|
%
|
||||||||||||||||||
|
Depreciation and amortization
|
66.2
|
77.4
|
76.9
|
11.2
|
14
|
%
|
(0.5
|
)
|
-1
|
%
|
||||||||||||||||||
|
Subtotal
|
746.2
|
772.8
|
704.3
|
26.6
|
3
|
%
|
(68.5
|
)
|
-10
|
%
|
||||||||||||||||||
|
Percent of revenue
|
36
|
%
|
33
|
%
|
33
|
%
|
||||||||||||||||||||||
|
Contingent acquisition-related
|
19.6
|
73.9
|
69.1
|
54.3
|
73
|
%
|
(4.8
|
)
|
-7
|
%
|
||||||||||||||||||
|
Impairment, restructuring & merger-related
|
40.2
|
3.6
|
42.5
|
(36.6
|
)
|
*
|
38.9
|
*
|
||||||||||||||||||||
|
Total operating expenses
|
$
|
806.0
|
$
|
850.3
|
$
|
815.9
|
$
|
44.3
|
5
|
%
|
$
|
(34.4
|
)
|
-4
|
%
|
|||||||||||||
2014 Compared With 2013
The decrease in total operating expenses was primarily attributable to the lower contingent acquisition-related charges (see table below) and cost savings initiatives, partially offset by increased impairment, restructuring, and merger-related charges.
Under a business realignment plan implemented in March 2014, we recorded charges of $15.6 million, including $8.8 million of severance related to a 7% global workforce reduction and $6.8 million of impairment for abandoned software. See Note 20 for information about additional impairment and merger-related charges.
Decreases in SG&A and R&D expenses were related to cost savings resulting from the business realignment, as well as lower gaming show costs due to timing changes that caused no major annual event to occur in 2014 versus two events in 2013. These decreases were partially offset by increases of $14.0 million for player marketing correlated with social gaming revenue growth and $7.7 million for bad debt provisions primarily related to certain international customers. The decrease in depreciation and amortization was primarily due to lower intangible amortization.
|
Acquisition-related charges (mostly DoubleDown)
|
2014
|
2013
|
C h a n g e
|
|||||||||||||
|
Earn-out (see Note 10 about valuation factors)
|
$
|
11.2
|
$
|
35.0
|
$
|
23.8
|
68
|
%
|
||||||||
|
Retention
|
8.4
|
38.9
|
30.5
|
78
|
%
|
|||||||||||
|
Total contingent costs
|
19.6
|
73.9
|
54.3
|
73
|
%
|
|||||||||||
|
Amortization of acquired intangibles
|
13.6
|
17.7
|
4.1
|
23
|
%
|
|||||||||||
|
Total
|
$
|
33.2
|
$
|
91.6
|
$
|
58.4
|
64
|
%
|
||||||||
2013 Compared With 2012
Increases in SG&A expenses were largely due to an increase of $34.5 million in advertising and promotion expenses, which included $27.1 million related to player marketing correlated with growing social gaming revenues, as well as higher gaming show costs in part due to timing changes that caused two major annual events to fall in 2013. SG&A increases also included $7.7 million for proxy contest fees, $7.7 million in bad debt provisions mostly related to certain international customer receivables, and $2.4 million for a legal settlement, partially offset by prior year distributor early-cancellation charges of $3.1 million. The remaining increase in SG&A and R&D expenses generally related to higher employee headcount. Lower impairment and restructuring charges (see Note 20) partially offset these increases in SG&A and R&D. Acquisition-related charges increased $3.4 million (see table below).
|
Acquisition-related charges (mostly DoubleDown)
|
2013
|
2012
|
C h a n g e
|
|||||||||||||
|
Earn-out (see Note 10 about valuation factors)
|
$
|
35.0
|
$
|
27.5
|
$
|
(7.5
|
)
|
-27
|
%
|
|||||||
|
Retention
|
38.9
|
41.6
|
2.7
|
6
|
%
|
|||||||||||
|
Total contingent costs
|
73.9
|
69.1
|
(4.8
|
)
|
-7
|
%
|
||||||||||
|
Amortization of acquired intangibles
|
17.7
|
13.3
|
(4.4
|
)
|
-33
|
%
|
||||||||||
|
Professional fees
|
-
|
5.8
|
5.8
|
100
|
%
|
|||||||||||
|
Total
|
$
|
91.6
|
$
|
88.2
|
$
|
(3.4
|
)
|
-4
|
%
|
|||||||
37
|
C h a n g e
|
||||||||||||||||||||||||||||
|
Years Ended September 30,
|
2014
|
2013
|
2012
|
14 vs 13
|
13 vs 12
|
|||||||||||||||||||||||
|
Interest Income
|
$
|
40.4
|
$
|
44.4
|
$
|
45.3
|
$
|
(4.0
|
)
|
-9
|
%
|
$
|
(0.9
|
)
|
-2
|
%
|
||||||||||||
|
WAP investments (1)
|
15.7
|
17.8
|
20.0
|
(2.1
|
)
|
-12
|
%
|
(2.2
|
)
|
-11
|
%
|
|||||||||||||||||
|
Receivables and investments
|
24.7
|
26.6
|
25.3
|
(1.9
|
)
|
-7
|
%
|
1.3
|
5
|
%
|
||||||||||||||||||
|
Interest Expense
|
(119.5
|
)
|
(123.4
|
)
|
(122.2
|
)
|
3.9
|
3
|
%
|
(1.2
|
)
|
-1
|
%
|
|||||||||||||||
|
WAP annuity accretion (1)
|
(15.6
|
)
|
(17.7
|
)
|
(19.9
|
)
|
2.1
|
12
|
%
|
2.2
|
11
|
%
|
||||||||||||||||
|
Borrowings
|
(80.5
|
)
|
(70.1
|
)
|
(69.9
|
)
|
(10.4
|
)
|
-15
|
%
|
(0.2
|
)
|
0
|
%
|
||||||||||||||
|
Convertible debt equity discount
|
(23.4
|
)
|
(35.6
|
)
|
(32.4
|
)
|
12.2
|
34
|
%
|
(3.2
|
)
|
-10
|
%
|
|||||||||||||||
|
Other, including gain (loss)
|
(8.2
|
)
|
(12.8
|
)
|
(2.0
|
)
|
4.6
|
36
|
%
|
(10.8
|
)
|
*
|
||||||||||||||||
|
Total other income (expense), net
|
$
|
(87.3
|
)
|
$
|
(91.8
|
)
|
$
|
(78.9
|
)
|
$
|
4.5
|
5
|
%
|
$
|
(12.9
|
)
|
-16
|
%
|
||||||||||
|
(1) WAP interest income includes earnings on cash and investments held for future winner payments, as well as jackpot annuity interest that accretes at approximately the same rate as WAP interest expense.
|
2014 Compared With 2013
The favorable change in total other income (expense) was primarily due to additional FV gain adjustments of $5.4 million on interest rate swaps.
2013 Compared With 2012
The change in total other income (expense) was unfavorable primarily due to increased foreign currency losses of $6.2 million primarily from Latin America and Australia currencies and additional FV loss adjustments of $4.7 million on interest rate swaps. Lower interest income and higher interest expense on debt also contributed to the unfavorable change.
|
C h a n g e
|
||||||||||||||||||||||||||||
|
Years Ended September 30,
|
2014
|
2013
|
2012
|
14 vs 13
|
13 vs 12
|
|||||||||||||||||||||||
|
Income tax provision (benefit)
|
$
|
73.4
|
$
|
129.6
|
$
|
93.1
|
$
|
56.2
|
43
|
%
|
$
|
(36.5
|
)
|
-39
|
%
|
|||||||||||||
|
Effective tax rate
|
22.8
|
%
|
32.2
|
%
|
27.2
|
%
|
9.4
|
pp
|
(5.0
|
)
|
pp
|
|||||||||||||||||
In general, differences between our effective tax rate and the US federal statutory rate of 35% principally result from the geographical distribution of taxable income, differences between the book and tax treatment of certain permanent items, and changes in unrecognized tax benefits.
2014 Compared With 2013
Our annual effective income tax rate for 2014 was favorably impacted by $29.6 million related to the settlement of US federal audits in December 2013 and $9.4 million related to the expiration of the statute of limitations for 2010. These tax benefits were partially offset by $6.9 million related to the negative impact of nondeductible foreign currency losses related to the Argentine peso devaluation during the year.
2013 Compared With 2012
Although the 2013 effective tax rate on income from continuing operations was favorably impacted by the manufacturer's deduction and the R&D tax credit, the 2012 effective tax rate reflected a significant tax benefit of $44.7 million related to Entraction closures, resulting in an unfavorable year-over-year change.
38
BUSINESS SEGMENT RESULTS – North America (See Note 19)
|
C h a n g e
|
||||||||||||||||||||||||||||
|
Years Ended September 30,
|
2014
|
2013
|
2012
|
14 vs 13
|
13 vs 12
|
|||||||||||||||||||||||
|
Total Revenues
|
$
|
1,619.2
|
$
|
1,835.1
|
$
|
1,644.1
|
$
|
(215.9
|
)
|
-12
|
%
|
$
|
191.0
|
12
|
%
|
|||||||||||||
|
Operating Income
|
427.7
|
487.9
|
425.8
|
(60.2
|
)
|
-12
|
%
|
62.1
|
15
|
%
|
||||||||||||||||||
2014 Compared With 2013
North America revenues declined driven by decreases of $197.3 million in product sales and $84.1 million in gaming operations, partially offset by an increase of $65.5 million in interactive. Operating income declined with lower revenues.
2013 Compared With 2012
North America revenue improvement was driven by increases in interactive of $133.0 million and product sales of $111.6 million, partially offset by a decline in gaming operations of $53.6 million. Operating income improved due to revenue growth outpacing higher operating expenses. The increase in operating expenses primarily related to additional expenses from DoubleDown of $55.3 million, including higher advertising of $27.1 million related to player marketing in correlation with increasing social gaming revenue and incremental acquisition-related charges of $3.4 million.
GAMING OPERATIONS – North America
|
C h a n g e
|
||||||||||||||||||||||||||||
|
Years Ended September 30,
|
2014
|
2013
|
2012
|
14 vs 13
|
13 vs 12
|
|||||||||||||||||||||||
|
Revenues
|
$
|
770.1
|
$
|
854.2
|
$
|
907.8
|
$
|
(84.1
|
)
|
-10
|
%
|
$
|
(53.6
|
)
|
-6
|
%
|
||||||||||||
|
Gross margin
|
60
|
%
|
61
|
%
|
60
|
%
|
(1
|
)
|
pp
|
1
|
pp
|
|||||||||||||||||
|
Installed base - units '000
|
38.0
|
41.4
|
43.4
|
(3.4
|
)
|
-8
|
%
|
(2.0
|
)
|
-5
|
%
|
|||||||||||||||||
|
MegaJackpots® (premium brand)
|
19.0
|
21.8
|
23.8
|
(2.8
|
)
|
-13
|
%
|
(2.0
|
)
|
-8
|
%
|
|||||||||||||||||
|
Lease (CDS, racino, other)
|
19.0
|
19.6
|
19.6
|
(0.6
|
)
|
-3
|
%
|
-
|
0
|
%
|
||||||||||||||||||
|
Yield ($0.00)
|
$
|
53.31
|
$
|
55.35
|
$
|
59.19
|
$
|
(2.04
|
)
|
-4
|
%
|
$
|
(3.84
|
)
|
-6
|
%
|
||||||||||||
2014 Compared With 2013
North America gaming operations revenues decreased primarily due to installed base decline, most significant in MegaJackpots® and lower yields. Gross margin decline and lower yields were attributable to lower play levels.
2013 Compared With 2012
North America gaming operations revenues decreased primarily driven by lower yields along with installed base decline, which were most significant in MegaJackpots®. The decrease in yield was primarily due to lower play levels, which was most significant in MegaJackpots® WAP games, as well as a higher concentration of installed base in lower-yield units. Gross margin improvement was primarily due to lower jackpot expense and reduced depreciation associated with decreased machine builds.
39
PRODUCT SALES – North America
|
C h a n g e
|
||||||||||||||||||||||||||||
|
Years Ended September 30,
|
2014
|
2013
|
2012
|
14 vs 13
|
13 vs 12
|
|||||||||||||||||||||||
|
Revenues
|
$
|
562.5
|
$
|
759.8
|
$
|
648.2
|
$
|
(197.3
|
)
|
-26
|
%
|
$
|
111.6
|
17
|
%
|
|||||||||||||
|
Machines
|
308.4
|
519.4
|
421.3
|
(211.0
|
)
|
-41
|
%
|
98.1
|
23
|
%
|
||||||||||||||||||
|
Non-machine
|
254.1
|
240.4
|
226.9
|
13.7
|
6
|
%
|
13.5
|
6
|
%
|
|||||||||||||||||||
|
Gross margin
|
58
|
%
|
54
|
%
|
57
|
%
|
4
|
pp
|
(3
|
)
|
pp
|
|||||||||||||||||
|
Machine units recognized - '000
|
24.2
|
42.2
|
29.1
|
(18.0
|
)
|
-43
|
%
|
13.1
|
45
|
%
|
||||||||||||||||||
|
Machine ASP - '000
|
$
|
12.8
|
$
|
12.3
|
$
|
14.5
|
$
|
0.5
|
4
|
%
|
$
|
(2.2
|
)
|
-15
|
%
|
|||||||||||||
|
Machine units shipped - '000
|
24.2
|
41.7
|
29.3
|
(17.5
|
)
|
-42
|
%
|
12.4
|
42
|
%
|
||||||||||||||||||
|
New/expansion
|
8.9
|
8.8
|
7.3
|
0.1
|
1
|
%
|
1.5
|
21
|
%
|
|||||||||||||||||||
|
Replacement
|
15.3
|
32.9
|
22.0
|
(17.6
|
)
|
-53
|
%
|
10.9
|
50
|
%
|
||||||||||||||||||
2014 Compared With 2013
North America product sales revenue decline was driven by lower replacement machine units recognized. This decrease was largely the result of 9,800 fewer VLT units provided under government contracts in Canada, as well as 2,300 fewer poker units sold under a multi-property corporate contract, and lower machine demand overall. Increases in new/expansion units were partially offset by 1,800 fewer new VLT units shipped into Illinois.
Non-machine revenues increased primarily due to $11.3 million in IP license fees, largely related to arrangements that changed from periodic to fully paid-up licenses. ASP improved due to a greater mix of higher-priced units, when compared to the large prior year replacement contracts of lower-priced VLT and poker units. Gross margin improved primarily due to favorable product mix and higher margin non-machine revenue.
2013 Compared With 2012
Revenues from North America product sales were driven primarily by increased machine and systems sales. Machine units recognized increased primarily driven by 6,000 additional VLT replacement units in Canada, 4,400 new VLT units in Illinois, and 4,600 poker replacement units sold under a multi-property corporate contract. Non-machine revenues increased mostly due to additional systems installations and a patent royalty settlement of $5.0 million. ASP decreased primarily due to promotional discounting and a higher mix of lower-priced VLT and poker units. Gross margin decreased primarily due to increased promotional discounting.
INTERACTIVE – North America
|
C h a n g e
|
||||||||||||||||||||||||||||
|
Years Ended September 30,
|
2014
|
2013
|
2012
|
14 vs 13
|
13 vs 12
|
|||||||||||||||||||||||
|
Revenues
|
$
|
286.6
|
$
|
221.1
|
$
|
88.1
|
$
|
65.5
|
30
|
%
|
$
|
133.0
|
151
|
%
|
||||||||||||||
|
Social gaming
|
280.5
|
218.5
|
87.0
|
62.0
|
28
|
%
|
131.5
|
151
|
%
|
|||||||||||||||||||
|
IGTi
|
6.1
|
2.6
|
1.1
|
3.5
|
135
|
%
|
1.5
|
136
|
%
|
|||||||||||||||||||
|
Gross margin
|
62
|
%
|
62
|
%
|
61
|
%
|
-
|
pp
|
1
|
pp
|
||||||||||||||||||
|
DoubleDown average user metrics
|
||||||||||||||||||||||||||||
|
DAU ('000)
|
1,785
|
1,636
|
1,372
|
149
|
9
|
%
|
264
|
19
|
%
|
|||||||||||||||||||
|
MAU ('000)
|
6,027
|
6,141
|
5,097
|
(114
|
)
|
-2
|
%
|
1,044
|
20
|
%
|
||||||||||||||||||
|
Bookings per DAU ($0.00)
|
$
|
0.43
|
$
|
0.37
|
$
|
0.26
|
$
|
0.06
|
16
|
%
|
$
|
0.11
|
42
|
%
|
||||||||||||||
2014 Compared With 2013
North America interactive revenues increased primarily due to continued growth in social gaming. Our DoubleDown Casino social gaming revenues improved with increases in both DAU and bookings per DAU. This growth was driven by the ongoing roll-out of new content to the DoubleDown Casino and effective player marketing strategies. Mobile comprised 33% of social gaming bookings compared to 22% in the prior year. IGTi revenue grew due to New Jersey opening up online real-money gaming in 2014, and continued growth in Canada.
40
2013 Compared With 2012
North America interactive revenue grew as a result of our acquisition in January 2012 and subsequent growth of the DoubleDown Casino. Social gaming revenues continued to improve with increases in both bookings per DAU and DAU. These improvements were driven primarily by the introduction of IGT content to the DoubleDown Casino and overall growth in desktop and mobile platform applications. Mobile comprised 22% of 2013 social gaming bookings compared to 4% in 2012. IGTi revenue grew due to new games released and player expansion within our online real-money partner in Canada. Gross margin growth was primarily the result of the favorable contribution from DoubleDown.
|
C h a n g e
|
||||||||||||||||||||||||||||
|
Years Ended September 30,
|
2014
|
2013
|
2012
|
14 vs 13
|
13 vs 12
|
|||||||||||||||||||||||
|
Total Revenues
|
$
|
438.9
|
$
|
506.5
|
$
|
506.6
|
$
|
(67.6
|
)
|
-13
|
%
|
$
|
(0.1
|
)
|
0
|
%
|
||||||||||||
|
Operating Income
|
90.6
|
120.1
|
103.6
|
(29.5
|
)
|
-25
|
%
|
16.5
|
16
|
%
|
||||||||||||||||||
2014 Compared with 2013
International revenues declined in all categories, most significantly in product sales with a decrease of $40.9 million. Changes in foreign currency exchange negatively impacted revenues by $11.6 million. Operating income decline was attributable to lower revenue and higher bad debt provisions, partially offset by cost savings from the business realignment.
2013 Compared with 2012
International revenues remained relatively constant primarily due to a decrease of $11.9 million in interactive, offset by an increase of $6.8 million in product sales and $5.0 million in gaming operations. Changes in foreign currency exchange negatively impacted revenues by $8.9 million. Operating income improved mostly due to lower operating expenses attributable to the closures of certain European online turnkey and poker operations initiated in our 2012 fourth quarter, partially offset by an increase in bad debt provisions of $7.3 million related to certain customer receivables.
GAMING OPERATIONS – International
|
C h a n g e
|
||||||||||||||||||||||||||||
|
Years Ended September 30,
|
2014
|
2013
|
2012
|
14 vs 13
|
13 vs 12
|
|||||||||||||||||||||||
|
Revenues
|
$
|
116.8
|
$
|
137.2
|
$
|
132.2
|
$
|
(20.4
|
)
|
-15
|
%
|
$
|
5.0
|
4
|
%
|
|||||||||||||
|
Gross margin
|
72
|
%
|
69
|
%
|
70
|
%
|
3
|
pp
|
(1
|
)
|
pp
|
|||||||||||||||||
|
Installed base units - '000
|
9.6
|
13.2
|
13.7
|
(3.6
|
)
|
-27
|
%
|
(0.5
|
)
|
-4
|
%
|
|||||||||||||||||
|
MegaJackpots® (premium brand)
|
3.1
|
3.3
|
3.3
|
(0.2
|
)
|
-6
|
%
|
-
|
0
|
%
|
||||||||||||||||||
|
Lease (CDS, racino, other)
|
6.5
|
9.9
|
10.4
|
(3.4
|
)
|
-34
|
%
|
(0.5
|
)
|
-5
|
%
|
|||||||||||||||||
|
Yield ($0.00)
|
$
|
28.12
|
$
|
27.96
|
$
|
27.19
|
$
|
0.16
|
1
|
%
|
$
|
0.77
|
3
|
%
|
||||||||||||||
2014 Compared with 2013
International gaming operations revenue decreased primarily due to installed base decline in lease operations, partially offset by a slight improvement in yield. The removal of Mexico lease units converted to for-sale was a significant driver of installed base and revenue decline. Gross margin increased primarily due to lower depreciation expense. Yield improvement from the removal of lower-yielding lease unit conversions in Mexico was partially offset by lower play levels in MegaJackpots® and unfavorable changes in foreign exchange rates.
2013 Compared with 2012
International gaming operations revenues increased mostly due to improved yield, partially offset by a lower installed base. Gross margin decline was driven by increased costs related to depreciation and royalty expenses. The installed base decline was primarily due to casino closures in Mexico. Yield improved in both MegaJackpots® and lease operations.
41
PRODUCT SALES – International
|
C h a n g e
|
||||||||||||||||||||||||||||
|
Years Ended September 30,
|
2014
|
2013
|
2012
|
14 vs 13
|
13 vs 12
|
|||||||||||||||||||||||
|
Revenues
|
$
|
284.5
|
$
|
325.4
|
$
|
318.6
|
$
|
(40.9
|
)
|
-13
|
%
|
$
|
6.8
|
2
|
%
|
|||||||||||||
|
Machines
|
185.1
|
236.1
|
232.2
|
(51.0
|
)
|
-22
|
%
|
3.9
|
2
|
%
|
||||||||||||||||||
|
Non-machine
|
99.4
|
89.3
|
86.4
|
10.1
|
11
|
%
|
2.9
|
3
|
%
|
|||||||||||||||||||
|
Gross margin
|
49
|
%
|
48
|
%
|
49
|
%
|
1
|
pp
|
(1
|
)
|
pp
|
|||||||||||||||||
|
Machine units recognized - '000
|
13.6
|
15.0
|
14.5
|
(1.4
|
)
|
-9
|
%
|
0.5
|
3
|
%
|
||||||||||||||||||
|
Machine ASP - '000
|
$
|
13.6
|
$
|
15.8
|
$
|
16.0
|
$
|
(2.2
|
)
|
-14
|
%
|
$
|
(0.2
|
)
|
-1
|
%
|
||||||||||||
|
Machine units shipped - '000
|
13.5
|
13.9
|
14.9
|
(0.4
|
)
|
-3
|
%
|
(1.0
|
)
|
-7
|
%
|
|||||||||||||||||
|
New/expansion
|
2.3
|
4.8
|
5.6
|
(2.5
|
)
|
-52
|
%
|
(0.8
|
)
|
-14
|
%
|
|||||||||||||||||
|
Replacement
|
11.2
|
9.1
|
9.3
|
2.1
|
23
|
%
|
(0.2
|
)
|
-2
|
%
|
||||||||||||||||||
2014 Compared with 2013
International product sales revenue decreased primarily due to lower machine unit volume, most significant in Latin America. ASP declined primarily due to a higher mix of lower-priced conversion machines in Mexico. Non-machine revenues increased primarily due to an increase in system sales of $8.9 million. Gross margin improved primarily due to a large sale of higher-margin lease conversion units in Mexico, as well as lower freight and rework costs.
2013 Compared with 2012
International product sales revenue improved for both machines due to higher units and non-machine related to higher theme conversions and systems sales. Gross margin decreased slightly primarily due to increased promotional discounting, partially offset by a favorable mix of higher-margin non-machine sales. ASP declined primarily due to increased promotional discounting.
INTERACTIVE – International
|
C h a n g e
|
||||||||||||||||||||||||||||
|
Years Ended September 30,
|
2014
|
2013
|
2012
|
14 vs 13
|
13 vs 12
|
|||||||||||||||||||||||
|
Revenues - IGTi
|
$
|
37.6
|
$
|
43.9
|
$
|
55.8
|
$
|
(6.3
|
)
|
-14
|
%
|
$
|
(11.9
|
)
|
-21
|
%
|
||||||||||||
|
Gross margin
|
62
|
%
|
57
|
%
|
49
|
%
|
5
|
pp
|
8
|
pp
|
||||||||||||||||||
2014 Compared with 2013
International IGTi revenues declined while gross margin improved, primarily due to discontinued lower-performing product offerings that carried higher royalty and operational costs.
2013 Compared with 2012
International IGTi revenues declined $14.3 million due to closures of certain European online turnkey and poker operations and $7.4 million due to a prior year VAT settlement. These decreases were offset by an increase of $9.8 million in online casino revenues, primarily related to increased customers. Gross margin improvement was attributable to lower tax assessments, an increased mix of higher-margin IGT rgs® revenues, and a realignment of certain player marketing costs.
42
LIQUIDITY AND CAPITAL RESOURCES
|
Increase (Decrease)
|
||||||||||||||||||||
|
September 30,
|
2014
|
2013
|
2012
|
14 vs 13
|
13 vs 12
|
|||||||||||||||
|
Cash and equivalents
|
$
|
255.1
|
$
|
713.3
|
$
|
206.3
|
$
|
(458.2
|
)
|
$
|
507.0
|
|||||||||
|
Accounts receivable, net
|
329.3
|
348.6
|
346.6
|
(19.3
|
)
|
2.0
|
||||||||||||||
|
Inventories
|
71.4
|
90.1
|
92.9
|
(18.7
|
)
|
(2.8
|
)
|
|||||||||||||
|
Working Capital
|
676.3
|
267.5
|
633.0
|
408.8
|
(365.5
|
)
|
||||||||||||||
|
Trailing-twelve month statistics:
|
||||||||||||||||||||
|
Days sales outstanding (excluding contracts and notes)
|
58
|
54
|
59
|
4
|
(5
|
)
|
||||||||||||||
|
Inventory turns
|
5.4
|
5.8
|
4.8
|
(0.4
|
)
|
1.0
|
||||||||||||||
At September 30, 2014, our principal sources of liquidity were cash and equivalents, as well as amounts available under our revolving bank credit facility discussed below under CREDIT FACILITIES AND INDEBTEDNESS. Other potential sources of capital include, but are not limited to, the issuance of debt and equity securities (see Note 1 about GTECH merger limitations). Based on past performance and current expectations, we believe the combination of these resources will satisfy our needs for working capital, jackpot liabilities, capital expenditures, debt service, and other liquidity requirements associated with our existing operations into the foreseeable future.
Cash and equivalents decreased during the year primarily due to $325.6 million in net debt payments, $211.6 million cash used for share repurchases, $185.0 million for prepaid licensing rights, $140.4 million for acquisition-related contingent payments, $107.7 million for dividends, and $88.3 million for capital expenditures. These cash expenditures were primarily offset by cash generated from operations before the licensing prepayment and acquisition-related payments of $468.5 million and net investing proceeds of $123.3 million. Restricted cash and investments and jackpot annuity investments are used for funding jackpot winner payments and online player deposits.
In March 2014, we invested $185.0 million to secure long-term licensing rights for Wheel of Fortune® and Jeopardy®. We also committed to pay an additional $5.0 million in early 2015 and $37.6 million ratably over the next ten years. This new arrangement extended our global land-based rights through 2024 and expanded our rights to include social gaming and online real-money wagering in the US.
Payments of $140.4 million for acquisition-related contingent consideration were comprised of $58.3 million for retention bonuses, $60.1 million for earn-out, and $22.0 million for release of an indemnification holdback. Payments of $56.1 million, related to earn-out and an indemnification holdback accrued at acquisition, were included in financing cash flows. The remaining $84.3 million, related to retention and earn-out accrued subsequent to acquisition, was included in operating cash flows within the net change of accounts payable and other liabilities.
Foreign subsidiary operations held 43% of our cash and equivalents at September 30, 2014 and 17% at September 30, 2013. Our foreign cash included $7.6 million in Argentine pesos at September 30, 2014 and we incurred $4.4 million in foreign currency losses resulting from the January 2014 devaluation.
Working capital increased primarily due to the maturity of our 3.25% convertible notes in May 2014. Inventory turns decreased due to lower sales volume. Days sales outstanding increased due to lower revenues.
43
CASH FLOWS SUMMARY – A Year over Year Comparative Analysis
|
Increase (Decrease)
|
||||||||||||||||||||
|
Years Ended September 30,
|
2014
|
2013
|
2012
|
14 vs 13
|
13 vs 12
|
|||||||||||||||
|
Operations
|
$
|
199.2
|
$
|
462.6
|
$
|
446.5
|
$
|
(263.4
|
)
|
$
|
16.1
|
|||||||||
|
Investing
|
35.0
|
(36.1
|
)
|
(308.8
|
)
|
71.1
|
272.7
|
|||||||||||||
|
Financing
|
(685.5
|
)
|
84.0
|
(392.6
|
)
|
(769.5
|
)
|
476.6
|
||||||||||||
|
Effects of exchange rates
|
(6.9
|
)
|
(3.5
|
)
|
1.2
|
(3.4
|
)
|
(4.7
|
)
|
|||||||||||
|
Net change in cash and equivalents
|
$
|
(458.2
|
)
|
$
|
507.0
|
$
|
(253.7
|
)
|
$
|
(965.2
|
)
|
$
|
760.7
|
|||||||
Operating Cash Flows
Operating cash flows decreased in 2014 primarily due to a reduction of $109.2 million in cash earnings (net income plus non-cash adjustments) and increased cash used of $154.2 million for changes in operating assets and liabilities related to variations in business volume and payment timing. The most significant changes in operating assets and liabilities included: additional cash used of $238.8 million for other assets and deferred costs, including $185.0 million for prepaid licensing rights; additional cash used of $55.8 million for accounts payable and accrued liabilities, including an increase of $36.9 million in acquisition-related contingent payments; and additional cash provided of $159.7 million by receivables.
Operating cash flows increased in 2013 primarily due to higher cash earnings, offset by the use of an additional $6.6 million for changes in operating assets and liabilities related to variations in business volume and payment timing. Increased cash used of $87.4 million for accounts payable and accrued liabilities, including $47.4 million for acquisition-related contingent payments, and $26.1 million for jackpot liabilities was partially offset by less cash used of $46.6 million for other assets, $25.9 million for inventory and $13.8 million for income taxes, as well as cash provided from the settlement of treasury lock contracts of $12.6 million.
Investing Cash Flows
Increased cash provided from investing in 2014 was primarily due to increased proceeds of $57.7 million from investment securities and lower capital expenditures (see table below), partially offset by a decrease of $23.4 million in net proceeds from loans receivable.
Reduced cash used for investing in 2013 was primarily due to $233.9 million less cash used for business acquisitions and lower capital expenditures (see table below).
|
Increase (Decrease)
|
||||||||||||||||||||
|
Years Ended September 30,
|
2014
|
2013
|
2012
|
14 vs 13
|
13 vs 12
|
|||||||||||||||
|
Property, plant and equipment
|
$
|
23.7
|
$
|
21.9
|
$
|
43.8
|
$
|
1.8
|
$
|
(21.9
|
)
|
|||||||||
|
Gaming operations equipment
|
61.8
|
105.5
|
162.4
|
(43.7
|
)
|
(56.9
|
)
|
|||||||||||||
|
Intellectual property
|
2.8
|
0.4
|
2.5
|
2.4
|
(2.1
|
)
|
||||||||||||||
|
Total capital expenditures
|
$
|
88.3
|
$
|
127.8
|
$
|
208.7
|
$
|
(39.5
|
)
|
$
|
(80.9
|
)
|
||||||||
Financing Cash Flows
Additional cash used for financing in 2014 was primarily due to the following increases: $677.0 million for net debt payments; $28.2 million for acquisition-related contingent payments; $28.7 million for dividends; and $21.1 million for share repurchases. See Note 17 for more information about share repurchases.
Reduced cash used for financing in 2013 was primarily due to: an increase of $211.4 million in net debt proceeds primarily related to the issuance of 5.35% bonds in September 2013; $284.7 million less cash used for share repurchases; and an increase of $27.9 million used for acquisition-related contingent payments.
44
CREDIT FACILITIES and INDEBTEDNESS (See Note 12)
At September 30, 2014, $525.0 million was outstanding under our $1.0 billion revolving credit facility, amended and restated on April 23, 2013, $454.4 million was available, and $20.6 million was reserved for letters of credit, performance bonds and bank guarantees. Of the $1.0 billion line, up to $50.0 million is available for letters of credit and up to $50.0 million is available for swing line borrowing. Subject to lender consent, the facility may be increased by $250.0 million at any time up to 60 days prior to maturity. All amounts outstanding will be immediately due and payable at maturity on April 23, 2018, which may be extended upon request for one year on the second closing date anniversary (April 23, 2015), presuming no default exists.
Interest rates and facility fees are based on our public debt ratings or net funded debt to EBITDA ratio (debt minus any unrestricted cash and investments in excess of $150.0 million), whichever is more favorable to IGT. At September 30, 2014, our pricing level was Baa2/BBB-, resulting in an interest rate of LIBOR plus 100 bps and a facility fee of 17.5 bps. Additional offering costs of $3.3 million were deferred along with previous credit facility deferred offering costs of $8.2 million, which together are amortizing to interest expense over the new 5-year term.
Our credit facility carries no limitations on share repurchases or dividend payments (see Note 1 about limitations related to the GTECH merger) provided no default exists and includes the following covenants (all terms as defined in the facility document):
|
|
●
|
a minimum ratio of 3.0 adjusted EBITDA to interest expense (interest coverage ratio)
|
|
|
|
●
|
a maximum ratio of 3.5 for net funded debt to adjusted EBITDA (net funded debt leverage ratio)
|
|
|
|
●
|
certain restrictions on our ability to:
|
|
|
|
|
■
|
pledge the securities of our subsidiaries
|
|
|
|
■
|
permit our subsidiaries to incur or guaranty additional debt, or enter into swap agreements
|
|
|
|
■
|
incur liens
|
|
|
|
■
|
merge with or acquire other companies, liquidate or dissolve
|
|
|
|
■
|
sell, transfer, lease or dispose of all or substantially all assets
|
|
|
|
■
|
change the nature of our business
|
The facility specifies certain events of default (some of which are subject to applicable grace or cure periods), including failure to make timely principal and interest payments or satisfy the covenants. An event of default, if not cured, could cause the entire outstanding borrowings under the credit facility to become immediately due and payable, lenders may cease making loans and/or terminate commitments, and cross-default provisions may be triggered in other debt issuances. We were in compliance with all debt covenants at September 30, 2014, with an interest coverage ratio of 8.6:1 and a net funded debt leverage ratio of 2.7:1.
3.25% Convertible Notes
These notes were redeemed for cash at maturity on May 1, 2014. All hedges expired at maturity and warrants expired on various dates through November 21, 2014.
7.5% Bonds Due June 2019
On June 15, 2009, we issued $500.0 million aggregate principal amount of 7.50% bonds due 2019, under our March 2009 shelf registration statement and June 11, 2009 prospectus supplement, to certain underwriters pursuant to an underwriting agreement dated June 10, 2009. We received net proceeds of $493.3 million after a discount of $2.7 million and deferred offering costs of $4.0 million, which together are amortizing to interest expense over the 10-year term. Interest is payable semiannually on June 15 and December 15, beginning December 15, 2009 and the bonds mature on June 15, 2019. We used the net proceeds from these bonds to fund the redemption of a portion of our Debentures put to us in December 2009.
45
5.5% Bonds Due June 2020
On June 8, 2010, we issued $300.0 million aggregate principal amount of 5.50% bonds due 2020, under our March 2009 shelf registration statement and June 3, 2010 prospectus supplement pursuant to an underwriting agreement dated June 3, 2010. We received net proceeds of $295.7 million after a discount of $1.3 million and deferred offering costs of approximately $3.0 million, which together are amortizing to interest expense over the 10-year term. Interest is payable semiannually on June 15 and December 15, beginning December 15, 2010 and the bonds mature on June 15, 2020. Net proceeds from these bonds were used to reduce outstanding amounts under our domestic credit facility.
5.35% Bonds Due October 2023
On September 19, 2013, we issued $500.0 million aggregate principal amount of 5.35% bonds due 2023, under our March 2012 shelf registration statement, March 29, 2012 prospectus, and September 13, 2013 prospectus supplement pursuant to an underwriting agreement dated September 12, 2013. We received net proceeds of $493.9 million after a discount of $2.1 million and deferred offering costs of $4.0 million, which together are amortizing to interest expense over the 10-year term. Interest is payable semiannually on April 15 and October 15 and the bonds mature on October 15, 2023. Net proceeds from these bonds were used to fund the redemption of our convertible notes in May 2014 and for general corporate purposes.
Additional Bond Terms
Each of our bonds are general unsecured unsubordinated obligations of IGT, ranking equal with all existing and future unsecured and unsubordinated obligations. The bonds rank junior to all existing and future liabilities, including trade payables, of our subsidiaries. IGT may redeem the bonds earlier than the maturity date by paying the holders 100% of the principal amount plus a make-whole redemption premium as described further in each indenture.
Each of our bonds contain covenants ,which may in certain circumstances restrict our ability to incur additional debt, limit our ability to enter into sale and leaseback transactions, or restrict our ability to sell, transfer, lease or dispose of substantially all assets. Further, each of the bonds specify certain events of default, some of which are subject to applicable grace or cure periods, including the failure to make timely principal and interest payments or satisfy the covenants. Upon the occurrence of an event of default under the bonds, outstanding amounts may become due and payable immediately. Except for the 7.5% bondholder amendment described below, if a change of control repurchase event occurs, bondholders may require us to purchase all or a portion of their bonds for cash.
Certain interest rate derivatives (swaps and treasury locks) have been executed related to our bonds and are further described in Notes 11 and 12.
Bondholder Amendments
On October 20, 2014, the requisite consents were received on our 7.5% bonds solicited on October 8, 2014 in connection with the proposed GTECH merger (see Note 1). A cash fee of $2.50 per bond was offered to the 7.5% bondholders who consented to the following amendments: (1) exclude the merger of IGT and GTECH from the definition of "Change of Control"; and (2) following the merger, apply the definition of "Change of Control" to the post-merger parent of IGT (Holdco), and permit Holdco to furnish the financial reports that are currently required to be furnished by IGT. IGT will record an increase to deferred offering costs and APIC for the consent fees and related professional fees collectively totaling approximately $1.8 million, which will be paid by GTECH.
To assure that all IGT bondholders will generally benefit equally and ratably from at least the same subsidiary guarantees afforded to other Holdco debt securities, all three series of IGT bonds (7.5%, 5.5%, and 5.35%) that remain outstanding following the GTECH merger will be unconditionally guaranteed by Holdco on a pari passu basis (equal ranking).
46
Shelf Registration
In March 2012, we filed a shelf registration statement with the SEC which allows us to issue debt securities, in one or more series, from time to time in amounts, at prices and on terms determined at the time of offering. See Note 1 about limitations related to the proposed GTECH merger.
FINANCIAL CONDITION
|
September 30,
|
2014
|
2013
|
Increase
(Decrease)
|
|||||||||
|
Assets
|
$
|
3,989.5
|
$
|
4,612.8
|
$
|
(623.3
|
)
|
|||||
|
Liabilities
|
2,791.9
|
3,358.7
|
(566.8
|
)
|
||||||||
|
Total Equity
|
1,197.6
|
1,254.1
|
(56.5
|
)
|
||||||||
Changes During 2014
Total assets decreased primarily due to reductions in cash and investments of $494.7 million for net debt repayments.
Total liabilities decreased primarily related to reductions in $314.3 million in net debt and $159.9 million in other liabilities (current and noncurrent), largely due to acquisition-related contingent payments.
Total equity decreased primarily due to share repurchases of $211.6 million and dividends declared of $109.0 million, partially offset by comprehensive income of $224.5 million and an increase of $39.6 million from employee stock plans.
47
CONTRACTUAL OBLIGATIONS and COMMERCIAL COMMITMENTS
The following table summarizes expected effects on future liquidity and cash flows from our minimum contractual obligations and commercial commitments as of September 30, 2014.
|
Payments due by fiscal year
|
||||||||||||||||||||
|
Total
|
2015
|
2016
to
2017
|
2018
to
2019
|
2020
and
thereafter
|
||||||||||||||||
|
Debt (1)
|
$
|
1,825.0
|
$
|
-
|
$
|
-
|
$
|
1,025.0
|
$
|
800.0
|
||||||||||
|
Interest and fees on debt (2)
|
275.2
|
42.1
|
84.2
|
78.2
|
70.7
|
|||||||||||||||
|
Jackpot winner payments (3)
|
456.5
|
117.5
|
98.4
|
66.9
|
173.7
|
|||||||||||||||
|
Open purchase orders
|
112.9
|
100.8
|
12.1
|
-
|
-
|
|||||||||||||||
|
Acquisition contingent consideration (4)
|
58.2
|
57.6
|
0.6
|
-
|
-
|
|||||||||||||||
|
Lease commitments (5)
|
60.2
|
14.9
|
23.4
|
15.8
|
6.1
|
|||||||||||||||
|
Other obligations (6)
|
48.2
|
9.1
|
13.7
|
7.0
|
18.4
|
|||||||||||||||
|
Totals
|
$
|
2,836.2
|
$
|
342.0
|
$
|
232.4
|
$
|
1,192.9
|
$
|
1,068.9
|
||||||||||
| (1) | Amounts represent the expected principal cash payments relating to our long-term debt and do not include any FV adjustments or discounts. See the MDA—Credit Facilities discussion earlier and Note 12 for additional debt information. |
| (2) | Amounts represent the expected interest cash payments relating to our long-term debt, net of the impact of interest rate swaps that effectively exchange a portion of our fixed interest for variable interest as described in Notes 11 and 12. |
| (3) | Winner payments represent amounts due previous and future WAP jackpot winners. The timing and amount of future winner payments were estimated based on historical patterns of winners' lump sum payment elections and discount rates effective at September 30, 2014. Sufficient levels of cash and investments are maintained to fund jackpot winner liabilities, as further described in Notes 1 and 9. |
| (4) | See Note 21 for additional information regarding acquisition contingent consideration. |
| (5) | See Note 15 for additional information regarding lease commitments. |
| (6) | Other obligations include unconditional amounts due under licenses, royalties and IP rights. |
Liabilities related to unrecognized tax benefits of $58.1 million were excluded from the table above, as we cannot reasonably estimate the timing of cash settlements with taxing authorities. See Note 14 for additional information regarding unrecognized tax benefits.
Arrangements with Off-Balance Sheet Risk
In the normal course of business, we are a party to financial instruments with off-balance sheet risk, such as performance bonds, guarantees and product warranties not reflected in our balance sheet. We may provide indemnifications of varying scope and terms to customers, vendors, lessors, business partners and other parties with respect to certain matters, including but not limited to, losses arising out of our breach of agreements with those parties, from services to be provided by us, or from IP infringement claims made by third parties.
Additionally, we have agreements with our directors and certain officers that require us, among other things, to indemnify them against certain liabilities that may arise by reason of their status or service as directors or officers. We have also agreed to indemnify certain former officers and directors of acquired companies. We maintain director and officer insurance, which may cover our liabilities arising from these indemnification obligations in certain circumstances.
It is not possible to determine the maximum potential obligations under these indemnification undertakings due to the unique facts and circumstances involved in each particular agreement. Such indemnification undertakings may not be subject to maximum loss clauses. Historically, we have not incurred material costs related to indemnification obligations.
We do not expect any material losses to result from these arrangements and do not rely on off-balance sheet financing arrangements to fund our operations. See Note 13.
48
RECENTLY ISSUED ACCOUNTING STANDARDS
At September 30, 2014, there were no recently issued accounting standards that are expected to have a significant impact to our financial statements in 2015. We are currently evaluating the anticipated impact beginning in 2018 of the new Revenue Recognition Standard issued in May 2014. See Note 1.
CRITICAL ACCOUNTING ESTIMATES
Our consolidated financial statements are prepared in conformity with US GAAP, which requires that we make estimates incorporating judgments and assumptions believed to be reasonable based on our historical experience, contract terms, trends in our company and the industry as a whole, as well as information available from other outside sources. Our estimates affect amounts recorded in the financial statements and actual results may differ from initial estimates.
The following accounting estimates are considered the most sensitive to changes from external factors, requiring subjective or complex judgments about matters that are inherently uncertain or variable, and are considered the most critical to fully understanding and evaluating our reported financial results.
Revenue Recognition
Our revenues are derived from the design, development, manufacture, and marketing of casino-style gaming equipment, systems technology, and game content across multiple platforms—land-based, online real-money and online social. Revenues are recognized when all of the following criteria have been satisfied: (1) persuasive evidence of an arrangement exists; (2) the price to the customer is fixed and determinable; (3) delivery has occurred and any acceptance terms have been fulfilled; (4) collection is reasonably assured.
Determining whether these criteria have been met requires us to make assumptions and exercise judgment that could significantly affect the timing and amounts of revenue reported each period. The application of our revenue recognition policies and changes in our assumptions or judgments also affect the timing and amounts of revenues and costs recognized. Determinations are subject to judgment and may change depending on the circumstances surrounding the substance or nature of the transactions.
Our sales include multiple element arrangements that bundle software systems with equipment and services. These arrangements require judgment and estimates primarily related to the allocation of revenues based on VSOE or management's best estimate of each element's relative selling price. If we are unable to establish VSOE for undelivered software and software-related elements, revenues may be deferred. Online social gaming revenues result in a small deferral, as chip sales are recognized ratably over a rather short estimated average period of chip consumption. Deferred revenue totaled $31.8 million at September 30, 2014 and $37.4 million at September 30, 2013, and primarily related to obligations under multi-element contracts that may take several months to complete or are recognized ratably over the service period, such as maintenance.
Intangible Assets and Acquisition Contingent Earn-out Payable
Impairment testing for goodwill, other intangibles, and royalties requires judgment, including the identification of reporting units, allocation of related goodwill, assignment of corporate shared assets and liabilities to reporting units, estimated cash flows, and determinations of FV. While we believe our estimates of future revenues and cash flows are reasonable, different assumptions could materially affect the assessment of useful lives, recoverability and FV. If actual cash flows fall below initial forecasts, we may need to record additional amortization and/or impairment charges.
49
Goodwill (See Note 8)
The carrying amount of goodwill is tested for impairment at least annually and in between annual tests in certain circumstances. An entity is permitted to first assess qualitatively whether it is necessary to perform the two-step goodwill impairment test. If it is determined that the two-step test is necessary, then the FV of each reporting unit is first compared to its carrying amount including goodwill. If the FV of the reporting unit is greater than its carrying amount, goodwill is not considered impaired. If the FV of the reporting unit is less than its carrying value, the amount of the impairment loss is measured by comparing the implied FV of goodwill to its carrying amount. If the carrying amount of goodwill exceeds its implied FV, an impairment loss is recognized equal to that excess.
Our three reporting units, North America, International and DoubleDown, were determined in accordance with US GAAP for reporting units. Our evaluation determined that components below our North America and International operating segments, with the exception of DoubleDown, were economically similar and should be aggregated. The DoubleDown component was disaggregated because of its uniquely different customer base and use of virtual currency in a social gaming market.
Inherent in goodwill valuations are significant judgments and estimates, including assumptions about future revenues, profitability, cash flows, and long-term growth rates, as well as our operational plans and interpretation of current industry and macroeconomic factors. If assumptions do not prove correct or economic conditions affecting future operations change, goodwill could become impaired and result in a material adverse effect on our results of operations and financial position. Goodwill totaled $1.5 billion at September 30, 2014 and September 30, 2013.
2014 Qualitative Assessment
For 2014, we performed a qualitative assessment for each of our three reporting units, which we estimated have FV significantly in excess of carrying value. We weighted the relative impact of key drivers and other industry or macroeconomic factors affecting each reporting unit in order to determine if any significant events, transactions, or other factors occurred or are expected to occur that would impair earnings or competitiveness. Factors specific to each reporting unit included financial performance and changes in carrying amounts. We also determined that the impact of macroeconomic factors on the discount rates and growth rates would not significantly affect the FVs of the reporting units. After assessing the totality of events and circumstances for each reporting unit, we concluded that it is likely that the FV of each IGT reporting unit is greater than its carrying value. As such, no further impairment testing was necessary.
2012 First Step Baseline Assessment
In determining the FV of our reporting units for our 2012 assessment, we applied the income approach using a combination of the income approach based on DCF and the market approach using the implied valuation multiples (such as BEV to revenue and EBITDA) of comparable gaming companies, weighting each method's result equally. Our DCF analysis was based on the present value of two components: the sum of our five-year projected cash flows and a terminal value assuming a long-term growth rate. The cash flow estimates were prepared based on our business plans for each reporting unit, considering historical results and anticipated future performance based on our expectations regarding product introductions and market opportunities. The discount rates used to determine the present value of future cash flows were derived from the weighted average cost of capital of a group of comparable companies with consideration for the size and specific risks of each IGT reporting unit. The discount rate used for each reporting unit ranged from approximately 10% to 17% for 2012.
Our 2012 annual goodwill impairment test indicated the FV of each reporting unit was significantly in excess of carrying value, by over 400% or $1.9 billion for each of the North America and International reporting units, and by over 69% or $225.0 million for the DoubleDown reporting unit. To illustrate the sensitivity of the FV estimates on our goodwill impairment test, we modified our 2012 test assumptions to create a hypothetical 50% decrease to the FV of each reporting unit. The resulting hypothetical excess of FV over carrying value would be approximately $0.8 billion for North America to $0.7 billion for International, and we would therefore continue to have no impairment for these reporting units. A hypothetical 50% decrease in the FV of DoubleDown would likely result in impairment.
50
Other Intangibles (See Note 8)
Our portfolio of other intangibles substantially consists of finite-lived patents, contracts, trademarks, developed technology, reacquired rights and customer relationships. We regularly monitor events or changes in circumstances that indicate the carrying value of these intangibles may not be recoverable or require a revision to the estimated remaining useful life. Our other intangibles totaled $80.9 million at September 30, 2014 and $130.6 million at September 30, 2013.
If an event or change occurs that indicates the carrying value might not be recoverable, we estimate cash flows directly associated with the use of the intangible to test recoverability and remaining useful lives based on the forecasted utilization of the asset and expected product revenues. In developing estimated cash flows, we incorporate assumptions regarding changes in legal factors, related industry climate, regulatory actions, contractual factors, operational performance and the company's strategic business plans, as well as the effects of obsolescence, demand, competition, and other market conditions. When the carrying amount exceeds the undiscounted cash flows expected to result from the use and eventual disposition of a finite-lived intangible asset or asset group, we then compare the carrying amount to its current FV. We estimate the FV using prices for similar assets, if available, or more typically using a DCF model. We recognize an impairment loss if the carrying amount is not recoverable and exceeds its FV.
In 2012, we recorded impairment of $14.6 million related to certain patents and $11.5 million related to developed technology, customer relationships, and trademarks. See Note 20.
Royalties
We regularly evaluate the estimated future benefit of prepaid and deferred royalties to determine if the carrying amount is recoverable from forecasted sales or placements of our games. The carrying value of our prepaid and deferred royalties increased to $259.4 million at September 30, 2014 from $58.6 million at September 30, 2013, primarily due to an investment of $185.0 million in March 2014 to secure and extend into online markets the long-term licensing rights for Wheel of Fortune® and Jeopardy®.
Acquisition Contingent Earn-out Payable (See Note 10)
Acquisition contingent earn-out payable relates to the estimated FV of consideration due for the business acquisitions of DoubleDown (January 2012) and Strategy 9 (May 2014) that is dependent on whether the businesses reach certain earnings targets (see Note 21). A DCF model is used to determine the FV based on the expected payments and probability-weighted earnings projections. Changes in projections and/or probabilities are the most significant assumptions and result in directionally similar changes in FV. Changes in the risk-adjusted discount rate cause a directionally opposite change in FV. Changes in FV are recorded to earnings within contingent acquisition-related costs and the payable is presented as a component of other liabilities, current and noncurrent depending on the expected payment timing.
To derive the estimated FV at September 30, 2014 for DoubleDown earn-out, we applied probability rates of 10% - 80% to various scenarios along with a discount rate of 18%. The 2014 accretion was primarily related to the time-value of money. The payable balance totaled $57.6 million current at September 30, 2014 versus $57.6 million current and $48.8 million noncurrent at September 30, 2013. To derive the estimated FV of $0.6 million noncurrent at September 30, 2014 for Strategy9 earn-out, we applied probability rates of 10% - 50% to future scenarios along with a discount rate of 10%.
51
Jackpot Liabilities and Expenses
A portion of our gaming operations recurring revenue arrangements incorporates IGT paid WAP jackpots for which we recognize jackpot liabilities and expense. Changes in estimates for WAP jackpot liabilities and expense are attributable to regular analysis and evaluation of the following factors:
variations in slot play (frequency of WAP jackpots and patterns of coin-in driving WAP jackpot growth)
volume (number of WAP units in service and levels of play or coin-in per unit)
interest rate movements (higher rates cause lower jackpot expense; lower rates cause higher jackpot expense)
startup amount (the size of base WAP jackpots at initial setup or after a jackpot is won)
Interest rates applicable to jackpot funding vary by jurisdiction and are impacted by market factors, as well as winner elections to receive a lump sum payment in lieu of periodic annual payments. Current and noncurrent portions of jackpot liabilities, as well as jackpot expense, may also be impacted by changes in our estimates and assumptions regarding the expected number of future winners who may elect a lump sum payout.
Changes in prime, treasury, and agency interest rates during a given period cause fluctuations in our jackpot expense largely due to the revaluation of future winner liabilities. The value of the jackpot liability (and expense) increases when rates decline because it increases the cost to fund the liability. Conversely, when rates increase, jackpot liabilities are reduced as it costs less to fund the liability. Our results may be materially affected by significant changes in interest rates.
Our jackpot liabilities decreased to $379.1 million at September 30, 2014 compared to $425.0 million at September 30, 2013. Consolidated jackpot expense totaled $86.7 million in 2014, $77.0 million in 2013, and $97.5 million in 2012. The increase in jackpot expense for 2014 resulted primarily from variations in slot play and interest rate changes, partially offset by decreased volume as a result of fewer units and lower yield. Note 1 summarizes our accounting policies related to jackpot liabilities and expense.
Inventory and Gaming Operations Equipment
The determination of obsolete or excess inventory requires us to estimate the future demand for our products within specific time horizons, generally one year or less. We also estimate salvage values and useful lives for our gaming operations equipment. Trends in market demand and changes in technology or customer requirements may require us to record additional inventory obsolescence or asset charges, which would negatively impact gross profit and operating results.
Inventory and gaming operations equipment management remains an area of focus as we balance the need to maintain strategic levels to ensure competitive lead times versus the risk of obsolescence or asset charges because of changing technology and customer requirements. Inventories totaled $71.4 million at September 30, 2014 and $90.1 million at September 30, 2013. The net carrying amount of our gaming operations equipment totaled $713.0 million at September 30, 2014 and $785.9 million at September 30, 2013.
Income Taxes (See Notes 1 and 14)
We conduct business globally and are subject to income taxes in US federal, state, local, and foreign jurisdictions. Determination of the appropriate amount and classification of income taxes depends on several factors, including estimates of the timing and probability of realization of deferred income taxes, reserves for uncertain tax positions, and income tax payments.
We record deferred tax assets and liabilities based on temporary differences between the financial reporting and tax basis of assets and liabilities, applying enacted tax rates expected to be in effect for the year in which the differences are expected to reverse. The ability to realize the deferred tax assets is evaluated through the forecasting of taxable income in each jurisdiction, using historical and projected future operating results, the reversal of existing temporary differences and the availability of tax planning strategies. Net deferred tax assets totaled $239.5 million at September 30, 2014 and $239.6 million at September 30, 2013.
52
Valuation allowances are recorded to reduce deferred tax assets when it is more likely than not that a tax benefit will not be realized. Changes in tax laws, enacted tax rates, geographic mix or estimated annual taxable income could change our valuation of deferred tax assets and liabilities, which in turn impacts our tax provision. We carefully monitor many factors including the impact of current economic conditions in our valuation of deferred tax assets. At September 30, 2014, our total valuation allowance of $71.6 million primarily consisted of investment write-downs, capital losses, net operating losses and foreign deferred tax assets. The related deferred tax assets are not expected to be fully realized because we cannot conclude that it is more likely than not that we will earn income of the specific character required to utilize these assets before they expire.
In the ordinary course of business, there are many transactions and calculations for which the ultimate tax determination is uncertain. We are required to recognize uncertain tax positions taken or expected to be taken in a tax return, when they are "more likely than not" to be sustained upon examination. This assessment further presumes that tax authorities evaluate the technical merits of transactions individually with full knowledge of all facts and circumstances surrounding the issue. The amount recognized in the financial statements is the largest benefit that we believe is more than 50% likely of being realized upon settlement. Changes in facts or information, as well as the expiration of statutes of limitations and/or settlements with tax jurisdictions, may result in material adjustments to these estimates in the future.
Our income tax provision will be impacted to the extent that the final outcome of tax positions differs from the estimates recorded. At September 30, 2014, our unrecognized tax benefits totaled $47.5 million, of which $36.1 million would impact the effective tax rate if recognized. Our 2014 tax provision was positively impacted by
$29.6 million related to the settlement of US federal audits in December 2013 and $9.4 million related to the expiration of the statute of limitations for 2010. These tax benefits were partially offset by $6.9 million related to the negative impact of nondeductible foreign currency losses related to the Argentine peso devaluation during 2014.
Item 7A. QUANTITATIVE AND QUALITATIVE DISCLOSURES ABOUT MARKET RISK
We use derivative financial instruments to manage certain foreign currency exchange and interest rate risk. The primary business objective of our hedging program, as defined in our corporate risk management policy, is to minimize the impact to our financial results from currency transaction remeasurement and other specified economic exposures. We enter into derivative financial instruments with high-credit quality counterparties and diversify our positions among such counterparties to reduce our exposure to credit losses. We are not party to leveraged derivatives and do not hold or issue financial instruments for speculative purposes.
Foreign Currency Risk
We routinely use forward exchange contracts to minimize our market risk exposure related to our monetary assets and liabilities denominated in nonfunctional foreign currencies. The primary business objective of our economic hedging program is to minimize the impact to earnings from changes in foreign exchange rates. These hedging instruments are subject to fluctuations in value that are generally offset by the value of the underlying exposures being hedged. Counterparties to our agreements are major commercial banks.
We also hedge significant investments denominated in foreign currency with forward exchange contracts to protect the US dollar value of our investment. In addition, from time to time, we may enter into forward exchange contracts to establish with certainty the US dollar amount of future firm commitments denominated in a foreign currency.
Hedging
The notional amount of forward contracts hedging our net foreign currency exposure related to our monetary assets and liabilities denominated in nonfunctional currency totaled $58.7 million at September 30, 2014 and $91.9 million at September 30, 2013. Changes in foreign exchange rates upon which these foreign exchange contracts are based result in exchange gains and losses. Generally, contract gain or loss should be offset by gain or loss on the underlying monetary exposures.
53
Translation
As currency rates change, translation of our foreign currency functional operations into US dollars affects year-over-year equity comparability. We do not generally hedge translation risk because cash flows from our international operations are typically reinvested locally. Currency exchange rates with the most significant impact to our translation include the British pound, Australian dollar, Euro, South African rand, and Canadian dollar. Disregarding that rates can move in opposite directions resulting in offsetting gains and losses, we estimate a 10% change in exchange rates overall would have impacted our reported equity by approximately $12.7 million at September 30, 2014 and $11.5 million at September 30, 2013.
Interest Rate Risk
Costs to fund jackpot liabilities
Fluctuations in prime, treasury and agency rates due to changes in market and other economic conditions directly impact our cost to fund jackpots and corresponding gaming operations gross profit. If interest rates decline, jackpot cost increases and gross profit decreases. We estimate a hypothetical decline of 100 bps in applicable interest rates would have reduced our gross profit by approximately $13.9 million in 2014 and $17.0 million in 2013. We do not manage this exposure with derivative financial instruments.
Domestic Credit Facility
Fluctuations in LIBOR directly impact interest costs related to our domestic credit facility. We estimate a hypothetical increase of 100 bps in LIBOR would have increased our interest expense for 2014 by approximately $2.6 million and $0.5 million in 2013. We do not manage this exposure with derivative financial instruments. See Note 12 for additional information about our domestic credit facility.
Bonds and Swaps ( See Notes 11 and 12)
At September 30, 2014, the carrying value of our 7.5% bonds, net of discount, totaled $498.5 million and the
FV totaled $568.0 million; the related swap bond adjustment was carried at its FV of $38.5 million. At September 30, 2013, the carrying value of these bonds, net of discount, totaled $498.2 million and the FV totaled $581.1 million; the related swap bond adjustment was carried at its FV of $48.4 million.
At September 30, 2014, the carrying value of our 5.5% bonds, net of discount, totaled $299.2 million and the FV totaled $317.0 million; the related swap bond adjustment was carried at its FV of $19.3 million. At September 30, 2013, the carrying value of these bonds, net of discount, totaled $299.1 million and the FV totaled $320.0 million; the related swap bond adjustment was carried at its FV of $22.6 million.
At September 30, 2014, the carrying value of our 5.35% bonds, net of discount, totaled $498.1 million and the FV totaled $517.3 million. At September 30, 2013, the carrying value of these bonds, net of discount, totaled $497.9 million and the FV totaled $508.4 million.
54
Item 8. FINANCIAL STATEMENTS AND SUPPLEMENTARY DATA
|
|
56
|
|
|
|
|
|
|
CONSOLIDATED STATEMENTS OF COMPREHENSIVE INCOME
|
57
|
|
|
|
|
|
|
CONSOLIDATED BALANCE SHEETS
|
58
|
|
|
|
|
|
|
CONSOLIDATED STATEMENTS OF CASH FLOWS
|
59
|
|
|
|
|
|
|
SUPPLEMENTAL CASH FLOWS INFORMATION
|
60
|
|
|
|
|
|
|
CONSOLIDATED STATEMENTS OF EQUITY
|
61
|
|
|
|
|
|
|
NOTES TO CONSOLIDATED FINANCIAL STATEMENTS
|
62
|
|
|
|
|
|
|
1.
|
SUMMARY OF SIGNIFICANT ACCOUNTING POLICIES
|
62
|
|
2.
|
VARIABLE INTERESTS AND AFFILIATES
|
73
|
|
3.
|
INVESTMENT SECURITIES
|
74
|
|
4.
|
RECEIVABLES
|
74
|
|
5.
|
CONCENTRATIONS OF CREDIT RISK
|
76
|
|
6.
|
INVENTORIES
|
76
|
|
7.
|
PROPERTY, PLANT, AND EQUIPMENT
|
76
|
|
8.
|
GOODWILL AND OTHER INTANGIBLES
|
76
|
|
9.
|
JACKPOT INVESTMENTS AND LIABILITIES
|
77
|
|
10.
|
FAIR VALUE MEASUREMENTS
|
78
|
|
11.
|
DERIVATIVE INSTRUMENTS
|
80
|
|
12.
|
CREDIT FACILITIES AND INDEBTEDNESS
|
81
|
|
13.
|
CONTINGENCIES
|
83
|
|
14.
|
INCOME TAXES
|
88
|
|
15.
|
LEASE COMMITMENTS
|
90
|
|
16.
|
EMPLOYEE BENEFIT PLANS
|
90
|
|
17.
|
EARNINGS PER SHARE
|
92
|
|
18.
|
ACCUMULATED OTHER COMPREHENSIVE INCOME (LOSS)
|
93
|
|
19.
|
BUSINESS SEGMENTS
|
93
|
|
20.
|
IMPAIRMENT, RESTRUCTURING, AND MERGER-RELATED COSTS
|
95
|
|
21.
|
BUSINESS ACQUISITIONS
|
96
|
|
22.
|
DISCONTINUED OPERATIONS
|
97
|
|
23.
|
QUARTERLY FINANCIAL DATA (Unaudited)
|
97
|
55
REPORT OF INDEPENDENT REGISTERED PUBLIC ACCOUNTING FIRM
To the Board of Directors and Shareholders of
International Game Technology:
In our opinion, the accompanying consolidated balance sheets and the related consolidated statements of comprehensive income, of cash flows and of equity present fairly, in all material respects, the financial position of International Game Technology and its subsidiaries at September 30, 2014 and September 30, 2013 and the results of their operations and their cash flows for each of the three years in the period ended September 30, 2014 in conformity with accounting principles generally accepted in the United States of America. Also in our opinion, the Company maintained, in all material respects, effective internal control over financial reporting as of September 30, 2014, based on criteria established in Internal Control - Integrated Framework (1992) issued by the Committee of Sponsoring Organizations of the Treadway Commission (COSO). The Company's management is responsible for these financial statements, for maintaining effective internal control over financial reporting and for its assessment of the effectiveness of internal control over financial reporting, included in Management's Report on Internal Control over Financial Reporting appearing under Item 9A. Our responsibility is to express opinions on these financial statements and on the Company's internal control over financial reporting based on our integrated audits. We conducted our audits in accordance with the standards of the Public Company Accounting Oversight Board (United States). Those standards require that we plan and perform the audits to obtain reasonable assurance about whether the financial statements are free of material misstatement and whether effective internal control over financial reporting was maintained in all material respects. Our audits of the financial statements included examining, on a test basis, evidence supporting the amounts and disclosures in the financial statements, assessing the accounting principles used and significant estimates made by management, and evaluating the overall financial statement presentation. Our audit of internal control over financial reporting included obtaining an understanding of internal control over financial reporting, assessing the risk that a material weakness exists, and testing and evaluating the design and operating effectiveness of internal control based on the assessed risk. Our audits also included performing such other procedures as we considered necessary in the circumstances. We believe that our audits provide a reasonable basis for our opinions.
A company's internal control over financial reporting is a process designed to provide reasonable assurance regarding the reliability of financial reporting and the preparation of financial statements for external purposes in accordance with generally accepted accounting principles. A company's internal control over financial reporting includes those policies and procedures that (i) pertain to the maintenance of records that, in reasonable detail, accurately and fairly reflect the transactions and dispositions of the assets of the company; (ii) provide reasonable assurance that transactions are recorded as necessary to permit preparation of financial statements in accordance with generally accepted accounting principles, and that receipts and expenditures of the company are being made only in accordance with authorizations of management and directors of the company; and (iii) provide reasonable assurance regarding prevention or timely detection of unauthorized acquisition, use, or disposition of the company's assets that could have a material effect on the financial statements.
Because of its inherent limitations, internal control over financial reporting may not prevent or detect misstatements. Also, projections of any evaluation of effectiveness to future periods are subject to the risk that controls may become inadequate because of changes in conditions, or that the degree of compliance with the policies or procedures may deteriorate.
/s/ PricewaterhouseCoopers LLP
San Jose, CA
56
CONSOLIDATED STATEMENTS OF COMPREHENSIVE INCOME
(See Accompanying Notes)
|
2014
|
2013
|
2012
|
||||||||||
|
(In millions, except per share amounts)
|
||||||||||||
|
REVENUES
|
||||||||||||
|
Gaming operations
|
$
|
886.9
|
$
|
991.4
|
$
|
1,040.0
|
||||||
|
Product sales
|
847.0
|
1,085.2
|
966.8
|
|||||||||
|
Interactive
|
324.2
|
265.0
|
143.9
|
|||||||||
|
Total
|
2,058.1
|
2,341.6
|
2,150.7
|
|||||||||
|
COSTS AND OPERATING EXPENSES
|
||||||||||||
|
Cost of gaming operations
|
339.5
|
374.3
|
405.7
|
|||||||||
|
Cost of product sales
|
382.1
|
520.2
|
444.5
|
|||||||||
|
Cost of interactive
|
121.9
|
102.7
|
62.9
|
|||||||||
|
Selling, general and administrative
|
455.2
|
460.4
|
410.4
|
|||||||||
|
Research and development
|
224.8
|
235.0
|
217.0
|
|||||||||
|
Depreciation and amortization
|
66.2
|
77.4
|
76.9
|
|||||||||
|
Contingent acquisition-related
|
19.6
|
73.9
|
69.1
|
|||||||||
|
Impairment, restructuring, and merger-related
|
40.2
|
3.6
|
42.5
|
|||||||||
|
Total
|
1,649.5
|
1,847.5
|
1,729.0
|
|||||||||
|
OPERATING INCOME
|
408.6
|
494.1
|
421.7
|
|||||||||
|
OTHER INCOME (EXPENSE)
|
||||||||||||
|
Interest income
|
40.4
|
44.4
|
45.3
|
|||||||||
|
Interest expense
|
(119.5
|
)
|
(123.4
|
)
|
(122.2
|
)
|
||||||
|
Other
|
(8.2
|
)
|
(12.8
|
)
|
(2.0
|
)
|
||||||
|
Total
|
(87.3
|
)
|
(91.8
|
)
|
(78.9
|
)
|
||||||
|
INCOME FROM CONTINUING OPERATIONS BEFORE TAX
|
321.3
|
402.3
|
342.8
|
|||||||||
|
Income tax provision
|
73.4
|
129.6
|
93.1
|
|||||||||
|
INCOME FROM CONTINUING OPERATIONS
|
247.9
|
272.7
|
249.7
|
|||||||||
|
Loss from discontinued operations, net of tax
|
-
|
-
|
(3.8
|
)
|
||||||||
|
NET INCOME
|
$
|
247.9
|
$
|
272.7
|
$
|
245.9
|
||||||
|
OTHER COMPREHENSIVE INCOME (LOSS)
|
||||||||||||
|
Foreign currency translation adjustment
|
(22.7
|
)
|
(4.3
|
)
|
13.4
|
|||||||
|
Unrealized gain (loss), net of tax
|
(0.7
|
)
|
8.0
|
(0.1
|
)
|
|||||||
|
COMPREHENSIVE INCOME
|
$
|
224.5
|
$
|
276.4
|
$
|
259.2
|
||||||
|
BASIC EARNINGS (LOSS) PER SHARE
|
||||||||||||
|
Continuing operations
|
$
|
1.00
|
$
|
1.04
|
$
|
0.86
|
||||||
|
Discontinued operations
|
-
|
-
|
(0.01
|
)
|
||||||||
|
Net income
|
$
|
1.00
|
$
|
1.04
|
$
|
0.85
|
||||||
|
DILUTED EARNINGS (LOSS) PER SHARE
|
||||||||||||
|
Continuing operations
|
$
|
0.99
|
$
|
1.03
|
$
|
0.86
|
||||||
|
Discontinued operations
|
-
|
-
|
(0.01
|
)
|
||||||||
|
Net income
|
$
|
0.99
|
$
|
1.03
|
$
|
0.85
|
||||||
|
CASH DIVIDENDS DECLARED PER SHARE
|
$
|
0.44
|
$
|
0.34
|
$
|
0.24
|
||||||
|
WEIGHTED AVERAGE SHARES OUTSTANDING
|
||||||||||||
|
Basic
|
248.6
|
262.6
|
288.8
|
|||||||||
|
Diluted
|
250.5
|
265.2
|
290.4
|
|||||||||
57
CONSOLIDATED BALANCE SHEETS
(See Accompanying Notes)
|
September 30,
|
2014
|
2013
|
||||||
|
(In millions, except par value)
|
||||||||
|
ASSETS
|
||||||||
|
Cash and equivalents
|
$
|
255.1
|
$
|
713.3
|
||||
|
Investment securities
|
-
|
28.8
|
||||||
|
Restricted cash and investment securities
|
57.2
|
64.9
|
||||||
|
Restricted cash and investment securities of VIEs
|
2.1
|
2.1
|
||||||
|
Jackpot annuity investments
|
41.9
|
44.1
|
||||||
|
Jackpot annuity investments of VIEs
|
11.1
|
12.4
|
||||||
|
Accounts receivable, net
|
329.3
|
348.6
|
||||||
|
Current maturities of contracts and notes receivable, net
|
200.9
|
229.3
|
||||||
|
Inventories
|
71.4
|
90.1
|
||||||
|
Deferred income taxes
|
98.3
|
111.1
|
||||||
|
Other assets and deferred costs
|
153.8
|
131.3
|
||||||
|
Total current assets
|
1,221.1
|
1,776.0
|
||||||
|
Property, plant and equipment, net
|
412.7
|
483.9
|
||||||
|
Jackpot annuity investments
|
211.3
|
234.5
|
||||||
|
Jackpot annuity investments of VIEs
|
25.4
|
34.1
|
||||||
|
Contracts and notes receivable, net
|
115.5
|
165.6
|
||||||
|
Goodwill
|
1,461.6
|
1,471.1
|
||||||
|
Other intangible assets, net
|
80.9
|
130.6
|
||||||
|
Deferred income taxes
|
142.0
|
128.8
|
||||||
|
Other assets and deferred costs
|
319.0
|
188.2
|
||||||
|
TOTAL ASSETS
|
$
|
3,989.5
|
$
|
4,612.8
|
||||
|
LIABILITIES AND SHAREHOLDERS' EQUITY
|
||||||||
|
LIABILITIES
|
||||||||
|
Short-term debt
|
$
|
-
|
$
|
826.6
|
||||
|
Accounts payable
|
77.7
|
110.0
|
||||||
|
Jackpot liabilities, current portion
|
117.5
|
131.7
|
||||||
|
Accrued employee benefits
|
31.4
|
40.2
|
||||||
|
Accrued income taxes
|
0.9
|
7.8
|
||||||
|
Dividends payable
|
27.2
|
25.9
|
||||||
|
Other accrued liabilities
|
290.1
|
366.3
|
||||||
|
Total current liabilities
|
544.8
|
1,508.5
|
||||||
|
Long-term debt
|
1,878.6
|
1,366.3
|
||||||
|
Jackpot liabilities
|
261.6
|
293.3
|
||||||
|
Other liabilities
|
106.9
|
190.6
|
||||||
|
TOTAL LIABILITIES
|
2,791.9
|
3,358.7
|
||||||
|
COMMITMENTS AND CONTINGENCIES
|
-
|
-
|
||||||
|
SHAREHOLDERS' EQUITY
|
||||||||
|
Common stock: $0.00015625 par value; 1,280.0 shares authorized;
274.7 and 271.4 shares issued; 247.3 and 256.2 shares outstanding
|
-
|
-
|
||||||
|
Additional paid-in capital
|
1,472.7
|
1,433.1
|
||||||
|
Treasury stock at cost: 27.4 and 15.2 shares
|
(486.5
|
)
|
(274.9
|
)
|
||||
|
Retained earnings
|
226.6
|
87.7
|
||||||
|
Accumulated other comprehensive income
|
(15.2
|
)
|
8.2
|
|||||
|
TOTAL EQUITY
|
1,197.6
|
1,254.1
|
||||||
|
TOTAL LIABILITIES AND SHAREHOLDERS' EQUITY
|
$
|
3,989.5
|
$
|
4,612.8
|
||||
58
CONSOLIDATED STATEMENTS OF CASH FLOWS
(See Accompanying Notes)
|
Years Ended September 30,
|
2014
|
2013
|
2012
|
|||||||||
|
(In millions)
|
||||||||||||
|
OPERATING
|
||||||||||||
|
Net income
|
$
|
247.9
|
$
|
272.7
|
$
|
245.9
|
||||||
|
Adjustments:
|
||||||||||||
|
Depreciation and amortization
|
189.0
|
231.6
|
240.3
|
|||||||||
|
Acquisition-related contingent earn-out costs
|
11.2
|
35.0
|
27.5
|
|||||||||
|
Discounts and deferred issuance costs
|
28.8
|
45.0
|
41.2
|
|||||||||
|
Share-based compensation
|
32.1
|
39.4
|
33.2
|
|||||||||
|
Impairment
|
21.2
|
3.6
|
40.6
|
|||||||||
|
Excess tax benefits from employee stock plans
|
(6.8
|
)
|
(2.5
|
)
|
(2.4
|
)
|
||||||
|
Other non-cash items
|
(0.5
|
)
|
7.3
|
(16.9
|
)
|
|||||||
|
Changes in operating assets and liabilities, excluding acquisitions:
|
||||||||||||
|
Receivables
|
66.6
|
(93.1
|
)
|
(101.1
|
)
|
|||||||
|
Inventories
|
13.3
|
14.2
|
(11.7
|
)
|
||||||||
|
Accounts payable and accrued liabilities
|
(89.4
|
)
|
(33.6
|
)
|
53.8
|
|||||||
|
Jackpot liabilities
|
(61.6
|
)
|
(73.6
|
)
|
(47.5
|
)
|
||||||
|
Income taxes, net of employee stock plans
|
(42.4
|
)
|
(24.6
|
)
|
(38.4
|
)
|
||||||
|
Other assets and deferred costs
|
(210.2
|
)
|
28.6
|
(18.0
|
)
|
|||||||
|
Settlement of treasury lock contracts
|
-
|
12.6
|
-
|
|||||||||
|
Net operating cash flows
|
199.2
|
462.6
|
446.5
|
|||||||||
|
INVESTING
|
||||||||||||
|
Capital expenditures
|
(88.3
|
)
|
(127.8
|
)
|
(208.7
|
)
|
||||||
|
Proceeds from assets sold
|
23.3
|
24.6
|
33.1
|
|||||||||
|
Investment securities, net
|
28.9
|
(28.8
|
)
|
-
|
||||||||
|
Jackpot annuity investments, net
|
50.9
|
48.6
|
51.8
|
|||||||||
|
Changes in restricted cash
|
7.8
|
14.9
|
10.7
|
|||||||||
|
Loans receivable cash advanced
|
(5.9
|
)
|
-
|
(0.8
|
)
|
|||||||
|
Loans receivable payments received
|
14.9
|
32.4
|
29.8
|
|||||||||
|
Proceeds from unconsolidated affiliates
|
4.9
|
-
|
9.2
|
|||||||||
|
Business acquisitions, net of cash acquired
|
(1.5
|
)
|
-
|
(233.9
|
)
|
|||||||
|
Net investing cash flows
|
35.0
|
(36.1
|
)
|
(308.8
|
)
|
|||||||
|
FINANCING
|
||||||||||||
|
Debt proceeds
|
800.0
|
617.9
|
280.0
|
|||||||||
|
Debt repayments
|
(1,125.0
|
)
|
(260.0
|
)
|
(140.0
|
)
|
||||||
|
Debt issuance costs
|
(0.6
|
)
|
(6.5
|
)
|
-
|
|||||||
|
Employee stock plan proceeds
|
8.7
|
27.5
|
13.3
|
|||||||||
|
Excess tax benefits from employee stock plans
|
6.8
|
2.5
|
2.4
|
|||||||||
|
Share repurchases, including net shares
|
(211.6
|
)
|
(190.5
|
)
|
(475.2
|
)
|
||||||
|
Noncontrolling interest acquired
|
-
|
-
|
(2.5
|
)
|
||||||||
|
Dividends paid
|
(107.7
|
)
|
(79.0
|
)
|
(70.6
|
)
|
||||||
|
Acquisition-related contingent consideration
|
(56.1
|
)
|
(27.9
|
)
|
-
|
|||||||
|
Net financing cash flows
|
(685.5
|
)
|
84.0
|
(392.6
|
)
|
|||||||
|
FOREIGN EXCHANGE RATES EFFECT ON CASH AND EQUIVALENTS
|
(6.9
|
)
|
(3.5
|
)
|
1.2
|
|||||||
|
NET CHANGE IN CASH AND EQUIVALENTS
|
(458.2
|
)
|
507.0
|
(253.7
|
)
|
|||||||
|
BEGINNING CASH AND EQUIVALENTS
|
713.3
|
206.3
|
460.0
|
|||||||||
|
ENDING CASH AND EQUIVALENTS
|
$
|
255.1
|
$
|
713.3
|
$
|
206.3
|
||||||
59
SUPPLEMENTAL CASH FLOWS INFORMATION
(See Accompanying Notes)
|
Years Ended September 30,
|
2014
|
2013
|
2012
|
|||||||||
|
(In millions)
|
||||||||||||
|
INVESTMENT SECURITIES
|
||||||||||||
|
Purchases
|
$
|
(115.0
|
)
|
$
|
(28.8
|
)
|
$
|
-
|
||||
|
Proceeds from sales
|
143.9
|
-
|
-
|
|||||||||
|
Net
|
$
|
28.9
|
$
|
(28.8
|
)
|
$
|
-
|
|||||
|
JACKPOT FUNDING
|
||||||||||||
|
Change in jackpot liabilities
|
$
|
(61.6
|
)
|
$
|
(73.6
|
)
|
$
|
(47.5
|
)
|
|||
|
Jackpot annuity investment purchases
|
(5.8
|
)
|
(11.6
|
)
|
(10.8
|
)
|
||||||
|
Jackpot annuity investment proceeds
|
56.7
|
60.2
|
62.6
|
|||||||||
|
Net change in jackpot annuity investments
|
50.9
|
48.6
|
51.8
|
|||||||||
|
Net jackpot funding
|
$
|
(10.7
|
)
|
$
|
(25.0
|
)
|
$
|
4.3
|
||||
|
CAPITAL EXPENDITURES
|
||||||||||||
|
Property, plant and equipment
|
$
|
(23.7
|
)
|
$
|
(21.9
|
)
|
$
|
(43.8
|
)
|
|||
|
Gaming operations equipment
|
(61.8
|
)
|
(105.5
|
)
|
(162.4
|
)
|
||||||
|
Intellectual property
|
(2.8
|
)
|
(0.4
|
)
|
(2.5
|
)
|
||||||
|
Total
|
$
|
(88.3
|
)
|
$
|
(127.8
|
)
|
$
|
(208.7
|
)
|
|||
|
PAYMENTS
|
||||||||||||
|
Interest
|
$
|
74.1
|
$
|
58.2
|
$
|
61.4
|
||||||
|
Income taxes
|
114.7
|
154.5
|
133.4
|
|||||||||
|
Acquisition-related:
|
||||||||||||
|
Release of indemnification holdback
|
22.0
|
-
|
-
|
|||||||||
|
Retention bonuses
|
58.3
|
30.2
|
-
|
|||||||||
|
Contingent earn-out:
|
||||||||||||
|
Operating cash flows (accrued subsequent to acquisition)
|
26.0
|
17.2
|
-
|
|||||||||
|
Financing cash flows (accrued at acquisition)
|
34.1
|
27.9
|
-
|
|||||||||
|
Total contingent earn-out
|
60.1
|
45.1
|
-
|
|||||||||
|
Total acquisition-related
|
$
|
140.4
|
$
|
75.3
|
$
|
-
|
||||||
|
NONCASH INVESTING AND FINANCING ITEMS:
|
||||||||||||
|
Accrued capital asset additions
|
$
|
1.3
|
$
|
1.9
|
$
|
1.5
|
||||||
|
Business acquisitions:
|
||||||||||||
|
Fair value of assets
|
$
|
2.4
|
$
|
-
|
$
|
350.5
|
||||||
|
Fair value of liabilities
|
0.9
|
-
|
116.6
|
|||||||||
Payments for acquisition-related contingent earn-out consideration
Amounts accrued as of the acquisition date are reflected in financing cash flows. Payments for amounts accrued subsequent to the acquisition date, in excess of amounts accrued as part of the purchase price allocation, are reflected in operating cash flows within changes in accounts payable and accrued liabilities.
Depreciation and amortization
Amounts reflected in operating cash flows are comprised of operating expenses shown separately on the income statements, plus those amounts included within cost of gaming operations, cost of product sales, cost of interactive, and discontinued operations.
60
CONSOLIDATED STATEMENTS OF EQUITY
(See Accompanying Notes)
|
Years Ended September 30,
|
2014
|
2013
|
2012
|
|||||||||
|
(In millions)
|
||||||||||||
|
COMMON STOCK
|
||||||||||||
|
Beginning shares
|
271.4
|
343.5
|
341.9
|
|||||||||
|
Employee stock plan shares issued
|
3.3
|
2.9
|
1.6
|
|||||||||
|
Treasury shares retired
|
-
|
(75.0
|
)
|
-
|
||||||||
|
Ending shares
|
274.7
|
271.4
|
343.5
|
|||||||||
|
Ending balance
|
$
|
-
|
$
|
-
|
$
|
0.1
|
||||||
|
ADDITIONAL PAID-IN CAPITAL
|
||||||||||||
|
Beginning balance
|
$
|
1,433.1
|
$
|
1,585.1
|
$
|
1,542.5
|
||||||
|
Employee stock plan shares issued
|
7.5
|
23.7
|
9.4
|
|||||||||
|
Share-based compensation
|
32.1
|
39.4
|
33.2
|
|||||||||
|
Treasury stock retired
|
-
|
(215.1
|
)
|
-
|
||||||||
|
Ending balance
|
$
|
1,472.7
|
$
|
1,433.1
|
$
|
1,585.1
|
||||||
|
TREASURY STOCK
|
||||||||||||
|
Beginning balance
|
$
|
(274.9
|
)
|
$
|
(1,332.9
|
)
|
$
|
(855.2
|
)
|
|||
|
Shares repurchased
|
(211.6
|
)
|
(190.5
|
)
|
(475.2
|
)
|
||||||
|
Restricted Stock Award forfeitures
|
-
|
(3.7
|
)
|
(2.5
|
)
|
|||||||
|
Treasury stock retired
|
-
|
1,252.2
|
-
|
|||||||||
|
Ending balance
|
$
|
(486.5
|
)
|
$
|
(274.9
|
)
|
$
|
(1,332.9
|
)
|
|||
|
RETAINED EARNINGS
|
||||||||||||
|
Beginning balance
|
$
|
87.7
|
$
|
941.0
|
$
|
763.8
|
||||||
|
Dividends declared
|
(109.0
|
)
|
(88.9
|
)
|
(68.7
|
)
|
||||||
|
Net income
|
247.9
|
272.7
|
245.9
|
|||||||||
|
Treasury stock retired
|
-
|
(1,037.1
|
)
|
-
|
||||||||
|
Ending balance
|
$
|
226.6
|
$
|
87.7
|
$
|
941.0
|
||||||
|
ACCUMULATED OTHER COMPREHENSIVE INCOME (LOSS)
|
||||||||||||
|
Beginning balance
|
$
|
8.2
|
$
|
4.5
|
$
|
(8.8
|
)
|
|||||
|
Other comprehensive income (loss)
|
(23.4
|
)
|
3.7
|
13.3
|
||||||||
|
Ending balance
|
$
|
(15.2
|
)
|
$
|
8.2
|
$
|
4.5
|
|||||
|
NONCONTROLLING INTEREST
|
||||||||||||
|
Beginning balance
|
$
|
-
|
$
|
-
|
$
|
2.4
|
||||||
|
Change in ownership
|
-
|
-
|
(2.4
|
)
|
||||||||
|
Ending balance
|
$
|
-
|
$
|
-
|
$
|
-
|
||||||
61
NOTES TO CONSOLIDATED FINANCIAL STATEMENTS
1. SUMMARY OF SIGNIFICANT ACCOUNTING POLICIES
BASIS OF PRESENTATION AND CONSOLIDATION
Our consolidated financial statements incorporate all of the accounts of International Game Technology, including all majority-owned or controlled subsidiaries and VIEs for which we are the primary beneficiary. All inter-company accounts and transactions were eliminated. Our consolidated financial statements are prepared in accordance with SEC and US GAAP requirements on a basis consistent with the comparative periods and include all adjustments of a normal recurring nature necessary to fairly present our consolidated results of operations, financial position, and cash flows for all periods presented.
Fiscal Calendar
Our fiscal year is reported on a 52/53-week period ending on the Saturday nearest to September 30. For simplicity, fiscal periods in this report are presented using the calendar month end as outlined in the table below.
|
Fiscal Year
|
Date Ended
|
Weeks
|
||||
|
Presented as
|
Actual
|
|||||
|
2014
|
September 30, 2014
|
September 27, 2014
|
52
|
|||
|
2013
|
|
September 30, 2013
|
|
September 28, 2013
|
|
52
|
|
2012
|
|
September 30, 2012
|
|
September 29, 2012
|
|
52
|
Discontinued Operations (See Note 22)
Prior period discontinued operations were reclassified in our income statements, but statements of cash flows were not recast.
Use of Estimates
We are required to make estimates, judgments and assumptions that we believe are reasonable based on our historical experience, contract terms, observance of known trends in our company and the industry as a whole, and information available from other outside sources. Our estimates affect reported amounts for assets, liabilities, revenues, expenses, and related disclosures. Actual results may differ from initial estimates.
PROPOSED MERGER
On July 15, 2014, we entered into a definitive merger agreement with GTECH S.p.A. for the acquisition of IGT by GTECH for $6.4 billion, comprised of $4.7 billion in cash and stock, along with the assumption of $1.7 billion in net debt. Under the terms of the merger agreement, as amended on September 23, 2014, IGT and GTECH will combine under a newly formed holding company (HoldCo) domiciled in the UK that will apply for listing solely on the NYSE.
At the closing of the transaction, IGT shares will cease trading on the NYSE and GTECH shares will cease trading on the Borsa Italiana (MSE). IGT will survive as a wholly owned subsidiary of HoldCo, currently named Georgia Worldwide PLC, which will be renamed to a name to be identified by GTECH. HoldCo will maintain corporate headquarters in the UK and operating headquarters in Las Vegas, NV, Providence, RI and Rome, Italy.
At the effective time of the merger, each share of IGT common stock will be converted into the right to receive a combination of $13.69 in cash, plus a number of ordinary shares of HoldCo equal to $4.56 divided by the dollar value of a GTECH share prior to the transaction closing, subject to calculation adjustments and limitations set forth in the merger agreement.
62
The merger agreement contains certain customary covenants regarding the operation of IGT's business during the period prior to the transaction closing, including, among others, limitations on IGT's ability to: (i) issue or grant shares of capital stock or other equity interests in IGT; (ii) acquire shares of capital stock or other equity interests in IGT; and (iii) incur new indebtedness or issue debt securities, in each case subject to certain exceptions.
Consummation of the merger is expected in the first half of calendar 2015, subject to certain closing conditions, including, among others: (i) IGT and GTECH shareholder approvals; (ii) expiration or termination of the waiting period under the Hart-Scott-Rodino Antitrust Improvements Act of 1976, as amended, and certain other antitrust approvals; (iii) certain gaming regulatory approvals; and (iv) effectiveness of the HoldCo F-4 and (v) NYSE listing approval for the HoldCo shares.
The merger agreement also contains certain termination rights for IGT and GTECH, such that under certain circumstances, IGT may be required to pay a termination fee of $135.3 million or reimburse certain regulatory expenses incurred by GTECH, and GTECH may be required to pay a termination fee of up to $270.6 million.
For additional details about the terms and conditions of the merger agreement and related matters, refer to the Agreement and Plan of Merger, Support Agreement, and Voting Agreement, all dated July 15, 2014 and filed as Exhibit 2.1, 10.1, and 10.2, respectively, to our Current Report on Form 8-K filed with the SEC on July 18, 2014, along with Amendment No. 1 to Agreement and Plan of Merger dated as of September 23, 2014 and filed as Exhibit 2.1 to our Current Report on Form 8-K filed with the SEC on September 23, 2014. Additional information regarding the proposed merger transaction is available in the HoldCo F-4, which includes the preliminary proxy statement of IGT that also constitutes a prospectus of HoldCo.
ACCOUNTING POLICIES
Revenue Recognition
Revenues are recognized when all of the following have been satisfied: (1) persuasive evidence of an arrangement exists; (2) the price to the customer is fixed and determinable; (3) delivery has occurred and any acceptance terms have been fulfilled; (4) collection is reasonably assured.
Revenues are reported net of incentive rebates and discounts. Sales taxes and other taxes of a similar nature are presented on a net basis (excluded from revenues). Amounts billed prior to completing the earnings process are deferred until revenue recognition criteria is met.
Gaming Operations
Gaming operations revenues are generated by providing customers with proprietary land-based gaming equipment, systems, content licensing, and services under a variety of recurring revenue arrangements (including WAP, CDS, stand-alone participation and flat fee), as well as other equipment leasing and rental.
WAP systems consist of linked slot machines located in multiple casino properties, connecting to an IGT central computer system. WAP games differ from all other games in that an IGT-sponsored progressive jackpot increases with every wager until a player wins the top award combination. Casinos with IGT WAP machines pay a percentage of the coin-in (amounts wagered) for IGT services related to the design, assembly, installation, operation, maintenance, and marketing of the WAP systems, as well as funding and administration of the IGT-sponsored progressive jackpots.
Revenues from CDS, stand-alone participation and other equipment leasing or rentals are recognized based on a percentage of the net win or on a fixed daily/monthly fee or rental basis.
63
Product Sales
Revenues from product sales include land-based gaming machines and non-machine gaming related equipment, systems, services, licensing and royalty fees, and component parts (including game theme and electronics conversion kits). Time-based licensing and maintenance fees are typically recognized ratably over the term of the agreement. Our credit sales terms are predominately 90 days or less. We also grant extended payment terms under contracts of sale secured by the related equipment sold, and these contracts are predominantly paid within their terms.
Interactive
Interactive revenues are generated from online social gaming and online real-money products and services.
Social gaming revenues are generated from the sale of virtual casino chips to players in our online DoubleDown Casino that can be used for additional play or game enhancements. Revenues from player purchases are recognized ratably over the estimated average service period in which the chips are consumed based on historical data analysis. Because DoubleDown is the principal, responsible for substantially all aspects of the casino services and sale of virtual goods to the player, revenues are recorded on a gross basis. Payment processing fees paid to Facebook, Apple and Google on a revenue participation basis are recorded within cost of revenues. This determination is subject to judgment and material changes in the substance or nature of arrangements with our customers and payment processors may result in a change in presentation.
IGTi revenues are generated from online real-money gaming solutions offerings, which encompass gaming systems infrastructure applications, content licensing, and back office operational support services, including WAP jackpot funding and administration. IGTi solutions are generally provided under revenue sharing arrangements based on a percentage of net win similar to gaming operations discussed above.
Multi-element Arrangements
The majority of our multiple element contracts are for some combination of machines, systems, license fees, maintenance, training, and other services. Revenues for individual deliverables are recognized when the relevant criteria for that element has been met.
Most of our products and services qualify as separate units of accounting. Terms of performance, cancellation, termination, or refunds in our multiple element contracts are similar to those for individual stand-alone deliverables. Arrangement consideration is allocated among multiple deliverables based on relative selling prices. In order of preference, relative selling prices are estimated based on VSOE, third-party evidence, or management's best estimate.
VSOE is determined by the net price charged for each deliverable when it is sold separately. VSOE for maintenance agreements is determined based on actual renewals sold. Third-party evidence is generally not available for our products because of their unique nature. When VSOE is not available, generally for new or highly customized offerings where third-party evidence is not available, the estimated selling price is the amount for which the product or service would be sold individually. Management's best estimate is made based on our standard pricing and discounting practices, which consider multiple factors, such as market conditions, competitive landscape, internal costs, and profit objectives.
Generally, revenues allocated to nonsoftware elements are recognized upon delivery and customer acceptance, and revenue allocated to software elements or future services can require deferral or recognition over a lease, licensing, or service term.
64
Deferred Revenue
Deferred revenue primarily relates to product sales obligations under multi-element contracts that may take several months to complete the criteria for revenue recognition or those elements recognized ratably over a service period, such as maintenance or licensing.
|
September 30,
|
2014
|
2013
|
||||||
|
Other accrued liabilities (current)
|
$
|
29.4
|
$
|
31.0
|
||||
|
Other liabilities (noncurrent)
|
2.4
|
6.4
|
||||||
|
Total deferred revenues
|
$
|
31.8
|
$
|
37.4
|
||||
Jackpot Accounting
Jackpot Liabilities and Expense
We incur jackpot expense and accrue jackpot liabilities with every wager on devices connected to an IGT WAP system. Only WAP games include IGT-sponsored jackpots for which IGT incurs jackpot expense. WAP games are a component of our MegaJackpot® premium branded units and comprised 16% of our total gaming operations installed base at September 30, 2014, 2013, and 2012. A portion of fees paid to IGT is used for the funding and administration of the IGT-sponsored WAP jackpot payments.
Jackpot expense represents the estimated cost to fund jackpots and is recorded to cost of revenues. Changes in estimates for WAP jackpot liabilities and expense are attributable to regular analysis and evaluation of the following factors:
variations in slot play (frequency of WAP jackpots and patterns of coin-in driving WAP jackpot growth)
volume (number of WAP units in service and levels of play or coin-in per unit)
interest rate movements (higher rates cause lower jackpot expense; lower rates cause higher jackpot expense)
startup amount (the size of base WAP jackpots at initial setup or after a jackpot is won)
Our WAP jackpots are generally payable in equal annual installments over 20 to 26 years or immediately in the case of instant win systems. Winners may elect to receive a lump sum payment for the present value of the jackpot discounted at applicable interest rates in lieu of periodic annual installments. Discount rates eligible for use in the lump sum payment calculation vary by jurisdiction and are impacted by market forces and other economic conditions.
Jackpot liabilities are comprised of payments due previous winners, as well as amounts due future winners of WAP jackpots not yet won. Previous winner liabilities for periodic payments are carried at the accreted cost of jackpot annuity investments in qualifying US government or agency securities used to fund future periodic payments. Liabilities due future winners are revalued and recorded at the present value of the amount carried on WAP meters for jackpots not yet won.
We estimate the present value of future winner liabilities using current market prime, treasury, or agency rates, weighted with historical lump sum payout election ratios. The most recent historical patterns indicate that approximately 90% of winners will elect the lump sum payment option. Additionally, we estimate the current portion of future winner liabilities based on historical experience with winner payment elections, in conjunction with the theoretical projected number of jackpots.
Restricted Cash and Investments
We are required by gaming regulation to maintain sufficient reserves in restricted accounts to be used for the purpose of funding payments to WAP jackpot winners. Restricted amounts are based primarily on the jackpot meters displayed to slot players and vary by jurisdiction. Compliance with restricted cash and investments requirements for jackpot funding is reported to gaming authorities in various jurisdictions. Additionally, restricted cash is maintained for online player deposits.
65
Jackpot Annuity Investments
Held to maturity for funding annual jackpot payments to previous winners, jackpot annuity investments are comprised of discounted qualifying US treasury or agency securities. With both the intent and ability to hold these investments to maturity, these investments are stated at cost plus interest accreted over the term of the security. Certain jurisdictions require regulatory approval for liquidation of these annuity investments.
WAP Systems Interest
Interest income accretion on jackpot annuity investments is offset by interest expense accretion on previous winner liabilities. WAP interest income and expense, included in other income (expense), accretes at approximately the same rate and varies depending on the amount of jackpots won and the number of winners electing periodic payments. WAP systems annuity interest accretion totaled $15.7 million in 2014, $17.8 million in 2013, and $20.0 million in 2012. Interest income also includes earnings on other cash and short-term investments held for WAP operations.
Share-based Compensation (See Note 16)
Under our SIP, eligible employees and non-employee directors may be granted non-qualified and incentive stock options, restricted shares or stock appreciation rights. SIP grants may vest based on time of service or performance. Stock options are generally granted at an exercise price equal to the market price on the date of grant, with a 10-year contractual term. SIP grants generally vest over 3-5 years either in ratable annual increments or 100% at the end of the vesting period.
The amount, frequency, and terms of share-based awards vary based on competitive practices, operating results, and government regulations. New shares of IGT common stock are issued upon exercises of stock options, vesting of restricted share units, or restricted share grants. Since 2010, restricted share awards have been granted in the form of units without dividends and count as two shares against the balance of shares available for grant. Forfeitures occur primarily when employment is terminated prior to vesting.
ESPP
Under the ESPP, eligible employees are granted an option with a 12-month term to purchase a limited number of shares, exercisable the last day in February each year at 95% of the market price upon exercise. Eligible employees may participate in this plan through payroll deductions up to certain limits.
Measurement
Share-based compensation is measured at FV on the grant date reduced for estimated forfeitures. We use historical data and projections to estimate expected employee behaviors related to option exercises and forfeitures. Share-based compensation is recorded over the applicable vesting period using the straight-line method for service-based awards and the accelerated method for performance-based awards.
The FV of restricted share awards is based on the market price of IGT common stock on the grant date. We also use the Monte-Carlo simulation process to estimate the FV on the grant date of the relative total shareholder return portion of awards that are based on a combination of operating performance targets and stock price modifiers. We estimate the FV of stock option awards on the grant date using the Black-Scholes valuation model. Valuation models require the input of highly subjective assumptions, and changes in assumptions used can materially affect the FV estimate. Expected volatility and dividends are based on implied and historical IGT stock factors. Expected term represents the estimated weighted average time between grant and employee exercise. Risk free rate is based on US Treasury rates appropriate for the expected term.
66
Advertising Costs
Advertising costs are expensed as incurred. Amounts included in continuing operations totaled $74.6 million in 2014, $68.2 million in 2013, and $34.3 million in 2012. Increases since 2012 were primarily in correlation with social gaming revenue growth.
Operating Leases
We lease certain facilities and equipment under various agreements with expiration dates through May 2023. Leases may also provide that we pay certain operating expenses applicable to the property, such as utilities, maintenance, property taxes, and liability and property damage insurance. Lease payments, net of potential sublease rentals, are accrued for properties no longer in service. Expenses under operating leases are recognized on a straight-line basis over the term of the contract, net of lessor reimbursements. Capitalized operating lease expenses are recognized with an effective interest allocation over the contract term.
Research and Development
R&D is expensed as incurred because our products generally reach technological feasibility shortly before distribution. Employee related costs associated with product development are included in R&D costs. Certain R&D performed for specific customers is charged to cost of revenues with the related sale. Development costs related to software to be used only for services provided to customers is capitalized as internal-use software and amortized over its useful life within the costs of relevant revenues.
Income Taxes (See Note 14)
Deferred tax assets and liabilities are recorded based on temporary differences between the financial reporting and tax bases of assets and liabilities, applying enacted tax rates expected to be in effect for the year in which the differences are expected to reverse. Deferred tax assets are reduced by a valuation allowance when it is "more likely than not" that some or all of it would not be realized.
Our provision for income taxes includes interest, penalties and reserves for uncertain tax positions. As required, uncertain tax positions taken or expected to be taken in a tax return are recognized when it is "more likely than not" to be sustained upon examination. A recognized tax position is recorded at the largest amount of benefit that had a "greater than 50% likelihood" of being realized upon settlement.
Earnings Per Share (See Note 17)
EPS is computed using the weighted average number of common and potential shares outstanding. Restricted common shares granted with non-forfeitable rights to dividends are included as participating securities under the two-class method. Net income available to these participating securities is not significant.
Cash and Equivalents
Cash on deposit may be held in money market funds and may be in excess of Federal Deposit Insurance Corporation limits. In addition to cash deposits at major banks, cash and equivalents include other marketable securities with original maturities of 90 days or less, primarily in US Treasury-backed money market funds.
Investment Securities (See Notes 3 and 10)
We place short-term investments in high credit quality financial institutions and in short-duration high-quality securities. With the exception of US Government and Agency securities, our short-term investment policy limits the amount of credit exposure in any one financial institution, industry group, or type of investment. These available-for-sale securities are reported at FV, with unrealized gains and losses recorded in accumulated other comprehensive income (loss).
67
Customer Receivables and Financing
Allowances for Credit Losses
Allowances for credit losses related to accounts receivable and customer financing are recorded where collectability is uncertain. The adequacy of these allowances is evaluated on a quarterly basis, with consideration for a number of applicable factors, including customers' financial condition, historical customer collection experience, receivable aging, economic conditions, legal environment, and regulatory landscape.
Customer Financing
Our customer financing portfolio is comprised of two classes, contracts and notes. Contracts include extended payment terms granted to qualifying customers for periods from one to five years and are secured by the related products sold. Notes consist of development financing loans granted to select customers to assist in the funding of new or expanding gaming facilities, generally under terms of one to seven years and are secured by the developed property and/or other customer assets. Customer financing interest income is recognized based on market rates prevailing at issuance.
One of three categories of internally assigned risk grades (low, medium, and high) are assigned to each contract or note based on a number of factors, including customer size, type, financial condition, historical collection experience, accounts aging, credit agency ratings, and other industry trade reports. The high risk category includes most of our development financing loans in new markets and customers in regions with a history of currency or economic instability, such as South America. Many of our high risk loans are performing according to contract and did not warrant an allowance. Internally assigned risk grades on each contract and note are reevaluated quarterly.
When a scheduled payment is not received within 30 days of its due date, the past due customer financing is collectively evaluated for impairment (general allowance). When collectability becomes uncertain, due to events and circumstances such as bankruptcy and tax or legal issues that caused an adverse change in a customer's cash flows or financial condition, the financing is individually evaluated for impairment (specific allowance). The amount of specific allowance is determined based on an evaluation of the probability of collection. All changes in the net carrying amount of customer financing is recorded to bad debt provision or impairment.
When collection is deemed unlikely (typically at 50% allowance or greater) during our quarterly review, the contract or note is placed on nonaccrual status and interest income is recognized on a cash basis. Uncollectible contracts or notes are written off when all reasonable collection efforts are exhausted and it is determined that there is minimal chance of any kind of recovery, such as a customer property closure, bankruptcy restructuring or finalization, or other conditions that severely impacted customer ability to repay amounts owed.
Inventories (See Note 6)
Inventories are stated at the lower of cost (approximate cost determined on the first-in, first-out method) or market value. We regularly assess inventory quantities for excess and obsolescence primarily based on forecasted product demand.
Property, Plant and Equipment (See Note 7)
Property, plant and equipment is depreciated down to salvage value under the straight-line method. Maintenance and repairs are expensed as incurred and improvements are capitalized. Depreciation and asset charges related to gaming operations equipment are recorded to cost of revenues. Cash proceeds from gaming operations equipment subsequently converted to a sale are reflected in investing cash flows.
68
Goodwill and Other Intangible Assets (See Note 8)
Finite-lived intangible assets are amortized over 1 to 8 years, reflecting the expected pattern in which the economic benefits of the assets will be consumed based on projected usage and revenues. When the pattern of economic benefit is not determinable, amortization is recorded under the straight-line method. Factors considered when assigning useful lives include legal, regulatory, and contractual provisions, as well as the effects of product obsolescence, demand, competition, and other economic factors.
Goodwill and other intangible assets not subject to amortization are assessed for impairment annually or more often if there are indicators of impairment. Our portfolio of finite-lived intangibles is evaluated regularly to determine if changes in circumstances indicated the carrying values may not be recoverable or a change in remaining useful life is needed. Indicators that could trigger an impairment review include detrimental changes in legal and regulatory factors, market conditions, or operational performance. Impairment is measured as the amount by with the carrying value exceeded the FV and recognized as a component of operating income.
Other Assets
Other assets are comprised of deferred licensing rights and other expenses, investments in unconsolidated affiliates, uncertain tax positions, refundable deposits, and other miscellaneous receivables.
Deferred Licensing Rights
We pay royalty and license fees for the use of third-party trade names, celebrity likenesses, content, and other IP rights. Licensing rights and deferred fees are classified as current or non-current assets based on the estimated period of expected consumption related to forecasted distribution schedules. Amortization is generally based on the actual pattern of consumption or straight-line over the contract life when a pattern is not determinable. Certain contracts for IP rights called for payments contingent upon revenues generated. Unrealizable deferred rights are charged to cost of revenues, or to R&D if the product has not been released.
Investments in Unconsolidated Affiliates (See Note 2)
The equity method of accounting is applied to investments in unconsolidated affiliates when we exercise significant influence, but did not control financial and operating decisions. Equity earnings of our unconsolidated affiliates are included in operating income because they are integral to our business operations. Equity method losses are not material to our financial statements and presented as a component of selling, general and administrative expenses.
Strategic investments in unconsolidated affiliates are presented apart from investment securities held for a return, in non-current other assets, or current other assets if we intend to sell in less than 12 months. Investments in unconsolidated affiliates not accounted for under the equity or cost methods are recorded as available-for-sale securities at FV. Unrealized holding gains or losses are recorded in other comprehensive income, except those hedged with designated FV foreign currency derivatives that are recognized in other income (expense).
Convertible Debt Instruments (See Note 12)
The FV of our convertible debt is estimated using similar debt instruments at issuance that did not have a conversion feature and the residual FV is allocated to an equity component that represents the estimated FV of the conversion feature at issuance. This guidance is applied retrospectively to all outstanding convertible debt, with an adjustment to decrease long-term debt for the unamortized balance of the recast discount.
Derivative Instruments (See Note 11)
We use derivative financial instruments to manage certain foreign currency exchange and interest rate risk. We execute derivative financial instruments with high credit quality counterparties and diversified our positions among such counterparties to reduce our exposure to credit losses.
69
Derivative financial instruments are recognized as FV assets or liabilities. Accounting for changes in the FV of derivatives depends on the intended use and resulting designation. We are not party to leveraged derivatives and do not hold or issue financial instruments for speculative purposes. Derivative financial instruments are recorded on a net basis with counterparties with a master netting arrangement. Unless otherwise noted, derivative gains or losses, including any ineffectiveness, are recognized in other income (expense). Cash flows from derivative instruments designated as FV or cash flow hedges are classified in the same category as cash flows from the items being hedged.
Foreign Currency Hedging
We routinely use derivative financial instruments to minimize our market risk exposure related to monetary assets and liabilities denominated in nonfunctional foreign currencies. The primary business objective of our hedging program is to minimize the impact to earnings from changes in foreign exchange rates. These hedging instruments are subject to fluctuations in value that are generally offset by the value of the underlying exposures being hedged. Counterparties to our agreements are major commercial banks. These forward exchange contracts are not designated hedges.
Significant investments denominated in foreign currency are also hedged with forward exchange contracts to protect the US dollar value of the investment. As designated FV hedges, these derivative gains or losses are recorded together with the offsetting gains or losses on the change in the investment's FV attributable to foreign currency rates. Time value is excluded from effectiveness testing.
Interest Rate Hedging
We use interest rate swap derivatives to diversify our debt portfolio between fixed and variable rate instruments. The amount and term of each swap is matched with all or a portion of outstanding principal and remaining term of a specific obligation. Our swaps exchanged fixed rates for variable rates without an exchange of the notional amount upon which they are based.
These swaps are designated FV hedges because they protect against FV changes related to interest rates on a portion of fixed rate borrowings. These derivative gains or losses are recorded together with the offsetting change in the FV of the hedge-designated portion of fixed rate debt to other income (expense). Amounts receivable or payable under the swaps are net settled and recorded as a net receivable or payable with corresponding adjustments to interest expense.
Treasury Locks
We use interest rate lock derivatives to reduce exposure to fluctuations in the treasury yield component of the coupon of an anticipated debt issuance. These interest rate locks are designated cash flow hedges because they protect against variability in cash flows of future debt proceeds and coupon interest due to changes in treasury interest rates in advance of a planned debt issuance.
Changes in the FV are recorded until settled as a current other asset or liability depending on whether the contracts are in a gain or a loss position. The FV of the effective portion is reported in AOCI and the amount upon settlement is amortized over the life of the issued debt using the effective interest method. Ineffectiveness (measured as the excess change in FV over the hypothetical expected change in FV) is recorded in other non-operating expense.
Accelerated Share Repurchases (See Note 17)
Share repurchases are used to increase shareholder value and to reduce outstanding share count dilution. Negotiated accelerated share repurchase transactions are used to achieve timing, cost, and volume objectives. Designed to combine the immediate share retirement benefits of a tender offer with the market impact and pricing benefits of a disciplined daily open market share repurchase program, an ASR guarantees repurchase of a large number of shares while limiting our price risk with a cap feature. The number of shares to be repurchased is generally based on the daily VWAP of our common stock during the transaction term, less a discount, subject to a cap.
70
Shares delivered before the transaction is closed are accounted for as treasury share repurchases that reduce the outstanding common shares used to calculate EPS. The final settlement provision is recorded as a forward contract within equity at the execution date with a zero FV. Holdback amounts, if any, are recorded as APIC initially and reclassified to treasury stock as remaining shares are delivered. Upon final settlement, outstanding shares are adjusted to reflect the final number of shares delivered and additional amounts settled in cash from IGT, if any, are recorded to treasury stock.
Other Liabilities
Other liabilities are primarily comprised of uncertain tax positions, deferred revenue, customer deposits, accrued expenses, and deferred compensation.
Foreign Currency Translation and Remeasurement
For non-US dollar functional subsidiaries, assets and liabilities are translated at exchange rates in effect at the balance sheet date, and income and expense accounts at the average exchange rates for the year. Resulting currency translation adjustments are recorded to accumulated other comprehensive income. Remeasurement gains and losses resulting from transactions executed in non-functional currency are recorded in other income (expense).
Fair Value Measurements (See Note 10)
FV has been generally defined as the price that would be received to sell an asset or paid to transfer a liability (exit price), in the principal or most advantageous market, in an orderly transaction between market participants, on the measurement date. Assets and liabilities carried at FV are classified and disclosed in one of the following three levels:
1 - Quoted market prices in active markets for identical instruments
2 - Quoted market prices for similar instruments, using observable market based inputs or unobservable inputs corroborated by market data
3 - Unobservable inputs using our own assumptions when observable inputs are unavailable
Valuation methods and assumptions used to estimate FV, when quoted market prices are not available, are subject to judgment and changes in these factors can materially affect FV estimates.
Level 3 Valuation Process
Our valuation policies and procedures are determined by the Accounting Department, which ultimately reports to the Chief Financial Officer, in coordination with appropriate business asset owners and third-party valuation services when needed. Changes in FV and methods for calibration, back testing, and other testing procedures of pricing models are evaluated through analytical review by managers of the responsible Accounting Department quarterly, by the Global Controller at inception and periodically with significant changes. Material valuations are discussed with the Audit Committee at inception and periodically if changes are significant or if impairment charges are recorded. Third-party information is evaluated for consistency with the FASB ASC for FV measurement through analytical review and in-depth discussions with a variety of valuation experts.
Unobservable inputs are used only to the extent that observable inputs are not available and reflect management assumptions that cannot be corroborated with observable market data about what market participants would use in pricing the asset or liability, including assumptions about risk. Our unobservable inputs consist primarily of expected cash flows, stock price volatility, and other rates derived through extrapolation or interpolation. These inputs are developed based on the best information available, including trends deduced from available historical information and future expectations, using company specific data and market or industry published data. These inputs are validated for reasonableness by analytic comparison to other relevant valuation statistics whenever possible. Unobservable inputs depend on the facts and circumstances specific to a given asset or liability and require significant professional judgment.
71
Treasury Stock Retirement
Treasury stock is periodically retired when approved by the Board of Directors, at which time any excess of cost over par value is allocated between retained earnings and APIC. Amounts allocated to APIC are limited to the sum of both (1) APIC arising from previous retirements and net gains on sales of treasury stock of the same and (2) the pro rata portion of APIC, voluntary transfers of retained earnings, capitalization of stock dividends, and so forth, on the same issue. For this purpose, any remaining APIC applicable to issues fully retired (formal or constructive) is deemed to be applicable pro rata to shares of common stock.
RECENTLY ADOPTED ACCOUNTING STANDARDS OR UPDATES
Offsetting Assets and Liabilities
In December 2011, the FASB issued an ASU to require new disclosures associated with offsetting financial instruments and derivative instruments on the balance sheet that will enable users to evaluate the effect on an entity's financial position. In January 2013, the FASB issued an ASU to clarify the scope of disclosures about offsetting assets and liabilities. The scope of the new disclosures was narrowed to include derivatives, repurchase agreements and securities borrowing and lending that are offset or subject to an enforceable master netting arrangement or similar agreement. Both ASUs were effective for our 2014 first quarter and had no material impact on our financial statements.
RECENTLY ISSUED ACCOUNTING STANDARDS OR UPDATES--NOT YET ADOPTED
Uncertainties About An Entity's Ability To Continue As A Going Concern
In August 2014, the FASB issued an ASU to require management to evaluate whether there are conditions and events, considered in the aggregate, that raise substantial doubt about an entity's ability to continue as a going concern for the twelve months following the date that financial statements are issued. The evaluation is similar to the assessment required to be performed by auditors under auditing standards and required for both interim and annual periods. This ASU will be effective for our 2018 first quarter and is not expected to have a material impact on our financial statements.
Share-based Payments With Performance Targets Achievable After The Service Period
In June 2014, the FASB issued an ASU to clarify that performance targets in share-based payments that affect vesting and can be achieved after the requisite service period should be accounted for as a performance condition. As such, the performance condition would not be reflected in the grant date FV estimate and compensation cost would be recognized over the service period if achievement of the performance condition is probable. This ASU is effective for our 2017 first quarter, but can be adopted earlier, and is not expected to have a material impact on our financial statements. Optional transition methods include (a) prospectively to all awards granted or modified after the effective date or (b) retrospectively to all awards with performance targets that are outstanding as of the beginning of the earliest annual period presented and to all new or modified awards thereafter.
New Revenue Recognition Standard
In May 2014, the FASB issued an ASU establishing a new ASC Topic —Revenue From Contracts With Customers, which is a comprehensive new revenue recognition standard that will supersede virtually all existing revenue guidance. Under the new standard, revenue will be recognized when control of the promised goods or services is transferred to customers in an amount that reflects the consideration to which the company expects to be entitled in exchange for those goods and services. The standard creates a five-step model that will generally require companies to use more judgment and make more estimates than under current guidance when considering the terms of contracts along with all relevant facts and circumstances. These include the identification of customer contracts and separating performance obligations, the determination of transaction price that potentially includes an estimate of variable consideration, allocating the transaction price to each separate performance obligation, and recognizing revenue in line with the pattern of transfer.
72
The standard will be effective for our 2018 first quarter and early adoption is not permitted. The standard allows for adoption under either "full retrospective" in which prior periods presented are recast under the new guidance or "modified retrospective" in which it would be applied only to the most current period presented along with a cumulative-effect adjustment at the date of adoption. The standard also requires extensive additional disclosures to provide greater insight into revenues recognized and deferred, including quantitative and qualitative information about significant judgments and changes in those judgments made to determine the timing and amount of revenues recognized. We are currently evaluating the impact that this standard will have on our financial statements.
Discontinued Operations
In April 2014, the FASB issued an ASU that raises the threshold for a disposal to qualify as discontinued operations, such that it must represent a strategic shift that has or will have a major effect on an entity's operations and financial results or an acquired business that is classified as held for sale at acquisition. This ASU also requires new disclosures for both discontinued operations and disposals of individually significant components that don't qualify as discontinued operations. This ASU will be effective for our 2015 first quarter and is not expected to have a material impact on our financial statements.
Presentation Of An Unrecognized Tax Benefit When A Net Operating Loss Carryforward Exists
In July 2013, the FASB issued an ASU requiring the netting of unrecognized tax benefits against a deferred tax asset for a loss or other carryforward that would apply in settlement of the uncertain tax position. This ASU will be effective for our 2015 first quarter and is not expected to have a material impact on our financial statements.
Cumulative Translation Adjustment Upon Derecognition Of Certain Subsidiaries
In March 2013, the FASB issued an ASU requiring the release of cumulative translation adjustment into net income when an entity either sells a part or all of its investment in or no longer holds a controlling financial interest in a foreign entity. This ASU will be effective prospectively for our 2015 first quarter and is not expected to have a material impact on our financial statements.
Obligations Resulting From Joint And Several Liability Arrangements
In February 2013, the FASB issued an ASU to require new disclosures for an entity that is jointly and severally liable to measure the obligation as the sum of the amount the entity has agreed with co-obligors to pay and any additional amount it expects to pay on behalf of a co-obligor. This ASU will be effective for our 2015 first quarter and is not expected to have a material impact on our financial statements.
2. VARIABLE INTERESTS AND AFFILIATES
VARIABLE INTEREST ENTITIES
New Jersey Trusts
Regulation in New Jersey requires that annuitized WAP jackpot payments to winners be administered through an individual trust set up for each WAP system. These trusts are VIEs and IGT is the primary consolidating beneficiary, because these VIE trusts are designed for the sole purpose of administering jackpot payments for IGT WAP winners and IGT guarantees all liabilities of the trusts. The assets of these consolidated VIEs can only be used to settle trust obligations and have been segregated on our balance sheet. The consolidation of these VIEs primarily increases jackpot liabilities and related assets, as well as interest income and equivalent offsetting interest expense. Consolidated VIE trust assets and equivalent liabilities totaled $38.6 million at September 30, 2014 and $48.6 million at September 30, 2013.
73
Latin America Distributor
In March 2012, we contracted with a third party distributor in Latin America to sell IGT products. The distributor was a VIE as it was unable to finance its activities without additional support from IGT; however, the distributor was not consolidated because IGT does not have contractual or implied control. This arrangement was terminated by mutual agreement in January 2014. Revenues recognized related to this distributor totaled $2.7 million in 2014, $11.1 million in 2013, and $4.4 million in 2012. Receivables related to this distributor totaled $6.6 million at September 30, 2014.
Joint Venture
During 2014, we received $4.9 million in return of capital upon the dissolution of IGT Synergy Holding Ltd, a 50/50 joint venture between IGT and China LotSynergy Holdings, Ltd.
We held no investments at September 30, 2014 and debt securities recorded at FV of $28.8 million at September 30, 2013. See Note 10 about FV measurements. We received proceeds of $143.9 million and realized nominal gains on investments sold during 2014. There were no gains or losses in 2013 and 2012.
4. RECEIVABLES
ACCOUNTS RECEIVABLE
Reconciliation Of Allowances For Credit Losses
|
September 30,
|
2014
|
2013
|
2012
|
|||||||||
|
Beginning balance
|
$
|
22.3
|
$
|
19.1
|
$
|
17.6
|
||||||
|
Charge-offs and other adjustments
|
(2.1
|
)
|
(3.1
|
)
|
(2.8
|
)
|
||||||
|
Recoveries
|
0.1
|
0.1
|
1.1
|
|||||||||
|
Provisions
|
3.9
|
6.2
|
3.2
|
|||||||||
|
Ending balance
|
$
|
24.2
|
$
|
22.3
|
$
|
19.1
|
||||||
CUSTOMER FINANCING—CONTRACTS AND NOTES
Reconciliation Of Allowances For Credit Losses
|
September 30,
|
2014
|
2013
|
2012
|
|||||||||
|
Beginning balance
|
$
|
78.5
|
$
|
72.8
|
$
|
71.4
|
||||||
|
Charge-offs and other adjustments
|
(5.4
|
)
|
-
|
(10.4
|
)
|
|||||||
|
Recoveries
|
-
|
-
|
-
|
|||||||||
|
Provisions
|
19.0
|
5.7
|
11.8
|
|||||||||
|
Ending balance
|
$
|
92.1
|
$
|
78.5
|
$
|
72.8
|
||||||
|
Current portion
|
$
|
85.2
|
$
|
67.7
|
$
|
51.6
|
||||||
|
Non-current portion
|
6.9
|
10.8
|
21.2
|
|||||||||
Recorded Investment
|
(principal and interest due, net of deferred interest and fees (a))
|
September 30, 2014
|
September 30, 2013
|
||||||||||||||||||||||
|
Contracts
|
Notes
|
Total
|
Contracts
|
Notes
|
Total
|
|||||||||||||||||||
|
Individually evaluated for impairment
|
$
|
28.3
|
$
|
75.5
|
$
|
103.8
|
$
|
7.4
|
$
|
75.0
|
$
|
82.4
|
||||||||||||
|
Collectively evaluated for impairment
|
304.7
|
-
|
304.7
|
375.8
|
15.2
|
391.0
|
||||||||||||||||||
|
Total
|
$
|
333.0
|
$
|
75.5
|
$
|
408.5
|
$
|
383.2
|
$
|
90.2
|
$
|
473.4
|
||||||||||||
(a) Deferred interest and fees totaled $6.5 million at September 30, 2014 and $7.0 million at September 30, 2013
74
|
Allowances for Credit Losses
|
September 30, 2014
|
September 30, 2013
|
||||||||||||||||||||||
|
|
Contracts
|
Notes
|
Total
|
Contracts
|
Notes
|
Total
|
||||||||||||||||||
|
Individually evaluated for impairment
|
$
|
14.6
|
$
|
60.5
|
$
|
75.1
|
$
|
2.6
|
$
|
60.8
|
$
|
63.4
|
||||||||||||
|
Collectively evaluated for impairment
|
17.0
|
-
|
17.0
|
14.4
|
0.7
|
15.1
|
||||||||||||||||||
|
Total
|
$
|
31.6
|
$
|
60.5
|
$
|
92.1
|
$
|
17.0
|
$
|
61.5
|
$
|
78.5
|
||||||||||||
Estimated future collections
|
2015
|
2016
|
2017
|
2018
|
2019
|
Thereafter
|
Total
|
||||||||||||||||||||||
|
Contracts
|
$
|
185.9
|
$
|
86.2
|
$
|
25.5
|
$
|
3.1
|
$
|
0.7
|
$
|
-
|
$
|
301.4
|
||||||||||||||
|
Notes
|
15.0
|
-
|
-
|
-
|
-
|
-
|
15.0
|
|||||||||||||||||||||
|
$
|
200.9
|
$
|
86.2
|
$
|
25.5
|
$
|
3.1
|
$
|
0.7
|
$
|
-
|
$
|
316.4
|
|||||||||||||||
|
Recorded Investment Aging Analysis
|
September 30, 2014
|
September 30, 2013
|
||||||||||||||||||||||
|
|
Contracts
|
Notes
|
Total
|
Contracts
|
Notes
|
Total
|
||||||||||||||||||
|
Past Due
|
||||||||||||||||||||||||
|
1-29 days
|
$
|
6.9
|
$
|
1.3
|
$
|
8.2
|
$
|
18.4
|
$
|
1.5
|
$
|
19.9
|
||||||||||||
|
30-59 days
|
4.2
|
1.3
|
5.5
|
5.1
|
1.4
|
6.5
|
||||||||||||||||||
|
60-89 days
|
3.6
|
1.2
|
4.8
|
4.5
|
1.3
|
5.8
|
||||||||||||||||||
|
Over 90 days
|
23.7
|
66.7
|
90.4
|
16.1
|
54.9
|
71.0
|
||||||||||||||||||
|
Total (1)
|
$
|
38.4
|
$
|
70.5
|
$
|
108.9
|
$
|
44.1
|
$
|
59.1
|
$
|
103.2
|
||||||||||||
|
|
||||||||||||||||||||||||
|
Amount not past due (2)
|
294.6
|
5.0
|
299.6
|
339.1
|
31.1
|
370.2
|
||||||||||||||||||
|
Grand total
|
$
|
333.0
|
$
|
75.5
|
$
|
408.5
|
$
|
383.2
|
$
|
90.2
|
$
|
473.4
|
||||||||||||
|
(1)Alabama impaired note included in total past due
|
$
|
70.0
|
$
|
70.0
|
$
|
56.2
|
$
|
56.2
|
||||||||||||||||
|
(2)Alabama impaired note included in amount not past due
|
5.0
|
5.0
|
18.8
|
18.8
|
||||||||||||||||||||
|
|
||||||||||||||||||||||||
|
Over 90 days, accruing interest
|
$
|
0.6
|
$
|
-
|
$
|
0.6
|
$
|
-
|
$
|
1.3
|
$
|
1.3
|
||||||||||||
|
Nonaccrual status
|
21.9
|
75.5
|
97.4
|
13.5
|
76.2
|
89.7
|
||||||||||||||||||
Recorded Investment by Credit Quality Indicator
|
(Using Credit Profile by Internally Assigned Risk Grade)
|
September 30, 2014
|
September 30, 2013
|
||||||||||||||||||||||
|
Contracts
|
Notes
|
Total
|
Contracts
|
Notes
|
Total
|
|||||||||||||||||||
|
Low
|
$
|
138.9
|
$
|
-
|
$
|
138.9
|
$
|
126.1
|
$
|
-
|
$
|
126.1
|
||||||||||||
|
Medium
|
82.6
|
-
|
82.6
|
100.2
|
0.1
|
100.3
|
||||||||||||||||||
|
High (3)
|
111.5
|
75.5
|
187.0
|
156.9
|
90.1
|
247.0
|
||||||||||||||||||
|
Total
|
$
|
333.0
|
$
|
75.5
|
$
|
408.5
|
$
|
383.2
|
$
|
90.2
|
$
|
473.4
|
||||||||||||
|
(3) Alabama impaired note included
|
$
|
75.0
|
$
|
75.0
|
$
|
75.0
|
$
|
75.0
|
||||||||||||||||
|
Impaired Loans
|
September 30, 2014
|
September 30, 2013
|
||||||||||||||||||||||
|
|
Contracts
|
Notes
|
Total
|
Contracts
|
Notes
|
Total
|
||||||||||||||||||
|
Recorded investment
|
$
|
28.3
|
$
|
75.5
|
$
|
103.8
|
$
|
5.7
|
$
|
75.0
|
$
|
80.7
|
||||||||||||
|
Unpaid principal face
|
28.7
|
75.5
|
104.2
|
5.8
|
75.0
|
80.8
|
||||||||||||||||||
|
Related allowance
|
14.6
|
60.5
|
75.1
|
2.6
|
60.8
|
63.4
|
||||||||||||||||||
|
Average recorded investment
|
17.0
|
75.3
|
92.3
|
4.1
|
75.0
|
79.1
|
||||||||||||||||||
Interest income recognized on impaired contracts, none of which was cash basis, totaled $1.1 million in 2014 and $0.5 million in 2013.
75
5. CONCENTRATIONS OF CREDIT RISK
|
Nevada
|
10%
|
|
Argentina
|
11%
|
|
Illinois
|
6%
|
|
Europe
|
8%
|
|
Louisiana
|
6%
|
|
Mexico
|
8%
|
|
California
|
5%
|
|
Australia
|
5%
|
|
Other (less than 4% individually)
|
29%
|
|
Other (less than 4% individually)
|
12%
|
|
North America
|
56%
|
|
International
|
44%
|
6. INVENTORIES
|
September 30,
|
2014
|
2013
|
||||||
|
Raw materials
|
$
|
48.9
|
$
|
51.2
|
||||
|
Work-in-process
|
0.8
|
2.7
|
||||||
|
Finished goods
|
21.7
|
36.2
|
||||||
|
Total
|
$
|
71.4
|
$
|
90.1
|
||||
7. PROPERTY, PLANT AND EQUIPMENT
|
September 30,
|
2014
|
2013
|
Useful
Lives
|
|||||||||
|
(years)
|
||||||||||||
|
Land
|
$
|
52.1
|
$
|
61.2
|
||||||||
|
Buildings
|
232.4
|
231.3
|
40
|
|||||||||
|
Leasehold improvements
|
15.2
|
16.4
|
1-10
|
|||||||||
|
Machinery, furniture and equipment
|
286.8
|
309.0
|
3-10
|
|||||||||
|
Gaming operations equipment
|
713.0
|
785.9
|
2-5
|
|||||||||
|
Total
|
1,299.5
|
1,403.8
|
||||||||||
|
Less accumulated depreciation
|
(886.8
|
)
|
(919.9
|
)
|
||||||||
|
Property, plant and equipment, net
|
$
|
412.7
|
$
|
483.9
|
||||||||
Depreciation expense totaled $134.6 million in 2014, $168.5 million in 2013, and $177.4 million in 2012.
8. GOODWILL AND OTHER INTANGIBLES
GOODWILL
|
Reconciliation By Segment
|
North America
|
International
|
Total
|
|||||||||
|
2013
|
||||||||||||
|
Beginning balance
|
$
|
1,275.6
|
$
|
194.1
|
$
|
1,469.7
|
||||||
|
Purchase price adjustment
|
(0.2
|
)
|
-
|
(0.2
|
)
|
|||||||
|
Foreign currency
|
-
|
1.6
|
1.6
|
|||||||||
|
Ending balance
|
1,275.4
|
195.7
|
1,471.1
|
|||||||||
|
2014
|
||||||||||||
|
Acquisitions (See Note 21)
|
0.5
|
-
|
0.5
|
|||||||||
|
Foreign currency
|
-
|
(10.0
|
)
|
(10.0
|
)
|
|||||||
|
Ending balance
|
$
|
1,275.9
|
$
|
185.7
|
$
|
1,461.6
|
||||||
76
|
Balances
|
September 30, 2014
|
September 30, 2013
|
||||||||||||||||||||||
|
Accumulated
|
Accumulated
|
|||||||||||||||||||||||
|
Cost
|
Amortization
|
Net
|
Cost
|
Amortization
|
Net
|
|||||||||||||||||||
|
Patents
|
$
|
355.8
|
$
|
334.5
|
$
|
21.3
|
$
|
376.1
|
$
|
334.1
|
$
|
42.0
|
||||||||||||
|
Developed technology
|
131.0
|
94.7
|
36.3
|
129.1
|
79.9
|
49.2
|
||||||||||||||||||
|
Contracts
|
20.1
|
19.3
|
0.8
|
20.1
|
18.6
|
1.5
|
||||||||||||||||||
|
Reacquired rights
|
13.4
|
5.1
|
8.3
|
14.7
|
5.2
|
9.5
|
||||||||||||||||||
|
Customer relationships
|
61.2
|
52.0
|
9.2
|
61.2
|
40.1
|
21.1
|
||||||||||||||||||
|
Trademarks
|
12.5
|
7.5
|
5.0
|
12.5
|
5.2
|
7.3
|
||||||||||||||||||
|
Total
|
$
|
594.0
|
$
|
513.1
|
$
|
80.9
|
$
|
613.7
|
$
|
483.1
|
$
|
130.6
|
||||||||||||
Additions for the year ended September 30, 2014 included $2.8 million of patents with a weighted average life of 5 years, as well as $1.9 million of developed technology with a weighted average life of 5 years from the Strategy9 business acquisition described in Note 21.
Aggregate Amortization
|
Future Annual Estimates
|
|||||||||||||||||||||||||||||||
|
2014
|
2013
|
2012
|
2015
|
2016
|
2017
|
2018
|
2019
|
||||||||||||||||||||||||
|
$
|
54.4
|
$
|
63.1
|
$
|
62.9
|
$
|
37.5
|
$
|
20.9
|
$
|
11.1
|
$
|
6.0
|
$
|
2.1
|
||||||||||||||||
9. JACKPOT INVESTMENTS AND LIABILITIES
See Note 10 for information about related carrying values, FVs, and unrealized gains and losses.
|
JACKPOT ANNUITY INVESTMENTS
|
Years
|
|||||||||||||||||||
|
1
|
2 - 5
|
6 - 10
|
Thereafter
|
Total
|
||||||||||||||||
|
Maturities through 2039 with interest accretion
|
$
|
53.0
|
$
|
154.0
|
$
|
103.5
|
$
|
56.4
|
$
|
366.9
|
||||||||||
JACKPOT LIABILITIES
|
September 30,
|
2014
|
2013
|
||||||
|
Payments due previous winners
|
$
|
377.6
|
$
|
422.0
|
||||
|
Payments due future winners
|
78.9
|
94.3
|
||||||
|
Unamortized discounts
|
(77.4
|
)
|
(91.3
|
)
|
||||
|
Total jackpot liabilities
|
$
|
379.1
|
$
|
425.0
|
||||
|
Future Jackpot Payments Due
|
2015
|
2016
|
2017
|
2018
|
2019
|
Thereafter
|
Total
|
|||||||||||||||||||||
|
Previous winners
|
$
|
60.5
|
$
|
47.9
|
$
|
41.0
|
$
|
34.7
|
$
|
30.8
|
$
|
162.7
|
$
|
377.6
|
||||||||||||||
|
Future winners
|
57.0
|
7.6
|
1.9
|
0.7
|
0.7
|
11.0
|
78.9
|
|||||||||||||||||||||
77
10. FAIR VALUE MEASUREMENTS
FINANCIAL ASSETS (LIABILITIES) CARRIED AT FAIR VALUE
|
Fair
Value
|
Level 1
|
Level 2
|
Level 3
|
|||||||||||||
|
September 30, 2014
|
||||||||||||||||
|
Money market funds
|
$
|
65.8
|
$
|
65.8
|
$
|
-
|
$
|
-
|
||||||||
|
Derivative assets
|
65.2
|
-
|
65.2
|
-
|
||||||||||||
|
Derivative liabilities
|
(58.1
|
)
|
-
|
(58.1
|
)
|
-
|
||||||||||
|
Acquisition contingent consideration payable
|
(58.2
|
)
|
-
|
-
|
(58.2
|
)
|
||||||||||
|
September 30, 2013
|
||||||||||||||||
|
Money market funds
|
$
|
168.0
|
$
|
168.0
|
$
|
-
|
$
|
-
|
||||||||
|
Investment securities
|
28.8
|
-
|
28.8
|
-
|
||||||||||||
|
Derivative assets
|
74.6
|
-
|
74.6
|
-
|
||||||||||||
|
Derivative liabilities
|
(72.2
|
)
|
-
|
(72.2
|
)
|
-
|
||||||||||
|
Acquisition contingent consideration payable
|
(106.4
|
)
|
-
|
-
|
(106.4
|
)
|
||||||||||
Valuation Techniques and Balance Sheet Presentation
Money market funds were primarily money market securities valued based on quoted market prices in active markets.
Investment securities were commercial paper debt securities valued based on quoted market prices for similar instruments, using observable market based inputs. See Note 3.
Derivative assets and liabilities were valued using quoted forward pricing from bank counterparties, LIBOR credit default swap rates for non-performance risk, forward yields for the 10-year treasury sourced from Bloomberg, and net settlement amounts where appropriate. These are presented primarily as components of other assets, other liabilities, notes payable, and AOCI. See Note 11.
Acquisition contingent earn-out payable related to the estimated FV of consideration due for the business acquisitions of DoubleDown and Strategy9 that is dependent on whether the businesses reach certain earnings targets. A DCF model is used to determine the FV based on the expected payments and probability-weighted earnings projections. Changes in projections and/or probabilities are the most significant assumptions and result in directionally similar changes in FV. Changes in the risk-adjusted discount rate cause a directionally opposite change in FV. Changes in FV are recorded to earnings within contingent acquisition-related costs and the payable is presented as a component of other liabilities, current and noncurrent depending on the expected payment timing.
To derive the estimated FV at September 30, 2014 for DoubleDown earn-out, we applied probability rates of 10% - 80% to various scenarios along with a discount rate of 18 %. The 2014 accretion was primarily related to the time-value of money. The payable balance totaled $57.6 million current at September 30, 2014 versus $57.6 million current and $48.8 million noncurrent at September 30, 2013. To derive the estimated FV of $0.6 million noncurrent at September 30, 2014 for Strategy9 earn-out, we applied probability rates of 10% - 50% to future scenarios along with a discount rate of 10 %. See Note 21.
Reconciliation of Items Carried at Fair Value Using Significant Unobservable Inputs (Level 3)
|
Acquisition Contingent Consideration Payable
|
Investments in
Unconsolidated
Affiliates
|
|||||||||||||||
|
Years Ended September 30,
|
2014
|
2013
|
2012
|
2012
|
||||||||||||
|
Beginning balance
|
$
|
(106.4
|
)
|
$
|
(116.4
|
)
|
$
|
-
|
$
|
9.3
|
||||||
|
Gain (loss) included in:
|
||||||||||||||||
|
Other income (expense) - other
|
-
|
-
|
-
|
(0.7
|
)
|
|||||||||||
|
Issuances
|
(0.6
|
)
|
-
|
(88.9
|
)
|
-
|
||||||||||
|
Accretion (interest and FV adjustment)
|
(11.2
|
)
|
(35.0
|
)
|
(27.5
|
)
|
0.6
|
|||||||||
|
Payments
|
60.0
|
45.0
|
-
|
(9.2
|
)
|
|||||||||||
|
Ending balance
|
$
|
(58.2
|
)
|
$
|
(106.4
|
)
|
$
|
(116.4
|
)
|
$
|
-
|
|||||
78
FINANCIAL ASSETS (LIABILITIES) NOT CARRIED AT FAIR VALUE
|
Carrying
Value
|
Fair
Value
|
Level 1
|
Level 2
|
Level 3
|
Unrealized
Gain (Loss)
|
|||||||||||||||||||
|
September 30, 2014
|
||||||||||||||||||||||||
|
Jackpot investments
|
$
|
289.7
|
$
|
323.0
|
$
|
323.0
|
$
|
-
|
$
|
-
|
$
|
33.3
|
||||||||||||
|
Contracts & notes receivable
|
316.4
|
311.8
|
-
|
-
|
311.8
|
(4.6
|
)
|
|||||||||||||||||
|
Jackpot liabilities
|
(379.1
|
)
|
(369.6
|
)
|
-
|
-
|
(369.6
|
)
|
9.5
|
|||||||||||||||
|
Debt
|
(1,820.8
|
)
|
(1,923.7
|
)
|
(1,402.3
|
)
|
-
|
(521.4
|
)
|
(102.9
|
)
|
|||||||||||||
|
September 30, 2013
|
||||||||||||||||||||||||
|
Jackpot investments
|
$
|
325.1
|
$
|
366.3
|
$
|
366.3
|
$
|
-
|
$
|
-
|
$
|
41.2
|
||||||||||||
|
Contracts & notes receivable
|
394.9
|
388.3
|
-
|
-
|
388.3
|
(6.6
|
)
|
|||||||||||||||||
|
Jackpot liabilities
|
(425.0
|
)
|
(425.2
|
)
|
-
|
-
|
(425.2
|
)
|
(0.2
|
)
|
||||||||||||||
|
Debt
|
(2,121.9
|
)
|
(2,346.6
|
)
|
(2,346.6
|
)
|
-
|
-
|
(224.7
|
)
|
||||||||||||||
Valuation Techniques and Balance Sheet Presentation
Jackpot investments were valued based on quoted market prices. See Note 9.
Contracts and notes receivable were valued using DCF, incorporating expected payments and market interest rates relative to the credit risk of each customer (low 7.5 %, medium 8.0 %, high 9.5 % - 11.00 %). Credit risk is determined on a number of factors, including customer size, type, financial condition, historical collection experience, account aging, and credit ratings derived from credit reporting agencies and other industry trade reports. Contracts are secured by the underlying assets sold and notes are secured by the developed property and/or other assets. The high risk category includes most of our development financing loans in new markets and customers in regions with a history of currency or economic instability, such as Latin America. See Notes 4 and 5.
Jackpot liabilities were valued using DCF, incorporating expected future payment timing, estimated funding rates based on the treasury yield curve, and IGT's nonperformance credit risk. Expected annuity payments over 1-25 years (average 10 years) were discounted using the 10-year treasury yield curve rate (2.52%) for the estimated funding rate and the 10-year credit default swap rate (2.47%) for nonperformance risk. The present value (carrying value) of the expected lump sum payments were discounted using the 1-year treasury yield curve rate (.09%) with the 1-year credit default swap rate (.35%) for the current amounts and the 2-year treasury yield curve rate (.57%) with the 2-year credit default swap rate (.55%) for noncurrent amounts. Significant increases (decreases) in any of these inputs in isolation would result in a lower (higher) FV measurement. Generally, changes in the estimated funding rates do not correlate with changes in nonperformance credit risk. See Note 9.
Debt is predominantly level 1 and valued using quoted market prices or dealer quotes for the identical financial instrument when traded as an asset in an active market. Outstanding borrowings under our revolving credit facility are level 3 and FV is determined using DCF of expected payments at the current market rate of 1.425%. Carrying values in the table excluded swap adjustments and equity components of convertible debt. See Note 12.
79
11. DERIVATIVES INSTRUMENTS
FOREIGN CURRENCY HEDGING
The notional amount of foreign currency contracts hedging our exposure related to monetary assets and liabilities denominated in nonfunctional currency totaled $58.7 million at September 30, 2014 and $91.9 million at September 30, 2013.
INTEREST RATE HEDGING
In conjunction with our 7.5% bonds issued in June 2009, we executed $250 million notional value of interest rate swaps that exchange 7.5% fixed interest payments for variable rate interest payments, at one-month LIBOR plus 342 bps, reset two business days before the 15th of each month. In April 2011, we additionally executed $250 million notional value interest rate swaps that exchange the remaining fixed interest payments on these bonds for variable rate interest payments, based on six-month LIBOR plus 409 bps, reset in arrears two business days before June 15 and December 15 each year. All of these swaps terminate on June 15, 2019.
In conjunction with our 5.5% bonds issued in June 2010, we executed $300 million notional value of interest rate swaps that terminate on June 15, 2020. These swaps effectively exchange 5.5% fixed interest payments for variable rate interest payments, based on the six-month LIBOR plus 186 bps, reset in arrears two business days before June 15 and December 15 each year. These swaps terminate on June 15, 2020.
Our interest rate swaps are designated FV hedges against changes in the FV of a portion of their related bonds. Net amounts receivable or payable under our swaps settle semiannually on June 15 and December 15. Our assessments have determined that these interest rate swaps are highly effective.
PRESENTATION OF DERIVATIVE AMOUNTS
All derivatives are recorded gross, except counter-party netting of our swaps' interest receivable and payable.
|
Balance Sheet Location and Fair Value
|
September 30, 2014
|
September 30, 2013
|
||||||||||||||
|
|
Assets
|
Liabilities
|
Assets
|
Liabilities
|
||||||||||||
|
Non-designated Hedges: Foreign Currency Contracts
|
||||||||||||||||
|
Other assets and deferred costs (current)
|
$
|
2.1
|
$
|
-
|
$
|
0.5
|
$
|
-
|
||||||||
|
Other accrued liabilities
|
-
|
0.3
|
-
|
1.1
|
||||||||||||
|
|
||||||||||||||||
|
Designated Hedges: Interest Rate Swaps
|
||||||||||||||||
|
Other assets and deferred costs (noncurrent)
|
55.4
|
-
|
66.5
|
-
|
||||||||||||
|
Long-term debt
|
-
|
57.8
|
-
|
71.1
|
||||||||||||
|
Gross Derivatives
|
57.5
|
58.1
|
67.0
|
72.2
|
||||||||||||
|
|
||||||||||||||||
|
Counter-party Netting: Swaps Interest Receivable and Payable
|
||||||||||||||||
|
Accounts receivable
|
||||||||||||||||
|
Due from counter-party
|
15.5
|
-
|
15.6
|
-
|
||||||||||||
|
Due to counter-party
|
(7.8
|
)
|
-
|
(8.0
|
)
|
-
|
||||||||||
|
|
||||||||||||||||
|
Net Derivatives
|
$
|
65.2
|
$
|
58.1
|
$
|
74.6
|
$
|
72.2
|
||||||||
Income Statement Location and Income (expense)
|
Years Ended September 30,
|
2014
|
2013
|
2012
|
|||||||||
|
Non-designated Hedges: Foreign Currency Contracts
|
||||||||||||
|
Other income (expense)
|
$
|
2.6
|
$
|
(0.5
|
)
|
$
|
0.5
|
|||||
|
|
||||||||||||
|
Designated Hedges: Interest Rate Swaps
|
||||||||||||
|
Effectiveness - Interest expense
|
$
|
27.0
|
$
|
25.9
|
$
|
24.5
|
||||||
|
Ineffectiveness - Other income (expense)
|
2.2
|
(3.2
|
)
|
1.5
|
||||||||
80
12. CREDIT FACILITIES AND INDEBTEDNESS
|
September 30,
|
2014
|
2013
|
||||||
|
Credit facility due April 2018
|
$
|
525.0
|
$
|
-
|
||||
|
3.25% convertible notes due May 2014
|
-
|
850.0
|
||||||
|
7.5% bonds due June 2019
|
500.0
|
500.0
|
||||||
|
5.5% bonds due June 2020
|
300.0
|
300.0
|
||||||
|
5.35% bonds due October 2023
|
500.0
|
500.0
|
||||||
|
Total principal debt obligations (at face)
|
1,825.0
|
2,150.0
|
||||||
|
Discounts:
|
||||||||
|
3.25% convertible notes
|
-
|
(23.3
|
)
|
|||||
|
7.5% bonds
|
(1.5
|
)
|
(1.8
|
)
|
||||
|
5.5% bonds
|
(0.8
|
)
|
(0.9
|
)
|
||||
|
5.35% bonds
|
(1.9
|
)
|
(2.1
|
)
|
||||
|
Swap FV adjustments (See Note 11):
|
||||||||
|
7.5% bonds
|
38.5
|
48.4
|
||||||
|
5.5% bonds
|
19.3
|
22.6
|
||||||
|
Total outstanding debt recorded, net
|
$
|
1,878.6
|
$
|
2,192.9
|
||||
|
2015
|
2016
|
2017
|
2018
|
2019
|
Thereafter
|
Total
|
||||||||||||||||||||||
|
Expected principal payments
|
$
|
-
|
$
|
-
|
$
|
-
|
$
|
525.0
|
$
|
500.0
|
$
|
800.0
|
$
|
1,825.0
|
||||||||||||||
IGT was compliant with all covenants and no embedded features required bifurcation at September 30, 2014.
REVOLVING CREDIT FACILITY
At September 30, 2014, $525.0 million was outstanding under our $1.0 billion revolving credit facility, amended and restated on April 23, 2013, $454.4 million was available, and $20.6 million was reserved for letters of credit, performance bonds, and bank guarantees. Of the $1.0 billion line, up to $50.0 million is available for letters of credit and up to $50.0 million is available for swing line borrowing. Subject to lender consent, the facility may be increased by $250.0 million at any time up to 60 days prior to maturity. All amounts outstanding will be immediately due and payable at maturity on April 23, 2018, which may be extended upon request for one year on the second closing date anniversary (April 23, 2015), presuming no default exists.
Interest rates and facility fees are based on our public debt ratings or net funded debt to EBITDA ratio (debt minus any unrestricted cash and investments in excess of $150.0 million), whichever is more favorable to IGT. At September 30, 2014, our pricing level was Baa2/BBB-, resulting in an interest rate of LIBOR plus 100 bps and a facility fee of 17.5 bps. Additional offering costs of $3.3 million were deferred along with previous credit facility deferred offering costs of $8.2 million, which together are amortizing to interest expense over the new 5-year term.
Our credit facility carries no limitations on share repurchases or dividend payments (see Note 1 about limitations related to the GTECH merger) provided no default exists and includes the following covenants (all terms as defined in the facility document):
|
|
●
|
a minimum ratio of 3.0 adjusted EBITDA to interest expense (interest coverage ratio)
|
|
|
|
●
|
a maximum ratio of 3.5 for net funded debt to adjusted EBITDA (net funded debt leverage ratio)
|
|
|
|
●
|
certain restrictions on our ability to:
|
|
|
|
|
■
|
pledge the securities of our subsidiaries
|
|
|
|
■
|
permit our subsidiaries to incur or guaranty additional debt, or enter into swap agreements
|
|
|
|
■
|
incur liens
|
|
|
|
■
|
merge with or acquire other companies, liquidate or dissolve
|
|
|
|
■
|
sell, transfer, lease or dispose of all or substantially all assets
|
|
|
|
■
|
change the nature of our business
|
81
The facility specifies certain events of default (some of which are subject to applicable grace or cure periods), including failure to make timely principal and interest payments or satisfy the covenants. An event of default, if not cured, could cause the entire outstanding borrowings under the credit facility to become immediately due and payable, lenders may cease making loans and/or terminate commitments, and cross-default provisions may be triggered in other debt issuances.
3.25% CONVERTIBLE NOTES
These notes were redeemed for cash at maturity on May 1, 2014. All hedges expired at maturity and the warrants expired on various dates through November 21, 2014. The elements of interest expense are reflected in the table below.
|
2014
|
2013
|
2012
|
||||||||||
|
Contractual interest expense
|
$
|
16.4
|
$
|
27.5
|
$
|
27.5
|
||||||
|
Discount amortization
|
23.4
|
36.7
|
33.4
|
|||||||||
BONDS OUTSTANDING
7.5% Bonds Due June 2019
On June 15, 2009, we issued $500.0 million aggregate principal amount of 7.50% bonds due 2019, under our March 2009 shelf registration statement and June 11, 2009 prospectus supplement, to certain underwriters pursuant to an underwriting agreement dated June 10, 2009. We received net proceeds of $493.3 million after a discount of $2.7 million and deferred offering costs of $4.0 million, which together are amortizing to interest expense over the 10-year term. Interest is payable semiannually on June 15 and December 15, beginning December 15, 2009 and the bonds mature on June 15, 2019. We used the net proceeds from these bonds to fund the redemption of a portion of our Debentures put to us in December 2009.
5.5% Bonds Due June 2020
On June 8, 2010, we issued $300.0 million aggregate principal amount of 5.50% bonds due 2020, under our March 2009 shelf registration statement and June 3, 2010 prospectus supplement pursuant to an underwriting agreement dated June 3, 2010. We received net proceeds of $295.7 million after a discount of $1.3 million and deferred offering costs of approximately $3.0 million, which together are amortizing to interest expense over the 10-year term. Interest is payable semiannually on June 15 and December 15, beginning December 15, 2010 and the bonds mature on June 15, 2020. Net proceeds from these bonds were used to reduce outstanding amounts under our domestic credit facility.
5.35% Bonds Due October 2023
On September 19, 2013, we issued $500.0 million aggregate principal amount of 5.35% bonds due 2023, under our March 2012 shelf registration statement, March 29, 2012 prospectus, and September 13, 2013 prospectus supplement pursuant to an underwriting agreement dated September 12, 2013. We received net proceeds of $493.9 million after a discount of $2.1 million and deferred offering costs of $4.0 million, which together are amortizing to interest expense over the 10-year term. Interest is payable semiannually on April 15 and October 15 and the bonds mature on October 15, 2023. Net proceeds from these bonds were used to fund the redemption of our convertible notes in May 2014 and for general corporate purposes.
Treasury Locks
During 2013, we executed interest rate lock transactions to reduce exposure to fluctuations in treasury interest rates in anticipation of the 5.35% Bonds issued on September 19, 2013. These transactions fixed the treasury yield component of the coupon rate on an aggregate notional amount of $250 million and matured on August 15, 2013 and September 19, 2013. There was no ineffectiveness. The total gain of $12.6 million was recorded to AOCI, net of $4.6 million tax, and is being amortized over the 10-year term of the 5.35% Bonds as a yield adjustment to reduce interest expense.
82
Additional Bond Terms
Each of our bonds are general unsecured unsubordinated obligations of IGT, ranking equal with all existing and future unsecured and unsubordinated obligations. The bonds rank junior to all existing and future liabilities, including trade payables, of our subsidiaries. IGT may redeem the bonds earlier than the maturity date by paying the holders 100% of the principal amount plus a make-whole redemption premium as described further in each indenture.
Each of our bonds contain covenants, which may in certain circumstances restrict our ability to incur additional debt, limit our ability to enter into sale and leaseback transactions, or restrict our ability to sell, transfer, lease or dispose of substantially all assets. Further, each of the bonds specify certain events of default, some of which are subject to applicable grace or cure periods, including the failure to make timely principal and interest payments or satisfy the covenants. Upon the occurrence of an event of default under the bonds, outstanding amounts may become due and payable immediately. Except for the 7.5% bondholder amendment described below, if a change of control repurchase event occurs, bondholders may require us to purchase all or a portion of their bonds for cash.
Certain interest rate derivatives (swaps and treasury locks) have been executed related to our bonds and are further described in Notes 11 and 12.
Bondholder Amendments
On October 20, 2014, the requisite consents were received on our 7.5% bonds solicited on October 8, 2014 in connection with the proposed GTECH merger (see Note 1). A cash fee of $2.50 per bond was offered to the 7.5% bondholders who consented to the following amendments: (1) exclude the merger of IGT and GTECH from the definition of "Change of Control"; and (2) following the merger, apply the definition of "Change of Control" to the post-merger parent of IGT (Holdco), and permit Holdco to furnish the financial reports that are currently required to be furnished by IGT. IGT will record an increase to deferred offering costs and APIC for the consent fees and related professional fees collectively totaling approximately $1.8 million, which will be paid by GTECH.
To assure that all IGT bondholders will generally benefit equally and ratably from at least the same subsidiary guarantees afforded to other Holdco debt securities, all three series of IGT bonds (7.5%, 5.5%, and 5.35%) that remain outstanding following the GTECH merger will be unconditionally guaranteed by Holdco on a pari passu basis (equal ranking).
SHELF REGISTRATION
In March 2012, we filed a shelf registration statement with the SEC which allows us to issue debt securities, in one or more series, from time to time in amounts, at prices and on terms determined at the time of offering. See Note 1 about limitations related to the proposed GTECH merger.
13. CONTINGENCIES
LEGAL PROCEEDINGS
From time to time, in the normal course of its operations, the Company is a party to litigation matters and claims. Litigation can be expensive and disruptive to normal business operations. Moreover, the results of complex legal proceedings are difficult to predict and the Company's view of these matters may change in the future as the litigation and events related thereto unfold. The Company expenses legal fees as incurred. The Company records a provision for contingent losses when it is both probable that a liability will be incurred and the amount or range of the loss can be reasonably estimated. With respect to litigation and other legal proceedings where the Company has determined that a loss is reasonably possible, the Company is unable to estimate the amount or range of reasonably possible loss in excess of amounts already accrued, due to the inherent difficulty of predicting the outcome of and uncertainties regarding such litigation and legal proceedings. An unfavorable outcome to any legal matter, if material, could have an adverse effect on the Company's operations or its financial position, liquidity or results of operations.
83
Atlantic Lotteries
On April 26, 2012, representatives of a purported class of persons allegedly harmed by VLT gaming filed an action in the Supreme Court of New Foundland and Labrador. Atlantic Lottery Corporation has impleaded VLC, Inc., IGT-Canada, Inc., International Game Technology and other third party defendants seeking indemnification for any judgment recovered against Atlantic Lottery Corporation in the main action. Plaintiffs filed a motion for class action certification on September 17, 2012. The Court has decided to address the motion for certification in two phases. Under Phase 1, the Court was to determine whether the Plaintiffs have pleaded a cause of action. Hearings on Phase 1 were held on June 6 and 7, 2013. In Phase 1 of the class action certification application, the Court ruled that the claim discloses arguable causes of action. Phase 2 of the certification application will determine whether there are sufficient common issues raised in the claim and whether a class proceeding is the preferable procedure.
Shareholder Derivative Action
On April 8, 2011, the Company was nominally sued in a derivative complaint filed in the US District Court for the District of Nevada, captioned Arduini v. Hart, et al., Case No. 3:11-cv-00255. Plaintiff purportedly brought this action on behalf of the Company. The complaint asserts claims against various current and former officers and directors of the Company, for breaches of fiduciary duties, unjust enrichment, abuse of control, gross mismanagement, waste of corporate assets, and contribution and indemnification. The complaint sought an unspecified amount of damages. A motion to dismiss was filed. On March 14, 2012, defendants' motion to dismiss the action was granted. On April 3, 2012, the plaintiff appealed to the US Court of Appeals for the Ninth Circuit. Oral arguments were made to the Ninth Circuit on April 10, 2014.
Lightning Box Games
On July 30, 2013, IGT was sued in US District Court for the Northern District of Illinois for patent infringement by Lightning Box Games, captioned Lightning Box Games PTY LTD. v. International Game Technology and Caesars Entertainment Corporation, Case No. 13-cv-5423. LBG alleged infringement of two related patents for "Electronic System for Playing of Reel-Type Games," and specifically accused IGT's MultiPLAY video slot machines of infringing one or more claims of the patents. LBG was seeking, among other items, preliminary and permanent injunctive relief, monetary damages resulting from the infringing conduct (including pre- and post-judgment interest), and court costs. On April 23, 2014, IGT and LBG executed a Settlement Agreement. On April 29, 2014, the Court dismissed the case with prejudice.
Mark E Pollack Arbitration
In January 2013, IGT notified Mark E Pollack that it was terminating eight agreements between IGT and Mr. Pollack relating to services provided by Mr. Pollack (e.g., providing ideas for gaming machines and initiating and arranging meetings with various artists and intellectual property owners). Mr. Pollack disagreed that IGT could terminate the agreements and the parties entered mediation pursuant to the dispute resolution provisions in the respective agreements. On October 22, 2013, the parties filed arbitration demands submitting the dispute to arbitration before Judicial Arbitration Mediation Services (JAMS), captioned International Game Technology v. Pollack, Case No. 1260002648 and Pollack v. International Game Technology, Case No. 1260002648, in which Mr. Pollack requested unspecified monetary damages and injunctive relief. An arbitrator was selected, and the arbitration hearing date was scheduled for November 3, 2014. On September 29, 2014, IGT and Mark E Pollack executed a Settlement Agreement and Mutual Release, the terms of which are confidential. IGT and Mark E Pollack jointly submitted a Stipulated Dismissal requesting JAMS to enter a Consent Order dismissing, with prejudice, all claims, affirmative defenses and counterclaims in the arbitration.
84
WMS Gaming, Inc.
2013 Northern District of Illinois
On July 2, 2013, IGT was sued by WMS Gaming, Inc. in US District Court for the Northern District of Illinois, captioned WMS Gaming, Inc. v. IGT, Case No. 1:13-cv-4788. The suit relates to a contract between the parties. WMS alleges that IGT breached the contract, anticipatorily repudiated the contract, breached the implied covenant of good faith and fair dealing, and violated the Nevada Unfair Trade Practices Act. WMS sought a temporary restraining order, which was denied. WMS is seeking, among other things, declaratory judgment, specific performance, injunctive relief, unspecified monetary damages, and attorneys' fees and costs. IGT intends to vigorously defend against the claims asserted in this lawsuit. On March 25, 2014 the Court stayed this action pending resolution of the related arbitration between IGT and WMS. On June 13, 2014, IGT, Scientific Games Corporation and WMS Gaming, Inc. entered into a Master Settlement Agreement and IGT and Scientific Games Corporation entered into a TITO Game Manufacturer License Agreement. This action was dismissed with prejudice on June 23, 2014.
2013 Arbitration
Related to foregoing lawsuit, on September 10, 2013 IGT filed an arbitration with the American Arbitration Association against WMS, captioned IGT v. WMS Gaming, Inc., No. 79 517 112 13. IGT and WMS have a license agreement for TITO enabled gaming machines. IGT alleges WMS failed to pay license fees owed on certain products covered by the agreement. IGT is seeking a judgment that WMS must pay license fees on certain products and monetary damages of $50.0 million resulting from WMS's failure to pay license fees on those products. On June 13, 2014, IGT, Scientific Games Corporation and WMS Gaming, Inc. entered into a Master Settlement Agreement and IGT and Scientific Games Corporation entered into a TITO Game Manufacturer License Agreement. This action was dismissed with prejudice on July 14, 2014.
2013 District of Nevada
Related to the foregoing lawsuit and arbitration, on October 22, 2013, WMS filed suit in the US District Court for the District of Nevada, captioned WMS Gaming, Inc. v. IGT, Case No. 3:13-cv-00583. WMS is seeking, among other things, a declaratory judgment that the arbitration provision of the license agreement is unenforceable, alleging that IGT is seeking to arbitrate non-arbitrable issues, and seeking a refund of royalties WMS has allegedly overpaid. WMS has filed a motion for preliminary injunction, seeking to enjoin the arbitration. WMS's motion for preliminary injunction was denied on March 21, 2014 and the case was stayed pending the related arbitration between IGT and WMS. On June 13, 2014, IGT, Scientific Games Corporation and WMS Gaming, Inc. entered into a Master Settlement Agreement and IGT and Scientific Games Corporation entered into a TITO Game Manufacturer License Agreement. This action was dismissed with prejudice on June 19, 2014.
Global Draw Limited
On September 17, 2013, Global Draw Limited commenced proceedings in London against IGT-UK Group Limited (a wholly owned subsidiary of IGT) and IGT, captioned 2013 High Court of Justice (Commercial Court) in London, England, Case No. 2013, Folio 1246. Global Draw's claims arise out of a Sale and Purchase Agreement dated April 26, 2011 (SPA) pursuant to which Global Draw purchased from IGT-UK all of the outstanding shares of Barcrest Limited. Global Draw seeks claims against IGT-UK under the terms of indemnities and warranties contained in the SPA and against IGT under the terms of a guarantee given by IGT in respect of the liabilities of IGT-UK under the SPA. On November 7, 2013, IGT-UK filed and served its defense and counterclaim in response to the claim, and IGT has also entered its defense. The claims assert damages of £1.3 million and US $2.9 million excluding interest, plus other unquantified damages. On June 24, 2014 Global Draw updated the $2.9 million damage assertion to $5.2 million. Global Draw filed a summary judgment application pertaining to the interpretation of certain terms of the SPA. On September 10, 2014, the court ruled on the summary judgment application, with IGT having successfully defended against the application except for its obligations to indemnify Global Draw for costs and expenses relating to proceedings against Global Draw in Italy during the period of September 23, 2011 to September 23, 2013.
85
The amount payable in connection with IGT's indemnification obligations regarding the Italy proceedings has not been determined. The court also ordered Global Draw to pay 75% of IGT's costs in defending the application. A trial on the outstanding claims is now scheduled for May 7-19, 2015.
Shareholder Class Actions Relating to the Pending Transaction with GTECH S.p.A.
Subsequent to the announcement of the Company's entry into a merger agreement with GTECH S.p.A. (see Note 1), various putative shareholder class action complaints have been filed by purported shareholders of the Company. As of November 12, 2014, the Company had received the following complaints, each filed in the Eighth Judicial District Court of the State of Nevada for Clark County: Klein v. International Game Technology, et al., Case No. A-14-704058-B, filed July 18, 2014; Steinberg v. International Game Technology, et al., Case No. A-14-704098-C, filed July 21, 2014; Kanter v. International Game Technology, et al., Case No. A-14-704101-C, filed July 21, 2014; Tong v. International Game Technology, et al., Case No. A-14-704140-B, filed July 21, 2014; MacDougall v. International Game Technology, et al., Case No. A-14-704147-C, filed July 22, 2014; Longo v. International Game Technology, et al., Case No. A-14-704277-B, filed July 23, 2014; Kitchen v. International Game Technology, et al., Case No. A-14-704286-C, filed July 23, 2014; Gonzalez, et al. v. International Game Technology, et al., Case No. A-14-704288-C, filed July 23, 2014; Krol v. International Game Technology, et al., Case No. A-14-704330-C, filed July 24, 2014; Irving Firemen's Relief & Retirement Fund v. International Game Technology, et al., Case No. A-14-704334-B, filed July 24, 2014; Neumann v. International Game Technology, et al., Case No. A-14-704393-B, filed July 25, 2014; Taber v. International Game Technology, et al., Case No. A-14-704403-B, filed July 25, 2014; Aberman v. International Game Technology, et al., Case No. A-14-704454-B, filed July 27, 2014; Epstein, et al. v. International Game Technology, et al., Case No. A-14-704509-B, filed July 28, 2014; Lowinger v. International Game Technology, et al., Case No. A-14-704759-B, filed July 30, 2014; Lerman v. International Game Technology, et al., Case No. A-14-704849-B, filed August 1, 2014; Braunstein v. International Game Technology, et al., Case No. A-14-704210-B, filed July 22, 2014; and Weston v. International Game Technology, et al., Case No. A-14-704856-C, filed August 1, 2014.
In addition, the following related complaints were filed in the Eighth Judicial District Court of the State of Nevada for Clark County, but have been voluntarily dismissed: Zak v. International Game Technology, et al., Case No. A-14-704095-C, filed July 21, 2014 and dismissed September 16, 2014; Lerman v. International Game Technology, et al., Case No. A-14-704287-C, filed July 23, 2014 and dismissed July 31, 2014; and Iron Workers District Council of Tennessee Valley & Vicinity Welfare, Pension & Annuity Plans v. International Game Technology, et al., Case No. A-14-704409-C, filed July 25, 2014 and dismissed August 22, 2014.
The complaints purport to be brought on behalf of all similarly situated shareholders of the Company and generally allege that the members of the IGT board of directors breached their fiduciary duties to IGT shareholders by approving the proposed merger transaction for inadequate consideration, entering into a merger agreement containing preclusive deal protection devices and failing to take steps to maximize the value to be paid to IGT shareholders. The complaints also allege claims against IGT and GTECH, and, in some cases, certain of GTECH's subsidiaries, for aiding and abetting these alleged breaches of fiduciary duties. The complaints seek preliminary and permanent injunctions against the completion of the transaction, or, alternatively, damages in favor of the plaintiffs and the class in the event that the transaction is completed. Certain of the complaints also seek, in the event that the transaction is completed, rescission of the transaction or rescissory damages in favor of the plaintiffs and the class. IGT intends to vigorously defend against the claims asserted in these lawsuits.
On October 2, 2014, the District Court held a hearing and granted motions to consolidate the above cases and appointed interim lead plaintiffs and lead and liaison plaintiffs' counsel.
OTHER ARRANGEMENTS WITH OFF-BALANCE SHEET RISKS
In the normal course of business, we are party to financial instruments with off-balance sheet risk, such as performance bonds not reflected in our balance sheet. We do not expect any material losses to result from these arrangements and are not dependent on off-balance sheet financing arrangements to fund our operations.
86
Performance Bonds
Performance bonds outstanding related to certain gaming operations equipment totaled $12.0 million at September 30, 2014. We are liable to reimburse the bond issuer in the event of exercise due to our nonperformance.
Letters of Credit
Outstanding letters of credit issued under our domestic credit facility to ensure payment to certain vendors and governmental agencies totaled $8.5 million at September 30, 2014.
IGT Licensor Arrangements
Our sales agreements that include software and IP licensing arrangements may require IGT to indemnify the third-party licensee against liability and damages (including legal defense costs) arising from any claims of patent, copyright, trademark infringement, or trade secret misappropriation. Should such a claim occur, we could be required to make payments to the licensee for any liabilities or damages incurred. Historically, we have not incurred any significant settlement costs due to infringement claims. As we consider the likelihood of incurring future costs to be remote, no liability has been recorded.
Self-Insurance
We retain a portion of our workers' compensation, automobile liability, directors' and officers' liability, electronic errors and omissions liability, and property and crime risks in the form of deductibles or self-insured retentions and we are self-insured for various levels of employee medical, dental, prescription drug, and disability coverage. We purchase stop loss coverage to protect against unexpected claims. Accrued insurance claims and reserves include estimated settlements for known claims, and actuarial estimates for claims incurred but not reported.
State and Federal Taxes
We are subject to sales, use, income, gaming and other tax audits and administrative proceedings in various US federal, state, local, and foreign jurisdictions. While we believe we have properly reported our tax liabilities in each jurisdiction, we can give no assurance that taxing authorities will not propose adjustments that increase our tax liabilities.
Product Warranties
The majority of our products are generally covered by a warranty for periods ranging from 90 to 180 days. We estimated accrued warranty costs in the table below based on historical trends in product failure rates and expected costs to provide warranty services.
|
2014
|
2013
|
2012
|
||||||||||
|
Beginning balance
|
$
|
4.4
|
$
|
4.2
|
$
|
6.2
|
||||||
|
Reduction for payments made
|
(3.4
|
)
|
(5.7
|
)
|
(5.9
|
)
|
||||||
|
Accrual for new warranties issued
|
4.4
|
8.0
|
7.6
|
|||||||||
|
Adjustments for pre-existing warranties
|
(2.1
|
)
|
(2.1
|
)
|
(3.7
|
)
|
||||||
|
Ending balance
|
$
|
3.3
|
$
|
4.4
|
$
|
4.2
|
||||||
87
14. INCOME TAXES
INCOME TAX PROVISION FROM CONTINUING OPERATIONS
|
Years Ended September 30,
|
2014
|
2013
|
2012
|
|||||||||
|
Distribution of Income Before Tax
|
||||||||||||
|
US
|
$
|
314.8
|
$
|
374.0
|
$
|
354.6
|
||||||
|
Foreign
|
6.5
|
28.3
|
(11.8
|
)
|
||||||||
|
Total
|
$
|
321.3
|
$
|
402.3
|
$
|
342.8
|
||||||
|
Components of Income Tax Provision
|
||||||||||||
|
Federal
|
$
|
61.1
|
$
|
141.0
|
$
|
92.6
|
||||||
|
State
|
4.5
|
14.6
|
8.5
|
|||||||||
|
Foreign
|
14.2
|
23.5
|
14.1
|
|||||||||
|
Total current
|
79.8
|
179.1
|
115.2
|
|||||||||
|
Federal
|
0.6
|
(36.6
|
)
|
(16.8
|
)
|
|||||||
|
State
|
0.6
|
(1.8
|
)
|
(0.8
|
)
|
|||||||
|
Foreign
|
(7.6
|
)
|
(11.1
|
)
|
(4.5
|
)
|
||||||
|
Total deferred
|
(6.4
|
)
|
(49.5
|
)
|
(22.1
|
)
|
||||||
|
Total income tax provision
|
$
|
73.4
|
$
|
129.6
|
$
|
93.1
|
||||||
|
Reconciliation of Statutory Federal Rate to Effective Rate
|
||||||||||||
|
Federal statutory tax
|
35.0
|
%
|
35.0
|
%
|
35.0
|
%
|
||||||
|
State income tax, net
|
0.7
|
%
|
1.8
|
%
|
1.4
|
%
|
||||||
|
Foreign subsidiaries tax, net
|
1.0
|
%
|
0.5
|
%
|
4.2
|
%
|
||||||
|
Manufacturer's deduction
|
-3.0
|
%
|
-3.4
|
%
|
-2.5
|
%
|
||||||
|
Entraction closures
|
0.0
|
%
|
0.0
|
%
|
-12.4
|
%
|
||||||
|
Change in Income Tax Contingencies
|
-11.7
|
%
|
-0.6
|
%
|
0.3
|
%
|
||||||
|
Other, net
|
0.8
|
%
|
-1.1
|
%
|
1.2
|
%
|
||||||
|
Total effective rate
|
22.8
|
%
|
32.2
|
%
|
27.2
|
%
|
||||||
DEFERRED INCOME TAXES
|
September 30,
|
2014
|
2013
|
||||||
|
Deferred Tax Assets
|
||||||||
|
Reserves
|
$
|
115.0
|
$
|
127.7
|
||||
|
Jackpot payment timing difference
|
109.6
|
119.5
|
||||||
|
Share-based compensation
|
25.8
|
29.6
|
||||||
|
Net operating loss carryforwards
|
37.2
|
36.1
|
||||||
|
Property, plant and equipment
|
2.6
|
-
|
||||||
|
Goodwill and intangibles
|
66.4
|
58.4
|
||||||
|
Capital loss carryover
|
23.6
|
24.4
|
||||||
|
Other
|
6.8
|
11.7
|
||||||
|
Total deferred income tax assets
|
387.0
|
407.4
|
||||||
|
Valuation allowance
|
(62.0
|
)
|
(63.2
|
)
|
||||
|
Total deferred income tax assets, net
|
325.0
|
344.2
|
||||||
|
Deferred Tax Liabilities
|
||||||||
|
Interest expense on convertible debt
|
(30.9
|
)
|
(38.7
|
)
|
||||
|
Property, plant and equipment
|
-
|
(15.3
|
)
|
|||||
|
Goodwill and intangibles
|
(33.6
|
)
|
(36.3
|
)
|
||||
|
Other
|
(21.0
|
)
|
(14.3
|
)
|
||||
|
Total deferred income tax liabilities
|
(85.5
|
)
|
(104.6
|
)
|
||||
|
Net Deferred Income Tax Assets
|
$
|
239.5
|
$
|
239.6
|
||||
88
|
Balance Sheet Location at September 30,
|
2014
|
2013
|
||||||
|
Current deferred income tax assets
|
$
|
98.3
|
$
|
111.1
|
||||
|
Non-current deferred income tax assets
|
142.0
|
128.8
|
||||||
|
Non-current deferred income tax liabilities (included in other liabilities)
|
0.8
|
0.3
|
||||||
Total valuation allowance decreased $1.2 million during 2014, primarily related to foreign deferred assets and the utilization of capital losses in the US. The valuation allowance is based on our assessment that it is more likely than not that certain deferred tax assets will not be realized in the foreseeable future.
Net operating loss carryforwards at September 30, 2014 included $7.7 million in the US and $120.5 million in foreign countries and expire in tax years 2014 through 2031. Net capital loss carryover totaled $63.1 million at September 30, 2014 and expires in tax years 2015 through 2017.
At September 30, 2014, we had not provided US deferred income taxes or foreign withholding taxes on $200.8 million in unrecognized temporary differences related to the basis of our investments in foreign subsidiaries expected to be permanently reinvested in operations outside the US. We do not anticipate any events that would cause such earnings to become taxable in the US. Determination of the amount of any unrecognized deferred income tax liability on these undistributed earnings is not practicable.
UNCERTAIN TAX BENEFITS
Aggregate Changes in Unrecognized Tax Benefits
|
2014
|
2013
|
2012
|
||||||||||
|
Beginning balance
|
$
|
109.2
|
$
|
111.5
|
$
|
116.4
|
||||||
|
Increases related to prior year tax positions
|
6.6
|
1.7
|
2.2
|
|||||||||
|
Decreases related to prior year tax positions
|
(53.5
|
)
|
(3.3
|
)
|
(8.8
|
)
|
||||||
|
Increases related to current year tax positions
|
0.5
|
3.2
|
4.9
|
|||||||||
|
Decreases related to current year tax positions
|
-
|
(1.3
|
)
|
(3.2
|
)
|
|||||||
|
Reductions due to lapse of statute of limitations
|
(15.3
|
)
|
(2.6
|
)
|
-
|
|||||||
|
Reductions for settlements with taxing authorities
|
-
|
-
|
-
|
|||||||||
|
Ending balance
|
$
|
47.5
|
$
|
109.2
|
$
|
111.5
|
||||||
The amount of unrecognized tax benefits that would impact our effective tax rate, if recognized, totaled $36.1 million at September 30, 2014 and $80.8 million at September 30, 2013.
Interest and penalties related to unrecognized tax benefits are included in our income tax provision. During the years ended September 30, 2014, 2013, and 2012, we recognized a benefit of $10.6 million, a benefit of $0.4 million, and an expense of $2.4 million, respectively, in interest and penalties. Accrued interest and penalties, net of federal income tax benefits, totaled $8.0 million at September 30, 2014 and $18.6 million at September 30, 2013.
On November 13, 2013, we reached effective settlement with the US tax authorities related to our 1999, 2006, 2007, 2008, and 2009 tax years. As a result, we reduced our income tax provision by approximately $29.6 million and our unrecognized tax benefits by approximately $33.1 million, inclusive of interest and penalties. We are generally no longer subject to US federal, state, local or foreign income tax examination by tax authorities for years before 2009.
89
15. LEASE COMMITMENTS
Rent and lease expense for continuing operations, net of sublease rentals, included no contingent rental payments and totaled $15.4 million in 2014, $14.6 million in 2013, and $14.3 million in 2012.
|
Operating
|
Capitalized
|
Total
|
||||||||||
|
2015
|
$
|
14.6
|
$
|
0.3
|
$
|
14.9
|
||||||
|
2016
|
12.7
|
0.3
|
13.0
|
|||||||||
|
2017
|
10.1
|
0.3
|
10.4
|
|||||||||
|
2018
|
8.7
|
0.3
|
9.0
|
|||||||||
|
2019
|
6.4
|
0.4
|
6.8
|
|||||||||
|
Thereafter
|
6.1
|
-
|
6.1
|
|||||||||
|
Total minimum payments
|
$
|
58.6
|
1.6
|
$
|
60.2
|
|||||||
|
Less amount representing interest
|
(0.2
|
)
|
||||||||||
|
Capitalized lease obligation
|
1.4
|
|||||||||||
|
Less current portion
|
(0.3
|
)
|
||||||||||
|
Long-term portion
|
$
|
1.1
|
||||||||||
16. EMPLOYEE BENEFIT PLANS
IGT maintains a salary deferral 401(k) plan that allows eligible employees to contribute up to 40% of their base pay up to the IRS prescribed limit. The Plan is a designated safe harbor plan, whereby IGT matches up to 3.5% of the employee's eligible earnings on the first 6% contributed by the employee. Employee and IGT matching contributions vest immediately.
IGT may also contribute a discretionary amount of profits to eligible employees, which vest over a six-year period. Cash bonuses are paid annually to eligible management employees and cash sharing is distributed to non-management employees annually. Charges recorded for these plans totaled $41.4 million in 2014, $45.0 million in 2013, and $44.5 million in 2012.
Additionally, IGT implemented a non-qualified deferred compensation plan in September 1999, which provides an unfunded incentive compensation arrangement for eligible management and highly compensated employees. Participants may elect to defer up to 50% of their annual earnings with a minimum deferral of $2,000. Distributions can be paid out as short-term payments or at retirement. Retirement benefits can be paid out as a lump sum or in annual installments over a term of up to 15 years.
SHARE-BASED COMPENSATION
|
Weighted Average
|
||||||||||||||||
|
Options
|
Shares
|
Exercise
Price
Per
Share
|
Remaining
Contractual
Term
(in years)
|
Aggregate
Intrinsic
Value
|
||||||||||||
|
Outstanding at beginning of 2014
|
9.1
|
$
|
18.57
|
|||||||||||||
|
Granted
|
-
|
-
|
||||||||||||||
|
Exercised
|
(0.5
|
)
|
13.10
|
|||||||||||||
|
Forfeited
|
(0.2
|
)
|
16.12
|
|||||||||||||
|
Expired
|
(1.0
|
)
|
22.63
|
|||||||||||||
|
Outstanding at end of 2014
|
7.4
|
$
|
18.41
|
4.3
|
$
|
10.0
|
||||||||||
|
Vested and expected to vest
|
7.3
|
$
|
18.42
|
4.3
|
$
|
10.0
|
||||||||||
|
Exercisable
|
6.6
|
$
|
18.69
|
4.1
|
$
|
9.2
|
||||||||||
90
|
Weighted Average
|
||||||||||||||||
|
Restricted Share Units
|
Shares
|
Grant Date
Fair Value
Per Share
|
Remaining
Vesting
Period
(in years)
|
Aggregate
Intrinsic
Value
|
||||||||||||
|
Outstanding at beginning of 2014
|
6.3
|
$
|
14.55
|
|||||||||||||
|
Granted
|
3.6
|
16.16
|
||||||||||||||
|
Vested
|
(2.6
|
)
|
14.45
|
|||||||||||||
|
Forfeited
|
(1.0
|
)
|
15.29
|
|||||||||||||
|
Outstanding at end of 2014
|
6.3
|
$
|
15.39
|
1.3
|
$
|
106.3
|
||||||||||
|
|
||||||||||||||||
|
Expected to vest
|
5.0
|
$
|
15.27
|
1.3
|
$
|
84.0
|
||||||||||
Option Valuation Assumptions
|
2012
|
|
||
|
|
|
|
|
|
Expected volatility
|
|
0.47
|
|
|
Expected dividends
|
|
1.48 %
|
|
|
Expected term (in years)
|
|
4.7
|
|
|
Risk free rate
|
|
0.85 %
|
|
Reported Share-based Compensation
|
Years Ended September 30,
|
2014
|
2013
|
2012
|
|||||||||
|
Pre-tax
|
$
|
32.1
|
$
|
39.4
|
$
|
33.2
|
||||||
|
Tax benefit
|
(10.8
|
)
|
(12.5
|
)
|
(10.4
|
)
|
||||||
|
After-tax
|
$
|
21.3
|
$
|
26.9
|
$
|
22.8
|
||||||
Other Share-based Compensation Information
|
Years Ended September 30,
|
2014
|
2013
|
2012
|
|||||||||
|
Weighted average grant date FV per share:
|
||||||||||||
|
Options granted
|
$
|
-
|
$
|
-
|
$
|
5.70
|
||||||
|
Restricted shares granted
|
$
|
16.16
|
$
|
14.26
|
$
|
15.05
|
||||||
|
Total intrinsic value of options exercised
|
$
|
1.7
|
$
|
6.4
|
$
|
3.8
|
||||||
|
Total FV of restricted shares vested
|
47.6
|
17.3
|
11.6
|
|||||||||
|
Tax benefit realized for tax return deductions
|
13.8
|
8.1
|
5.5
|
|||||||||
|
At September 30, 2014
|
||||
|
Shares available for future grant (see Note 1 about GTECH merger limitations)
|
20.7
|
|||
|
Unrecognized costs for outstanding awards
|
$
|
62.3
|
||
|
Weighted average future recognition period (in years)
|
1.9
|
|||
Approximately 0.1 million shares were issued in February 2014 under the ESPP. At September 30, 2014, 0.7 million shares were available for future grants and we expected to issue approximately 0.1 million shares in February 2015 under this plan.
Additionally, eligible UK employees may enroll in the International Game Technology Savings Related Share Option Scheme established in January 1999 (formerly the Barcrest Savings Related Share Option Scheme). Employees must elect to vest over three, five, or seven years and the option price is equal to 80% of the market price of our stock on the grant date. During 2014, 3,000 shares were issued under this plan and approximately 474,000 shares were available for grant at September 30, 2014. Based on enrollment through September 30, 2014, we expect to issue approximately 2,000 shares under this plan over the next year.
91
17. EARNINGS PER SHARE
|
Years Ended September 30,
|
2014
|
2013
|
2012
|
|||||||||
|
Income from continuing operations available to common shares
|
$
|
247.9
|
$
|
272.7
|
$
|
249.7
|
||||||
|
|
||||||||||||
|
Basic weighted average shares outstanding
|
248.6
|
262.6
|
288.8
|
|||||||||
|
Dilutive effect of non-participating share-based awards
|
1.9
|
2.6
|
1.6
|
|||||||||
|
Diluted weighted average common shares outstanding
|
250.5
|
265.2
|
290.4
|
|||||||||
|
|
||||||||||||
|
Basic EPS from continuing operations
|
$
|
1.00
|
$
|
1.04
|
$
|
0.86
|
||||||
|
Diluted EPS from continuing operations
|
$
|
0.99
|
$
|
1.03
|
$
|
0.86
|
||||||
|
|
||||||||||||
|
Weighted average shares excluded from diluted EPS because the effect would be anti-dilutive:
|
||||||||||||
|
Share-based awards
|
6.5
|
8.2
|
11.3
|
|||||||||
|
3.25% convertible notes (1)
|
-
|
42.6
|
42.6
|
|||||||||
|
Hedges
|
-
|
(42.6
|
)
|
(42.6
|
)
|
|||||||
|
Warrants (1) (expired November 21, 2014)
|
42.6
|
42.6
|
42.6
|
|||||||||
|
(1) Excluded because the conversion price and exercise price exceeded the average market price of our common stock
|
||||||||||||
Share repurchases
|
Years Ended September 30,
|
2014
|
2013
|
2012
|
|||||||||
|
Total shares repurchased (2)
|
12.3
|
12.8
|
32.9
|
|||||||||
|
Average price paid per share
|
$
|
17.25
|
$
|
17.71
|
$
|
14.23
|
||||||
|
Aggregate payments
|
211.6
|
190.5
|
475.2
|
|||||||||
|
Remaining authorization (see Note 1 about GTECH merger limitations)
|
209.7
|
|||||||||||
|
(2) Including net shares tendered by employees at vesting for tax withholding obligations
|
||||||||||||
In November 2013, we executed a $200.0 million ASR transaction and received 11.6 million total common shares based on the VWAP over the 3-month transaction period for an average price of $17.22 per share.
In June 2012, we executed a $400.0 million ASR transaction and received 30.3 million total common shares based on the VWAP over the 6-month transaction period for an average price of $13.22 per share.
92
18. ACCUMULATED OTHER COMPREHENSIVE INCOME (LOSS)
|
|
Foreign
Currency
Translation
|
Treasury
Locks –
Unrecognized
Gain (Loss)
|
TOTAL
|
|||||||||
|
Balance at September 30, 2012
|
$
|
4.5
|
$
|
-
|
$
|
4.5
|
||||||
|
|
||||||||||||
|
2013
|
||||||||||||
|
Activity before reclassifications:
|
||||||||||||
|
Amount before tax
|
(4.3
|
)
|
12.6
|
8.3
|
||||||||
|
Income tax
|
-
|
(4.6
|
)
|
(4.6
|
)
|
|||||||
|
Amount net of tax
|
(4.3
|
)
|
8.0
|
3.7
|
||||||||
|
Reclassifications to earnings
|
-
|
-
|
-
|
|||||||||
|
Net other comprehensive income
|
(4.3
|
)
|
8.0
|
3.7
|
||||||||
|
|
||||||||||||
|
Balance at September 30, 2013
|
$
|
0.2
|
$
|
8.0
|
$
|
8.2
|
||||||
|
|
||||||||||||
|
2014
|
||||||||||||
|
Activity before reclassifications:
|
||||||||||||
|
Amount before tax
|
(22.7
|
)
|
-
|
(22.7
|
)
|
|||||||
|
Income tax
|
-
|
-
|
-
|
|||||||||
|
Amount net of tax
|
(22.7
|
)
|
-
|
(22.7
|
)
|
|||||||
|
Reclassifications to earnings:
|
||||||||||||
|
Amount before tax (located within interest expense on the income statement)
|
-
|
(1.1
|
)
|
(1.1
|
)
|
|||||||
|
Income tax effect
|
-
|
0.4
|
0.4
|
|||||||||
|
Amount net of tax
|
-
|
(0.7
|
)
|
(0.7
|
)
|
|||||||
|
Net other comprehensive income
|
(22.7
|
)
|
(0.7
|
)
|
(23.4
|
)
|
||||||
|
|
||||||||||||
|
Balance at September 30, 2014
|
$
|
(22.5
|
)
|
$
|
7.3
|
$
|
(15.2
|
)
|
||||
19. BUSINESS SEGMENTS
We view our business in two operating segments , North America and International, each incorporating all revenue categories—Gaming Operations, Product Sales, and Interactive.
NORTH AMERICA, comprising 79 % of consolidated revenues in 2014, 78 % in 2013 and 76 % in 2012, includes operations associated with our land-based and online real-money customers located in the US and Canada, as well as all customers serviced by our US-based social gaming operations.
INTERNATIONAL, comprising 21 % of consolidated revenues in 2014, 22 % in 2013, and 24 % in 2012, consists of our land-based and online real-money customers located in all other jurisdictions worldwide.
Certain income and expenses related to company-wide initiatives, primarily comprised of general and administrative costs and other income (expense), are managed at the corporate level and not allocated to an operating segment. Our business segments are designed to allocate resources within a framework of management responsibility. Operating costs included in one segment may benefit other segments. Ongoing realignment of business development and administrative functions may result in ongoing changes to allocations of operating cost amongst our operating segments.
We do not recognize inter-company revenues or expenses upon the transfer of gaming products between operating segments. Segment accounting policies are consistent with those of our consolidated financial statements and segment profit is measured on the basis of operating income. Impairment and restructuring charges (see Note 20) are reflected within the segment where actions occurred.
93
BUSINESS SEGMENTS FINANCIAL INFORMATION
|
Years Ended September 30,
|
2014
|
2013
|
2012
|
|||||||||
|
NORTH AMERICA
|
||||||||||||
|
Revenues
|
$
|
1,619.2
|
$
|
1,835.1
|
$
|
1,644.1
|
||||||
|
Gaming operations
|
770.1
|
854.2
|
907.8
|
|||||||||
|
Product sales
|
562.5
|
759.8
|
648.2
|
|||||||||
|
Interactive
|
286.6
|
221.1
|
88.1
|
|||||||||
|
Gross profit
|
966.9
|
1,066.9
|
961.2
|
|||||||||
|
Gaming operations
|
462.9
|
522.4
|
541.2
|
|||||||||
|
Product sales
|
324.9
|
407.3
|
366.6
|
|||||||||
|
Interactive
|
179.1
|
137.2
|
53.4
|
|||||||||
|
Operating income
|
427.7
|
487.9
|
425.8
|
|||||||||
|
|
||||||||||||
|
Depreciation and amortization
|
148.1
|
190.4
|
195.3
|
|||||||||
|
Long-lived assets
|
373.8
|
479.8
|
590.3
|
|||||||||
|
Additions to long-lived assets
|
67.9
|
103.3
|
146.2
|
|||||||||
|
Total assets
|
2,758.4
|
2,745.6
|
2,560.0
|
|||||||||
|
INTERNATIONAL
|
||||||||||||
|
Revenues
|
$
|
438.9
|
$
|
506.5
|
$
|
506.6
|
||||||
|
Gaming operations
|
116.8
|
137.2
|
132.2
|
|||||||||
|
Product sales
|
284.5
|
325.4
|
318.6
|
|||||||||
|
Interactive
|
37.6
|
43.9
|
55.8
|
|||||||||
|
Gross profit
|
247.7
|
277.5
|
276.4
|
|||||||||
|
Gaming operations
|
84.5
|
94.7
|
93.1
|
|||||||||
|
Product sales
|
140.0
|
157.7
|
155.7
|
|||||||||
|
Interactive
|
23.2
|
25.1
|
27.6
|
|||||||||
|
Operating income
|
90.6
|
120.1
|
103.6
|
|||||||||
|
|
||||||||||||
|
Depreciation and amortization
|
34.1
|
35.3
|
40.3
|
|||||||||
|
Long-lived assets
|
36.5
|
51.1
|
79.4
|
|||||||||
|
Additions to long-lived assets
|
14.9
|
7.3
|
40.1
|
|||||||||
|
Total assets
|
695.9
|
760.1
|
812.7
|
|||||||||
|
CORPORATE (unallocated)
|
||||||||||||
|
Operating expense
|
$
|
(109.7
|
)
|
$
|
(113.9
|
)
|
$
|
(107.7
|
)
|
|||
|
|
||||||||||||
|
Depreciation and amortization
|
6.8
|
5.9
|
4.7
|
|||||||||
|
Long-lived assets
|
83.3
|
83.6
|
79.4
|
|||||||||
|
Additions to long-lived assets
|
6.8
|
19.1
|
23.9
|
|||||||||
|
Total assets
|
535.2
|
1,107.1
|
912.4
|
|||||||||
|
CONSOLIDATED
|
||||||||||||
|
Revenues
|
$
|
2,058.1
|
$
|
2,341.6
|
$
|
2,150.7
|
||||||
|
Gaming operations
|
886.9
|
991.4
|
1,040.0
|
|||||||||
|
Product sales
|
847.0
|
1,085.2
|
966.8
|
|||||||||
|
Interactive
|
324.2
|
265.0
|
143.9
|
|||||||||
|
Gross profit
|
1,214.6
|
1,344.4
|
1,237.6
|
|||||||||
|
Gaming operations
|
547.4
|
617.1
|
634.3
|
|||||||||
|
Product sales
|
464.9
|
565.0
|
522.3
|
|||||||||
|
Interactive
|
202.3
|
162.3
|
81.0
|
|||||||||
|
Operating income
|
408.6
|
494.1
|
421.7
|
|||||||||
|
|
||||||||||||
|
Depreciation and amortization
|
189.0
|
231.6
|
240.3
|
|||||||||
|
Long-lived assets
|
493.6
|
614.5
|
749.1
|
|||||||||
|
Additions to long-lived assets
|
89.6
|
129.7
|
210.2
|
|||||||||
|
Total assets
|
3,989.5
|
4,612.8
|
4,285.1
|
|||||||||
94
GEOGRAPHICAL INFORMATION
Revenues below were identified by customer location, except social gaming was by selling location.
|
2014
|
2013
|
2012
|
||||||||||
|
US
|
$
|
1,518.9
|
$
|
1,612.2
|
$
|
1,490.1
|
||||||
|
Non-US
|
539.2
|
729.4
|
660.6
|
|||||||||
|
Total revenues
|
$
|
2,058.1
|
$
|
2,341.6
|
$
|
2,150.7
|
||||||
20. IMPAIRMENT, RESTRUCTURING, AND MERGER-RELATED COSTS
|
Years Ended September 30,
|
2014
|
2013
|
2012
|
|||||||||
|
Impairment
|
$
|
14.4
|
$
|
3.6
|
$
|
42.5
|
||||||
|
Alabama note
|
5.3
|
2.3
|
12.8
|
|||||||||
|
Entraction
|
-
|
-
|
15.1
|
|||||||||
|
Other
|
9.1
|
1.3
|
14.6
|
|||||||||
|
Business realignment restructuring
|
15.6
|
-
|
-
|
|||||||||
|
Merger-related costs
|
10.2
|
-
|
-
|
|||||||||
|
Total
|
$
|
40.2
|
$
|
3.6
|
$
|
42.5
|
||||||
Impairment
Alabama Note
IGT machines ceased to be operated at the VictoryLand, Country Crossing and Greentrack facilities in 2010, as a result of challenges related to the legality of electronic charitable bingo in Alabama. Impairment has been recognized each year since, as the prospects of collecting our Alabama development financing declined with deteriorating market conditions and the decreasing value of associated property collateral. The level 3 FV of the collateral was determined using expected cash flows discounted at risk-based market rates. The net carrying amount of the remaining Alabama note receivable totaled $14.8 million at September 30, 2014.
Entraction
In September 2012, based on an evaluation of our future business strategy and diminished returns largely related to regulatory challenges, we consolidated our IGTi product development and customer service resources in Europe primarily acquired with Entraction. We began exiting online turnkey and poker operations and closing or reducing certain facilities in Europe (Stockholm and Tallinn), resulting in restructuring charges of $3.6 million for severance, lease termination, and other wind-down costs, and impairment of $11.5 million related to acquired intangible assets, including developed technology, customer relationships, and trademarks.
Other
In September 2014, we recorded impairment of $9.1 million related to undeveloped land in Reno, Nevada due to a decline in market value.
In 2013, we recorded impairment of $1.3 million related to our building in Manchester, UK that was put on the market and $2.1 million was reclassified to held-for-sale within other assets.
During 2012, we recorded impairment of $14.6 million resulting from the evaluation of our business strategy and outlook related to the use of our Walker Digital patent portfolio.
95
Business Realignment Restructuring
To address the recent challenges facing the gaming industry, in March 2014 cost-saving measures were completed under a plan to realign our operating structure. Under this business realignment, we reduced our global workforce by 7% and accrued the charges below during 2014, which were substantially paid at September 30, 2014.
|
|
North America
|
International
|
Consolidated
|
|||||||||
|
Severance (cash)
|
$
|
6.0
|
$
|
2.8
|
$
|
8.8
|
||||||
|
Impairment of abandoned software (non-cash)
|
6.1
|
0.7
|
6.8
|
|||||||||
|
Total restructuring charges
|
$
|
12.1
|
$
|
3.5
|
$
|
15.6
|
||||||
Merger-related Costs
During 2014, we recorded $10.2 million of GTECH merger-related expenses, including professional fees for legal and financial consulting and retention bonuses to all employees who remain employed through the closing date of the proposed merger. See Note 1.
21. BUSINESS ACQUISITIONS
Strategy9
In May 2014, IGT purchased the net assets related to the Strategy9 slot tournament manager, previously distributed by IGT under a royalty arrangement, for initial cash of $1.5 million plus contingent consideration up to $2.8 million. Consideration at acquisition of $2.4 million, which included an estimated FV for contingencies of $0.9 million, was allocated to $1.9 million of developed technology and $0.5 million of deductible goodwill related to non-separable intangibles. Strategy9 is reflected in our North America business segment and the pro forma impact of the business acquisition is not material to our consolidated results.
Double Down Interactive LLC.
On January 20, 2012, we acquired 100% of Seattle based Double Down Interactive LLC., developer and operator of the online social gaming operations of DoubleDown Casino found on Facebook. DoubleDown has a broad and expanding game portfolio, offering blackjack, slots, slot tournaments, video poker, and roulette to social gamers all around the world. This strategic acquisition is establishing IGT's position in casino-style social gaming and strengthening our core business with added distribution channels for IGT game content. DoubleDown is presented as a component of our North America segment.
Our initial investment of $250.9 million, net of cash acquired, included $225.0 million paid through March 2012, $0.9 million paid in April 2012, and $25.0 million held back for 18 months to provide a source of recovery in the event of certain indemnification claims. Total potential consideration of $500.9 million, net of cash acquired, also provides for maximum earn-out payments of $165.0 million over the three years following the acquisition dependent on financial performance targets and maximum employee retention payments of $85.0 million to certain DoubleDown employees over the two years following the acquisition.
The estimated FV of $88.9 million for the earn-out consideration at the acquisition date was included in the capitalized purchase price of $339.8 million, net of cash acquired. FV amounts were determined using DCF based on probability-weighted earnings projections and a risk-adjusted discount rate of 19%. The retention payments were not capitalized in the purchase price. Professional fees recorded in administrative operating expenses for this acquisition totaled $5.6 million through September 30, 2012. See Note 1 regarding revenue recognition for online social casino-style games. See Note 10 regarding earn-out FV adjustments recorded subsequent to acquisition in contingent acquisition-related costs. The purchase consideration was allocated to tangible assets of $7.2 million, identifiable intangible assets of $109.2 million, goodwill of $226.1 million related to non-separable intangibles that is deductible for tax purposes, and liabilities of $2.7 million.
96
BringIt, Inc.
In February 2012, IGT acquired BringIt, Inc., for its gaming technology and expertise for total cash consideration of $8.1 million allocated primarily to non-deductible goodwill related to non-separable intangibles of $6.7 million and developed technology of $0.8 million. Additionally, IGT agreed to pay $2.0 million contingent on the retention of three key employees over the two years following the acquisition, which was not included in the capitalized purchase price and will be recorded as operating expenses in a separate line for contingent acquisition related costs. BringIt is presented as a component of our North America segment.
Unaudited pro forma information
On a pro forma basis as if DDI and BringIt had been acquired at the beginning of 2011, the impact to 2012 earnings and revenues would not have been material.
Entraction Holding AB
Between June 2011 and March 2012, IGT acquired 100.0% of the outstanding shares of Entraction, a supplier of online real-money gaming products and services, for cash of $110.7 million. Entraction was integrated into our International operating segment and provided additional market opportunities in online real-money gaming. The purchase consideration was allocated to tangible net assets of $2.9 million, identifiable intangible assets of $17.7 million, and goodwill of $90.1 million related to non-separable intangibles and not deductible for tax purposes. Pro forma information is not provided as it was not material to our consolidated financial statements.
22. DISCONTINUED OPERATIONS
The sale of our UK Barcrest Group in 2011 remains subject to contingent consideration related to certain customer arrangements and potential indemnification obligations. Loss on the sale in 2012 totaled $2.4 million (or $3.8 million after-tax). Additional gain or loss on the sale may be recorded as these outstanding items are resolved over the next year.
A third party contract dispute related to our discontinued operations in Japan was resolved during 2014 and there were no remaining liabilities of discontinued operations at September 30, 2014.
23. QUARTERLY FINANCIAL DATA (Unaudited)
|
First
|
Second
|
Third
|
Fourth
|
|||||||||||||
|
2014
|
||||||||||||||||
|
Total revenues
|
$
|
541.2
|
$
|
512.8
|
$
|
467.6
|
$
|
536.5
|
||||||||
|
Gross profit
|
309.8
|
292.8
|
284.9
|
327.1
|
||||||||||||
|
Operating income (1)
|
103.7
|
72.1
|
109.6
|
123.2
|
||||||||||||
|
Income from continuing operations (1)
|
79.2
|
25.7
|
72.1
|
70.9
|
||||||||||||
|
Net income (1)
|
79.2
|
25.7
|
72.1
|
70.9
|
||||||||||||
|
Diluted EPS (1)
|
$
|
0.31
|
$
|
0.10
|
$
|
0.29
|
$
|
0.28
|
||||||||
|
2013
|
||||||||||||||||
|
Total revenues
|
$
|
530.3
|
$
|
600.0
|
$
|
579.0
|
$
|
632.3
|
||||||||
|
Gross profit
|
309.5
|
341.3
|
337.1
|
356.5
|
||||||||||||
|
Operating income
|
118.4
|
129.3
|
123.0
|
123.4
|
||||||||||||
|
Income from continuing operations
|
65.3
|
78.2
|
65.7
|
63.5
|
||||||||||||
|
Net income
|
65.3
|
78.2
|
65.7
|
63.5
|
||||||||||||
|
Diluted EPS
|
$
|
0.24
|
$
|
0.29
|
$
|
0.25
|
$
|
0.24
|
||||||||
(1) Our 2014 second quarter included business realignment restructuring charges of $16.5 million. See Note 20.
97
Item 9. CHANGES IN AND DISAGREEMENTS WITH ACCOUNTANTS ON ACCOUNTANTS ON ACCOUNTING AND FINANCIAL DISCLOSURE
None
Item 9A. CONTROLS AND PROCEDURES
We maintain disclosure controls and procedures designed to provide reasonable assurance that information required to be disclosed in our reports filed under the Exchange Act is recorded, processed, summarized, and reported within the time periods specified by the SEC's rules and forms, and that such information is accumulated and communicated to our management, including our CEO and CFO, as appropriate, to allow for timely decisions regarding required disclosure. We recognize that any controls and procedures, no matter how well designed and operated, can only provide reasonable assurance of achieving desired control objectives. Judgment is required when designing and evaluating the cost-benefit relationship of potential controls and procedures.
As of the end of the period covered by this report, with the supervision and participation of management, including our CEO and CFO, we evaluated the effectiveness of the design and operation of our disclosure controls and procedures. Based on this evaluation, our CEO and CFO have concluded that, as of the end of such period, our disclosure controls and procedures were effective at the reasonable assurance level.
Inherent Limitations over Internal Control
Internal control over financial reporting refers to the process designed by, or under the supervision of, our CEO and CFO, and affected by our board of directors, management and other personnel, to provide reasonable assurance regarding the reliability of financial reporting and the preparation of financial statements for external purposes in accordance with generally accepted accounting principles. Internal control over financial reporting includes those policies and procedures that:
| (i) | pertain to the maintenance of records that in reasonable detail accurately and fairly reflect the transactions and dispositions of our assets |
| (ii) | provide reasonable assurance that the transactions are recorded as necessary to permit preparation of financial statements in accordance with generally accepted accounting principles, and that our receipts and expenditures are being made only in accordance with authorizations of our management and our directors |
| (iii) | provide reasonable assurance regarding prevention or timely detection of unauthorized acquisition, use or disposition of our assets that could have a material effect on the financial statements |
Internal control over financial reporting cannot provide absolute assurance of achieving financial reporting objectives because of its inherent limitations, including the possibility of human error and circumvention by collusion or overriding of controls. A control system, no matter how well designed and operated, can provide only reasonable, not absolute, assurance that the objectives of the control system are met. No evaluation of internal controls can provide absolute assurance that all control issues and instances of fraud, if any, have been detected. Also, any evaluation of the effectiveness of controls in future periods are subject to the risk that those internal controls may become inadequate because of changes in business conditions, or that the degree of compliance with the policies or procedures may deteriorate.
98
Management's Report on Internal Control over Financial Reporting
Management is responsible for establishing and maintaining adequate internal control over our financial reporting as such term is defined in Exchange Act Rule 13a-15(f). We have evaluated the effectiveness of our internal control over financial reporting as of September 30, 2014. This evaluation was performed using the Internal Control - Integrated Framework developed by the Committee of Sponsoring Organizations of the Treadway Commission (1992 Framework). Based on this evaluation, management has concluded that, as of such date, our internal control over financial reporting was effective. The effectiveness of the Company's internal control over financial reporting as of September 30, 2014 has been audited by PricewaterhouseCoopers LLP, an independent registered public accounting firm, as stated in their report in Item 8.
Changes in Internal Control over Financial Reporting
As a part of our normal operations, we update our internal controls as necessary to accommodate any modifications to our business processes or accounting procedures. No change occurred during the most recent fiscal quarter that materially affected, or are reasonably likely to materially affect, our internal control over financial reporting.
Item 9B. OTHER INFORMATION
None
PART III
The information required by Items 10, 11, 12, 13, and 14, except as provided below, is incorporated by reference from an amendment to this Annual Report on Form 10-K to be filed with the SEC within 120 days of the end of the fiscal year covered by this report.
Item 10. DIRECTORS, EXECUTIVE OFFICERS, AND CORPORATE GOVERNANCE
We have adopted the "Code of Ethics for Principal Executive Officer and Senior Financial Officers of International Game Technology" (Finance Code of Ethics), a code of ethics that applies to our Principal Executive Officer, Principal Financial Officer, Principal Accounting Officer or Controller, or any persons performing similar functions (together, the "Covered Officers"). The Finance Code of Ethics is publicly available on our website. If we make any substantive amendments to the Finance Code of Ethics or grant any waiver, including any implicit waiver, from a provision of the code to any of the Covered Officers, we intend to disclose the nature of such amendment or waiver on our website (IGT.com).
Item 11. EXECUTIVE COMPENSATION
Item 12. SECURITY OWNERSHIP OF CERTAIN BENEFICIAL OWNERS AND MANAGEMENT AND RELATED STOCKHOLDER MATTERS
Item 13. CERTAIN RELATIONSHIPS AND RELATED TRANSACTIONS, AND DIRECTOR INDEPENDENCE
99
PART IV
Item 15. EXIBITS AND FINANCIAL STATEMENT SCHEDULES
|
(a)(1)
|
Consolidated Financial Statements are included under Item 8.
|
|
(a)(2)
|
Consolidated Financial Statement Schedules are either not required or included under Item 8.
|
|
Parent Company Financial Statements - Financial Statements of the Registrant only are omitted under Rule 3-05 as modified by ASR 302.
|
|
|
(a)(3)
|
Exhibits:
|
|
2.1*
|
Unit Purchase Agreement, dated January 12, 2012, by and among IGT, Double Down Interactive LLC, the Sellers a party thereto, and Gregory Enell, As Sellers' Agent (incorporated by reference to Exhibit 2.1 to Registrants' Report on Form 10-Q for the quarter ended March 31, 2012)
|
|
2.2
|
Agreement and Plan of Merger, dated as of July 15, 2014, among GTECH S.p.A., GTECH Corporation, Georgia Worldwide Limited, Georgia Worldwide Corporation and International Game Technology (incorporated by reference to Exhibit 2.1 to Registrant's Current Report on Form 8-K filed on July 18, 2014)
|
|
2.3
|
Amendment No, 1 to Agreement and Plan of Merger, dated as of September 23, 2014, among GTECH S.p.A., GTECH Corporation, Georgia Worldwide PLC (formerly Georgia Worldwide Limited), Georgia Worldwide Corporation and International Game Technology
|
|
3.1
|
Articles of Incorporation of International Game Technology, as amended (incorporated by reference to Exhibit 3.1 to Registrant's Report on Form 10-K for the year ended September 30, 2006)
|
|
3.2
|
Amended and Restated Code of Bylaws of International Game Technology, dated January 13, 2014 (incorporated by reference to Exhibit 10.1 to Registrant's Current Report on Form 8-K filed on January 17, 2014)
|
|
4.1
|
Indenture, dated May 11, 2009, between IGT and Wells Fargo Bank, National Association, as Trustee, related to the 3.25% Convertible Notes due 2014 (incorporated by reference to Exhibit 4.1 to Registrant's Current Report on Form 8-K filed May 11, 2009)
|
|
4.2
|
Form of 3.25% Convertible Notes due 2014 (incorporated by reference to Exhibit 4.2 to Registrant's Current Report on Form 8-K filed May 11, 2009)
|
|
4.3
|
Indenture, dated June 15, 2009, between IGT and Wells Fargo Bank, National Association, as Trustee, related to senior debt securities (incorporated by reference to Exhibit 4.1 to Registrant's Current Report on Form 8-K filed June 15, 2009)
|
|
4.4
|
First Supplemental Indenture, dated June 15, 2009, between IGT and Wells Fargo Bank, National Association, as Trustee, related to the 7.5% Notes due 2019 (incorporated by reference to Exhibit 4.2 to Registrant's Current Report on Form 8-K filed June 15, 2009)
|
|
4.5
|
Form of 7.5% Notes due 2019 (incorporated by reference to Exhibit 4.3 to Registrant's Current Report on Form 8-K filed June 15, 2009)
|
|
4.6
|
Second Supplemental Indenture, dated June 8, 2010, between IGT and Wells Fargo Bank, National Association, as Trustee, related to the 5.500% Notes due 2020 (incorporated by reference to Exhibit 4.2 to Registrant's Current Report on Form 8-K filed June 8, 2010)
|
100
|
4.7
|
Form of 5.500% Notes due 2020 (incorporated by reference to Exhibit 4.3 to Registrant's Current Report on Form 8-K filed June 8, 2010)
|
|
4.8
|
Third Supplemental Indenture, dated September 19, 2013, between IGT and Wells Fargo Bank, National Association, as Trustee, related to the 5.350% Notes due 2023 (incorporated by reference to Exhibit 4.2 to Registrant's Current Report on Form 8-K filed September 19, 2013)
|
|
4.9
|
Form of 5.350% Notes due 2023 (incorporated by reference to Exhibit 4.3 to Registrant's Current Report on Form 8-K filed September 19, 2013)
|
|
4.10
|
Amendment No. 1, dated as of October 20, 2014, between International Game Technology and Wells Fargo Bank, National Association, as trustee, to the Indenture dated as of June 15, 2009, as supplemented by the First Supplemental Indenture dated as of June 15, 2009 (incorporated by reference to Exhibit 4.1 to Registrant's Current Report on Form 8-K filed October 22, 2014)
|
|
10.1**
|
Form of officers and directors indemnification agreement (incorporated by reference to Exhibit 10.1 to Registrant's Report on Form 10-K for the year ended October 2, 2010)
|
|
10.2**
|
International Game Technology Savings Related Share Option Scheme, adopted on March 3, 2009 (incorporated by reference to Exhibit 10.2 to Registrant's Report on Form 10-K for the year ended September 30, 2011)
|
|
10.3**
|
Amendment and Restated IGT Deferred Compensation Plan (Applicable to Post-2004 Deferrals) dated December 15, 2008 (incorporated by reference to Exhibit 10.2 to Registrant's Report on Form 10-Q for the quarter ended December 31, 2008)
|
|
10.4**
|
International Game Technology 2002 Stock Incentive Plan, as amended effective July 1, 2013 (incorporated by reference to Exhibit 10.3 to Registrant's Report on Form 10-Q for the quarter ended June 30, 2013)
|
|
10.5**
|
IGT Profit Sharing Plan (as amended and restated as of April 1, 2002) (incorporated by reference to Exhibit 10.1 to Registrant's Report on Form 10-Q for the quarter ended December 31, 2002)
|
|
10.6**
|
Amendments to IGT Profit Sharing Plan dated July 14, 2003 and November 15, 2005 (incorporated by reference to Exhibit 10.8 to Registrant's Report on Form 10-K for the year ended September 30, 2006)
|
|
10.7**
|
Amendment 2006-I to IGT Profit Sharing Plan effective as of January 1, 2006 (incorporated by reference to Exhibit 10.8 to Registrant's Report on Form 10-K for the year ended September 30, 2007)
|
|
10.8**
|
IGT 2002 Stock Incentive Plan Agreement Forms: Director Stock Option Agreement; Incentive Stock Option Agreement; Nonqualified Stock Option Agreement; Restricted Stock Award Agreement; UK Stock Option Sub-Plan Option Agreement (incorporated by reference to Exhibit 10.17 to Registrant's Report on Form 10-K for the year ended September 30, 2004)
|
|
10.9**
|
IGT 2002 Stock Incentive Plan Agreement Forms: Director Restricted Stock Award Agreement (incorporated by reference to Exhibit 10.14 to Registrant's Report on Form 10-K for the year ended September 30, 2008)
|
|
10.10**
|
IGT 2002 Stock Incentive Plan Agreement Forms: Director Restricted Stock Unit Award Agreement (incorporated by reference to Exhibit 10.9 to Registrant's Report on Form 10-K for the year ended September 30, 2011)
|
|
10.11**
|
IGT 2002 Stock Incentive Plan – Form: Director Deferral Election Form – Annual RSU Award (incorporated by reference to Exhibit 10.10 to Registrant's Report on Form 10-K for the year ended September 30, 2011)
|
101
|
10.12**
|
IGT 2002 Stock Incentive Plan – Form: Director Election to Receive Equity Award in Lieu of Fees (incorporated by reference to Exhibit 10.11 to Registrant's Report on Form 10-K for the year ended September 30, 2011)
|
|
10.13**
|
IGT 2002 Stock Incentive Plan – Form: Restricted Stock Unit Award Agreement (incorporated by reference to Exhibit 10.4 to Registrant's Report on Form 10-Q for the quarter ended June 30, 2013)
|
|
10.14**
|
IGT 2002 Stock Incentive Plan – Form: Performance Restricted Stock Unit Award Agreement Fiscal 2014 (incorporated by reference to Exhibit 10.5 to Registrant's Report on Form 10-Q for the quarter ended December 31, 2013)
|
|
10.15**
|
International Game Technology Employee Stock Purchase Plan, amended and restated effective as of January 11, 2011 (incorporated by reference to Exhibit 10.2 to Registrant's Current Report on Form 8-K filed March 4, 2011)
|
|
10.16**
|
Summary of IGT Management Bonus Plan (incorporated by reference to Exhibit 10.20 to Registrant's Report on Form 10-K for the year ended September 30, 2004)
|
|
10.17**
|
Amended and Restated IGT Directors' Compensation Policy and Share Ownership Guidelines, effective September 29, 2013 (incorporated by reference to Exhibit 10.17 to Registrant's Report on Form 10-K for the year ended September 30, 2013)
|
|
10.18**
|
IGT Executive Share Ownership Guidelines, effective October 2, 2011 (incorporated by reference to Exhibit 10.15 to Registrant's Report on Form 10-K for the year ended September 30, 2011)
|
|
10.19**
|
Amended and Restated Executive Share Ownership Guidelines, effective September 30, 2012 (incorporated by reference to Exhibit 10.19 to Registrant's Report on Form 10-K for the year ended September 30, 2012)
|
|
10.20**
|
Amended and Restated Employment Agreement, dated December 1, 2009, between International Game Technology and Thomas J. Matthews (incorporated by reference to Exhibit 10.1 to Registrant's Current Report on Form 8-K filed December 7, 2009)
|
|
10.21**
|
Employment Agreement, dated November 14, 2013, between International Game Technology and Patti S. Hart (incorporated by reference to Exhibit 10.1 to Registrant's Current Report on Form 8-K filed November 15, 2013)
|
|
10.22**
|
Executive Transition Agreement, dated to be effective October 23, 2009, between International Game Technology and Patrick W. Cavanaugh (incorporated by reference to Exhibit 10.1 to Registrant's Current Report on Form 8-K filed December 23, 2009)
|
|
10.23
|
Purchase agreement dated as of May 5, 2009, between IGT and Goldman, Sachs & Co., as representative for the initial purchasers of the 3.25% Convertible Notes due May 1, 2014 (incorporated by reference to Exhibit 10.1 of Registrant's Current Report on Form 8-K filed May 11, 2009)
|
|
10.24
|
Convertible Bond Hedge Transaction, dated May 5, 2009, between IGT and Goldman, Sachs & Co., relating to the 3.25% Convertible Notes due May 1, 2014 (incorporated by reference to Exhibit 10.2 to Registrant's Report on Form 10-Q for the quarter ended June 30, 2009)
|
|
10.25
|
Convertible Bond Hedge Transaction, dated May 5, 2009, between IGT and Morgan Stanley & Co., Incorporated as Agent for Morgan Stanley & Co. International plc, relating to the 3.25% Convertible Notes due May 1, 2014 (incorporated by reference to Exhibit 10.3 to Registrant's Report on Form 10-Q for the quarter ended June 30, 2009)
|
|
10.26
|
Convertible Bond Hedge Transaction, dated May 5, 2009, between IGT and Deutsche Bank AG, London Branch, relating to the 3.25% Convertible Notes due May 1, 2014 (incorporated by reference to Exhibit 10.4 to Registrant's Report on Form 10-Q for the quarter ended June 30, 2009)
|
102
|
10.27
|
Convertible Bond Hedge Transaction, dated May 5, 2009, between IGT and BNP Paribas, relating to the 3.25% Convertible Notes due May 1, 2014 (incorporated by reference to Exhibit 10.5 to Registrant's Report on Form 10-Q for the quarter ended June 30, 2009)
|
|
10.28
|
Convertible Bond Hedge Transaction, dated May 5, 2009, between IGT and Bank of America, N.A., relating to the 3.25% Convertible Notes due May 1, 2014 (incorporated by reference to Exhibit 10.6 to Registrant's Report on Form 10-Q for the quarter ended June 30, 2009)
|
|
10.29
|
Convertible Bond Hedge Transaction, dated May 5, 2009, between IGT and The Royal Bank of Scotland plc, relating to the 3.25% Convertible Notes due May 1, 2014 (incorporated by reference to Exhibit 10.7 to Registrant's Report on Form 10-Q for the quarter ended June 30, 2009)
|
|
10.30
|
Issuer Warrant Transaction, dated May 5, 2009, between IGT and Goldman, Sachs & Co., relating to the 3.25% Convertible Notes due May 1, 2014 (incorporated by reference to Exhibit 10.27 to Registrant's Report on Form 10-K for the year ended September 30, 2009)
|
|
10.31
|
Issuer Warrant Transaction, dated May 5, 2009, between IGT and Morgan Stanley & Co. Incorporated as Agent for Morgan Stanley & Co. International plc, relating to the 3.25% Convertible Notes due May 1, 2014 (incorporated by reference to Exhibit 10.28 to Registrant's Report on Form 10-K for the year ended September 30, 2009)
|
|
10.32
|
Issuer Warrant Transaction, dated May 5, 2009, between IGT and Deutsche Bank AG, London Branch, relating to the 3.25% Convertible Notes due May 1, 2014 (incorporated by reference to Exhibit 10.29 to Registrant's Report on Form 10-K for the year ended September 30, 2009)
|
|
10.33
|
Issuer Warrant Transaction, dated May 5, 2009, between IGT and BNP Paribas, relating to the 3.25% Convertible Notes due May 1, 2014 (incorporated by reference to Exhibit 10.30 to Registrant's Report on Form 10-K for the year ended September 30, 2009)
|
|
10.34
|
Issuer Warrant Transaction, dated May 5, 2009, between IGT and Bank of America, N.A., relating to the 3.25% Convertible Notes due May 1, 2014 (incorporated by reference to Exhibit 10.31 to Registrant's Report on Form 10-K for the year ended September 30, 2009)
|
|
10.35
|
Issuer Warrant Transaction, dated May 5, 2009, between IGT and The Royal Bank of Scotland plc, relating to the 3.25% Convertible Notes due May 1, 2014 (incorporated by reference to Exhibit 10.32 to Registrant's Report on Form 10-K for the year ended September 30, 2009)
|
|
10.36
|
Credit Agreement dated as of April 14, 2011, with Bank of America, N.A. as Administrative Agent, Wells Fargo Bank, N.A. as Syndication Agent, The Royal Bank of Scotland plc, Union Bank, N.A., and Mizuho Corporate Bank, Ltd, as Co-Documentation Agents, and Wells Fargo Securities LLC, Merrill Lynch, Pierce, Fenner, and Smith Incorporated and RBS Securities, Inc., as Joint Lead Arrangers and Joint Book Runners, and a syndicate of other lenders (incorporated by reference to Exhibit 10.1 to Registrant's Current Report on Form 8-K filed April 15, 2011)
|
|
10.37**
|
IGT 2002 Stock Incentive Plan Form: Notice of Credit of Director Restricted Stock Units (with attached Terms and Conditions) (incorporated by reference to Exhibit 10.33 to Registrant's Report on Form 10-K for the year ended September 30, 2011)
|
|
10.38**
|
Executive Transition Agreement, dated October 23, 2009, between International Game Technology and Robert C. Melendres (incorporated by reference to Exhibit 10.37 to Registrant's Report on Form 10-K for the year ended September 30, 2011)
|
|
10.39***
|
Capped Accelerated Stock Buyback Agreement, dated as of June 13, 2012, by and between the Company and Goldman, Sachs & Co (incorporated by reference to Exhibit 10.1 to Registrant's Report on Form 10-Q/A Amendment No. 1 for the quarter ended June 30, 2012)
|
103
|
10.40***
|
Supplemental Confirmation, dated as of June 13, 2012, by and between the Company and Goldman, Sachs & Co (incorporated by reference to Exhibit 10.2 to Registrant's Report on Form 10-Q/A Amendment No. 1 for the quarter ended June 30, 2012)
|
|
10.41
|
Amended and Restated Credit Agreement, dated as of April 23, 2013 with The Royal Bank of Scotland plc. as Administrative Agent and Swing Line Lender, Wells Fargo Bank, N.A., as Syndication Agent and L/C Issuer, Bank of America, N.A., JPMorgan Chase Bank, N.A., Mizuho Corporate Bank, Ltd., Union Bank, National Association and U.S. Bank National Association, as Co-Documentation Agents, with Wells Fargo Securities, LLC, Union Bank, N.A. and RBS Securities Inc., as Joint Lead Arrangers and Joint Lead Book Runners, and a syndicate of other lenders (incorporated by reference to Exhibit 10.1 to Registrant's Current Report on Form 8-K filed on April 25, 2013)
|
|
10.42
|
Settlement Agreement, dated June 27, 2013, among International Game Technology, Ader Investment Management LP, Ader Long/Short Fund LP, Doha Partners, I LP, Ader Fund Management LLC, Ader Investment Management LLC and each of the other persons set forth on the signature pages thereto (incorporated by reference to Exhibit 99.1 to Registrant's Report on Form 8-K filed on July 1, 2013)
|
|
10.43**
|
Amendment 2012-III to IGT Profit Sharing Plan effective as of January 1, 2013 (incorporated by reference to Exhibit 10.47 to Registrant's Report on Form 10-K for the year ended September 30, 2013)
|
|
10.44**
|
Form of Executive Transition Agreement (entered into with John M. Vandemore, Eric A. Berg, Eric P. Tom, and Paul C. Gracey, Jr) (incorporated by reference to Exhibit 10.1 to Registrant's Current Report on Form 8-K filed on January 17, 2014)
|
|
10.45
|
Capped Accelerated Stock Buyback Agreement, dated as of November 7, 2013, by and between the Company and BNP Paribas (incorporated by reference to Exhibit 10.3 to Registrant's Report on 10-Q for the quarter ended December 31, 2013)
|
|
10.46***
|
Supplemental Confirmation, dated as of November 8, 2013, by and between the Company and BNP Paribas (incorporated by reference to Exhibit 10.4 to Registrant's Report on 10-Q for the quarter ended December 31, 2013)
|
|
10.47
|
Support Agreement, dated as of July 15, 2014, among International Game Technology, De Agostini S.p.A. and DeA Partecipazioni S.p.A. (incorporated by reference to Exhibit 10.1 to Registrant's Current Report on Form 8-K filed on July 18, 2014)
|
|
10.48
|
Voting Agreement, dated as of July 15, 2014, among International Game Technology, Georgia Worldwide Limited, De Agostini S.p.A., and DeA Partecipazioni S.p.A. (incorporated by reference to Exhibit 10.2 to Registrant's Current Report on Form 8-K filed on July 18, 2014)
|
|
10.49**
|
International Game Technology Retention Plan, dated as of August 18, 2014 (incorporated by reference to Exhibit 10.1 to Registrant's Current Report on Form 8-K filed on August 22, 2014)
|
|
10.50**
|
IGT 2002 Stock Incentive Plan – Form: Restricted Stock Unit Award Agreement
|
|
21
|
Subsidiaries
|
|
23.1
|
Consent of PricewaterhouseCoopers LLP, Independent Registered Public Accounting Firm
|
|
24
|
Power of Attorney (see next page)
|
|
31.1
|
Certification of Chief Executive Officer pursuant to Rule 13a – 14(a) of the Exchange Act, as adopted pursuant to section 302 of the Sarbanes-Oxley Act of 2002
|
|
31.2
|
Certification of Chief Financial Officer pursuant to Rule 13a – 14(a) of the Exchange Act, as adopted pursuant to section 302 of the Sarbanes-Oxley Act of 2002
|
104
|
32.1
|
Certification of Chief Executive Officer pursuant to Rule 13a – 14(b) of the Exchange Act and section 18 U.S.C. Section 1350, as adopted pursuant to section 906 of the Sarbanes-Oxley Act of 2002
|
|
32.2
|
Certification of Chief Financial Officer pursuant to Rule 13a – 14(b) of the Exchange Act and section 18 U.S.C. Section 1350, as adopted pursuant to section 906 of the Sarbanes-Oxley Act of 2002
|
|
99.1
|
Government Gaming Regulation
|
|
101.INS
|
XBRL Instance
|
|
101.SCH
|
XBRL Taxonomy Extension Schema
|
|
101.CAL
|
XBRL Taxonomy Extension Calculation
|
|
101.DEF
|
XBRL Taxonomy Extension Definition
|
|
101.LAB
|
XBRL Taxonomy Extension Labels
|
|
101.PRE
|
XBRL Taxonomy Extension Presentation
|
* Certain schedules and exhibits referenced in the Unit Purchase Agreement have been omitted in accordance with Item 601(b)(2) of Regulation S-K. A copy of any omitted schedule or exhibit will be furnished supplementally to the Securities and Exchange Commission upon request.
** Management contract or compensatory plan or arrangement
*** The Supplemental Confirmation is partially redacted pursuant to a confidential treatment order
105
Signatures
Pursuant to the requirements of Section 13 or 15(d) of the Securities Exchange Act of 1934, as amended, the registrant has caused this Annual Report on Form 10-K to be signed on its behalf by the undersigned, thereunto duly authorized.
Date: November 25, 2014
|
INTERNATIONAL GAME TECHNOLOGY
|
|
By: /s/ John Vandemore
|
|
John Vandemore
|
|
Chief Financial Officer and Treasurer
|
|
(Principal Financial Officer)
|
Power of Attorney
Pursuant to the requirements of the Securities Exchange Act of 1934, as amended, this report has been signed below by the following persons on behalf of the registrant and in the capacities and on the dates indicated. Each person whose signature appears below hereby authorizes Patti Hart and John Vandemore, or either of them, as attorneys-in-fact to sign on their behalf, individually, and in each capacity stated below, and to file all amendments and/or supplements to this Annual Report on Form 10-K.
|
Signature
|
Title
|
Date
|
|
|
/s/ Patti S. Hart
|
Chief Executive Officer
|
||
|
Patti S. Hart
|
(Principal Executive Officer)
|
November 25, 2014
|
|
|
/s/ John Vandemore
|
Chief Financial Officer and Treasurer
|
||
|
John Vandemore
|
(Principal Financial and Accounting Officer)
|
November 25, 2014
|
|
|
/s/ Philip G. Satre
|
|||
|
Philip G. Satre
|
Chairman of the Board of Directors
|
November 25, 2014
|
|
|
/s/ Paget L. Alves
|
|||
|
Paget L. Alves
|
Director
|
November 25, 2014
|
|
|
/s/ Eric Brown
|
|||
|
Eric Brown
|
Director
|
November 25, 2014
|
|
|
/s/ Janice Chaffin
|
|||
|
Janice Chaffin
|
Director
|
November 25, 2014
|
|
|
/s/ Greg Creed
|
|||
|
Greg Creed
|
Director
|
November 25, 2014
|
|
|
/s/ Robert Miller
|
|||
|
Robert Miller
|
Director
|
November 25, 2014
|
|
|
/s/ Vincent L Sadusky
|
|||
|
Vincent L. Sadusky
|
Director
|
November 25, 2014
|
|
|
/s/ Tracey Weber
|
|||
|
Tracey Weber
|
Director
|
November 25, 2014
|