Attached files
UNITED STATES
SECURITIES AND EXCHANGE COMMISSION
Washington, D.C. 20549
__________________________________________________
FORM 10-K
ANNUAL REPORT PURSUANT TO
SECTION 13 OR 15(d) OF THE SECURITIES EXCHANGE ACT OF 1934
For the fiscal year ended September 26, 2014 Commission File No. 1-7463
__________________________________________________
Jacobs Engineering Group Inc.
Delaware | 95-4081636 | |
State of incorporation | IRS Employer identification number | |
155 North Lake Avenue Pasadena, California 91101 | (626) 578-3500 | |
Address of principal executive offices | Telephone number (including area code) | |
Securities registered pursuant to Section 12(b) of the Act:
__________________________________________________
Title of Each Class | Name of Each Exchange on Which Registered | |
Common Stock, $1 par value | New York Stock Exchange | |
Securities registered pursuant to Section 12(g) of the Act: None
__________________________________________________
Indicate by check-mark if the Registrant is a well-known seasoned issuer, as defined in Rule 405 of the Securities Act: ý Yes ¨ No
Indicate by check-mark if the Registrant is not required to file reports pursuant to Section 13 or 15(d) of the Act. ¨ Yes ý No
Indicate by check-mark whether the Registrant (1) has filed all reports required to be filed by Section 13 or 15(d) of the Securities Exchange Act of 1934 during the preceding 12 months (or for such shorter period that the Registrant was required to file such reports), and (2) has been subject to such filing requirements for the past 90 days. ý Yes ¨ No
Indicate by check-mark whether the Registrant: has submitted electronically and posted on its corporate Web site, if any, every Interactive Data File required to be submitted and posted pursuant to Rule 405 of Regulation S-T (§232.405 of this chapter) during the preceding 12 months (or for such shorter period that the Registrant was required to submit and post such files).
ý Yes - ¨ No
Indicate by check-mark if disclosure of delinquent filers pursuant to Item 405 of Regulation S-K (§229.405 of this chapter) is not contained herein, and will not be contained, to the best of the Registrant’s knowledge, in definitive proxy or information statements incorporated by reference in Part III of this Form 10-K or any amendment to this Form 10-K. ý
Indicate by check-mark whether the Registrant is a large accelerated filer, an accelerated filer, a non-accelerated filer or a smaller reporting company. See the definitions of “large accelerated filer”, “accelerated filer” and “smaller reporting company” in Rule 12b-2 of the Exchange Act.
Large accelerated filer | ý | Accelerated filer | ¨ | |||
Non-accelerated filer | ¨ | Smaller reporting company | ¨ | |||
Indicate by check-mark whether the Registrant is a shell company (as defined in Rule 12b-2 of the Act) ¨ Yes ý No
There were 130,552,640 shares of common stock outstanding as of November 18, 2014. The aggregate market value of the Registrant’s common equity held by non-affiliates was approximately $8.3 billion as of March 28, 2014, based upon the last reported sales price on the New York Stock Exchange on that date.
__________________________________________________
DOCUMENTS INCORPORATED BY REFERENCE
Part III — Portions of the Registrant’s definitive Proxy Statement to be issued in connection with its 2015 Annual Meeting of Shareholders.
JACOBS ENGINEERING GROUP INC.
Fiscal 2014 Annual Report on Form 10-K
Table of Contents
Item | Page No. | ||
Item 1. | |||
Item 1A. | |||
Item 1B. | |||
Item 2. | |||
Item 3. | |||
Item 4. | |||
Item 5. | |||
Item 6. | |||
Item 7. | |||
Item 7A. | |||
Item 8. | |||
Item 9. | |||
Item 9A. | |||
Item 9B. | |||
Item 10. | |||
Item 11. | |||
Item 12. | |||
Item 13. | |||
Item 14. | |||
Item 15. | |||
Page 2
PART I
FORWARD-LOOKING STATEMENTS
In addition to historical information, this Annual Report on Form 10-K contains forward-looking statements that are not based on historical fact. When used herein, words such as "expects", "anticipates", "believes", "seeks", "estimates", "plans", "intends", and similar words identify forward-looking statements. You should not place undue reliance on these forward-looking statements. Although such statements are based on management’s current estimates and expectations, and currently available competitive, financial, and economic data, forward-looking statements are inherently uncertain and involve risks and uncertainties that could cause our actual results to differ materially from what may be inferred from the forward-looking statements. Some of the factors that could cause or contribute to such differences are listed and discussed in Item 1A—Risk Factors, below. The risk factors and other matters described herein are not all-inclusive, and we undertake no obligation to release publicly any revisions or updates to any forward-looking statements. We encourage you to read carefully the risk factors described in other documents we file from time to time with the United States Securities and Exchange Commission (the "SEC").
Unless the context otherwise requires, all references herein to "Jacobs" or the "Registrant" are to Jacobs Engineering Group Inc. and its predecessors, and references to the "Company", "we", "us" or "our" are to Jacobs Engineering Group Inc. and its consolidated subsidiaries.
Item 1. | BUSINESS |
General Background Information
We are one of the largest technical professional services firms in the world. We provide a diverse range of technical, professional, and construction services to a large number of industrial, commercial, and governmental clients. We provide four broad categories of services:
• | Project Services (including engineering, design, architecture, interiors, planning, environmental, and similar services); |
• | Process, Scientific, and Systems Consulting Services (including services performed in connection with scientific testing, analysis, and consulting activities, as well as information technology and systems engineering and integration activities); |
• | Construction Services (encompassing traditional field construction services as well as modular construction activities, direct hire construction, and construction management services); and |
• | Operations and Maintenance Services (including services performed in connection with operating large, complex facilities on behalf of clients, as well as services involving process plant and facilities maintenance). |
We focus our services on clients operating in the following industries and markets:
• | Oil and gas exploration, production, and refining; |
• | Chemicals and polymers; |
• | Programs for various national governments, including aerospace, defense, and environmental programs; |
• | Buildings (including specialized buildings for clients operating in the fields of healthcare, education, and high technology; governmental complexes; other specialized civic and mission critical buildings, installations, and laboratories; and retail and commercial buildings); |
• | Infrastructure and telecommunications; |
• | Mining and minerals; |
• | Pharmaceuticals and biotechnology; |
• | Power; |
• | Pulp and paper; |
• | Technology and manufacturing; and, |
• | Food and consumer products, among others. |
Page 3
We are headquartered in Pasadena, California, USA, and provide our services through more than 200 offices located around the globe, primarily in North America, South America, Europe, the Middle East, India, Australia, Africa, and Asia.
How We Operate
The relationships we have with our clients drive our business. As a broad-based technical professional services firm, we offer a range of services to help our clients maintain a competitive edge in their respective markets. From feasibility studies to design, to engineering, to construction, to start-up and commissioning, and then to operations and maintenance, we customize our services to meet business and project goals. Our global network of professionals works with a multi-office approach in an effort to provide clients with the best, most economical project or program solutions.
We strive to provide client value through continuous improvement in our performance. We regularly monitor our clients' expectations, our quality system, and our operational performance. Tools such as our Jacobs Value Enhancing Practices, Global Standard Operating Procedures, project reviews, the Jacobs System to Ensure Project Success ("JSTEPS") and Safe Plans of Action ("SPAs") provide added value to our clients' projects. They also allow us to create performance improvement actions during the project execution. Through continuous improvement upon our performance, our tools, and our processes, we believe we can offer our clients superior value when they do business with us.
JacobsValue+SM ("Value Plus") is an internal tool we use to document and quantify the actual value or savings we provide to our clients and their projects. Some of the benefits achieved through the Value Plus program include lower total installed cost, shorter schedule, and reduced life cycle cost. Value Plus is implemented at project initiation: a project goal is created, and cost-saving ideas are entered into the Value Plus database. When the Value Plus cycle is complete, the project team and client identify unique cost and/or schedule reductions for the project.
Our Business Model
Our organizational structure and integrated system for delivering services are key components of our business strategy. Our operating units generally use a matrix organizational structure whereby our project management functions are supported by the various technical planning, design, and construction disciplines that are necessary to effectively execute long-term engineering and construction contracts. We recognize that technical expertise alone cannot grow our business; project management skills and the ability to manage multi-million dollar projects and programs for our clients are critical to our success. Crucial functions, such as project controls and procurement, are embedded within each of our major offices and serve operations by providing specialized services required by projects.
Our business is set up to foster cooperation among teams and across our operating units. We do not maintain “profit centers” within the Company, nor do the operating groups compete against each other for contracts. Our organizational structure and integrated system for delivering services are key components of our business strategy. The following three ideas support our business model:
Multi-Domestic Approach
We work in many countries with locally staffed offices that share a common set of values, tools, and a single vision, while maintaining one-on-one contact with individual clients. This multi-domestic approach enables us to provide customized service suited to the locale while still taking advantage of the Company’s global network.
Boundaryless Approach
Our diversity encompasses our people, geographic reach, expertise, and technical capabilities. On projects around the world, we enhance local expertise with the best talent and the best technology available anywhere throughout the Company. This seamless, boundaryless approach keeps us flexible and enhances our ability to develop the best possible solutions for our clients, regardless of office or project location.
Cost Management Approach
As the global economy expands and companies providing technical, professional, and construction services are required to compete against each other across geographic boundaries, the Company that can provide its clients with cost-efficient solutions to their project needs has the advantage. With a relentless focus on managing costs, we provide savings to clients and deliver superior technical, professional, and construction services safely, efficiently, and within the cost and time parameters our clients require.
Page 4
Jacobs’ corporate functions include Quality and Safety, Finance and Administration, Legal, Compliance, Communications, Global Sales and Marketing, Human Resources, and Information Technology departments that are integral to our success.
The Company's Culture
Our employees are our most important and valuable asset and, therefore, the prevention of job-related injuries is given top priority. It is the policy of the Company to provide and maintain a safe and healthy working environment and to follow operating practices that safeguard all employees and result in a more efficient operation.
BeyondZero® , the name of our program that promotes our culture of caring, moves beyond efforts to have an incident and injury-free safety performance. We implement a true culture of caring where concern for employees' health, safety, and welfare extends outside the office walls, beyond the project site fences and into their homes, cars, and all the places where they interact with family, friends, and fellow employees. It actively involves employees in championing the safety and wellness of themselves and others, encouraging every employee to have the courage to take action and positively influence the intentions and behaviors of those around them, with the belief that the safety and wellness of employees are integrally linked to sound business performance and efficiency in project execution.
Since Jacobs’ founding, the Company has been based on doing business honestly, ethically, and with the utmost integrity. Our culture, and our Code of Conduct that is signed annually by all employees, prescribes that everyone at the Company must adhere to Jacobs’ Core Values and ethical code, and comply with the laws that govern the Company’s activities worldwide. Our employees and business partners are expected to follow the highest principles of business conduct, integrity, and ethics as they carry out their responsibilities, and are guided by the following principles in carrying out their responsibilities: loyalty, compliance with applicable laws, observance of ethical standards, avoidance of conflicts of interest, and communication. We endeavor to deal fairly with our employees, customers, suppliers, and competitors, and to respect the policies and procedures of those outside the Company.
Our objective is to present a clear and consistent image of our Company to our clients, employees, shareholders, and business partners - regarding how we behave, how we communicate, how we look, and most importantly, how our promises to our clients are delivered - anywhere in the world.
We accomplish this foremost through our core values, which allow us to behave as one company and unify us worldwide. By keeping our core values as a central focus of our Company, we are able to think the same way and arrive at similar conclusions, regardless of our physical location. Our core values are:
• | People are our greatest asset; |
• | We are relationship-based; and |
• | Growth is an imperative. |
The balance inherent in our core values is also evident in our approach to sustainability, which maintains an even balance between the people, the economics, and the environmental aspects of business. Jacobs is driven to continuously improve efficiencies and reduce energy and resources, practices that drive down costs and contribute to a lower impact on the environment. The Company adheres to the following seven sustainability principles:
• | Sustainable development is a corporate priority; |
• | We seek broad, deep, differentiated capabilities and services; |
• | Sustainable development is integrated into our business; |
• | Training and education are important; |
• | Our facilities and operations follow sustainable principles; |
• | We contribute to the common effort for sustainability; and |
• | We are open and transparent. |
Applying the best, most efficient and effective sustainable solutions for clients worldwide, in all major industries in our clients operate, allows us to make a significant contribution to a safe and sustainable future. Each year we issue a Sustainability Report that describes many of our efforts and accomplishments regarding environmental sustainability.
With respect to human resources, our goal is to establish an inclusive, diverse workplace that energizes the people who fuel our Company's growth. Although we are a large company with over 66,300 employees in over 25 countries, our
Page 5
employees are unified in their focus on superior value, safety, and ethical business practices; regardless of the country. Employees frequently move around the system as they grow their careers and serve clients; so everyone at the Company is urged to operate with a boundaryless mindset; connecting across geographies, disciplines, and industries to collaborate on innovative solutions that provide maximum value to clients.
How We Grow
Jacobs has grown significantly since its founding in 1947; both through organic growth and through strategic acquisition, an important part of the Company’s growth strategy. We have successfully acquired and integrated numerous companies over the years that have enhanced our capabilities, geographic reach, and offerings.
In terms of organic growth, our relationship-based business model is central to our sustained growth and profitability. We pursue the development of long-term relationships and alliances with our clients. By working with our clients on their capital programs, we increase our understanding of their overall business needs, as well as the unique technical requirements of their specific projects. This increased understanding enables us, we believe, to provide superior value to our clients. Our approach provides us with opportunities to market the services our clients are expected to need in the pre-design phase, such as master planning, permitting, or project finance options; in the design phase; and in the construction, post-start-up and commissioning phases of a facility, including operations and maintenance services.
Our relationships with clients also present ongoing opportunities to expand into adjacent markets. For example, clients operating in the mining and minerals market often have a need for our infrastructure and buildings capabilities. The same is true for clients operating in other markets.
We market our services to clients in a wide range of public and institutional, process, and industrial markets. We increase our opportunities through selective market diversity, and are able to price contracts more competitively and enhance overall profitability while delivering additional value to our clients by integrating and bundling our services. In complex economic times, we have the ability to evolve along with market cycles worldwide. When opportunities decrease in a particular market or geography, other opportunities often increase. Because of our selective market diversity, we believe we are well-positioned to address a wide range of opportunities across many markets and geographies, which helps us grow our business.
Closely linked to our relationship-based business model is our multi-domestic geographic strategy. Our core clients can depend on us for assistance with their engineering and construction needs when they move projects around the world. We therefore follow our clients into new geographic regions, which helps us perform meaningful portions of their projects by utilizing local resources rather than exporting the work to other offices.
The Role of Acquisitions and Strategic Investments in the Development Our Business
When we review acquisition targets, we are conscious of the effect the acquisition may have on our client base. We favor acquisitions that allow us to (i) expand into a new client market; (ii) enhance the range of services we provide existing clients; and/or (iii) access new geographic areas in which our clients either already operate or plan to expand. By expanding into new geographic areas and adding to our existing technical and project management capabilities, we strive to position ourselves as a preferred, single-source provider of technical, professional, and construction services to our major clients. The following is a brief description of some of our recent key acquisitions (in chronological order):
• | On July 1, 2014, the Company acquired Federal Network Systems ("FNS"), a subsidiary of Verizon Communications headquartered in Ashburn, Virginia. FNS provides systems integration and communication, information technology and data security solutions for the global market; with particular focus on supporting the Intelligence Community, the U.S. Department of Defense ("DoD"), and federal civilian customers. FNS designs, integrates, secures, operates and maintains highly complex mission critical voice, data and video networks. |
• | On February 7, 2014, the Company acquired Eagleton Engineering, LLC ("Eagleton") headquartered in Houston, Texas. The acquisition enhances the Company's capabilities in midstream and upstream pipeline engineering, design and field surveying services. Eagleton specializes in pipeline engineering, primarily providing professional services and resources to the oil, gas and petrochemical industries. The firm’s services cover the full life cycle of project planning and delivery, from conceptual studies and design to full turnkey engineering, procurement and construction solutions and operational support. |
• | On January 7, 2014, the Company acquired the assets of FMHC Corporation ("FMHC") headquartered in Chicago, Ill. This acquisition enhances the Company's capabilities turnkey wireless communications site |
Page 6
development, design, network deployment, construction, and related services to clients operating in the wireless telecommunications industry.
• | On December 20, 2013, the Company acquired the stock of Stobbarts Limited, a construction firm based in West Cumbria, United Kingdom. The acquisition enhances the Company's capabilities in nuclear, decommissioning, construction and civil engineering. |
• | On December 13, 2013, the Company acquired all of the outstanding interests in Sinclair Knight Merz Management Pty Limited and Sinclair Knight Merz Holdings Limited (collectively, "SKM"), a provider of engineering, design, procurement, construction and project management services, from the SKM shareholders. Due to its size and complexities, more information about the SKM acquisition is provided throughout this report. |
• | On November 22, 2013, the Company acquired certain assets and liabilities of MARMAC Field Services, Inc. ("MARMAC") headquartered in Costa Mesa, California. The acquisition enhances the Company's capabilities in pipeline engineering and design services; both geographically and by adding additional capabilities to serve the utility and gas industries. |
• | On October 18, 2013, the Company acquired an 45% interest in Guimar Engenharia, a privately held engineering services and project management/construction management ("PMCM") company based in Rio de Janeiro, Brazil. The acquisition represents Jacobs’ first significant investment in Brazil. Guimar has a broad client base and operations throughout Brazil, where it is a leading provider of PMCM services for clients in the pulp and paper, petroleum, chemicals, food and beverage, mining and minerals, building and infrastructure industries. |
• | On October 14, 2013, the Company acquired substantially all the assets and liabilities of the Trompeter Group. This acquisition enhances the Company's capabilities in advanced engineering services, maintenance support, technical training services, and contingent workforce services to the automotive manufacturing industry. The business is headquartered in Detroit, Michigan. |
• | On August 30, 2013, the Company's South African joint venture, Jacobs Matasis (Proprietary) Limited, acquired Ilitha Projects and Ilitha Staffing. Ilitha Projects provides management and Engineering, Procurement, Construction and Management (EPCM) services to clients in a broad range of market sectors, including oil and gas, refining, chemicals, power, nuclear, marine mining and metals. Ilitha Staffing supplies technical contract staff sourcing and management services with a strong emphasis on integration with the client’s culture and business practices. |
• | Commencing on June 6, 2013, and through the end of fiscal 2014, the Company acquired further ownership interests in Consulting Engineering Services (India) Private Limited (“CES”), an infrastructure and civil engineering company headquartered in Delhi, India. During the fiscal year 2014, we acquired an additional 24.6% interest in CES bringing our ownership interest in CES, to 94.6%. CES provides a range of solutions in infrastructure development, planning, engineering, and construction management. |
• | On May 28, 2013, we acquired Compass Technology Services, Inc. ("Compass"), headquartered in Atlanta, Georgia. Compass is a provider of telecommunications professional and field services in the Southeastern U.S. and enhances the Company's capabilities in wireless telecommunications infrastructure design and construction. |
• | In August 2012, we acquired a consulting project management business based in Sydney, Australia. The primary purpose of this acquisition was to expand our geographic presence and grow our infrastructure business in Australia. |
• | In December 2011, we acquired Unique World Pty Ltd., headquartered in Sydney, Australia. Unique World is an information management and knowledge management consultancy specializing in enabling technologies such as collaboration, business process automation, business intelligence, intranets, and portals. Unique World expands the Company's capabilities in Australia to include such information technology ("IT") services, as well as expanding the client base to which we can offer these services. |
Page 7
• | In November 2011, we acquired KlingStubbins, Inc., a 500-person firm headquartered in Philadelphia, Pennsylvania, USA, with offices located throughout the U.S. and China. KlingStubbins provides professional services in the areas of architecture, engineering, interiors, planning, and landscape architecture. The markets served by KlingStubbins include corporate/commercial, governmental, science and technology, higher education, mission critical, and interiors. |
After we complete an acquisition, we generally move very quickly to integrate the newly-acquired operations. We typically assign senior operations personnel to manage the overall integration process with assistance from our sales, accounting, legal, IT, human resources, and risk management departments. Although integrating newly acquired businesses can be very challenging, the assimilation process is critical in order to assure (i) that our global businesses processes and systems are properly deployed throughout the newly-acquired entities and (ii) that we can begin to leverage-off the acquired talents, skills, and expertise to grow our business and help our clients execute their capital programs. Newly-acquired businesses are generally not left as stand-alone entities within the Company’s internal reporting system. The businesses we acquire are typically folded in to existing operational organizations within the Company. For additional information regarding certain issues related to our acquisition strategy, please refer to Item 1A— Risk Factors below.
Page 8
Financial Information About Segments
Although we describe our business in this Annual Report on Form 10-K in terms of the various services we provide, the markets in which our clients operate, and the geographic areas in which we operate, we have concluded that our operations may be aggregated into one reportable segment pursuant to those accounting principles generally accepted in the U.S. (“U.S. GAAP”). In making this determination, we considered the various economic characteristics of our operations, including: the nature of the services we provide, the nature of our internal processes for delivering and distributing those services, and the types of customers we have. In addition to the discussion that follows, please refer to Note 14 — Segment Information of Notes to Consolidated Financial Statements beginning on page F-1 of this Annual Report on Form 10-K.
There is a high degree of similarity among the workforces employed across the categories of services we provide. For example, professionals in engineering and design services (i.e., services provided by persons who are degreed, and in certain circumstances licensed, such as engineers, architects, scientists, and economists) exist in all four service categories. In addition, there is a high degree of similarity among a significant component of the workforces we employ to perform construction and operations and maintenance ("O&M") projects. In providing construction and O&M services, we employ a large number of skilled craft labor personnel. These may include welders, pipe fitters, electricians, crane operators, and other personnel who work on very large capital projects (in the case of projects classified within the construction services category) or on smaller capital projects (in the case of maintenance projects classified within the O&M services category).
All of our offices use a matrix organizational structure. Our results, therefore, are dependent on groups representing technical disciplines (e.g., electrical engineering, mechanical engineering, cost engineering, etc.) supporting project management personnel (who maintain the relationship between our clients and us and are ultimately responsible for delivering projects to our clients safely, on time, and on budget). Additionally, all of our operating regions use common tools, policies, and procedures to manage and run their respective units. These include project review meetings, project performance evaluations, and project execution plans.
Each of the Company's operating regions provides most of the services the Company offers generally, and each of our operating regions includes in its customer base many of the same or similar clients as our other regions.
The use of technology throughout our organization is highly uniform. Whether it is computer-aided design and drafting (“CADD”) applications used by our engineering and design staff, or modeling programs used by the scientific and consulting staff, or scheduling, estimating, and cost control applications used by home-office personnel in support of our construction and maintenance activities, all of the service categories described above are equally affected by changes in technology as they occur in the economy at large.
Furthermore, the types of information and internal reports used by the Company’s chief operating decision maker (the “CODM”), who is also the Company’s chief executive officer, and other members of management to monitor performance, evaluate results of operations, allocate resources, and otherwise manage the business support a single reportable segment. Accordingly, based on these similarities, we have concluded that our operations may be aggregated into one reportable segment for purposes of the disclosures included in this Annual Report on Form 10-K.
Page 9
Services Provided
As described above, the services we provide generally fall into the following four broad categories: Project Services; Process, Scientific, and Systems Consulting services; Construction services; and Operations and Maintenance ("O&M")services.
The following table sets forth our revenues from each of our four service categories for each of the last five fiscal years (in thousands):
2014 | 2013 | 2012 | 2011 | 2010 | ||||||||||||||||
Project Services | $ | 6,576,004 | $ | 5,977,917 | $ | 5,693,419 | $ | 5,070,575 | $ | 4,224,898 | ||||||||||
Process, Scientific, and Systems Consulting | 758,957 | 705,694 | 772,031 | 815,561 | 888,405 | |||||||||||||||
Construction | 4,138,729 | 3,825,878 | 3,145,311 | 3,060,820 | 3,722,101 | |||||||||||||||
Operations and Maintenance (“O&M”) | 1,221,467 | 1,308,887 | 1,283,017 | 1,434,708 | 1,080,113 | |||||||||||||||
$ | 12,695,157 | $ | 11,818,376 | $ | 10,893,778 | $ | 10,381,664 | $ | 9,915,517 | |||||||||||
Project Services
We employ the engineering, architecture, interiors, design, planning, and related disciplines necessary to design and engineer modern process plants, buildings, infrastructure projects, technology and manufacturing facilities, consumer products manufacturing facilities, power plants and stations, pulp and paper plants, and other facilities.
We are capable of providing our clients with a variety of value engineering services, including "safety in design". Through safety in design we integrate best practices, hazard analysis, and risk assessment methods early in the design phase of projects, taking those steps necessary to eliminate or mitigate injury and damage during the construction, start-up, testing and commissioning, and operations phases of a project.
In the area of construction management, we provide our clients with a wide range of services as an agent for our clients. We may act as program director, whereby we oversee, on the owner's behalf, the complete planning, design, and construction phases of the project. Alternatively, our services may be limited to providing construction consulting.
Project Services also includes planning, scheduling, procurement, estimating, cost engineering, project accounting, quality and safety, and all other key support services needed for complete cradle-to-grave project delivery.
Process, Scientific, and Systems Consulting Services
We employ the professional and technical skills and expertise with respect to a broad range of consulting services, including: performing pricing studies, market analyses, and financial projections necessary in determining the feasibility of a project; performing gasoline reformulation modeling; analyzing and evaluating layout and mechanical designs for complex processing plants; analyzing automation and control systems; analyzing, designing, and executing biocontainment strategies; developing and performing process protocols with respect to the U.S. Food and Drug Administration-mandated qualification and validation requirements; and performing geological and metallurgical studies.
Also included in this service category are revenues relating to defense and aerospace-related programs. Such services typically are more technical and scientific in nature than other project services we provide, and may involve such tasks as supporting the development and testing of conventional weapons systems; weapons modeling and simulations; computer systems development, maintenance, and support; evaluation and testing of mission-critical control systems; aerospace, testing, and propulsion systems and facilities; and other highly technical or scientific tasks.
Construction Services
In addition to the construction management services included under Project Services above, we provide traditional field construction services to private and public sector clients. We also provide our clients with a modular construction option. Our modular construction includes the engineering and construction of a facility in an off-site fabrication and assembly environment, with final completion during the field erection phase. The option provides our clients with an alternative approach to traditional methods of engineering and construction, which can compress and shorten the construction schedule, reduce risk, lower costs, and provide environmental benefits. In the area of environmental remediation and restoration, we also provide environmental remedial construction services for a variety of public and private sector clients.
Page 10
Historically, our field construction activities have been focused primarily on those construction projects for which we perform much of the related engineering and design work. By focusing our construction efforts in this way, we minimize the risks associated with constructing complex projects based on designs prepared by third parties. The financial risk to us of constructing complex assets based on designs prepared by third parties may be particularly significant on fixed-price contracts; therefore, we generally avoid this type of project. However, we will pursue construction-only projects when we can negotiate pricing and other contract terms we deem acceptable and which we believe can result in a fair return for the degree of risk we assume.
Operations and Maintenance ("O&M") Services
O&M refers to all of the tasks required to operate and maintain large, complex facilities on behalf of clients. We provide key management and support services over all aspects of the operations of a facility, including managing subcontractors and other on-site personnel. O&M also includes process plant maintenance services, which generally involves all tasks required to keep a process plant (typically a refinery or chemical plant) in day-to-day operation.
Within the aerospace and defense areas, O&M often requires us to provide the management and technical support services necessary to operate and maintain such sites as engine test facilities, weapons integration facilities, and high-tech simulation and verification centers. Such O&M contracts also frequently require us to provide facilities management and maintenance services; utilities operations and maintenance services; property management and disposition services; and construction support services.
Within the environmental area, O&M often includes engineering and technical support services as well as program management services necessary to remediate contaminated sites.
Although the gross profit margins we realize from O&M services are generally lower than those associated with the other services we provide, the costs to support maintenance activities are also generally lower. Also, O&M services offer us an opportunity for long-term relationships with clients. This aspect of O&M services greatly reduces the selling costs in respect of such services.
Page 11
The Industries and Markets in Which Our Clients Operate
We market our services to clients where the scope of work required by their capital projects and programs is within our expertise. Within each market, we may offer specialty services unique to the sector, or services which differentiate us from our competitors in the marketplace.
The following table sets forth our revenues from each of the various industry groups and markets in which our clients operate for each of the last five fiscal years (in thousands):
2014 | 2013 | 2012 | 2011 | 2010 | ||||||||||||||||
Chemicals and Polymers | $ | 2,985,352 | $ | 2,391,144 | $ | 1,704,723 | $ | 1,461,125 | $ | 1,203,373 | ||||||||||
Refining – Downstream | 2,239,343 | 2,337,387 | 2,379,750 | 2,256,092 | 2,876,059 | |||||||||||||||
National Government Programs | 2,282,116 | 2,284,533 | 2,272,611 | 2,313,240 | 2,314,548 | |||||||||||||||
Infrastructure | 1,361,574 | 1,015,864 | 1,085,649 | 1,219,633 | 938,978 | |||||||||||||||
Mining & Minerals | 918,608 | 712,320 | 550,134 | 449,194 | 26,161 | |||||||||||||||
Oil & Gas – Upstream | 863,344 | 915,478 | 790,546 | 753,471 | 559,492 | |||||||||||||||
Buildings | 834,122 | 738,404 | 843,938 | 893,528 | 869,248 | |||||||||||||||
Industrial and Other | 758,036 | 899,756 | 690,124 | 630,694 | 537,863 | |||||||||||||||
Pharmaceuticals and Biotechnology | 452,662 | 523,490 | 576,303 | 404,687 | 589,795 | |||||||||||||||
$ | 12,695,157 | $ | 11,818,376 | $ | 10,893,778 | $ | 10,381,664 | $ | 9,915,517 | |||||||||||
Chemicals and Polymers
Our clients in this sector rely on our extensive knowledge of and experience with feedstock synthesis, chemical synthesis, and polymerization, including advanced polymerization reactors and state-of-the-art, post-reactor processing techniques to help bring new products and new facilities to market quickly and economically. We apply best practices on capital and maintenance work by leveraging resources within our alliances and partnerships. Specialty services we provide to our clients in these industries include project finance structuring consulting, market analysis, facility appraisal, and procurement with global inspection capabilities.
An important capability we offer our clients in the chemicals business is in the area of field services. We have contracts with major chemical producers worldwide to provide construction, on-site maintenance, and turnaround activities. Many of these contracts are evergreen in nature, with relationships extending over many years due to our focus on safety, value, and client satisfaction and lead us to numerous formal alliances.
Refining - Downstream
Our typical refining projects for global clients include new design and construction, revamps or expansions of existing plants, turnarounds, upgrades of individual process units within refineries, and long-term maintenance services. We also provide process assessments, facility appraisals, feasibility studies, technology evaluations, project finance structuring and support, and multi-client subscription services.
Our modular construction capabilities, asset management/maintenance services, and formal client alliances help differentiate us to customers operating in this industry. Using modular construction decreases congestion at the construction site and provides enhanced safety, cost, and project execution benefits in remote locations.
We also include power generation projects within our clients' refining and processing facilities, such as simple and combined cycle power projects, industrial gas turbines, and emergency power generation stations. In addition, we offer support in the procurement and commissioning of equipment.
National Government Programs
We categorize our National Government Programs as generally relating to aerospace and defense programs or environmental programs for government entities.
Page 12
Aerospace and Defense Programs
We provide an in-depth range of science, engineering, construction and technical support services to the aerospace and defense industry. Long-term clients include the Ministry of Defence in the U.K., NASA, the DoD, the U.S. Special Operations Command ("USSOCOM"), and the Australian Department of Defence. Specific to NASA is our ability to design, build, operate, and maintain highly complex facilities relating to space systems, including test and evaluation facilities, launch facilities, and support infrastructure.
Our experience in the defense sector includes military systems acquisition management and strategic planning; operations and maintenance of test facilities and ranges; test and evaluation services in computer, laboratory, facility, and range environments; test facility computer systems instrumentation and diagnostics; and test facility design and build. We also provide systems engineering and integration of complex weapons and space systems, as well as hardware and software design of complex flight and ground systems.
We have provided advanced technology engineering services to the DoD for more than 50 years, and currently support major defense programs in the U.S. and internationally. We operate and maintain several DoD test centers and provide services and assist in the acquisition and development of systems and equipment for Special Operations Forces, as well as the development of biological, chemical, and nuclear detection and protection systems.
We maintain enterprise information systems for government and commercial clients worldwide, ranging from the operation of complex computational networks to the development and validation of specific software applications. We also support the DoD in a number of information technology programs, including network design, integration, and support; command and control technology; development and maintenance of databases and customized applications; and security solutions.
Environmental Programs
We provide environmental investigation, permitting, restoration, remediation, engineering, and site operations services to a number of European, North American, and Middle Eastern government agencies. Our projects include hazardous and nuclear waste management and site cleanup and closure; the preparation of feasibility studies and environmental investigations; environmental design; and remediation services on several national programs, as well as compliance with various national environmental policies.
Additionally, we support our clients in such areas as pollution prevention assessments; underground storage tank removal; contaminated soil and water remediation, monitoring and systems cleanup; long-term water quality management plans; and air quality planning and permitting. Much of this type of work is in support of large infrastructure projects that are underway in both Europe and in North America.
As a differentiating aspect of our support to our government clients, we provide asset management services in the form of long-term infrastructure operations and maintenance. Asset management also includes building closures that involve deactivation, decommissioning, and demolition of government facilities. This is an integral part of our services for the DoE.
Infrastructure
The strengths we offer our clients in this industry group include expertise in transportation, transit, aviation, water and wastewater, and civil construction projects throughout North America, Europe, India, the Middle East, and Asia. Representative clients include national government departments and agencies in the U.S. and the U.K.; state departments of transportation within the U.S.; other regional and local agencies; and private industry freight transport firms.
Transportation development/rehabilitation is a core competency of our infrastructure business. Typical projects include highways, bridges, transit, tunnels, airports, railroads, intermodal facilities, and maritime or port projects where our interdisciplinary teams work independently or as an extension of the client's staff. Providing alternative financing methods has proven successful in Europe where there is privatization of public infrastructure systems.
In water infrastructure, we help public and private sector clients develop or rehabilitate critical water resource systems. Emerging economies are investing heavily in water and wastewater systems, while governments in North America and Europe are addressing the challenges of drought and aging infrastructure. We also develop water/wastewater conveyance systems and water flood defense projects.
Oil & Gas - Upstream
Page 13
As international oil companies develop reserves and try to maximize their existing resources, our expertise in a range of production methods, combined with our commitment to safety and strength in project management, helps us deliver a wide range of projects for oil and gas operators.
In the exploration and production market, our projects range from oil recovery through steam injection to gas treating, gas gathering, and gas storage projects including extraction of commercially valuable elements of the gas stream, utilizing new technologies such as Steam-Assisted Gravity Drainage ("SAGD").
Typical projects for our clients in this sector involve the design and construction of projects that recover oil and gas, and include oil thermal recovery facilities either by in-situ means or oil sands mining, upgraders, pipelines, gas plants, and CO2 flood. These are typically large projects that may involve many of our offices and often include work-share with our Mumbai, India office as a value-added engineering center to reduce project costs.
We also provide substantial maintenance and modification services for aging oil and gas facilities around the world. In connection with the refining market, we also provide process assessments, facility appraisals, feasibility studies, technology evaluations, project finance structuring consulting services, and other support services.
Buildings
We have planned, designed, and constructed buildings for a variety of clients and markets for more than 60 years. We believe our global presence and understanding of contracting and delivery demands keep us in an excellent position to provide professional services worldwide.
Our diversified client base encompasses both public and private sectors and relates primarily to institutional, commercial, government and corporate buildings, including projects at many of the world's leading medical and research centers, and universities. We focus our efforts and resources in areas where capital spending initiatives drive demand, and where changes and advances in technology require innovative, value-adding solutions. We also provide integrated facility management services (sometimes through joint ventures with third parties) for which we assume responsibility for the ongoing operation and maintenance of entire commercial or industrial complexes on behalf of clients.
We have specific capabilities in energy and power, master planning, and commissioning for office headquarters, aviation facilities, mission-critical facilities, municipal and civic buildings, courts and correctional facilities, mixed-use and commercial centers, healthcare and education campuses, and recreation complexes.
Advanced technology clients require highly specialized buildings in the fields of medical research, nano science, biotechnology, and laser sciences. We offer total integrated design and construction management solutions to these projects, many of which are world leaders in their functions.
Our acquisition of design firm KlingStubbins reinforces our commitment to our clients in this industry group, expanding our capabilities to clients in the pharma-bio, data center, government intelligence, corporate headquarters/interiors, and science and technology-based education markets around the globe.
Our government building projects include large, multi-year programs in the U.S. and Europe. U.S. government agencies we serve include the Federal Aviation Administration ("FAA"); the General Services Administration ("GSA"); the Internal Revenue Service ("IRS"); the U.S. Departments of State, Treasury, Agriculture, Homeland Security, and Defense; and the Army National Guard, among others. In the U.K., we are leading the Custodial Services' project management delivery program to upgrade the U.K. prison stock and also certain security-led programs such as upgrading works to the Palace of Westminster and some regional police authorities.
We are providing services to the DoD on military family housing; quality of life projects; training, maintenance, and readiness facilities; and command and control centers, as well as military facilities supporting the DoD's global re-basing program, the 2005 Base Realignment and Closure ("BRAC") program.
Mining and Minerals
Our mining and minerals business targets the non-ferrous and ferrous metal markets, precious metals, energy minerals (uranium, coal, oil sands), and industrial and fertilizer minerals (mineral sands, borates, trona, phosphates and potash). We work with many of the resources companies undertaking new and existing facility upgrades and process plant developments. We offer project management; front-end studies; and full EPCM capabilities; completions, commissioning and start-up services specializing in new plant construction, brownfield expansions, and sustaining capital and maintenance projects.
Page 14
For our mining and mineral clients, we provide the industry proprietary sulfuric acid production technology through our Chemetics® product - an important synergistic by-product of the smelting process and a key consumable in mines employing ore leaching technology. We are also able to deliver value to our mining clients by providing distinctive adjacent capabilities such as infrastructure and major equipment and materials to support their mining operations.
By focusing on mitigating our clients' resource risk, we are able to address challenges of tight labor markets by providing a reliable and familiar labor pool for their ongoing projects. We host local offices in the most active mining geographies (South America, Australia, Canada, India, and South Africa), and can thereby effectively help our clients improve their project delivery and resource availability.
Pharmaceuticals and Biotechnology
We provide our pharmaceuticals and biotechnology clients single-point consulting, engineering, procurement, construction management, and validation ("EPCMV") project delivery, enabling us to execute the industry's largest capital programs on a single-responsibility basis. Typical projects in this sector include laboratories, research and development facilities, pilot plants, bulk active pharmaceutical ingredient production facilities, full-scale biotechnology production facilities, and secondary manufacturing facilities.
As companies in this industry continue to experience pressure to decrease product time-to-market, reduce costs, and increase return on investment, the types of services we provide have grown over the years to include modular construction, as well as consulting and strategic planning to help our clients complete capital projects faster and more efficiently.
Regulatory compliance, state-of-the-art technology, and increased efficiencies are critical issues to our clients in these industries. We have expertise in containment, barrier technology, locally controlled environments, building systems automation, and off-the-site design and fabrication of facility modules; in addition to vaccine production and purification, and aseptic processing.
Industrial and Other
We provide a broad range of services to our clients operating in the power; pulp and paper; high-technology manufacturing; and food, beverage, and consumer products industries and markets.
Power
Global energy demand is expected to grow by nearly 50 percent over the next 25 years, according to the U.S. Energy Information Administration. Significant capital spend in the power business is being driven by plant obsolescence and the need for utilities to comply with regulatory requirements and changes in environmental legislation. Our typical projects include simple and combined cycle power projects, cogeneration power plants, asset lifetime extension projects, and emergency power generation stations. In addition to traditional engineering, we offer services in procurement and commissioning of equipment, as well as construction services for the power market including thermal, biomass, renewables, and nuclear energy facilities.
Pulp and Paper
The pulp and paper industry has been consolidating for many years, and several of our traditional pulp and paper clients have emerged as major consumer product companies. These clients have created new opportunities for us in non-traditional areas, such as wall board plants and facilities that manufacture diapers and feminine care products. Typical projects range from small mill projects to complex, multi-million-dollar paper machine rebuilds, mill expansions, and the construction of new facilities.
Pulp and paper projects encompass many areas of a mill, and our expertise also includes the converting and packaging of paper products for distribution and consumer use. Our pulp and paper capability extends through our offices in the U.S., U.K., France, Spain, Italy, and Mexico to clients worldwide. A significant portion of our work consists of assisting our clients in their compliance with environmental regulations and standards that affect the pulp and paper industry. We monitor all key environmental regulations affecting our clients and offer compliance studies, permitting support, design of pollution control systems, and compliance services regarding air pollutant standards and hazardous air pollutant emission limits from industrial boilers.
High-Technology Manufacturing
We provide our core services for a variety of high tech manufacturing and test facilities, particularly for clients in the automotive and industrial industries. Typical automotive projects range from conceptual design and feasibility studies to
Page 15
complete design-build programs of aero-acoustic wind tunnels, engine test facilities, acoustic enclosures, transmission test stands; powertrain, environmental, emissions, altitude, and electromagnetic compatibility test facilities; in-line and end-of-line component test stands; and computer-based measurement and control systems. We also serve advanced technology and research facilities, including facilities supporting research in fusion and fission energy, nanoscale materials, and high-powered lasers and X-rays to support important research activities in the U.S., Europe, and the U.K.
In addition, we perform projects for clients operating in the semiconductor industry. Projects in the semiconductor industry are typically more complex than many other commercial facilities, requiring a greater emphasis on cleanroom and similar high-end technologies. Our projects range from on-site plant engineering and tool hookups to multi-million dollar state-of-the-art wafer fabrication and crystal growing facilities used to produce solar energy cells, microprocessors for computers, and other consumer electronic devices.
Food, Beverage, and Consumer Products
As a provider to the food, beverage, and consumer products supply chain, our global presence and capabilities allow us to help our clients with targeted expansion and new investments. Our food processing services include hygienic design, clean-in-place ("CIP") systems, heat transfer systems, material handling of liquids and solids, refrigeration, and compliance with government requirements. From facility design to raw materials processing to converting, packaging, and distribution, our vast depth of expertise helps our clients do just that. Our knowledge of food and beverage processing results in plants that are productive, efficient, and economical.
Backlog
Backlog represents the total dollar amount of revenues we expect to record in the future as a result of performing work under contracts that have been awarded to us. With respect to O&M contracts, however, we include in backlog the amount of revenues we expect to receive for only one succeeding year, regardless of the remaining life of the contract. For national government programs (other than U.S. federal O&M contracts), our policy is to include in backlog the full contract award, whether funded or unfunded, excluding option periods. In accordance with industry practice, substantially all of our contracts are subject to cancellation, termination, or suspension at the discretion of the client. In addition, the contracts in our backlog are subject to changes in the scope of services to be provided as well as adjustments to the costs relating to the contracts. Accordingly, backlog is not necessarily indicative of our future revenues or earnings.
Our backlog includes expected revenues for contracts that are based on estimates. For additional information regarding our backlog including those risk factors specific to backlog, please refer to Item 1A — Risk Factors, and Item 7 — Management’s Discussion and Analysis of Financial Condition and Results of Operations, below.
Significant Customers
The following table sets forth the percentage of total revenues earned directly or indirectly from agencies of the U.S. federal government for each of the last five fiscal years:
2014 | 2013 | 2012 | 2011 | 2010 | |||||||||
17.8 | % | 19.9 | % | 22.1 | % | 24.4 | % | 25.4 | % | ||||
It is uncommon for a commercial customer to contribute 10% or more of the Company’s total revenues. On occasion, however, we will perform a number of field services projects for a single customer in the same fiscal year which, primarily because of the amount of pass-through costs (discussed below) that is included in revenue, will cause total revenue from that customer to exceed 10% of total consolidated revenues. For additional information regarding certain risks related to our customer concentration, please refer to Item 1A — Risk Factors, below.
Financial Information About Geographic Areas
Selected financial information regarding the geographic areas in which we operate is included in Note 14 — Segment Information of Notes to Consolidated Financial Statements beginning on page F-1 of this Annual Report on Form 10-K and is incorporated herein by reference.
Page 16
Contracts
While there is considerable variation in the pricing provisions of the contracts we undertake, our contracts generally fall into two broad categories: cost-reimbursable and fixed-price. The following table sets forth the percentages of total revenues represented by these types of contracts for each of the last five fiscal years:
2014 | 2013 | 2012 | 2011 | 2010 | ||||||
Cost-reimbursable | 83% | 85% | 85% | 84% | 87% | |||||
Fixed-price | 17% | 15% | 15% | 16% | 13% | |||||
In accordance with industry practice, most of our contracts (including those with the U.S. federal government) are subject to termination at the discretion of the client, which is discussed in greater detail in Item 1A — Risk Factors. In such situations, our contracts typically provide for reimbursement of costs incurred and payment of fees earned through the date of termination.
When we are directly responsible for engineering, design, procurement, and construction of a project or the maintenance of a client’s plant or facility, we reflect the costs of materials, equipment, and subcontracts in both revenues and costs. On other projects, where the client elects to pay for such items directly and we have no associated responsibility for such items, these amounts are not reflected in either revenues or costs. The following table sets forth the approximate amount of such pass-through costs included in revenues for each of the last five fiscal years (in millions of dollars):
2014 | 2013 | 2012 | 2011 | 2010 | ||||||||||||||
$ | 2,954.9 | $ | 2,624.8 | $ | 2,328.4 | $ | 2,118.5 | $ | 2,723.3 | |||||||||
Cost-Reimbursable Contracts
Cost-reimbursable contracts generally provide for reimbursement of costs incurred plus an amount of profit. The profit element may be in the form of a simple mark-up applied to the labor costs incurred or it may be in the form of a fee, or a combination of a mark-up and a fee. The fee element can also take several forms. The fee may be a fixed amount; it may be an amount based on a percentage of the costs incurred; or it may be an incentive fee based on targets, milestones, or performance factors defined in the contract. In general, we prefer cost-reimbursable contracts because we believe the primary reason for awarding a contract to us should be our technical expertise and professional qualifications rather than price.
Fixed-Price Contracts
Fixed-price contracts include both “lump sum bid” contracts and “negotiated fixed-price” contracts. Under lump sum bid contracts, we typically bid against other contractors based on specifications the client furnishes. This type of pricing presents certain inherent risks, including the possibility of ambiguities in the specifications received, problems with new technologies, and economic and other changes that may occur over the contract period. Additionally, it is not unusual for lump sum bid contracts to lead to an adversarial relationship with clients, which is contrary to our relationship-based business model. Accordingly, lump sum bid contracts are not our preferred form of contract. In contrast, under a negotiated fixed-price contract, we are selected as the contractor first and then we negotiate a price with our client. Negotiated fixed-price contracts frequently exist in single-responsibility arrangements where we perform some portion of the work before negotiating the total price of the project. Thus, although both types of contracts involve a firm price for the client, the lump sum bid contract provides the greater degree of risk to us. However, because of economies that may be realized during the contract term, both negotiated fixed-price and lump sum bid contracts may offer greater profit potential than other types of contracts. Over the past five years, most of our fixed-price work has been either negotiated fixed-price contracts or lump sum bid contracts for project services, rather than turn-key construction.
Competition
For information regarding the competitive conditions in our business, please refer to Item 1A—Risk Factors, below.
Employees
At September 26, 2014, we had approximately 53,500 full-time, staff employees (including contract staff). Additionally, as of September 26, 2014, there were approximately 12,800 persons employed in the field on a project basis. The number of field employees varies in relation to the number and size of the maintenance and construction projects in progress at any particular time.
Page 17
Executive Officers of the Registrant
The information required by Paragraph (a), and Paragraphs (c) through (g) of Item 401 of Regulation S-K (except for information required by Paragraph (e) of that Item to the extent the required information pertains to our executive officers) and Item 405 of Regulation S-K is hereby incorporated by reference from our definitive proxy statement to be filed with the SEC pursuant to Regulation 14A within 120 days after the close of our fiscal year.
The following table presents the information required by Paragraph (b) of Item 401 of Regulation S-K.
Year Joined the | |||||||
Name | Age | Position with the Company | Registrant | ||||
Craig L. Martin | 64 | President, Chief Executive Officer and Director | 1994 | ||||
George A. Kunberger, Jr. | 62 | Executive Vice President, Global Sales and Marketing | 1979 | ||||
Andrew F. Kremer | 57 | Executive Vice President, Operations | 1998 | ||||
Joseph G. Mandel | 54 | Executive Vice President, Operations | 2011 | ||||
John W. Prosser, Jr. | 69 | Executive Vice President, Finance and Administration and Treasurer | 1974 | ||||
Santo Rizzuto | 54 | Executive Vice President, Operations | 2013 | ||||
Phillip J. Stassi | 59 | Executive Vice President, Operations | 1977 | ||||
Cora L. Carmody | 57 | Senior Vice President, Information Technology | 2008 | ||||
Geoffrey P. Sanders | 57 | Senior Vice President and Chief Accounting Officer | 1988 | ||||
Lori S. Sundberg | 50 | Senior Vice President, Global Human Resources | 2013 | ||||
Michael R. Tyler | 58 | Senior Vice President and General Counsel | 2013 | ||||
All of the officers listed in the preceding table serve in their respective capacities at the pleasure of the Board of Directors and, with the exception of Mr. Mandel, Mr. Rizzuto, Ms. Sundberg, and Mr. Tyler,, have served in executive and senior management capacities with the Company for more than five years.
Mr. Mandel joined the Company in February 2011 through the acquisition of certain operating companies comprising Aker Solutions ASA. Mr. Mandel served in various senior management roles with Aker Solutions ASA since first joining them in 1995.
Mr. Rizzuto was Chief Executive Officer and Managing Director of SKM from October 2011 until the company's acquisition by Jacobs in December 2013. From 1997 to 2011 he served in a number of global operational leadership roles within SKM.
Ms. Sundberg joined the Company in April 2013. Ms. Sundberg served as the Senior Vice President of Human Resources and Ethics at Arizona Public Services Company, Arizona's largest electric utility company, from November 2007 to April 2013. From 1998 to 2007 she served in a number of global HR leadership roles with American Express.
Mr. Tyler joined the Company in June 2013. He previously served as Executive Vice President, General Counsel and Secretary of Sanmina Corporation, a global electronics manufacturing services provider from April 2007 to June 2013, and Chief Legal and Administrative Officer of Gateway, Inc., a computer hardware company, from January 2004 to April 2007.
Mr. Sanders joined the company in June 1988. He was elected Senior Vice President and Chief Accounting Officer in May 2014. Mr. Sanders previously served as Vice President, Controller of the Company for over 10 years with responsibility for various finance, tax, accounting, and other functions within the Company.
Available Information
You may read and copy any materials we file with the SEC at the SEC’s Public Reference Room located at 100 F Street N.E., Washington, D.C., 20549. In order to obtain information about the operation of the Public Reference Room, a person may call the SEC at 1-800-732-0330. The SEC also maintains a site on the Internet that contains reports, proxy and information statements, and other information regarding issuers that file electronically with the SEC. The SEC’s website is http://www.sec.gov. You may also read and download the various reports we file with, or furnish to, the SEC free of charge from our website, http://www.jacobs.com.
Page 18
Item 1A. RISK FACTORS
We operate in a changing environment that involves numerous known and unknown risks and uncertainties that could materially adversely affect our business, financial condition, and results of operations. The risks described below highlight some of the factors that have affected and could affect us in the future. We may also be affected by unknown risks or risks that we currently think are immaterial. If any such events actually occur, our business, financial condition, and results of operations could be materially adversely affected.
Construction and maintenance sites are inherently dangerous workplaces. If we fail to maintain safe work sites, we can be exposed to significant financial losses as well as civil and criminal liabilities.
Construction and maintenance sites often put our employees and others in close proximity with large pieces of mechanized equipment, moving vehicles, chemical and manufacturing processes, and highly regulated materials. On many sites we are responsible for safety and, accordingly, must implement safety procedures. If we fail to implement such procedures or if the procedures we implement are ineffective, our employees and others may become injured. Unsafe work sites also have the potential to increase employee turnover, increase the cost of a project to our clients, and raise our operating costs. Any of the foregoing could result in financial losses, which could have a material adverse impact on our business, financial condition, and results of operations.
In addition, our projects can involve the handling of hazardous and other highly regulated materials, which, if improperly handled or disposed of, could subject us to civil and criminal liabilities. We are also subject to regulations dealing with occupational health and safety. Although we maintain functional groups whose primary purpose is to ensure we implement effective health, safety, and environmental (“HSE”) work procedures throughout our organization, including construction sites and maintenance sites, the failure to comply with such regulations could subject us to liability.
Our safety record is critical to our reputation. Many of our clients require that we meet certain safety criteria to be eligible to bid for contracts and many contracts provide for automatic termination or forfeiture of some or all of our contract fees or profit in the event we fail to meet certain measures. As a result, our failure to maintain adequate safety standards could result in reduced profitability or the loss of projects or clients, and could have a material adverse impact on our business, financial condition, and results of operations.
Our project execution activities may result in liability for faulty engineering services.
Our failure to make judgments and recommendations in accordance with applicable professional standards could result in large damages. Our engineering practice, for example, involves professional judgments regarding the planning, design, development, construction, operations and management of industrial facilities and public infrastructure projects. While we do not generally accept liability for consequential damages, and although we have adopted a range of insurance, risk management and risk avoidance programs designed to reduce potential liabilities, a catastrophic event at one of our project sites or completed projects resulting from the services we have performed could result in significant professional or product liability, warranty or other claims against us as well as reputational harm, especially if public safety is impacted. These liabilities could exceed our insurance limits or the fees we generate, or could impact our ability to obtain insurance in the future. In addition, clients or subcontractors who have agreed to indemnify us against any such liabilities or losses might refuse or be unable to pay us. An uninsured claim, either in part or in whole, if successful and of a material magnitude, could have a substantial impact on our operations.
The outcome of pending and future claims and litigation could have a material adverse impact on our business, financial condition, and results of operations.
We are a party to litigation in the normal course of business. Since we engage in engineering and construction activities for large facilities and projects where design, construction or systems failures can result in substantial injury or damage to employees or others, we are exposed to substantial claims and litigation if there is a failure at any such project. Such claims could relate to, among other things, personal injury, loss of life, business interruption, property damage, pollution, and environmental damage and be brought by our clients or third parties, such as those who use or reside near our clients’ projects. We can also be exposed to claims if we agreed that a project will achieve certain performance standards or satisfy certain technical requirements and those standards or requirements are not met. In many of our contracts with clients, subcontractors, and vendors, we agree to retain or assume potential liabilities for damages, penalties, losses, and other exposures relating to projects that could result in claims that greatly exceed the anticipated profits relating to those contracts. In addition, while
Page 19
clients and subcontractors may agree to indemnify us against certain liabilities, such third parties may refuse or be unable to pay us.
We maintain insurance coverage for various aspects of our business and operations. Our insurance programs have varying coverage limits and maximums, and insurance companies may seek to deny claims we might make. In addition, we have elected to retain a portion of losses that may occur through the use of various deductibles, limits, and retentions under these programs. As a result, we may be subject to future liability for which we are only partially insured, or completely uninsured.
Although in the past we have been generally able to cover our insurance needs, there can be no assurances that we can secure all necessary or appropriate insurance in the future, or that such insurance can be economically secured. For example, catastrophic events can result in decreased coverage limits, more limited coverage, increased premium costs or deductibles. We also monitor the financial health of the insurance companies from which we procure insurance, and this is one of the factors we take into account when purchasing insurance. Our insurance is purchased from a number of the world's leading providers, often in layered insurance or quota share arrangements. If any of our third party insurers fail, abruptly cancel our coverage or otherwise cannot satisfy their insurance requirements to us, then our overall risk exposure and operational expenses could be increased and our business operations could be interrupted.
In addition, the nature of our business sometimes results in clients, subcontractors, and vendors presenting claims to us for, among other things, recovery of costs related to certain projects. Similarly, we occasionally present change orders and other claims to our clients, subcontractors, and vendors. If we fail to document properly the nature of our claims and change orders or are otherwise unsuccessful in negotiating reasonable settlements with our clients, subcontractors, and vendors, we could incur cost overruns, reduced profits or, in some cases, a loss for a project. A failure to promptly recover on these types of claims could have a material adverse impact on our liquidity and financial results. Additionally, irrespective of how well we document the nature of our claims and change orders, the cost to prosecute and defend claims and change orders can be significant.
Litigation and regulatory proceedings are subject to inherent uncertainties and unfavorable rulings can and do occur. Pending or future claims against us could result in professional liability, product liability, criminal liability, warranty obligations, and other liabilities which, to the extent we are not insured against a loss or our insurer fails to provide coverage, could have a material adverse impact on our business, financial condition, and results of operations.
We bear the risk of cost overruns in fixed-price contracts. We may experience reduced profits or, in some cases, losses under these contracts if costs increase above our estimates.
For fiscal 2014, approximately 17.0% of our revenues were earned under contracts that were fixed-price in nature. For these contracts, we bear the risk of paying some, if not all, of any cost overruns. Fixed-price contract amounts are established in part on cost and scheduling estimates that are based on a number of assumptions, including those about future economic conditions, prices and availability of labor, equipment and materials, and other exigencies. If these estimates prove inaccurate, there are errors or ambiguities as to contract specifications, or if circumstances change due to, among other things, unanticipated technical problems, difficulties in obtaining permits or approvals, changes in local laws or labor conditions, weather delays, changes in the costs of raw materials, or our vendors’ or subcontractors’ inability to perform, then cost overruns may occur and we could experience reduced profits or, in some cases, a loss for that project. If the project is significant, or there are one or more issues that impact multiple projects, costs overruns could have a material adverse impact on our business, financial condition, and results of operations.
Our vulnerability to the cyclical nature of the markets in which our clients operate is exacerbated during economic downturns or time of political uncertainty.
We provide technical, professional, construction, and O&M services to clients operating in a number of markets including oil and gas exploration, production, and refining; programs for various national governments, including the U.S. federal government; chemicals and polymers; mining and minerals; pharmaceuticals and biotechnology; infrastructure; buildings; power; and other, general industrial and consumer businesses and markets (such as technology and manufacturing; pulp and paper; and food and consumer products). These markets and the resulting demand for our services have been, and we expect will continue to be, cyclical and subject to significant fluctuations due to a variety of factors beyond our control, including economic conditions and changes in client spending, particularly during periods of economic or political uncertainty.
Page 20
Current global economic and political conditions have negatively impacted many of our clients’ ability and willingness to fund their projects. They have also caused our clients to reduce their capital expenditures, alter the mix of services purchased, seek more favorable price and other contract terms, and otherwise slow their spending on our services. For example, in the public sector, declines in state tax revenues as well as other economic declines may result in lower state and local government spending. In addition, due to these conditions many of our competitors may be more inclined to take greater or unusual risks or accept terms and conditions in contracts that we might not deem acceptable. These conditions have reduced the demand for our services, which has had a significant negative impact on our business and results of operations.
Current economic and political conditions also make it extremely difficult for our clients, our vendors, and us to accurately forecast and plan future business activities and could cause businesses to continue to slow spending on our services. We cannot predict the timing, strength or duration of any economic slowdown or subsequent economic recovery worldwide or in our clients’ markets. In addition, our business has traditionally lagged recoveries in the general economy and, therefore, may not recover as quickly as the economy at large. A continuation or worsening of current weak economic conditions or a reduction in government spending could have a material adverse impact on our business, financial condition, and results of operations.
Regardless of economic or market conditions, investment decisions by our customers may vary by location or as a result of other factors like the availability of labor or relative construction cost. Because we are dependent on the timing and funding of new awards, we are therefore vulnerable to changes in our clients’ markets and investment decisions. As a result, our past results have varied and may continue to vary depending upon the demand for future projects in the markets and the locations in which we operate.
Fluctuations in commodity prices may affect our customers’ investment decisions and therefore subject us to risks of cancellation, delays in existing work, or changes in the timing and funding of new awards.
Commodity prices can affect our customers in a number of ways. For example, for those customers that produce commodity products such as oil, gas, copper, or fertilizers, fluctuations in price can have a direct effect on their profitability and cash flow and, therefore, their willingness to continue to invest or make new capital investments. To the extent commodity prices decline and our customers defer new investments or cancel or delay existing projects, the demand for our services decreases, which may have a material adverse impact on our business, financial condition, and results of operations.
Commodity prices can also strongly affect the costs of projects. Rising commodity prices can negatively impact the potential returns on investments that are planned, as well as those in progress, and result in customers deferring new investments or canceling or delaying existing projects. Cancellations and delays have affected our past results and may continue to do so in significant and unpredictable ways and could have a material adverse impact on our business, financial condition, and results of operations.
Our continued success is dependent upon our ability to hire, retain, and utilize qualified personnel.
The success of our business is dependent upon our ability to hire, retain, and utilize qualified personnel, including engineers, architects, designers, craft personnel, and corporate management professionals who have the required experience and expertise. From time to time, it may be difficult to attract and retain qualified individuals with the expertise and in the timeframe demanded by our clients. In certain geographic areas, for example, we may not be able to satisfy the demand for our services because of our inability to successfully hire and retain qualified personnel.
In addition, as some of our key personnel approach retirement age, we need to have appropriate succession plans in place and to successfully implement such plans. If we cannot attract and retain qualified personnel or effectively implement appropriate succession plans, it could have a material adverse impact on our business, financial condition, and results of operations.
The cost of providing our services, including the extent to which we utilize our workforce, affects our profitability. For example, the uncertainty of contract award timing can present difficulties in matching our workforce size with our contracts. If an expected contract award is delayed or not received, we could incur costs resulting from excess staff, reductions in staff, or redundancy of facilities that could have a material adverse impact on our business, financial conditions, and results of operations.
Page 21
Contracts with the U.S. federal government and other governments and their agencies pose additional risks relating to future funding and compliance.
Contracts with the U.S. federal government and other governments and their agencies, which are a significant source of our revenue and profit, are subject to various uncertainties, restrictions, and regulations including oversight audits by various government authorities as well as cost controls. Government contracts are also exposed to uncertainties associated with funding such as sequestration. Contracts with the U.S. federal government, for example, are subject to the uncertainties of Congressional funding. Governments are typically under no obligation to maintain funding at any specific level, and funds for government programs may even be eliminated.
As a result, our government clients may reduce the scope or terminate our contracts for convenience or decide not to renew our contracts with little or no prior notice. Since government contracts represent a significant percentage of our revenues (for example, those with the U.S. federal government represented approximately 17.8% of our total revenue in fiscal 2014), a significant reduction in government funding or the loss of such contracts could have a material adverse impact on our business, financial condition, and results of operations.
Most government contracts are awarded through a rigorous competitive process. The U.S. federal government has increasingly relied upon multiple-year contacts with multiple contractors that generally require those contractors to engage in an additional competitive bidding process for each task order issued under a contract. This process may result in us facing significant additional pricing pressure and uncertainty and incurring additional costs. Moreover, we may not be awarded government contracts because of existing policies designed to protect small businesses and under-represented minorities. Our inability to win new contracts or be awarded work under existing contracts could have a negative impact on our business and results of operations.
In addition, government contracts are subject to specific procurement regulations and a variety of other socio-economic requirements, which affects how we transact business with our clients and, in some instances, impose additional costs on our business operations. For example, for contracts with the U.S. federal government, we must comply with the Federal Acquisition Regulation, the Truth in Negotiations Act, the Cost Accounting Standards, the Service Contract Act, and numerous regulations governing, environmental protection, and employment practices. Government contracts also contain terms that expose us to heightened levels of risk and potential liability than non-government contracts. This includes, for example, unlimited indemnification obligations.
We also are subject to government audits, investigations, and proceedings. For example, government agencies such as the U.S. Defense Contract Audit Agency routinely review and audit us to determine the adequacy of and our compliance with our internal control systems and policies and whether allowable costs are in accordance with applicable regulations. These audits can result in a determination that a rule or regulation has been violated or that adjustments are necessary to the amount of contract costs we believe are reimbursable by the agencies and the amount of our overhead costs allocated to the agencies.
If we violate a rule or regulation, fail to comply with a contractual or other requirement or do not satisfy an audit, a variety of penalties can be imposed including monetary damages and criminal and civil penalties. In addition, any or all of our government contracts could be terminated, we could be suspended or debarred from all government contract work, or payment of our costs could be disallowed. For example, in so-called "qui tam" actions brought by individuals or the government under the U.S. Federal False Claims Act or under similar state and local laws, treble damages can be awarded. The occurrence of any of these actions could harm our reputation and could have a material adverse impact on our business, financial condition, and results of operations.
Many of our federal government contracts require us to have security clearances, which can be difficult and time consuming to obtain. If our employees are unable to obtain or retain the necessary securities clearances, our clients could terminate or not renew existing contracts or award us new contracts. To the extent this occurs, our operations and results of operations could be negatively impacted.
The contracts in our backlog may be adjusted, cancelled or suspended by our clients and, therefore, our backlog is not necessarily indicative of our future revenues or earnings. Additionally, even if fully performed, our backlog is not a good indicator of our future gross margins.
As of the end of fiscal 2014, our backlog totaled approximately $18.4 billion. There is no assurance that backlog will actually be realized as revenues in the amounts reported or, if realized, will result in profits. In accordance with industry practice, substantially all of our contracts are subject to cancellation, termination, or suspension at the discretion of the client.
Page 22
In addition, the contracts in our backlog are subject to changes in the scope of services to be provided as well as adjustments to the costs relating to the contracts. The revenue for certain contracts included in backlog are based on estimates. Projects can remain in backlog for extended periods of time because of the nature of the project and the timing of the particular services required by the project. The risk of contracts in backlog being cancelled or suspended generally increases during periods of wide-spread economic slowdowns.
Additionally, the way we perform on our individual contracts can affect greatly our gross margins and hence, future profitability. In some markets, there is a continuing trend towards cost-reimbursable contracts with incentive-fee arrangements. Typically, our incentive fees are based on such things as achievement of target completion dates or target costs, overall safety performance, overall client satisfaction, and other performance criteria. If we fail to meet such targets or achieve the expected performance standards, we may receive a lower, or even zero, incentive fee resulting in lower gross margins. Accordingly, there is no assurance that the contracts in backlog, assuming they produce the revenues currently expected, will generate gross margins at the rates we have realized in the past.
Negative conditions in the credit and financial markets and delays in receiving client payments could result in liquidity problems.
Although we finance much of our operations using cash provided by operations, at times we depend on the availability of credit to grow our business and to help fund business acquisitions. In addition, some of our clients depend on the availability of credit to help finance their capital projects. Instability in the credit markets in the U.S. or abroad, could cause the availability of credit to be relatively difficult or expensive to obtain. This situation could make it more difficult or more expensive for us to access funds, refinance our existing indebtedness, enter into agreements for new indebtedness, or obtain funding through the issuance of securities or such additional capital may not be available on terms acceptable to us. We may also enter into business acquisition agreements that require us to access credit, which if not available at the closing of the acquisition could result in a breach of the acquisition agreement and a resulting claim for damages by the sellers of such business. In addition, market conditions could negatively impact our clients’ ability to fund their projects and, therefore, utilize our services, which could have a material adverse impact on our business, financial condition, and results of operations.
In addition, we are subject to the risk that the counterparties to our credit agreements may go bankrupt if they suffer catastrophic demand on their liquidity that will prevent them from fulfilling their contractual obligations to us. We also routinely enter into contracts with counterparties including vendors, suppliers, and subcontractors that may be negatively impacted by events in the credit markets. If those counterparties are unable to perform their obligations to us or our clients, we may be required to provide additional services or make alternate arrangements on less favorable terms with other parties to ensure adequate performance and delivery of services to our clients. These circumstances could also lead to disputes and litigation with our partners or clients, which could have a material adverse impact on our reputation, business, financial condition, and results of operations.
In addition, we typically bill our clients for our services in arrears and are, therefore, subject to our clients delaying or failing to pay our invoices. In weak economic environments, we may experience increased delays and failures due to, among other reasons, a diminution in our clients’ access to the credit markets. If one or more clients delays in paying or fail to pay us a significant amount of our outstanding receivables, it could have a material adverse impact on our liquidity, financial condition, and results of operations.
Furthermore, our cash balances and short-term investments are maintained in accounts held by major banks and financial institutions located primarily in North America, Europe, South America, Australia and Asia. Some of our accounts hold deposits in amounts that exceed available insurance. Although none of the financial institutions in which we hold our cash and investments have gone into bankruptcy or forced receivership, or have been seized by their governments, there is a risk that this may occur in the future. If this were to occur, we would be at risk of not being able to access our cash which may result in a temporary liquidity crisis that could impede our ability to fund operations.
Our use of joint ventures and partnerships exposes us to risks and uncertainties, many of which are outside of our control.
As is common in the industry, we perform certain contracts as a member of joint ventures, partnerships, and similar arrangements. This situation exposes us to a number of risks, including the risk that our partners may be unable to fulfill their obligations to us or our clients. Our partners may also be unable or unwilling to provide the required levels of financial support to the partnerships. If these circumstances occur, we may be required to pay financial penalties or liquidated damages, provide additional services, or make additional investments to ensure adequate performance and delivery of the contracted services. Under agreements with joint and several liabilities, we could be liable for both our obligations and those of our partners. These
Page 23
circumstances could also lead to disputes and litigation with our partners or clients, all of which could have a material adverse impact on our reputation, business, financial condition, and results of operations.
We participate in joint ventures and similar arrangements in which we are not the controlling partner. In these cases, we have limited control over the actions of the joint venture. These joint ventures may not be subject to the same requirements regarding internal controls and internal control over financial reporting that we follow. To the extent the controlling partner makes decisions that negatively impact the joint venture or internal control problems arise within the joint venture, it could have a material adverse impact on our business, financial condition, and results of operations.
The failure by a joint venture partner to comply with applicable laws, regulations or client requirements could negatively impact our business and, for government clients, could result in fines, penalties, suspension or even debarment being imposed on us, which could have a material adverse impact on our business, financial condition, and results of operations.
We are dependent on third parties to complete many of our contracts.
Much of the work performed under our contracts is performed by third-party subcontractors we hire. We also rely on third-party equipment manufacturers or suppliers to provide much of the equipment and materials used for projects. If we are unable to hire qualified subcontractors or find qualified equipment manufacturers or suppliers, our ability to successfully complete a project could be impaired. If we are not able to locate qualified third-party subcontractors or the amount we are required to pay for subcontractors or equipment and supplies exceeds what we have estimated, especially in a lump-sum or a fixed-price contract, we may suffer losses on these contracts. If a subcontractor, supplier, or manufacturer fails to provide services, supplies or equipment as required under a contract for any reason, we may be required to source these services, equipment or supplies to other third parties on a delayed basis or on less favorable terms, which could impact contract profitability. In the current economic environment, third parties may find it difficult to obtain sufficient financing to help fund their operations. The inability to obtain financing could adversely affect a third party’s ability to provide materials, equipment or services which could have a material adverse impact on our business, financial condition, and results of operations. In addition, a failure by a third party subcontractor, supplier or manufacturer to comply with applicable laws, regulations or client requirements could negatively impact our business and, for government clients, could result in fines, penalties, suspension or even debarment being imposed on us, which could have a material adverse impact on our business, financial condition, and results of operations.
Maintaining adequate bonding and letter of credit capacity is necessary for us to successfully bid on and win some contracts.
In line with industry practice, we are often required to provide performance or payment bonds to our customers. These bonds indemnify the customer should we fail to perform our obligations under the contract. If a bond is required for a particular project and we are unable to obtain an appropriate bond, we cannot pursue that project.
Historically, we have had adequate bonding and letter of credit capacity but, as is typically the case, the issuance of a bond is at the surety’s sole discretion and the issuance of a letter of credit is based on the Company's credit worthiness. Because of an overall lack of worldwide bonding capacity, we may find it difficult to find sureties who will provide required levels of bonding or such bonding may only be available at significant additional cost. There can be no assurance that our bonding capacity will continue to be available to us on reasonable terms. Our inability to obtain adequate bonding and, as a result, to bid on new contracts that require such bonding could have a material adverse impact on our business, financial condition, results of operations, and cash flows.
Past and future environmental, heath, and safety laws could impose significant additional costs and liabilities.
We are subject to a variety of environmental, health, and safety laws and regulations governing, among other things, discharges to air and water, the handling, storage, and disposal of hazardous or waste materials and the remediation of contamination associated with the releases of hazardous substances and human health and safety. These laws and regulations and the risk of attendant litigation can cause significant delays to a project and add significantly to its cost. Violations of these regulations could subject us and our management to civil and criminal penalties and other liabilities.
Various U.S. federal, state, local, and foreign environmental laws and regulations may impose liability for property damage and costs of investigation and cleanup of hazardous or toxic substances on property currently or previously owned by us or arising out of our waste management or environmental remediation activities. These laws may impose responsibility and liability without regard to knowledge of or causation of the presence of contaminants. The liability under these laws is joint and several. We have potential liabilities associated with our past waste management and other activities and with our current
Page 24
and prior ownership of various properties. The discovery of additional contaminants or the imposition of unforeseen clean-up obligations at these or other sites could have a material adverse impact on our financial condition and results of operations.
When we perform our services, our personnel and equipment may be exposed to radioactive and hazardous materials and conditions. We may be subject to liability claims by employees, customers, and third parties as a result of such exposures. In addition, we may be subject to fines, penalties or other liabilities arising under environmental or safety laws. A claim, if not covered by insurance, could have a material adverse impact on our results of operations and financial condition.
Such laws, regulations and policies are reviewed periodically and any changes could affect us in substantial and unpredictable ways. Such changes could, for example, relax or repeal laws and regulations relating to the environment, which could result in a decline in the demand for our environmental services and, in turn, could negatively impact our revenue. Our failure to comply with such laws or regulations, whether actual or alleged, could expose us to fines, penalties or potential litigation liabilities, including costs, settlements and judgments, any of which could adversely affect our business, financial condition and results of operations.
In addition, we and many of our clients operate in highly regulated environments, which may require us or our clients to obtain, and to comply with, federal, state, and local government permits and approvals. Any of these permits or approvals may be subject to denial, revocation or modification under various circumstances. Failure to obtain or comply with, or the loss or modification of, the conditions of permits or approvals may subject us to penalties or other liabilities, which could have a material adverse impact on our business, financial condition, and result of operations.
If we fail to comply with federal, state, local or foreign governmental requirements, our business may be adversely affected.
We are subject to U.S. federal, state, local and foreign laws and regulations that affect our business. For example, our global operations require importing and exporting goods and technology across international borders. Although we have policies and procedures to comply with U.S. and foreign international trade laws, the violation of such laws could subject the Company and its employees to civil or criminal penalties, including substantial monetary fines, or other adverse actions including denial of import or export privileges, and could damage our reputation and therefore, our ability to do business.
Employee, agent or partner misconduct or our overall failure to comply with laws or regulations could weaken our ability to win contracts, which could result in reduced revenues and profits.
Misconduct, fraud, non-compliance with applicable laws and regulations, or other improper activities by one of our employees, agents or partners could have a significant negative impact on our business and reputation. Such misconduct could include the failure to comply with government procurement regulations, regulations regarding the protection of classified information, regulations prohibiting bribery and other corrupt practices, regulations regarding the pricing of labor and other costs in government contracts, regulations on lobbying or similar activities, regulations pertaining to the internal controls over financial reporting, environmental laws, and any other applicable laws or regulations. For example, we routinely provide services that may be highly sensitive or that relate to critical national security matters; if a security breach were to occur, our ability to procure future government contracts could be severely limited. The precautions we take to prevent and detect these activities may not be effective, and we could face unknown risks or losses. Our failure to comply with applicable laws or regulations or acts of misconduct could subject us to fines and penalties, loss of security clearance, and suspension or debarment from contracting, which could weaken our ability to win contracts and result in reduced revenues and profits and could have a material adverse impact on our business, financial condition, and results of operations.
We could be adversely affected by violations of the U.S. Foreign Corrupt Practices Act and similar worldwide anti-bribery laws.
The U.S. Foreign Corrupt Practices Act (“FCPA”), the U.K. Bribery Act of 2010, and similar anti-bribery laws in other jurisdictions generally prohibit companies and their intermediaries from making improper payments for the purpose of obtaining or retaining business. Our policies mandate compliance with these anti-bribery laws. We operate in many parts of the world that have experienced governmental corruption to some degree and, in certain circumstances, strict compliance with anti-bribery laws may conflict with local customs and practices. Despite our training and compliance programs, there is no assurance that our internal control policies and procedures will protect us from acts committed by our employees or agents. If we are found to be liable for FCPA or other violations (either due to our own acts or our inadvertence, or due to the acts or inadvertence of others), we could suffer from civil and criminal penalties or other sanctions, which could have a material adverse impact on our business, financial condition, and results of operations.
Page 25
The loss of or a significant reduction in business from one or a few customers could have an adverse impact on us.
A few clients have in the past and may in the future account for a significant portion of our revenue and/or backlog in any one year or over a period of several consecutive years. For example, in fiscal 2014, 2013, and fiscal 2012, approximately 17.8%, 19.9%, and 22.1%, respectively, of our revenue was earned directly or indirectly from agencies of the U.S. federal government. Although we have long-standing relationships with many of our significant clients, our clients may unilaterally reduce, delay, or cancel their contracts at any time. Our loss of or a significant reduction in business from a significant client could have a material adverse impact on our business, financial condition, and results of operations.
We engage in a highly competitive business. If we are unable to compete effectively, we could lose market share and our business and results of operations could be negatively impacted.
We face intense competition to provide technical, professional, and construction services to clients. The extent of such competition varies by industry, geographic market, and project type. For example, with respect to our construction and operations and maintenance services, clients generally award large projects to large contractors, which may give our larger competitors an advantage when bidding for these projects. Conversely, with respect to our engineering, design, architectural, and consulting services, low barriers of entry can result in competition with smaller, newer competitors. If we are unable to compete effectively, we may experience a loss of market share or reduced profitability or both, which if significant, could have a material adverse impact on our business, financial condition, and results of operations.
Our larger competitors for engineering, construction, and maintenance services for process plants include Bechtel, Fluor, Foster Wheeler, KBR, Technip, WorleyParsons, CB&I, and AMEC. In the area of buildings, our competitors include several of the competitors previously mentioned as well as HDR, HOK, AECOM, and Turner. In the area of infrastructure, our competitors include several of the competitors previously mentioned as well as Parsons Brinckerhoff, HNTB, Tetra Tech, Parsons, and W.S. Atkins. In the area of national government programs, our principal competitors include several of the competitors listed above as well as Leidos, CH2M Hill, Weston, Lockheed Martin, and Computer Sciences Corporation.
In addition to the risks discussed elsewhere in Risk Factors, our international operations are also exposed to additional risks and uncertainties including unfavorable political developments and weak foreign economies.
For fiscal 2014, approximately 44.2% of our revenues was earned from clients outside the U.S. Our business is dependent on the continued success of our international operations, and we expect our international operations to continue to account for a significant portion of our total revenues. Our international operations are subject to a variety of risks, including:
• | Recessions and other economic crises in other regions, such as Europe, or specific foreign economies and the impact on our costs of doing business in those countries; |
• | Difficulties in staffing and managing foreign operations, including logistical and communication challenges; |
• | Unexpected changes in foreign government policies and regulatory requirements; |
• | Lack of developed legal systems to enforce contractual rights; |
• | Renegotiation or nullification of our existing contracts; |
• | The adoption of new, and the expansion of existing, trade or other restrictions; |
• | Embargoes; |
• | Acts of war, civil unrest, force majeure, and terrorism; |
• | The ability to finance efficiently our foreign operations; |
• | Social, political, and economic instability; |
• | Expropriation of property; |
• | Tax increases; |
• | Limitations on the ability to repatriate foreign earnings; and |
• | U.S. government policies. |
The lack of a well-developed legal system in some of these countries may make it difficult to enforce our contractual rights. In addition, military action or continued unrest, particularly in the Middle East, could impact the supply or pricing of oil, disrupt our operations in the region and elsewhere. To the extent our international operations are affected by unexpected or
Page 26
adverse economic, political and other conditions, our business, financial condition, and results of operations may be adversely affected.
We work in international locations where there are high security risks, which could result in harm to our employees or unanticipated cost.
Some of our services are performed in high risk locations, where the country or location is subject to political, social or economic risks, or war or civil unrest. In those locations where we have employees or operations, we may expend significant efforts and incur substantial security costs to maintain the safety of our personnel. Despite these activities, in these locations, we cannot guarantee the safety of our personnel and we may suffer future losses of employees and subcontractors.
Foreign exchange risks may affect our ability to realize a profit from certain projects.
Our reported financial condition and results of operations are exposed to the effects (both positive and negative) that fluctuating exchange rates have on the process of translating the financial statements of our international operations, which are denominated in currencies other than the U.S. dollar, into the U.S. dollar. While we generally attempt to denominate our contracts in the currencies of our expenditures, we do enter into contracts that expose us to currency risk, particularly to the extent contract revenue is denominated in a currency different than the contract costs. We attempt to minimize our exposure from currency risks by obtaining escalation provisions for projects in inflationary economies or entering into derivative (hedging) instruments, when there is currency risk exposure that is not naturally mitigated via our contracts. These actions, however, may not always eliminate currency risk exposure. Based on fluctuations in currency, the U.S. dollar value of our backlog may from time to time increase or decrease significantly. We may also be exposed to limitations on our ability to reinvest earnings from operations in one country to fund the financing requirements of our operations in other countries.
Our business strategy relies in part on acquisitions to sustain our growth. Acquisitions of other companies present certain risks and uncertainties.
Our business strategy involves growth through, among other things, the acquisition of other companies. Acquiring companies presents a number of risks, including:
• | Assumption of liabilities of an acquired business, including liabilities that were unknown at the time the acquisition was negotiated; |
• | Valuation methodologies may not accurately capture the value of the acquired business; |
• | Failure to realize anticipated benefits, such as cost savings and revenue enhancements; |
• | Difficulties relating to combining previously separate entities into a single, integrated, and efficient business; |
• | The effects of diverting management’s attention from day-to-day operations to matters involving the integration of acquired companies; |
• | Potentially substantial transaction costs associated with business combinations; |
• | Potential impairment resulting from the overpayment for an acquisition; |
• | Difficulties relating to assimilating the personnel, services, and systems of an acquired business and to assimilating marketing and other operational capabilities; |
• | Increased burdens on our staff and on our administrative, internal control and operating systems, which may hinder our legal and regulatory compliance activities; and |
• | Difficulties in applying and integrating our system of internal controls to an acquired business. |
While we often obtain indemnification rights from the sellers of acquired businesses, such rights may be difficult to enforce, the losses may exceed any dedicated escrow funds, and the indemnitors may not have the ability to financially support the indemnity.
In addition, there is no assurance that we will continue to locate suitable acquisition targets or that we will be able to consummate any such transactions on terms and conditions acceptable to us. Existing cash balances and cash flow from operations, together with borrowing capacity under our credit facilities, may be insufficient to make acquisitions Credit market conditions may also make it more difficult and costly to finance acquisitions. Acquisitions may also bring us into businesses we have not previously conducted and expose us to additional business risks that are different than those we have traditionally experienced.
Page 27
In the event we issue stock as consideration for certain acquisitions we may make, we could dilute share ownership.
One method of acquiring companies or otherwise funding our corporate activities is through the issuance of additional equity securities. Accordingly, we filed a shelf registration statement on Form S-4 on December 7, 2007. If we issue additional equity securities pursuant to this shelf registration statement or otherwise, such issuances could have the effect of diluting our earnings per share as well as our existing shareholders’ individual ownership percentages in the Company.
Our quarterly results may fluctuate significantly, which could have a material negative effect on the price of our common stock.
Our quarterly operating results may fluctuate significantly, which could have a material negative effect on the price of our common stock, because of a number of factors, including:
• | Fluctuations in the spending patterns of our government and commercial customers; |
• | The number and significance of projects executed during a quarter; |
• | Unanticipated changes in contract performance, particularly with contracts that have funding limits; |
• | The timing of resolving change orders, requests for equitable adjustments, and other contract adjustments; |
• | Delays incurred in connection with a project; |
• | Changes in prices of commodities or other supplies; |
• | Weather conditions that delay work at project sites; |
• | The timing of expenses incurred in connection with acquisitions or other corporate initiatives; |
• | Natural disasters or other crises; |
• | Staff levels and utilization rates; |
• | Changes in prices of services offered by our competitors; and |
• | General economic and political conditions. |
Our actual results could differ from the estimates and assumptions used to prepare our financial statements.
In preparing our financial statements, our management is required under U.S. GAAP to make estimates and assumptions as of the date of the financial statements. These estimates and assumptions affect the reported values of assets, liabilities, revenue, and expenses and disclosure of contingent assets and liabilities. Areas requiring significant estimates by our management include:
• | Recognition of contract revenue, costs, profit or losses in applying the principles of percentage of completion accounting; |
• | Estimated amounts for expected project losses, warranty costs, contract close-out or other costs; |
• | Recognition of recoveries under contract change orders or claims; |
• | Collectability of billed and unbilled accounts receivable and the need and amount of any allowance for doubtful accounts; |
• | The amount of reserves necessary for self-insured risks; |
• | Accruals for estimated liabilities, including litigation reserves; |
• | Valuation of assets acquired, and liabilities, goodwill, and intangible assets assumed, in acquisitions; |
• | Valuation of stock-based compensation; and |
• | The determination of liabilities under pension and other post-retirement benefit programs. |
Our actual business and financial results could differ from our estimates of such results, which could have a material negative impact on our financial condition and results of operations.
An impairment charge of goodwill could have a material adverse impact on our financial condition and results of operations.
Under U.S. GAAP, we are required to test goodwill carried in our Consolidated Balance Sheets for possible impairment on an annual basis based upon a fair value approach. As of September 26, 2014, we had $3.0 billion of goodwill, representing 35.8% of our total assets of $8.5 billion. We have chosen to perform our annual impairment reviews of goodwill at
Page 28
the end of the third quarter of our fiscal year. We also are required to test goodwill for impairment between annual tests if events occur or circumstances change that would more likely than not reduce our enterprise fair value below its book value. These events or circumstances could include a significant change in the business climate, including a significant sustained decline in a reporting unit’s market value, legal factors, operating performance indicators, competition, sale or disposition of a significant portion of our business, potential government actions toward our facilities, and other factors.
If the fair value of our reporting units is less than their carrying value, we could be required to record an impairment charge. The amount of any impairment could be significant and could have a material adverse impact on our financial condition and results of operations for the period in which the charge is taken. For a further discussion of goodwill impairment testing, please see Item 7—Management’s Discussion and Analysis of Financial Condition and Results of Operations below.
We may be required to contribute additional cash to meet any underfunded benefit obligations associated with retirement and post-retirement benefit plans we manage.
We have various employee benefit plan obligations that require us to make contributions to satisfy, over time, our underfunded benefit obligations, which are generally determined by calculating the projected benefit obligations minus the fair value of plan assets. For example, as of September 26, 2014, and September 27, 2013, our defined benefit pension and post-retirement benefit plans were projected to be underfunded by $400.8 million and $402.5 million, respectively. See Note 6—Pension Plans of Notes to Consolidated Financial Statements beginning on page F-1 of this Annual Report on Form 10-K for additional disclosure. In the future, our benefit plan obligations may increase or decrease depending on changes in the levels of interest rates, pension plan asset performance and other factors. If we are required to contribute a significant amount of the deficit for underfunded benefit plans, our cash flows could be materially and adversely affected.
Rising inflation, interest rates, and/or construction costs could reduce the demand for our services as well as decrease our profit on our existing contracts, in particular with respect to our fixed-price contracts.
Rising inflation, interest rates, or construction costs could reduce the demand for our services. In addition, we bear all of the risk of rising inflation with respect to those contracts that are fixed-price. Because a significant portion of our revenues are earned from cost-reimbursable type contracts (approximately 83.0% during fiscal 2014), the effects of inflation on our financial condition and results of operations over the past few years have been generally minor. However, if we expand our business into markets and geographic areas where fixed-price and lump-sum work is more prevalent, inflation may have a larger impact on our results of operations in the future. Therefore, increases in inflation, interest rates or construction costs could have a material adverse impact on our business, financial condition, and results of operations.
We may be affected by market or regulatory responses to climate change.
Growing concerns about climate change may result in the imposition of additional environmental regulations. For example, there is a growing consensus that new and additional regulations may be enacted concerning, among other things, greenhouse gas emissions could result in increased compliance costs for us and our clients. Legislation, international protocols, regulation or other restrictions on emissions could also affect our clients, including those who are involved in the exploration, production or refining of fossil fuels. Such changes could increase the costs of projects for our clients or, in some cases, prevent a project from going forward, thereby potentially reducing the need for our services, which would in turn have a material adverse impact on our business, financial condition, and results of operations. However, these changes could also increase the pace of projects, such as carbon capture or storage projects, that could have a positive impact on our business. We cannot predict when or whether any of these various proposals may be enacted or what their effect will be on us or on our customers.
Our effective tax rate may increase or decrease.
We are subject to income taxes in the U.S. and numerous foreign jurisdictions. Significant judgment is required in determining our worldwide provision for income taxes. In the ordinary course of our business, there are many transactions and calculations where the ultimate tax determination is uncertain. We are regularly under audit by tax authorities. Although we believe that our tax estimates and tax positions are reasonable, they could be materially affected by many factors including the final outcome of tax audits and related litigation, the introduction of new tax accounting standards, legislation, regulations, and related interpretations, our global mix of earnings, the realizability of deferred tax assets and changes in uncertain tax positions. An increase or decrease in our effective tax rate could have a material adverse impact on our financial condition and results of operations.
Page 29
Systems and information technology interruption could adversely impact our ability to operate.
We rely heavily on computer, information, and communications technology and related systems in order to properly operate our business. From time to time, we experience occasional system interruptions and delays. In the event we are unable to regularly deploy software and hardware, effectively upgrade our systems and network infrastructure, and take other steps to maintain or improve the efficiency and efficacy of our systems, the operation of such systems could be interrupted or result in the loss, corruption, or release of data. In addition, our computer and communication systems and operations could be damaged or interrupted by natural disasters, telecommunications failures, acts of war or terrorism, computer viruses, physical or electronic security breaches, intentional or inadvertent user misuse or error, or similar events or disruptions. Any of these or other events could cause interruptions, delays, loss of critical and/or sensitive data or similar effects, which could have a material adverse impact on our business, financial condition, protection of intellectual property, and results of operations, as well as those of our clients.
We may not be able to protect our intellectual property or that of our clients.
Our technology and intellectual property provide us, in many instances, with a competitive advantage. Although we protect our property through patent registrations, license restrictions, and similar mechanisms, we may not be able to successfully preserve our rights and they could be invalidated, circumvented, challenged or become obsolete. In addition, the laws of some foreign countries in which we operate do not protect intellectual property rights to the same extent as the U.S. If we are unable to protect and maintain our intellectual property rights or if there are any successful intellectual property challenges or infringement proceedings against us, our ability to differentiate our service offerings could be reduced. In addition, our clients or other third parties may also provide us with their technology and intellectual property. There is a risk we may not sufficiently protect our or their information from improper use or dissemination and, as a result, could be subject to claims and litigation and resulting liabilities, loss of contracts or other consequences that could have an adverse impact on our business, financial condition, and results of operations.
Our businesses could be materially and adversely affected by events outside of our control.
Extraordinary or force majeure events beyond our control, such as natural or man-made disasters, could negatively impact our ability to operate. As an example, from time to time we face unexpected severe weather conditions which may result in weather-related delays that are not always reimbursable under a fixed-price contract; evacuation of personnel and curtailment of services; increased labor and material costs in areas resulting from weather-related damage and subsequent increased demand for labor and materials for repairing and rebuilding; inability to deliver materials, equipment and personnel to jobsites in accordance with contract schedules and loss of productivity. We may remain obligated to perform our services after any such natural or man-made event, unless a force majeure clause or other contractual provision provides us with relief from our contractual obligations. If we are not able to react quickly to such events, or if a high concentration of our projects are in a specific geographic region that suffers from a natural or man-made catastrophe, our operations may be significantly affected, which could have a negative impact on our operations. In addition, if we cannot complete our contracts on time, we may be subject to potential liability claims by our clients which may reduce our profits.
We are subject to professional standards, duties and statutory obligations on professional reports and opinions we issue, which could subject us to monetary damages.
We issue reports and opinions to clients based on our professional engineering expertise as well as our other professional credentials that subject us to professional standards, duties and obligations regulating the performance of our services. For example, we issue opinions and reports to government clients in connection with securities offerings. If a client or another third party alleges that our report or opinion is incorrect or it is improperly relied upon and we are held responsible, we could be subject to significant monetary damages.
Delaware law and our charter documents may impede or discourage a takeover or change of control.
We are a Delaware corporation. Certain anti-takeover provisions of the Delaware general corporation law impose restrictions on the ability of others to acquire control of us. In addition, certain provisions of our charter documents may impede or discourage a takeover. For example:
• | Our Board of Directors is divided into three staggered classes (although our Board of Directors is currently being destaggered); |
• | Only our Board of Directors can fill vacancies on the board; |
• | There are various restrictions on the ability of a shareholder to nominate a director for election; and |
Page 30
• | Our Board of Directors can authorize the issuance of preference shares. |
These types of provisions, as well as our ability to adopt a shareholder rights agreement in the future, could make it more difficult for a third party to acquire control of us, even if the acquisition would be beneficial to our shareholders. Accordingly, stockholders may be limited in the ability to obtain a premium for their shares.
Item 1B. UNRESOLVED STAFF COMMENTS
None.
Item 2. | PROPERTIES |
Our properties consist primarily of office space within general, commercial office buildings located in major cities primarily in the following countries: United States; Australia; Austria; Belgium; Canada; Chile; China; Finland; France; Germany; Greece; India; Italy; Mexico; Morocco; The Netherlands; Oman; Poland; Puerto Rico; Peru; Republic of Ireland; Saudi Arabia; South Africa; Singapore; Spain; Sweden; United Arab Emirates; and the United Kingdom. Such space is used for operations (providing technical, professional, and other home office services), sales, and administration. Most of our properties are leased. In addition, we own facilities located in Charleston, South Carolina which serve as our principal manufacturing and fabrication site for our modular construction activities. We also have fabrication facilities located in Canada in Pickering, Ontario and Edmonton and Lamont, Alberta. The total amount of space used by us for all of our operations is approximately 9.5 million square feet.
We also lease smaller, project offices located throughout the U.S., the U.K., and in certain other countries. We also rent most of our construction equipment on a short-term basis.
Item 3. | LEGAL PROCEEDINGS |
The information required by this Item 3 is included in Note 11 — Contractual Guarantees, Litigation, Investigations, and Insurance of Notes to Consolidated Financial Statements beginning on page F-1 of this Annual Report on Form 10-K and is incorporated herein by reference.
Item 4. | MINE SAFETY DISCLOSURE |
Section 1503 of the Dodd-Frank Wall Street Reform and Consumer Protection Act (the “Dodd-Frank Act”) requires domestic mine operators to disclose violations and orders issued under the Federal Mine Safety and Health Act of 1977 (the “Mine Act”) by the federal Mine Safety and Health Administration. Under the Mine Act, an independent contractor, such as Jacobs, that performs services or construction of a mine is included within the definition of a mining operator. We do not act as the owner of any mines.
Information concerning mine safety violations or other regulatory matters required by Section 1503(a) of the Dodd-Frank Act and Item 104 of Regulation S-K is included in Exhibit 95.
Page 31
PART II
Item 5. | MARKET FOR REGISTRANT'S COMMON EQUITY, RELATED STOCKHOLDER MATTERS AND ISSUER PURCHASES OF EQUITY SECURITIES |
Market Information
Jacobs’ common stock is listed on the NYSE and trades under the symbol JEC. We provided to the NYSE, without qualification, the required annual certification of our Chief Executive Officer regarding compliance with the NYSE’s corporate governance listing standards. The following table sets forth the low and high sales prices of a share of our common stock during each of the fiscal quarters presented, based on the NYSE Composite Price History:
Low Sales Price | High Sales Price | |||||||
Fiscal 2014: | ||||||||
First quarter | $ | 55.80 | $ | 64.27 | ||||
Second quarter | 58.20 | 66.88 | ||||||
Third quarter | 52.57 | 65.02 | ||||||
Fourth quarter | 49.13 | 55.00 | ||||||
Fiscal 2013: | ||||||||
First quarter | $ | 38.28 | $ | 43.56 | ||||
Second quarter | 41.50 | 56.53 | ||||||
Third quarter | 48.86 | 57.97 | ||||||
Fourth quarter | 53.99 | 62.33 | ||||||
Shareholders
According to the records of our transfer agent, there were 1,169 shareholders of record as of November 18, 2014.
Share Repurchases
On August 19, 2014, the Board of Directors approved a program to repurchase up to $500 million of the Company's common stock over the next three years. Under the program’s terms, shares may be repurchased from time to time at the our discretion on the open market, through block trades or otherwise. The timing of our share repurchases will depend upon market conditions, other uses of capital and other factors.
A summary of repurchases of our common stock during the fourth quarter of fiscal 2014 is as follows (in thousands, except per-share amounts):
Period | Total Number of Shares Purchased | Average Price Paid per Share (1) | Total Numbers of Shares Purchased as Part of Publicly Announced Plans or Programs | Approximate Dollar Value of Shares that May Yet Be Purchased Under the Plans or Programs | ||||||
June 28 through July 25, 2014 | — | $ | — | — | $ | 500,000 | ||||
July 26 through August 22, 2014 | — | — | — | 500,000 | ||||||
August 23 through September 26, 2014 | 1,500 | 52.27 | 1,500 | 421,601 | ||||||
Total | 1,500 | $ | 52.27 | 1,500 | $ | 421,601 | ||||
(1) | Includes commissions paid. |
Dividends
Our policy is to use cash flows from operations to fund future growth, pay down debt, and, subject to market conditions, repurchase common stock under a stock buy-back program approved by our Board of Directors. Accordingly, we have not paid a cash dividend since fiscal 1984. Although our Board of Directors periodically reviews and considers the merits of paying cash dividends, we currently have no plans to pay cash dividends in the foreseeable future.
Page 32
Unregistered Sales of Equity Securities and Use of Proceeds.
On October 14, 2013, we acquired the assets of Trompeter Enterprises, L.L.C., Motion Mekanix, Inc., Teamm Workforce, Inc., and Sims Software II, Inc. (collectively "Trompeter"); and on December 20, 2013, we acquired the assets of Stobbarts (Nuclear) Limited, for cash and shares of our common stock. In connection with these acquisitions, we issued 33,947 shares of our common stock with an aggregate value of approximately $2.0 million. No underwriters or placement agents were involved with these acquisitions.
The issuance of our common stock in the acquisition was exempt from the registration requirements of the Securities Act of 1933, as amended (the "Securities Act"), pursuant to Rule 506 thereof. The offer and sale of the shares of our common stock: (i) was made as part of a transaction that did not involve more than 35 purchasers, ( as defined in Rule 501(e) under the Securities Act) who were either accredited investors or had such knowledge and experience in financial and business matters that such purchaser was capable of evaluating the merits and risks of acquiring shares of our common stock, and (ii) did not involve any general solicitation or general advertising.
Page 33
Performance Graph
The following graph and table shows the changes over the past five-year period in the value of $100 invested at the end of fiscal 2009 in (1) the common stock of Jacobs Engineering Group Inc., (2) the Standard & Poor’s 500 Index, and (3) the Dow Jones Heavy Construction Group Index. The values of each investment are based on share price appreciation, with reinvestment of all dividends, provided any were paid. The investments are assumed to have occurred at the beginning of the period presented. The stock performance included in this graph is not necessarily indicative of future stock price performance.
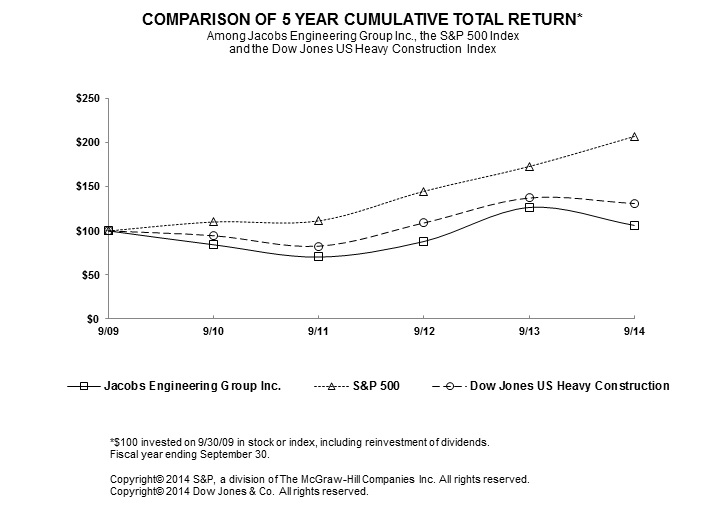
2009 | 2010 | 2011 | 2012 | 2013 | 2014 | |||||||||||||
Jacobs Engineering Group Inc. | 100.00 | 84.22 | 70.27 | 87.99 | 126.62 | 106.25 | ||||||||||||
S&P 500 | 100.00 | 110.16 | 111.42 | 145.07 | 173.13 | 207.30 | ||||||||||||
Dow Jones US Heavy Construction | 100.00 | 94.54 | 82.70 | 109.07 | 137.40 | 131.15 | ||||||||||||
Note: The above information was provided by Research Data Group, Inc.
Page 34
Item 6. | SELECTED FINANCIAL DATA |
The following table presents selected financial data for each of the last five fiscal years. This selected financial data should be read in conjunction with the Consolidated Financial Statements and related notes beginning on page F-1 of this Annual Report on Form 10-K. Dollar amounts are presented in thousands, except for per share information:
2014 (a) | 2013 | 2012 (b) | 2011 | 2010 (c) | ||||||||||||||||
Results of Operations: | ||||||||||||||||||||
Revenues | $ | 12,695,157 | $ | 11,818,376 | $ | 10,893,778 | $ | 10,381,664 | $ | 9,915,517 | ||||||||||
Net earnings attributable to Jacobs | 328,108 | 423,093 | 378,954 | 331,029 | 245,974 | |||||||||||||||
Financial Position: | ||||||||||||||||||||
Current ratio | 1.66 to 1 | 2.14 to 1 | 2.07 to 1 | 1.47 to 1 | 2.23 to 1 | |||||||||||||||
Working capital | $ | 1,542,225 | $ | 2,151,939 | $ | 1,865,025 | $ | 1,011,565 | $ | 1,527,589 | ||||||||||
Current assets | 3,892,071 | 4,039,558 | 3,612,077 | 3,180,091 | 2,767,042 | |||||||||||||||
Total assets | 8,453,659 | 7,274,144 | 6,839,433 | 6,199,226 | 4,683,917 | |||||||||||||||
Cash | 732,647 | 1,256,405 | 1,032,457 | 905,633 | 938,842 | |||||||||||||||
Long-term debt | 764,075 | 415,086 | 528,260 | 2,042 | 509 | |||||||||||||||
Total Jacobs stockholders’ equity | 4,469,255 | 4,213,097 | 3,722,473 | 3,312,988 | 2,859,048 | |||||||||||||||
Return on average equity | 7.56 | % | 10.66 | % | 10.77 | % | 10.73 | % | 8.97 | % | ||||||||||
Backlog: | ||||||||||||||||||||
Technical professional services | $ | 12,607,029 | $ | 11,118,400 | $ | 10,266,500 | $ | 9,100,100 | $ | 7,588,900 | ||||||||||
Field services | 5,773,005 | 6,099,500 | 5,643,200 | 5,189,700 | 5,613,100 | |||||||||||||||
Total | $ | 18,380,034 | $ | 17,217,900 | $ | 15,909,700 | $ | 14,289,800 | $ | 13,202,000 | ||||||||||
Per Share Information: | ||||||||||||||||||||
Basic earnings per share | $ | 2.51 | $ | 3.27 | $ | 2.97 | $ | 2.63 | $ | 1.98 | ||||||||||
Diluted earnings per share | 2.48 | $ | 3.23 | 2.94 | 2.60 | 1.96 | ||||||||||||||
Stockholders’ equity | 33.92 | 32.00 | 28.65 | 25.93 | 22.71 | |||||||||||||||
Average Number of Shares of Common Stock and Common Stock Equivalents Outstanding (Diluted) | 132,371 | 130,945 | 128,692 | 127,235 | 125,790 | |||||||||||||||
Common Shares Outstanding at Year End | 131,753 | 131,639 | 129,936 | 127,785 | 125,909 | |||||||||||||||
(a) | Includes costs of $77.4 million or $0.58 per diluted share, related to the Company's restructuring initiatives in the third and fourth quarter of fiscal 2014. |
(b) | Includes a one-time, after-tax gain of $4.0 million, or $0.03 per diluted share, related to the sale of the Company's intellectual property for iron ore pelletizing and certain other related assets. |
(c) | Includes non-recurring, after-tax charges totaling $60.3 million, or $0.48 per diluted share, relating to the SIVOM judgment (refer to Item 7 — Management’s Discussion and Analysis of Financial Condition and Results of Operations of the Company's 2010 Annual Report on Form 10-K for a description of this matter and its effects on the Company’s fiscal 2010 Consolidated Financial Statements. |
Page 35
Item 7. | MANAGEMENT'S DISCUSSION AND ANALYSIS OF FINANCIAL CONDITION AND RESULTS OF OPERATIONS |
Critical Accounting Policies
In order to understand better the changes that occur to key elements of our financial condition, results of operations, and cash flows, a reader of this Management’s Discussion and Analysis (“MD&A”) should be aware of the critical accounting policies we apply in preparing our consolidated financial statements.
The consolidated financial statements contained in this report were prepared in accordance with U.S. GAAP. The preparation of our consolidated financial statements and the financial statements of any business performing long-term engineering and construction-type contracts requires management to make certain estimates and judgments that affect both the entity’s results of operations and the carrying values of its assets and liabilities. Although our significant accounting policies are described in Note 2 – Significant Accounting Policies of Notes to Consolidated Financial Statements beginning on page F-1 of this Annual Report on Form 10-K, the following discussion is intended to highlight and describe those accounting policies that are especially critical to the preparation of our consolidated financial statements.
Revenue Accounting for Contracts and Use of Joint Ventures—In general, we recognize revenues at the time we provide services. Depending on the commercial terms of the contract, we recognize revenues either when costs are incurred, or using the percentage-of-completion method of accounting by relating contract costs incurred to date to the total estimated costs at completion. This method of revenue recognition requires us to prepare estimates of costs to complete contracts in progress as of the balance sheet dates. In making such estimates, judgments are required to evaluate the possible effects of variances in schedule; the costs of materials and labor; productivity; and the impact of change orders, claims, contract disputes, and achievement of contractual performance standards. Many of our engineering and construction contracts provide for reimbursement of costs plus a fixed or percentage fee. For contracts containing incentive fee arrangements, fees are frequently based on achievement of target completion dates, target costs, and/or other performance criteria. Failure to meet these targets or increases in contract costs can result in unrealized incentive fees or non-recoverable costs, which could exceed revenues recognized from the project.
We provide for contract losses in their entirety in the period they become known, without regard to the percentage of completion. For multiple contracts with a single customer we account for each contract separately.
The nature of our business sometimes results in clients, subcontractors or vendors presenting claims to us for recovery of costs they incurred in excess of what they expected to incur, or for which they believe they are not contractually responsible. In those situations where a claim against us may result in additional costs to the contract, we include in the total estimated costs of the contract (and therefore, the estimated amount of margin to be earned under the contract) an estimate, based on all relevant facts and circumstances available, of the additional costs to be incurred. Similarly, and in the normal course of business, we may present claims to our clients for costs we have incurred for which we believe we are not contractually responsible. In those situations where we have presented such claims to our clients, we include in revenues the amount of costs incurred, without profit, to the extent it is probable that the claims will result in additional contract revenue, and the amount of such additional revenue can be reliably estimated. Costs associated with unapproved change orders are included in revenues using substantially the same criteria used for claims.
Certain cost-reimbursable contracts with government customers as well as certain commercial clients provide that contract costs are subject to audit and adjustment. In this situation, revenues are recorded at the time services are performed based upon the amounts we expect to realize upon completion of the contracts. In those situations where an audit indicates that we may have billed a client for costs that are not allowable under the terms of the contract, we estimate the amount of such nonbillable costs and adjust our revenues accordingly.
As is common to the industry, we execute certain contracts jointly with third parties through various forms of joint ventures and consortiums. Although the joint ventures own and hold the contracts with the clients, the services required by the contracts are typically performed by us and our joint venture partners, or by other subcontractors under subcontracting agreements with the joint ventures. The assets of our joint ventures, therefore, consist almost entirely of cash and receivables (representing amounts due from clients), and the liabilities of our joint ventures consist almost entirely of amounts due to the joint venture partners (for services provided by the partners to the joint ventures under their individual subcontracts) and other subcontractors. In general, at any given time, the equity of our joint ventures represents the undistributed profits earned on contracts the joint ventures hold with clients. Very few of our joint ventures have employees. None of our joint ventures have
Page 36
third-party debt or credit facilities. Our joint ventures, therefore, are simply mechanisms used to deliver engineering and construction services to clients. Rarely do they, in and of themselves, present any risk of loss to us or to our partners separate from those that we would carry if we were performing the contract on our own. Under U.S. GAAP, our share of losses associated with the contracts held by the joint ventures, if and when they occur, has always been reflected in our Consolidated Financial Statements.
In evaluating the Company's joint ventures (also referred to as "variable interest entities", or "VIEs") for accounting and consolidation purposes, we perform a qualitative analysis to determine whether or not the Company has a “controlling financial interest” in the VIE. The Company is deemed to have a controlling financial interest in a VIE if it has (i) the power to direct the activities of the VIE that most significantly impact the VIE's economic performance; and (ii) the right to receive benefits, or obligation to absorb losses, that could potentially be significant to the VIE. In making our qualitative analysis, the Company assesses each VIE to determine those activities that most significantly impact the VIE's economic performance and whether the Company, another entity, or multiple entities have the power to direct those activities.
If we determine that we have the power to direct those activities of the VIE that most significantly impact its financial performance and have the right or obligation to receive benefits or absorb losses that could potentially be significant to the VIE, then we are the primary beneficiary of the VIE and we consolidate the VIE. If we determine that we do not have the power to direct the most significant activities of the VIE or power is shared by two or more unrelated parties, then we are not the primary beneficiary and we do not consolidate the VIE.
For the Company's unconsolidated joint ventures, we use either the equity method of accounting or proportional consolidation. The Company does not currently participate in any significant VIEs in which it has a controlling financial interest. There were no changes in facts and circumstances in the period that caused the Company to reassess the method of accounting for its VIEs.
Accounting for Stock Issued to Employees and Others— We measure the cost of employee services received in exchange for an award of equity instruments based on the estimated grant-date fair value of the award. We estimate the fair value of stock options granted to employees and directors using the Black-Scholes option-pricing model. Like all option-pricing models, the Black-Scholes model requires the use of highly subjective assumptions including (i) the expected volatility of the market price of the underlying stock, and (ii) the expected term of the award, among others. Accordingly, changes in assumptions and any subsequent adjustments to those assumptions can cause drastically different fair values to be assigned to our stock option awards. For restricted stock units containing service and performance conditions with measures external to the Company, compensation expense is based on the fair value of such units determined using Monte Carlo Simulations. Due to the uncertainties inherent in the use of assumptions and the results of applying Monte Carlo Simulations, the amount of expense recorded in the accompanying consolidated financial statements may not be representative of the effects on our future consolidated financial statements because equity awards tend to vest over several years and additional equity awards may be made in the future.
Accounting for Pension Plans— The accounting for pension plans requires the use of assumptions and estimates in order to calculate periodic pension cost and the value of the plans’ assets and liabilities. These assumptions include discount rates, investment returns, and projected salary increases, among others. The actuarial assumptions used in determining the funded statuses of the plans are provided in Note 6 – Pension Plans of Notes to Consolidated Financial Statements beginning on page F-1 of this Annual Report on Form 10-K.
The expected rates of return on plan assets for fiscal 2015 range from 4.5% to 8.5% compared to 0.4% to 8.5% for the prior year. We believe the range of rates selected for fiscal 2015 reflects the long-term returns expected on the plans’ assets, considering recent market conditions, projected rates of inflation, the diversification of the plans’ assets, and the expected real rates of market returns. The discount rates used to compute plan liabilities were changed from a range of 0.4% to 9.3% in fiscal 2013 to a range of 1.8% to 8.8% in fiscal 2014. These assumptions represent the Company’s best estimate of the rates at which its pension obligations could be effectively settled.
Changes in the actuarial assumptions often have a material effect on the values assigned to plan assets and liabilities, and the associated pension expense. For example, if the discount rate used to value the net pension benefit obligation (“PBO”) at September 26, 2014, was higher (lower) by 0.5%, the PBO would have been lower (higher) at that date by approximately $92.0 million for non-U.S. plans, and by approximately $21.1 million for U.S. plans. If the expected return on plan assets was higher (lower) by 1.0%, the net periodic pension cost for fiscal 2015 would be lower (higher) by approximately $8.8 million for non-U.S. plans, and by approximately $3.8 million for U.S. plans. Differences between actuarial assumptions and actual performance (i.e., actuarial gains and losses) that are not recognized as a component of net periodic pension cost in the period
Page 37
in which such differences arise are recorded to accumulated other comprehensive income (loss) and are recognized as part of net periodic pension cost in future periods in accordance with U.S. GAAP. Management monitors trends in the marketplace within which our pension plans operate in an effort to assure the fairness of the actuarial assumptions used.
Contractual Guarantees, Litigation, Investigations, and Insurance— In the normal course of business, we are subject to certain contractual guarantees and litigation. The guarantees to which we are a party generally relate to project schedules and plant performance. Most of the litigation in which we are involved has us as a defendant in workers’ compensation; personal injury; environmental; employment/labor; professional liability; and other similar lawsuits. We maintain insurance coverage for various aspects of our business and operations. We have elected, however, to retain a portion of losses that occur through the use of various deductibles, limits, and retentions under our insurance programs. This situation may subject us to some future liability for which we are only partially insured, or completely uninsured, and we intend to mitigate any such future liability by continuing to exercise prudent business judgment in negotiating the terms and conditions of our contracts.
In accordance with U.S. GAAP, we record in our Consolidated Balance Sheets amounts representing our estimated liability relating to such guarantees, litigation, and insurance claims. We include any adjustments to such liabilities in our consolidated results of operations.
In addition, as a contractor providing services to the U.S. federal government and several of its agencies, we are subject to many levels of audits, investigations, and claims by, or on behalf of, the U.S. federal government with respect to contract performance, pricing, costs, cost allocations, and procurement practices. We adjust revenues based upon the amounts we expect to realize considering the effects of any client audits or governmental investigations.
Testing Goodwill for Possible Impairment— The goodwill carried on our Consolidated Balance Sheets is tested annually for possible impairment. In performing the annual impairment test, we evaluate our goodwill at the reporting unit level. We have determined that we have two reporting units, which are based on geography. We refer to these reporting units internally as “Europe” and “Non-Europe”. Each of our reporting units conducts the business activities described elsewhere in this 2014 Form 10-K, which includes providing professional technical services such as design, engineering, and architectural services; construction and/or construction management services; and operations and maintenance services.
Our geography-based reporting units reflect the Company’s organizational structure, which is based predominately on geography, as well as our acquisition strategy, which favors acquisition targets that, among other things, provide access to new geographic areas. Our reporting units represent rational groupings into which substantially all of our major acquisitions (which are responsible for the goodwill appearing in our Consolidated Balance Sheets) have been assimilated, and where all of the operations under each reporting unit share in the benefits of the goodwill created by our acquisitions.
U.S. GAAP does not prescribe a specific valuation method for estimating the fair value of reporting units. The valuation technique used to estimate the fair value of the reporting units requires the use of significant estimates and assumptions, including revenue growth rates, operating margins, discount rates and future market conditions, among others.
Page 38
For fiscal years 2013 through 2014, we used both an income approach and a market approach to test our goodwill for possible impairment. Such approaches require us to make estimates and judgments. Under the income approach, fair value is determined by using the discounted cash flows of our reporting units. Under the market approach, the fair value of our reporting units is determined by reference to guideline companies that are reasonably comparable to our reporting units; the fair values are estimated based on the valuation multiples of the invested capital associated with the guideline companies. In assessing whether there is an indication that the carrying value of goodwill has been impaired, we utilize the results of both valuation techniques and consider the range of fair values indicated. The fair values for each reporting unit exceeded the respective book values by over 40%. The key assumptions used to determine the fair value of our reporting units in our testing were:
Income Approach
2013 Assumptions:
•Company financial projections for fiscal years 2013 to 2016
•Weighted average cost of capital of 11%
•Residual period growth rate of 3%
2014 Assumptions:
•Company financial projections for fiscal years 2014 to 2018
•Weighted average cost of capital of 11%
•Residual period growth rate of 3%
Market Approach
With respect to the market approach, for guideline publicly traded companies reasonably comparable to the Company's reporting units, the Company used multiples ranging from 6.3 to 8.0 of EBITDA (earnings before interest, taxes, depreciation, and amortization) and 8.0 to 9.7 of EBIT (earnings before interest and taxes), for the fiscal year 2013 test applied to the projected fiscal year 2013 financial results for each of our reporting units. The Company used multiples ranging from 5.9 to 7.6 of EBITDA and 7.6 to 10.0 of EBIT, for the fiscal year 2014 test applied to the projected fiscal year 2014 financial results for each of our reporting units.
It is possible that changes in market conditions, economy, facts and circumstances, judgments, and assumptions used in estimating the fair value could change, resulting in possible impairment of goodwill in the future. The fair values resulting from the valuation techniques used are not necessarily representative of the values we might obtain in a sale of the reporting units to willing third parties.
The Company performs the annual goodwill impairment test for the reporting units at the end of the third quarter of our fiscal year. The Company will test goodwill for impairment between annual tests if an event occurs or circumstances change that would more likely than not reduce the fair value of a reporting unit below its carrying amount. We have determined that the fair value of our reporting units substantially exceeded their respective carrying values for fiscal years 2014, 2013, and 2012.
Based on the most recent results of our annual impairment tests, there were no indications of impairment of the goodwill shown in our Consolidated Balance Sheets at either September 26, 2014, or September 27, 2013. Furthermore, the Company performed an interim impairment assessment at September 26, 2014, and concluded that it was not more likely than not that the fair value of either reporting unit had been reduced to an amount below its carrying amount.
Page 39
Fiscal 2014 — Overview
The 2014 Restructuring
During the third quarter of fiscal 2014, the Company commenced a series of initiatives intended to improve operational efficiency, reduce costs, accelerate the integration of SKM, and better position the Company to drive growth of the business in the future. We are not exiting any geographic markets or service types, nor exiting any client end-markets as a result of the initiatives. Actions completed during the third and fourth quarters of fiscal 2014 included involuntary terminations, the abandonment of certain leased offices, and the co-location of employees. Included in the Company's consolidated results of operations for fiscal 2014 are pre-tax costs of $93.3 million relating to the 2014 restructuring effort (the "2014 Restructuring"). The costs of the 2014 Restructuring are included in selling, general, and administrative expense in the accompanying Consolidated Statements of Earnings net of a $23.6 million reduction in bonus plan expense. The following table summarizes the effects of the 2014 Restructuring on the Company's consolidated results of operations for fiscal 2014 (in thousands, except for earnings (loss) per share):
Year Ended | |||||||||||
September 26, 2014 | |||||||||||
Without 2014 Restructuring | Effects of 2014 Restructuring | U.S. GAAP | |||||||||
Consolidated pre-tax earnings (loss) | $ | 635,496 | $ | (93,330 | ) | $ | 542,166 | ||||
Tax (expense) benefit | (206,003 | ) | 15,949 | (190,054 | ) | ||||||
Net earnings of the Group | 429,493 | (77,381 | ) | 352,112 | |||||||
Non-controlling interests | (24,004 | ) | — | (24,004 | ) | ||||||
Net earnings of Jacobs | $ | 405,489 | $ | (77,381 | ) | $ | 328,108 | ||||
Diluted earnings (loss) per share | $ | 3.06 | $ | (0.58 | ) | $ | 2.48 | ||||
The Company does not expect to incur any costs for the 2014 Restructuring in fiscal 2015.
The Fiscal 2014 Acquisition of Sinclair Knight Merz
On December 13, 2013, the Company acquired all of the outstanding equity interests in Sinclair Knight Merz Management Pty Limited and Sinclair Knight Merz Holdings Limited (collectively, "SKM"), a provider of engineering, design, procurement, construction and project management services for approximately $1.2 billion in cash. SKM's results of operations have been included in the Company's consolidated results of operations since the date of acquisition. The following table presents SKM's results of operations included in the Company's consolidated results of operations for fiscal 2014 (in thousands, except per share amounts):
2014 | |||
SKM Revenues | $ | 765,152 | |
Net earnings attributable to Jacobs: | |||
Before 2014 Restructuring | $ | 24,551 | |
After 2014 Restructuring | $ | 10,156 | |
Basic and Diluted EPS: | |||
Before 2014 Restructuring | $ | 0.19 | |
After 2014 Restructuring | $ | 0.08 | |
Additional information related to the SKM acquisition can be found in Note 2-Significant Accounting Policies- Business Combinations of Notes to Consolidated Financial Statements beginning on page F-1 of this Annual Report on Form 10-K.
Page 40
Other 2014 Events
In addition to the 2014 Restructuring and the acquisition of SKM, the Company's consolidated results of operations for fiscal 2014 were affected by the following discrete events:
•$6.8 million, or $0.05 per diluted share, increase to net earnings due to the favorable resolution of an international tax matter in the first quarter of fiscal 2014; as a result of these events, approximately $4.1 million of accrued interest expense was reversed;
•$6.4 million, or $0.05 per diluted share, increase to net earnings related to a gain on the sale of certain intellectual property in the second quarter of fiscal 2014;
•$22.7 million, or $0.18 per diluted share, decrease to net earnings relating to certain specific operational events at SKM and SKM transaction-related costs and expenses incurred during the first half of the fiscal year;
•$22.3 million, or $0.16 per diluted share, decrease to net earnings due to lower margins associated with certain projects in Europe combined with unusual weather effects in the second quarter of fiscal 2014; and,
2014 Overview
The Company’s net earnings decreased $95.0 million, or 22.5%, from $423.1 million for fiscal 2013 to $328.1 million for fiscal 2014. In addition to the effects of the 2014 Restructuring and the acquisition of SKM, the Company's consolidated results of operations for fiscal 2014 were affected by the other 2014 events described above.
Above we disclose and discuss our results of operations before the effects of the 2014 Restructuring or the other transactions and events described above. Although such information is non-GAAP in nature, it is presented because management believes it provides additional context for investors to better understand the Company’s operating results to investors to assess the Company’s performance and operating trends.
Backlog at September 26, 2014, increased $1.2 billion, or 6.7%, to $18.4 billion. The increase for the year due primarily to the acquisitions of SKM and FNS, combined with new awards from clients operating in the Refining-Downstream, Infrastructure, and Chemicals and Polymers industry groups and markets, among others.
Results of Operations
General
Our business focuses exclusively on providing technical professional services and field services to a large number of industrial, commercial, and governmental clients around the world. The services we provide generally fall into four broad categories:
• | Project Services (including engineering, design, architecture, interiors, planning, environmental, and similar services); |
• | Process, Scientific, and Systems Consulting Services (including services performed in connection with scientific testing, analysis, and consulting activities, as well as information technology and systems engineering and integration activities); |
• | Construction Services (encompassing traditional field construction services as well as modular construction activities, direct hire construction, and construction management services); and |
• | Operations and Maintenance Services (including services performed in connection with operating large, complex facilities on behalf of clients, as well as services involving process plant and facilities maintenance). |
The scope of services we can provide our clients, therefore, ranges from consulting and conceptual design services (which are often required by clients in the very early stages of a project) to complete single-responsibility, design-build contracts, to services required in the post start-up phases of a project such as O&M services.
Page 41
The following table sets forth our revenues by type of service for each of the last three fiscal years (in thousands):
2014 | 2013 | 2012 | ||||||||||
Technical Professional Services revenues: | ||||||||||||
Project Services | $ | 6,576,004 | $ | 5,977,917 | $ | 5,693,419 | ||||||
Process, Scientific, and Systems Consulting | 758,957 | 705,694 | 772,031 | |||||||||
Total Technical Professional Services revenues | 7,334,961 | 6,683,611 | 6,465,450 | |||||||||
Field Services revenues: | ||||||||||||
Construction | 4,138,729 | 3,825,878 | 3,145,311 | |||||||||
Operations and Maintenance (“O&M”) | 1,221,467 | 1,308,887 | 1,283,017 | |||||||||
Total Field Services revenues | 5,360,196 | 5,134,765 | 4,428,328 | |||||||||
$ | 12,695,157 | $ | 11,818,376 | $ | 10,893,778 | |||||||
Project Services revenues for the year ended September 26, 2014, increased $598.1 million, or 10.0%, from the corresponding period last year. The increase was due primarily to revenues attributable to SKM. Also contributing to the increases were higher levels of activity in several of industry groups and markets we serve, including Buildings, Chemicals and Polymers, and Refining-Downstream.
Whereas construction revenues for the year ended September 26, 2014, increased $312.9 million, or 8.2%, from the corresponding period last year, revenues from Process, Scientific, and Systems Consulting and O&M services for fiscal 2014 were relatively unchanged from the prior year. The increase in construction revenues during fiscal 2014 as compared to last year was due primarily to projects for customers operating in the Chemicals and Polymers market and the Mining and Minerals industries in the U.S.
We focus our services on clients operating in select industry groups and markets. We believe these industry groups and markets have sufficient common needs to permit cross-utilization of our resources. The following table sets forth our revenues by these industry groups and markets for each of the last three fiscal years (in thousands):
2014 | 2013 | 2012 | ||||||||||
Chemicals and Polymers | $ | 2,985,352 | $ | 2,391,144 | $ | 1,704,723 | ||||||
National Government Programs | 2,282,116 | 2,284,533 | 2,272,611 | |||||||||
Refining – Downstream | 2,239,343 | 2,337,387 | 2,379,750 | |||||||||
Infrastructure | 1,361,574 | 1,015,864 | 1,085,649 | |||||||||
Mining & Minerals | 918,608 | 712,320 | 550,134 | |||||||||
Oil & Gas – Upstream | 863,344 | 915,478 | 790,546 | |||||||||
Buildings | 834,122 | 738,404 | 843,938 | |||||||||
Industrial and Other | 758,036 | 899,756 | 690,124 | |||||||||
Pharmaceuticals and Biotechnology | 452,662 | 523,490 | 576,303 | |||||||||
$ | 12,695,157 | $ | 11,818,376 | $ | 10,893,778 | |||||||
Revenues increased $876.8 million, or 7.4%, from $11.8 billion for fiscal 2013 to $12.7 billion for fiscal 2014.
Revenues from clients operating in the Chemicals and Polymers industries increased $594.2 million, or 24.9%, from $2.4 billion for fiscal 2013 to $3.0 billion for fiscal 2014. This increase occurred throughout many of the geographic locations in which we operate. We continue to receive new awards for FEED (front-end engineering design) and pre-FEED services. We have long-term relationships with numerous chemical companies around the world, and we believe this industry group will provide strong growth opportunities long-term. We see particularly strong growth potential in North America and the Middle East due to the growing source of available feedstock. Leveraging our geographic presence as strengthened by the SKM
Page 42
transaction, we were recently awarded a significant professional services contract for what will be the largest chlorine dioxide plant in the world, located in Asia. Although we see good growth opportunities for this element of our business, particularly as they relate to methanol, derivatives, and other projects, we continue to see owners take a measured approach to releasing succeeding phases of their capital projects.
Revenues from clients operating in the Infrastructure market increased $345.7 million, or 34.0%, from $1.0 billion for fiscal 2013 to $1.4 billion for fiscal 2014. SKM contributed approximately 50.0% of the increase, with the U.K. and U.S. legacy operations contributing to the remainder of the increase. We see this market as strong, particularly in several of the sub-markets within this industry group, particularly for transportation and water projects. One example is the Asset Management Programme (AMP6) cycle in the U.K., where we believe the Company is well positioned to assist clients improve their relative efficiency and wastewater effluent quality. We also see increasing momentum behind transportation infrastructure projects in many of the geographies in which we operate. Also included in this revenue category is our growing services to customers operating in the telecommunications industry. Long-term, we see this market as attracting significant capital as countries around the world strive to improve and expand their wireless communications capabilities.
Revenues from clients operating in the Buildings market increased $95.7 million, or 13.0%, from $738.4 million for fiscal 2013 to $834.1 million for fiscal 2014. Although SKM was responsible for most of this increase, the Company saw growth in our U.S. and Middle East markets. We also see growth potential in parts of North Africa where we believe we are well portioned to capitalize on buildings projects with high technical content (e.g., health care, aviation, and education). We view the Buildings market as improving as our business continues to shift towards projects for clients in the private sector.
Revenues from clients operating in the Mining and Minerals markets increased $206.3 million, or 29.0%, from $712.3 million for fiscal 2013 to $918.6 million for fiscal 2014. The increased revenues in 2014 was due primarily to SKM. Globally, our clients in these industries continue to behave conservatively when it comes to new spend. In addition, although we believe consolidation among companies in this industry will provide more stable capital spending in the long-term, such actions may have significant impacts in the short-term. Nevertheless, we believe we will be able to capture additional market share from clients operating in these industries by continuing to focus on asset optimization and sustaining capital projects (small-cap projects and maintenance-driven work) for our clients. In addition, we expect the SKM acquisition to expand our capabilities beyond non-ferrous metals to iron ore and coal and to bring together our existing hydro-metallurgy and concentrator skills with SKM's strength in materials handling and infrastructure.
Revenues from clients operating in the Pharmaceutical and Biotechnology markets decreased $70.8 million, or 13.5%, from $523.5 million for fiscal 2013 to $452.7 million for fiscal 2014. The decrease in revenues were due primarily to the normal wind-down and completion of projects, including work on several vaccine plants located in North America. Although revenues from clients operating in these industries have declined over the preceding three fiscal years, we have seen a recent increase in new project awards, as well as indications from certain clients of increasing captial investment. We continue to view these industries as improving with prospects in the area of biotechnology-based drug development, principally in North America, and secondary manufacturing expansion, primarily in India and Asia.
The Industrial and Other category includes projects for clients operating in the Pulp & Paper, High-Technology Manufacturing, Power, and Food, Beverage & Consumer Products industries. Revenues in this category decreased $141.7 million, or 15.8%, from $899.8 million for fiscal 2013 to $758.0 million for fiscal 2014. The decrease in Industrial and Other revenues were due primarily to decreased activity in the Pulp & Paper market in the U.S. and the High-Technology Manufacturing market in Ireland.
Direct costs of contracts increased $645.3 million, or 6.5%, from $9.98 billion during fiscal 2013 to $10.62 billion during fiscal 2014. Direct costs of contracts include all costs incurred in connection with and directly for the benefit of client contracts, including depreciation and amortization relating to assets used in connection with providing the services required by client projects. The level of direct costs of contracts may fluctuate between reporting periods due to a variety of factors including the amount of pass-through costs we incur during a period. On those projects where we are responsible for subcontract labor or third-party materials and equipment, we reflect the amounts of such items in both revenues and costs (and we refer to such costs as “pass-through costs”). On other projects, where the client elects to pay for such items directly and we have no associated responsibility for such items, these amounts are not considered pass-through costs and are, therefore, not reflected in either revenues or costs. To the extent that we incur a significant amount of pass-through costs in a period, our direct cost of contracts are likely to increase as well.
Pass-through costs increased $330.0 million, or 12.6%, from $2.62 billion during fiscal 2013 to $2.95 billion for fiscal 2014. In general, pass-through costs are more significant on projects that have a higher content of field services activities. Pass-
Page 43
through costs are generally incurred at a specific point in the lifecycle of a project and are highly dependent on the needs of our individual clients and the nature of the clients’ projects. However, because we have hundreds of projects which start at various times within a fiscal year, the effect of pass-through costs on the level of direct costs of contracts can vary between fiscal years without there being a fundamental or significant change to the underlying business.
As a percentage of revenues, direct costs of contracts were 83.7% for fiscal 2014, compared to 84.4% for fiscal 2013. The relationship between direct costs of contracts and revenues will fluctuate between reporting periods depending on a variety of factors including the mix of business during the reporting periods being compared as well as the level of margins earned from the various types of services provided. Generally speaking, the more procurement we do on behalf of our clients (i.e., where we purchase equipment and materials for use on projects, and/or procure subcontracts in connection with projects) and the more field services revenues we have relative to technical, professional services revenues, the higher the ratio will be of direct costs of contracts to revenues. Because revenues from pass-through costs typically have lower margin rates associated with them, it is not unusual for us to experience an increase or decrease in such revenues without experiencing a corresponding increase or decrease in our gross margins and operating profit. The ratio of direct costs of contracts to revenues over the prior year period decreased, primarily as a result of higher margins in both professional technical services and field services activities and the acquisition of SKM.
Selling, general, and administrative ("SG&A") expenses for fiscal 2014 increased by $372.4 million, or 31.7%, to $1.55 billion, compared to $1.17 billion for fiscal 2013. The increase in SG&A expenses reflects the effects of the 2014 Restructuring discussed above as well as the results of operations of SKM. Also included in SG&A expenses for the current fiscal year are transaction-related expenses incurred in connection with the SKM acquisition of $9.2 million. Also included in SG&A expenses for fiscal 2014 are due diligence and other transaction-related costs incurred in connection with other mergers and acquisition activity.
Net interest expense for fiscal 2014 decreased $5.8 million to $1.7 million from $7.5 million in fiscal 2013. The decrease is related to the reassessment during fiscal 2014 of a tax matter involving one of our international subsidiaries which resulted in the reversal of $8.1 million of accrued interest, offset in part by the net impacts of the SKM acquisition.
The Company’s consolidated effective income tax rate was 35.1% for fiscal 2014, compared to 33.5% in fiscal 2013. Contributing to the increase as compared to the prior year was the effect of the 2014 Restructuring. Also contributing to the higher effective tax rate is the stamp duty paid in the first quarter of fiscal 2014 related to the SKM acquisition.
Fiscal 2013 Compared to Fiscal 2012
We recorded net earnings of $423.1 million, or $3.23 per diluted share, for the fiscal year ended September 27, 2013, compared to $379.0 million, or $2.94 per diluted share for the fiscal year ended September 28, 2012.
Revenues increased $924.6 million, or 8.5%, from $10.9 billion for fiscal 2012 to $11.8 billion for fiscal 2013.
Revenues from clients operating in the Chemicals and Polymers industries increased $686.4 million, or 40.3%, from $1.7 billion for fiscal 2012 to $2.4 billion for fiscal 2013. The effect of shale gas projects and the low price of natural gas influenced activity in the chemicals market in fiscal 2013. Furthermore, our clients were looking at various options to monetize natural gas. This increased activity occurred primarily in the U.S. and the U.K. along with smaller increases in the Middle East and Asia.
Revenues from clients operating in the Refining—Downstream market decreased $42.4 million, or 1.8%, from $2.38 billion for fiscal 2012 to $2.34 billion for fiscal 2013. Included in revenues for fiscal 2012 were a significant amount of pass-through costs for a large U.S. based project that was winding down during fiscal 2012. Notwithstanding these decreases, we had strong sales in this market during fiscal 2013. Several downstream companies have announced large capital projects and the industry is beginning to focus on compliance with the EPA TIER 3 Ultra Low Sulfur Gasoline regulations where we believe we are well positioned to support our clients with the required facility modifications.
National Government Programs revenues for fiscal 2013 remained relatively flat compared to fiscal 2012. Uncertainties over U.S. government budget issues and ongoing sequestration concerns remained a primary driver limiting our growth in this market. These actions had little effect on the Company's projects in backlog in this market during fiscal 2013. We believe that sequestration slowed the release of new project opportunities in this market. Nevertheless, we had significant Aerospace and Defense awards in this market during fiscal 2013. In addition, certain changes in government contracting in the U.S. helped to stabilize this area of our business. We saw an increasing volume of work released by U.S. government agencies in the form of
Page 44
multiple award task order contracts ("MATOC"). These types of awards allow the Company to bid on, and participate in, more government sites than large, single-award contracts.
Revenues from clients operating in the Infrastructure market decreased $69.8 million, or 6.4%, from $1.09 billion for fiscal 2012 to $1.02 billion for fiscal 2013. We had significant wins in the U.S. market in fiscal 2013. The partial U.S. federal government shutdown added some uncertainty to our U.S. infrastructure market, though we experienced little short-term disruption.
Revenues from clients operating in the Oil and Gas—Upstream market increased $124.9 million, or 15.8%, from $790.5 million for fiscal 2012 to $915.5 million for fiscal 2013. These increases were primarily a result of improvement in the Canadian oil and gas business, particularly in field services. We saw more opportunities in the Middle East, including unconventional gas development programs and large pipeline FEED projects. Onshore development and production in the U.S. continued to be strong. The Australian market was being driven by the development of liquefied natural gas export projects.
Revenues from clients operating in the Buildings market decreased $105.5 million, or 12.5%, from $844.0 million for fiscal 2012 to $738.4 million for fiscal 2013. The state of the U.S. economy impacted this market. Our Buildings business continued to shift towards projects for clients in the private sector. Opportunities in the private sector business came from mission critical, education, healthcare, aviation, and corporate and commercial programs and projects.
Revenues from clients operating in the Mining and Minerals market increased $162.2 million, or 29.5%, from $550.1 million for fiscal 2012 to $712.3 million for fiscal 2013. Generally, our clients in this market were affected negatively by a general slowdown in the rate of growth in the Chinese economy; falling spot prices for iron ore, coking, and thermal coal; and weaker commodity prices - albeit these declines occurred from prices that were generally high from a historical perspective. These trends resulted in clients reducing their capital spending in the Mining and Minerals market. Despite this cooling market, we were able to capture additional market share during fiscal 2013. The increase in revenues in this market in fiscal 2013 as compared to fiscal 2012 was primarily from projects based out of the U.S.
Revenues from clients operating in the Pharmaceutical and Biotechnology markets decreased $52.8 million, or 9.2%, from $576.3 million for fiscal 2012 to $523.5 million for fiscal 2013. Though several of our customers delayed projects, this market was fairly stable for us in fiscal 2013.
Revenues from clients operating in the Industrial and Other markets increased $209.6 million, or 30.4%, from $690.1 million for fiscal 2012 to $899.8 million for fiscal 2013. The increases in Industrial and Other revenues were due primarily to increased activity in the Pulp & Paper market in the U.S. and the High-Technology Manufacturing market in Ireland.
Direct costs of contracts increased $809.3 million, or 8.8%, from $9.17 billion during fiscal 2012 to $9.98 billion during fiscal 2013. Pass-through costs increased $296.4 million, or 12.7%, from $2.33 billion during fiscal 2012 to $2.62 billion for fiscal 2013.
As a percentage of revenues, direct costs of contracts were 84.4% for fiscal 2013, compared to 84.1% for fiscal 2012. The increase in the ratio of direct costs of contracts to revenues in fiscal 2013 as compared to fiscal 2012 was due primarily to a slight decrease in margins for our professional services offset by improved margins for our field services.
SG&A expenses for fiscal 2013 increased by $42.4 million, or 3.8%, to $1.17 billion, compared to $1.13 billion for fiscal 2012. The increase in SG&A is primarily reflective of the Company's increased business activity when compared to fiscal 2012. As a percentage of revenues, SG&A costs declined for fiscal 2013 as compared to fiscal 2012.
Interest expense for fiscal 2013 increased $1.2 million to $12.9 million from $11.7 million in fiscal 2012. Interest expense in both fiscal 2013 and fiscal 2012 was due primarily to the debt incurred in connection with the acquisition of the Aker Entities. The increase in interest expense in fiscal 2013 when compared to fiscal 2012 is related primarily to the accrual of interest related to a potential tax liability from an acquisition completed in fiscal 2012.
The Company’s consolidated effective income tax rate was 33.5% for fiscal 2013, compared to 34.1% in fiscal 2012. The Company's lower effective income tax rate in fiscal 2013 when compared to the corresponding period in fiscal 2012 was due primarily to an increase in income attributable to noncontrolling interests.
Page 45
Contractual Obligations
The following table sets forth certain information about our contractual obligations as of September 26, 2014 (in thousands):
Payments Due by Fiscal Period | ||||||||||||||||||||
Total | 1 Year or Less | 2 - 3 Years | 4 - 5 Years | More than 5 Years | ||||||||||||||||
Debt obligations | $ | 800,807 | $ | 36,732 | $ | 764,075 | ||||||||||||||
Operating leases (a) | 1,095,323 | 230,866 | 329,172 | 226,395 | 308,890 | |||||||||||||||
Obligations under defined benefit pension plans (b) | 407,264 | 42,079 | 89,275 | 96,560 | 179,350 | |||||||||||||||
Obligations under nonqualified deferred compensation plans (c) | 133,112 | 11,400 | 24,186 | 26,160 | 71,366 | |||||||||||||||
Purchase obligations (d) | 1,516,229 | 1,516,229 | ||||||||||||||||||
Interest (e) | 31,295 | 9,594 | 17,361 | 4,340 | ||||||||||||||||
Total | $ | 3,984,030 | $ | 1,846,900 | $ | 459,994 | $ | 353,455 | $ | 1,323,681 | ||||||||||
(a) | Assumes the Company will make the end of lease term residual value guarantee payment of $38.8 million in 2015 with respect to the lease of an office building in Houston, Texas. Please refer to Note 10—Commitments and Contingencies, and Derivative Financial Instruments of Notes to Consolidated Financial Statements beginning on page F-1 of this Annual Report on Form 10-K. |
(b) | Assumes that future contributions will be consistent with amounts projected to be contributed in fiscal 2015, allowing for certain growth based on rates of inflation and salary increases, but limited to the amount recorded as of September 26, 2014. Actual contributions will depend on a variety of factors, including amounts required by local laws and regulations, and other funding requirements. |
(c) | Assumes that future payments will be consistent with amounts paid in fiscal 2014, allowing for certain growth. Due to the nonqualified nature of the plans, and the fact that benefits are based in part on years of service, the payments included in the schedule were limited to the amount recorded as of September 26, 2014. |
(d) | Represents those liabilities estimated to be under firm contractual commitments as of September 26, 2014; primarily accounts payable and accrued payroll. |
(e) | Determined based on borrowings outstanding at the end of fiscal 2014 using the interest rates in effect at that time and, for our outstanding long term debt, concluding with the expiration date of the 2014 Facility, as defined below. |
Page 46
Backlog
Backlog represents the total dollar amount of revenues we expect to record in the future as a result of performing work under contracts that have been awarded to us. With respect to O&M contracts, however, we include in backlog the amount of revenues we expect to receive for only one succeeding year, regardless of the remaining life of the contract. For national government programs (other than U.S. federal O&M contracts), our policy is to include in backlog the full contract award, whether funded or unfunded, excluding option periods.
The following table summarizes our backlog for each of the last three fiscal years (in millions):
2014 | 2013 | 2012 | ||||||||||
Technical professional services | $ | 12,607.0 | $ | 11,118.4 | $ | 10,266.5 | ||||||
Field services | 5,773.0 | 6,099.5 | 5,643.2 | |||||||||
Total | $ | 18,380.0 | $ | 17,217.9 | $ | 15,909.7 | ||||||
The entire value of contract awards are added to backlog when the contracts are awarded to us. Accordingly, backlog can fluctuate from one reporting period to the next due to the timing of when new contracts are added to backlog and when the contract revenue is recognized in our consolidated financial statements. Many of our contracts require us to provide services that span over a number of fiscal quarters (and sometimes over fiscal years). Our backlog at September 26, 2014 increased by $1.2 billion, or 6.7%, to $18.4 billion from $17.2 billion at September 27, 2013. The increase in backlog from September 27, 2013 to September 26, 2014 was due primarily to the acquisitions of SKM and FNS, combined with new awards from clients operating in the Refining-Downstream, Infrastructure, and Chemicals and Polymers industry groups and markets, among others.
In accordance with industry practice, substantially all of our contracts are subject to cancellation or termination at the discretion of the client. In a situation where a client terminates a contract, we would ordinarily be entitled to receive payment for work performed up to the date of termination and, in certain instances, we may be entitled to allowable termination and cancellation costs. There were no significant project cancellations in fiscal 2014.
While management uses all information available to it to determine backlog, our backlog at any given time is subject to changes in the scope of services to be provided as well as increases or decreases in costs relating to the contracts included therein. Accordingly, backlog is not necessarily a reliable indicator of future revenues.
Backlog relating to work to be performed either directly or indirectly for the U.S. federal government and its agencies totaled approximately $4.8 billion (or 26.1% of total backlog), $4.1 billion (or 23.9% of total backlog), and $3.6 billion (or 22.9% of total backlog) at September 26, 2014, September 27, 2013, and September 28, 2012, respectively. Most of our federal contracts require that services be provided beyond one year. In general, these contracts must be funded annually (i.e., the amounts to be spent under the contract must be appropriated by the U.S. Congress to the procuring agency, and then the agency must allot these sums to the specific contracts).
Subject to the factors discussed in Item 1A—Risk Factors, above, we estimate that approximately 9.1 billion, or 49.3%, of total backlog at September 26, 2014 will be realized as revenues within the next fiscal year.
Effects of Inflation
The effects of inflation on our business is discussed in Item 1A—Risk Factors, and is incorporated herein by reference.
Liquidity and Capital Resources
At September 26, 2014, our primary sources of liquidity consisted of $0.7 billion of cash and cash equivalents and $0.8 billion of available borrowing capacity under our $1.60 billion revolving credit facility (the "2014 Facility"). Additional information regarding the 2014 Facility is set forth in Note 5 - Borrowings in Notes to Consolidated Financial Statements beginning on page F-1 of this Annual Report on Form 10-K. We finance as much of our operations and growth as possible through cash generated by our operations.
During fiscal 2014, our cash and cash equivalents decreased by $0.5 billion from $1.26 billion at September 27, 2013 to $0.7 billion at September 26, 2014. This compares to a net increase in cash and cash equivalents of $223.9 million during the corresponding period last year. During fiscal 2014, we experienced net cash inflows of $721.7 million from operating activities
Page 47
and $304.9 million from financing activities. These cash inflows were offset by cash outflows of $1,518.8 million from investing activities and $31.6 million from the effects of exchange rate changes.
Operations provided net cash of $721.7 million during fiscal 2014. This compares to net cash inflows of $448.5 million and $299.8 million during fiscal 2013 and 2012, respectively. The $273.2 million increase in cash provided by operations in fiscal 2014 as compared to fiscal 2013 was due primarily to a $327.5 million favorable change in the Company's working capital accounts partially offset by a $88.1 million decrease in net earnings attributable to the Group and a $28.5 million change related to the Company's defined benefit pension plans.
Because such a high percentage of our revenues are earned on cost-plus type contracts, and due to the significance of revenues relating to pass-through costs, most of the costs we incur are included in invoices we send to clients. Although we continually monitor our accounts receivable, we manage the operating cash flows of the Company by managing the working capital accounts in total, rather than by the individual elements. The primary elements of the Company’s working capital accounts are accounts receivable, accounts payable, and billings in excess of cost. Accounts payable consists of obligations to third parties relating primarily to costs incurred for projects which are generally billable to clients. Accounts receivable consist of billings to our clients — a substantial portion of which is for project-related costs. Billings in excess of cost consist of billings to and payments from our clients for costs yet to be incurred.
This relationship between revenues and costs, and between receivables and payables is unique to our industry, and facilitates review of our liquidity at the total working capital level. The changes in cash flows relating to our working capital accounts were due simply to the timing of cash receipts and payments within our working capital accounts and is not indicative of any known trend or fundamental change to the underlying business. We still continue to experience delays in certain payments and have seen an increase in the length of payment terms with certain customers. We believe that this situation does not present a significant risk to the Company's cash flows. We believe the risk of not collecting substantially all of the Company's outstanding receivables is remote. Though the Company provides services in a number of countries outside the U.S., we believe our credit risk is not significant. Our private sector customers are comprised principally of large, well known, and well established multi-national companies. Our government customers are comprised of national, state, and local agencies located principally in the U.S. and the U.K. We have not historically experienced significant collection issues with either of our governmental or non-governmental customers.
We used $1.5 billion of cash and cash equivalents for investing activities during fiscal 2014. This compares to $157.1 million and $181.1 million during fiscal 2013 and 2012, respectively. This increase was primarily the result of the Company's acquisition of SKM for $1.2 billion ($1.1 billion net of cash acquired) in fiscal 2014 and compares to minimal acquisition activity in fiscal 2013 and 2012.
Additions to property and equipment totaled $132.1 million, $127.3 million, and $102.6 million for fiscal years 2014, 2013, and 2012, respectively. Included in fiscal 2014 and 2013 activity are significant expenditures for leasehold improvements relating primarily to the consolidation of certain office space, expansion of office space and relocations of certain office space, all occurring in a number of locations.
Our financing activities resulted in net cash inflows of $304.9 million during 2014 as compared to net cash outflows of $59.7 million and $2.7 million during fiscal 2014 and 2013, respectively. In connection with our acquisition of SKM, we borrowed $600.0 million under our prior facility (the "2012 Facility"). See Note 5 - Borrowings in Notes to Consolidated Financial Statements beginning on page F-1 of this Annual Report on Form 10-K. Amounts borrowed to complete the SKM acquisition that were still outstanding on the date we closed the 2014 Facility were paid-off and re-borrowed under the 2014 Facility. On August 19, 2014, the Board of Directors approved a program to repurchase up to $500 million of the Company's common stock over the next three years. Under the program’s terms, shares may be repurchased from time to time at the our discretion on the open market, through block trades or otherwise. The timing of our share repurchases will depend upon market conditions, other uses of capital and other factors.
The Company had $0.7 billion of cash and short term equivalents at September 26, 2014. Of this amount, approximately $263.3 million was held in the U.S. and $469.3 million was held outside of the U.S., primarily in Canada, the U.K., and the Eurozone. Other than the tax cost of repatriating funds held outside the U.S. to the U.S. (see Note 9—Income Taxes of Notes to Consolidated Financial Statements beginning on page F-1 of this Annual Report on Form 10-K), there are no impediments to repatriating these funds to the U.S.
The total amount utilized under the 2014 Facility at September 26, 2014 was $766.9 million ($764.1 million in the form of direct borrowings and $2.8 million utilized in the form of letters of credit). Please refer to Note 5—Borrowings of
Page 48
Notes to Consolidated Financial Statements beginning on page F-1 of this Annual Report on Form 10-K for additional information regarding the 2012 facility and the 2014 Facility.
We believe we have adequate liquidity and capital resources to fund our operations, support our acquisition strategy, and service our debt for the next twelve months. We had $0.7 billion in cash and cash equivalents at September 26, 2014, compared to $1.26 billion at September 27, 2013. Our consolidated working capital position at September 26, 2014 was $1.5 billion; a decrease of $609.7 million from September 27, 2013.
Additionally, there was $0.8 billion of borrowing capacity available at September 26, 2014 under the 2014 Facility. We believe that the remaining capacity, terms and conditions of our revolving credit facility, combined with cash on-hand and the other committed and uncommitted facilities we have in place, are adequate for our working capital and general business requirements.
The Company had $315.4 million of letters of credit outstanding at September 26, 2014. Of this amount, $2.8 million were issued under the 2014 Facility and $312.6 million were issued under separate, committed and uncommitted letter-of-credit facilities.
Off-Balance Sheet Arrangements
We are party to financial instruments with off-balance sheet risk in the form of guarantees not reflected in our balance sheet that arise in the normal course of business. However, such off-balance sheet arrangements are not reasonably likely to have an effect on our financial condition, revenues or expenses, results of operations, liquidity, capital expenditures or resources that is material to investors. See Note 10 – Commitments and Contingencies, and Derivative Financial Instruments of Notes to Consolidated Financial Statements beginning on page F-1 of this Annual Report on Form 10-K.
New Accounting Pronouncements
From time to time, the Financial Accounting Standards Board ("FASB") issues accounting standards updates (each being an "ASU") to its Accounting Standards Codification ("ASC"), which constitutes the primary source of U.S. GAAP. The Company regularly monitors ASUs as they are issued and considers their applicability to its business. All ASUs applicable to the Company are adopted by the due date and in the manner prescribed by the FASB. A discussion of those recently issued ASUs most likely to affect the presentation of the Company's consolidated financial statements follows.
In May 2014, the FASB issued ASU No. 2014-09—Revenue from Contracts with Customers. The new guidance provided by ASU 2014-09 is intended to remove inconsistencies and weaknesses in the existing revenue requirements, provide a more robust framework for addressing revenue issues, improve comparability, provide more useful information and simplify the preparation of financial statements. ASU 2014-09 is effective for annual and interim reporting periods beginning after December 15, 2016. Early adoption is not permitted. The Company is currently evaluating the impact that the new guidance may have on the consolidated financial statements.
In December 2011, the FASB adopted ASU No. 2011-11—Disclosures about Offsetting Assets and Liabilities. ASU 2011-11 amends Topic 210 of the ASC and requires entities to disclose information about offsetting and related arrangements to enable users of their financial statements to understand the effect of those arrangements on their respective financial positions. The scope of this ASU includes derivatives, sale and repurchase agreements, reverse sale and repurchase agreements, and securities borrowing and securities lending agreements. Entities are required to apply the provisions of ASU 2011-11 for annual reporting periods beginning on or after January 1, 2013. The Company does not believe that the adoption of ASU 2011-11 will have a material effect on its consolidated financial statements.
Page 49
Item 7A. | QUANTITATIVE AND QUALITATIVE DISCLOSURES ABOUT MARKET RISK |
We do not enter into derivative financial instruments for trading, speculation or other purposes that would expose the Company to market risk. In the normal course of business, our results of operations are exposed to risks associated with fluctuations in interest rates and currency exchange rates.
Interest Rate Risk
Please refer to the discussion of the 2014 Facility and the 2012 Facility in the liquidity and capital resources discussion in Management's Discussion and Analysis of Financial Condition and Results of Operations in this Annual Report on Form 10-K, and Note 5 - Borrowings in Notes to Consolidated Financial Statements beginning on Page F-1 of this Annual report on Form 10-K.
Foreign Currency Risk
In situations where our operations incur contract costs in currencies other than their functional currency, we attempt to have a portion of the related contract revenues denominated in the same currencies as the costs. In those situations where revenues and costs are transacted in different currencies, we sometimes enter into foreign exchange contracts in order to limit our exposure to fluctuating foreign currencies. We follow the provisions of ASC 815-10 - Derivatives and Hedging in accounting for our derivative contracts. The Company does not currently have exchange rate sensitive instruments that would have a material effect on our consolidated financial statements or results of operations.
Item 8. | FINANCIAL STATEMENTS AND SUPPLEMENTARY DATA |
The information required by this Item 8 is submitted as a separate section beginning on page F-1of this Annual Report on Form 10-K and is incorporated herein by reference.
Item 9. | CHANGES IN AND DISAGREEMENTS WITH ACCOUNTANTS ON ACCOUTING AND FINANCIAL DISCLOSURE |
None.
Item 9A. | CONTROLS AND PROCEDURES |
Evaluation of Disclosure Controls and Procedures
The Company’s management, with the participation of its Chief Executive Officer and Chief Financial Officer, evaluated the effectiveness of the Company’s disclosure controls and procedures as defined by Rule 13a-15(e) of the Securities Exchange Act of 1934, as amended (the “Exchange Act”) as of September 26, 2014, the end of the period covered by this Annual Report on Form 10-K (the “Evaluation Date”). Based on that evaluation, the Chief Executive Officer and Chief Financial Officer concluded that the Company’s disclosure controls and procedures were effective as of the Evaluation Date.
Management’s Annual Report on Internal Control Over Financial Reporting
Management is responsible for establishing and maintaining adequate internal controls over financial reporting, as defined in Rule 13a-15(f) under the Exchange Act. Management, with the participation of its Chief Executive Officer and Chief Financial Officer, has assessed the effectiveness of the Company’s internal control over financial reporting as of the Evaluation Date based on the framework established in “Internal Control—Integrated Framework”, issued by the Committee of Sponsoring Organizations of the Treadway Commission. Based on this evaluation, management has concluded that the Company’s internal controls over financial reporting as of the Evaluation Date were effective. The Company’s independent registered public accounting firm, Ernst & Young LLP, has issued an attestation report on the Company’s internal control over financial reporting which appears later in this Annual Report on Form 10-K.
Changes in Internal Control
There were no changes in the Company’s internal control over financial reporting during the Company’s fiscal quarter ended September 26, 2014, that have materially affected, or are reasonably likely to materially affect, the Company’s internal control over financial reporting.
Page 50
Limitations on Effectiveness of Controls
The Company’s management, including its Chief Executive Officer and Chief Financial Officer, does not expect that its disclosure controls and procedures or its system of internal control over financial reporting will prevent or detect all errors and all fraud. A control system, no matter how well designed or operated, can provide only reasonable, but not absolute, assurance that the objectives of the system of internal control are met. The design of the Company’s control system reflects the fact that there are resource constraints, and that the benefits of such control system must be considered relative to their costs. Further, because of the inherent limitations in all control systems, no evaluation of controls can provide absolute assurance that all control failures and instances of fraud, if any, within the Company have been detected. These inherent limitations include the realities that judgments in decision-making can be faulty and that breakdowns can occur because of simple error or mistake. Additionally, controls can be circumvented by the intentional acts of individuals, by collusion of two or more people, or by management override of the controls. The design of any system of controls is also based in part on certain assumptions about the likelihood of future events, and there can be no assurance that the design of any particular control will always succeed in achieving its objective under all potential future conditions.
Item 9B. | OTHER INFORMATION |
None.
Page 51
PART III
Item 10. | DIRECTORS, EXECUTIVE OFFICERS AND CORPORATE GOVERNANCE |
Directors, Executive Officers, Promoters and Control Persons
The information required by Paragraph (a), and Paragraphs (c) through (g) of Item 401 of Regulation S-K (except for information required by Paragraph (e) of that Item to the extent the required information pertains to our executive officers) and Item 405 of Regulation S-K is hereby incorporated by reference from our definitive proxy statement to be filed with the SEC pursuant to Regulation 14A within 120 days after the close of our fiscal year. The information required by Paragraph (b) of Item 401 of Regulation S-K is set forth in Part I, Item 1 of this Annual Report on Form 10-K.
Code of Ethics
We have adopted a code of ethics for our chief executive, chief financial, and principal accounting officers; a code of business conduct and ethics for members of our Board of Directors; and corporate governance guidelines. The full text of the codes of ethics and corporate governance guidelines is available at our website www.jacobs.com. In the event we make any amendment to, or grant any waiver from, a provision of the code of ethics that applies to the principal executive officer, principal financial officer or principal accounting officer that requires disclosure under applicable SEC rules, we will disclose such amendment or waiver and the reasons therefor on our website. We will provide any person without charge a copy of any of the aforementioned codes of ethics upon receipt of a written request. Requests should be addressed to: Jacobs Engineering Group Inc., 155 S. North Lake Avenue, Pasadena, California, 91101, Attention: Corporate Secretary.
Corporate Governance
The information required by Items 407(c)(3), (d)(4) and (d)(5) of Regulation S-K is hereby incorporated by reference from our definitive proxy statement to be filed with the SEC pursuant to Regulation 14A within 120 days after the close of our fiscal year.
Item 11. | EXECUTIVE COMPENSATION |
The information required by this Item is hereby incorporated by reference from our definitive proxy statement to be filed with the SEC pursuant to Regulation 14A within 120 days after the close of our fiscal year.
Page 52
Item 12. | SECURITY OWNERSHIP OF CERTAIN BENEFICIAL OWNERS AND MANAGEMENT AND RELATED STOCKHOLDER MATTERS |
Securities Authorized for Issuance Under Equity Compensation Plans
The following table presents certain information about our equity compensation plans as of September 26, 2014:
Column A | Column B | Column C | ||||||||
Plan Category | Number of securities to be issued upon exercise of outstanding options, warrants, and rights | Weighted- average exercise price of outstanding options, warrants, and rights | Number of securities remaining available for future issuance under equity compensation plans (excluding securities reflected in Column A) | |||||||
Equity compensation plans approved by shareholders (a) | 4,221,147 | $ | 53.23 | 7,208,797 | ||||||
Equity compensation plans not approved by shareholders | — | — | — | |||||||
Total | 4,221,147 | $ | 53.23 | 7,208,797 | ||||||
____________________
(a) | The number in Column A excludes purchase rights accruing under our two, broad-based, shareholder-approved employee stock purchase plans: The Jacobs Engineering Group Inc. 1989 Employee Stock Purchase Plan (the “1989 ESPP”), and the Global Employee Stock Purchase Plan (the “GESPP”). These plans give employees the right to purchase shares at an amount and price that are not determinable until the end of the specified purchase periods, which occur monthly. Our shareholders have authorized a total of 27.8 million shares of common stock to be issued through the 1989 ESPP and the GESPP. From the inception of the 1989 ESPP and the GESPP through September 26, 2014, a total of 25.7 million shares have been issued, leaving 2.1 million shares of common stock available for future issuance at that date. |
Item 13. | CERTAIN RELATIONSHIPS AND RELATED TRANSACTIONS, AND DIRECTOR INDEPENDENCE |
The information required by this Item is hereby incorporated by reference from our definitive proxy statement to be filed with the SEC pursuant to Regulation 14A within 120 days after the close of our fiscal year.
Item 14. | PRINCIPAL ACCOUNTING FEES AND SERVICES |
The information required by this Item is hereby incorporated by reference from our definitive proxy statement to be filed with the SEC pursuant to Regulation 14A within 120 days after the close of our fiscal year.
Page 53
PART IV
Item 15. | EXHIBITS AND FINANCIAL STATEMENT SCHEDULES |
(a)Documents filed as part of this report:
(1) | The Company’s Consolidated Financial Statements at September 26, 2014 and September 27, 2013 and for each of the three years in the period ended September 26, 2014, September 27, 2013 and September 28, 2012 and the notes thereto, together with the report of the independent auditors on those Consolidated Financial Statements are hereby filed as part of this report, beginning on page F-1. |
(2) | Financial statement schedules – no financial statement schedules are presented as the required information is either not applicable, or is included in the consolidated financial statements or notes thereto. |
(3) | See Exhibits and Index to Exhibits, below. |
Page 54
(b)Exhibits and Index to Exhibits:
2.1 | Share Purchase Agreement between Aker Solutions ASA and certain of its subsidiaries and the Registrant and certain of its subsidiaries, dated as of December 21, 2010, for the purchase of certain Aker Solutions businesses. Filed as Exhibit 2.1 to the Registrant’s Quarterly Report on Form 10-Q for the first quarter of fiscal 2011 and incorporated herein by reference. | ||
2.2 | Merger Implementation Deed between Sinclair Knight Merz Management Pty Limited and Sinclair Knight Merz Holdings Limited and Jacobs Engineering Group Inc. and Jacobs Australia Holdings Company Pty. Ltd, dated as of September 8, 2013. Filed as Exhibit 2.2 to the Registrant’s fiscal 2013 Annual Report on Form 10-K and incorporated herein by reference. | ||
2.3 | Sales Agreement between Sinclair Knight Merz Management Pty Limited, Sinclair Knight Merz Holdings Limited, Jacobs Engineering Group Inc. and Jacobs Australia Holdings Company Pty, Ltd., dated as of December 13, 2013. Filed as Exhibit 2.3 to the Registrant’s Quarterly Report on Form 10-Q for the first quarter of fiscal 2014 and incorporated herein by reference. | ||
3.1 | Amended and Restated Certificate of Incorporation of the Registrant. Filed as Exhibit 3.1 to the Registrant’s Current Report on Form 8-K on January 28, 2014 and incorporated herein by reference. | ||
3.2 | Jacobs Engineering Group Inc. Amended and Restated Bylaws, dated January 23, 2014. Filed as Exhibit 3.2 to the Registrant’s Current Report on Form 8-K on January 28, 2014 and incorporated herein by reference. | ||
4.1 | See Sections 5 through 18 of Exhibit 3.1. | ||
4.2 | See Article II, Section 3.03 of Article III, Article VI and Section 7.04 of Article VII of Exhibit 3.2. | ||
†10.1# | The Jacobs Engineering Group Inc. Incentive Bonus Plan for Officers and Key Managers as amended and restated May 22, 2014. | ||
†10.2# | The Executive Security Program of Jacobs Engineering Group Inc. | ||
†10.3# | Amendment to the Executive Security Program of Jacobs Engineering Group Inc., dated December 23, 2008. | ||
†10.4# | Amendment to the Executive Security Program of Jacobs Engineering Group Inc., dated May 31, 2009. | ||
10.5 # | Jacobs Engineering Group Inc. 1991 Executive Deferral Plan, effective June 1, 1991. Filed as Exhibit 10.5 to the Registrant’s fiscal 2012 Annual Report on Form 10-K and incorporated herein by reference. | ||
10.6 # | Jacobs Engineering Group Inc. 1993 Executive Deferral Plan, effective December 1, 1993. Filed as Exhibit 10.6 to the Registrant’s fiscal 2012 Annual Report on Form 10-K and incorporated herein by reference. | ||
†10.7# | Jacobs Engineering Group Inc. 1995 Executive Deferral Plan, effective January 1, 1995. | ||
10.8 # | Jacobs Engineering Group Inc. Amended and Restated Executive Deferral Plan. Filed as Exhibit 10.8 to the Registrant’s fiscal 2012 Annual Report on Form 10-K and incorporated herein by reference. | ||
Page 55
†10.9# | The Jacobs Engineering Group Inc. 1989 Employee Stock Purchase Plan, as Amended and Restated-effective January 22, 2009. | ||
10.10 # | The Jacobs Engineering Group Inc. Global Employee Stock Purchase Plan. Filed as Exhibit 10.10 to the Registrant’s fiscal 2011 Annual Report on Form 10-K and incorporated herein by reference. | ||
10.11 # | Jacobs Engineering Group Inc. 401(k) Plus Savings Plan and Trust, as Amended and Restated April 1, 2003. Filed as Exhibit 10.12 to the Registrant’s fiscal 2012 Annual Report on Form 10-K and incorporated herein by reference. | ||
10.12 # | Jacobs Engineering Group Inc. 1999 Stock Incentive Plan, as Amended and Restated. Filed as Exhibit 10.1 to the Registrant’s Current Report on Form 8-K (File No. 333-157014) on January 28, 2014 and incorporated herein by reference. | ||
10.13 # | Form of Indemnification Agreement entered into between the Registrant and certain of its officers and directors. Filed as Exhibit 10.1 to the Registrant's Quarterly Report on Form 10-Q for the third quarter of fiscal 2012 and incorporated herein by reference. | ||
10.14 # | Form of Jacobs Engineering Group Inc. Non-Qualified Stock Option Agreement. Filed as Exhibit 4.3 to the Registrant’s Registration Statement on Form S-8 filed on January 29, 2009 and incorporated herein by reference. | ||
10.15 # | Form of Jacobs Engineering Group Inc. Restricted Stock Agreement. Filed as Exhibit 10.3 to the Registrant's Quarterly Report on Form 10-Q for the second quarter of fiscal 2012 and incorporated herein by reference. | ||
10.16 # | Form of Restricted Stock Unit Award Agreement (Market Stock Units). Filed as Exhibit 10.2 to the Registrant’s Current Report on Form 8-K on June 1, 2011 and incorporated herein by reference. | ||
10.17 # | Form of Restricted Stock Unit Award Agreement. Filed as Exhibit 10.2 to the Registrant’s Quarterly Report on Form 10-Q for the second quarter of fiscal 2012 and incorporated herein by reference. | ||
10.18 # | Form of Restricted Stock Award Agreement. Filed as Exhibit 10.3 to the Registrant’s Current Report on Form 8-K on June 1, 2011 and incorporated herein by reference. | ||
10.19 # | Amendment One to Restricted Stock Unit Award Agreement (Market Stock Units) by and between Craig Martin and the Company dated as of October 14, 2011. Filed as Exhibit 10.1 to the Registrant’s Current Report on Form 8-K on October 18, 2011 and incorporated herein by reference. | ||
10.20 # | Jacobs Engineering Group Inc. 1999 Outside Director Stock Plan, as Amended and Restated. Filed as Exhibit 10.21 to the Registrant’s fiscal 2012 Annual Report on Form 10-K and incorporated herein by reference. | ||
10.21# | Form of Restricted Stock Unit Award Agreement (Performance Shares - Net Earnings Growth 2013 Award). Filed as Exhibit 10.3 to the Registrant’s Quarterly Report on Form 10-Q for the third quarter of fiscal 2013 and incorporated herein by reference. | ||
10.22# | Form of Restricted Stock Unit Award Agreement. (Performance Shares - TSR 2013 Award). Filed as Exhibit 10.4 to the Registrant’s Quarterly Report on Form 10-Q for the third quarter of fiscal 2013 and incorporated herein by reference. | ||
10.23 | Credit Agreement dated as of March 29, 2012 among Jacobs Engineering Group Inc. and certain of its subsidiaries as borrowers, and the Bank of America, N.A, (as Administrative Agent); BNP Paribas, and Wells Fargo Bank, N.A. (as Co-Syndication Agents); Union Bank, N.A. (as Documentation Agent); Merrill Lynch, Pierce, Fenner & Smith Incorporated (as Sole Book Manager); and Merrill Lynch, Pierce, Fenner & Smith Incorporated, BNP Paribas Securities Corp, and Wells Fargo Securities, LLC (as Joint Lead Arrangers). Filed as Exhibit 10.1 to the Registrant's Quarterly Report on Form 10-Q for the second quarter of fiscal 2012 and incorporated herein by reference. | ||
Page 56
10.24 # | Employment agreement between Jacobs Engineering Group Inc. and Michael Tyler dated May 28, 2013. Filed as Exhibit 10.2 to the Registrant’s Quarterly Report on Form 10-Q for the third quarter of fiscal 2013 and incorporated herein by reference. | ||
10.25 # | Retirement Agreement dated April 14, 2014 between the Registrant and Thomas R. Hammond. Filed as Exhibit 10.1 to the Registrant’s Quarterly Report on Form 10-Q for the second quarter of fiscal 2014 and incorporated herein by reference. | ||
10.26 # | Jacobs Engineering Group Inc. 2005 Executive Deferral Plan, effective January 1, 2005. Filed as Exhibit 10.1 to the Registrant’s Quarterly Report on Form 10-Q for the second quarter of fiscal 2010 and incorporated herein by reference. | ||
10.27 # | Agreement between Jacobs Engineering Group Inc. and Noel G. Watson dated July 1, 2010. Filed as Exhibit 10.1 to the Registrant’s Quarterly Report on Form 10-Q for the third quarter of fiscal 2010 and incorporated herein by reference. | ||
10.28 # | Consulting Agreement between Jacobs Engineering Group Inc. and Noel G. Watson dated July 1, 2010. Filed as Exhibit 10.2 to the Registrant’s Quarterly Report on Form 10-Q for the third quarter of fiscal 2010 and incorporated herein by reference. | ||
10.29 # | Amendment No. 1 to Consulting Agreement between the Registrant and Noel G. Watson dated July 1, 2011. Filed as Exhibit 10.1 to the Registrant’s Quarterly Report on Form 10-Q for the third quarter of fiscal 2011 and incorporated herein by reference. | ||
10.30 # | Amendment No. 2 to Consulting Agreement between the Registrant and Noel G. Watson dated July 1, 2013. Filed as Exhibit 10.1 to the Registrant’s Quarterly Report on Form 10-Q for the third quarter of fiscal 2013 and incorporated herein by reference. | ||
10.31 | Term Loan Agreement dated January 27, 2011 between Jacobs Engineering U.K. Limited and Royal Bank of Scotland Finance (Ireland). Filed as Exhibit 10.1 to the Registrant’s Quarterly Report on Form 10-Q for the second quarter of fiscal 2011 and incorporated herein by reference. | ||
10.32 | Senior Term Loan Facility dated January 26, 2011 between Jacobs Nederland B.V. and BNP Paribas. Filed as Exhibit 10.2 to the Registrant’s Quarterly Report on Form 10-Q for the second quarter of fiscal 2011 and incorporated herein by reference. | ||
10.33 | Senior Term Loan Facility dated January 26, 2011 between Jacobs Engineering U.K. Limited and Bank of America, N.A., London Branch. Filed as Exhibit 10.3 to the Registrant’s Quarterly Report on Form 10-Q for the second quarter of fiscal 2011 and incorporated herein by reference. | ||
10.34 | Senior Term Loan Facility dated January 26, 2011 between Jacobs Australia Pty Limited and Bank of America, N.A., Australian Branch. Filed as Exhibit 10.4 to the Registrant’s Quarterly Report on Form 10-Q for the second quarter of fiscal 2011 and incorporated herein by reference. | ||
10.35 | Form of Guaranty among certain subsidiaries of the Registrant and Royal Bank of Scotland Finance (Ireland), BNP Paribas, Bank of America, N.A., London Branch, and Bank of America, N.A., Australian Branch. Filed as Exhibit 10.5 to the Registrant’s Quarterly Report on Form 10-Q for the second quarter of fiscal 2011 and incorporated herein by reference. | ||
10.36# | Employment Agreement dated December 23, 2010 between the Registrant and Gary Mandel. Filed as Exhibit 10.6 to the Registrant’s Quarterly Report on Form 10-Q for the second quarter of fiscal 2011 and incorporated herein by reference. | ||
10.37 | Amended and Restated Credit Agreement dated as of February 7, 2014 among Jacobs Engineering Group Inc. and certain of its subsidiaries as borrowers, and the Bank of America, N.A. (as Administrative Agent); Bank of America, N.A., BNP Paribas, and Wells Fargo Bank, N.A. (as Co-Syndication Agents); The Bank of Tokyo-Mitsubishi UFJ, LTD, and TD Bank, N.A. (as Co-Documentation Agents); Merrill Lynch, Pierce, Fenner & Smith Incorporated (as Sole Book Manager); and Merrill Lynch, Pierce, Fenner & Smith Incorporated, BNP Paribas Securities Corp, and Wells Fargo Securities, LLC (as Joint Lead Arrangers). Filed as Exhibit 10.1 to the Registrant’s Current Report on Form 8-K on February 11, 2014 and incorporated herein by reference. | ||
Page 57
10.38# | Form of Restricted Stock Unit Award Agreement (Performance Shares - Net Earnings Growth - 2014 Award). Filed as Exhibit 10.1 to the Registrant’s Quarterly Report on Form 10-Q for the third quarter of fiscal 2014 and incorporated herein by reference. | ||
10.39# | Form of Restricted Stock Unit Award Agreement (Performance Shares - TSR - 2014 Award). Filed as Exhibit 10.2 to the Registrant’s Quarterly Report on Form 10-Q for the third quarter of fiscal 2014 and incorporated herein by reference. | ||
†10.40 | Amendment No. 3 to Consulting Agreement between the Registrant and Noel G. Watson dated July 1, 2014. | ||
10.41# | Offer Letter by and between Jacobs Engineering Group Inc. and Kevin C. Berryman, effective November 12, 2014. Filed as Exhibit 99.1 to Amendment No. 1 to the Registrant’s Current Report on Form 8-K/A on November 17, 2014 and incorporated herein by reference. | ||
†21. | List of Subsidiaries of Jacobs Engineering Group Inc. | ||
†23. | Consent of Ernst & Young LLP, Independent Registered Public Accounting Firm. | ||
†31.1 | Certification of Chief Executive Officer pursuant to Section 302 of the Sarbanes-Oxley Act of 2002. | ||
†31.2 | Certification of Chief Financial Officer pursuant to Section 302 of the Sarbanes-Oxley Act of 2002. | ||
†32.1 | Certification of Chief Executive Officer pursuant to 18 U.S.C. Section 1350, as adopted pursuant to Section 906 of the Sarbanes-Oxley Act of 2002. | ||
†32.2 | Certification of Chief Financial Officer pursuant to 18 U.S.C. Section 1350, as adopted pursuant to Section 906 of the Sarbanes-Oxley Act of 2002. | ||
†95. | Mine Safety Disclosure. | ||
†101.INS | XBRL Instance Document | ||
†101.SCH | XBRL Taxonomy Extension Schema Document | ||
†101.CAL | XBRL Taxonomy Extension Calculation Linkbase Document | ||
†101.DEF | XBRL Taxonomy Extension Definition Linkbase Document | ||
†101.LAB | XBRL Taxonomy Extension Label Linkbase Document | ||
†101.PRE | XBRL Taxonomy Extension Presentation Linkbase Document | ||
† | Being filed herewith. |
# | Management contract or compensatory plan or arrangement. |
Page 58
SIGNATURES
Pursuant to the requirements of Section 13 or 15(d) of the Securities Exchange Act of 1934, the Registrant has duly caused this report to be signed on its behalf by the undersigned, thereunto duly authorized.
JACOBS ENGINEERING GROUP INC. | |||||
Dated: | November 21, 2014 | By: | /S/ Craig L. Martin | ||
Craig L. Martin | |||||
President, Chief Executive Officer, and Director (Principal Executive Officer) | |||||
Pursuant to the requirements of the Securities Exchange Act of 1934, this report has been signed below by the following persons on behalf of the Registrant and in the capacities and on the dates indicated:
Signature | Title | Date | ||
/S/ Craig L. Martin | President, Chief Executive Officer and Director (Principal Executive Officer) | November 21, 2014 | ||
Craig L. Martin | ||||
/S/ Noel G. Watson | Chairman of the Board | November 21, 2014 | ||
Noel G. Watson | ||||
/S/ Joseph R. Bronson | Director | November 21, 2014 | ||
Joseph R. Bronson | ||||
/S/ John F. Coyne | Director | November 21, 2014 | ||
John F. Coyne | ||||
/S/ Juan Jose Suarez Coppel | Director | November 21, 2014 | ||
Juan Jose Suarez Coppel | ||||
/S/ Robert C. Davidson, Jr. | Director | November 21, 2014 | ||
Robert C. Davidson, Jr. | ||||
/S/ Ralph E. Eberhart | Director | November 21, 2014 | ||
Ralph E. Eberhart | ||||
/S/ Edward V. Fritzky | Director | November 21, 2014 | ||
Edward V. Fritzky | ||||
/S/ Linda Fayne Levinson | Director | November 21, 2014 | ||
Linda Fayne Levinson | ||||
/S/ Peter J. Robertson | Director | November 21, 2014 | ||
Peter J. Robertson | ||||
/S/ Christopher M.T. Thompson | Director | November 21, 2014 | ||
Christopher M.T. Thompson | ||||
/S/ John W. Prosser, Jr. | Executive Vice President, Finance and Administration and Treasurer (Principal Financial Officer) | November 21, 2014 | ||
John W. Prosser, Jr. | ||||
/S/ Geoffrey P. Sanders | Senior Vice President and Chief Accounting Officer (Principal Accounting Officer) | November 21, 2014 | ||
Geoffrey P. Sanders | ||||
Page 59
JACOBS ENGINEERING GROUP INC. AND SUBSIDIARIES
CONSOLIDATED FINANCIAL STATEMENTS
WITH REPORT OF INDEPENDENT REGISTERED PUBLIC ACCOUNTING FIRM
September 26, 2014
F-1
JACOBS ENGINEERING GROUP INC. AND SUBSIDIARIES
INDEX TO CONSOLIDATED FINANCIAL STATEMENTS
September 26, 2014
F-2
-+
JACOBS ENGINEERING GROUP INC. AND SUBSIDIARIES
CONSOLIDATED BALANCE SHEETS
(In thousands, except share information)
At September 26, 2014 and September 27, 2013
2014 | 2013 | |||||||
ASSETS | ||||||||
Current Assets: | ||||||||
Cash and cash equivalents | $ | 732,647 | $ | 1,256,405 | ||||
Receivables | 2,867,555 | 2,548,990 | ||||||
Deferred income taxes | 169,893 | 131,086 | ||||||
Prepaid expenses and other current assets | 121,976 | 103,077 | ||||||
Total current assets | 3,892,071 | 4,039,558 | ||||||
Property, Equipment, and Improvements, Net | 456,797 | 379,296 | ||||||
Other Noncurrent Assets: | ||||||||
Goodwill | 3,026,349 | 2,022,831 | ||||||
Intangibles | 440,192 | 217,904 | ||||||
Miscellaneous | 638,250 | 614,555 | ||||||
Total other noncurrent assets | 4,104,791 | 2,855,290 | ||||||
$ | 8,453,659 | $ | 7,274,144 | |||||
LIABILITIES AND STOCKHOLDERS’ EQUITY | ||||||||
Current Liabilities: | ||||||||
Notes payable | $ | 36,732 | $ | 22,783 | ||||
Accounts payable | 622,875 | 457,893 | ||||||
Accrued liabilities | 1,279,556 | 1,029,816 | ||||||
Billings in excess of costs | 410,683 | 345,097 | ||||||
Income taxes payable | — | 32,030 | ||||||
Total current liabilities | 2,349,846 | 1,887,619 | ||||||
Long-term Debt | 764,075 | 415,086 | ||||||
Other Deferred Liabilities | 834,078 | 723,104 | ||||||
Commitments and Contingencies | ||||||||
Stockholders’ Equity: | ||||||||
Capital stock: | ||||||||
Preferred stock, $1 par value, authorized—1,000,000 shares; issued and outstanding—none | — | — | ||||||
Common stock, $1 par value, authorized—240,000,000 shares; issued and outstanding—131,752,768 shares and 131,639,196 shares, respectively | 131,753 | 131,639 | ||||||
Additional paid-in capital | 1,173,858 | 1,084,624 | ||||||
Retained earnings | 3,527,193 | 3,300,961 | ||||||
Accumulated other comprehensive loss | (363,549 | ) | (304,127 | ) | ||||
Total Jacobs stockholders’ equity | 4,469,255 | 4,213,097 | ||||||
Noncontrolling interests | 36,405 | 35,238 | ||||||
Total Group stockholders’ equity | 4,505,660 | 4,248,335 | ||||||
$ | 8,453,659 | $ | 7,274,144 | |||||
See the accompanying Notes to Consolidated Financial Statements.
F-3
JACOBS ENGINEERING GROUP INC. AND SUBSIDIARIES
CONSOLIDATED STATEMENTS OF EARNINGS
For the Fiscal Years Ended September 26, 2014, September 27, 2013, and September 28, 2012
(In thousands, except per share information)
2014 | 2013 | 2012 | ||||||||||
Revenues | $ | 12,695,157 | $ | 11,818,376 | $ | 10,893,778 | ||||||
Costs and Expenses: | ||||||||||||
Direct costs of contracts | (10,621,373 | ) | (9,976,057 | ) | (9,166,789 | ) | ||||||
Selling, general and administrative expenses | (1,545,716 | ) | (1,173,340 | ) | (1,130,916 | ) | ||||||
Operating Profit | 528,068 | 668,979 | 596,073 | |||||||||
Other Income (Expense)': | ||||||||||||
Interest income | 9,693 | 5,395 | 6,049 | |||||||||
Interest expense | (11,437 | ) | (12,906 | ) | (11,686 | ) | ||||||
Gain on sale of intellectual property | 12,147 | — | 6,292 | |||||||||
Miscellaneous income (expense), net | 3,695 | 80 | (3,392 | ) | ||||||||
Total other income (expense), net | 14,098 | (7,431 | ) | (2,737 | ) | |||||||
Earnings Before Taxes | 542,166 | 661,548 | 593,336 | |||||||||
Income Tax Expense | (190,054 | ) | (221,366 | ) | (202,382 | ) | ||||||
Net Earnings of the Group | 352,112 | 440,182 | 390,954 | |||||||||
Net Earnings Attributable to Noncontrolling Interests | (24,004 | ) | (17,089 | ) | (12,000 | ) | ||||||
Net Earnings Attributable to Jacobs | $ | 328,108 | $ | 423,093 | $ | 378,954 | ||||||
Net Earnings Per Share: | ||||||||||||
Basic | $ | 2.51 | $ | 3.27 | $ | 2.97 | ||||||
Diluted | $ | 2.48 | $ | 3.23 | $ | 2.94 | ||||||
CONSOLIDATED STATEMENTS OF COMPREHENSIVE INCOME
For the Fiscal Years Ended September 26, 2014, September 27, 2013, and September 28, 2012
(In thousands)
2014 | 2013 | 2012 | ||||||||||
Net Earnings of the Group | $ | 352,112 | $ | 440,182 | $ | 390,954 | ||||||
Other Comprehensive (Loss) Income: | ||||||||||||
Foreign currency translation adjustments | (33,316 | ) | (23,704 | ) | 30,038 | |||||||
Change in pension liability | (15,303 | ) | 4,496 | (100,385 | ) | |||||||
Gains (losses) on cash flow hedges | 1,022 | 1,467 | 3,567 | |||||||||
Other Comprehensive (Loss) Income Before Income Taxes | (47,597 | ) | (17,741 | ) | (66,780 | ) | ||||||
Income Tax Benefit (Expense): | ||||||||||||
Foreign currency translation adjustments | 3,250 | — | (750 | ) | ||||||||
Change in pension liability | (14,562 | ) | (3,949 | ) | 24,443 | |||||||
Gains (losses) on cash flow hedges | (513 | ) | (550 | ) | (1,262 | ) | ||||||
Total Income Tax Benefit (Expense) | (11,825 | ) | (4,499 | ) | 22,431 | |||||||
Net Other Comprehensive Income (Loss) | (59,422 | ) | (22,240 | ) | (44,349 | ) | ||||||
Net Comprehensive Income of the Group | 292,690 | 417,942 | 346,605 | |||||||||
Net Comprehensive Income Attributable to Noncontrolling Interests | (24,004 | ) | (17,089 | ) | (12,000 | ) | ||||||
Total Comprehensive Income Attributable to Jacobs | $ | 268,686 | $ | 400,853 | $ | 334,605 | ||||||
See the accompanying Notes to Consolidated Financial Statements including the Company's note on Other Comprehensive Income for a presentation of amounts reclassified to net income during the period
F-4
JACOBS ENGINEERING GROUP INC. AND SUBSIDIARIES
CONSOLIDATED STATEMENTS OF STOCKHOLDERS’ EQUITY
For the Fiscal Years Ended September 26, 2014, September 27, 2013, and September 28, 2012
(In thousands)
Common Stock | Additional Paid-in Capital | Retained Earnings | Accumulated Other Comp- rehensive Income (Loss) | Total Jacobs Stock- holders’ Equity | Non- controlling Interests | Total Group Stock- holders’ Equity | ||||||||||||||||||||||
Balances at September 30, 2011 | $ | 127,785 | $ | 858,460 | $ | 2,564,281 | $ | (237,538 | ) | $ | 3,312,988 | $ | 10,397 | $ | 3,323,385 | |||||||||||||
Net earnings | — | — | 378,954 | — | 378,954 | 12,000 | 390,954 | |||||||||||||||||||||
Foreign currency translation adjustments, net of deferred tax expense of $750 | — | — | — | 29,288 | 29,288 | — | 29,288 | |||||||||||||||||||||
Pension liability, net of deferred tax benefit of $24,443 | — | — | — | (75,942 | ) | (75,942 | ) | — | (75,942 | ) | ||||||||||||||||||
Gain on derivatives, net of deferred tax expense of $1,262 | — | — | — | 2,305 | 2,305 | — | 2,305 | |||||||||||||||||||||
Noncontrolling interest acquired / consolidated | — | — | (3,971 | ) | — | (3,971 | ) | 15,528 | 11,557 | |||||||||||||||||||
Distributions to noncontrolling interests | — | — | — | — | — | (5,376 | ) | (5,376 | ) | |||||||||||||||||||
Contributions from noncontrolling interests | — | — | — | — | — | 3,867 | 3,867 | |||||||||||||||||||||
Issuances of equity securities, net | 2,706 | 106,494 | — | — | 109,200 | — | 109,200 | |||||||||||||||||||||
Repurchases of equity securities | (555 | ) | (10,971 | ) | (18,823 | ) | — | (30,349 | ) | — | (30,349 | ) | ||||||||||||||||
Balances at September 28, 2012 | 129,936 | 953,983 | 2,920,441 | (281,887 | ) | 3,722,473 | 36,416 | 3,758,889 | ||||||||||||||||||||
Net earnings | — | — | 423,093 | — | 423,093 | 17,089 | 440,182 | |||||||||||||||||||||
Foreign currency translation adjustments | — | — | — | (23,704 | ) | (23,704 | ) | — | (23,704 | ) | ||||||||||||||||||
Pension liability, net of deferred tax expense of $3,949 | — | — | — | 547 | 547 | — | 547 | |||||||||||||||||||||
Gain on derivatives, net of deferred tax expense of $550 | — | — | — | 917 | 917 | — | 917 | |||||||||||||||||||||
Noncontrolling interest acquired / consolidated | — | 11,087 | — | — | 11,087 | (10,293 | ) | 794 | ||||||||||||||||||||
Distributions to noncontrolling interests | — | — | — | — | (7,974 | ) | (7,974 | ) | ||||||||||||||||||||
Contributions from noncontrolling interests | — | — | — | — | — | — | — | |||||||||||||||||||||
Issuances of equity securities, net of deferred tax expense of $3,111 | 2,864 | 137,592 | — | — | 140,456 | — | 140,456 | |||||||||||||||||||||
Repurchases of equity securities | (1,161 | ) | (18,038 | ) | (42,573 | ) | — | (61,772 | ) | — | (61,772 | ) | ||||||||||||||||
Balances at September 27, 2013 | 131,639 | 1,084,624 | 3,300,961 | (304,127 | ) | 4,213,097 | 35,238 | 4,248,335 | ||||||||||||||||||||
Net earnings | — | — | 328,108 | — | 328,108 | 24,004 | 352,112 | |||||||||||||||||||||
Foreign currency translation adjustments, net of deferred tax benefit of $3,250 | — | — | — | (30,066 | ) | (30,066 | ) | — | (30,066 | ) | ||||||||||||||||||
Pension liability, net of deferred tax expense of $14,562 | — | — | — | (29,865 | ) | (29,865 | ) | — | (29,865 | ) | ||||||||||||||||||
Gain on derivatives, net of deferred tax expense of $513 | — | — | — | 509 | 509 | — | 509 | |||||||||||||||||||||
Noncontrolling interest acquired / consolidated | — | 4,779 | — | — | 4,779 | (17,724 | ) | (12,945 | ) | |||||||||||||||||||
Distributions to noncontrolling interests | — | — | (968 | ) | — | (968 | ) | (5,113 | ) | (6,081 | ) | |||||||||||||||||
Contributions from noncontrolling interests | — | — | (15,704 | ) | — | (15,704 | ) | — | (15,704 | ) | ||||||||||||||||||
Issuances of equity securities, net of deferred tax expense of $1,264 | 2,254 | 114,953 | — | — | 117,207 | — | 117,207 | |||||||||||||||||||||
Repurchases of equity securities | (2,140 | ) | (30,498 | ) | (85,204 | ) | — | (117,842 | ) | — | (117,842 | ) | ||||||||||||||||
Balances at September 26, 2014 | $ | 131,753 | $ | 1,173,858 | $ | 3,527,193 | $ | (363,549 | ) | $ | 4,469,255 | $ | 36,405 | $ | 4,505,660 | |||||||||||||
See the accompanying Notes to Consolidated Financial Statements.
F-5
JACOBS ENGINEERING GROUP INC. AND SUBSIDIARIES
CONSOLIDATED STATEMENTS OF CASH FLOWS
For the Fiscal Years Ended September 26, 2014, September 27, 2013, and September 28, 2012
(In thousands)
2014 | 2013 | 2012 | ||||||||||
Cash Flows from Operating Activities: | ||||||||||||
Net earnings attributable to the Group | $ | 352,112 | $ | 440,182 | $ | 390,954 | ||||||
Adjustments to reconcile net earnings to net cash flows from operations: | ||||||||||||
Depreciation and amortization: | ||||||||||||
Property, equipment and improvements | 98,592 | 69,889 | 58,890 | |||||||||
Intangible assets | 46,820 | 28,985 | 41,934 | |||||||||
Gain on sale of intellectual property | (12,147 | ) | — | (6,292 | ) | |||||||
Stock based compensation | 43,400 | 39,518 | 32,442 | |||||||||
Tax deficiency (benefit) from stock based compensation | 1,344 | 3,213 | (3,957 | ) | ||||||||
Equity in earnings of investees | (8,394 | ) | (14,140 | ) | (8,980 | ) | ||||||
Change in pension plan obligations | (37,218 | ) | (8,714 | ) | (28,351 | ) | ||||||
Change in deferred compensation plans | (7,062 | ) | (8,915 | ) | (5,474 | ) | ||||||
(Gains) Losses on sales of assets, net | (4,668 | ) | 519 | 811 | ||||||||
Changes in assets and liabilities, excluding the effects of businesses acquired: | ||||||||||||
Receivables | 107,944 | (234,864 | ) | (227,123 | ) | |||||||
Prepaid expenses and other current assets | (7,217 | ) | (15,898 | ) | (19,265 | ) | ||||||
Accounts payable | 108,241 | 82,389 | 10,673 | |||||||||
Accrued liabilities | (2,172 | ) | (18,214 | ) | 80,806 | |||||||
Billings in excess of costs | 29,833 | 84,043 | (15,626 | ) | ||||||||
Income taxes payable | (17,373 | ) | (5,676 | ) | 10,015 | |||||||
Deferred income taxes | 30,799 | (4,358 | ) | (1,036 | ) | |||||||
Other deferred liabilities | 3,725 | (2,199 | ) | (4,764 | ) | |||||||
Change in long-term receivables | 2,828 | 15,815 | — | |||||||||
Long-term insurance prepayment | (17,411 | ) | — | — | ||||||||
Other, net | 9,740 | (3,059 | ) | (5,852 | ) | |||||||
Net cash provided by operating activities | 721,716 | 448,516 | 299,805 | |||||||||
Cash Flows from Investing Activities: | ||||||||||||
Additions to property, equipment and improvements | (132,146 | ) | (127,270 | ) | (102,574 | ) | ||||||
Disposals of property, equipment, and improvements | 10,414 | 4,276 | 319 | |||||||||
Change in cash related to consolidation of joint ventures | — | 5,344 | — | |||||||||
Purchases of investments | (25,137 | ) | (15 | ) | (38 | ) | ||||||
Sales of investments | 58 | 11 | 15 | |||||||||
Sale of intellectual property | 12,371 | — | 12,726 | |||||||||
Acquisitions of businesses, net of cash acquired | (1,384,342 | ) | (39,429 | ) | (91,575 | ) | ||||||
Net cash used for investing activities | (1,518,782 | ) | (157,083 | ) | (181,127 | ) | ||||||
See the accompanying Notes to Consolidated Financial Statements.
F-6
JACOBS ENGINEERING GROUP INC. AND SUBSIDIARIES
CONSOLIDATED STATEMENTS OF CASH FLOWS
For the Fiscal Years Ended September 26, 2014, September 27, 2013, and September 28, 2012
(In thousands)
Continued
2014 | 2013 | 2012 | ||||||||||
Cash Flows from Financing Activities: | ||||||||||||
Proceeds from long-term borrowings | 819,681 | — | 528,673 | |||||||||
Repayments of long-term borrowings | (455,426 | ) | (118,293 | ) | (98 | ) | ||||||
Proceeds from short-term borrowings | 207,876 | 59,094 | 2,586 | |||||||||
Repayments of short-term borrowings | (226,091 | ) | (35,400 | ) | (579,901 | ) | ||||||
Proceeds from issuances of common stock | 44,704 | 46,079 | 43,568 | |||||||||
Common stock repurchases | (78,399 | ) | — | — | ||||||||
Tax (deficiency) benefit from stock based compensation | (1,344 | ) | (3,213 | ) | 3,956 | |||||||
Distributions to noncontrolling interests | (6,081 | ) | (7,974 | ) | (5,376 | ) | ||||||
Contributions from noncontrolling interests | — | — | 3,868 | |||||||||
Net cash provided by (used for) financing activities | 304,920 | (59,707 | ) | (2,724 | ) | |||||||
Effect of Exchange Rate Changes | (31,612 | ) | (7,778 | ) | 10,870 | |||||||
Increase (Decrease) in Cash and Cash Equivalents | (523,758 | ) | 223,948 | 126,824 | ||||||||
Cash and Cash Equivalents at Beginning of Period | 1,256,405 | 1,032,457 | 905,633 | |||||||||
Cash and Cash Equivalents at End of Period | $ | 732,647 | $ | 1,256,405 | $ | 1,032,457 | ||||||
See the accompanying Notes to Consolidated Financial Statements.
F-7
JACOBS ENGINEERING GROUP INC. AND SUBSIDIARIES
NOTES TO CONSOLIDATED FINANCIAL STATEMENTS
1. Description of Business and Basis of Presentation
Description of Business
We provide a broad range of technical, professional, and construction services including engineering, design, and architectural services; construction and construction management services; operations and maintenance services; and process, scientific, and systems consulting services. We provide our services through offices and subsidiaries located primarily in North America, South America, Europe, the Middle East, India, Australia, Africa, and Asia. We provide our services under cost-reimbursable and fixed-price contracts. The percentage of revenues realized from each of these types of contracts for each of the last three fiscal years was as follows:
2014 | 2013 | 2012 | |||||||
Cost-reimbursable | 83 | % | 85 | % | 85 | % | |||
Fixed-price | 17 | % | 15 | % | 15 | % | |||
Basis of Presentation, Definition of Fiscal Year, and Other Matters
The accompanying Consolidated Financial Statements have been prepared in accordance with U.S. GAAP and include the accounts of Jacobs Engineering Group Inc. and its subsidiaries and affiliates which it controls. All significant intercompany accounts and transactions have been eliminated in consolidation.
The Company’s fiscal year ends on the Friday closest to September 30 (determined on the basis of the number of workdays) and, accordingly, an additional week of activity is added every five-to-six years.
Please refer to Note 16—Definitions for the definitions of certain terms used in the accompanying Consolidated Financial Statements and these Notes to Consolidated Financial Statements.
2. Significant Accounting Policies
Revenue Accounting for Contracts and Use of Joint Ventures
In general, we recognize revenues at the time we provide services. Depending on the commercial terms of the contract, we recognize revenues either when costs are incurred, or using the percentage-of-completion method of accounting by relating contract costs incurred to date to the total estimated costs at completion. Contract losses are provided for in their entirety in the period they become known, without regard to the percentage-of-completion. For multiple contracts with a single customer we account for each contract separately. We also recognize as revenues costs associated with claims and unapproved change orders to the extent it is probable that such claims and change orders will result in additional contract revenue, and the amount of such additional revenue can be reliably estimated.
Certain cost-reimbursable contracts include incentive-fee arrangements. The incentive fees in such contracts can be based on a variety of factors but the most common are the achievement of target completion dates, target costs, and/or other performance criteria. Failure to meet these targets can result in unrealized incentive fees. We recognize incentive fees based on expected results using the percentage-of-completion method of accounting. As the contract progresses and more information becomes available, the estimate of the anticipated incentive fee that will be earned is revised as necessary. We bill incentive fees based on the terms and conditions of the individual contracts. In certain situations, we are allowed to bill a portion of the incentive fees over the performance period of the contract. In other situations, we are allowed to bill incentive fees only after the target criterion has been achieved. Incentive fees which have been recognized but not billed are included in receivables in the accompanying Consolidated Balance Sheets.
F-8
JACOBS ENGINEERING GROUP INC. AND SUBSIDIARIES
NOTES TO CONSOLIDATED FINANCIAL STATEMENTS—(Continued)
Certain cost-reimbursable contracts with government customers as well as certain commercial clients provide that contract costs are subject to audit and adjustment. In this situation, revenues are recorded at the time services are performed based upon the amounts we expect to realize upon completion of the contracts. Revenues are not recognized for non-recoverable costs. In those situations where an audit indicates that we may have billed a client for costs not allowable under the terms of the contract, we estimate the amount of such nonbillable costs and adjust our revenues accordingly.
When we are directly responsible for subcontractor labor or third-party materials and equipment, we reflect the costs of such items in both revenues and costs (and we refer to such costs as “pass-through” costs). On those projects where the client elects to pay for such items directly and we have no associated responsibility for such items, these amounts are not reflected in either revenues or costs.
The following table sets forth pass-through costs included in revenues for each of the last three fiscal years (in millions):
2014 | 2013 | 2012 | ||||||||
$ | 2,954.9 | $ | 2,624.8 | $ | 2,328.4 | |||||
As is common to the industry, we execute certain contracts jointly with third parties through various forms of joint ventures and consortiums. Although the joint ventures own and hold the contracts with the clients, the services required by the contracts are typically performed by us and our joint venture partners, or by other subcontractors under subcontracting agreements with the joint ventures. The assets of our joint ventures, therefore, consist almost entirely of cash and receivables (representing amounts due from clients), and the liabilities of our joint ventures consist almost entirely of amounts due to the joint venture partners (for services provided by the partners to the joint ventures under their individual subcontracts) and other subcontractors. In general, at any given time, the equity of our joint ventures represents the undistributed profits earned on contracts the joint ventures hold with clients. Very few of our joint ventures have employees. None of our joint ventures have third-party debt or credit facilities. Our joint ventures, therefore, are simply mechanisms used to deliver engineering and construction services to clients. Rarely do they, in and of themselves, present any risk of loss to us or to our partners separate from those that we would carry if we were performing the contract on our own. Under U.S. GAAP, our share of losses associated with the contracts held by the joint ventures, if and when they occur, has always been reflected in our Consolidated Financial Statements.
Certain of our joint ventures meet the definition of a VIE. In evaluating our VIEs for possible consolidation, we perform a qualitative analysis to determine whether or not we have a “controlling financial interest” in the VIE as defined by U.S. GAAP. We consolidate only those VIEs over which we have a controlling financial interest.
For the Company’s unconsolidated joint ventures, we use either the equity method of accounting or proportional consolidation. The Company does not currently participate in any significant VIEs in which it has a controlling financial interest that it does not consolidate.
There were no changes in facts and circumstances during the period that caused the Company to reassess the method of accounting for its VIEs.
Fair Value Measurements
The net carrying amounts of cash and cash equivalents, trade receivables and payables, and notes payable approximate Fair Value due to the short-term nature of these instruments. Similarly, we believe the carrying value of long-term debt also approximates Fair Value based on the interest rates and scheduled maturities applicable to the outstanding borrowings. Certain other assets and liabilities, such as forward contracts and an interest rate swap agreement we purchased as cash-flow hedges discussed in Note 10 —Commitments and Contingencies - Derivative Financial Instruments are required to be carried in our Consolidated Financial Statements at Fair Value.
The Fair Value of the Company’s reporting units (needed for purposes of determining whether there is an indication of possible impairment of the carrying value of goodwill) is determined using a both an income approach and a market approach. Both approaches require us to make estimates and judgments. Under the income approach, Fair Value is determined by using the discounted cash flows of our reporting units. Under the market approach, the Fair Values of our reporting units are determined by reference to guideline companies that are reasonably comparable to our reporting units; the Fair Values are estimated based on the valuation multiples of the invested capital associated with the guideline companies. In assessing whether there is an indication that the carrying value of goodwill has been impaired, we utilize the results of both valuation
F-9
JACOBS ENGINEERING GROUP INC. AND SUBSIDIARIES
NOTES TO CONSOLIDATED FINANCIAL STATEMENTS—(Continued)
techniques and consider the range of Fair Values indicated. The range of values (both ends of the range) for each reporting unit, exceeded the respective book values by more than 40%.
With respect to share-based payments, we estimate the Fair Value of stock options granted to employees and directors using the Black-Scholes option-pricing model. Like all option-pricing models, the Black-Scholes model requires the use of highly subjective assumptions including (i) the expected volatility of the market price of the underlying stock, and (ii) the expected term of the award, among others. Accordingly, changes in assumptions and any subsequent adjustments to those assumptions can cause drastically different Fair Values to be assigned to our stock option awards. For restricted stock units containing service and market conditions, compensation expense is based on the Fair Value of such units using a Monte Carlo simulation. Due to the uncertainties inherent in the use of assumptions and the results of applying Monte Carlo simulations and because equity awards tend to vest over several years and additional equity awards may be made in the future, the amount of expense recorded in the accompanying consolidated financial statements may not be representative of the effects on our future consolidated financial statements.
The Fair Values of the assets owned by the various pension plans that the Company sponsors are determined based on the type of asset, consistent with U.S. GAAP. Equity securities are valued by using market observable data such as quoted prices. Publicly traded corporate equity securities are valued at the last reported sale price on the last business day of the year. Securities not traded on the last business day are valued at the last reported bid price. Debt securities are valued at the last reported sale price on the last business day applicable. Real estate consists primarily of common or collective trusts, with underlying investments in real estate. They are valued using the best information available, including quoted market price, market prices for similar assets when available, internal cash flow estimates discounted at an appropriate interest rate, or independent appraisals, as appropriate. Insurance contracts, investments in infrastructure/raw goods, and hedge funds are valued using actuarial assumptions and values reported by the fund managers.
The methodologies described above and elsewhere in these Notes to Consolidated Financial Statements may produce a Fair Value measure that may not be indicative of net realizable value or reflective of future Fair Values. Furthermore, while the Company believes its valuation methods are appropriate and consistent with other market participants, the use of different methodologies or assumptions to determine the Fair Value of certain financial instruments could result in a different Fair Value measurement.
Cash Equivalents
We consider all highly liquid investments with original maturities of less than three months to be cash equivalents. Cash equivalents at September 26, 2014 and September 27, 2013 consisted primarily of money market mutual funds and overnight bank deposits.
Receivables and Billings in Excess of Costs
“Receivables” include billed receivables, unbilled receivables, and retentions receivable. Billed receivables represent amounts invoiced to clients in accordance with the terms of our client contracts. They are recorded in our financial statements when they are issued. Unbilled receivables and retentions receivable represent reimbursable costs and amounts earned and reimbursable under contracts in progress as of the respective balance sheet dates. Such amounts become billable according to the contract terms, which usually consider the passage of time, achievement of certain milestones or completion of the project. We anticipate that substantially all of such unbilled amounts will be billed and collected over the next fiscal year.
Certain contracts allow us to issue invoices to clients in advance of providing services. “Billings in excess of costs” represent billings to, and cash collected from, clients in advance of work performed. We anticipate that substantially all such amounts will be earned over the next twelve months.
Property, Equipment, and Improvements
Property, equipment and improvements are carried at cost, and are shown net of accumulated depreciation and amortization in the accompanying Consolidated Balance Sheets. Depreciation and amortization is computed primarily by using the straight-line method over the estimated useful lives of the assets. The cost of leasehold improvements is amortized using the straight-line method over the lesser of the estimated useful life of the asset or the remaining term of the related lease. Estimated useful lives range from 20 to 40 years for buildings, from 3 to 10 years for equipment and from 4 to 10 years for leasehold improvements.
F-10
JACOBS ENGINEERING GROUP INC. AND SUBSIDIARIES
NOTES TO CONSOLIDATED FINANCIAL STATEMENTS—(Continued)
Goodwill and Other Intangible Assets
Goodwill represents the excess of the cost of an acquired business over the Fair Value of the net tangible and intangible assets acquired. Goodwill and intangible assets with indefinite lives are not amortized; instead, we test goodwill for possible impairment. We conduct such tests annually (or more frequently if events occur or circumstances change that would more likely than not reduce the Fair Values of our reporting units below their respective carrying values). The first step in the test is to compare the Fair Value of each of the Company’s reporting units to their respective carrying amounts, including goodwill. In the event that the carrying value of a reporting unit exceeds its Fair Value, a second test is performed to measure the amount of the impairment loss, if any. In performing the annual impairment test, the Company evaluates goodwill at the reporting unit level. We have determined that our operating segment is comprised of two reporting units based on geography. Based on the results of these tests, we have determined that the Fair Value of our reporting units substantially exceeded their respective carrying values for fiscal years 2014, 2013, and 2012.
The following table provides certain information related to the Company’s acquired intangible assets for each of the fiscal years presented (in thousands):
Customer Relationships, Contracts, and Backlog | Developed Technology | Trade Names | Other | Total | ||||||||||||||||
Balances, September 30, 2011 | $ | 229,738 | $ | 21,977 | $ | 3,473 | $ | 3,818 | $ | 259,006 | ||||||||||
Acquisitions | 13,010 | — | 1,200 | 410 | 14,620 | |||||||||||||||
Amortization | (24,406 | ) | (1,533 | ) | (1,430 | ) | (1,597 | ) | (28,966 | ) | ||||||||||
Foreign currency translation | (613 | ) | — | (161 | ) | (124 | ) | (898 | ) | |||||||||||
Balances, September 28, 2012 | 217,729 | 20,444 | 3,082 | 2,507 | 243,762 | |||||||||||||||
Acquisitions | — | — | — | — | — | |||||||||||||||
Amortization | (20,731 | ) | (1,533 | ) | (614 | ) | (1,130 | ) | (24,008 | ) | ||||||||||
Foreign currency translation | (1,471 | ) | — | (289 | ) | (90 | ) | (1,850 | ) | |||||||||||
Balances, September 27, 2013 | 195,527 | 18,911 | 2,179 | 1,287 | 217,904 | |||||||||||||||
Acquisitions | 249,164 | — | 15,049 | — | 264,213 | |||||||||||||||
Amortization | (37,737 | ) | (1,533 | ) | (3,251 | ) | (693 | ) | (43,214 | ) | ||||||||||
Foreign currency translation | 1,087 | — | 171 | 31 | 1,289 | |||||||||||||||
Balances, September 26, 2014 | $ | 408,041 | $ | 17,378 | $ | 14,148 | $ | 625 | $ | 440,192 | ||||||||||
Weighted average amortization period (years) | 10.2 | 12.0 | 4.0 | 11.6 | 10.1 | |||||||||||||||
The weighted average amortization period includes the effects of foreign currency translation.
The above table excludes the values assigned to those intangible assets embedded in the Company’s investment in AWE Management Ltd. (“AWE”) and Guimar Engenharia LTDA ("Guimar"). Those amounts are included in the carrying value of the Company’s investment in AWE and Guimar. The amount of amortization expense we estimate we will record during each of the next five fiscal years relating to intangible assets existing at September 26, 2014, including those associated with AWE and Guimar, is: fiscal 2015 - $52.9 million; fiscal 2016 - $51.5 million; fiscal 2017 - $49.0 million; fiscal 2018 - $47.5 million; and fiscal 2019 - $46.7 million. The amounts reported for future amortization include the effect of exchange rate changes.
The change in goodwill during the three year period ending September 26, 2014 was due primarily to businesses acquired during fiscal 2014.
Business Combinations
On December 13, 2013, the Company acquired all of the outstanding interests in Sinclair Knight Merz Management Pty Limited and Sinclair Knight Merz Holdings Limited (collectively, "SKM"), a provider of engineering, design, procurement, construction and project management services. The Company purchased SKM for approximately $1.2 billion in cash. The acquisition agreement includes customary representations, warranties, and indemnities supported by an escrow account. SKM's results of operations have been included in the Company's consolidated results of operations since the date of acquisition.
F-11
JACOBS ENGINEERING GROUP INC. AND SUBSIDIARIES
NOTES TO CONSOLIDATED FINANCIAL STATEMENTS—(Continued)
The Company has, in total, incurred approximately $16.6 million of expenses directly related to the SKM acquisition. Included in selling, general and administrative expense for fiscal 2014 is $9.2 million of incremental, transaction-related expenses.
The following table presents the preliminary allocation of the purchase price (in thousands) paid for SKM:
Assets: | |||
Cash and cash equivalents | $ | 152,051 | |
Receivables and other current assets | 367,580 | ||
Property and equipment, and other | 71,630 | ||
Intangible assets | 202,166 | ||
Total assets | 793,427 | ||
Liabilities: | |||
Current liabilities | 333,298 | ||
Deferred tax liability | 70,758 | ||
Long-term liabilities | 20,416 | ||
Total liabilities | 424,472 | ||
Net identifiable assets acquired | $ | 368,955 | |
Goodwill | 850,719 | ||
Net assets acquired | $ | 1,219,674 | |
The Company expects to collect substantially all of the acquired receivables of $304.6 million, net of acquired allowances.
The purchase price allocation of the SKM transaction continues to be subject to post-closing adjustment as the Company finalizes the values assigned to project-related assets and liabilities, claims, other contingencies, acquired intangible assets, and leased properties, among other items. The Company intends to complete the purchase price allocation by the end of the measurement period provided by U.S. GAAP. The preliminary useful lives of the intangible assets acquired from SKM range from 3 to 12 years.
Some of the factors contributing to the recognition of goodwill include: (i) access to a large, highly-trained and stable workforce; (ii) the opportunity to expand our client base in Australia, Asia, South America and the U.K.; (iii) the opportunity to expand our presence in multiple industries, including: mining, infrastructure, buildings, water and energy; and (iv) the opportunity to achieve operating synergies. We expect that a significant portion of the the goodwill recognized in the SKM transaction will ultimately be deductible in the U.S. for federal income tax purposes.
The following table presents the unaudited, pro forma consolidated results of operations (in millions, except per share amounts) for fiscal years 2014 and 2013 as if the acquisition of SKM operations had occurred as of September 28, 2012. The period end dates of SKM are different from those of the Company and, accordingly, certain adjustments were made to conform SKM's period end dates to those of the Company. Management believes these adjustments make the comparative data more representative of what the combined results of operations would have been over the pro forma period. The pro forma results are not necessarily indicative of (i) the results of operations that would have occurred had we actually acquired SKM on September 28, 2012; or (ii) future results of operations:
2014 | 2013 | ||||||
Revenues | $ | 12,944,848 | $ | 13,064,768 | |||
Net earnings attributable to Jacobs | $ | 335,658 | $ | 488,434 | |||
Basic earnings per share | $ | 2.57 | $ | 3.78 | |||
Diluted earnings per share | $ | 2.54 | $ | 3.73 | |||
The pro forma earnings for fiscal year 2014 were adjusted to exclude $21.4 million of transaction-related costs incurred by both parties and, for fiscal year 2013, include $21.4 million of transaction-related costs in the pro forma earnings.
F-12
JACOBS ENGINEERING GROUP INC. AND SUBSIDIARIES
NOTES TO CONSOLIDATED FINANCIAL STATEMENTS—(Continued)
For fiscal years 2014 and 2013, the pro forma earnings were adjusted to reduce interest expense by $2.3 million (for a total of $2.1 million) and to include incremental interest expense of $5.4 million (for a total of $5.4 million), respectively. For fiscal years 2014 and 2013, the pro forma earnings were adjusted to include net incremental intangible amortization of $2.5 million (for a total of $19.9 million) and $16.1 million (for a total of $21.3 million), respectively. The difference in the total intangible amortization between the periods is due to the effects of exchange rate changes.
The pro forma earnings for fiscal year 2014 include an expense from SKM of $24 million related to a settlement with certain SKM shareholders regarding provisions of their shareholding plan that was settled and paid prior to the close of the business combination and recorded during the three month period ended December 27, 2013.
During fiscal year 2014, the Company also acquired Federal Network Services LLC (formerly a subsidiary of Verizon), Eagleton Engineering, LLC, FMHC Corporation, Stobbarts (Nuclear) Limited, Trompeter Enterprises, and MARMAC Field Services, Inc. The operations of these acquisitions were not material to the Company's consolidated results for fiscal 2014. During fiscal 2014, we also acquired an additional 15% interest in Zamel and Turbag Consulting Engineers Company ("ZATE"), a refining, chemicals, infrastructure and civil engineering company headquartered in Al Khobar, Saudi Arabia. This transaction brought the Company's ownership in ZATE to 75%.
Foreign Currencies
In preparing our Consolidated Financial Statements, it is necessary to translate the financial statements of our subsidiaries operating outside the U.S., which are denominated in currencies other than the U.S. dollar, into the U.S. dollar. In accordance with U.S. GAAP, revenues and expenses of operations outside the U.S. are translated into U.S. dollars using weighted-average exchange rates for the applicable period(s) being translated while the assets and liabilities of operations outside the U.S. are generally translated into U.S. dollars using period-end exchange rates. The net effect of foreign currency translation adjustments is included in stockholders’ equity as a component of accumulated other comprehensive income (loss) in the accompanying Consolidated Balance Sheets.
Share-Based Payments
We measure the value of services received from employees and directors in exchange for an award of an equity instrument based on the grant-date Fair Value of the award. The computed value is recognized as a non-cash cost on a straight-line basis over the period the individual provides services, which is typically the vesting period of the award with the exception of awards containing an internal performance measure which is recognized on a straight-line basis over the vesting period subject to the probability of meeting the performance requirements and adjusted for the number of shares expected to be earned. The cost of these awards is recorded in selling, general and administrative expense in the Company's Consolidated Financial Statements.
The following table presents our stock-based compensation expense for the various types of awards made by the Company for each of the fiscal years presented (in thousands):
Award Type | 2014 | 2013 | 2012 | |||
Restricted Stock and Restricted Stock Units (excluding Market and Performance Awards) | $17,307 | $12,836 | $11,021 | |||
Stock Options | 10,829 | 11,385 | 14,067 | |||
Market and Performance Awards | 15,264 | 15,297 | 7,354 | |||
Total Expense | $43,400 | $39,518 | $32,442 | |||
The Company has two incentive plans whereby eligible employees and directors of Jacobs may be granted stock options, restricted stock, and/or restricted stock units.
Stock Options—Substantially all of the stock options granted during the year are awarded on the same date (although the date is different for employees and directors). The following table presents the assumptions used in the Black-Scholes option-pricing model during each of the last three fiscal years for awards made to employees and directors:
F-13
JACOBS ENGINEERING GROUP INC. AND SUBSIDIARIES
NOTES TO CONSOLIDATED FINANCIAL STATEMENTS—(Continued)
Awards Made to Employees | Awards Made to Directors | |||||||||||||||||
2014 | 2013 | 2012 | 2014 | 2013 | 2012 | |||||||||||||
Dividend yield | 0 | % | 0 | % | 0 | % | 0 | % | 0 | % | 0 | % | ||||||
Expected volatility | 34.25 | % | 38.37 | % | 43.28 | % | 35.30 | % | 37.65 | % | 41.42 | % | ||||||
Risk-free interest rate | 1.79 | % | 1.11 | % | 0.95 | % | 1.76 | % | 0.95 | % | 1.11 | % | ||||||
Expected term of options (in years) | 5.82 | 5.82 | 5.82 | 5.82 | 5.82 | 5.82 | ||||||||||||
Performance Awards— During fiscal years 2014, 2013, and 2012, the Company granted restricted stock units containing service, performance, and market conditions. The restricted stock unit award is split equally between Relative TSR Restricted Stock Units and Net Earnings Growth Restricted Stock Units.
The number of Relative TSR Restricted Stock Units in which the employee may ultimately vest shall be equal to the Relative TSR grant multiplied by the TSR Performance Multiplier. The TSR Performance Multiplier will be determined by comparing the Company's total stockholder return to the total stockholder return of each of the companies in a specified industry peer group over the three-year period immediately following the award date. For purposes of computing total stockholder return, the beginning stock price will be the average closing stock price over the 30 calendar day period ending on the award date ("Performance Period"), and the ending stock price will be the average closing price over the 30 calendar day period ending on the last day of the performance period. Any dividend payments made over the Performance Period will be deemed re-invested on the ex-dividend data in additional shares of the related Company.
The following table presents the basis on which the Relative TSR Restricted Stock Units are determined:
Company TSR Percentile Rank | TSR Performance Multiplier | |
Below 30th percentile | —% | |
30th percentile | 50% | |
50th percentile | 100% | |
70th percentile or above | 150% | |
If the Company's total stockholder return over the Performance Period falls between any of the brackets described above, the TSR Performance Multiplier will be determined using straight line interpolation based on the actual percentile ranking.
Substantially all of the TSR restricted stock units awarded during the year are awarded on the same date. The following table presents the assumptions used to value the TSR restricted stock units:
2014 | 2013 | 2012 | ||||
Dividend yield | — | % | — | % | — | % |
Expected volatility | 24.77 | % | 29.18 | % | 36.30 | |
Risk-free interest rate | 0.80 | % | 0.42 | % | 0.42 | |
Expected term (in years) | 3 | 3 | 3 | |||
The number of Net Earnings Growth Restricted Stock Units awarded in fiscal year 2012 in which an employee may ultimately vest shall be equal to the sum of the following: (1) an amount, not less than zero, equal to one-third of the earned Net Earnings Growth Restricted Stock Units grant multiplied by the Net Earnings Growth Performance Multiplier (or, "NEGPM", as defined) determined based upon the growth in the Company's Net Earnings (as defined) over the period from April 1, 2012 to March 31, 2013; plus, (2) an amount, not less than zero, equal to (A) two-thirds of the earned Net Earnings Growth Restricted Stock Units grant multiplied by the NEGPM determined based upon the average growth in the Company's Net Earnings over the period from April 1, 2012 to March 31, 2014, minus (B) the amount determined pursuant to (1) above; plus, (3) an amount, not less than zero, equal to (A) the earned Net Earnings Growth Restricted Stock Units grant multiplied by the NEGPM determined based upon the average growth in the Company's Net Earnings over the period from April 1, 2012 to March 31, 2015, minus (B) the amount determined pursuant to (1) and (2) above.
For Net Earnings Growth Restricted Stock Units awarded in fiscal years 2013 and 2014, all of the criteria referenced in the paragraph above are the same over the three year vesting period with the exception of the performance period. The
F-14
JACOBS ENGINEERING GROUP INC. AND SUBSIDIARIES
NOTES TO CONSOLIDATED FINANCIAL STATEMENTS—(Continued)
periods for fiscal years 2013 and 2014 are based upon the Company's Net Earnings (as defined) over the period starting on the first day of the Company's third quarter of fiscal 2013 and ending on the last day of the Company's second quarter of fiscal 2016 and the Company's Net Earnings (as defined) over the period starting on the first day of the Company's third quarter of fiscal 2014 and ending on the last day of the Company's second quarter of fiscal 2017, respectively.
If the Company's average growth in Net Earnings over the applicable fiscal years during the respective performance periods is between 5% and 10%, 10% and 15%, or 15% and 20%, the Net Earnings Growth Performance Multiplier will be determined using straight line interpolation based on the actual average growth in the Company's consolidated net earnings attributable to Jacobs.
The following table presents the basis on which the Net Earnings Growth Restricted Stock Units are determined:
Average Net Earnings Growth | Net Earnings Growth Performance Multiplier | |
Less than 5% | —% | |
5% | 50% | |
10% | 100% | |
15% | 150% | |
20% | 200% | |
Unless stated otherwise, all other awards are valued based on the closing price of the Company's common stock as reported in the NYSE Composite Price History on their respective grant dates.
Concentrations of Credit Risk
Our cash balances and cash equivalents are maintained in accounts held by major banks and financial institutions located primarily in North America, South America, Europe, the Middle East, India, Australia, Africa, and Asia. In the normal course of business, and consistent with industry practices, we grant credit to our clients without requiring collateral. Concentrations of credit risk is the risk that, if we extend a significant amount of credit to clients in a specific geographic area or industry, we may experience disproportionately high levels of default if those clients are adversely affected by factors particular to their geographic area or industry. Concentrations of credit risk relative to trade receivables are limited due to our diverse client base, which includes the U.S. federal government and multi-national corporations operating in a broad range of industries and geographic areas. Additionally, in order to mitigate credit risk, we continually evaluate the credit worthiness of our major commercial clients.
Use of Estimates and Assumptions
The preparation of financial statements in conformity with U.S. GAAP requires us to employ estimates and make assumptions that affect the reported amounts of certain assets and liabilities; the revenues and expenses reported for the periods covered by the financial statements; and certain amounts disclosed in these Notes to the Consolidated Financial Statements. Although such estimates and assumptions are based on management’s most recent assessment of the underlying facts and circumstances utilizing the most current information available and past experience, actual results could differ significantly from those estimates and assumptions. Our estimates, judgments, and assumptions are evaluated periodically and adjusted accordingly.
Earlier in these Notes to Consolidated Financial Statements we discussed three significant accounting policies that rely on the application of estimates and assumptions: revenue recognition for long-term construction contracts; the process for testing goodwill for possible impairment; and the accounting for share-based payments to employees and directors. The following is a discussion of certain other significant accounting policies that rely on the use of estimates:
Accounting for Pensions— We use certain assumptions and estimates in order to calculate periodic pension cost and the value of the assets and liabilities of our pension plans. These assumptions involve discount rates, investment returns, and projected salary increases, among others. Changes in the actuarial assumptions may have a material effect on the plans’ liabilities and the projected pension expense.
F-15
JACOBS ENGINEERING GROUP INC. AND SUBSIDIARIES
NOTES TO CONSOLIDATED FINANCIAL STATEMENTS—(Continued)
Accounting for Income Taxes— We determine our consolidated income tax expense using the asset and liability method prescribed by U.S. GAAP. Under this method, deferred tax assets and liabilities are recognized for the temporary differences between the carrying amounts of assets and liabilities for financial reporting purposes and income tax purposes. Such deferred tax assets and liabilities are adjusted, as appropriate, to reflect changes in tax rates expected to be in effect when the temporary differences reverse. If and when we determine that a deferred tax asset will not be realized for its full amount, we will recognize and record a valuation allowance with a corresponding charge to earnings. Judgment is required in determining our worldwide provision for income taxes. In the normal course of business, we may engage in numerous transactions every day for which the ultimate tax outcome (including the period in which the transaction will ultimately be included in taxable income or deducted as an expense) is uncertain. Additionally, we file income, franchise, gross receipts and similar tax returns in many jurisdictions. Our tax returns are subject to audit and investigation by the Internal Revenue Service, most states in the U.S., and by various government agencies representing many jurisdictions outside the U.S.
Contractual Guarantees, Litigation, Investigations, and Insurance— In the normal course of business, we are subject to certain contractual guarantees and litigation. We record in the Consolidated Balance Sheets amounts representing our estimated liability relating to such guarantees, litigation, and insurance claims. We perform an analysis to determine the level of reserves to establish for both insurance-related claims that are known and have been asserted against us as well as for insurance-related claims that are believed to have been incurred based on actuarial analysis, but have not yet been reported to our claims administrators as of the respective balance sheet dates. We include any adjustments to such insurance reserves in our Consolidated Statements of Earnings. In addition, as a contractor providing services to various agencies of the U.S. federal government, we are subject to many levels of audits, investigations, and claims by, or on behalf of, the U.S. federal government with respect to contract performance, pricing, costs, cost allocations, and procurement practices. We adjust revenues based upon the amounts we expect to realize considering the effects of any client audits or governmental investigations.
Accounting for Business Combinations— U.S. GAAP requires that the purchase price paid for business combinations accounted for using the acquisition method be allocated to the assets and liabilities acquired based on their respective Fair Values. Determining the Fair Value of contract assets and liabilities acquired often requires estimates and judgments regarding, among other things, the estimated cost to complete such contracts. The Company must also make certain estimates and judgments relating to other assets and liabilities acquired as well as any identifiable intangible assets acquired.
New Accounting Pronouncements
In May 2014, the FASB issued ASU No. 2014-09—Revenue from Contracts with Customers. The new guidance provided by ASU 2014-09 is intended to remove inconsistencies and weaknesses in the existing revenue requirements, provide a more robust framework for addressing revenue issues, improve comparability, provide more useful information and simplify the preparation of financial statements. ASU 2014-09 is effective for annual and interim reporting periods beginning after December 15, 2016. Early adoption is not permitted. The Company is currently evaluating the impact that the new guidance may have on the consolidated financial statements.
In December 2011, the FASB adopted ASU No. 2011-11—Disclosures about Offsetting Assets and Liabilities. ASU 2011-11 amends Topic 210 of the ASC and requires entities to disclose information about offsetting and related arrangements to enable users of their financial statements to understand the effect of those arrangements on their respective financial positions. The scope of this ASU includes derivatives, sale and repurchase agreements, reverse sale and repurchase agreements, and securities borrowing and securities lending agreements. Entities are required to apply the provisions of ASU 2011-11 for annual reporting periods beginning on or after January 1, 2013. The Company does not believe that the adoption of ASU 2011-11 will have a material effect on its consolidated financial statements.
F-16
JACOBS ENGINEERING GROUP INC. AND SUBSIDIARIES
NOTES TO CONSOLIDATED FINANCIAL STATEMENTS—(Continued)
3. Employee Stock Purchase and Stock Option Plans
Broad-Based, Employee Stock Purchase Plans
Under the 1989 ESPP and the GESPP, eligible employees who elect to participate in these plans are granted the right to purchase shares of the common stock of Jacobs at a discount that is limited to 5% of the per-share market value on the day shares are sold to employees. The following table summarizes the stock issuance activity under the 1989 ESPP and the GESPP during each of the last three fiscal years:
2014 | 2013 | 2012 | ||||||||||
Aggregate Purchase Price Paid for Shares Sold: | ||||||||||||
Under the 1989 ESPP | $ | 30,354,723 | $ | 30,012,848 | $ | 32,236,660 | ||||||
Under the GESPP | 3,314,046 | 3,068,578 | 2,944,987 | |||||||||
Total | $ | 33,668,769 | $ | 33,081,426 | $ | 35,181,647 | ||||||
Aggregate Number of Shares Sold: | ||||||||||||
Under the 1989 ESPP | 553,201 | 642,675 | 853,819 | |||||||||
Under the GESPP | 59,883 | 64,963 | 76,360 | |||||||||
Total | 613,084 | 707,638 | 930,179 | |||||||||
At September 26, 2014, there remains 1,860,820 shares reserved for issuance under the 1989 ESPP and 212,185 shares reserved for issuance under the GESPP.
Stock Incentive Plans
We also sponsor the 1999 SIP and the 1999 ODSP. The 1999 SIP provides for the issuance of incentive stock options, nonqualified stock options, share appreciation rights ("SAR"), restricted stock, and restricted stock units to employees. The 1999 ODSP provides for awards of shares of common stock, restricted stock, and restricted stock units, and grants of nonqualified stock options to our outside (i.e., nonemployee) directors. The following table sets forth certain information about the 1999 Plans:
1999 SIP | 1999 ODSP | Total | |||||||
Number of shares authorized | 29,850,000 | 800,000 | 30,650,000 | ||||||
Number of remaining shares reserved for issuance at September 26, 2014 | 11,072,944 | 357,000 | 11,429,944 | ||||||
Number of shares relating to outstanding stock options at September 26, 2014 | 3,954,272 | 266,875 | 4,221,147 | ||||||
Number of shares available for future awards: | |||||||||
At September 26, 2014 | 7,118,672 | 90,125 | 7,208,797 | ||||||
At September 27, 2013 | 5,099,632 | 140,125 | 5,239,757 | ||||||
Effective September 28, 2012, all grants of shares under the 1999 SIP are issued on a fungible share basis. An award of an option or SAR counts as 1.00 share issued under the 1999 SIP Plan. A grant other than an option or SAR counts as 1.92 shares issued under the 1999 SIP Plan.
The following table presents the Fair Value of shares (of restricted stock and restricted stock units) vested during each of the last three fiscal years (in thousands):
2014 | 2013 | 2012 | ||||||||||
Restricted Stock and Restricted Stock Units (service condition) | $ | 6,820 | $ | 13,054 | $ | 7,955 | ||||||
Restricted Stock Units (service, market, and performance conditions at target) | 18,675 | — | — | |||||||||
Total | $ | 25,495 | $ | 13,054 | $ | 7,955 | ||||||
F-17
JACOBS ENGINEERING GROUP INC. AND SUBSIDIARIES
NOTES TO CONSOLIDATED FINANCIAL STATEMENTS—(Continued)
The following table presents the Company’s total pre-tax compensation cost relating to share-based payments included in the accompanying Consolidated Statements of Earnings (in thousands):
2014 | 2013 | 2012 | ||||||||
$ | 43,400 | $ | 39,518 | $ | 32,442 | |||||
At September 26, 2014, the amount of compensation cost relating to nonvested awards not yet recognized in the financial statements is approximately $146.0 million. The majority of the unrecognized compensation costs will be recognized by the first quarter of fiscal 2018. The weighted average remaining contractual term of options currently exercisable is 4.6 years.
Stock Options
The following table summarizes the stock option activity for each of the last three fiscal years:
Number of Stock Options | Weighted Average Exercise Price | ||||||
Outstanding at September 30, 2011 | 6,461,510 | $ | 43.28 | ||||
Granted | 658,700 | $ | 37.45 | ||||
Exercised | (1,281,449 | ) | $ | 22.54 | |||
Cancelled or expired | (82,027 | ) | $ | 43.92 | |||
Outstanding at September 28, 2012 | 5,756,734 | $ | 47.23 | ||||
Granted | 753,450 | $ | 54.71 | ||||
Exercised | (1,782,371 | ) | $ | 37.00 | |||
Cancelled or expired | (121,601 | ) | $ | 50.22 | |||
Outstanding at September 27, 2013 | 4,606,212 | $ | 52.33 | ||||
Granted | 602,525 | $ | 53.51 | ||||
Exercised | (718,065 | ) | $ | 47.18 | |||
Cancelled or expired | (269,525 | ) | $ | 54.46 | |||
Outstanding at September 26, 2014 | 4,221,147 | $ | 53.23 | ||||
Stock options outstanding at September 26, 2014 consisted entirely of nonqualified stock options. The following table presents the total intrinsic value of stock options exercised during each of the last three fiscal years (in thousands):
2014 | 2013 | 2012 | ||||||||
$ | 9,590 | $ | 22,163 | $ | 26,196 | |||||
F-18
JACOBS ENGINEERING GROUP INC. AND SUBSIDIARIES
NOTES TO CONSOLIDATED FINANCIAL STATEMENTS—(Continued)
The total intrinsic value of stock options exercisable at September 26, 2014, was approximately $30.5 million. The following table presents certain other information regarding our 1999 Plans:
2014 | 2013 | 2012 | ||||||||||
At fiscal year end: | ||||||||||||
Range of exercise prices for options outstanding | $25.87–$94.11 | $20.98–$94.11 | $18.49–$94.11 | |||||||||
Number of options exercisable | 2,725,980 | 3,034,111 | 4,219,557 | |||||||||
For the fiscal year: | ||||||||||||
Range of prices relating to options exercised | $20.98–$57.54 | $18.49–$56.95 | $13.29–$37.73 | |||||||||
Estimated weighted average Fair Values of options granted | $ | 19.04 | $ | 20.64 | $ | 15.55 | ||||||
The following table presents certain information regarding stock options outstanding, and stock options exercisable at September 26, 2014:
Options Outstanding | Options Exercisable | |||||||||||||||
Range of Exercise Prices | Number | Weighted Average Remaining Contractual Life (years) | Weighted Average Price | Number | Weighted Average Exercise Price | |||||||||||
$25.87 - $26.80 | 21,500 | 0.44 | $ | 26.73 | 21,500 | $ | 26.73 | |||||||||
$32.51 - $37.32 | 531,375 | 7.55 | 37.01 | 269,625 | 37.00 | |||||||||||
$37.43 - $46.37 | 1,460,412 | 5.44 | 42.39 | 1,363,037 | 42.30 | |||||||||||
$47.11 - $55.04 | 1,453,911 | 8.53 | 52.99 | 397,644 | 51.02 | |||||||||||
$55.13 - $57.81 | 17,000 | 5.04 | 56.51 | 10,250 | 57.27 | |||||||||||
$60.08 - $83.61 | 165,075 | 5.31 | 70.40 | 92,050 | 78.42 | |||||||||||
$88.19 - $94.11 | 571,874 | 0.64 | 92.57 | 571,874 | 92.57 | |||||||||||
4,221,147 | 6.09 | $ | 53.23 | 2,725,980 | $ | — | ||||||||||
The 1999 Plans allow participants to satisfy the exercise price of stock options by tendering shares of Jacobs common stock that have been owned by the participants for at least six months. Shares so tendered are retired and canceled, and are shown as repurchases of common stock in the accompanying Consolidated Statements of Stockholders’ Equity.
The following table presents the number of shares of restricted stock and restricted stock units issued under the 1999 SIP during each of the last three fiscal years:
2014(1) | 2013(1) | 2012 | |||||||
Restricted stock | 589,150 | 445,200 | 497,100 | ||||||
Restricted stock units (service condition) | 287,545 | 107,500 | 116,450 | ||||||
Restricted stock units (service, market, and performance conditions at target) | 432,700 | 471,250 | 525,000 | ||||||
The amount of restricted stock units issued for awards with performance and market conditions in the above table are based on the target amount. The number of shares ultimately issued, which could be greater or less than target, will be based on achieving specific performance conditions described in Note 2 – Significant Accounting Policies.
F-19
JACOBS ENGINEERING GROUP INC. AND SUBSIDIARIES
NOTES TO CONSOLIDATED FINANCIAL STATEMENTS—(Continued)
The following table presents the number of shares of restricted stock and restricted stock units cancelled and withheld for taxes under the 1999 SIP during each of the last three fiscal years:
2014(1)(2) | 2013(1)(2) | 2012 | |||||||
Restricted stock | 147,221 | 128,923 | 80,460 | ||||||
Restricted stock units (service condition) | 12,333 | 3,385 | 5,650 | ||||||
Restricted stock units (service, market, and performance conditions at target) | 52,000 | 32,000 | 22,000 | ||||||
The amount of restricted stock units cancelled for awards with market and performance conditions in the above table is based on the target amount.
(1) The share amounts in the above tables for fiscal 2013 and 2014 reflect the fungible share counting of 1.92 shares for each share of restricted stock and restricted stock unit issued.
(2) Commencing in fiscal 2013, shares withheld for withholding tax liabilities are available for awards under the 1999 SIP and have been included in the table above for fiscal 2013 and 2014 only.
The restrictions attached to restricted stock and restricted stock units generally relate to the recipient’s ability to sell or otherwise transfer the stock or stock units. There are also restrictions that subject the stock and stock units to forfeiture back to the Company until earned by the recipient through continued employment or service.
The following table provides the number of shares of restricted stock and restricted stock units outstanding at September 26, 2014 under the 1999 SIP. Shares granted prior to September 29, 2012 were granted on a 1-to-1 basis ("Not Fungible"). Shares Granted after September 28, 2012 were issued on a 1.92-to-1.00 basis ("Fungible"):
Not Fungible | Fungible | Total | |||||||
Restricted stock | 929,990 | 985,400 | 1,915,390 | ||||||
Restricted stock units (service condition) | 103,920 | 384,995 | 488,915 | ||||||
Restricted stock units (service, market, and performance conditions at target) | 475,000 | 871,950 | 1,346,950 | ||||||
The following table presents the number of shares of restricted stock and restricted stock units issued under the 1999 ODSP during each of the last three fiscal years:
2014 | 2013 | 2012 | |||||||
Restricted stock units (service condition) | 15,000 | 13,500 | 8,000 | ||||||
The following table provides the number of shares of restricted stock and restricted stock units outstanding at September 26, 2014 under the 1999 ODSP (all shares granted under the 1999 ODSP are issued on a 1-to-1 basis):
2014 | |||
Restricted stock | 40,000 | ||
Restricted stock units (service condition) | 62,500 | ||
All shares granted under the 1999 ODSP are issued on a 1-to-1 basis.
F-20
JACOBS ENGINEERING GROUP INC. AND SUBSIDIARIES
NOTES TO CONSOLIDATED FINANCIAL STATEMENTS—(Continued)
4. Earnings Per Share
Basic and Diluted Earnings Per Share
The following table (i) reconciles the denominator used to compute Basic EPS to the denominator used to compute Diluted EPS for each of the last three fiscal years, and (ii) discloses the number of antidilutive stock options, shares of restricted stock, and restricted stock units outstanding at the end of each of the fiscal years indicated (in thousands):
2014 | 2013 | 2012 | |||||||
Shares used to calculate EPS: | |||||||||
Weighted average shares outstanding (denominator used to compute basic EPS) | 130,483 | 129,288 | 127,644 | ||||||
Effect of stock options and restricted stock | 1,888 | 1,657 | 1,048 | ||||||
Denominator used to compute diluted EPS | 132,371 | 130,945 | 128,692 | ||||||
Antidilutive stock options, shares of restricted stock, and restricted stock units | 2,074 | 2,603 | 5,093 | ||||||
Share Repurchases
On August 19, 2014, the Company's Board of Directors authorized a new share repurchase program of up to $500 million of the Company's common stock. The following table summarizes the activity under this program during fiscal 2014 (in thousands, except per-share amounts):
Amount Authorized (in thousands) | Average Price Per Share (1) | Total Shares Retired | Shares Repurchased 2014 | |||||||||||
$ | 500,000 | $ | 52.27 | 1,500 | 1,500 | |||||||||
(1) | Includes commissions paid and calculated as the average price per share since the repurchase |
program authorization date.
Share repurchases may be executed through various means including, without limitation, open market transactions, privately negotiated transactions or otherwise. The share repurchase program does not obligate the Company to purchase any shares, and expires on August 19, 2017. The authorization for the share repurchase program may be terminated, increased or decreased by the Company’s Board of Directors in its discretion at any time.
5. Borrowings
Short-Term Credit Arrangements
The Company maintains both committed and uncommitted credit arrangements with several banks providing for short-term borrowing capacity and overdraft protection. There were overdrafts of $36.7 million outstanding under these short-term credit facilities at a weighted average interest rate of 6.4% at September 26, 2014, and there were overdrafts of $22.8 million outstanding under these short-term credit facilities at September 27, 2013.
Long-term Debt
On February 7, 2014, Jacobs and certain of its subsidiaries entered into a $1.6 billion long-term unsecured, revolving credit facility (the "2014 Facility") with a syndicate of large, U.S. and international banks and financial institutions. The 2014 Facility replaced and refinanced the Company's previous $1.21 billion unsecured revolving credit facility originally entered into by the Company on March 29, 2012 (the "2012 Facility"). On the closing date of the 2014 Facility, all amounts outstanding and committed under the 2012 Facility were effectively terminated and refinanced under the 2014 Facility. The 2014 Facility also provides an accordion feature that allows the Company and the lenders to increase the facility amount to $2.1 billion. The 2014 Facility did not change interest rates for borrowings outstanding under the 2012 Facility, but did reduce the fees on the unused portion of the facility.
The following table presents certain information regarding the Company’s long-term revolving credit facilities at September 26, 2014, and September 27, 2013 (dollars in thousands):
2014 | 2013 | |||||||||
Principal Balance Outstanding | Range of Interest Rates | Principal Balance Outstanding | Range of Interest Rates | |||||||
$ | 764,075 | 1.0% – 1.51% | $ | 415,086 | 0.96% – 1.37% | |||||
The total amount outstanding under the 2014 Facility in the form of direct borrowings at September 26, 2014 was $0.8 billion. The Company has issued $2.8 million in letters of credit leaving $0.8 billion of available borrowing capacity under the 2014 Facility at September 26, 2014. In addition, the Company had $312.6 million issued under separate, committed and uncommitted letter-of-credit facilities for total issued letters of credit of $315.4 million at September 26, 2014.
The 2014 Facility expires in February 2019 and permits the Company to borrow under two separate tranches in U.S. dollars, certain specified foreign currencies, and any other currency that may be approved in accordance with the terms of the 2014 Facility. Depending on the Company's Consolidated Leverage Ratio, borrowings under the 2014 Facility will bear interest at either a eurocurrency rate plus a margin of between 1.0% and 1.5% or a base rate plus a margin of between 0% and 0.5%. The 2014 Facility also provides for a financial letter of credit subfacility of $300.0 million, permits performance letters of credit, and provides for a $50.0 million subfacility for swingline loans. Letters of credit are subject to fees based on the Company's Consolidated Leverage Ratio at the time any such letter of credit is issued. The Company pays a facility fee of between 0.100% and 0.25% per annum depending on the Company's Consolidated Leverage Ratio. Amounts outstanding under the 2014 Facility may be prepaid at the option of the Company without premium or penalty, subject to customary breakage fees in connection with the prepayment of eurocurrency loans. The 2014 Facility contains affirmative, negative, and financial covenants customary for financings of this type including, among other things, limitations on certain other indebtedness, loans and investments, liens, mergers, asset sales and transactions with affiliates. In addition, the 2014 Facility contains customary events of default. We were in compliance with our debt covenants at September 26, 2014.
The following table presents certain additional information regarding the Company’s 2014 and 2012 Facilities for the fiscal years shown:
2014 | 2013 | |||||||
Maximum amount outstanding at any month-end during the fiscal year | $ | 1,036,066 | $ | 526,602 | ||||
Average amount outstanding during the year | $ | 866,264 | $ | 470,343 | ||||
Weighted average interest rate during the year | 1.18 | % | 1.11 | % | ||||
The following table presents the amount of interest paid by the Company during each of the last three fiscal years (in thousands):
2014 | 2013 | 2012 | ||||||||
$ | 13,841 | $ | 6,685 | $ | 8,572 | |||||
6. Pension and Other Postretirement Benefit Plans
Company-Only Sponsored Plans
We sponsor various defined benefit pension plans covering employees of certain U.S. and international subsidiaries. The pension plans provide pension benefits that are based on the employee’s compensation and years of service. Our funding policy is to fund the actuarially determined accrued benefits where applicable, allowing for projected compensation increases using the projected unit method.
The accounting for pension and other post-retirement benefit plans requires the use of assumptions and estimates in order to calculate periodic benefit cost and the value of the plans’ assets and benefit obligations. These assumptions include discount rates, investment returns, and projected salary increases, amongst others. The discount rates used in valuing the plans' benefit obligations were determined with reference to high quality corporate/government bonds that are appropriately matched
F-21
JACOBS ENGINEERING GROUP INC. AND SUBSIDIARIES
NOTES TO CONSOLIDATED FINANCIAL STATEMENTS—(Continued)
to the duration of each plan's obligations. The expected long-term rate of return on plan assets is generally based on using country-specific simulation models which select a single outcome for expected return based on the target asset allocation. The expected long-term-rates of return used in the valuation are the annual average returns generated by these assumptions over a 20 year period for each asset class based on the expected long-term rate of return of the underlying assets.
The following table sets forth the changes in the plans’ combined net benefit obligation (segregated between plans existing within and outside the U.S.) during each of the fiscal years presented (in thousands):
U.S. Pension Plans | Non-U.S. Pension Plans | |||||||||||||||
2014 | 2013 | 2014 | 2013 | |||||||||||||
Net benefit obligation at the beginning of the year | $ | 468,439 | $ | 509,605 | $ | 1,307,331 | $ | 1,191,345 | ||||||||
Service cost | 12,077 | 13,814 | 25,374 | 30,117 | ||||||||||||
Interest cost | 22,041 | 18,569 | 54,208 | 51,331 | ||||||||||||
Participants’ contributions | 3,095 | 3,071 | 9,082 | 11,805 | ||||||||||||
Actuarial (gains)/losses | 27,076 | (42,689 | ) | 105,838 | 57,764 | |||||||||||
Benefits paid | (35,634 | ) | (33,960 | ) | (33,387 | ) | (34,058 | ) | ||||||||
Curtailments and settlements | — | — | (269,580 | ) | (6,297 | ) | ||||||||||
Plan amendments | (1,306 | ) | — | — | 109 | |||||||||||
Special termination benefits | — | 29 | — | — | ||||||||||||
Effect of exchange rate changes | — | — | (2,346 | ) | 5,215 | |||||||||||
Net benefit obligation at the end of the year | $ | 495,788 | $ | 468,439 | $ | 1,196,520 | $ | 1,307,331 | ||||||||
The following table sets forth the changes in the combined Fair Value of the plans’ assets (segregated between plans existing within and outside the U.S.) during each of the fiscal years presented (in thousands):
U.S. Pension Plans | Non-U.S. Pension Plans | |||||||||||||||
2014 | 2013 | 2014 | 2013 | |||||||||||||
Fair Value of plan assets at the beginning of the year | $ | 390,777 | $ | 359,348 | $ | 982,479 | $ | 877,950 | ||||||||
Actual return on plan assets | 45,484 | 53,495 | 130,665 | 72,368 | ||||||||||||
Employer contributions | 11,628 | 8,823 | 57,977 | 53,885 | ||||||||||||
Participants’ contributions | 3,095 | 3,071 | 9,082 | 11,805 | ||||||||||||
Gross benefits paid | (35,634 | ) | (33,960 | ) | (33,387 | ) | (34,058 | ) | ||||||||
Business combinations/consolidations | — | — | — | — | ||||||||||||
Curtailments/settlements | — | — | (268,486 | ) | (4,973 | ) | ||||||||||
Effect of exchange rate changes | — | — | (2,159 | ) | 5,502 | |||||||||||
Fair Value of plan assets at the end of the year | $ | 415,350 | $ | 390,777 | $ | 876,171 | $ | 982,479 | ||||||||
The following table reconciles the combined funded statuses of the plans recognized in the accompanying Consolidated Balance Sheets at September 26, 2014, and September 27, 2013 (segregated between plans existing within and outside the U.S.) (in thousands):
U.S. Pension Plans | Non-U.S. Pension Plans | |||||||||||||||
2014 | 2013 | 2014 | 2013 | |||||||||||||
Net benefit obligation at the end of the year | $ | 495,788 | $ | 468,439 | $ | 1,196,520 | $ | 1,307,331 | ||||||||
Fair Value of plan assets at the end of the year | 415,350 | 390,777 | 876,171 | 982,479 | ||||||||||||
Under-funded amount recognized at the end of the year | $ | 80,438 | $ | 77,662 | $ | 320,349 | $ | 324,852 | ||||||||
F-22
JACOBS ENGINEERING GROUP INC. AND SUBSIDIARIES
NOTES TO CONSOLIDATED FINANCIAL STATEMENTS—(Continued)
The following table presents the accumulated benefit obligation at September 26, 2014, and September 27, 2013 (segregated between plans existing within and outside the U.S.) (in thousands):
U.S. Pension Plans | Non-U.S. Pension Plans | |||||||||||||||
2014 | 2013 | 2014 | 2013 | |||||||||||||
Accumulated benefit obligation at the end of the year | $ | 455,245 | $ | 431,726 | $ | 1,128,715 | $ | 1,222,234 | ||||||||
The following table presents the amounts recognized in the accompanying Consolidated Balance Sheets at September 26, 2014, and September 27, 2013 (segregated between plans existing within and outside the U.S.) (in thousands):
U.S. Pension Plans | Non-U.S. Pension Plans | |||||||||||||||
2014 | 2013 | 2014 | 2013 | |||||||||||||
Prepaid benefit cost included in prepaid assets | $ | — | $ | — | $ | 7,123 | $ | 15,193 | ||||||||
Accrued benefit cost included in current liabilities | — | — | 1,447 | 1,000 | ||||||||||||
Accrued benefit cost included in noncurrent liabilities | 80,438 | 77,662 | 326,025 | 339,045 | ||||||||||||
Net amount recognized at the end of the year | $ | 80,438 | $ | 77,662 | $ | 320,349 | $ | 324,852 | ||||||||
Included in the tables are amounts relating to a U.S. pension plan, the participating employees in which are assigned to, and work exclusively on, a specific operating contract with the U.S. federal government. It is the intention of the parties to this contract that the cost of this pension plan will be fully reimbursed by the U.S. federal government pursuant to applicable cost accounting standards. Accordingly, included in “Other Noncurrent Assets” in the accompanying Consolidated Balance Sheet at September 26, 2014 is a receivable from the U.S. federal government of approximately $61.1 million ($58.4 million at September 27, 2013) representing the underfunded amount for this pension plan.
The following table presents the significant actuarial assumptions used in determining the funded statuses and the following year's benefit cost of the Company’s U.S. plans for each fiscal year presented:
2014 | 2013 | 2012 | |||||||
Weighted average discount rates | 3.9% to 4.4% | 4.4% to 5.0% | 3.4% to 3.9% | ||||||
Rates of compensation increases | 2.95 | % | 2.80 | % | 3.25 | % | |||
Expected long-term rates of return on plan assets | 7.7 | % | 7.7 | % | 7.5 | % | |||
F-23
JACOBS ENGINEERING GROUP INC. AND SUBSIDIARIES
NOTES TO CONSOLIDATED FINANCIAL STATEMENTS—(Continued)
The following table presents the significant actuarial assumptions used in determining the funded statuses and the following year's benefit cost of the Company’s Non-U.S. pension plans for each fiscal year presented:
2014 | 2013 | 2012 | ||||
Weighted average discount rates | 1.8% to 8.8% | 0.4% to 9.3% | 0.6% to 8.4% | |||
Rates of compensation increases | 2.6% to 7.5% | 2.5% to 7.5% | 2.8% to 7.5% | |||
Expected long-term rates of return on plan assets | 4.5% to 8.5% | 0.4% to 8.5% | 2.4% to 8.5% | |||
The following table presents certain amounts relating to our U.S. pension plans recognized in accumulated other comprehensive loss at September 26, 2014, September 27, 2013 and September 28, 2012(in thousands):
2014 | 2013 | 2012 | ||||||||||
Arising during the period: | ||||||||||||
Net actuarial (gain) loss | $ | 1,378 | $ | (15,850 | ) | $ | 2,756 | |||||
Reclassification adjustments: | ||||||||||||
Net actuarial gain | (2,255 | ) | (2,674 | ) | (2,011 | ) | ||||||
Total | $ | (877 | ) | $ | (18,524 | ) | $ | 745 | ||||
The following table presents certain amounts relating to our Non-U.S. pension plans recognized in accumulated other comprehensive loss at September 26, 2014, September 27, 2013 and September 28, 2012 (in thousands):
2014 | 2013 | 2012 | ||||||||||
Arising during the period: | ||||||||||||
Net actuarial loss (gain) | $ | 48,752 | $ | 27,417 | $ | 83,298 | ||||||
Prior service cost (benefit) | (1 | ) | 297 | (1,947 | ) | |||||||
Total | 48,751 | 27,714 | 81,351 | |||||||||
Reclassification adjustments: | ||||||||||||
Net actuarial gain | (12,914 | ) | (9,778 | ) | (6,131 | ) | ||||||
Prior service cost (benefit) | (19 | ) | 41 | (23 | ) | |||||||
Total | (12,933 | ) | (9,737 | ) | (6,154 | ) | ||||||
Total | $ | 35,818 | $ | 17,977 | $ | 75,197 | ||||||
The following table presents certain amounts relating to our pension plans recorded in accumulated other comprehensive loss that have not yet been recognized as components of net periodic benefit cost at September 26, 2014, and September 27, 2013 (segregated between plans existing within and outside the U.S.) (in thousands):
U.S. Pension Plans | Non-U.S. Pension Plans | |||||||||||||||
2014 | 2013 | 2014 | 2013 | |||||||||||||
Net actuarial loss | $ | 49,569 | $ | 50,446 | $ | 263,913 | $ | 228,074 | ||||||||
Prior service cost | — | — | (487 | ) | (466 | ) | ||||||||||
Total | $ | 49,569 | $ | 50,446 | $ | 263,426 | $ | 227,608 | ||||||||
The following table presents the amount of accumulated comprehensive income that will be amortized against earnings as part of our net periodic benefit cost in fiscal 2015 based on 2014 exchange rates (segregated between plans existing within and outside the U.S.) (in thousands):
U.S. Pension Plans | Non-U.S. Pension Plans | |||||||
Unrecognized net actuarial loss | $ | 3,756 | $ | 18,505 | ||||
Unrecognized prior service cost | (239 | ) | (99 | ) | ||||
Accumulated comprehensive loss to be recorded against earnings | $ | 3,517 | $ | 18,406 | ||||
F-24
JACOBS ENGINEERING GROUP INC. AND SUBSIDIARIES
NOTES TO CONSOLIDATED FINANCIAL STATEMENTS—(Continued)
We consider various factors in developing the estimates for the expected, long-term rates of return on plan assets. These factors include the projected, long-term rates of returns on the various types of assets in which the plans invest, as well as historical returns. In general, investment allocations are determined by each plan’s trustees and/or investment committees. The objectives of the plans’ investment policies are to (i) maximize returns while preserving capital; (ii) provide returns sufficient to meet the current and long-term obligations of the plan as the obligations become due; and (iii) maintain a diversified portfolio of assets so as to reduce the risk associated with having a disproportionate amount of the plans’ total assets invested in any one type of asset, issuer or geography. None of our pension plans hold Jacobs common stock directly (although some plans may hold shares indirectly through investments in mutual funds). The plans’ weighted average asset allocations at September 26, 2014, and September 27, 2013 (the measurement dates used in valuing the plans’ assets and liabilities) were as follows:
U.S. Pension Plans | Non-U.S. Pension Plans | |||||||||||
2014 | 2013 | 2014 | 2013 | |||||||||
Equity securities | 75 | % | 74 | % | 29 | % | 32 | % | ||||
Debt securities | 21 | % | 20 | % | 32 | % | 31 | % | ||||
Real estate investments | — | % | 1 | % | 7 | % | 6 | % | ||||
Other | 4 | % | 5 | % | 32 | % | 31 | % | ||||
The following table presents the Fair Value of the Company’s Domestic U.S. plan assets at September 26, 2014, segregated by level of Fair Value measurement inputs within the Fair Value hierarchy promulgated by U.S. GAAP (in thousands):
Fair Values By Level of Fair Value Measurement Inputs | ||||||||||||
Level 1 | Level 3 | Total | ||||||||||
Domestic equities | $ | 268,674 | $ | — | $ | 268,674 | ||||||
Overseas equities | 40,587 | — | 40,587 | |||||||||
Domestic bonds | 85,853 | — | 85,853 | |||||||||
Cash and equivalents | 3,932 | — | 3,932 | |||||||||
Real estate | — | — | — | |||||||||
Hedge funds | — | 16,304 | 16,304 | |||||||||
Total | $ | 399,046 | $ | 16,304 | $ | 415,350 | ||||||
The following table presents the Fair Value of the Company’s Non-U.S. pension plan assets at September 26, 2014, segregated by level of Fair Value measurement inputs within the Fair Value hierarchy promulgated by U.S. GAAP (in thousands):
Fair Values By Level of Fair Value Measurement Inputs | ||||||||||||
Level 1 | Level 3 | Total | ||||||||||
Domestic equities | $ | 33,842 | $ | — | $ | 33,842 | ||||||
Overseas equities | 218,779 | — | 218,779 | |||||||||
Domestic bonds | 198,344 | — | 198,344 | |||||||||
Overseas bonds | 76,349 | — | 76,349 | |||||||||
Cash and equivalents | 37,487 | — | 37,487 | |||||||||
Real estate | — | 59,966 | 59,966 | |||||||||
Insurance contracts | — | 37,468 | 37,468 | |||||||||
Hedge funds | — | 213,936 | 213,936 | |||||||||
Total | $ | 564,801 | $ | 311,370 | $ | 876,171 | ||||||
F-25
JACOBS ENGINEERING GROUP INC. AND SUBSIDIARIES
NOTES TO CONSOLIDATED FINANCIAL STATEMENTS—(Continued)
The following table presents the Fair Value of the Company’s U.S. pension plan assets at September 27, 2013, segregated by level of Fair Value measurement inputs within the Fair Value hierarchy promulgated by U.S. GAAP (in thousands):
Fair Values By Level of Fair Value Measurement Inputs | ||||||||||||
Level 1 | Level 3 | Total | ||||||||||
Domestic equities | $ | 247,155 | $ | — | $ | 247,155 | ||||||
Overseas equities | 40,719 | — | 40,719 | |||||||||
Domestic bonds | 79,482 | — | 79,482 | |||||||||
Cash and equivalents | 3,499 | — | 3,499 | |||||||||
Real estate | — | 4,411 | 4,411 | |||||||||
Hedge funds | — | 15,511 | 15,511 | |||||||||
Total | $ | 370,855 | $ | 19,922 | $ | 390,777 | ||||||
The following table presents the Fair Value of the Company’s Non-U.S. pension plan assets at September 27, 2013, segregated by level of Fair Value measurement inputs within the Fair Value hierarchy promulgated by U.S. GAAP (in thousands):
Fair Values By Level of Fair Value Measurement Inputs | ||||||||||||
Level 1 | Level 3 | Total | ||||||||||
Domestic equities | $ | 108,261 | $ | — | $ | 108,261 | ||||||
Overseas equities | 207,607 | — | 207,607 | |||||||||
Domestic bonds | 230,202 | — | 230,202 | |||||||||
Overseas bonds | 76,372 | — | 76,372 | |||||||||
Cash and equivalents | 28,185 | — | 28,185 | |||||||||
Infrastructure / raw Goods | — | 7,076 | 7,076 | |||||||||
Real estate | — | 57,173 | 57,173 | |||||||||
Insurance contracts | — | 21,214 | 21,214 | |||||||||
Hedge funds | — | 246,389 | 246,389 | |||||||||
Total | $ | 650,627 | $ | 331,852 | $ | 982,479 | ||||||
At September 26, 2014 and September 27, 2013, the Company holds no assets in the U.S. or Non-U.S. pension plans that use Level 2 fair value measurement inputs.
The following table summarizes the changes in the Fair Value of the Company’s U.S. Pension Plans’ Level 3 assets for the year ended September 26, 2014 (in thousands):
Real Estate | Hedge Funds | |||||||
Balance, beginning of year | $ | 4,411 | $ | 15,511 | ||||
Sale | (4,411 | ) | — | |||||
Realized and unrealized gains (losses) | — | 793 | ||||||
Balance, end of year | $ | — | $ | 16,304 | ||||
F-26
JACOBS ENGINEERING GROUP INC. AND SUBSIDIARIES
NOTES TO CONSOLIDATED FINANCIAL STATEMENTS—(Continued)
The following table summarizes the changes in the Fair Value of the Company’s Non-U.S. Pension Plans’ Level 3 assets for the year ended September 26, 2014 (in thousands):
Infrastructure / Raw Goods | Real Estate | Insurance Contracts | Hedge Funds | |||||||||||||
Balance, beginning of year | $ | 7,076 | $ | 57,173 | $ | 21,214 | $ | 246,389 | ||||||||
Purchases, sales, and settlements | (8,125 | ) | (6,022 | ) | 975 | 4,915 | ||||||||||
Realized and unrealized gains | 1,025 | 8,341 | 926 | (41,096 | ) | |||||||||||
Transfers | — | — | 15,756 | — | ||||||||||||
Effect of exchange rate changes | 24 | 474 | (1,403 | ) | 3,728 | |||||||||||
Balance, end of year | $ | — | $ | 59,966 | $ | 37,468 | $ | 213,936 | ||||||||
The following table summarizes the changes in the Fair Value of the Company’s U.S. Pension Plans’ Level 3 assets for the year ended September 27, 2013 (in thousands):
Real Estate | Hedge Funds | |||||||
Balance, beginning of year | $ | 4,841 | $ | 14,471 | ||||
Transfers | — | — | ||||||
Realized and unrealized losses | (430 | ) | 1,040 | |||||
Balance, end of year | $ | 4,411 | $ | 15,511 | ||||
The following table summarizes the changes in the Fair Value of the Company’s Non-U.S. Pension Plans’ Level 3 assets for the year ended September 27, 2013 (in thousands):
Infrastructure / Raw Goods | Real Estate | Insurance Contracts | Hedge Funds | |||||||||||||
Balance, beginning of year | $ | 6,111 | $ | 49,537 | $ | 18,291 | $ | 93,400 | ||||||||
Purchases, sales, and settlements | — | — | 1,646 | 144,441 | ||||||||||||
Realized and unrealized gains | 678 | 7,670 | 1,058 | 4,664 | ||||||||||||
Transfers | — | — | — | — | ||||||||||||
Effect of exchange rate changes | 287 | (34 | ) | 219 | 3,884 | |||||||||||
Balance, end of year | $ | 7,076 | $ | 57,173 | $ | 21,214 | $ | 246,389 | ||||||||
The following table presents the amount of cash contributions we anticipate making into the plans during fiscal 2015 (in thousands):
U.S. Pension Plans | Non-U.S. Pension Plans | |||||
$ | 4,000 | $ | 38,079 | |||
The following table presents the total benefit payments expected to be paid to pension plan participants during each of the next five fiscal years, and in total for the five years thereafter (in thousands):
U.S. Pension Plans | Non-U.S. Pension Plans | |||||||
2015 | $ | 38,355 | $ | 34,024 | ||||
2016 | 40,911 | 33,485 | ||||||
2017 | 43,283 | 35,170 | ||||||
2018 | 40,881 | 37,757 | ||||||
2019 | 40,955 | 38,445 | ||||||
For the period 2020 through 2024 | 208,013 | 242,260 | ||||||
F-27
JACOBS ENGINEERING GROUP INC. AND SUBSIDIARIES
NOTES TO CONSOLIDATED FINANCIAL STATEMENTS—(Continued)
The following table presents the components of net periodic benefit cost for the Company’s U.S. pension plans recognized in the accompanying Consolidated Statements of Earnings for each of the last three fiscal years (in thousands):
2014 | 2013 | 2012 | ||||||||||
Service cost | $ | 12,077 | $ | 13,814 | $ | 12,838 | ||||||
Interest cost | 22,041 | 18,569 | 20,923 | |||||||||
Expected return on plan assets | (28,495 | ) | (25,826 | ) | (23,764 | ) | ||||||
Actuarial loss | 3,608 | 8,030 | 10,981 | |||||||||
Prior service cost | (103 | ) | (103 | ) | (103 | ) | ||||||
Net pension cost, before special items | 9,128 | 14,484 | 20,875 | |||||||||
Special termination benefits | — | 29 | — | |||||||||
Settlement loss | — | — | 6,035 | |||||||||
Total net periodic pension cost recognized | $ | 9,128 | $ | 14,513 | $ | 26,910 | ||||||
The following table presents the components of net periodic benefit cost for the Company’s Non-U.S. pension plans recognized in the accompanying Consolidated Statements of Earnings for each of the last three fiscal years (in thousands):
2014 | 2013 | 2012 | ||||||||||
Service cost | $ | 25,374 | $ | 30,117 | $ | 22,723 | ||||||
Interest cost | 54,208 | 51,331 | 54,287 | |||||||||
Expected return on plan assets | (56,394 | ) | (54,817 | ) | (50,996 | ) | ||||||
Actuarial loss | 15,993 | 13,276 | 8,227 | |||||||||
Prior service cost | (28 | ) | (43 | ) | 152 | |||||||
Net pension cost, before special items | 39,153 | 39,864 | 34,393 | |||||||||
Curtailments and settlements | (15,894 | ) | (383 | ) | 1,326 | |||||||
Total net periodic pension cost recognized | $ | 23,259 | $ | 39,481 | $ | 35,719 | ||||||
Multiemployer Plans
In Canada and the U.S., we contribute to various trusteed pension plans covering hourly construction employees under industry-wide agreements. We also contribute to various trusteed plans in Australia and certain countries in Europe covering both hourly and certain salaried employees. Contributions are based on the hours worked by employees covered under these agreements and are charged to direct costs of contracts on a current basis.
The majority of the contributions the Company makes to multiemployer pension plans is outside the U.S. With respect to these multiemployer plans, the Company's liability to fund these plans is generally limited to the contributions we are required to make under collective bargaining agreements.
Based on our review of our multiemployer pension plans under the guidance provided in ASU 2011-09—Compensation-Retirement Benefits-Multiemployer Plans, we have concluded that none of the multiemployer pension plans into which we contribute are individually significant to our Consolidated Financial Statements.
The following table presents the Company’s contributions to these multiemployer plans during each of the last three fiscal years (in thousands):
F-28
JACOBS ENGINEERING GROUP INC. AND SUBSIDIARIES
NOTES TO CONSOLIDATED FINANCIAL STATEMENTS—(Continued)
2014 | 2013 | 2012 | ||||||||||
Canada | $ | 56,341 | $ | 72,660 | $ | 72,053 | ||||||
Europe and Australia | 12,693 | 12,930 | 10,808 | |||||||||
United States | 4,485 | 4,366 | 4,420 | |||||||||
Total | $ | 73,519 | $ | 89,956 | $ | 87,281 | ||||||
7. Other Comprehensive Income
The following table presents amounts reclassified from changes in pension liabilities in other comprehensive income to direct cost of contracts and selling, general and administrative expenses in the Company's Consolidated Statements of Earnings for the periods presented related to the Company's defined benefit pension plans (in thousands):
2014 | 2013 | 2012 | |||||||||
Amortization of Defined Benefit Items: | |||||||||||
Actuarial losses | $ | (19,601 | ) | $ | (17,554 | ) | $ | (11,444 | ) | ||
Prior service benefit (cost) | 28 | 43 | (152 | ) | |||||||
Total Before Income Tax | (19,573 | ) | (17,511 | ) | (11,596 | ) | |||||
Income Tax Benefit | 4,385 | 5,859 | 3,955 | ||||||||
Total reclassifications after-tax | $ | (15,188 | ) | $ | (11,652 | ) | $ | (7,641 | ) | ||
8. Savings and Deferred Compensation Plans
Savings Plans
We sponsor various defined contribution savings plans which allow participants to make voluntary contributions by salary deduction. Such plans cover substantially all of our domestic, nonunion employees in the U.S. and are qualified under Section 401(k) of the U.S. IRC. Similar plans outside the U.S. cover various groups of employees of our international subsidiaries and affiliates. Several of these plans allow the Company to match, on a voluntary basis, a portion of the employee contributions. The following table presents the Company’s contributions to these savings plans during each of the last three fiscal years (in thousands):
2014 | 2013 | 2012 | ||||||||
$ | 88,951 | $ | 74,686 | $ | 70,211 | |||||
Deferred Compensation Plans
Our Executive Security Plan and Executive Deferral Plans are nonqualified deferred compensation programs that provide benefits payable to directors, officers, and certain key employees or their designated beneficiaries at specified future dates, upon retirement, or death. Benefit payments under both plans are funded by a combination of contributions from participants and the Company, and most of the participants are covered by life insurance policies with the Company designated as the beneficiary. The following table presents the amount charged to expense for the Company’s deferred compensation plans during each of the last three fiscal years (in thousands):
2014 | 2013 | 2012 | ||||||||
$ | 5,321 | $ | 4,470 | $ | 4,349 | |||||
F-29
JACOBS ENGINEERING GROUP INC. AND SUBSIDIARIES
NOTES TO CONSOLIDATED FINANCIAL STATEMENTS—(Continued)
9. Income Taxes
The following table presents the components of our consolidated income tax expense for each of the last three fiscal years (in thousands):
2014 | 2013 | 2012 | ||||||||||
Current income tax expense: | ||||||||||||
Federal | $ | 102,450 | $ | 121,302 | $ | 111,035 | ||||||
State | 18,698 | 23,246 | 23,303 | |||||||||
Foreign | 38,107 | 74,107 | 69,080 | |||||||||
Total current tax expense | 159,255 | 218,655 | 203,418 | |||||||||
Deferred income tax expense (benefit): | ||||||||||||
Federal | 7,561 | (4,718 | ) | (2,505 | ) | |||||||
State | 2,789 | (582 | ) | (1,985 | ) | |||||||
Foreign | 20,449 | 8,011 | 3,454 | |||||||||
Total deferred income tax expense (benefit) | 30,799 | 2,711 | (1,036 | ) | ||||||||
Consolidated income tax expense | $ | 190,054 | $ | 221,366 | $ | 202,382 | ||||||
Deferred taxes reflect the tax effects of the differences between the amounts recorded as assets and liabilities for financial reporting purposes and the comparable amounts recorded for income tax purposes. Deferred tax assets and liabilities are measured using the enacted tax rates and laws that will be in effect when the differences are expected to reverse. The following table presents the components of our net deferred tax assets at September 26, 2014, and September 27, 2013 (in thousands):
2014 | 2013 | |||||||
Deferred tax assets: | ||||||||
Obligations relating to: | ||||||||
Defined benefit pension plans | $ | 67,822 | $ | 97,349 | ||||
Other employee benefit plans | 215,863 | 198,869 | ||||||
Net operating losses | 64,063 | 41,836 | ||||||
Self-insurance programs | 4,672 | 1,758 | ||||||
Contract revenues and costs | 39,734 | 19,468 | ||||||
Other | 3,039 | 6,564 | ||||||
Valuation allowance | (54,651 | ) | (37,300 | ) | ||||
Gross deferred tax assets | 340,542 | 328,544 | ||||||
Deferred tax liabilities: | ||||||||
Depreciation and amortization | (193,726 | ) | (127,974 | ) | ||||
Residual US tax on unremitted non-US earnings | — | (6,724 | ) | |||||
Other, net | (1,372 | ) | (7,560 | ) | ||||
Gross deferred tax liabilities | (195,098 | ) | (142,258 | ) | ||||
Net deferred tax assets | $ | 145,444 | $ | 186,286 | ||||
A valuation allowance is recorded to reduce deferred tax assets to the amount that is more likely than not to be realized. The valuation allowance at September 26, 2014 and September 27, 2013 was $54.7 million and $37.3 million, respectively.
F-30
JACOBS ENGINEERING GROUP INC. AND SUBSIDIARIES
NOTES TO CONSOLIDATED FINANCIAL STATEMENTS—(Continued)
Net operating loss carry forwards of foreign subsidiaries at September 26, 2014 and September 27, 2013 totaled $205.8 million and $136.1 million, respectively. If unused, foreign net operating losses of $88.0 million will expire between 2017 and 2034. Net operating losses of $117.8 million can be carried forward indefinitely.
The following table presents the income tax benefits realized from the exercise of nonqualified stock options and disqualifying dispositions of stock sold under our employee stock purchase plans during each of the last three fiscal years (in millions):
2014 | 2013 | 2012 | ||||||||
$ | 3.4 | $ | 7.3 | $ | 9.3 | |||||
The following table reconciles total income tax expense using the statutory U.S. federal income tax rate to the consolidated income tax expense shown in the accompanying Consolidated Statements of Earnings for each of the last three fiscal years (dollars in thousands):
2014 | 2013 | 2012 | ||||||||||
Statutory amount | $ | 189,758 | $ | 231,542 | $ | 207,668 | ||||||
State taxes, net of the federal benefit | 12,750 | 14,892 | 13,538 | |||||||||
Tax differential on foreign earnings | (8,811 | ) | (20,253 | ) | (16,944 | ) | ||||||
Uncertain tax positions | (9,847 | ) | 1,553 | 277 | ||||||||
Other, net | 6,204 | (6,368 | ) | (2,157 | ) | |||||||
Consolidated income tax expense | $ | 190,054 | $ | 221,366 | $ | 202,382 | ||||||
Rates used to compute statutory amount | 35.0 | % | 35.0 | % | 35.0 | % | ||||||
Consolidated effective income tax rate | 35.1 | % | 33.5 | % | 34.1 | % | ||||||
The Company’s consolidated effective income tax rate was 35.1% for fiscal 2014, compared to 33.5% in fiscal 2013. Contributing to the increase as compared to the prior year's periods were the effects of the fiscal 2014 restructuring efforts. Also contributing to the higher effective tax rate were certain non-deductible, acquisition-related costs and expenses related to the SKM acquisition.
The following table presents income tax payments made during each of the last three fiscal years (in millions):
2014 | 2013 | 2012 | ||||||||
$ | 173.6 | $ | 235.8 | $ | 191.4 | |||||
The following table presents the components of our consolidated earnings before taxes for each of the last three fiscal years (in thousands):
2014 | 2013 | 2012 | ||||||||||
United States earnings | $ | 288,800 | $ | 352,404 | $ | 286,987 | ||||||
Foreign earnings | 253,366 | 309,144 | 306,349 | |||||||||
$ | 542,166 | $ | 661,548 | $ | 593,336 | |||||||
United States income taxes, net of applicable credits, have been provided on the undistributed earnings of the Company’s foreign subsidiaries, except in those instances where the earnings have been permanently reinvested. At September 26, 2014, approximately $26.1 million of such undistributed earnings of certain foreign subsidiaries have been permanently reinvested. Should these earnings be repatriated, approximately $7.3 million of income taxes would be payable.
The Company accounts for unrecognized tax benefits in accordance with ASC Topic 740, Income Taxes. It accounts for interest and penalties on unrecognized tax benefits as interest and penalties (i.e., not as part of income tax expense). The Company’s liability for gross unrecognized tax benefits was $41.9 million and $51.8 million at September 26, 2014 and
F-31
JACOBS ENGINEERING GROUP INC. AND SUBSIDIARIES
NOTES TO CONSOLIDATED FINANCIAL STATEMENTS—(Continued)
September 27, 2013, respectively, all of which, if recognized, would affect the Company’s consolidated effective income tax rate. The Company had $39.2 million and $44.8 million in accrued interest and penalties at September 26, 2014, and September 27, 2013, respectively. The Company estimates that, within 12 months, $3.5 million of gross, primarily non-U.S. unrecognized tax benefits will reverse due to the anticipated expiration of time to assess tax. As of September 26, 2014, the Company’s U.S. federal income tax returns for tax years 2011 through 2014 remain subject to examination.
The following table presents the reconciliation of the beginning and ending amount of unrecognized tax benefits for the years presented (in thousands):
2014 | 2013 | 2012 | ||||||||||
Balance, beginning of year | $ | 51,770 | $ | 53,637 | $ | 31,130 | ||||||
Additions based on tax positions related to the current year | 6,528 | 5,447 | 6,110 | |||||||||
Additions for tax positions of prior years | — | — | 21,438 | |||||||||
Reductions for tax positions of prior years | (16,375 | ) | (6,354 | ) | (4,441 | ) | ||||||
Settlement | — | (960 | ) | (600 | ) | |||||||
Balance, end of year | $ | 41,923 | $ | 51,770 | $ | 53,637 | ||||||
F-32
JACOBS ENGINEERING GROUP INC. AND SUBSIDIARIES
NOTES TO CONSOLIDATED FINANCIAL STATEMENTS—(Continued)
10. Commitments and Contingencies, and Derivative Financial Instruments
Commitments Under Operating Leases
We lease certain of our facilities and equipment under operating leases with net aggregate future lease payments of approximately $1.1 billion at September 26, 2014, payable as follows (in thousands):
In fiscal years, | |||
2015 | $ | 230,866 | |
2016 | 175,877 | ||
2017 | 153,295 | ||
2018 | 129,530 | ||
2019 | 96,865 | ||
Thereafter | 308,890 | ||
1,095,323 | |||
Amounts representing sublease income | (19,259 | ) | |
Total, net aggregate future lease payments | $ | 1,076,064 | |
We recognize rent expense, inclusive of landlord concessions and tenant allowances, over the lease term on a straight-line basis. We also recognize rent expense on a straight-line basis for leases containing fixed escalation clauses and rent holidays. Contingent rentals are included in rent expense as accruable. Operating leases relating to many of our major offices generally contain renewal options, and provide for additional rental based on escalation in operating expenses and real estate taxes.
The following table presents rent expense and sublease income offsetting the Company’s rent expense during each of the last three fiscal years (in thousands):
2014 | 2013 | 2012 | ||||||||||
Rent expense | $ | 194,796 | $ | 173,340 | $ | 165,221 | ||||||
Sublease income | (6,102 | ) | (7,914 | ) | (8,402 | ) | ||||||
Net rent | $ | 188,694 | $ | 165,426 | $ | 156,819 | ||||||
Guarantee
We are party to a synthetic lease agreement involving certain real and personal property located in Houston, Texas that we use in our operations. A synthetic lease is a type of off-balance sheet transaction which provides us with certain tax and other financial benefits. Significant terms of the lease are as follows:
End of lease term | 2015 | ||
End of term purchase option (in thousands) | $ | 52,200 | |
Residual value guaranty (in thousands) | $ | 38,800 | |
The lease agreement gives us the right to request an extension of the lease term. We may also assist the owner in selling the property at the end of the lease term, the proceeds from which would be used to reduce our residual value guarantee. In connection with the lease, we entered into a floating-to-fixed interest rate swap agreement with a U.S. bank which fixes the amount of the Company’s lease payments. The notional amount of this hedge at September 26, 2014, was $52.2 million. This instrument allows us to receive a floating rate payment tied to the 1-month LIBOR from the counterparty in exchange for a fixed-rate payment from us. We have determined this interest rate swap to be “highly effective” according to U.S. GAAP. The minimum lease payments required by the lease agreement is included in the above lease pay-out schedule. We have determined that the estimated Fair Value of the aforementioned financial guarantee was not significant at September 26, 2014. The Company is currently exploring refinancing options with respect to the lease agreement.
F-33
JACOBS ENGINEERING GROUP INC. AND SUBSIDIARIES
NOTES TO CONSOLIDATED FINANCIAL STATEMENTS—(Continued)
Derivative Financial Instruments
In situations where our operations incur contract costs in currencies other than their functional currency, we attempt to have a portion of the related contract revenues denominated in the same currencies as the costs. In those situations where revenues and costs are transacted in different currencies, we sometimes enter into foreign exchange contracts in order to limit our exposure to fluctuating foreign currencies. The Company does not currently have exchange rate sensitive instruments that would have a material effect on our consolidated financial statements or results of operations.
Letters of Credit
Letters of credit outstanding at September 26, 2014 totaled $315.4 million. Of this amount, $2.8 million has been issued under the 2014 Facility and $312.6 million are issued under separate, committed and uncommitted letter-of-credit facilities.
11. Contractual Guarantees, Litigation, Investigations, and Insurance
In the normal course of business, we are subject to certain contractual guarantees and litigation. The guarantees to which we are a party generally relate to project schedules and plant performance. Most of the litigation in which we are involved has us as a defendant in workers' compensation; personal injury; environmental; employment/labor; professional liability; and other similar lawsuits.
We maintain insurance coverage for various aspects of our business and operations. Our insurance programs have varying coverage limits and maximums, and insurance companies may seek to not pay any claims we might make. We have also elected to retain a portion of losses that occur through the use of various deductibles, limits, and retentions under our insurance programs. As a result, we may be subject to future liability for which we are only partially insured or completely uninsured. We intend to mitigate any such future liability by continuing to exercise prudent business judgment in negotiating the terms and conditions of our contracts. Our insurers are also subject to business risk and, as a result, one or more of them may be unable to fulfill their insurance obligations due to insolvency or otherwise.
Additionally, as a contractor providing services to the U.S. federal government and several of its agencies, we are subject to many levels of audits, investigations, and claims by, or on behalf of, the U.S. federal government with respect to our contract performance, pricing, costs, cost allocations, and procurement practices. Furthermore, our income, franchise, and similar tax returns and filings are also subject to audit and investigation by the Internal Revenue Service, most states within the U.S. as well as by various government agencies representing jurisdictions outside the U.S.
We record in our Consolidated Balance Sheets amounts representing our estimated liability relating to such claims, guarantees, litigation, and audits and investigations. We perform an analysis to determine the level of reserves to establish for insurance-related claims that are known and have been asserted against us, and for insurance-related claims that are believed to have been incurred based on actuarial analysis, but have not yet been reported to our claims administrators as of the respective balance sheet dates. We include any adjustments to such insurance reserves in our consolidated results of operations.
Management believes, after consultation with counsel, that such guarantees, litigation, U.S. government contract-related audits, investigations and claims, and income tax audits and investigations should not have any material adverse effect on our consolidated financial statements.
On August 9, 2014, the Company received a Notice of Arbitration from Motiva Enterprises LLC. The Arbitration is pending in Houston, Texas before the International Institute for Conflict Prevention and Resolution. In 2006, Motiva contracted with Bechtel-Jacobs CEP Port Arthur Joint Venture (“BJJV”), a joint venture between Bechtel Corporation and Jacobs Engineering Group, Inc. to perform professional services in connection with the expansion project at the Motiva Port Arthur, TX refinery. In the Notice of Arbitration, Motiva asserts various causes of action and alleges entitlement to equitable and monetary relief in excess of $7 billion. BJJV has denied liability and is vigorously defending these claims. The Company does not expect this matter to have a material adverse effect on its consolidated financial statements.
The Company is a defendant in a property damage lawsuit pending in North Carolina's Superior Courts arising out of a June 9, 2009, natural gas explosion at a ConAgra Foods Inc. plant in Garner, Wake County, North Carolina. The Company has settled the personal injury claims and is vigorously defending the property damage claim and believes it has meritorious defenses. In addition, the Company believes it has adequate insurance coverage as well as a right to indemnification from ConAgra. Accordingly, the Company does not expect these matters to have any material adverse effect on its consolidated financial statements.
F-34
JACOBS ENGINEERING GROUP INC. AND SUBSIDIARIES
NOTES TO CONSOLIDATED FINANCIAL STATEMENTS—(Continued)
12. Common and Preferred Stock
Jacobs is authorized to issue two classes of capital stock designated “common stock” and “preferred stock” (each has a par value of $1.00 per share). The preferred stock may be issued in one or more series. The number of shares to be included in a series as well as each series’ designation, relative powers, dividend and other preferences, rights and qualifications, redemption provisions, and restrictions are to be fixed by the Board of Directors at the time each series is issued. Except as may be provided by the Board of Directors in a preferred stock designation, or otherwise provided for by statute, the holders of shares of common stock have the exclusive right to vote for the election of Directors and all other matters requiring stockholder action. The holders of shares of common stock are entitled to dividends if and when declared by the Board of Directors from whatever assets are legally available for that purpose.
13. Other Financial Information
Receivables
The following table presents the components of “Receivables” as shown in the accompanying Consolidated Balance Sheets at September 26, 2014, and September 27, 2013 as well as certain other related information (in thousands):
2014 | 2013 | |||||||
Amounts billed, net | $ | 1,425,341 | $ | 1,389,278 | ||||
Unbilled receivables and other | 1,368,482 | 1,109,931 | ||||||
Retentions receivable | 73,732 | 49,781 | ||||||
Total receivables, net | $ | 2,867,555 | $ | 2,548,990 | ||||
Other information about receivables: | ||||||||
Amounts due from the United States federal government included above, net of advanced billings | $ | 324,928 | $ | 292,698 | ||||
Claims receivable | $ | 78,634 | $ | 25,237 | ||||
Billed receivables, net consist of amounts invoiced to clients in accordance with the terms of the client contracts and are shown net of an allowance for doubtful accounts. We anticipate that substantially all of such billed amounts will be collected over the next twelve months.
Unbilled receivables and retentions receivable represent reimbursable costs and amounts earned and reimbursable under contracts in progress as of the respective balance sheet dates. Such amounts become billable according to the contract terms, which usually consider the passage of time, achievement of certain milestones or completion of the project. We anticipate that substantially all of such unbilled amounts will be billed and collected over the next twelve months.
Claims receivable are included in “Receivables” in the accompanying Consolidated Balance Sheets and represent certain costs incurred on contracts to the extent it is probable that such claims will result in additional contract revenue and the amount of such additional revenue can be reliably estimated.
Property, Equipment, and Improvements, Net
The following table presents the components of our property, equipment, and improvements, net at September 26, 2014, and September 27, 2013 (in thousands):
2014 | 2013 | |||||||
Land | $ | 21,497 | $ | 22,027 | ||||
Buildings | 128,584 | 131,690 | ||||||
Equipment | 634,415 | 537,835 | ||||||
Leasehold improvements | 287,814 | 204,940 | ||||||
Construction in progress | 20,059 | 22,678 | ||||||
1,092,369 | 919,170 | |||||||
Accumulated depreciation and amortization | (635,572 | ) | (539,874 | ) | ||||
$ | 456,797 | $ | 379,296 | |||||
F-35
JACOBS ENGINEERING GROUP INC. AND SUBSIDIARIES
NOTES TO CONSOLIDATED FINANCIAL STATEMENTS—(Continued)
Miscellaneous Noncurrent Assets
The following table presents the components of “Miscellaneous noncurrent assets” shown in the accompanying Consolidated Balance Sheets at September 26, 2014, and September 27, 2013 (in thousands):
2014 | 2013 | |||||||
Deferred income taxes | $ | 170,649 | $ | 197,458 | ||||
Cash surrender value of life insurance policies | 116,686 | 100,253 | ||||||
Investments | 226,628 | 194,782 | ||||||
Notes receivable | 8,007 | 11,689 | ||||||
Reimbursable pension costs (a) | 77,710 | 84,348 | ||||||
Other | 38,570 | 26,025 | ||||||
Total | $ | 638,250 | $ | 614,555 | ||||
(a) | Consists of costs incurred relating to a defined benefit pension plan covering employees providing services on a contract with, and for the benefit of, the U.S. federal government pursuant to which such costs are fully reimbursable. |
Accrued Liabilities
The following table presents the components of “Accrued liabilities” shown in the accompanying Consolidated Balance Sheets at September 26, 2014 and September 27, 2013 (in thousands):
2014 | 2013 | |||||||
Accrued payroll and related liabilities | $ | 782,615 | $ | 688,391 | ||||
Project-related accruals | 218,460 | 115,418 | ||||||
Insurance liabilities | 52,826 | 48,209 | ||||||
Sales and other similar taxes | 52,373 | 47,973 | ||||||
Deferred rent | 96,129 | 57,581 | ||||||
Other | 77,153 | 72,244 | ||||||
Total | $ | 1,279,556 | $ | 1,029,816 | ||||
Other Deferred Liabilities
The following table presents the components of “Other deferred liabilities” shown in the accompanying Consolidated Balance Sheets at September 26, 2014 and September 27, 2013 (in thousands):
2014 | 2013 | |||||||
Liabilities relating to defined benefit pension and early retirement plans | $ | 407,263 | $ | 416,707 | ||||
Liabilities relating to nonqualified deferred compensation arrangements | 114,325 | 101,653 | ||||||
Deferred income taxes | 195,098 | 142,258 | ||||||
Miscellaneous | 117,392 | 62,486 | ||||||
Total | $ | 834,078 | $ | 723,104 | ||||
F-36
JACOBS ENGINEERING GROUP INC. AND SUBSIDIARIES
NOTES TO CONSOLIDATED FINANCIAL STATEMENTS—(Continued)
Total Accumulated Other Comprehensive Loss
The following table presents the components of “Accumulated other comprehensive loss” shown in the accompanying Consolidated Balance Sheets at September 26, 2014, and September 27, 2013 (in thousands):
2014 | 2013 | |||||||
Foreign currency translation adjustments | $ | (62,919 | ) | $ | (32,853 | ) | ||
Adjustments relating to defined benefit pension plans | (299,210 | ) | (269,345 | ) | ||||
Other | (1,420 | ) | (1,929 | ) | ||||
Total | $ | (363,549 | ) | $ | (304,127 | ) | ||
Supplemental Cash Flow Information
During fiscal 2014 and fiscal 2013, the Company acquired businesses for cash and stock of $1.39 billion and $39.4 million, respectively. The following table presents the non-cash adjustments relating to these acquisitions made in preparing the accompanying Consolidated Statements of Cash Flows (in thousands):
2014 | 2013 | |||||||
Working capital | $ | 48,327 | $ | 4,197 | ||||
Property and equipment | 59,216 | 386 | ||||||
Noncurrent assets | 262,450 | — | ||||||
Deferred liabilities | (7,895 | ) | 2,181 | |||||
Non-controlling interests | 16,572 | 18,589 | ||||||
Foreign currency translation | 1,768 | (3,461 | ) | |||||
Goodwill | 1,005,923 | 17,537 | ||||||
F-37
JACOBS ENGINEERING GROUP INC. AND SUBSIDIARIES
NOTES TO CONSOLIDATED FINANCIAL STATEMENTS—(Continued)
14. Segment Information
We provide a broad range of technical, professional, and construction services including engineering, design, and architectural services; construction and construction management services; operations and maintenance services; and process, scientific, and systems consulting services. We provide our services through offices and subsidiaries located primarily in North America, South America, Europe, the Middle East, India, Australia, Africa, and Asia. We provide our services under cost-reimbursable and fixed-price contracts.
All of our operations share similar economic characteristics. For example, all of our operations are highly influenced by the general availability of qualified engineers and other technical professional staff. They also provide similar services as well as share similar processes for delivering our services. There is also a high degree of similarity of the workforces employed among the various categories of services we provide. For example, engineering and design services (i.e., services provided by persons who are degreed, and in certain circumstances licensed, professionals such as engineers, architects, scientists, and economists) exist in all four service categories. In addition, there is a high degree of similarity among a significant component of the workforces we employ to perform construction and operations and maintenance projects. In providing construction and operations and maintenance services, we employ a large number of skilled craft labor personnel. These include welders, pipe fitters, electricians, crane operators, and other personnel who work on very large capital projects (in the case of projects classified within the construction services category) or on smaller capital projects (in the case of maintenance projects classified within the operations and maintenance services category). In addition, the use of technology is highly similar and consistent throughout our organization, as is our client base (with the exception of our operations outside the U.S., which perform very little work for the U.S. federal government), and our quality assurance and safety programs. Furthermore, the types of information and internal reports used by the Company’s chief operating decision maker and other members of management to monitor performance, evaluate results of operations, allocate resources, and otherwise manage the business support a single reportable segment. Accordingly, based on these operational similarities and the way management monitors the Company’s results of operations, we have concluded that our operations may be aggregated into one reportable segment for purposes of this disclosure.
The following table presents certain financial information by geographic area for fiscal 2014, 2013, and 2012 (in thousands):
2014 | 2013 | 2012 | ||||||||||
Revenues: | ||||||||||||
United States | $ | 7,078,366 | $ | 6,993,594 | $ | 6,749,583 | ||||||
Europe | 2,402,399 | 2,148,504 | 1,681,421 | |||||||||
Canada | 1,344,632 | 1,652,386 | 1,564,883 | |||||||||
Asia | 299,086 | 204,203 | 156,748 | |||||||||
India | 148,453 | 158,908 | 124,362 | |||||||||
Australia and New Zealand | 709,379 | 141,507 | 253,932 | |||||||||
South America and Mexico | 271,213 | 241,590 | 158,141 | |||||||||
Middle East and Africa | 441,629 | 277,684 | 204,708 | |||||||||
Total | $ | 12,695,157 | $ | 11,818,376 | $ | 10,893,778 | ||||||
Long-Lived Assets: | ||||||||||||
United States | $ | 240,501 | $ | 230,281 | $ | 203,746 | ||||||
Europe | 58,562 | 47,128 | 46,763 | |||||||||
Canada | 51,622 | 61,122 | 47,539 | |||||||||
Asia | 4,063 | 4,272 | 3,580 | |||||||||
India | 17,960 | 15,049 | 17,094 | |||||||||
Australia | 49,436 | 8,329 | 7,859 | |||||||||
South America and Mexico | 11,084 | 6,159 | 2,400 | |||||||||
Middle East and Africa | 23,569 | 6,956 | 2,150 | |||||||||
Total | $ | 456,797 | $ | 379,296 | $ | 331,131 | ||||||
Revenues were earned from unaffiliated clients located primarily within the various and respective geographic areas shown. Long-lived assets consist of property and equipment, net of accumulated depreciation and amortization.
F-38
JACOBS ENGINEERING GROUP INC. AND SUBSIDIARIES
NOTES TO CONSOLIDATED FINANCIAL STATEMENTS—(Continued)
The following table presents the revenues earned directly or indirectly from the U.S. federal government and its agencies, expressed as a percentage of total revenues, for fiscal 2014, 2013, and 2012:
2014 | 2013 | 2012 | |||||
17.8 | % | 19.9 | % | 22.1 | % | ||
F-39
JACOBS ENGINEERING GROUP INC. AND SUBSIDIARIES
NOTES TO CONSOLIDATED FINANCIAL STATEMENTS—(Continued)
15. Selected Quarterly Information — Unaudited
The following table presents selected quarterly financial information for each of the last three fiscal years. Amounts are presented in thousands, except for per share amounts:
First Quarter | Second Quarter | Third Quarter | Fourth Quarter | Fiscal Year | ||||||||||||||||||||
2014 | ||||||||||||||||||||||||
Revenues | $ | 3,068,891 | $ | 3,176,033 | $ | 3,231,791 | $ | 3,218,442 | $ | 12,695,157 | ||||||||||||||
Operating profit (a) | 145,047 | 122,434 | 123,937 | 136,650 | 528,068 | |||||||||||||||||||
Earnings before taxes | 146,921 | 132,394 | 118,046 | 144,805 | 542,166 | |||||||||||||||||||
Net earnings of the Group | 98,949 | 90,800 | 71,309 | 91,054 | 352,112 | |||||||||||||||||||
Net earnings attributable to Jacobs | 93,732 | 83,460 | (d) | 64,842 | (b) | 86,074 | (b) | 328,108 | ||||||||||||||||
Earnings per share: | ||||||||||||||||||||||||
Basic | 0.72 | 0.64 | (d) | 0.50 | (b) | 0.66 | (b) | 2.51 | ||||||||||||||||
Diluted | 0.71 | 0.63 | (d) | 0.49 | (b) | 0.65 | (b) | 2.48 | ||||||||||||||||
2013 | ||||||||||||||||||||||||
Revenues | $ | 2,759,641 | $ | 2,835,084 | $ | 3,080,995 | $ | 3,142,656 | $ | 11,818,376 | ||||||||||||||
Operating profit (a) | 160,269 | 165,203 | 168,359 | 175,148 | 668,979 | |||||||||||||||||||
Earnings before taxes | 156,311 | 161,908 | 168,423 | 174,906 | 661,548 | |||||||||||||||||||
Net earnings of the Group | 104,523 | 107,089 | 112,089 | 116,481 | 440,182 | |||||||||||||||||||
Net earnings attributable to Jacobs | 99,010 | 104,401 | 108,871 | 110,811 | 423,093 | |||||||||||||||||||
Earnings per share: | ||||||||||||||||||||||||
Basic | 0.77 | 0.81 | 0.84 | 0.85 | 3.27 | |||||||||||||||||||
Diluted | 0.76 | 0.80 | 0.83 | 0.84 | 3.23 | |||||||||||||||||||
2012 | ||||||||||||||||||||||||
Revenues | $ | 2,631,768 | $ | 2,702,851 | $ | 2,772,874 | $ | 2,786,285 | $ | 10,893,778 | ||||||||||||||
Operating profit (a) | 141,952 | 133,138 | 153,366 | 167,617 | 596,073 | |||||||||||||||||||
Earnings before taxes | 139,554 | 132,315 | 151,371 | 170,096 | 593,336 | |||||||||||||||||||
Net earnings of the Group | 91,436 | 87,446 | 100,990 | 111,082 | 390,954 | |||||||||||||||||||
Net earnings attributable to Jacobs | 89,710 | 83,933 | 97,900 | 107,411 | (c) | 378,954 | (c) | |||||||||||||||||
Earnings per share: | ||||||||||||||||||||||||
Basic | 0.71 | 0.66 | 0.77 | 0.84 | (c) | 2.97 | (c) | |||||||||||||||||
Diluted | 0.70 | 0.65 | 0.76 | 0.83 | (c) | 2.94 | (c) | |||||||||||||||||
(a) | Operating profit represents revenues less (i) direct costs of contracts, and (ii) selling, general and administrative expenses. |
(b) | Includes costs of $47.0 million, or $0.35 per diluted share, in the third quarter of fiscal 2014, and $30.4 million, or $0.23 per diluted share, in the fourth quarter of fiscal 2014, related to the Company's restructuring activities. |
(c) | Includes an after-tax gain of $4.0 million, or $0.03 per diluted share, related to the sale of the Company's intellectual property for iron ore pelletizing and certain other related assets. |
(d) | Includes $6.4 million, or $0.05 per diluted share, increase to net earnings related to a gain on the sale of certain intellectual property in the second quarter of fiscal 2014. |
F-40
JACOBS ENGINEERING GROUP INC. AND SUBSIDIARIES
NOTES TO CONSOLIDATED FINANCIAL STATEMENTS—(Continued)
16. | Definitions |
The following terms used in the accompanying Consolidated Financial Statements and these Notes to Consolidated Financial Statements have the meanings set forth below:
“1989 ESPP” means the Jacobs Engineering Group Inc. 1989 Employee Stock Purchase Plan, as amended. The 1989 ESPP is a shareholder-approved, broad-based, employee stock purchase plan qualified under Section 423 of the U.S. IRC.
“1999 ODSP" means the Jacobs Engineering Group Inc. 1999 Outside Director Stock Plan, as amended. The 1999 ODSP is a shareholder-approved, equity-based compensation plan covering Jacobs' non-management directors.
“1999 SIP” means the Jacobs Engineering Group Inc. Stock Incentive Plan, as amended. The 1999 SIP is a shareholder-approved, equity-based compensation plan covering the Company's officers and key employees.
The "2014 Restructuring" refers to a series of initiatives intended to improve operational efficiency, reduce costs, accelerate the integration of SKM, and better position the Company to drive growth of the business in the future. Actions included involuntary terminations, the abandonment of certain leased offices, and the co-location of employees. Included in the Company's consolidated results of operations for fiscal 2014 are pre-tax costs of $93.3 million relating to the 2014 Restructuring. These costs are included in selling, general, and administrative expense in the accompanying Consolidated Statements of Earnings.
“ASC” refers to the Accounting Standards Codification as maintained by the FASB. The ASC is the primary source of U.S. GAAP to be applied by the Company and all other nongovernmental entities. The ASC organizes and presents hundreds of previously separate pieces of authoritative accounting guidance into a single on-line research database. The accounting principles promulgated by the ASC are organized therein by broad topics, and is updated by the FASB through the issuances of ASUs.
“ASU” means Accounting Standards Updates, the primary means by which the ASC is updated by the FASB.
“Company” (including “we”, “us” or “our”) means Jacobs Engineering Group Inc. and its consolidated subsidiaries and affiliates.
“Consolidated EBITDA" generally means consolidated net earnings attributable to Jacobs, plus consolidated (i) interest expense, (ii) tax expense, and (iii) depreciation and amortization expense (including amortization expense relating to intangible assets).
"Consolidated Funded Indebtedness" generally means the sum of (i) the balances outstanding under all loan, credit, and similar agreements for borrowed money (including purchase money indebtedness), (ii) all amounts representing direct obligations arising under letters of credit, (iii) indebtedness in respect of capital leases and similar financing arrangements, and (iv) the value of all guarantees issued with respect to the types of indebtedness described in (i) through (iii).
"Consolidated Leverage Ratio" means, as of any date of determination, the ratio of (i) the Company's "Consolidated Funded Indebtedness" as of such date to (ii) the Company's "Consolidated EBITDA" for the immediately preceding four consecutive fiscal quarters.
“EPS” means earnings-per-share. “Basic EPS” is computed by dividing the consolidated net earnings attributable to Jacobs by the weighted average number of shares of common stock outstanding during the period. “Diluted EPS” is computed in a manner similar to the computation of Basic EPS, but gives effect to all dilutive securities that were outstanding during the period. Our dilutive securities consist of nonqualified stock options and restricted stock (including restricted stock units)
F-41
JACOBS ENGINEERING GROUP INC. AND SUBSIDIARIES
NOTES TO CONSOLIDATED FINANCIAL STATEMENTS—(Continued)
“Fair Value” means the price that would be received from selling an asset, or paid to transfer a liability, in an orderly transaction between market participants as of the date fair value is determined (i.e., the “measurement date”). When determining fair value, U.S. GAAP requires that we consider the principal or most advantageous market in which we would transact any sale or purchase. U.S. GAAP also requires that the inputs (factors) we use (consider) to determine fair value be considered in the following order of priority:
• | Level 1 inputs are quoted prices in active markets for identical assets or liabilities; |
• | Level 2 inputs are observable inputs (other than quoted prices in active markets included in Level 1) such as (i) quoted prices for similar assets or liabilities, (ii) quoted prices in markets that have insufficient volume or infrequent transactions (i.e., less active markets), and (iii) model-driven valuations in which all significant inputs are observable or can be derived principally from, or corroborated with, observable market data for substantially the full term of the asset or liability; and |
• | Level 3 inputs are unobservable inputs to the valuation methodology that are significant to the fair value measurement. |
“FASB” means the Financial Accounting Standards Board. The FASB is the designated organization within the U.S. for establishing standards of financial accounting that govern the preparation of financial reports by nongovernmental entities.
“GESPP” means the Jacobs Engineering Group Inc. Global Employee Stock Purchase Plan, as amended. The GESPP is a shareholder-approved, broad-based, employee stock purchase plan covering employees of certain of Jacobs' non-U.S. subsidiaries.
“Group” refers to the combined economic interests and activities of Jacobs and the persons and entities holding noncontrolling interests in the subsidiaries and affiliates that are consolidated into the accompanying Consolidated Financial Statements.
“Jacobs” means Jacobs Engineering Group Inc.
“U.S. GAAP” means those accounting principles and practices generally accepted in the United States.
“U.S. IRC” means the U.S. Internal Revenue Code of 1986, as amended.
“VIE” means a “Variable Interest Entity” as defined in U.S. GAAP. A VIE is a legal entity in which equity investors do not have sufficient equity at risk for the entity to finance its activities without additional subordinated financial support or, as a group, the holders of the equity investment at risk lack any one of the following three characteristics: (i) the power, through voting rights or similar rights, to direct the activities of a legal entity that most significantly impact the entity's economic performance; (ii) the obligation to absorb the expected losses of the legal entity; or (iii) the right to receive the expected residual returns of the legal entity. Accordingly, entities issuing consolidated financial statements (i.e., a “reporting entity”) shall consolidate a VIE if the reporting entity has a “controlling financial interest” in the VIE, as demonstrated by the reporting entity having both (i) the power to direct the activities of a VIE that most significantly impact the VIE's economic performance; and (ii) the right to receive benefits from the VIE that could potentially be significant to the VIE or the obligation to absorb losses of the VIE that could potentially be significant to the VIE.
F-42
Report of Ernst & Young LLP
Independent Registered Public Accounting Firm
The Board of Directors and Stockholders
Jacobs Engineering Group Inc.
We have audited the accompanying consolidated balance sheets of Jacobs Engineering Group Inc. and subsidiaries as of September 26, 2014 and September 27, 2013, and the related consolidated statements of earnings, comprehensive income, stockholders' equity, and cash flows for each of the three fiscal years in the period ended September 26, 2014. These financial statements are the responsibility of the Company's management. Our responsibility is to express an opinion on these financial statements based on our audits.
We conducted our audits in accordance with the standards of the Public Company Accounting Oversight Board (United States). Those standards require that we plan and perform the audit to obtain reasonable assurance about whether the financial statements are free of material misstatement. An audit includes examining, on a test basis, evidence supporting the amounts and disclosures in the financial statements. An audit also includes assessing the accounting principles used and significant estimates made by management, as well as evaluating the overall financial statement presentation. We believe that our audits provide a reasonable basis for our opinion.
In our opinion, the financial statements referred to above present fairly, in all material respects, the consolidated financial position of Jacobs Engineering Group Inc. and subsidiaries at September 26, 2014 and September 27, 2013, and the consolidated results of their operations and their cash flows for each of the three fiscal years in the period ended September 26, 2014, in conformity with U.S. generally accepted accounting principles.
We also have audited, in accordance with the standards of the Public Company Accounting Oversight Board (United States), Jacobs Engineering Group Inc. and subsidiaries’ internal control over financial reporting as of September 26, 2014, based on criteria established in Internal Control-Integrated Framework issued by the Committee of Sponsoring Organizations of the Treadway Commission (1992 framework) and our report dated November 21, 2014 expressed an unqualified opinion thereon.
/S/ Ernst & Young LLP
Los Angeles, California
November 21, 2014
F-43
Report of Ernst & Young LLP
Independent Registered Public Accounting Firm
The Board of Directors and Stockholders
Jacobs Engineering Group Inc.
We have audited Jacobs Engineering Group Inc. and subsidiaries’ internal control over financial reporting as of September 26, 2014, based on criteria established in Internal Control-Integrated Framework issued by the Committee of Sponsoring Organizations of the Treadway Commission (1992 framework) (the COSO criteria). Jacobs Engineering Group Inc. and subsidiaries’ management is responsible for maintaining effective internal control over financial reporting, and for its assessment of the effectiveness of internal control over financial reporting included in the accompanying Management’s Annual Report on Internal Control over Financial Reporting. Our responsibility is to express an opinion on the company’s internal control over financial reporting based on our audit.
We conducted our audit in accordance with the standards of the Public Company Accounting Oversight Board (United States). Those standards require that we plan and perform the audit to obtain reasonable assurance about whether effective internal control over financial reporting was maintained in all material respects. Our audit included obtaining an understanding of internal control over financial reporting, assessing the risk that a material weakness exists, testing and evaluating the design and operating effectiveness of internal control based on the assessed risk, and performing such other procedures as we considered necessary in the circumstances. We believe that our audit provides a reasonable basis for our opinion.
A company’s internal control over financial reporting is a process designed to provide reasonable assurance regarding the reliability of financial reporting and the preparation of financial statements for external purposes in accordance with generally accepted accounting principles. A company’s internal control over financial reporting includes those policies and procedures that (1) pertain to the maintenance of records that, in reasonable detail, accurately and fairly reflect the transactions and dispositions of the assets of the company; (2) provide reasonable assurance that transactions are recorded as necessary to permit preparation of financial statements in accordance with generally accepted accounting principles, and that receipts and expenditures of the company are being made only in accordance with authorizations of management and directors of the company; and (3) provide reasonable assurance regarding prevention or timely detection of unauthorized acquisition, use, or disposition of the company’s assets that could have a material effect on the financial statements.
Because of its inherent limitations, internal control over financial reporting may not prevent or detect misstatements. Also, projections of any evaluation of effectiveness to future periods are subject to the risk that controls may become inadequate because of changes in conditions, or that the degree of compliance with the policies or procedures may deteriorate.
In our opinion, Jacobs Engineering Group Inc. and subsidiaries maintained, in all material respects, effective internal control over financial reporting as of September 26, 2014, based on the COSO criteria.
We also have audited, in accordance with the standards of the Public Company Accounting Oversight Board (United States), the consolidated balance sheets of Jacobs Engineering Group Inc. and subsidiaries as of September 26, 2014 and September 27, 2013 and the related consolidated statements of earnings, comprehensive income, stockholders’ equity, and cash flows for each of the three fiscal years in the period ended September 26, 2014 of Jacobs Engineering Group Inc. and subsidiaries and our report dated November 21, 2014 expressed an unqualified opinion thereon.
/S/ Ernst & Young LLP
Los Angeles, California
November 21, 2014
F-44