Attached files
| file | filename |
|---|---|
| 8-K - CURRENT REPORT - ASPIRITY HOLDINGS LLC | twincities_8k.htm |
Exhibit 99.1
| |
16233 Kenyon Ave, Suite 210 Lakeville MN 55044 952-241-3103 main · 952-898-3571 fax |
| November 14, 2014 | PRESS RELEASE |
TCPH Reports Financial Results for
2014’s Third Quarter and First Nine Months;
Revises Guidance for 2014
LAKEVILLE, MN – Twin Cities Power Holdings, LLC (“TCPH” or the “Company”) today announced its financial results for the third quarter and nine months ended September 30, 2014:
| · | Total revenues for Q3 2014 were $3,539,000 compared to $12,221,000 for the same period in 2013, a decrease of 71%. |
| o | For the nine months, revenues were $37,531,000, up 26% from $29,845,000 for the same period in 2013. |
| · | For Q3 2014, the operating loss totaled $5,502,000, down from operating income of $3,748,000 in Q3 2013. |
| o | For the nine months ended September 30, 2014, operating income was $4,352,000, down 32% from $6,394,000 for the same period in 2013. |
| · | The comprehensive loss for 2014’s third quarter totaled $5,873,000, down from income of $3,495,000 in the comparable period of 2013. |
| o | For the nine months, comprehensive income was $2,556,000, down 48% from $4,930,000 for the same period in 2013. |
| · | The ratio of earnings to fixed charges1 for the trailing 12 months ended September 30, 2014 was 0.71 times. |
| · | With respect to our balance sheet: |
| o | At September 30, 2014, our liquidity ratio (unrestricted cash, cash in trading accounts, and trade receivables divided by total assets) was 80.4% compared to 85.4% at December 31, 2013; |
| o | Our debt-to-total capital ratio (total debt divided by total debt plus equity) increased to 81.6% at September 30, 2014 from 68.2% at December 31, 2013; and |
| o | Our debt-to-equity ratio (total debt divided by total equity) increased to 4.45 times at September 30, 2014 compared to 2.14 times at December 31, 2013. |
| · | Based on management’s assessment of wholesale and retail electricity market conditions, we are revising our guidance that revenues for 2014 should be in a range of $45 to $55 million (down from $55 to $60 million) with operating income of $6 to $8 million (down from $10 to $13 million). |
“In Q1 2014, the sustained cold of the “polar vortex” and the exceptional volatility of the electricity markets represented very advantageous trading opportunities and we set revenue and profitability records. The average for the benchmark PJM West Hub peak price during the first quarter was $102.50/MWh with a standard deviation of $97.51 and a trading range of $37.15 to $655.75 – extremely favorable trading conditions. However, market conditions in the second and third quarters were not so favorable. PJM West Hub peak averaged $45.80/MWh with a standard deviation of $8.56 and a trading range of $30.97 to $80.65 – very lackluster”, said Tim Krieger, TCPH’s Chief Executive Officer.
_______________________
| 1 | As defined by the SEC, the ratio of earnings to fixed charges is "earnings" (the sum of income before taxes and fixed charges) divided by "fixed charges" equal to interest expense, one-third of operating lease rental expense to approximate interest, and amortization of deferred financing costs. |
| 1 |
| |
16233 Kenyon Ave, Suite 210 Lakeville MN 55044 952-241-3103 main · 952-898-3571 fax |
“Today, we settled the long-running FERC investigation into the activities of the three Canadian traders who were fired by the Company months before the investigation began for $3.6 million. While we take the full hit this quarter, the settlement will actually be paid out over about 4 years. At least the investigation is behind us and we can move on”, said Tim Krieger, TCPH’s Chief Executive Officer.
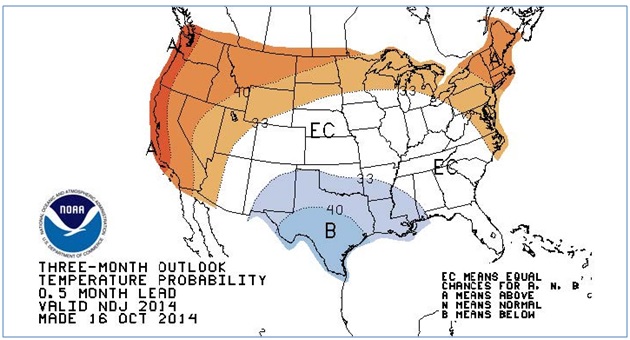
“The gas market as measured by the average Henry Hub price, while up 24% to $4.57/MCF during the first nine months of 2014 compared to last year’s average for the period of $3.69 and the 5 year average of $3.76, did not produce enough volatility to offset the mild weather in the second and third quarters. As shown below, the NOAA three month outlook dated October 16, 2014 calls for above normal temperatures for the rest of the year and January in our key northeastern markets, meaning that while we may see some occasional weather-driven trading opportunities, chances for such are not great”, said Tim Krieger, TCPH’s Chief Executive Officer.
"For the first nine months of 2014, as expected, our retail businesses saw increased account growth and reduced operating losses. While our profitability in the segment is not yet what we would like it to be, we are pleased with our account growth, particularly given the challenge of the polar vortex. We are now licensed in 8 of the 14 states with restructured markets and believe that there are significant growth opportunities for us in the segment”, concluded Mr. Krieger.
| 2 |
| |
16233 Kenyon Ave, Suite 210 Lakeville MN 55044 952-241-3103 main · 952-898-3571 fax |
About Twin Cities Power Holdings, LLC
Twin Cities Power Holdings, LLC is a Minnesota limited liability company that serves as a holding company and is headquartered at 16233 Kenyon Ave, Suite 210, Lakeville, MN 55044, telephone 952-241-3103. More information about the Company is available at www.twincitiespower.com.
The Company trades electricity for its own account in wholesale markets regulated by the Federal Energy Regulatory Commission as well as other energy-related derivative contracts on exchanges regulated by the Commodity Futures Trading Commission. The Company also holds retail electricity supplier licenses from the states of Connecticut, Maryland, Massachusetts, New Hampshire, New Jersey, Ohio, Pennsylvania, and Rhode Island. See www.townsquareenergy.com and www.discountenergygroup.com.
While the equity of TCPH is privately held, our Renewable Unsecured Subordinated Notes are registered with the SEC and may be purchased by residents of California, Colorado, Connecticut, Delaware, Florida, Georgia, Illinois, Indiana, Kansas, Michigan, Minnesota, Mississippi, Missouri, New Jersey, New Mexico, New York, South Dakota, Texas, Utah, Vermont, and Wisconsin. To obtain an investment kit, visit www.tcpnotes.com. To check our most recent interest rate offerings, visit www.sec.gov, select “Filings”, “Company Filings Search”, enter “Twin Cities Power” in the company name box, and click the Search button. Our most current interest rate offerings are found in the most recent Rule 424(b)(2) prospectus supplement filings.
Forward Looking Statements
This press release contains forward-looking statements. Forward-looking statements can be identified by words such as: "may", "will", "expect", "anticipate", "believe", "estimate" "continue", "predict", or other similar words making reference to future periods, including expectations of 2014 revenues and operating income. In addition, forward-looking statements include statements regarding our intent, belief, or current expectation about trends affecting the markets in which we participate, our businesses, financial condition, and growth strategies, among other things. Forward-looking statements are not guarantees of future performance and involve risks and uncertainties. Actual results may differ materially from those predicted in forward-looking statements as a result of various factors, including, but not limited to, those set forth in the "Risk Factors" sections of our filings with the Securities and Exchange Commission.
If any of the events described in these "Risk Factors" occur, they could have a material adverse effect on our business, financial condition, and results of operations. When considering forward-looking statements, you should keep these risk factors, as well as the other cautionary statements in our SEC filings, in mind. You should not place undue reliance on any forward-looking statement. We undertake no obligation to update or revise publicly any forward-looking statements, whether as a result of new information, future events, or otherwise after the date of this press release.
| 3 |
| |
16233 Kenyon Ave, Suite 210 Lakeville MN 55044 952-241-3103 main · 952-898-3571 fax |
Non-GAAP Financial Measures
TCPH’s press releases and other communications may include certain “non-GAAP financial measures”, defined as a numerical measure of a company's financial performance, financial position, or cash flows that excludes, or includes, amounts that are included in, or excluded from, the most directly comparable measure calculated and presented in accordance with GAAP in the company's financial statements.
Non-GAAP financial measures utilized by the Company include presentations of liquidity measures and debt-to-equity ratios. The Company’s management believes that these non-GAAP financial measures provide useful information and enables investors and analysts to more accurately compare the Company's ongoing financial performance over the periods presented.
Investor Relations Contact
Wiley H. Sharp III
VP - Finance & CFO, 952-241-3105
| 4 |
| |
16233 Kenyon Ave, Suite 210 Lakeville MN 55044 952-241-3103 main · 952-898-3571 fax |
| Twin Cities Power Holdings, LLC & Subsidiaries |
| Dollars in thousands | For & at 3 months ended Sep 30, | For & at 9 months ended Sep 30, | For & at year ended Dec 31, | |||||||||||||||||
| 2014 | 2013 | 2014 | 2013 | 2013 | ||||||||||||||||
| Statement of Operations Data | ||||||||||||||||||||
| Wholesale trading revenue | $ | 551 | $ | 9,946 | $ | 29,415 | $ | 24,535 | $ | 25,305 | ||||||||||
| Retail electricity revenue | 2,988 | 2,275 | 8,115 | 5,310 | 7,480 | |||||||||||||||
| Net revenue | 3,539 | 12,221 | 37,531 | 29,845 | 32,785 | |||||||||||||||
| Total costs of revenues & operations | 9,041 | 8,473 | 33,178 | 23,450 | 29,176 | |||||||||||||||
| Operating income (loss) | (5,502 | ) | 3,748 | 4,352 | 6,394 | 3,609 | ||||||||||||||
| Interest expense | (604 | ) | (381 | ) | (1,586 | ) | (1,090 | ) | (1,502 | ) | ||||||||||
| Interest income | 48 | 6 | 100 | 21 | 31 | |||||||||||||||
| Other income (expense), net | (76 | ) | 3 | (331 | ) | 3 | 2 | |||||||||||||
| Tax (provision) benefit | – | – | – | (9 | ) | (9 | ) | |||||||||||||
| Net income (loss) | (6,134 | ) | 3,375 | 2,535 | 5,320 | 2,131 | ||||||||||||||
| Preferred distributions | (137 | ) | (137 | ) | (412 | ) | (412 | ) | (549 | ) | ||||||||||
| Net income attributable to common | (6,271 | ) | 3,238 | 2,124 | 4,908 | 1,582 | ||||||||||||||
| Foreign currency translation adjustment | 142 | 28 | 360 | (132 | ) | (201 | ) | |||||||||||||
| Change in fair value of cash flow hedges | 321 | 229 | 78 | 154 | 439 | |||||||||||||||
| Unrealized gain on investment securities | (64 | ) | – | (6 | ) | – | 6 | |||||||||||||
| Comprehensive income (loss) | $ | (5,873 | ) | $ | 3,495 | $ | 2,556 | $ | 4,930 | $ | 1,826 | |||||||||
| Ratio of earnings to fixed charges, trailing 12 months | 0.71x | – | 2.26x | |||||||||||||||||
| Balance Sheet Data | ||||||||||||||||||||
| Cash - unrestricted | $ | 2,938 | $ | 9,014 | $ | 3,190 | ||||||||||||||
| Cash in trading accounts | 16,513 | 10,864 | 10,484 | |||||||||||||||||
| Trade receivables | 2,560 | 1,805 | 1,315 | |||||||||||||||||
| Other current assets | 501 | 328 | 639 | |||||||||||||||||
| Total current assets | 22,512 | 22,011 | 15,630 | |||||||||||||||||
| Prpoerty, equipment & furnishings, net | 781 | 503 | 504 | |||||||||||||||||
| Other assets, net | 4,095 | 745 | 1,428 | |||||||||||||||||
| Total assets | $ | 27,388 | $ | 23,259 | $ | 17,562 | ||||||||||||||
| Current debt | $ | 7,508 | $ | 4,103 | $ | 5,123 | ||||||||||||||
| Trade payables | 1,660 | 1,365 | 1,036 | |||||||||||||||||
| Accrued expenses | 2,034 | 4,066 | 1,343 | |||||||||||||||||
| Other current liabilities | 951 | 250 | 250 | |||||||||||||||||
| Total current liabilities | 12,153 | 9,784 | 7,751 | |||||||||||||||||
| Long term debt | 8,840 | 4,257 | 5,062 | |||||||||||||||||
| Other liabilities | 2,718 | 62 | – | |||||||||||||||||
| Total liabilities | 23,710 | 14,103 | 12,813 | |||||||||||||||||
| Series A preferred equity | 2,745 | 2,745 | 2,745 | |||||||||||||||||
| Common equity | (200 | ) | 5,932 | 1,303 | ||||||||||||||||
| Accumulated comprehensive income | 1,133 | 479 | 700 | |||||||||||||||||
| Total equity | 3,678 | 9,156 | 4,748 | |||||||||||||||||
| Total liabilities & equity | $ | 27,388 | $ | 23,259 | $ | 17,562 | ||||||||||||||
| Liquidity, percent of total assets | 80.4% | 93.2% | 85.4% | |||||||||||||||||
| Debt to total capital ratio | 81.6% | 47.7% | 68.2% | |||||||||||||||||
| Debt to equity ratio | 4.45x | 0.91x | 2.14x | |||||||||||||||||
| 5 |
| |
16233 Kenyon Ave, Suite 210 Lakeville MN 55044 952-241-3103 main · 952-898-3571 fax |
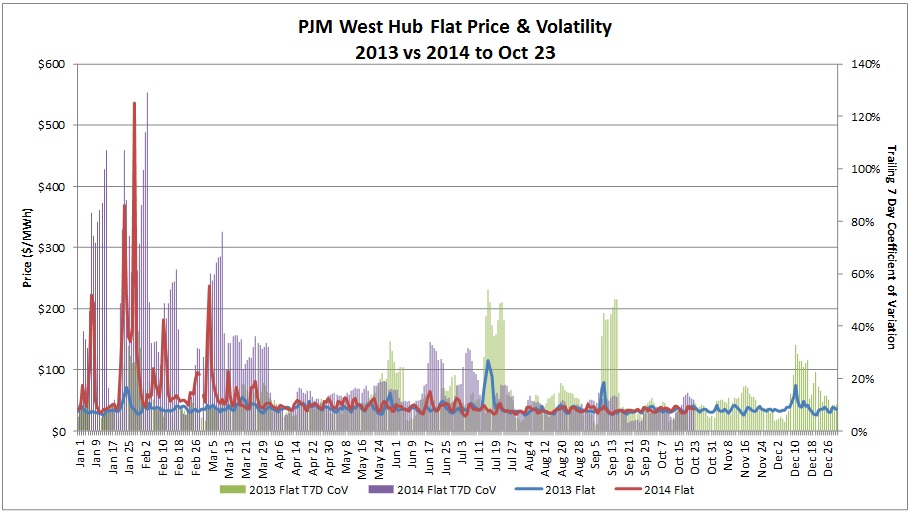
This chart shows the level and volatility of PJM West Hub day-ahead power prices for all of 2013 and for 2014 on a year to date basis. Our trading revenues generally correspond to weather- and gas driven volatility or lack thereof. Other factors come into play as well, which might cause revenues to correlate less directly to volatility. Among others, these factors include the size and nature of the trades we may or may not have in place when and if the market moves, as well as the duration of profitable trading opportunities. As you can see, price and volatility levels increased in Q1 2014 compared to 2013 and have settled down since then.
| 6 |