Attached files
| file | filename |
|---|---|
| EXCEL - IDEA: XBRL DOCUMENT - ASPIRITY HOLDINGS LLC | Financial_Report.xls |
| EX-31.2 - CERTIFICATION - ASPIRITY HOLDINGS LLC | tcph_10q-ex3102.htm |
| EX-31.1 - CERTIFICATION - ASPIRITY HOLDINGS LLC | tcph_10q-ex3101.htm |
| EX-32.1 - CERTIFICATION - ASPIRITY HOLDINGS LLC | tcph_10q-ex3201.htm |
UNITED STATES OF AMERICA
SECURITIES AND EXCHANGE COMMISSION
Washington, DC 20549
FORM 10-Q
| x | QUARTERLY REPORT PURSUANT TO SECTION 13 OR 15(d) OF THE SECURITIES EXCHANGE ACT OF 1934 |
FOR THE QUARTERLY PERIOD ENDED SEPTEMBER 30, 2014
or
| o | TRANSITION REPORT PURSUANT TO SECTION 13 OR 15(d) OF THE SECURITIES EXCHANGE ACT OF 1934 |
For the Transition Period from __ to __
Commission File Number: 333-179460
Twin Cities Power Holdings, LLC
(Exact name of registrant as specified in its charter)
| Minnesota | 6221 – Commodity Contracts Brokers and Dealers | 27-1658449 | ||
| (State of organization) | (Primary Standard Industrial Classification Code Number) | (IRS Employer Identification Number) |
|
16233 Kenyon Avenue, Suite 210 Lakeville, Minnesota 55044 |
||
| (Address of principal executive offices, zip code) | ||
| (952) 241-3103 | ||
| (Registrant’s telephone number, including area code) | ||
| not applicable | ||
| (Former name, former address and former fiscal year, if changed since last report) |
_________________________________________________________
Indicate by check mark whether the registrant (1) has filed all reports required to be filed by Section 13 or 15(d) of the Securities Exchange Act of 1934 during the preceding 12 months (or for such shorter period that the registrant was required to file such reports), and (2) has been subject to such filing requirements for the past 90 days. Yes x No o
Indicate by check mark whether the registrant has submitted electronically and posted on its corporate web site, if any, every Interactive Data File required to be submitted and posted pursuant to Rule 405 of Regulation S T (§232.405 of this chapter) during the preceding 12 months (or for such shorter period that the registrant was required to submit and post such files). Yes x No o
Indicate by check mark whether the registrant is a large accelerated filer, an accelerated filer, a non-accelerated filer, or smaller reporting company. See definition of “large accelerated filer”, “accelerated filer”, and “smaller reporting company” in Rule 12b-2 of the Exchange Act. (Check one):
| Large accelerated filer o | Accelerated filer o | Non-accelerated filer o | Smaller reporting company x |
Indicate by check mark whether the registrant is a shell company (as defined in Rule 12b-2 of the Exchange Act). Yes o No x
| TABLE OF CONTENTS | |
| Definitions | 3 |
| Forward Looking Statements | 8 |
| Non-GAAP Financial Measures | 9 |
| Part I – Financial Information | 10 |
| Item 1 - Financial Statements (Unaudited) | 10 |
| Consolidated Balance Sheets | 10 |
| Consolidated Statements of Comprehensive Income | 11 |
| Consolidated Statements of Cash Flows | 12 |
| Notes to Consolidated Financial Statements | 14 |
| Item 2 - Management’s Discussion and Analysis of Financial Condition and Results of Operations | 38 |
| Industry Background | 38 |
| Company Overview | 43 |
| Results of Operations | 47 |
| Liquidity, Capital Resources, and Cash Flow | 55 |
| Financing | 57 |
| Non-GAAP Financial Measures | 59 |
| Critical Accounting Policies and Estimates | 59 |
| Item 3 - Quantitative and Qualitative Disclosures about Market Risk | 61 |
| Commodity Price Risk | 61 |
| Interest Rate Risk | 62 |
| Liquidity Risk | 63 |
| Wholesale Counterparty Credit Risk | 63 |
| Retail Customer Credit Risk | 63 |
| Foreign Exchange Risk | 63 |
| Item 4 - Controls and Procedures | 64 |
| Part II – Other Information | 65 |
| Item 1 - Legal Proceedings | 65 |
| Item 1A - Risk Factors | 65 |
| Item 2 - Unregistered Sales of Equity Securities and Use of Proceeds | 65 |
| Item 3 - Defaults Upon Senior Securities | 65 |
| Item 4 - Mine Safety Disclosures | 65 |
| Item 5 - Other Information | 65 |
| Item 6 - Exhibits | 66 |
| Signatures | 67 |
| 2 |
Definitions
| Abbreviation or acronym | Definition | |
| ABN AMRO | ABN AMRO Clearing Chicago, LLC and ABN AMRO Clearing Bank, N.V. | |
| AESO | Alberta Electric System Operator, a statutory corporation of the Province of Alberta, is an ISO serving the Alberta Interconnected Electric System | |
| ASC | Accounting Standards Codification | |
| ASU | Accounting Standards Update | |
| BLS | Bureau of Labor Statistics, an agency within the U.S. Department of Labor | |
| Btu; therm; MMBtu | A “Btu” or British thermal unit is a measure of thermal energy or the amount of heat needed to raise the temperature of one pound of water from 39°F to 40°F. A “therm” is one hundred thousand Btu. One “MMBtu” is one million Btu. | |
| C$ | Canadian dollars | |
| CEF | Cygnus Energy Futures, LLC, a wholly-owned subsidiary of CP and a second-tier subsidiary of the Company | |
| CFTC | Commodity Futures Trading Commission, an independent agency of the United States government that regulates futures and option markets | |
| CLP | Connecticut Light & Power Company, an EDC in Connecticut | |
| CME | CME Group Inc. operates the CME (Chicago Mercantile Exchange), CBOT (Chicago Board of Trade), NYMEX (New York Mercantile Exchange), and COMEX (Commodities Exchange) derivatives exchanges and also offers certain cleared OTC products and services | |
| Company | TCPH and its subsidiaries | |
| CoV | Abbreviates the coefficient of variation, a simple measure of volatility useful for comparing two or more data series; equal to the standard deviation divided by the mean | |
| CP | Cygnus Partners, LLC, a first-tier subsidiary of the Company | |
| CP&U | Community Power & Utility, LLC, an electricity retailer acquired by TCP on June 29, 2012 | |
| CSE | Comparison shopping engine, a web site that compares prices for specific products. While most comparison shopping engines do not offer the products or services themselves, some may earn commissions when users follow the links in the search results and make a purchase from an online vendor | |
| CTG | Chesapeake Trading Group, LLC, a wholly-owned subsidiary of TCP and a second-tier subsidiary of the Company | |
| DEG | Discount Energy Group, LLC, a wholly-owned subsidiary of REH and a second-tier subsidiary of the Company, effective January 2, 2014 |
| 3 |
| Abbreviation or acronym | Definition | |
| Degree-days; CDD; HDD |
A “degree-day” compares outdoor temperatures to a standard of 65°F. Hot days require energy for cooling and are measured in cooling degree-days or “CDD” while cold days require energy for heating and are measured in heating degree-days or “HDD”. For example, a day with a mean temperature of 80°F would result in 15 CDD and a day with a mean temperature of 40°F would result in 25 HDD.
If heating degree-days are less than the average for an area for a period, the weather was “warmer than normal”; if they were greater, it was “colder than normal”. The converse is true for cooling degree-days - if CDD are less than the average for an area for a period, the weather was “colder than normal”; if they were greater, it was “warmer than normal”. | |
| DOE | U.S. Department of Energy | |
| EDC | Electric distribution company | |
| EIA | Energy Information Administration, an independent agency within DOE | |
| ERCOT | Electric Reliability Council of Texas, an ISO managing 85% of the electric Load of Texas and subject to oversight by the Public Utility Commission of Texas and the Texas Legislature but not FERC | |
| FASB | Financial Accounting Standards Board | |
| FERC | Federal Energy Regulatory Commission, an independent regulatory agency within DOE | |
| Form S-1 | The Company’s Registration Statement on Form S-1, declared effective by the Securities and Exchange Commission on May 10, 2012 with respect to the Company’s Notes Offering | |
| FTR | Financial Transmission Rights are financial instruments traded in certain ISOs and RTOs that entitle their holders to receive or pay charges based on congestion price differences in the day-ahead energy market across specific transmission paths. The value of an FTR reflects the difference in congestion prices rather than the difference in locational marginal prices, which includes energy, congestion, and marginal losses. Market participants may request FTRs between any pricing nodes on the system, including hubs, control zones, aggregates, generator buses, load buses and interface pricing points. FTRs are generally available to the nearest 0.1 MW. The FTR target allocation is calculated hourly and is equal to the product of the FTR MW and the congestion price difference between sink and source that occurs in the day-ahead energy market. The value of an FTR can be positive or negative depending on the sink minus source congestion price difference, with a negative difference resulting in a liability for the holder. | |
| GAAP | Generally accepted accounting principles in the United States | |
| ICE | IntercontinentalExchange Group, Inc. operates a network of 17 regulated exchanges and 6 clearinghouses for financial and commodity markets in the U.S., Canada, Europe, and Asia. In November 2013, ICE completed the acquisition of NYSE Euronext. | |
| INC and DEC | An increment offer or “INC” is an offer in the day-ahead market to sell energy at a specified source bus. An INC will clear if the LMP at the bus equals or exceeds the offer price. A decrement bid or “DEC” is a bid in the day-ahead market to purchase energy at a specified sink bus. A DEC will clear if the LMP at the bus does not exceed the bid price. |
| 4 |
| Abbreviation or acronym | Definition | |
| ISO; RTO | Independent System Operator, a non-profit organization formed at the direction or recommendation of FERC that coordinates, controls, and monitors the operation of a bulk electric power system, usually within a single U.S. state, but sometimes encompassing multiple states. A Regional Transmission Organization (“RTO”) typically performs the same functions as an ISO, but covers a larger area. ISOs and RTOs may also operate centrally cleared wholesale markets for electric power quoted on both a “real-time” and “day ahead” basis. | |
| ISO-NE | ISO New England Inc., an RTO serving Connecticut, Maine, Massachusetts, New Hampshire, Rhode Island, and Vermont | |
| LMP | One of the unique aspects of ISO electricity markets is the availability of “locational marginal prices” (“LMPs”). The theoretical price of electricity at each node on the network is calculated based on the assumptions that: (1) one additional megawatt-hour of energy is demanded at the node in question; and (2) the marginal cost to the system that would result from the re-dispatch of available generating units to serve such load can establish the production cost of the additional energy. LMPs are typically quoted on a “real-time” and “day-ahead” basis. In the real-time market, prices at specific nodes are updated every 5 minutes based on current and targeted supply and demand. Day-ahead prices are for power to be delivered at a specified hour and transmission point during the next day. LMPs vary by time and location due to physical system limitations, congestion, and loss factors; however, in an unconstrained system with no losses, all LMPs would be equal. This means that LMPs can be conceptually separated into three components - an energy price, a congestion component, and a loss component. | |
| MCA | The Company’s Member Control Agreement, as amended | |
| MEF | Minotaur Energy Futures, LLC, a wholly-owned subsidiary of TCP and a second-tier subsidiary of the Company | |
| MISO | Midcontinent Independent System Operator, Inc., (formerly the Midwest Independent Transmission System Operator, Inc.), an RTO serving all or part of Arkansas, Illinois, Indiana, Iowa, Louisiana, Manitoba, Michigan, Minnesota, Mississippi, Missouri, Montana, North Dakota, South Dakota, Texas, and Wisconsin | |
| MCF | One thousand cubic feet, a common unit of price measure for natural gas. In 2010, one MCF of natural gas had a heat content of 1,025 Btu. | |
| NERC | North American Electric Reliability Corporation, a non-profit corporation formed on March 28, 2006 as the successor to the National Electric Reliability Council, also known as NERC, formed in 1968. NERC is the designated Electric Reliability Organization (“ERO”) for the U.S. and operates under the auspices of FERC. | |
| NGX | Natural Gas Exchange Inc., headquartered in Calgary, Alberta provides electronic trading, central counterparty clearing, and data services to the North American natural gas and electricity markets. NGX is wholly owned by TMX Group Inc. which collectively manages all aspects of Canada’s senior and junior equity markets. | |
| NOAA | National Oceanic and Atmospheric Administration, an agency of the U.S. Department of Commerce |
| 5 |
| Abbreviation or acronym | Definition | |
| Notes | The Company’s Renewable Unsecured Subordinated Notes issued pursuant to its ongoing Notes Offering | |
| Notes Offering | The direct public offering the Company’s Notes pursuant to a registration statement on Form S-1 declared effective by the SEC on May 10, 2012 | |
| NRSRO | A SEC-recognized Nationally Recognized Statistical Rating Organization; The major NRSROs that rate utilities are Standard & Poor’s Financial Services LLC (“S&P”), Moody’s Investor Services, Inc. (“Moody’s”), and Fitch Ratings Inc. (“Fitch”) | |
| NYISO | New York Independent System Operator, an ISO serving New York state | |
| OTC | Over-the-counter | |
| PJM | PJM Interconnection, a RTO serving all or part of Delaware, Illinois, Indiana, Kentucky, Maryland, Michigan, New Jersey, North Carolina, Ohio, Pennsylvania, Tennessee, Virginia, West Virginia, and the District of Columbia. | |
| POR; non-POR | All states with restructured retail markets have implemented laws and regulations with respect to permitted billing, credit, and collections practices. Some of these states require an EDC billing customers in their service territory on behalf of suppliers operating there to purchase the receivables generated as a result of energy sales, generally at a modest discount to reflect bad debt experience. These states are known as “purchase of receivables” or “POR” jurisdictions while those without this provision are known as “non-POR” areas. | |
| PURPA | Public Utilities Regulatory Policy Act of 1978 | |
| RECs | Renewable energy certificates represent the property rights to the environmental, social, and other non-power qualities of renewable electricity generation and can be sold separately from the underlying physical electricity. | |
| REH | Retail Energy Holdings, LLC, a first-tier subsidiary of the Company | |
| SEC | U.S. Securities and Exchange Commission, an independent agency of the United States government with primary responsibility for enforcing federal securities laws and regulating the securities industry and stock exchanges | |
| SUM | Summit Energy, LLC, a wholly-owned subsidiary of TCP and a second-tier subsidiary of the Company | |
| TCE | Twin Cities Energy, LLC, an inactive first-tier subsidiary of the Company | |
| TCP | Twin Cities Power, LLC, a first-tier subsidiary of the Company | |
| TCPC | Twin Cities Power – Canada, Ltd., an inactive wholly-owned subsidiary of TCE and a second-tier subsidiary of the Company | |
| TCPH | Twin Cities Power Holdings, LLC | |
| TSE | Town Square Energy, initially, an accounting division of TCP resulting from the acquisition of the business and assets of CP&U. Effective June 1, 2013, TSE became a wholly-owned first-tier subsidiary of the Company and on October 25, 2013, it became a wholly owned subsidiary of REH and a second-tier subsidiary of TCPH | |
| UI | The United Illuminating Company, an EDC in Connecticut | |
| UTC | In an up-to-congestion or “UTC” transaction, a day-ahead market participant offers to inject energy at a specified source and simultaneously withdraw the same quantity at a specific sink at a maximum bid price difference between the two locations. The transaction will clear if the price differential between sink and source does not exceed the bid price. |
| 6 |
| Abbreviation or acronym | Definition | |
| VaR |
Value-at-Risk is a measure of the risk of loss on a specific portfolio of financial assets. For a given portfolio, probability, and time horizon, VaR is the value at which the probability that a mark-to-market loss over the given time horizon exceeds the calculated value, assuming normal markets and no trading. For example, if a portfolio has a one-day, 5% VaR of $1 million, there is a 5% probability that the portfolio will fall in value by more than $1 million over a one-day period.
| |
| Watt (W); Watt-hour (Wh) | Although in everyday usage, the terms “energy” and “power” are essentially synonyms, scientists, engineers, and the energy business distinguish between them. Technically, energy is the ability to do work, or move a mass a particular distance by the application of force while power is the rate at which energy is generated or consumed.
In the case of electricity, power is measured in watts (W) and is equal to voltage or the difference in charge between two points multiplied by amperage or the current or rate of electrical flow. The energy supplied or consumed by a circuit is measured in watt-hours (Wh). For example, when a light bulb with a power rating of 100W is turned on for one hour, the energy used is 100 watt-hours. This same amount of energy would light a 40-watt bulb for 2.5 hours or a 50-watt bulb for 2.0 hours. Multiples of watts and watt-hours are measured using International Systems of Units (“SI”) conventions. For example: |
| Prefix | Symbol | Multiple (Number) | Value |
| kilo | k | one thousand (1,000) | 103 |
| mega | M | one million (1,000,000) | 106 |
| giga | G | one billion (1,000,000,000) | 109 |
| tera | T | one trillion (1,000,000,000,000) | 1012 |
|
Kilowatt (kW) or kilowatt-hour (kWh): one thousand watts or watt-hours. Kilowatt-hours are typically used to measure residential energy consumption and retail prices. One kWh is equal to 3,412 Btu, but fuel with a heat content of 7,000 to 11,500 Btu must be consumed to generate and deliver one kWh of electricity.
Megawatt (MW) or megawatt-hour (MWh): one million watts or watt-hours or one thousand kilowatts or kilowatt-hours. Megawatts are typically used to measure electrical generation capacity and megawatt-hours are the pricing units used in the wholesale electricity market. |
| 7 |
Forward Looking Statements
Readers are urged to carefully review and consider the various disclosures made by us in this Form 10-Q and in our other reports filed with the SEC that attempt to advise interested parties of the factors that may affect our business.
Statements in this report that are not statements of historical facts may be considered “forward-looking” and, accordingly, involve risks and uncertainties that could cause actual results to differ materially from those discussed. Although such forward-looking statements have been made in good faith and are based on reasonable assumptions, there is no assurance that the expected results will be achieved. Any statements that express, or involve discussions as to, future expectations, risks, beliefs, plans, objectives, assumptions, events, uncertainties, financial performance, or growth strategies, often, but not always, through the use of words or phrases such as “anticipates”, “believes”, “estimates”, “expects”, “intends”, “plans”, “projects”, “likely”, “will continue”, “could”, “may”, “potential”, “target”, “outlook”, or words of similar meaning are not statements of historical facts and may be forward-looking.
In connection with the safe harbor provisions of the Private Securities Litigation Reform Act of 1995, we are providing this cautionary statement to identify important factors that could cause our actual results to differ materially from those indicated in forward-looking statements made by or on behalf of the Company in this Form 10-Q, in presentations, on our website, in response to questions, or otherwise. You should not place undue reliance on any forward-looking statement. Examples of forward-looking statements include, among others, statements we make regarding:
| · | Expected operating results, such as revenue growth and earnings; |
| · | Anticipated levels of capital expenditures and expansion of our retail electricity business segment; |
| · | Current or future price volatility in the energy markets and future market conditions; |
| · | Our belief that we have sufficient liquidity to fund our operations during the next 12 months; |
| · | Expectations of the effect on our financial condition of claims, litigation, environmental costs, contingent liabilities, and governmental and regulatory investigations and proceedings; |
| · | Our strategies for risk management; and |
| · | Any other risk factors listed from time to time by the Company in reports filed with the Securities and Exchange Commission |
Additional disclosures regarding factors that could cause our results and performance to differ from results or performance anticipated by this report are discussed under the heading “Item 1A – Risk Factors” of our Form 10-K for 2013 (the “2013 Form 10-K”), the “Risk Factors” section beginning on page 10 of our Form S-1, and various places in this report on Form 10-Q, including without limitation Part I, Item 3, and any assumptions and other factors referred to specifically in connection with such forward-looking statements that could cause our actual results to differ materially from those indicated in the forward-looking statements.
| 8 |
Any forward-looking statement speaks only as of the date on which such statement is made, and we undertake no obligation to update any forward-looking statement to reflect events or circumstances after the date on which that statement is made or to reflect the occurrence of unanticipated events. New factors emerge from time to time, and it is not possible for management to predict all of these factors, nor can it assess the impact of each of these factors on the businesses of the Company or the extent to which any factor, or combination of factors, may cause actual results to differ materially from those contained in any forward-looking statement.
Non-GAAP Financial Measures
The Company’s communications may include certain non- GAAP financial measures. A “non-GAAP financial measure” is defined as a numerical measure of a company's financial performance, financial position, or cash flows that excludes, or includes, amounts that are included in, or excluded from, the most directly comparable measure calculated and presented in accordance with GAAP in the company's financial statements.
Non-GAAP financial measures utilized by the Company include presentations of liquidity measures and debt-to-equity ratios. The Company’s management believes that these non-GAAP financial measures provide useful information to investors and enable investors and analysts to more accurately compare the Company's ongoing financial performance over the periods presented.
| 9 |
Part I – Financial Information
Item 1 - Financial Statements (Unaudited)
Twin Cities Power Holdings, LLC and Subsidiaries
Consolidated Balance Sheets
As of September 30, 2014 and December 31, 2013
| September 30, | December 31, | |||||||
| 2014 | 2013 | |||||||
| Assets | Unaudited | |||||||
| Current assets | ||||||||
| Cash - unrestricted | $ | 2,937,711 | $ | 3,190,495 | ||||
| Cash in trading accounts | 16,513,373 | 10,484,448 | ||||||
| Accounts receivable - trade | 2,559,630 | 1,315,209 | ||||||
| Note receivable | – | 140,964 | ||||||
| Marketable securities | – | 256,004 | ||||||
| Prepaid expenses and other current assets | 501,485 | 242,482 | ||||||
| Total current assets | 22,512,199 | 15,629,602 | ||||||
| Property, equipment, and furniture, net | 780,608 | 504,298 | ||||||
| Other assets | ||||||||
| Intangible assets, net | 408,696 | 305,978 | ||||||
| Deferred financing costs, net | 248,737 | 337,559 | ||||||
| Cash - restricted | 1,319,371 | 320,188 | ||||||
| Land held for development | 551,990 | 110,477 | ||||||
| Mortgage note receivable | – | 353,504 | ||||||
| Investment in convertible notes | 1,566,545 | – | ||||||
| Total assets | $ | 27,388,146 | $ | 17,561,606 | ||||
| Liabilities and Members' Equity | ||||||||
| Current liabilities | ||||||||
| Current portions of total debt | ||||||||
| Senior notes payable | $ | 7,032 | $ | 200,000 | ||||
| Renewable unsecured subordinated notes | 7,501,338 | 4,922,596 | ||||||
| Accounts payable - trade | 1,659,730 | 1,035,644 | ||||||
| Accrued expenses | 498,708 | 683,556 | ||||||
| Accrued compensation | 844,804 | 299,439 | ||||||
| Accrued interest | 690,797 | 359,758 | ||||||
Obligations under settlement agreement | 888,228 | – | ||||||
| Obligations under non-competition agreement | 62,500 | 250,000 | ||||||
| Total current liabilities | 12,153,137 | 7,750,993 | ||||||
| Long-term debt | ||||||||
| Senior notes payable | 219,262 | – | ||||||
| Obligations under settlement agreement | 2,717,596 | – | ||||||
| Renewable unsecured subordinated notes | 8,620,448 | 5,062,230 | ||||||
| Total liabilities | 23,710,443 | 12,813,223 | ||||||
| Commitments and contingencies | ||||||||
| Members' equity | ||||||||
| Series A preferred equity | 2,745,000 | 2,745,000 | ||||||
| Common equity | (200,100 | ) | 1,302,994 | |||||
| Accumulated other comprehensive income | 1,132,803 | 700,389 | ||||||
| Total members' equity | 3,677,703 | 4,748,383 | ||||||
| Total liabilities and members' equity | $ | 27,388,146 | $ | 17,561,606 | ||||
See notes to consolidated financial statements.
| 10 |
Twin Cities Power Holdings, LLC and Subsidiaries
Consolidated Statements of Comprehensive Income
Three and Nine Months ended September 30, 2014 and 2013
| Three Months | Nine Months | |||||||||||||||
| Ended September 30, | Ended September 30, | |||||||||||||||
| 2014 | 2013 | 2014 | 2013 | |||||||||||||
| Unaudited | Unaudited | Unaudited | Unaudited | |||||||||||||
| Revenue | ||||||||||||||||
| Wholesale trading revenue, net | $ | 550,968 | $ | 9,945,697 | $ | 29,415,492 | $ | 24,534,563 | ||||||||
| Retail electricity revenue. | 2,988,460 | 2,274,917 | 8,115,008 | 5,310,275 | ||||||||||||
| 3,539,428 | 12,220,614 | 37,530,500 | 29,844,838 | |||||||||||||
| Costs and expenses | ||||||||||||||||
| Cost of retail electricity sold | 2,629,531 | 2,218,996 | 8,896,838 | 5,501,298 | ||||||||||||
| Retail sales and marketing | 40,622 | 36 | 192,017 | 461 | ||||||||||||
| Compensation and benefits | 1,555,862 | 4,793,152 | 14,479,003 | 11,171,553 | ||||||||||||
| Professional fees | 988,698 | 458,408 | 3,486,894 | 3,958,240 | ||||||||||||
| Other general and administrative | 3,450,572 | 779,617 | 5,118,443 | 2,111,088 | ||||||||||||
| Trading tools and subscriptions | 375,705 | 221,841 | 1,005,126 | 707,808 | ||||||||||||
| 9,040,990 | 8,472,050 | 33,178,321 | 23,450,448 | |||||||||||||
| Operating income (loss) | (5,501,562 | ) | 3,748,564 | 4,352,179 | 6,394,390 | |||||||||||
| Other income (expense) | ||||||||||||||||
| Interest expense | (604,063 | ) | (381,364 | ) | (1,586,340 | ) | (1,089,897 | ) | ||||||||
| Interest income | 47,899 | 5,765 | 100,433 | 21,464 | ||||||||||||
| Gain (loss) on foreign currency exchange | (141,648 | ) | 3,360 | (402,497 | ) | 3,033 | ||||||||||
| Realized gain on sale of marketable securities | 62,707 | – | 65,655 | – | ||||||||||||
| Other income | 2,690 | – | 6,010 | – | ||||||||||||
| (632,415 | ) | (372,239 | ) | (1,816,739 | ) | (1,065,400 | ) | |||||||||
| Income (Loss) before income taxes | (6,133,977 | ) | 3,376,325 | 2,535,440 | 5,328,990 | |||||||||||
| Income tax provision | – | – | – | 8,823 | ||||||||||||
| Net income (loss) | (6,133,977 | ) | 3,376,325 | 2,535,440 | 5,320,167 | |||||||||||
| Preferred distributions | (137,268 | ) | (137,268 | ) | (411,804 | ) | (411,768 | ) | ||||||||
| Net income (loss) attributable to common | (6,271,245 | ) | 3,239,057 | 2,123,636 | 4,908,399 | |||||||||||
| Other comprehensive income (loss) | ||||||||||||||||
| Foreign currency translation adjustment | 141,730 | 28,546 | 359,858 | (132,254 | ) | |||||||||||
| Change in fair value of cash flow hedges | 320,739 | 228,688 | 78,323 | 154,288 | ||||||||||||
| Unrealized gain on marketable securities | (63,903 | ) | – | (5,767 | ) | – | ||||||||||
| Comprehensive income (loss) | $ | (5,872,679 | ) | $ | 3,496,291 | $ | 2,556,050 | $ | 4,930,433 | |||||||
See notes to consolidated financial statements.
| 11 |
Twin Cities Power Holdings, LLC and Subsidiaries
Consolidated Statements of Cash Flows
Nine Months Ended September 30, 2014 and 2013
| Nine Months | ||||||||
| Ended September 30, | ||||||||
| 2014 | 2013 | |||||||
| Unaudited | Unaudited | |||||||
| Cash flows from operating activities | ||||||||
| Net income | $ | 2,535,440 | $ | 5,320,167 | ||||
| Adjustments to reconcile net income to net cash provided by operating activities: | ||||||||
| Loss on settlement agreement | 3,605,824 | – | ||||||
| Depreciation and amortization | 645,463 | 411,248 | ||||||
| Gain on sale of marketable securities | (65,655 | ) | – | |||||
| Loss on sale of property, equipment, and furniture | – | 2,477 | ||||||
| (Increase) decrease in: | ||||||||
| Cash in trading accounts | (5,759,534 | ) | 1,352,731 | |||||
| Accounts receivable - trade | (1,244,420 | ) | 386,308 | |||||
| Prepaid expenses and other assets | (156,204 | ) | (138,899 | ) | ||||
| Increase (decrease) in: | ||||||||
| Accounts payable - trade | 624,086 | (104,096 | ) | |||||
| Accrued expenses | (328,158 | ) | 456,862 | |||||
| Accrued compensation | 545,365 | 1,337,384 | ||||||
| Accrued interest | 331,039 | 172,543 | ||||||
| Net cash provided by operating activities | 733,246 | 9,196,725 | ||||||
| Cash flows from investing activities | ||||||||
| Repayment of note receivable | 140,964 | – | ||||||
| Purchase of marketable securities | (913,534 | ) | – | |||||
| Proceeds from the sale of marketable securities | 1,229,426 | – | ||||||
| Purchase of investment in convertible notes | (1,566,545 | ) | – | |||||
| Purchase of property, equipment and furniture | (178,210 | ) | (76,196 | ) | ||||
| Increase in cost of land held for development | (88,009 | ) | – | |||||
| Increase in restricted cash | (999,183 | ) | – | |||||
| Payments on obligations under non-competition agreement | (187,501 | ) | (187,500 | ) | ||||
| Acquisition of Discount Energy Group, LLC | (680,017 | ) | – | |||||
| Net cash used in investing activities | (3,242,609 | ) | (263,696 | ) | ||||
| Cash flows from financing activities | ||||||||
| Proceeds from line of credit | 700,000 | – | ||||||
| Payments to line of credit | (700,000 | ) | – | |||||
| Payments on senior notes payable | (201,705 | ) | (4,066,927 | ) | ||||
| Renewable unsecured subordinated notes: | ||||||||
| Issuances | 6,899,777 | 6,448,599 | ||||||
| Redemptions | (762,817 | ) | (302,164 | ) | ||||
| Distributions - preferred | (411,804 | ) | (427,635 | ) | ||||
| Distributions - common | (3,626,730 | ) | (2,173,511 | ) | ||||
| Net cash provided by (used in) financing activities | 1,896,721 | (521,638 | ) | |||||
| Net increase (decrease) in cash | (612,642 | ) | 8,411,391 | |||||
| Effect of exchange rate changes on cash | 359,858 | (169,681 | ) | |||||
| Cash - unrestricted | ||||||||
| Beginning of period | 3,190,495 | 771,852 | ||||||
| End of period | $ | 2,937,711 | $ | 9,013,562 | ||||
See notes to consolidated financial statements.
| 12 |
Twin Cities Power Holdings, LLC and Subsidiaries
Consolidated Statements of Cash Flows (Continued)
Nine Months Ended September 30, 2014 and 2013
| Nine Months | ||||||||
| Ended September 30, | ||||||||
| 2014 | 2013 | |||||||
| Unaudited | Unaudited | |||||||
| Non-cash investing and financing activities: | ||||||||
| Effective portion of cash flow hedges | $ | 434,937 | $ | 72,256 | ||||
| Obligations under non-competition agreement | $ | – | $ | 500,000 | ||||
| Series A preferred units issued in exchange for redeemable preferred units | $ | – | $ | 2,745,000 | ||||
| Land held for development obtained via foreclosure on mortgage loan | $ | 353,504 | $ | – | ||||
| Acquisition of property, equipment, and furniture via mortgage loan | $ | 228,000 | $ | – | ||||
| Supplemental disclosures of cash flow information: | ||||||||
| Cash payments for interest | $ | 1,255,301 | $ | 917,354 | ||||
See notes to consolidated financial statements.
| 13 |
Twin Cities Power Holdings, LLC and Subsidiaries
Notes to Consolidated Financial Statements
| 1. | Basis of Presentation and Description of Business |
Basis of Presentation
Twin Cities Power Holdings, LLC (“TCPH” or the “Company”) has prepared the foregoing unaudited consolidated financial statements in accordance with GAAP and the requirements of the SEC with respect to interim reporting. As permitted under these rules, certain footnotes and other financial information required by GAAP for complete financial statements have been condensed or omitted. The interim consolidated financial statements include all normal and recurring adjustments that are necessary for a fair presentation of our financial position and operating results and include the accounts of TCPH and its subsidiaries. All significant intercompany balances and transactions have been eliminated in consolidation.
For additional information, please refer to our audited consolidated financial statements and the accompanying notes for the years ended December 31, 2013 and 2012 included in our 2013 Form 10-K.
Organization
TCPH is a Minnesota limited liability company formed on December 30, 2009. On November 14, 2011, TCPH entered into an Agreement and Plan of Reorganization (the “Reorganization”) with its then current members and Twin Cities Power, LLC (“TCP”), Cygnus Partners, LLC (“CP”), and Twin Cities Energy, LLC (“TCE”) which were affiliated through common ownership. Effective December 31, 2011, following receipt of approval from the Federal Energy Regulatory Commission (“FERC”), the members of TCP, CP, and TCE each contributed all of their ownership interests in these entities to TCPH in exchange for ownership interests in TCPH, which made TCPH a holding company and the sole member of each of TCP, CP, and TCE. The Reorganization was accounted for as a transaction among entities under common control.
Subsequent to the Reorganization, the Company formed two new active first-tier subsidiaries, Retail Energy Holdings, LLC (“REH”) and Cyclone Partners LLC (“Cyclone”). With respect to second-tier subsidiaries, TCP has three active subsidiaries - Summit Energy, LLC (“SUM”), Chesapeake Trading Group, LLC (“CTG”), and Minotaur Energy Futures, LLC (“MEF”), formed on March 25, 2014; CP has one - Cygnus Energy Futures, LLC (“CEF”); and REH has two - Town Square Energy, LLC (“TSE”) and Discount Energy Group, LLC (“DEG”). TCE and its wholly-owned subsidiary, Twin Cities Power – Canada, Ltd. (“TCPC”), became inactive in the third quarter of 2012.
Businesses
The Company operates in three business segments – wholesale trading, retail energy services, and real estate development. TCPH trades electricity and energy derivatives for its own account in North American wholesale markets, provides electricity supply services in certain states that allow retail customers to choose their electricity supplier, and engages in residential real estate development.
| 14 |
Wholesale Trading
The Company trades financial and physical contracts in wholesale electricity markets managed by Independent System Operators or Regional Transmission Organizations (collectively, the “ISOs”) and regulated by FERC, including those managed by the Midcontinent Independent System Operator (“MISO”), the PJM Interconnection (“PJM”), ISO New England (“ISO-NE”), and the New York Independent System Operator (“NYISO”). We also are members of the Electric Reliability Council of Texas (“ERCOT”) which is an ISO regulated by the Texas Public Utilities Commission and the Texas Legislature. The Company also trades electricity and other energy-related commodities and derivatives on exchanges operated by the Intercontinental Exchange® (“ICE”), the Natural Gas Exchange Inc. (“NGX”), and the CME Group (“CME”), all of which are regulated the Commodity Futures Trading Commission (“CFTC”).
In general, the Company’s trading activities are characterized by the acquisition of electricity or other energy-related commodities at a given location and its delivery to another. Financial transactions settle in cash in an amount equal to the difference between the purchase and sale prices, while physical transactions are settled by the delivery of the commodity. ISO-traded financial contracts are also known as virtual trades, are outstanding overnight, and settle the next day. The Company also trades electricity and other energy derivatives on ICE, NGX, and CME and may hold an open interest in these contracts overnight or longer. On very rare occasions, the Company may also trade physical electricity between certain markets, buying in one and selling in another.
Retail Energy Services
On June 29, 2012, TCP acquired certain assets and the business of Community Power & Utility LLC, a retail energy supplier serving residential and small commercial markets in Connecticut. The business was re-named TSE, and beginning on July 1, 2012, the Company began selling electricity to retail accounts. Initially, TSE was run as a division of TCP but effective June 1, 2013, TSE was reorganized as a wholly-owned subsidiary of the Company. During late 2012 and early 2013, TSE applied for retail electricity supplier licenses for the states of Massachusetts, New Hampshire, and Rhode Island which were issued on various dates in 2013.
On October 25, 2013, in anticipation of receipt of FERC approval of the Company’s acquisition of DEG, a retail energy business licensed by the states of Maryland, New Jersey, Pennsylvania, and Ohio, the Company formed REH and transferred the ownership of TSE to this entity. FERC approval of the acquisition of DEG was received on December 13, 2013 and the transaction closed on January 2, 2014.
The eight states in which the Company is currently licensed incorporate the service territories of 32 investor-owned electric utilities and as of September 30, 2014, the Company was actively marketing its services in ten of these.
Real Estate Development
On October 23, 2013, the Company formed Cyclone as a wholly-owned subsidiary to take advantage of certain perceived investment opportunities present in the residential real estate market in the southern portion of the Minneapolis-St. Paul metropolitan area. Specifically, Cyclone intends to acquire and develop land for resale, either as improved sites for construction of single- and multi-family homes or as completed dwellings.
| 2. | Summary of Significant Accounting Policies |
A description of our significant accounting policies is included in the 2013 Form 10-K and our interim consolidated financial statements should be read in conjunction with the financial statements and accompanying notes included in that report.
Results for the three and nine month periods ended September 30, 2014 are not necessarily indicative of the results expected for the year ending December 31, 2014.
| 15 |
Cash
Cash includes highly liquid investments with an original maturity of three months or less at the time of purchase. As of September 30, 2014 and December 31, 2013, the Company had no cash equivalents included in its cash balances.
Revenue Recognition
Wholesale Trading
The Company’s wholesale trading activities use derivatives such as swaps, forwards, futures, and options to generate trading revenues. These contracts are marked to fair value in the accompanying consolidated balance sheets. The Company’s agreements with the ISOs and the exchanges permit net settlement of contracts, including the right to offset cash collateral in the settlement process. Accordingly, the Company nets cash collateral against the derivative position in the accompanying consolidated balance sheets. All realized and unrealized gains and losses on derivative instruments held for trading purposes are recorded in revenues.
Retail Energy Services
Revenue from the retail sale of electricity to customers is recorded in the period in which the commodity is consumed, net of any applicable sales tax. The Company follows the accrual method of accounting for revenues whereby electricity consumed by customers but not yet billed under the cycle billing method is estimated and accrued along with the related costs. Changes in estimates are reflected in operations in the period in which they are refined. During the three and nine month periods ended September 30, 2014, the Company recorded additional retail sales of electricity of $0 and $465,000 due to a change in the amount of estimated unbilled revenue recorded in earlier periods.
Real Estate Development
Revenues from real estate developments, if any, are recognized at the time of sale closing if all significant conditions are satisfied, including adequate down payment, reasonable assurance of collectability of any notes received, and completion of other contract requirements. Recognition of all or part of the revenue is deferred if any significant conditions are not satisfied.
Derivative Instruments
In our wholesale operations, we use derivative contracts for trading purposes, seeking to profit from perceived opportunities driven by expected changes in market prices. In our retail business, the Company is exposed to volatility in the cost of energy acquired for sale to customers, and as a result, we use derivatives to hedge or reduce this variability.
Our retail operations follow ASC 815, Derivatives and Hedging (“ASC 815”) guidance that permits “hedge accounting” under which the effective portion of gains or losses from the derivative and the hedged item are recognized in earnings in the same period. To qualify for hedge accounting, the hedge relationships must meet extensive documentation requirements and hedge effectiveness and ineffectiveness must be assessed and measured on an on-going basis. Our risk management policies also permit the use of non-hedging derivatives in our retail operations which we refer to as undesignated economic hedges.
For a cash flow hedge, the effective portion of any change in the hedging instrument’s fair value is recorded as other comprehensive income until the change in value of the hedged item is recognized in earnings. For an undesignated economic hedge, all changes in the derivative financial instrument’s fair value are recognized currently in earnings.
| 16 |
Financial Instruments
The Company holds various financial instruments. The nature of these instruments and the Company’s operations expose the Company to foreign currency risk, credit risk, and fair value risk.
Foreign Currencies
A portion of the Company’s assets and liabilities are denominated in Canadian dollars and are subject to fluctuations in exchange rates. The Company does not have any exposure to any highly inflationary foreign currencies.
Foreign currency transactions result in gains and losses due to the increase or decrease in exchange rates between periods. Translation gains and losses are included as a separate component of equity. Gains and losses from foreign currency transactions are included in other income or expense. Foreign currency transactions resulted in a loss of $141,648 for the three months ended September 30, 2014 and a gain of $3,360 for the 3 months ended September 30, 2013. For the nine months ended September 30, 2014 foreign currency transactions resulted in a loss of $402,497, and a gain of $3,033 for the nine months ended September 30, 2013, respectively.
Concentrations of Credit Risk
Financial instruments that subject the Company to concentrations of credit risk consist principally of deposits in trading accounts and accounts receivable. The Company has a risk policy that includes value-at-risk calculations, position limits, stop loss limits, stress testing, system controls, position monitoring, liquidity guidelines, and compliance training.
At any given time there may be a concentration of receivables balances with one or more of the exchanges upon which we transact our wholesale business or, in the case of retail, one or more of the utilities operating in purchase-of-receivables states in which we do business.
Fair Value
The fair values of the Company’s cash, accounts receivable, and accounts payable were considered to approximate their carrying values at September 30, 2014 and December 31, 2013 due to the short-term nature of the accounts.
Management believes the carrying values of the Company’s Renewable Unsecured Subordinated Notes reasonably approximate their fair values at September 30, 2014 and December 31, 2013 due to the relatively new age of these particular instruments. No assessment of the fair value of these obligations has been completed and there is no readily available market price.
Business Combinations
The Company accounts for business combinations in accordance with ASC 805, Business Combinations (“ASC 805”), which requires an acquirer to recognize and measure in its financial statements the identifiable assets acquired, the liabilities assumed, and any non-controlling interest in the acquisition at fair value at the transaction date. In addition, transaction costs are expensed as incurred. See “Note 7 - Intangible Assets”.
| 17 |
Profits Interests
Certain second-tier subsidiaries of the Company have Class B members. Under the terms of the subsidiaries’ member control agreements, Class B members have no voting rights, are not required to contribute capital, and have no rights to distributions following termination of employment, but are entitled to a defined share of profits while employed. Since Class B members have no corporate governance rights or risk of capital loss (or gain), they do not own non-controlling equity interests and profits interests payments are recorded as compensation expense during the period earned and are classified as accrued compensation on the balance sheet.
During the three months ended September 30, 2014 and 2013, the Company included $143,421 and $2,033,937, respectively, in compensation and benefits representing the allocation of profits interests to Class B members.
During the nine months ended September 30, 2014 and 2013, the Company included $5,566,883 and $4,142,009, respectively, in compensation and benefits representing the allocation of profits interests to Class B members.
Income Taxes
The Company and its subsidiaries are not taxable entities for U.S. federal income tax purposes. As such, the Company and its subsidiaries do not directly pay federal income tax. Taxable income or loss, which may vary substantially from the net income or net loss reported in our consolidated statements of comprehensive income, is includable in the federal income tax returns for each member. The holder of the Company’s preferred units is taxed based on distributions received, while holders of common units are taxed on their proportionate share of the Company’s taxable income. Therefore, no provision or liability for federal or state income taxes has been made for those entities.
TCPC files tax returns with the Canada Revenue Agency and the Tax and Revenue Administration of Alberta.
In accounting for uncertainty in income taxes, we recognize the financial statement benefit of a tax position only after determining that the relevant tax authority would more likely than not sustain the position following an audit. The Company recognizes interest and penalties on any unrecognized tax benefits as a component of income tax expense. Based on evaluation of the Company’s tax positions, management believes all positions taken would be upheld under an examination.
The Company’s federal and state tax returns are potentially open to examinations for the years 2009 through 2013 and its Canadian tax returns are potentially open to examination for the years 2010 through 2013.
On January 6, 2014, TCPH received a notice from the Internal Revenue Service notifying that the Company’s 2012 return was under review. On July 31, 2014, the Company was informed by the IRS that its 2012 return was accepted with no adjustments.
| 18 |
New Accounting Pronouncements
In May 2014, the FASB issued new accounting guidance related to revenue recognition. This new standard will eliminate all industry-specific guidance and replace all current U.S. GAAP guidance on the topic. The new revenue recognition standard provides a unified model to determine when and how revenue is recognized. The core principle is that a company should recognize revenue to depict the transfer of promised goods or services to customers in an amount that reflects the consideration for which the entity expects to be entitled in exchange for those goods or services. This guidance will be effective for the Company beginning January 1, 2017 and can be applied either retrospectively to each period presented or as a cumulative-effect adjustment as of the date of adoption. We are currently assessing the impact on the Company’s consolidated financial statements.
| 3. | Cash |
The Company deposits its unrestricted cash in financial institutions. Balances, at times, may exceed federally insured limits.
Restricted cash at September 30, 2014 and December 31, 2013 was $1,319,371 and $320,188, respectively. At September 30, 2014, all restricted cash was posted as security in connection with certain litigation in the Canadian courts. See “Note 15 - Commitments and Contingencies”.
Cash held in trading accounts may be unavailable at times for immediate withdrawal depending upon trading activity. Cash needed to meet credit requirements for outstanding trades and that was available for immediate withdrawal as of September 30, 2014 and December 31, 2013 was as follows:
| September 30, | December 31, | |||||||
| 2014 | 2013 | |||||||
| Credit requirement | $ | 4,050,577 | $ | 2,185,175 | ||||
| Available credit | 12,462,796 | 8,299,273 | ||||||
| Cash in trading accounts | $ | 16,513,373 | $ | 10,484,448 | ||||
| 19 |
| 4. | Accounting for Derivatives and Hedging Activities |
The following table lists the fair values of the Company’s derivative assets and liabilities as of September 30, 2014 and December 31, 2013:
| Fair Value | ||||||||
| Asset Derivatives | Liability Derivatives | |||||||
| At September 30, 2014 | ||||||||
| Not designated as hedging instruments: | ||||||||
| Wholesale Trading segment | ||||||||
| Energy commodity contracts | $ | 1,668,506 | $ | 2,247,660 | ||||
| Retail Energy Services segment | ||||||||
| Energy commodity contracts | 292,606 | 238,418 | ||||||
| Designated as cash flow hedges: | ||||||||
| Energy commodity contracts | 758,443 | 323,506 | ||||||
| Total derivative instruments | 2,719,555 | 2,809,584 | ||||||
| Cash deposits in collateral accounts | 16,603,402 | – | ||||||
| Cash in trading accounts, net | $ | 19,322,957 | $ | 2,809,584 | ||||
| At December 31, 2013 | ||||||||
| Not designated as hedging instruments: | ||||||||
| Wholesale Trading segment | ||||||||
| Energy commodity contracts | $ | 614,592 | $ | 687,156 | ||||
| Retail Energy Services segment | ||||||||
| Energy commodity contracts | 103,014 | 70,672 | ||||||
| Designated as cash flow hedges: | ||||||||
| Energy commodity contracts | 417,310 | 60,695 | ||||||
| Total derivative instruments | 1,134,916 | 818,523 | ||||||
| Cash deposits in collateral accounts | 10,168,055 | – | ||||||
| Cash in trading accounts, net | $ | 11,302,971 | $ | 818,523 | ||||
For the three months ended September 30, 2014, the Company hedged the cost of 27,200 MWh via designated derivatives or 81.4% of the 33,416 MWh of electricity sold to its retail customers in such period.
As of September 30, 2014, we had designated futures contracts for 24,232 MWh and 64,184 MWh for delivery in the remainder of 2014 and 2015, respectively, as cash flow hedges of expected electricity purchases for customers receiving service from us as of that date. $302,722 of net gain on the 2014 contracts and $132,215 of net gain on the 2015 derivatives, a net gain of $434,937 in total, was deferred and included in accumulated other comprehensive income (“AOCI”). These amounts are expected to be reclassified to cost of energy sold by December 31, 2014 and 2015, respectively.
As of December 31, 2013, we had hedged the cost of 32,760 MWh (approximately 32% of expected 2014 electricity purchases for the customers receiving service from us as of that date) and $356,614 of the net gain on the effective portion of the hedge was deferred and included in AOCI. This amount is expected to be reclassified to cost of energy sold by December 31, 2014.
| 20 |
The following table summarizes the amount of gain or loss recognized in AOCI or earnings for derivatives designated as cash flow hedges for the periods indicated:
| Gain (Loss) Recognized in AOCI | Income Statement Classification | Gain (Loss) Reclassified from AOCI | ||||||||
| Three Months Ended September 30, 2014 | ||||||||||
| Cash flow hedges | $ | 77,711 | Cost of energy sold | $ | (243,028 | ) | ||||
| Nine Months Ended September 30, 2014 | ||||||||||
| Cash flow hedges | $ | 253,844 | Cost of energy sold | $ | 175,521 | |||||
| Year Ended December 31, 2013 | ||||||||||
| Cash flow hedges | $ | 685,936 | Cost of energy sold | $ | 247,290 | |||||
The following table provides details with respect to changes in AOCI as presented in our consolidated balance sheets, including those relating to our designated cash flow hedges, for the three and nine month periods ended September 30, 2014:
| Foreign Currency | Cash Flow Hedges | Available for Sale Securities | Total | |||||||||||||
| Three Months ended September 30, 2014 | ||||||||||||||||
| Balance - June 30, 2014 | $ | 556,136 | $ | 114,198 | $ | 63,903 | $ | 734,237 | ||||||||
| Other comprehensive income (loss) before reclassifications | 141,730 | 77,711 | – | 219,441 | ||||||||||||
| Amounts reclassified from AOCI | – | 243,028 | (63,903 | ) | 179,125 | |||||||||||
| Net current period other comprehensive income (loss) |
|
|
141,730 |
|
|
|
320,739 |
|
|
|
(63,903 |
) |
|
|
398,566 |
|
| Balance - September 30, 2014 | $ | 697,866 | $ | 434,937 | $ | – | $ | 1,132,803 | ||||||||
| Nine Months ended September 30, 2014 | ||||||||||||||||
| Balance - December 31, 2013 | $ | 338,008 | $ | 356,614 | $ | 5,767 | $ | 700,389 | ||||||||
| Other comprehensive income (loss) before reclassifications |
|
|
359,858 |
|
|
|
253,844 |
|
|
|
– |
|
|
|
613,702 |
|
| Amounts reclassified from AOCI | – | (175,521 | ) | (5,767 | ) | (181,288 | ) | |||||||||
| Net current period other comprehensive income (loss) |
|
|
359,858 |
|
|
|
78,323 |
|
|
|
(5,767 |
) |
|
|
432,414 |
|
| Balance - September 30, 2014 | $ | 697,866 | $ | 434,937 | $ | – | $ | 1,132,803 | ||||||||
In the third quarter and first nine months of 2014, in addition to certain derivatives designated as cash flow hedges, we also used certain other derivative contracts to which hedge accounting was not applied to reduce our exposure to higher electricity costs. The gain or loss on these economic hedges within our retail segment is reported as “wholesale trading revenue”.
| 21 |
For the three and nine months ended September 30, 2014, we recorded wholesale trading revenues of $54,730 and $2,105,208, respectively, in our retail energy services segment. See also “Note 16 – Segment Information.”
| 5. | Accounts Receivable |
Accounts receivable – trade consists of receivables from both our wholesale trading and retail segments. Wholesale trading receivables represent net settlement amounts due from a market operator or an exchange while retail receivables include amounts resulting from sales to end-use customers.
| September 30, | December 31, | |||||||
| 2014 | 2013 | |||||||
| Wholesale trading | $ | 1,018,040 | $ | 168,953 | ||||
| Retail energy services - billed | 1,054,480 | 944,100 | ||||||
| Retail energy services - unbilled | 487,110 | 202,156 | ||||||
| Accounts receivable - trade | $ | 2,559,630 | $ | 1,315,209 | ||||
As of September 30, 2014, there were two individual accounts, one in the wholesale segment and one in the retail energy services segment, with receivable balances greater than 10% that aggregated 73% of total consolidated accounts receivable.
As of December 31, 2013, there were two individual accounts in the Company’s retail energy services segment with receivable balances greater than 10% that aggregated 87% of total consolidated accounts receivable.
The Company believes that any risk associated with these concentrations is minimal.
| 6. | Marketable Securities |
As of September 30, 2014, the Company held no marketable securities.
The following table shows the cost and estimated fair value of available-for-sale securities at December 31, 2013:
| Cost | Gross Unrealized Gains | Gross Unrealized Losses | Fair Value | |||||||||||||
| U.S. equities | $ | 224,415 | $ | 5,836 | $ | – | $ | 230,251 | ||||||||
| International equities | 25,047 | – | (69 | ) | 24,978 | |||||||||||
| Money market fund | 775 | – | – | 775 | ||||||||||||
| Total | $ | 250,237 | $ | 5,836 | $ | (69 | ) | $ | 256,004 | |||||||
For the three and nine months ended September 30, 2014 the Company had sales of securities and realized a gain of $62,707 and $65,655, respectively, and had no realized impairment charges.
| 22 |
The following table shows the unrealized losses on, and the fair value of, securities positions by the length of time such assets were in a continuous loss position as of December 31, 2013:
| Less than Twelve Months | ||||||||
| Unrealized Losses | Fair Value | |||||||
| International equities | $ | (69 | ) | $ | 24,978 | |||
| 7. | Intangible Assets |
On June 29, 2012, TCP acquired certain assets and the business of Community Power & Utility LLC (“CP&U”), a retail energy supplier serving residential and small commercial markets in Connecticut, for $160,000. The business has been re-named “Town Square Energy” and is now a wholly-owned second-tier subsidiary of the Company. Of the purchase price, $85,000 was allocated to the acquisition of an existing service contract with an industry-specific provider of transaction management, billing, and customer information software and services, and $75,000 was allocated to customer relationships.
Effective January 1, 2013, in connection with the sale of his units to Timothy S. Krieger, the Company’s founder, Chairman, Chief Executive Officer, and controlling member, the Company entered into a Non-Competition Agreement (the “NCA”) with David B. Johnson, a current governor of the Company valued at $500,000, to be amortized and paid in equal installments over 24 months.
On January 2, 2014, the Company acquired 100% of the outstanding membership interests of Discount Energy Group, LLC (“DEG”) for a total purchase price of $848,527, consisting of $680,017 in cash and $168,510 in assumption of accounts payable. Of this total consideration, $293,869 was allocated to tangible assets including deposits with PJM and certain utilities and prepaid expenses and $554,658 was allocated to intangible assets. Intangible assets acquired included state licenses and utility relationships, the DEG brand name, a fully functional website, active and inactive customer lists, and domain names. The intangible assets will be amortized over 24 months using the straight line method.
| September 30, | December 31, | |||||||
| 2014 | 2013 | |||||||
| Other intangibles | $ | 714,658 | $ | 160,000 | ||||
| Non-competition agreement | 500,000 | 500,000 | ||||||
| Less: accumulated amortization | (805,962 | ) | (354,022 | ) | ||||
| Intangible assets, net | $ | 408,696 | $ | 305,978 | ||||
Total amortization of intangible assets for the three and nine month periods ended September 30, 2014 and 2013 was $138,064, $79,837, $451,940, and $239,511, respectively, and is included in other general and administrative expenses.
| 8. | Deferred Financing Costs |
Prior to the May 10, 2012 effective date of its Notes Offering, the Company incurred certain professional fees and filing costs associated with the offering totaling $393,990. The Company has capitalized these costs and amortizes them on a monthly basis over the weighted average term of the Notes sold, exclusive of any expected renewals.
| 23 |
| September 30, | December 31, | |||||||
| 2014 | 2013 | |||||||
| Deferred financing costs | $ | 393,990 | $ | 393,990 | ||||
| Less: accumulated amortization | (145,253 | ) | (56,431 | ) | ||||
| Deferred financing costs, net | $ | 248,737 | $ | 337,559 | ||||
Total amortization of deferred financing costs for the three and nine month periods ended September 30, 2014 and 2013 was $33,751 and $15,080 and $88,822 and $29,837, respectively and is included in other general and administrative expenses.
| 9. | Land Held for Development |
On December 18, 2013, the Company bought a defaulted note secured by a first mortgage on certain real property from Bremer Bank, National Association with the intention of foreclosing and thereby obtaining title to the land. As of December 31, 2013, land held for development totaled $110,477, consisting of one single family lot. Also as of the same date, the carrying value of the mortgage totaled $353,504 and consisted of the purchase price of $340,000 of principal and $13,504 of accrued interest. On April 21, 2014, the foreclosure on the mortgage note was completed. Consequently, the note was cancelled and the land received was reclassified to “land held for development”, and as of September 30, 2014, land held for development totaled $551,990.
| 10. | Convertible Promissory Note |
On March 20, 2014, the Company invested $1,000,000 in a privately placed Convertible Promissory Note, convertible into Series B Preferred Shares (the “B Note”) issued by Ultra Green Packaging, Inc. (“Ultra Green”). The B Note will mature on December 31, 2019 and bears interest at a fixed rate of 10% per annum. Interest will accrue until December 31, 2014, at which time all accrued and unpaid interest will become due and payable. Thereafter, interest will be due and payable on a quarterly basis.
At the option of the Company, the principal and accrued interest on the B Note is convertible at or prior to maturity into shares of Ultra Green’s Series B Preferred Stock (the “Series B”). If converted before Ultra Green’s 2015 financial results are available (the “2015 Results Date”), the Conversion Price will be $0.25 per share, subject to certain anti-dilution provisions. After the 2015 Results Date, the Conversion Price will be equal to the lower of (1) $0.25 per share if Ultra Green has achieved $31.5 million of revenue (the “Revenue Target”) and $7.0 million of EBITDA (the “EBITDA Target”) or (2) an amount per share equal to $0.25 per share times the lower of (a) actual revenue divided by the Revenue Target or (b) actual EBITDA divided by the EBITDA Target, subject to a floor of $0.09 per share.
As of February 24, 2014, at the start of the B Note offering, Ultra Green had 30,232,334 fully diluted common and common-equivalent shares outstanding. Assuming no additional issuances of common or common-equivalents, including conversion of B Notes issued to persons other than the Company, and conversion of the principal amount of its B Note only, the Company would have owned between 4,000,000 and 11,111,111 shares at the high and low conversion prices of $0.25 and $0.09 per share or 11.7% to 26.9% of the fully diluted shares outstanding as of such date.
| 24 |
On each of June 4 and June 18, 2014, the Company loaned Ultra Green $50,000 (for a total of $100,000) in the form of short term, unsecured promissory notes (the “Short Term Notes”), each with a maturity date of July 31, 2014. The Short Term Notes bear interest as determined by the short-term AFR Rate, computed in accordance with Section 1274(d) of the Internal Revenue Code of 1986, as amended, and published by the Internal Revenue Service, which was 0.32% for June 2014.
On June 19, 2014, the Board of Directors of Ultra Green authorized an offering of up to $8,000,000 of Convertible Promissory Notes convertible into Series C Preferred Shares, the terms of which are more fully described below (the “C Note Offering”, the “C Notes”, and the “Series C”, respectively). In connection with the C Note Offering, Ultra Green offered each holder of B Notes the option to convert their B Notes into C Notes. Upon conversion of all B Notes into C Notes, Ultra Green’s board has authorized the cancellation of its Series B stock.
In addition to its cash investments as described above, the Company has lent the services of Mr. Keith Sperbeck, its Vice President – Operations, to Ultra Green as its Interim CEO for an indefinite period concluding when Ultra Green hires a full-time chief executive officer. In lieu of any cash compensation to either Mr. Sperbeck or the Company, on June 19, 2014, Ultra Green issued the Company a non-statutory option to purchase 50,000,000 shares of its common stock for $0.01 per share, which option was fully vested and exercisable immediately upon issuance.
On July 2, 2014, the Company invested $400,000 in C Notes. Effective as of the same date, the principal of the Short Term Notes was also converted into C Notes, bringing the total principal amount of the C Notes owned by the Company to $500,000. The C Notes will mature on December 31, 2019 and bear interest at a fixed rate of 10% per annum. Interest will accrue until June 30, 2015, at which time all accrued and unpaid interest will become due and payable. Thereafter, interest will be due and payable on a quarterly basis.
The outstanding principal and accrued interest on the C Notes may be converted into shares of Ultra Green’s Series C Preferred Stock (the “Series C”) on their maturity date at the option of the Company at an initial conversion price of $1.00 per share, as adjusted. In addition, at any time prior to or at maturity and upon the affirmative vote of the holders of 66.625% of the aggregate outstanding principal amount of the C Notes, all of the C Notes will convert into shares of Series C at the conversion price of $1.00 per share.
Each share of Series C is convertible into 100 Ultra Green common shares for an initial conversion price of $0.01 per share. The Series C shall have voting rights on an “as-converted” basis, voting with the common stock on any matter presented to the shareholders of the Company for their action or consideration at any shareholder meeting, or by written consent in lieu thereof. See also “Note 17 - Subsequent Events.”
| 25 |
11. Fair Value Measurements
The Fair Value Measurement Topic of FASB’s ASC establishes a fair value hierarchy that prioritizes the inputs to valuation techniques used to measure fair value. The three types of valuation inputs in the fair market hierarchy are as follows:
| · | “Level 1 inputs” are quoted prices in active markets for identical assets or liabilities. |
| · | “Level 2 inputs” are inputs other than quoted prices that are observable either directly or indirectly for the asset or liability. |
| · | “Level 3 inputs” are unobservable inputs for which little or no market data exists. |
Financial instruments categorized as Level 1 holdings are publicly traded in liquid markets with daily quotes and include exchange-traded derivatives such as futures contracts and options, certain highly-rated debt obligations, and some equity securities. Holdings such as shares in money market mutual funds that are based on net asset values as derived from quoted prices in active markets of the underlying securities are also classified as Level 1. The fair values of financial instruments that are not publicly traded in liquid markets, but do have characteristics similar to observable market information such as wholesale commodity prices, interest rates, credit margins, maturities, collateral, and the like upon which valuations are based are categorized in Level 2. Financial instruments that are not traded in publicly quoted markets or that are acquired based on prices and terms determined by direct negotiation with the issuer are classified as Level 3 and carried at book value which management believes is a reasonable approximation of fair value until circumstances otherwise dictate. From time to time, the Company may engage third parties such as appraisers, brokers, or investment bankers to assist management in its valuation and classification of financial instruments.
The methods described above may produce fair value calculations that may not be indicative of net realizable value or reflective of future fair values. Furthermore, the use of different methodologies or assumptions to determine fair values could result in different fair value measurements and such variations could be material. There have been no changes in the methodologies used since December 31, 2013.
The following table presents certain assets measured at fair value as of the dates indicated:
| Level 1 | Level 2 | Level 3 | Total | |||||||||||||
| At September 30, 2014 | ||||||||||||||||
| Cash in trading accounts, net | $ | 16,513,373 | $ | – | $ | – | $ | 16,513,373 | ||||||||
| Investment in convertible notes | – | – | 1,566,545 | 1,566,545 | ||||||||||||
| At December 31, 2013 | ||||||||||||||||
| Cash in trading accounts, net | $ | 10,484,448 | $ | – | $ | – | $ | 10,484,448 | ||||||||
| Marketable securities | 256,004 | – | – | 256,004 | ||||||||||||
| Mortgage note receivable | – | – | 353,504 | 353,504 | ||||||||||||
There were no transfers during the nine months ended September 30, 2014 between Levels 1 and 2.
| 26 |
The following table reconciles beginning and ending Level 3 fair value financial instrument balances for the nine months ended September 30, 2014:
| Balance - December 31, 2013 | $ | 353,504 | ||
| Total gains and losses: | ||||
| Included in other comprehensive income | – | |||
| Included in earnings | – | |||
| Purchases | 1,566,545 | |||
| Settlement * | (353,504 | ) | ||
| Transfers into Level 3 | – | |||
| Transfers out of Level 3 | – | |||
| Balance - September 30, 2014 | $ | 1,566,545 | ||
| Gains for the period included in earnings attributable to the change in unrealized gains or losses relating to assets still held as of September 30, 2014 | $ | – |
____________________
* - Reflects foreclosure on mortgage note and transfer of land received to "Land held for development"; see "Note 9 - Land Held for Development".
| 12. | Debt |
Notes payable by the Company are summarized as follows:
| September 30, 2014 | December 31, 2013 | |||||||
| Renewable Unsecured Subordinated Notes | $ | 16,121,786 | $ | 9,984,826 | ||||
| Mortgage note payable to Security State Bank of Aitkin | 226,294 | – | ||||||
| Note payable to John O. Hanson dated April 8, 2011, repaid on March 25, 2014 | – | 200,000 | ||||||
| $ | 16,348,080 | $ | 10,184,826 | |||||
Notes payable by maturity are summarized as follows:
| September 30, 2014 | December 31, 2013 | |||||||
| 2014 and 2015 to September 30 | $ | 7,508,370 | $ | 5,122,596 | ||||
| Current maturities | 7,508,370 | 5,122,596 | ||||||
| 2015 before September 30 | – | 1,266,590 | ||||||
| 2015 after September 30 | 1,901,722 | – | ||||||
| 2016 | 2,437,811 | 772,250 | ||||||
| 2017 | 2,518,091 | 549,140 | ||||||
| 2018 | 803,172 | 2,297,250 | ||||||
| 2019 and thereafter | 1,178,914 | 177,000 | ||||||
| Long term debt | 8,839,710 | 5,062,230 | ||||||
| Total | $ | 16,348,080 | $ | 10,184,826 | ||||
| 27 |
ABN AMRO Margin Agreement
In February 2012, the Company executed a Futures Risk-Based Margin Finance Agreement with ABN AMRO (the “ABN AMRO Margin Agreement”). The ABN AMRO Margin Agreement provides CEF with an uncommitted $25,000,000 revolving line of credit on which it pays a commitment fee of $35,000 per month. Any loans outstanding are payable on demand and bear interest at an annual rate equal to 1.00% in excess of the Federal Funds Target Rate, or approximately 1.25%. Any advances under the ABN AMRO Margin Agreement are secured by all balances in CEF’s trading accounts with ABN AMRO. Under the ABN AMRO Margin Agreement, the Company is also subject to certain reporting, affirmative, and negative covenants, including certain financial tests. The ABN AMRO Margin Agreement was amended on May 31, 2013 to reduce the uncommitted credit line to $15,000,000, the commitment fee to $25,000 per month, and the covenant with respect to net liquidating equity as defined to $1,500,000.
As of September 30, 2014 and December 31, 2013, there were no borrowings outstanding under the ABN AMRO Margin Agreement and the Company was in compliance with all covenants.
Renewable Unsecured Subordinated Notes
On May 10, 2012, the Company’s registration statement on Form S-1 with respect to its offering of up to $50,000,000 of 3 and 6 month and 1, 2, 3, 4, 5, and 10 year Renewable Unsecured Subordinated Notes was declared effective by the SEC. Interest on the Subordinated Notes is paid monthly, quarterly, semi-annually, annually, or at maturity at the sole discretion of each investor.
The Company made interest payments of $466,789, $150,778, $1,006,566, and $269,539 during the three and nine month periods ended September 30, 2014 and 2013, respectively. Total accrued interest on the Subordinated Notes at September 30, 2014 and December 31, 2013 was $690,797 and $354,094, respectively.
As of September 30, 2014, the Company had $16,121,786 of its Subordinated Notes outstanding as follows:
| Initial Term | Principal Amount | Weighted Average Interest Rate | ||||||
| 3 months | $ | 495,850 | 13.03% | |||||
| 6 months | 215,388 | 8.25% | ||||||
| 1 year | 5,750,154 | 12.50% | ||||||
| 2 years | 2,200,666 | 13.12% | ||||||
| 3 years | 2,715,748 | 14.35% | ||||||
| 4 years | 723,385 | 14.79% | ||||||
| 5 years | 3,035,605 | 15.94% | ||||||
| 10 years | 984,990 | 14.56% | ||||||
| Total | $ | 16,121,786 | 13.73% | |||||
| Weighted average term | 34.6 mos | |||||||
RBC Line of Credit
On May 12, 2014, the Company drew $700,000 under an evergreen, uncommitted line of credit from Royal Bank of Canada (the “RBC Line” and “RBC”, respectively). Advances under the RBC Line bear interest at a variable annual interest rate of 1 month LIBOR plus 2.25% set at the time of advance for a 30 day term, mature at various dates, and are collateralized by assets held in the Company’s marketable securities account. RBC is not obligated to make any extensions of credit to the Company and availability of funds may be increased or decreased by RBC in its sole and absolute discretion. Prepayment of any outstanding principal under the RBC Line may subject the Company to LIBOR break funding costs.
As of September 30, 2014, there were no borrowings outstanding under the RBC Line and the Company was in compliance with all terms and conditions.
| 28 |
Security State Mortgage
On June 16, 2014, the Company purchased a single family home in Garrison, Minnesota for use as a corporate retreat (the “Garrison Property”) for a purchase price of $285,000, paid with $57,000 of cash and the proceeds of a $228,000 note (the “Security State Mortgage”) advanced by the Security State Bank of Aitkin (“Security State”) and secured by a first mortgage. The loan is payable in 239 equal installments of $1,482 due on the 16th of each month beginning on July 16, 2014 and one irregular installment of $1,482 due on June 16, 2034 (the “maturity date”). The note bears interest at an annual rate equal to the prime rate as published from time to time by The Wall Street Journal plus 0.75%, subject to a floor of 4.75%. Whenever increases occur in the interest rate, Security State, at its option and with notice to the Company, may: (a) increase the Company’s payments to insure the loan will be paid off by the maturity date; (b) increase the Company’s payments to cover accruing interest; (c) increase the number of the Company’s payments; or (d) continue the payments at the same amount and increase the Company’s final payment. The loan may be prepaid in whole or in part at any time without penalty.
As of September 30, 2014, the Company was in compliance with all terms and conditions of the Security State Mortgage.
| 13. | Ownership |
As of September 30, 2014 and December 31, 2013, the Company’s ownership is as presented below:
| Series A Preferred | Common | |||||||||||
| Units held | Percent of class | Units held | Percent of class | |||||||||
| Timothy S. Krieger | 496 | 100.00% | 4,935 | 99.50% | ||||||||
| Summer Enterprises, LLC | – | 0.00% | 25 | 0.50% | ||||||||
| Total | 496 | 100.00% | 4,960 | 100.00% | ||||||||
| 14. | Related Party Transactions |
Interest expense associated with notes payable to related parties was $10,082 and $41,632 for the three and nine month periods ended September 30, 2013. There were no notes payable to related parties for the three and nine month periods ending September 30, 2014.
On June 23, 2011, the building in which the Company leases its Lakeville, Minnesota office space was sold to Kenyon Holdings, LLC (“Kenyon”), a company owned by Mr. Krieger and Keith W. Sperbeck, its Vice President of Operations. On January 1, 2013, the Company and Kenyon entered into a five year lease expiring December 31, 2017 for 11,910 square feet at a monthly rent of $12,264. On September 25, 2014, the lease was amended to reduce the square footage to 10,730 and monthly rent to $11,113. For rent, real estate taxes, and operating expenses, the Company paid Kenyon $55,201, $38,854, $154,052 and $175,492 for the three and nine months ended September 30, 2014 and 2013, respectively.
| 29 |
Effective January 1, 2013, in connection with the purchase of David B. Johnson’s units by Mr. Krieger, the Company entered into the NCA with Mr. Johnson, a current governor and former member of the Company, pursuant to which the Company is obligated to pay Mr. Johnson $500,000 in 24 equal monthly installments of $20,833 each. The total amount paid pursuant to the NCA during the three and nine month periods ended September 30, 2014 and 2013 was $62,500 and $187,500, respectively.
On March 5, 2013, CEF entered into a 36 month lease for 1,800 square feet of office space in Tulsa, Oklahoma with the Brandon J. and Heather N. Day Revocable Trust at a monthly rent of $3,750. Mr. Day is an employee of CEF, a second-tier subsidiary of the Company. Total rent paid for the three month periods ended September 30, 2014 and 2013 was $11,250, and total rent paid for the nine month periods then ended was $33,750 and $30,000, respectively.
In connection with the Company’s initial investment of $1.0 million in Ultra Green (see “Note 10 – Convertible Promissory Note”), the Company paid a 10% commission to Cedar Point Capital, LLC, a registered broker dealer (“Cedar Point”). David Johnson, a member of the Company’s Board of Governors, is the sole owner of Cedar Point. No commissions were paid on the Company’s follow-on investments.
On June 17, 2014, the building in which the Company leases its Chandler, Arizona office space occupied by certain of its retail business functions was purchased by Fulton Marketplace, LLC (“Fulton”), a company owned by Mr. Krieger and Mr. Sperbeck. Effective August 1, 2014, the Company and Fulton entered into a five year lease expiring July 31, 2019, subject to two consecutive five year extension periods, for 2,712 square feet. The rent for the first lease year is $4,068 per month and it will increase by 3% annually at the start of each lease year thereafter. The Company incurred $10,706 for the three and nine months ended September 30, 2014 for rent, real estate taxes, and operating expenses.
| 15. | Commitments and Contingencies |
FERC Investigation
On October 12, 2011, FERC initiated a formal non-public investigation into TCE’s power scheduling and trading activity in MISO for the period from January 1, 2010 through May 31, 2011.
On June 12, 2014, FERC issued a Notice of Alleged Violations (“NAV”) indicating that the staff of its Office of Enforcement had preliminarily determined that during the period from January 1, 2010 through January 31, 2011, TCPC and certain affiliated companies, including TCE and TCP, and individuals Allan Cho, Jason F. Vaccaro, and Gaurav Sharma, each violated the FERC’s prohibition on electric energy market manipulation by scheduling and trading physical power in MISO to benefit related swap positions that settle based on real-time MISO prices.
The FERC investigation addresses trading activity by former employees of TCPC whose employment contracts were terminated by TCPC on February 1, 2011 in connection with the Company’s reorganization of its Canadian operations. TCE and TCPC have no employees and do not conduct any operations.
| 30 |
On November 14, 2014, TCE reached a settlement with FERC regarding the Investigation and the NAV. The settlement requires TCE to pay $978,186 plus interest of $127,638 as disgorgement of profits and $2,500,000 as a civil penalty, for a total of $3,605,824. Within 10 days of the effective date, TCE will pay $500,000 to MISO as disgorgement and beginning with the second quarter 2015, TCE shall pay the remainder in 16 equal quarterly installments, first to MISO as disgorgement until it is fully paid, and thereafter to the Treasury in satisfaction of the penalty. The Company further agreed to implement certain procedures to improve compliance. Failure to comply with the terms and conditions will be deemed a violation of the final order and may subject the Company to additional action.
Former Employee Litigation
On February 1, 2011, the Company commenced a major restructuring of the operations of TCPC and all personnel were terminated, although several were subsequently re-hired. During the course of 2011, three former employees of TCPC commenced legal proceedings and brought separate summary judgment applications seeking damages aggregating C$3,367,000 for wrongful dismissal and payment of performance bonuses. The Company filed a counterclaim for C$3,096,000 against one of the former employees for losses suffered, inappropriate expenses, and related matters. Two of the three summary judgment applications were dismissed on January 12, 2012. All three summary judgment applications were appealed and were heard on July 4, 5, and 6, 2012 by the Alberta Court of Queen’s Bench. On July 6, 2012, the court dismissed two of the three applications and allowed the third, awarding summary judgment against TCPC for a portion of the claim amounting to C$1,376,726. This third matter will hereinafter be referred to as the “TCPC judgment action”.
In 2013, the former employees brought applications to amend their pleadings to include as additional defendants certain TCPC U.S. affiliates (“Twin Cities USA”). One of the former employees proceeded with the application and the others were adjourned. The application that proceeded went forward on April 29 and 30, 2013. In a decision dated January 31, 2014, the Court of Queen’s Bench dismissed the applications to add additional defendants but allowed certain refinements to the pleadings. Thereafter the Company and TCPC consented to an amendment of pleadings of the other employees consistent with the Court’s ruling.
In addition, on January 31, 2014 within the “TCPC judgment action” the Court of Queen’s Bench ordered Twin Cities USA to post security for costs in the sum of C$75,000 together with security for judgment in the sum of C$1,376,726. In order to preserve its claims and counterclaims against the former employees in the TCPC judgment action, Twin Cities USA posted security for the judgment and costs and continues to maintain that security pending further order or direction form the Court of Queen’s Bench.
Twin Cities USA and TCPC intend to continue to vigorously defend against the allegations and claims of the former employees and have filed counterclaims or amended counterclaims for losses suffered and costs incurred in responding to the FERC investigation, inappropriate expenses, and related matters.
Due to the uncertainty surrounding the outcome of the litigation, including that of its counterclaims against the former employees, the Company is presently unable to determine a range of reasonably possible outcomes.
| 31 |
PJM Resettlements
Transmission Line Losses: On May 11, 2012, FERC issued an order denying rehearing motions in regards to PJM resettlement fees confirming its intent to reverse refunds it had granted to a number of market participants in a 2009 order. These refunds were related to transmission line loss refunds issued to the Company by PJM for prior periods. Pursuant to the order, the Company was required to return $782,000 to PJM which amount was paid in full in July 2012.
On July 9, 2012, several parties filed a petition for review of the May 11, 2012 FERC order with the District of Columbia Circuit of the U.S. Court of Appeals and certain subsidiaries of TCPH filed motions to intervene in the proceeding. In an order issued August 6, 2013, the Court remanded to FERC for further consideration the issue of recoupment of refunds that had previously been directed by FERC. The Court found that FERC’s orders failed to explain why refund recoupment was warranted and therefore its recoupment directive was found to be arbitrary and capricious.
On February 20, 2014, the FERC issued an order establishing a briefing schedule allowing parties to the proceeding to provide briefs on whether or not the recoupment orders should be reconsidered. Although briefing on all issues relevant to the remand was invited by FERC, it also presented five specific questions, primarily relating to the effect of the recoupment orders, for the parties to address. Initial briefs were due on April 6, 2014 and FERC’s reply briefs were due May 6, 2014.
Now that briefing is completed, it is expected that FERC will issue an order responding to the Court’s remand directive. If FERC affirms its prior order it is expected that some or all of the financial marketer appellants and interveners will again challenge the lawfulness of the decision on rehearing or before the Court of Appeals. If FERC reconsiders its order and finds that the refunds should not have been recouped, or failing that action, if the Court again finds the FERC order unlawful, then some or all of the funds paid to PJM in July 2012 could be returned to the Company. Due to the uncertainty surrounding the outcome of the remand and appeals process, the Company is presently unable to determine a reasonable estimate of the amount, if any, which could be returned.
BOR Charges: During the period from July 2009 to July 2011, due to its participation in PJM, the Company was required to pay certain balancing operating reserve (“BOR”) charges. During the same period, DC Energy, LLC and DC Energy Mid-Atlantic, LLC (collectively, “DC Energy”) were determined to have inappropriately avoided such payments by reporting certain transactions as internal bilateral transactions. A FERC order dated July 12, 2013 on Docket No. EL12-8-001 denied rehearing on a complaint by DC Energy with respect to PJM’s plan to retroactively bill them for these charges. PJM’s settlement reruns associated with these adjustments began in July 2013 and were expected to take approximately six months to complete. Through September 30, 2014, the Company had received refunds totaling $611,093 from PJM ($494,771 in 2013 and $116,322 in 2014) that have been recognized as revenue. On April 28, 2014, DC Energy and PJM filed a proposed settlement with FERC which required its approval. On September 29, 2014, FERC issued an order accepting the proposed settlement agreement. This action allows the Company to retain the funds that have already been received and the approved settlement agreement will be considered final if rehearing is not requested of FERC by November 29, 2014.
| 32 |
PJM Up To Congestion Fees
On August 29, 2014, FERC initiated a proceeding under Section 206 of the Federal Power Act, as amended, described in Docket No. EL14-37-000 regarding how PJM treats up-to-congestion (“UTC”) transactions in the market (the “§206 proceeding”). The purpose of the proceeding is for FERC to examine how uplift is, or should be, allocated to all virtual transactions within the PJM market. The Company is an active trader of these UTCs.
Currently, under PJM’s Tariff and Operating Agreement, UTCs are treated differently under its FTR forfeiture rule than are INCs and DECs, two other types of virtual transactions. Further, INCs and DECs are subject to uplift charges, but UTCs are not. In Docket No EL14-37-000, FERC noted that should any uplift be charged UTCs, it would apply such back to the date that notice of the proceeding was published in the Federal Register (September 8, 2014), thus setting a “refund effective date”. From the refund effective date to September 30, 2014, the Company traded approximately 415,000 MWh of UTCs in PJM.
Although the Company’s UTC trading activity exposes it to potential uplift charges, none have been billed as the investigation is still pending. Further, TCPH has not established any reserves for such as management is uncertain as to the probability, amount, and timing of the actual payment, if any, that might be due.
Letter of Credit
On June 24, 2014, the Company’s restricted cash balance of $320,188 was returned by the City of Lakeville and a letter of credit in favor of Cyclone Partners, LLC was issued by Vermillion State Bank for the same amount. The note evidencing the letter of credit matures on demand, and advances, up to a maximum of $320,188, bears interest at an annual rate of 5.25%, and are secured by a mortgage on the property being developed and the guaranty of Cyclone. As of September 30, 2014 the Company was in compliance with all terms and conditions of the letter of credit.
Guarantees
In the ordinary course, TCPH provides guarantees for the future obligations of TCP, SUM, and CEF with respect to their participation in PJM, NYISO, MISO, and ERCOT. On April 8, 2014, the Company cancelled its guarantee for the benefit of PJM with respect to CEF. On April 14, 2014, TCPH increased its guarantee for the benefit of MISO to $2,000,000. As of September 30, 2014, such guarantees were in an unlimited amount for PJM, an unlimited amount for NYISO, up to $2,000,000 for MISO, and up to $5,000,000 for ERCOT.
On August 12, 2013, the Company entered into a corporate guaranty in favor of Noble Americas Energy Solutions LLC (“Noble”), pursuant to which, the Company has agreed, among other things, to guarantee, up to a maximum of $1,000,000 plus any costs of enforcement or collection, the prompt and complete payment of all amounts owed to Noble by TSE related to any transactions between TSE and Noble.
On April 25, 2014, the Company entered into a corporate guaranty in favor of Noble pursuant to which the Company has agreed, among other things, to guarantee, up to a maximum of $1,000,000 plus any costs of enforcement or collection, the prompt and complete payment of all amounts owed to Noble by DEG related to any transactions between DEG and Noble.
| 16. | Segment Information |
The Company has three business segments used to measure its business activity – wholesale trading, retail energy services, and real estate development:
| · | Wholesale trading activities earn profits from trading financial, physical, and derivative electricity in wholesale markets regulated by the FERC and the CFTC. |
| · | On July 1, 2012, the Company began selling electricity to residential and small commercial customers. |
| · | On October 23, 2013, the Company formed a new entity to take advantage of certain investment opportunities in the residential real estate market. |
Trading profits and sales are classified as “foreign” or “domestic” based on the location where the trade or sale originated. For the three and nine month periods ended September 30, 2014 and the year ended December 31, 2013, all such transactions were “domestic.” Furthermore, the Company has no long-lived assets in foreign jurisdictions.
These segments are managed separately because they operate under different regulatory structures and are dependent upon different revenue models. The performance of each is evaluated based on the operating income or loss generated.
| 33 |
Certain amounts reported in prior periods have been reclassified to conform to the current period’s presentation.
Information on segments for the three and nine month periods ended September 30, 2014 is as follows:
| Wholesale Trading | Retail Energy Services | Real Estate Development | Corporate, Net of Eliminations | Consolidated Total | ||||||||||||||||
| Three Months Ended September 30, 2014 | ||||||||||||||||||||
| Wholesale trading | $ | 496,238 | $ | 54,730 | $ | – | $ | – | $ | 550,968 | ||||||||||
| Retail energy services | – | 2,988,460 | – | – | 2,988,460 | |||||||||||||||
| Revenues, net | 496,238 | 3,043,190 | – | – | 3,539,428 | |||||||||||||||
| Costs of retail electricity sold | – | 2,629,531 | – | – | 2,629,531 | |||||||||||||||
| Retail sales and marketing | – | 40,622 | – | – | 40,622 | |||||||||||||||
| Compensation and benefits | 1,070,568 | 106,581 | – | 378,713 | 1,555,862 | |||||||||||||||
| Professional fees | 615,761 | 205,677 | 2,200 | 165,060 | 988,698 | |||||||||||||||
| Other general and administrative | 3,681,315 | 301,361 | 11,605 | (543,709 | ) | 3,450,572 | ||||||||||||||
| Trading tools and subscriptions | 261,937 | 108,705 | 755 | 4,308 | 375,705 | |||||||||||||||
| Operating costs and expenses | 5,629,581 | 3,392,477 | 14,560 | 4,372 | 9,040,990 | |||||||||||||||
| Operating income (loss) | $ | (5,133,343 | ) | $ | (349,287 | ) | $ | (14,560 | ) | $ | (4,372 | ) | $ | (5,501,562 | ) | |||||
| Capital expenditures | $ | – | $ | 34,014 | $ | 32,504 | $ | 29,884 | $ | 96,402 | ||||||||||
| Nine Months Ended September 30, 2014 | ||||||||||||||||||||
| Wholesale trading | $ | 27,310,284 | $ | 2,105,208 | $ | – | $ | – | $ | 29,415,492 | ||||||||||
| Retail energy services | – | 8,115,008 | – | – | 8,115,008 | |||||||||||||||
| Revenues, net | 27,310,284 | 10,220,216 | – | – | 37,530,500 | |||||||||||||||
| Costs of retail electricity sold | – | 8,896,838 | – | – | 8,896,838 | |||||||||||||||
| Retail sales and marketing | – | 192,017 | – | – | 192,017 | |||||||||||||||
| Compensation and benefits | 13,038,791 | 273,030 | – | 1,167,182 | 14,479,003 | |||||||||||||||
| Professional fees | 2,049,757 | 700,579 | 2,200 | 734,358 | 3,486,894 | |||||||||||||||
| Other general and administrative | 6,016,006 | 904,408 | 71,160 | (1,873,131 | ) | 5,118,443 | ||||||||||||||
| Trading tools and subscriptions | 669,851 | 300,581 | 2,223 | 32,471 | 1,005,126 | |||||||||||||||
| Operating costs and expenses | 21,774,405 | 11,267,453 | 75,583 | 60,880 | 33,178,321 | |||||||||||||||
| Operating income (loss) | $ | 5,535,879 | $ | (1,047,237 | ) | $ | (75,583 | ) | $ | (60,880 | ) | $ | 4,352,179 | |||||||
| Capital expenditures | $ | 15,218 | $ | 720,635 | $ | 89,009 | $ | 121,374 | $ | 946,236 | ||||||||||
| 34 |
Information on segments at September 30, 2014 is as follows:
| Wholesale Trading | Retail Energy Services | Real Estate Development | Corporate, Net of Eliminations | Consolidated Total | ||||||||||||||||
| At September 30, 2014 | ||||||||||||||||||||
| Identifiable Assets | ||||||||||||||||||||
| Cash - unrestricted | $ | 1,758,176 | $ | 172,341 | $ | 399 | $ | 1,006,795 | $ | 2,937,711 | ||||||||||
| Cash in trading accounts | 15,093,874 | 1,419,499 | – | – | 16,513,373 | |||||||||||||||
| Accounts receivable - trade | 1,017,188 | 1,541,590 | – | 852 | 2,559,630 | |||||||||||||||
| Prepaid expenses and other assets | 142,438 | 121,401 | 3,731 | 233,915 | 501,485 | |||||||||||||||
| Total current assets | 18,011,676 | 3,254,831 | 4,130 | 1,241,562 | 22,512,199 | |||||||||||||||
| Property, equipment, and furniture, net | 67,448 | 88,970 | 1,000 | 623,190 | 780,608 | |||||||||||||||
| Intangible assets, net | – | 346,196 | – | 62,500 | 408,696 | |||||||||||||||
| Deferred financing costs, net | – | – | – | 248,737 | 248,737 | |||||||||||||||
| Cash - restricted | 67,770 | – | – | 1,251,601 | 1,319,371 | |||||||||||||||
| Land held for development | – | – | 551,990 | – | 551,990 | |||||||||||||||
| Investment in convertible notes | – | – | – | 1,566,545 | 1,566,545 | |||||||||||||||
| Total assets | $ | 18,146,894 | $ | 3,689,997 | $ | 557,120 | $ | 4,994,135 | $ | 27,388,146 | ||||||||||
| Identifiable Liabilities and Equity | ||||||||||||||||||||
| Current portion of: | ||||||||||||||||||||
| Senior notes payable | $ | – | $ | – | $ | – | $ | 7,032 | $ | 7,032 | ||||||||||
| Subordinated notes | – | – | – | 7,501,338 | 7,501,338 | |||||||||||||||
| Accounts payable - trade | 421,306 | 743,894 | 21,667 | 472,863 | 1,659,730 | |||||||||||||||
| Accrued expenses | – | 495,013 | – | 3,695 | 498,708 | |||||||||||||||
| Accrued compensation. | 829,804 | – | – | 15,000 | 844,804 | |||||||||||||||
| Accrued interest | – | – | – | 690,797 | 690,797 | |||||||||||||||
| Obligations under settlement agreement | 888,228 | – | – | – | 888,228 | |||||||||||||||
| Obligations under non-competition agreement | – | – | – | 62,500 | 62,500 | |||||||||||||||
| Total current liabilities | 2,139,338 | 1,238,907 | 21,667 | 8,753,225 | 12,153,137 | |||||||||||||||
| Senior notes payable | – | – | – | 219,262 | 219,262 | |||||||||||||||
| Obligations under settlement agreement | 2,717,596 | – | – | – | 2,717,596 | |||||||||||||||
| Subordinated notes | – | – | – | 8,620,448 | 8,620,448 | |||||||||||||||
| Total liabilities | 4,856,934 | 1,238,907 | 21,667 | 17,592,935 | 23,710,443 | |||||||||||||||
| Investment in subsidiaries | 6,371,223 | 6,324,868 | 699,372 | (13,395,463 | ) | – | ||||||||||||||
| Series A preferred equity | – | – | – | 2,745,000 | 2,745,000 | |||||||||||||||
| Common equity | 6,220,871 | (4,308,715 | ) | (163,919 | ) | (1,948,337 | ) | (200,100 | ) | |||||||||||
| Accumulated other comprehensive income | 697,866 | 434,937 | – | – | 1,132,803 | |||||||||||||||
| Total members' equity | 13,289,960 | 2,451,090 | 535,453 | (12,598,800 | ) | 3,677,703 | ||||||||||||||
| Total liabilities and equity | $ | 18,146,894 | $ | 3,689,997 | $ | 557,120 | $ | 4,994,135 | $ | 27,388,146 |
| 35 |
Information on segments for the three and nine month periods ended September 30, 2013 is as follows:
| Wholesale Trading | Retail Energy Services | Real Estate Development | Corporate, Net of Eliminations | Consolidated Total | ||||||||||||||||
| Three Months Ended September 30, 2013 | ||||||||||||||||||||
| Wholesale trading | $ | 9,945,697 | $ | – | $ | – | $ | – | $ | 9,945,697 | ||||||||||
| Retail energy services | – | 2,274,917 | – | – | 2,274,917 | |||||||||||||||
| Revenues, net | 9,945,697 | 2,274,917 | – | – | 12,220,614 | |||||||||||||||
| Costs of retail electricity sold | – | 2,218,996 | – | – | 2,218,996 | |||||||||||||||
| Retail sales and marketing | – | 36 | – | – | 36 | |||||||||||||||
| Compensation and benefits | 4,242,612 | 53,475 | – | 497,065 | 4,793,152 | |||||||||||||||
| Professional fees | 126,944 | 115,603 | – | 215,861 | 458,408 | |||||||||||||||
| Other general and administrative | 1,286,946 | 211,792 | – | (719,121 | ) | 779,617 | ||||||||||||||
| Trading tools and subscriptions | 210,254 | 4,018 | – | 7,569 | 221,841 | |||||||||||||||
| Operating costs and expenses | 5,866,756 | 2,603,920 | – | 1,374 | 8,472,050 | |||||||||||||||
| Operating income (loss) | $ | 4,078,941 | $ | (329,003 | ) | $ | – | $ | (1,374 | ) | $ | 3,748,564 | ||||||||
| Capital expenditures | $ | 2,018 | $ | – | $ | – | $ | 16,855 | $ | 18,873 | ||||||||||
| Nine Months Ended September 30, 2013 | ||||||||||||||||||||
| Wholesale trading | $ | 24,534,563 | $ | – | $ | – | $ | – | $ | 24,534,563 | ||||||||||
| Retail energy services | – | 5,310,275 | – | – | 5,310,275 | |||||||||||||||
| Revenues, net | 24,534,563 | 5,310,275 | – | – | 29,844,838 | |||||||||||||||
| Costs of retail electricity sold | – | 5,501,298 | – | – | 5,501,298 | |||||||||||||||
| Retail sales and marketing | – | 461 | – | – | 461 | |||||||||||||||
| Compensation and benefits | 9,622,450 | 138,656 | – | 1,410,447 | 11,171,553 | |||||||||||||||
| Professional fees | 2,820,216 | 240,343 | – | 897,681 | 3,958,240 | |||||||||||||||
| Other general and administrative | 3,796,649 | 647,182 | – | (2,332,743 | ) | 2,111,088 | ||||||||||||||
| Trading tools and subscriptions | 669,763 | 13,881 | – | 24,164 | 707,808 | |||||||||||||||
| Operating costs and expenses | 16,909,078 | 6,541,821 | – | (451 | ) | 23,450,448 | ||||||||||||||
| Operating income (loss) | $ | 7,625,485 | $ | (1,231,546 | ) | $ | – | $ | 451 | $ | 6,394,390 | |||||||||
| Capital expenditures | $ | 32,567 | $ | – | $ | – | $ | 43,629 | $ | 76,196 | ||||||||||
| 36 |
| 17. | Subsequent Events |
From October 1 to November 12, 2014, the Company sold additional Subordinated Notes totaling $1,473,700 with a weighted average term of 37.3 months and bearing a weighted average interest rate of 13.75%.
On October 14, 2014, REH, TSE, and DEG entered into a Credit Agreement with the Toronto, Ontario branch of Maple Bank GmbH (the “Maple Agreement” and “Maple Bank”), expiring October 31, 2016. The Maple Agreement provides the Company’s retail energy services businesses with a revolving line of credit of up to $5,000,000 in committed amount secured by a first position security interest in all of the assets, a pledge of the equity of such companies by TCPH, and certain guarantees. Availability of loans is keyed to advance rates against certain eligible receivables as defined. Any loans outstanding bear interest at an annual rate equal to 3 month LIBOR, subject to a floor of 0.50%, plus a margin of 6.00%. In addition, the Company is obligated to pay an annual fee of 1.00% of the committed amount on a monthly basis and a monthly non-use fee of 1.00% of the difference between the committed amount and the average daily principal balance of any outstanding loans. The Company is also subject to certain reporting, affirmative, and negative covenants. On October 14, 2014, REH drew down $800,000 from this line of credit and had paid the draw off in full on October 27, 2014.
On November 5, the Company entered into a corporate guaranty in favor of Shell Energy North America L.P. “Shell” pursuant to which the Company has agreed, among other things, to guarantee, up to a maximum of $500,000 plus any costs of enforcement or collection, the prompt and complete payment of all amounts owed to Shell by TSE related to any transactions between TSE and Shell.
On November 5, the Company entered into a corporate guaranty in favor of Shell Energy North America L.P. pursuant to which the Company has agreed, among other things, to guarantee, up to a maximum of $500,000 plus any costs of enforcement or collection, the prompt and complete payment of all amounts owed to Shell by DEG related to any transactions between DEG and Shell.
At the conclusion of the C Note Offering, anticipated to be on November 10, 2014, assuming $9,155,302 of C Notes are sold, and excluding options and warrants for 5,390,000 shares with exercise prices in excess of $0.50, and excluding 2,000,000 Series A Preferred Shares, which would not participate in a sale of Ultra Green other than to receive their cost basis back, Ultra Green will have 1,119,130,554 fully diluted common and common-equivalent shares outstanding. Assuming no additional issuances of common or common-equivalents to others, conversion of the principal amount of its B and C Notes to Series C shares, conversion of the Series C into common shares, and the exercise of the option described above, the Company would own 200,000,000 common shares or 17.87% of the fully diluted shares outstanding. See also “Note 10 – Convertible Promissory Note.”
The Company has evaluated subsequent events occurring through the date that the financial statements were issued.
| 37 |
Item 2 - Management’s Discussion and Analysis of Financial Condition and Results of Operations
The following discussion should be read in conjunction with our consolidated financial statements, notes to those statements, Management’s Discussion and Analysis of Financial Condition and Results of Operations from our 2013 Form 10-K, and the other financial information appearing elsewhere in this report. In addition to historical information, the following discussion and other parts of this Form 10-Q contain forward-looking information that involves risks and uncertainties. Readers are cautioned that forward-looking statements should be read in conjunction with our disclosures in this Form 10-Q under the heading “Forward-Looking Statements” located on page 8, “Item 1A – Risk Factors” of our 2013 Form 10-K, and the “Risk Factors” section beginning on page 10 of our Form S-1.
The risks and uncertainties described in this Form 10-Q, our 2013 Form 10-K, and our Form S-1 are not the only risks facing our Company. Additional risks and uncertainties that we are not presently aware of, or that we currently consider immaterial, may also affect our business operations. Our business, financial condition, or results of operations could suffer if the risks set forth are realized.
Industry Background
Electric power in commercial quantities, unlike other energy commodities such as coal or natural gas, cannot be stored - the supply must be produced or generated exactly when used or demanded by customers. Further, the laws of physics dictate that power flows within a network along the lines of least resistance, not necessarily where we may want it to go. These facts, coupled with the necessity of electricity in modern life, have obvious implications for market structures and regulations.
Since 1978, the investor–owned portion of the industry has been undergoing a massive restructuring process with the passage of the Public Utilities Regulatory Policy Act. PURPA stimulated development of renewable energy sources and co-generation and laid the groundwork for deregulation and competition by opening wholesale power markets to non-utility producers for the first time.
Today, the industry includes any entity producing, selling, distributing, or trading electricity. As of the end of 2012, utilities numbered over 2,100 and included investor-owned, publicly-owned, cooperative, and federal entities - investor-owned utilities accounted for more than 71% of the industry’s revenues, unit sales, and customers. There were also about 110 non-utility power producers. Power marketers and retail energy providers do not own any generation, transmission, or distribution assets but buy and sell in wholesale and retail markets. Other wholesale market participants include banks, hedge funds, private equity firms, and trading houses.
Overall, according to EIA data for 2012 (the most recent available), the U.S. electric power industry generated and sold 3,695 GWh at retail (down 1.5% from 2011) for a little more than $363.6 billion (down 2.0%) to over 145 million residential, commercial, industrial, and transportation customers (up 0.5%). In 2012, the average U.S. retail electricity price was 9.84¢/kWh - residential customers paid 11.88¢/kWh, commercial users paid 10.09¢/kWh, and industrial and transportation consumers paid 6.70¢/kWh.
| 38 |
Electricity Prices
Today, wholesale prices are subject to a federal regulatory framework focused on ensuring fair competition and reliability of supply. At the state level, under the traditional system which most states continue to employ, a vertically integrated utility is responsible for serving all consumers in a defined territory and customers are obligated to pay the regulated rate for their class of service. However, in a state with a restructured or “deregulated” market, i.e., one with retail choice, the generation, transmission, distribution, and retail marketing functions of the business are legally separated and consumer pricing is unbundled.
Wholesale electricity prices are driven by supply and demand and actually change minute-by-minute. Near term demand is largely affected by the weather and consumer behavior while supply is driven by plant availability and fuel prices, particularly for natural gas as it is the fuel of choice for marginal generation requirements. In the longer term, retail electricity prices reflect supply-side factors such as fuel prices and availability, generation technologies, plant and line construction and maintenance costs, and capital costs. Demand-side factors include population growth, economic activity, and energy efficiency. Governmental policies and regulations with respect to energy and the environment affect both the supply of, and demand for, electricity.
Wholesale prices are typically quoted as “on-peak”, “off-peak”, or “flat”, and in dollars per megawatt-hour ($/MWh). Peak hours are generally the 16 hours ending 0800 (8:00 am) to 2300 (11:00 pm) on weekdays, except for the NERC holidays of New Year’s Day, Memorial Day, Independence Day, Labor Day, Thanksgiving Day, and Christmas Day. Off-peak periods are all NERC holidays and weekend hours plus the 8 weekday hours from the hour ending at 2400 (midnight) until the hour ending at 0700 (7:00 am). Each month in a calendar year has a different number of on- and off- peak hours, consequently, the flat price for a given month takes this into account. The flat price for a day is simply the average of the 24 hourly prices. Retail prices are quoted in cents per kilowatt-hour (¢/kWh).
One of the unique aspects of ISO electricity markets is the availability of “locational marginal prices” (“LMPs”), also known as “nodal pricing”. The theoretical price of electricity at each node on the network is calculated based on the assumptions that one additional kilowatt-hour is demanded at the node in question, and that the marginal cost to the system that would result from the optimized re-dispatch of available generating units to serve the load can establish the production cost of the additional energy. LMPs are typically quoted on a “real-time” and “day-ahead” basis. In the real-time market, prices at specific nodes on the grid are updated every 5 minutes based on current and targeted supply and demand. Day-ahead prices are for power to be delivered at a specified hour and transmission point during the next day.
LMPs vary by time and location due to physical system limitations, congestion, and loss factors; however, in an unconstrained system with no losses, all LMPs would be equal. This means that LMPs can be conceptually separated into three components - an energy price, a congestion component, and a loss component.
As generators are dispatched to meet load, the energy transfer capacity of transmission lines is used. Bulk power systems must be operated to allow for continuity of supply even if a contingent event, like the loss of a line, generator, or transformer were to occur. At times, transmission lines may also reach their maximum thermal capacity. These “security constraints”, also known as “congestion”, limit the ability to use the least expensive generation. In other words, when constraints exist on a transmission network, there is a need for more expensive generation to be used, and separate prices on either side of a node give rise to congestion pricing to relieve the constraint and reduce line loadings.
Finally, since transmission lines act as resistors to the flow of energy, to receive a specific quantity at a particular destination, more than the expected quantity must be injected into the line at origination to compensate for losses.
| 39 |
Wholesale Electricity Markets
After PURPA, the Energy Policy Act of 1992 was the next major legislative step towards full deregulation of wholesale power markets. In 1996, FERC issued Orders 888 and 889, which allowed for energy to be scheduled across multiple power systems, and in 1999, FERC issued Order 2000 calling for electric utilities to form RTOs or ISOs to operate the nation’s bulk power system. The intended benefits of ISOs include eliminating discriminatory access to transmission for all generators, improving operating efficiency, and increasing system reliability. ISOs are typically not-for-profit entities using governance models developed by FERC. To date, seven ISOs have been formed in the U.S. In the parts of the country where ISOs have not been established, including the southeast, southwest and northwest, active wholesale markets are still present, although they operate with different structures.
In addition to controlling the physical flow of power within its area of responsibility via direction to generators operating within the ISO’s footprint, many ISOs also operate wholesale markets for real-time and day-ahead energy, as well as for generating capacity and ancillary services required to ensure system reliability.
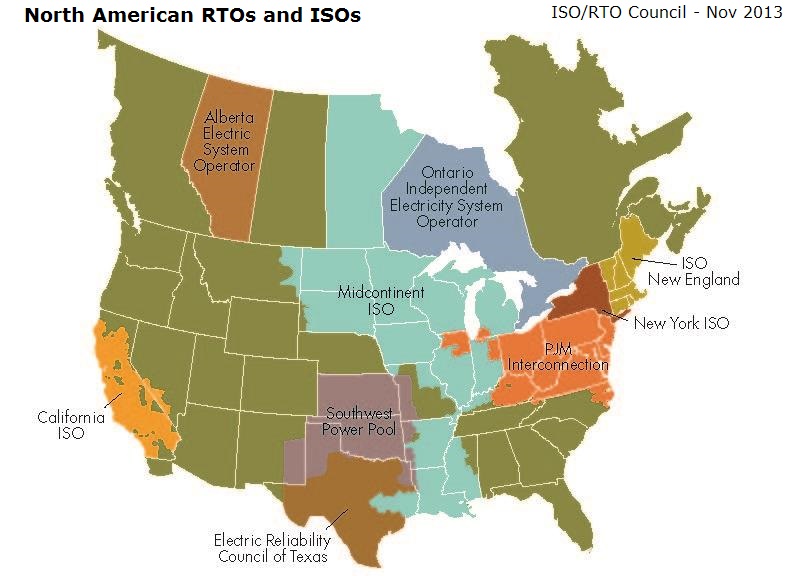
Trading activity in ISO markets is often characterized by the acquisition of electricity at a given location such as a node or hub and its delivery to another. “Virtual” or purely financial transactions settle in cash in an amount equal to the difference between the purchase and sale prices, while physical transactions are settled by the delivery of the electricity itself, but in either case, the ISO serves as the counter-party and central clearinghouse for all trades.
| 40 |
In addition to the markets operated by the ISOs, derivative contracts such as swaps, options, and futures keyed to a wholesale electricity price are traded over-the-counter and on regulated exchanges, including ICE, NGX, and CME. Derivative contracts are available for many terms and pricing points and always settle in cash with profit or loss determined by price movements in the underlying commodity, whether it be electricity or another energy commodity such as natural gas or crude oil.
Retail Electricity Markets
Historically, at the state level, electricity was a regulated market, where vertically-integrated utilities owned all or a major part of the bulk power and distribution infrastructure and were responsible for generating electricity or buying it from other producers and distributing it to homes and businesses. Regulated utilities are responsible for serving all consumers in their defined territory and customers are obligated to pay the regulated rate for their class of service. Neither provider nor consumer has a choice about who they do business with.
In the 1990s, many states, particularly those in the Northeast and California where retail prices were historically among the highest in the country, began restructuring their electric power industries in an effort to bring the benefits of competition to retail customers. This new regulatory approach centered on deregulation of generation and retail marketing while continuing the traditional cost-of-service plan for transmission and distribution.
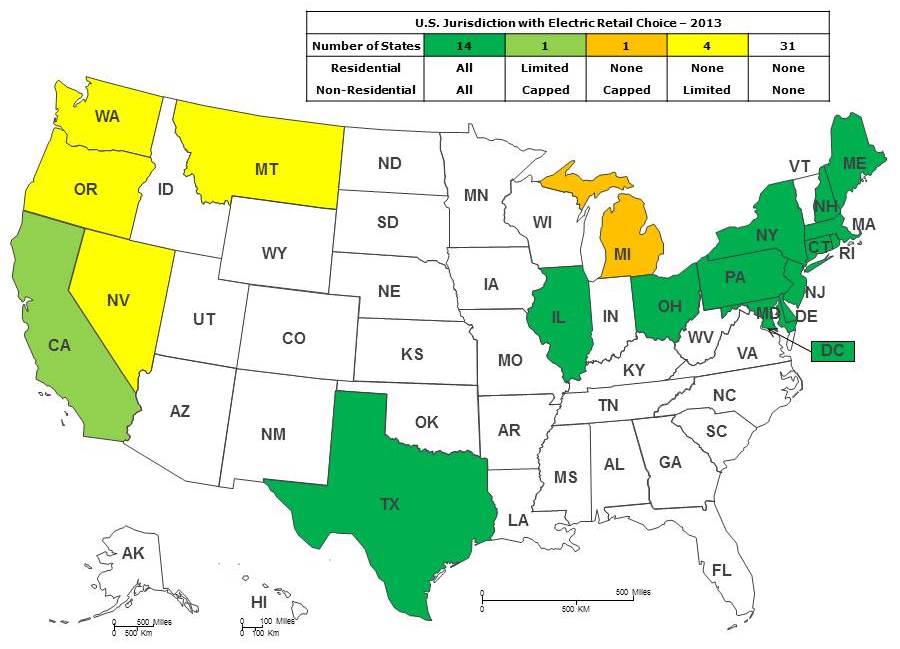
| 41 |
Unbundling of consumer electric bills in restructured markets made many aware for the first time exactly what they were paying for. In general, the bills of retail electricity customers include numerous charges that can be classified into three major categories – generation, delivery, and governmental policy costs, such as universal service, lifeline service, energy efficiency programs, and sales and use taxes. On average between 2000 and 2012, energy and delivery accounted for about 67% and 33%, respectively, of the average retail price excluding policy costs. Of course, these percentages fluctuate from year to year and state to state, primarily due to wholesale energy market conditions, weather, and state rules. The regulated portions of formerly vertically-integrated utilities, now generally known as electric or local distribution companies (“EDCs” or “LDCs”) are responsible for delivering power, billing consumers, and resolving any service issues, but customers can shop around and buy power from any licensed supplier or broker doing business in the state, hence “retail choice”.
Today, 15 years after Massachusetts and Rhode Island became the first states to effectively implement choice in 1998, 20 jurisdictions have some form of choice. However, it is important to note that not all consumers in choice jurisdictions are able to select their electricity supplier as they are served by public or cooperative utilities. Nonetheless, in the 14 areas where all rate classes have choice there are almost 24 million residential and over 2.8 million non-residential customers using about 353,000,000 MWh annually.
Overall, we believe that choice is proving to be a boon for consumers. According to an analysis of data from the EIA, between 2000 and 2012 retail rates for all customer sectors in states with restructured retail markets increased by only 12.0% compared with a 34.9% increase in states that rely on regulated utilities.
| 42 |
Company Overview
The following discussion should be read in conjunction with our consolidated financial statements, notes to those statements, and the other financial information appearing in this report. The risks and uncertainties described are not the only ones facing our Company. Additional risks and uncertainties that we are not presently aware of, or that we currently consider immaterial, may also affect our business operations. Our business, financial condition, or results of operations could suffer if the risks set forth are realized.
Through its wholly-owned subsidiaries, TCPH trades financial and physical electricity contracts in North American wholesale markets regulated by FERC and operated by ISOs and RTOs, trades energy derivative contracts on exchanges regulated by the CFTC, including ICE, NGX, and CME, provides electricity supply services to retail customers in certain states that permit retail choice, and is engaged in certain real estate development activities. Consequently, the Company has three major business segments used to measure its activity – wholesale trading, retail energy services, and real estate development.
The following shows our organizational structure as of September 30, 2014 (active entities only):
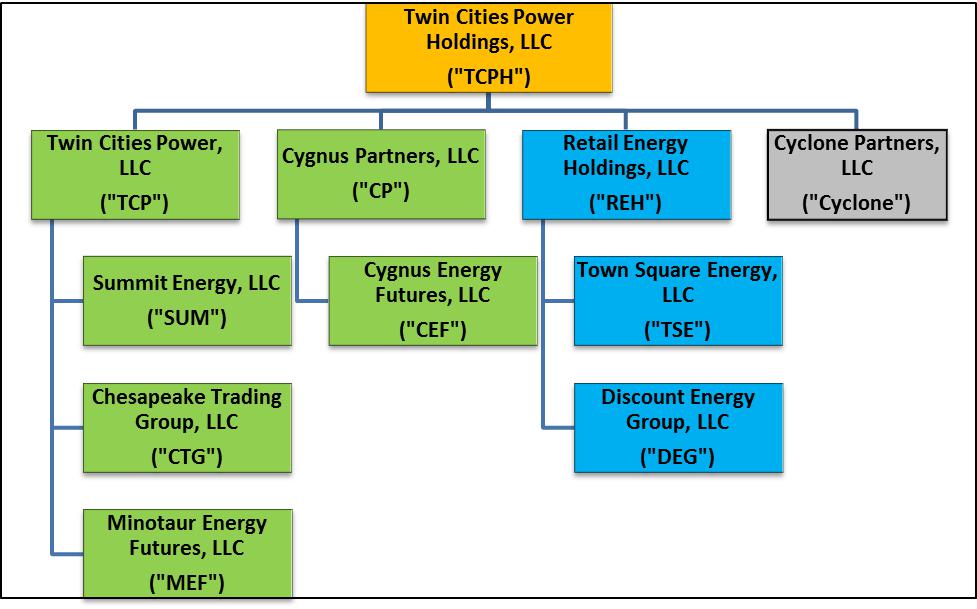
|
Key: Orange – Holding Company; Green – Wholesale Energy Trading; Light Blue – Retail Energy Services; Gray – Real Estate Development |
Wholesale Trading
In general, the Company’s trading activities are characterized by the acquisition of electricity or other energy-related commodities at a given location and its delivery to another. “Financial” transactions settle in cash in an amount equal to the difference between the purchase and sale prices, while “physical” transactions are settled by the delivery of the commodity. ISO-traded financial contracts are also known as “virtual” trades, are outstanding overnight, and settle the next day. The Company also trades electricity and other energy derivatives on ICE, NGX, and CME and may hold an open interest in these contracts overnight or longer.
| 43 |
For the three and nine months ended September 30, 2014 and 2013, financial and virtual electricity represented 100% of our total trading volume in FERC-regulated markets, that is, we traded no physical power during these periods in our wholesale segment.
Retail Energy Services
On June 29, 2012, TCP acquired certain assets and the business of Community Power & Utility LLC, a retail energy supplier serving residential and small commercial markets in Connecticut. The business was re-named TSE, and beginning on July 1, 2012, the Company began selling electricity to retail accounts. During late 2012 and early 2013, TSE applied for retail electricity supplier licenses for the states of Massachusetts, New Hampshire, and Rhode Island which were issued on various dates in 2013. On January 2, 2014, the Company acquired DEG, a retail energy business licensed by the states of Maryland, New Jersey, Pennsylvania, and Ohio. These eight states incorporate the service territories of 32 investor-owned electric utilities and as of September 30, 2014, the Company was actively marketing its services in ten of these.
Projected margins in specific utility service territories ultimately determine where the Company deploys its retail marketing resources and obtains customers. To date, our customer base consists largely of residential consumers with a few small commercial accounts. We primarily use direct marketing strategies to sell our services and our customers may typically cancel their contracts at any time.
Real Estate Development
On October 23, 2013, the Company formed Cyclone as a wholly-owned subsidiary to take advantage of certain perceived investment opportunities present in the residential real estate market in the southern portion of the Minneapolis-St. Paul metropolitan area. Specifically, Cyclone intends to acquire and develop land for resale, either as improved sites for construction of single- and multi-family homes or as completed dwellings.
Derivative Instruments
In our wholesale operations, we use derivative contracts for trading purposes, seeking to profit from perceived opportunities driven by expected changes in market prices. In our retail business, we are exposed to volatility in the cost of energy acquired for sale to customers, and as a result, we use derivatives to hedge or reduce this variability.
Our retail operations follow GAAP guidance that permits “hedge accounting”. To qualify for hedge accounting, the relationship between the “hedged item” - say power purchases for a given delivery zone - and a derivative used as a “hedging instrument” - say, a swap contract for future delivery of electricity at a related hub - must meet extensive documentation requirements and hedge effectiveness and ineffectiveness must be assessed and measured on an on-going basis. For these derivatives “designated” as cash flow hedges, the effective portion of any change in the hedging instrument’s fair value is recorded as other comprehensive income and deferred until the change in value of the hedged item is recognized in earnings. Our risk management policies also permit the use of undesignated derivatives which we refer to as “economic hedges”. For an undesignated economic hedge, all changes in the derivative financial instrument’s fair value are recognized currently in revenues.
| 44 |
The table below details our open derivative contracts held for trading purposes, as undesignated, economic hedges by our retail segment, and as cash flow hedges by our retail segment as of September 30, 2014:
Open Derivative Contracts
As of September 30, 2014
| Fair Value | ||||||||||||||||||
| Segment and contract type | Hub or zone | Delivery period | Final settlement | MWh long (short) | Asset | Liability | ||||||||||||
| Wholesale Trading | ||||||||||||||||||
| Electricity future | PJM West Hub | daily | daily | 11,200 | $ | 3,480 | $ | – | ||||||||||
| Electricity futures | AESO | Q4 2014 | various | 109,720 | 254,664 | 690,763 | ||||||||||||
| Electricity futures | AESO | Q1 2015 | various | 77,120 | 1,410,362 | 1,556,897 | ||||||||||||
| Subtotals, wholesale trading segment. | 198,040 | 1,668,506 | 2,247,660 | |||||||||||||||
| Retail Energy Services - Economic Hedges | ||||||||||||||||||
| Electricity futures | PJM West Hub | Q4 2014 | various | 14,850 | 17,088 | 46,370 | ||||||||||||
| Electricity futures | PJM West Hub | Q1 2015 | various | 17,355 | 200,012 | – | ||||||||||||
| Electricity futures | PJM West Hub | Q2 2015 | various | 14,280 | – | 50,416 | ||||||||||||
| Electricity futures | PJM West Hub | Q3 2015 | various | 16,240 | 75,408 | 45,264 | ||||||||||||
| Electricity futures | PJM West Hub | Q4 2015 | various | 21,285 | 98 | 96,368 | ||||||||||||
| Subtotals, retail energy services segment, economic hedges | 84,010 | 292,606 | 238,418 | |||||||||||||||
| Retail Energy Services - Designated Cash Flow Hedges | ||||||||||||||||||
| Electricity futures | ISO-NE Mass Hub and CT Zone | Q4 2014 | various | 24,232 | 379,114 | 76,392 | ||||||||||||
| Electricity futures | ISO-NE Mass Hub | Q1 2015 | various | 11,816 | 253,690 | 7,480 | ||||||||||||
| Electricity futures | ISO-NE Mass Hub | Q2 2015 | various | 32,128 | 37,400 | 90,998 | ||||||||||||
| Electricity futures | ISO-NE Mass Hub | Q3 2015 | various | 18,480 | 60,344 | 148,636 | ||||||||||||
| Electricity futures | ISO-NE Mass Hub | Q4 2015 | various | 1,760 | 27,895 | – | ||||||||||||
| Subtotals, retail energy services segment, cash flow hedges | 88,416 | 758,443 | 323,506 | |||||||||||||||
| Totals | 370,466 | $ | 2,719,555 | $ | 2,809,584 | |||||||||||||
| 45 |
The table below details our open derivative contracts held for trading purposes, as undesignated, economic hedges by our retail segment, and as cash flow hedges by our retail segment as of December 31, 2013:
Open Derivative Contracts
As of December 31, 2013
| Fair Value | ||||||||||||||||||
| Segment and contract type | Hub or zone | Delivery period | Final settlement | MWh long (short) | Asset | Liability | ||||||||||||
| Wholesale Trading | ||||||||||||||||||
| Electricity futures | PJM West Hub | daily | daily | 23,200 | $ | – | $ | 55,448 | ||||||||||
| Electricity futures | AESO | Q1 2014 | various | 60,600 | 614,592 | 631,708 | ||||||||||||
| Subtotals, wholesale trading segment | 83,800 | 614,592 | 687,156 | |||||||||||||||
| Retail Energy Services - Economic Hedges | ||||||||||||||||||
| Electricity futures | ISO-NE Mass Hub, NYISO Zone G, and PJM West Hub | Q1 2014 | various | 22,200 | 60,226 | 36,724 | ||||||||||||
| Electricity futures | PJM West Hub | Q2 2014 | various | 5,120 | 1,932 | 7,660 | ||||||||||||
| Electricity futures | PJM West Hub | Q3 2014 | various | 5,120 | 40,856 | 4,872 | ||||||||||||
| Electricity futures | PJM West Hub | Q3 2014 | various | 5,120 | – | 21,416 | ||||||||||||
| Subtotals, retail energy services segment, economic hedges | 37,560 | 103,014 | 70,672 | |||||||||||||||
| Retail Energy Services - Designated as Cash Flow Hedges | ||||||||||||||||||
| Electricity futures | ISO-NE Mass Hub | Q1 2014 | various | 12,200 | 289,338 | – | ||||||||||||
| Electricity futures | ISO-NE Mass Hub | Q2 2014 | various | 8,560 | 2,436 | 24,564 | ||||||||||||
| Electricity futures | ISO-NE Mass Hub | Q3 2014 | various | 5,120 | 11,588 | 251 | ||||||||||||
| Electricity futures | ISO-NE Mass Hub | Q4 2014 | various | 6,880 | 113,948 | 35,880 | ||||||||||||
| Subtotals, retail energy services segment, cash flow hedges | 32,760 | 417,310 | 60,695 | |||||||||||||||
| Totals | 154,120 | $ | 1,134,916 | $ | 818,523 | |||||||||||||
| 46 |
Results of Operations
Three Months Ended September 30, 2014 and 2013
The following table sets forth selected financial data for the periods indicated, which has been derived from the consolidated financial statements included in this report:
| For The Three Months Ended September 30, | ||||||||||||||||||||||||
| 2014 | 2013 | Increase (decrease) | ||||||||||||||||||||||
| Dollars in thousands | Dollars | Percent | Dollars | Percent | Dollars | Percent | ||||||||||||||||||
| Revenue | ||||||||||||||||||||||||
| Wholesale trading revenue, net | $ | 551 | 15.6% | $ | 9,946 | 81.4% | $ | (9,395 | ) | -94.5% | ||||||||||||||
| Retail electricity revenue | 2,988 | 84.4% | 2,275 | 18.6% | 713 | 31.3% | ||||||||||||||||||
| Net revenue | 3,539 | 100.0% | 12,221 | 100.0% | (8,682 | ) | -71.0% | |||||||||||||||||
| Operating costs & expenses | ||||||||||||||||||||||||
| Cost of retail electricity sold | 2,629 | 74.3% | 2,219 | 18.2% | 410 | 18.5% | ||||||||||||||||||
| Retail sales and marketing | 41 | 1.2% | 1 | 0.0% | 40 | 4000.0% | ||||||||||||||||||
| Compensation and benefits | 1,556 | 44.0% | 4,793 | 39.2% | (3,237 | ) | -67.5% | |||||||||||||||||
| Professional fees | 989 | 27.9% | 458 | 3.7% | 531 | 115.9% | ||||||||||||||||||
| Other general & administrative | 3,451 | 97.5% | 780 | 6.4% | 2,671 | 342.4% | ||||||||||||||||||
| Trading tools & subscriptions | 376 | 10.5% | 222 | 1.7% | 154 | 69.4% | ||||||||||||||||||
| Total operating expenses | 9,042 | 255.5% | 8,473 | 69.3% | 569 | 6.7% | ||||||||||||||||||
| Operating income (loss) | (5,503 | ) | -155.5% | 3,748 | 30.7% | (9,251 | ) | -246.8% | ||||||||||||||||
| Interest expense | (604 | ) | -17.1% | (381 | ) | -3.1% | (223 | ) | 58.5% | |||||||||||||||
| Interest income | 48 | 1.4% | 6 | -0.1% | 42 | 700.0% | ||||||||||||||||||
| Gain (loss) on foreign currency exchange | (142 | ) | -4.0% | 3 | 0.0% | (145 | ) | -4833.3% | ||||||||||||||||
| Realized gain on sale of marketable securities | 63 | 1.8% | – | 0.0% | 63 | na | ||||||||||||||||||
| Other income | 3 | 0.1% | – | 0.0% | 3 | na | ||||||||||||||||||
| Other expense, net | (632 | ) | -18.0% | (372 | ) | -3.0% | (260 | ) | 69.9% | |||||||||||||||
| Net income (loss) | (6,135 | ) | -173.4% | 3,376 | 27.6% | (9,511 | ) | -281.7% | ||||||||||||||||
| Preferred distributions | (137 | ) | -3.9% | (137 | ) | -1.1% | – | 0.0% | ||||||||||||||||
| Net income (loss) attributable to common | $ | (6,272 | ) | -177.1% | $ | 3,239 | 26.5% | $ | (9,511 | ) | -293.6% | |||||||||||||
| 47 |
Wholesale trading revenue, net: Generally, our greatest opportunities for profitable trades occur during periods of market turbulence, when the forecast for supply or demand is more likely to be inaccurate. When demand for energy is relatively stable, price variations tend to be small or non-existent. During periods of market turbulence, prices tend to be volatile, which give our traders the opportunity to take advantage of such volatility. In our wholesale trading business, we record revenues based upon changes in the fair values of the contracts we trade, net of costs. The initial recognition of fair value and subsequent changes in fair value affect reported earnings in the period the change occurs. The fair values of instruments that remain open at a balance sheet date represent unrealized gains or losses. Our primary costs in generating revenue are compensation of our energy traders as well as the interest expense of obtaining the capital necessary to post collateral.
On a wholesale level, electricity prices are highly correlated with weather and the price of natural gas, particularly in our key eastern markets, where it is the marginal fuel of choice for most generation. The benchmark price to which much of our wholesale trading is keyed is PJM West Hub and volatility in this index drives many of our revenue opportunities. While our revenues generally track changes in price, other factors come into play as well, such as the size of trades we have in place and whether or not we are buying or selling.
According to NOAA data, for the three months ended September 30, 2014, heating degree-days for the U.S. were 80 or 10% above the figure for the same period in 2013 of 73 and 1% below the 30 year normal of 81. Cooling degree-days during the third quarter of 2014 totaled 764 compared to 791 in 2013 and a normal of 816. The average temperature for the 2014 period was 70.5°F, making the quarterly period about 1% cooler than normal and last year’s 71.5°F.
During the third quarter of 2014, the Henry Hub natural gas spot price averaged $3.96/MCF, 12% above 2013’s $3.55 mark and 10% above the 5 year average price of $3.60. Supplies of gas during 2014 were adequate. Weekly storage levels averaged 2,554 BCF or 17% less than in 2013’s level of 3,063 BCF and 18% lower than the 5 year average of 3,113.
| Three Months Ended September 30, | ||||||||||||||||||||||||||||
| Increase (decrease) | ||||||||||||||||||||||||||||
| Units | This year vs last year | This year vs LTA | ||||||||||||||||||||||||||
| 2014 | 2013 | LTA (1) | Units | Percent | Units | Percent | ||||||||||||||||||||||
| U.S. Weather | ||||||||||||||||||||||||||||
| Heating degree-days | 80 | 73 | 81 | 7 | 10% | (1 | ) | -1% | ||||||||||||||||||||
| Cooling degree-days | 764 | 791 | 816 | (27 | ) | -3% | (52 | ) | -6% | |||||||||||||||||||
| Avg temperature (°F) | 70.5°F | 71.5°F | 71.5°F | -1.0°F | -1% | -0.9°F | -1% | |||||||||||||||||||||
| Natural Gas | ||||||||||||||||||||||||||||
| Henry Hub spot price ($/MCF) | 3.96 | 3.55 | 3.60 | 0.42 | 12% | 0.37 | 10% | |||||||||||||||||||||
| Working gas in underground storage, Lower 48 states, EIA weekly estimates (BCF) | |
|
2,554 |
|
|
|
3,063 |
|
|
|
3,113 |
|
|
|
(508 |
) |
|
|
-17% |
|
|
|
(558 |
) |
|
|
-18% |
|
____________________
1 - "LTA" abbreviates long term average. For weather data, the 30 year period is 1984-2013 and for natural gas the 5 year period is 2009-2013.
| 48 |
The average for the PJM West Hub peak price during the three months ended September 30, 2014 was $41.11/MWh with a standard deviation of $6.31 resulting in a coefficient of variation of 15%, compared to $47.65/MWh, $25.42, and 53% for the same period in 2013. As shown by the table below, price volatility in the 2014 period was considerably lower than that of the 2013 period.
| Three Months Ended September 30, | ||||||||||||||||
| PJM West Hub Peak Day Ahead | Increase (decrease) | |||||||||||||||
| 2014 | 2013 | Units | Percent | |||||||||||||
| Price ($/MWh) | ||||||||||||||||
| Average | 41.11 | 47.65 | (6.54 | ) | -14% | |||||||||||
| Maximum | 65.21 | 153.85 | (88.65 | ) | -58% | |||||||||||
| Minimum | 30.97 | 31.18 | (0.21 | ) | -1% | |||||||||||
| Standard deviation | 6.31 | 25.42 | (19.11 | ) | -75% | |||||||||||
| Coefficient of variation (stdev ÷ avg) | 15% | 53% | -38% | -71% | ||||||||||||
| Daily percentage changes | ||||||||||||||||
| Average | 0.1% | 1.9% | -1.8% | -93% | ||||||||||||
| Maximum | 35.9% | 127.6% | -91.8% | -72% | ||||||||||||
| Minimum | -22.0% | -55.3% | 33.3% | -60% | ||||||||||||
| Standard deviation | 10.3% | 21.3% | -11.0% | -52% | ||||||||||||
| Number of days | ||||||||||||||||
| Up 10% or more | 11 | 13 | (2 | ) | -15% | |||||||||||
| Between 10% up and 10% down | 40 | 38 | 2 | 5% | ||||||||||||
| Down 10% or more | 13 | 13 | – | 0% | ||||||||||||
On November 14, 2014, the Company settled with FERC. See “Note 15 – FERC Investigation”. Disgorgement of profits, including interest ($1,106,000), is recorded as a reduction of revenue during the period ended September 30, 2014, since the payment relates to the trades that were initially recorded in revenue during the 13 month period from January 1, 2010 to January 31, 2011. With regard to the civil penalty ($2,500,000), the Company has expensed it as an operating expense since the charge results from the Company’s operations.
Largely as a result of these factors for the three months ended September 30, 2014, net trading revenue decreased by $9,395,000 or 94.5% to $551,000 compared to $9,946,000 for the same period in 2013.
Retail electricity sales: Revenue from the retail sale of electricity is recorded in the period in which customers consume the commodity, net of any applicable sales tax. Revenue applicable to electricity consumed by customers but not yet billed under the cycle billing method is estimated and accrued along with the related costs. Changes in estimates are reflected in operations in the period in which they are refined.
In the third quarter of 2014, in addition to the designated hedges described below in “costs of retail electricity sold” to which hedge accounting was applied, we also used certain derivative contracts to which hedge accounting was not applied as economic hedges to reduce our exposure to higher costs. Consequently, the gain on these contracts is reported as “wholesale trading revenue, net”. For the three months ended September 30, 2014 and 2013, we recorded wholesale trading revenues of $54,730 and $0, respectively, in our retail energy services segment.
During the third quarter of 2014, exclusive of these gains on economic hedges, we recognized retail sales revenue of $2,988,000 compared to $2,275,000 for 2013, up 31.3%, principally as a result of increased prices and an increased customer count.
| 49 |
The following table summarizes the key operating statistics of our retail business.
| For/At Three Months Ended September 30, | ||||||||||||||||
| Key Operating Statistics | Increase (decrease) | |||||||||||||||
| 2014 | 2013 | Units | Percent | |||||||||||||
| Wholesale trading ($000s) | 55 | – | 55 | na | ||||||||||||
| Retail electricity sales ($000s) | 2,988 | 2,275 | 714 | 31.4% | ||||||||||||
| Total retail revenues ($000s) | 3,043 | 2,275 | 768 | 33.8% | ||||||||||||
| Unit sales (MWh) | 33,452 | 30,862 | 2,590 | 8.4% | ||||||||||||
| Average retail price (¢/kWh) | 8.93 | 7.37 | 1.56 | 21.2% | ||||||||||||
| Customers receiving service, EoP | 14,644 | 10,116 | 4,528 | 44.8% | ||||||||||||
| New customer sign-ups, net of (drops) | 4,839 | 1,911 | 2,928 | 153.2% | ||||||||||||
| Avg daily sign-ups (drops) | 53 | 21 | 32 | 153.2% | ||||||||||||
Real estate development, net: Revenues from real estate developments, if any, are recognized at the time of sale closing if all significant conditions are satisfied, including adequate down payment, reasonable assurance of collectability of any notes received, and completion of other contract requirements. Recognition of all or part of the revenue is deferred if any significant conditions are not satisfied.
Costs that relate directly to development projects are capitalized and allocated using the specific identification method. Land acquisition, improvements, and holding costs, including real estate taxes and interest are capitalized while a development is in progress. Interest expense, if any, is capitalized based on specific identification of notes payable issued to finance specific assets under development. Once development on a project has been completed and sales have begun, remaining inventory is recorded at the lower of cost or market. Development costs are charged to cost of sales when the related revenue is recognized or when a development is abandoned.
During the three months ended September 30, 2014, the Company recorded no revenue or income but capitalized a total of $31,504 of costs associated with its real estate development activities.
Costs of retail electricity sold: Our costs of electricity sold include the cost of purchased power, EDC service fees, renewable energy certificates, bad debt expense, and gains net of losses and commissions on derivative contracts used to hedge power purchase costs. For the three months ended September 30, 2014, the Company purchased electricity sold to retail customers in ISO-NE’s and PJM’s wholesale markets and from certain other wholesale suppliers. The Company is required to maintain cash deposits in separate accounts to meet our wholesale energy vendors’ financial assurance requirements to purchase energy, ancillary services, and capacity which amount is included in “cash in trading accounts”.
During the third quarter of 2014, we fixed part of the cost of the energy sold to our customers using 18,602 MWh of forward physical purchases and 27,200 MWh of derivatives designated as cash flow hedges. For the three months ended September 30, 2014 and 2013, our designated hedges had the effect of increasing cost of retail electricity sold by $243,028 and $105,549, respectively.
As shown by the Open Derivative Contracts table on page 45, as of September 30, 2014, we had designated 88,416 MWh of electricity futures as hedges against the cost of expected 2014 and 2015 electricity purchases. $434,937, representing the net gain on the effective portion of the hedges, was deferred in accumulated other comprehensive income and $302,722 and $132,215 of this amount is expected to be reclassified to cost of retail electricity sold by December 31, 2014 and 2015, respectively.
| 50 |
For the three months ended September 30, 2014, our cost of retail electricity sold, net of gains on designated hedges, increased by $410,000 or 18.5% to $2,629,000 compared to $2,219,000 for the same period in 2013.
Compensation and benefits: Salaries, wages, and related expenses such as employee benefits and payroll taxes consist primarily of base and incentive compensation paid to our administrative officers, energy traders, and other employees.
Even though we hired additional traders in the second quarter of 2014, for the three months ended September 30, 2014, salaries, wages, and related costs decreased by $3,237,000 or 67.5% to $1,556,000 compared to $4,793,000 for the same period in 2013. A substantial portion of our personnel expense is directly related to the revenue we record, since our traders’ compensation is tied to revenue production.
Professional fees: Professional fees consist of legal expenses, audit fees, tax compliance reporting service fees, and other fees paid for outside consulting services.
For the third quarter of 2014, professional fees increased by $531,000 or 115.9% to $989,000 compared to $458,000 for the same period in 2013, due to higher consulting fees, the acquisition of DEG, and increased legal fees related to the FERC investigation.
Other general and administrative: Other general and administrative expenses consist of rent, depreciation, amortization, travel, outside retail marketing and customer service costs, and all other direct office support expenses.
For the three months ended September 30, 2014, these costs increased by approximately $2,671,000 to $3,451,000 compared to $780,000 for the same period in 2013. The increase was primarily related to the FERC settlement; and an increase in amortization expense by $77,000 to $172,000 from $95,000 due to the amortization of certain intangible assets acquired in connection with the DEG acquisition. Also, with the DEG acquisition the entity has accumulated its own general and administrative expenses that did not exist in the same period in 2013. The Company also continues to incur marketing costs and administrative expenses associated with the Notes Offering.
Trading tools and subscriptions: Trading tools and subscriptions consist primarily of amounts paid for services that provide weather reports and forecasting, electrical load forecasting, congestion analysis and other factors relative to electricity production and consumption.
For the period ended September 30, 2014, trading tools and subscriptions expense increased by $154,000 or 69.4% to $376,000 compared to $222,000 for the same period in 2013, primarily due to the acquisition of DEG and the increase in the number of traders.
Other income (expense): Other expense, net of other income, increased by $260,000 to $632,000 for 2014 compared to $372,000 for 2013. As the principal component of other expense, interest expense increased by $223,000 to $604,000 for the three months from $381,000 during the same period in 2013. The increase was attributed primarily to an increase in outstanding debt of $2,651,000 for the three months ended September 30, 2014 compared to an increase of $19,000 for the three months ended September 30, 2013.
Preferred distributions: During the second quarters of 2014 and 2013, we distributed $137,000 to preferred unit holders.
| 51 |
Nine Months Ended September 30, 2014 and 2013
The following table sets forth selected financial data for the periods indicated, which has been derived from the consolidated financial statements included in this report:
| For The Nine Months Ended September 30, | ||||||||||||||||||||||||
| Dollars in thousands | 2014 | 2013 | Increase (decrease) | |||||||||||||||||||||
| Dollars | Percent | Dollars | Percent | Dollars | Percent | |||||||||||||||||||
| Revenue | ||||||||||||||||||||||||
| Wholesale trading revenue, net | $ | 29,415 | 78.4% | $ | 24,535 | 82.2% | $ | 4,880 | 19.9% | |||||||||||||||
| Retail electricity revenue | 8,115 | 21.6% | 5,310 | 17.8% | 2,805 | 52.8% | ||||||||||||||||||
| Net revenue | 37,530 | 100.0% | 29,845 | 100.0% | 7,685 | 25.7% | ||||||||||||||||||
| Operating costs & expenses | ||||||||||||||||||||||||
| Cost of retail electricity sold | 8,897 | 23.7% | 5,501 | 18.4% | 3,396 | 61.7% | ||||||||||||||||||
| Retail sales & marketing | 192 | 0.5% | 1 | 0.0% | 191 | 19100% | ||||||||||||||||||
| Compensation & benefits | 14,479 | 38.6% | 11,172 | 37.4% | 3,307 | 29.6% | ||||||||||||||||||
| Professional fees | 3,487 | 9.3% | 3,958 | 13.3% | (471 | ) | -11.9% | |||||||||||||||||
| Other general & administrative | 5,118 | 13.6% | 2,111 | 7.1% | 3,007 | 142.4% | ||||||||||||||||||
| Trading tools & subscriptions | 1,005 | 2.7% | 708 | 2.4% | 297 | 41.9% | ||||||||||||||||||
| Total operating expenses | 33,178 | 88.4% | 23,451 | 78.6% | 9,727 | 41.5% | ||||||||||||||||||
| Operating income | 4,352 | 11.6% | 6,394 | 21.4% | (2,042 | ) | -31.9% | |||||||||||||||||
| Interest expense | (1,586 | ) | -4.2% | (1,090 | ) | -3.7% | (497 | ) | 45.6% | |||||||||||||||
| Interest income | 100 | 0.3% | 21 | 0.1% | 79 | 367.3% | ||||||||||||||||||
| Loss on foreign currency exchange | (403 | ) | -1.1% | 3 | 0.0% | (406 | ) | -11953% | ||||||||||||||||
| Realized gain on sale of marketable securities | 66 | 0.2% | – | 0.0% | 66 | na | ||||||||||||||||||
| Other income | 6 | 0.0% | – | 0.0% | 6 | na | ||||||||||||||||||
| Other expense, net | (1,817 | ) | -4.8% | (1,065 | ) | -3.6% | (752 | ) | 70.7% | |||||||||||||||
| Income before | ||||||||||||||||||||||||
| income taxes | 2,535 | 6.8% | 5,329 | 17.9% | (2,794 | ) | -52.4% | |||||||||||||||||
| Income tax provision | – | 0.0% | 9 | 0.0% | (9 | ) | -100.0% | |||||||||||||||||
| Net income | 2,535 | 6.8% | 5,320 | 17.8% | (2,785 | ) | -52.4% | |||||||||||||||||
| Preferred distributions | (412 | ) | -1.1% | (412 | ) | -1.4% | – | 0.0% | ||||||||||||||||
| Net income attributable to common | $ | 2,123 | 5.7% | $ | 4,908 | 16.4% | $ | (2,785 | ) | -56.7% | ||||||||||||||
Wholesale trading revenue, net: Market conditions in the first nine months of 2014 were exceptionally favorable for us during the first quarter and adverse in the second and third. We successfully capitalized on the exceptional market volatility brought about by the “polar vortex”, which largely disappeared in the April to September period.
According to NOAA data, for the nine months ended September 30, 2014, heating degree-days for the U.S. were 3,054 or 8% above the figure for the same period in 2013 of 2,840 and 11% above the 30 year normal of 2,745. Cooling degree-days during the nine months ended September 30, 2014 totaled 1,182 compared to 1,193 in 2013 and a normal of 1,227. The average temperature for the 2014 period was 55.2°F, making the quarterly period about 3% cooler than normal (59.6°F) and 1% cooler than last year’s 55.9°F.
During the first nine months of 2014, the Henry Hub natural gas spot price averaged $4.57/MCF, 24% above 2013’s $3.69 mark and 21% above the 5 year average price of $3.76. Supplies of gas during 2014 were adequate. Weekly storage levels averaged 1,832 BCF or 27% less than in 2013’s level of 2,523 and 28% lower than the 5 year average of 2,547.
| 52 |
| Nine Months Ended September 30, | ||||||||||||||||||||||||||||
| Increase (decrease) | ||||||||||||||||||||||||||||
| Units | This year vs last year | This year vs LTA | ||||||||||||||||||||||||||
| 2014 | 2013 | LTA (1) | Units | Percent | Units | Percent | ||||||||||||||||||||||
| U.S. Weather | ||||||||||||||||||||||||||||
| Heating degree-days | 3,054 | 2,840 | 2,745 | 214 | 8% | 309 | 11% | |||||||||||||||||||||
| Cooling degree-days | 1,182 | 1,193 | 1,227 | (11 | ) | -1% | (45 | ) | -4% | |||||||||||||||||||
| Avg temperature (°F) | 55.2°F | 55.9°F | 56.9°F | -0.7°F | -1% | -1.7°F | -3% | |||||||||||||||||||||
| Natural Gas | ||||||||||||||||||||||||||||
| Henry Hub spot price ($/MCF) | 4.57 | 3.69 | 3.76 | 0.88 | 24% | 0.81 | 21% | |||||||||||||||||||||
| Working gas in underground storage, Lower 48 states, EIA weekly estimates (BCF) | 1,832 | 2,523 | 2,547 | (691 | ) | -27% | (716 | ) | -28% | |||||||||||||||||||
_____________________
1 - "LTA" abbreviates long term average. For weather data, the 30 year period is 1984-2013 and for natural gas the 5 year period is 2009-2013.
The average for the PJM West Hub peak price during the nine months ended September 30, 2014 was $64.50/MWh with a standard deviation of $62.18 resulting in a coefficient of variation of 96%, compared to $44.27/MWh, $16.31, and 37% for the same period in 2013. As shown by the table below, price volatility was generally much higher in the 2014 period as compared to 2013.
| Nine Months Ended September 30, | ||||||||||||||||
| PJM West Hub Peak Day Ahead | Increase (decrease) | |||||||||||||||
| 2014 | 2013 | Units | Percent | |||||||||||||
| Price ($/MWh) | ||||||||||||||||
| Average | 64.50 | 44.27 | 20.23 | 46% | ||||||||||||
| Maximum | 655.75 | 153.85 | 501.89 | 326% | ||||||||||||
| Minimum | 30.97 | 29.70 | 1.26 | 4% | ||||||||||||
| Standard deviation | 62.18 | 16.31 | 45.87 | 281% | ||||||||||||
| Coefficient of variation (stdev ÷ avg) | 96% | 37% | 60% | 162% | ||||||||||||
| Daily percentage changes | ||||||||||||||||
| Average | 3.3% | 1.2% | 2.1% | 183% | ||||||||||||
| Maximum | 200.3% | 127.6% | 72.7% | 57% | ||||||||||||
| Minimum | -78.1% | -55.3% | -22.8% | 41% | ||||||||||||
| Standard deviation | 28.9% | 15.7% | 13.2% | 85% | ||||||||||||
| Number of days | ||||||||||||||||
| Up 10% or more | 51 | 38 | 13 | 34% | ||||||||||||
| Between 10% up and 10% down | 90 | 119 | (29 | ) | -24% | |||||||||||
| Down 10% or more | 50 | 34 | 16 | 47% | ||||||||||||
Largely as a result of these factors, including the resolution of the FERC settlement, for the nine months ended September 30, 2014, net trading revenue increased by $4,880,000 or 19.9% to $29,415,000 compared to $24,535,000 for the same period in 2013.
Retail electricity sales: During the nine months ended September 30, 2014, we recognized retail sales revenue of $8,115,000 compared to $5,310,000 for 2013, up 52.8%, principally as a result of increases in the amount of energy used per customer, increased prices, and an increased customer count.
| 53 |
For the nine month period ended September 30, 2014, in addition to the designated hedges described below in “costs of retail electricity sold” to which hedge accounting was applied, we also used certain derivative contracts to which hedge accounting was not applied as economic hedges to reduce our exposure to higher costs. Consequently, the gain on these contracts is reported as “wholesale trading revenue, net.” For the nine month periods ended September 30, 2014 and 2013, we recorded wholesale trading revenues of $2,105,000 and $0, respectively, in our retail energy services segment.
The following table summarizes the key operating statistics of our retail business for the first nine months of 2014 and 2013.
| For/At Nine Months Ended September 30, | ||||||||||||||||
| Key Operating Statistics | Increase (decrease) | |||||||||||||||
| 2014 | 2013 | Units | Percent | |||||||||||||
| Wholesale trading ($000s) | 2,105 | – | 2,105 | na | ||||||||||||
| Retail electricity sales ($000s) | 8,115 | 5,310 | 2,805 | 52.8% | ||||||||||||
| Total retail revenues ($000s) | 10,220 | 5,310 | 4,910 | 92.5% | ||||||||||||
| Unit sales (MWh) | 80,655 | 71,327 | 9,328 | 13.1% | ||||||||||||
| Average retail price (¢/kWh) | 10.06 | 7.44 | 2.62 | 35.1% | ||||||||||||
| Customers receiving service, EoP | 14,644 | 10,116 | 4,528 | 44.8% | ||||||||||||
| New customer sign-ups, net of (drops) | 3,679 | 6,729 | (3,050 | ) | -45.3% | |||||||||||
| Avg daily sign-ups (drops) | 13 | 25 | (11 | ) | -45.3% | |||||||||||
Real estate development, net: During the nine months ended September 30, 2014, the Company recorded no revenue or income but capitalized a total of $88,009 of costs associated with its real estate development activities.
Costs of retail electricity sold: During the nine months ended September 30, 2014, we fixed part of the cost of the energy sold to our customers using 27,885 MWh of forward physical purchases and 59,075 MWh of derivatives designated as cash flow hedges. For the nine months ended September 30, 2014 and 2013, our designated hedges had the effect of decreasing cost of retail electricity sold by $175,521 and $147,694, respectively.
Principally as a result of increases in the amount of energy used per customer, increased costs, and an increase customer count, for the nine months ended September 30, 2014, our cost of retail electricity sold, net of gains on designated hedges, increased by $3,396,000 or 61.7% to $8,897,000 compared to $5,501,000 for the same period in 2013.
Compensation and benefits: For the nine months ended September 30, 2014, salaries, wages, and related costs increased by $3,007,000 or 29.6% to $14,479,000 compared to $11,172,000 for the same period in 2013. Our personnel expense is directly related to the revenue we record, since our traders’ compensation is tied to revenue production.
Professional fees: For the nine months ended September 30, 2014, professional fees decreased by $471,000 to $3,487,000 compared to $3,958,000 for the same period in 2013, primarily due to higher consulting fees incurred in the comparable 2013 period.
Other general and administrative: For the nine months ended September 30, 2014, these costs increased by approximately $3,007,000 to $5,118,000 compared to $2,111,000 for 2013. The increase was primarily related to the FERC settlement and an increase in amortization expense by $272,000 to $541,000 from $269,000 due to the amortization of certain intangible assets acquired in connection with the DEG acquisition. In addition, DEG incurred an additional $92,000 of general and administrative expenses in the period that were not present in 2013. Finally, the Company donated $50,000 and $0 to charities during the periods ending September 30, 2014 and 2013, respectively, and continues to incur marketing costs and administrative expenses associated with the Notes Offering.
| 54 |
Trading tools and subscriptions: For the nine months ended September 30, 2014, trading tools and subscriptions expense increased by $297,000 or 41.9% to $1,005,000 compared to $708,000 for the same period in 2013, primarily due to the acquisition of DEG and the increase in the number of traders.
Other income (expense): Other expense, net of other income, increased by $752,000 to $1,817,000 for the first nine months of 2014 compared to $1,065,000 for the same period in 2013. As the principal component of other expense, interest expense increased by $497,000 to $1,586,000 for the year to date from $1,090,000 during 2013. The increase was attributed primarily to an increase in outstanding debt of $6,163,000 for the nine month period ended September 30, 2014 compared to $2,079,000 for the nine month period ended September 30, 2013.
Preferred distributions: During the nine months ended September 30, 2014 and 2013, we distributed $412,000 to preferred unit holders.
Liquidity, Capital Resources, and Cash Flow
In our wholesale trading business, we require a significant amount of cash to maintain collateral with the trading markets in which we operate, which in turn allows us to trade in those markets and generate revenues. With respect to our retail operation, in addition to collateral posted with ISOs that allow us to acquire power for our customers, we are also required to fund accounts receivable as well as margin requirements associated with hedges. We are generally required to pay for power every 4 days or so, while our average collection period on receivables is 40 to 45 days. As such, our capital is largely invested in trading accounts and deposits and receivables. Our capital expenditure requirements are nominal, being limited to computer and office equipment, software, and office furniture. Therefore, in any given reporting period, the amount of cash consumed or generated will primarily be due to changes in working capital.
Historically, our capital requirements have been funded by notes payable and operating profits and we are dependent on cash on hand, cash-flow positive operations, and additional financing to service our existing obligations. Should we incur significant losses from operations within a short period, we might be forced to cover such payments by reducing the balances in our trading accounts, which would have a detrimental effect on the Company.
We are taxed as a partnership for income tax purposes which means that we do not pay any income taxes. All of our income (or loss) for each year is allocated among holders of our common units who are then personally responsible for the tax liability associated with such income. Our Member Control Agreement provides for distributions of cash to these members based upon their respective ownership interests in the amount necessary to permit the member who is in the highest income tax bracket to pay all state and federal taxes on our net income allocated to such member.
The decision to make distributions other than tax distributions to holders of our common units and required distributions to holders of preferred units is at the discretion of our Board of Governors (the “Board”) and depends on various factors, including our results of operations, financial condition, capital requirements, contractual restrictions, outstanding indebtedness, investment opportunities, and other factors considered by the Board to be relevant. The indenture governing our Notes prohibits us from paying distributions to our members if there is an event of default with respect to the Notes or if payment of the distribution would result in an event of default. The indenture also prohibits our Board from declaring or paying any distributions other than tax distributions if, in the reasonable determination of the Board, the Company would have insufficient cash to meet anticipated Note redemption or repayment obligations.
| 55 |
While we believe we have sufficient cash on hand, coupled with anticipated cash generated from operating activities and the anticipated proceeds from our Notes Offering to meet our operating cash requirements for at least the balance of 2014, we regularly evaluate other potential sources of capital, which may include sourcing additional financing in the form of debt in order to provide added flexibility to support our working capital needs and reduce our overall costs of borrowing. In addition, the Company currently has sufficient liquidity for its operating requirements and expects to use a portion of its available cash to finance additional retail energy expansion and acquisitions.
The following table is presented as a measure of our liquidity and capital resources as of the dates indicated:
| At | ||||||||||||||||||||||||
| Dollars in thousands | September 30, 2014 | December 31, 2013 | Increase (decrease) | |||||||||||||||||||||
| Dollars | Percent of total assets | Dollars | Percent of total assets | Dollars | Percent | |||||||||||||||||||
| Liquidity | ||||||||||||||||||||||||
| Cash - unrestricted | $ | 2,938 | 10.7% | $ | 3,190 | 18.2% | $ | (252 | ) | -7.9% | ||||||||||||||
| Cash in trading accounts | 16,513 | 60.3% | 10,484 | 59.7% | 6,029 | 57.5% | ||||||||||||||||||
| Accounts receivable - trade | 2,560 | 9.3% | 1,315 | 7.5% | 1,245 | 94.7% | ||||||||||||||||||
| Total liquid assets | 22,011 | 80.4% | 14,989 | 85.4% | 7,022 | 46.8% | ||||||||||||||||||
| Total assets | $ | 27,388 | 100.0% | $ | 17,562 | 100.0% | $ | 9,826 | 56.0% | |||||||||||||||
| Capital Resources | ||||||||||||||||||||||||
| Current | $ | 7,508 | 27.4% | $ | 5,123 | 29.2% | $ | 2,385 | 46.6% | |||||||||||||||
| Long term | 8,840 | 32.3% | 5,062 | 28.8% | 3,778 | 74.6% | ||||||||||||||||||
| Total debt | 16,348 | 59.7% | 10,185 | 58.0% | 6,163 | 60.5% | ||||||||||||||||||
| Series A preferred | 2,745 | 10.0% | 2,745 | 15.6% | – | 0.0% | ||||||||||||||||||
| Common | 933 | 3.4% | 2,003 | 11.4% | (1,070 | ) | (53.4% | ) | ||||||||||||||||
| Total equity | 3,678 | 13.4% | 4,748 | 27.0% | (1,070 | ) | (22.5% | ) | ||||||||||||||||
| Total capitalization | $ | 20,026 | 73% | $ | 14,933 | 84.9% | $ | 5,093 | 34.1% | |||||||||||||||
| 56 |
The table below summarizes our primary sources and uses of unrestricted cash for the nine months ended September 30, 2014 and 2013 as derived from the statements of cash flows included in this Form 10-Q.
| For the Nine Months Ended September 30, | ||||||||||||||||
| Dollars in thousands | Increase (decrease) | |||||||||||||||
| 2014 | 2013 | Dollars | Percent | |||||||||||||
| Net cash | ||||||||||||||||
| provided by (used in): | ||||||||||||||||
| Operating activities | $ | 733 | $ | 9,197 | $ | (8,464 | ) | (92.0 | )% | |||||||
| Investing activities | (3,243 | ) | (263 | ) | (2,980 | ) | 1133.1 | % | ||||||||
| Financing activities | 1,897 | (521 | ) | 2,418 | 364.1 | % | ||||||||||
| Net cash flow | (613 | ) | 8,413 | (9,026 | ) | (107.3 | )% | |||||||||
| Effect of exchange | ||||||||||||||||
| rate changes on cash | 360 | (170 | ) | 530 | 211.8 | % | ||||||||||
| Cash - unrestricted: | ||||||||||||||||
| Beginning of period | 3,190 | 772 | 2,418 | 313.2 | % | |||||||||||
| End of period | $ | 2,937 | $ | 9,014 | $ | (6,078 | ) | (67.4 | )% | |||||||
At September 30, 2014, our debt totaled $16,348,000 compared to $10,185,000 as of the prior year end. For the nine months ended September 30, 2014, we generated $733,000 of cash from operating activities and used $3,243,000 for investments in property, equipment, furniture, land held for development, certain securities, and restricted cash. Financing activities provided net cash of $1,897,000, including a net increase in debt of $5,935,000 and the payment of $4,038,000 in distributions. Of the total distribution amount, $412,000 was paid to the holder of our preferred units and $3,626,000 was paid to our common unit-holders.
Financing
In February 2012, we executed a $25,000,000 Futures Risk-Based Margin Finance Agreement for the benefit of CEF (the “Margin Line” and the “Margin Agreement”, respectively) with ABN AMRO. The Margin Agreement provides an uncommitted revolving line of credit for which CEF pays a monthly commitment fee. Loans under the Margin Agreement are secured by all balances in CEF’s trading accounts with ABN AMRO, are payable on demand, and bear interest at an annual rate equal to 1.00% in excess of the Federal Funds Target Rate, or approximately 1.25%. Under the Margin Agreement, the Company is also subject to certain reporting, affirmative, and negative covenants, including maintenance of minimum account net liquidating equity, a maximum loan ratio as defined, and minimum consolidated tangible net worth as defined. The Margin Agreement was amended on May 31, 2013 to reduce the credit line to $15,000,000, the commitment fee to $25,000 per month, and the covenant with respect to net liquidating equity as defined to $1,500,000.
On May 10, 2012, our Form S-1 registration statement relating to our offer and sale of Renewable Unsecured Subordinated Notes (File No. 333-179460) was declared effective by the SEC, and our offering of notes commenced on May 15, 2012. The registration statement on Form S-1 covers up to $50,000,000 in principal amount of 3 and 6 month and 1, 2, 3, 4, 5, and 10 year notes.
| 57 |
For the nine month periods ended September 30, 2014 and 2013, we incurred $953,000 and $841,000, respectively, of offering-related expenses, including marketing and printing expense, legal and accounting fees, filing fees, and trustee fees. These costs and expenses are expensed as incurred. From the effective date of May 10, 2012 through August 13, 2014, we have sold a total of $17,619,689 in principal amount of Notes and repaid $1,497,903, for a net raise to date of $16,121,786, exclusive of offering costs as described above.
On May 12, 2014, the Company drew $700,000 under an evergreen, uncommitted line of credit from Royal Bank of Canada (the “RBC Line” and “RBC”, respectively). Advances under the RBC Line bear interest at a variable annual interest rate of 1 month LIBOR plus 2.25% set at the time of advance for a 30 day term, mature at various dates, and are collateralized by assets held in the Company’s marketable securities account. RBC is not obligated to make any extensions of credit to the Company and availability of funds may be increased or decreased by RBC in its sole and absolute discretion. Prepayment of any outstanding principal under the RBC Line may subject the Company to LIBOR break funding costs.
On June 16, 2014, the Company purchased a single family home in Garrison, Minnesota for use as a corporate retreat (the “Garrison Property”) for a purchase price of $285,000, paid with $57,000 of cash and the proceeds of a $228,000 note (the “Security State Mortgage”) advanced by the Security State Bank of Aitkin (“Security State”) and secured by a first mortgage. The loan is payable in 239 equal installments of $1,482 due on the 16th of each month beginning on July 16, 2014 and one irregular installment of $1,482 due on June 16, 2034 (the “maturity date”). The note bears interest at an annual rate equal to the prime rate as published from time to time by The Wall Street Journal plus 0.75%, subject to a floor of 4.75%. Whenever increases occur in the interest rate, Security State, at its option and with notice to the Company, may: (a) increase the Company’s payments to insure the loan will be paid off by the maturity date; (b) increase the Company’s payments to cover accruing interest; (c) increase the number of the Company’s payments; or (d) continue the payments at the same amount and increase the Company’s final payment. The loan may be prepaid in whole or in part at any time without penalty.
On October 14, 2014, REH, TSE, and DEG entered into a Credit Agreement with the Toronto, Ontario branch of Maple Bank GmbH (the “Maple Agreement” and “Maple Bank”), expiring October 31, 2016. The Maple Agreement provides the Company’s retail energy services businesses with a revolving line of credit of up to $5,000,000 in committed amount secured by a first position security interest in all of the assets, a pledge of the equity of such businesses by TCPH, and certain guarantees. Availability of loans is keyed to advance rates against certain eligible receivables as defined. Any loans outstanding bear interest at an annual rate equal to 3 month LIBOR, subject to a floor of 0.50%, plus a margin of 6.00%. In addition, the Company is obligated to pay an annual fee of 1.00% of the committed amount on a monthly basis and a monthly non-use fee of 1.00% of the difference between the committed amount and the average daily principal balance of any outstanding loans. The Company is also subject to certain customary reporting, affirmative, and negative covenants.
| 58 |
Effective January 31, 2012, TCP sold certain financial rights, but not governance rights, to 496 new membership units, which we refer to as “redeemable preferred units”, to John Hanson for a purchase price of $2,745,000, paid by conversion of certain notes payable to him. Effective July 1, 2012, these preferred units were exchanged for preferred units with identical terms issued by TCPH. From the effective date to the redemption date, we paid Mr. Hanson and his designee a guaranteed distribution of $45,750 per month. Effective June 28, 2013, pursuant to a Membership Unit Purchase Agreement, Timothy Krieger, the CEO of the Company, purchased the 496 redeemable preferred units from Mr. Hanson. Concurrently with the purchase, Mr. Krieger and the Company exchanged the redeemable preferred units for an identical number of new Series A Preferred Units (the “Series A Preferred”) and the redeemable preferred units were cancelled. The Series A preferred is not redeemable, callable, or convertible, is non-voting with respect to elections to the Board, is senior to the Company’s common equity units with respect to rights in liquidation, and is entitled to distributions out of legally available funds in the amount of $92.25 per unit per month.
Non-GAAP Financial Measures
The Company’s communications may include certain non- GAAP financial measures. A “non-GAAP financial measure” is defined as a numerical measure of a company's financial performance, financial position, or cash flows that excludes, or includes, amounts that are included in, or excluded from, the most directly comparable measure calculated and presented in accordance with GAAP in the company's financial statements.
Non-GAAP financial measures utilized by the Company include presentations of liquidity measures and debt-to-equity ratios. The Company’s management believes that these non-GAAP financial measures provide useful information to investors and enable investors and analysts to more accurately compare the Company's ongoing financial performance over the periods presented.
Critical Accounting Policies and Estimates
Revenue Recognition and Commodity Derivative Instruments
Revenues in our wholesale trading business are derived from trading financial, physical, and derivative energy contracts while those for our retail segment result from electricity sales to end-use consumers.
In our trading activities, contracts with the exchanges on which we trade permit net settlement, including the right to offset cash collateral in the settlement process. Accordingly, we net cash collateral against the derivative position in the accompanying consolidated balance sheets. All realized and unrealized gains and losses on derivative instruments are recorded in revenues.
| 59 |
Revenue from the retail sale of electricity is recorded in the period in which customers consume the commodity, net of any applicable sales tax. In our retail business, we are exposed to volatility in the cost of energy acquired for sale to customers, and as a result, in October 2012, we began using derivatives to hedge or reduce this variability, since changes in the price of certain derivatives are expected to be highly effective at offsetting changes in this cost. In addition to cash flow hedges, beginning in the first quarter of 2014 we also used certain other contracts to which hedge accounting was not applied to reduce our exposure to higher electricity costs. The gain on these economic hedges is reported as “wholesale trading revenue.”
Revenues from real estate developments, if any, are recognized at the time of sale closing if all significant conditions are satisfied, including adequate down payment, reasonable assurance of collectability of any notes received, and completion of other contract requirements. Recognition of all or part of the revenue is deferred if any significant conditions are not satisfied. Costs that relate directly to development projects are capitalized and allocated using the specific identification method. Land acquisition, improvements, and holding costs, including real estate taxes and interest are capitalized while a development is in progress. Interest expense, if any, is capitalized based on specific identification of notes payable issued to finance specific assets under development. Once development on a project has been completed and sales have begun, remaining inventory is recorded at the lower of cost or market. Development costs are charged to cost of sales when the related revenue is recognized or when a development is abandoned.
Profits Interest Payments
Two of our second-tier subsidiaries (SUM and CEF) have Class B members. Under the terms of such subsidiaries’ member control agreements, Class B members have no voting rights, are not required to contribute capital, and have no rights to distributions following termination of employment, but are entitled to a defined share of profits while employed. Since Class B members have no corporate governance rights or risk of capital loss (or gain), they do not own non-controlling equity interests and profits interests payments are recorded as compensation expense during the period earned and are classified as accrued compensation on the balance sheet.
For the three and nine month periods ended September 30, 2014 and 2013, we recorded $143,421, $2,033,937, $5,566,833, and $4,142,009, respectively, in salaries and wages and related taxes, representing the allocation of profits to Class B members. The amount of accrued profits interests included in accrued compensation at September 30, 2014 and 2013 was $150,187 and $2,041,474, respectively.
| 60 |
Item 3 - Quantitative and Qualitative Disclosures about Market Risk
We are exposed to market risk in our normal business activities. Market risk is the potential loss that may result from changes associated with an existing or forecasted financial or commodity transaction. The types of market risks we are exposed to are commodity price risk, interest rate risk, liquidity risk, credit risk and currency exchange risk. In order to manage these risks we may use various fixed-price forward purchase and sales contracts, futures and option contracts, and swaps and options traded in the over-the-counter financial markets.
Commodity Price Risk
Commodity price risks result from exposures to changes in spot prices, forward prices, volatilities, and correlations between various commodities, such as natural gas, electricity, coal, oil, and emissions credits. We manage the commodity price risk of our retail load serving obligations by entering into various derivative or non-derivative instruments to hedge the variability in future cash flows from forecasted sales and purchases of electricity. These instruments include forwards, futures, swaps, and option contracts traded on various exchanges as well as over-the-counter markets. The portion of forecasted transactions hedged may vary based upon management's assessment of market, weather, operation and other factors.
In our wholesale trading businesses, we measure the risk of our portfolio using several analytical methods, including position limits, stop loss, value-at-risk (“VaR”), and stress testing. Each trading unit has a VaR limit. Our daily long term VaR model is based upon log-normal returns calculated from the last 30 business days of prices at the 95% confidence level, or 1.645 standard deviations, with a one day liquidity assumption. Our short term VaR model measures the risk of virtual and up-to-congestion transactions and is based upon 4 years of seasonal prices at the 95% confidence level, with a one day liquidity assumption.
VaR is calculated daily, using positions and prices updated to the close of business on the previous day. The price history used is ideally that of the instrument held; however, in the cases where those prices are unavailable, benchmarking is used. Our VaR calculations always use the market value of the position, not its cost. In the case of a position where it is likely to take more than one day to close out, VaR is multiplied by the square root of the average days to liquidate the position in a stressed market.
The following table summarizes our long term and short term VaR as of and for the three months ended September 30, 2014 and 2013:
| Dollars in thousands | At/For Three Months Ended September 30, | Increase (decrease) | ||||||||||||||
| 2014 | 2013 | Units | Percent | |||||||||||||
| VaR as of September 30 | $ | 402 | $ | 258 | $ | 144 | 55.8% | |||||||||
| VaR for the quarters ended September 30: | ||||||||||||||||
| Average | $ | 480 | $ | 198 | $ | 281 | 141.9% | |||||||||
| Maximum | 1,172 | 878 | 294 | 33.5% | ||||||||||||
| Minimum | 66 | 23 | 43 | 184.4% | ||||||||||||
| VaR, percent of cash in trading accounts: | ||||||||||||||||
| As of September 30 | 2.44% | 2.38% | 0.06% | 2.5% | ||||||||||||
| For the quarters ended September 30: | ||||||||||||||||
| Average (1) | 2.82% | 1.86% | 0.96% | 51.3% | ||||||||||||
| Maximum (1) | 6.88% | 8.24% | -1.36% | -16.5% | ||||||||||||
| Minimum (1) | 0.39% | 0.22% | 0.17% | 77.9% | ||||||||||||
____________________
1 - Dollar VaR divided by the average balance of cash in trading accounts for the period.
| 61 |
The following table summarizes our long term and short term VaR as of and for the nine months ended September 30, 2014 and 2013:
| Dollars in thousands | At/For Nine Months Ended September 30, (1) | Increase (decrease) | ||||||||||||||
| 2014 | 2013 | Units | Percent | |||||||||||||
| VaR as of September 30 | $ | 402 | $ | 258 | $ | 144 | 55.8% | |||||||||
| VaR for the quarters ended September 30: | ||||||||||||||||
| Average | $ | 394 | $ | 253 | $ | 141 | 55.8% | |||||||||
| Maximum | 1,470 | 1,077 | 394 | 36.6% | ||||||||||||
| Minimum | 7 | 6 | 1 | 24.5% | ||||||||||||
| VaR, percent of cash in trading accounts: | ||||||||||||||||
| As of September 30 | 2.44% | 2.38% | 0.06% | 2.5% | ||||||||||||
| For the quarters ended September 30: | ||||||||||||||||
| Average (1) | 2.92% | 2.21% | 0.71% | 32.1% | ||||||||||||
| Maximum (1) | 10.89% | 9.41% | 1.48% | 15.8% | ||||||||||||
| Minimum (1) | 0.06% | 0.05% | 0.00% | 5.6% | ||||||||||||
____________________
1 - Includes short term VaR beginning April 1, 2013.
2 - Dollar VaR divided by the average balance of cash in trading accounts for the period.
Due to the inherent limitations of statistical measures such as VaR, the evolving nature of the competitive markets for electricity and related derivatives, and the seasonality of changes in market prices, the VaR calculation may not capture the full extent of commodity price exposure. As a result, actual changes in the fair value of mark-to-market derivative instruments assets and liabilities could differ from the calculated VaR, and such changes could have a material impact on our financial results.
The value of the derivative financial instruments we hold for trading purposes and as cash flow hedges is significantly influenced by forward commodity prices. Periodic changes in forward prices could cause significant changes in the marked-to-market valuation (“MTM valuation”) of these contracts. For example, assuming that all other variables remain constant:
| Percentage change in forward price from | Average percentage change in mark-to-market valuation of derivatives | Change in mark-to-market valuation
of derivatives (dollars in thousands) | ||||||||||||||||||||||
| September 30, 2014 | Held for trading | Held as economic hedges | Designated as cash flow hedges | Held for trading | Held as economic hedges | Designated as cash flow hedges | ||||||||||||||||||
| 10% | -166.4% | 2194.7% | 125.9% | (964 | ) | 1,189 | 548 | |||||||||||||||||
| 5% | -83.2% | 1097.3% | 63.0% | (482 | ) | 595 | 274 | |||||||||||||||||
| 1% | -16.6% | 219.5% | 12.6% | (96 | ) | 119 | 55 | |||||||||||||||||
| -1% | 16.6% | -219.5% | -12.6% | 96 | (119 | ) | (55 | ) | ||||||||||||||||
| -5% | 83.2% | -1097.3% | -63.0% | 482 | (595 | ) | (274 | ) | ||||||||||||||||
| -10% | 166.4% | -2194.7% | -125.9% | 964 | (1,189 | ) | (548 | ) | ||||||||||||||||
Interest Rate Risk
Although we currently have no variable rate debt, in the future we may be exposed to fluctuations in interest rates through the issuance of such obligations. Exposures to interest rate fluctuations may be mitigated by entering into derivative instruments known as interest rate swaps, caps, collars, and put or call options. These contracts reduce exposure to interest rate volatility and result in primarily fixed rate debt obligations when taking into account the combination of the variable rate debt and the interest rate derivative instrument.
| 62 |
Liquidity Risk
Liquidity risk arises from our general funding needs and the management of our assets and liabilities. We are exposed to additional collateral posting or margin requirements with the ISOs and exchanges if price volatility or levels increase. Based on a sensitivity analysis for positions under marginable contracts, a 20% increase in electricity prices would cause an increase in margin collateral posted of approximately $166,347 as of September 30, 2014. This analysis uses simplified assumptions and is calculated based on portfolio composition and margin-related contract provisions as of September 30, 2014.
Wholesale Counterparty Credit Risk
Credit risk relates to the risk of loss resulting from non-performance or non-payment by counterparties pursuant to the terms of their contractual obligations. We monitor and manage credit risk through the credit policies described in the “Business – Wholesale Trading – Credit Risk Management” section of our 2013 Form 10-K. Given the credit quality, diversification, and term of the exposure in the portfolio, we do not anticipate a material impact on financial position or results of operations from nonperformance by any counterparty.
Retail Customer Credit Risk
Although we are currently not exposed to retail customer credit risk due to our participation in POR programs, we expect that this situation will change as we grow our retail business. Furthermore, economic and market conditions may affect our customers' willingness and ability to pay their bills in a timely manner, which could lead to an increase in bad debt expense above and beyond the allowance for uncollectible accounts charged to us by utilities. In general, we intend to manage retail credit risk as described the “Business – Retail Energy Services – Credit Risk Management” section of 2013 Form 10-K.
Foreign Exchange Risk
A portion of our assets and liabilities are denominated in Canadian dollars and are therefore subject to fluctuations in exchange rates, however, we do not have any exposure to any highly inflationary foreign currencies. We believe our foreign currency exposure is limited.
| 63 |
Item 4 - Controls and Procedures
The Company maintains a system of disclosure controls and procedures that is designed to ensure that information required to be disclosed in our Exchange Act reports is recorded, processed, summarized and reported within the time periods specified in the SEC’s rules and forms, and that such information is accumulated and communicated to our management, including our Chief Executive Officer and Chief Financial Officer, as appropriate, to allow timely decisions regarding required disclosures.
Under the supervision and with the participation of our management, including our Chief Executive Officer and Chief Financial Officer, the Company conducted an evaluation of our disclosure controls and procedures as defined in Exchange Act Rules 13a-15(e) and 15d-15(e). Based on this evaluation, the Company’s Chief Executive Officer and Chief Financial Officer concluded that, as of September 30, 2014, the Company’s disclosure controls and procedures were effective.
Changes in Internal Control over Financial Reporting
There was no change in the Company’s internal control over financial reporting that occurred during the three months ended September 30, 2014 that has materially affected, or is reasonably likely to materially affect, the Company’s internal control over financial reporting.
| 64 |
Part II – Other Information
Item 1 - Legal Proceedings
See “Note 15 - Commitments and Contingencies” on page 30 of this Form 10-Q for a discussion of certain legal proceedings.
Item 1A - Risk Factors
No material changes from prior disclosure.
Item 2 - Unregistered Sales of Equity Securities and Use of Proceeds
None
Item 3 - Defaults Upon Senior Securities
None
Item 4 - Mine Safety Disclosures
None
Item 5 - Other Information
None
| 65 |
Item 6 - Exhibits
| Exhibit Number | Description | |
| 31.1 | Certification of Chief Executive Officer, pursuant to Rule 13a-14 and 15d-14 of the Securities Exchange Act of 1934. | |
| 31.1 | Certification of Chief Financial Officer, pursuant to Rule 13a-14 and 15d-14 of the Securities Exchange Act of 1934. | |
| 32.1 | Certification of Chief Executive Officer and Chief Financial Officer, pursuant to 18 U.S.C. Section 1350, as adopted pursuant to Section 906 of the Sarbanes-Oxley Act of 2002. | |
| 101.INS* | XBRL Instance Document | |
| 101.SCH* | XBRL Schema Document | |
| 101.CAL* | XBRL Calculation Linkbase Document | |
| 101.DEF* | XBRL Definition Linkbase Document | |
| 101.LAB* | XBRL Labels Linkbase Document | |
| 101.PRE* | XBRL Presentation Linkbase Document |
| * | Pursuant to Rule 406T of Regulation S-T, the Interactive Data Files on Exhibit 101 hereto are deemed not filed or part of a registration statement or prospectus for purposes of Section 11 or 12 of the Securities Act of 1933, as amended, are deemed not filed for purposes of Section 18 of the Securities Exchange Act of 1934, as amended, and are otherwise not subject to liability under those sections. |
| 66 |
Signatures
Pursuant to the requirements of the Securities Exchange Act of 1934, the registrant has duly caused this report to be signed on its behalf by the undersigned thereto duly authorized.
| TWIN CITIES POWER HOLDINGS, LLC | |||
|
|
|||
| Dated: November 14, 2014 | By: | Timothy S. Krieger | |
| Chief Executive Officer, President and Chairman of the Board (principal executive officer) | |||
|
|
|||
| Dated: November 14, 2014 | By: | Wiley H. Sharp III | |
| Vice President – Finance and Chief Financial Officer (principal accounting and financial officer) |
| 67 |