Attached files
| file | filename |
|---|---|
| 8-K - 8-K - WireCo WorldGroup Inc. | q32014investorcallslides.htm |

WireCo WorldGroup Investor Call Q3 2014
2 Forward-Looking Statements This presentation contains statements that relate to future events and expectations and as such constitute forward-looking statements. It is important to note that the Company’s performance, and actual results, financial condition or business could differ materially from those expressed in such forward- looking statements. Forward-looking statements include those containing such words as “anticipates,” “believes”, “continues,” “estimates,” “expects,” “forecasts,” “intends,” “outlook,” “plans,” “projects,” “should,” “targets,” “will,” or other words of similar meaning. Factors that could cause or contribute to such differences include, but are not limited to: the general economic conditions in markets and countries where we have operations; risks associated with our non-U.S. operations; our ability to implement and maintain sufficient internal controls; foreign currency exchange rate fluctuations; the competitive environment in which we operate; changes in the availability or cost of raw materials and energy; risks associated with our manufacturing activities; our ability to meet quality standards; our ability to protect our trade names; violations of laws and regulations; the impact of environmental issues and changes in environmental laws and regulations; our ability to successfully execute and integrate acquisitions; comparability of our specified scaled disclosure requirements applicable to emerging growth companies; labor disturbances, including any resulting from suspension or termination of our collective bargaining agreements; our significant indebtedness; covenant restrictions; the interests of our principal equity holder may not be aligned with the holders of our 9.5% Senior Notes; and credit-rating downgrades. More detailed information about factors that could affect future performance or results may be found in our filings with the Securities and Exchange Commission (“SEC”), including our Annual Report on Form 10-K for the year ended December 31, 2013 and subsequent reports. Forward-looking statements should not be relied upon as a guarantee of future performance or results, nor will they prove to be accurate indications of the times at or by which any such performance or results will be achieved. The Company undertakes no obligation to update forward-looking statements to reflect changed assumptions, the occurrence of unanticipated events or changes in future operating results, financial condition or business over time. Non-GAAP Financial Measures Some of the information included in this presentation is derived from our consolidated financial information but is not presented in our financial statements prepared in accordance with U.S. generally accepted accounting principles (“GAAP”). Certain of these data are considered “Non-GAAP Financial Measures” under SEC rules. These Non-GAAP Financial Measures supplement our GAAP disclosures and should not be considered an alternative to the GAAP measure. Reconciliations to the most directly comparable GAAP financial measures can be found in the Appendix to this presentation. These Non-GAAP Financial Measures are provided as a means to enhance communications with security holders by providing additional information regarding our operating results and liquidity. Management uses these Non-GAAP Financial Measures in evaluating our performance and in determining debt covenant calculations. Any reference during the discussion today to EBITDA means Adjusted EBITDA or Acquisition Adjusted EBITDA, for which we have provided reconciliations in the Appendix. Cautionary Statements

3 WireCo Business Overview

4 WireCo Overview Steel (71%) Large diameter, highly engineered rope and electrical signal transmission cable Engineered specialty wire products used in industrial end markets Highly engineered, made-to-order synthetic ropes and technical products that have strength characteristics of steel but weigh significantly less Synthetic (29%) Highly engineered plastic molding from recycled materials used in a variety of industrial, structural and oil and gas applications Rope (72% of Sales) (1) Broad Product Offering Specialty Wire (17% of Sales) (1) Engineered Products (11% of Sales) (1) Rope: Diverse End Market Applications Oil & Gas Industrial and Infrastructure Fishing Maritime Mining Structures (1) Percentages shown as % of Q3 2014 Sales.

5 WireCo Q3 Performance

6 $203.8 $217.1 $616.2 $654.1 Q3 '13 Q3 '14 Q3 YTD '13 Q3 YTD '14 Sales 7% year over year growth with Adjusted EBITDA(1) growth of 9% year over year – Increased activity in certain key rope end markets, such as Industrial and Infrastructure, Offshore Oil & Gas, and Fishing – Margin improvement primarily driven by operational improvements in our global manufacturing facilities Adjusted EBITDA(1) improved as a percentage of sales to 17.9% vs. Q3 2013 of 17.5% YTD Improvement in Sales and Adjusted EBITDA(1) vs. 2013 of $37.9 million and $12.5 million, respectively Q3 YTD Adjusted EBITDA(1) Margin of 17.8% vs. YTD 2013 of 16.9% Q3 Performance Summary (1) Adjusted EBITDA and Free Cash Flow are Non-GAAP Financial Measures. See appendix for reconciliations to most directly comparable GAAP Financial Measures. Results continue to improve with solid fundamental performance $35.7 $39.0 $104.2 $116.7 Q3 '13 Q3 '14 Q3 YTD '13 Q3 YTD '14 Sales Adjusted EBITDA(1) 9.2% ahead Q3 2013 12.0% ahead YTD 2013 6.5% ahead Q3 2013 6.2% ahead YTD 2013 17.8% 16.9% 17.5% 17.9%

7 Free Cash Flow(1) of $16.2 million in Q3 - cash generation continued key initiative to fund strategic investments and debt pay down – Improved working capital management key factor in Free Cash Flow(1) growth • Inventory optimization charge of $9.2 million in the quarter • Represents the last charge related to the 2013 program • Creates efficiencies from a physical material movement perspective at manufacturing and distribution facilities • Cash conversion cycle reduced 24 days since Q3 ’13; 5th consecutive quarter of reduction • DSO reduced to 59 days from high of 82 days in Q2 ‘13 – Maintaining discipline on capital spend • Focus on projects generating the right amount of return • Continuing to invest in maintenance capital $33.3 $16.2 $16.6 $28.0 Q3 '13 Q3 '14 Q3 YTD '13 Q3 YTD '14 Q3 Performance Summary (1) Adjusted EBITDA, Free Cash Flow, Adjusted Working Capital and Net Debt are Non-GAAP Financial Measures. See appendix for reconciliations to most directly comparable GAAP Financial Measures. Free Cash Flow(1) 2014 Cash flow positive of $28 million Reduced Net Debt(1) from $833.5 million in Q2 to $817.3 million in Q3
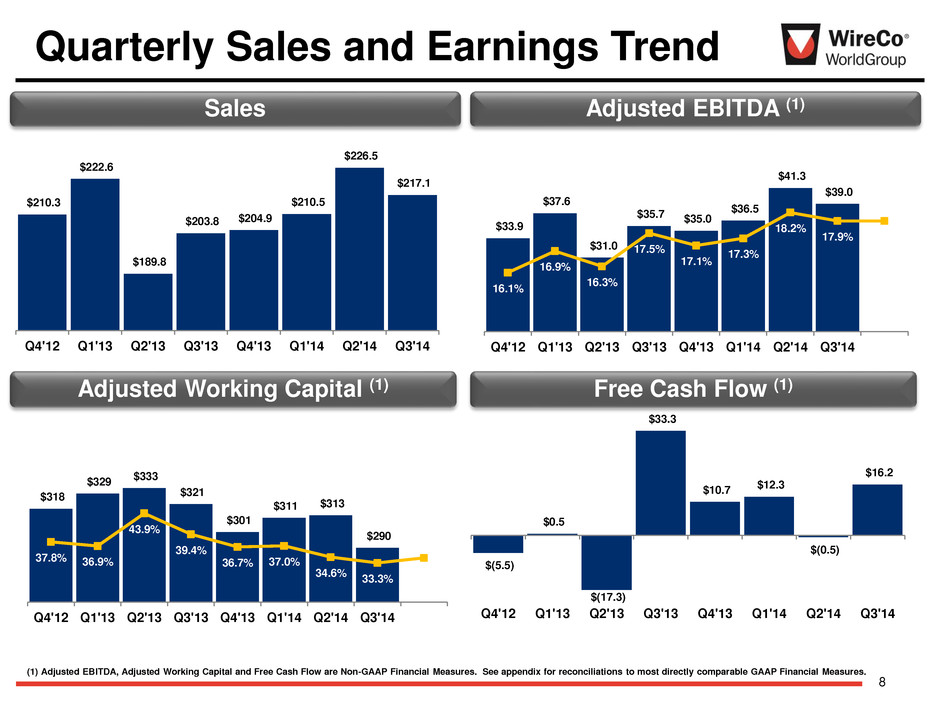
8 Quarterly Sales and Earnings Trend Sales Adjusted EBITDA (1) Free Cash Flow (1) Adjusted Working Capital (1) $210.3 $222.6 $189.8 $203.8 $204.9 $210.5 $226.5 $217.1 Q4'12 Q1'13 Q2'13 Q3'13 Q4'13 Q1'14 Q2'14 Q3'14 $(5.5) $0.5 $(17.3) $33.3 $10.7 $12.3 $(0.5) $16.2 Q4'12 Q1'13 Q2'13 Q3'13 Q4'13 Q1'14 Q2'14 Q3'14 $33.9 $37.6 $31.0 $35.7 $35.0 $36.5 $41.3 $39.0 16.1% 16.9% 16.3% 17.5% 17.1% 17.3% 18.2% 17.9% 17.9% Q4'12 Q1'13 Q2'13 Q3'13 Q4'13 Q1'14 Q2'14 Q3'14 (1) Adjusted EBITDA, Adjusted Working Capital and Free Cash Flow are Non-GAAP Financial Measures. See appendix for reconciliations to most directly comparable GAAP Financial Measures. $318 $329 $333 $321 $301 $311 $313 $290 37.8% 36.9% 43.9% 39.4% 36.7% 37.0% 34.6% 33.3% 34.4% Q4'12 Q1'13 Q2'13 Q3'13 Q4'13 Q1'14 Q2'14 Q3'14
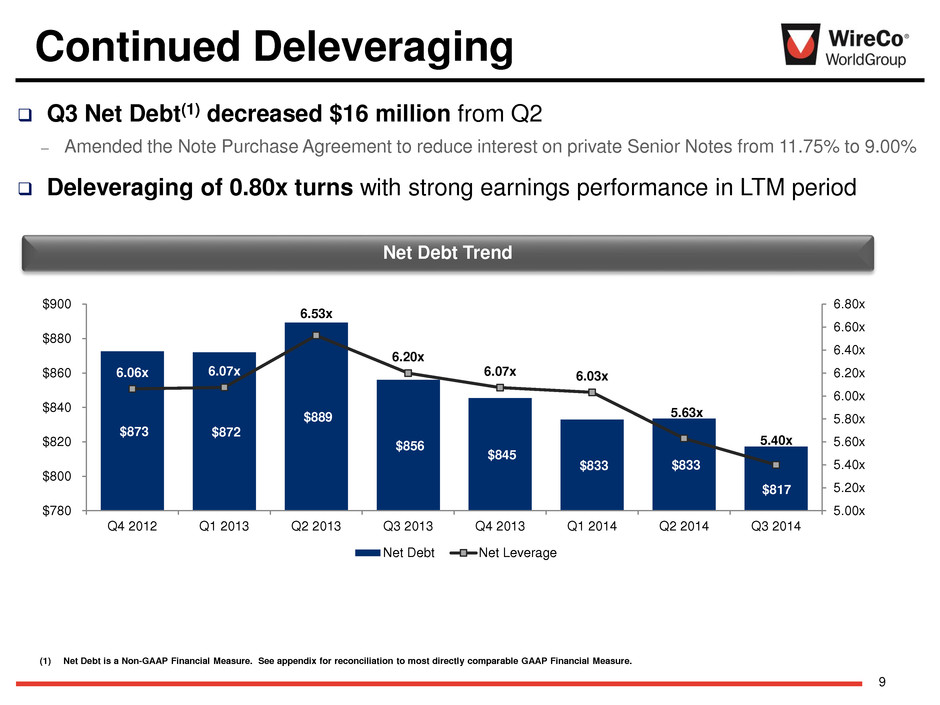
9 Q3 Net Debt(1) decreased $16 million from Q2 – Amended the Note Purchase Agreement to reduce interest on private Senior Notes from 11.75% to 9.00% Deleveraging of 0.80x turns with strong earnings performance in LTM period Continued Deleveraging (1) Net Debt is a Non-GAAP Financial Measure. See appendix for reconciliation to most directly comparable GAAP Financial Measure. Net Debt Trend $873 $872 $889 $856 $845 $833 $833 $817 6.06x 6.07x 6.53x 6.20x 6.07x 6.03x 5.63x 5.40x 5.00x 5.20x 5.40x 5.60x 5.80x 6.00x 6.20x 6.40x 6.60x 6.80x $780 $800 $820 $840 $860 $880 $900 Q4 2012 Q1 2013 Q2 2013 Q3 2013 Q4 2013 Q1 2014 Q2 2014 Q3 2014 Net Debt Net Leverage

10 WireCo Market Outlook

11 Market Outlook Current Market Dynamics WireCo Mitigant/Impact Oil & Gas market potentially affected by lower oil prices Rig count in the US remains steady Offshore contracts Industrial and Infrastructure slowing with sluggish European economy WireCo’s geographic and industry diversity Fishing growth South America market increasing Euro currency exposure Executed cross currency - $300 million USD notional swap Euro based factories cost competitive Fishing market expanding Product development strengthens established markets Emerging markets offer new income streams Strong quarter and year over year growth, current outlook mixed by business, but WireCo well-positioned given diversity and strong global market positions

12 $153.5 $159.6 $161.9 $155.7 Q4 '13 Q1 '14 Q2 '14 Q3 '14 Market Outlook & Trends Oil & Gas Market Outlook WireCo Notes Sales Results ($ millions) Q3 LTM Rope Sales: $630.7 – Sales dropped 3.8% versus prior quarter – Q3 continued momentum in Oil and Gas – Strength in fishing performance Industrial and Infrastructure Mining Fishing Maritime Structures Rope Performance Rope Update (1)Source: Baker Hughes. Chart on Investo call Recon. Ask Pedro/A dam for commen tary ─ Q3 Rig Counts continued to increase 1.6% Globally vs. Q1 ‘14(1), led by US growth of 2.8%, but concerns over price of oil ─ European recovery slowly gaining momentum, albeit unevenly ─ US residential recovery to be flat ─ Emerging markets construction with mixed signals ─ OEMs still subdued ─ Continued pressure on commodity prices ─ Industry CAPEX to continue downward trend ─ Mine closures in US ─ Increased presence in Southern Europe ─ Wild Catch with positive outlook ─ Fish Farming in South America gaining momentum ─ Historically low freight rates ─ Lower margins for fleet operators ─ Vessel Order book expanding; new orders also growing ─ Project shipments delayed ─ Improvement in governmental infrastructure projects

13 $18.7 $17.8 $29.1 $23.8 Q4 '13 Q1 '14 Q2 '14 Q3 '14 $32.6 $33.1 $35.5 $37.6 Q4 '13 Q1 '14 Q2 '14 Q3 '14 Q3 LTM Wire Sales: $138.8 Sales Results Specialty Wire ($ millions) WireCo Performance Engineered Products ($ millions) Q3 LTM Engineered Products Sales: $89.4 Market Outlook Specialty Wire and Engineered Products Chart on Investo call Recon. Ask Pedro/A dam for commen tary – Positive momentum in order intake – Project nature of shipments staggered – Expanded product portfolio for pipes – 6.2% growth vs. Q2 ‘14 and 16.0% growth vs. Q3 ‘13 – 5 year infrastructure plan revealed in Mexico – Housing, Heavy Construction and Automotive with positive signs in Mexico
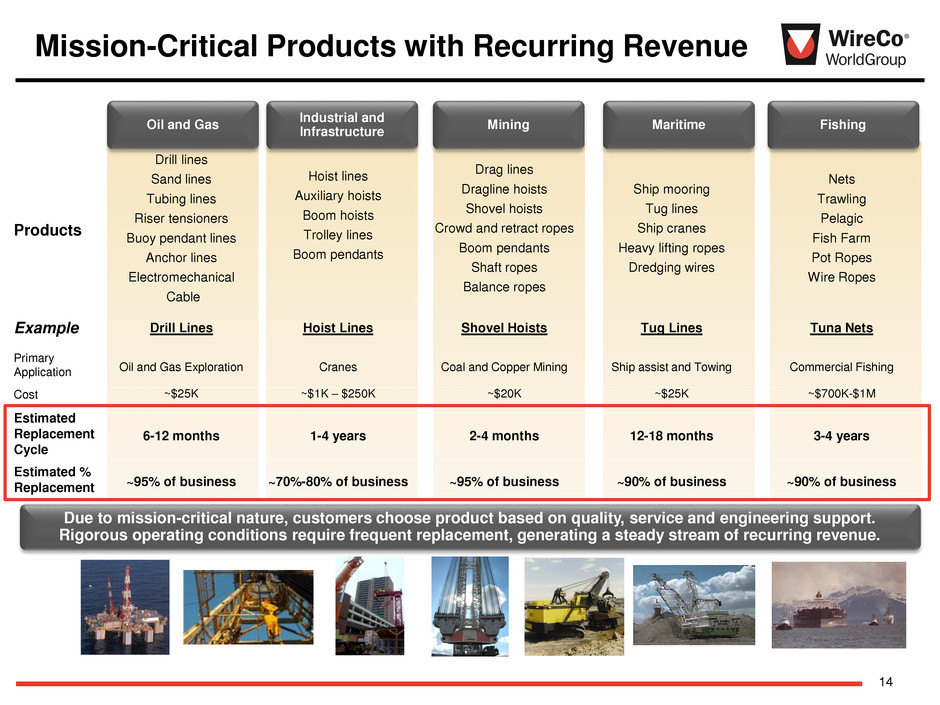
14 Due to mission-critical nature, customers choose product based on quality, service and engineering support. Rigorous operating conditions require frequent replacement, generating a steady stream of recurring revenue. Mission-Critical Products with Recurring Revenue Products Drill lines Sand lines Tubing lines Riser tensioners Buoy pendant lines Anchor lines Electromechanical Cable Hoist lines Auxiliary hoists Boom hoists Trolley lines Boom pendants Drag lines Dragline hoists Shovel hoists Crowd and retract ropes Boom pendants Shaft ropes Balance ropes Ship mooring Tug lines Ship cranes Heavy lifting ropes Dredging wires Nets Trawling Pelagic Fish Farm Pot Ropes Wire Ropes Example Drill Lines Hoist Lines Shovel Hoists Tug Lines Tuna Nets Primary Application Oil and Gas Exploration Cranes Coal and Copper Mining Ship assist and Towing Commercial Fishing Cost ~$25K ~$1K – $250K ~$20K ~$25K ~$700K-$1M Estimated Replacement Cycle 6-12 months 1-4 years 2-4 months 12-18 months 3-4 years Estimated % Replacement ~95% of business ~70%-80% of business ~95% of business ~90% of business ~90% of business Oil and Gas Industrial and Infrastructure Mining Maritime Fishing

15 Industrial and Infrastructure: Mission Critical Products WireCo WorldGroup is a Global Supplier of Lifting Products for Industrial and Infrastructure Rope Solutions The Company’s Customer Focused Approach forms our Innovative Design and High Quality Standards Construction Cranes Harbor Cranes Ship Cranes Production Cranes Truck Mounted Cranes Hydraulic Boom Cranes Crawler Cranes Telescopic Cranes Tower Crane Deck Cranes Floating Cranes Floating Grab Cranes Offshore Cranes Pull-In Risers Coal and Iron Unloaders Container Cranes Gantry/Revolving Grab Cranes General Cargo Cranes Harbor Mobile Cranes Lockages and Ship Liftings Cable Cranes Electric Hoists Foundry Cranes Ladle Cranes Scrap Yard Cranes Scrapers Skip Hoists Slab Transport Cranes Crane Rope Applications
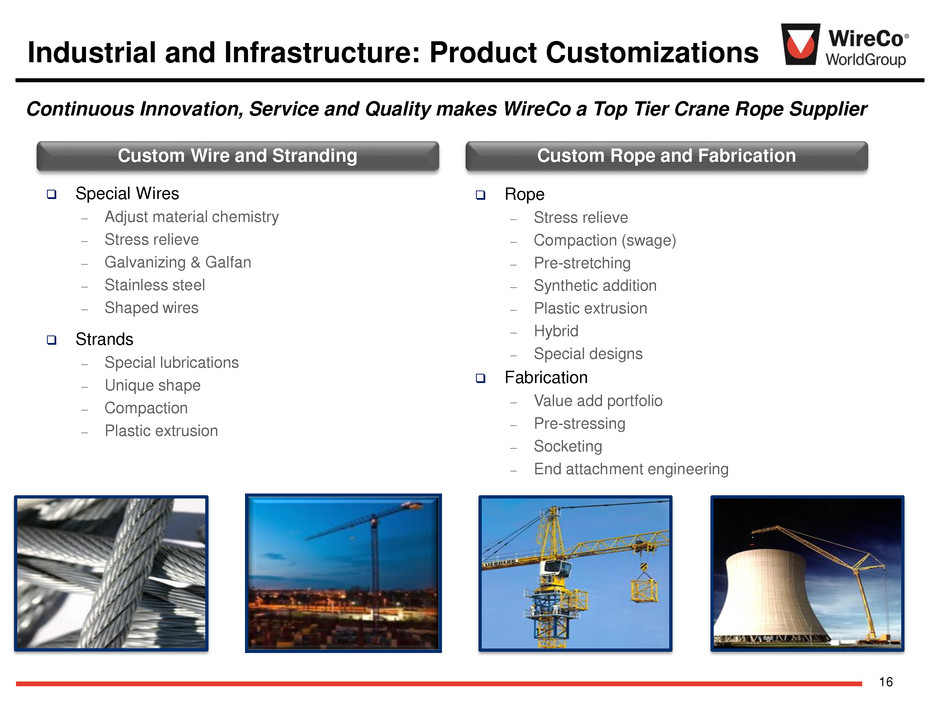
16 Industrial and Infrastructure: Product Customizations Continuous Innovation, Service and Quality makes WireCo a Top Tier Crane Rope Supplier Custom Wire and Stranding Special Wires – Adjust material chemistry – Stress relieve – Galvanizing & Galfan – Stainless steel – Shaped wires Strands – Special lubrications – Unique shape – Compaction – Plastic extrusion Custom Rope and Fabrication Rope – Stress relieve – Compaction (swage) – Pre-stretching – Synthetic addition – Plastic extrusion – Hybrid – Special designs Fabrication – Value add portfolio – Pre-stressing – Socketing – End attachment engineering

17 Industrial and Infrastructure: Customer Driven Approach Customer Satisfaction Achieved with Global Stock Availability of Diverse Product Portfolio and On-Site Service Complete Brand Portfolio Servicing All End Markets Global Brands – Casar (Global) – Union (North America) – Oliveira (Global) – Camesa (Regional) – Drumet (Regional) – WireCo Structures (Global) WireCo European Crane Center Fully Operational Proactive Replenishment to Customers Serviced through Global Stocking Locations On-Site Sales Service and Support Key Engineering Relationships with Global OEMs WireCo Values

18 Investing to build a world class organization for sustainable long-term growth Questions

19 Appendix

20 A/P 248 239 244 235 228 240 248 228 137 128 151 139 136 138 135 128 100 110 120 130 140 150 160 $215 $220 $225 $230 $235 $240 $245 $250 Q4 '12 Q1 '13 Q2 '13 Q3 '13 Q4 '13 Q1 '14 Q2 '14 Q3 '14 D S I $ ( in m ill io n s ) Inventory, net Days sales in inventory (DSI) Linear (Inventory, net) 153 174 172 160 149 160 160 142 65 70 82 71 65 68 63 59 2 22 42 62 82 102 122 142 $50 $70 $90 $110 $130 $150 $170 $190 Q4 '12 Q1 '13 Q2 '13 Q3 '13 Q4 '13 Q1 '14 Q2 '14 Q3 '14 D S O $ ( in m ill io n s ) AR Days sales outstanding (DSO) Linear (AR) Cash conversion cycle has decreased by 24 days since Q3 2013 Q3 2014 Adjusted Working Capital(1) 33.3% of sales Adjusted Working Capital(1) Metrics Adjusted Working Capital(1) A/R Inventory (1) Adjusted Working Capital is a Non-GAAP Financial Measure. See appendix for reconciliation to most directly comparable GAAP Financial Measure. WC charts BB TAB (2) (2) Q4 '12 Q1 '13 Q2 '13 Q3 '13 Q4 '13 Q1 '14 Q2 '14 Q3 '14 37.8% 36.9% 43.9% 39.4% 36.7% 37.0% 34.6% 3 .3% AWC % of L3M Sales 83 84 83 74 76 89 95 80 46 45 51 44 45 50 51 45 2 12 22 32 42 52 62 $35 $45 $55 $65 $75 $85 $95 $105 Q4 '12 Q1 '13 Q2 '13 Q3 '13 Q4 '13 Q1 '14 Q2 '14 Q3 '14 D P O $ ( in m ill io n s ) AP Days payables outstanding (DPO) Linear (AP) 318 329 333 321 301 311 313 290 156 153 182 166 156 156 147 142 0 20 40 60 80 100 120 140 160 180 200 $- $50 $100 $150 $200 $250 $300 $350 Q4 '12 Q1 '13 Q2 '13 Q3 '13 Q4 '13 Q1 '14 Q2 '14 Q3 '14 C a s h C onv e rs io n $ ( in m ill io n s ) AWC Cash conversion cycle Linear (AWC)

21 Income Statement Results 2013 2014 FY Q1 Q2 Q3 Q4 Q1 Q2 Q3 2013 Sales $222.6 $189.8 $203.8 $204.9 $210.5 $226.5 $217.1 $821.1 Adj. EBITDA (1) $37.6 $31.0 $35.7 $35.0 $36.5 $41.3 $39.0 $139.2 Adj. EBITDA Margin 16.9% 16.3% 17.5% 17.1% 17.3% 18.2% 17.9% 17.0% Sales Var. QoQ 6.2% (14.8%) 7.4% 0.5% 2.7% 7.6% (4.2%) Adj. EBITDA Var. QoQ 10.9% (17.5%) 15.2% (2.0%) 4.3% 13.2% (5.6%) Sales Var. YoY (2) (3.5%) (17.2%) (2.5%) (2.3%) (5.5%) 19.3% 6.5% Adj. EBITDA Var. YoY (2) (1.0%) (19.1%) 5.5% 3.3% (2.9%) 33.2% 9.2% (1) Adjusted EBITDA is a Non-GAAP Financial Measure. See appendix for reconciliation to most directly comparable GAAP Financial Measure. (2) Variances consider pro forma sales and Acquisition Adjusted EBITDA
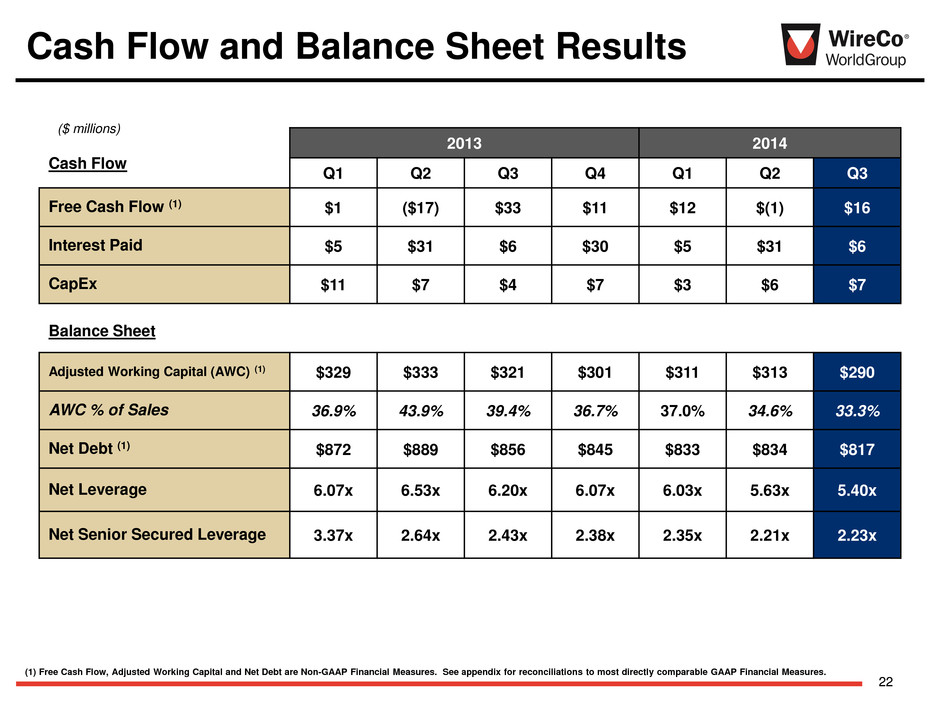
22 2013 2014 Q1 Q2 Q3 Q4 Q1 Q2 Q3 Free Cash Flow (1) $1 ($17) $33 $11 $12 $(1) $16 Interest Paid $5 $31 $6 $30 $5 $31 $6 CapEx $11 $7 $4 $7 $3 $6 $7 Cash Flow (1) Free Cash Flow, Adjusted Working Capital and Net Debt are Non-GAAP Financial Measures. See appendix for reconciliations to most directly comparable GAAP Financial Measures. Adjusted Working Capital (AWC) (1) $329 $333 $321 $301 $311 $313 $290 AWC % of Sales 36.9% 43.9% 39.4% 36.7% 37.0% 34.6% 33.3% Net Debt (1) $872 $889 $856 $845 $833 $834 $817 Net Leverage 6.07x 6.53x 6.20x 6.07x 6.03x 5.63x 5.40x Net Senior Secured Leverage 3.37x 2.64x 2.43x 2.38x 2.35x 2.21x 2.23x Balance Sheet Cash Flow and Balance Sheet Results ($ millions)

23 Adjusted EBITDA Reconciliation ($000s) Non-GAAP Reconciliations Note: Effective in Q1 2014 prior year reclasses were made to be consistent with current period presentation. These adjustments were not made retrospectively as the Company has only revised Q1 2013, Q2 2013 and Q3 2013 in its quarterly reports. Line items impacted include interest expense and other adjustments Q1 2013 Q2 2013 Q3 2013 Q4 2013 2013 Q1 2014 Q2 2014 Q3 2014 Net Loss (GAAP) (11,369)$ (13,437)$ (644)$ (1,554)$ (27,004)$ (43)$ (2,097)$ (35,192)$ Plus: Interest expense, net 20,107 20,350 20,107 20,266 80,830 19,858 20,116 19,603 Income tax expense (benefit) (1,439) 2,792 5,632 3,556 10,541 658 2,704 (4,540) Depreciation and amortization 13,777 14,542 14,436 15,779 58,534 13,035 12,913 12,192 Foreign currency exchange losses (gains), net 10,854 (836) (14,417) (9,185) (13,584) (950) 4,045 31,816 Share-based compensation 634 1,091 1,993 2,251 5,969 1,762 1,808 1,969 Other expense (income), net 153 (866) 1,165 183 635 (755) 176 (125) Loss on extinguishment of debt - - - - - - - 617 Acquisition costs 33 337 - (1) 369 12 334 - Purchase accounting (inventory step-up and other) 923 838 393 37 2,191 - - - Advisory fees 1,037 1,297 1,220 997 4,551 952 947 2,001 Reorganization and restructuring charges 1,962 3,589 2,005 1,992 9,548 987 147 832 Effect of inventory optimization program - - 2,970 - 2,970 - - 9,244 Non-cash impairment of assets - - - - - 598 - 246 Other adjustments 891 1,285 819 648 3,643 356 230 289 Adjusted EBITDA (Non-GAAP) 37,563$ 30,982$ 35,679$ 34,969$ 139,193$ 36,470$ 41,323$ 38,952$
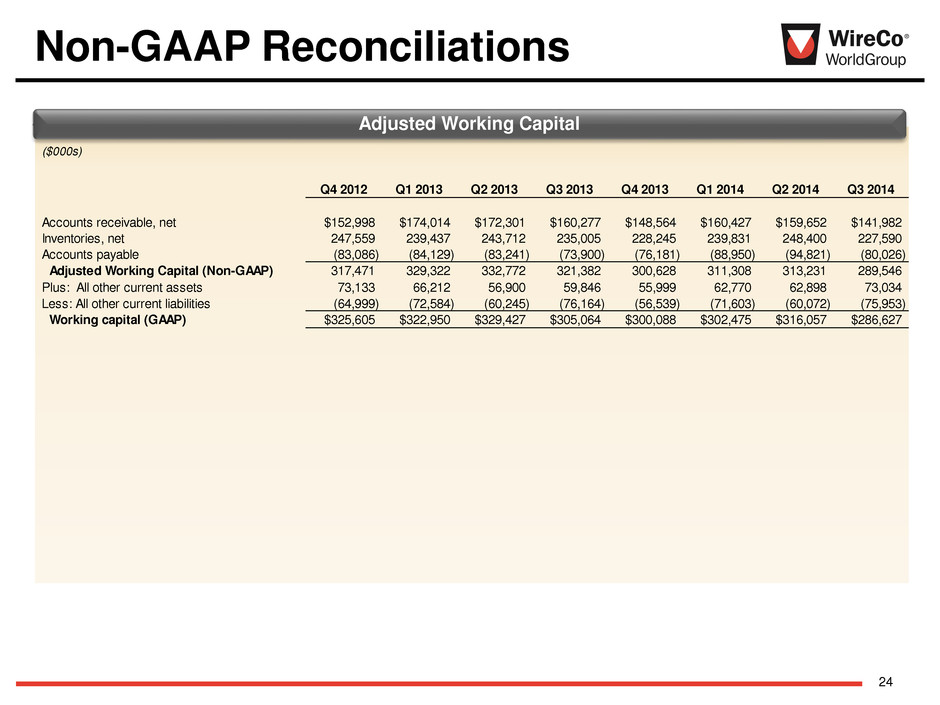
24 Adjusted Working Capital Non-GAAP Reconciliations ($000s) Q4 2012 Q1 2013 Q2 2013 Q3 2013 Q4 2013 Q1 2014 Q2 2014 Q3 2014 Acco nts receivable, net $152,998 $174,014 $172,301 $160,277 $148,564 $160,427 $159,652 $141,982 Inventories, net 247,559 239,437 243,712 235,005 228,245 239,831 248,400 227,590 Accounts payable (83,086) (84,129) (83,241) (73,900) (76,181) (88,950) (94,821) (80,026) Adjusted Working Capital (Non-GAAP) 317,471 329,322 332,772 321,382 300,628 311,308 313,231 289,546 Plus: All other current assets 73,133 66,212 56,900 59,846 55,999 62,770 62,898 73,034 Less: ll other current liabilities (64,999) (72,584) (60,245) (76,164) (56,539) (71,603) (60,072) (75,953) Working capital (GAAP) $325,605 $322,950 $329,427 $305,064 $300,088 $302,475 $316,057 $286,627

25 Free Cash Flow Reconciliation ($000s) Non-GAAP Reconciliations Q4 2012 Q1 2013 Q2 2013 Q3 2013 Q4 2013 Q1 2014 Q2 2014 Q3 2014 Net cash provided by operating activities (GAAP) 2,215$ 12,116$ (10,468)$ 37,358$ 16,145$ 15,650$ 10,072$ 22,704$ Less: capital expenditures and other investing activities (13,253) (11,498) (6,826) (4,190) (6,839) (3,200) (6,424) (4,638) Less: acquisition of business - - - - - - (4,573) - Effect of exchange rates on cash and cash equivalents 802 (1,005) 395 849 686 46 26 (1,978) Other items 4,702 933 (416) (693) 670 (187) 352 147 Free Cash Flow (Non-GAAP) (5,534)$ 546$ (17,315)$ 33,324$ 10,662$ 12,309$ (547)$ 16,235$

26 Net Debt Reconciliation ($000s) Non-GAAP Reconciliations Q4 2012 Q1 2013 Q2 2013 Q3 2013 Q4 2013 Q1 2014 Q2 2014 Q3 2014 Borrowings under Revolving Loan Facility 50,276$ 48,676$ 63,826$ 37,376$ 32,000$ 18,500$ 27,250$ 44,050$ Short-term borrowings 1,594 - - - - - - - Polish Debt due 2014 25,882 16,332 16,110 17,047 8,860 8,810 8,756 8,029 Term Loan due 2017 334,163 333,325 332,488 331,650 330,813 329,975 326,021 325,192 9.50% Senior Notes due 2017 425,000 425,000 425,000 425,000 425,000 425,000 425,000 425,000 9.00% Senior Notes due 2017 (formerly 11.75% Senior Notes) 82,500 82,500 82,500 82,500 82,500 82,500 82,500 56,000 Other indebtedness 575 782 633 622 688 491 594 188 Capital lease obligations 6,045 5,780 5,101 3,464 3,333 3,659 2,869 2,455 Total debt at face value plus capital lease obligations (GAAP) 926,035 912,395 925,658 897,659 883,194 868,935 872,990 860,914 Less: Cash and cash equivalents (49,244) (36,303) (33,717) (38,566) (34,987) (33,373) (37,003) (41,718) Less: Restricted cash (4,254) (4,101) (2,635) (3,111) (2,887) (2,551) (2,429) (1,873) Net Debt (Non-GAAP) 872,537$ 871,991$ 889,306$ 855,982$ 845,320$ 833,011$ 833,558$ 817,323$
