Attached files
| file | filename |
|---|---|
| EX-10.1 - EX-10.1 - WireCo WorldGroup Inc. | d316293dex101.htm |
| EX-31.2 - EX-31.2 - WireCo WorldGroup Inc. | d316293dex312.htm |
| EX-31.1 - EX-31.1 - WireCo WorldGroup Inc. | d316293dex311.htm |
| EX-32.1 - EX-32.1 - WireCo WorldGroup Inc. | d316293dex321.htm |
| EX-32.2 - EX-32.2 - WireCo WorldGroup Inc. | d316293dex322.htm |
Table of Contents
UNITED STATES
SECURITIES AND EXCHANGE COMMISSION
Washington, D.C. 20549
Form 10-K
| x | ANNUAL REPORT PURSUANT TO SECTION 13 OR 15(d) OF THE SECURITIES EXCHANGE ACT OF 1934 |
For the fiscal year ended December 31, 2011
OR
| ¨ | TRANSITION REPORT PURSUANT TO SECTION 13 OR 15(d) OF THE SECURITIES EXCHANGE ACT OF 1934 |
For the transition period from to
Commission file number 333-174896

WireCo WorldGroup Inc.
(Exact name of registrant as specified in its charter)
| Delaware | 27-0061302 | |
| (State or other jurisdiction of incorporation or organization) |
(I.R.S. Employer Identification No.) |
12200 NW Ambassador Drive
Kansas City, MO 64163
(816) 270-4700
(address, including zip code, and telephone number, including area code, of registrant’s principal executive offices)
Securities registered pursuant to Section 12(b) of the Act: None
Securities registered pursuant to Section 12(g) of the Act: None
Indicate by check mark if the registrant is a well-known seasoned issuer (as defined in Rule 405 of the Securities Act). YES ¨ NO x
Indicate by check mark if the registrant is not required to file reports pursuant to Section 13 or Section 15(d) of the Act. YES ¨ NO x
Indicate by check mark whether the registrant (1) has filed all reports required to be filed by Section 13 or 15(d) of the Securities Exchange Act of 1934 during the preceding 12 months (or for such shorter period that the registrant was required to file such reports), and (2) has been subject to such filing requirements for the past 90 days. YES ¨ NO x
Indicate by check mark whether the registrant has submitted electronically and posted on its corporate website, if any, every Interactive Date File required to be submitted and posted pursuant to Rule 405 of Regulation S-T (§232.405 of this chapter) during the preceding 12 months (or for such shorter period that the registrant was required to submit and post such files). YES ¨ NO ¨
Indicate by check mark if disclosure of delinquent filers pursuant to Item 405 of Regulation S-K is not contained herein, and will not be contained, to the best of registrant’s knowledge, in definitive proxy or information statements incorporated by reference in Part III of this Form 10-K or any amendment to this Form 10-K. x
Indicate by check mark whether the registrant is a large accelerated filer, an accelerated filer, a non-accelerated filer or a smaller reporting company. See the definitions of “large accelerated filer,” “accelerated filer” and “smaller reporting company” in Rule 12b-2 of the Exchange Act. (Check one):
| Large accelerated filer | ¨ | Accelerated filer | ¨ | |||||
| Non-accelerated filer | x | Smaller reporting company | ¨ | |||||
Indicate by check mark whether the registrant is a shell company (as defined in Exchange Act Rule 12b-2). YES ¨ NO x
There is no market for the Registrant’s equity. As of March 15, 2012, the Company had 2,011,411 shares of common stock outstanding, all of which was held by affiliates.
DOCUMENTS INCORPORATED BY REFERENCE
None
Table of Contents
WireCo WorldGroup Inc.
Annual Report
For the year ended December 31, 2011
2
Table of Contents
Cautionary Information Regarding Forward-Looking Statements
The Securities and Exchange Commission (“SEC”) encourages companies to disclose forward-looking information so that investors can better understand a company’s future prospects and make informed investment decisions. This report contains such “forward-looking” statements within the meaning of the Private Securities Litigation Reform Act of 1995.
These forward-looking statements relate to future events or our future financial performance with respect to our financial condition, results of operations, business plans and strategies, operating efficiencies or synergies, competitive positions, growth opportunities for existing products, plans and objectives of management, capital expenditures and other matters. These statements involve known and unknown risks, uncertainties and other factors that may cause our actual results, levels of activity, performance or achievements to be materially different from those expressed or implied by any forward-looking statements. Such statements include, in particular, statements about our plans, strategies and prospects under the headings “Business” and “Management’s Discussion and Analysis of Financial Condition and Results of Operations”. In some cases, forward-looking statements are identified by terminology such as “may,” “will,” “could,” “would,” “should,” “expect,” “plan,” “anticipate,” “intend,” “believe,” “estimate,” “predict,” “potential,” “pro forma,” “seek” or “continue” or the negative of those terms or other comparable terminology. These statements are only predictions and such expectations may prove to be incorrect. Such differences could be caused by a number of factors or combination of factors including, but not limited to, the factors identified below and those discussed in Item 1A, Risk Factors, of this annual report. Readers are strongly encouraged to consider these factors and the following factors when evaluating any forward-looking statements concerning the Company:
| • | the general political, economic and competitive conditions in markets and countries where we have operations, including, inflation or deflation and changes in tax rates; |
| • | foreign currency exchange fluctuations; |
| • | our failure to meet quality standards; |
| • | our ability to successfully execute and integrate acquisitions; |
| • | changes in our operating strategy or development plans; |
| • | our ability to attract, hire and retain qualified personnel, including our ability to maintain our highly skilled executives, sales and engineering staff; |
| • | changes in the availability or cost of raw materials, energy and labor; |
| • | our ability to develop and maintain competitive advantages; |
| • | risks associated with our manufacturing activities; |
| • | labor disturbances, including any resulting from the suspension or termination of our collective bargaining agreements; |
| • | the impact of environmental and safety issues and changes in environmental and safety laws and regulations; |
| • | changes in the cost and availability of transportation; |
| • | our reliance on distributors; |
| • | additional tax liabilities we may incur; |
| • | the impact of trade regulations; |
| • | availability of credit, both to us and our customers; |
| • | the competitive environment in the wire rope, synthetic rope, electromechanical cable and specialty wire industries, both in the U.S. and abroad; |
| • | the substantial doubt of the China joint venture’s ability to continue operating; |
| • | our significant indebtedness; |
| • | interest rate fluctuations and changes in capital market conditions; and |
| • | our ability to implement and maintain sufficient internal controls. |
3
Table of Contents
Any forward-looking statements that we make in this annual report speak only as of the date of such statement, and we undertake no obligation to update such statements. Comparisons of results for current and any prior periods are not intended to express any future trends or indications of future performance, unless expressed as such, and should only be viewed as historical data.
Our Organization
The diagram below illustrates our current corporate structure, including the Issuer of the 9.5% Senior Notes due 2017 (“Senior Notes”) and the Guarantors. The boxes of non-Guarantors are shaded. The percentages indicate our voting interest in each entity.
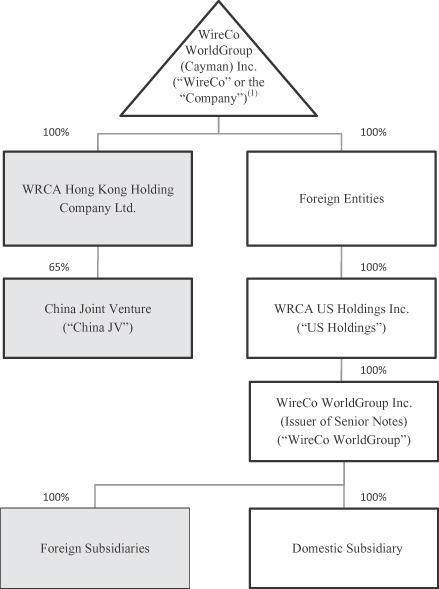
| (1) | This entity is 83.7% beneficially owned by Paine & Partners Fund III and 11.2% beneficially owned by our executive officers and directors with the remaining 5.1% held by other members of management. In addition, certain current and former members of management beneficially own 4.8% of the non-voting common stock of U.S. Holdings. WireCo directly or indirectly owns 100% of the voting common stock of WireCo WorldGroup and all of the subsidiaries guaranteeing the Senior Notes. |
4
Table of Contents
| Item 1. | Business |
Introduction
As permitted by the rules and regulations of the SEC, references herein to “WireCo,” the “Company,” “we,” “us” and “our” refer to WireCo WorldGroup (Cayman) Inc. and its consolidated subsidiaries unless otherwise noted. The financial statements and related footnotes included in Item 6, Item 7 and Item 8 of Part II of this annual report on Form 10-K are those of WireCo WorldGroup (Cayman) Inc., the indirect parent of WireCo WorldGroup Inc. (“WireCo WorldGroup”), and contain certain footnote disclosures regarding the financial information of WireCo WorldGroup (Cayman) Inc. and certain of its wholly-owned subsidiaries that guarantee, subject to customary release provisions, substantially all of the outstanding indebtedness of WireCo WorldGroup.
COMPANY OVERVIEW
WireCo WorldGroup (Cayman) Inc. is an exempted company incorporated under the laws of the Cayman Islands. We believe we are the largest global manufacturer of high-performance wire rope and one of the leading worldwide manufacturers of synthetic rope, electromechanical cable (“EMC”), fabricated products and specialty wire. Our highly engineered and specialized products have a reputation for quality, performance and safety, and are marketed under well-known brands such as Union®, Camesa®, MacWhyte®, CASAR®, Wireline Works™, U.S. Reel™, Phillystran®, Oliveira™, Drumet® and Union International. Our proprietary technical and manufacturing expertise utilizes advanced metallurgical and material technologies to develop highly engineered and specialized ropes which are “mission-critical” operating components used in heavy lifting, pulling, supporting and suspension applications, where functionality and safety are the top priority. We maintain a comprehensive product portfolio across the diverse end markets we serve, including crane, oil and gas, mining, fishing, marine, structures and general industrial.
Our global manufacturing footprint, with 13 facilities, is supplemented by a global network of company-owned distribution facilities and independent distributors. Our China joint venture (“China JV”) provides additional manufacturing capacity in Wuhan, China. We currently have global capacity to annually produce approximately 408,000 tons of wire and approximately 230,000 tons of wire rope. We are vertically integrated and manufacture the majority of the wire we use in our wire ropes. Controlling our wire supply is a significant advantage in terms of quality, manufacturing flexibility, inventory control and cost reduction. Our global presence enables us to provide fast delivery and short lead times to customers, ensuring product availability and high quality customer service and technical support. For financial information about our operations in geographic areas, refer to Note 17—“Segment Reporting” to our consolidated financial statements included in Item 8, Financial Statements and Supplementary Data, of this annual report. For the year ended December 31, 2011, we recorded net sales of $604.9 million, Acquisition Adjusted EBITDA of $129.6 million including pro forma EBITDA for our most recent acquisition, operating income of $57.0 million and a net loss of $50.7 million. The net loss in 2011 was driven by the loss on our investment in and advances to the China JV, additional interest expense and unrealized foreign currency exchange losses attributed primarily to intercompany loans. For a reconciliation of (i) net loss to Acquisition Adjusted EBITDA and (ii) cash flows from operating activities to Acquisition Adjusted EBITDA, refer to Item 6, Selected Financial Data, of this annual report.
5
Table of Contents
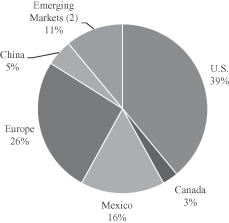
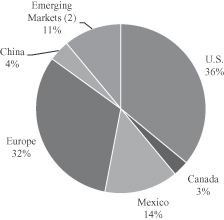
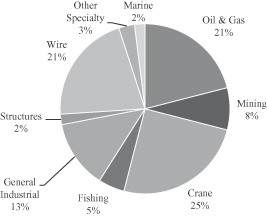
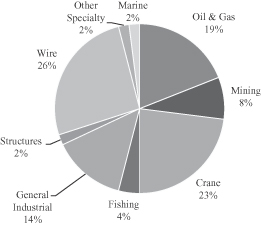
The charts below provide a breakdown of our 2011 actual and pro forma sales(1) by customer location and end market:
| 2011 Actual Sales by Customer Location | 2011 Pro forma Sales(1) by Customer Location | |
|
| |
| 2011 Actual Sales by End Market | 2011 Pro forma Sales(1) by End Market | |
|
| |
| (1) | 2011 pro forma sales reflect the July 18, 2011 acquisition of Drumet Liny i Druty spółka z ograniczoną odpowiedzialnością (“Drumet”) as if it closed on January 1, 2011. See Note 3 “Acquisitions” to our consolidated financial statements included in Item 8, Financial Statements and Supplementary Data, of this annual report for additional information on the Drumet acquisition. |
| (2) | Emerging markets primarily include Africa, Australia, Central America, Commonwealth of Independent States (“CIS”), India, the Middle East, the Pacific Rim and South America. |
OUR HISTORY
On June 30, 2003, Wire Rope Corporation of America purchased our predecessor’s assets out of bankruptcy. After restructuring our operations, we began to expand globally. On June 17, 2005, we acquired Aceros Camesa, S.A. de C.V. (“Aceros Camesa”), which provided us with low cost manufacturing, increased capacity, a source of high quality, low cost wire for our wire ropes throughout North America, expanded geographic coverage, product diversification and access to additional customers in the industries we serve. On June 12, 2006, we entered into a 50-year equity joint venture agreement with WISCO Wuhan Jiangbei Iron and Steel Ltd. (f/k/a Jiangbei Steel Processing and Logistics Co., Ltd.), a steel producer based in Hubei, China, and wholly owned subsidiary of Wuhan Iron and Steel Company, establishing WISCO WireCo Wire Rope Co., Ltd. (f/k/a WISCO WRCA Co. Ltd.) (“China JV”) in Wuhan, China, primarily for the purpose of manufacturing, marketing and sale of specialty wire and wire ropes.
6
Table of Contents
In 2007, we purchased three companies. On February 26, 2007, we purchased all of the outstanding shares of Wireline Works Partnership (“Wireline Works”), a Calgary, Canada-based manufacturer of EMC for the oil & gas market. On August 24, 2007, we purchased all of the outstanding shares of CASAR Drahtseilwerk Saar GmbH (“CASAR”), a manufacturer of high performance wire rope for the crane and mining end markets, located in Kirkel, Germany. The CASAR acquisition provided a premium brand, new customers and our first manufacturing footprint in Europe. On November 16, 2007, we purchased all of the outstanding shares of U.S. Reel, Inc. (“U.S. Reel”), a leading U.S. wooden reels supplier located in Carrolton, Missouri. In 2007, Wire Rope Corporation of America changed its name to WireCo WorldGroup Inc. to align its identity with our global operations. Since 2008, we have completed one acquisition each year.
Phillystran Acquisition. On December 31, 2009, we purchased all of the outstanding shares of Phillystran Inc. (“Phillystran”) based in Montgomeryville, Pennsylvania. Phillystran is a leading manufacturer of high performance synthetic rope products. With this acquisition, we expanded into the global high tech synthetic rope market.
Oliveira Acquisition. On November 16, 2010, we purchased all of the outstanding shares of Luís Oliveira Sá, SGPS, S.A. (“Oliveira”), a Portugal-based steel and synthetic rope manufacturer with facilities in Portugal and the Netherlands. Oliveira is a leading manufacturer of high performance synthetic ropes targeted at the offshore oil and gas, marine, agricultural and general industrial markets and wire ropes for the fishing and crane markets. In combination with the Phillystran acquisition described above, we now market technologically advanced synthetic ropes on a global scale. In addition to diversifying our product offerings, we were able to access new customers, expand our end markets and broaden our geographic coverage, primarily in Europe.
Drumet Acquisition. On July 18, 2011, we purchased all of the outstanding shares of Drumet, a leading producer of steel wire ropes and a large producer of specialty wire and staple band located in Włocławek, Poland. Drumet’s wire capacity supplies most of our internal wire requirements in Europe, which allows us to manufacture the highest quality wire for our wire ropes, provide shorter lead times, reduce our inventory, provide greater manufacturing flexibility and offer significant cost savings. In addition, Drumet expands our sales presence in Eastern Europe with new customer relationships, introduces a new brand to the Company’s existing portfolio and offers a high-quality, low-cost labor base. Furthermore, we expect to continue penetrating existing markets by cross-selling our broad portfolio of branded products.
OUR STRATEGY
Expand Global Penetration and Brand Distinction to Drive Organic Growth. We intend to capitalize on our technological leadership, market position, engineering capabilities and industry expertise to target growth opportunities in both emerging geographic markets and attractive industry segments within large established markets. We believe substantial growth opportunities exist internationally. Accordingly, we have invested significantly in expanding our international sales force, implemented a comprehensive global sales and brand management strategy and established a global manufacturing and service structure to increase our presence in these key growth markets. Industry teams have been established to provide product expertise and outstanding customer service for the crane, oil and gas, mining, fishing and structures end markets. We intend to leverage our strong existing relationships with large multinational firms to expand into new markets and grow our business within existing markets.
Drive Growth Through Continued Product Innovation. We plan to build on our history of innovation and technological expertise to bring to market new highly engineered products. We have over 50 engineers and metallurgists who in their respective capacities contribute to our product development efforts. For more information on products currently in development, refer to the Product Development section within Our Business Activities.
7
Table of Contents
Create One Customer Experience. We will develop business processes and systems to support a consistent customer experience across all brands and markets. The four key elements to the “One WireCo” customer experience include:
| 1. | Product quality and performance; |
| 2. | On time delivery; |
| 3. | Creative solutions to customer applications delivered by engineers, industry specialists and customer service representatives; and |
| 4. | Standing behind everything we do. |
Our global sales team has the technical training to offer customers products from our broad portfolio of brands in order to best meet their performance requirements. Our global manufacturing and distribution footprint, complemented by our vertically integrated production of wire for our wire ropes, provides the highest level of quality assurance with the shortest amount of lead time possible for our customers. We believe providing customers with the same high quality service and products across all of our brands and locations will enhance our customer relationships and growth potential.
Optimize our Global Assets through Supply Chain Management. Our supply chain process is centrally managed to provide cost reduction opportunities within our global operations through strategic sourcing relationships for key raw materials used to manufacture our products. Where cost effective, we utilize internally produced wire that is consumed in the production process to displace externally sourced materials, and we leverage our global transportation through carriers with regional expertise. We are also implementing production planning scheduling tools and processes to optimize the manufacturing of our products to serve our customers’ needs, asset utilization, inventory management and overall costs.
Diversify through Strategic Acquisitions. We have a strong track record of identifying, executing and successfully integrating acquisitions. Since 2007, we have successfully integrated five acquisitions (Wireline Works, CASAR, U.S. Reel, Phillystran and Oliveira) and we are in the process of integrating Drumet, which we acquired in July 2011. These acquisitions have been critical to creating new growth opportunities, have enhanced our leadership position and have served to diversify our end market penetration. We plan to continue pursuing acquisitions and strategic alliances that further expand and complement our product portfolio, improve our competitive positioning in growth markets and present opportunities for significant cost synergies. We will evaluate each potential acquisition by strategic and financial metrics and prioritize maintaining liquidity.
SEGMENT REPORTING
We report the manufacturing, marketing, selling and distribution of wire and synthetic ropes, EMC, specialty wire and related products as one global enterprise. We have five operating segments that reflect geographic regions including the United States, Mexico, Germany, Portugal and Poland. The production processes across each of these operating segments exhibit a high degree of similarity involving stranding wire or synthetic fiber and closing the resulting strand into wire or synthetic rope. We have established a global sales force organized by geography and supported by end-market directors and an international operations group, which parallels the global sales structure with one member of management responsible for North American operations and another member of management responsible for European operations. Additionally, the global supply chain management functions of logistics, purchasing and planning are headquartered at the corporate office. In order to align employee interests with our global objectives, one of our primary employee incentive plans is based upon our consolidated results. Financial information reported at the consolidated level is used by corporate management in evaluating overall financial and operational performance, market strategies and decisions to allocate capital resources. Based upon all of these factors, we have concluded that we have one reportable segment. For information regarding net sales, net income (loss) and assets, refer to our consolidated financial statements included in Item 8, Financial Statements and Supplementary Data.
8
Table of Contents
OUR INDUSTRY
Overview
Our industry consists of highly engineered wire ropes, synthetic ropes, EMC and specialty wire. Wire ropes serve a variety of end markets such as crane, oil and gas, mining, general industrial, fishing, marine and structures, which require customized products capable of withstanding extremely heavy loads and harsh operating environments with specific quality, durability, weight, functionality and performance capabilities. Given the intensity of wire rope usage in heavy lifting, pulling, supporting and suspension applications and their consumable nature, wire ropes are subject to strict inspection and removal criteria, necessitating frequent replacement. As a result, the aftermarket represents a significant portion of highly engineered wire rope sales.
The following provides a detailed description about uses of our products by some of our end markets and the growth drivers impacting respective key industry end markets:
Cranes
Wire ropes are a critical component of infrastructure applications and are used by cranes and other heavy machinery employed in commercial construction for repair and maintenance of buildings, manufacturing facilities, bridges, material handling at port and railway facilities and other infrastructure assets. Growth in this market is predominantly driven by global macroeconomic and demographic trends, including economic activity, population growth, urbanization and aging infrastructure throughout the world. Infrastructure demand for wire ropes is also impacted by commercial trade and transportation activity as wire ropes are used by container cranes at ports and rail yards.
Having reached a trough in mid-2009, the crane market is expected to rebound in line with broader construction and infrastructure trends. According to the Association of Equipment Manufacturers, the global construction machinery industry is predicted to grow approximately 11% in 2012, 10% in 2013 and 8% in 2014. The resulting increase in construction activity is expected to increase demand for wire rope, as new cranes coming online will require high-tech wire rope products to operate, while existing cranes will require frequent replacements from the normal wear-and-tear associated with heavy industrial processes.
The wire rope industry is expected to benefit from two key macroeconomic trends: a growing demand for emerging market infrastructure and an increasing emphasis on clean-tech, alternative and traditional energy.
| • | Infrastructure projects are expected to increase in emerging market economies driven by a rapidly growing population, continued urbanization and strong gross domestic product growth. For example, China continues to invest heavily in infrastructure projects and recently announced plans to build 42,000 kilometers of new rail track by 2020. This construction will require significant crane usage, and thus offers a substantial opportunity for technically advanced wire rope products. In India, demand for infrastructure is amplified by significant infrastructure shortages throughout the country. Per the Economic Times, India’s heavily utilized ports, congested roads, chronic power and water shortages and aging railways, has prompted investment of nearly $480 billion in the five-year plan ending in 2012, more than doubling their investment of $216 billion during the previous plan. The next plan envisions investment of $1 trillion. |
| • | The growing popularity of construction associated with green and alternative energy sources is another positive sign for the crane industry. The United Kingdom’s intentions to source a quarter of its electric requirements from off-shore wind farms by 2020 will require new turbines to support 32 gigawatts of generating capacity over the span of the next decade. This represents a vast potential for the original equipment manufacturers (“OEM”) and replacement crane market, as it involves huge cranes mounted on semi-submersible barges. The market for nuclear power plant construction also presents a significant expansion opportunity for cranes: China plans to bring the nuclear sector’s share of China’s power-generating capacity to 4% from less than 2%. The U.S. is also expected to increase its share of electricity derived from nuclear energy, which is currently 20%, with four to six new reactors coming |
9
Table of Contents
| on line by 2020, according to the World Nuclear Association. Each nuclear power construction site requires the use of approximately three to six jumbo crawler cranes for a number of years, and will therefore potentially require frequent and high volume wire rope replacements to maintain smooth crane operations. |
Oil and Gas
Wire and synthetic ropes are used throughout the oil and gas industry from exploration to production. Wire rope and synthetic rope demand will benefit from several key trends in the oil and gas market:
| • | Growth in active rig count driven by increasing global energy demand; |
| • | Increasing average well depth requiring larger ropes with specific weight and strength characteristics; and |
| • | Greater need for real-time data transmission to optimize drilling efficiency. |
The increased global demand for oil and gas drives increased production, workover, completion and drilling activity, as observed in the rising active global rig count. According to Baker Hughes, the worldwide active rig count increased from 3,227 as of December 2010 to 3,612 as of December 2011, an increase of 12%. Oil and gas activity varies by geography based on local drilling and production economics. The U.S. active rig count increased from 1,711 rigs as of December 2010 to 2,003 rigs as of December 2011, an increase of 17%.
According to the U.S. Energy Information Administration, the average depth of a crude oil exploratory well has increased from 6,950 feet to 7,778 feet. Demand for synthetic rope is increasing as offshore drilling and production activity continues to expand into deeper water depths where steel ropes are prohibitively heavy to use. Wire ropes cannot be used for mooring applications beyond approximately 6,500 feet, whereas synthetic ropes can be used up to approximately 32,800 feet. Synthetic ropes are also used for seismic streamer applications in offshore exploration.
As production and drilling activity shifts to harder-to-access reserves, the need for real-time information becomes increasingly important to optimize production. EMC provides the strength member and signal conductor for insertion and removal of the geophysical tools used for data-logging and perforation of the well. Demand for EMC is estimated to grow in line with the broader oil and gas industry, while supply remains limited given the unique technological expertise required to produce this product.
Mining
Wire ropes are used for various operating applications, primarily in surface and deep shaft mining for minerals, base and precious metals. The mining industry is marked by long-term growth trends and historically stable production. As a result, the aftermarket for parts and servicing of mining equipment tends to be relatively stable. The high fixed costs and lower variable costs associated with operating a mine help contribute to a decreased likelihood of shutdown once a mine is opened. In addition, mines typically operate 24 hours per day, seven days per week due to the high costs associated with any downtime. Due to the severe wear-and-tear that wire ropes endure in surface mining operations, wire ropes typically need to be replaced every two to nine months according to strict safety guidelines.
Mining activity has been increasing despite fluctuations in commodity pricing. The global natural resource market is benefiting from heightened demand driven by the urbanization of emerging markets such as China. According to the China Electricity Council, China’s coal demand is expected to be 4.3 billion tons by 2015. The exploration and production of mined commodity metals such as copper and iron ore is expected to increase in the near future. According to the International Copper Study Group, worldwide mine production of copper was 16.8 million metric tons in 2011 and is projected to increase to 17.9 million metric tons in 2012.
10
Table of Contents
General Industrial
General industrial encompasses industrial applications that use general purpose wire rope or specialty wire in various end markets, including construction, transportation, defense, automotive, agriculture and logging. These end markets tend to be directly correlated to general economic activity and output given the breadth of applications included. According to the International Monetary Fund, global output is expected to grow 3.3% in 2012 and 3.9% in 2013, with growth in emerging and developing countries, such as Russia, China, India and Brazil at 5.4% in 2012 and 5.9% in 2013. The global outlook was slightly revised downward compared to last year due primarily to the euro area economy. Growth in emerging and developing economies slowed more than forecast, possibly due to a greater-than-expected effect of macroeconomic policy tightening or weaker underlying growth.
OUR PRODUCTS
Our position as one of the global leaders in each of the end markets we serve is derived from our ability to provide a comprehensive and technically advanced product portfolio of wire rope, synthetic rope, EMC, fabricated products and specialty wire. Our products have limited life cycles as a result of operating wear-and-tear. Below is detail of the various products we offer:
Wire Rope
We produce both highly engineered specialty products and general purpose wire rope suitable for a variety of uses. Our wire rope products are sold under CASAR, MacWhyte, Union, Camesa, Oliveira and Drumet brand names and range from small specialty ropes of 1/16 of an inch in diameter to large mining ropes of up to five inches in diameter. Several applications of wire rope products are listed below by end market:
| End Market |
Uses | |
| Oil and Gas | Drill lines Sand lines Tubing lines | |
| Crane | Construction (tower, mobile) Harbor (ship-to-shore, dockside) Marine (deck, offshore) Industrial (overhead and special cranes) | |
| General Industrial | Slings Barrier cable | |
| Mining | Surface mining ropes (drag lines, shovels) Underground ropes (shaft ropes, balance ropes) | |
| Marine | Mooring lines Towing lines | |
| Structures | Bridges | |
| Fishing | Bottom trawlers Tuna fishing | |
| Other Specialty | Logging Aircraft | |
11
Table of Contents
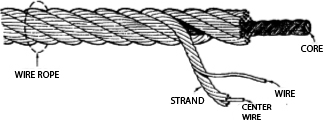
Wire ropes are designed and engineered to meet specific end use requirements and customer specifications, such as bright or galvanized rope, or rope that is impregnated with various synthetic materials. Production begins by helically stranding, or laying, steel wire together around a center wire to form strands. During the stranding process, protective lubricants are applied to the strands before they are spooled and taken to the closing department where they are finished into wire rope. Closing machines helically arrange, or close, the strands of wire around an independent wire rope or fiber core to form wire rope.
We are a provider of both highly engineered and standardized rope products. We market our wire rope products using the Union, MacWhyte and CASAR brand names as highly engineered products that, although more expensive than most competitors’ wire rope, provide customers with better value due to their quality, performance and the aftermarket service we provide. Our standardized products are sold under the Camesa, Oliveira and Drumet brand names. We have targeted markets both domestically and internationally and determined specific customers and products to be used to penetrate these markets. Our product development efforts will continue to identify critical applications where new or enhanced products can add value for the end user. Our product development process incorporates our extensive field expertise, rope design experience, manufacturing knowledge, state-of-the-art metallurgy and plastic extrusion capabilities to develop products that set the standard for performance in key industries. Net sales of wire rope were approximately 59%, 61% and 65% of our consolidated net sales for the years ended December 31, 2011, 2010 and 2009, respectively.
Synthetic Rope
We manufacture and sell synthetic rope products under the Phillystran and Oliveira brand names. Synthetic ropes are high tenacity fiber ropes, strands, braids and strength members made from fibers such as Kevlar®, Dyneema®, Twaron® and Technora®, and are used in a broad range of marine, fishing, industrial and government/military rope applications. Synthetic ropes are primarily used in applications that require specific operating strength, buoyancy, corrosion resistance or weight tolerance characteristics beyond wire rope. These include mooring lines, fishing ropes, life and winch lines, structural and support lines, boat rigging, power cables and broadcast tower guy cables. We have pioneered the development of new products which combine the use of steel wire ropes with high-strength synthetic components that improves the strength to weight ratio in the finished product.
We specialize in producing jacketed synthetic ropes as well as braided, twisted, and parallel ropes and strength members. Jacketed ropes have a protective outer jacket that increases the synthetic fibers’ resistance to harsh and abrasive conditions. All synthetic ropes are tested for tensile strength, elongation, modulus, stress relaxation, creep, tension, and bending life in both wet and dry conditions to ensure a high quality. Many of the products supplied by Phillystran and Oliveira are designed to specific customer requirements. Net sales of synthetic rope represented approximately 6% and 5% of our consolidated net sales for the years ended December 31, 2011 and 2010, respectively.
EMC
We believe that we are the leading non-captive global manufacturer of EMC. Our EMC product, marketed under the Camesa and Wireline Works brand names, is an electrical signal conducting cable that is armor-plated with high-carbon steel wire or highly engineered steel alloys to protect the signal conductors inside. Our EMC
12
Table of Contents
product is used in the oil and gas exploration industry and provides a link to the surface from underground drilling holes. The cable not only transmits data but also acts as a strength member for the insertion and removal of the geophysical tools used for logging and perforating the wells. We produce EMC to customer specifications in single conductor and multiconductor varieties, and the production process consists of stranding together purchased copper wires that are then jacketed with a polypropylene plastic. The jacketed copper strands are then stranded together, covered with an adhesive tape and wrapped by two layers of high-carbon steel wire to form the finished product.
We service our EMC customers through a network of distributors worldwide. We believe the Camesa brand of EMC has a very strong brand image for quality and reliability in this market. We sell EMC primarily to oil and gas companies operating in Mexico, the U.S. and Canada, but have strong distribution relationships in China, the Middle East and Europe. As part of our customer service strategy, we routinely produce EMC to customer specifications and inventory standardized product around the globe. Net sales of EMC represented approximately 7%, 9% and 7% of our consolidated net sales for the years ended December 31, 2011, 2010 and 2009, respectively.
Fabricated products
We also manufacture fabricated products with wire rope. These fabricated products are wire ropes with a wide variety of fittings attached at the ends, ranging from hooks, studs or sockets to highly specialized fittings produced to customer specifications. We are a leading supplier of bridge cable in North America with an increasing presence in South America and Europe. Our products include bridge rope, spiral strand, locked coil and custom assemblies sold into suspension and bridge applications. These products are custom designed and often have longer lead times compared to our other products. Sold under the WireCo and MacWhyte brand names, we supplied the cable hangers for America’s latest two large bridge projects: the San Francisco Bay Bridge and the Manhattan Bridge. We are currently supplying the lift cables for the Bordeaux Bridge in France.
We are a leading manufacturer of engineered OEM fabricated products, supplying the crane, automotive, amusement ride, mining, industrial, petroleum and military markets. These products are custom made to exacting standards and requirements. Our product line spans a wide range of specialty assemblies including parachute cables on NASA’s latest space capsule, the Orion, to jet-catching arrestor cables on aircraft carriers.
Net sales of fabricated products represented approximately 6% of our consolidated net sales for each of the years ended December 31, 2011, 2010 and 2009.
Specialty Wire
We are a leading producer of specialty wire used for infrastructure applications and general industrial end markets. Our high-quality wire products, such as spring wire, PC strand, tire bead, hard drawn wire, steel wire band and guy strands are manufactured for a wide variety of uses in a broad range of industries. For example, our wire products are used in furniture, mattress springs, screens, augers, car and truck tires, construction, air conditioning, fencing and tensioning applications. Our PC strand serves as a strengthening member in concrete used in bridges, road projects and commercial construction. Steel wire band is used to manufacture staples for various industries and guy strand is used in the telecommunications industry. We also manufacture high-carbon steel wire for use in the production of our own wire ropes and EMC products. Steel wire is produced by reducing the diameter of high-carbon steel rod into smaller diameter wires. The production process begins by submerging the high-carbon steel rod coils in various chemical baths to clean it of scale and rust, and to ensure it is lubricated and chemically ready for the production process. The high-carbon steel rod is then drawn, or pulled, through carboloy dies, which transforms it into wire of various diameters and tensile strengths.
We manufacture specialty wire products in the U.S., Mexico and Poland and primarily sell it throughout North America, South America and Europe. We service our customers through wire distributors and direct sales to manufacturers and end users globally. In order to quickly fill customer orders and effectively sell specialty
13
Table of Contents
steel wire through customary spot contracts, we usually maintain short production lead times and carry small inventories of various types of high volume wires. We only maintain inventory for long-term accounts with consistent purchasing behavior. We plan to grow our specialty wire sales globally with our high quality and cost competitive specialty wire products produced in Mexico and Poland. Our net sales of specialty wire were approximately 21%, 20% and 22% of our consolidated net sales for the years ended December 31, 2011, 2010 and 2009, respectively.
OUR BUSINESS ACTIVITIES
Manufacturing
We operate 13 manufacturing facilities located in North America and Europe. Within the U.S., we have five facilities located in Missouri in the cities of St. Joseph, Sedalia, Chillicothe, Kirksville and Carrollton and manufacturing facilities in Rosenberg, Texas and Montgomeryville, Pennsylvania. We have two facilities in Mexico in the cities of Vallejo and Cuautitlan. Within Europe, we have a facility in Kirkel, Germany, two facilities in Portugal in the cities of Maia and Paredes and one facility in Włocławek, Poland. Our China JV also operates a facility in Wuhan, China.
Sales, Marketing and Distribution
During 2010, a new global sales structure was developed. This new structure focuses on expanding our international sales force and streamlining our product and end market management with a comprehensive global sales strategy. Our global sales force is directed by two senior members of the management team. We have a cross-functional sales force consisting of regional sales managers who are supported by global end-market directors. Our team of global end-market directors is responsible for the marketing efforts and business development activities for key end markets. Our industry technical experts help our customers understand the optimal rope for their specific applications in order to maximize performance, enhance safety and decrease costs. Each global end-market director works with assigned product engineers and production planners. This structure is designed to provide the highest level of service to our customers. The regional sales managers maintain primary sales responsibility for sales in a geographic region of the world. We continued to expand our sales coverage in emerging markets by adding regional managers. During 2010, we added sales coverage in Canada, Europe, CIS, Africa, Australia, the Pacific Rim and the Middle East. The sales of our products are driven by a technical understanding of the applications. The evolution of our sales force has contributed to our growth.
We provide technical and educational materials to distributors and customers and often dispatch engineering personnel to visit end user operations. Our team of more than 50 engineers and metallurgists is an important resource for end-users, assisting in installations and explaining operating parameters and machinery limitations to our customers’ operators and facility managers. Our engineering staff works closely with our customers and our manufacturing facilities to design and produce the best products that fulfill their specific needs. We complement these sales efforts with a comprehensive internet presence that provides information on our products and technical support capabilities in multiple languages. We also participate in trade shows targeted at our key markets to expand our brand identity. An international business director and our customer service team coordinate the efforts of all parties to assure a rapid response to customers around the world.
Customers
Our key customers include distributors, OEMs and end users of our products in the various industries we serve. We benefit from a broad customer base and have a strong incumbency position, as evidenced by the fact that, on average, our top 20 customers have been conducting business with us for over 20 years. Due to our diversified customer base, our top ten customers only accounted for approximately 23% and 26% of our net sales in 2011 and 2010, respectively, and our largest customer accounted for less than 6% of net sales in 2011 and 2010.
14
Table of Contents
Raw Materials and Suppliers
The main raw materials that we use to manufacture our products are high-carbon steel rod and synthetic fibers. We purchase high-carbon steel rod from a number of U.S., Mexican and other foreign suppliers. We purchase standard fibers, such as polypropylene, polyethylene, polyester and polyamide (nylon), and high tenacity synthetic fibers, such as Dyneema®, from a number of suppliers located in the U.S., Europe, China, Japan, Brazil and other foreign countries. These raw materials are purchased at regular intervals, usually on a monthly basis, depending on pricing and market conditions.
Product Development
Our product engineering department includes both R&D engineers and technical service engineers who are located in the corporate office as well as around the world. Our product development effort also includes members of sales, finance, quality assurance and manufacturing operations. The product engineering team also has responsibility for product training and evaluating performance of all our products at customer locations as well as other quality assurance activities.
We have over 50 engineers and metallurgists who in their respective capacities contribute to our product development efforts. We believe our research and development initiatives have enhanced our reputation as a product innovator in the industries that we serve. Demand for the products developed in previous years continues to increase as our customers recognize the added value to their business. Within the last two years, we have introduced an average of nine new products per year to the diverse industries that we serve. These new products have been added to our already extensive and highly engineered product portfolio. We plan to build on our history of innovation and technological expertise to bring to market new highly engineered products. We have plans in 2012 to introduce eight new products.
Based on our review of related costs, we estimate our annual cost of research and development to be less than $2.0 million.
TRADEMARKS
We rely on patents, trademarks, trade secrets and other intellectual property laws and strategies to protect our proprietary rights. We have a significant number of trademarks covering our company names and material brands. These trademarks include WireCo® WorldGroup, Union®, Camesa®, MacWhyte®, CASAR®, Wireline Works™, U.S. Reel™, Phillystran®, Oliveira™ and Drumet®. In addition, we have trademarks registered in the U.S. and some foreign countries to protect our specific “marker strand” designs, which, consistent with market practice, designate our wire rope products as well as various product trade names. We have also trademarked our orange plastic coating used to enhance the performance of our wire rope product lines.
COMPETITION
We produce and sell a wide range of products and compete with other U.S. and international manufacturers of similar products. Our main competitors in the wire rope sector include Bridon International Ltd., Usha Martin Ltd. and KISWIRE Co., Ltd. Our major competitors in the synthetic rope sector include Cortland Cable Co., Bexco Ropes B.V., Samson Rope Technologies, Royal Lankhorst Euronete Group, Lupatech S.A., CSL and Offshore & Trawl Supply AS (“OTS”). In the EMC sector, we compete with Rochester Corporation and other vertically integrated companies which produce EMC solely for internal use. Our main competitors in the specialty wire sector include KISWIRE Co. Ltd., N.V. Bekaert S.A., Leggett & Platt Wire Group, Davis Wire Corporation, Deacero, S.A. de C.V. and various other manufacturers, both domestic and international.
In spite of this highly competitive environment, we have established market leading positions in the end markets we serve under our distinguished brands. We generally compete on the basis of product performance, price and sales and technical service support. We do not currently face significant competition from alternative technologies, such as hydraulic mechanisms.
15
Table of Contents
Competitive Strengths
Global Leadership Position. We maintain leadership positions across our end markets. In the crane market, our CASAR brand is recognized around the world as a leader in high-performance crane ropes used in a wide range of heavy lifting applications, including tower cranes, mobile cranes and port cranes. This position provides us with a strong and growing presence in North America, Europe and Asia, the three major centers for crane manufacturing and utilization in the world. We are a leading supplier to the oil and gas and mining end markets under the Union brand. Our Camesa brand EMC product is recognized globally as a premier product offering. We are a premium provider of synthetic ropes sold under the Phillystran and Oliveira brands. We attribute our leadership position to our engineering capabilities and technical expertise underpinned by a heritage of over 75 years of innovation, quality, industry experience and superior customer service. We also differentiate ourselves through our comprehensive portfolio of over 4,000 highly engineered rope designs.
Global Manufacturing Footprint Combined with Local Distribution. We focus on maintaining an efficient global supply chain and a variable, low-cost operating model. We have 13 manufacturing facilities in North America and Europe. Our China JV also operates a facility in Wuhan, China. These facilities are strategically located to provide fast delivery and short lead times to ensure product availability and high quality customer service from our well-trained sales and engineering teams. We leverage our low cost facilities to provide wire and other components to other facilities globally for use in the assembly of more highly engineered products. As we enter new global markets, our manufacturing capabilities allow us to match manufacturing requirements to customer demand.
Advanced Technical and Manufacturing Expertise. Our team of over 50 engineers and metallurgists continues to enhance our current product offering portfolio as well as develop new product innovations that extend our leading technical expertise and enable us to deliver application-specific products to our customers. Our experienced manufacturing team of plant managers and engineers has extensive industry experience, allowing us to leverage a talented and knowledgeable workforce to deliver high performance products to our customers. Our culture of innovation has led to the frequent introduction of new products and extension of product lines to meet the changing needs of our customers.
Diversity of End Markets, Customers and Geographies. We offer a broad range of leading brand name products to over 5,800 customers across a diverse range of end markets. We believe our overall business diversity helps to mitigate the impact of a downturn in any one product, end market or geographic area. We also have a global customer base generating approximately 61% and 52% of net sales in 2011 and 2010, respectively, to customers outside the U.S. We expect that percentage to increase as we expand our overseas market presence and further integrate recently acquired manufacturing facilities.
Poised to Benefit from End Markets with Attractive Fundamentals. Our leading market positions, global manufacturing and distribution footprint and technical capabilities position us to benefit from strong industry fundamentals in the major end markets we serve. Global infrastructure spending is expected to total more than $41 trillion through 2030, driven by the urbanization of emerging markets such as China, India and Brazil, as well as stimulus projects aimed at refurbishing infrastructure in developed markets. Drilling and production activity is expanding into new and harsher environments that will require more technologically advanced rope, longer drill lines and more frequent replacement cycles, each of which is expected to increase demand for wire rope. Furthermore, global mining activity is also expected to strengthen as long term demand for coal, copper and other minerals increase in line with the increased need for natural resources and energy.
Recurring Sales and Profitability. Our highly engineered and specialized ropes are mission critical equipment components in our customers’ operations. Although they represent a comparatively small cost of the larger projects in which they are used, our customers view our products as key operating expenses in the broader context of limiting exposure to operational disruption and downtime, and, as a result, are willing to pay for high quality ropes. Moreover, the consumable nature of our products and their rigid replacement cycles result in a recurring revenue base. Our sales are complemented by our flexible cost structure and our focus on maintaining
16
Table of Contents
and enhancing our profitability. For example, from 2007 to 2011, we increased gross profit from 20% to 26%. We have also demonstrated an ability to deliver favorable financial results throughout economic cycles by reacting quickly and closely managing our cost position by head count reduction, production optimization and distribution rationalization.
Experienced and Proven Management Team. We are led by an experienced management team that has over 300 cumulative years of direct industry experience and averages 22 years of experience. Management holds a meaningful equity interest and their compensation is tied directly to our financial performance. The team has a proven track record of product development, expanding the customer base, improving operating efficiencies and entering new markets. Consistent with our strategy of further diversifying and strengthening our product platform, management has a successful track record of pursuing and integrating complementary and strategic acquisitions.
REGULATION
Safety
Our facilities and operations are subject to, among other laws and regulations, comprehensive occupational health and safety laws and regulations. Numerous national and local government agencies in a number of countries regulate our manufacturing operations to protect the health of workers, prevent workplace injuries and illnesses and save lives. The Occupational Safety and Health Administration (“OSHA”) is the primary regulator in the United States. The Secretariat of Labor and Social Welfare (“STPS”) issues the regulations on health and safety in the workplace in Mexico. The European Agency for Safety and Health at Work (“EU-OSHA”) is the regulator in Germany, Portugal and Poland. The State Administration on Work Safety (“SAWS”) is the agency of the Government of the People’s Republic of China responsible for the regulation of risks to occupational safety and health in China. Our facilities are subject to investigation by these regulators without advance notice. Our regulators have not identified any material deficiencies or situations that could have a material impact on our operations.
Environmental Matters
Our business operations and facilities are subject to a number of laws and regulations, which govern the discharge of pollutants and hazardous substances into the air and water, the handling, storage, use and disposal of such materials and remediation of contaminated sites. The Environmental Protection Agency (“EPA”) is the primary regulator in the United States. Mexico’s environment ministry is The Secretariat of Environment and Natural Resources. Within Europe, the Federal Ministry of the Environment, Nature Conservation and Nuclear Safety is the regulator in Germany, the Ministry for Environment and Spatial Planning is the regulator in Portugal and the Ministry of the Environment is the regulator in Poland. The People’s Republic of China formed the Ministry of Environmental Protection to oversee regulations in China to protect human health and the environment. Operations at our facilities include transforming steel rods and wire into wire rope or cable, which can produce wastewater, spent acid and excess petroleum waste and transforming polyethylene and polypropylene into fiber strand and fiber rope, which produce no waste. We also store certain petroleum products and hazardous substances that we use in our operations. Due to the nature of these activities, our facilities are subject to investigation by regulators who regularly inspect our facilities. Our regulators have not identified any material deficiencies or situations that could have a material impact on our operations.
Quality Certifications
We hold numerous quality certifications for the products we manufacture. All of our rope and wire fabrication facilities throughout North America and Europe, including our China JV in Asia, are ISO 9001 certified. ISO 9001 is an international standard certification granted by the International Organization for Standardization (“ISO”) that confirms a supplier can consistently provide goods and services that meet client needs and expectations and comply with applicable regulations. Certain of our facilities in the U.S. and Mexico and the facility operated by our China JV provide product into the petroleum industry are also certified to
17
Table of Contents
“API 9A”. This API certification is granted by the American Petroleum Institute (“API”) and relates to quality and performance standards for oilfield products. Our API certifications assure our customers that we have a quality control system and that our products are approved in accordance with API performance standards. Because of the high risk environment inherent in our customers’ industries, many insurance providers require petroleum companies to only purchase products that are produced from a supplier certified by API and carries the API logo. Our goal is to have our three European plants API certified by the end of 2012. The Qualified Products List (“QPL”) 83420 certification, granted by the Defense Logistics Agency of the U.S. government, provides us with the ability to produce and supply aircraft control cables for various aircraft manufacturers, including Boeing, Raytheon, Cessna and the U.S. government. We also hold a certification to AS9100, which relates specifically to the aircraft industry. We believe we are the only manufacturer that holds all four such certifications.
We hold Center for Engineering (“CFE”) certifications for products produced at our facilities in Mexico. CFE certifications are granted by the Mexican federal government and authorize an industrial manufacturer to supply industrial products. Specific customers also certify us as qualified and approved suppliers. We are certified by many of the largest manufacturers in the world, including PEMEX, Boeing, Cessna, Goodrich, Caterpillar, Grove and Oshkosh Truck.
We are certified by Lloyd’s Register Quality Assurance, Inc. for the products produced at our St. Joseph and Sedalia locations in Missouri. The Lloyd’s Register Group is an independent risk-management organization providing risk assessment and mitigation services and management systems certification. We are certified by Germanischer Lloyd SE for the products produced at our German and Portuguese facilities. Germanischer Lloyd is a technical supervisory organization that conducts safety surveys to mitigate risks and assurance of technical compliance for the shipping and oil and gas industries.
EMPLOYEES AND LABOR RELATIONS
We have nearly 3,000 employees, not including the China JV, of which approximately 65% are covered by collective bargaining agreements. The current agreements have expiration dates as follows:
| Location |
Collective Bargaining Unit |
Expiration | ||
| St. Joseph, Missouri | United Steelworkers of America Local 5783 | June 30, 2013 | ||
| St. Joseph, Missouri | International Brotherhood of Electric Workers Local 545 | December 31, 2014 | ||
| Chillicothe, Missouri | United Steelworkers of America Local 990-1 | February 28, 2014 | ||
| Vallejo, Mexico | Sindicato Progresista de Trabajadores de la Industria Metálica, del Plástico, del Vidrio, Similares y Conexos de la República Mexicana | October 31, 2012 | ||
| Cuautitlan, Mexico | Indicato de Trabajdores de la Industria Metálica y Metal-Mecánica de la Industria y Maquila de Cables de Acero, Alambres, Compra-Venta de Materiales, Maquinaria y Refacciones, Maquinados, Soldadura, Arrendamiento de Equipo, Similares y Conexos del Estado de México | December 31, 2012 | ||
| Kirkel, Germany | Industriegewerkschaft Metall | May 31, 2013 | ||
| Maia and Paredes, Portugal | Federação dos Sindicatos dos Trabalhadores Texteis, Lanifícios, Vesturário, Calçado e Peles de Portugal (“FESETE”) | February 28, 2011(1) | ||
| Włocławek, Poland | Trade Union of Metal Workers in DRUMET, the Independent and Self-Governing Trade Union Solidarność in DRUMET and Technicians and Engineers Trade Union | December 31, 2014 |
| (1) | The collective bargaining agreement for the year 2012 has not been formally approved at our Portuguese facility; the previous agreement issued on February 28, 2011 continues to remain effective. |
18
Table of Contents
FINANCIAL INFORMATION ABOUT GEOGRAPHIC AREAS
WireCo’s foreign operations are primarily conducted in Mexico, Germany, Portugal and Poland, where we have manufacturing facilities. Refer to Note 17—“Segment Reporting” to our consolidated financial statements included in Item 8, Financial Statements and Supplementary Data, of this annual report for financial information about WireCo’s foreign and domestic operations.
AVAILABLE INFORMATION
Effective February 7, 2012, we became an SEC registrant and will file annual reports, quarterly reports and other documents with the SEC subsequent to that date. Interested parties may also read and copy any of our filings at the SEC’s Public Reference Room at 100 F Street N.E., Room 1580, Washington, DC 20549. Information on the operation of the Public Reference Room may be obtained by calling the SEC at 1-800-SEC-0330. The SEC also maintains an Internet website that contains reports and other information regarding issuers that file electronically with the SEC. The address of that site is www.sec.gov.
Our financial information, including annual reports on Form 10-K, quarterly reports on Form 10-Q, current reports on Form 8-K and if applicable, amendments to those reports filed or furnished pursuant to the Securities Exchange Act of 1934, as amended (the “Exchange Act”), is available, free of charge by making a request within the investors tab on our website, www.wirecoworldgroup.com.
19
Table of Contents
| Item 1A. | Risk Factors |
Our financial condition, results of operations and cash flows are subject to various risks, many of which are not exclusively within our control and may cause actual performance to differ materially from historical or projected future performance. The risks described below could materially and adversely affect our business, financial condition, results of operations or cash flows. These risks are not the only risks that we face and our business operations could also be affected by additional factors that are not presently known to us or that we currently consider to be immaterial to our operations. See “Forward-Looking Statements” on page 3 of this annual report for cautionary statements regarding forward-looking statements.
Risks Relating to our Business
Demand for our products depends on the health of the global economy.
Demand for our products depends on the level of activity in the industries that we serve. The oil and gas, mining, infrastructure and general industrial end markets are cyclical in nature. The general condition of the economy in our markets and a variety of other factors beyond our control affect demand for our products. Historically, downturns in general economic conditions have resulted in diminished product demand, excess manufacturing capacity and lower average selling prices. In addition, cyclicality in particular industries we serve may affect our results of operations. For example, our sales to the oil and gas end market are subject to variability due to fluctuations in oil and gas supply and demand, exploration discoveries and weather-related factors. Our sales to the mining end market are subject to similar fluctuations related to the price for the commodity that is mined, which is driven by global demographic, political and economic circumstances. Our sales to the infrastructure end market are also dependent on regional economic conditions and overall demand for commercial buildings, bridges and roads.
The ongoing European debt crisis continues to have a negative impact on the European economy. A prolonged downturn could have the following impacts, among others:
| • | disrupt the current U.S. recovery and weaken global trade; |
| • | hamper key emerging markets such as China and India and result in another global recession with reduced demand and lower prices for the products we produce; |
| • | disruption of the Euro currency system and/or changes in currency regimes; |
| • | disruption of the payment and settlement system; |
| • | severe inflation due to currency depreciation; |
| • | the failure of banks or financial systems or the reduced ability of banks to lend due to higher funding costs; and |
| • | devaluation of assets. |
Economic downturns in national or international economies in general or in the industries we serve in particular could have a material adverse effect on our sales, results of operations, cash flows and access to capital.
An increasing portion of our business depends on operations and sales outside North America in areas that are subject to increased political and economic risks.
We operate and sell our products in regions outside of North America, which are exposed to political and economic risks. Therefore, our international operations may be subject to additional risks, including:
| • | economic, social and political instability; |
| • | exchange controls and currency restrictions; |
| • | currency fluctuations and devaluations; |
20
Table of Contents
| • | high levels of inflation and high domestic interest rates; |
| • | tariffs and other trade regulations; |
| • | risks related to local governmental and other regulatory regimes; |
| • | difficulties in repatriating earnings; |
| • | changes in local economic conditions; |
| • | exposure to possible expropriation or other government actions; |
| • | hostility from local populations; |
| • | diminished ability to legally enforce our contractual rights in non-U.S. countries; |
| • | ineffective intellectual property protection; |
| • | possible terrorist attacks; |
| • | difficulties in receivables collection; and |
| • | dependence on foreign personnel. |
Our international operations expose us to varying political and business risks and challenges. For example, we are faced with potential difficulties in staffing and managing local operations and have to design solutions to manage credit risks of local customers and distributors. In addition, certain jurisdictions in which we operate may be politically unstable. We also operate in jurisdictions in which our status as a Cayman company may expose us to increased risk of terrorist attacks, or to greater impact from the national and global military, diplomatic and financial response to any future attacks or other threats.
Some of our operations are located in jurisdictions that have historically experienced high levels of inflation and high domestic interest rates. The operating results and cash flows of our subsidiaries located in such jurisdictions could be adversely affected due to lower demand or lower growth in demand for our products if they experience high levels of inflation. In addition, because the U.S. dollar is our functional currency, our results of operations and financial condition could be adversely affected if inflation in such jurisdictions increases without a corresponding devaluation of the local currency.
Some of our operations are located in regions with particular exposure to storms, floods, riots, fires, sabotage, terrorism, civil commotion or civil unrest, interference by civil or military authorities, acts of war (declared or undeclared) or armed hostilities or other national or international calamity, or failure of energy sources. Production efficiency prevents us from relocating such operations and, as a result any of the aforementioned occurrences, could materially adversely affect our business.
Our reported financial condition and results of operations are subject to exchange rate fluctuations, which will make it more difficult to predict our financial results.
Our financial condition and results of operations are reported in multiple currencies, which currently include the Mexican peso, the euro, the Polish złoty and the Chinese renminbi, and are then translated into U.S. dollars at the applicable exchange rate for inclusion in our consolidated financial statements. As a result, appreciation of the U.S. dollar against the Mexican peso, euro, Polish złoty and Chinese renminbi will have a negative impact on our reported revenues and operating profit while depreciation of the U.S. dollar against such currencies will have a positive effect on reported revenues and operating profit. We do not expect to use derivative financial instruments to mitigate this translation effect.
If we do not maintain the quality of our products, our customers may choose to purchase from other suppliers and our sales would be harmed.
Our products are used in applications by our customers where quality and performance are critical. If we are unable to maintain the high standards, including various quality certifications, expected by our customers, or our
21
Table of Contents
competitors are able to produce higher quality products, our sales may be harmed by the loss of existing customers and our ability to attract new customers. Should this occur, we may also need to increase our investments in manufacturing processes, which could increase our expenses, reduce our margins and adversely affect our cash flows. A failure to maintain certification in any one plant will not affect the certification process in our other plants.
We could face product liability claims relating to products we manufacture that could increase our costs.
Our products are often used in conjunction with heavy machinery or in construction. Accordingly, we have potential exposure to product liability claims in the event that the use of any of our products results in personal injury, property damage or a failure of our products cause a work stoppage, including situations resulting from misuse of our products. Any such claims may be significant. Therefore, product liability claims against us could have a negative reputational impact, particularly if the failure of a product is highly publicized.
Furthermore, manufacturing defects may not be discovered for some time after new products are introduced. In the event that any of our products prove to be defective, among other things, we may be responsible for damages related to any defective products and we may be required to recall or redesign such products. Any insurance we maintain may not continue to be available on terms acceptable to us or such coverage may not be adequate for liabilities actually incurred. As a result, products liability claims could have a material and adverse effect on our business, financial condition and results of operations.
We may pursue and execute acquisitions, which could adversely affect our business.
We have made, and may in the future make, acquisitions of or significant investments in businesses with complementary products, services and/or technologies. We cannot provide assurance that we will be able to consummate any such transactions or that any future acquisitions will be consummated at acceptable prices and terms. Acquisitions involve numerous risks, including, but not limited to:
| • | difficulties in integrating the operations, technologies, products and personnel of acquired companies; |
| • | lack of synergies or the inability to realize expected synergies and cost savings; |
| • | revenue and expense levels of acquired entities differing from those anticipated at the time of the acquisitions; |
| • | difficulties in managing geographically dispersed operations; |
| • | the potential loss of key employees, customers and strategic partners of acquired companies; |
| • | claims by terminated employees, shareholders of acquired companies or other third parties related to the transaction; |
| • | the issuance of dilutive securities, assumption or incurrence of additional debt obligations or expenses, or use of substantial portions of our cash to fund our acquisition; |
| • | diversion of management’s attention from normal daily operations of the business; and |
| • | the impairment of acquired intangible assets as a result of technological advancements or worse-than-expected performance of acquired companies. |
We may become responsible for unexpected liabilities that we failed or were unable to discover in the course of performing due diligence in connection with historical acquisitions and any future acquisitions. We cannot provide assurance that any indemnification rights we have obtained, or will obtain in the future, will be enforceable, collectible or sufficient in amount, scope or duration to fully offset the possible liabilities associated with the business or property acquired. Any of these liabilities, individually or in the aggregate, could have a material adverse effect on our business, financial condition and results of operations.
22
Table of Contents
Acquisitions are inherently risky, and we cannot provide any assurance that our previous or future acquisitions will be successful. The inability to effectively manage the risks associated with previous or future acquisitions could materially and adversely affect our business, financial condition or results of operations.
We cannot provide assurance that we will achieve the synergies identified in this report or that we will achieve synergies and cost savings in connection with future acquisitions. In addition, many of the businesses that we have acquired and will acquire have financial statements that have been prepared by the management of such companies, which may be presented or audited in a different manner than our financial statements or may have not been independently reviewed or audited. We cannot provide assurance that the financial statements of companies we have acquired or will acquire would not be materially different if such statements were prepared or audited on a basis consistent with our financial statements, or that we would not discover adjustments that need to be made to such financial statements following the acquisitions. Finally, we cannot provide assurance that we will continue to acquire businesses at valuations consistent with our prior acquisitions or that we will complete acquisitions at all.
We depend heavily on our senior management, and we may be unable to replace key executives if needed.
Our future success depends, in significant part, upon the continued services and leadership skills of our management personnel. Our senior management team has extensive manufacturing, finance and engineering experience, and we believe that the depth of our management team is instrumental to our continued success. The loss of the services of one or more of our senior management personnel for any reason, including resignation or retirement, could adversely affect our business, financial condition and results of operations. We cannot provide assurance that we will be able to retain and maintain existing senior management personnel or attract additional qualified personnel when needed.
We face volatility in the prices for, and availability of, raw materials and energy used in our business, which could adversely impact our competitive position and results of operations.
We rely heavily on certain raw materials (principally high carbon steel rod and synthetic fibers, such as polyethylene and polypropylene) and energy sources (principally electricity, natural gas and propane) in our manufacturing processes. As a result, our earnings are affected by changes in the costs and availability of these raw materials and energy. Unanticipated increases in the prices of such commodities would increase our costs more than expected, negatively impacting our business, results of operations and financial condition if we are unable to fully offset the effects of higher raw material or energy costs through price increases, productivity improvements or cost-reduction programs. In addition, the loss of any of our significant raw material suppliers could cause shortages. Some of our suppliers have experienced temporary shortages in the recent past. Any extended interruption in the supply of any of our significant raw materials, including any delays in delivery of these inputs, may make it difficult or impossible to satisfy customers’ delivery requirements, which could have a material adverse effect on our results of operations.
If we are unable to develop new products on a timely basis, it could adversely affect our business and prospects.
We believe that our future success depends, in part, on our ability to develop, on a timely basis, technologically advanced products. Although we believe we have certain technological and other advantages over our competitors, maintaining such advantages will require us to continue investing in research and development and sales and marketing. There can be no assurance that we will have sufficient resources to make such investments, that we will be able to make the technological advances necessary to maintain such competitive advantages or that we can recover major research and development expenses.
We experience risks associated with manufacturing, which could adversely affect our business and results of operations.
We manufacture our products and face risks associated with those operations. These risks include:
| • | equipment downtime as a result of unanticipated failures, accidents, natural disasters or other events; |
23
Table of Contents
| • | the availability of replacement parts; |
| • | the management of personnel and costs associated with increasing or decreasing capacity to meet product demand; and |
| • | the need for capital expenditures to repair, replace or upgrade our machinery. |
If we experience any manufacturing disruptions, our ability to produce products for delivery to our customers in a timely manner would be adversely affected. In addition, increased costs at our manufacturing facilities could reduce our gross margins. The capital expenditures to maintain and expand our capabilities also adversely affect our cash flows.
A significant interruption or casualty loss at any one of our facilities could increase our production costs and reduce our sales, earnings and cash flows.
Our facilities may experience interruptions or casualty losses and may be subject to events such as explosions, fires, inclement weather, acts of God, terrorism, accidents or transportation disruptions. A significant portion of our capacity is generated by each of our manufacturing facilities and a shutdown, interruption or casualty loss at any of these facilities could lead to production curtailment and could substantially impair our business. Interruptions in production capabilities would increase production costs and reduce our sales and earnings. In addition to lost revenue, long-term business interruption could result in the loss of some customers. To the extent these events are not covered by insurance, we are unable to recover insurance proceeds to reimburse for losses or business interruption, or if we are insured, but there are delays in the receipt of such reimbursements, our cash flows may be adversely impacted by events of this type.
Organized labor action could have a material adverse effect on our business.
Many of our operations are highly labor intensive. We have collective bargaining agreements with our employees at several plant locations and distribution centers. Approximately 65% of our non-China JV work force is unionized. If our unionized employees were to engage in a strike, work stoppage or other slowdown at any of our plants, this could adversely affect our ability to produce our products. In addition, any significant increase in labor costs or the making of other significant concessions as a result of agreements with our workforce could have a material adverse effect on our business, financial condition and results of operations.
We are subject to significant environmental compliance obligations and environmental liabilities that could be significant, which could increase our costs or cause us to change our operations.
As our activities involve the handling, storage, use and disposal of hazardous substances, we may be subject to material liabilities arising from conditions caused by the release of these substances. Such liability can include the costs of investigation and clean-up, fines and penalties sought by environmental authorities and damages arising out of personal injury and contaminated property and other toxic tort claims, as well as lost or impaired natural resources. Certain environmental laws impose strict liability, and under certain circumstances, joint and several liability on current and prior owners and operators of sites without regard to comparative fault. In addition, environmental requirements change frequently, and have tended to become more stringent over time. We cannot predict what environmental laws or regulations will be enacted or amended in the future, how existing or future laws or regulations will be interpreted or enforced, or the amount of future expenditures that may be required to comply with such laws or regulations.
Failure to maintain or comply with environmental permits, governmental approvals or other environmental requirements necessary to operate our business, exposure to any one of the possible environmental obligations and liabilities listed above, and the uncertainty that our indemnification rights will result in the recovery of any environmental losses that may arise, may subject us to significant obligations and liabilities that could have a material adverse effect on our business, financial condition and results of operations.
24
Table of Contents
Occupational health and safety laws and regulations could become more stringent and necessitate additional expenditures, which could harm our results of operations.
Failure to comply with applicable occupational health and safety laws and regulations could lead to manufacturing shutdowns, product shortages, delays in product manufacturing, operating restrictions, withdrawal of required licenses and prohibitions against exporting or importing of products. In addition, civil and criminal penalties could result from regulatory violations. Such laws and regulations may become more stringent and result in necessary modifications to our current practices and facilities that could force us to incur additional costs that could materially affect us.
We are dependent on maritime transport and other transportation methods, and an increase in shipping costs or inability to secure space on vessels could adversely affect our sales and profitability.
Shipping and freight costs are a significant component of our cost structure. We are dependent on finding efficient means of transporting our goods from our production facilities to distribution centers and from those distribution centers to our customers. In addition, we ship intermediate goods between our global manufacturing facilities, further increasing our dependence on efficient transportation. Shipping and freight costs are particularly sensitive to oil prices. If shipping and freight costs increase, our sales and profitability may be adversely affected. Furthermore, there may be delays between the time of increases in freight costs and price increases in our products. These increased costs may harm our profitability and results of operations.
Space on international maritime shipping vessels is at times limited and difficult to secure. We have no control over established maritime shipping routes and the present routes ships use may change. If we are unable to use maritime transport to ship our goods to our customers or if shipping costs increase because of changes in routes, our sales to offshore customers may be limited, and our business, financial condition and results of operations could be materially and adversely affected. In addition, we cannot provide assurance that the products we transport offshore will reach market in marketable condition. These challenges to the maritime transport of our products could have a material adverse effect on our business.
Taxing authorities could challenge our historical and future tax positions, or tax laws to which we are subject could change in a manner adverse to us.
We maintain operations in multiple jurisdictions, each of which maintains a separate system of income taxation. The amount of income taxes we pay is subject to our interpretation of applicable tax laws in the jurisdictions in which we file. Applicable tax authorities may challenge the tax positions we have taken. Any successful challenge to one or more of our prior tax positions could result in a material tax liability to us or to one or more of our subsidiaries, for one or more prior years. Tax laws in the various jurisdictions in which we operate are also subject to change. Any such future changes could be unfavorable to us, and could result in an increased tax burden. Should we be assessed with additional taxes, this may result in a material adverse effect on our results of operations or financial condition.
We purchase a significant portion of our required materials from sources in other countries, which are subject to costs related to tariffs and security measures.
The imposition of tariffs pursuant to trade laws and regulations in the jurisdictions in which our operations and suppliers are located, including the United States, Mexico, the European Union and China, can have an adverse impact on our business by placing tariffs and tariff-rate quotas on the import of certain raw materials and raising the prices of raw materials we require for our production. In addition, under certain tax laws, customs and taxing authorities may, from time to time, review the tariff classifications we use to import our raw materials and export our products. Future audits may subject us to additional taxes. Further, new strict security measures regarding maritime transport, which may be implemented in the future, may increase the cost of our supplies being shipped from foreign sources, which could have a negative effect on our margins and our results of operations.
25
Table of Contents
The risks associated with the effects of constrained credit markets on our customers and suppliers could reduce our sales and increase our expenses.
Financial turmoil and weakness in the global economy resulted in severe volatility and disruptions in the capital and credit markets. A resumption of poor credit market conditions may adversely impact the availability of operating financing, upon which many of our customers depend, resulting in project cancellations or delays. Our customers may also face limitations when trying to access the credit markets to fund ongoing operations or capital projects. Credit constraints experienced by our customers may result in lost revenues, delay in the collection of receivables, reduced profitability for us and, in some cases, higher than expected losses due to failure by our customers to make payments to us. Our suppliers’ ability to deliver products may also be affected by financing constraints caused by current credit market conditions, which could negatively impact our revenue and cost of products sold, at least until alternate sources of supply are arranged.
We face competition and competitive pressures, which could adversely affect our results of operations and financial condition.
Our industry is highly competitive. We face competition on multiple fronts, including from large global firms and local, specialized rope manufacturers. Other global firms may have more capital at their disposal, and may be able to produce their products at a lower cost due to their size and economies of scale. Our competitors who are based in other jurisdictions may have lower production costs because of lower labor costs, fewer regulatory standards, local access to raw materials, lower shipping costs or other factors. Local specialized firms may have an advantage due to their knowledge of the markets in which they operate. In addition, our competitors may be able to offer substitute products that customers could use as a replacement to our products.
We are subject to risks associated with our China Joint Venture that could cause inventory loss, distraction of management and increased expenses.
Our China JV has not performed as we had intended. The joint venture has been operating at a loss since its establishment in 2006 and has experienced difficulty in paying principal and interest on their debt. Due to these continued losses and reduced liquidity, there is substantial doubt as to the China JV’s ability to continue as a going concern, which could cause inventory loss, management distraction and increased expenses related to future advances. Our investment in and advances to the China JV was $0 as of December 31, 2011. Our exposure to loss as a result of our involvement with the China JV is limited to prepaid inventory of $1.9 million. The Company does not guarantee the debts of the China JV in whole or in part.
Any threat to, or impairment of, our intellectual property rights could cause us to incur costs to defend these rights.
As a company that manufactures and markets branded products, we rely on patent, trademark, trade secret and other intellectual property law and protective measures to protect our proprietary rights. Although we employ a variety of intellectual property in the development and manufacturing of our respective products, we believe that none of that intellectual property is individually critical to our current operations. Taken as a whole, however, we believe our intellectual property rights are significant. Our intellectual property protection measures may not be sufficient to prevent misappropriation of our technology or trademarks. From time to time, we may have to defend our intellectual property rights against third parties who may infringe on these rights and defend against claims from third parties, who may assert infringement claims against us or our customers in connection with the use of our products, and these proceedings may require us to incur significant legal and other costs and may divert the attention of our management. Our failure to protect our intellectual property or a successful third-party claim of infringement could have a material adverse effect on our business, financial condition and results of operations.
26
Table of Contents
We are controlled by a principal equity holder who will be able to make important decisions about our business and capital structure.
A majority of our shares are held by Paine & Partners Fund III, an affiliate of Paine & Partners. As a result, Paine & Partners controls us and has the power to elect the members of our board of directors, appoint new management and approve any action requiring the approval of the holders of our stock, including approving acquisitions or sales of all or substantially all of our assets. Paine & Partners has the ability to control decisions affecting our capital structure, including the issuance of additional capital stock, the implementation of stock repurchase programs and the declaration of dividends. The interests of our principal equity holder may not be aligned with the holders of our Senior Notes. If we encounter financial difficulties, or we are unable to pay our debts as they mature, the holders of the Senior Notes might prefer that we raise additional equity to reduce our leverage and pay our debts, while our principal equity holder might instead choose to take other actions, such as selling our assets, to avoid increasing their investment in us or diluting their ownership. Our principal equity holder may have an interest in pursuing acquisitions, divestitures, financings or other transactions that, in their judgment, could enhance their equity investment, even though such transactions might involve risks to the holders of our Senior Notes. Furthermore, Paine & Partners and its affiliates have no continuing obligation to provide us with debt or equity financing or to provide us with joint purchasing or similar opportunities with its other portfolio companies. Additionally, Paine & Partners or its affiliates may, from time to time, acquire and hold interests in businesses that compete directly or indirectly with us. Paine & Partners or its affiliates may also pursue acquisition opportunities that may be complementary to our business and, as a result, those acquisition opportunities may not be available to us.
Risks Relating to our Public Debt
Our substantial level of indebtedness could have a material adverse effect on our financial condition and prevent us from fulfilling our debt service obligations.
We have substantial indebtedness. As of December 31, 2011, we had $597.6 million of total indebtedness at face value. In addition, subject to restrictions in the indenture governing the Senior Notes (“Indenture”) and restrictions in our U.S. revolving credit facility and term credit agreement, we may incur additional indebtedness. Our high level of indebtedness could have important consequences, including the following:
| • | it may be more difficult for us to satisfy our obligations with respect to the Senior Notes; |
| • | our ability to obtain additional financing for working capital, capital expenditures, acquisitions or general corporate purposes may be impaired; |
| • | we must use a substantial portion of our cash flow from operations to pay interest and principal on the Senior Notes and other indebtedness, which will reduce the funds available to us for other purposes such as capital expenditures; |
| • | we may be limited in our ability to borrow additional funds; |
| • | we may have a higher level of indebtedness than some of our competitors, which may put us at a competitive disadvantage and reduce our flexibility in planning for, or responding to, changing conditions in our industry, including increased competition; |
| • | we may be more vulnerable to economic downturns and adverse developments in our business; and |
| • | there would be a material adverse effect on our business and financial condition if we were unable to service our indebtedness or obtain additional financing, as needed. |
We expect to obtain the money to pay our expenses and to pay the principal and interest on the Senior Notes, our revolving credit facility, our term credit agreement and our other debt from our cash flow from operations. Our ability to satisfy our expenses thus depends on our future performance, which will be affected by financial, business, economic and other factors. We will not be able to control many of these factors, such as economic conditions in the markets where we operate and pressure from competitors. We cannot be certain that our cash flow will be sufficient to allow us to pay principal and interest on our indebtedness and meet our other
27
Table of Contents
obligations. If we lack sufficient liquidity, we may be required to refinance all or part of our existing debt, sell assets or borrow more money. We cannot guarantee that we will be able to do so on terms acceptable to us, or at all. In addition, the terms of existing or future debt agreements may restrict us from pursuing any of these alternatives.
We and our subsidiaries may incur substantially more debt, including secured debt, which could further exacerbate the risks associated with our substantial indebtedness.
We and our subsidiaries may incur substantial additional debt, including secured debt, in the future. Although certain of our debt agreements contain restrictions on the incurrence of additional indebtedness, these restrictions are subject to a number of qualifications and exceptions, and the indebtedness incurred in compliance with these restrictions could be substantial. Also, these restrictions do not prevent us from incurring obligations that do not constitute indebtedness as defined in the relevant agreement. If new debt is added to our current debt levels, the related risks that we now face could intensify.
Covenants in our debt instruments may limit our ability to operate our business and any failure by us to comply with such covenants may accelerate our obligation to repay the underlying debt.
The Indenture and certain other debt instruments contain covenant restrictions that limit our ability to operate our business, including covenant restrictions that may prevent us from:
| • | incurring additional debt or issuing guarantees; |
| • | creating liens; |
| • | entering into certain transactions with our affiliates; and |
| • | consolidating, merging or transferring all or substantially all of our assets and the assets of our subsidiaries on a consolidated basis. |
Our revolving credit facility and our term credit agreement require us to maintain specific leverage ratios, and the Indenture requires us to meet a specific fixed charge coverage ratio prior to incurring certain additional debt. Our ability to comply with these covenants is dependent on our future performance, which will be subject to many factors, some of which are beyond our control, including prevailing economic conditions. Our failure to comply with these obligations could prevent us from borrowing additional money and could result in our default. If a default occurs under any of our senior indebtedness, the relevant lenders could elect to declare such indebtedness, together with accrued interest and other fees, to be immediately due and payable and to proceed against our assets that secure such senior indebtedness. Moreover, if the lenders under a facility or other agreement in default were to accelerate the indebtedness outstanding under that facility, it could result in a default under other indebtedness. If all or any part of our indebtedness were to be accelerated, we may not have or be able to obtain sufficient funds to repay it. In addition, we may incur other indebtedness in the future that may contain financial or other covenants that are more restrictive than those contained in the Indenture.
As a result of these and certain other covenants, our ability to respond to changes in business and economic conditions and to obtain additional financing, if needed, may be significantly restricted, and we may be prevented from engaging in transactions that might otherwise be beneficial to us. In addition, our failure to comply with these covenants could result in a default under the Senior Notes and our other debt, which could permit the holders to accelerate such debt. If any of our debt is accelerated, we may not have sufficient funds available to repay such debt.
If we fail to implement and maintain proper and effective internal controls, our ability to produce accurate and timely financial statements could be impaired and we may be unable to comply with regulatory requirements.
We may in the future identify deficiencies that need to be addressed in our internal controls over financial reporting. Should we, or our independent auditors, determine in future periods that we have a material weakness in our internal controls over financial reporting, we may be adversely affected. In addition, our filing of the
28
Table of Contents
registration statement for the exchange of the Senior Notes in accordance with the terms of the registration rights agreement, require us to comply with certain provisions of the Sarbanes-Oxley Act relating to internal controls beginning with our annual report for the year ended December 31, 2012. These regulations impose complex and continually changing regulatory requirements on our operations and reporting, impose comprehensive reporting and disclosure requirements, set stricter independence and financial expertise standards for audit committee members and impose civil and criminal penalties for the Company, their chief executive officer, chief financial officer and directors for securities law violations. We may incur significant additional legal, compliance and accounting costs as a result of becoming subject to the Sarbanes-Oxley Act, and our management may be required to devote significant time or incur significant additional expense in order to comply with such requirements and to remediate any material weaknesses or deficiencies that may be identified. In addition, becoming subject to the Sarbanes-Oxley Act could increase the difficulty and expense of obtaining director and officer liability insurance, and make it harder for us to attract and retain qualified directors and executive officers. Any inability to comply with such requirements may negatively impact our results of operations, our financial condition or our reputation.
| Item 1B. | Unresolved Staff Comments |
None.
| Item 2. | Properties |
Our principal properties include our manufacturing facilities, our distribution centers and our administrative offices. We maintain and operate seven domestic manufacturing facilities in Missouri, Texas and Pennsylvania. In addition, we maintain and operate six international manufacturing facilities in Mexico, Germany, Portugal and Poland. Our China JV (65% owned by us) operates a facility in China with approximately 1.0 million square feet. We maintain eleven stand-alone distribution facilities in the U.S., Portugal, Netherlands, Slovakia and the Czech Republic. In addition to these distribution facilities, there is warehouse space available at substantially all of our manufacturing facilities. Our administrative offices are located in leased buildings in Kansas City, Missouri, and the Cayman Islands.
Our principal properties cover approximately 5.3 million square feet in the aggregate; approximately 4.8 million square feet is owned and approximately 0.5 million square feet is leased. Utilization of manufacturing capacity varies by manufacturing plant based upon the type of products assigned and the level of demand for those products. We believe that our manufacturing plants are well maintained, adequately utilized and are sufficient to support the current operations of the business. These facilities, together with planned capital expenditures, are expected to meet our needs in the foreseeable future.
Most of our properties and other assets are subject to liens securing our various borrowings. Refer to Note 8—“Borrowings” to our consolidated financial statements included in Item 8, Financial Statements and Supplementary Data, of this annual report for further information on assets secured.
| Item 3. | Legal Proceedings |
We are not a party to any material legal proceedings. From time to time, we are involved in routine litigation arising in the ordinary course of business, which is incidental to our operations. For further information required by this item, refer to Note 16—“Commitments and Contingencies” to our consolidated financial statements included in Item 8, Financial Statements and Supplementary Data, of this annual report.
| Item 4. | Mine Safety Disclosures |
Not applicable.
29
Table of Contents
| Item 5. | Market for Registrant’s Common Equity, Related Stockholder Matters and Issuer Purchases of Equity Securities |
Our common equity consists of common stock. Our common stock is privately held and there is no established public trading market. As of March 15, 2012, there were fifteen stockholders of record of our common stock. The agreements governing our indebtedness impose restrictions on our ability to pay dividends to our stockholders. We did not pay any dividends during 2011 and 2010.
For information about securities authorized for issuance under our equity compensation plan, refer to Item 12, Security Ownership of Certain Beneficial Owners and Management and Related Stockholder Matters, of this annual report.
| Item 6. | Selected Financial Data |
The selected financial data below should be read in conjunction with Item 7, Management’s Discussion and Analysis of Financial Condition and Results of Operations, and the WireCo WorldGroup (Cayman) Inc. consolidated financial statements and the related notes included in Item 8, Financial Statements and Supplementary Data. Wire Rope Corporation of America, Inc. (“Predecessor”) was purchased by WireCo WorldGroup Limited (WireCo Cyprus) (“Successor”) on February 7, 2007. The predecessor financials do not reflect the purchase accounting effects of the 2007 purchase. On December 29, 2008, the shareholders of WireCo Cyprus contributed all previously issued and outstanding shares in exchange for shares of common stock of WireCo WorldGroup (Cayman) Inc.
During the periods presented we made a number of acquisitions. Our consolidated financial statements include the results of operations of these acquired businesses from the date of acquisition. For a list of our acquisitions, see Part I, Item I “Our History”. Period to period results of operations vary depending on the dates of the acquisitions. Accordingly, this selected financial data is not necessarily comparable or indicative of our financial results.
Non-GAAP Financial Measures
Adjusted EBITDA and Acquisition Adjusted EBITDA as presented in this annual report are supplemental measures of performance and liquidity that are not required by, or presented in accordance with, accounting principles generally accepted in the United States (“GAAP”). These non-GAAP performance measures do not have standardized meanings and, therefore, may not be comparable to similar measures presented by other companies. We believe that, in addition to conventional measures prepared in accordance with GAAP, certain investors use this information to evaluate our performance and liquidity using the ratio of Acquisition Adjusted EBITDA to total debt. Accordingly, these non-GAAP financial measures are intended to provide additional information and should not be considered in isolation or as a substitute for measures of performance and liquidity prepared in accordance with GAAP.
30
Table of Contents
| Successor | Predecessor | |||||||||||||||||||||||||
| Years ended December 31, | 327 days ended December 31, 2007 (4) |
38 days ended February 7, 2007 (5) |
||||||||||||||||||||||||
| 2011 (1) | 2010 (2) | 2009 (3) | 2008 | |||||||||||||||||||||||
| (dollars in thousands) | ||||||||||||||||||||||||||
| Statement of Operations Data: |
||||||||||||||||||||||||||
| Net sales |
$ | 604,927 | $ | 447,678 | $ | 383,253 | $ | 536,671 | $ | 341,028 | $ | 29,217 | ||||||||||||||
| Gross profit |
158,573 | 118,531 | 88,893 | 133,593 | 69,607 | 4,656 | ||||||||||||||||||||
| Operating income |
57,009 | 41,354 | 26,053 | 61,201 | 14,527 | (1,307 | ) | |||||||||||||||||||
| Net income (loss) |
(50,707 | ) | (6,565 | ) | 4,086 | 11,682 | (17,401 | ) | (11,623 | ) | ||||||||||||||||
| As of December 31, | ||||||||||||||||||||||||||
| 2011 (1) | 2010 (2) | 2009 (3) | 2008 | 2007 (4) | ||||||||||||||||||||||
| Balance Sheet Data: |
||||||||||||||||||||||||||
| Working capital |
$ | 202,707 | $ | 226,468 | $ | 113,287 | $ | 116,655 | $ | 125,863 | ||||||||||||||||
| Total assets |
885,703 | 822,406 | 658,274 | 690,790 | 684,074 | |||||||||||||||||||||
| Long-term debt |
565,044 | 500,248 | 328,588 | 333,927 | 340,442 | |||||||||||||||||||||
| Total stockholders’ equity |
129,536 | 195,069 | 195,307 | 184,933 | 198,606 | |||||||||||||||||||||
| Years ended December 31, | 327 days ended December 31, 2007 (4) |
38 days ended February 7, 2007 (5) |
||||||||||||||||||||||||
| 2011 (1) | 2010 (2) | 2009 (3) | 2008 | |||||||||||||||||||||||
| Statement of Cash Flows Data: |
||||||||||||||||||||||||||
| Cash flows provided by (used in): |
||||||||||||||||||||||||||
| Operating activities |
$ | 10,653 | $ | (4,351 | ) | $ | 69,669 | $ | 24,519 | $ | 6,409 | $ | (3,658 | ) | ||||||||||||
| Investing activities |
(93,335 | ) | (102,326 | ) | (33,300 | ) | (38,699 | ) | (284,072 | ) | (1,259 | ) | ||||||||||||||
| Financing activities |
56,956 | 140,984 | (25,422 | ) | 14,877 | 281,817 | 3,645 | |||||||||||||||||||
| Other Data: |
||||||||||||||||||||||||||
| Acquisition Adjusted EBITDA (6) |
$ | 129,607 | $ | 111,707 | $ | 92,565 | $ | 121,792 | $ | 80,562 | $ | 3,382 | ||||||||||||||
| (1) | The 2011 results reflect partial year activity for the acquisition of Drumet on July 18, 2011. |
| (2) | The 2010 results reflect partial year activity for the acquisition of Oliveira on November 16, 2010. |
| (3) | Effective January 1, 2009, the Company adopted new Financial Accounting Standards Board (“FASB”) guidance for business combinations requiring acquisition-related costs to be expensed for future acquisitions. Previously, acquisition-related costs were added to the purchase price. |
| (4) | The 2007 results reflect partial year activity for the acquisitions of Wireline Works, CASAR and U.S. Reel, effective February 26, 2007, August 24, 2007 and November 16, 2007, respectively. |
| (5) | The Company adopted FASB guidance on accounting for uncertainty in income taxes as of January 1, 2007. |
| (6) | We define Adjusted EBITDA as net income (loss) plus, without duplication: interest expense, income tax expense (benefit), depreciation and amortization, as further adjusted by (i) other non-cash expenses, such as loss on our investment in the China JV, foreign currency exchange losses (gains) and share-based compensation expense, (ii) non-operating expenses, (iii) all fees, costs, expenses incurred in connection with any merger, consolidation, acquisition or offering of debt or equity securities, (iv) payments of the management fees pursuant to the Management Fee Letter with Paine & Partners, LLC (“Paine & Partners”), (v) reorganization or restructuring charges, reserves or expenses and (vi) all amounts deducted in arriving at net income (loss) in respect of severance packages payable in connection with the termination of any officer, director or employee. We define Acquisition Adjusted EBITDA as Adjusted EBITDA plus pro forma adjustments for acquisitions (EBITDA prior to the date of acquisition). We have disclosed Adjusted EBITDA and Acquisition Adjusted EBITDA, non-GAAP performance and liquidity measures, as a means to enhance communications with security holders. Management uses Adjusted EBITDA as a measure for internal evaluation of performance and incentive plan purposes. Acquisition Adjusted EBITDA is used to compare our financial measure to those of our peers and for debt covenant calculations. The Senior Notes |
31
Table of Contents
| include a covenant that requires the Company to maintain a senior secured debt to Acquisition Adjusted EBITDA ratio that does not exceed 2.75 to 1.0 measured at the end of each quarter using the preceding four quarters consolidated Acquisition Adjusted EBITDA. |
Adjusted EBITDA and Acquisition Adjusted EBITDA differ from net income (loss) and cash flows from operating activities, the most comparable GAAP financial measures, in that they exclude and add back certain items. These items are excluded or included by management to better evaluate normalized operational earnings and to evaluate liquidity using the ratio of Acquisition Adjusted EBITDA to total debt. As a result, Adjusted EBITDA and Acquisition Adjusted EBITDA may not reflect important aspects of the results of our operations and cash flows. Our presentation and calculation of Adjusted EBITDA and Acquisition Adjusted EBITDA may not be comparable to that of other companies. The concepts of Adjusted EBITDA and Acquisition Adjusted EBITDA have important limitations as analytical tools and should not be considered in isolation or as a substitute for analysis of our results as reported under GAAP. For example, Adjusted EBITDA and Acquisition Adjusted EBITDA exclude certain tax payments that may represent a reduction in cash available to us; do not reflect any cash requirements for the assets being depreciated and amortized that may have to be replaced in the future; do not reflect capital cash expenditures, future requirements for capital expenditures or contractual commitments; do not reflect changes in, or cash requirements for, our working capital needs; and do not reflect the significant interest expense, or the cash requirements necessary to service interest or principal payments, on our indebtedness.
The following is a reconciliation of net income (loss) to Adjusted EBITDA and Acquisition Adjusted EBITDA:
| Successor | Predecessor | |||||||||||||||||||||||||
| Years ended December 31, | 327 days ended December 31, 2007 |
38 days ended February 7, 2007 |
||||||||||||||||||||||||
| 2011 | 2010 | 2009 | 2008 | |||||||||||||||||||||||
| (dollars in thousands) | ||||||||||||||||||||||||||
| Net income (loss) |
$ | (50,707 | ) | $ | (6,565 | ) | $ | 4,086 | $ | 11,682 | $ | (17,401 | ) | $ | (11,623 | ) | ||||||||||
| Plus: |
||||||||||||||||||||||||||
| Income tax expense (benefit) |
5,016 | (13,170 | ) | (4,435 | ) | 1,899 | 203 | (7,048 | ) | |||||||||||||||||
| Depreciation and amortization |
39,224 | 34,247 | 31,543 | 33,404 | 31,543 | 1,636 | ||||||||||||||||||||
| Interest expense, net |
51,063 | 33,720 | 24,718 | 33,358 | 30,677 | 2,748 | ||||||||||||||||||||
| Loss on extinguishment of long-term debt |
5,654 | 6,520 | — | — | — | — | ||||||||||||||||||||
| Other expense, net |
523 | 1,073 | 1,249 | 1,418 | 5,432 | 14,599 | ||||||||||||||||||||
| Loss on investment in China joint venture |
33,015 | 16,726 | 3,703 | 1,539 | 544 | 17 | ||||||||||||||||||||
| Foreign currency exchange losses (gains) |
12,445 | 3,050 | (3,268 | ) | 11,305 | (4,522 | ) | — | ||||||||||||||||||
| Share-based compensation |
3,841 | 3,161 | 3,034 | 2,904 | 2,863 | 2,891 | ||||||||||||||||||||
| Management fee and board payments (a) |
2,931 | 2,830 | 4,357 | 3,143 | 1,803 | — | ||||||||||||||||||||
| Bank fees (b) |
1,289 | 1,171 | 472 | 530 | 565 | — | ||||||||||||||||||||
| Acquisition costs |
6,114 | 5,287 | 996 | (346 | ) | 3,290 | — | |||||||||||||||||||
| Purchase accounting (inventory step-up) (c) |
1,875 | 1,364 | — | — | 9,481 | — | ||||||||||||||||||||
| Restructuring costs (d) |
9,389 | 2,669 | 3,720 | 1,255 | 2,801 | — | ||||||||||||||||||||
| Other adjustments (e) |
1,547 | 261 | 1,810 | 1,118 | 1,661 | 162 | ||||||||||||||||||||
| Production curtailment (f) |
— | — | 3,532 | — | — | — | ||||||||||||||||||||
| Pro forma savings from restructuring (g) |
— | 1,281 | 2,628 | — | — | — | ||||||||||||||||||||
|
|
|
|
|
|
|
|
|
|
|
|
|
|||||||||||||||
| Adjusted EBITDA |
123,219 | 93,625 | 78,145 | 103,209 | 68,940 | 3,382 | ||||||||||||||||||||
| Phillystran pro forma EBITDA (h) |
— | — | 2,955 | 3,389 | 2,371 | — | ||||||||||||||||||||
| Oliveira pro forma EBITDA (i) |
— | 11,397 | 11,465 | 15,194 | 9,251 | — | ||||||||||||||||||||
| Drumet pro forma EBITDA (j) |
6,388 | 6,685 | NM | NM | NM | — | ||||||||||||||||||||
|
|
|
|
|
|
|
|
|
|
|
|
|
|||||||||||||||
| Acquisition Adjusted EBITDA |
$ | 129,607 | $ | 111,707 | $ | 92,565 | $ | 121,792 | $ | 80,562 | $ | 3,382 | ||||||||||||||
|
|
|
|
|
|
|
|
|
|
|
|
|
|||||||||||||||
32
Table of Contents
The following is a reconciliation of cash flows from operating activities to Adjusted EBITDA and Acquisition Adjusted EBITDA:
| Successor | Predecessor | |||||||||||||||||||||||||
| Years ended December 31, | 327 days ended December 31, 2007 |
38 days ended February 7, 2007 |
||||||||||||||||||||||||
| 2011 | 2010 | 2009 | 2008 | |||||||||||||||||||||||
| (dollars in thousands) | ||||||||||||||||||||||||||
| Net cash provided by (used in) operating activities |
$ | 10,653 | $ | (4,351 | ) | $ | 69,669 | $ | 24,519 | $ | 6,409 | $ | (3,658 | ) | ||||||||||||
| Plus: Adjustments to reconcile net income (loss) to Adjusted EBITDA: |
||||||||||||||||||||||||||
| Income tax expense (benefit) |
5,016 | (13,170 | ) | (4,435 | ) | 1,899 | 203 | (7,048 | ) | |||||||||||||||||
| Interest expense, net |
51,063 | 33,720 | 24,718 | 33,358 | 30,677 | 2,748 | ||||||||||||||||||||
| Other expense, net |
523 | 1,073 | 1,249 | 1,418 | 5,432 | 14,599 | ||||||||||||||||||||
| Foreign currency exchange losses (gains) |
12,445 | 3,050 | (3,268 | ) | 11,305 | (4,522 | ) | — | ||||||||||||||||||
| Management fee and board payments (a) |
2,931 | 2,830 | 4,357 | 3,143 | 1,803 | — | ||||||||||||||||||||
| Bank fees (b) |
1,289 | 1,171 | 472 | 530 | 565 | — | ||||||||||||||||||||
| Acquisition costs |
6,114 | 5,287 | 996 | (346 | ) | 3,290 | — | |||||||||||||||||||
| Purchase accounting (inventory step-up) (c) |
1,875 | 1,364 | — | — | 9,481 | — | ||||||||||||||||||||
| Restructuring costs (d) |
9,389 | 2,669 | 3,720 | 1,255 | 2,801 | — | ||||||||||||||||||||
| Other adjustments (e) |
1,547 | 261 | 1,810 | 1,118 | 1,661 | 162 | ||||||||||||||||||||
| Less: Cash flow adjustments to net income (loss) not included in Adjusted EBITDA |
||||||||||||||||||||||||||
| Amortization of debt issuance costs and discounts/premium |
(6,271 | ) | (3,430 | ) | (2,145 | ) | (2,077 | ) | (1,857 | ) | (6,126 | ) | ||||||||||||||
| Loss on equipment disposals |
(185 | ) | — | — | — | — | — | |||||||||||||||||||
| Unrealized foreign currency exchange gain (loss) on intercompany loans |
(11,866 | ) | (5,598 | ) | 2,530 | (3,561 | ) | 2,648 | — | |||||||||||||||||
| Realized foreign currency exchange gains |
— | 3,229 | — | — | — | — | ||||||||||||||||||||
| Changes in deferred income taxes |
5,223 | 21,453 | 13,270 | 9,711 | 10,150 | 7,956 | ||||||||||||||||||||
| Changes in assets and liabilities, net of purchase accounting impact (k) |
33,473 | 42,786 | (40,958 | ) | 20,937 | 199 | (5,251 | ) | ||||||||||||||||||
| Production curtailment (f) |
— | — | 3,532 | — | — | — | ||||||||||||||||||||
| Pro forma savings from restructuring (g) |
— | 1,281 | 2,628 | — | — | — | ||||||||||||||||||||
|
|
|
|
|
|
|
|
|
|
|
|
|
|||||||||||||||
| Adjusted EBITDA |
$ | 123,219 | $ | 93,625 | $ | 78,145 | $ | 103,209 | $ | 68,940 | $ | 3,382 | ||||||||||||||
| Phillystran pro forma EBITDA (h) |
— | — | 2,955 | 3,389 | 2,371 | — | ||||||||||||||||||||
| Oliveira pro forma EBITDA (i) |
— | 11,397 | 11,465 | 15,194 | 9,251 | — | ||||||||||||||||||||
| Drumet pro forma EBITDA (j) |
6,388 | 6,685 | NM | NM | NM | — | ||||||||||||||||||||
|
|
|
|
|
|
|
|
|
|
|
|
|
|||||||||||||||
| Acquisition Adjusted EBITDA |
$ | 129,607 | $ | 111,707 | $ | 92,565 | $ | 121,792 | $ | 80,562 | $ | 3,382 | ||||||||||||||
|
|
|
|
|
|
|
|
|
|
|
|
|
|||||||||||||||
NM Not meaningful
| (a) | Management fees are paid to Paine & Partners for administrative and other support services, including travel and other out-of-pocket costs incurred on our behalf. Additionally, payments to certain members of the board of directors are included. |
33
Table of Contents
| (b) | Bank fees consist of unused line of credit fees, letter of credit fees and non-capitalizable costs associated with the modification of our indebtedness. |
| (c) | Inventory step-up costs are directly related to our acquisitions. In accordance with U.S. GAAP, inventory is recorded at fair value on the date of acquisition and the difference between fair value and cost is recorded to Cost of Sales as the inventory is sold. |
| (d) | Restructuring costs consist of severance costs related to headcount reductions and reorganizations, including those pursuant to a significant plan as disclosed in Note 13—“Restructuring” to our consolidated financial statements in Item 8, Financial Statements and Supplementary Data of this annual report, expenses associated with distribution center closures, legal fees for various litigation, consultant costs associated with entity restructuring activities and fees incurred in preparation of our registration statement with the SEC. |
| (e) | Other adjustments for the year ended December 31, 2011 consist primarily of legal consulting expenses related to prospective U.S. import tariff changes on goods shipped from Mexico to the U.S. Non-capitalizable ERP information technology system installation costs of $1.8 million and $1.1 million for the years ended December 31, 2009 and 2008, respectively, are included within other adjustments. We implemented an ERP system, which went into effect on January 1, 2009, in most U.S. facilities. |
| (f) | Production curtailment represents estimated unabsorbed fixed manufacturing expenses due to the significantly reduced production volumes in 2009 as a result of decreased customer demand. This amount represents the Company’s fixed manufacturing expenses in its U.S. facilities less the amount of those expenses, which were absorbed into inventory. |
| (g) | Pro forma savings from restructuring for 2009 consists of full year impacts associated with employee headcount reductions, distribution center closures and lease buy-out savings. For 2010, this adjustment reflects a full year of lease payments for machinery and equipment that we purchased from the lessor on December 31, 2010. These amounts represent the actual expense incurred for these items in the respective annual period prior to the Company’s decision to terminate, close or buy-out. |
| (h) | The Phillystran acquisition closed on December 31, 2009. Pro forma adjustments are included for the years ended December 31, 2009, 2008 and 2007 as if the acquisition had been consummated on the first day of the period presented for comparative purposes. The amounts represent the net income of Phillystran before deductions for interest, taxes, depreciation and amortization. |
| (i) | The Oliveira acquisition closed on November 16, 2010. Pro forma adjustments are included for the 319 days ended November 15, 2010 and years ended December 31, 2009, 2008 and 2007 as if the acquisition had been consummated on the first day of the period presented for comparative purposes. The amounts represent the net income of Oliveira before deductions for interest, taxes, depreciation and amortization and are converted from euros to U.S. dollars using the average exchange rates for each of the respective periods. Amounts for the period ended November 15, 2010 and years ended December 31, 2009, 2008 and 2007 were converted from euros to U.S. dollars using $1.00 to €0.7543, $1.00 to €0.7163, $1.00 to €0.6800 and $1.00 to €0.7288, respectively. |
| (j) | The Drumet acquisition closed on July 18, 2011. Pro forma adjustments are included for the 198 days ended July 17, 2011 and years ended December 31, 2010 and 2009 as if the acquisition had been consummated on the first day of the period presented for comparative purposes. The amounts represent the net income of Drumet before deductions for interest, taxes, depreciation and amortization and are converted from Polish złotys to U.S. dollars using the average exchange rates for each of the respective periods. Amounts for the period ended July 17, 2011 and years ended December 31, 2010 and 2009 were converted from Polish złotys to U.S. dollars using $1.00 to zł.3.0386, $1.00 to zł.3.0066 and $1.00 to zł.3.0921, respectively. As the former Drumet emerged from bankruptcy during 2009, its EBITDA amounts for that period and prior periods are not meaningful and, therefore, have not been provided. |
| (k) | The changes in assets and liabilities is a sum of the line items from the consolidated statements of cash flows. |
34
Table of Contents
| Item 7. | Management’s Discussion and Analysis of Financial Condition and Results of Operations |
Management’s discussion and analysis (“MD&A”) provides a review of the consolidated results of operations, financial condition, liquidity and capital resources of WireCo WorldGroup (Cayman) Inc. (“WireCo,” the “Company,” “we,” “us” and “our”) on a historical basis and discusses factors that have affected recent earnings, as well as those factors that may affect future earnings. Our MD&A should be read in conjunction with the consolidated financial statements and related notes included in Item 8, Financial Statements and Supplementary Data. Please see “Forward-Looking Statements” for a discussion of the risks, uncertainties and assumptions relating to these statements.
BUSINESS OVERVIEW
We believe we are the largest global manufacturer of high-performance wire rope and one of the leading worldwide manufacturers of electromechanical cable (“EMC”), synthetic rope, fabricated products and specialty wire. Our highly engineered and specialized products have a reputation for quality, performance and safety, and are marketed under well-known brands such as Union®, Camesa®, MacWhyte®, CASAR®, Wireline Works™, U.S. Reel™, Phillystran®, Oliveira™, Drumet® and Union International. Our proprietary technical and manufacturing expertise utilizes advanced metallurgical and material technologies to develop “mission-critical” products used in heavy lifting, pulling, supporting and suspension applications, where functionality and safety are the top priority. We maintain a comprehensive product portfolio across the diverse end markets we serve, including crane, oil and gas, mining, general industrial, wire, fishing and structures. Our global manufacturing footprint with 13 facilities worldwide is supplemented by a global network of company-owned distribution facilities and local distributors. Our China joint venture (“China JV”) also provides additional manufacturing capacity in Wuhan, China. We currently have global capacity to annually produce approximately 408,000 tons of wire and approximately 230,000 tons of wire rope. We aggregate our five operating segments that reflect geographic regions, including the United States, Mexico, Germany, Portugal and Poland, into one reportable segment as they have similar economic and other characteristics, such as the production and distribution processes, similar product offerings and similar customers.
EXECUTIVE SUMMARY
During 2011, we executed on our strategic initiatives related to acquiring and integrating companies that expand our geographic and product diversity and supply chain management. On July 18, 2011, we acquired all of the issued shares of Drumet Liny i Druty spółka z ograniczoną odpowiedzialnością (“Drumet”), also referred to as our Polish subsidiary, for an aggregate transaction value of approximately $100.8 million, payable in cash installments aggregating $62.4 million and debt assumed of approximately $38.4 million. Drumet, located in Włocławek, Poland, is a leading producer of steel wire ropes and a large producer of wire and staple band in Europe. Drumet’s wire capacity supplies most of our internal wire requirements in Europe, which allows us to manufacture quality wire for our wire ropes, provide shorter lead times, reduce inventory, utilize greater manufacturing flexibility and offer significant cost savings. In addition, Drumet expands our sales presence in Eastern Europe with new customer relationships, introduces a new brand to the Company’s existing portfolio and offers a high-quality, low-cost labor base. As a result of the acquisition, our wire capacity has increased approximately 40% and our wire rope capacity has increased approximately 15%.
Additionally, we realized benefits from our November 16, 2010 acquisition of Luís Oliveira Sá, SGPS, S.A. (“Oliveira”) through continued diversification of our product offerings. Excluding net sales from recent acquisition activity, we also experienced strong organic growth in the crane, oil and gas, mining, general purpose and wire end markets primarily due to rising demand in the respective industries and market share gains.
To fund our growing international operations, as well as prepare for future acquisitions, we issued an additional $150.0 million aggregate principal amount of unsecured 9.5% Senior Notes due 2017 (“Senior Notes”) on June 10, 2011. With a portion of the proceeds, we paid down a portion of our senior secured Term Loan since our ability to acquire companies is limited by secured borrowings. Additionally, we entered into a euro-based
35
Table of Contents
senior secured revolving credit facility (“Euro Facility”) with a current borrowing capacity of €30.0 million to enhance our liquidity position and support the increased working capital needs at our European manufacturing facilities.
For the China JV’s operational needs, we invested $15.0 million in the China JV during 2011 as a capital contribution. The associated increase of the Company’s ownership percentage from 51% to 65% was effective on May 31, 2011. As the Company still lacks the power to control the China JV’s principal operating activities, the Company continues to account for its investment under the equity method. In the fourth quarter of 2011, the China JV continued to incur losses that reduced our investment balance to $6.6 million. As a result of the continued losses recognized during 2011 and reduced liquidity, which raise substantial doubt as to the China JV’s ability to continue as a going concern, we recorded an impairment charge that reduced our remaining investment to zero and provided a full reserve against advances made by the Company to the China JV. In order to improve liquidity, China JV management has executed headcount and salary reductions and the China JV will focus on producing high-end specialty ropes, such as crane and mining ropes, and wire for the Company’s internal use. The China JV partner has agreed to provide additional funding in the form of a loan to the China JV to assist with principal and interest payments. Additionally, the China JV management is negotiating with a lender to restructure its debt under a revised agreement to further defer principal payments and lower the interest rate. The revised agreement may require compliance with restrictive operational and financial covenants. There can be no assurance that the China JV will be successful in negotiating these provisions with the lender or be able to comply with the operational and financial covenants that may result from a new agreement or that the financial funding provided by the China JV partner will be enough to resolve the China JV’s liquidity issues. Furthermore, there can be no assurance that the China JV will be able to restructure its debt or obtain additional financing from its joint venture partners or other third parties. We plan to continue to provide sales support and our engineers to support their operations. We have no current plans to invest further equity in the China JV.
We continue to make organizational changes to better manage our global operations and integrate our recent acquisitions. A year ago, we implemented a new global sales structure, which streamlined our global sales structure by having two senior members of management direct sales activity in the Eastern and Western Hemispheres. During 2011, we aligned our operations group to match the structure of our sales teams by assigning two senior members of management responsibility for our North American operations and our European operations. Also, an executive officer will lead our global supply chain management functions of logistics, purchasing and planning. This will ensure a consistent, global approach to the “customer experience” that differentiates us from our competition.
For the year ended December 31, 2011, we recorded net sales of $604.9 million, an increase of $157.2 million, or 35%, over 2010 net sales of $447.7 million. Acquisition Adjusted EBITDA, which includes Drumet pro forma EBITDA, was $129.6 million, and we reported a net loss of $50.7 million for the year ended December 31, 2011, compared to Acquisition Adjusted EBITDA of $111.7 million, which included Oliveira and Drumet pro forma EBITDA, and a net loss of $6.6 million for the same period in 2010. Overall, our operating income has improved over the prior period; however, our increased non-operating expenses, such as interest expense, loss on investment in and advances to the China JV and foreign currency exchange losses, have contributed to the substantial net loss for the year.
The table below depicts actual net sales and pro forma net sales for the year ended December 31, 2011 compared to the same period in 2010:
| Years ended December 31, |
||||||||
| 2011 | 2010 | |||||||
| (dollars in thousands) | ||||||||
| Net sales as reported |
$ | 604,927 | $ | 447,678 | ||||
| Oliveira pro forma net sales |
— | 55,143 | ||||||
| Drumet pro forma net sales |
64,956 | 82,389 | ||||||
|
|
|
|
|
|||||
| Pro forma net sales |
$ | 669,883 | $ | 585,210 | ||||
|
|
|
|
|
|||||
36
Table of Contents
For a reconciliation of (i) net loss to Acquisition Adjusted EBITDA and (ii) cash flows from operating activities to Acquisition Adjusted EBITDA, refer to Item 6, Selected Financial Data, of this annual report.
RESULTS OF OPERATIONS
This section focuses on significant items that impacted our operating results during the year ended December 31, 2011. Most notably, our recent acquisitions affect the comparability of period-over-period results. Operating results of Oliveira and Drumet are included in our consolidated statements of operations since the date of acquisition.
Our revenues and certain expenses are affected by fluctuations in the value of the U.S. dollar against the value of the euro, Mexican peso and Polish złoty. When we refer to changes in foreign currency exchange rates, we are referring to the differences between the foreign currency exchange rates we use to convert our international operations’ results from local currencies into U.S. dollars for reporting purposes. The impacts of foreign currency exchange rate fluctuations are calculated as the difference between prior period activity translated using the current period’s currency exchange rates and the comparable prior year period’s currency exchange rates. We use this method for all countries where the functional currency is not the U.S. dollar.
Year ended December 31, 2011 compared to the year ended December 31, 2010
The following table presents selected consolidated financial data for the years ended December 31, 2011 and 2010:
| Years
ended December 31, |
Change | |||||||||||||||
| 2011 | 2010 | Dollars | Percent | |||||||||||||
| (dollars in thousands) | ||||||||||||||||
| Net sales |
$ | 604,927 | $ | 447,678 | $ | 157,249 | 35 | % | ||||||||
|
|
|
|
|
|
|
|||||||||||
| Gross profit |
158,573 | 118,531 | 40,042 | 34 | % | |||||||||||
| Other operating expenses |
(101,564 | ) | (77,177 | ) | (24,387 | ) | 32 | % | ||||||||
| Other expense, net |
(102,700 | ) | (61,089 | ) | (41,611 | ) | 68 | % | ||||||||
| Income tax benefit (expense) |
(5,016 | ) | 13,170 | (18,186 | ) | NM | ||||||||||
|
|
|
|
|
|
|
|||||||||||
| Net loss |
$ | (50,707 | ) | $ | (6,565 | ) | $ | (44,142 | ) | NM | ||||||
|
|
|
|
|
|
|
|||||||||||
| Gross profit as % of net sales |
26 | % | 26 | % | ||||||||||||
| Other operating expenses as % of net sales |
17 | % | 17 | % | ||||||||||||
NM = Not Meaningful
Net sales
Our net sales increased $157.2 million, or 35%, for the year ended December 31, 2011 as compared to the same period in 2010. Of the increase, $93.8 million, or 60%, was attributable to recent acquisitions. Our Portuguese subsidiary generated approximately $63.4 million of net sales for the year ended December 31, 2011 compared to $5.9 million for the 46 days ended December 31, 2010. Our Polish subsidiary generated $36.3 million of net sales for the period July 18, 2011 and December 31, 2011. Changes in foreign currency exchange rate fluctuations accounted for approximately $6.0 million of the increase in net sales for the year ended December 31, 2011. In April 2011, we increased our base prices to reflect current market conditions.
Excluding our recent acquisitions, we experienced growth in the crane, oil and gas, mining general purpose and wire end markets. Wire rope sales increased $44.1 million, or 17%, for the year ended December 31, 2011 over the prior period. Net sales of wire rope into the crane market contributed approximately $16.0 million of this increase in net sales. Approximately $5.7 million, representing a 38% change, of this increase can be attributed to additional sales in the rapidly growing Asian crane market. Another $6.8 million, representing an 11% change, of the increase can be attributed to the recovery of crane markets in Europe.
37
Table of Contents
Our oil and gas market sales increased approximately $11.2 million. This increase can primarily be attributed to an increase in North American sales of $8.2 million due to increased drilling and exploration activities to meet global energy demands. The U.S. active rig count increased from 1,711 rigs as of December 2010 to 2,003 rigs as of December 2011, an increase of 17%. The worldwide active rig count increased 12% during that same time period.
Sales of wire rope for mining products increased approximately $8.3 million driven primarily by rising demand for iron ore, copper and coal. Of this increase, $3.6 million, or 12%, represented net sales to customers in North America, $1.1 million, or 40%, was sales generated in South America and $1.3 million, or 737%, was sales in the Asian market. Sales of our general purpose wire ropes increased $4.1 million, primarily in North America. Wire rope sales represented 59% of our total consolidated net sales for the year ended December 31, 2011 compared to 61% for the same period in 2010.
Excluding our recent acquisitions, our specialty wire sales increased $15.4 million, or 18%, over the prior period. This increase in specialty wire sales was largely due to increasing market share into the domestic Mexican wire market and demand for infrastructure projects in different regions of Mexico. Specifically, we had significant sales of our tire bead wire, PC strand and PC wire products. We expect to realize continued growth in our wire sales with the acquisition of our Polish subsidiary, which has increased our wire manufacturing capacity approximately 40%. This increased capacity will be used to produce wire products for internal use and third-party sales. Specialty wire sales represented 21% of our total consolidated net sales for the year ended December 31, 2011 compared to 20% for the same period in 2010.
Our net sales of fabricated products increased $6.3 million, or 24%, over prior year from $26.9 million to $33.2 million, which set an all-time sales record for this product in 2011. This increase was primarily due to shipment of product for the Manhattan Bridge and San Francisco Bay Bridge contracts that were awarded in 2010, offset by a decrease in infrastructure activity worldwide.
Net sales of EMC and synthetic rope did not significantly change over prior year.
Gross profit
Gross profit increased $40.0 million, but our gross margin remained unchanged at 26%, primarily due to a similar mix of products sold. Since we have multiple products with different gross margin levels, fluctuations in the mix of products sold may cause our gross profit to vary. Production of wire is less complex and, therefore, wire has lower margins than our value-added products, such as wire rope, synthetic rope and EMC. The price of steel rod, our primary raw material in wire and wire rope, increased compared to the same period in 2010. The cost of other raw material components, such as polyethylene and polypropylene used to produce our synthetic rope products, also increased slightly period over period. We monitor the cost of our raw materials and pass along price increases and decreases accordingly.
Other operating expenses
Other operating expenses are comprised of our selling expenses, administrative expenses and amortization expense on intangible assets with finite lives. Total other operating expenses as a percentage of net sales were 17% for the year ended December 31, 2011 and 2010.
| Years
ended December 31, |
Change | |||||||||||||||
| 2011 | 2010 | Dollars | Percent | |||||||||||||
| (dollars in thousands) | ||||||||||||||||
| Selling expenses |
$ | (26,067 | ) | $ | (17,520 | ) | $ | (8,547 | ) | 49 | % | |||||
| Administrative expenses |
(62,330 | ) | (47,221 | ) | (15,109 | ) | 32 | % | ||||||||
| Amortization expense |
(13,167 | ) | (12,436 | ) | (731 | ) | 6 | % | ||||||||
|
|
|
|
|
|
|
|||||||||||
| Other operating expenses |
$ | (101,564 | ) | $ | (77,177 | ) | $ | (24,387 | ) | 32 | % | |||||
38
Table of Contents
Selling expenses are comprised of payroll and fringe benefits for our international sales organization, which include sales commissions and other expenses, such as travel, advertising, training and recruiting expenses. Selling expenses increased $8.5 million, or 49%, over prior year. The majority of our selling expenses are directly correlated to the fluctuations in sales volume. Our net sales increased 35% compared to 2010, resulting in an increase of $6.1 million in selling expenses. During 2010, a new global sales structure was developed; we added sales coverage in Canada, Europe, Commonwealth of Independent States, the Pacific Rim and the Middle East. In 2011, we had a full year of these international sales personnel expenses, which contributed to $1.3 million of the increase in selling expenses. As we are expanding our sales coverage into emerging markets, the sales efforts are not comparable to our developed markets.
Administrative expenses are comprised of payroll and fringe benefits for our support staff, other personnel expenses, acquisition costs, restructuring charges, legal fees and other costs. Administrative expenses increased $15.1 million, or 32%, over prior year. Of this increase, $10.4 million is related to our recent acquisition activity. Drumet incurred administrative expenses of $9.9 million between July 18, 2011 and December 31, 2011 and Oliveira incurred $0.5 million more in administrative expenses for the year ended December 31, 2011 as compared to the same period in 2010. Acquisition costs incurred in 2011 related to Drumet and Oliveira represented $5.0 million and $1.1 million, respectively. We incurred $5.3 million in acquisition costs during the same period in 2010. Severance costs related to workforce reductions and reorganization of our distribution networks were $6.1 million in 2011, including $3.1 million of restructuring activity related to our recent acquisitions, compared to $1.3 million in 2010. Legal, auditor and other expenses associated with our registration statement, which was declared effective by the SEC in early 2012, totaled $1.5 million for the year ended December 31, 2011. During 2011, we incurred $2.9 million in consultant fees related to international trade matters, various litigation and entity restructuring activities.
Amortization expense increased $0.7 million primarily due to the amortization of intangible assets acquired in our recent purchases.
Foreign currency exchange rate fluctuations accounted for $0.8 million of the increase in other operating expenses for the year ended December 31, 2011.
Other expense, net
Other expense is comprised of our interest expense, loss on investment in and advances to the China JV, foreign currency exchange losses and other non-operating expenses. Other expense increased $41.6 million for the year ended December 31, 2011 compared to the same period in 2010. Significant components of this change were as follows:
| Years
ended December 31, |
Change | |||||||||||||||
| 2011 | 2010 | Dollars | Percent | |||||||||||||
| (dollars in thousands) | ||||||||||||||||
| Interest expense, net |
$ | (51,063 | ) | $ | (33,720 | ) | $ | (17,343 | ) | 51 | % | |||||
| Loss on investment in and advances to the China JV |
(33,015 | ) | (16,726 | ) | (16,289 | ) | 97 | % | ||||||||
| Foreign currency exchange losses |
(12,445 | ) | (3,050 | ) | (9,395 | ) | 308 | % | ||||||||
| Loss on extinguishment of long-term debt |
(5,654 | ) | (6,520 | ) | 866 | (13 | %) | |||||||||
| Other expense, net |
(523 | ) | (1,073 | ) | 550 | (51 | %) | |||||||||
|
|
|
|
|
|
|
|||||||||||
| Other expense, net |
$ | (102,700 | ) | $ | (61,089 | ) | $ | (41,611 | ) | 68 | % | |||||
| • | Interest expense increased $17.3 million, or 51%, for the year ended December 31, 2011 compared to the same period in 2010 primarily due to additional debt outstanding, higher interest rates and amortization of increased debt issuance costs related to debt offerings and amendments. Approximately $11.2 million of the increased interest expense is attributable to increased principal related to our Senior Notes. On May 19, 2010, we issued $275.0 million aggregate principal amount of Senior Notes that were used to retire the then outstanding $160.0 million of 11% Senior Notes resulting in |
39
Table of Contents
| approximately $3.1 million of increased interest expense. An additional $150.0 million aggregate principal amount of Senior Notes were issued on June 10, 2011, resulting in approximately $8.1 million of increased interest expense for the year ended December 31, 2011. As our registration statement with the SEC was not declared effective by May 2011, we incurred $1.4 million of special penalty interest in 2011 compared to $0.5 million in 2010. In conjunction with borrowings under the Euro Facility, which was executed in June 2011, we incurred $0.8 million of interest. Interest expense on the Term Loan increased $0.7 million period over period due to an increase in the interest rate effective May 2010 and additional debt outstanding with $65.0 million borrowed in November 2010, offset by a principal paydown of $132.8 million in June 2011 with proceeds from the Senior Notes. The amortization of debt issuance costs and the discount/premium related to these debt issuances and modifications, including amortization of the discount on our Polish Debt, resulted in an additional $2.8 million in interest expense for the year ended December 31, 2011. Upon the China JV becoming operational in September 2010, we ceased capitalizing interest on our original capital contribution of $25.5 million. Capitalized interest totaled $1.4 million for the year ended December 31, 2010. |
| • | The loss on investment in and advances to the China JV increased $16.3 million for the year ended December 31, 2011 compared to the same period in 2010. We have incurred a larger portion of the China JV’s losses since May 31, 2011, when our ownership percentage increased from 51% to 65%. Additionally, we recorded an allowance of $8.3 million against our related advances and recorded an impairment charge that reduced our remaining investment of $6.6 million due to continued losses and reduced liquidity, which raise substantial doubt as to the China JV’s ability to continue as a going concern. In the fourth quarter of 2011, the China JV impaired its property, plant and equipment and other noncurrent assets, which resulted in a loss that reduced our investment to zero. In 2010, we recorded an impairment charge of $7.5 million on our investment and related advances due to continued losses and reduced liquidity. |
| • | For the year ended December 31, 2011, we incurred net foreign currency exchange losses of $12.4 million compared to $3.1 million for the same period in 2010. The revaluation of new intercompany loans denominated in U.S. dollars at our Polish subsidiary contributed to $8.4 million of the loss. The U.S. dollar to Polish złoty exchange rate on the acquisition date of July 18, 2011 was $1.00 to zł.2.8374 compared to $1.00 to zł.3.4127 at December 31, 2011. Additionally, we recognized $1.6 million of foreign exchange loss associated with the funds denominated in other currencies used to purchase Drumet and the revaluation of the remaining purchase price installment payments denominated in euros payable by our Polish subsidiary whose functional currency is the Polish złoty. The revaluation of intercompany loans denominated in U.S. dollars for intercompany subsidiaries whose functional currency is the euro resulted in a $3.0 million loss for the year ended December 31, 2011 due to the slight depreciation of the euro. The U.S. dollar to euro exchange rate at December 31, 2010 was $1.00 to €0.7484 compared to $1.00 to €0.7729 at December 31, 2011. The current year losses were offset by a $2.1 million gain recognized at our Mexican subsidiary on net intercompany accounts receivable balances and trade accounts receivable balances denominated in U.S. dollars. The exchange rate at December 31, 2010 was $1.00 to 12.3817 Mexican pesos compared to $1.00 to 13.9787 Mexican pesos at December 31, 2011. |
| • | Loss on extinguishment of long-term debt decreased by $0.8 million for the year ended December 31, 2011 compared to the same period in 2010. During 2011, we incurred a loss of $5.7 million in conjunction with the prepayment of a portion of the Term Loan. We wrote-off $4.2 million of unamortized debt issuance costs associated with the pro rata portion that was prepaid and incurred $1.5 million in third-party fees to modify certain agreements in order to issue $150 million aggregate principal amount of additional Senior Notes. In May 2010, we incurred a loss of $6.5 million on the early extinguishment of our 11% Senior Notes. This 2010 loss consisted of a $3.2 million prepayment penalty, a write-off of $2.6 million in unamortized debt issuance costs associated with the 11% Senior Notes and $0.7 million of third-party fees to modify our Term Loan agreement in conjunction with the issuance of $275 million aggregate principal amount of Senior Notes. |
40
Table of Contents
Income taxes
For the year ended December 31, 2011, the Company’s income tax expense was $5.0 million, an increase of $18.2 million, as compared to an income tax benefit of $13.2 million for the year ended December 31, 2010. The income tax benefit recognized for the year ended December 31, 2010 included $2.8 million in valuation allowance release of previously unrealizable net operating losses by the Company’s Mexican subsidiaries. The remaining increase in tax expense is driven by an increase in the valuation allowance in the U.S. and Portugal of $13.0 million. Due to increasing operating losses in the U.S. tax jurisdiction in 2011, the Company does not expect to realize the increased tax benefits and has offset the tax benefit with a valuation allowance. The resulting effective tax rate was an expense of 11% and a benefit of 67% for the year ended December 31, 2011 and 2010, respectively. The effective tax rate of 67% was due to near break-even earnings for the year ended December 31, 2010 coupled with a significant income tax benefit largely due to the release of the $2.8 million valuation allowance discussed above.
Year ended December 31, 2010 compared to the year ended December 31, 2009
The following table presents selected consolidated financial data for the years ended December 31, 2010 and 2009:
| Years
ended December 31, |
Change | |||||||||||||||
| 2010 | 2009 | Dollars | Percent | |||||||||||||
| (dollars in thousands) | ||||||||||||||||
| Net sales |
$ | 447,678 | $ | 383,253 | $ | 64,425 | 17 | % | ||||||||
|
|
|
|
|
|
|
|||||||||||
| Gross profit |
118,531 | 88,893 | 29,638 | 33 | % | |||||||||||
| Other operating expenses |
(77,177 | ) | (62,840 | ) | (14,337 | ) | 23 | % | ||||||||
| Other expense, net |
(61,089 | ) | (26,402 | ) | (34,687 | ) | 131 | % | ||||||||
| Income tax benefit |
13,170 | 4,435 | 8,735 | NM | ||||||||||||
|
|
|
|
|
|
|
|||||||||||
| Net income (loss) |
$ | (6,565 | ) | $ | 4,086 | $ | (10,651 | ) | NM | |||||||
|
|
|
|
|
|
|
|||||||||||
| Gross profit as % of net sales |
26 | % | 23 | % | ||||||||||||
| Other operating expenses as % of net sales |
17 | % | 16 | % | ||||||||||||
|
NM = Not Meaningful |
||||||||||||||||
Net sales
Our financial results for 2010 reflect net sales of $447.7 million, an increase of $64.4 million, or approximately 17%, from 2009. The increase was primarily driven by global economic growth, the economic recovery in the United States and our recent acquisition activity, offset in part by the continued economic decline in the European markets. Phillystran, acquired on December 31, 2009, contributed to sales increases of $17.1 million in 2010 compared to 2009. The base pricing levels for our products remained relatively flat from 2009 to 2010. The impact of foreign currency exchange rate fluctuations on net sales was not significant for this period.
The major end markets that experienced significant sales growth in 2010 were the same end markets which experienced the most significant declines in 2009. Oil and gas rebounded in 2010 with wire rope sales increasing $23.2 million, or approximately 80%, from $29.2 million in 2009 to $52.4 million in 2010, and EMC sales increasing $12.0 million, or approximately 43%, from $27.7 million to $39.7 million. This increase was driven by higher rig counts in North America and additional sales in international markets. The number of drilling rigs actively exploring for developing oil or natural gas in the United States, is at its highest point since December of 2008. Also, general industrial sales were up $14.4 million, or 63%, over prior year from $22.7 million to $37.1 million. This end market, comprised of several industries, including construction, transportation, defense, automotive, agriculture and logging, is directly linked to the general economic activity. The strong domestic sales
41
Table of Contents
growth was offset by lower sales of $12.8 million in European markets. Globally, OEM business continued to be depressed and negatively impacted our sales, most notably at our German subsidiary. German sales were $95.1 million for 2010 compared to $107.9 million for 2009.
Gross profit
Gross profit as a percentage of sales increased from 23% for the year ended December 31, 2009 to 26% for the year ended December 31, 2010. This improvement of 3% was primarily the result of increased operating efficiencies at our plants due to higher production volumes and increased sales volume of more specialized wire rope and EMC products resulting in higher gross profit. In 2010, our plants were operating at a higher capacity than 2009, resulting in increased absorption of fixed costs.
Other operating expenses
Total other operating expenses as a percentage of net sales were 17% and 16% for the year ended December 31, 2010 and 2009.
| Years
ended December 31, |
Change | |||||||||||||||
| 2010 | 2009 | Dollars | Percent | |||||||||||||
| (dollars in thousands) | ||||||||||||||||
| Selling expenses |
$ | (17,520 | ) | $ | (10,263 | ) | $ | (7,257 | ) | 71 | % | |||||
| Administrative expenses |
(47,221 | ) | (40,570 | ) | (6,651 | ) | 16 | % | ||||||||
| Amortization expense |
(12,436 | ) | (12,007 | ) | (429 | ) | 4 | % | ||||||||
|
|
|
|
|
|
|
|||||||||||
| Other operating expenses |
$ | (77,177 | ) | $ | (62,840 | ) | $ | (14,337 | ) | 23 | % | |||||
Other operating expenses increased $14.3 million, or 23%, for the year ended December 31, 2010, compared to the same period of 2009. The increase in selling expenses was primarily due to 2010 costs associated with the development of the global sales structure, an increase in commissions and sales bonuses and favorable adjustments in 2009 related to warranty and other reserves. In early 2010, the Company added international sales positions for coverage in the Middle East, the Pacific Rim, Russia, Europe and Canada. Travel expenses, recruiting costs and other personnel costs associated with our international activities increased $2.0 million over the prior year. These expenses are expected to continue to increase in 2011 as the full year impact of the global sales force investment will be reflected in selling expense. Sales bonus and commission expense increased $1.5 million over prior year due to the increase in net sales. Our German subsidiary reduced certain warranty reserves in 2009 by approximately $1.2 million as a result of the ultimate settlement for amounts less than originally accrued. In 2009, our German subsidiary also released certain provisions in the amount of $1.2 million related to employment agreements that were renegotiated during 2009. Additionally, approximately $0.4 million and $0.7 million of the increase in selling expenses was the result of our acquisitions of Phillystran and Oliveira, respectively.
The increase in administrative expenses was primarily due to worldwide compensation-related expenses and acquisition costs associated with the purchase of Oliveira. As many of our compensation programs are based on quarterly profitability and our 2010 operating results exceeded plan for all quarters compared to only one quarter in 2009, our administrative bonus expense increased approximately $3.7 million. Direct acquisition costs associated with the purchase of Oliveira were $5.0 million. These costs were primarily comprised of finder fees, legal fees and due diligence support fees. In 2009, we incurred $0.9 million of direct acquisition costs with the purchase of Phillystran. Additionally, we incurred $0.4 million in administrative expenses associated with Oliveira activity since the date of acquisition and $0.8 million more in administrative expenses in 2010 over 2009 related to Phillystran. During 2009, there was an unfavorable adjustment regarding an increase in the allowance for doubtful accounts of $1.4 million related to specific customer accounts; no such adjustment was necessary for 2010. Additionally, Paine & Partners’ management fee decreased $0.8 million from $2.9 million for the year ended December 31, 2009 to $2.1 million for the year ended December 31, 2010.
42
Table of Contents
The impact of foreign currency exchange rate fluctuations on other operating expenses was not significant for this period.
Other expense, net
Other expense increased $34.7 million for the year ended December 31, 2010 compared to the same period in 2009. Significant components of this change were as follows:
| Years
ended December 31, |
Change | |||||||||||||||
| 2010 | 2009 | Dollars | Percent | |||||||||||||
| (dollars in thousands) | ||||||||||||||||
| Interest expense, net |
$ | (33,720 | ) | $ | (24,718 | ) | $ | (9,002 | ) | 36 | % | |||||
| Loss on investment in and advances to the China JV |
(16,726 | ) | (3,703 | ) | (13,023 | ) | 352 | % | ||||||||
| Foreign currency exchange gains (losses) |
(3,050 | ) | 3,268 | (6,318 | ) | (193 | %) | |||||||||
| Loss on extinguishment of long-term debt |
(6,520 | ) | — | (6,520 | ) | 100 | % | |||||||||
| Other expense, net |
(1,073 | ) | (1,249 | ) | 176 | (14 | %) | |||||||||
|
|
|
|
|
|
|
|||||||||||
| Other expense, net |
$ | (61,089 | ) | $ | (26,402 | ) | $ | (34,687 | ) | 131 | % | |||||
| • | Interest expense increased $9.0 million for the year ended December 31, 2010, compared to 2009. The increase in net interest expense is primarily related to approximately $5.3 million in additional interest expense on the $275 million aggregate principal amount of Senior Notes issued in May 2010 due to the increased principal and approximately $2.1 million in additional interest expense associated with the May 2010 Term Loan amendment. On an annual basis, we expect to incur approximately $8.5 million in additional interest expense associated with these Senior Notes, net of savings from the retirement of the 11% Senior Notes; approximately $7.9 million in additional interest expense on our Term Loan, which includes the interest rate change per the amendment and $65.0 million of additional indebtedness incurred with the incremental loan on November 24, 2010, subject to variable market interest rates; and an additional $2.4 million in interest expense related to the amortization of debt issuance costs. If we utilize our revolving credit facility for future borrowings, we would expect to incur additional interest expense in-line with the outstanding balance and variable market interest rates. |
| • | The loss on investment in and advances to the China JV increased $13.0 million year-over-year attributed to continued issues related to equipment and other issues related to the slower business start-up, in addition to depreciation and reduced interest capitalization on the facility and equipment beginning in September 2010, when the facility and equipment were ready for its intended use. These expenses impact our 51% share of operating results. Additionally, we began amortizing the interest previously capitalized on our $25.5 million investment in September 2010. Interest capitalized in 2009 was $2.2 million versus $1.4 million in 2010, and amortization was $0.1 million in 2010. Furthermore, we recorded an other than temporary impairment of $7.5 million to write-down our investment in and advances to the China JV to fair value as of December 31, 2010. We discuss this impairment charge in more detail in Note 7—“Investment in and Advances to the China Joint Venture” to our consolidated financial statements in Item 8, Financial Statements and Supplementary Data. |
| • | For the years ended December 31, 2010 and 2009, the Company recognized a foreign exchange loss of $3.0 million and a foreign exchange gain of $3.3 million, respectively. The $6.3 million fluctuation is primarily due to the $7.5 million change in foreign currency exchange losses on the revaluation of intercompany loans denominated in U.S. dollars due to the depreciation in the euro in 2010, offset by realized gains of $3.2 million on euro-based investment and cash accounts purchased and settled by a domestic operating subsidiary during 2010. The U.S. dollar to euro exchange rate for 2010 averaged $1.00 to €0.7538 versus $1.00 to €0.7178 in 2009. The remaining $2.0 million loss is a result of net transactional losses across all WireCo subsidiaries. |
| • | We incurred a loss on extinguishment of long-term debt of $6.5 million in 2010. On May 19, 2010, we issued $275.0 million aggregate principal amount of the Senior Notes. As part of this issuance, we |
43
Table of Contents
| retired our 11% Senior Notes and incurred a loss on the early extinguishment. This loss consisted of a $3.2 million prepayment penalty, a write-off of $2.6 million in unamortized debt issuance costs associated with the 11% Senior Notes and $0.7 million of third-party fees to modify our Term Loan agreement. |
Income taxes
For the year ended December 31, 2010, the Company’s income tax benefit was $13.2 million, an increase of $8.8 million, as compared to $4.4 million for the year ended December 31, 2009. The effective tax rate was 67% and 1,271% for the years ended December 31, 2010 and 2009, respectively. The Company’s high effective tax rate is a result of the Company recognizing taxable income from its subsidiaries in tax jurisdictions with low tax rates and recognizing pre-tax losses in tax jurisdictions with high tax rates. In 2009, the Company had a near break-even pre-tax loss compared to a $19.7 million pre-tax loss in 2010. Additionally in 2010, the effective tax rate was increased by an $8.9 million benefit recorded on the release of a valuation allowance in Mexico.
LIQUIDITY AND CAPITAL RESOURCES
Overview
During 2011, we completed a significant refinancing transaction and executed a euro-based credit facility. With proceeds from the $150.0 million aggregate principal amount of Senior Notes issued in June 2011, we prepaid $132.8 million of our outstanding Term Loan balance. This refinancing transaction extended the maturity of this debt from February 2014 to May 2017 and also permitted more financial flexibility to further our business growth. We executed the Euro Facility to enhance our liquidity position and provide increased working capital to support our European manufacturing facilities. Also, during 2011, we financed the purchase of Drumet with cash-on-hand and borrowings under our revolving credit facilities to pay the $51.8 million in cash consideration, net of cash acquired, due at the time of purchase. We expect to fund the remaining acquisition installment payments with cash from operations or borrowings under our revolving credit facilities. In conjunction with this purchase, we assumed non-interest bearing debt with a face value of $33.9 million at closing (“Polish Debt”).
Our principal sources of liquidity consist of cash from operations, borrowings under our revolving credit agreements and access to debt markets. External sources of cash from debt issuances have been used to refinance existing indebtedness and fund acquisitions. Our principal uses of cash are to support operations and service our debt. Our liquidity is influenced by many factors, including the amount and timing of our cash collections from our customers, fluctuations in the cost of our raw materials and the amount we invest in acquisitions and capital expenditures. We monitor the cost of our raw materials and pass along price increases and decreases accordingly. We currently have no plans to enter into derivative agreements to mitigate raw material price changes in any of our facilities.
We reinvest the earnings of substantially all of our non-U.S. subsidiaries in those respective operations. The foreign operating subsidiaries use cash generated from earnings to fund working capital, invest in capital expenditures and service interest and principal payments on intercompany debt. Our outstanding debt is issued by the U.S. operating subsidiary and there are intercompany loans within the corporate legal structure that are paid with earnings from the operating subsidiaries in foreign jurisdictions to provide liquidity in the U.S. for interest and principal payments on our outstanding debt. Of the consolidated cash and cash equivalents balance of $27.7 million at December 31, 2011, cash and cash equivalents held in foreign countries were $25.3 million, of which all was held in the subsidiaries’ local currency. The cash balances in currencies other than the U.S. dollar are primarily in the euro, the Mexican peso and the Polish złoty, all of which can be readily converted to U.S. dollars. If the cash held at our Mexican subsidiaries, which are the only foreign subsidiaries of our U.S. operations, was to be repatriated to the U.S., we could be required to accrue and pay U.S. income taxes to repatriate these funds. Our intent is to permanently reinvest these earnings outside the U.S. and our current plans do not indicate a need to repatriate these funds to the U.S.
44
Table of Contents
We are currently working with our China JV partner and various banks to secure additional funding and restructure the existing debt at the China JV. We plan to continue to source a portion of our internal wire requirements from the China JV and provide sales support and our engineers to support operations. We have no current plans to invest further equity in the China JV. Due to continued losses and reduced liquidity, there is substantial doubt as to the China JV’s ability to continue as a going concern. As of December 31, 2011, our exposure to loss as a result of our involvement with the China JV is limited to our prepaid inventory of $1.9 million. We do not guarantee the debts of the China JV in whole or in part.
Based on current expectations, management believes that existing cash balances, operating cash flows, credit facilities and access to debt and other available financing resources will be sufficient to fund anticipated operating, capital and debt service requirements and other commitments in the foreseeable future. However, there can be no assurance of the cost or availability of future borrowings, if any, under our credit facilities or in the debt markets. Our cost of certain debt can be impacted by independent rating agencies, which assign debt ratings based on certain factors including credit measurements such as interest coverage and leverage ratios, liquidity and competitive position.
Available Liquidity
Available liquidity is defined as total availability under our revolving credit facilities plus cash and cash equivalents. Available liquidity was as follows on the dates indicated:
| December 31, 2011 | December 31, 2010 | |||||||
| (in thousands) | ||||||||
| Availability under revolving credit facilities: |
||||||||
| Revolving Credit Agreement |
$ | 49,481 | $ | 55,392 | ||||
| Euro Facility |
571 | — | ||||||
| CASAR Revolving Credit Agreement |
9,233 | 9,208 | ||||||
|
|
|
|
|
|||||
| 59,285 | 64,600 | |||||||
| Cash and cash equivalents |
27,663 | 53,880 | ||||||
|
|
|
|
|
|||||
| Total available liquidity |
$ | 86,948 | $ | 118,480 | ||||
|
|
|
|
|
|||||
Working Capital
| December 31, 2011 | December 31, 2010 | |||||||
| (in thousands) | ||||||||
| Current assets: |
||||||||
| Cash and cash equivalents |
$ | 27,663 | $ | 53,880 | ||||
| Other current assets |
309,991 | 249,103 | ||||||
|
|
|
|
|
|||||
| Total current assets |
337,654 | 302,983 | ||||||
| Less: Total current liabilities |
(134,947 | ) | (76,515 | ) | ||||
|
|
|
|
|
|||||
| Working capital |
$ | 202,707 | $ | 226,468 | ||||
|
|
|
|
|
|||||
The purchase of Drumet in the third quarter of 2011 resulted in an increase in current assets of $40.0 million, offset by the current liabilities incurred and assumed of $35.3 million, which includes current maturities of long-term debt of $12.3 million and acquisition installment payments of $9.8 million, as well as a reduction of cash used to fund the purchase. Accounts receivable and inventories, excluding those acquired, increased $12.0 million and $23.4 million, respectively from December 31, 2010 due to increased sales volumes and stocking of products in locations to reduce delivery time to customers. Offsetting these increases in working capital, were an increase in borrowings on our short-term revolver of $16.1 million and an increase in accounts payable of approximately $9.2 million, excluding those acquired.
45
Table of Contents
Borrowings
During 2011, we issued $150.0 million aggregate principal amount of Senior Notes due in 2017. A portion of the offering proceeds were used to prepay $132.8 million of the outstanding Term Loan balance and the remainder for general corporate purposes. We also entered into a euro-based revolving credit facility with commitments of €30.0 million (equivalent of $38.8 million at December 31, 2011) and amended certain credit agreements to facilitate these new borrowing activities. With the acquisition of Drumet, we assumed non-interest bearing long-term debt with a face value equivalent to $33.9 million at closing. These transactions are discussed in further detail below in the section titled “Long-term Debt and Credit Facility Activity”.
Our debt capitalization ratio (total debt as a percentage of total debt plus total equity) was 82% and 72% as of December 31, 2011 and 2010, respectively. The following table sets forth our capitalization:
| December 31, 2011 | December 31, 2010 | |||||||
| (in thousands) | ||||||||
| Debt: |
||||||||
| Revolving Credit Agreement |
$ | 16,101 | $ | — | ||||
| CASAR Revolving Credit Agreement |
— | — | ||||||
| Euro Facility |
28,595 | — | ||||||
| Other indebtedness |
658 | 799 | ||||||
| Polish Debt at face value |
28,034 | — | ||||||
| Term Loan |
99,250 | 233,419 | ||||||
| Senior Notes due 2017 at face value |
425,000 | 275,000 | ||||||
|
|
|
|
|
|||||
| Total debt |
597,638 | 509,218 | ||||||
| Total stockholders’ equity |
129,536 | 195,069 | ||||||
|
|
|
|
|
|||||
| Total capitalization |
$ | 727,174 | $ | 704,287 | ||||
|
|
|
|
|
|||||
Standard & Poor’s Rating Services (“S&P”) and Moody’s Investors Service (“Moody’s”) rate our debt as noninvestment grade and provide their view of WireCo’s outlook. These ratings and outlooks change from time to time and can be found on the websites of S&P and Moody’s.
As of December 31, 2011, we were in compliance with all restrictive and financial covenants associated with our borrowings, including the revolving credit agreements, and we do not expect to breach any covenants. A breach of financial covenants in our credit agreements (i.e., those that require the maintenance of ratios based on Acquisition Adjusted EBITDA) would force us to seek a waiver or amendment with the lenders under our credit agreements, and no assurance can be given that we would be able to obtain any necessary waivers or amendments on satisfactory terms, if at all. The lenders would likely condition any waiver or amendment, if given, on additional consideration from us, such as a consent fee, higher interest rate, principal repayment or more restrictive covenants and limitations on our business. Any such breach, if not waived by the lenders, would result in an event of default under that agreement, in which case the lenders could elect to declare all amounts borrowed due and payable.
Long-term Debt and Credit Facility Activity
For a detailed discussion of our borrowings, see Note 8—“Borrowings” to our consolidated financial statements in Item 8, Financial Statements and Supplementary Data of this annual report. For a description of assets securing our indebtedness, see the section entitled “Security for Borrowings” below.
Polish Debt – With the acquisition of Drumet, we assumed debt with a face value of zł.91.7 million and €1.1 million (equivalent of $33.9 million at closing). These notes bear no interest and require varied installment payments each calendar year-end until December 31, 2014, the maturity date. We estimated the fair value of these non-interest bearing notes on the date of acquisition to be zł.75.0 million and €0.9 million (equivalent of
46
Table of Contents
$27.7 million at closing) using an effective interest rate of 10.00%. The discounted value of the notes is accreted to the face value of the payments through interest expense. The Polish Debt balance was $28.0 million as of December 31, 2011.
Senior Notes. On June 10, 2011, we issued $150 million aggregate principal amount of Senior Notes at 104.75% of their aggregate principal amount. We received net proceeds from the offering of $150.9 million, including a premium of $7.1 million and net of debt issuance costs of $6.2 million related to underwriting, legal, accounting and other third-party expenses. The unsecured Senior Notes were offered as additional debt securities under the Indenture, pursuant to which we previously issued the $275 million aggregate principal amount of Senior Notes. As of December 31, 2011, we had $425 million aggregate principal amount of Senior Notes outstanding due May 15, 2017. Interest on the Senior Notes (9.5%) is due semi-annually on May 15th and November 15th of each year. The Indenture contains various covenants including, but not limited to, limitations on: indebtedness, dividends and other capital distributions, sale of assets, transactions with affiliates, liens and issuances of preferred stock. Certain of our subsidiaries guarantee this debt.
Term Loan, as amended. On June 10, 2011, we amended our Term Loan Credit Agreement. This amendment was necessary to issue an additional $150 million aggregate principal amount of Senior Notes and enter into the Euro Facility. Based on credit ratings at the time of the amendment, the interest rate on outstanding borrowings decreased from LIBOR plus 3.50% with a LIBOR floor of 1.75% to LIBOR plus 3.25% with a LIBOR floor of 1.75%. The interest rate on the Term Loan was 5.00% at December 31, 2011. On June 10, 2011, we prepaid $132.8 million of the outstanding Term Loan balance with a portion of the proceeds from the Senior Notes offering. The Term Loan balance was $99.3 million as of December 31, 2011. The Term Loan requires interest and fixed quarterly principal payments of approximately $0.3 million and the remaining principal amount is due on February 8, 2014, the maturity date of the Term Loan. Pursuant to the Term Loan agreement, the Company’s senior secured leverage ratio must be 3.25 to 1.00. Negative covenants include, but are not limited to, limitations on the Company’s ability to incur liens, engage in mergers, consolidations, or amalgamations; liquidate, wind up or dissolve; dispose of all or substantially all of the Company’s property or business; and engage in any asset sales.
Revolving Credit Agreement, as amended. On June 10, 2011, we amended our Revolving Credit Agreement in order to issue the Senior Notes. Certain negative covenants were amended to allow, among other things, the additional indebtedness. Advances under the Revolving Credit Agreement bear interest at either the prime rate plus an applicable margin or at the LIBOR plus an applicable margin; the rate is designated by the borrower upon each draw. The borrowing capacity under the Revolving Credit Agreement is an aggregate principal amount of $66.0 million, subject to an incurrence covenant and an adjusted borrowing base calculation based on specified advance rates against the value of eligible accounts receivable and inventory. Also, outstanding letters of credit, which we utilize in connection with various normal business activities, reduce the amount available to be drawn. At December 31, 2011, there were two outstanding letters of credit in the amount of $0.4 million. The Company had borrowed $16.1 million as of December 31, 2011 and had approximately $49.5 million of availability under the Revolving Credit Agreement as of December 31, 2011. Advances under the Revolving Credit Agreement bear interest at either the prime rate plus an applicable margin or at the LIBOR plus an applicable margin; the rate is designated by the borrower upon each draw. The agreement imposes a letter of credit fee on outstanding letters of credit and a fee for unutilized commitments. The interest rate was 4.00% at December 31, 2011. The Revolving Credit Agreement contains various negative covenants that limit or restrict the incurrence of indebtedness and guarantees, the creation of liens, transactions with affiliates, amendments of organizational documents, the incurrence of capital leases and operating leases, changes in locations and storage, use of certain collateral, investments (including limitations on investments in and loans to subsidiaries with proceeds of borrowings thereunder), amendments and changes to the terms of the notes, advances and acquisitions, mergers, consolidations, asset sales, dividends and distributions and certain other transactions and business activities. The Revolving Credit Agreement also contains customary events of default, including upon a change of control and the occurrence of a material adverse change in business. The Revolving Credit Agreement contains a minimum fixed charge coverage ratio requirement, a maximum senior leverage ratio requirement and a maximum capital expenditures allowance. The Revolving Credit Agreement matures on the earlier of February 8, 2014 or six months prior to the Term Loan maturity.
47
Table of Contents
Euro Facility. On June 10, 2011, we entered into a euro-based senior secured revolving credit facility with Deutsche Bank AG, London Branch and Goldman Sachs Bank USA, with commitments of €30.0 million to date (equivalent of $38.8 million at December 31, 2011). The borrowing capacity under the Euro Facility can be increased to €40.0 million if future commitments are made by existing or new financial institutions. We had borrowed $28.6 million under the Euro Facility as of December 31, 2011. There were two outstanding letters of credit issued to the former owner of Drumet related to the remaining purchase price installment payments of €7.5 million (equivalent of $9.7 million at December 31, 2011), which reduced the availability to $0.6 million. Revolving loans under the Euro Facility bear interest at a rate equal to 4.50% plus Euribor, adjusted for certain additional costs and reserve requirements. The weighted average interest rate on outstanding draws at December 31, 2011 was 5.58%. The agreement imposes a letter of credit fee on outstanding letters of credit, limited to €10.0 million, at a rate equal to 4.50%. In addition, we also must pay a commitment fee for the unutilized commitments at a rate equal to 1.80%. The Euro Facility matures on either February 8, 2014 (the Term Loan maturity date) or June 10, 2016, if by August 2013, the Company repays the Term Loan in full or amends the Term Loan to extend its maturity to a date beyond June 10, 2016. The Euro Facility contains similar covenants and events of default as the Term Loan. All obligations under the Euro Facility are guaranteed by the same parties that guarantee the Term Loan.
CASAR Revolving Credit Agreement. We have a revolving credit agreement with BGL BNP Paribas S.A. The borrowing capacity under the CASAR Revolving Credit Agreement is an aggregate principal amount of $10.0 million, subject to an adjusted borrowing base calculation based on specified advance rates against the realizable value of eligible inventory and accounts receivable and reduced by outstanding letters of credit. At December 31, 2011, there were outstanding letters of credit in the amount of $0.8 million. We did not borrow under this agreement during 2011 and 2010. As of December 31, 2011, the availability under the agreement was $9.2 million. Advances under the CASAR Revolving Credit Agreement bear interest at the three-month daily LIBOR plus 2.00% (in case of drawings in euros, the corresponding Euribor interest rate). The interest rate was 2.37% at December 31, 2011. The Company must also pay a fee for unutilized commitments at a rate equal to 0.50%. The CASAR Revolving Credit Agreement contains various negative covenants that limit or restrict the incurrence of indebtedness and guarantees, the creation of liens, transactions with affiliates, among other business activities. The CASAR Revolving Credit Agreement contains a minimum debt coverage ratio requirement and a maximum senior leverage ratio requirement. The CASAR Revolving Credit Agreement matures on August 22, 2012.
48
Table of Contents
Security for Borrowings
| Respective borrowings secured by (1): | ||||||||||||||||
| United States/ Canada / |
Germany |
Poland | Netherlands | |||||||||||||
| Borrowings: |
A/R and |
All Other Assets |
A/R and |
All Other Assets |
A/R and Inventory |
All Other Assets |
A/R and Inventory |
All Other Assets | ||||||||
| Term Loan | second-priority lien (3) | first- priority lien (3) |
second-priority on certain accounts; second-priority lien on remainder (4) | first- priority lien (3) |
second- priority lien (4) |
first- priority lien (except PP&E) (3) |
second- priority lien (4) |
first- priority lien (3) | ||||||||
| Revolving Credit Agreement | first- priority lien | second- priority lien |
||||||||||||||
| CASAR Revolving Credit Agreement | first-priority lien on certain accounts | |||||||||||||||
| Euro Facility | second-priority lien (3) | first- priority lien (3) |
second-priority on certain accounts; first-priority lien on remainder (4) | first- priority lien (3) |
first- priority lien (4) |
first- priority lien (except PP&E) (3) |
first- priority lien (4) |
first- priority lien (3) | ||||||||
| Polish Debt | first- priority lien on only PP&E(2) |
|||||||||||||||
| (1) | Assets at our Mexican and Portuguese subsidiaries are not secured under any of our borrowings. |
| (2) | The collateral is being released gradually with the payment of each installment, first personal property and then real estate. |
| (3) | Priority is pari passu. |
| (4) | Only one lien, priority established in Term Loan. |
Detail of our revolving credit activity for 2011 was as follows:
Revolving Credit Agreement, classified as a current liability
| Amount | Weighted-average interest rate |
|||||||
| (dollars in thousands) | ||||||||
| Amount outstanding at December 31, 2011 |
$ | 16,101 | 4.00 | % | ||||
| Average amount outstanding during the year ended December 31, 2011 |
$ | 9,221 | 4.00 | % | ||||
| Maximum amount outstanding during the year ended December 31, 2011 |
$ | 52,215 | 4.00 | % | ||||
Euro Facility, classified as long-term debt
| Amount | Weighted-average interest rate |
|||||||
| (dollars in thousands) | ||||||||
| Amount outstanding at December 31, 2011 |
$ | 28,595 | 5.58 | % | ||||
| Average amount outstanding during the year ended December 31, 2011 |
$ | 20,996 | 5.76 | % | ||||
| Maximum amount outstanding during the year ended December 31, 2011 |
$ | 28,595 | 5.58 | % | ||||
49
Table of Contents
Cash Flow Data
The following table summarizes our cash flows from operating, investing and financing activities in 2011, 2010 and 2009:
| 2011 | 2010 | 2009 | ||||||||||
| (dollars in thousands) | ||||||||||||
| Cash flows provided by (used in) |
||||||||||||
| Operating activities |
$ | 10,653 | $ | (4,351 | ) | $ | 69,669 | |||||
| Investing activities |
(93,335 | ) | (102,326 | ) | (33,300 | ) | ||||||
| Financing activities |
56,956 | 140,984 | (25,422 | ) | ||||||||
| Effect of exchange rates on cash and cash equivalents |
(491 | ) | 3,245 | (430 | ) | |||||||
|
|
|
|
|
|
|
|||||||
| Net increase (decrease) in cash and cash equivalents |
(26,217 | ) | 37,552 | 10,517 | ||||||||
| Cash and cash equivalents, beginning of year |
53,880 | 16,328 | 5,811 | |||||||||
|
|
|
|
|
|
|
|||||||
| Cash and cash equivalents, end of year |
$ | 27,663 | $ | 53,880 | $ | 16,328 | ||||||
|
|
|
|
|
|
|
|||||||
Cash Flows from Operating Activities
Net cash flow from operating activities increased $15.0 million for the year ended December 31, 2011 as compared to the same period in 2010 due primarily to a $25.0 million increase in operating income, excluding depreciation and amortization and share-based compensation, offset in part by an increased investment in inventory and accounts receivable of $14.0 million compared to 2010. Increased accrued interest on the additional borrowings resulted in a source of $4.6 million in 2011 compared to 2010.
The significant decrease in operating cash flows of $74.0 million from 2009 to 2010 was primarily attributable to increased sales activity in 2010 compared to 2009. This increased demand for our products in 2010 resulted in a use of cash of $21.5 million to replenish inventories that were depleted in 2009 in order to conserve cash and a use of cash of $12.1 million due to increased accounts receivable resulting from improved sales. The use of cash was partially offset by an increase in accounts payable of $13.3 million driven in part by an increase in purchases of raw materials used in our production process. Cash flows from operating activities also includes a use of $5.0 million for direct acquisition costs related to the purchase of Oliveira in November 2010 as compared to $0.9 million of direct acquisition costs for Phillystran in 2009. The 2009 cash flows from operating activities reflect measures taken under difficult economic conditions to reduce our investment in working capital. Inventories and accounts receivable were reduced by $28.2 million and $35.2 million respectively, partially offset by a use of cash for accounts payable of $18.8 million. The changes in other balance sheet accounts resulted in a net use of cash of $22.5 million in 2010 as compared to a net use of $3.6 million in 2009, primarily related to increased payments of income taxes in 2010 of $13.6 million most of which was attributed to our German subsidiary and increased interest payments of $8.6 million in 2010 resulting from our debt issuance and amendments in May 2010. The use of cash for taxes and interest payments in 2010 is offset in part by accruals of $6.6 million for these expenses at year end.
Cash Flows from Investing Activities
Cash flows from investing activities consist primarily of cash outlays for capital spending, acquisitions of companies and our investment activity with the China JV. Capital expenditures totaled $24.0 million, $17.9 million and $15.3 million in 2011, 2010 and 2009, respectively. For 2012, we estimate that our planned capital spending will be between $32 million and $35 million, of which approximately $12 million is at our newly acquired manufacturing facilities. Actual capital expenditures for 2012 may differ materially from our estimate. We paid $51.8 million, $80.9 million and $15.3 million, net of cash acquired, to purchase Drumet, Oliveira and Phillystran in 2011, 2010 and 2009, respectively. In addition to advances, we contributed $15.0 million to the China JV as a capital contribution during 2011, which increased our ownership interest from 51% to 65%.
50
Table of Contents
Cash Flows from Financing Activities
Cash flows from financing activities consist primarily of borrowings and repayments under revolving credit agreements, principal payments on long-term debt and activity associated with the issuance of new debt. Net borrowings (repayments) under revolving credit agreements were $44.7 million, $(10.6) million and $(19.8) million in 2011, 2010, and 2009, respectively. Principal payments on long-term debt, which includes the Term Loan and other indebtedness, were $1.8 million, $1.9 million and $5.7 million in 2011, 2010 and 2009, respectively. During 2011 and 2010, we refinanced a portion of our existing debt and issued new debt to fund acquisitions and other general corporate purposes. In June 2011, we received net proceeds of $157.1 million from the offering of $150 million aggregate principal amount of Senior Notes. A portion of the proceeds from this offering were used to prepay $132.8 million of the outstanding Term Loan balance. In May 2010, we received net proceeds of $268.2 million from the Senior Notes offering. The proceeds from this offering were used, in part, to redeem all of the outstanding $160.0 million 11% Senior Notes and pay the $3.2 million call premium associated with this early extinguishment. In November 2010, the Company borrowed an additional $65.0 million under the Term Loan to repay the outstanding amount under the Revolving Credit Agreement and for general corporate purposes. Associated with the 2011 and 2010 debt activity discussed above, we paid debt issuance costs of $10.3 million and $16.6 million, respectively, of which $8.8 million and $15.0 million was capitalized, respectively.
Effect of Exchange Rates on Cash and Cash Equivalents
The 2010 increase of cash and cash equivalents due to exchange rates includes $3.2 million of realized foreign currency exchange gains on our euro-based money market and cash investments. On June 2, 2010 and September 30, 2010, our domestic operating subsidiary converted excess cash in U.S. dollars to euros of $35 million and $31 million, respectively. On November 16, 2010, these Euro-based accounts, in addition to other resources, were used to purchase Oliveira, resulting in the realized gain.
CONTRACTUAL OBLIGATIONS AND COMMITMENTS
The following table provides information regarding our contractual obligations and commitments as of December 31, 2011. Amounts payable in a currency other than the U.S. dollar have been translated using the foreign currency exchange rate in effect as of December 31, 2011. Amounts drawn under our revolving credit facilities are presented in the table based on our presentation in the financial statements. The Revolving Credit Agreement is classified as current and amounts drawn are denoted as due within one year and the Euro Facility is classified as long-term and amounts drawn are denoted as due based on the earliest contractual maturity date.
We believe we will be able to fund these obligations through cash generated from our operations, available credit facilities and refinancing or any combination thereof. Our contractual commitments will have an impact on our future liquidity.
| Payments due by period | ||||||||||||||||||||||||||||
| Total | 2012 | 2013 | 2014 | 2015 | 2016 | Thereafter | ||||||||||||||||||||||
| (dollars in thousands) | ||||||||||||||||||||||||||||
| Revolving Credit Agreement |
$ | 16,101 | $ | 16,101 | $ | — | $ | — | $ | — | $ | — | $ | — | ||||||||||||||
| Long-term debt |
581,537 | 13,416 | 8,898 | 133,871 | 94 | 94 | 425,164 | |||||||||||||||||||||
| Interest on long-term debt (1) |
230,554 | 46,894 | 46,844 | 41,063 | 40,375 | 40,375 | 15,003 | |||||||||||||||||||||
| Capital lease obligations |
10,966 | 4,679 | 3,268 | 888 | 1,419 | 201 | 511 | |||||||||||||||||||||
| Operating lease obligations |
19,808 | 4,534 | 4,057 | 3,686 | 3,154 | 2,330 | 2,047 | |||||||||||||||||||||
| Pension & post-employment benefits |
4,570 | 389 | 376 | 409 | 406 | 432 | 2,558 | |||||||||||||||||||||
| Acquisition installment payments (2) |
9,802 | 9,802 | — | — | — | — | — | |||||||||||||||||||||
|
|
|
|
|
|
|
|
|
|
|
|
|
|
|
|||||||||||||||
| Total contractual obligations |
$ | 873,338 | $ | 95,815 | $ | 63,443 | $ | 179,917 | $ | 45,448 | $ | 43,432 | $ | 445,283 | ||||||||||||||
|
|
|
|
|
|
|
|
|
|
|
|
|
|
|
|||||||||||||||
51
Table of Contents
| (1) | Amounts include contractual interest payments using the interest rate as of December 31, 2011 applicable to our variable interest debt instruments and stated fixed rates for all other debt instruments. |
| (2) | On July 18, 2011, we acquired Drumet for an aggregate purchase price equivalent to approximately $62.4 million using the exchange rates in effect at closing. The purchase price is to be paid in three installments. The installation payment due on December 31, 2011 was paid in January 2012 and the remaining installment of €4.3 million is payable on July 31, 2012. |
Income Taxes. Due to the uncertainty with respect to the timing of cash payments, the table above excludes unrecognized tax benefits. These unrecognized tax benefits of $18.0 million are classified on our consolidated balance sheets in Other noncurrent accrued liabilities and Noncurrent deferred income tax liabilities. We do not expect to make significant payments on these liabilities within the next year. For further information, refer to Note 14—“Income Taxes” to our consolidated financial statements in Item 8, Financial Statements and Supplementary Data of this annual report.
Off-balance Sheet Arrangements
Other than the commitments discussed above, we do not have off-balance sheet debt. We do not have any material transactions, arrangements, obligations (including contingent obligations) or other relationships with unconsolidated entities or other persons, as defined by Item 303(a) (4) of Regulation S-K under the Securities Exchange Act of 1934, as amended, that have or are reasonably likely to have a material current or future impact on our financial condition, results of operations, liquidity, capital expenditures, capital resources or significant components of revenues or expenses.
CRITICAL ACCOUNTING POLICIES
Our consolidated financial statements are prepared in accordance with accounting principles generally accepted in the United States (“U.S. GAAP”), which requires us to make judgments, assumptions and estimates that affect the amounts reported. The judgments, assumptions and estimates used by management are based on our historical experiences, current trends and understanding of current facts and circumstances. However, actual results could differ from our judgments, assumptions and estimates, and such differences could be material. Some of our accounting estimates are considered critical as they are both important to the portrayal of our financial condition and results, and require management to make significant, subjective and complex judgments. We believe the following accounting estimates are most critical to aid in fully understanding and evaluating our results.
Inventory valuation—We periodically evaluate the carrying value of our inventory. This evaluation includes assessing the adequacy of allowances to cover losses in the normal course of operations, providing for excess and obsolete inventory and ensuring that inventory is valued at the lower of cost or estimated net realizable value. Our evaluation considers such factors as the cost of inventory, future demand, our historical experience and market conditions. In assessing the realization of inventory values, we are required to make judgments and estimates regarding future market conditions. Because of the subjective nature of these judgments and estimates, it is reasonably likely that actual outcomes will differ from our estimates. Adjustments to these reserves may be required if actual market conditions for our products are substantially different than the assumptions underlying our estimates.
Impairment of property, plant and equipment and finite-lived intangible assets—We evaluate the recoverability of property, plant and equipment and finite-lived intangible assets for impairment whenever events or circumstances indicate that the carrying amount of an asset or asset group may not be recoverable. On a quarterly basis, we review our long-lived asset groups for indicators such as a significant decrease in the market price of an asset group or a significant adverse change in the manner in which we are using an asset group or its physical condition. For purposes of this test, we group long-lived assets at the lowest level of identifiable cash flows, which we have determined to be our five reporting units. For purposes of impairment testing, our asset
52
Table of Contents
groups for analysis of impairment of property, plant and equipment are defined as our operating segments. Refer to Note—17 “Segment Reporting” to our consolidated financial statements included in Item 8, Financial Statements and Supplementary Data of this annual report for a description of our five operating segments. As our products are primarily sold through internal distribution facilities and are indistinguishable between manufacturing facilities, we are unable to perform this test by individual manufacturing facility. The recoverability of the carrying value is tested by estimating the undiscounted future cash flows anticipated to be generated by the particular asset(s) being tested for impairment. When determining future cash flow estimates, we consider historical results adjusted to reflect current and anticipated operating conditions. Estimating future cash flows requires significant judgment by management in such areas as future economic conditions, industry-specific conditions, product pricing and necessary capital expenditures. The use of different assumptions or estimates for future cash flows could produce different impairment amounts (or none at all) for property, plant and equipment and finite-lived intangible assets. If the carrying amount exceeds its estimated undiscounted net cash flows, the asset’s carrying amount is reduced to its estimated fair value. The fair value is determined by discounting the estimated future cash flows using the appropriate discount rate for the asset or asset groups within the reporting unit.
Impairment of indefinite-lived intangible assets—Annually or whenever events or changes in circumstances indicate that impairment may exist, we test indefinite-lived intangible assets for impairment. The impairment test for indefinite-lived intangible assets consists of a comparison of the fair value of a group of indefinite-lived intangible assets with the group’s carrying value. If the carrying amount of the group exceeds its fair value, an impairment loss is recognized in an amount equal to that excess.
We utilize a “relief from royalty” methodology in evaluating impairment of our indefinite-lived trade names. The methodology determines the fair value of each trade name through use of a discounted cash flow model that incorporates an estimated royalty rate we would be able to charge a third party for the use of the particular trade name. When determining the future cash flow estimates, we must estimate future sales and a fair market royalty rate for each applicable brand and an appropriate discount rate to measure the present value of the anticipated cash flows. Estimating future sales requires significant judgment by management in such areas as future economic conditions, product pricing and consumer trends. The use of different assumptions or estimates from the above mentioned factors could produce different impairment amounts or none at all for indefinite-lived intangible assets.
Recoverability of goodwill—Annually or whenever events or changes in circumstances indicate that impairment may exist, we test goodwill for impairment. In September 2011, the Financial Accounting Standards Board updated its guidance on the annual testing of goodwill for impairment to allow companies to first assess qualitative factors to determine whether it is more likely than not that the fair value of a reporting unit is less than its carrying amount as a basis of determining whether it is necessary to perform the two-step goodwill impairment test required under the current accounting standards. Factors considered in the qualitative assessment include but are not limited to macroeconomic conditions, industry and market considerations, internal cost factors, the overall financial performance of the reporting unit compared to operating plans, and the results of past impairment tests. If an entity concludes that it is more likely than not that a reporting unit’s fair value is less than its carrying amount, it is required to perform step one of the two-step goodwill impairment test. The first step of the test compares the carrying value of a reporting unit, including goodwill, with its fair value. If the carrying value of a reporting unit exceeds its fair value, the second step of the test to determine the amount of goodwill impairment loss to be recognized is completed. We estimate a fair value for each of our five reporting units and compare this value to the carrying value of the net assets, including the goodwill, for each reporting unit to determine if any impairment is necessary.
In 2011, the Company elected to early adopt the provisions of Accounting Standards Update (ASU) 2011-08. Accordingly, the Company performed a qualitative assessment for four of the five reporting units. There was no assessment of the Polish reporting unit as no goodwill was recognized as part of the fair value assessment of this reporting unit, which was acquired on July 18, 2011. As a result of the qualitative assessment, the Company concluded that it was more likely than not that there was no impairment to the goodwill for any of
53
Table of Contents
our reporting units other than our recently acquired Portugal reporting unit. Qualitative factors considered in reaching this conclusion for the Portugal unit included the following factors: the business was recently acquired; the financial results were below plan; and certain adverse macroeconomic factors were impacting the region in which it operates. Accordingly, a step one evaluation of the fair market value of the Portugal reporting unit was performed. The Company developed an estimate of the fair value for this reporting unit using both a market approach and an income approach (Level 3 inputs per the fair value hierarchy). We relied on a number of factors when completing impairment assessment including a review of discounted future cash flows, discount rate, royalty rates and weighted average cost of capital. When determining future cash flow estimates, we consider historical results adjusted to reflect current and anticipated operating conditions. Estimating future cash flows requires significant judgment by management in such areas as future economic conditions, industry-specific conditions, product pricing and necessary capital expenditures. In determining an appropriate discount rate to apply to the estimated future cash flows, we consider the current interest rate environment and an estimated cost of capital.
The use of different assumptions or estimates from the above mentioned factors could produce different impairment amounts or none at all for indefinite-lived intangible assets and goodwill. At December 31, 2011, the fair value of the Portugal reporting unit exceeded the book value by approximately 10%. The fair value for each of the remaining reporting units substantially exceeds their carrying value.
Investment in the China Joint Venture—We review our investment in the China JV for impairment whenever events or changes in business circumstances indicate that the carrying amount of the investment may not be fully recoverable. Evidence of a loss in value that is other than temporary might include the absence of an ability to recover the carrying amount of the investment, the inability of the investee to sustain an earnings capacity that would justify the carrying amount of the investment, or estimated sales proceeds that are insufficient to recover the carrying amount of the investment. Management’s assessment as to whether any decline in value is other than temporary is based on our ability and intent to hold the investment and whether evidence indicating the carrying value of the investment is recoverable within a reasonable period of time outweighs evidence to the contrary. Management considers our investment to be a strategic long-term investment. Therefore, management completes its assessment with a long-term viewpoint. If the fair value of the investment is determined to be less than the carrying value and the decline in value is considered to be other than temporary, an appropriate write-down is recorded based on the excess of the carrying value over the best estimate of fair value of the investment.
The Company performed an assessment of the fair value of our investment in the China JV at December 31, 2011 and 2010 and recorded impairment charges of $6.6 million and $7.5 million, respectively, in these years because the fair value of the investment was below the carrying value.
We performed a valuation as of December 31, 2011 using a combination of the income and market approach. Under the income approach, we performed a discounted cash flow analysis and determined that the discounted cash flows were not adequate to support the equity value after taking into account the non-recourse debt in the existing capital structure. Under the market approach, we appraised the underlying real and personal property held by the China JV to determine if the fair value of the assets minus the non-recourse debt in the existing capital structure was greater than the carrying amount of our investment. Both of these approaches indicated that the fair value of our equity investment was impaired to zero at December 31, 2011. Changing the material assumptions in the fair value calculation by 10% would still result in an impairment of the investment to zero.
At December 31, 2010, we performed a valuation using a combination of the market approach and cost approach to determine the fair value of our investment in the China JV. Under the market approach, we estimated the fair value based on our negotiations with the China JV partner regarding the $15 million equity investment, which was contributed in 2011. Under the cost approach, we estimated fair value based on the amount that currently would be required to acquire or construct the underlying assets of the China JV. In assigning a weighting to these two fair value methods, we applied a higher percentage to the cost approach as the market
54
Table of Contents
approach was subject to factors which were beyond our control, including the Chinese government approval of our additional equity investment. Judgment used in this valuation included, but was not limited to the arm’s length nature of the upcoming equity investment and the replacement cost of the underlying assets of the China JV. Changing any of these material assumptions by 10%, such as assigning a higher weighting to the market approach or estimating the replacement cost of the underlying assets of the China JV, possible impairment would have ranged from $5.2 million to $9.3 million.
Valuation of intangibles associated with business combinations—We are required to estimate the fair value and useful lives of assets acquired and liabilities assumed, including intangible assets, in a business combination. Judgment used in the valuation of intangible assets can include the cash flows that an asset is expected to generate per management’s projections, royalty rates, growth rates, obsolescence curve rates, present value factors, tax shield benefit factors, the weighted average cost of capital and discount rates. We believe that the assumptions made are comparable to those that market participants would use in making estimates of fair value. Additionally, determining the expected life of an intangible asset requires management’s judgment and is based on the evaluation of various factors, including the competitive environment and customer history. We have determined most of our trade names to have indefinite lives because we plan to use these names into perpetuity. If actual results are not consistent with our estimates, we may be exposed to impairment charges.
Income taxes—Our income tax expense is based on our income and statutory tax rates in the various jurisdictions in which we operate. Tax laws are complex and subject to different interpretations by the taxpayer and respective governmental taxing authorities. Significant judgment is required in determining our income tax expense and in evaluating our tax positions, including evaluating uncertainties. Management reviews our tax positions quarterly and adjusts the balances as new information becomes available. Deferred income tax assets represent amounts available to reduce income taxes payable on taxable income in future years. Such assets arise because of temporary differences between the financial reporting and tax bases of assets and liabilities, as well as from net operating loss and tax credit carryforwards. Deferred tax assets realizable in future periods are recorded net of a valuation allowance based on an assessment of each entity’s, or group of entities, ability to generate sufficient taxable income within an appropriate period, in a specific tax jurisdiction. To the extent management does not consider it more likely than not that a deferred tax asset will be recovered, a valuation allowance is established. Management considers the following in making this assessment: 1) future reversals of existing taxable temporary differences, 2) future taxable income exclusive of reversing temporary differences, 3) taxable income in prior carryback years and 4) tax planning strategies that would, if necessary, be implemented. Some or all of these adjustments are subject to review by the taxing authorities. If one or more of the taxing authorities were to successfully challenge our right to realize some or all of the tax benefit we have recorded, and we were unable to realize this benefit, it could have a material and adverse effect on our financial results and cash flows.
As more fully described in Note 14—“Income Taxes” to our consolidated financial statements in Item 8, Financial Statements and Supplementary Data, of this annual report, gross deferred tax assets were $57.4 million and $46.3 million as of December 31, 2011 and 2010, respectively, partially offset by a valuation allowance of $18.1 million and $5.0 million, respectively. The gross deferred tax assets generated in 2011 and 2010 primarily related to limitations on interest deductions in the U.S. and losses recognized in the U.S. and Portugal. The tax benefits arising from losses in the U.S. and Portugal and the tax benefit related to the interest deductions are partially offset by a valuation allowance as we do not expect to realize these tax benefits. Management evaluates the recoverability of these future tax deductions by reviewing book earnings for the prior three years as well as future expected taxable income by jurisdiction. Future taxable income is considered from all sources, including the scheduling of the reversal of taxable temporary differences, forecasted operating earnings and available tax planning strategies. These estimates of future taxable income inherently require significant judgment. Management uses historical experience and short and long-range business forecasts to develop such estimates. In jurisdictions where there is a three year historical cumulative book loss, management does not rely on future book income projections to determine if a deferred tax asset will be realized because this is considered to be a significant piece of negative evidence. For these jurisdictions, only the future reversals of existing temporary differences as well as tax planning strategies that would be implemented, if necessary, are considered to determine if deferred tax assets will be realized.
55
Table of Contents
Note 2—“Summary of Significant Accounting Policies” to our consolidated financial statements in Item 8, Financial Statements and Supplementary Data, of this annual report expands upon discussion of our accounting policies.
RECENTLY ISSUED ACCOUNTING STANDARDS
Refer to Note 2—“Summary of Significant Accounting Policies” to our consolidated financial statements included in Item 8, Financial Statements and Supplementary Data of this annual report for a description of the recently issued accounting pronouncements.
| Item 7A. | Quantitative and Qualitative Disclosures About Market Risk |
Market risk is the potential economic loss arising from adverse changes in market factors. We utilize various financial instruments that have certain inherent market risks, but these instruments have not been entered into for trading or speculative purposes. Our exposure to financial market risks results primarily from fluctuations in interest rates, commodity prices and foreign currency exchange rates.
Interest Rate Risk. Variable-rate indebtedness totaled $143.9 million at December 31, 2011. Our Revolving Credit Agreement, Euro Facility and Term Loan Agreement contain variable rate debt which accrues interest based on target interest indexes (LIBOR, Euribor or an alternative base rate) subject to certain floors, plus an applicable spread as set forth in the credit agreements. Our variable rate debt may be sensitive to fluctuations in interest rates. In our present condition, a hypothetical 10% increase in the LIBOR rate would not result in any additional interest expense as the current variable rate would still be below the 1.75% LIBOR floor on our Term Loan balance. Also, a hypothetical 10% increase in the LIBOR or Euribor on our borrowings under revolving credit facilities would not have a material impact on interest expense assuming currently outstanding borrowing amounts. Actual changes in market prices may differ from hypothetical changes. In practice, as markets move, we may manage our risk by adjusting hedging strategies as appropriate.
Commodity Price Risk. In our manufacturing operations, we rely heavily on certain raw materials (principally high carbon steel rod and synthetic fibers, such as polyethylene and polypropylene) and energy sources (principally, electricity, natural gas and propane). We are exposed to changes in the prices of these raw materials and energy sources due to, among other things, fluctuations in foreign and domestic production capacity, availability, consumption and foreign currency rates. Our raw material and energy costs are unpredictable and subject to a variety of factors outside our control. We monitor the cost of our raw materials and pass along price increases and decreases accordingly. We intend to continue to pass through these price changes for the foreseeable future.
Foreign Currency Exchange Rate Risk. The consolidated financial statements are prepared in U.S. dollars. The assets and liabilities of our foreign subsidiaries are denominated in foreign currencies, which create exposure to changes in foreign currency exchange rates. Our primary exposure to foreign currency exchange fluctuations are the U.S. dollar/euro and U.S. dollar/złoty related to subsidiaries with intercompany loans and investments denominated in currencies other than their local currency. At December 31, 2011, we had intercompany loans that required remeasurement in the aggregate amounts of $174.0 million. A hypothetical 10% increase in the U.S. dollar to the euro exchange rate would result in a foreign currency exchange gain of approximately $6.9 million compared to the actual loss recorded of $3.0 million. A hypothetical 10% decrease in the exchange rate would result in a greater foreign currency exchange loss of approximately $17.0 million. A hypothetical 10% increase in the U.S. dollar to the Polish złoty exchange rate would result in a foreign currency exchange gain of approximately $2.1 million compared to the actual loss recorded of approximately $8.4 million. A hypothetical 10% decrease in the exchange rate would result in a greater foreign currency exchange loss of approximately $8.8 million. We also have some exposure to foreign exchange fluctuations related to the Mexican peso/U.S. dollar on an intercompany loan, but the overall impact on the consolidated statements of operations is insignificant. We manage this risk by monitoring our foreign currency denominated cash inflows and outflows. We are unable to hedge this risk as we are parties on both sides of the transaction.
56
Table of Contents
| Item 8. | Financial Statements and Supplementary Data |
57
Table of Contents
Report of Independent Registered Public Accounting Firm
The Board of Directors
WireCo WorldGroup (Cayman) Inc.:
We have audited the accompanying consolidated balance sheets of WireCo WorldGroup (Cayman) Inc. and subsidiaries (the “Company”) as of December 31, 2011 and 2010, and the related consolidated statements of operations, comprehensive income (loss), and stockholders’ equity and cash flows for each of the years in the three-year period ended December 31, 2011. These consolidated financial statements are the responsibility of the Company’s management. Our responsibility is to express an opinion on these consolidated financial statements based on our audits.
We conducted our audits in accordance with the standards of the Public Company Accounting Oversight Board (United States). Those standards require that we plan and perform the audit to obtain reasonable assurance about whether the financial statements are free of material misstatement. An audit includes examining, on a test basis, evidence supporting the amounts and disclosures in the financial statements. An audit also includes assessing the accounting principles used and significant estimates made by management, as well as evaluating the overall financial statement presentation. We believe that our audits provide a reasonable basis for our opinion.
In our opinion, the consolidated financial statements referred to above present fairly, in all material respects, the financial position of WireCo WorldGroup (Cayman) Inc. and subsidiaries as of December 31, 2011 and 2010, and the results of their operations and their cash flows for each of the years in the three-year period ended December 31, 2011, in conformity with U.S. generally accepted accounting principles.
/s/ KPMG LLP
Kansas City, Missouri
March 16, 2012
58
Table of Contents
WIRECO WORLDGROUP (CAYMAN) INC. AND SUBSIDIARIES
Consolidated Balance Sheets
December 31, 2011 and 2010
(dollars in thousands, except per share data)
| 2011 | 2010 | |||||||
| Assets | ||||||||
| Current assets: |
||||||||
| Cash and cash equivalents |
$ | 27,663 | $ | 53,880 | ||||
| Accounts receivable, less allowance for doubtful accounts of $2,294 and $2,446, respectively |
108,607 | 86,960 | ||||||
| Other receivables |
3,499 | 3,921 | ||||||
| Inventories, net |
187,544 | 141,551 | ||||||
| Prepaid expenses and other current assets |
6,919 | 9,942 | ||||||
| Deferred income taxes |
3,422 | 6,729 | ||||||
|
|
|
|
|
|||||
| Total current assets |
337,654 | 302,983 | ||||||
| Property, plant and equipment, net |
236,146 | 200,588 | ||||||
| Intangible assets, net |
109,773 | 113,167 | ||||||
| Goodwill |
168,831 | 170,150 | ||||||
| Investment in and advances to the China joint venture |
— | 14,113 | ||||||
| Deferred financing fees, net |
19,192 | 19,366 | ||||||
| Deferred income taxes |
3,437 | — | ||||||
| Other noncurrent assets |
10,670 | 2,039 | ||||||
|
|
|
|
|
|||||
| Total assets |
$ | 885,703 | $ | 822,406 | ||||
|
|
|
|
|
|||||
| Liabilities and Stockholders’ Equity | ||||||||
| Current liabilities: |
||||||||
| Borrowings under revolving credit agreement |
$ | 16,101 | $ | — | ||||
| Current maturities of long-term debt |
13,416 | 2,520 | ||||||
| Interest payable |
6,481 | 3,859 | ||||||
| Accounts payable |
59,741 | 43,533 | ||||||
| Accrued compensation and benefits |
14,765 | 6,808 | ||||||
| Deferred income taxes |
24 | 1,107 | ||||||
| Acquisition installment payments |
9,802 | — | ||||||
| Other accrued liabilities |
14,617 | 18,688 | ||||||
|
|
|
|
|
|||||
| Total current liabilities |
134,947 | 76,515 | ||||||
| Long-term debt, excluding current maturities |
565,044 | 500,248 | ||||||
| Deferred income taxes |
28,963 | 29,104 | ||||||
| Other accrued liabilities |
27,213 | 21,470 | ||||||
|
|
|
|
|
|||||
| Total liabilities |
756,167 | 627,337 | ||||||
|
|
|
|
|
|||||
| Commitments and contingencies (Note 16) |
||||||||
| Stockholders’ equity: |
||||||||
| Common shares, $0.01 par value. Authorized 3,000,000 shares; 2,011,411 shares issued at December 31, 2011 and 2010 |
20 | 20 | ||||||
| Additional paid-in capital |
216,924 | 213,083 | ||||||
| Accumulated other comprehensive loss |
(34,392 | ) | (15,976 | ) | ||||
| Accumulated deficit |
(52,886 | ) | (3,321 | ) | ||||
|
|
|
|
|
|||||
| Total stockholders’ equity attributable to WireCo WorldGroup (Cayman) Inc. |
129,666 | 193,806 | ||||||
| Non-controlling interests |
(130 | ) | 1,263 | |||||
|
|
|
|
|
|||||
| Total stockholders’ equity |
129,536 | 195,069 | ||||||
|
|
|
|
|
|||||
| Total liabilities and stockholders’ equity |
$ | 885,703 | $ | 822,406 | ||||
|
|
|
|
|
|||||
See accompanying notes to consolidated financial statements.
59
Table of Contents
WIRECO WORLDGROUP (CAYMAN) INC. AND SUBSIDIARIES
Consolidated Statements of Operations
Years ended December 31, 2011, 2010 and 2009
(dollars in thousands)
| 2011 | 2010 | 2009 | ||||||||||
| Net sales |
$ | 604,927 | $ | 447,678 | $ | 383,253 | ||||||
| Cost of sales |
(446,354 | ) | (329,147 | ) | (294,360 | ) | ||||||
|
|
|
|
|
|
|
|||||||
| Gross profit |
158,573 | 118,531 | 88,893 | |||||||||
|
|
|
|
|
|
|
|||||||
| Other operating expenses: |
||||||||||||
| Selling expenses |
(26,067 | ) | (17,520 | ) | (10,263 | ) | ||||||
| Administrative expenses |
(62,330 | ) | (47,221 | ) | (40,570 | ) | ||||||
| Amortization expense |
(13,167 | ) | (12,436 | ) | (12,007 | ) | ||||||
|
|
|
|
|
|
|
|||||||
| Total other operating expenses |
(101,564 | ) | (77,177 | ) | (62,840 | ) | ||||||
|
|
|
|
|
|
|
|||||||
| Operating income |
57,009 | 41,354 | 26,053 | |||||||||
|
|
|
|
|
|
|
|||||||
| Other income (expense): |
||||||||||||
| Interest expense, net |
(51,063 | ) | (33,720 | ) | (24,718 | ) | ||||||
| Loss on investment in and advances to the China joint venture |
(33,015 | ) | (16,726 | ) | (3,703 | ) | ||||||
| Foreign currency exchange gains (losses) |
(12,445 | ) | (3,050 | ) | 3,268 | |||||||
| Loss on extinguishment of long-term debt |
(5,654 | ) | (6,520 | ) | — | |||||||
| Other expense, net |
(523 | ) | (1,073 | ) | (1,249 | ) | ||||||
|
|
|
|
|
|
|
|||||||
| Other expense, net |
(102,700 | ) | (61,089 | ) | (26,402 | ) | ||||||
|
|
|
|
|
|
|
|||||||
| Loss before income taxes |
(45,691 | ) | (19,735 | ) | (349 | ) | ||||||
| Income tax benefit (expense) |
(5,016 | ) | 13,170 | 4,435 | ||||||||
|
|
|
|
|
|
|
|||||||
| Net income (loss) |
(50,707 | ) | (6,565 | ) | 4,086 | |||||||
| Less: Net loss attributable to non-controlling interests |
(1,142 | ) | (310 | ) | (1,360 | ) | ||||||
|
|
|
|
|
|
|
|||||||
| Net income (loss) attributable to WireCo WorldGroup (Cayman) Inc. |
$ | (49,565 | ) | $ | (6,255 | ) | $ | 5,446 | ||||
|
|
|
|
|
|
|
|||||||
See accompanying notes to consolidated financial statements.
60
Table of Contents
WIRECO WORLDGROUP (CAYMAN) INC. AND SUBSIDIARIES
Consolidated Statements of Comprehensive Income (Loss)
Years ended December 31, 2011, 2010 and 2009
(dollars in thousands)
| 2011 | 2010 | 2009 | ||||||||||
| Net income (loss) including non-controlling interests |
$ | (50,707 | ) | $ | (6,565 | ) | $ | 4,086 | ||||
| Other comprehensive income (loss): |
||||||||||||
| Foreign currency translation gain (loss) |
(17,620 | ) | 3,166 | 3,254 | ||||||||
| Pension and other post-employment benefits |
(1,047 | ) | — | — | ||||||||
|
|
|
|
|
|
|
|||||||
| Comprehensive income (loss) including non-controlling interests |
(69,374 | ) | (3,399 | ) | 7,340 | |||||||
| Less: Comprehensive income (loss) attributable to non-controlling interests |
(251 | ) | 103 | 501 | ||||||||
|
|
|
|
|
|
|
|||||||
| Comprehensive income (loss) attributable to WireCo WorldGroup (Cayman) Inc. |
$ | (69,123 | ) | $ | (3,502 | ) | $ | 6,839 | ||||
|
|
|
|
|
|
|
|||||||
See accompanying notes to consolidated financial statements.
61
Table of Contents
WIRECO WORLDGROUP (CAYMAN) INC. AND SUBSIDIARIES
Consolidated Statements of Stockholders’ Equity
Years ended December 31, 2011, 2010 and 2009
(dollars in thousands)
| Common stock | Accumulated other comprehensive loss |
Retained earnings (Accumulated deficit) |
WireCo WorldGroup (Cayman) Inc. stockholders’ equity |
Non-controlling interests |
Total stockholders’ equity |
|||||||||||||||||||||||
| Par value | Additional paid-in capital |
|||||||||||||||||||||||||||
| Balance, December 31, 2008 |
$ | 20 | $ | 206,888 | $ | (21,792 | ) | $ | (2,512 | ) | $ | 182,604 | $ | 2,329 | $ | 184,933 | ||||||||||||
| Amortization of share-based compensation |
— | 3,034 | — | — | 3,034 | — | 3,034 | |||||||||||||||||||||
| Other comprehensive income |
— | — | 2,753 | — | 2,753 | 501 | 3,254 | |||||||||||||||||||||
| Net income (loss) |
— | — | — | 5,446 | 5,446 | (1,360 | ) | 4,086 | ||||||||||||||||||||
|
|
|
|
|
|
|
|
|
|
|
|
|
|
|
|||||||||||||||
| Balance, December 31, 2009 |
20 | 209,922 | (19,039 | ) | 2,934 | 193,837 | 1,470 | 195,307 | ||||||||||||||||||||
| Amortization of share-based compensation |
— | 3,161 | — | — | 3,161 | — | 3,161 | |||||||||||||||||||||
| Other comprehensive income |
— | — | 3,063 | — | 3,063 | 103 | 3,166 | |||||||||||||||||||||
| Net loss |
— | — | — | (6,255 | ) | (6,255 | ) | (310 | ) | (6,565 | ) | |||||||||||||||||
|
|
|
|
|
|
|
|
|
|
|
|
|
|
|
|||||||||||||||
| Balance, December 31, 2010 |
20 | 213,083 | (15,976 | ) | (3,321 | ) | 193,806 | 1,263 | 195,069 | |||||||||||||||||||
| Amortization of share-based compensation |
— | 3,841 | — | — | 3,841 | — | 3,841 | |||||||||||||||||||||
| Other comprehensive loss |
— | — | (18,416 | ) | — | (18,416 | ) | (251 | ) | (18,667 | ) | |||||||||||||||||
| Net loss |
— | — | — | (49,565 | ) | (49,565 | ) | (1,142 | ) | (50,707 | ) | |||||||||||||||||
|
|
|
|
|
|
|
|
|
|
|
|
|
|
|
|||||||||||||||
| Balance, December 31, 2011 |
$ | 20 | $ | 216,924 | $ | (34,392 | ) | $ | (52,886 | ) | $ | 129,666 | $ | (130 | ) | $ | 129,536 | |||||||||||
|
|
|
|
|
|
|
|
|
|
|
|
|
|
|
|||||||||||||||
See accompanying notes to consolidated financial statements.
| 62 |
Table of Contents
WIRECO WORLDGROUP (CAYMAN) INC. AND SUBSIDIARIES
Consolidated Statements of Cash Flows
Years ended December 31, 2011, 2010 and 2009
(dollars in thousands)
| 2011 | 2010 | 2009 | ||||||||||
| Cash flows from operating activities: |
||||||||||||
| Net income (loss) |
$ | (50,707 | ) | $ | (6,565 | ) | $ | 4,086 | ||||
| Adjustments to reconcile net income (loss) to net cash provided by (used in) operating activities: |
||||||||||||
| Depreciation and amortization |
39,224 | 34,247 | 31,543 | |||||||||
| Amortization of debt issuance costs and discounts/premium |
6,271 | 3,430 | 2,145 | |||||||||
| Loss on extinguishment of long-term debt |
5,654 | 6,520 | — | |||||||||
| Loss on investment in and advances to the China joint venture |
33,015 | 16,726 | 3,703 | |||||||||
| Shared-based compensation |
3,841 | 3,161 | 3,034 | |||||||||
| Loss on equipment disposals |
185 | — | — | |||||||||
| Unrealized foreign currency exchange loss (gain) on intercompany loans and other |
11,866 | 5,598 | (2,530 | ) | ||||||||
| Realized foreign currency transaction gain on investments |
— | (3,229 | ) | — | ||||||||
| Changes in deferred income taxes |
(5,223 | ) | (21,453 | ) | (13,270 | ) | ||||||
| Changes in assets and liabilities, net of purchase accounting impact: |
||||||||||||
| Accounts receivable |
(14,811 | ) | (12,113 | ) | 28,167 | |||||||
| Inventories |
(32,752 | ) | (21,512 | ) | 35,172 | |||||||
| Prepaids and other assets |
4,368 | (7,935 | ) | (3,905 | ) | |||||||
| Interest payable |
2,613 | (2,008 | ) | (96 | ) | |||||||
| Accounts payable |
10,790 | 13,336 | (18,777 | ) | ||||||||
| Other accrued liabilities |
(3,681 | ) | (12,554 | ) | 397 | |||||||
|
|
|
|
|
|
|
|||||||
| Net cash provided by (used in) operating activities |
10,653 | (4,351 | ) | 69,669 | ||||||||
|
|
|
|
|
|
|
|||||||
| Cash flows from investing activities: |
||||||||||||
| Investment in and advances to China joint venture |
(17,560 | ) | (2,121 | ) | (547 | ) | ||||||
| Capitalization of interest paid on investment in China joint venture |
— | (1,416 | ) | (2,230 | ) | |||||||
| Acquisition of businesses, net of cash acquired |
(51,813 | ) | (80,888 | ) | (15,251 | ) | ||||||
| Capital expenditures |
(23,962 | ) | (17,901 | ) | (15,272 | ) | ||||||
|
|
|
|
|
|
|
|||||||
| Net cash used in investing activities |
(93,335 | ) | (102,326 | ) | (33,300 | ) | ||||||
|
|
|
|
|
|
|
|||||||
| Cash flows from financing activities: |
||||||||||||
| Proceeds from long-term debt borrowing |
— | 65,000 | — | |||||||||
| Principal payments on long-term debt |
(1,766 | ) | (1,897 | ) | (5,671 | ) | ||||||
| Proceeds from issuance of senior notes, including discount/premium |
157,125 | 268,205 | — | |||||||||
| Debt issuance costs paid |
(8,790 | ) | (14,988 | ) | — | |||||||
| Retirement of long-term debt |
(132,814 | ) | (163,200 | ) | — | |||||||
| Amendment fees paid to third-parties |
(1,495 | ) | (1,580 | ) | — | |||||||
| Net borrowings (repayments) under revolving credit agreements |
44,696 | (10,556 | ) | (19,751 | ) | |||||||
|
|
|
|
|
|
|
|||||||
| Net cash provided by (used in) financing activities |
56,956 | 140,984 | (25,422 | ) | ||||||||
|
|
|
|
|
|
|
|||||||
| Effect of exchange rates on cash and cash equivalents |
(491 | ) | 3,245 | (430 | ) | |||||||
|
|
|
|
|
|
|
|||||||
| Increase (decrease) in cash and cash equivalents |
(26,217 | ) | 37,552 | 10,517 | ||||||||
| Cash and cash equivalents, beginning of year |
53,880 | 16,328 | 5,811 | |||||||||
|
|
|
|
|
|
|
|||||||
| Cash and cash equivalents, end of year |
$ | 27,663 | $ | 53,880 | $ | 16,328 | ||||||
|
|
|
|
|
|
|
|||||||
| Supplemental Disclosure of Cash Flow Information: |
||||||||||||
| Cash paid for interest, net of interest capitalized |
$ | 43,462 | $ | 34,772 | $ | 24,908 | ||||||
| Cash paid for income taxes, net of refunds |
10,816 | 15,632 | 2,004 | |||||||||
| Debt assumed from business acquired |
27,692 | — | — | |||||||||
| Capital leases assumed from business acquired |
10,701 | — | — | |||||||||
| Acquisition installment payments |
10,639 | — | — | |||||||||
See accompanying notes to consolidated financial statements.
63
Table of Contents
WIRECO WORLDGROUP (CAYMAN) INC. AND SUBSIDIARIES
Notes to Consolidated Financial Statements
(all currencies in thousands, except per share data)
| (1) | Organization and Description of the Business |
WireCo WorldGroup (Cayman) Inc., an exempted company incorporated under the laws of the Cayman Islands, is a holding company. WireCo WorldGroup (Cayman) Inc. and its subsidiaries (collectively referred to as the Company) manufacture and sell wire ropes, electromechanical cables, synthetic ropes, fabricated products and specialty wire to various end markets including crane, oil and gas, mining, fishing, marine, structures and general industrial. These products are marketed under well-known brands such as Union®, Camesa®, MacWhyte®, CASAR®, Wireline Works™, U.S. Reel™, Phillystran®, Oliveira™, Drumet® and Union International. The Company participates in a joint venture (“China JV”) with WISCO Wuhan Jiangbei Iron and Steel Ltd. for the manufacturing, marketing and sale of specialty wire and wire ropes. The Company has manufacturing locations in North America and Europe, and the China JV has a manufacturing facility in China.
| (2) | Summary of Significant Accounting Policies |
| (a) | Principles of Consolidation |
The consolidated financial statements include the accounts of the Company. As discussed below, the China JV is accounted for under the equity method and is not consolidated. All intercompany transactions and balances have been eliminated in consolidation.
| (b) | Basis of Presentation |
The consolidated financial statements have been prepared in United States (“U.S.”) dollars and in accordance with U.S. generally accepted accounting principles (“GAAP”). Non-controlling interests are presented as a component of stockholders’ equity, net income (loss) and comprehensive income (loss) for the periods presented. Non-controlling interests are representative of current and former management members owning 4.8% of the outstanding, non-voting shares of WRCA U.S. Holdings, Inc. (“US Holdings”), an indirect subsidiary of the Company. Certain amounts within the prior year have been reclassified to conform with the current year presentation. The Company separately classified Accrued compensation and benefits from the Other accrued liabilities line on the consolidated balance sheets to make the presentation comparable to 2011.
| (c) | Management Estimates |
The preparation of financial statements in conformity with U.S. GAAP requires management to make estimates and assumptions about future events relating to the reported amounts of assets and liabilities and the disclosure of contingent assets and liabilities at the date of the consolidated financial statements and the reported amounts of revenues and expenses during the reporting periods. Estimates are revised when facts and circumstances change. As such, actual results could materially differ from those estimates.
| (d) | Cash and Cash Equivalents |
Cash and all highly liquid investments with an original maturity of three months or less are classified as cash and cash equivalents.
Checks issued, but not presented to banks in excess of cash balances (“book overdrafts”), are classified within accounts payable in the accompanying consolidated balance sheets. The change in book overdrafts is reported as a component of cash flows from operating activities as they do not represent bank overdrafts or a financing activity.
64
Table of Contents
WIRECO WORLDGROUP (CAYMAN) INC. AND SUBSIDIARIES
Notes to Consolidated Financial Statements – (Continued)
(all currencies in thousands, except per share data)
| (e) | Accounts Receivable |
Accounts receivable are recorded at the invoiced amount, net of an allowance for doubtful accounts. The Company recognizes allowances for doubtful accounts to ensure accounts receivable are not overstated due to the inability or unwillingness of its customers to make required payments. The allowance is based on the specific identification of receivables the Company considers at risk and for all other customers, management considers historical losses, current aging of receivables and existing economic conditions. Account balances are charged off against the allowance for doubtful accounts after all means of collection have been exhausted and the potential for recovery is considered remote. In order to reduce the risk of the inability to collect, the Company maintains credit insurance on certain receivables.
The Company extends credit to its customers in various industries including crane, oil and gas, mining, fishing, marine, structures and general industrial. Consequently, the Company’s ability to collect the amounts due from customers may be affected by the economic conditions in these respective industries. The Company’s customers are also dispersed across a wide geographic area, mitigating any concentration of credit risk. The Company did not have any customer that generated greater than 10% of its net sales in 2011, 2010 or 2009.
Below is a rollforward of the allowance for doubtful accounts:
| Years ended December 31, | ||||||||||||
| 2011 | 2010 | 2009 | ||||||||||
| Balance at beginning of year |
$ | 2,446 | $ | 2,270 | $ | 742 | ||||||
| Bad debt expense |
515 | 753 | 1,552 | |||||||||
| Write-offs |
(566 | ) | (477 | ) | (100 | ) | ||||||
| Effect of exchange rate changes |
(101 | ) | (100 | ) | 76 | |||||||
|
|
|
|
|
|
|
|||||||
| Balance at end of year |
$ | 2,294 | $ | 2,446 | $ | 2,270 | ||||||
|
|
|
|
|
|
|
|||||||
| (f) | Inventories |
Inventories are stated at the lower of cost or market determined using the first-in, first-out (“FIFO”) method, net of reserves for obsolete and slow-moving inventory. Inventory costs include raw materials, labor and allocated manufacturing overhead.
| (g) | Property, Plant and Equipment |
Property, plant and equipment are stated at cost, less accumulated depreciation. Expenditures for additions to plant facilities, or that significantly increase productive capacity or extend useful lives, are capitalized. The cost of minor tools and equipment and repair and maintenance costs are expensed as incurred. Depreciation is calculated on a straight-line basis over the estimated useful lives of the respective classes of assets as follows:
| Asset category |
Useful life | |
| Buildings and improvements | 10 – 40 years | |
| Machinery and equipment | 5 – 20 years | |
| Transportation and other equipment | 5 – 10 years | |
| Capitalized software | 3 – 7 years | |
| Furniture, fixtures and office equipment | 3 – 5 years |
65
Table of Contents
WIRECO WORLDGROUP (CAYMAN) INC. AND SUBSIDIARIES
Notes to Consolidated Financial Statements – (Continued)
(all currencies in thousands, except per share data)
Equipment under capital leases, which are recorded at the present value of minimum lease payments, and leasehold improvements are depreciated on a straight-line basis over the estimated useful life of the asset or the life of the lease, whichever is shorter. No provision for depreciation is made on projects in process until such time as the relevant asset is complete and ready for its intended use.
Long-lived assets, such as property, plant and equipment, are reviewed for impairment whenever events or changes in business circumstances indicate that the carrying amount of an asset group may not be fully recoverable. For purposes of this test, long-lived assets are grouped at the lowest level of identifiable cash flows, which the Company has determined to be its five operating segments that reflect geographic regions, including the United States, Mexico, Germany, Portugal and Poland. Recoverability of an asset group considered to be held-and-used is determined by comparing the carrying amount of the asset to the estimated undiscounted future net cash flows expected to be generated by the use of the asset. If the carrying amount exceeds its estimated undiscounted net cash flows, the asset group’s carrying amount is reduced to its estimated fair value. The fair value is determined by discounting the estimated future cash flows using the appropriate discount rate for the asset groups. There were no impairment charges recorded during the periods presented in the consolidated statements of operations.
| (h) | Intangible Assets |
Intangible assets with finite lives are amortized on a straight-line basis over their respective estimated useful lives. Intangible assets that are subject to amortization are evaluated for impairment in accordance with the Company’s policy for long-lived assets as discussed above for property, plant and equipment. Intangible assets with indefinite lives are not amortized, but are reviewed at least annually, or more frequently as indicators warrant, for impairment. Impairment of intangible assets with indefinite lives occurs when the carrying amount of the intangible asset exceeds its fair value. The Company estimates a fair value for each of its five reporting units. For purposes of impairment testing, the Company’s reporting units are defined as its operating segments. If impaired, the asset’s carrying amount is reduced to its fair value. There were no impairment charges recorded during the periods presented in the consolidated statements of operations.
| (i) | Goodwill |
Goodwill is an asset representing the excess of the purchase price over the fair value of the net identifiable assets acquired in a business combination. Goodwill is not amortized, but instead tested for impairment at least annually, or when a triggering event occurs between annual impairment tests. In 2011, the Company early adopted Accounting Standards Update (“ASU”) 2011-08, “Intangibles – Goodwill and Other (Topic 350): Testing Goodwill for Impairment” (“ASU 2011-08”), which allows companies to perform a qualitative assessment of the fair value of its reporting units before calculating the fair value of its reporting units in step one of the two-step goodwill impairment model. The Company’s reporting units are defined as its operating segments. If, through the qualitative assessment, the Company determines that it is more likely than not that a reporting unit’s fair value is greater than its carrying value, the remaining impairment steps would be unnecessary.
An entity is required to perform step one of the two-step goodwill impairment test only if it concludes that it is more likely than not that a reporting unit’s fair value is less than its carrying amount. Under the first step, the fair value of the reporting unit is compared with its carrying value, including goodwill. The Company develops an estimate of the fair value of each reporting unit using both a market approach and an income approach (Level 3 inputs per the fair value hierarchy described later in
66
Table of Contents
WIRECO WORLDGROUP (CAYMAN) INC. AND SUBSIDIARIES
Notes to Consolidated Financial Statements – (Continued)
(all currencies in thousands, except per share data)
this note). If the fair value of the reporting unit is less than its carrying value, an indication of goodwill impairment exists for the reporting unit and the entity must perform step two of the impairment test (measurement). Under step two, an impairment loss is recognized for any excess of the carrying amount of the reporting unit’s goodwill over the implied fair value of that goodwill. The implied fair value of goodwill is determined by allocating the fair value of the reporting unit in a manner similar to a purchase price allocation and the residual fair value after this allocation is the implied fair value of the reporting unit goodwill. The Company performs its annual assessment of the recoverability of goodwill as of October 1, 2011. No impairment of goodwill was recorded for any of the periods presented in the consolidated statements of operations.
| (j) | Investment in the China Joint Venture |
The Company accounts for its 65% ownership in the China JV using the equity method of accounting, as the minority rights granted by the joint venture agreement represent substantive participation rights that preclude the Company’s ability to effectively control the joint venture’s principal business activities. Such substantive participation rights include selecting, terminating and setting the compensation of management and determining and amending financial budgets.
The Company reviews the investment for impairment whenever events or changes in business circumstances indicate that the carrying amount of the investment may not be fully recoverable. If the fair value of the investment is determined to be less than the carrying value and the decline in value is considered to be other than temporary, an appropriate write-down is recorded based on the excess of the carrying value over the fair value of the investment. For the years ended December 31, 2011 and 2010, the Company recorded an other than temporary impairment of $6,646 and $7,500, respectively. Additional details of this impairment are included in Note 7—“Investment in and Advances to the China Joint Venture”.
| (k) | Debt Issuance Costs |
For revolving debt agreements, all costs are capitalized and amortized using the straight-line method over the term of the debt instrument as additional interest expense. All fees associated with the incurrence of other indebtedness are capitalized and amortized using the effective interest method over the term of the debt instrument. For non-substantial debt modifications to debt agreements other than revolving debt agreements, only fees paid directly to the lender are capitalized and amortized using the effective interest method over the term of the debt as additional interest expense. Third-party fees associated with non-substantial debt modifications (i.e. attorney fees) are expensed as incurred in either Administrative expenses or Loss on Extinguishment of Long-term Debt depending on the facts and circumstances. Additionally, original debt issuance discounts are recorded as a direct deduction from the face amount of the debt and amortized using the effective-interest method over the term of the debt instrument as additional interest expense. Premiums are recorded as an accretion to the face amount of the debt and amortized using the effective-interest method over the term as a reduction to interest expense.
| (l) | Fair Value of Financial Instruments |
Fair value is defined as the exchange price that would be received for an asset or paid to transfer a liability (an exit price) in the principal or most advantageous market for the asset or liability in an orderly transaction between market participants on the measurement date.
67
Table of Contents
WIRECO WORLDGROUP (CAYMAN) INC. AND SUBSIDIARIES
Notes to Consolidated Financial Statements – (Continued)
(all currencies in thousands, except per share data)
The Company determines the fair values of its financial instruments based on the fair value hierarchy. The hierarchy is based upon the transparency of inputs to the valuation of an asset or liability as of the measurement date. The three levels are defined as follows:
| • | Level 1 inputs are quoted prices for identical assets or liabilities in active markets. |
| • | Level 2 inputs are quoted prices for similar assets and liabilities in active markets, quoted prices for identical or similar assets and liabilities in markets that are not active or inputs that are observable for the assets or liabilities, either directly or indirectly (such as interest rates, yield curves and prepayment speeds). |
| • | Level 3 inputs are unobservable inputs that are supported by little or no market activity. These inputs, which require significant judgment, may be internally developed using the Company’s best information and assumptions that a market participant would consider. |
Where possible, the Company maximizes the use of observable inputs and minimizes the use of unobservable inputs when measuring fair value.
| (m) | Revenue Recognition |
Revenues from the sale of inventories are recognized when the inventories are shipped and the customer takes ownership and assumes the risk of loss, collection of the revenue is probable, persuasive evidence of an arrangement exists and the sales price is fixed and determinable. An allowance for sales returns is recorded as a reduction to revenue.
Shipping and handling amounts charged to customers to deliver product are included in net sales and the associated shipping and handling costs are included in cost of sales.
Sales taxes collected from customers and remitted to government authorities are recorded on a net basis and therefore are excluded from net sales in the consolidated statements of operations.
| (n) | Share-based Compensation |
Share-based compensation expense, which include grants of stock options to employees and directors, is measured at the grant date fair value of the award using the Black-Scholes model. Share-based compensation expense for time-based awards is recognized on a straight-line basis over the vesting periods in which the awards are earned. Share-based compensation expense for performance-based awards is recognized when the performance conditions are considered probable.
| (o) | Pension and Post-employment Plans |
The Company provides pension and other post-employment benefits to certain active and former employees. These benefits are expensed as such obligations are incurred. The recognition of expense is impacted by estimates made by management. Significant assumptions in measuring the benefit obligations and costs include: discount rates, mortality rates, assumed rates of return, compensation increases, turnover rates and healthcare cost trend rates. The Company reviews its assumptions on an annual basis and makes modifications to the assumptions based on current rates and trends as appropriate. The Company recognizes the funded status of defined pension and post-employment plans in the consolidated balance sheet. The funded status is measured as the difference between the fair market value of the plan assets and the benefit obligation. Any translational asset/liability, prior service cost/credit or actuarial gain/loss that has not yet been recognized as a component of net periodic cost is
68
Table of Contents
WIRECO WORLDGROUP (CAYMAN) INC. AND SUBSIDIARIES
Notes to Consolidated Financial Statements – (Continued)
(all currencies in thousands, except per share data)
recognized in the accumulated other comprehensive loss section of the consolidated statement of stockholders’ equity. Accumulated other comprehensive loss will be adjusted as these amounts are subsequently recognized as a component of net periodic benefit cost in future periods.
| (p) | Income Taxes |
Income taxes are accounted for under the asset and liability method. Deferred tax assets and liabilities are recognized for the future tax consequences attributable to differences between the consolidated financial statement carrying amounts of existing assets and liabilities and their respective tax bases and operating loss and tax credit carryforwards. Deferred tax assets and liabilities are measured using enacted tax rates expected to apply to taxable income in the years in which those temporary differences are expected to be recovered or settled. The effect on deferred tax assets and liabilities of a change in tax rates is recognized in income in the period that includes the enactment date. Deferred taxes are determined separately for each tax-paying component within each tax jurisdiction based on provisions of enacted tax law. A valuation allowance is established or maintained when, based on currently available information and other factors, it is more likely than not that all or a portion of a deferred tax asset will not be realized. The Company considers the following in making this assessment: (i) future reversals of existing taxable temporary differences, (ii) future taxable income exclusive of reversing temporary differences except in jurisdictions where there is a three year historical cumulative book loss, (iii) taxable income in prior carryback years and (iv) tax planning strategies that would, if necessary, be implemented.
The Company evaluates the sustainability of each uncertain tax position based on its technical merits and recognizes the effect of income tax positions only if those positions are more likely than not of being sustained. Income tax positions recognized are measured at the largest amount that is greater than 50% likely of being realized. Changes in recognition or measurement are reflected in the period in which the change in judgment occurs. The Company records interest and penalties as a component of income tax expense.
| (q) | Foreign Currency |
The financial statements of foreign subsidiaries for which the functional currency is not the U.S. dollar are translated to U.S. dollars using (i) exchange rates in effect at period-end for assets and liabilities and (ii) average exchange rates during the period for revenues and expenses. Adjustments resulting from translation of such financial statements are reflected in accumulated other comprehensive income (loss) as a separate component of consolidated stockholders’ equity.
Gains and losses on foreign currency transactions are included in the consolidated statements of operations. The Company has intercompany loans that require remeasurement in the aggregate amounts of $174,040 and $120,295 at December 31, 2011 and 2010, respectively. Maturities of these loans are planned and expected in the foreseeable future and are remeasured through the consolidated statement of operations. Unrealized remeasurement gains (losses) of $(11,866), $(5,598) and $1,853 were recognized during the years ended December 31, 2011, 2010 and 2009, respectively.
| (r) | Comprehensive Income (Loss) |
The financial statements include net income (loss), as well as other changes in stockholders’ equity that result from transactions and events other than those with stockholders. The Company’s only significant elements of other comprehensive income (loss) consisted of adjustments related to foreign currency translation and pension and other post-employment benefits.
69
Table of Contents
WIRECO WORLDGROUP (CAYMAN) INC. AND SUBSIDIARIES
Notes to Consolidated Financial Statements – (Continued)
(all currencies in thousands, except per share data)
| (s) | New Accounting Pronouncements |
Recently Adopted Accounting Standards
In September 2011, the Financial Accounting Standards Board (“FASB”) issued ASU 2011-08, which amends the guidance in Accounting Standards Codification (“ASC”) Topic 350-20, Intangibles – Goodwill and Other – Goodwill. ASU 2011-08 is intended to reduce the cost and complexity of the annual goodwill impairment test. Under ASU 2011-08, entities have the option of performing a qualitative assessment before calculating the fair value of a reporting unit. An entity is required to perform step one of the two-step goodwill impairment test only if it concludes that it is more likely than not that a reporting unit’s fair value is less than its carrying amount. This revised standard is effective for annual and interim goodwill impairment tests performed for fiscal years beginning after December 15, 2011, with early adoption permitted. The Company adopted this standard for its annual impairment test in 2011, with no material impact on its financial position, results of operations or cash flows.
Recently Issued Accounting Standards Not Yet Adopted
In May 2011, the FASB issued ASU 2011-04, “Fair Value Measurement (Topic 820): Amendments to Achieve Common Fair Value Measurement and Disclosure Requirements in U.S. GAAP and IFRSs” (“ASU 2011-04”). ASU 2011-04 was issued to provide a consistent definition of fair value and ensure that the fair value measurement and disclosure requirements are similar between U.S. GAAP and International Financial Reporting Standards (“IFRS”). ASU 2011-04 changes certain fair value measurement principles and enhances the disclosure requirements particularly for Level 3 fair value measurements. This standard is effective for interim and annual reporting periods beginning after December 15, 2011. The Company does not expect the adoption of this standard to have a material impact on its financial position, results of operations or cash flows.
| (3) | Acquisitions |
Under the acquisition method of accounting, the assets acquired and liabilities assumed in the Company’s acquisitions are recorded at their respective estimated fair values at the date of acquisition. Some estimates used to arrive at fair market value on the date of acquisition include: cash flows that an asset is expected to generate per management’s projections, royalty rates, growth rates, obsolescence curve rates, tax shield benefit factors, the weighted average cost of capital and discount rates.
Drumet
On July 18, 2011, the Company acquired 100% of the outstanding shares of Drumet Liny i Druty spółka z ograniczoną odpowiedzialnością (“Drumet”). Drumet is a manufacturer of steel wire ropes, wire and staple band with a production facility in Poland and distribution facilities in Slovakia and the Czech Republic. The acquisition of Drumet expands the Company’s sales presence in Eastern Europe, introduces another brand to the Company’s existing portfolio, offers a low-cost labor base and reduces the Company’s dependence on external wire suppliers. The purchase price was equivalent to approximately $62,452, net of cash acquired of $2,385, using the exchange rates in effect at closing. The aggregate transaction value was approximately $100,845, payable in cash installments ($51,813, net of cash acquired, at closing, $4,628 payable on December 31, 2011 (paid in January 2012) and $6,011 payable on July 31, 2012) and debt assumed consisting of non-interest bearing debt and certain machinery and equipment leases with an estimated fair value of approximately $38,393. See Note 8—“Borrowings” for further information on the non-interest bearing debt and Note 16—“Commitments and Contingences” for further information on the Company’s leases.
70
Table of Contents
WIRECO WORLDGROUP (CAYMAN) INC. AND SUBSIDIARIES
Notes to Consolidated Financial Statements – (Continued)
(all currencies in thousands, except per share data)
The allocation of the purchase price to the estimated fair values of the identified tangible and intangible assets acquired and liabilities assumed was as follows:
| Net working capital, net of cash acquired |
$ | 26,953 | ||
| Property, plant and equipment |
57,353 | |||
| Intangible assets (1) |
13,965 | |||
| Other non-current assets |
11,044 | |||
| Other non-current liabilities |
(2,865 | ) | ||
| Deferred income taxes |
(5,605 | ) | ||
| Assumed debt |
(38,393 | ) | ||
|
|
|
|||
| Net assets acquired |
$ | 62,452 | ||
|
|
|
| (1) | The identifiable intangible assets acquired consist of the trade name of $9,485 and customer relationships of $4,480. The trade name intangible asset has an indefinite life and, therefore, is not amortized. The customer relationship intangible asset is being amortized on a straight-line basis over its estimated useful life of 12 years. The fair values of the acquired intangible assets were estimated by applying the income approach. Such estimations required the use of inputs that were unobservable in the market place (Level 3), including a discount rate that the Company estimated would be used by a market participant in valuing these assets, projections of revenues and cash flows, royalty rate and client attrition rates. The acquisition was accounted for as a non-taxable purchase transaction and, accordingly, the identifiable intangible assets are non-deductible for tax purposes. |
Prior to the purchase, Drumet’s assets were not fully utilized as the target market was limited primarily to European customers. Since this was not a forced liquidation or distressed sale, and both the buyer and seller were well informed and acting in their own best interests, the Company concluded that this was not a bargain purchase. Management reviewed the assets and liabilities acquired and the assumptions used to estimate their fair value and determined that the estimated fair value of the buildings, machinery and equipment and intangible assets acquired should be reduced for the effects of the underutilization based on their relative fair market value to the total fair market value for these asset groups. No goodwill was recognized in connection with this acquisition.
Operating results of Drumet are included in the consolidated statement of operations since the date of acquisition. The Company expensed $4,983 of direct acquisition costs associated with this acquisition in Administrative expenses in the consolidated statements of operations.
Oliveira
On November 16, 2010, the Company acquired all of the issued shares of Luís Oliveira Sá – SGPS, S.A. (“Oliveira”), a steel and synthetic rope manufacturer with facilities in Portugal and the Netherlands for cash consideration of $80,888, net of cash acquired. Oliveira is a manufacturer of synthetic ropes targeted at offshore oil and gas industry applications and wire ropes for the fishing and after-market crane markets. The acquisition of Oliveira diversifies the Company’s product offerings, geographic sales reach and end markets served.
71
Table of Contents
WIRECO WORLDGROUP (CAYMAN) INC. AND SUBSIDIARIES
Notes to Consolidated Financial Statements – (Continued)
(all currencies in thousands, except per share data)
The acquisition was accounted for as a non-taxable purchase transaction and accordingly, the identifiable intangible assets, including goodwill, are non-deductible for tax purposes. The allocation of the purchase price was as follows:
| Net working capital, excluding cash |
$ | 27,191 | ||
| Property, plant and equipment |
44,321 | |||
| Intangible and other non-current assets |
14,161 | |||
| Goodwill |
15,860 | |||
| Liabilities assumed |
(6,112 | ) | ||
| Deferred income taxes |
(14,533 | ) | ||
|
|
|
|||
| Total purchase price |
$ | 80,888 | ||
|
|
|
Goodwill arising from the acquisition is primarily attributed to synergies resulting from cross-selling opportunities in new markets with different products and the ability to strategically source raw materials. The intangible assets consist of the Oliveira trade name with an indefinite life, customer relationships with an estimated life of 15 years and purchased technology with an estimated life of 10 years.
Operating results of Oliveira are included in the consolidated statements of operations since the date of acquisition. Direct acquisition costs of $1,052 and $4,970 were expensed in Administrative expenses in the consolidated statements of operations during 2011 and 2010, respectively.
Pro forma Financial Information
The 2011 and 2010 unaudited pro forma financial information in the table below summarizes the combined results of operations of the Company, Drumet and Oliveira as of the beginning of the periods presented. The unaudited pro forma financial information is presented for informational purposes only, and is not indicative of the results of operations that would have been achieved if the acquisition had taken place at the beginning of the periods, or that may result in the future.
| 2011 | 2010 | |||||||
| (unaudited) | (unaudited) | |||||||
| Net sales |
$ | 669,883 | $ | 585,210 | ||||
| Net income |
(45,409 | ) | (514 | ) | ||||
The pro forma amounts above reflect adjustments, net of related income tax effects, for interest on acquisition-related borrowings under the Company’s revolving credit facilities, depreciation on property, plant and equipment, amortization of intangible assets and exclusion of certain charges, such as acquisition costs and amortization of the inventory fair value step-up.
Phillystran
On December 31, 2009, the Company acquired 100% of the outstanding common stock of Phillystran Inc. (“Phillystran”) based in Montgomeryville, Pennsylvania for cash consideration of $15,251. Phillystran is a manufacturer of high tenacity fiber ropes, strands, braids and strength members for specialized applications including mooring lines, life lines, winch lines, boat rigging, structural and support lines, power cables and broadcast tower guy cables. Direct acquisition costs of $1,029 were expensed in Administrative expenses.
72
Table of Contents
WIRECO WORLDGROUP (CAYMAN) INC. AND SUBSIDIARIES
Notes to Consolidated Financial Statements – (Continued)
(all currencies in thousands, except per share data)
The allocation of the purchase price of the acquisition was as follows:
| Net working capital |
$ | 1,191 | ||
| Property, plant and equipment |
4,140 | |||
| Intangible assets |
6,503 | |||
| Goodwill |
7,011 | |||
| Deferred income taxes |
(3,594 | ) | ||
|
|
|
|||
| Total purchase price |
$ | 15,251 | ||
|
|
|
Goodwill arising from the acquisition of Phillystran is primarily attributed to synergies resulting from the combination of Phillystran’s synthetic rope manufacturing technical abilities with the Company’s global sales force. This extension of the Company’s product mix provides additional opportunities for the Company to sell to both existing and new customers. The intangible assets consist of the Phillystran trade name with an indefinite life and customer relationships with an estimated life of 20 years.
Pro forma results of operations are not presented as the purchase of Phillystran was not considered material to the Company.
| (4) | Inventories, net |
The major classes of inventories were as follows as of the dates indicated:
| December 31, 2011 |
December 31, 2010 |
|||||||
| Raw materials |
$ | 77,033 | $ | 53,635 | ||||
| Work in process |
14,287 | 10,214 | ||||||
| Finished goods, net |
96,224 | 77,702 | ||||||
|
|
|
|
|
|||||
| Inventories, net |
$ | 187,544 | $ | 141,551 | ||||
|
|
|
|
|
|||||
| (5) | Property, Plant and Equipment, net |
The components of property, plant and equipment were as follows as of the dates indicated:
| December 31, 2011 |
December 31, 2010 |
|||||||
| Land |
$ | 36,640 | $ | 31,799 | ||||
| Buildings and improvements |
74,263 | 57,187 | ||||||
| Machinery and equipment |
165,295 | 149,976 | ||||||
| Transportation and other equipment |
4,243 | 3,234 | ||||||
| Capitalized software |
12,968 | 13,231 | ||||||
| Furniture, fixtures and office equipment |
8,839 | 4,644 | ||||||
| Construction in process |
18,902 | 7,284 | ||||||
|
|
|
|
|
|||||
| Property, plant and equipment |
321,150 | 267,355 | ||||||
| Less: Accumulated depreciation |
(85,004 | ) | (66,767 | ) | ||||
|
|
|
|
|
|||||
| Property, plant and equipment, net |
$ | 236,146 | $ | 200,588 | ||||
|
|
|
|
|
|||||
Depreciation expense was $26,057, $21,811 and $19,536 for the years ended December 31, 2011, 2010 and 2009, respectively. Depending on the nature and use of the asset, depreciation expense is recorded in Cost of sales, Selling expenses and Administrative expenses in the accompanying consolidated statements of operations.
73
Table of Contents
WIRECO WORLDGROUP (CAYMAN) INC. AND SUBSIDIARIES
Notes to Consolidated Financial Statements – (Continued)
(all currencies in thousands, except per share data)
| (6) | Intangible Assets and Goodwill |
The components of intangible assets were as follows as of the dates indicated:
| Gross carrying amount |
Weighted- average amortization period |
Accumulated amortization |
Net carrying amount |
|||||||||||||
| December 31, 2011: |
||||||||||||||||
| Customer and distributor relationships |
$ | 105,191 | 10 years | $ | (53,477 | ) | $ | 51,714 | ||||||||
| Trade names—non-amortizing |
48,140 | Indefinite | — | 48,140 | ||||||||||||
| Trade name—amortizing |
682 | 15 years | (220 | ) | 462 | |||||||||||
| Technology and patents |
15,739 | 13 years | (6,449 | ) | 9,290 | |||||||||||
| Other |
6,002 | 7 years | (5,835 | ) | 167 | |||||||||||
|
|
|
|
|
|
|
|||||||||||
| Total intangible assets |
$ | 175,754 | $ | (65,981 | ) | $ | 109,773 | |||||||||
|
|
|
|
|
|
|
|||||||||||
| December 31, 2010: |
||||||||||||||||
| Customer and distributor relationships |
$ | 103,286 | 10 years | $ | (42,817 | ) | $ | 60,469 | ||||||||
| Trade names—non-amortizing |
41,368 | Indefinite | — | 41,368 | ||||||||||||
| Trade name—amortizing |
682 | 15 years | (174 | ) | 508 | |||||||||||
| Technology and patents |
16,100 | 13 years | (5,589 | ) | 10,511 | |||||||||||
| Other |
6,114 | 7 years | (5,803 | ) | 311 | |||||||||||
|
|
|
|
|
|
|
|||||||||||
| Total intangible assets |
$ | 167,550 | $ | (54,383 | ) | $ | 113,167 | |||||||||
|
|
|
|
|
|
|
|||||||||||
Amortization of intangible assets was $13,167, $12,436 and $12,007 for the years ended December 31, 2011, 2010 and 2009, respectively.
Using the exchange rates in effect at year end, estimated amortization of intangible assets as of December 31, 2011 is as follows:
| 2012 |
$ | 12,726 | ||
| 2013 |
12,429 | |||
| 2014 |
7,575 | |||
| 2015 |
6,697 | |||
| 2016 |
6,496 | |||
| Thereafter |
15,710 | |||
|
|
|
|||
| Total |
$ | 61,633 | ||
|
|
|
The changes in the carrying value of goodwill were as follows as of the dates indicated:
| Balance as of December 31, 2009 |
$ | 156,078 | ||
| Goodwill resulting from acquisition |
15,860 | |||
| Foreign currency translation and other |
(1,788 | ) | ||
|
|
|
|||
| Balance as of December 31, 2010 |
$ | 170,150 | ||
| Foreign currency translation and other |
(1,319 | ) | ||
|
|
|
|||
| Balance as of December 31, 2011 |
$ | 168,831 | ||
|
|
|
74
Table of Contents
WIRECO WORLDGROUP (CAYMAN) INC. AND SUBSIDIARIES
Notes to Consolidated Financial Statements – (Continued)
(all currencies in thousands, except per share data)
| (7) | Investment in and Advances to the China Joint Venture |
On June 12, 2006, the Company entered into a 50-year equity joint venture agreement with WISCO Wuhan Jiangbei Iron and Steel Ltd. (f/k/a Jiangbei Steel Processing and Logistics Co., Ltd., the “China JV Partner”), a China based steel producer and wholly owned subsidiary of Wuhan Iron and Steel Company, establishing WISCO WireCo Wire Rope Co., Ltd. (f/k/a WISCO WRCA Co., Ltd.) (“China JV”) primarily for the purpose of manufacturing, marketing and sale of specialty wire and wire ropes. The China JV has capacity to produce approximately 40,000 tons of wire rope and 55,000 tons of wire annually.
Since the joint venture’s formation, the Company has contributed cash in the amount of $40,500, including $15,000 during 2011. On May 4, 2011, the Company entered into an agreement (“Capital Increase Agreement”) with WISCO Wuhan Jiangbei Iron and Steel Ltd., which provided for the $15,000 capital contribution in exchange for an increase in the Company’s ownership interest in the China JV from 51% to 65%. The capital contribution was subject to approval from three Chinese government agencies. The increase in the Company’s ownership percentage was effective on May 31, 2011, upon approval from the Wuhan Bureau of Commerce. On June 1, 2011, the Company signed a Letter of Continuing Support, which provided for financial support, as needed, to the China JV to ensure its continuing operations while any Chinese government approvals for the equity contribution were pending. Upon the Company’s capital contribution, the Letter of Continuing Support became null and void. Therefore, the Company has no further financial commitments to fund the China JV.
During 2011 and preceding years, the Company made advances to the China JV relating primarily to travel expenses of Company employees assisting with training, engineering and other matters and consulting expenses the Company paid on behalf of the China JV. During 2011, the Company fully reserved $8,315 against its related advances to the China JV, which was recorded in Loss on investment in and advances to the China joint venture in the accompanying statement of operations, as management determined it probable that the Company will be unable to collect all amounts due according to the original terms of the advances to the China JV. As of December 31, 2011 and December 31, 2010, the Company had prepaid inventory of $1,942 and $4,593, respectively, to be delivered to the Company’s manufacturing facilities within the next twelve months. This prepaid inventory is classified in Prepaid expenses and other current assets in the consolidated balance sheets. Management determined no adjustment was necessary for prepaid inventory, as sufficient materials are in stock for the pending purchase orders.
The Company’s share in the losses of the investment was $14,375, $9,226 and $3,703 for the years ended December 31, 2011, 2010 and 2009, respectively. The loss on the investment increased significantly in 2011 and 2010 due to continued start-up issues, reduced interest capitalization, the commencement of depreciation expense in September 2010, and an increase in our ownership percentage on May 31, 2011 As our share of losses in the China JV exceeded our carrying amount, we will discontinue applying the equity method until the China JV subsequently reports sufficient net income to cover the net losses not recognized during the period the equity method is suspended.
During the construction of the plant and installation of equipment until September 1, 2010, the Company capitalized interest expense on the investment in the China JV of $1,416 and $2,230 for the period ended August 31, 2010 and year ended December 31, 2009, respectively. The amortization period of the total capitalized interest amount of $6,645 was 20 years, based upon the average estimated life of the facility and equipment. During 2011, $3,679 of capitalized interest was expensed due to equity losses exceeding the Company’s investment balance.
Based on the facts and circumstances that existed at December 31, 2011 and 2010, management determined the need to assess the investment and advances for impairment. The Company performed a fair value assessment using a combination of the market, income, and a cost approach. Based on these valuations,
75
Table of Contents
WIRECO WORLDGROUP (CAYMAN) INC. AND SUBSIDIARIES
Notes to Consolidated Financial Statements – (Continued)
(all currencies in thousands, except per share data)
management determined that the fair value of the investment was below the carrying value, resulting in an other than temporary impairment charge of $6,646 and $7,500, included in Loss on investment in and advances to the China joint venture for the years ended December 31, 2011 and 2010, respectively. At December 31, 2010, the China JV was in breach of one of its financial debt covenants, which required the China JV to maintain liabilities of less than 80% of total assets. The China JV entered into an agreement with one of its lenders on April 20, 2011 (“Supplemental Agreement”), which was contingent upon the $15,000 capital contribution by the Company. The Supplemental Agreement extends the loans of the China JV, provides that no principal payments under the loans of the China JV is due before 2013 and defers compliance with the financial covenant under the loans of the China JV, which the China JV breached, until 2013. The capital contribution was funded in its entirety on September 30, 2011, two days following the 30 working day requirement. China JV management has not received communication from the lender notifying them of an event of default, and believes that the China JV has constructively complied with the Supplemental Agreement. The China JV Partner has agreed to provide additional funding in the form of a loan to the China JV to assist with principal and interest payments. Additionally, the China JV management is negotiating with the lender to restructure its debt under a revised agreement to further defer principal payments and lower the interest rate. The revised agreement may require compliance with restrictive operational and financial covenants. There can be no assurance that the China JV will be successful in negotiating these provisions with the lender or be able to comply with the operational and financial covenants that may result from a new agreement or that the financial funding provided by the China JV Partner will be enough to resolve the China JV’s liquidity issues. Furthermore, there can be no assurance that the China JV will be able to restructure its debt or obtain additional financing from its joint venture partners or other third parties.
Due to the continued losses and reduced liquidity, there is substantial doubt as to the China JV’s ability to continue as a going concern. As of December 31, 2011, the Company’s exposure to loss as a result of its involvement with the China JV is limited to prepaid inventory of $1,942. The Company does not guarantee the debts of the China JV in whole or in part.
The summarized assets and liabilities of the China JV, which was considered a significant non-consolidated subsidiary, are as follows as of the dates indicated:
| As of December 31, | ||||||||
| 2011 | 2010 | |||||||
| Assets: |
||||||||
| Current assets |
$ | 17,558 | $ | 17,425 | ||||
| Noncurrent assets |
181,955 | 183,505 | ||||||
|
|
|
|
|
|||||
| Total assets |
$ | 199,513 | $ | 200,930 | ||||
|
|
|
|
|
|||||
| Liabilities and equity: |
||||||||
| Current liabilities |
$ | 145,684 | $ | 171,394 | ||||
| Noncurrent liabilities |
42,433 | 4,538 | ||||||
|
|
|
|
|
|||||
| Total liabilities |
188,117 | 175,932 | ||||||
| Net equity |
11,396 | 24,998 | ||||||
|
|
|
|
|
|||||
| Total liabilities and equity |
$ | 199,513 | $ | 200,930 | ||||
|
|
|
|
|
|||||
76
Table of Contents
WIRECO WORLDGROUP (CAYMAN) INC. AND SUBSIDIARIES
Notes to Consolidated Financial Statements – (Continued)
(all currencies in thousands, except per share data)
Summarized results of the China JV’s operations are presented in the table below for the dates indicated.
| Years ended December 31, | ||||||||||||
| 2011 | 2010 | 2009 | ||||||||||
| Net sales |
$ | 15,996 | $ | 10,901 | $ | 2,835 | ||||||
| Gross profit |
(10,396 | ) | (10,336 | ) | (4,698 | ) | ||||||
| Impairment charge |
(3,742 | ) | — | — | ||||||||
| Net loss |
(29,262 | ) | (17,691 | ) | (7,550 | ) | ||||||
| (8) | Borrowings |
Long-term debt consists of the following as of the dates indicated:
| December 31, 2011 |
December 31, 2010 |
|||||||
| Term Loan due 2014 |
$ | 99,250 | $ | 233,419 | ||||
| Senior Notes due 2017 |
425,000 | 275,000 | ||||||
| Polish debt due 2014 |
28,034 | — | ||||||
| Other indebtedness |
658 | 799 | ||||||
| Borrowings under revolving credit facilities |
44,696 | — | ||||||
|
|
|
|
|
|||||
| Total debt at face value |
597,638 | 509,218 | ||||||
| Plus: Unamortized premium (discount), net |
(3,077 | ) | (6,450 | ) | ||||
| Less: Current maturities of long-term debt |
(13,416 | ) | (2,520 | ) | ||||
| Less: Borrowings under revolving credit facilities which are classified as current |
(16,101 | ) | — | |||||
|
|
|
|
|
|||||
| Total long-term debt |
$ | 565,044 | $ | 500,248 | ||||
|
|
|
|
|
|||||
Certain subsidiaries jointly and severally and fully and unconditionally guarantee, subject to customary release provisions, substantially all of the outstanding long-term debt. As of December 31, 2011, the Company was in compliance with all restrictive and financial covenants associated with its borrowings. For a description of assets securing the Company’s indebtedness, see the section entitled “Security for Borrowings” within this footnote.
Term Loan
The Company has a Term Loan Credit Agreement (“Term Loan”) with Deutsche Bank Trust Company America. On May 3, 2010, the Company amended this agreement in order to issue the $275,000 aggregate principal amount of 9.5% Senior Notes due 2017 (“Senior Notes”) and redeem the 11% Senior Notes. The Term Loan amendment increased the interest rate on outstanding borrowings from LIBOR plus 2.25% to LIBOR plus 3.50%, with a LIBOR floor of 1.75%. On November 24, 2010, the Company entered into an amendment to the Term Loan to borrow an additional $65,000. In conjunction with this amendment, the Company capitalized $3,575 in fees paid to the lender.
On June 10, 2011, the Company amended the Term Loan in order to issue an additional $150,000 aggregate principal amount of Senior Notes and enter into a euro-based revolving credit agreement. The interest rate on outstanding borrowings decreased from LIBOR plus 3.50%, with a LIBOR floor of 1.75%, to LIBOR plus 3.25%, with a LIBOR floor of 1.75%. For this amendment, the Company capitalized $409 in fees paid to the lenders, which will be amortized over the remaining life of the agreement. Also, on June 10, 2011, the
77
Table of Contents
WIRECO WORLDGROUP (CAYMAN) INC. AND SUBSIDIARIES
Notes to Consolidated Financial Statements – (Continued)
(all currencies in thousands, except per share data)
Company prepaid $132,814 of the outstanding Term Loan balance and accrued interest of $1,375. The Company wrote-off $4,159 of unamortized debt issuance costs associated with the pro rata portion of the Term Loan that was extinguished. These costs combined with the $1,495 in amendment fees, which could not be capitalized, resulted in a loss on extinguishment of long-term debt of $5,654 for the year ended December 31, 2011.
The interest rate on the Term Loan was 5.00%, 5.25% and 2.53% at December 31, 2011, 2010 and 2009, respectively. The Term Loan requires interest and fixed principal payments of $250 on a quarterly basis. The remaining principal amount is due on February 8, 2014, the maturity date of the Term Loan. Subject to certain notification procedures, the Company may prepay the Term Loan at any time without premium or penalty.
Pursuant to the Term Loan agreement, the Company’s senior secured leverage ratio must be 3.25 to 1.00. Negative covenants include, but are not limited to, limitations on the Company’s ability to incur liens, engage in mergers, consolidations, or amalgamations; liquidate, wind up or dissolve; dispose of all or substantially all of the Company’s property or business; and engage in any asset sales.
Senior Notes
On May 19, 2010, the Company issued $275,000 aggregate principal amount of unsecured Senior Notes due May 15, 2017 at 97.529% of their principal amount under the indenture governing the Senior Notes (the “Indenture”). The Company received net proceeds from the offering of $268,205, net of a $6,795 original issue discount (“OID”). In conjunction with this issuance, the Company incurred $11,560 in debt issuance costs related to underwriting, legal, accounting and other third-party expenses.
On June 10, 2011, the Company issued an additional $150,000 aggregate principal amount of Senior Notes at 104.75% of their principal amount under the Indenture. The Company received gross proceeds from the offering of $157,125, including a $7,125 premium on the issuance. The Company capitalized $6,236 in debt issuance costs related to underwriting, legal, accounting and other third-party expenses.
Interest on the Senior Notes is due semi-annually on May 15th and November 15th of each year. The effective interest rate on $425,000 aggregate principal amount of Senior Notes, including debt issuance costs, is 10.39%.
In connection with the offerings of the Senior Notes, the Company entered into registration rights agreements with the note holders, in which the Company agreed to file a registration statement with the Securities and Exchange Commission (“SEC”) for a registered exchange offer by May 19, 2011. Since the registration statement was not declared effective within 365 days of the issue date of the Senior Notes, the Company became obligated to pay special interest to each holder of the Senior Notes in accordance with the terms of the registration rights agreements at an amount equal to an additional 0.25% of the principal amount per each 90-day period until all registration defaults have been cured, up to a maximum amount of additional interest of 1.00% of the principal amount. Interest expense of $1,396 and $493 related to this special interest is reflected in the consolidated statements of operations for the years ended December 31, 2011 and 2010, respectively. The Company’s exchange offer for registered Senior Notes was consummated on March 9, 2012, and no further special interest will be incurred beyond that date.
The Senior Notes are redeemable at the Company’s option, in whole or in part, at any time on or after May 15, 2013, at the following redemption prices (expressed as percentages of principal amount) plus any accrued and unpaid interest: 2013 – 104.750%, 2014 – 102.375%, 2015 and thereafter – 100.000%. At any time prior to May 15, 2013, the Company may on any one or more occasions redeem up to 35% of the original aggregate principal amount of exchange notes at a redemption price equal to 109.50% of the
78
Table of Contents
WIRECO WORLDGROUP (CAYMAN) INC. AND SUBSIDIARIES
Notes to Consolidated Financial Statements – (Continued)
(all currencies in thousands, except per share data)
principal amount, plus accrued and unpaid interest, with the net cash proceeds of one or more equity offerings; provided that at least 65% of the original aggregate principal amount of exchange notes remains outstanding immediately after the occurrence of such redemption; and that any such redemption occurs within 90 days of the date of the closing of such equity offering. At any time on or prior to May 15, 2013, the Senior Notes may also be redeemed, in whole, or any portion thereof, at a redemption price equal to 100% of the principal amount of the Senior Notes redeemed, plus any accrued and unpaid interest and an applicable premium representing the greater of 1.0% of the principal amount or the excess of the present value at such redemption date over the principal amount. Additionally, the holders of the Senior Notes have the right to put the Senior Notes to the Company at 101% of their principal amount to the extent the Company has a change of control.
The Indenture contains various covenants including, but not limited to, limitations on: indebtedness, dividends and other capital distributions, sale of assets, transactions with affiliates, liens and issuances of preferred stock.
The Senior Notes are senior unsecured obligations that rank equally in right of payment with all of our existing and future senior debt and the Senior Notes are senior to our existing and future subordinated debt. Certain subsidiaries held by the Company guarantee this debt.
In 2007, the Company issued $160,000 of unsecured 11% Senior Notes maturing on February 8, 2015 (“11% Senior Notes”). Interest on the 11% Senior Notes was payable on March 1st and September 1st of each year. On May 19, 2010, the Company redeemed all outstanding $160,000 with a portion of the proceeds from the Senior Notes. Associated with this redemption, the Company incurred a $3,200 call premium and wrote-off $2,569 of unamortized debt issuance costs. These costs combined with the $751 in amendment fees paid to third parties resulted in a loss on extinguishment of $6,520 in 2010.
Polish Debt
With the acquisition of Drumet on July 18, 2011, the Company assumed long-term debt with a face value of zł.91,700 and €1,100 (equivalent of $33,864 at closing) (“Polish Debt”). These notes bear no interest and require varied installment payments each calendar year-end until December 31, 2014, the maturity date. The Company estimated the fair value of these non-interest bearing notes on the date of acquisition to be zł.74,998 and €897 (equivalent of $27,692 at closing) using an effective interest rate of 10.00%. The discounted value of the notes is accreted to the face value of the notes through interest expense. The outstanding balance on the Polish Debt, net of discount, was $24,005 as of December 31, 2011. Interest expense of $1,186 was recognized during 2011 and the remaining change in the balance was the result of foreign currency translation and a principal payment.
Revolving Credit Facilities
The Company has three revolving credit facilities: a revolving credit agreement with HSBC Bank USA, National Association (“HSBC”) (“Revolving Credit Agreement”), a revolving credit agreement with BGL BNP Paribas S.A. (“CASAR Revolving Credit Agreement”) and a revolving credit agreement with Deutsche Bank AG, London Branch and Goldman Sachs Bank USA (“Euro Facility”).
| (1) | Revolving Credit Agreement |
The borrowing capacity under the Revolving Credit Agreement is an aggregate principal amount of $66,000, subject to an incurrence covenant and an adjusted borrowing base calculation based
79
Table of Contents
WIRECO WORLDGROUP (CAYMAN) INC. AND SUBSIDIARIES
Notes to Consolidated Financial Statements – (Continued)
(all currencies in thousands, except per share data)
on specified advance rates against the value of eligible accounts receivable and inventory. Also, outstanding letters of credit, which the Company utilizes in connection with various normal business activities, reduce the amount available to be drawn. At December 31, 2011, there were two outstanding letters of credit in the amount of $418. The Company had borrowed $16,101 as of December 31, 2011 and had approximately $49,481 of availability under the Revolving Credit Agreement as of December 31, 2011. The Company did not have an outstanding balance under the Revolving Credit Agreement as of December 31, 2010.
On May 3, 2010, the Company amended this agreement in order to issue $275,000 aggregate principal amount of Senior Notes and redeem the 11% Senior Notes. Upon execution of the amendment, the applicable margins referenced below were revised upwards from previously stated applicable margins. In connection with the June 10, 2011 offering of $150,000 aggregate principal amount of Senior Notes and the execution of the Euro Facility, the Company entered into an amendment to its Revolving Credit Agreement which provided for, among other things, the incurrence of additional indebtedness and the permission to use the offering proceeds to prepay a portion of the Term Loan.
Advances under the Revolving Credit Agreement bear interest at either the prime rate plus an applicable margin or at the LIBOR plus an applicable margin; the rate is designated by the borrower upon each draw. The agreement imposes a letter of credit fee on outstanding letters of credit and a fee for unutilized commitments based upon the chart below. The interest rate was 4.00%, 4.25% and 2.75% at December 31, 2011, 2010 and 2009, respectively.
As of December 31, 2011, applicable margins and fees were as follows:
| Average excess availability for prior quarter |
Applicable LIBOR margin |
Applicable prime rate margin |
Applicable unused line fee |
Applicable letter of credit margin |
||||||||||||
| Less than or equal to $18,000 |
2.50 | % | 1.25 | % | 0.50 | % | 2.50 | % | ||||||||
| Less than or equal to $33,000 but greater than $18,000 |
2.25 | % | 1.00 | % | 0.75 | % | 2.25 | % | ||||||||
| Greater than $33,000 |
2.00 | % | 0.75 | % | 1.00 | % | 2.00 | % | ||||||||
The Revolving Credit Agreement contains various negative covenants that limit or restrict the incurrence of indebtedness and guarantees, the creation of liens, transactions with affiliates, amendments of organizational documents, the incurrence of capital leases and operating leases, changes in locations and storage, use of certain collateral, investments (including limitations on investments in and loans to subsidiaries with proceeds of borrowings thereunder), amendments and changes to the terms of the notes, advances and acquisitions, mergers, consolidations, asset sales, dividends and distributions and certain other transactions and business activities. The Revolving Credit Agreement also contains customary events of default, including upon a change of control and the occurrence of a material adverse change in business. The Revolving Credit Agreement contains a minimum fixed charge coverage ratio requirement, a maximum senior leverage ratio requirement and a maximum capital expenditures allowance. For detail of assets secured by the Revolving Credit Agreement, see the section entitled “Security for Borrowings” within this footnote. The Revolving Credit Agreement matures on the earlier of February 8, 2014 or six months prior to the Term Loan maturity. Borrowings under the Revolving Credit Agreement are classified as a current liability as the Company pays down its outstanding revolver balance daily with lockbox receipts.
80
Table of Contents
WIRECO WORLDGROUP (CAYMAN) INC. AND SUBSIDIARIES
Notes to Consolidated Financial Statements – (Continued)
(all currencies in thousands, except per share data)
| (2) | CASAR Revolving Credit Agreement |
The borrowing capacity under the CASAR Revolving Credit Agreement is an aggregate principal amount of $10,000, subject to an adjusted borrowing base calculation based on specified advance rates against the realizable value of eligible inventory and accounts receivable and reduced by outstanding letters of credit. At December 31, 2011, there were outstanding letters of credit in the amount of $767. The Company did not borrow under this agreement during 2011 and 2010. As of December 31, 2011, the availability under the agreement was $9,233. Advances under the CASAR Revolving Credit Agreement bear interest at the three-month daily LIBOR plus 2.00% (in case of drawings in euros, the corresponding Euribor interest rate). The interest rate was 2.37%, 2.37% and 4.48% at December 31, 2011, 2010 and 2009, respectively. The Company must also pay a fee for unutilized commitments at a rate equal to 0.50%.
The CASAR Revolving Credit Agreement contains various negative covenants that limit or restrict the incurrence of indebtedness and guarantees, the creation of liens, transactions with affiliates, among other business activities. The CASAR Revolving Credit Agreement contains a minimum debt coverage ratio requirement and a maximum senior leverage ratio requirement. The CASAR Revolving Credit Agreement matures on August 22, 2012.
| (3) | Euro Facility |
On June 10, 2011, the Company entered into the Euro Facility with €30,000 currently committed to date (equivalent of $38,817 at December 31, 2011). The borrowing capacity under the Euro Facility can be increased to €40,000 if future commitments are made by existing or new financial institutions. The Company incurred $1,931 in debt issuance costs related to underwriting, legal, accounting and other third-party expenses, which are amortized using the straight-line method over the remaining life of the agreement. The Company had borrowed $28,595 under the Euro Facility as of December 31, 2011. There were two outstanding letters of credit issued to the former owner of Drumet related to the remaining purchase price installment payments of €7,459 (equivalent of $9,651 at December 31, 2011), which reduced the availability to $571. The letter of credit issued for €3,295 related to the December 31, 2011 payment expired on January 20, 2012.
Revolving loans under the Euro Facility bear interest at a rate equal to 4.50% plus Euribor (set by reference to Reuters or, if not available, on the basis of rates agreed by reference banks), adjusted for certain additional costs and reserve requirements. The weighted average interest rate on outstanding draws at December 31, 2011 was 5.58%. The agreement imposes a letter of credit fee on outstanding letters of credit, limited to €10,000, at a rate equal to 4.50%. In addition, the Company also must pay a commitment fee for unutilized commitments at a rate equal to 1.80%.
The Euro Facility contains similar covenants and events of default as the Term Loan. All obligations under the Euro Facility are guaranteed by the same parties that guarantee the Term Loan. The Euro Facility matures on either February 8, 2014 (the Term Loan maturity date) or June 10, 2016, if by August 2013, the Company repays the Term Loan in full or amends the Term Loan to extend its maturity to a date beyond June 10, 2016. As the extension of the Euro Facility maturity date is not fully within the control of the Company, the debt issuance costs are amortized using the shorter life, assuming a February 8, 2014 maturity.
81
Table of Contents
WIRECO WORLDGROUP (CAYMAN) INC. AND SUBSIDIARIES
Notes to Consolidated Financial Statements – (Continued)
(all currencies in thousands, except per share data)
Security for Borrowings
| Respective borrowings secured by (1): | ||||||||||||||||
| United
States/Canada / |
Germany |
Poland | Netherlands | |||||||||||||
| Borrowings: |
A/R and |
All Other Assets |
A/R and |
All Other Assets |
A/R and Inventory |
All Other Assets |
A/R and Inventory |
All Other Assets | ||||||||
| Term Loan | second-priority lien (3) | first- priority lien (3) |
second-priority on certain accounts; second-priority lien on remainder (4) | first- priority lien (3) |
second- priority lien (4) |
first- priority lien (except PP&E) (3) |
second- priority lien |
first- priority lien (3) | ||||||||
| Revolving Credit Agreement | first- priority lien | second- priority lien |
||||||||||||||
| CASAR Revolving Credit Agreement | first-priority lien on certain accounts | |||||||||||||||
| Euro Facility | second-priority lien (3) | first- priority lien (3) |
second-priority on certain accounts; first-priority lien on remainder (4) | first- priority lien (3) |
first- priority lien (4) |
first- priority lien (except PP&E) (3) |
first- priority lien (4) |
first- priority lien (3) | ||||||||
| Polish Debt | first- priority lien on only PP&E(2) |
|||||||||||||||
| (1) | Assets at our Mexican and Portuguese subsidiaries are not secured under any of our borrowings. |
| (2) | The collateral is being released gradually with the payment of each installment, first personal property and then real estate. |
| (3) | Priority is pari passu. |
| (4) | Only one lien, priority established in Term Loan. |
Future Principal Payments on Long-Term Debt
The aggregate minimum principal payments required on the Company’s long-term debt as of December 31, 2011, were as follows:
| 2012 |
$ | 13,416 | ||
| 2013 |
8,898 | |||
| 2014 |
133,871 | |||
| 2015 |
94 | |||
| 2016 |
94 | |||
| Thereafter |
425,164 | |||
|
|
|
|||
| Total |
$ | 581,537 | ||
|
|
|
82
Table of Contents
WIRECO WORLDGROUP (CAYMAN) INC. AND SUBSIDIARIES
Notes to Consolidated Financial Statements – (Continued)
(all currencies in thousands, except per share data)
Debt Issuance Costs and Debt Discounts/Premium
In connection with the issuance of borrowings or modification of debt agreements, the Company incurred debt issuance costs. Amortization of $4,808, $3,085, and $2,145 was recorded as additional interest expense during the years ended December 31, 2011, 2010 and 2009, respectively. Unamortized debt issuance costs were $19,192 and $19,366 at December 31, 2011 and 2010, respectively. In 2011, the Company wrote-off $4,159 of unamortized debt issuance costs associated with the pro rata portion of the Term Loan that was prepaid in conjunction with the issuance of $150 million aggregate principal amount of Senior Notes. Also, upon early extinguishment of the 11% Senior Notes in May 2010, the Company wrote-off $2,569 of unamortized debt issuance costs.
The discount and premium associated with the issuance of the Senior Notes and the discount associated with the Polish Debt is amortized to interest expense over the term of the debt. Amortization of $1,463 and $345 was recorded as additional interest expense during the years ended December 31, 2011 and 2010, respectively.
Interest Expense, net
Net interest expense consists of:
| Years ended December 31, | ||||||||||||
| 2011 | 2010 | 2009 | ||||||||||
| Interest on long-term debt |
$ | 43,174 | $ | 30,419 | $ | 23,052 | ||||||
| Interest on revolving credit facilities classified as current |
489 | 256 | 745 | |||||||||
| Amortization of debt issuance costs and discounts/premium |
6,271 | 3,430 | 2,145 | |||||||||
| Interest rate swap settlements |
1,178 | 3,101 | 3,821 | |||||||||
| Interest rate swap mark-to-market adjustments |
(1,151 | ) | (2,540 | ) | (2,598 | ) | ||||||
| Capitalized interest |
(148 | ) | (1,506 | ) | (2,807 | ) | ||||||
| Other |
1,250 | 560 | 360 | |||||||||
|
|
|
|
|
|
|
|||||||
| Interest expense, net |
$ | 51,063 | $ | 33,720 | $ | 24,718 | ||||||
|
|
|
|
|
|
|
|||||||
| (9) | Derivative Instruments |
As part of the Company’s ongoing operations, the Company is exposed to market risks, such as fluctuations in interest rates and commodity prices.
Interest Rate Swap Agreements
In 2007, the Company entered into two interest rate swap agreements to mitigate the effects of fluctuations in interest rates on a portion of the outstanding Term Loan. These instruments did not qualify as cash flow hedges. Accordingly, the gains and losses associated with the change in the fair value of the instruments were recorded to earnings in the period of change. The four-year interest rate swap agreement had an original notional value that stepped down by $20,000 each year on March 31 until the end of the agreement on December 31, 2011. Under this agreement, the Company received variable payments based on LIBOR and made fixed payments at the rate of 4.97% on the notional value. The three-year interest rate swap agreement with a notional value of $30,000 expired on September 30, 2010. The Company received variable payments based on LIBOR and made fixed payments at the rate of 4.69%. The Company had interest rate swap agreements outstanding on a notional amount of $40,000 and $60,000 at December 31, 2010 and 2009, respectively. Net cash outflows under the interest rate swap agreements are recorded in Interest expense, net. Note 8—“Borrowings” includes detail of the various components of Interest expense, net.
83
Table of Contents
WIRECO WORLDGROUP (CAYMAN) INC. AND SUBSIDIARIES
Notes to Consolidated Financial Statements – (Continued)
(all currencies in thousands, except per share data)
Natural Gas Contract
In 2009, the Company entered into a derivative contract for the purchase of natural gas at the Company’s production facilities in Mexico. This instrument did not qualify as a cash flow hedge. Accordingly, the gains and losses associated with the change in the fair value of the instrument were recorded to earnings in the period of change. The Company contracted for approximately 95% of its consumption during 2009 and approximately 50% of its consumption during 2010. The contract exchanged a floating gas price for a fixed cost of $6.89 per mmbtu (Million British Thermal Units) delivered to the plant locations for the full contract period. This agreement expired December 31, 2010. Net cash outflows on the natural gas contract, included in Cost of sales, were $276 and $785 for the years ended December 31, 2010 and 2009.
| (10) | Fair Value Measurements |
The Company’s short-term financial instruments include cash and cash equivalents, accounts receivable, other receivables, borrowings under revolving credit agreement, accounts payable and other accrued liabilities. The carrying amounts reported on the consolidated balance sheets for these items approximate fair market value due to their relative short-term nature.
The estimated fair value of the Company’s Term Loan is based on rates currently available for obligations with similar terms and maturities (Level 2 inputs), the estimated fair value of the Senior Notes is based on current market rates in inactive markets (Level 2 inputs) and the estimated fair value of the Polish Debt and Euro Facility, which are not actively traded, is determined using a discounted cash flow model (Level 3 inputs).
The carrying amounts and estimated fair values of the Company’s debt at December 31, 2011 were as follows:
| Carrying amount |
Estimated fair value |
|||||||
| Term Loan |
$ | 99,250 | $ | 97,265 | ||||
| Senior Notes |
425,952 | 427,125 | ||||||
| Polish Debt |
24,005 | 24,005 | ||||||
| Euro Facility |
28,595 | 28,595 | ||||||
The Company determines the fair values of its financial instruments based on the fair value hierarchy. The following table presents the Company’s financial assets and liabilities measured at estimated fair value on a recurring basis:
| December 31, 2010 |
Estimated fair value measurements |
|||||||||||||||
| Level 1 | Level 2 | Level 3 | ||||||||||||||
| Liabilities: |
||||||||||||||||
| Interest rate swaps |
$ | 1,151 | — | $ | 1,151 | — | ||||||||||
There were no transfers between Level 1 and Level 2 assets or liabilities during the years ended December 31, 2011 and 2010.
The Company estimates the fair value of its interest rate swaps using present value measurements based on the LIBOR swap rate, credit spreads and other relevant market conditions. The fair value of the liability as of December 31, 2010 was included in Other noncurrent accrued liabilities in the accompanying consolidated balance sheet. The changes in fair value of the interest rate swaps were recorded in Interest expense, net. Note 8—“Borrowings” includes detail of the various components of Interest expense, net.
84
Table of Contents
WIRECO WORLDGROUP (CAYMAN) INC. AND SUBSIDIARIES
Notes to Consolidated Financial Statements – (Continued)
(all currencies in thousands, except per share data)
| (11) | Share-based Compensation |
| (a) | Time-based Stock Options |
The Company maintains a Long-term Incentive Plan (the “Plan”) pursuant to which the Company may grant up to 563,216 non-qualified stock options to officers and key employees. To date, the Company has only granted stock options settleable in shares. All awards have ten year contractual terms. All 2007 options vested ratably over five years of service on each December 31, beginning with December 31, 2007. The subsequent awards vest ratably over five years of service from date of grant, with one-fifth vesting each year. Certain options awards provide for accelerated vesting if there is a change in control (as defined in the Non-Qualified Stock Option Agreement).
The fair value of each option award is estimated on the date of grant using the Black-Scholes model. The assumptions for 2011, 2010 and 2009 grants are provided in the following table. Since the Company’s shares are not publicly traded, expected volatility is estimated based on the average historical volatility of similar entities with publicly traded shares. The risk-free interest rate for the expected term of the option is based on the U.S. Treasury yield curve at the date of grant. As the Company lacks historical exercise data, the Company used the simplified method to estimate the expected term of the options in 2011. For the 2010 and 2009 grants, management probability weighted three scenarios (no Initial Public Offering (“IPO”), IPO and private sale) in determining the expected term.
| 2011 | 2010 | 2009 | ||||||||||
| Expected volatility |
46 | % | 50 | % | 50 | % | ||||||
| Risk-free interest rate |
3.00 | % | 1.65 | % | 2.20 | % | ||||||
| Expected term of the option (years) |
6.5 | 4.4 | 4.6 | |||||||||
| Grant date fair value per option |
$ | 130.20 | $ | 89.58 | $ | 82.89 | ||||||
Stock option activity during the periods indicated is as follows:
| Options |
Number of options |
Weighted average exercise price |
Weighted average remaining contractual term (years) |
Grant-date fair value of options |
||||||||||||
| Balance at December 31, 2008 |
291,603 | $ | 101.32 | 8.24 | $ | 14,815 | ||||||||||
| Granted |
3,000 | 190.00 | 249 | |||||||||||||
| Forfeited |
— | 100.00 | — | |||||||||||||
|
|
|
|
|
|||||||||||||
| Balance at December 31, 2009 |
294,603 | $ | 102.22 | 7.27 | $ | 15,064 | ||||||||||
|
|
|
|
|
|||||||||||||
| Exercisable at December 31, 2009 |
170,162 | $ | 100.45 | 7.24 | ||||||||||||
| Balance at December 31, 2009 |
294,603 | $ | 102.22 | 7.27 | $ | 15,064 | ||||||||||
| Granted |
20,000 | 212.90 | 1,792 | |||||||||||||
| Forfeited |
(787 | ) | 100.00 | (39 | ) | |||||||||||
|
|
|
|
|
|||||||||||||
| Balance at December 31, 2010 |
313,816 | $ | 109.28 | 6.49 | $ | 16,817 | ||||||||||
|
|
|
|
|
|||||||||||||
| Exercisable at December 31, 2010 |
228,296 | $ | 100.91 | 6.27 | ||||||||||||
| Balance at December 31, 2010 |
313,816 | $ | 109.28 | 6.49 | $ | 16,817 | ||||||||||
| Granted |
20,000 | 262.52 | 2,604 | |||||||||||||
|
|
|
|
|
|||||||||||||
| Balance at December 31, 2011 |
333,816 | $ | 118.46 | 5.78 | $ | 19,421 | ||||||||||
|
|
|
|
|
|||||||||||||
| Exercisable at December 31, 2011 |
291,216 | $ | 102.71 | 5.56 | ||||||||||||
85
Table of Contents
WIRECO WORLDGROUP (CAYMAN) INC. AND SUBSIDIARIES
Notes to Consolidated Financial Statements – (Continued)
(all currencies in thousands, except per share data)
The Company recorded share-based compensation expense of $3,841, $3,161 and $3,034 for the years ended December 31, 2011, 2010 and 2009, respectively, in Administrative expenses in the accompanying consolidated statements of operations. Total unrecognized compensation cost of $3,677 for time-based options remains to be expensed as of December 31, 2011. At December 31, 2011, there were 156,124 options available for future grants under the Plan.
| (b) | Performance-based Stock Options |
In 2007 and 2008, the Company issued non-qualified performance-based options to certain members of management to purchase an aggregate of 73,276 shares. These performance-based options have exercise prices ranging from $100 to $132 per share and vest if (i) Paine & Partners Capital Fund III, L.P. receives cash equal to or in excess of 300% of the total investment in the Company and (ii) at that time, the employee is employed with the Company. Compensation expense of $2,751 will be recognized based on the grant date fair value when the achievement of the performance condition is considered probable. The table below lists the assumptions used to value the performance-based options granted by the Company:
| Expected volatility |
50.00 | % | ||||||
| Risk-free interest rate |
2.76 | % | ||||||
| Expected options life (years) |
4.0 | |||||||
| Fair value per option |
$ | 33.90 – 42.45 |
| (12) | Employee Benefits |
Collective Bargaining Agreements
At December 31, 2011, approximately 65% of the Company’s employees were covered by collective bargaining agreements. In the United States, the Company has collective bargaining agreements with the employees at the St. Joseph plant and the Chillicothe plant. Our international locations all have collective bargaining agreements, except the China JV. The current agreements have expiration dates as follows:
| Location |
Collective Bargaining Unit |
Expiration | ||
| St. Joseph, Missouri | United Steelworkers of America Local 5783 | June 30, 2013 | ||
| St. Joseph, Missouri | International Brotherhood of Electric Workers Local 545 | December 31, 2014 | ||
| Chillicothe, Missouri | United Steelworkers of America Local 990-1 | February 28, 2014 | ||
| Vallejo, Mexico | Sindicato Progresista de Trabajadores de la Industria Metálica, del Plástico, del Vidrio, Similares y Conexos de la República Mexicana | October 31, 2012 | ||
| Cuautitlan, Mexico | Indicato de Trabajdores de la Industria Metálica y Metal-Mecánica de la Industria y Maquila de Cables de Acero, Alambres, Compra-Venta de Materiales, Maquinaria y Refacciones, Maquinados, Soldadura, Arrendamiento de Equipo, Similares y Conexos del Estado de México | December 31, 2012 | ||
| Kirkel, Germany | Industriegewerkschaft Metall | May 31, 2013 | ||
| Maia and Paredes, Portugal | Federação dos Sindicatos dos Trabalhadores Texteis, Lanifícios, Vesturário, Calçado e Peles de Portugal (“FESETE”) | February 28, 2011(1) | ||
| Włocławek, Poland | Trade Union of Metal Workers in DRUMET, the Independent and Self-Governing Trade Union Solidarność in DRUMET and Technicians and Engineers Trade Union | December 31, 2014 |
86
Table of Contents
WIRECO WORLDGROUP (CAYMAN) INC. AND SUBSIDIARIES
Notes to Consolidated Financial Statements – (Continued)
(all currencies in thousands, except per share data)
| (1) | The collective bargaining agreement for the year 2012 has not been formally approved; the previous agreement issued on February 28, 2011 still applies. |
401(k) Plan
The Company provides an employer match benefit to those U.S. employees who participate in its defined contribution 401(k) plan. The Company’s matching contributions were $1,112, $1,094 and $505 for the years ended December 31, 2011, 2010 and 2009, respectively.
Pension and Other Post-employment Benefits
The Company has defined benefit pension plans that cover certain employees at its manufacturing facilities in Mexico and Germany and its distribution facility in the Netherlands. In addition, certain defined post-employment benefits are provided under Mexico labor law and apply to certain employees.
In December 2011, the Company announced changes to one of its Mexican defined benefit plans. The plan was frozen and participant balances were contributed to a defined contribution plan. This benefit plan change resulted in the elimination of any expected years of future employee service associated with this plan. As a result, a pretax curtailment gain of $741 was recognized in Administrative expenses in the accompanying consolidated statement of operations for the year ended December 31, 2011.
The following table sets forth the plans’ benefit obligations, the fair value of plan assets and the plans’ funded status at December 31, 2011 and 2010:
| Pension benefits | Post-employment benefits | |||||||||||||||
| 2011 | 2010 | 2011 | 2010 | |||||||||||||
| Benefit obligations |
$ | 5,451 | $ | 4,869 | $ | 427 | $ | 450 | ||||||||
| Fair value of plan assets |
1,292 | 1,162 | — | — | ||||||||||||
|
|
|
|
|
|
|
|
|
|||||||||
| Funded status |
$ | (4,159 | ) | $ | (3,707 | ) | $ | (427 | ) | $ | (450 | ) | ||||
|
|
|
|
|
|
|
|
|
|||||||||
| Amounts recognized in the consolidated balance sheets consist of: |
||||||||||||||||
| Current liabilities |
$ | (234 | ) | $ | (245 | ) | $ | (102 | ) | $ | (47 | ) | ||||
| Noncurrent liabilities |
(3,925 | ) | (3,462 | ) | (325 | ) | (403 | ) | ||||||||
|
|
|
|
|
|
|
|
|
|||||||||
| Amount recognized |
$ | (4,159 | ) | $ | (3,707 | ) | $ | (427 | ) | $ | (450 | ) | ||||
|
|
|
|
|
|
|
|
|
|||||||||
Weighted average assumptions used to determine benefit obligations and net benefit cost for the years ended December 31, 2011, 2010 and 2009 were as follows:
| Pension benefits | Post-employment benefits | |||||||||||||||||||||||
| 2011 | 2010 | 2009 | 2011 | 2010 | 2009 | |||||||||||||||||||
| Discount rate |
5.60 | % | 5.71 | % | 6.40 | % | 7.75 | % | 8.00 | % | 8.75 | % | ||||||||||||
| Expected long-term rate of return on plan assets |
4.52 | 4.77 | — | — | — | — | ||||||||||||||||||
| Rate of compensation increase |
1.93 | 1.94 | 2.19 | 4.54 | 5.51 | 5.52 | ||||||||||||||||||
The Company’s expected long-term rate of return on plan assets is based on the portfolio as a whole and not on the sum of the returns on individual asset categories. The return is based exclusively on historical returns, without adjustments.
87
Table of Contents
WIRECO WORLDGROUP (CAYMAN) INC. AND SUBSIDIARIES
Notes to Consolidated Financial Statements – (Continued)
(all currencies in thousands, except per share data)
The following table summarizes benefit costs, employer contributions and benefits paid during 2011, 2010 and 2009:
| Pension benefits | Post-employment benefits | |||||||||||||||||||||||
| 2011 | 2010 | 2009 | 2011 | 2010 | 2009 | |||||||||||||||||||
| Net benefit cost |
$ | (173 | ) | 564 | 438 | 15 | 125 | 158 | ||||||||||||||||
| Employer contributions |
79 | 158 | — | — | — | — | ||||||||||||||||||
| Benefits paid |
209 | 217 | 218 | — | 6 | — | ||||||||||||||||||
The benefits expected to be paid from the pension plans in each year from 2012 – 2016 are $282, $280, $322, $328 and $364, respectively. The aggregate benefits expected to be paid in the five years from 2017– 2021 are $2,303. The expected benefits are based on the same assumptions used to measure the Company’s benefit obligations at December 31, 2011 and include estimated future employee service.
The benefits expected to be paid from the post-employment benefit plans in each year from 2012 – 2016 are $107, $96, $87, $78 and $68, respectively. The aggregate benefits expected to be paid in the five years from 2017 – 2021 are $255. The expected benefits are based on the same assumptions used to measure the Company’s benefit obligations at December 31, 2011 and include estimated future employee service.
| (13) | Restructuring |
During 2011, the Company implemented a workforce reduction plan at certain European manufacturing facilities to increase operating efficiencies and utilize synergies. As a result, the Company terminated 93 employees and recorded charges of $1,682 associated with these terminations in Administrative expenses in the accompanying consolidated statement of operations. Also during 2011, the Company closed two distribution centers due to a consolidation and reorganization of the Company’s distribution network. As a result of these closures, the Company terminated 27 employees and recorded $1,150 in employee termination benefits and other associated costs in Administrative expenses in the accompanying consolidated statement of operations. As of December 31, 2011, $2,294 was accrued for severance and other related restructuring costs in Other current accrued liabilities.
A rollforward of the restructuring activities is set forth below:
| Balance at December 31, 2010 |
$ | — | ||
| Restructuring charges |
2,832 | |||
| Payments |
(538 | ) | ||
|
|
|
|||
| Balance at December 31, 2011 |
$ | 2,294 | ||
|
|
|
In 2009, the global recession lowered sales and gross profit. In order to better align the operating costs with the lower customer demand, the Company implemented a workforce reduction plan in addition to other cost containment measures. During 2009, the Company terminated 326 employees and recorded charges of $3,013 associated with these terminations in Administrative expenses in the accompanying consolidated statement of operations.
88
Table of Contents
WIRECO WORLDGROUP (CAYMAN) INC. AND SUBSIDIARIES
Notes to Consolidated Financial Statements – (Continued)
(all currencies in thousands, except per share data)
| (14) | Income Taxes |
The provision for income taxes is based on income (loss) before income taxes as follows:
| 2011 | 2010 | 2009 | ||||||||||
| U.S. operations |
$ | (46,758 | ) | $ | (30,314 | ) | $ | (36,352 | ) | |||
| Foreign operations |
1,067 | 10,579 | 36,003 | |||||||||
|
|
|
|
|
|
|
|||||||
| Loss before income taxes |
$ | (45,691 | ) | $ | (19,735 | ) | $ | (349 | ) | |||
|
|
|
|
|
|
|
|||||||
For the years ended December 31, 2011, 2010 and 2009, the components of income tax benefit (expense) consisted of the following:
| 2011 | 2010 | 2009 | ||||||||||
| Current: |
||||||||||||
| U.S. federal |
$ | (1,600 | ) | $ | (1,720 | ) | $ | 34 | ||||
| State and local |
(298 | ) | (389 | ) | (330 | ) | ||||||
| Foreign jurisdictions |
(8,341 | ) | (6,174 | ) | (8,539 | ) | ||||||
|
|
|
|
|
|
|
|||||||
| Total current expense |
(10,239 | ) | (8,283 | ) | (8,835 | ) | ||||||
|
|
|
|
|
|
|
|||||||
| Deferred: |
||||||||||||
| U.S. federal |
4,263 | 10,307 | 10,957 | |||||||||
| State and local |
680 | 719 | 1,317 | |||||||||
| Foreign jurisdictions |
280 | 10,427 | 996 | |||||||||
|
|
|
|
|
|
|
|||||||
| Total deferred benefit |
5,223 | 21,453 | 13,270 | |||||||||
|
|
|
|
|
|
|
|||||||
| Income tax benefit (expense) |
$ | (5,016 | ) | $ | 13,170 | $ | 4,435 | |||||
|
|
|
|
|
|
|
|||||||
Income taxes attributable to loss before income taxes differed from the amounts computed by applying the U.S. federal income tax rate of 34% to pretax loss as a result of the following:
| 2011 | 2010 | 2009 | ||||||||||
| Computed “expected” tax benefit |
$ | 15,535 | $ | 6,710 | $ | 119 | ||||||
| State income taxes, net |
484 | 463 | 1,267 | |||||||||
| Foreign tax rate differential |
(2,288 | ) | 5,511 | 7,338 | ||||||||
| Permanent differences |
(6,140 | ) | (5,434 | ) | (423 | ) | ||||||
| Net increases (decreases) in reserves for uncertain tax positions |
104 | (2,623 | ) | (2,301 | ) | |||||||
| Change in deferred tax asset valuation allowance |
(13,045 | ) | 8,197 | (874 | ) | |||||||
| Other, net |
334 | 346 | (691 | ) | ||||||||
|
|
|
|
|
|
|
|||||||
| Income tax benefit (expense) |
$ | (5,016 | ) | $ | 13,170 | $ | 4,435 | |||||
|
|
|
|
|
|
|
|||||||
The foreign tax rate differential reflects the difference in the tax rates in the jurisdictions that the Company operates compared to the U.S. federal income tax rate. The permanent differences are primarily composed of a variety of differences to compute taxable income for the Company’s Mexican and Polish subsidiaries.
89
Table of Contents
WIRECO WORLDGROUP (CAYMAN) INC. AND SUBSIDIARIES
Notes to Consolidated Financial Statements – (Continued)
(all currencies in thousands, except per share data)
The tax effects of temporary differences that give rise to significant portions of the deferred tax assets and deferred tax liabilities as of December 31, 2011 and 2010 are presented below:
| 2011 | 2010 | |||||||
| Deferred tax assets: |
||||||||
| Unrealized loss on interest rate swaps |
$ | — | $ | 491 | ||||
| Disallowed interest carryforward |
24,126 | 18,170 | ||||||
| Domestic net operating loss carryforwards |
11,872 | 11,222 | ||||||
| Foreign net operating loss carryforwards |
5,862 | 5,358 | ||||||
| Foreign tax credits and alternative minimum tax carryforwards |
1,023 | 1,023 | ||||||
| Foreign tax on net assets to be recovered |
3,025 | 3,286 | ||||||
| Unrealized currency losses |
15 | 10 | ||||||
| Inventories |
501 | — | ||||||
| Other deductible temporary differences |
11,021 | 6,760 | ||||||
|
|
|
|
|
|||||
| Total gross deferred tax assets |
57,445 | 46,320 | ||||||
| Less: Valuation allowance |
(18,086 | ) | (5,041 | ) | ||||
|
|
|
|
|
|||||
| Net deferred tax assets |
39,359 | 41,279 | ||||||
|
|
|
|
|
|||||
| Deferred tax liabilities: |
||||||||
| Property, plant and equipment |
(26,419 | ) | (27,610 | ) | ||||
| Intangible assets |
(32,756 | ) | (34,748 | ) | ||||
| Inventories |
— | (1,394 | ) | |||||
| Other taxable temporary differences |
(2,312 | ) | (1,009 | ) | ||||
|
|
|
|
|
|||||
| Total gross deferred liabilities |
(61,487 | ) | (64,761 | ) | ||||
|
|
|
|
|
|||||
| Net deferred tax liabilities |
$ | (22,128 | ) | $ | (23,482 | ) | ||
|
|
|
|
|
|||||
These amounts have been presented in the accompanying consolidated balance sheets as follows:
| 2011 | 2010 | |||||||
| Net current deferred tax assets |
$ | 3,398 | $ | 5,622 | ||||
| Net noncurrent deferred tax liabilities |
(25,526 | ) | (29,104 | ) | ||||
|
|
|
|
|
|||||
| Net deferred tax liabilities |
$ | (22,128 | ) | $ | (23,482 | ) | ||
|
|
|
|
|
|||||
The Company is required to assess the ultimate realization of deferred tax assets using a “more likely than not” assessment of realization. The ultimate realization of deferred tax assets is dependent upon the generation of future taxable income during the periods in which those temporary differences become deductible. Management considers the expected reversal of deferred tax liabilities (including the impact of available carryback and carryforward opportunities), projected future taxable income from the reversal of temporary differences and tax-planning strategies in making this assessment.
The Company recorded a valuation allowance of $18,086 and $5,041 at December 31, 2011 and 2010, respectively, against certain deferred tax assets primarily related to tax credits generated from Mexican subsidiaries, foreign tax credits and interest expense deductions in the U.S. and net operating losses in the U.S. and Portugal. Management believes that the recoverability of a portion of certain acquired and generated deferred tax assets is not more likely than not because the ultimate realization of the tax asset is mainly dependent on the availability of future taxable income in Mexico and other countries of $17,427 and the ability of the U.S. entities to utilize foreign tax credits of $659. The ultimate amount of deferred tax
90
Table of Contents
WIRECO WORLDGROUP (CAYMAN) INC. AND SUBSIDIARIES
Notes to Consolidated Financial Statements – (Continued)
(all currencies in thousands, except per share data)
assets realized could be materially different from that recorded, as impacted by changes in federal or foreign income tax laws and upon the generation of future taxable income to enable the Company to realize the related tax assets particularly the Company’s tax asset for disallowed interest given the Company’s borrowing structure and anticipated future interest expense.
As discussed above, the U.S. companies generated excess foreign tax credits of $659, which may only be utilized to offset U.S. taxes imposed on foreign source income. At December 31, 2011 and 2010, the Company has domestic net operating loss carryforwards, without the impact of adopting guidance on accounting for uncertainty in income taxes in accordance with ASC 740-10-25, of $38,817 and $38,588, respectively. These losses may be carried forward and will begin to expire if unutilized beginning in 2027. At December 31, 2011 and 2010, the Company has net operating loss carryforwards for Mexico income tax purposes of approximately $1,084 and $16,137, respectively, which are available to offset future Mexico taxable income, if any.
At December 31, 2011, the Company has not provided tax on cumulative undistributed earnings of foreign subsidiaries, with the exception of Peru and Canada, because it is the Company’s intention to reinvest these earnings indefinitely. These earnings relate to ongoing operations and, at December 31, 2011, were approximately $119,365. The taxes provided on the cumulative undistributed earnings of Peru and Canada are not significant. If earnings were distributed, the Company would be subject to income taxes and withholding taxes payable to various governments. It is impractical to determine the taxes due at that time.
In accordance with ASC 740, the Company is required to inventory, evaluate, and measure all uncertain tax positions taken or to be taken on tax returns, and to record liabilities for the amount of such positions that may not be sustained, or may only partially be sustained, upon examination by the relevant taxing authorities.
The following table summarizes the Company’s reconciliation of unrecognized tax benefits, excluding penalties and interest, for the years ended December 31, 2011, 2010 and 2009:
| 2011 | 2010 | 2009 | ||||||||||
| Balance at beginning of period |
$ | 14,461 | $ | 10,089 | $ | 8,112 | ||||||
| Increases based on current year tax positions |
235 | 612 | 535 | |||||||||
| Increases for prior years’ tax positions |
8,078 | 4,760 | 1,796 | |||||||||
| Decreases for prior years’ tax positions |
(4,753 | ) | (1,000 | ) | (354 | ) | ||||||
|
|
|
|
|
|
|
|||||||
| Balance at end of period |
$ | 18,021 | $ | 14,461 | $ | 10,089 | ||||||
|
|
|
|
|
|
|
|||||||
The net amount of unrecognized tax benefits at December 31, 2011, 2010 and 2009 that, if recognized, would favorably impact our effective tax rate was $18,454, $14,699 and $8,854, respectively. The increase for prior years’ tax positions includes $2,204 related to the Company’ acquisition of Drumet. This increase is not reflected in tax expense in 2011. Tax expense for 2011, 2010 and 2009 reflects accrued interest and penalties related to uncertain tax positions of $335, $404 and $550, respectively. The total accrued interest and penalties included on the consolidated balance sheets at December 31, 2011, 2010 and 2009 was $2,069, $3,155 and $1,683 respectively.
We estimate that it is reasonably possible that the amount of gross unrecognized tax benefits will increase by $700 to $2,800 over the next twelve months due to various federal, state and foreign audit settlements, uncertainty regarding similar positions and the expiration of statutes of limitations.
| (15) | Related party Transactions |
Paine & Partners, LLC (“Paine & Partners”), which manages the funds that control the Company, has entered into agreements with the Company to provide administrative and other support services. The Company paid management fees of $2,300, $2,100 and $2,900 for the years ended December 31, 2011,
91
Table of Contents
WIRECO WORLDGROUP (CAYMAN) INC. AND SUBSIDIARIES
Notes to Consolidated Financial Statements – (Continued)
(all currencies in thousands, except per share data)
2010 and 2009, respectively. In addition to these fees, the Company paid $1,000, $2,000 and $650 during 2011, 2010 and 2009, respectively, associated with Paine & Partners’ services related to acquisitions. Also, in 2010 the Company paid Paine & Partners fees of $2,750 related to the issuance of the $275,000 aggregate principal amount of Senior Notes. The fees associated with the Senior Notes issuance were capitalized as debt issuance costs and all other fees were recorded in Administrative expenses in the consolidated statements of operations.
| (16) | Commitments and Contingencies |
Commitments
The Company leases certain buildings, machinery and equipment and vehicles under non-cancelable operating and capital leases with varying expiration dates. Operating leases generally have 3 to 10 year terms, with one or more renewal options. Rent expense under operating leases was $5,216, $5,223 and $4,204 for the years ended December 31, 2011, 2010 and 2009, respectively.
Using the exchange rates in effect at year end, future minimum lease payments at December 31, 2011, were as follows:
| Capital leases |
Operating leases |
Total | ||||||||||
| 2012 |
$ | 4,679 | $ | 4,534 | $ | 9,213 | ||||||
| 2013 |
3,268 | 4,057 | 7,325 | |||||||||
| 2014 |
888 | 3,686 | 4,574 | |||||||||
| 2015 |
1,419 | 3,154 | 4,573 | |||||||||
| 2016 |
201 | 2,330 | 2,531 | |||||||||
| Thereafter |
511 | 2,047 | 2,558 | |||||||||
|
|
|
|
|
|
|
|||||||
| 10,966 | $ | 19,808 | $ | 30,774 | ||||||||
|
|
|
|
|
|||||||||
| Less: Interest portion |
(1,042 | ) | ||||||||||
|
|
|
|||||||||||
| Total |
$ | 9,924 | ||||||||||
|
|
|
|||||||||||
The amounts payable in relation to the capital leases are recorded in the consolidated balance sheets in Other accrued liabilities (current and noncurrent captions).
Contingencies
The Company is involved in various claims and legal actions arising in the ordinary course of business, which are incidental to its operations. The Company currently maintains insurance coverage for certain risks, such as product liability and workers’ compensation. In accordance with ASC Topic 450, Contingencies, the Company establishes accruals for litigation matters when the Company believes it is probable that a loss has been incurred and the amount of the loss can be reasonably estimated. As of December 31, 2011, the Company has accrued approximately $487 for certain outstanding legal proceedings. If the Company has not accrued an amount because the litigation does not meet the criteria for accrual as set forth above, the Company discloses the matter if a material loss is reasonably possible. For matters which have progressed sufficiently through discovery and development of important factual information and legal issues, the Company is able to estimate a range of possible loss. At December 31, 2011, none of the Company’s legal proceedings met the reasonably possible criterion.
92
Table of Contents
WIRECO WORLDGROUP (CAYMAN) INC. AND SUBSIDIARIES
Notes to Consolidated Financial Statements – (Continued)
(all currencies in thousands, except per share data)
| (17) | Segment Reporting |
The Company reports the manufacturing, marketing, selling and distribution of wire and synthetic ropes, electromechanical cable, specialty wire and related products as one global enterprise. The Company has five operating segments that reflect geographic regions, including the United States, Mexico, Germany, Portugal and Poland. The production processes across each of these operating segments exhibit a high degree of similarity involving stranding wire or synthetic fiber and closing the resulting strand into wire or synthetic rope. The Company has established a global sales force organized by geography and supported by end-market directors and an international operations group, which parallels the global sales structure with one senior member of management responsible for North American operations and another senior member of management responsible for European operations. Additionally, the global supply chain management functions of logistics, purchasing and planning are headquartered at the corporate office. In order to align employee interests with the Company’s global objectives, one of the Company’s employee primary incentive plans is based upon consolidated results of the Company. Financial information reported at the consolidated level is used by corporate management in evaluating overall financial and operational performance, market strategies and decisions to allocate capital resources. Based upon all of these factors, the Company has concluded that it has one reportable segment.
Enterprise-wide Disclosures and Concentration of Business
Net sales
Net sales, classified by the geographic areas in which the Company operates, were as follows:
| Net sales | ||||||||||||
| Years ended December 31, | ||||||||||||
| 2011 | 2010 | 2009 | ||||||||||
| United States |
$ | 304,959 | $ | 265,847 | $ | 198,915 | ||||||
| Mexico |
94,312 | 80,791 | 77,806 | |||||||||
| Germany |
105,975 | 95,148 | 106,532 | |||||||||
| Portugal |
63,393 | 5,892 | — | |||||||||
| Poland |
36,288 | — | — | |||||||||
|
|
|
|
|
|
|
|||||||
| Total |
$ | 604,927 | $ | 447,678 | $ | 383,253 | ||||||
|
|
|
|
|
|
|
|||||||
Long-lived assets, net
The Company’s net long-lived assets, classified by the geographic areas in which the Company operates, were as follows:
| Long-lived assets, net (1) | ||||||||||||
| As of December 31, | ||||||||||||
| 2011 | 2010 | 2009 | ||||||||||
| United States |
$ | 255,748 | $ | 270,297 | $ | 269,920 | ||||||
| Mexico |
74,684 | 80,081 | 88,942 | |||||||||
| Germany |
57,834 | 61,406 | 70,666 | |||||||||
| Portugal |
67,754 | 72,121 | — | |||||||||
| Poland |
58,730 | — | — | |||||||||
|
|
|
|
|
|
|
|||||||
| Total |
$ | 514,750 | $ | 483,905 | $ | 429,528 | ||||||
|
|
|
|
|
|
|
|||||||
| (1) | Long-lived assets are defined as property, plant and equipment, intangible assets and goodwill. |
93
Table of Contents
WIRECO WORLDGROUP (CAYMAN) INC. AND SUBSIDIARIES
Notes to Consolidated Financial Statements – (Continued)
(all currencies in thousands, except per share data)
| (18) | Selected Quarterly Financial Data (Unaudited) |
The following tables show selected quarterly financial data for each quarter of 2011 and 2010:
| Quarter ended | ||||||||||||||||
| 2011 |
December 31, 2011 |
September 30, 2011 |
June 30, 2011 |
March 31, 2011 |
||||||||||||
| Net sales |
$ | 156,988 | $ | 163,786 | $ | 145,432 | $ | 138,721 | ||||||||
| Gross profit |
43,755 | 39,526 | 38,685 | 36,607 | ||||||||||||
| Operating income |
16,016 | 15,046 | 11,534 | 14,413 | ||||||||||||
| Net income (loss) |
(22,928 | )(1) | (20,868 | ) | (11,074 | ) | 4,163 | |||||||||
| Quarter ended | ||||||||||||||||
| 2010 |
December 31, 2010 |
September 30, 2010 |
June 30, 2010 |
March 31, 2010 |
||||||||||||
| Net sales |
$ | 118,895 | $ | 115,722 | $ | 108,433 | $ | 104,628 | ||||||||
| Gross profit |
31,278 | 30,342 | 29,919 | 26,992 | ||||||||||||
| Operating income |
5,506 | 12,227 | 13,233 | 10,388 | ||||||||||||
| Net income (loss) |
(12,227 | ) | 10,001 | (2,736 | ) | (1,603 | ) | |||||||||
| (1) | During the fourth quarter of 2011, the Company recorded an other than temporary impairment charge related to the Company’s investment in the China JV of $6,646 and reserved $3,550 against the Company’s advances to the China JV. Refer to Note 7—“Investment in and Advances to the China JV” for further information. Also, $1,454 of income tax benefit was recorded in the fourth quarter of 2011 that related to prior years. This error did not have a material impact on results previously reported. |
| (19) | Condensed Consolidating Financial Statements |
Guarantees of the Senior Notes
As discussed in Note 8—“Borrowings”, the Company has Senior Notes, which are unsecured obligations of WireCo WorldGroup Inc. (the “Issuer”). The Issuer is an indirect, consolidated subsidiary of the Company. These obligations are jointly and severally and fully and unconditionally guaranteed by WireCo WorldGroup (Cayman) Inc., the ultimate parent company. Certain entities controlled by the Company (collectively referred to as the “Guarantors”) also jointly and severally and fully and unconditionally guarantee these obligations, subject to customary release provisions. All voting shares for the entities presented in the “Guarantors” column are 100% owned by the Company. WRCA Hong Kong Holding Company Limited, which holds the investment in the China JV, and the Mexican subsidiaries of WireCo WorldGroup Inc. are collectively referred to as the “Non-Guarantor Subsidiaries”. There are currently no significant restrictions on the ability of WireCo WorldGroup Inc. or any guarantor to obtain funds from its subsidiaries by dividend or loan.
The following condensed consolidating financial statements are prepared with each entity’s investment in subsidiaries accounted for under the equity method, as applicable. The adjustments eliminate investments in subsidiaries, related stockholders’ equity and other intercompany balances and transactions. During the fourth quarter of 2011, WireCo WorldGroup Limited (Cyprus) (“WireCo Cyprus”) was redomiciled to the Cayman Islands and merged with WireCo WorldGroup (Cayman) Inc. and as such, activity as of December 31, 2011 and for the period from November 9, 2011 through December 31, 2011, is included in the parent column. Prior to the merger, WireCo Cyprus was reflected in the “Guarantors” column. As of December 31, 2009 and for the first three quarters of 2010, Phillystran was a separate legal entity and reflected in the “Guarantors” column. During the fourth quarter of 2010, Phillystran was legally liquidated into WireCo WorldGroup Inc. and as such, is included in the “Issuer” column for the fourth quarter of 2010 and subsequent periods.
94
Table of Contents
WIRECO WORLDGROUP (CAYMAN) INC. AND SUBSIDIARIES
Notes to Consolidated Financial Statements – (Continued)
(all currencies in thousands, except per share data)
Condensed Consolidating Balance Sheets
| December 31, 2011 | ||||||||||||||||||||||||
| WireCo WorldGroup (Cayman) Inc. |
Issuer | Guarantors | Non-Guarantor Subsidiaries |
Elimination Adjustments |
Total Company Consolidated |
|||||||||||||||||||
| Assets | ||||||||||||||||||||||||
| Current assets: |
||||||||||||||||||||||||
| Cash and cash equivalents |
$ | 3 | $ | 2,265 | $ | 18,324 | $ | 7,071 | $ | — | $ | 27,663 | ||||||||||||
| Accounts receivable, less allowance for doubtful accounts |
— | 43,998 | 46,374 | 18,235 | — | 108,607 | ||||||||||||||||||
| Intercompany accounts receivable |
15,144 | 36,822 | 38,117 | 23,255 | (113,338 | ) | — | |||||||||||||||||
| Other receivables |
— | 552 | 2,947 | — | — | 3,499 | ||||||||||||||||||
| Inventories, net |
— | 100,829 | 70,265 | 28,395 | (11,945 | ) | 187,544 | |||||||||||||||||
| Prepaid expenses and other current assets |
— | 2,965 | 1,553 | 2,401 | — | 6,919 | ||||||||||||||||||
| Deferred income taxes |
— | — | 1,766 | 1,500 | 156 | 3,422 | ||||||||||||||||||
|
|
|
|
|
|
|
|
|
|
|
|
|
|||||||||||||
| Total current assets |
15,147 | 187,431 | 179,346 | 80,857 | (125,127 | ) | 337,654 | |||||||||||||||||
| Intercompany notes receivable |
— | 161,693 | — | 2,623 | (164,316 | ) | — | |||||||||||||||||
| Property, plant and equipment, net |
— | 68,658 | 110,327 | 57,161 | — | 236,146 | ||||||||||||||||||
| Intangible assets, net |
— | 48,546 | 51,215 | 10,012 | — | 109,773 | ||||||||||||||||||
| Goodwill |
— | 117,855 | 43,467 | 7,509 | — | 168,831 | ||||||||||||||||||
| Investment in subsidiaries |
148,257 | 142,707 | 61,175 | — | (352,139 | ) | — | |||||||||||||||||
| Investment in and advances to the China joint venture |
— | — | — | — | — | — | ||||||||||||||||||
| Deferred financing fees, net |
— | 19,192 | — | — | — | 19,192 | ||||||||||||||||||
| Deferred income taxes |
— | 984 | 2,453 | — | — | 3,437 | ||||||||||||||||||
| Other noncurrent assets |
— | 426 | 9,692 | 552 | — | 10,670 | ||||||||||||||||||
|
|
|
|
|
|
|
|
|
|
|
|
|
|||||||||||||
| Total assets |
$ | 163,404 | $ | 747,492 | $ | 457,675 | $ | 158,714 | $ | (641,582 | ) | $ | 885,703 | |||||||||||
|
|
|
|
|
|
|
|
|
|
|
|
|
|||||||||||||
| Liabilities and Stockholders’ Equity | ||||||||||||||||||||||||
| Current liabilities: |
||||||||||||||||||||||||
| Borrowings under revolving credit agreement |
$ | — | $ | 16,101 | $ | — | $ | — | $ | — | $ | 16,101 | ||||||||||||
| Current maturities of long-term debt |
— | 1,000 | 12,416 | — | — | 13,416 | ||||||||||||||||||
| Interest payable |
— | 6,475 | 6 | — | — | 6,481 | ||||||||||||||||||
| Accrued compensation and benefits |
— | 7,027 | 6,579 | 1,159 | — | 14,765 | ||||||||||||||||||
| Accounts payable |
74 | 18,143 | 14,417 | 27,107 | — | 59,741 | ||||||||||||||||||
| Intercompany accounts payable |
1,132 | 73,434 | 31,126 | 4,461 | (110,153 | ) | — | |||||||||||||||||
| Intercompany notes payable |
— | — | 3,163 | — | (3,163 | ) | — | |||||||||||||||||
| Deferred income taxes |
— | 24 | — | — | — | 24 | ||||||||||||||||||
| Acquisition installment payments |
— | — | 9,802 | — | — | 9,802 | ||||||||||||||||||
| Other accrued liabilities |
82 | 4,892 | 6,970 | 2,695 | (22 | ) | 14,617 | |||||||||||||||||
|
|
|
|
|
|
|
|
|
|
|
|
|
|||||||||||||
| Total current liabilities |
1,288 | 127,096 | 84,479 | 35,422 | (113,338 | ) | 134,947 | |||||||||||||||||
| Long-term debt, excluding current maturities |
— | 552,798 | 12,246 | — | — | 565,044 | ||||||||||||||||||
| Intercompany notes payable |
— | — | 164,307 | — | (164,307 | ) | — | |||||||||||||||||
| Deferred income taxes |
— | 3,771 | 19,793 | 5,399 | — | 28,963 | ||||||||||||||||||
| Other accrued liabilities |
— | 9,823 | 13,681 | 3,718 | (9 | ) | 27,213 | |||||||||||||||||
|
|
|
|
|
|
|
|
|
|
|
|
|
|||||||||||||
| Total liabilities |
1,288 | 693,488 | 294,506 | 44,539 | (277,654 | ) | 756,167 | |||||||||||||||||
|
|
|
|
|
|
|
|
|
|
|
|
|
|||||||||||||
| Stockholders’ equity: |
||||||||||||||||||||||||
| Total stockholders’ equity attributable to WireCo WorldGroup (Cayman) Inc. |
162,116 | 54,004 | 163,299 | 114,175 | (363,928 | ) | 129,666 | |||||||||||||||||
| Non-controlling interests |
— | — | (130 | ) | — | — | (130 | ) | ||||||||||||||||
|
|
|
|
|
|
|
|
|
|
|
|
|
|||||||||||||
| Total stockholders’ equity |
162,116 | 54,004 | 163,169 | 114,175 | (363,928 | ) | 129,536 | |||||||||||||||||
|
|
|
|
|
|
|
|
|
|
|
|
|
|||||||||||||
| Total liabilities and stockholders’ equity |
$ | 163,404 | $ | 747,492 | $ | 457,675 | $ | 158,714 | $ | (641,582 | ) | $ | 885,703 | |||||||||||
|
|
|
|
|
|
|
|
|
|
|
|
|
|||||||||||||
95
Table of Contents
WIRECO WORLDGROUP (CAYMAN) INC. AND SUBSIDIARIES
Notes to Consolidated Financial Statements – (Continued)
(all currencies in thousands, except per share data)
| December 31, 2010 | ||||||||||||||||||||||||
| WireCo WorldGroup (Cayman) Inc. |
Issuer | Guarantors | Non-Guarantor Subsidiaries |
Elimination Adjustments |
Total Company Consolidated |
|||||||||||||||||||
| Assets | ||||||||||||||||||||||||
| Current assets: |
||||||||||||||||||||||||
| Cash and cash equivalents |
$ | — | $ | 35,481 | $ | 16,838 | $ | 1,561 | $ | — | $ | 53,880 | ||||||||||||
| Accounts receivable, less allowance for doubtful accounts |
— | 38,241 | 28,742 | 19,977 | — | 86,960 | ||||||||||||||||||
| Intercompany accounts receivable |
— | 31,007 | 47,304 | 22,909 | (101,220 | ) | — | |||||||||||||||||
| Other receivables |
— | 2,155 | 1,766 | — | — | 3,921 | ||||||||||||||||||
| Inventories, net |
— | 74,682 | 52,116 | 20,975 | (6,222 | ) | 141,551 | |||||||||||||||||
| Prepaid expenses and other current assets |
— | 3,477 | 3,133 | 3,332 | — | 9,942 | ||||||||||||||||||
| Deferred income taxes |
— | — | 4,655 | 2,074 | — | 6,729 | ||||||||||||||||||
|
|
|
|
|
|
|
|
|
|
|
|
|
|||||||||||||
| Total current assets |
— | 185,043 | 154,554 | 70,828 | (107,442 | ) | 302,983 | |||||||||||||||||
| Intercompany notes receivable |
— | 96,918 | — | 2,663 | (99,581 | ) | — | |||||||||||||||||
| Property, plant and equipment, net |
— | 73,793 | 68,235 | 58,560 | — | 200,588 | ||||||||||||||||||
| Intangible assets, net |
— | 54,273 | 45,725 | 13,169 | — | 113,167 | ||||||||||||||||||
| Goodwill |
— | 117,855 | 43,943 | 8,352 | — | 170,150 | ||||||||||||||||||
| Investment in subsidiaries |
197,821 | 125,399 | 87,220 | — | (410,440 | ) | — | |||||||||||||||||
| Investment in and advances to the China joint venture |
— | 4,413 | — | 9,700 | — | 14,113 | ||||||||||||||||||
| Deferred financing fees, net |
— | 19,366 | — | — | — | 19,366 | ||||||||||||||||||
| Other noncurrent assets |
— | 1,023 | 945 | 71 | — | 2,039 | ||||||||||||||||||
|
|
|
|
|
|
|
|
|
|
|
|
|
|||||||||||||
| Total assets |
$ | 197,821 | $ | 678,083 | $ | 400,622 | $ | 163,343 | $ | (617,463 | ) | $ | 822,406 | |||||||||||
|
|
|
|
|
|
|
|
|
|
|
|
|
|||||||||||||
| Liabilities and Stockholders’ Equity | ||||||||||||||||||||||||
| Current liabilities: |
||||||||||||||||||||||||
| Current maturities of long-term debt |
$ | — | $ | 2,423 | $ | 97 | $ | — | $ | — | $ | 2,520 | ||||||||||||
| Interest payable |
— | 3,859 | — | — | — | 3,859 | ||||||||||||||||||
| Accounts payable |
— | 13,419 | 9,296 | 20,818 | — | 43,533 | ||||||||||||||||||
| Accrued compensation and benefits |
— | 4,189 | 1,553 | 1,066 | — | 6,808 | ||||||||||||||||||
| Intercompany accounts payable |
33 | 52,907 | 38,893 | 9,407 | (101,240 | ) | — | |||||||||||||||||
| Deferred income taxes |
— | 1,107 | — | — | — | 1,107 | ||||||||||||||||||
| Other accrued liabilities |
— | 4,404 | 8,851 | 5,413 | 20 | 18,688 | ||||||||||||||||||
|
|
|
|
|
|
|
|
|
|
|
|
|
|||||||||||||
| Total current liabilities |
33 | 82,308 | 58,690 | 36,704 | (101,220 | ) | 76,515 | |||||||||||||||||
| Long-term debt, excluding current maturities |
— | 499,546 | 702 | — | — | 500,248 | ||||||||||||||||||
| Intercompany notes payable |
— | — | 81,679 | 17,901 | (99,580 | ) | — | |||||||||||||||||
| Deferred income taxes |
— | 6,649 | 18,416 | 4,039 | — | 29,104 | ||||||||||||||||||
| Other accrued liabilities |
— | 9,708 | 6,866 | 4,896 | — | 21,470 | ||||||||||||||||||
|
|
|
|
|
|
|
|
|
|
|
|
|
|||||||||||||
| Total liabilities |
33 | 598,211 | 166,353 | 63,540 | (200,800 | ) | 627,337 | |||||||||||||||||
|
|
|
|
|
|
|
|
|
|
|
|
|
|||||||||||||
| Stockholders’ equity: |
||||||||||||||||||||||||
| Total stockholders’ equity attributable to WireCo WorldGroup (Cayman) Inc. |
197,788 | 79,872 | 233,006 | 99,803 | (416,663 | ) | 193,806 | |||||||||||||||||
| Non-controlling interests |
— | — | 1,263 | — | — | 1,263 | ||||||||||||||||||
|
|
|
|
|
|
|
|
|
|
|
|
|
|||||||||||||
| Total stockholders’ equity |
197,788 | 79,872 | 234,269 | 99,803 | (416,663 | ) | 195,069 | |||||||||||||||||
|
|
|
|
|
|
|
|
|
|
|
|
|
|||||||||||||
| Total liabilities and stockholders’ equity |
$ | 197,821 | $ | 678,083 | $ | 400,622 | $ | 163,343 | $ | (617,463 | ) | $ | 822,406 | |||||||||||
|
|
|
|
|
|
|
|
|
|
|
|
|
|||||||||||||
96
Table of Contents
WIRECO WORLDGROUP (CAYMAN) INC. AND SUBSIDIARIES
Notes to Consolidated Financial Statements – (Continued)
(all currencies in thousands, except per share data)
Condensed Consolidating Statements of Operations
| Year ended December 31, 2011 | ||||||||||||||||||||||||
| WireCo WorldGroup (Cayman) Inc. |
Issuer | Guarantors | Non-Guarantor Subsidiaries |
Elimination Adjustments |
Total Company Consolidated |
|||||||||||||||||||
| Net sales |
$ | — | $ | 310,483 | $ | 262,717 | $ | 172,577 | $ | (140,850 | ) | $ | 604,927 | |||||||||||
| Cost of sales |
— | (244,925 | ) | (188,589 | ) | (148,080 | ) | 135,240 | (446,354 | ) | ||||||||||||||
|
|
|
|
|
|
|
|
|
|
|
|
|
|||||||||||||
| Gross profit |
— | 65,558 | 74,128 | 24,497 | (5,610 | ) | 158,573 | |||||||||||||||||
|
|
|
|
|
|
|
|
|
|
|
|
|
|||||||||||||
| Other operating expenses: |
||||||||||||||||||||||||
| Selling expenses |
— | (9,907 | ) | (14,824 | ) | (1,336 | ) | — | (26,067 | ) | ||||||||||||||
| Administrative expenses |
(244 | ) | (45,182 | ) | (11,623 | ) | (5,281 | ) | — | (62,330 | ) | |||||||||||||
| Amortization expense |
— | (5,728 | ) | (5,462 | ) | (1,977 | ) | — | (13,167 | ) | ||||||||||||||
|
|
|
|
|
|
|
|
|
|
|
|
|
|||||||||||||
| Total other operating expenses |
(244 | ) | (60,817 | ) | (31,909 | ) | (8,594 | ) | — | (101,564 | ) | |||||||||||||
|
|
|
|
|
|
|
|
|
|
|
|
|
|||||||||||||
| Operating income (loss) |
(244 | ) | 4,741 | 42,219 | 15,903 | (5,610 | ) | 57,009 | ||||||||||||||||
|
|
|
|
|
|
|
|
|
|
|
|
|
|||||||||||||
| Other income (expense): |
||||||||||||||||||||||||
| Interest expense, net |
— | (37,796 | ) | (12,061 | ) | (1,206 | ) | — | (51,063 | ) | ||||||||||||||
| Loss on investment in and advances to the China JV |
— | (7,725 | ) | (482 | ) | (24,700 | ) | (108 | ) | (33,015 | ) | |||||||||||||
| Equity earnings (losses) from subsidiaries |
(49,565 | ) | 17,308 | (66,415 | ) | — | 98,672 | — | ||||||||||||||||
| Foreign currency exchange gains (losses) |
— | 862 | (15,453 | ) | 2,146 | — | (12,445 | ) | ||||||||||||||||
| Loss on extinguishment of long-term debt |
— | (5,654 | ) | — | — | — | (5,654 | ) | ||||||||||||||||
| Other income (expense), net |
— | (552 | ) | 96 | (67 | ) | — | (523 | ) | |||||||||||||||
|
|
|
|
|
|
|
|
|
|
|
|
|
|||||||||||||
| Other expense, net |
(49,565 | ) | (33,557 | ) | (94,315 | ) | (23,827 | ) | 98,564 | (102,700 | ) | |||||||||||||
|
|
|
|
|
|
|
|
|
|
|
|
|
|||||||||||||
| Loss before income taxes |
(49,809 | ) | (28,816 | ) | (52,096 | ) | (7,924 | ) | 92,954 | (45,691 | ) | |||||||||||||
| Income tax benefit (expense) |
— | 3,045 | (5,979 | ) | (2,238 | ) | 156 | (5,016 | ) | |||||||||||||||
|
|
|
|
|
|
|
|
|
|
|
|
|
|||||||||||||
| Net loss |
(49,809 | ) | (25,771 | ) | (58,075 | ) | (10,162 | ) | 93,110 | (50,707 | ) | |||||||||||||
| Less: Net loss attributable to non-controlling interests |
— | — | (1,142 | ) | — | — | (1,142 | ) | ||||||||||||||||
|
|
|
|
|
|
|
|
|
|
|
|
|
|||||||||||||
| Net loss attributable to WireCo WorldGroup (Cayman), Inc. |
$ | (49,809 | ) | $ | (25,771 | ) | $ | (56,933 | ) | $ | (10,162 | ) | $ | 93,110 | $ | (49,565 | ) | |||||||
|
|
|
|
|
|
|
|
|
|
|
|
|
|||||||||||||
97
Table of Contents
WIRECO WORLDGROUP (CAYMAN) INC. AND SUBSIDIARIES
Notes to Consolidated Financial Statements – (Continued)
(all currencies in thousands, except per share data)
| Year ended December 31, 2010 | ||||||||||||||||||||||||
| WireCo WorldGroup (Cayman) Inc. |
Issuer | Guarantors | Non-Guarantor Subsidiaries |
Elimination Adjustments |
Total Company Consolidated |
|||||||||||||||||||
| Net sales |
$ | — | $ | 273,327 | $ | 142,720 | $ | 142,394 | $ | (110,763 | ) | $ | 447,678 | |||||||||||
| Cost of sales |
— | (218,817 | ) | (100,140 | ) | (119,755 | ) | 109,565 | (329,147 | ) | ||||||||||||||
|
|
|
|
|
|
|
|
|
|
|
|
|
|||||||||||||
| Gross profit |
— | 54,510 | 42,580 | 22,639 | (1,198 | ) | 118,531 | |||||||||||||||||
|
|
|
|
|
|
|
|
|
|
|
|
|
|||||||||||||
| Operating expenses: |
||||||||||||||||||||||||
| Selling expenses |
— | (10,558 | ) | (5,728 | ) | (1,234 | ) | — | (17,520 | ) | ||||||||||||||
| Administrative expenses |
(8 | ) | (24,745 | ) | (17,391 | ) | (5,077 | ) | — | (47,221 | ) | |||||||||||||
| Amortization expense |
— | (5,737 | ) | (4,761 | ) | (1,938 | ) | — | (12,436 | ) | ||||||||||||||
|
|
|
|
|
|
|
|
|
|
|
|
|
|||||||||||||
| Total operating expenses |
(8 | ) | (41,040 | ) | (27,880 | ) | (8,249 | ) | — | (77,177 | ) | |||||||||||||
|
|
|
|
|
|
|
|
|
|
|
|
|
|||||||||||||
| Operating income (loss) |
(8 | ) | 13,470 | 14,700 | 14,390 | (1,198 | ) | 41,354 | ||||||||||||||||
|
|
|
|
|
|
|
|
|
|
|
|
|
|||||||||||||
| Other income (expense): |
||||||||||||||||||||||||
| Interest expense, net |
— | (29,444 | ) | (4,287 | ) | 11 | — | (33,720 | ) | |||||||||||||||
| Loss on investment in and advances to the China JV |
— | — | — | (16,658 | ) | (68 | ) | (16,726 | ) | |||||||||||||||
| Equity earnings (losses) from subsidiaries |
(6,255 | ) | 18,696 | 3,335 | — | (15,776 | ) | — | ||||||||||||||||
| Foreign currency gains (losses) |
— | 2,781 | (5,194 | ) | (637 | ) | — | (3,050 | ) | |||||||||||||||
| Loss on extinguishment of long-term debt |
— | (6,520 | ) | — | — | — | (6,520 | ) | ||||||||||||||||
| Other income (expense), net |
— | (566 | ) | 103 | (610 | ) | — | (1,073 | ) | |||||||||||||||
|
|
|
|
|
|
|
|
|
|
|
|
|
|||||||||||||
| Other income (expense), net |
(6,255 | ) | (15,053 | ) | (6,043 | ) | (17,894 | ) | (15,844 | ) | (61,089 | ) | ||||||||||||
|
|
|
|
|
|
|
|
|
|
|
|
|
|||||||||||||
| Income (loss) before income taxes |
(6,263 | ) | (1,583 | ) | 8,657 | (3,504 | ) | (17,042 | ) | (19,735 | ) | |||||||||||||
| Income tax benefit |
— | 8,938 | 703 | 3,529 | — | 13,170 | ||||||||||||||||||
|
|
|
|
|
|
|
|
|
|
|
|
|
|||||||||||||
| Net income (loss) |
(6,263 | ) | 7,355 | 9,360 | 25 | (17,042 | ) | (6,565 | ) | |||||||||||||||
| Less: Net loss attributable to non-controlling interests |
— | — | (310 | ) | — | — | (310 | ) | ||||||||||||||||
|
|
|
|
|
|
|
|
|
|
|
|
|
|||||||||||||
| Net income (loss) attributable to WireCo WorldGroup (Cayman), Inc. |
$ | (6,263 | ) | $ | 7,355 | $ | 9,670 | $ | 25 | $ | (17,042 | ) | $ | (6,255 | ) | |||||||||
|
|
|
|
|
|
|
|
|
|
|
|
|
|||||||||||||
98
Table of Contents
WIRECO WORLDGROUP (CAYMAN) INC. AND SUBSIDIARIES
Notes to Consolidated Financial Statements – (Continued)
(all currencies in thousands, except per share data)
| Year ended December 31, 2009 | ||||||||||||||||||||||||
| WireCo WorldGroup (Cayman) Inc. |
Issuer | Guarantors | Non-Guarantor Subsidiaries |
Elimination Adjustments |
Total Company Consolidated |
|||||||||||||||||||
| Net sales |
$ | — | $ | 209,559 | $ | 134,786 | $ | 118,137 | $ | (79,229 | ) | $ | 383,253 | |||||||||||
| Cost of sales |
— | (179,805 | ) | (90,295 | ) | (105,848 | ) | 81,588 | (294,360 | ) | ||||||||||||||
|
|
|
|
|
|
|
|
|
|
|
|
|
|||||||||||||
| Gross profit |
— | 29,754 | 44,491 | 12,289 | 2,359 | 88,893 | ||||||||||||||||||
|
|
|
|
|
|
|
|
|
|
|
|
|
|||||||||||||
| Operating expenses: |
||||||||||||||||||||||||
| Selling expenses |
— | (7,576 | ) | (1,166 | ) | (1,521 | ) | — | (10,263 | ) | ||||||||||||||
| Administrative expenses |
(25 | ) | (20,947 | ) | (13,301 | ) | (6,297 | ) | — | (40,570 | ) | |||||||||||||
| Amortization expense |
— | (5,528 | ) | (4,672 | ) | (1,807 | ) | — | (12,007 | ) | ||||||||||||||
|
|
|
|
|
|
|
|
|
|
|
|
|
|||||||||||||
| Total operating expenses |
(25 | ) | (34,051 | ) | (19,139 | ) | (9,625 | ) | — | (62,840 | ) | |||||||||||||
|
|
|
|
|
|
|
|
|
|
|
|
|
|||||||||||||
| Operating income (loss) |
(25 | ) | (4,297 | ) | 25,352 | 2,664 | 2,359 | 26,053 | ||||||||||||||||
|
|
|
|
|
|
|
|
|
|
|
|
|
|||||||||||||
| Other income (expense): |
||||||||||||||||||||||||
| Interest expense, net |
— | (19,894 | ) | (4,124 | ) | (700 | ) | — | (24,718 | ) | ||||||||||||||
| Loss on investment in and advances to the China JV |
— | — | — | (3,703 | ) | — | (3,703 | ) | ||||||||||||||||
| Equity earnings (losses) from subsidiaries |
5,446 | 2,944 | (17,743 | ) | — | 9,353 | (0 | ) | ||||||||||||||||
| Foreign currency gains (losses) |
— | (1,533 | ) | 3,213 | 1,588 | — | 3,268 | |||||||||||||||||
| Other income (expense), net |
— | (997 | ) | 248 | (500 | ) | — | (1,249 | ) | |||||||||||||||
|
|
|
|
|
|
|
|
|
|
|
|
|
|||||||||||||
| Other income (expense), net |
5,446 | (19,480 | ) | (18,406 | ) | (3,315 | ) | 9,353 | (26,402 | ) | ||||||||||||||
|
|
|
|
|
|
|
|
|
|
|
|
|
|||||||||||||
| Income (loss) before income taxes |
5,421 | (23,777 | ) | 6,946 | (651 | ) | 11,712 | (349 | ) | |||||||||||||||
| Income tax benefit (expense) |
— | 11,259 | (5,869 | ) | (955 | ) | — | 4,435 | ||||||||||||||||
|
|
|
|
|
|
|
|
|
|
|
|
|
|||||||||||||
| Net income (loss) |
5,421 | (12,518 | ) | 1,077 | (1,606 | ) | 11,712 | 4,086 | ||||||||||||||||
| Less: Net loss attributable to non-controlling interests |
— | — | (1,360 | ) | — | — | (1,360 | ) | ||||||||||||||||
|
|
|
|
|
|
|
|
|
|
|
|
|
|||||||||||||
| Net income (loss) attributable to WireCo WorldGroup (Cayman), Inc. |
$ | 5,421 | $ | (12,518 | ) | $ | 2,437 | $ | (1,606 | ) | $ | 11,712 | $ | 5,446 | ||||||||||
|
|
|
|
|
|
|
|
|
|
|
|
|
|||||||||||||
99
Table of Contents
WIRECO WORLDGROUP (CAYMAN) INC. AND SUBSIDIARIES
Notes to Consolidated Financial Statements – (Continued)
(all currencies in thousands, except per share data)
Condensed Consolidating Statements of Cash Flows
| Year ended December 31, 2011 | ||||||||||||||||||||||||
| WireCo WorldGroup (Cayman) Inc. |
Issuer | Guarantors | Non-Guarantor Subsidiaries |
Elimination Adjustments |
Total Company Consolidated |
|||||||||||||||||||
| Net cash provided by (used in) operating activities |
$ | 3 | $ | (18,740 | ) | $ | 15,328 | $ | 14,062 | $ | — | $ | 10,653 | |||||||||||
|
|
|
|
|
|
|
|
|
|
|
|
|
|||||||||||||
| Cash flows from investing activities: |
||||||||||||||||||||||||
| Investment in and advances to China joint venture |
— | (2,560 | ) | — | (15,000 | ) | — | (17,560 | ) | |||||||||||||||
| Capital expenditures |
— | (8,006 | ) | (4,241 | ) | (11,715 | ) | — | (23,962 | ) | ||||||||||||||
| Investment in subsidiaries |
— | — | (40,369 | ) | 40,369 | — | — | |||||||||||||||||
| Acquisition of business, net of cash acquired |
— | — | (51,813 | ) | — | — | (51,813 | ) | ||||||||||||||||
|
|
|
|
|
|
|
|
|
|
|
|
|
|||||||||||||
| Net cash provided by (used in) investing activities |
— | (10,566 | ) | (96,423 | ) | 13,654 | — | (93,335 | ) | |||||||||||||||
|
|
|
|
|
|
|
|
|
|
|
|
|
|||||||||||||
| Cash flows from financing activities: |
||||||||||||||||||||||||
| Principal payments on long-term debt |
— | (1,357 | ) | (409 | ) | — | — | (1,766 | ) | |||||||||||||||
| Proceeds from issuance of senior notes, including discount/premium |
— | 157,125 | — | — | — | 157,125 | ||||||||||||||||||
| Debt issuance costs paid |
— | (8,790 | ) | — | — | — | (8,790 | ) | ||||||||||||||||
| Retirement of long-term debt |
— | (132,814 | ) | — | — | — | (132,814 | ) | ||||||||||||||||
| Amendment fees paid to third-parties |
— | (1,495 | ) | — | — | — | (1,495 | ) | ||||||||||||||||
| Net borrowings under revolving credit agreements |
— | 44,696 | — | — | — | 44,696 | ||||||||||||||||||
| Increases (decreases) in intercompany notes |
— | (61,275 | ) | 83,176 | (21,901 | ) | — | — | ||||||||||||||||
|
|
|
|
|
|
|
|
|
|
|
|
|
|||||||||||||
| Net cash provided by (used in) financing activities |
— | (3,910 | ) | 82,767 | (21,901 | ) | — | 56,956 | ||||||||||||||||
|
|
|
|
|
|
|
|
|
|
|
|
|
|||||||||||||
| Effect of exchange rates on cash and cash equivalents |
— | — | (186 | ) | (305 | ) | — | (491 | ) | |||||||||||||||
|
|
|
|
|
|
|
|
|
|
|
|
|
|||||||||||||
| Increase (decrease) in cash and cash equivalents |
3 | (33,216 | ) | 1,486 | 5,510 | — | (26,217 | ) | ||||||||||||||||
| Cash and cash equivalents, beginning of period |
— | 35,481 | 16,838 | 1,561 | — | 53,880 | ||||||||||||||||||
|
|
|
|
|
|
|
|
|
|
|
|
|
|||||||||||||
| Cash and cash equivalents, end of period |
$ | 3 | $ | 2,265 | $ | 18,324 | $ | 7,071 | $ | — | $ | 27,663 | ||||||||||||
|
|
|
|
|
|
|
|
|
|
|
|
|
|||||||||||||
100
Table of Contents
WIRECO WORLDGROUP (CAYMAN) INC. AND SUBSIDIARIES
Notes to Consolidated Financial Statements – (Continued)
(all currencies in thousands, except per share data)
| Year ended December 31, 2010 | ||||||||||||||||||||||||
| WireCo WorldGroup (Cayman) Inc. |
Issuer | Guarantors | Non-Guarantor Subsidiaries |
Elimination Adjustments |
Total Company Consolidated |
|||||||||||||||||||
| Net cash provided by (used in) operating activities |
$ | — | $ | (2,086 | ) | $ | (3,904 | ) | $ | 1,639 | $ | — | $ | (4,351 | ) | |||||||||
|
|
|
|
|
|
|
|
|
|
|
|
|
|||||||||||||
| Cash flows from investing activities: |
||||||||||||||||||||||||
| Investment in and advances to China joint venture |
— | (2,121 | ) | — | — | — | (2,121 | ) | ||||||||||||||||
| Capitalization of interest paid on investment in China joint venture |
— | — | — | (1,416 | ) | — | (1,416 | ) | ||||||||||||||||
| Acquisition of businesses, net of cash acquired |
— | — | (80,888 | ) | — | — | (80,888 | ) | ||||||||||||||||
| Capital contributions, net |
— | (44,639 | ) | 44,639 | — | — | — | |||||||||||||||||
| Capital expenditures |
— | (12,766 | ) | (1,812 | ) | (3,323 | ) | — | (17,901 | ) | ||||||||||||||
|
|
|
|
|
|
|
|
|
|
|
|
|
|||||||||||||
| Net cash used in investing activities |
— | (59,526 | ) | (38,061 | ) | (4,739 | ) | — | (102,326 | ) | ||||||||||||||
|
|
|
|
|
|
|
|
|
|
|
|
|
|||||||||||||
| Cash flows from financing activities: |
||||||||||||||||||||||||
| Proceeds from long-term debt borrowing |
— | 65,000 | — | — | — | 65,000 | ||||||||||||||||||
| Principal payments on long-term debt |
— | (1,897 | ) | — | — | — | (1,897 | ) | ||||||||||||||||
| Proceeds from issuance of senior notes, net of OID |
— | 268,205 | — | — | — | 268,205 | ||||||||||||||||||
| Deferred financing fees paid |
— | (14,988 | ) | — | — | — | (14,988 | ) | ||||||||||||||||
| Repayment of senior notes |
— | (163,200 | ) | — | — | — | (163,200 | ) | ||||||||||||||||
| Amendment fees paid for long-term debt and revolving line of credit |
— | (1,580 | ) | — | — | — | (1,580 | ) | ||||||||||||||||
| Net borrowings (payments) under revolving credit agreement |
— | (10,556 | ) | — | — | — | (10,556 | ) | ||||||||||||||||
| Changes in intercompany note balances, net |
— | (52,334 | ) | 52,334 | — | — | — | |||||||||||||||||
|
|
|
|
|
|
|
|
|
|
|
|
|
|||||||||||||
| Net cash provided by financing activities |
— | 88,650 | 52,334 | — | — | 140,984 | ||||||||||||||||||
|
|
|
|
|
|
|
|
|
|
|
|
|
|||||||||||||
| Effect of exchange rates on cash and cash equivalents |
— | 3,230 | (94 | ) | 109 | — | 3,245 | |||||||||||||||||
|
|
|
|
|
|
|
|
|
|
|
|
|
|||||||||||||
| Increase (decrease) in cash and cash equivalents |
— | 30,268 | 10,275 | (2,991 | ) | — | 37,552 | |||||||||||||||||
| Cash and cash equivalents, beginning of year |
— | 5,213 | 6,563 | 4,552 | — | 16,328 | ||||||||||||||||||
|
|
|
|
|
|
|
|
|
|
|
|
|
|||||||||||||
| Cash and cash equivalents, end of year |
$ | — | $ | 35,481 | $ | 16,838 | $ | 1,561 | $ | — | $ | 53,880 | ||||||||||||
|
|
|
|
|
|
|
|
|
|
|
|
|
|||||||||||||
101
Table of Contents
WIRECO WORLDGROUP (CAYMAN) INC. AND SUBSIDIARIES
Notes to Consolidated Financial Statements – (Continued)
(all currencies in thousands, except per share data)
| Year ended December 31, 2009 | ||||||||||||||||||||||||
| WireCo WorldGroup (Cayman) Inc. |
Issuer | Guarantors | Non-Guarantor Subsidiaries |
Elimination Adjustments |
Total Company Consolidated |
|||||||||||||||||||
| Net cash provided by operating activities |
$ | — | $ | 41,893 | $ | 19,533 | $ | 8,243 | $ | — | $ | 69,669 | ||||||||||||
|
|
|
|
|
|
|
|
|
|
|
|
|
|||||||||||||
| Cash flows from investing activities: |
||||||||||||||||||||||||
| Investment in and advances to China joint venture |
— | (547 | ) | — | — | — | (547 | ) | ||||||||||||||||
| Capitalization of interest paid on investment in China joint venture |
— | — | — | (2,230 | ) | — | (2,230 | ) | ||||||||||||||||
| Acquisition of businesses |
— | — | (15,251 | ) | — | — | (15,251 | ) | ||||||||||||||||
| Capital contributions, net |
— | (15,251 | ) | 15,251 | — | — | — | |||||||||||||||||
| Capital expenditures |
— | (9,362 | ) | (2,214 | ) | (3,696 | ) | — | (15,272 | ) | ||||||||||||||
|
|
|
|
|
|
|
|
|
|
|
|
|
|||||||||||||
| Net cash used in investing activities |
— | (25,160 | ) | (2,214 | ) | (5,926 | ) | — | (33,300 | ) | ||||||||||||||
|
|
|
|
|
|
|
|
|
|
|
|
|
|||||||||||||
| Cash flows from financing activities: |
||||||||||||||||||||||||
| Principal payments on long-term debt |
— | (2,175 | ) | (3,496 | ) | — | — | (5,671 | ) | |||||||||||||||
| Net borrowings (payments) under revolving credit agreement |
— | (19,751 | ) | — | — | — | (19,751 | ) | ||||||||||||||||
| Changes in intercompany note balances, net |
— | 9,020 | (9,020 | ) | — | — | — | |||||||||||||||||
|
|
|
|
|
|
|
|
|
|
|
|
|
|||||||||||||
| Net cash used in financing activities |
— | (12,906 | ) | (12,516 | ) | — | — | (25,422 | ) | |||||||||||||||
|
|
|
|
|
|
|
|
|
|
|
|
|
|||||||||||||
| Effect of exchange rates on cash and cash equivalents |
— | — | (554 | ) | 124 | — | (430 | ) | ||||||||||||||||
|
|
|
|
|
|
|
|
|
|
|
|
|
|||||||||||||
| Increase in cash and cash equivalents |
— | 3,827 | 4,249 | 2,441 | — | 10,517 | ||||||||||||||||||
| Cash and cash equivalents, beginning of year |
— | 1,386 | 2,314 | 2,111 | — | 5,811 | ||||||||||||||||||
|
|
|
|
|
|
|
|
|
|
|
|
|
|||||||||||||
| Cash and cash equivalents, end of year |
$ | — | $ | 5,213 | $ | 6,563 | $ | 4,552 | $ | — | $ | 16,328 | ||||||||||||
|
|
|
|
|
|
|
|
|
|
|
|
|
|||||||||||||
102
Table of Contents
| Item 9. | Changes in and Disagreements with Accountants on Accounting and Financial Disclosure |
Not applicable.
| Item 9A. | Controls and Procedures |
Evaluation of Disclosure Controls and Procedures
We maintain “disclosure controls and procedures” as defined in Rules 13a-15(e) and 15d-15(e) under the Exchange Act, that are designed to provide reasonable assurance that information required to be disclosed by a company in the reports that it files or submits under the Exchange Act is recorded, processed, summarized and reported, within the time periods specified in the SEC’s rules and forms and that such information is accumulated and communicated to our management, including our principal executive officer and principal financial officer, as appropriate, to allow timely decisions regarding required disclosure. In designing and evaluating the disclosure controls and procedures, management recognizes that any controls and procedures, no matter how well designed and operated, can provide only reasonable, and not absolute, assurance of achieving the desired control objectives. In reaching a reasonable level of assurance, management necessarily was required to apply its judgment in evaluating the cost benefit relationship of possible controls and procedures.
Under the supervision and with the participation of our management, including our principal executive officer and principal financial officer, we conducted an evaluation prior to filing this report of our disclosure controls and procedures. Based on this evaluation, our principal executive officer and our principal financial officer concluded that our disclosure controls and procedures were effective as of December 31, 2011.
This annual report does not include a report of management’s assessment regarding internal control over financial reporting or an attestation report of our independent registered public accounting firm due to a transition period established by the rules of the SEC for newly public companies.
Changes in Internal Control over Financial Reporting
There were no changes in our internal control over financial reporting (as defined by Rules 13a-15(f) and 15d-15(f) under the Exchange Act) during the year ended December 31, 2011, that materially affected, or are reasonably likely to materially affect, our internal control over financial reporting.
| Item 9B. | Other Information |
None.
103
Table of Contents
| Item 10. | Directors, Executive Officers and Corporate Governance |
Executive Officers
The following table sets forth certain information of key executive officers:
| Name |
Age | Industry experience |
Title | |||
| Ira L. Glazer | 60 | 9 | President and Chief Executive Officer | |||
| Eric V. Bruder | 48 | 19 | Executive Vice President and Chief Operations Officer | |||
| J. Keith McKinnish | 54 | 6 | Senior Vice President and Chief Financial Officer | |||
| David T. Hornaday | 59 | 36 | Senior Vice President and Chief Administrative Officer | |||
| Wolfgang Oswald | 46 | 11 | Senior Vice President of Global Sales | |||
| Miguel Gomez | 44 | 11 | Senior Vice President of Sales, Western Hemisphere | |||
| Joaquin Barrios | 51 | 29 | Senior Vice President of Global Supply Chain |
The following our brief biographies of these executive officers:
Ira L. Glazer has been President and Chief Executive Officer of WireCo WorldGroup since July 2003. He is a member of our board of directors for WireCo WorldGroup, as well as the Company. Prior to this appointment, Mr. Glazer was a turnaround consultant/restructuring officer, with Getzler & Co., responsible for the design and implementation of our reorganization plan after we declared bankruptcy. Mr. Glazer spent five years in the turnaround business. Before his Chief Restructuring Officer position with us, Mr. Glazer was the Chief Executive Officer of Castle Dental Corp for nine months. Prior to Castle Dental Corp, Mr. Glazer had numerous consulting assignments, many as Chief Restructuring Officer. Mr. Glazer had a successful ten-year career with Maidenform holding the positions of Chief Financial Officer and Chief Operating Officer. Mr. Glazer started his career with Chase Manhattan Bank as a Vice President and Division Executive in commercial lending. He holds a Bachelor’s Degree in Business Administration from Pace University in New York.
Eric V. Bruder has been Executive Vice President and Chief Operations Officer since July 2007. He is responsible for our manufacturing and global supply chain, product engineering and technical services and quality systems. Mr. Bruder joined WireCo WorldGroup in October of 1992 and worked as a plant engineer for several years before moving to the positions of Corporate Plant Engineering Manager, Operations Manager of our Sedalia, Missouri plant and Senior Vice President of Manufacturing. He holds a Bachelor’s Degree in Engineering Technology from Missouri Western State University and a Master’s Degree in Business Administration from Rockhurst University. Prior to joining WireCo WorldGroup, Mr. Bruder served in the United States Army.
J. Keith McKinnish joined the Company in July 2006 as Senior Vice President and Chief Financial Officer. Mr. McKinnish has over 30 years of experience in corporate financial management. Prior to joining WireCo WorldGroup, Mr. McKinnish was the Chief Financial Officer of Curtis Papers, Inc. Previous to this position, Mr. McKinnish held numerous financial positions with Champion International during his 22-year tenure. Mr. McKinnish holds a Bachelor’s Degree in Economics from the University of North Carolina at Charlotte.
David T. Hornaday is Senior Vice President and Chief Administrative Officer. He directs global human resources, corporate communications, investor relations and marketing communications. Mr. Hornaday has been with WireCo WorldGroup since 1976, working in areas of general management, human resources, sales and marketing management, planning and logistics. He plays a key role in transforming the organization’s talent base while controlling fringe benefit costs. He also leads the Company’s marketing initiatives that strengthen the WireCo brand and launch new products. He has a journalism degree from the University of Missouri and a Master’s Degree in Business Administration from Southern Methodist University.
104
Table of Contents
Wolfgang Oswald is Senior Vice President of Global Sales. Mr. Oswald manages all sales activities in Europe, Asia, Africa and the Pacific Rim and oversees four of the global market directors’ efforts to develop and execute strategies to build the wire rope business in new and existing markets. Mr. Oswald joined CASAR, our German subsidiary, as Managing Director in 2003 after serving as Chief Executive Officer of the Paulsen Wire Rope Corporation, a former sister company of CASAR in the United States from 2001 to 2002. For the four years prior to that, Mr. Oswald was Managing Director of Viterra Sicherheit, a former subsidiary of the EON group, which at that time was Germany’s leading company for electronic alarm systems. Mr. Oswald has five years of experience in management consulting. He holds a Master’s Degree in Business Administration from the University of Augsburg, Germany and a Master’s Degree in Economics from Wayne State University in Detroit, Michigan.
Miguel Gomez is Senior Vice President of Sales, Western Hemisphere. He oversees all sales activities in North, Central and South America and provides guidance to the market directors for our high carbon wire, EMC and synthetic rope businesses. Mr. Gomez served as the Commercial Sales Director for Aceros Camesa for three years. Prior to joining Aceros Camesa in 2002, Mr. Gomez worked as a General Manager for Nissan in Mexico for two years. He also has several years of managerial experience with TXI Chaparral Steel Company. Mr. Gomez holds a Bachelor of Science Degree in Mechanical and Electrical Engineering from Universidad Iberoamericana, a diploma in marketing from the Instituto Tehnológico y de Est. Sup. de Monterrey (ITESM) and a Master’s Degree in Business Administration from McGill University (Montreal, Canada).
Joaquin Barrios was promoted to Senior Vice President of Global Supply Chain in October 2011. Prior to accepting this new role, Mr. Barrios was Senior Vice President of Mexican Operations. Mr. Barrios worked for Aceros Camesa from 1983 until 2011 and served as the Managing Director of Aceros Camesa for two years prior to WireCo’s acquisition of Aceros Camesa. He has held key positions for Aceros Camesa such as Technical Director and Commercial Director. In the past years, Mr. Barrios has also had the positions of President, Logistics Director, Exports Manager, Plant Manager of Aceros Camesa’s Vallejo Plant and Quality Control Manager. Mr. Barrios has a Metallurgical Degree from Instituto Politécnico Nacional and a Master’s Degree in Business Administration from Instituto Tecnológico Autonomo de México.
Board of Directors
Through control of a majority of the shares of WireCo, Paine & Partners Fund III and Paine & Partners and its affiliates have the power to control us and our affairs and policies, including the election of our directors and the appointment of our management team. One of the four members of our board of directors (“board”) is a partner of Paine & Partners and one of the remaining three members of our board is an advisor of Paine & Partners. Of WireCo WorldGroup Inc.’s board, one member is a partner of Paine & Partners, a second member is a former partner of Paine & Partners and four of the remaining five members are employees or advisors of Paine & Partners.
The following table sets forth the names and positions of WireCo WorldGroup (Cayman) Inc.’s board of directors and their ages as of March 15, 2012:
| Name |
Age | Title |
Date of appointment | |||
| Franklin Myers | 59 | Director | October 2009 | |||
| W. Dexter Paine, III | 51 | Director | December 2008 | |||
| Ira L. Glazer* | 60 | Director, President and Chief Executive Officer | December 2008 | |||
| James R. Tibbetts | 67 | Director | December 2008 |
| * | See biographical information above. |
Franklin Myers is an Operating Advisor at Paine & Partners. Mr. Myers serves as the Senior Advisor to Cameron International Corporation (“Cameron”). Before 2008, Mr. Myers served as the Senior Vice President
105
Table of Contents
and Chief Financial Officer of Cameron. Mr. Myers was the General Counsel and Corporate Secretary of Cameron from 1995 to 1999 and served as the President of Cameron’s Cooper Energy Services Division from 1998 until 2001. Mr. Myers currently serves on the board of directors of Comfort Systems, Inc. (FIX/NYSE), ION Geophysical Corporation (IO/NYSE) and Holly Frontier Corporation (f/k/a Frontier Oil Corporation). Mr. Myers serves as an Audit Committee member of Comfort Systems, Inc. and chairs the compensation committee of ION Geophysical Corporation. Mr. Myers holds a Bachelor of Science degree in Industrial Engineering from Mississippi State University and a Juris Doctor degree with Honors from the University of Mississippi.
W. Dexter Paine, III is a founding Partner of Paine & Partners. He began his professional career at Bankers Trust Company in Los Angeles. In 1987, Mr. Paine joined Robertson Stephens & Company to establish a leveraged buyout group for the firm. In 1994, Mr. Paine joined Kohlberg & Company to establish and head the firm’s West Coast office. In 1997, he co-founded the predecessor firm to Paine & Partners where he served as president from its inception until 2008. Mr. Paine serves as a member of the boards of directors of Cevian Capital and SM Group and as chairman of the board of directors of the U.S. Ski and Snowboard Association. Mr. Paine is a former member of the international board of directors of Right to Play and past chairman of the board and Emeritus Trustee of Holderness School and the Nueva School. Mr. Paine holds a Bachelor of Arts degree in Economics from Williams College.
James R. Tibbetts joined WRCA Distributor Limited (Cayman) in May 2007 as the operations manager. WRCA Distributor Limited (Cayman) owns and manages the customer relationships for the EMC products that WireCo manufactures and sells throughout the world. Mr. Tibbetts started his career in Trinidad with the Texaco refinery as an apprentice engineer in 1964. In 1965, Texaco awarded him a scholarship to study Mechanical Engineering. He graduated in 1968 and joined the engineering team at the refinery for two years. After a 1970 appointment as Production Manager at an appliance manufacturing factory he was promoted to Engineering Manager. Late in 1974 he managed a service and construction contracting company which provided services to offshore exploration and production platforms to the Texaco Refinery and many factories throughout the Island of Trinidad. He returned to the Cayman Islands in 1987 where he was employed by Texaco and managed their local marketing organization until 2004. From 2004 until 2007 he worked as a consultant and managed an aircraft fueling operation at the local airport. Since its establishment in 2010, Mr. Tibbetts serves as the Manager of WireCo WorldGroup Sales (Cayman) Ltd., an entity created to manage our international sales organization.
The following experience, qualifications, attributes and/or skills of the above individuals led the board to conclude that they should serve as a director: their professional background and experience, current and previously held leadership positions, board experience and extensive knowledge and understanding of our business operations.
The following table sets forth the names and positions of the board of directors of WireCo WorldGroup Inc. and their ages as of March 15, 2012:
| Name |
Age | Title |
Date of appointment | |||
| John J. Anton | 69 | Chairman of the board, member of Audit Committee | November 2010 | |||
| Franklin Myers * | 59 | Director, chairman of Audit Committee | March 2011 | |||
| Stephan Kessel | 58 | Director, member of Audit Committee and Compensation Committee |
March 2011 | |||
| Troy W. Thacker | 39 | Director, member of Audit Committee and Compensation Committee |
February 2007 | |||
| Thomas S. L. Anderman | 33 | Director | November 2010 | |||
| Ira L. Glazer* | 60 | Director, President and Chief Executive Officer | February 2007 |
| * | See biographical information above. |
106
Table of Contents
John “Jack” Anton is an Operating Director at Paine & Partners. Mr. Anton brings over 40 years of experience leading organizations and acting as an investor in the worldwide food, consumer products and specialty ingredients industries. Before joining the predecessor firm to Paine & Partners in 2005, from 2001 through 2004 he was a Senior Advisory Director with Fremont Partners, a private equity management firm, where he was instrumental in the acquisition and successful divestiture of Specialty Brands Inc. Prior to Fremont Partners, Mr. Anton was Chairman, Chief Executive Officer and co-owner of Ghiradelli Chocolate Company. He led the acquisition of Ghiradelli in 1992 and was responsible for revitalizing the company’s brand, marketing programs and growth prior to transitioning Ghiradelli to its new ownership. Mr. Anton served from 1983 to 1990 as Chairman and co-owner of Carlin Foods Corporation, a national food ingredient company serving the dairy, baking and food service industries; and from 1990 to 1992 as Chairman of Carlin Investment Corporation, which was created to invest in food and specialty chemical firms. Prior to forming Carlin Foods, he spent nearly 20 years in management and executive roles at Ralston Purina and Nabisco Brands Corporations. Mr. Anton holds a Bachelor of Science Degree in Chemistry from the University of Notre Dame. Mr. Anton serves on the board and Audit Committee of Con-Way, Inc. (NYSE: CNW) and Basic American Foods (a privately held food company). Mr. Anton is also a member of the Advisory Board of Notre Dame’s College of Science and a member of the Advisory Board of the University of San Francisco’s Business School.
Stephan Kessel is an Operating Director at Paine & Partners. Dr. Kessel has enjoyed a successful career as an operating executive and advisor for value-added industrial and manufacturing companies, with specific expertise in the automotive sector. Dr. Kessel began his career in a research and development capacity with Continental AG, the leading supplier of tires, brake and chassis systems to the automotive industry. In 1997, he became a member of the Executive Board and succeeded in leading the turnaround of Continental AG’s truck tire business after 12 years of reported losses. In 1999, Dr. Kessel was appointed Chief Executive Officer at Continental. In 2002, Dr. Kessel joined Investcorp International Ltd. as Advisory Director, where he was involved in several acquisitions and divestitures of portfolio companies. He served as Chairman on the Advisory Boards of Gerresheimer Glas, Minimax and Stahl. In 2005, Dr. Kessel became Vice Chairman of the Board of Directors of Vulcan Holdings Luxembourg S.a.r.l., the parent company of VCST Industrial Products, a portfolio investment company of Paine & Partners, and served in this capacity until its sale in December 2005. Between 2007 and 2011 Dr. Kessel served as chairman on the boards of Etimex Holding, a highly specialized packaging company for food and other industries and Global Safety Textiles, the leading supplier of safety textiles for airbags in cars and trucks. He serves on the board of R 360 Environmental Solutions, Inc., the leading specialist for end-to-end recycling of oilfield waste, WEPA Instrieholding SE, the manufacturer of high quality hygienic papers, and Minimax-Viking, the leader in fire protection systems. He is also chairman of the board of Armacell International, a leader in elastomeric insulation for building and other industries. Dr. Kessel was raised in Aachen, Germany and is a graduate of the Rheinisch Westfälische Technische Hochschule (University) of Aachen, from which he holds a Doctorate in Chemistry.
Troy W. Thacker is Chief Executive Officer of R360 Environmental Solutions, Inc., and a former Partner of Paine & Partners. Mr. Thacker began his career at Morgan Stanley & Co. assisting with the establishment of a regional corporate finance and M&A office in Houston, Texas. While at Morgan Stanley, Mr. Thacker worked on financings, mergers and acquisitions and other corporate transactions for energy and industrial companies based in the southwest region. In 1997, Mr. Thacker joined SCF Partners, a private equity investment firm focused on the energy services and equipment manufacturing markets, where he assisted with the management of approximately $1.0 billion of funds. During his tenure at SCF, he was involved with several new investments. After graduating from Harvard Business School in 2000, Mr. Thacker joined Gryphon Investors, Inc., a middle-market private equity firm based in San Francisco. While at Gryphon, Mr. Thacker focused on retail and business services investment opportunities. Mr. Thacker joined the predecessor firm to Paine & Partners in 2001 and was employed until July 2010 when he assumed his current position as CEO of R360 Environmental Solutions Inc. In addition to his Master’s of Business Administration from Harvard Business School, Mr. Thacker holds a Bachelor of Science degree in Chemical Engineering from Rice University.
107
Table of Contents
Thomas S. L. Anderman is a Principal at Paine & Partners. Mr. Anderman began his career at Salomon Smith Barney / Citigroup, where he was an Analyst in the consumer / retail investment banking group. In 2004, he joined Freeman Spogli & Co., a retail-focused private investment firm, as an Associate in the New York office. Mr. Anderman joined Merrill Lynch Global Private Equity / BAML Capital Partners in 2008 as a Senior Associate focusing on new investments in the consumer sector and on several portfolio companies. He was promoted to Vice President in 2009. Mr. Anderman joined Paine & Partner’s New York office in 2010. He focuses on existing portfolio companies and new investment opportunities. In addition to his Master’s of Business Administration from the Kellogg School of Management, Mr. Anderman holds a Bachelor of Arts degree in Economics and a Master’s degree in Sociology from Stanford University.
The following experience, qualifications, attributes and/or skills of the above individuals led the board to conclude that they should serve as a director: their professional background and experience, current and previously held leadership positions, board experience and extensive knowledge and understanding of our business operations.
Committees
Our board has an audit committee and a compensation committee. The duties and responsibilities of the audit committee include recommending the appointment or termination of the engagement of independent accountants, otherwise overseeing the independent auditor relationship and reviewing significant accounting policies and controls. Messrs. Myers (chairman), Anton, Thacker and Kessel are members of our audit committee. Mr. Myers serves as an “audit committee financial expert”, but is not independent under the rules of the New York Stock Exchange. The duties and responsibilities of the compensation committee include overseeing the compensation of our directors, officers and other employees, along with our overall compensation policies, strategies, plans and programs. Messrs. Paine (chairman), Kessel and Thacker are members of our compensation committee.
Code of Business Conduct and Ethics
We have a Code of Business Conduct and Ethics that applies to all our employees, including our executives. These standards are designed to deter wrongdoing and to promote honest and ethical conduct.
| Item 11. | Executive Compensation |
Non-employee Director Compensation
This section describes the compensation paid to our non-employee directors. In addition to the standard compensation, the chairman receives $25,000 annually for that position. Ira L. Glazer, our President and CEO, serves on both boards, but is not paid any compensation for his services on either of these boards. His compensation is included in the Summary Compensation Table. Additionally, James R. Tibbetts, Manager of WRCA Distributor (Cayman) Ltd. and WireCo WorldGroup Sales (Cayman) Ltd., is solely compensated for his service as a member of management, not as a director. As he is not a named executive officer, his compensation is not included in the table below.
The following table sets forth the compensation paid to our non-employee directors of WireCo WorldGroup (Cayman) Inc. in 2011:
| Name |
Fees earned or paid in cash ($) |
Stock awards ($) |
Option awards ($) |
Non-equity incentive plan compensation ($) |
Change in pension value and nonqualified deferred compensation earnings ($) |
All other compensation ($) |
Total ($) |
|||||||||||||||||||||
| Franklin Myers |
— | — | — | — | — | — | — | |||||||||||||||||||||
| W. Dexter Paine, III |
— | — | — | — | — | — | — | |||||||||||||||||||||
| James R. Tibbetts |
— | — | — | — | — | — | — | |||||||||||||||||||||
108
Table of Contents
The following table sets forth the compensation paid to our non-employee directors of WireCo WorldGroup Inc. in 2011:
| Fees earned or paid in cash |
Stock awards |
Option awards (1) |
Non-equity incentive plan compensation |
Change in pension value and nonqualified deferred compensation earnings |
All other compensation |
Total | ||||||||||||||||||||||
| Name |
($) | ($) | ($) | ($) | ($) | ($) | ($) | |||||||||||||||||||||
| John J. Anton |
175,000 | — | 390,600 | — | — | — | 565,600 | |||||||||||||||||||||
| Franklin Myers |
150,000 | — | 390,600 | — | — | — | 540,600 | |||||||||||||||||||||
| W. Dexter Paine, III |
— | — | — | — | — | — | — | |||||||||||||||||||||
| Stephan Kessel |
150,000 | — | 390,600 | — | — | — | 540,600 | |||||||||||||||||||||
| Troy W. Thacker |
— | — | — | — | — | — | — | |||||||||||||||||||||
| Thomas S. L. Anderman |
— | — | — | — | — | — | — | |||||||||||||||||||||
| (1) | These amounts reflect the grant date fair value of the awards granted. Refer to Note 11—“Share-based Compensation” to our consolidated financial statements included in Item 8, Financial Statements and Supplementary Data of this annual report for the relevant assumptions used to determine the valuation of our option awards. |
Compensation Discussion and Analysis
Introduction
This section provides a discussion of the background and objectives of our compensation programs for senior management, including the following officers whom we refer to as our named executive officers:
| Name |
Title | |
| Ira L. Glazer | President and Chief Executive Officer | |
| Eric V. Bruder | Executive Vice President and Chief Operations Officer | |
| J. Keith McKinnish | Senior Vice President and Chief Financial Officer | |
| Wolfgang Oswald | Senior Vice President of Global Sales | |
| Joaquin Barrios | Senior Vice President of Global Supply Chain |
Board of Directors and Role of Management
The board has the overall responsibility for monitoring and approving the compensation programs for our named executive officers and making decisions regarding compensation to be paid or awarded to them.
Objectives and Design of Our Compensation Program
Our executive compensation program is designed to attract, retain and reward talented executives who can contribute to our long-term success and is based on the following general principles:
| • | compensation must be competitive with that offered by other companies that compete with us for executive talent; |
| • | differences in compensation should reflect differing levels of responsibilities; and |
| • | performance-based compensation should focus on critical business objectives and align pay through performance-leveraged incentive opportunities. |
109
Table of Contents
The board recognizes that the engagement of strong talent in critical functions may entail recruiting new executives at times and involve negotiations with individual candidates. As a result, the board may determine in a particular situation that it is in the best interests of the Company to negotiate compensation packages that deviate from our general compensation philosophy.
The board did not seek input from outside compensation consultants with respect to annual compensation decisions.
Elements of Our Compensation Program
Base Salaries
Base salaries are intended to provide a level of compensation sufficient to attract and retain an effective management team, when considered in combination with the other components of our executive compensation program. The relative levels of base salary for our named executive officers are designed to reflect each executive officer’s scope of responsibility and accountability with the Company. Mr. Glazer from time to time may have received a substantially greater portion of his total compensation in the form of incentive pay because of the incentive opportunities negotiated as part of his employment agreements described later in this section.
Annual Incentives
We maintain an incentive plan called the Management EBITDA Bonus Plan (“EBITDA Bonus Plan”), which is based on Adjusted EBITDA, for the purpose of providing additional incentive compensation opportunities for our management and professional employees. For this plan, Adjusted EBITDA is defined in the same context we use in our business to measure our performance and liquidity. Refer to “Non-GAAP Financial Measures” included in Item 6, Selected Financial Data of this annual report for discussion of Adjusted EBITDA. With the exception of Mr. Glazer, all of our named executive officers participated in the EBITDA Bonus Plan for fiscal year 2011. Bonuses are earned quarterly under the plan if the Company attains certain minimum Adjusted EBITDA performance objectives in the applicable fiscal quarter. The EBITDA Bonus Plan was designed to align the interests of management towards the achievement of a common goal of maximizing Adjusted EBITDA for the Company. The common goal upon which awards are based in the EBITDA Bonus Plan is attainment of the Adjusted EBITDA as budgeted for the fiscal quarter. Generally, no bonuses are paid under the EBITDA Bonus Plan unless the Company achieves a threshold of 85% of the Adjusted EBITDA as budgeted in the quarter. The Company believes Adjusted EBITDA is an appropriate measure of Company performance to utilize in making performance-based compensation decisions as senior management uses the same measure to evaluate the day-to-day performance of the business. According to the terms of the plan, if the Adjusted EBITDA threshold is met, a bonus pool is established as a percentage of Adjusted EBITDA and allocated to an executive pool, a management pool and a sales management pool. Within those pools, all plan participants are assigned a Participation Level Factor, which is applied to their salary to determine an extended participation amount. The extended participation amount for the individual is then divided by the total extended participation amount for the group to determine the participant’s percentage of their respective pool. The Participation Level Factor is based on the participant’s level of responsibility.
110
Table of Contents
The table below depicts how the portion of the EBITDA Bonus Plan allocated to the executive pool was determined for each quarter in 2011.
| 1st quarter | 2nd quarter | 3rd quarter | 4th quarter | Annual | ||||||||||||||||||
| Budgeted Adjusted EBITDA |
25,982,100 | 29,547,700 | 33,205,900 | 27,309,900 | 116,045,600 | |||||||||||||||||
| Actual Adjusted EBITDA (a) |
29,316,200 | 29,691,900 | 29,241,800 | 30,800,700 | 119,050,600 | |||||||||||||||||
| Actual as a % of budget |
113 | % | 100 | % | 88 | % | 113 | % | ||||||||||||||
| Allocated bonus percentage (b) |
6 | % | 4 | % | 2 | % | 6 | % | ||||||||||||||
| Bonus pool |
1,768,833 | 1,194,107 | 616,581 | 1,740,683 | 5,320,204 | |||||||||||||||||
| Bonus pool allocated to executives (c) |
753,296 | 498,826 | 246,254 | 695,206 | 2,193,582 | |||||||||||||||||
| Executive pool: | Participation Level Factor % (d ) | |||||||||||||||||||||
| Eric V. Bruder |
146,924 | 100,726 | 48,680 | 138,303 | 434,633 | 110% | ||||||||||||||||
| J. Keith McKinnish |
117,926 | 79,644 | 38,491 | 109,355 | 345,416 | 110% | ||||||||||||||||
| Wolfgang Oswald |
89,974 | 53,718 | 26,901 | 71,717 | 242,310 | 75% | ||||||||||||||||
| Joaquin Barrios |
69,615 | 44,470 | 25,729 | 73,099 | 212,913 | 100% | ||||||||||||||||
| Other Executives |
328,857 | 220,268 | 106,453 | 302,732 | 958,310 | |||||||||||||||||
|
|
|
|
|
|
|
|
|
|
|
|||||||||||||
| Total |
753,296 | 498,826 | 246,254 | 695,206 | 2,193,582 | |||||||||||||||||
| (a) | Actual Adjusted EBITDA excludes Adjusted EBITDA generated by Drumet for the period following the July 18, 2011 acquisition through December 31, 2011 since the Polish subsidiary’s activity is not reflected in the Budgeted Adjusted EBITDA amount. |
| (b) | Allocated Bonus Percentage is targeted at 3% of Actual Adjusted EBITDA if the Actual Adjusted EBITDA is 100% of the budgeted Adjusted EBITDA. The allocation percentage will vary based upon the methodology documented in the Management EBITDA Bonus Plan. The pool as a percentage of Actual Adjusted EBITDA may be adjusted higher or lower based on the number of participants in the plan at the discretion of management, subject to approval by the Compensation Committee of the Board of Directors. |
| (c) | The amount of the bonus pool allocated to executives is based on a subjective percentage that is reviewed annually. In 2011, approximately 41% of the bonus pool was allocated to executives. |
| (d) | The Participation Level Factor % represents the factor applied to the quarterly base salary of each executive to determine the split of the total pool to each member of the executive pool. The Participation Level Factor % is designed to reflect each executive officer’s scope of responsibility and accountability with the Company. |
Mr. Glazer does not participate in our EBITDA Bonus Plan. Instead, he is eligible for an annual EBITDA Bonus Plan (the “CEO Plan”), which is based on budgeted Adjusted EBITDA for the year. The bonus plan, exclusively structured for the CEO, is designed to pay a bonus of 1% of actual Adjusted EBITDA for achievement of 100% of the budgeted Adjusted EBITDA; successful completion of the key objectives established for the fiscal year; and, the board’s judgment that the CEO exhibited the leadership and maintained the ethical standards representative of the Company’s goals and objectives. If actual Adjusted EBITDA exceeds budgeted Adjusted EBITDA by 10%, the bonus plan payment reaches a maximum target of 1.8% of actual Adjusted EBITDA.
Three factors contribute to the total bonus payout:
| (1) | Numerical measurement based on the actual Adjusted EBITDA contributes 75% of the annual bonus potential; |
| (2) | Achievement of the following “key objectives” for the fiscal year contributes 12.5% of the annual bonus potential: |
| (i) | Financial goals including earnings, working capital and cash management; |
| (ii) | Adherence to corporate compliance with laws such as safety, anti-trust and bribery; |
111
Table of Contents
| (iii) | Implementation of international sales strategy, including multi-tiered branding strategy; |
| (iv) | Continued improvement in the China JV; |
| (v) | Acquisitions and related synergy realization; and |
| (3) | The board’s assessment of the CEO’s “non-objective performance” such as leadership contributes 12.5% of the annual bonus potential. |
The minimum performance by the Company in order for any bonus payment to be made requires achievement of 90% of the budgeted Adjusted EBITDA for the fiscal year. At 90% of budgeted Adjusted EBITDA, the bonus target would be 0.05% of actual Adjusted EBITDA. As the actual Adjusted EBITDA approaches the budgeted Adjusted EBITDA (between 90% and 100%), the bonus target potential increases arithmetically (based on interpolation) from 0.05% to 1% of actual Adjusted EBITDA. The bonus potential continues to increase arithmetically (based on interpolation) until it reaches a maximum of 1.8% of actual Adjusted EBITDA, which is achieved when actual Adjusted EBITDA reaches 110% of the budgeted Adjusted EBITDA for the fiscal year.
For 2011, Ira Glazer earned a bonus of $1,438,940. This amount was based on budgeted Adjusted EBITDA of $116.0 million and actual Adjusted EBITDA of $119.1 million or 102.7% of budget. The Compensation Committee determined that Mr. Glazer met the “non-objective performance” component, but Mr. Glazer was not awarded the full 12.5% for the “key objectives” component of the CEO Plan for 2011.
The following table sets forth the calculation of Mr. Glazer’s 2011 Bonus:
| Target % | Actual % | |||||||||||
| Adjusted EBITDA payment at 102.7% |
$ | 1,106,877 | 75.0 | % | 75.0 | % | ||||||
| Non-objective performance |
$ | 184,479 | 12.5 | % | 12.5 | % | ||||||
| Key objectives payment |
$ | 147,584 | 12.5 | % | 10.0 | % | ||||||
|
|
|
|
|
|
|
|||||||
| $ | 1,438,940 | 100.0 | % | 97.5 | % | |||||||
|
|
|
|
|
|
|
|||||||
Long-term Incentive Plan
In connection with the Paine & Partners Fund III acquisition, the Company adopted the 2007 Long-Term Incentive Plan (the “LTIP”). The LTIP is an omnibus incentive plan primarily designed as a vehicle for the award of equity incentive awards to employees and other service providers. On the plan’s adoption date, there were 563,216 shares of common stock of WireCo reserved for issuance under the LTIP. The LTIP authorizes various types of equity-based awards, including stock options, restricted stock, restricted stock units and other equity-based instruments. All stock options granted under the LTIP must contain an exercise price that is at least equal to the fair market value of the underlying shares on the date of grant. The LTIP is administered by the board of directors or by the compensation committee appointed by the Company’s board of directors.
Since 2007, the Company has issued time-based stock options to key employees and affiliates. In general, the options vest ratably over five years of service from the date of grant, with one-fifth vesting each year with the except of the 2007 awards, which vested ratably over five years of service on each December 31, beginning with December 31, 2007. Vesting is conditioned upon continued service, although partial or full accelerated vesting may occur under limited circumstances in connection with liquidity events or certain termination events. All 2007 awards are subject to the provision of the WireCo shareholders agreement, including limitations on transfer.
Additionally, the Company has issued performance-based options to a limited group of key executives to acquire 73,276 shares of common stock of WireCo. These options vest if (i) Paine & Partners Capital Fund III, L.P. receives cash equal to or in excess of 300% of the total investment in the Company and (ii) at that time, the stock option recipient is employed with the Company. Partial vesting may occur upon certain other liquidity events.
112
Table of Contents
All stock options granted under the LTIP contain a 10-year contractual term and require that any exercise of vested options be completed no later than 90 days following a termination from service unless otherwise stated in a separation agreement.
As of December 31, 2011, there were outstanding stock options to purchase 407,092 shares under the LTIP, with a weighted average exercise price of $117.59 per option. As of December 31, 2011, there were 156,124 shares of common stock of WireCo reserved for issuance under the LTIP.
Employee Benefits
Each of our named executive officers in the U.S. is entitled to participate in the Company’s employee benefit plans (including 401(k) retirement savings, medical, dental and life insurance benefits) on the same basis as other employees. Our named executive officers based in other countries are entitled to participate in the Company’s benefit plans on the same basis as other employees in their country of residence.
Employment-related Agreements
Mr. Glazer, Mr. Bruder and Mr. McKinnish are our only named executive officers covered by an employment agreement.
We entered into a binding term sheet with Mr. Glazer in connection with the Paine & Partners Fund III acquisition, effective February 8, 2007. The term of the contract is for five years, with automatic one-year renewals, unless either party gives notice of non-renewal at least 90 days prior to expiration of the then-current term. Under the contract, Mr. Glazer serves as our President and Chief Executive Officer and as a member of our board. The contact provides for an annual base salary of $500,000 (since increased to $750,000 as of July 1, 2010 and $850,000 as of July 1, 2011) and a performance-based annual bonus, with a target of 1.00% of actual Adjusted EBITDA for achievement of 100% of the budgeted Adjusted EBITDA and a maximum target of 1.80% of actual Adjusted EBITDA for achievement of 110% of the budgeted Adjusted EBITDA. The contract also established the terms of Mr. Glazer’s 2007 initial investment in WireCo shares and the terms of his 2007 WireCo stock option awards (see discussion above under “Long-term Incentive Program”). Under the contract, if we terminate Mr. Glazer’s employment without cause or if he terminates employment for good reason (each as defined in the contract), he is entitled to a severance payment equal to 18 months of base salary, subject to his execution of a release of claims in our favor. The contract contains several restrictive covenants in our favor, including non-competition and non-solicitation covenants that apply while Mr. Glazer is employed by us and for 18 months thereafter.
We entered into a binding term sheet with Mr. Bruder in connection with the Paine & Partners Fund III acquisition, effective February 8, 2007. The term of the contract is for five years. The board is currently considering renewal of this contract. Under the contract, Mr. Bruder serves as our Executive Vice President and Chief Operations Officer. The contact provides for an annual base salary of $215,000 (since increased to $380,000 as of July 1, 2010 and $430,000 as of July 1, 2011), as well as a performance-based annual bonus. The contract also established the terms of Mr. Bruder’s 2007 initial investment in WireCo shares and the terms of his 2007 WireCo stock option award (see discussion above under “Long-term Incentive Program”). Under the contract, if we terminate Mr. Bruder’s employment without cause or if he terminates employment for good reason (each as defined in the contract), he is entitled to a severance payment equal to 12 months of base salary, subject to his execution of a release of claims in our favor. The contract contains several restrictive covenants in our favor, including non-competition and non-solicitation covenants that apply while Mr. Bruder is employed by us and for 12 months thereafter.
We entered into a binding term sheet with Mr. McKinnish in connection with the Paine & Partners Fund III acquisition, effective February 8, 2007. The term of the contract is for five years. The board is currently considering renewal of this contract. Under the contract, Mr. McKinnish serves as our Chief Financial Officer. The contract provides for an annual base salary of $210,000 (since increased to $305,000 as of July 1, 2010 and
113
Table of Contents
$340,000 as of July 1, 2011), as well as a performance-based annual bonus. The contract also established the terms of Mr. McKinnish’s 2007 initial investment in WireCo shares and the terms of his 2007 WireCo stock option award (see discussion above under “Long-term Incentive Program”). Under the contract, if we terminate Mr. McKinnish’s employment without cause or if he terminates employment for good reason (each as defined in the contract), he is entitled to a severance payment equal to six months of base salary, subject to his execution of a release of claims in our favor. The contract contains several restrictive covenants in our favor, including non-competition and non-solicitation covenants that apply while Mr. McKinnish is employed by us and for 18 months thereafter.
Impact of Tax and Accounting Treatments
We believe the compensation paid to our named executive officers is fully deductible under the Internal Revenue Code at the time it is paid.
Timing of Compensation Decisions
Prior to July 1 of each fiscal year, the board and our Chief Executive Officer review changes in base salaries for the executive management team. The board and Chief Executive Officer may deviate from this general practice when appropriate under the circumstances.
Stock Ownership Guidelines
The Company does not impose any minimum equity guidelines for our named executive officers.
Compensation Board Report
The board has reviewed and discussed the foregoing Compensation Discussion and Analysis with the Company’s senior management. Based on the board’s review of and discussions with management, the board has included this Compensation Discussion and Analysis in this annual report.
The foregoing report is provided by the following directors, who constitute the compensation committee of the board:
W. Dexter Paine, III
Stephan Kessel
Troy W. Thacker
114
Table of Contents
Summary Compensation Table
The table below sets forth information regarding the compensation for our named executive officers during fiscal years 2011 and 2010:
| Name and principal position |
Fiscal year |
Salary ($) |
Option awards ($) |
Non-equity incentive plan compensation ($) |
All other compensation ($) |
Total ($) |
||||||||||||||||||
| Ira L. Glazer, |
2011 | 800,000 | — | 1,438,940 | — | 2,238,940 | ||||||||||||||||||
| President and Chief Executive Officer |
||||||||||||||||||||||||
| Eric V. Bruder, |
2011 | 405,000 | — | 434,633 | — | 839,633 | ||||||||||||||||||
| Executive Vice President and Chief Operations Officer |
||||||||||||||||||||||||
| J. Keith McKinnish, |
2011 | 322,500 | — | 345,416 | — | 667,916 | ||||||||||||||||||
| Senior Vice President and Chief Financial Officer |
||||||||||||||||||||||||
| Wolfgang Oswald, |
2011 | 346,789 | 651,000 | (3) | 242,310 | — | 1,240,099 | |||||||||||||||||
| Senior Vice President of Global Sales (1) |
||||||||||||||||||||||||
| Joaquin Barrios |
2011 | 191,446 | — | 212,913 | 39,655 | 444,014 | ||||||||||||||||||
| Senior Vice President of Global Supply Chain (2) |
||||||||||||||||||||||||
| (1) | Mr. Oswald receives his compensation in euros. For 2011, conversion to U.S. dollars was based on the average exchange rate of $1.00 to €0.7185. |
| (2) | Mr. Barrios receives his compensation in Mexican pesos. For 2011, conversion to U.S. dollars was based on the average exchange rate of $1.00 to 12.4268 Mexican pesos. Also, Mr. Barrios receives other compensation related to benefits, such as holiday and vacation bonuses, provided to all management employees in Mexico. |
| (3) | These amounts reflect the grant date fair value of the awards granted. Refer to Note 11—“Share-based Compensation” to our consolidated financial statements included in Item 8, Financial Statements and Supplementary Data of this annual report for the relevant assumptions used to determine the valuation of our option awards. |
Grants of Plan-based Awards
The following table reflects estimated payouts under non-equity incentive plan awards and the number, exercise price and grant date fair value of options to purchase shares of WireCo made to our named executive officers in 2011.
115
Table of Contents
The Company’s non-equity incentive plan awards are granted to our chief executive officer based on our CEO Bonus Plan and other executive participants based upon our EBITDA Bonus Plan. Pre-established performance targets are documented in the respective plans. For more detailed information regarding our CEO Bonus Plan and EBITDA Bonus Plan, see the section entitled “Annual Incentives” within this item.
| Grant date |
Estimated future payouts under non-equity incentive plan awards (1) |
All other option awards: number of securities underlying options (#) |
Exercise price of option awards ($/sh) |
Grant date fair value of option awards |
||||||||||||||||||||||||
| Name |
Threshold ($) |
Target ($) |
Maximum ($) |
|||||||||||||||||||||||||
| Ira L. Glazer |
N/A | $ | 52,221 | $ | 1,160,456 | $ | 2,297,703 | — | — | — | ||||||||||||||||||
| Eric V. Bruder |
N/A | $ | 120,732 | $ | 284,076 | no maximum | — | — | — | |||||||||||||||||||
| J. Keith McKinnish |
N/A | $ | 95,463 | $ | 224,618 | no maximum | — | — | — | |||||||||||||||||||
| Wolfgang Oswald |
2/8/2011 | $ | 62,606 | $ | 147,308 | no maximum | 5,000 | $ | 262.52 | $ | 651,000 | |||||||||||||||||
| Joaquin Barrios |
N/A | $ | 63,812 | $ | 150,146 | no maximum | — | — | — | |||||||||||||||||||
| (1) | The amounts reflected in these columns represent the threshold, target and maximum amounts that could have been earned under our CEO Bonus Plan and EBITDA Bonus Plan based on 2011 results. Actual amounts earned for 2011 performance are reflected in the “Non-equity incentive plan compensation” column within the Summary Compensation Table. |
Wolfgang Oswald, Senior Vice President of Global Sales, was awarded 5,000 options at an exercise price of $262.52 per option for the purpose of his contribution to the further growth and success of WireCo WorldGroup. The size of the grant to Mr. Oswald took into account his increased responsibilities as WireCo has continued to expand into other regions of the world and his performance.
Outstanding Equity Awards at Year-end
The following table provides information regarding outstanding options that have been granted, but not exercised as of December 31, 2011:
| Name |
Number of securities underlying unexercised options (#) exercisable |
Number of securities underlying unexercised options (#) unexercisable |
Equity incentive plan awards: number of securities underlying unexercised unearned options (#) |
Option exercise price |
Option expiration date |
|||||||||||||||
| Ira L. Glazer |
98,335 | — | — | $ | 100.00 | 2/9/2017 | (1) | |||||||||||||
| — | 42,039 | — | $ | 100.00 | 2/9/2017 | (2) | ||||||||||||||
| — | 10,136 | — | $ | 132.00 | 2/15/2018 | (2) | ||||||||||||||
| Eric V. Bruder |
49,168 | — | — | $ | 100.00 | 2/9/2017 | (1) | |||||||||||||
| — | 12,552 | — | $ | 132.00 | 2/15/2018 | (2) | ||||||||||||||
| J. Keith McKinnish |
19,667 | — | — | $ | 100.00 | 2/9/2017 | (1) | |||||||||||||
| — | 8,549 | — | $ | 132.00 | 2/15/2018 | (2) | ||||||||||||||
| Wolfgang Oswald |
4,000 | — | — | $ | 100.00 | 11/15/2017 | (1) | |||||||||||||
| 1,800 | 1,200 | — | $ | 132.00 | 2/15/2018 | (3) | ||||||||||||||
| 600 | 2,400 | — | $ | 212.90 | 7/1/2020 | (4) | ||||||||||||||
| — | 5,000 | — | $ | 262.52 | 2/8/2021 | (5) | ||||||||||||||
| Joaquin Barrios |
9,834 | — | — | $ | 100.00 | 7/31/2017 | (1) | |||||||||||||
116
Table of Contents
| (1) | All 2007 time-based options vest ratably over five years of service on each December 31, beginning with December 31, 2007. |
| (2) | These performance options vest if (i) Paine & Partners Capital Fund III, L.P. receives cash equal to or in excess of 300% of the total cash investment in the Company and (ii) at that time, the named executive officer is employed with the Company. |
| (3) | Unvested stock options with an expiration date of February 15, 2018 vest in one-fifth increments on February 15, 2009, February 15, 2010, February 15, 2011, February 15, 2012 and February 15, 2013. |
| (4) | Unvested stock options with an expiration date of July 1, 2020 vest in one-fifth increments on July 1, 2011, July 1, 2012, July 1, 2013, July 1, 2014 and July 1, 2015. |
| (5) | Unvested stock options with an expiration date of February 8, 2021 vest in one-fifth increments on February 8, 2012, February 8, 2013, February 8, 2014, February 8, 2015 and February 8, 2016. |
Option Exercises
There were no options exercised by our named executive officers during 2011.
Non-qualified Deferred Compensation Plans
We do not maintain any non-qualified deferred compensation plans.
Risk Assessment in Compensation Programs
The Company has assessed its compensation policies and practices to determine if its compensation programs are reasonably likely to have a material adverse effect on the Company. The Company’s compensation programs (i) generally apply on a uniform basis to management employees at all of the Company’s material business operations, (ii) focus on Adjusted EBITDA and (iii) are designed to award executives for meeting a blend of annual and cumulative long-term performance objectives. In light of these characteristics and as a result of our analysis, we have concluded that our compensation policies and practices do not create risks reasonably likely to have a material adverse effect on the Company.
Compensation Committee Interlocks and Insider Participation
The board makes all compensation-related decisions that affect Mr. Glazer, our President and Chief Executive Officer. Mr. Glazer, with input from the board, makes compensation-related decisions for all other senior management. Other than as disclosed under Item 10, Directors, Executive Officers and Corporate Governance, none of our executive officers served as: a member of the compensation committee (or other board committee performing equivalent functions or, in the absence of any such committee, the entire board of directors) of another entity, one of whose executive officers served on our board; or a director of another entity, one of whose executive officers served on our board.
Potential Payments upon Termination, Change in Control or Other Event
The employment agreements that govern the payments upon termination for our chief executive officer, chief operations officer and chief financial officer are described in more detail in the section entitled “Employment-related Agreements” within this item. Mr. Oswald and Mr. Barrios are not covered by employment agreements and therefore are not paid any amounts upon voluntary or involuntary termination. Pursuant to the Non-Qualified Stock Option Agreement, vested options automatically terminate upon the earlier of the tenth anniversary of the grant date or the 90th day following the optionee’s termination. Any unvested options terminate on the date of the optionee’s termination. The Non-Qualified Stock Option Agreement makes special provisions regarding the vesting of options if there is a liquidity event. A liquidity event means a public offering or other sales by the investor; however, such sales by the investor will not be considered a liquidity event if the sale is prior to a public offering and the investor continues to beneficially own 50 percent or more of the (a) outstanding shares and (b) the combined voting power of the then outstanding voting securities of the Company entitled to vote for the election of directors. Upon a liquidity event, total outstanding options will vest
117
Table of Contents
to the same percentage as the overall liquidated percentage of shares. Any remaining unvested options will continue to vest in equal installments on the vesting dates subsequent to the liquidity event. If an optionee is terminated without cause within a one-year period following the consummation of a liquidity event, all options become vested options. In the event of the optionee’s death, the installment of options scheduled to vest during the 12-month period immediately following death become vested options.
The following table provides an estimate of the payments and benefits that would be paid to our named executive officers assuming a December 31, 2011 termination date, upon voluntary or involuntary termination of employment or December 31, 2011 death. The table does not reflect any vacation pay or normal distribution of account balances under our qualified defined contribution plan. The items shown in this table reflect the Company’s estimated obligations.
| Name and principal position |
Termination by executive for good reason |
Termination by us without cause |
Change of control |
Death | ||||||||||||
| Ira L. Glazer, President and Chief Executive Officer |
||||||||||||||||
| Cash Severance |
$ | 1,291,800 | $ | 1,291,800 | $ | — | $ | — | ||||||||
| Value of Accelerated Equity |
— | — | — | — | ||||||||||||
|
|
|
|
|
|
|
|
|
|||||||||
| Total |
$ | 1,291,800 | $ | 1,291,800 | $ | — | $ | — | ||||||||
|
|
|
|
|
|
|
|
|
|||||||||
| Eric V. Bruder, Executive Vice President and Chief Operations Officer |
||||||||||||||||
| Cash Severance |
$ | 462,895 | $ | 462,895 | $ | — | $ | — | ||||||||
| Value of Accelerated Equity |
— | — | — | — | ||||||||||||
|
|
|
|
|
|
|
|
|
|||||||||
| Total |
$ | 462,895 | $ | 462,895 | $ | — | $ | — | ||||||||
|
|
|
|
|
|
|
|
|
|||||||||
| J. Keith McKinnish, Senior Vice President and Chief Financial Officer |
||||||||||||||||
| Cash Severance |
$ | 183,005 | $ | 183,005 | $ | — | $ | — | ||||||||
| Value of Accelerated Equity |
— | — | — | — | ||||||||||||
|
|
|
|
|
|
|
|
|
|||||||||
| Total |
$ | 183,005 | $ | 183,005 | $ | — | $ | — | ||||||||
|
|
|
|
|
|
|
|
|
|||||||||
| Wolfgang Oswald, Senior Vice President of Global Sales |
||||||||||||||||
| Cash Severance |
$ | — | $ | — | $ | — | $ | — | ||||||||
| Value of Accelerated Equity(1) |
— | — | 211,848 | 86,796 | ||||||||||||
|
|
|
|
|
|
|
|
|
|||||||||
| Total |
$ | — | $ | — | $ | 211,848 | $ | 86,796 | ||||||||
|
|
|
|
|
|
|
|
|
|||||||||
| Joaquin Barrios, Senior Vice President of Global Supply Chain |
||||||||||||||||
| Cash Severance |
$ | — | $ | — | $ | — | $ | — | ||||||||
| Value of Accelerated Equity |
— | — | — | — | ||||||||||||
|
|
|
|
|
|
|
|
|
|||||||||
| Total |
$ | — | $ | — | $ | — | $ | — | ||||||||
|
|
|
|
|
|
|
|
|
|||||||||
| (1) | Payments represent the value of unvested, accelerated options to purchase shares of the Company as of December 31, 2011, calculated by multiplying the number of accelerated options by the difference between the exercise price and assumed fair market value of our common stock on December 31, 2011. Options, which are currently “out of the money” are valued at $0. |
| Item 12. | Security Ownership of Certain Beneficial Owners and Management and Related Stockholder Matters |
WireCo indirectly owns 100% of the voting common stock of WRCA U.S. Holdings Inc. (“US Holdings”), and WireCo WorldGroup Inc. is a wholly-owned subsidiary of US Holdings. The following table provides certain information about beneficial ownership of the voting common stock of US Holdings as of March 15, 2012 by (i) each person known to own beneficially more than 5% of common stock, (ii) each director of US Holdings and named executive officers of WireCo WorldGroup Inc. and (iii) all directors and named executive
118
Table of Contents
officers as a group. A person has beneficial ownership of shares if he or she has or shares voting or investment power over the shares, or the right to acquire that power within 60 days of March 15, 2012. Unless otherwise indicated, the business address of each person is our corporate address.
| Name and address of beneficial owner |
Shares of voting common stock beneficially owned as of March 15, 2012 |
Percentage of ownership of US Holdings |
||||||
| WireCo WorldGroup (Cayman) Inc. |
1,452,343 | 100 | % | |||||
| John J. Anton, Chairman of the board |
— | — | ||||||
| Troy W. Thacker, Director |
— | — | ||||||
| Stephan Kessel, Director |
— | — | ||||||
| Franklin Myers, Director |
— | — | ||||||
| Thomas S. L. Anderman, Director |
— | — | ||||||
| Ira L. Glazer, President and Director (1) |
— | — | ||||||
| Eric V. Bruder, Executive Vice President and Secretary (2) |
— | — | ||||||
| J. Keith McKinnish, Vice President and Treasurer |
— | — | ||||||
| Wolfgang Oswald, Senior Vice President of Global Sales |
— | — | ||||||
| Joaquin Barrios, Senior Vice President of Global Supply Chain |
— | — | ||||||
| All directors and executive officers (12) as a group (3) |
— | — | ||||||
| (1) | Mr. Glazer owns 41,529 shares of non-voting common stock, or 2.7%, of all common stock of US Holdings. |
| (2) | Mr. Bruder owns 11,280 shares of non-voting common stock, or 0.7%, of all common stock of US Holdings. |
| (3) | The directors and executive officers own 58,774 shares of non-voting common stock, or 3.9%, of all common stock of US Holdings. |
The following table provides certain information about beneficial ownership of the common stock of WireCo WorldGroup (Cayman) Inc. as of March 15, 2012 by (i) each person known to own beneficially more than 5% of common stock, (ii) each director of WireCo and named executive officers of WireCo WorldGroup Inc. and (iii) all directors and executive officers as a group. A person has beneficial ownership of shares if he or she has or shares voting or investment power over the shares, or the right to acquire that power within 60 days of March 15, 2012. Unless otherwise indicated, the business address of each person is our corporate address.
| Name and address of beneficial owner |
Shares of common stock beneficially owned as of March 15, 2012 |
Percentage of ownership of WireCo |
||||||
| Paine & Partners Fund III (1) |
1,998,000 | 83.7 | % | |||||
| James R. Tibbetts, Director |
— | — | ||||||
| W. Dexter Paine III, Director |
— | — | ||||||
| Franklin Myers, Director (2) |
1,800 | * | ||||||
| Ira L. Glazer, President and Chief Executive Officer, Director (3) |
139,864 | 5.9 | % | |||||
| Eric V. Bruder, Executive Vice President and Chief Operations Officer (4) |
60,448 | 2.5 | % | |||||
| J. Keith McKinnish, Senior Vice President and Chief Financial Officer (5) |
23,951 | 1.0 | % | |||||
| Wolfgang Oswald, Senior Vice President of Global Sales (6) |
8,000 | * | ||||||
| Joaquin Barrios, Senior Vice President of Global Supply Chain (7) |
13,961 | * | ||||||
| All directors and executive officers (10) as a group (8) |
266,822 | 11.2 | % | |||||
119
Table of Contents
| (1) | This fund consists of various Paine funds. The manager of the fund is Paine & Partners and the address for Paine & Partners is 461 Fifth Avenue, 17th Floor, New York, New York 10017. |
| (2) | Includes beneficial ownership of 1,800 shares of WireCo common stock that may be acquired within 60 days of March 15, 2012 pursuant to stock options. |
| (3) | Includes beneficial ownership of 98,335 shares of WireCo common stock that may be acquired within 60 days of March 15, 2012 pursuant to stock options, as well as beneficial ownership of 41,529 non-voting shares of US Holdings that may be put or called under the US Holdings Shareholder Agreement. |
| (4) | Includes beneficial ownership of 49,168 shares of WireCo common stock that may be acquired within 60 days of March 15, 2012 pursuant to stock options, as well as beneficial ownership of 11,280 non-voting shares of US Holdings that may be put or called under the US Holdings Shareholder Agreement. |
| (5) | Includes beneficial ownership of 19,667 shares of WireCo common stock that may be acquired within 60 days of March 15, 2012 pursuant to stock options. |
| (6) | Includes beneficial ownership of 8,000 shares of WireCo common stock that may be acquired within 60 days of March 15, 2012 pursuant to stock options. |
| (7) | Includes beneficial ownership of 9,834 shares of WireCo common stock that may be acquired within 60 days of March 15, 2012 pursuant to stock options. |
| (8) | Includes beneficial ownership of 199,637 shares of WireCo common stock that may be acquired within 60 days of March 15, 2012 pursuant to stock options, as well as beneficial ownership of 58,774 non-voting shares of US Holdings, or 3.9%, that may be put or called under the US Holdings Shareholder Agreement. |
| * | Denotes ownership interest that is less than 1%. |
Equity Compensation Plan Information
The following table provides information as of December 31, 2011, about the common stock that may be issued upon the exercise of options, as well as shares remaining available for future issuance under the Company’s existing equity compensation plan.
| Plan category |
Number of securities to be issued upon exercise of outstanding options |
Weighted- average exercise price of outstanding options |
Number of
securities remaining available for future issuance under an equity compensation plan - excluding securities reflected in the first column |
|||||||||
| Equity compensation plans: |
||||||||||||
| Approved by security holders |
407,092 | $ | 117.59 | 156,124 | ||||||||
| Not approved by security holders |
— | $ | — | — | ||||||||
|
|
|
|
|
|
|
|||||||
| Total |
407,092 | $ | 117.59 | 156,124 | ||||||||
|
|
|
|
|
|
|
|||||||
| Item 13. | Certain Relationships and Related Transactions and Director Independence |
Shareholder agreements
In connection with our acquisition by Paine & Partners Fund III in 2007, Paine & Partners Fund III, certain of its affiliates, WireCo, US Holdings and certain current and former members of our management who invested in WireCo and US Holdings entered into a shareholders agreement. The shareholders agreement provides for, among other things, certain restrictions on the transferability of such person’s equity ownership in the Company and US Holdings, as well as tag-along rights, drag-along rights, piggyback registration rights and repurchase rights. In addition, the shareholders agreement provides for exchange rights, whereby shareholders may at any time exchange their non-voting shares in US Holdings for shares in the Company. Additionally, the shareholders agreement provides that at any time, if the board of directors of the Company determine it to be in the best interest of the Company, the Company may require the management shareholders of US Holdings to surrender to the Company any or all non-voting shares of US Holdings held by such shareholders, in return for the issuance to
120
Table of Contents
such shareholders of shares in the Company. In either case, the initial exchange ratio of 1 to 1 will be adjusted to reflect changes in the capital structure of US Holdings or the Company due to dividends, increases or reductions in the number of outstanding shares, or other similar events. In an exchange required by the Company, if there is U.S. federal income tax payable by holders as a result of the exchange, then the Company must provide a method to ensure such holders have sufficient liquidity to pay such tax.
On December 29, 2008, WireCo Cyprus, WireCo, and certain current and former members of management who invested in WireCo Cyprus or US Holdings entered into a shareholders agreement. The shareholders agreement provides for, among other things, certain restrictions on the transferability of such person’s current and future equity ownership in WireCo Cyprus, as well as certain tag-along rights, drag-along rights, piggyback registration rights and repurchase rights in certain circumstances. The shareholders agreement was later assumed by the Company in 2011 when WireCo Cyprus, through a series of steps, was ultimately merged into the Company. The options to purchase shares of WireCo Cyprus held by the shareholders were converted into the options to purchase shares of the Company upon the completion of the WireCo Cyprus merger into the Company.
Also in connection with the formation of WireCo, Paine & Partners Fund III, certain of its affiliates, WireCo, and certain members of our management who had invested in WireCo Cyprus and subsequently exchanged their shares for WireCo shares in connection with such formation, entered into a shareholders agreement on December 29, 2008. The shareholders agreement provides for, among other things, certain restrictions on the transferability of shares in WireCo, as well as certain tag-along rights, drag-along rights, piggyback registration rights and repurchase rights in certain circumstances.
Policies and Procedures Regarding Related Party Transactions
The Board has adopted a written policy governing related party transactions. The related party policy requires the Audit Committee to review each Related Party Transaction (defined below) and determine whether it will approve or ratify such transaction.
For purposes of the related party policy, a “Related Party Transaction” is any transaction, arrangement or relationships with a Related Party (defined below) where the aggregate amount involved is expected to exceed $10,000 in any calendar year. “Related Party” includes (a) any person who is or was (at any time during the last year) an executive officer, director or nominee for election as a director; (b) any person or group who is a beneficial owner of more than 5% of the Company’s voting securities; (c) any immediate family member of a person described in provisions (a) or (b) of this sentence; or (d) any entity which is owned or controlled by any of the foregoing persons or any entity in which any of the foregoing is an executive officer. Certain smaller or routine specified transactions are deemed preapproved by the Audit Committee.
In determining whether a Related Party Transaction will be approved or ratified, the Audit Committee should determine if the transaction is fair as to the Company and consider factors such as (a) the extent of the Related Party’s interest in the transaction; (b) the availability of other sources of comparable products or services; (c) whether the terms are competitive with terms generally available in similar transactions with persons that are not Related Parties; (d) the benefit to the Company; and (e) the aggregate value of the transaction.
Paine & Partners
In connection with our acquisition by Paine & Partners Fund III on February 8, 2007, the Company, WireCo and Paine & Partners entered into a management agreement relating to the ongoing provision by Paine & Partners of certain financial and strategic consulting, advisory and other similar services. As compensation for those services, we agreed to pay Paine & Partners an annual fee equal to the greater of $1.5 million or 2% of the projected Adjusted EBITDA of the Company for that year, as well as to reimburse Paine & Partners for its
121
Table of Contents
related expenses. In addition, the management agreement provides for us to pay fees to Paine & Partners in connection with merger, financing or similar transactions by the Company or their respective subsidiaries or affiliates. For detail of fees paid to Paine & Partners, refer to Note 15—“Related–party Transactions” to our consolidated financial statements included in Item 8, Financial Statements and Supplementary Data, of this annual report.
The Company has also entered into an Indemnification Letter Agreement in February of 2007 with Paine and Partners Fund III, which provides that we will indemnify Paine and Partners Fund III or any of its members, employees, agents, affiliates or controlling persons (the “Indemnified Person”) against all liabilities, losses, damages or expenses incurred by such Indemnified Person in connection with the management agreement entered into between the Company and Paine and Partners Fund III. Expenses incurred in defending any action or proceeding for which indemnification is required pursuant to the Indemnification Letter Agreement shall be reimbursed by the Company when incurred unless such liability, loss, damage or expense is ruled by a court of competent jurisdiction, which has become final and no longer subject to appeal or review, to have resulted primarily from such Indemnified Person’s bad faith or gross negligence.
China JV Arrangements
For information on the transactions between us and the China JV, refer to Note 7—“Investment in and Advances to the China JV” to our consolidated financial statements included in Item 8, Financial Statements and Supplementary Data, of this annual report.
We have entered into the following agreements with the China JV:
| • | On June 12, 2006, we entered into a trademark license contract with the China JV, pursuant to which we granted to the China JV, an exclusive, non-transferable and royalty-free license to use certain of our trademarks for the term of the joint venture agreement or earlier, at our discretion giving 90 days notice to the China JV, if the China JV fails to observe any obligations, provisions and conditions as stated in the contract or the China JV ceases to carry on business. |
| • | Also, on June 12, 2006, we entered into an exclusive distribution agency contract with the China JV, pursuant to which we are the exclusive distributor of products made by the China JV in the U.S., Mexico and Canada. The agreement will terminate automatically when the joint venture agreement with the China JV terminates. |
| • | Also on June 12, 2006, we entered into a sales agency contract, pursuant to which the China JV is a sales agent in China for our products made in the U.S. and Mexico, and into a technology license and support contract that provides for the payment of licensing fees to us by the China JV for the use of various proprietary information licenses and licensed technology. This agreement provides for payment of 3% of total China JV sales revenue per annum through 2012, 2% of total sales revenue per annum for the years 2013 through 2016 and no fee thereafter. The term of the agreement is for as long as the China JV uses the proprietary information or licensed technology. |
No payments were made in 2011, 2010 or 2009 between us and the China JV in respect of the above agreements.
Director Independence
We have no securities listed for trading on a national securities exchange, which may have requirements that a majority of our board of directors be independent. For purposes of complying with the disclosure requirements of the SEC, we have adopted the definition of independence used by the New York Stock Exchange. Under the New York Stock Exchange’s definition of independence, only one of our directors, Franklin Myers, is independent.
122
Table of Contents
| Item 14. | Principal Accountant Fees and Services |
During 2011 and 2010, KPMG LLP (“KPMG”) served as our independent registered public accounting firm. The following table presents the aggregate fees billed for services rendered during the years ended December 31, 2011 and 2010, respectively.
| Year ended December 31, |
||||||||
| 2011 | 2010 | |||||||
| (dollars in thousands) | ||||||||
| Audit fees (1) |
$ | 1,770 | $ | 1,710 | ||||
| Audit-related fees (2) |
1,391 | 419 | ||||||
| Tax fees (3) |
718 | 1,141 | ||||||
| All other fees (4) |
525 | 950 | ||||||
|
|
|
|
|
|||||
| Total fees |
$ | 4,404 | $ | 4,220 | ||||
|
|
|
|
|
|||||
| (1) | Consists of fees for professional services rendered in connection with the audits of our annual consolidated financial statements, reviews of our consolidated financial statements included in quarterly reports, routine consultation on accounting and reporting matters and statutory audits required for our foreign subsidiaries. |
| (2) | Consists of fees for assurance and related services rendered in connection with comfort letters related to debt offering documents and employee benefit plan audits. This amount also includes KPMG’s fees in connection with the registration statement and related amendments we filed with the SEC under the Securities Act during 2011. |
| (3) | Consists of fees for professional services rendered in connection with U.S. and foreign tax compliance, such as preparation of tax returns; tax planning, such as assistance with transfer pricing matters; and tax consultation, such as advice related to mergers and acquisitions and requests for rulings or technical advice from taxing authorities. |
| (4) | Fees for due diligence services related to the Company’s acquisition activities. |
The Audit Committee pre-approved all audit and non-audit services performed and related fees. The Audit Committee determined that the non-audit services rendered by KPMG in 2011 and 2010 were compatible with maintaining its independence as auditors of our consolidated financial statements. The Audit Committee has adopted policies and procedures concerning our independent registered public accounting firm, including the pre-approval of services to be provided and approval of related fees. The Audit Committee is responsible for the pre-approval of all audit, audit-related, tax and non-audit services; however, pre-approval authority may be delegated to one or more members of the Audit Committee (“designated member”). The designated member is required to report to the full Audit Committee each specific service pre-approved, together with copies of all supporting documentation. The Audit Committee has retained KPMG as our independent registered public accounting firm for 2012.
123
Table of Contents
| Item 15. | Exhibits and Financial Statement Schedules |
| (1) | Financial Statements |
The consolidated financial statements and related notes, together with the report of KPMG LLP, appear in Part II Item 8, Financial Statements and Supplementary Data, of this annual report.
| (2) | Financial Statement Schedules |
All schedules are omitted because they are not applicable, or not required, or because the required information is included in the consolidated financial statements or notes thereto.
| 3) | Exhibits |
A list of exhibits to this annual report is set forth in the Exhibit Index appearing elsewhere in this annual report and is incorporated herein by reference.
124
Table of Contents
Pursuant to the requirements of Section 13 or 15(d) of the Securities Exchange Act of 1934, the Registrant has duly caused this report to be signed on its behalf by the undersigned, thereunto duly authorized.
| WireCo WorldGroup Inc. | ||||||
| (Registrant) | ||||||
| March 16, 2012 | By: | /s/ Ira L. Glazer | ||||
| Ira L. Glazer | ||||||
| President and Chief Executive Officer | ||||||
Power of Attorney
Each Director whose signature is below constitutes and appoints Ira L. Glazer and J. Keith McKinnish and each of them, his true and lawful attorney-in-fact and agent, with full power of substitution and revocation, for him and in his name, place and stead, in any and all capacities, to execute any or all amendments to this annual report on Form 10-K, and to file the same, with all exhibits thereto, and other documents in connection therewith, with the Securities and Exchange Commission, granting unto said attorney-in-fact and agent full power and authority to do and perform each and every act and thing requisite and necessary to be done, as fully to all intents and purposes as he might or could do in person, hereby ratifying and confirming all that said attorney-in-fact and agent, or his substitute or substitutes, may lawfully do or cause to be done by virtue hereof.
Pursuant to the requirements of the Securities Exchange Act of 1934, this report has been signed below by the following persons on behalf of the Registrant and in the capacities indicated and on the dates indicated.
| /s/ Ira L. Glazer Ira L. Glazer |
President and Chief Executive Officer and Director (Principal Executive Officer) | March 16, 2012 | ||
| /s/ J. Keith McKinnish J. Keith McKinnish |
Senior Vice President and Chief Financial Officer (Principal Financial Officer) | March 16, 2012 | ||
| /s/ Beth Armstrong Beth Armstrong |
Vice President and Chief Accounting Officer (Principal Accounting Officer) | March 16, 2012 | ||
| /s/ Tom Anderman Tom Anderman |
Director | March 16, 2012 | ||
| /s/ John J. Anton John J. Anton |
Director | March 16, 2012 | ||
| /s/ Franklin Myers Franklin Myers |
Director | March 16, 2012 | ||
| /s/ Stephan Kessel Stephan Kessel |
Director | March 16, 2012 | ||
| /s/ Troy W. Thacker Troy W. Thacker |
Director | March 16, 2012 | ||
125
Table of Contents
Exhibit Index
| Exhibit |
Description | |
| 3.1 | WireCo WorldGroup Inc. Amended and Restated Certificate of Incorporation (incorporated by reference to Exhibit 3.2(a) to the Registrant’s Registration Statement on Form S-4 (File No. 333-174896), filed on June 15, 2011). | |
| 3.2 | WireCo WorldGroup Inc. Amended and Restated Bylaws (as amended) (incorporated by reference to Exhibit 3.2(b) to the Registrant’s Registration Statement on Form S-4 (File No. 333-174896), filed on June 15, 2011). | |
| 4.1(a) | Indenture dated May 19, 2010 between WireCo WorldGroup Inc., the Guarantors and U.S. Bank National Association, as trustee (incorporated by reference to Exhibit 4.1(a) to the Registrant’s Registration Statement on Form S-4 (File No. 333-174896), filed on June 15, 2011). | |
| 4.1(b) | Supplemental Indenture dated December 14, 2010 between WireCo WorldGroup Inc., the Oliveira Guarantors and U.S. Bank National Association, as trustee, adding the Oliveira Guarantors (incorporated by reference to Exhibit 4.1(b) to the Registrant’s Registration Statement on Form S-4 (File No. 333-174896), filed on June 15, 2011). | |
| 4.1(c) | Guarantee dated May 19, 2010 between WireCo WorldGroup Inc. and the Guarantors (incorporated by reference to Exhibit 4.1(c) to the Registrant’s Registration Statement on Form S-4 (File No. 333-174896), filed on June 15, 2011). | |
| 4.1(d) | Form of outstanding 9.5% Senior Note due 2017 (outstanding notes) (incorporated by reference to Exhibit 4.1(d) to the Registrant’s Registration Statement on Form S-4 (File No. 333-174896), filed on June 15, 2011). | |
| 4.1(e) | Form of registered 9.5% Senior Note due 2017 (exchange notes) (incorporated by reference to Exhibit 4.1(e) to Amendment No. 1 to the Registrant’s Registration Statement on Form S-4/A (File No. 333-174896), filed on August 19, 2011). | |
| 4.1(f) | Supplemental Indenture dated August 1, 2011 between WireCo WorldGroup Inc., Drumet Liny i Druty Sp. z o.o, Drumet Drahtseile GmbH, Drumet s.r.o., WireCo WorldGroup Poland Holdings Sp. z o.o and U.S. Bank National Association, as trustee (incorporated by reference to Exhibit 4.1(f) to Amendment No. 3 to the Registrant’s Registration Statement on Form S-4/A (File No. 333-174896), filed on December 9, 2011). | |
| 4.1(g) | Supplemental Indenture dated October 31, 2011 between WireCo WorldGroup Inc., Drumet CZ, s.r.o. and U.S. Bank National Association, as trustee, adding the Czech Guarantor (incorporated by reference to Exhibit 4.1(f) to Amendment No. 4 to the Registrant’s Registration Statement on Form S-4/A (File No. 333-174896), filed on January 30, 2012). | |
| 4.1(h) | Supplemental Indenture dated January 26, 2012 between WireCo WorldGroup Inc., WireCo WorldGroup Comercial, Unipessoal, Lda. and U.S. Bank National Association, as trustee, adding this Portuguese Guarantor(incorporated by reference to Exhibit 4.1(f) to Amendment No. 4 to the Registrant’s Registration Statement on Form S-4/A (File No. 333-174896), filed on January 30, 2012). | |
| 4.1(i) | Supplemental Indenture dated January 30, 2012, between WireCo WorldGroup Inc., the Guarantors and U.S. Bank National Association, as trustee, amending the Indenture (incorporated by reference to Exhibit 4.1(f) to Amendment No. 4 to the Registrant’s Registration Statement on Form S-4/A (File No. 333-174896), filed on January 30, 2012). | |
| 10.1 | Amended Ira L. Glazer Employment Term Sheet and CEO Bonus Plan dated June, 2011 | |
| 10.2 | Eric V. Bruder Employment Term Sheet dated February, 2007 (incorporated by reference to Exhibit 10.2 to the Registrant’s Registration Statement on Form S-4 (File No. 333-174896), filed on June 15, 2011). | |
126
Table of Contents
| Exhibit |
Description | |
| 10.3 | J. Keith McKinnish Employment Term Sheet dated February, 2007 (incorporated by reference to Exhibit 10.3 to the Registrant’s Registration Statement on Form S-4 (File No. 333-174896), filed on June 15, 2011). | |
| 10.4 | James Tibbetts Employment Term Sheet dated June, 2008 (incorporated by reference to Exhibit 10.4 to the Registrant’s Registration Statement on Form S-4 (File No. 333-174896), filed on June 15, 2011). | |
| 10.5 | Shareholders Agreement among WireCo WorldGroup (Cayman) Inc. and certain investors dated December 29, 2008 (incorporated by reference to Exhibit 10.5 to the Registrant’s Registration Statement on Form S-4 (File No. 333-174896), filed on June 15, 2011). | |
| 10.6 | Shareholders Agreement among WireCo WorldGroup Limited, WireCo WorldGroup (Cayman) Inc., and certain investors dated December 29, 2008 (incorporated by reference to Exhibit 10.6 to the Registrant’s Registration Statement on Form S-4 (File No. 333-174896), filed on June 15, 2011). | |
| 10.7 | Stockholders Agreement among WRCA U.S. Holdings Inc. and certain investors dated February 8, 2007 (incorporated by reference to Exhibit 10.7 to the Registrant’s Registration Statement on Form S-4 (File No. 333-174896), filed on June 15, 2011). | |
| 10.8 | Management EBITDA Bonus Plan (incorporated by reference to Exhibit 10.8 to Amendment No. 2 to the Registrant’s Registration Statement on Form S-4/A (File No. 333-174896), filed on November 18, 2011). | |
| 10.9(a) | WireCo WorldGroup Limited 2007 Long Term Incentive Plan (as amended) (incorporated by reference to Exhibit 10.9(a) to the Registrant’s Registration Statement on Form S-4 (File No. 333-174896), filed on June 15, 2011). | |
| 10.9(b) | Form of Non Qualified Stock Option Agreement - Time Vesting (incorporated by reference to Exhibit 10.9(b) to the Registrant’s Registration Statement on Form S-4 (File No. 333-174896), filed on June 15, 2011). | |
| 10.9(c) | Form of Non Qualified Stock Option Agreement - Performance Vesting (incorporated by reference to Exhibit 10.9(c) to the Registrant’s Registration Statement on Form S-4 (File No. 333-174896), filed on June 15, 2011). | |
| 10.10(a) | Amended and Restated Term Loan Credit Agreement dated June 10, 2011 between WireCo WorldGroup Inc., WRCA (Luxembourg) Holdings S.á r.l., WireCo WorldGroup Limited, WireCo WorldGroup (Cayman) Inc., Deutsche Bank Trust Company Americas, Canadian Imperial Bank of Commerce, Deutsche Bank AG, London Branch and Goldman Sachs Bank USA. (incorporated by reference to Exhibit 10.10(a) to Amendment No. 1 to the Registrant’s Registration Statement on Form S-4/A (File No. 333-174896), filed on August 19, 2011). | |
| 10.10(b) | Term Loan Guarantee Agreement as amended and restated between WRCA (Cyprus) Holdings Limited, WRCA Distributor (Cayman) Ltd., WRCA Finance (Luxembourg) S.á r.l., WRCA (Luxembourg) Holdings S.á r.l., WRCA (Luxembourg) S.á r.l., WRCA US Holdings Inc., WRCA, LLC, Camesa, Inc., Awarco, Inc. American Wire and Rope Company, Inc., Prestressed Concrete Strand of America, Inc. and Canadian Imperial Bank of Commerce dated February 8, 2007 (incorporated by reference to Exhibit 10.10(b) to the Registrant’s Registration Statement on Form S-4 (File No. 333-174896), filed on June 15, 2011). | |
| 10.10(c)(1) | Term Loan US Pledge Agreement (including form of supplement) between Closer Merger Sub Inc., WireRope Corporation of America, Inc., WRCA Finance (Luxembourg) S.á r.l., WRCA US Holdings Inc., WRCA, LLC, Camesa, Inc., Awarco, Inc. American Wire and Rope Company, Inc., Prestressed Concrete Strand of America, Inc. and Canadian Imperial Bank of Commerce dated February 8, 2007 (incorporated by reference to Exhibit 10.10(c)(1) to the Registrant’s Registration Statement on Form S-4 (File No. 333-174896), filed on June 15, 2011). | |
127
Table of Contents
| Exhibit |
Description | |
| 10.10(c)(2) | First Amendment to Term Loan US Pledge Agreement dated June 10, 2011 between WRCA US Holdings Inc., WireCo WorldGroup Inc., WRCA Finance (Luxembourg) S.á r.l., WRCA, LLC and Deutsche Bank Trust Company Americas. (incorporated by reference to Exhibit 10.10(c)(2) to the Registrant’s Registration Statement on Form S-4 (File No. 333-174896), filed on June 15, 2011). | |
| 10.10(d)(1) | Term Loan US Security Agreement between Closer Merger Sub Inc., WireRope Corporation of America, Inc., WRCA US Holdings Inc., WRCA, LLC, Camesa, Inc., Awarco, Inc. American Wire and Rope Company, Inc., Prestressed Concrete Strand of America, Inc., WRCA Distributor (Cayman) Ltd. and Canadian Imperial Bank of Commerce dated February 8, 2007 (incorporated by reference to Exhibit 10.10(d)(1) to the Registrant’s Registration Statement on Form S-4 (File No. 333-174896), filed on June 15, 2011). | |
| 10.10(d)(2) | First Amendment to Term Loan US Security Agreement dated June 10, 2011 between WireCo WorldGroup Inc., WRCA, LLC, WRCA US Holdings Inc., WRCA Distributor (Cayman) Ltd., WireCo WorldGroup Sales (Cayman) Ltd. and Deutsche Bank Trust Company Americas. (incorporated by reference to Exhibit 10.10(d)(2) to the Registrant’s Registration Statement on Form S-4 (File No. 333-174896), filed on June 15, 2011). | |
| 10.10(e)(1) | Deed of Charge over Shares in WRCA Distributor (Cayman) Ltd. between WireCo WorldGroup (Cayman) Inc. and Deutsche Bank Trust Company Americas dated November 9, 2011. (incorporated by reference to Exhibit 10.10(e)(1) to Amendment No. 2 to the Registrant’s Registration Statement on Form S-4/A (File No. 333-174896), filed on November 18, 2011). | |
| 10.10(e)(2) | Deed of Charge over Shares in WireCo WorldGroup Sales (Cayman) Ltd. between WireCo WorldGroup (Cayman) Inc. and Deutsche Bank Trust Company Americas dated November 9, 2011. (incorporated by reference to Exhibit 10.10(e)(2) to Amendment No. 2 to the Registrant’s Registration Statement on Form S-4/A (File No. 333-174896), filed on November 18, 2011). | |
| 10.11(a) | Amended and Restated ABL Loan and Security Agreement as amended and supplemented between Closer Merger Sub Inc., WRCA US Holdings Inc., WRCA (Cyprus) Holdings Limited, WRCA Distributor (Cayman) Ltd., WireRope Corporation of America, Inc., Prestressed Concrete Strand of America, Inc., Awarco, Inc. American Wire and Rope Company, Inc., Camesa, Inc., WRCA, LLC, HSBC Business Credit (USA) Inc., The CIT Group/Business Credit, Inc. and JPMorgan Chase Bank, N.A. dated February 8, 2007 (incorporated by reference to Exhibit 10.11(a) to Amendment No. 2 to the Registrant’s Registration Statement on Form S-4/A (File No. 333-174896), filed on November 18, 2011). | |
| 10.11(b) | ABL US Pledge Agreement (including form of supplement) between WRCA Finance (Luxembourg) S.á r.l., WRCA US Holdings, Inc., WireRope Corporation of America, Inc., WRCA, LLC, Camesa, Inc., Awarco, Inc. American Wire and Rope Company, Inc., Prestressed Concrete Strand of America, Inc. and HSBC Business Credit (USA) Inc., dated February 8, 2007 (incorporated by reference to Exhibit 10.11(b) to the Registrant’s Registration Statement on Form S-4 (File No. 333-174896), filed on June 15, 2011). | |
| 10.11(c) | ABL Guarantee Agreement (including form of supplement) between WRCA (Cyprus) Holdings Limited, WRCA Distributor (Cayman) Ltd., WRCA Finance (Luxembourg) S.á r.l., WRCA (Luxembourg) Holdings S.á r.l., WRCA (Luxembourg) S.á r.l., WRCA US Holdings Inc., WRCA, LLC, Camesa, Inc., Awarco, Inc. American Wire and Rope Company, Inc., Prestressed Concrete Strand of America, Inc. and HSBC Business Credit (USA) Inc. dated February 8, 2007 (incorporated by reference to Exhibit 10.11(c) to the Registrant’s Registration Statement on Form S-4 (File No. 333-174896), filed on June 15, 2011). | |
128
Table of Contents
| Exhibit |
Description | |
| 10.11(d) | Amended and Restated Intercreditor Agreement dated June 10, 2011 between WireCo WorldGroup Inc., WRCA US Holdings Inc., WRCA, LLC, WRCA Distributor (Cayman) Ltd., WireCo WorldGroup Sales (Cayman) Ltd., 1295728 Alberta ULC, Wireline Works Partnership, Deutsche Bank Trust Company Americas and HSBC Bank USA, National Association. (incorporated by reference to Exhibit 10.11(d) to the Registrant’s Registration Statement on Form S-4 (File No. 333-174896), filed on June 15, 2011). | |
| 10.11(e) | Agency Assignment Agreement dated June 10, 2011 between Canadian Imperial Bank of Commerce, Deutsche Bank Trust Company Americas, WireCo WorldGroup Inc., WRCA (Luxembourg) Holdings S.á r.l., WireCo WorldGroup Limited, WireCo WorldGroup (Cayman) Inc., WRCA Canadian Holdings (Luxembourg) S.á r.l., WRCA Finance (Luxembourg) S.á r.l., WRCA (Luxembourg) S.á r.l., Wireline Works Partnership, 1295728 Alberta ULC, WRCA US Holdings Inc., WRCA, LLC, CASAR Drahtseil Werk Saar GmbH, WireCo WorldGroup Sales (Cayman) Ltd., WRCA Distributor (Cayman) Ltd., WireCo WorldGroup B.V. (f/k/a Phillystran Europe B.V.), Oliveira Holland B.V., WRCA Portugal Sociedad Unipessoal LDA, WireCo WorldGroup Portugal Holdings, SGPS, S.A., Manuel Rodrigues de Oliveira Sa & Filhos, S.A., Albino, Maia & Santos, Unipessoal Limitada and Cabos & Lingas – Sociedade Portuguesa de Comercio, Limitada. (incorporated by reference to Exhibit 10.11(e) to the Registrant’s Registration Statement on Form S-4 (File No. 333-174896), filed on June 15, 2011). | |
| 10.11(f)(1) | Deed of Charge over Shares in WRCA Distributor (Cayman) Ltd. between WireCo WorldGroup (Cayman) Inc. and HSBC Bank USA, National Association dated November 9, 2011. (incorporated by reference to Exhibit 10.11(f)(1) to Amendment No. 2 to the Registrant’s Registration Statement on Form S-4/A (File No. 333-174896), filed on November 18, 2011). | |
| 10.11(f)(2) | Deed of Charge over Shares in WireCo WorldGroup Sales (Cayman) Ltd. between WireCo WorldGroup (Cayman) Inc. and HSBC Bank USA, National Association dated November 9, 2011. (incorporated by reference to Exhibit 10.11(f)(2) to Amendment No. 2 to the Registrant’s Registration Statement on Form S-4/A (File No. 333-174896), filed on November 18, 2011). | |
| 10.12 | Share Purchase Agreement dated November 16, 2010 between WRCA Portugal Sociedade Unipessoal LDA and Luís Oliveira Sá SGPS, S.A. (incorporated by reference to Exhibit 10.12 to the Registrant’s Registration Statement on Form S-4 (File No. 333-174896), filed on June 15, 2011). | |
| 10.13(a) | Purchase Agreement for Senior Notes dated May 14, 2010 between WireCo WorldGroup Inc., the Guarantors, Goldman, Sachs & Co. and J.P. Morgan Securities Inc. (incorporated by reference to Exhibit 10.13(a) to the Registrant’s Registration Statement on Form S-4 (File No. 333-174896), filed on June 15, 2011). | |
| 10.13(b) | Exchange and Registration Rights Agreement dated May 19, 2010 between WireCo WorldGroup Inc., the Guarantors, Goldman, Sachs & Co. and J.P. Morgan Securities Inc. (incorporated by reference to Exhibit 10.13(b) to the Registrant’s Registration Statement on Form S-4 (File No. 333-174896), filed on June 15, 2011). | |
| 10.13(c) | Purchase Agreement for Senior Notes dated June 7, 2011 between WireCo World Group Inc., the Guarantors, Goldman, Sachs & Co. and Deutsche Bank Securities Inc. (incorporated by reference to Exhibit 10.13(c) to the Registrant’s Registration Statement on Form S-4 (File No. 333-174896), filed on June 15, 2011). | |
| 10.13(d) | Exchange and Registration Rights Agreement dated June 10, 2011 between WireCo World Group Inc., the Guarantors, Goldman, Sachs & Co. and Deutsche Bank Securities Inc. (incorporated by reference to Exhibit 10.13(d) to the Registrant’s Registration Statement on Form S-4 (File No. 333-174896), filed on June 15, 2011). | |
129
Table of Contents
| Exhibit |
Description | |
| 10.14 | Preliminary Share Purchase Agreement dated June 6, 2011 between WRCA (Luxembourg) Holdings S.á r.l. and Sidonio Holdings Limited (Drumet) (incorporated by reference to Exhibit 10.14 to the Registrant’s Registration Statement on Form S-4 (File No. 333-174896), filed on June 15, 2011). | |
| 10.15(a) | Equity Joint Venture Contract dated June 12, 2006 between WRCA Hong Kong Holding Company Limited and WISCO Wuhan Jiangbei Iron and Steel Ltd. (incorporated by reference to Exhibit 10.15(a) to the Registrant’s Registration Statement on Form S-4 (File No. 333-174896), filed on June 15, 2011). | |
| 10.15(b) | Amendment to the Equity Joint Venture Contract dated May 4, 2011 between WRCA Hong Kong Holding Company Limited and WISCO Wuhan Jiangbei Iron and Steel Ltd. (incorporated by reference to Exhibit 10.15(b) to the Registrant’s Registration Statement on Form S-4 (File No. 333-174896), filed on June 15, 2011). | |
| 10.15(c) | Capital Increase Agreement dated May 4, 2011 between WRCA Hong Kong Holding Company Limited and WISCO Wuhan Jiangbei Iron and Steel Ltd. (incorporated by reference to Exhibit 10.15(c) to the Registrant’s Registration Statement on Form S-4 (File No. 333-174896), filed on June 15, 2011). | |
| 10.16 | Paine & Partners, LLC Management Agreement and form of Indemnification Letter Agreement (incorporated by reference to Exhibit 10.16 to Amendment No. 1 to the Registrant’s Registration Statement on Form S-4/A (File No. 333-174896), filed on August 19, 2011). | |
| 10.17 | Exchange Offer Agreement dated November 9, 2011 between WRCA US Holdings Inc., WireCo WorldGroup (Cayman) Inc., WireCo WorldGroup Limited (Cyprus) and the stockholders (incorporated by reference to Exhibit 10.17 to Amendment No. 3 to the Registrant’s Registration Statement on Form S-4/A (File No. 333-174896), filed on December 9, 2011). | |
| 14 | WRCA U.S. Holdings Inc. Code of Business Conduct and Ethics (incorporated by reference to Exhibit 14 to the Registrant’s Registration Statement on Form S-4 (File No. 333-174896), filed on June 15, 2011). | |
| 21 | List of Subsidiaries (incorporated by reference to Exhibit 21 to Amendment No. 4 to the Registrant’s Registration Statement on Form S-4/A (File No. 333-174896), filed on January 30, 2012). | |
| 31.1 | CEO Certification pursuant to Section 302 of the Sarbanes-Oxley Act of 2002 | |
| 31.2 | CFO Certification pursuant to Section 302 of the Sarbanes-Oxley Act of 2002 | |
| 32.1 | CEO Certification pursuant to Section 906 of the Sarbanes-Oxley Act of 2002 | |
| 32.2 | CFO Certification pursuant to Section 906 of the Sarbanes-Oxley Act of 2002 | |
130