Attached files
| file | filename |
|---|---|
| 8-K - FORM 8-K - Ameris Bancorp | v394263_8-k.htm |
Exhibit 99.1
3 r d Quarter 2014 Investor Presentation
This presentation contains certain performance measures determined by methods other than in accordance with accounting principles generally accepted in the United States of America (“GAAP”) . Management of Ameris Bancorp (the “Company”) uses these non - GAAP measures in its analysis of the Company’s performance . These measures are useful when evaluating the underlying performance and efficiency of the Company’s operations and balance sheet . The Company’s management believes that these non - GAAP measures provide a greater understanding of ongoing operations, enhance comparability of results with prior periods and demonstrate the effects of significant gains and charges in the current period . The Company’s management believes that investors may use these non - GAAP financial measures to evaluate the Company’s financial performance without the impact of unusual items that may obscure trends in the Company’s underlying performance . These disclosures should not be viewed as a substitute for financial measures determined in accordance with GAAP, nor are they necessarily comparable to non - GAAP performance measures that may be presented by other companies . Tangible common equity and Tier 1 capital ratios are non - GAAP measures . The Company calculates the Tier 1 capital using current call report instructions . The Company’s management uses these measures to assess the quality of capital and believes that investors may find them useful in their evaluation of the Company . These capital measures may, or may not be necessarily comparable to similar capital measures that may be presented by other companies . This presentation may contain statements that constitute “forward - looking statements” within the meaning of Section 27 A of the Securities Act of 1933 , as amended, and Section 21 E of the Securities Exchange Act of 1934 , as amended . The words “believe”, “estimate”, “expect”, “intend”, “anticipate” and similar expressions and variations thereof identify certain of such forward - looking statements, which speak only as of the dates which they were made . The Company undertakes no obligation to publicly update or revise any forward - looking statements, whether as a result of new information, future events or otherwise . Readers are cautioned that any such forward - looking statements are not guarantees of future performance and involve risks and uncertainties and that actual results may differ materially from those indicated in the forward - looking statements as a result of various factors . Readers are cautioned not to place undue reliance on these forward - looking statements and are referred to the Company’s periodic filings with the Securities and Exchange Commission for a summary of certain factors that may impact the Company’s results of operations and financial condition . 2 Cautionary Statements
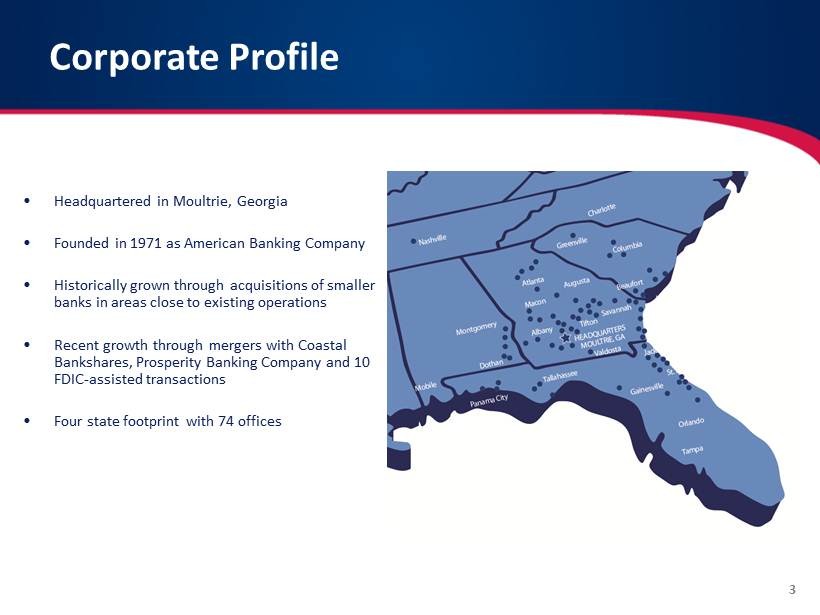
Corporate Profile • Headquartered in Moultrie, Georgia • Founded in 1971 as American Banking Company • Historically grown through acquisitions of smaller banks in areas close to existing operations • Recent growth through mergers with Coastal Bankshares , Prosperity Banking Company and 10 FDIC - assisted transactions • Four state footprint with 74 offices 3
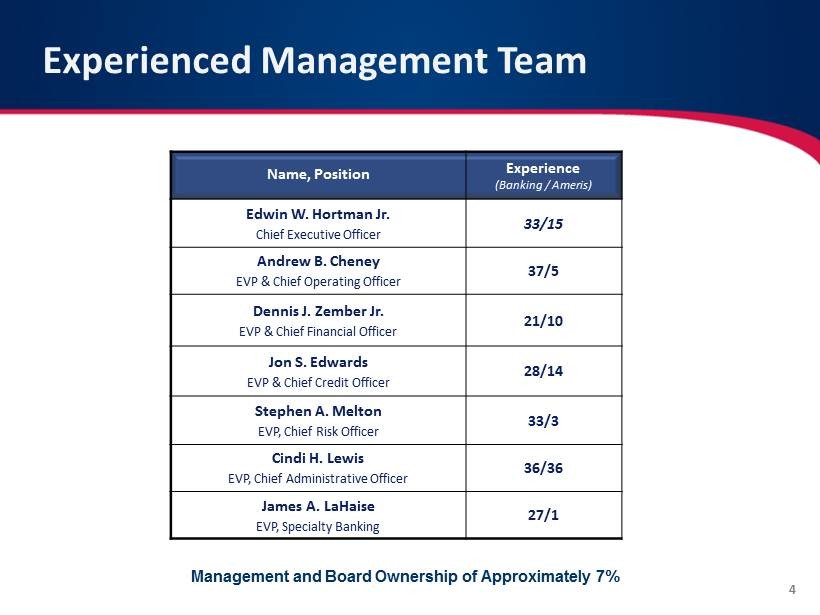
Name, Position Experience (Banking / Ameris ) Edwin W. Hortman Jr. Chief Executive Officer 33/15 Andrew B. Cheney EVP & Chief Operating Officer 37/5 Dennis J. Zember Jr. EVP & Chief Financial Officer 21/10 Jon S. Edwards EVP & Chief Credit Officer 28/14 Stephen A. Melton EVP, Chief Risk Officer 33/3 Cindi H. Lewis EVP, Chief Administrative Officer 36/36 James A. LaHaise EVP, Specialty Banking 27/1 4 Management and Board Ownership of Approximately 7% Experienced Management Team
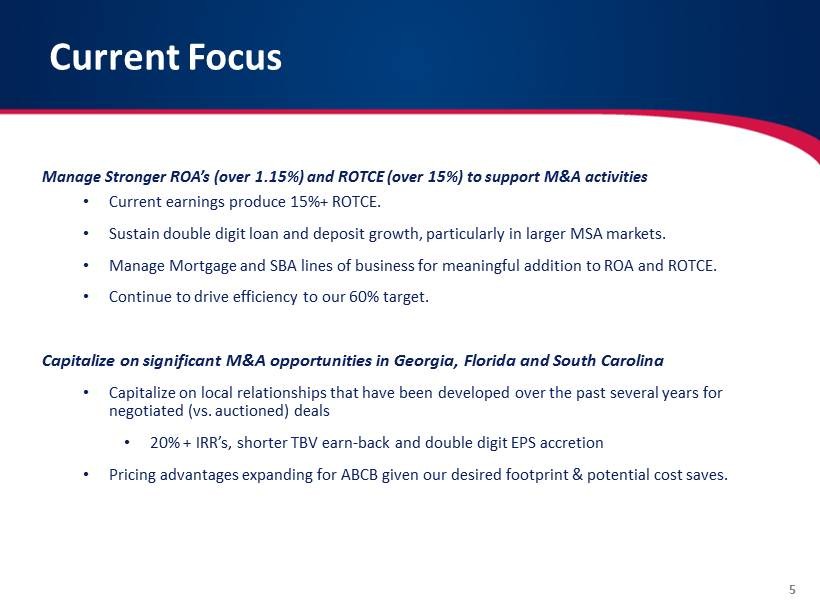
Manage Stronger ROA’s (over 1.15%) and ROTCE (over 15%) to support M&A activities • Current earnings produce 15 %+ ROTCE. • Sustain double digit loan and deposit growth, particularly in larger MSA markets. • Manage Mortgage and SBA lines of business for meaningful addition to ROA and ROTCE. • Continue to drive efficiency to our 60 % target . Capitalize on significant M&A opportunities in Georgia, Florida and South Carolina • Capitalize on local relationships that have been developed over the past several years for negotiated (vs. auctioned) deals • 20% + IRR’s, shorter TBV earn - back and double digit EPS accretion • Pricing advantages expanding for ABCB given our desired footprint & potential cost saves. 5 Current Focus
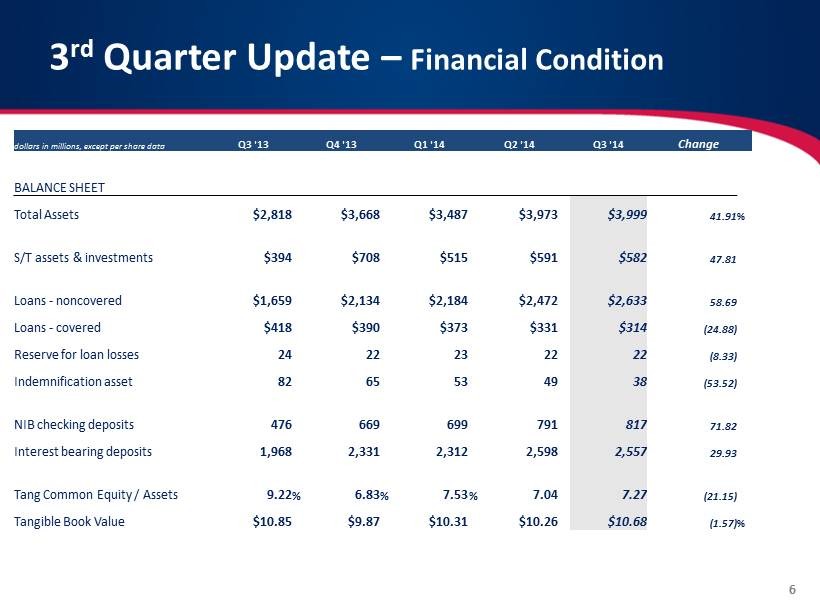
6 3 rd Quarter Update – Financial Condition dollars in millions, except per share data Q3 '13 Q4 '13 Q1 '14 Q2 '14 Q3 '14 Change BALANCE SHEET Total Assets $2,818 $3,668 $3,487 $3,973 $3,999 41.91 % S/T assets & investments $394 $708 $515 $591 $582 47.81 Loans - noncovered $1,659 $2,134 $2,184 $2,472 $2,633 58.69 Loans - covered $418 $390 $373 $331 $314 (24.88) Reserve for loan losses 24 22 23 22 22 (8.33) Indemnification asset 82 65 53 49 38 (53.52) NIB checking deposits 476 669 699 791 817 71.82 Interest bearing deposits 1,968 2,331 2,312 2,598 2,557 29.93 Tang Common Equity / Assets 9.22 % 6.83 % 7.53 % 7.04 7.27 (21.15) Tangible Book Value $10.85 $9.87 $10.31 $10.26 $10.68 (1.57) %
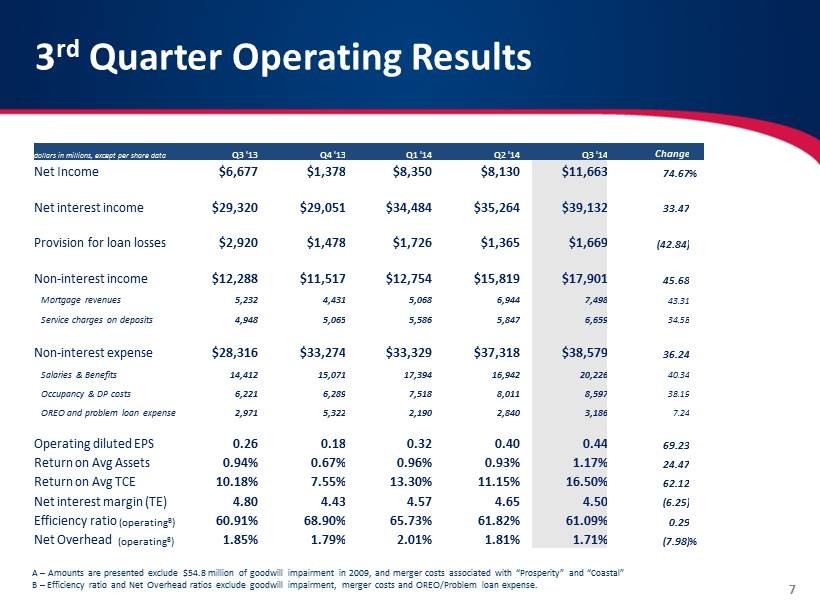
7 3 rd Quarter Operating Results A – Amounts are presented exclude $54.8 million of goodwill impairment in 2009, and merger costs associated with “Prosperity” an d “Coastal” B – Efficiency ratio and Net Overhead ratios exclude goodwill impairment, merger costs and OREO/Problem loan expense. dollars in millions, except per share data Q3 '13 Q4 '13 Q1 '14 Q2 '14 Q3 '14 Change Net Income $6,677 $1,378 $8,350 $8,130 $11,663 74.67 % Net interest income $29,320 $29,051 $34,484 $35,264 $39,132 33.47 Provision for loan losses $2,920 $1,478 $1,726 $1,365 $1,669 (42.84) Non - interest income $12,288 $11,517 $12,754 $15,819 $17,901 45.68 Mortgage revenues 5,232 4,431 5,068 6,944 7,498 43.31 Service charges on deposits 4,948 5,065 5,586 5,847 6,659 34.58 Non - interest expense $28,316 $33,274 $33,329 $37,318 $38,579 36.24 Salaries & Benefits 14,412 15,071 17,394 16,942 20,226 40.34 Occupancy & DP costs 6,221 6,289 7,518 8,011 8,597 38.19 OREO and problem loan expense 2,971 5,322 2,190 2,840 3,186 7.24 Operating diluted EPS 0.26 0.18 0.32 0.40 0.44 69.23 Return on Avg Assets 0.94% 0.67% 0.96% 0.93% 1.17% 24.47 Return on Avg TCE 10.18% 7.55% 13.30% 11.15% 16.50% 62.12 Net interest margin (TE) 4.80 4.43 4.57 4.65 4.50 (6.25) Efficiency ratio (operating B ) 60.91% 68.90% 65.73% 61.82% 61.09% 0.29 Net Overhead ( operating B ) 1.85% 1.79% 2.01% 1.81% 1.71% (7.98) %
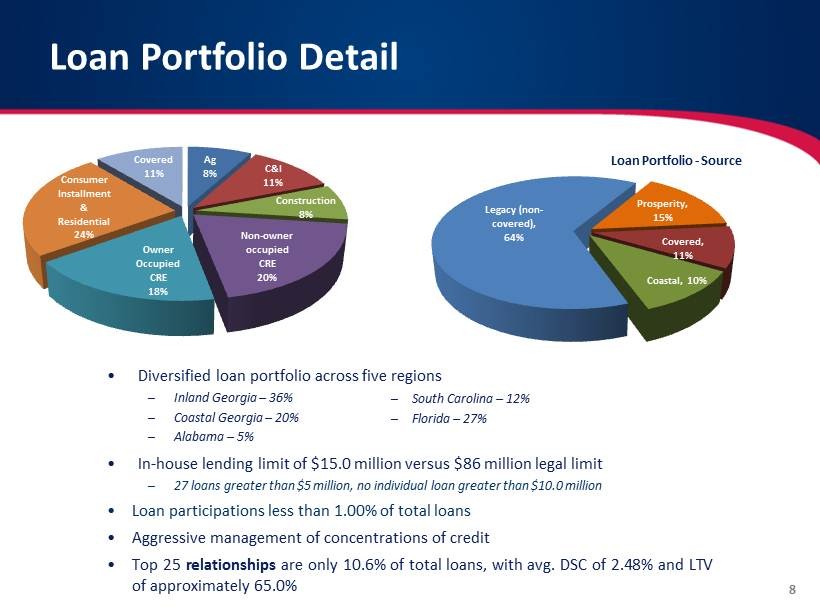
• Diversified loan portfolio across five regions – Inland Georgia – 36 % – Coastal Georgia – 20 % – Alabama – 5 % • In - house lending limit of $ 15 . 0 million versus $ 86 million legal limit – 27 loans greater than $ 5 million, no individual loan greater than $ 10 . 0 million • Loan participations less than 1 . 00 % of total loans • Aggressive management of concentrations of credit • Top 25 relationships are only 10 . 6 % of total loans, with avg . DSC of 2 . 48 % and LTV of approximately 65 . 0 % 8 – South Carolina – 12 % – Florida – 27 % Loan Portfolio Detail Ag 8% C&I 11% Construction 8% Non - owner occupied CRE 20% Owner Occupied CRE 18% Consumer Installment & Residential 24% Covered 11% Legacy (non - covered), 64% Prosperity, 15% Coastal, 10% Covered, 11% Loan Portfolio - Source
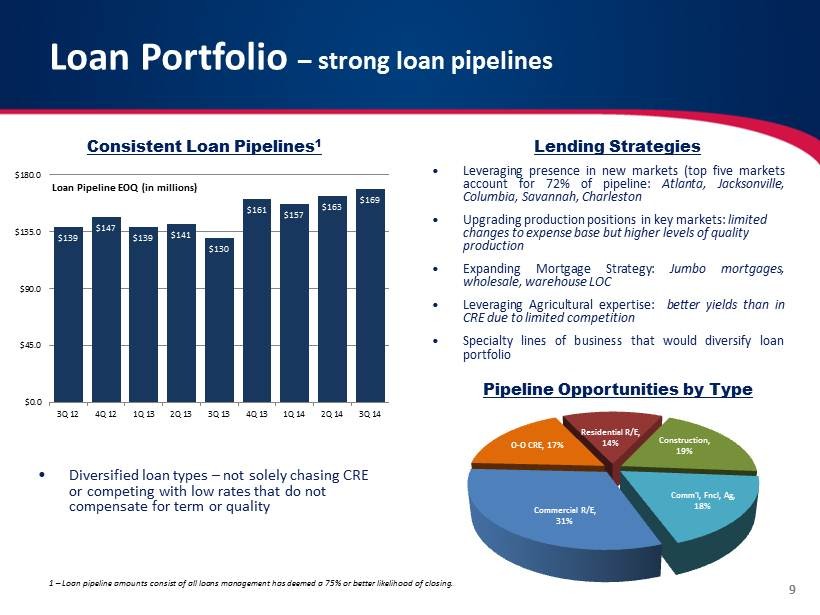
• Leveraging presence in new markets (top five markets account for 72 % of pipeline : Atlanta , Jacksonville, Columbia, Savannah, Charleston • Upgrading production positions in key markets: limited changes to expense base but higher levels of quality production • Expanding Mortgage Strategy : Jumbo mortgages, wholesale, warehouse LOC • Leveraging Agricultural expertise : better yields than in CRE due to limited competition • Specialty lines of business that would diversify loan portfolio • Diversified loan types – not solely chasing CRE or competing with low rates that do not compensate for term or quality 9 Loan Portfolio – strong loan pipelines Consistent Loan Pipelines 1 Lending Strategies Pipeline Opportunities by Type 1 – Loan pipeline amounts consist of all loans management has deemed a 75% or better likelihood of closing. $139 $147 $139 $141 $130 $161 $157 $163 $169 $0.0 $45.0 $90.0 $135.0 $180.0 3Q 12 4Q 12 1Q 13 2Q 13 3Q 13 4Q 13 1Q 14 2Q 14 3Q 14 Loan Pipeline EOQ (in millions) Commercial R/E, 31% O - O CRE, 17% Residential R/E, 14% Construction, 19% Comm'l, Fncl, Ag, 18%
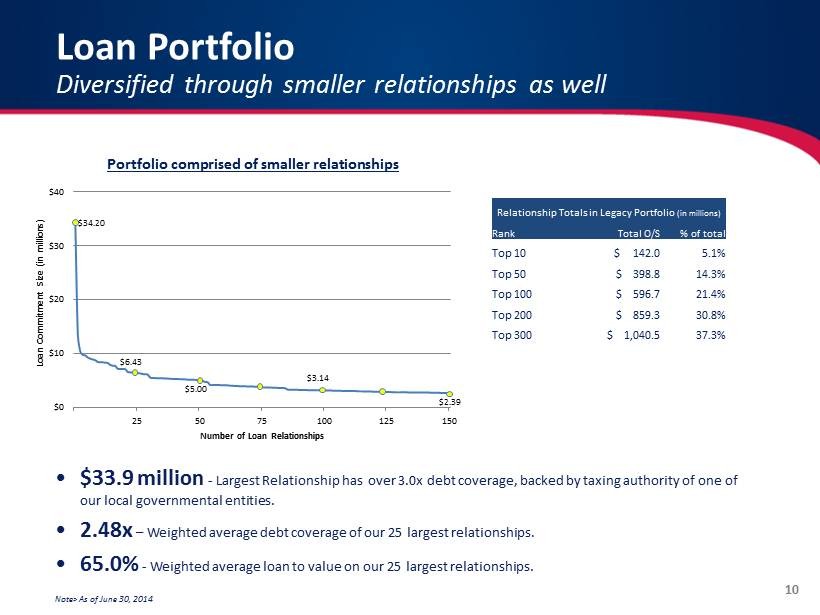
10 • $33.9 million - Largest Relationship has over 3.0x debt coverage, backed by taxing authority of one of our local governmental entities. • 2.48x – Weighted average debt coverage of our 25 largest relationships. • 65.0% - Weighted average loan to value on our 25 largest relationships. Note> As of June 30, 2014 Loan Portfolio Diversified through smaller relationships as well Portfolio comprised of smaller relationships Relationship Totals in Legacy Portfolio (in millions) Rank Total O/S % of total Top 10 $ 142.0 5.1% Top 50 $ 398.8 14.3% Top 100 $ 596.7 21.4% Top 200 $ 859.3 30.8% Top 300 $ 1,040.5 37.3% $34.20 $6.43 $5.00 $3.14 $2.39 $0 $10 $20 $30 $40 25 50 75 100 125 150 Loan Commitment Size (in millions) Number of Loan Relationships
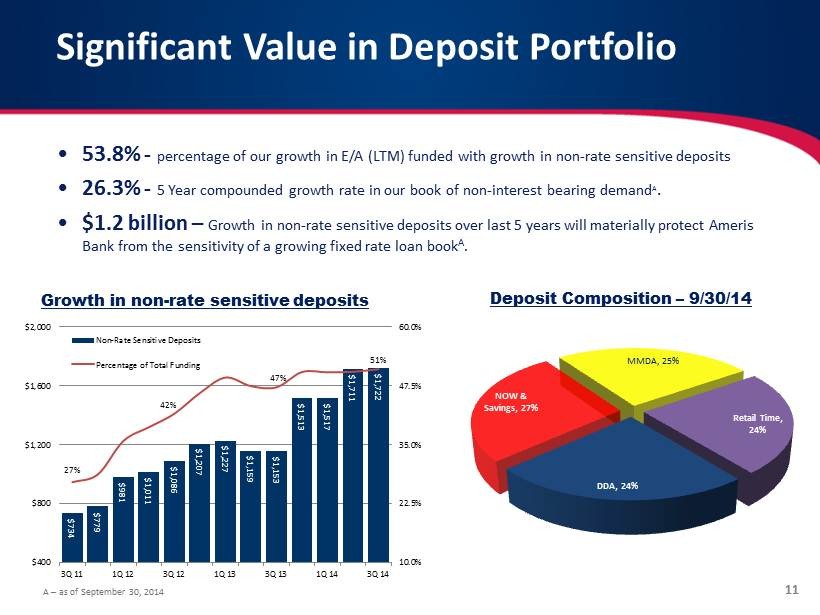
11 • 53.8% - percentage of our growth in E/A (LTM) funded with growth in non - rate sensitive deposits • 26.3% - 5 Year compounded growth rate in our book of non - interest bearing demand A . • $1.2 billion – Growth in non - rate sensitive deposits over last 5 years will materially protect Ameris Bank from the sensitivity of a growing fixed rate loan book A . Significant Value in Deposit Portfolio Deposit Composition – 9/30/14 Growth in non - rate sensitive deposits A – as of September 30, 2014 DDA, 24% NOW & Savings, 27% MMDA, 25% Retail Time, 24% $734 $779 $981 $1,011 $1,086 $1,207 $1,227 $1,159 $1,153 $1,513 $1,517 $1,711 $1,722 27% 42% 47% 51% 10.0% 22.5% 35.0% 47.5% 60.0% $400 $800 $1,200 $1,600 $2,000 3Q 11 1Q 12 3Q 12 1Q 13 3Q 13 1Q 14 3Q 14 Non-Rate Sensitive Deposits Percentage of Total Funding
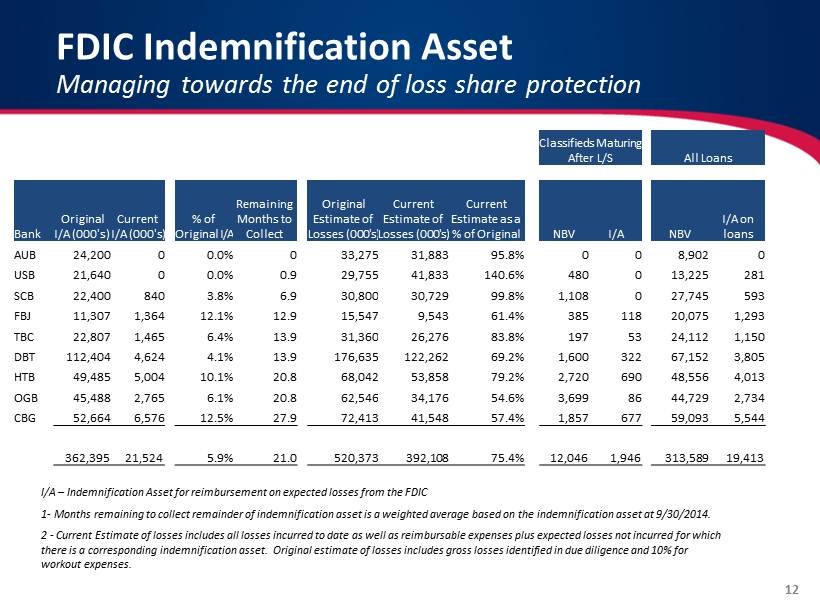
12 FDIC Indemnification Asset Managing towards the end of loss share protection I/A – Indemnification Asset for reimbursement on expected losses from the FDIC 1 - Months remaining to collect remainder of indemnification asset is a weighted average based on the indemnification asset at 9 /30/2014. 2 - Current Estimate of losses includes all losses incurred to date as well as reimbursable expenses plus expected losses not in curred for which there is a corresponding indemnification asset. Original estimate of losses includes gross losses identified in due diligenc e a nd 10% for workout expenses. Classifieds Maturing After L/S All Loans Bank Original I/A (000's) Current I/A (000's) % of Original I/A Remaining Months to Collect Original Estimate of Losses (000's) Current Estimate of Losses (000's) Current Estimate as a % of Original NBV I/A NBV I/A on loans AUB 24,200 0 0.0% 0 33,275 31,883 95.8% 0 0 8,902 0 USB 21,640 0 0.0% 0.9 29,755 41,833 140.6% 480 0 13,225 281 SCB 22,400 840 3.8% 6.9 30,800 30,729 99.8% 1,108 0 27,745 593 FBJ 11,307 1,364 12.1% 12.9 15,547 9,543 61.4% 385 118 20,075 1,293 TBC 22,807 1,465 6.4% 13.9 31,360 26,276 83.8% 197 53 24,112 1,150 DBT 112,404 4,624 4.1% 13.9 176,635 122,262 69.2% 1,600 322 67,152 3,805 HTB 49,485 5,004 10.1% 20.8 68,042 53,858 79.2% 2,720 690 48,556 4,013 OGB 45,488 2,765 6.1% 20.8 62,546 34,176 54.6% 3,699 86 44,729 2,734 CBG 52,664 6,576 12.5% 27.9 72,413 41,548 57.4% 1,857 677 59,093 5,544 362,395 21,524 5.9% 21.0 520,373 392,108 75.4% 12,046 1,946 313,589 19,413
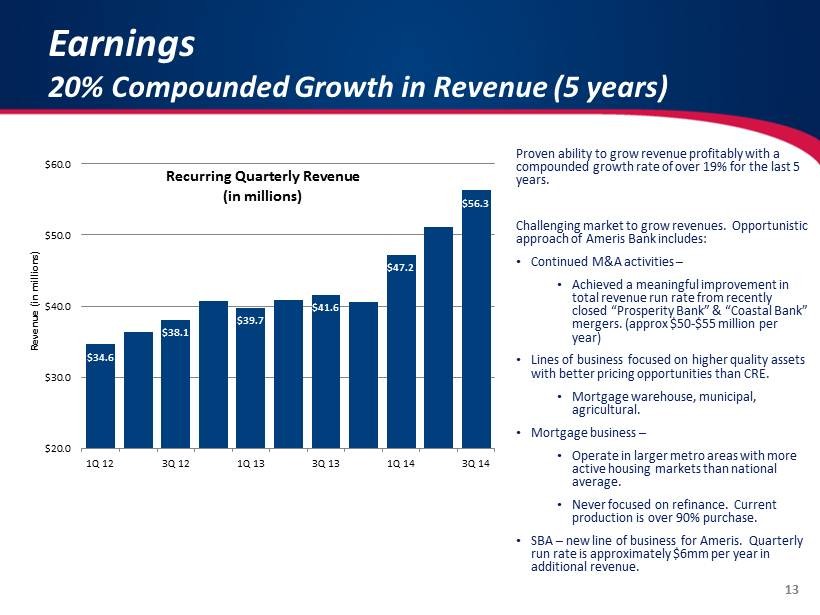
Proven ability to grow revenue profitably with a compounded growth rate of over 19% for the last 5 years. Challenging market to grow revenues. Opportunistic approach of Ameris Bank includes: • Continued M&A activities – • Achieved a meaningful improvement in total revenue run rate from recently closed “Prosperity Bank” & “Coastal Bank” mergers. ( approx $50 - $55 million per year) • Lines of business focused on higher quality assets with better pricing opportunities than CRE. • Mortgage warehouse, municipal, agricultural. • Mortgage business – • Operate in larger metro areas with more active housing markets than national average. • Never focused on refinance. Current production is over 90% purchase. • SBA – new line of business for Ameris. Quarterly run rate is approximately $6mm per year in additional revenue. 13 Earnings 20% Compounded Growth in Revenue (5 years) $34.6 $38.1 $39.7 $41.6 $47.2 $56.3 $20.0 $30.0 $40.0 $50.0 $60.0 1Q 12 3Q 12 1Q 13 3Q 13 1Q 14 3Q 14 Revenue (in millions) Recurring Quarterly Revenue (in millions)
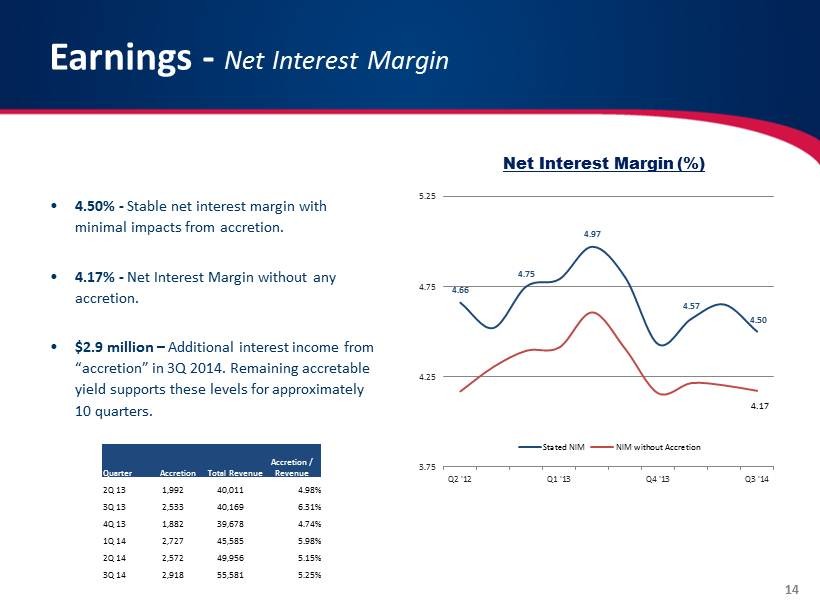
14 • 4.50% - Stable net interest margin with minimal impacts from accretion. • 4.17% - N et Interest Margin without any accretion. • $2.9 million – Additional interest income from “accretion” in 3Q 2014. Remaining accretable yield supports these levels for approximately 10 quarters. Earnings - Net Interest Margin Net Interest Margin (%) 4.66 4.75 4.97 4.57 4.50 4.17 3.75 4.25 4.75 5.25 Q2 '12 Q1 '13 Q4 '13 Q3 '14 Stated NIM NIM without Accretion Quarter Accretion Total Revenue Accretion / Revenue 2Q 13 1,992 40,011 4.98% 3Q 13 2,533 40,169 6.31% 4Q 13 1,882 39,678 4.74% 1Q 14 2,727 45,585 5.98% 2Q 14 2,572 49,956 5.15% 3Q 14 2,918 55,581 5.25%
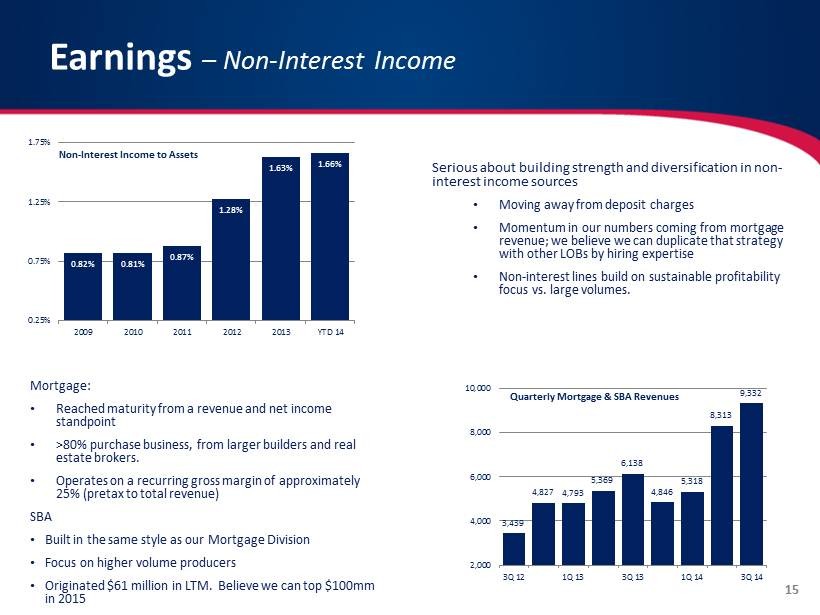
15 Serious about building strength and diversification in non - interest income sources • Moving away from deposit charges • Momentum in our numbers coming from mortgage revenue; we believe we can duplicate that strategy with other LOBs by hiring expertise • Non - interest lines build on sustainable profitability focus vs. large volumes. Earnings – Non - Interest Income Mortgage: • Reached maturity from a revenue and net income standpoint • >80% purchase business, from larger builders and real estate brokers. • Operates on a recurring gross margin of approximately 25% (pretax to total revenue) SBA • Built in the same style as our Mortgage Division • Focus on higher volume producers • Originated $61 million in LTM. Believe we can top $100mm in 2015 0.82% 0.81% 0.87% 1.28% 1.63% 1.66% 0.25% 0.75% 1.25% 1.75% 2009 2010 2011 2012 2013 YTD 14 Non - Interest Income to Assets 3,439 4,827 4,793 5,369 6,138 4,846 5,318 8,313 9,332 2,000 4,000 6,000 8,000 10,000 3Q 12 1Q 13 3Q 13 1Q 14 3Q 14 Quarterly Mortgage & SBA Revenues
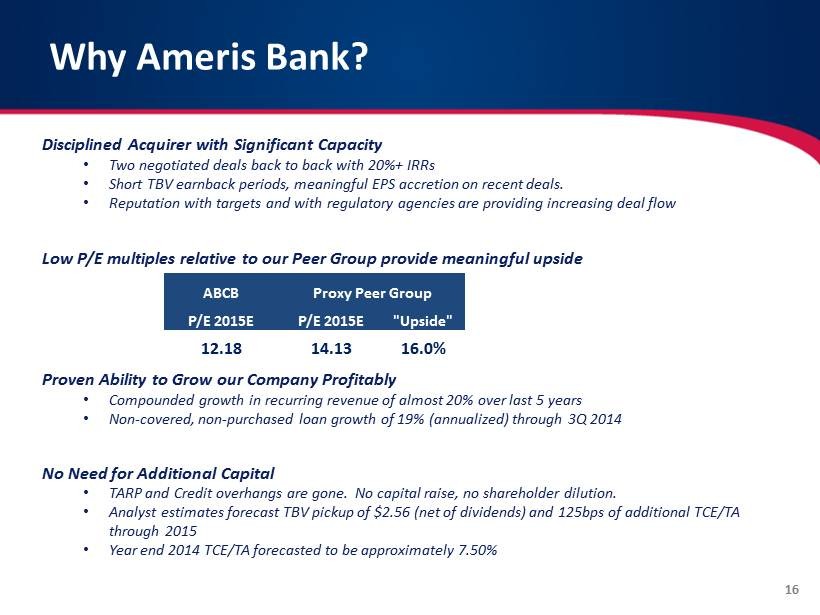
Disciplined Acquirer with Significant Capacity • Two negotiated deals back to back with 20%+ IRRs • Short TBV earnback periods, meaningful EPS accretion on recent deals. • Reputation with targets and with regulatory agencies are providing increasing deal flow Low P/E multiples relative to our Peer Group provide meaningful upside Proven Ability to Grow our Company Profitably • Compounded growth in recurring revenue of almost 20% over last 5 years • Non - covered, non - purchased loan growth of 19% (annualized) through 3Q 2014 No Need for Additional Capital • TARP and Credit overhangs are gone. No capital raise, no shareholder dilution. • Analyst estimates forecast TBV pickup of $2.56 (net of dividends) and 125bps of additional TCE/TA through 2015 • Year end 2014 TCE/TA forecasted to be approximately 7.50% 16 Why Ameris Bank? ABCB Proxy Peer Group P/E 2015E P/E 2015E "Upside" 12.18 14.13 16.0%
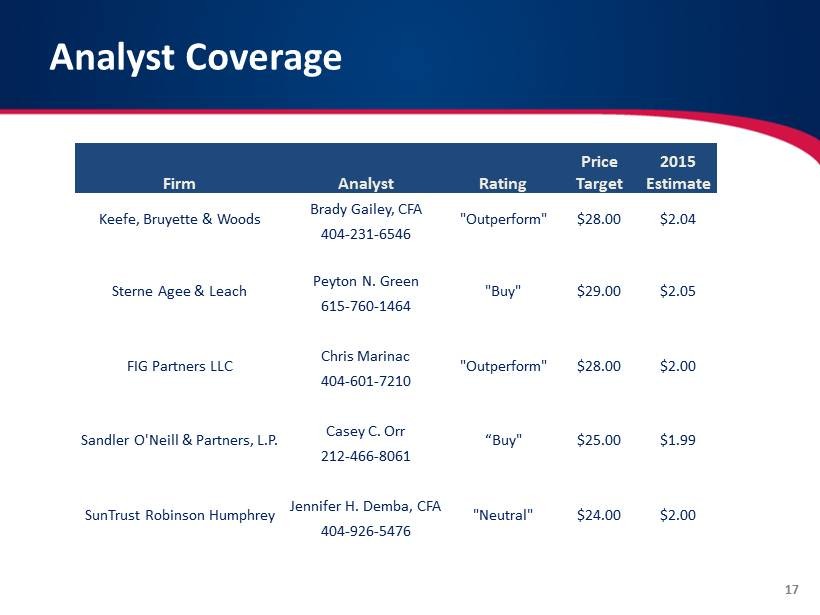
17 Analyst Coverage Firm Analyst Rating Price Target 2015 Estimate Keefe, Bruyette & Woods Brady Gailey, CFA "Outperform" $28.00 $ 2.04 404 - 231 - 6546 Sterne Agee & Leach Peyton N. Green "Buy" $29.00 $ 2.05 615 - 760 - 1464 FIG Partners LLC Chris Marinac "Outperform" $28.00 $2.00 404 - 601 - 7210 Sandler O'Neill & Partners, L.P. Casey C. Orr “Buy" $ 25.00 $1.99 212 - 466 - 8061 SunTrust Robinson Humphrey Jennifer H. Demba, CFA "Neutral" $ 24.00 $ 2.00 404 - 926 - 5476