Attached files
| file | filename |
|---|---|
| 8-K - FORM 8-K - NATIONAL FUEL GAS CO | d815367d8k.htm |
 National Fuel Gas Company
Investor Presentation
November 2014
Exhibit 99 |
 National Fuel Gas Company
Safe Harbor For Forward Looking Statements
2
This presentation may contain “forward-looking statements”
as defined by the Private Securities Litigation Reform Act of 1995, including statements
regarding future prospects, plans, objectives, goals, projections, estimates of oil and
gas quantities, strategies, future events or performance and underlying assumptions, capital structure, anticipated
capital expenditures, completion of construction projects, projections for pension and other
post-retirement benefit obligations, impacts of the adoption of new accounting rules,
and possible outcomes of litigation or regulatory proceedings, as well as statements that are
identified by the use of the words “anticipates,”
“estimates,”
“expects,”
“forecasts,”
“intends,”
“plans,”
“predicts,”
“projects,”
“believes,”
“seeks,”
“will,”
“may,”
and similar expressions. Forward-looking statements involve risks and uncertainties
which could cause actual results or outcomes to differ materially from those
expressed in the forward-looking statements. The Company’s expectations, beliefs
and projections are expressed in good faith and are believed by the Company to have a
reasonable basis, but there can be no assurance that management’s expectations, beliefs or projections will result or be
achieved or accomplished.
In addition to other factors, the following are important factors that, in the view of the
Company, could cause actual results to differ materially from those discussed in the
forward-looking statements: factors affecting the Company’s ability to
successfully identify, drill for and produce economically viable natural gas and oil reserves, including
among others geology, lease availability, title disputes, weather conditions, shortages, delays
or unavailability of equipment and services required in drilling operations, insufficient
gathering, processing and transportation capacity, the need to obtain governmental approvals and permits, and compliance with environmental laws and regulations;
the cost and effects of legal and administrative claims against the Company or activist
shareholder campaigns to effect changes at the Company; changes in laws, regulations or
judicial interpretations to which the Company is subject, including those involving derivatives,
taxes, safety, employment, climate change, other environmental matters, real property,
and exploration and production activities such as hydraulic fracturing; governmental/regulatory actions, initiatives and proceedings, including those involving rate cases
(which address, among other things, target rates of return, rate
design and retained natural gas), environmental/safety requirements, affiliate relationships,
industry structure, and franchise renewal; changes in the price of natural gas or oil;
changes in price differentials between similar quantities of natural gas or oil sold at different geographic
locations, and the effect of such changes on commodity production, revenues and demand for
pipeline transportation capacity to or from such locations; other changes in price
differentials between similar quantities of natural gas or oil having different quality, heating
value, hydrocarbon mix or delivery date; impairments under the SEC’s full cost ceiling
test for natural gas and oil reserves; uncertainty of oil and gas reserve estimates;
significant differences between the Company’s projected and actual production levels for
natural gas or oil; delays or changes in costs or plans with respect to Company projects or
related projects of other companies, including difficulties or delays in obtaining
necessary governmental approvals, permits or orders or in obtaining the cooperation of
interconnecting facility operators; changes in demographic patterns and weather
conditions; changes in the availability, price or accounting treatment of derivative financial
instruments; financial and economic conditions, including the availability of credit, and
occurrences affecting the Company’s ability to obtain financing on acceptable terms for working capital, capital expenditures and other investments, including any
downgrades in the Company’s credit ratings and changes in interest rates and other
capital market conditions; changes in economic conditions, including global, national or
regional recessions, and their effect on the demand for, and customers’
ability to pay for, the Company’s products and services; the creditworthiness or
performance of the
Company’s key suppliers, customers and counterparties; economic disruptions or uninsured
losses resulting from major accidents, fires, severe weather, natural disasters,
terrorist activities, acts of war, cyber attacks or pest infestation; significant differences
between the Company’s projected and actual capital expenditures and operating expenses;
changes in laws, actuarial assumptions, the interest rate environment and the return on
plan/trust assets related to the Company’s pension and other post-retirement benefits,
which can affect future funding obligations and costs and plan liabilities; increasing health
care costs and the resulting effect on health insurance premiums and on the obligation to
provide other post-retirement benefits; or increasing costs of insurance, changes in
coverage and the ability to obtain insurance. Forward-looking statements include
estimates of oil and gas quantities. Proved oil and gas reserves are those quantities of
oil and gas which, by analysis of geoscience and
engineering data, can be estimated with reasonable certainty to be economically producible under
existing economic conditions, operating methods and government regulations. Other
estimates of oil and gas quantities, including estimates of probable reserves, possible reserves, and resource potential, are by their nature more speculative than estimates
of proved reserves. Accordingly, estimates other than proved reserves are subject to
substantially greater risk of being actually realized. Investors are urged to consider closely
the disclosure in our Form 10-K available at
www.nationalfuelgas.com. You can also obtain this form on
the SEC’s website at www.sec.gov. For a discussion of
the risks set forth above and other factors that could cause actual results to differ materially from results referred to in the forward-looking statements, see
“Risk Factors”
in the Company’s Form 10-K for the fiscal year ended September 30, 2013 and the Forms
10-Q for the quarters ended December 31, 2013, March 31, 2014 and June 30, 2014. The
Company disclaims any obligation to update any forward-looking statements to reflect events or circumstances after the date thereof or to reflect the occurrence of
unanticipated events. |
 National Fuel Gas Company
Quality Assets -
Exceptional Location -
Unique Integration
3
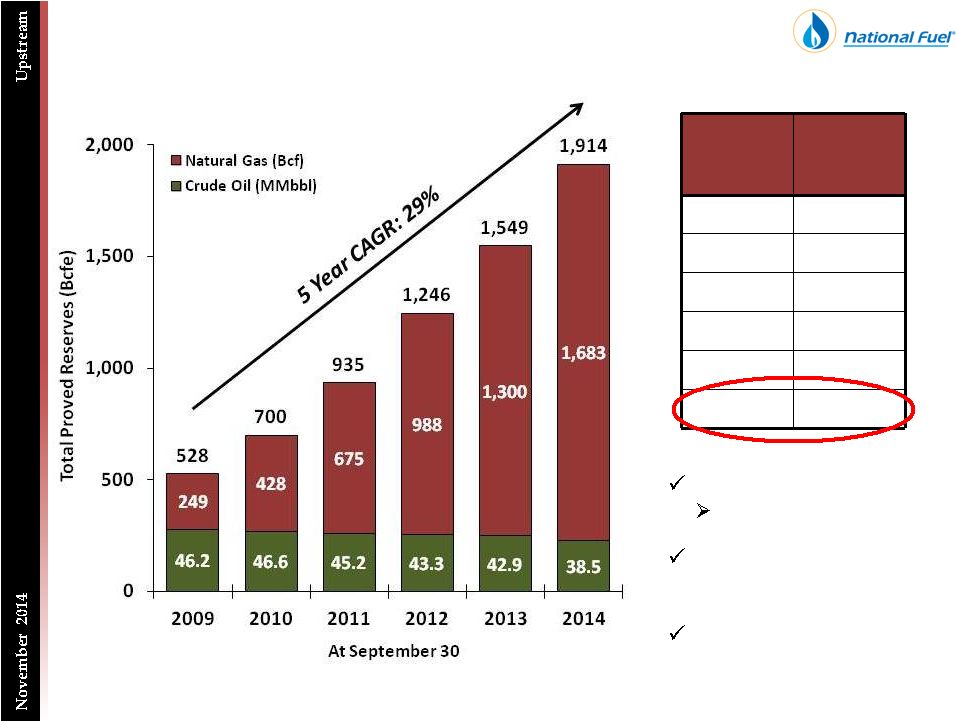
1.914 Tcfe of Proved Reserves
(1)
811,000 Net Acres in Pennsylvania
3 Million Bbls of Crude Oil Production
(2)
$250 Million of Midstream Adjusted EBITDA
(2)(3)
(1)
As of September 30, 2014
(2)
Fiscal year ended September 30, 2014. Midstream includes the Pipeline & Storage
segment and Gathering segment. (3)
A
reconciliation
of
Adjusted
EBITDA
to
Net
Income
is
included
at
the
end
of
this
presentation. |
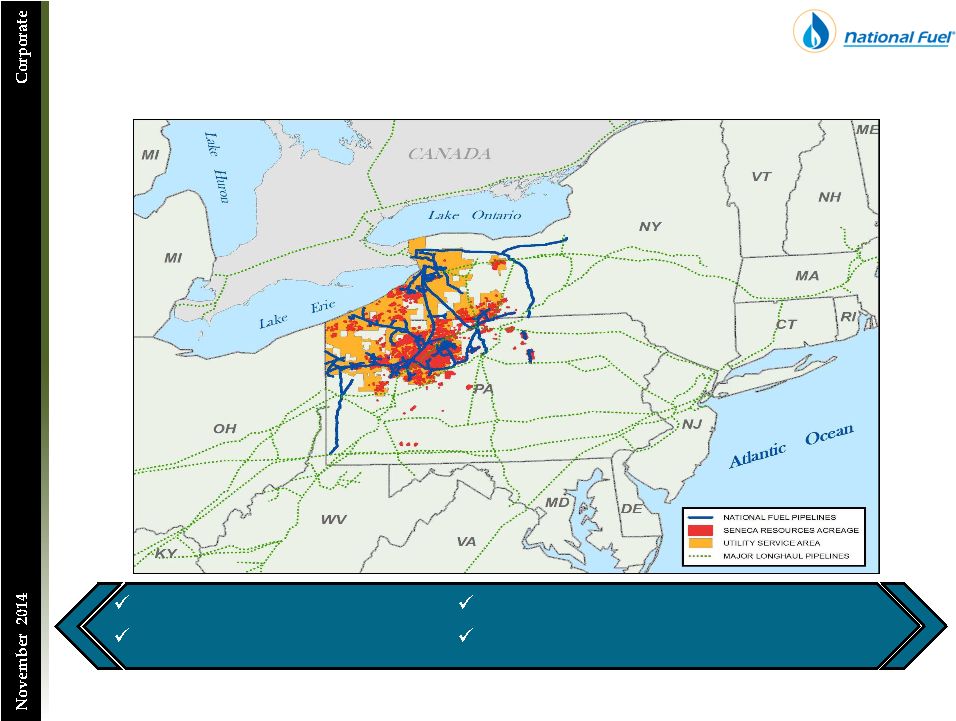
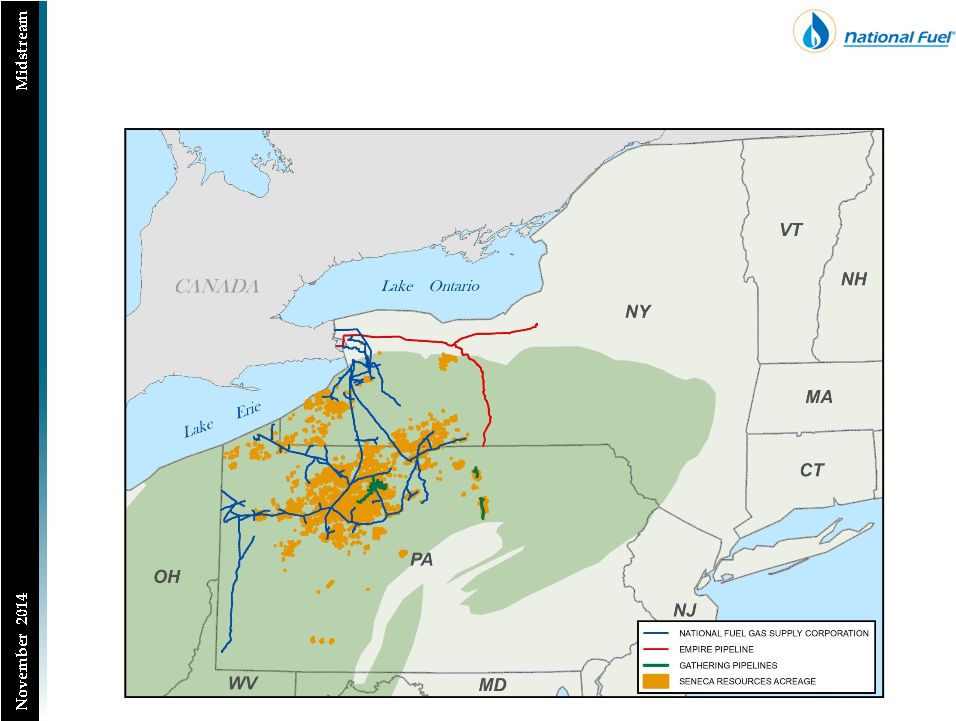
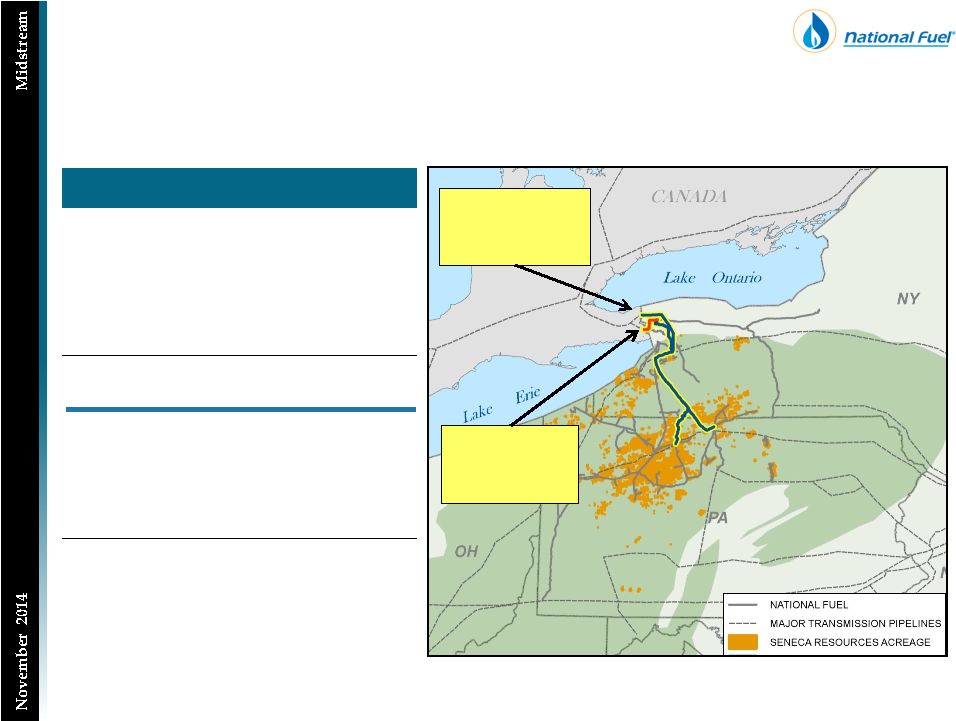
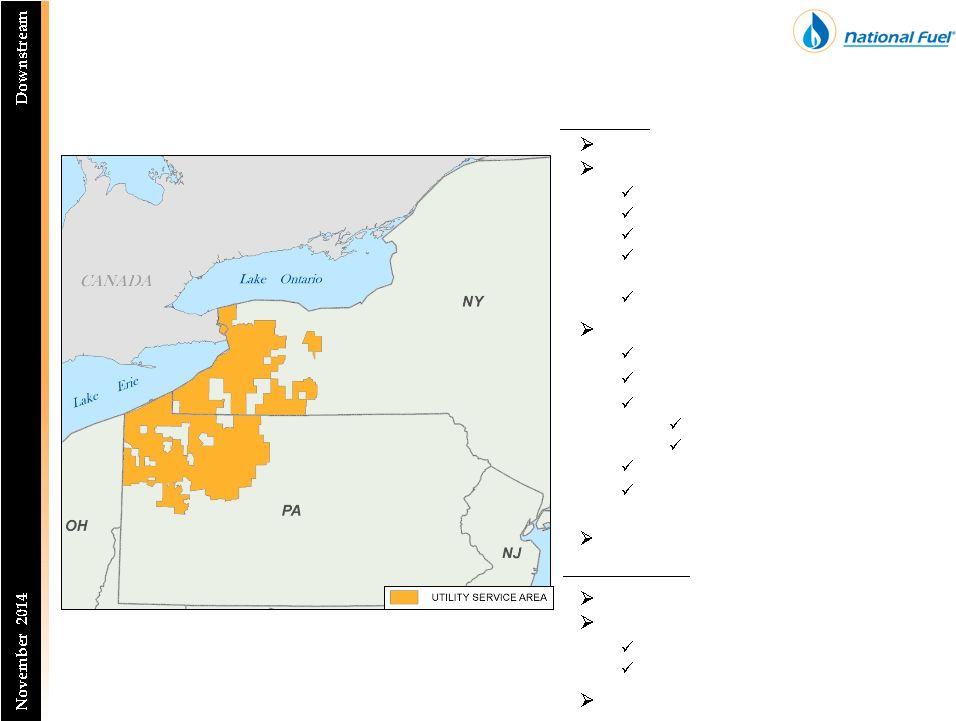
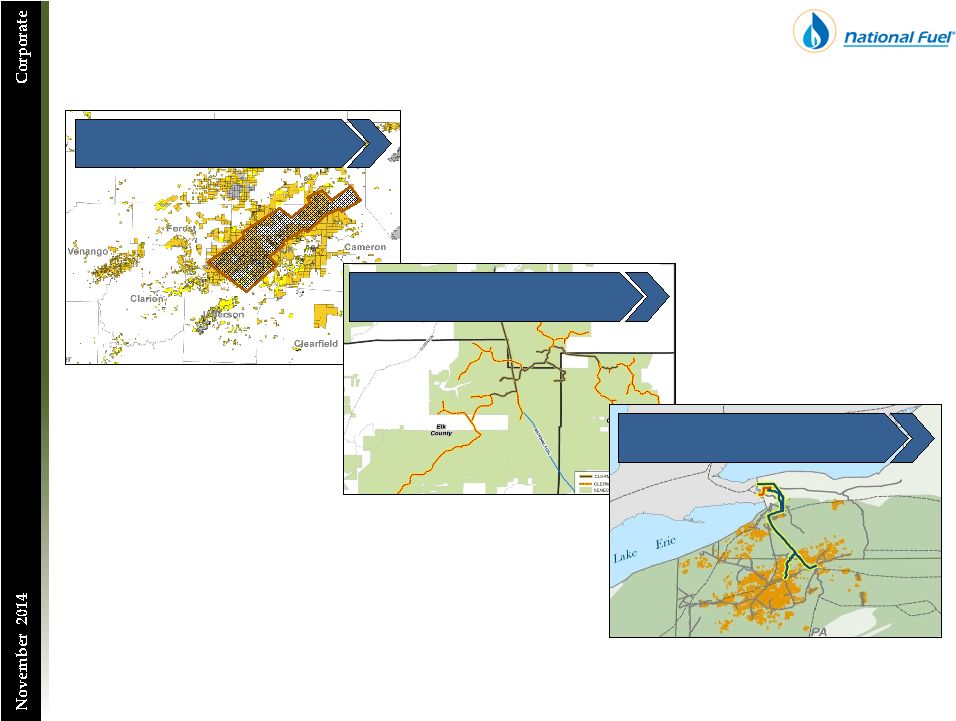   National Fuel Gas Company
Upstream and Midstream –
Common Vision For Growth
4
Western Development Area
Tier I Acreage: 200,000 Acres
Clermont Gathering System
NFG Supply & Other Interconnects
Northern Access Projects
490 MMcf/d to Canada by 2016
High quality
Marcellus acreage
Connected to our
interstate pipeline
network
Pipeline capacity to premium
and alternate markets |
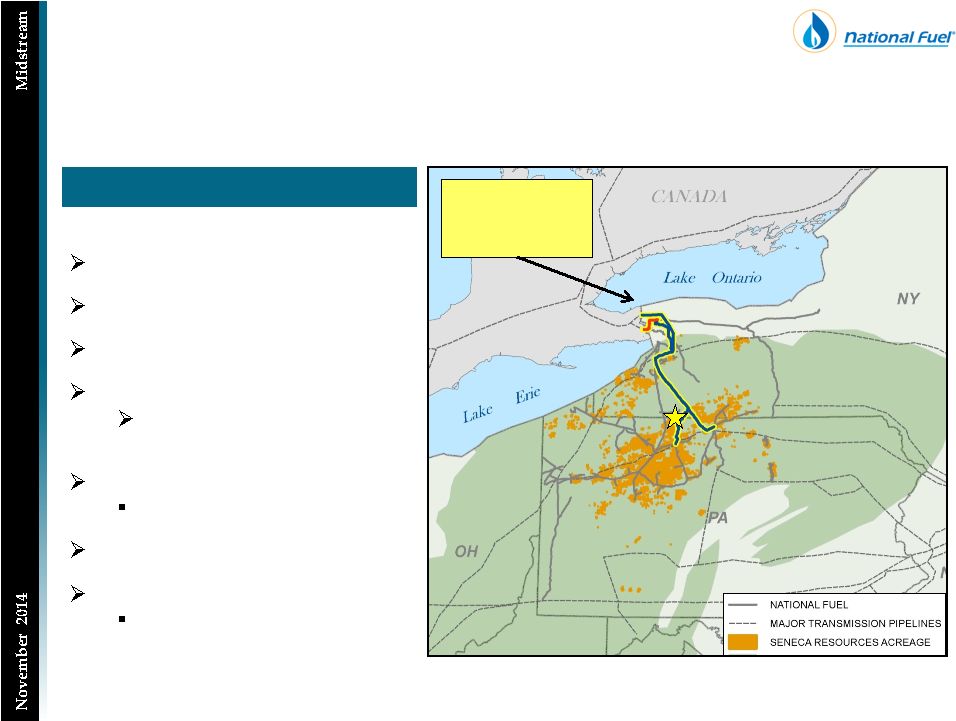
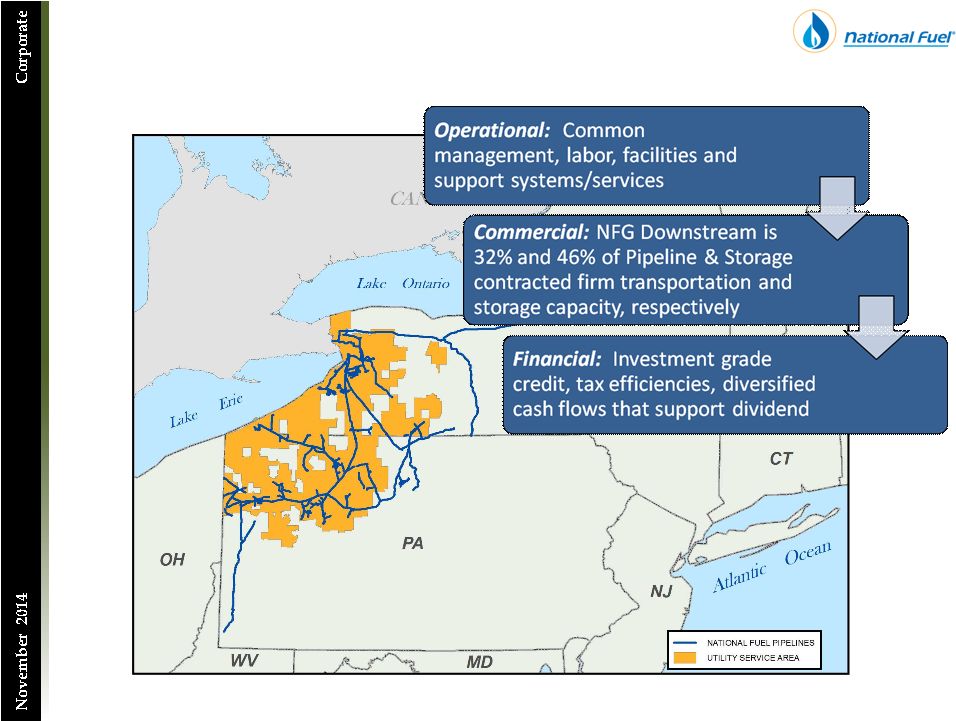 National Fuel Gas Company
Regulated Operations Provide Significant Synergies
5 |
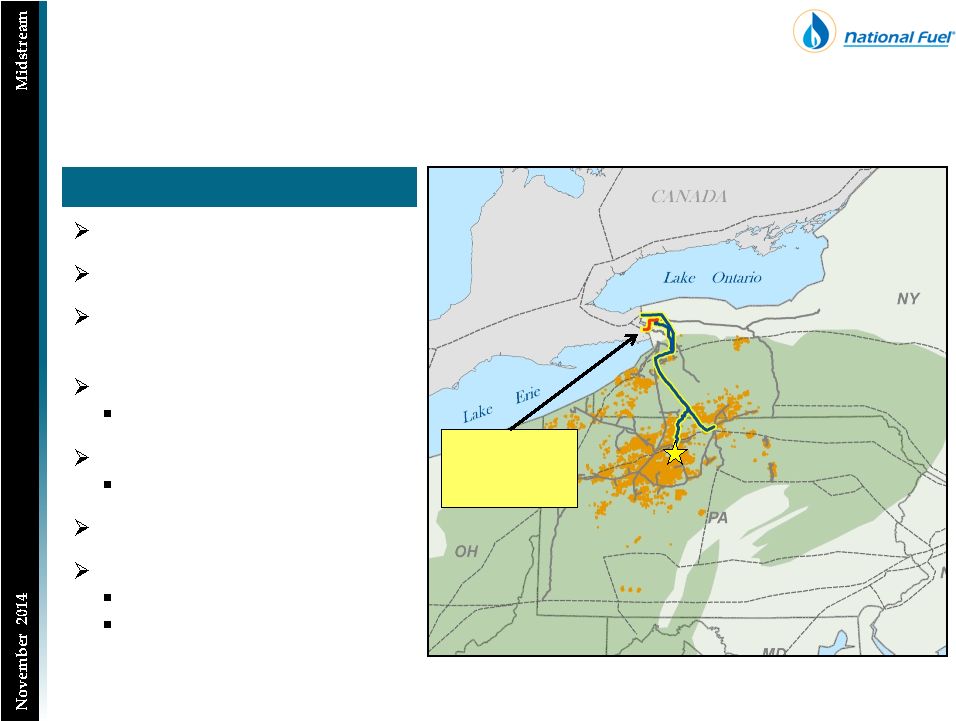
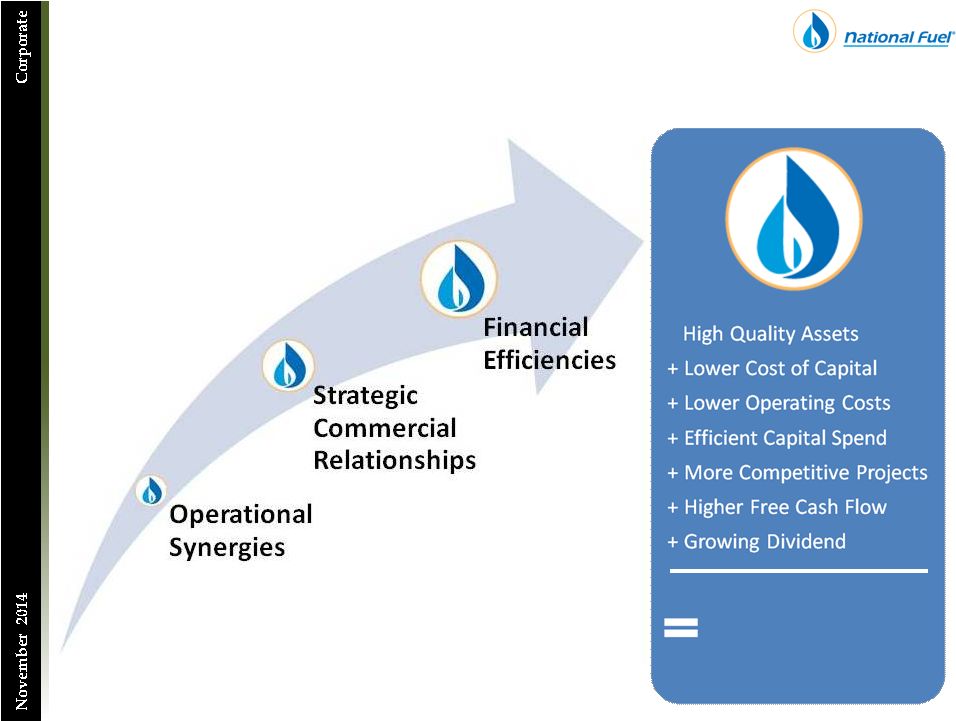 National Fuel Gas Company
What Makes NFG Unique, Also Maximizes Value
6
Foundation of
Our Appalachian
Growth Strategy |
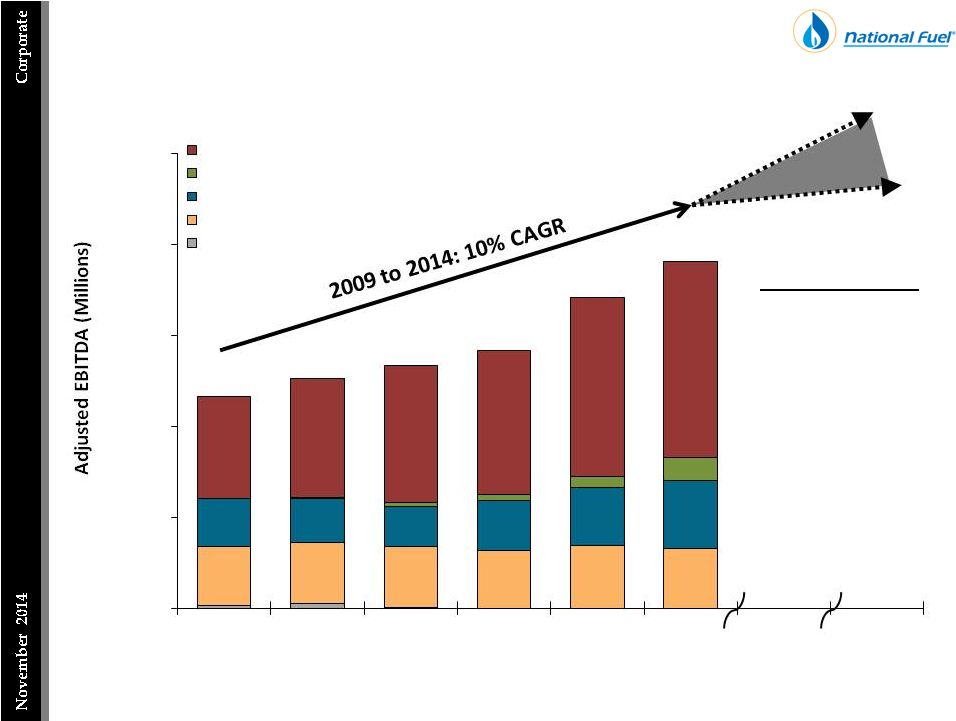 National Fuel Gas Company
Targeting Sustained EBITDA Growth over the next Five Years
2015 –
2019
10-15%
Forecasted
Adjusted EBITDA
CAGR
$164
$167
$169
$160
$172
$165
$131
$121
$111
$137
$161
$186
$64
$280
$327
$377
$397
$492
$539
$581
$632
$668
$704
$852
$953
$0
$250
$500
$750
$1,000
$1,250
2009
2010
2011
2012
2013
2014
2019E
Fiscal Year
Exploration & Production Segment
Gathering Segment
Pipeline & Storage Segment
Utility Segment
Energy Marketing & Other
7
Note: A reconciliation of Adjusted EBITDA to Net Income as presented on the Consolidated
Statement of Income and Earnings Reinvested in the Business is included at the end of this presentation. |
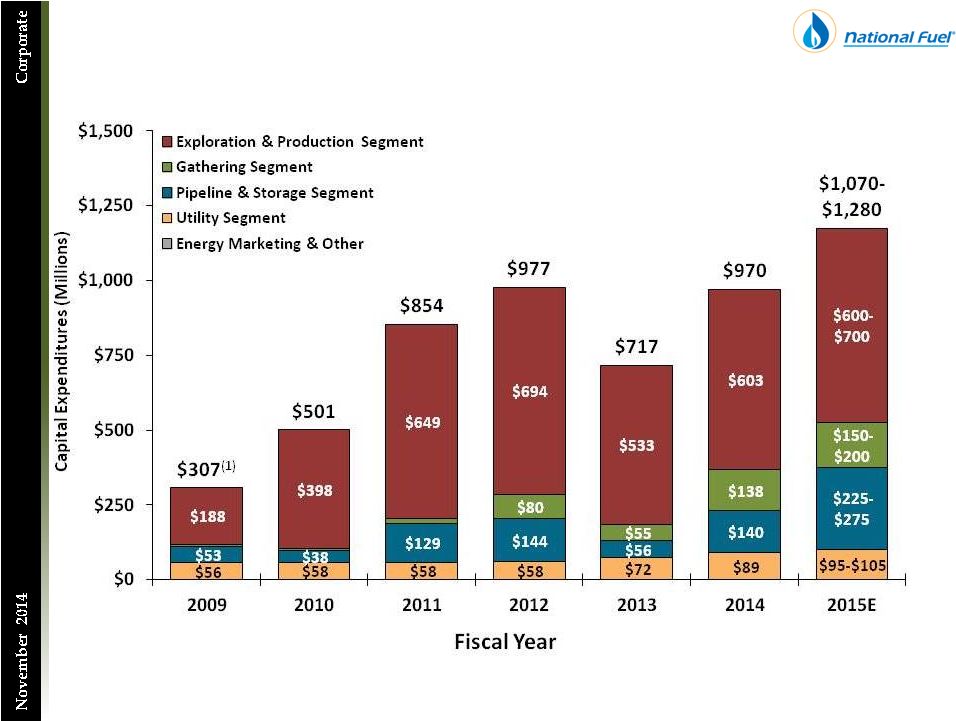 National Fuel Gas Company
Capital Spending Adjusts to Capitalize on Opportunities
8
Note: A reconciliation to Capital Expenditures as presented on the Consolidated Statement of
Cash Flows is included at the end of this presentation. (1)
Does not include the $34.9 MM Seneca Resources Corporation’s acquisition of
Ivanhoe’s U.S.-based assets in California, as this was accounted for as an investment in subsidiaries on the Statement
of Cash Flows, and was not included in the Exploration & Production segment’s Capital
Expenditures. |
 National Fuel Gas Company
Maintaining a Strong Balance Sheet
9
Total Debt
(1)
42%
$4.1 Billion
As of September 30, 2014
Debt/Adjusted EBITDA
Capitalization
Note: A reconciliation of Adjusted EBITDA to Net Income is included at the end of this
presentation. (1)
Long-term debt of $1.649 billion and short-term debt of $85.6 million
|
 National Fuel Gas Company
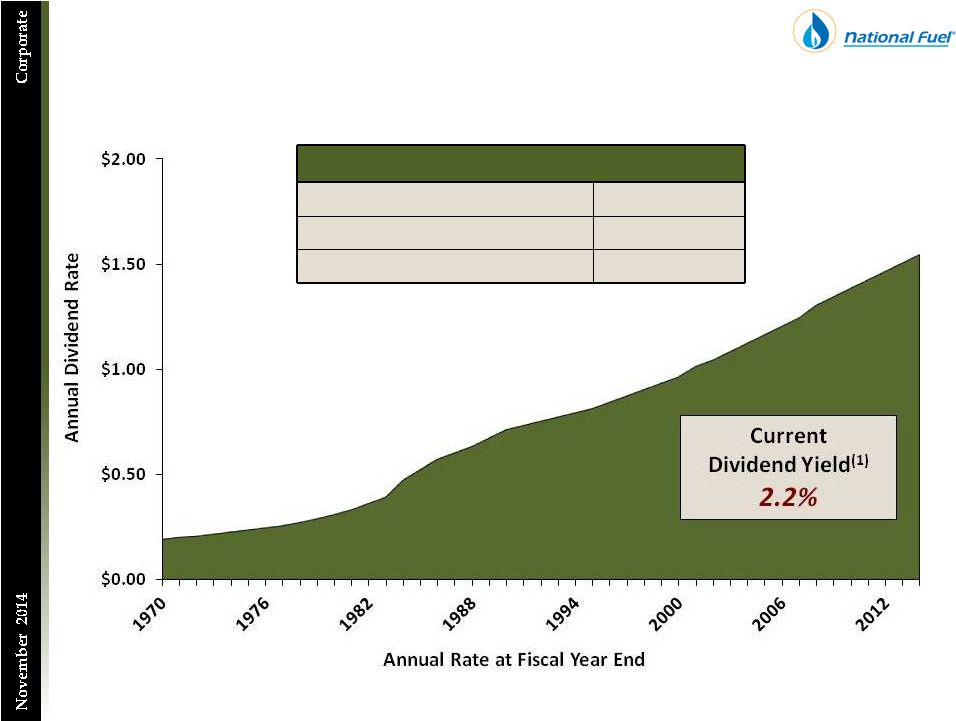
Dividend Track Record
10
Dividend Consistency
Consecutive Dividend Payments
112 Years
Consecutive Dividend Increases
44 Years
Current Annualized Dividend Rate
$1.54 per Share
(1) As of November 5, 2014 |
 11
Exploration & Production
Overview |
 Seneca Resources
Proven Record of Growth
12
Fiscal
Years
3-Year
F&D Cost
(1)
($/Mcfe)
2007-2009
$5.35
2008-2010
$2.37
2009-2011
$2.09
2010-2012
$1.87
2011-2013
$1.67
2012-2014
$1.38
(1)
Represents a three-year average U.S. finding and development cost
2014 F&D Cost = $1.15
Marcellus F&D: $1.00
327% Reserve
Replacement Rate
73% Proved Developed |
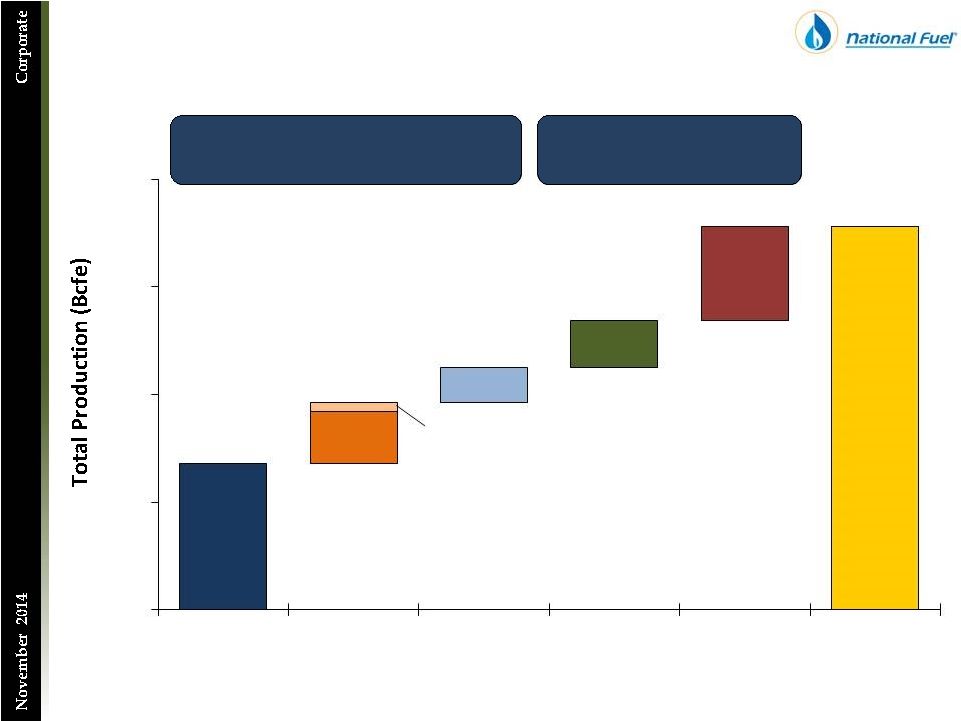
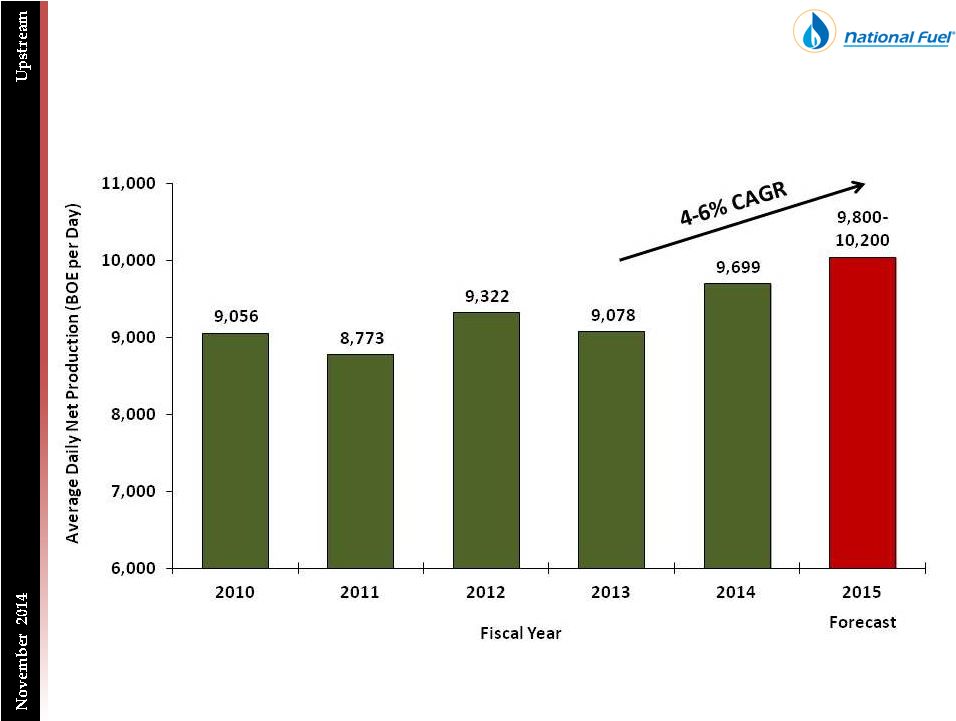
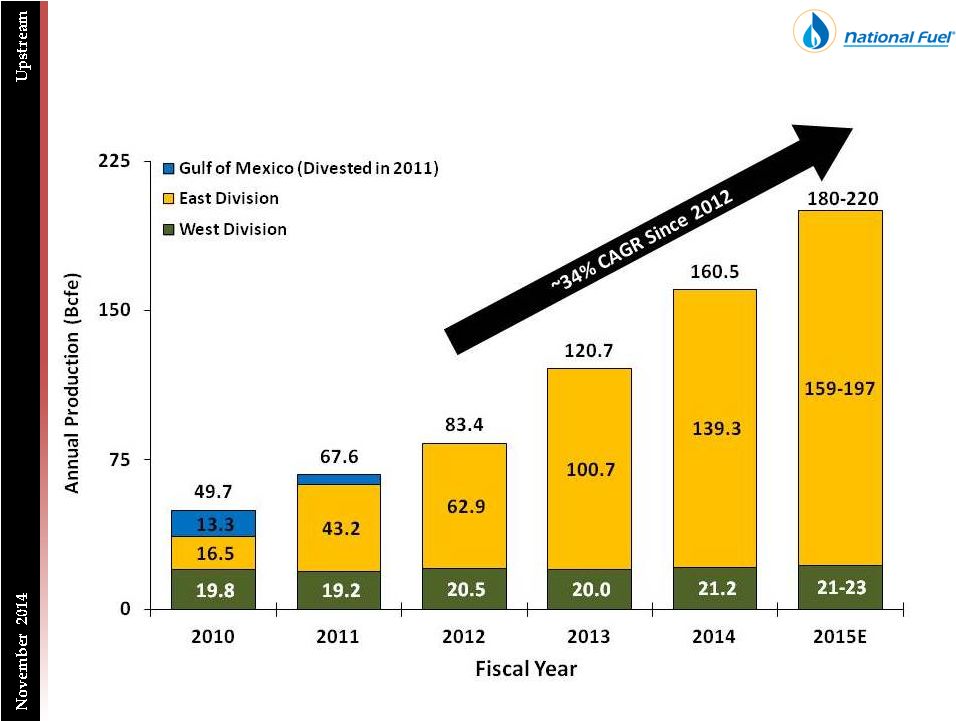 Seneca Resources
Delivering Tremendous Production Growth
13 |
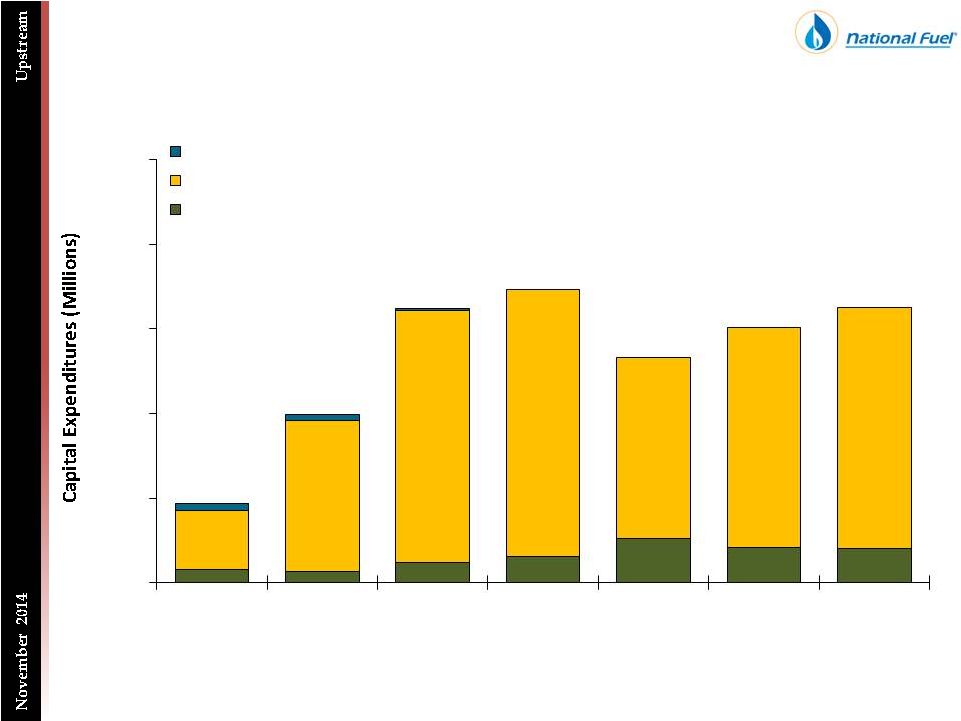 Disciplined Capital Spending
14
$31
$28
$47
$63
$105
$83
$55-$80
$139
$356
$596
$631
$428
$520
$545
-
$620
$188
(1)
$398
$649
$694
$533
$603
$600-$700
$0
$200
$400
$600
$800
$1,000
2009
2010
2011
2012
2013
2014
2015E
Fiscal Year
Gulf of Mexico (Divested in 2011)
East Division
West Division
Seneca Resources
(1)
Does not include the $34.9 MM Seneca Resources Corporation’s acquisition of
Ivanhoe’s U.S.-based assets in California, as this was accounted for as an investment in subsidiaries on the
Statement of Cash Flows, and was not included in the Exploration & Production
segment’s Capital Expenditures. |
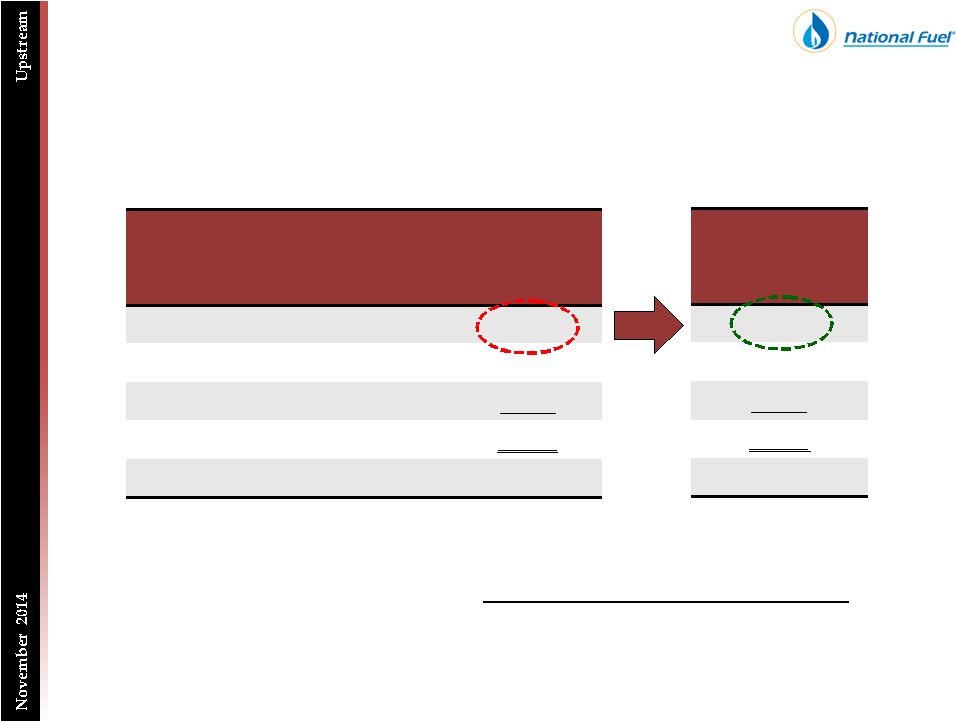
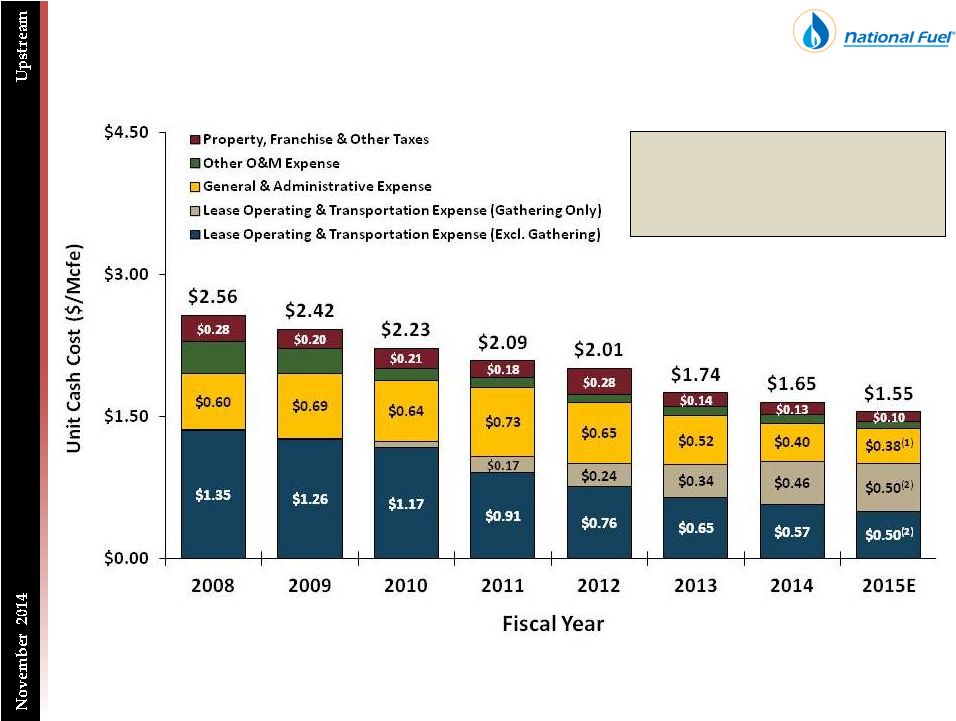 Seneca Resources
LOE: Operating Costs down; Transportation Costs up
15
(1)
Represents the midpoint of current General & Administrative Expense guidance of $0.35 to
$0.40 per Mcfe for fiscal 2015 (2)
The total of the two LOE components represents the midpoint of current LOE guidance of $0.95
to $1.05 per Mcfe for fiscal 2015 Seneca matches its long-term firm transport
(FT) contracts with firm sales (FS)
agreements, with the cost of transportation
reflected in price realization. As such, it is
not included in LOE. |
       Marcellus Shale
Prolific Pennsylvania Acreage
16
Eastern Development Area (EDA)
Mostly leased (16-18% royalty)
No near-term lease expiration
Limited development drilling until firm
transportation capacity on Atlantic
Sunrise becomes available in late 2017
Drilling activity will HBP key acreage
Western Development Area (WDA)
Average net revenue interest (NRI): 98%
No lease expiration
No royalty on most acreage
Highly contiguous
Significant economies of scale
1,700 to 2,000 locations de-risked
Seneca Lease
Seneca Fee
720,000 Acres
60,000 Acres |
 Marcellus Shale
EDA Delivering Significant Growth
17
Covington –
Fully Developed
Gross Production: ~45MMcf per Day
47 Wells Drilled and Producing
DCNR Tract 595
Gross Production: ~90 MMcf per Day
45 Wells Drilled
(1)
(52 Total Locations)
38 Wells Producing
DCNR Tract 100
Gross Production: ~410 MMcf per Day
58 Wells Drilled
(2)
(70 Total Locations)
53 Wells Producing
(2)
Opportunity for Geneseo development
Gamble
30 to 50 future locations
3 Wells Drilled; 1 Well Producing
Opportunity for Geneseo development
(1)
One well included in this total is drilled into the Geneseo Shale
(2)
One well included in this total is drilled into and producing from the Geneseo Shale
|
 Marcellus Shale
EDA –
Historical Well Results are Exceptional
18
Development Area
Producing
Well Count
Average
IP Rate
(MMcf/d)
Average
7-Day
(MMcf/d)
Average
30-Day
(MMcf/d)
Average
EUR
per Well
(Bcf)
Average
Lateral
Length
EUR per
1,000’
of
Lateral
(Bcfe)
Covington
Tioga
County
47
5.2
4.7
4.1
5.8
4,023’
1.44
Tract 595
Tioga
County
38
7.2
6.0
5.2
8.0
4,716’
1.70
Tract 100
Lycoming
County
52
(1)
17.0
14.9
12.7
12.6
5,304’
2.38
(1)
Does not include a well drilled into and producing from the Geneseo Shale
|
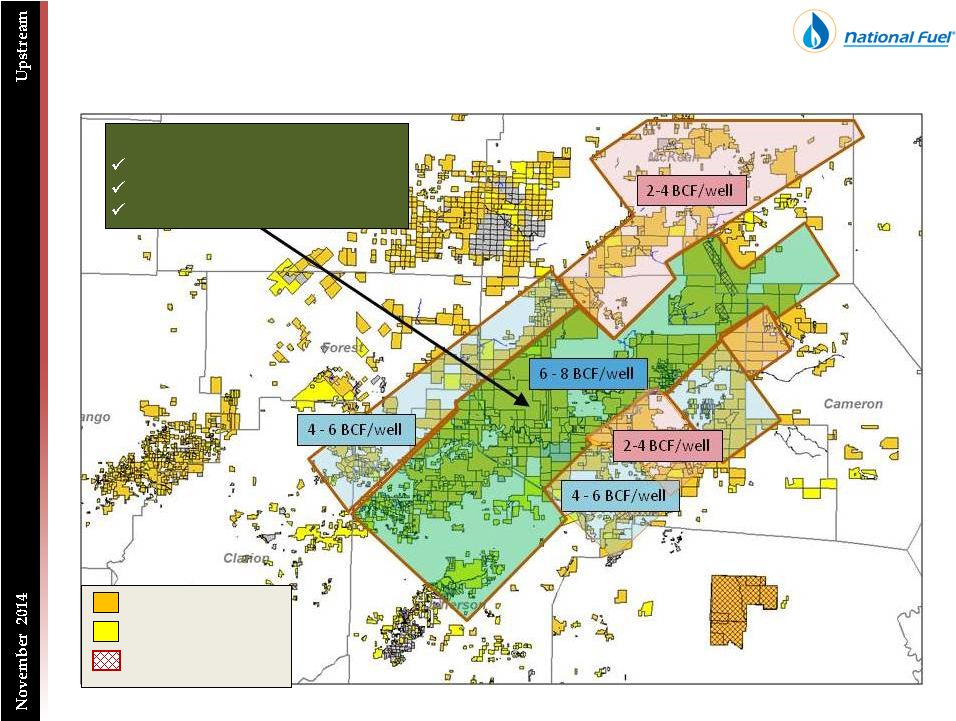 Marcellus Shale
Focusing on WDA Development
19
SRC Lease Acreage
SRC Fee Acreage
EOG Earned JV Acreage
Note: Assumes 6,000’
treated lateral length
Seneca’s Tier I Acreage:
200,000 Acres
6-8 Bcfe EUR Wells
Economic at $2.80 to $3.80/Mcfe |
 Marcellus Shale
Strong Wells Currently Producing Across WDA Acreage
20
Area
Producing
Well Count
Peak
24-Hour Rate
(MMcfd)
Average
7-Day (MMcf/d)
Average Treatable
Lateral Length
Clermont/Rich Valley
Elk, Cameron & McKean
counties
19
8.1
7.2
5,710’
WDA Development Areas:
WDA Delineation Areas:
Area
Producing
Well Count
Peak
24-Hour Rate
(MMcfd)
Average
7-Day (MMcf/d)
Average Treatable
Lateral Length
Ridgway
Elk County
1
7.1
6.4
5,537’
Church Run
Elk & Jefferson counties
2
4.8
4.5
4,690’
Owl’s Nest
Elk & Forest counties
1
6.1
5.8
6,137’
Sulger Farms
Jefferson County
1
6.1
5.6
5,778’ |
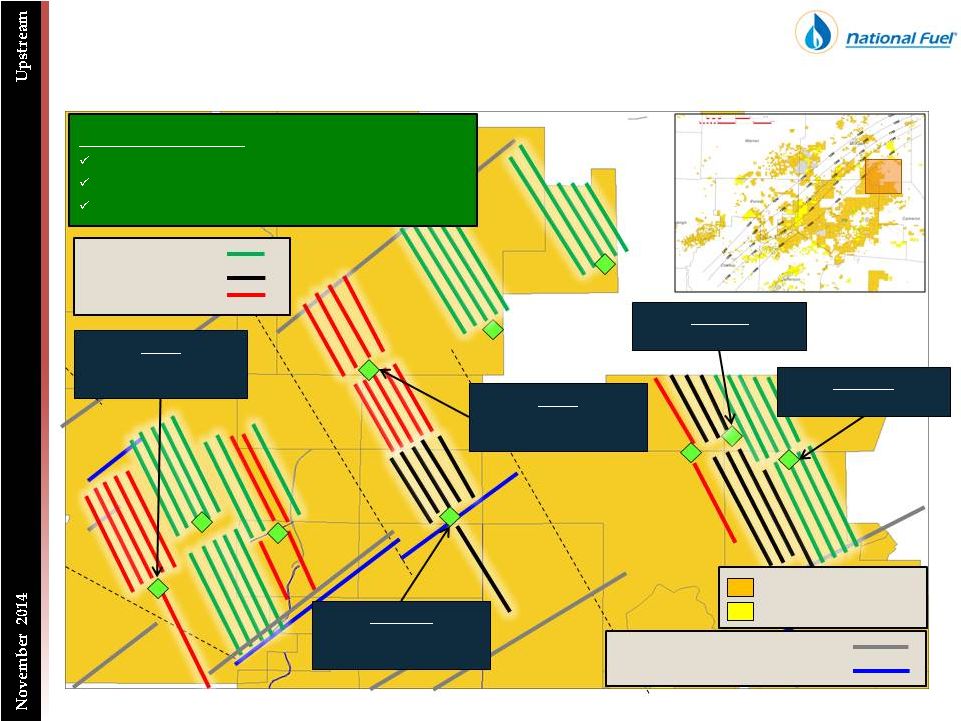 Marcellus Shale
Clermont/Rich Valley (CRV) Area
Marcellus Faults
Marcellus & Basement Faults
Planned Wells
Drilled Wells
Producing Wells
Pad H
6 Wells
Ave. IP: 8.0 MMCFD
Pad N
9 Wells
Ave. IP: 8.2 MMCFD
Clermont/Rich Valley
200-250 Planned Horizontal Locations
FY 2014 Year-end: 19 Wells; ~ 75 MMcfd
FY 2015 Fcst Year-end:~50 Wells; ~180 MMcfd
SRC Lease Acreage
SRC Fee Acreage
Pad C8-F
Completing
Pad C8-G
Drilling
Pad D9-D
6 Wells
Drilled
21 |
 Marcellus Shale
WDA Mineral Interests Significantly Enhance Returns
22
($/Mcf)
Typical
Producer
15% Royalty
Average Net Realized Price
$ 3.27
Less: Cash Operating Expenses
(0.65)
Less: Royalty Payment
(0.47)
Cash Margin
$ 2.15
Before Tax IRR
(1)
15%
In Clermont/Rich Valley, a typical producer burdened by a
15% royalty would require a $0.47 higher net realized price
to achieve same level of economics as Seneca Resources
The Seneca
Advantage
0% Royalty
$ 2.80
(0.65)
(0.00)
$ 2.15
15%
(1)
Internal
Rate
of
Return
(IRR)
includes
estimated
well
costs
under
current
coststructure,
LOE,
and
Gathering
tariffs
anticipated
for
each
prospect.
Clermont/Rich Valley Example |
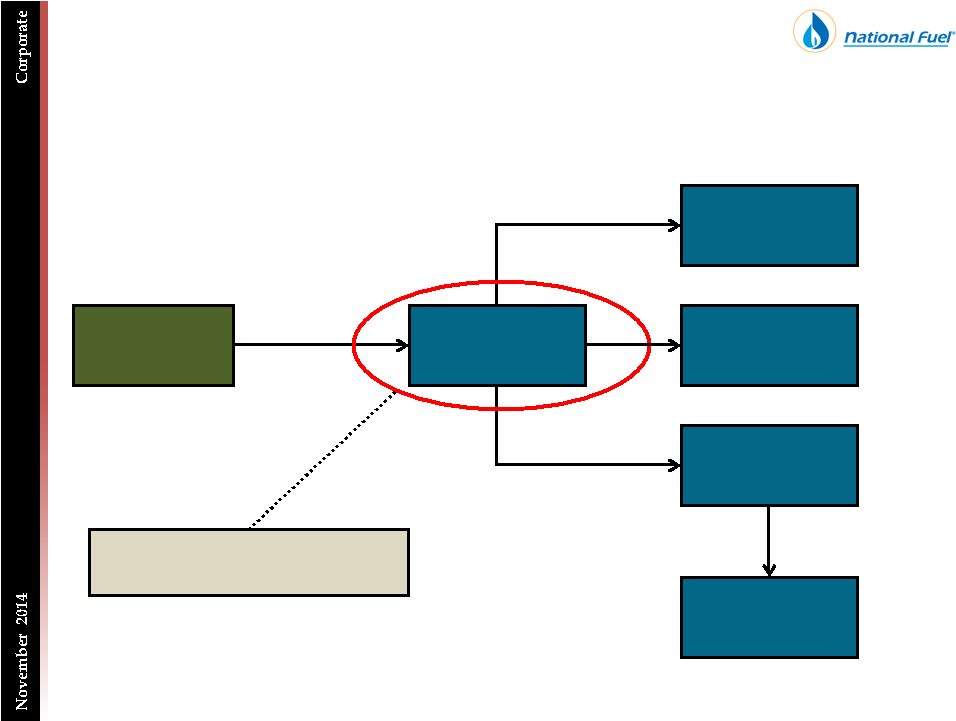 Natural Gas Marketing
How Does Seneca Sell its Production?
23
Well Head
Interconnection
with Interstate
Pipeline Network
Gathering
System
3rd Party
Marketer
(or spot market)
Firm Transport
Demand Center
(firm sales or
spot market)
Contracted Basis
Differential
FT Rate
Breakeven economics based on a
realized price after gathering
Spot Market |
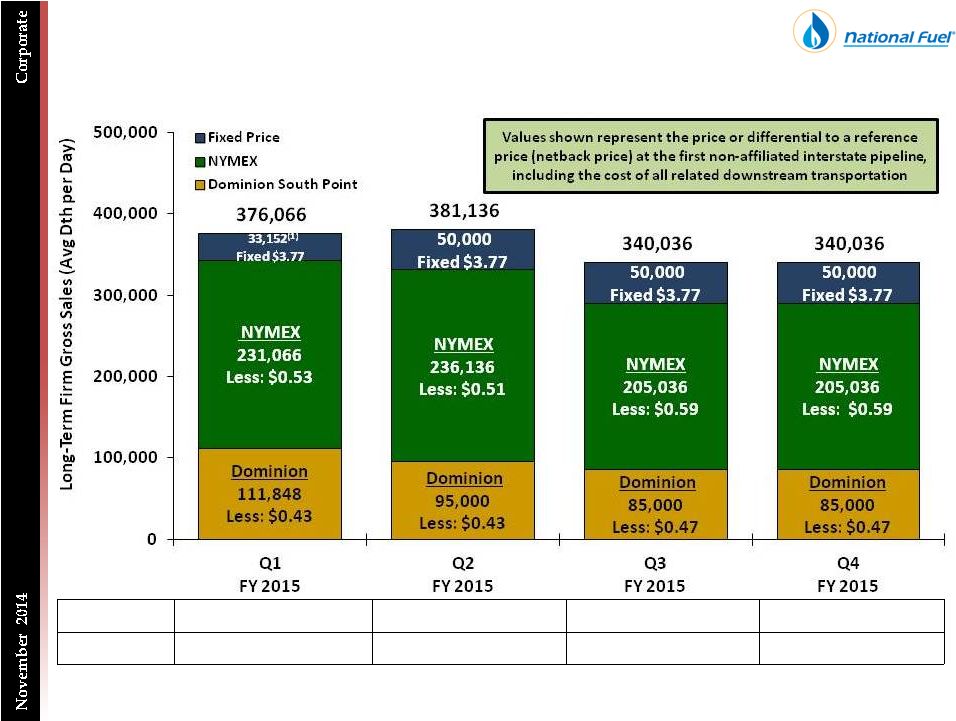
 Natural Gas Marketing
Adding Long-Term Firm Transport to the Portfolio
24
Project
(Counterparty)
In-
Service
Date
Contract
Term
Delivery
Market
FT Capacity (Dth/day)
Matched Firm Sales
Fiscal
2015
Fiscal
2016
Fiscal
2017
Fiscal
2018
Northeast Supply
Diversification
Project (TGP)
Nov.
2012
15 years
Canada
50,000
50,000
50,000
50,000
Executed Contracts
50,000 Dth/d
for 10 years
Niagara
Expansion/
TETCO (TGP/
NFG/TETCO)
Nov.
2015
15 years
Canada/
TETCO
---
170,000
170,000
170,000
Executed Contracts
140,000 Dth/d
for 15 years
Northern Access
2016 (NFG/
TransCanada/
Union)
Nov.
2016
15 years
Canada
---
---
350,000
350,000
Evaluating marketing
opportunities
Atlantic Sunrise
(Transco)
Nov.
2017
15 years
Mid-
Atlantic/
Southeast
---
---
---
189,405
Executed Contracts
189,405 Dth/d
for first 5 years
(1)
Total Firm Transportation Capacity
50,000
220,000
570,000
759,405
(1)
A
large
majority
of
the
executed
firm
sales
agreements
continue
for
the
remainder
of
the
firm
transportation
contract
term. |
 Natural Gas Marketing
Significant Base of Long-Term Firm Contracts
25 |
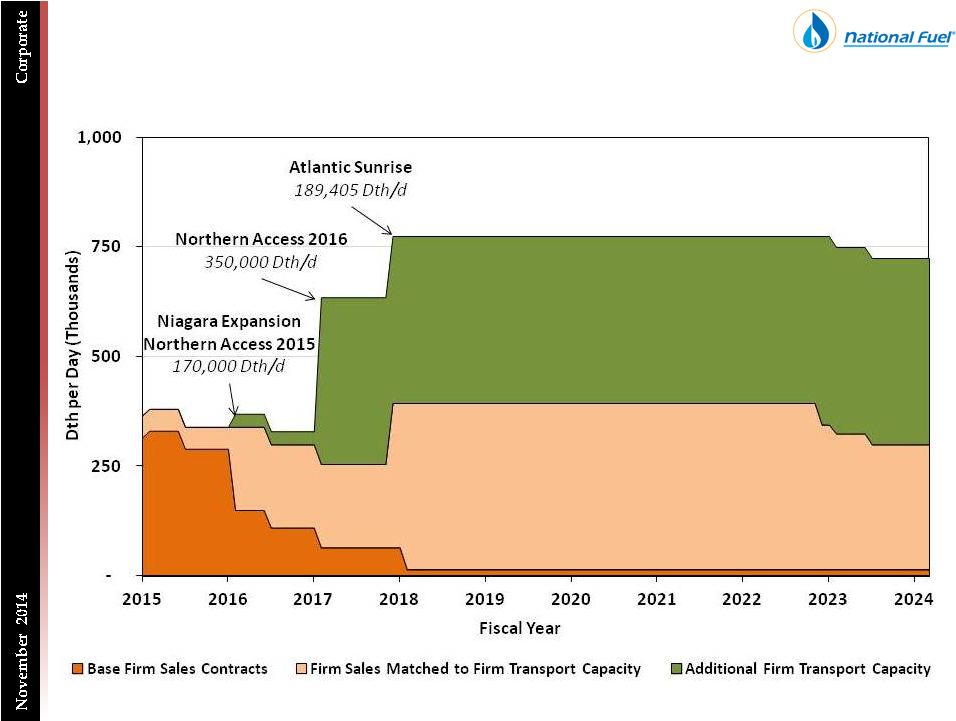
 Natural Gas Marketing
Firm Sales Provide a Market for Appalachian Production
26
26
EDA
(2)
318,033 Dth/d
320,036 Dth/d
280,036 Dth/d
280,036 Dth/d
WDA
(2)
58,034 Dth/d
61,100 Dth/d
60,000 Dth/d
60,000 Dth/d
(1)
Fixed price sales contracts totaling 50,000 Dth/day at an average fixed price of $3.77 per Dth
starting November 2014 through October 2017 (2)
EDA
and
WDA
carryan
average
net
revenue
interest
(NRI)
of
82%
-
84%
and
98%,
respectively |
 Natural Gas Marketing
Current Natural Gas Hedge Positions
27 |
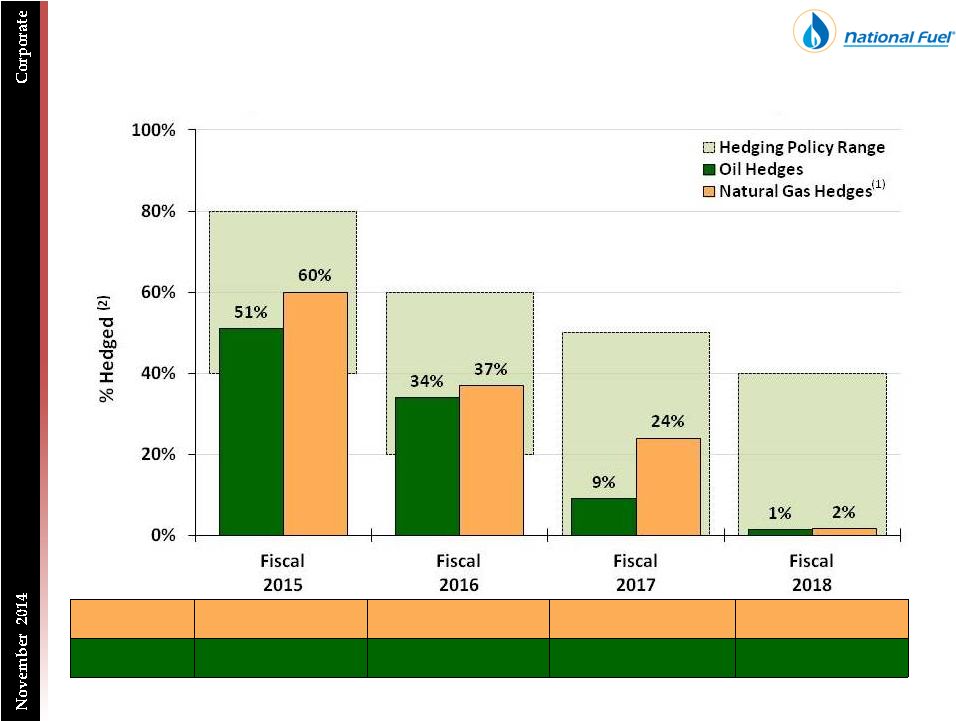 Natural Gas Marketing
Current Hedge Book has Seneca Positioned Very Well
28
(1)
Natural gas hedges include fixed price firm sales
(2)
Hedge positions reflect the midpoint of Seneca’s target annual production growth (20%)
starting with the midpoint of Fiscal 2015 guidance (180-220 Bcfe) Natural Gas
$4.01/MMBtu
$4.03/MMBtu
$4.11/MMBtu
$4.41/MMBtu
Crude Oil
$95.27/Bbl
$92.95/Bbl
$92.30/Bbl
$91.00/Bbl |
 Natural Gas Marketing
FY 2015 Production –
Firm Sales & Hedge Composition
29
Firm Sales with Price Certainty
108 Bcf at ~$3.70 /Mcf
Spot Price Exposure
66 Bcf at $2.50-$2.75 /Mcf
(1)
(1)
Spot price assumptions reflected in fiscal 2015 earnings guidance range
(2)
Dominion based firm sales contracts without a matching Dominion financial hedge
68.1 Bcf
24.1 Bcf
16.2 Bcf
22.0 Bcf
43.5 Bcf
4.1 Bcf
(2)
159-197 Bcf
0
50
100
150
200
NYMEX
Firm Sales
DOM
Firm Sales
Fixed
Price Sales
WDA
Spot Sales
EDA
Spot Sales
Total
East Division
Production |
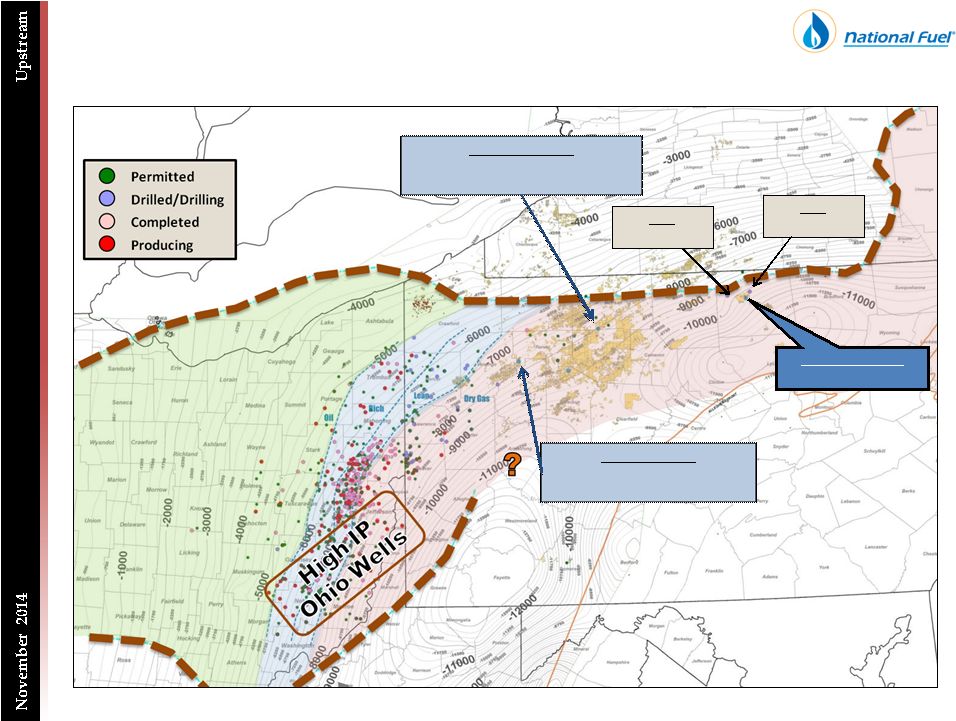     Utica Shale
Seneca Activity in Tioga County
30
Seneca -
Tionesta
Horizontal: Completed Fall 2012
Peak 24-Hour Rate: 3.9 MMcf/d
Seneca -
Mt Jewett
Horizontal: Completed September 2013
Peak 24-Hour Rate: 8.5 MMcf/d
Seneca -
DCNR 007
Drilling
Shell
26 MMcf/d
Shell
11 MMcf/d |
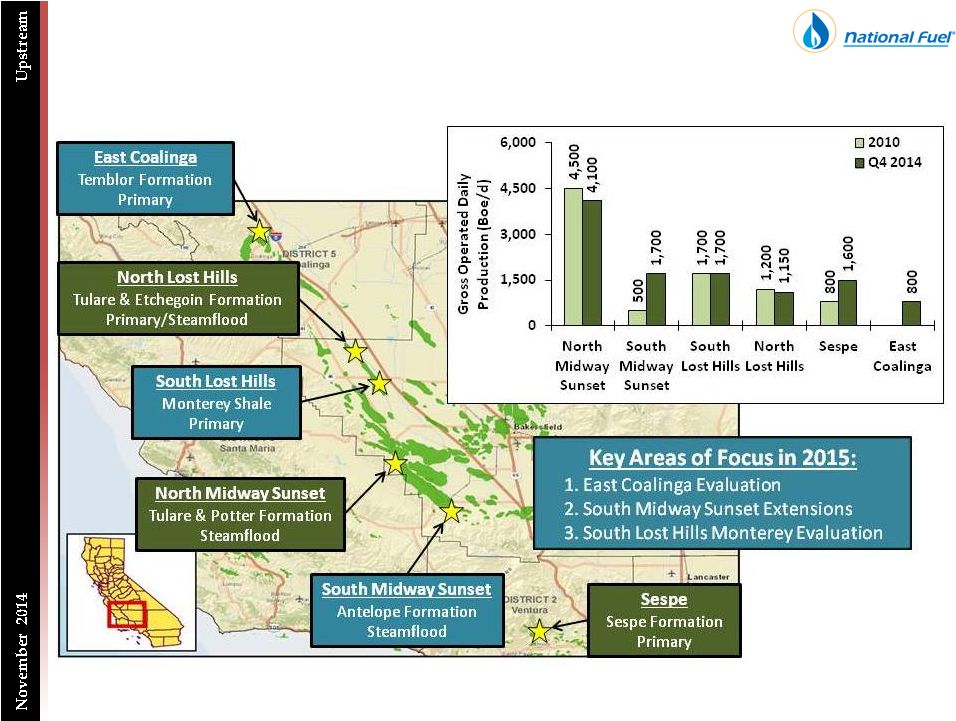 California
Stable Production Fields; Modest Growth Potential
31 |
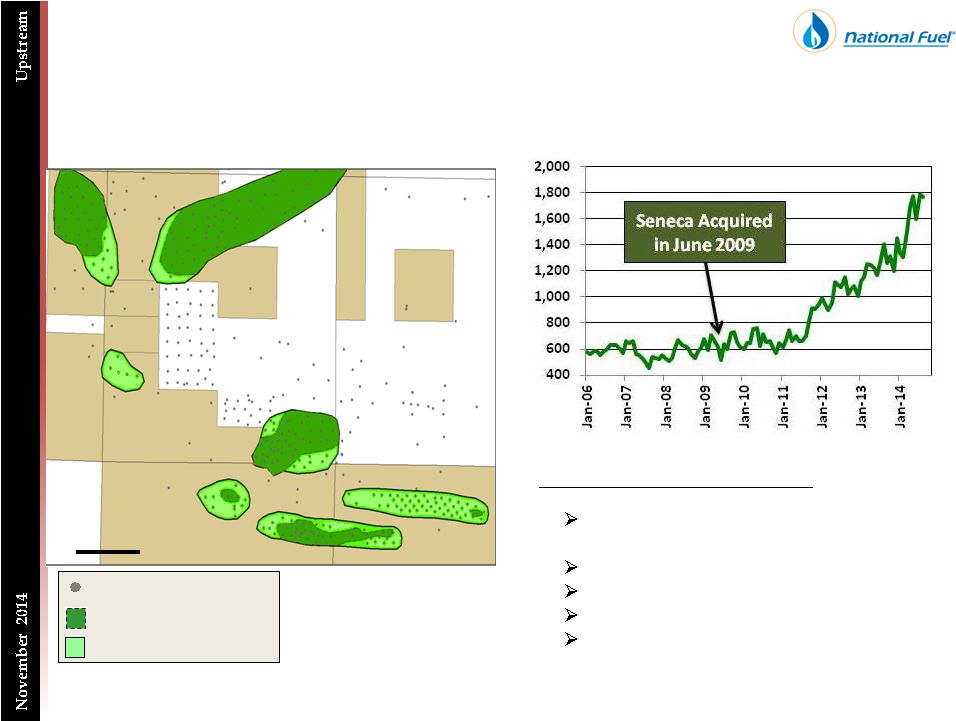
 California
East Coalinga Summary
32
Production has increased from 214 BOPD to
800
BOPD
•
Highest on leases since 2000
Drilled 12 evaluation wells in 2013
•
Producing ~150 BOPD
Drilled 31 new producers and 1 water
disposal well in 2014. Currently have 27 of
the new producers on line.
2014 Location
2013 Well
Active Well
Idle Well
P&A
Seneca Lease
Field Boundary |
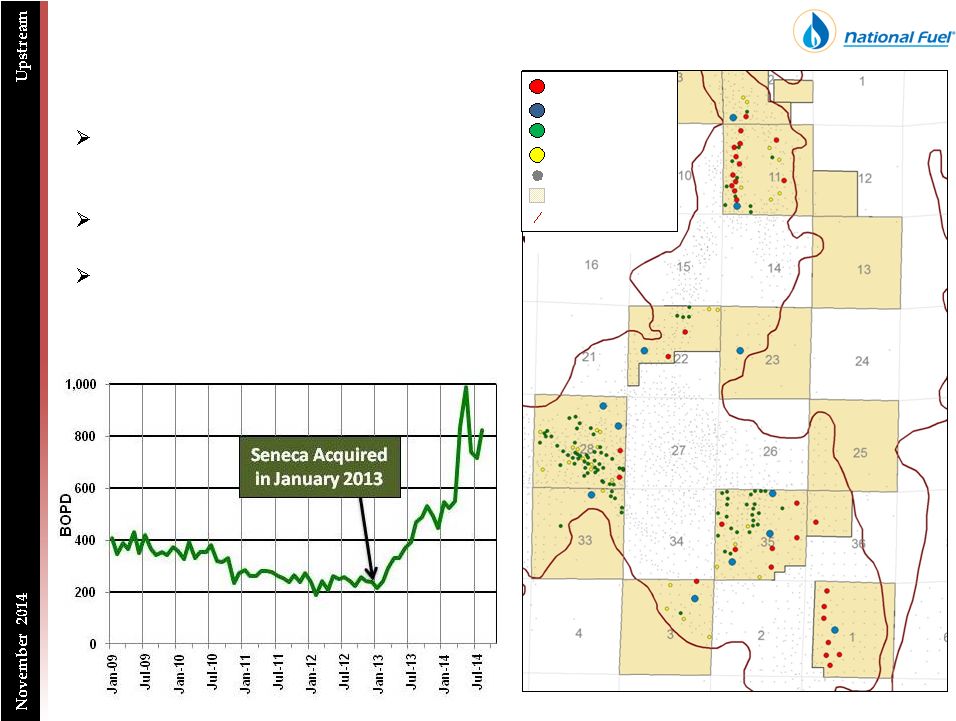
 California
South Midway Sunset Has Delivered Significant Growth
33
252 Pool
97X Pool
SE Pool
251 Pool
B Pool
A Pool
Extended Pool Boundary
Original Pool Boundary
Existing Wells
1000’
16X Pool
Highlights Since Acquisition
Increased daily production 310% to
approximately 1,700 BOPD
Drilled 102 new producers
Added 3.3 MMBO of proven reserves
Increased steam capacity by 280%
Identified opportunities for additional pool
development |
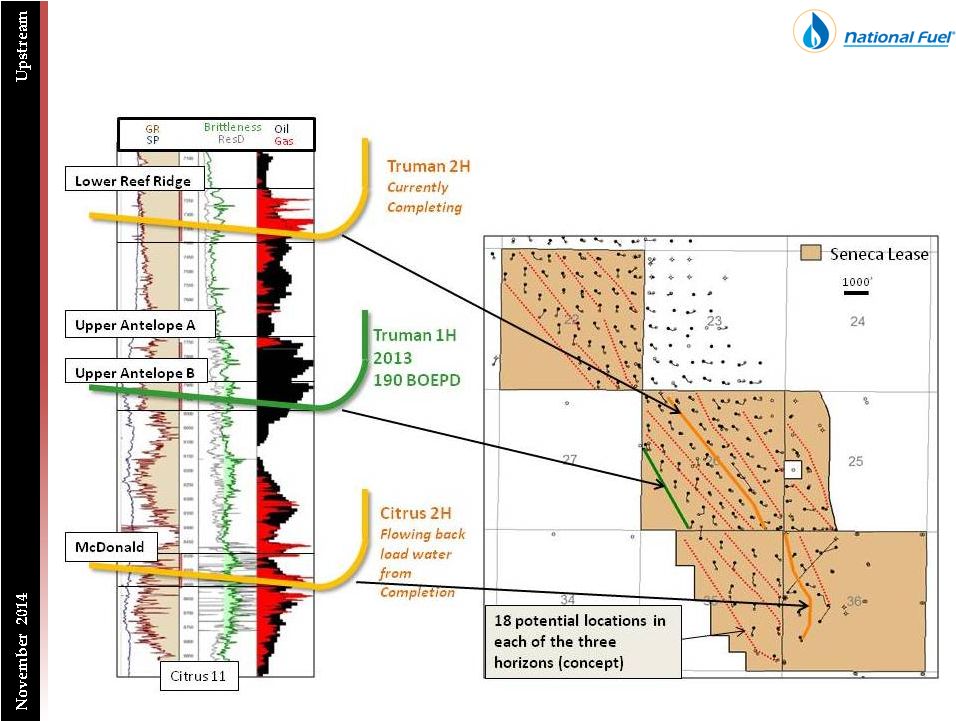 California
Evaluating the Monterey Shale at South Lost Hills
34 |
 California
Modest Growth Opportunities, But Strong Economics
35
Field
Average
Well Cost
Average
EUR
(MBO)
Estimated
IRR
@$85/Bbl
Fiscal 2015
Locations
North Midway Sunset
$300,000
32
59%
29
South Midway Sunset
$300,000
38
96%
42
East Coalinga
$580,000
35
30%
25 |
 California
Modest Growth Anticipated in 2015
36 |
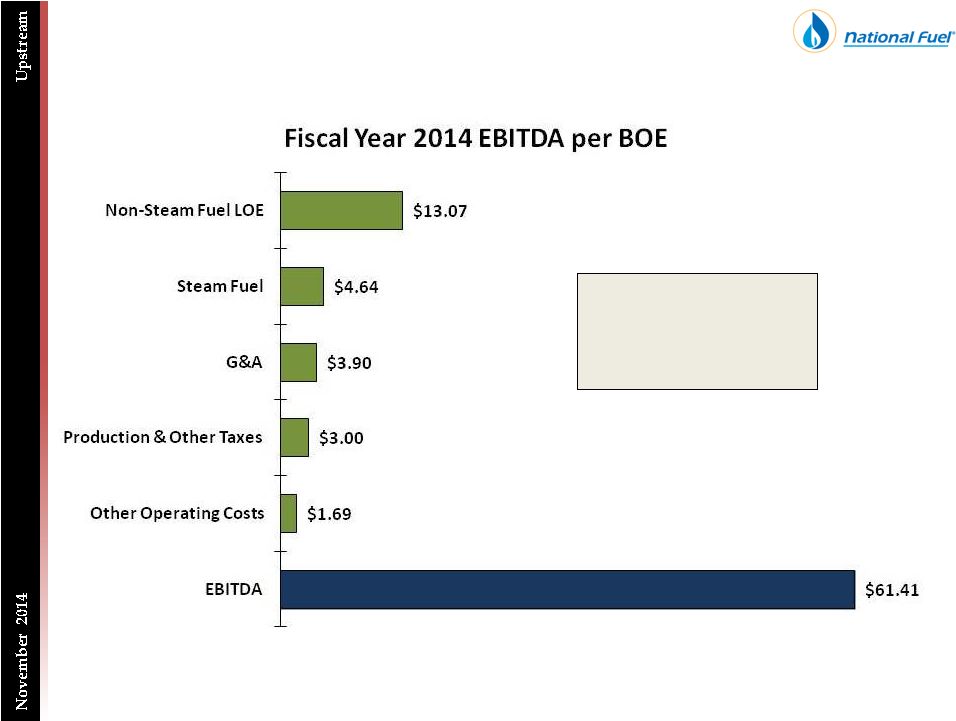 California
Strong Margins Support Significant Free Cash Flow
37
Average Revenue
for Fiscal 2014
$87.71 per BOE
Note:
A
reconciliation
of
Exploration
&
Production
West
Division
EBITDA
to
Exploration
&
Production
Segment
Net
Income
is
included
at
the
end
of
this
presentation. |
 Seneca Resources
What Will Seneca Look Like Moving Forward?
38
Consistent Production Growth: 15-25% CAGR
Driven by a very large, high-quality Appalachian acreage position
Maintain Oil Production
Expand When Possible
Excellent operator and significant cash flow generation
Disciplined Spending Driven by Firm
Pace of development adapts to changing market dynamics
A Leader in Technology, Safety & Environmental Responsibility
Maintain a leadership role in using technology and developing best practices
|
 39
Midstream Businesses
Overview |
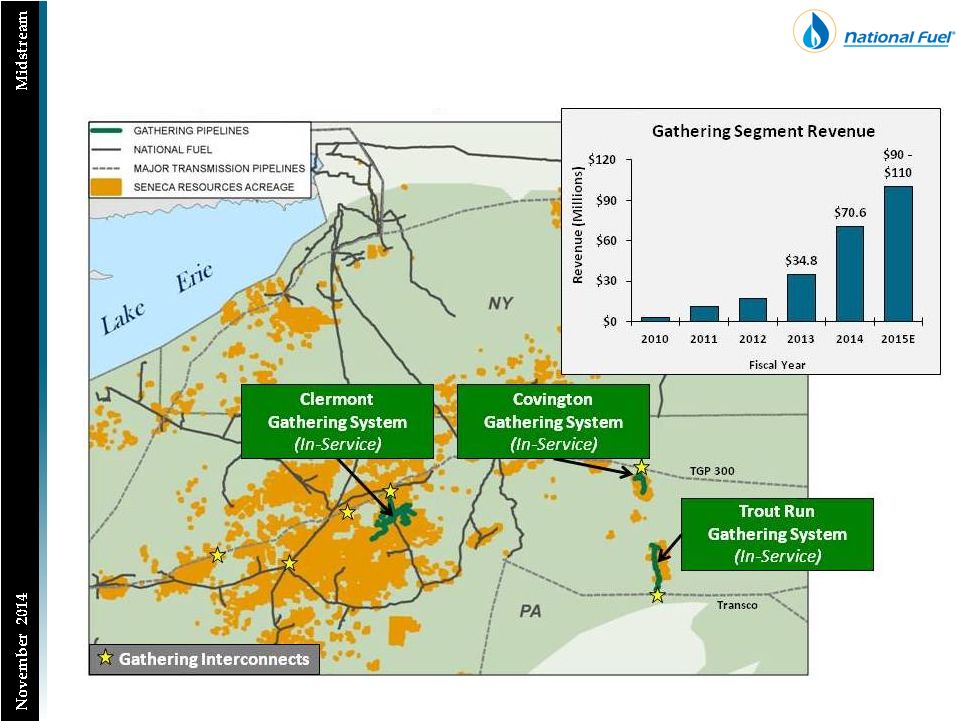
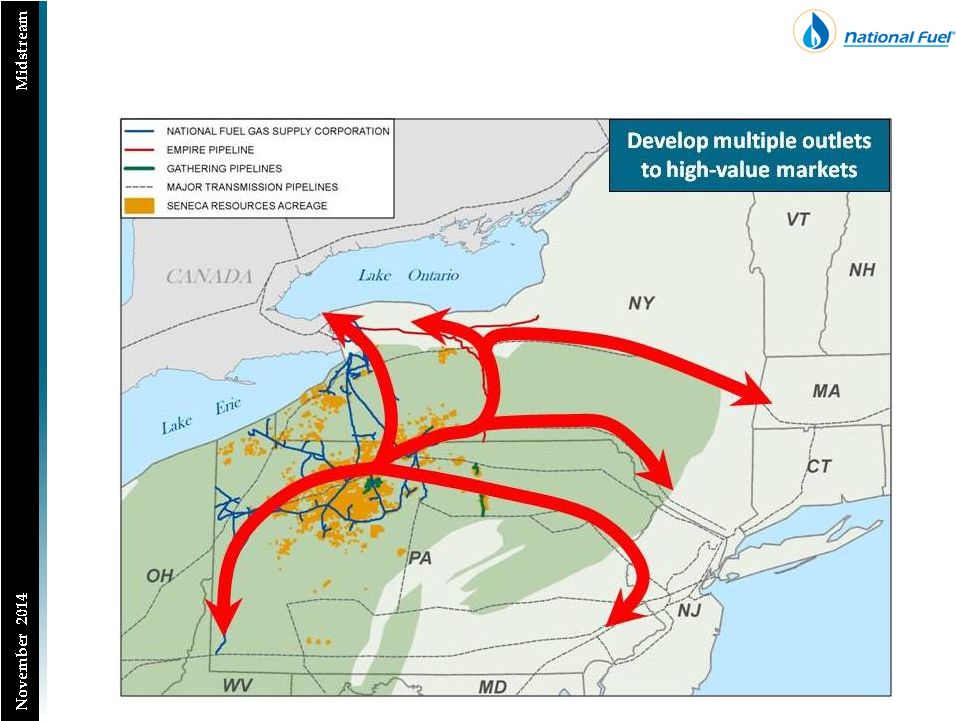
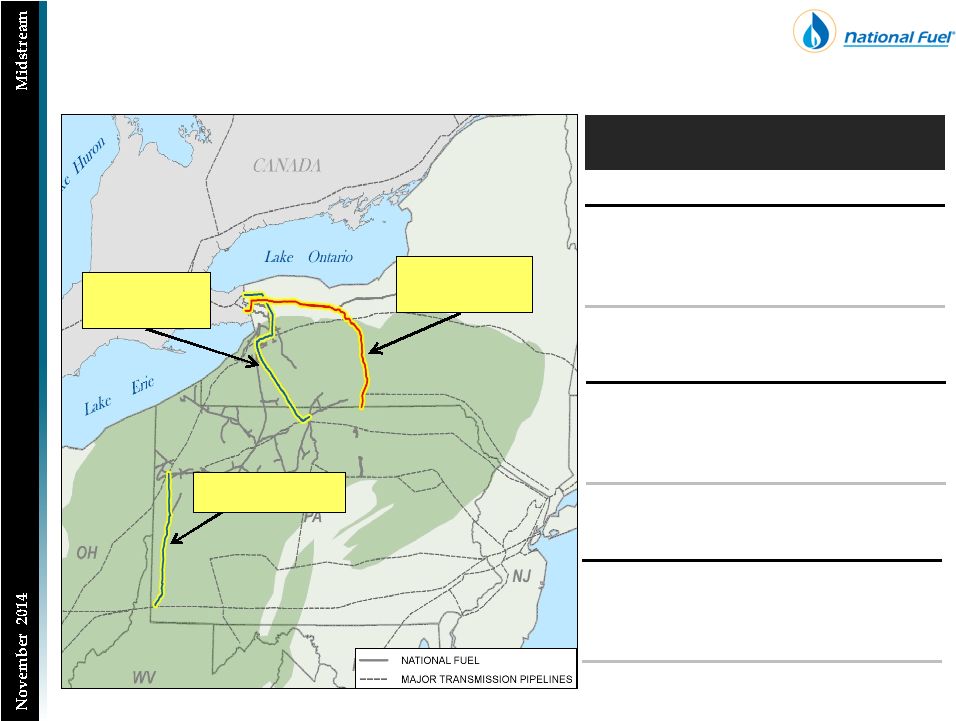
 Midstream Businesses
Positioned to Serve Rapidly Growing Production in Appalachia
40 |
 Gathering
 is the First Step to Reaching a Market
41 |
 Gathering
 Systems Supporting Seneca’s EDA Production
42
Covington Gathering System
In-Service Date: November 2009
Capacity: 220,000 Dth per day
Interconnect: TGP 300
Capital Expenditures (to date): $32 Million
Trout Run Gathering System
In-Service Date: May 2012
Capacity: 466,000 to 585,000 Dth per day
Interconnect:
Transco
–
Leidy
Lateral
Capital Expenditures (to date): $162 Million
Capital Expenditures (future): $30 to $70 Million
Interconnects
7.0
30.9
44.7
51.0
48.3
45-50
45.0
87.4
100-120
0
25
75
100
125
150
2010
2011
2012
2013
2014
2015E
Fiscal Year Throughput by Project
(Covington & Trout Run Systems)
Covington
Trout Run
50
5.3 |
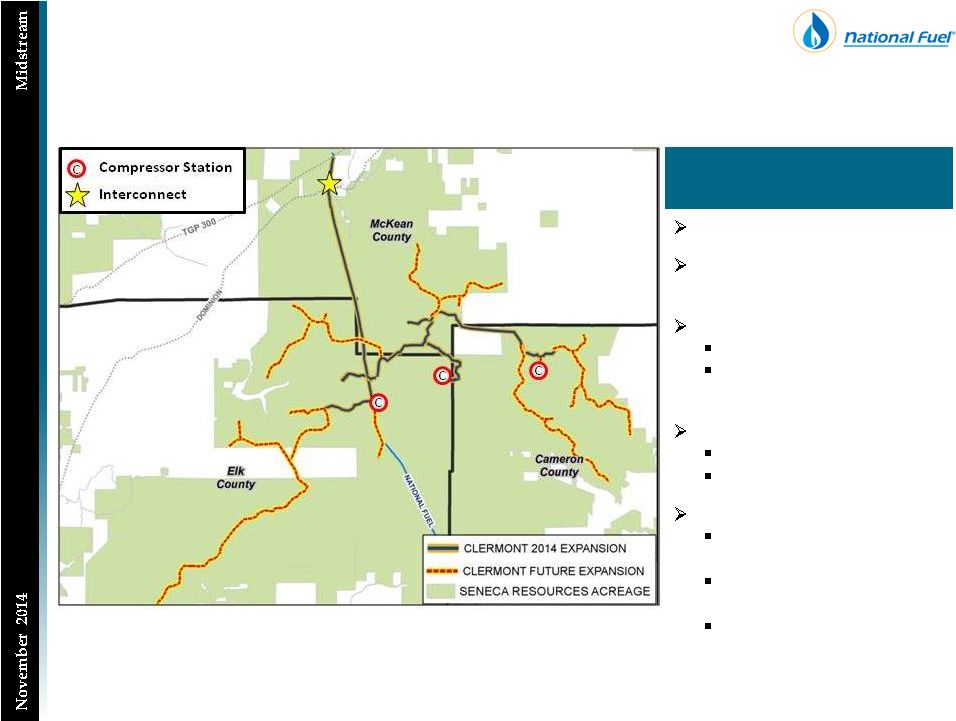 Gathering
Clermont Gathering System has Large Expandability
43
Clermont Gathering
System
In-Service: July 2014
Ultimate Trunkline Capacity:
1+ Bcf per day
Interconnects
TGP 300 (current)
NFG Supply Corporation
(Northern Access 2016)
Capital:
2014: $96 Million
2015: $110 -
$160 Million
Seneca Pads Connected
SRC Pad N (9 wells)
connected July 2014
SRC Pad H (6 wells)
connected September 2014
Up to 25 pads connected
following the 2015
expansion |
 Pipeline & Storage
Project Opportunities to Support Appalachian Growth
44 |
 Pipeline & Storage
Expansions to Move Gas from the WDA Are Significant
45
Projects to Support WDA Growth
Project
Capacity
(Dth/day)
Northern Access 2015
140,000
Northern Access 2016
350,000
Total New Capacity
490,000
Project
Capital Cost
Northern Access 2015
$66 Million
Northern Access 2016
$410 Million
Total Capital
Expenditures
$476 Million
Clermont
Northern
Access 2015
(November 2015)
Northern
Access 2016
(Late 2016) |
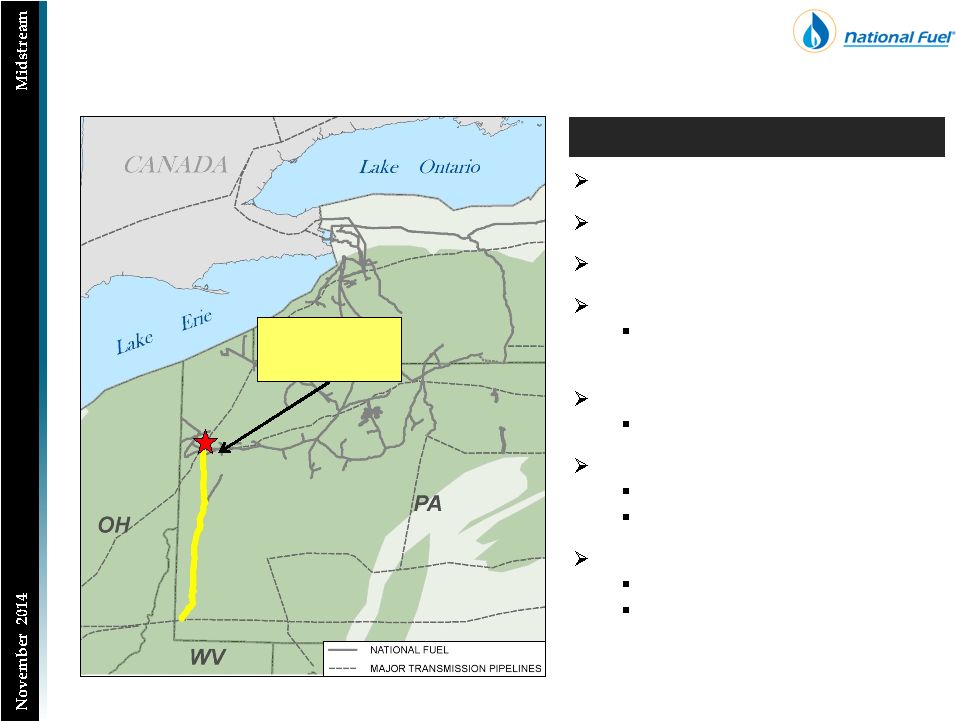
 Pipeline & Storage
Major Expansion Designed for Canadian Deliveries
46
Customer: Seneca Resources
In-Service: November 2015
System: NFG Supply Corp.
Capacity: 140,000 Dth per day
Lease to TGP as part of their
Niagara Expansion project
Interconnect
Niagara (TransCanada)
Total Cost: $66 Million
Major Facilities
23,000 HP Compression
Northern Access 2015
Northern
Access 2015
(November 2015)
Clermont |
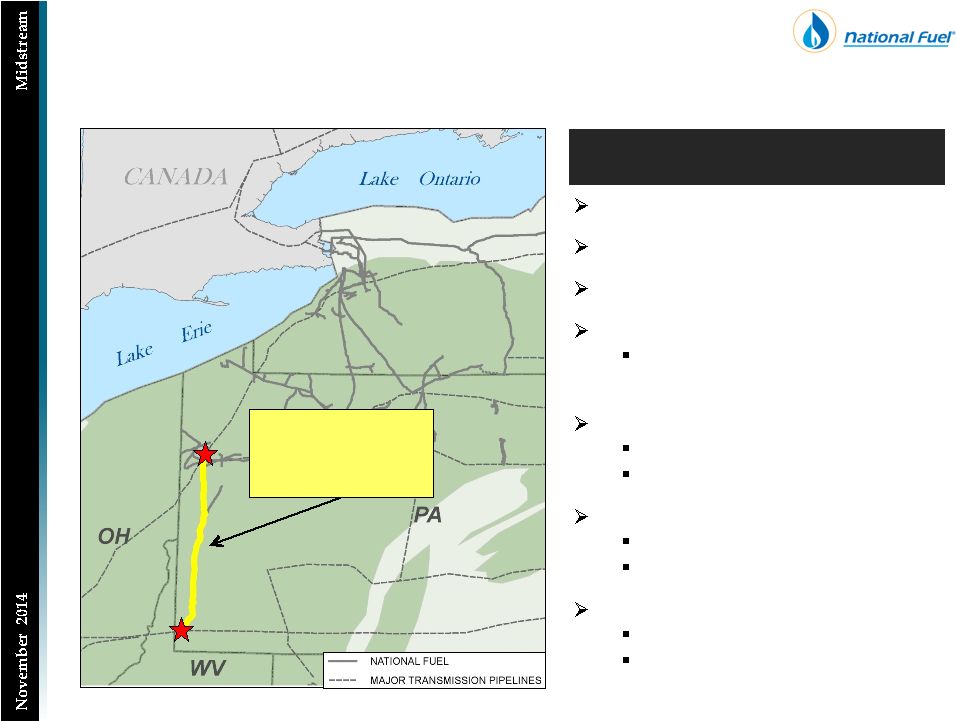
 Pipeline & Storage
Northern Access 2016 Provides Additional Access to Canada
47
Customer: Seneca Resources
In-Service: Late 2016
System: NFG Supply Corp. &
Empire Pipeline, Inc.
Capacity
350,000 Dth per day
Interconnect
Chippawa (TransCanada)
Total Cost: ~$410 Million
FERC Timing
Pre-filing: July 2014
Certificate filing: anticipated
Q2 FY2015
Northern Access 2016
Northern
Access 2016
(Late 2016) |
 Pipeline & Storage
Recent
3
rd
Party
Expansions
Have
Been
Highly
Successful
48
Completed Expansions
for 3
rd
Parties
Capacity (Dth/day)
Northern Access 2012
320,000
Tioga County Extension
350,000
Line N (2011, 2012 & 2013)
353,000
Total New Capacity
1,023,000
Capital Cost ($Millions)
Northern Access 2012
$72
Tioga County Extension
$58
Line N (2011, 2012 & 2013)
$ 104
Total Capital Expenditures
$234
Northern
Access 2012
Tioga
County
Extension
Line N Projects
Annual Reservation Charges ($Millions)
Northern Access 2012
$ 14.5
Tioga County Extension
$ 41.9
Line N (2011, 2012 & 2013)
$ 16.0
Total Reservation Charges
$ 72.4 |
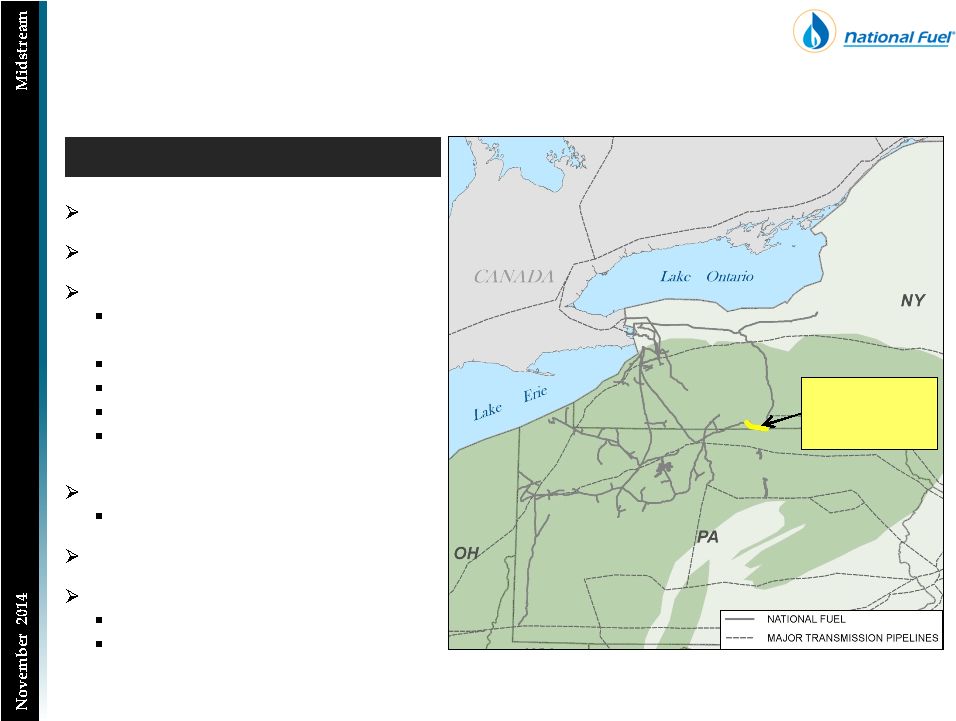
 Pipeline & Storage
Additional Line N Expansions
49
Customer: Third Party
Placed in-service November 1, 2014
System: NFG Supply Corp.
Capacity: 105,000 Dth per day
Precedent agreements signed for
all available capacity
Interconnect
Mercer (TGP Station 219)
Total Cost: $34 Million
Expansion: $30 Million
System Modernization: $4 Million
Major Facilities
3,550 HP Compressor
2.1 miles –
24”
Replacement
Pipeline
Mercer Expansion
Mercer
(TGP Station 219)
Mercer
Expansion |
 Mercer
(TGP Station 219)
Pipeline & Storage
Pairing Line N Expansions with System Modernization
50
Customer: Third Party
In-Service: November 2015
System: NFG Supply Corp.
Capacity: 175,000 Dth per day
Precedent agreements signed for
all available capacity
Interconnect
Mercer (TGP Station 219)
Holbrook (TETCO)
Total Cost: $76 Million
Expansion: $39 Million
Modernization: $37 Million
Major Facilities
3,550 HP Compressor
23.3 miles –
24”
Replacement
Pipeline
Westside Expansion &
Modernization
Holbrook (TETCO)
Westside
Expansion &
Modernization |
 Pipeline & Storage
Developing Unique Solutions for Shippers
51
In-Service: November 2015
System: NFG Supply & Empire Pipeline
New No-Notice Services
Precedent agreements executed with
RG&E, NYSEG & NFG Utility
Preserving 172,500 Dth per day (RG&E)
Preserving 20,000 Dth per day (NYSEG)
Retained Storage: 3.3 Bcf
New incremental transportation
capacity of 49,000 Dth per day
Interconnect
Tuscarora (NFG/Supply)
Total Cost: $45 Million
Major Facilities
1,500 HP Compressor
17 miles –
12”/16”
Pipeline
Tuscarora Lateral
Tuscarora
Lateral |
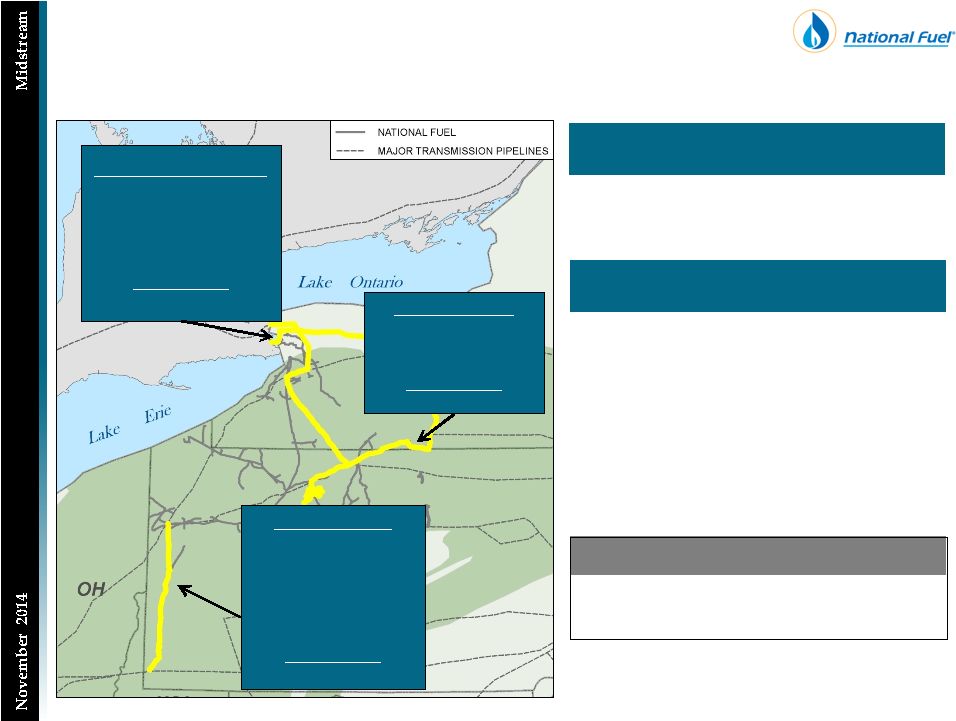 Pipeline & Storage
Significant Expansions Are Driving Growth
52
Completed Projects (Since 2009)
Recent Capacity
Additions
1,113,000 Dth/day
Line N Corridor
Line “N”
Expansion
Line “N”
2012 Expansion
Line “N”
2013 Expansion
Mercer Expansion
West Side Expansion
Total Capacity
633 MDth/d
Delivering Gas North
Tioga County Extension
Northern Access 2012
Northern Access 2015
Northern Access 2016
Total Capacity
1,160 MDth/d
Other Projects
Lamont Compressor
Tuscarora Lateral
Total Capacity
139 MDth/d
Planned Projects (2014+)
Precedent Agreements Executed
Total Expansion (2009-2016+)
Capacity
Additions
1,932,000 Dth/day
In-Service 2014
105,000 Dth/day
In-Service 2015
364,000 Dth/day
In-Service 2016+
350,000 Dth/day |
 53
Utility
Overview |
 Utility
New York & Pennsylvania Service Territories
54
Total Customers: 524,300
Rate Mechanisms:
Revenue Decoupling
Weather Normalization
Low Income Rates
Merchant Function Charge (Uncollectibles
Adjustment)
90/10 Sharing (Large Customers)
NY PSC Rate Case Settlement, May 2014
Rates Unchanged
9.1% ROE Confirmed
2-Tier Earnings Sharing Mechanism
9.5% to 10.5% -
Share 50%
10.5% > -
Share 80%
$8.2 MM CapEx -
system replacement
$8.0 MM incremental O&M (post-
retirement benefits)
Natural Gas Vehicle Pilot Program
Total Customers: 213,500
Rate Mechanisms:
Low Income Rates
Merchant Function Charge
ROE: Black Box Settlement (2007)
New York
Pennsylvania |
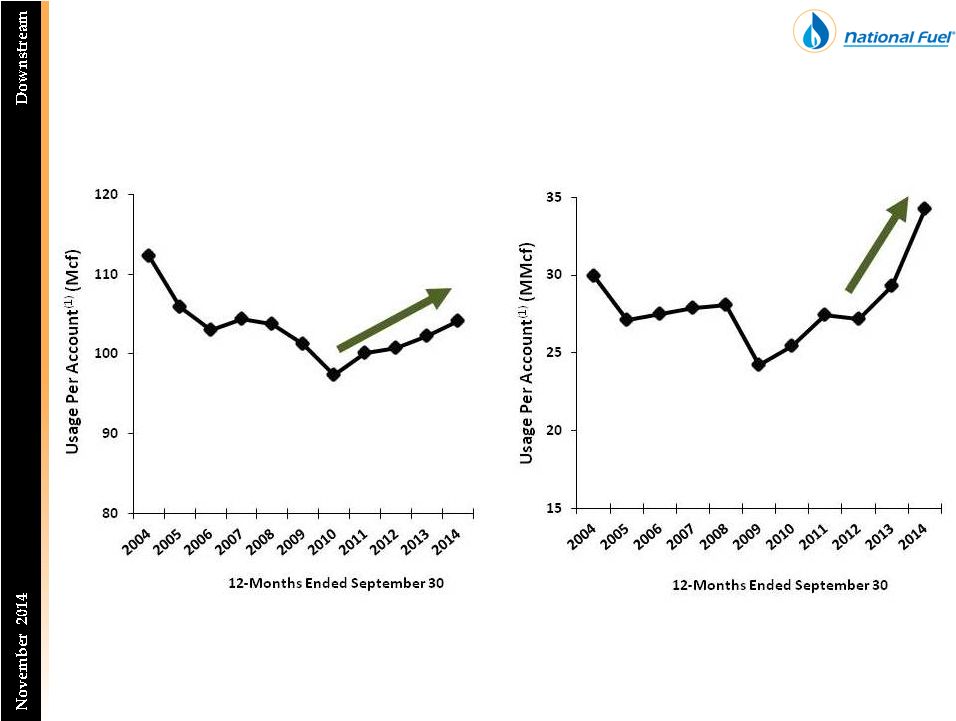 Utility
Shifting Trends in Customer Usage
55
Residential Usage
Industrial Usage
(1)
Weighted Average of New York and Pennsylvania service territories (assumes normal
weather) |
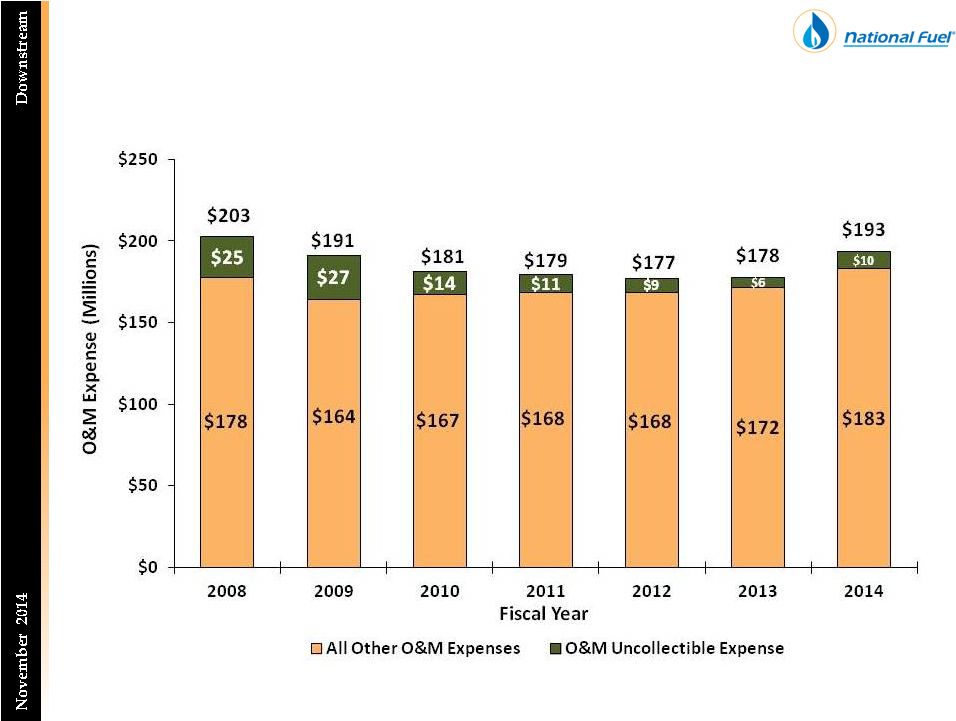 Utility
A Proven History of Controlling Costs
56 |
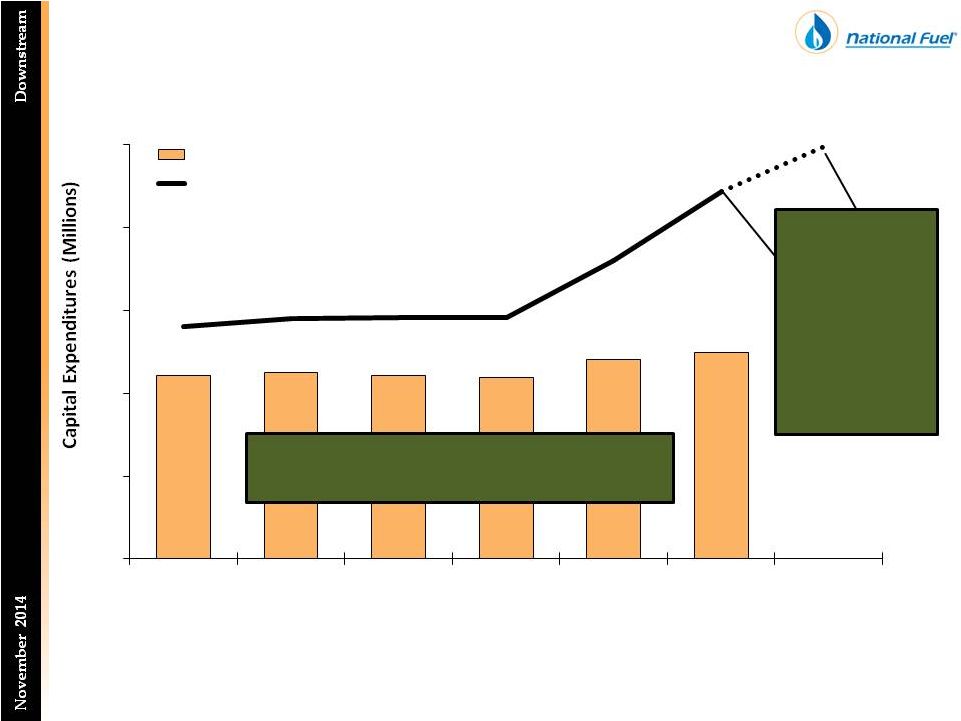 Utility
Strong Commitment to Safety
57
The Utility remains focused on maintaining the
ongoing safety and reliability of its system
Near-term
increase in capital
expenditures is
due to the
approx. $60MM
upgrade of the
Utility’s Customer
Information
System (CIS)
$44.4
$45.0
$44.3
$43.8
$48.1
$49.8
$56.2
$58.0
$58.4
$58.3
$72.0
$88.8
$95-$105
$0
$20
$40
$60
$80
$100
2009
2010
2011
2012
2013
2014
2015E
Fiscal Year
Capital Expenditures for Safety
Total Capital Expenditures |
 National Fuel Gas Company
A History of Success & A Future of Opportunity
58
32% CAGR
Since 2010
Adjusted
EBITDA
Growth
Production
Growth
Midstream
Businesses
Adjusted
EBITDA
A History of Success
11% CAGR
Since 2010
19% CAGR
Since 2010
Note: A reconciliation of Adjusted EBITDA to Net Income as presented on the Consolidated
Statement of Income and Earnings is included at the end of this presentation. A
Future of Opportunity Adjusted
EBITDA
Growth
Production
Growth
Midstream
Businesses
Adjusted
EBITDA
10-15% CAGR
2015 to 2019
15-25% CAGR
2015 to 2019
10-15% CAGR
2015 to 2019 |
 59
Appendix |
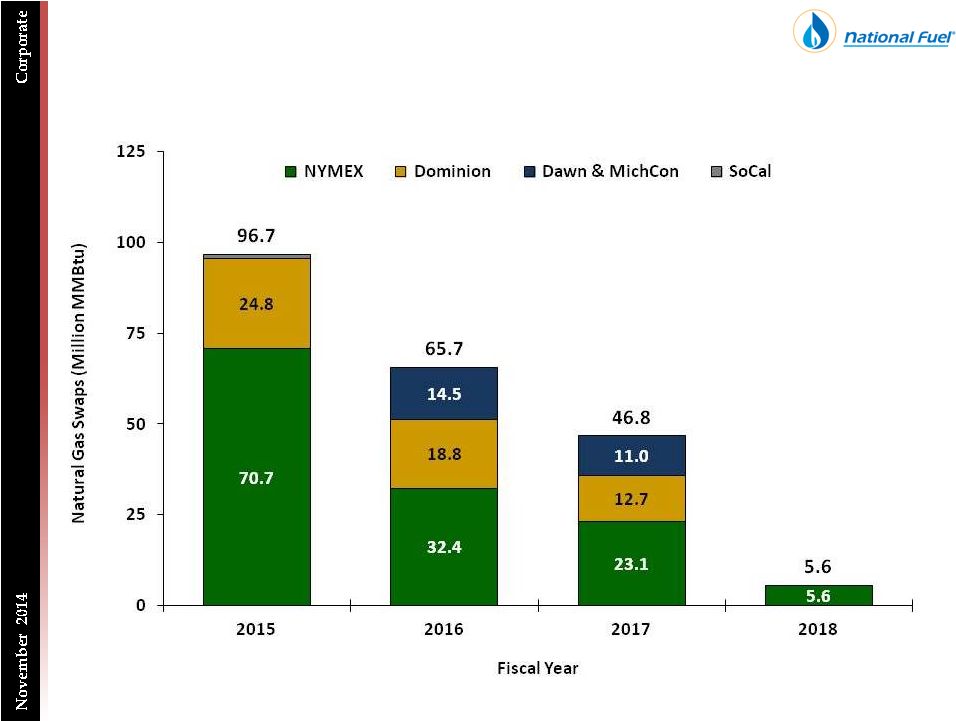
 National Fuel Gas Company
Natural Gas Hedge Positions
60
(Volumes in thousands Mmbtu; Prices in $/Mmbtu)
Fiscal 2015
Fiscal 2016
Fiscal 2017
Fiscal 2018
Volume
Avg.
Price
Volume
Avg.
Price
Volume
Avg.
Price
Volume
Avg.
Price
NYMEX Swaps
70,690
$4.16
32,350
$4.24
23,130
$4.50
5,550
$4.59
Dominion
Swaps
24,840
$3.74
18,840
$3.78
12,720
$3.87
-
-
SoCal Swaps
1,200
$4.35
-
-
-
-
-
-
MichCon
Swaps
-
-
9,000
$4.10
3,000
$4.10
-
-
Dawn Swaps
-
-
5,490
$4.36
7,950
$4.14
-
-
Fixed Price
Physical Sales
16,700
$3.77
18,300
$3.77
18,250
$3.77
1,550
$3.77
Total
113,430
$4.01
83,980
$4.03
65,050
$4.11
7,100
$4.41 |
 National Fuel Gas Company
Crude Oil Hedge Positions
61
Fiscal 2015
Fiscal 2016
Fiscal 2017
Fiscal 2018
Volume
Avg.
Price
Volume
Avg.
Price
Volume
Avg.
Price
Volume
Avg.
Price
Midway
Sunset
(MWSS)
Swaps
258,000
$92.10
36,000
$92.10
-
-
-
-
Brent
Swaps
903,000
$98.42
933,000
$95.18
384,000
$92.30
75,000
$91.00
NYMEX
Swaps
396,000
$90.14
300,000
$86.09
-
-
-
-
Total
1,557,000
$95.27
1,269,000
$92.95
384,000
$92.30
75,000
$91.00
(Volumes & Prices in Bbl) |
 Marcellus Shale
Position Offers Attractive Economics at $2.00 to $3.80/Mcfe
62
Prospect
County
Product
Approx.
Remaining
Locations
EUR
(Bcfe)
BTU
IRR
(1)
@
$4/MMBtu
15% IRR
(1)
Breakeven Price
($/Mcf)
EASTERN DEVELOPMENT AREA (EDA)
Tract 100
Lycoming
Dry Gas
18
11.5-12.5
1,030
90%
$1.92
Gamble
Lycoming
Dry Gas
29
10-11
1,030
77%
$2.05
Tract 595
Tioga
Dry Gas
14
8.1
1,030
45%
$2.63
Covington
Tioga
Dry Gas
Developed
5.8
1,030
22%
$3.49
WESTERN DEVELOPMENT AREA (WDA)
Clermont/Rich Valley
Elk/Cameron
Dry Gas
213
6-8
1,050
38%
$2.80
Ridgway
Elk
Dry Gas
450-570
6-8
1,111
26%
$3.30
Hemlock
Elk
Dry Gas
130-170
6-8
1,070
23%
$3.40
Church Run
Elk
Dry Gas
60-70
6-8
1,125
22%
$3.45
(W) West Branch
McKean
Dry Gas
47
6-8
1,050
22%
$3.48
Heath
Jefferson
Dry Gas
260-330
5-8
1,060
19%
$3.65
Sulger Farms
Jefferson
Dry Gas
170-210
5-8
1,020
19%
$3.66
Owl’s Nest/James City
Elk/Forest
Dry Gas
120-160
5-8
1,125
18%
$3.69
Boone Mt.
Elk
Dry Gas
230-290
4-6
1,020
18%
$3.76
Church Run
Elk
Wet Gas
40-50
2-4
1,140
13%
$4.32
Tionesta
Forest/Venango
Wet Gas/
Liquids
300-340
4-6
1,325
12%
$4.50
Owl’s Nest/James City
Elk/Forest
Wet Gas
150-180
4-6
1,140
11%
$4.51
Mt. Jewett
McKean
Wet Gas
90-110
2-4
1,140
6%
$5.50
Beechwood
Cameron
Dry Gas
210-280
2-4
1,030
2%
$7.14
Red Hill
Cameron
Dry Gas
150-200
2-4
1,030
2%
$7.14
(1)
Internal
Rate
of
Return
(IRR)
includes
estimated
well
costs
under
current
cost
structure,
LOE,
and
Gathering
tariffs
anticipated
for
each
prospect. |
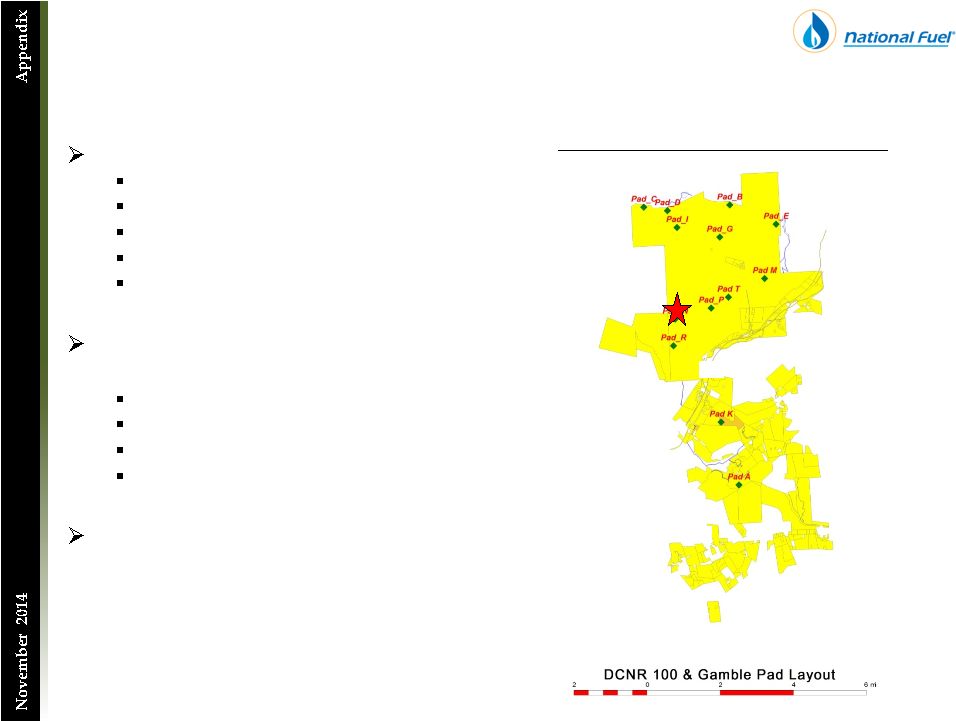 Geneseo Shale
Path to Geneseo Development –
2018/2019 Start
63
1
st
Well (Tract 100 –
Pad N)
Peak IP: 14.1 MMcf per day
30-Day Average Rate: 8.6 MMcf per day
Estimated EUR: 7.0 Bcf
Lateral Length: 4,920’
Frac Stages: 33 stages
Current developed infrastructure from DCNR
100 & Gamble:
13 well pads
3 compressor pads
3 water impoundments
Gathering infrastructure
Savings estimate of ~$300,000 per well from
shared infrastructure
•
>125 Wells
•
Water Infrastructure = $13MM
•
Usable Pads = $16MM
•
Road Infrastructure = $16MM
Tract 100/Gamble (Lycoming County)
Geneseo Well |
 National Fuel Gas Company
Comparable GAAP Financial Measure Slides and Reconciliations
64
This
presentation
contains
certain
non-GAAP
financial
measures.
For
pages
that
contain
non-GAAP
financial
measures,
pages
containing
the
most
directly
comparable
GAAP
financial
measures
and
reconciliations
are
provided
in
the
slides that follow.
The
Company
believes
that
its
non-GAAP
financial
measures
are
useful
to
investors
because
they
provide
an
alternative
method
for
assessing
the
Company’s
ongoing
operating
results,
for
measuring
the
Company’s
cash
flow
and
liquidity,
and
for
comparing
the
Company’s
financial
performance
to
other
companies.
The
Company’s
management
uses
these
non-GAAP
financial
measures
for
the
same
purpose,
and
for
planning
and
forecasting
purposes.
The
presentation
of
non-GAAP
financial
measures
is
not
meant
to
be
a substitute for
financial measures prepared in accordance with GAAP.
The
Company
defines
Adjusted
EBITDA
as
reported
GAAP
earnings
before
the
following
items:
interest
expense,
depreciation,
depletion
and
amortization,
interest
and
other
income,
impairments,
items
impacting
comparability
and
income taxes. |
 65
Reconciliation of Adjusted EBITDA to Consolidated Net Income
($ Thousands)
FY 2009
FY 2010
FY 2011
FY 2012
Exploration & Production - West Division Adjusted EBITDA
171,572
$
187,838
$
187,603
$
226,897
$
215,042
$
217,150
$
Exploration & Production - All Other Divisions Adjusted EBITDA
108,139
139,624
189,854
170,232
277,341
322,322
Total Exploration & Production Adjusted EBITDA
279,711
$
327,462
$
377,457
$
397,129
$
492,383
$
539,472
$
Total Adjusted EBITDA
Exploration & Production Adjusted EBITDA
279,711
$
327,462
$
377,457
$
397,129
$
492,383
$
539,472
$
Pipeline & Storage Adjusted EBITDA
130,857
120,858
111,474
136,914
161,226
186,022
Gathering Adjusted EBITDA
(141)
2,021
9,386
14,814
29,777
64,060
Utility Adjusted EBITDA
164,443
167,328
168,540
159,986
171,669
164,643
Energy Marketing Adjusted EBITDA
11,589
13,573
13,178
5,945
6,963
10,335
Corporate & All Other Adjusted EBITDA
(5,434)
408
(12,346)
(10,674)
(9,920)
(11,078)
Total Adjusted EBITDA
581,025
$
631,650
$
667,689
$
704,114
$
852,098
$
953,454
$
Total Adjusted EBITDA
581,025
$
631,650
$
667,689
$
704,114
$
852,098
$
953,454
$
Minus: Net Interest Expense
(81,013)
(90,217)
(75,205)
(82,551)
(89,776)
(90,107)
Plus: Other Income
9,762
6,126
5,947
5,133
4,697
9,461
Minus: Income Tax Expense
(52,859)
(137,227)
(164,381)
(150,554)
(172,758)
(189,614)
Minus: Depreciation, Depletion & Amortization
(170,620)
(191,199)
(226,527)
(271,530)
(326,760)
(383,781)
Minus: Impairment of Oil and Gas Properties (E&P)
(182,811)
-
-
-
-
-
Plus/Minus: Income/(Loss) from Discontinued
Operations, Net of Tax (Corp. & All Other) (2,776)
6,780
-
-
-
-
Plus: Gain on Sale of Unconsolidated
Subsidiaries (Corp. & All Other) -
-
50,879
-
-
-
Plus: Elimination of Other Post-Retirement
Regulatory Liability (P&S) -
-
-
21,672
-
-
Minus: Pennsylvania Impact Fee Related to Prior
Fiscal Years (E&P) -
-
-
(6,206)
-
-
Minus: New York Regulatory Adjustment
(Utility) -
-
-
-
(7,500)
-
Minus: Plugging and Abandonment Accrual
(E&P) -
-
-
-
-
-
Rounding
-
-
-
(1)
-
-
Consolidated Net Income
100,708
$
225,913
$
258,402
$
220,077
$
260,001
$
299,413
$
Consolidated Debt to Total Adjusted EBITDA
Long-Term Debt, Net of Current Portion (End of Period)
1,249,000
$
1,049,000
$
899,000
$
1,149,000
$
1,649,000
$
1,649,000
$
Current Portion of Long-Term Debt (End of Period)
-
200,000
150,000
250,000
-
-
Notes Payable to Banks and Commercial Paper (End
of Period) -
-
40,000
171,000
-
85,600
Total Debt (End of Period)
1,249,000
$
1,249,000
$
1,089,000
$
1,570,000
$
1,649,000
$
1,734,600
$
Long-Term Debt, Net of Current Portion (Start of Period)
999,000
1,249,000
1,049,000
899,000
1,149,000
1,649,000
Current Portion of Long-Term Debt (Start of Period)
100,000
-
200,000
150,000
250,000
-
Notes Payable to Banks and Commercial Paper
(Start of Period) -
-
-
40,000
171,000
-
Total Debt (Start of Period)
1,099,000
$
1,249,000
$
1,249,000
$
1,089,000
$
1,570,000
$
1,649,000
$
Average Total Debt
1,174,000
$
1,249,000
$
1,169,000
$
1,329,500
$
1,609,500
$
1,691,800
$
Average Total Debt to Total Adjusted EBITDA
2.02 x
1.98 x
1.75 x
1.89 x
1.89 x
1.77 x
FY 2013
FY 2014 |
 66
Reconciliation of Segment Capital Expenditures to
Consolidated Capital Expenditures
($ Thousands)
FY 2015
FY 2009
FY 2010
FY 2011
FY 2012
FY 2013
FY 2014
Forecast
Capital Expenditures from Continuing Operations
Exploration & Production Capital Expenditures
188,290
$
398,174
$
648,815
$
693,810
$
533,129
$
602,705
$
$600,000-700,000
Pipeline & Storage Capital Expenditures
52,504
37,894
129,206
144,167
56,144
$
139,821
$
$225,000-275,000
Gathering Segment Capital Expenditures
9,433
6,538
17,021
80,012
54,792
$
137,799
$
$1250,000-200,000
Utility Capital Expenditures
56,178
57,973
58,398
58,284
71,970
$
88,810
$
$95,000-105,000
Energy Marketing, Corporate & All Other Capital Expenditures
396
773
746
1,121
1,062
$
772
$
-
Total
Capital Expenditures from Continuing Operations 306,801
$
501,352
$
854,186
$
977,394
$
717,097
$
969,907
$
$1,070,000-1,238,000
Capital Expenditures from Discountinued Operations
All Other Capital Expenditures
216
150
$
-
$
-
$
-
$
-
$
-
$
Plus (Minus)
Accrued Capital Expenditures Exploration & Production FY 2014 Accrued Capital
Expenditures -
$
-
$
-
$
-
$
-
$
(80,108)
$
Exploration & Production FY 2013 Accrued Capital Expenditures
-
-
-
-
(58,478)
58,478
-
Exploration & Production FY 2012 Accrued Capital Expenditures
-
-
-
(38,861)
38,861
-
-
Exploration & Production FY 2011 Accrued Capital Expenditures
-
-
(103,287)
103,287
-
-
-
Exploration & Production FY 2010 Accrued Capital Expenditures
-
(78,633)
78,633
-
-
-
-
Exploration & Production FY 2009 Accrued Capital Expenditures
(9,093)
19,517
-
-
-
-
-
Pipeline & Storage FY 2014 Accrued Capital Expenditures
-
-
-
-
-
(28,122)
Pipeline & Storage FY 2013 Accrued Capital Expenditures
-
-
-
-
(5,633)
5,633
-
Pipeline & Storage FY 2012 Accrued Capital Expenditures
-
-
-
(12,699)
12,699
-
-
Pipeline & Storage FY 2011 Accrued Capital Expenditures
-
-
(16,431)
16,431
-
-
-
Pipeline & Storage FY 2010 Accrued Capital Expenditures
-
-
3,681
-
-
-
-
Pipeline & Storage FY 2008 Accrued Capital Expenditures
16,768
-
-
-
-
-
-
Gathering FY 2014 Accrued Capital Expenditures
-
-
-
-
-
(20,084)
Gathering FY 2013 Accrued Capital Expenditures
-
-
-
-
(6,700)
6,700
-
Gathering FY 2012 Accrued Capital Expenditures
-
-
-
(12,690)
12,690
-
-
Gathering FY 2011 Accrued Capital Expenditures
-
-
(3,079)
3,079
-
-
-
Gathering FY 2009 Accrued Capital Expenditures
(715)
715
-
-
-
-
-
Utility FY 2014 Accrued Capital Expenditures
-
-
-
-
-
(8,315)
Utility FY 2013 Accrued Capital Expenditures
-
-
-
-
(10,328)
10,328
-
Utility FY 2012 Accrued Capital Expenditures
-
-
-
(3,253)
3,253
-
-
Utility FY 2011 Accrued Capital Expenditures
-
-
(2,319)
2,319
-
-
-
Utility FY 2010 Accrued Capital Expenditures
-
-
2,894
-
-
-
-
Total
Accrued Capital Expenditures 6,960
$
(58,401)
$
(39,908)
$
57,613
$
(13,636)
$
(55,490)
$
-
$
Eliminations
(344)
$
-
$
-
$
-
$
-
$
-
$
-
$
Total Capital
Expenditures per Statement of Cash Flows 313,633
$
443,101
$
814,278
$
1,035,007
$
703,461
$
914,417
$
$1,070,000-1,238,000 |