Attached files
| file | filename |
|---|---|
| EX-99.2 - EXHIBIT 99.2 - NATIONAL FUEL GAS CO | nfg093017exhibit992.htm |
| EX-99.1 - EXHIBIT 99.1 - NATIONAL FUEL GAS CO | nfg-9302017xexhibit991.htm |
| EX-32 - EXHIBIT 32 - NATIONAL FUEL GAS CO | nfg-9302017xexhibit32.htm |
| EX-31.2 - EXHIBIT 31.2 - NATIONAL FUEL GAS CO | nfg-9302017xexhibit312.htm |
| EX-31.1 - EXHIBIT 31.1 - NATIONAL FUEL GAS CO | nfg-9302017xexhibit311.htm |
| EX-23.2 - EXHIBIT 23.2 - NATIONAL FUEL GAS CO | nfg-9302017xexhibit232.htm |
| EX-23.1 - EXHIBIT 23.1 - NATIONAL FUEL GAS CO | nfg-9302017xexhibit231.htm |
| EX-21 - EXHIBIT 21 - NATIONAL FUEL GAS CO | nfg-9302017xexhibit21.htm |
| EX-12 - EXHIBIT 12 - NATIONAL FUEL GAS CO | nfg-9302017xexhibit12.htm |
| EX-10.1 - EXHIBIT 10.1 - NATIONAL FUEL GAS CO | nfg-9302017xexhibit101.htm |
UNITED STATES SECURITIES AND EXCHANGE COMMISSION
Washington, D.C. 20549
Form 10-K
þ | ANNUAL REPORT PURSUANT TO SECTION 13 OR 15(d) OF THE SECURITIES EXCHANGE ACT OF 1934 | |
For the Fiscal Year Ended September 30, 2017
¨ | TRANSITION REPORT PURSUANT TO SECTION 13 OR 15(d) OF THE SECURITIES EXCHANGE ACT OF 1934 | |
For the Transition Period from to
Commission File Number 1-3880
National Fuel Gas Company
(Exact name of registrant as specified in its charter)
New Jersey | 13-1086010 | |
(State or other jurisdiction of incorporation or organization) | (I.R.S. Employer Identification No.) | |
6363 Main Street Williamsville, New York (Address of principal executive offices) | 14221 (Zip Code) | |
(716) 857-7000 |
Registrant’s telephone number, including area code |
Securities registered pursuant to Section 12(b) of the Act: |
Title of Each Class | Name of Each Exchange on Which Registered | |
Common Stock, par value $1.00 per share, and Common Stock Purchase Rights | New York Stock Exchange | |
Securities registered pursuant to Section 12(g) of the Act: None
Indicate by check mark if the registrant is a well-known seasoned issuer, as defined in Rule 405 of the Securities Act. Yes þ No ¨
Indicate by check mark if the registrant is not required to file reports pursuant to Section 13 or Section 15 (d) of the Act. Yes ¨ No þ
Indicate by check mark whether the registrant (1) has filed all reports required to be filed by Section 13 or 15(d) of the Securities Exchange Act of 1934 during the preceding 12 months and (2) has been subject to such filing requirements for the past 90 days. Yes þ No ¨
Indicate by check mark whether the registrant has submitted electronically and posted on its corporate Web site, if any, every Interactive Data File required to be submitted and posted pursuant to Rule 405 of Regulation S-T (§ 232.405 of this chapter) during the preceding 12 months (or for such shorter period that the registrant was required to submit and post such files). Yes þ No ¨
Indicate by check mark if disclosure of delinquent filers pursuant to Item 405 of Regulation S-K (§ 229.405 of this chapter) is not contained herein, and will not be contained, to the best of the registrant’s knowledge, in definitive proxy or information statements incorporated by reference in Part III of this Form 10-K or any amendment to this Form 10-K. þ
Indicate by check mark whether the registrant is a large accelerated filer, an accelerated filer, a non-accelerated filer, smaller reporting company, or an emerging growth company. See the definitions of “large accelerated filer,” “accelerated filer,” “smaller reporting company,” and “emerging growth company” in Rule 12b-2 of the Exchange Act. (Check one):
Large accelerated filer þ | Accelerated filer ¨ | |||
Non-accelerated filer ¨ (Do not check if a smaller reporting company) | Smaller reporting company ¨ | |||
Emerging growth company ¨ | ||||
If an emerging growth company, indicate by check mark if the registrant has elected not to use the extended transition period for complying with any new or revised financial accounting standards provided pursuant to Section 13(a) of the Exchange Act. ¨
Indicate by check mark whether the registrant is a shell company (as defined in Rule 12b-2 of the Act). Yes ¨ No þ
The aggregate market value of the voting stock held by nonaffiliates of the registrant amounted to $4,970,818,000 as of March 31, 2017.
Common Stock, par value $1.00 per share, outstanding as of October 31, 2017: 85,582,201 shares.
DOCUMENTS INCORPORATED BY REFERENCE
Portions of the registrant’s definitive Proxy Statement for its 2018 Annual Meeting of Stockholders, to be filed with the Securities and Exchange Commission within 120 days of September 30, 2017, are incorporated by reference into Part III of this report.
Glossary of Terms
Frequently used abbreviations, acronyms, or terms used in this report:
National Fuel Gas Companies
Company The Registrant, the Registrant and its subsidiaries or the Registrant’s subsidiaries as appropriate in the context of the disclosure
Distribution Corporation National Fuel Gas Distribution Corporation
Empire Empire Pipeline, Inc.
Midstream Corporation National Fuel Gas Midstream Corporation
National Fuel National Fuel Gas Company
NFR National Fuel Resources, Inc.
Registrant National Fuel Gas Company
Seneca Seneca Resources Corporation
Supply Corporation National Fuel Gas Supply Corporation
Regulatory Agencies
CFTC Commodity Futures Trading Commission
EPA United States Environmental Protection Agency
FASB Financial Accounting Standards Board
FERC Federal Energy Regulatory Commission
NYDEC New York State Department of Environmental Conservation
NYPSC State of New York Public Service Commission
PaDEP Pennsylvania Department of Environmental Protection
PaPUC Pennsylvania Public Utility Commission
PHMSA Pipeline and Hazardous Materials Safety Administration
SEC Securities and Exchange Commission
Other
Bbl Barrel (of oil)
Bcf Billion cubic feet (of natural gas)
Bcfe (or Mcfe) — represents Bcf (or Mcf) Equivalent The total heat value (Btu) of natural gas and oil expressed as a volume of natural gas. The Company uses a conversion formula of 1 barrel of oil = 6 Mcf of natural gas.
Btu British thermal unit; the amount of heat needed to raise the temperature of one pound of water one degree Fahrenheit.
Capital expenditure Represents additions to property, plant, and equipment, or the amount of money a company spends to buy capital assets or upgrade its existing capital assets.
Cashout revenues A cash resolution of a gas imbalance whereby a customer pays Supply Corporation and/or Empire for gas the customer receives in excess of amounts delivered into Supply Corporation’s and Empire’s systems by the customer’s shipper.
Degree day A measure of the coldness of the weather experienced, based on the extent to which the daily average temperature falls below a reference temperature, usually 65 degrees Fahrenheit.
Derivative A financial instrument or other contract, the terms of which include an underlying variable (a price, interest rate, index rate, exchange rate, or other variable) and a notional amount (number of units, barrels, cubic feet, etc.). The terms also permit for the instrument or contract to be settled net and no initial net investment is required to enter into the financial instrument or contract. Examples include futures contracts, options, no cost collars and swaps.
Development costs Costs incurred to obtain access to proved oil and gas reserves and to provide facilities for extracting, treating, gathering and storing the oil and gas.
Development well A well drilled to a known producing formation in a previously discovered field.
Dodd-Frank Act Dodd-Frank Wall Street Reform and Consumer Protection Act.
Dth Decatherm; one Dth of natural gas has a heating value of 1,000,000 British thermal units, approximately equal to the heating value of 1 Mcf of natural gas.
Exchange Act Securities Exchange Act of 1934, as amended
Expenditures for long-lived assets Includes capital expenditures, stock acquisitions and/or investments in partnerships.
Exploitation Development of a field, including the location, drilling, completion and equipment of wells necessary to produce the commercially recoverable oil and gas in the field.
Exploration costs Costs incurred in identifying areas that may warrant examination, as well as costs incurred in examining specific areas, including drilling exploratory wells.
FERC 7(c) application An application to the FERC under Section 7(c) of the federal Natural Gas Act for authority to construct, operate (and provide services through) facilities to transport or store natural gas in interstate commerce.
Exploratory well A well drilled in unproven or semi-proven territory for the purpose of ascertaining the presence underground of a commercial hydrocarbon deposit.
Firm transportation and/or storage The transportation and/or storage service that a supplier of such service is obligated by contract to provide and for which the customer is obligated to pay whether or not the service is utilized.
GAAP Accounting principles generally accepted in the United States of America
Goodwill An intangible asset representing the difference between the fair value of a company and the price at which a company is purchased.
Hedging A method of minimizing the impact of price, interest rate, and/or foreign currency exchange rate changes, often times through the use of derivative financial instruments.
Hub Location where pipelines intersect enabling the trading, transportation, storage, exchange, lending and borrowing of natural gas.
ICE Intercontinental Exchange. An exchange which maintains a futures market for crude oil and natural gas.
Interruptible transportation and/or storage The transportation and/or storage service that, in accordance with contractual arrangements, can be interrupted by the supplier of such service, and for which the customer does not pay unless utilized.
LDC Local distribution company
LIBOR London Interbank Offered Rate
LIFO Last-in, first-out
Marcellus Shale A Middle Devonian-age geological shale formation that is present nearly a mile or more below the surface in the Appalachian region of the United States, including much of Pennsylvania and southern New York.
Mbbl Thousand barrels (of oil)
Mcf Thousand cubic feet (of natural gas)
MD&A Management’s Discussion and Analysis of Financial Condition and Results of Operations
MDth Thousand decatherms (of natural gas)
MMBtu Million British thermal units (heating value of one dekatherm of natural gas)
MMcf Million cubic feet (of natural gas)
MMcfe Million cubic feet equivalent
NEPA National Environmental Policy Act of 1969, as amended
NGA The Natural Gas Act of 1938, as amended; the federal law regulating interstate natural gas pipeline and storage companies, among other things, codified beginning at 15 U.S.C. Section 717.
NYMEX New York Mercantile Exchange. An exchange which maintains a futures market for crude oil and natural gas.
Open Season A bidding procedure used by pipelines to allocate firm transportation or storage capacity among prospective shippers, in which all bids submitted during a defined time period are evaluated as if they had been submitted simultaneously.
-2-
PCB Polychlorinated Biphenyl
Precedent Agreement An agreement between a pipeline company and a potential customer to sign a service agreement after specified events (called “conditions precedent”) happen, usually within a specified time.
Proved developed reserves Reserves that can be expected to be recovered through existing wells with existing equipment and operating methods.
Proved undeveloped (PUD) reserves Reserves that are expected to be recovered from new wells on undrilled acreage, or from existing wells where a relatively major expenditure is required to make those reserves productive.
PRP Potentially responsible party
Reliable technology Technology that a company may use to establish reserves estimates and categories that has been proven empirically to lead to correct conclusions.
Reserves The unproduced but recoverable oil and/or gas in place in a formation which has been proven by production.
Restructuring Generally referring to partial “deregulation” of the pipeline and/or utility industry by statutory or regulatory process. Restructuring of federally regulated natural gas pipelines resulted in the separation (or “unbundling”) of gas commodity service from transportation service for wholesale and large-volume retail markets. State restructuring programs attempt to extend the same process to retail mass markets.
Revenue decoupling mechanism A rate mechanism which adjusts customer rates to render a utility financially indifferent to throughput decreases resulting from conservation.
S&P Standard & Poor’s Ratings Service
SAR Stock appreciation right
Service Agreement The binding agreement by which the pipeline company agrees to provide service and the shipper agrees to pay for the service.
Spot gas purchases The purchase of natural gas on a short-term basis.
Stock acquisitions Investments in corporations.
Unbundled service A service that has been separated from other services, with rates charged that reflect only the cost of the separated service.
Utica Shale A Middle Ordovician-age geological formation lying several thousand feet below the Marcellus Shale in the Appalachian region of the United States, including much of Ohio, Pennsylvania, West Virginia and southern New York.
VEBA Voluntary Employees’ Beneficiary Association
WNC Weather normalization clause; a clause in utility rates which adjusts customer rates to allow a utility to recover its normal operating costs calculated at normal temperatures. If temperatures during the measured period are warmer than normal, customer rates are adjusted upward in order to recover projected operating costs. If temperatures during the measured period are colder than normal, customer rates are adjusted downward so that only the projected operating costs will be recovered.
-3-
For the Fiscal Year Ended September 30, 2017
CONTENTS | ||
Page | ||
Part I | ||
ITEM 1 | ||
ITEM 1A | ||
ITEM 1B | ||
ITEM 2 | ||
ITEM 3 | ||
ITEM 4 | ||
Part II | ||
ITEM 5 | ||
ITEM 6 | ||
ITEM 7 | ||
ITEM 7A | ||
ITEM 8 | ||
ITEM 9 | ||
ITEM 9A | ||
ITEM 9B | ||
Part III | ||
ITEM 10 | ||
ITEM 11 | ||
ITEM 12 | ||
ITEM 13 | ||
ITEM 14 | ||
Part IV | ||
ITEM 15 | ||
-4-
PART I
Item 1 | Business |
The Company and its Subsidiaries
National Fuel Gas Company (the Registrant), incorporated in 1902, is a holding company organized under the laws of the State of New Jersey. Except as otherwise indicated below, the Registrant owns directly or indirectly all of the outstanding securities of its subsidiaries. Reference to “the Company” in this report means the Registrant, the Registrant and its subsidiaries or the Registrant’s subsidiaries as appropriate in the context of the disclosure. Also, all references to a certain year in this report relate to the Company’s fiscal year ended September 30 of that year unless otherwise noted.
The Company is a diversified energy company engaged principally in the production, gathering, transportation, distribution and marketing of natural gas. The Company operates an integrated business, with assets centered in western New York and Pennsylvania, being used for, and benefiting from, the production and transportation of natural gas from the Appalachian basin. Current development activities are focused in the Marcellus Shale, a Middle Devonian-age geological shale formation that is present nearly a mile or more below the surface in the Appalachian region of the United States, including much of Pennsylvania and southern New York. The common geographic footprint of the Company’s subsidiaries enables them to share management, labor, facilities and support services across various businesses and pursue coordinated projects designed to produce and transport natural gas from the Appalachian basin to markets in Canada and the eastern United States. The Company also develops and produces oil reserves, primarily in California. The Company reports financial results for five business segments: Exploration and Production, Pipeline and Storage, Gathering, Utility, and Energy Marketing.
1. The Exploration and Production segment operations are carried out by Seneca Resources Corporation (Seneca), a Pennsylvania corporation. Seneca is engaged in the exploration for, and the development and production of, natural gas and oil reserves in California and in the Appalachian region of the United States. At September 30, 2017, Seneca had U.S. proved developed and undeveloped reserves of 30,207 Mbbl of oil and 1,973,120 MMcf of natural gas.
2. The Pipeline and Storage segment operations are carried out by National Fuel Gas Supply Corporation (Supply Corporation), a Pennsylvania corporation, and Empire Pipeline, Inc. (Empire), a New York corporation. Supply Corporation provides interstate natural gas transportation and storage services for affiliated and nonaffiliated companies through (i) an integrated gas pipeline system extending from southwestern Pennsylvania to the New York-Canadian border at the Niagara River and eastward to Ellisburg and Leidy, Pennsylvania, and (ii) 27 underground natural gas storage fields owned and operated by Supply Corporation as well as four other underground natural gas storage fields owned and operated jointly with other interstate gas pipeline companies. Empire transports and stores natural gas for major industrial companies, utilities (including Distribution Corporation) and power producers in New York State. Empire also transports natural gas for natural gas marketers along with exploration and production companies from natural gas producing areas in Pennsylvania to markets in New York and to interstate pipeline delivery points for additional markets in the northeastern United States and Canada. Empire owns the Empire Pipeline, a 249-mile pipeline system comprising three principal components: a 157-mile pipeline that extends from the United States/Canadian border at the Niagara River near Buffalo, New York to near Syracuse, New York; a 77-mile pipeline extension from near Rochester, New York to an interconnection with the unaffiliated Millennium Pipeline near Corning, New York (the Empire Connector), and a 15-mile pipeline extension from Corning into Tioga County, Pennsylvania (the Tioga County Extension).
3. The Gathering segment operations are carried out by wholly-owned subsidiaries of National Fuel Gas Midstream Corporation (Midstream Corporation), a Pennsylvania corporation. Through these subsidiaries, Midstream Corporation builds, owns and operates natural gas processing and pipeline gathering facilities in the Appalachian region.
4. The Utility segment operations are carried out by National Fuel Gas Distribution Corporation (Distribution Corporation), a New York corporation. Distribution Corporation sells natural gas or provides natural gas transportation services to approximately 743,500 customers through a local distribution system located in western
-5-
New York and northwestern Pennsylvania. The principal metropolitan areas served by Distribution Corporation include Buffalo, Niagara Falls and Jamestown, New York and Erie and Sharon, Pennsylvania.
5. The Energy Marketing segment operations are carried out by National Fuel Resources, Inc. (NFR), a New York corporation, which markets natural gas to industrial, wholesale, commercial, public authority and residential customers primarily in western and central New York and northwestern Pennsylvania, offering competitively priced natural gas for its customers.
Financial information about each of the Company’s business segments can be found in Item 7, MD&A and also in Item 8 at Note J — Business Segment Information.
The following business is not included in any of the five reported business segments:
• | Seneca’s Northeast Division, which markets timber from Appalachian land holdings. At September 30, 2017, the Company owned approximately 93,000 acres of timber property and managed approximately 3,000 additional acres of timber cutting rights. |
No single customer, or group of customers under common control, accounted for more than 10% of the Company’s consolidated revenues in 2017.
Rates and Regulation
The Utility segment’s rates, services and other matters are regulated by the NYPSC with respect to services provided within New York and by the PaPUC with respect to services provided within Pennsylvania. For additional discussion of the Utility segment’s rates and regulation, see Item 7, MD&A under the heading “Rate and Regulatory Matters” and Item 8 at Note A — Summary of Significant Accounting Policies (Regulatory Mechanisms) and Note C — Regulatory Matters.
The Pipeline and Storage segment’s rates, services and other matters are regulated by the FERC. For additional discussion of the Pipeline and Storage segment’s rates and regulation, see Item 7, MD&A under the heading “Rate and Regulatory Matters” and Item 8 at Note A — Summary of Significant Accounting Policies (Regulatory Mechanisms) and Note C — Regulatory Matters.
The discussion under Item 8 at Note C — Regulatory Matters includes a description of the regulatory assets and liabilities reflected on the Company’s Consolidated Balance Sheets in accordance with applicable accounting standards. To the extent that the criteria set forth in such accounting standards are not met by the operations of the Utility segment or the Pipeline and Storage segment, as the case may be, the related regulatory assets and liabilities would be eliminated from the Company’s Consolidated Balance Sheets and such accounting treatment would be discontinued.
In addition, the Company and its subsidiaries are subject to the same federal, state and local regulations on various subjects, including environmental matters, to which other companies doing similar business in the same locations are subject.
The Exploration and Production Segment
The Exploration and Production segment contributed approximately 45.6% of the Company's 2017 net income available for common stock.
Additional discussion of the Exploration and Production segment appears below in this Item 1 under the headings “Sources and Availability of Raw Materials” and “Competition: The Exploration and Production Segment,” in Item 7, MD&A and in Item 8, Financial Statements and Supplementary Data.
The Pipeline and Storage Segment
The Pipeline and Storage segment contributed approximately 24.2% of the Company's 2017 net income available for common stock.
Supply Corporation’s firm transportation capacity is subject to change as the market identifies different transportation paths and receipt/delivery point combinations. At the end of fiscal year 2017, Supply Corporation
-6-
had firm transportation service agreements and leases for approximately 3,157 MDth per day (contracted transportation capacity). The Utility segment accounts for approximately 1,124 MDth per day or 35% of contracted transportation capacity, and the Energy Marketing and Exploration and Production segments represent another 157 MDth per day or 5%. Additionally, Supply Corporation leases 55 MDth per day or 2% of firm transportation capacity to Empire Pipeline. The remaining 1,821 MDth or 58% is subject to firm contracts or leases with nonaffiliated customers. Contracted transportation capacity with both affiliated and nonaffiliated shippers is expected to remain relatively constant in fiscal year 2018.
Supply Corporation had service agreements and leases for all of its firm storage capacity, totaling 68,042 MDth, at the end of 2017. The Utility segment has contracted for 28,491 MDth or 42% of the total firm storage capacity, and the Energy Marketing segment accounts for another 2,644 MDth or 4%. Additionally, Supply Corporation leases 3,753 MDth or 5% of its firm storage capacity to Empire. Nonaffiliated customers have contracted for the remaining 33,154 MDth or 49%. Supply Corporation does not expect any of its contracted firm storage services to terminate and be available for remarketing in fiscal year 2018.
At the end of 2017, Empire had service agreements in place for firm transportation capacity totaling up to approximately 954 MDth per day, with 98% of that capacity contracted as long-term, full-year deals. The Utility segment accounted for 4% of Empire’s firm contracted capacity, with the remaining 96% subject to contracts with nonaffiliated customers. None of the long-term contracts will expire or terminate in fiscal year 2018.
Empire’s firm storage capacity, totaling 3,753 MDth, was fully contracted at the end of fiscal year 2017. The total storage capacity is contracted on a long-term basis, with a nonaffiliated customer. The contract will not expire or terminate in fiscal year 2018.
The majority of Supply Corporation’s transportation and storage contracts, and the majority of Empire’s transportation contracts, allow either party to terminate the contract upon six or twelve months’ notice effective at the end of the primary term, and include “evergreen” language that allows for annual term extension(s).
Additional discussion of the Pipeline and Storage segment appears below under the headings “Sources and Availability of Raw Materials,” “Competition: The Pipeline and Storage Segment” and “Seasonality,” in Item 7, MD&A and in Item 8, Financial Statements and Supplementary Data.
The Gathering Segment
The Gathering segment contributed approximately 14.2% of the Company's 2017 net income available for common stock.
Additional discussion of the Gathering segment appears below under the headings “Sources and Availability of Raw Materials” and “Competition: The Gathering Segment,” in Item 7, MD&A and in Item 8, Financial Statements and Supplementary Data.
The Utility Segment
The Utility segment contributed approximately 16.6% of the Company's 2017 net income available for common stock.
Additional discussion of the Utility segment appears below under the headings “Sources and Availability of Raw Materials,” “Competition: The Utility Segment” and “Seasonality,” in Item 7, MD&A and in Item 8, Financial Statements and Supplementary Data.
The Energy Marketing Segment
The Energy Marketing segment contributed approximately 0.5% of the Company's 2017 net income available for common stock.
Additional discussion of the Energy Marketing segment appears below under the headings “Sources and Availability of Raw Materials,” “Competition: The Energy Marketing Segment” and “Seasonality,” in Item 7, MD&A and in Item 8, Financial Statements and Supplementary Data.
-7-
All Other Category and Corporate Operations
The All Other category and Corporate operations incurred a net loss in 2017. The impact of this net loss in relation to the Company's 2017 net income available for common stock was negative 1.1%.
Additional discussion of the All Other category and Corporate operations appears below in Item 7, MD&A and in Item 8, Financial Statements and Supplementary Data.
Sources and Availability of Raw Materials
The Exploration and Production segment seeks to discover and produce raw materials (natural gas, oil and hydrocarbon liquids) as further described in this report in Item 7, MD&A and Item 8 at Note J — Business Segment Information and Note M — Supplementary Information for Oil and Gas Producing Activities.
The Pipeline and Storage segment transports and stores natural gas owned by its customers, whose gas originates in the southwestern, mid-continent and Appalachian regions of the United States as well as in Canada. Additional discussion of proposed pipeline projects appears below under “Competition: The Pipeline and Storage Segment” and in Item 7, MD&A.
The Gathering segment gathers, processes and transports natural gas that is produced by Seneca in the Appalachian region of the United States. Additional discussion of proposed gathering projects appears below in Item 7, MD&A.
Natural gas is the principal raw material for the Utility segment. In 2017, the Utility segment purchased 65.7 Bcf of gas (including 60.7 Bcf for delivery to retail customers, 1.3 Bcf for off-system sales and 3.7 Bcf used in operations). Gas purchased from producers and suppliers in the United States under firm contracts (seasonal and longer) accounted for 53% of these purchases. Purchases of gas on the spot market (contracts of one month or less) accounted for 47% of the Utility segment’s 2017 purchases. Purchases from DTE Energy Trading, Inc. (26%), NextEra Energy Marketing, LLC (15%), SWN Energy Services Company, LLC (12%), South Jersey Resources Group, LLC (11%), J. Aron & Company (9%) and Direct Energy Business Marketing (8%) accounted for 81% of the Utility’s 2017 gas purchases. No other producer or supplier provided the Utility segment with more than 5% of its gas requirements in 2017.
The Energy Marketing segment depends on an adequate supply of natural gas to deliver to its customers. In 2017, this segment purchased 39.7 Bcf of gas, including 38.9 Bcf for delivery to its customers. The remaining 0.8 Bcf largely represents gas used in operations. The gas purchased by the Energy Marketing segment originates primarily in either the Appalachian or mid-continent regions of the United States.
Competition
Competition in the natural gas industry exists among providers of natural gas, as well as between natural gas and other sources of energy, such as fuel oil and electricity. Management believes that the environmental advantages of natural gas have enhanced its competitive position relative to other fuels.
The Company competes on the basis of price, service and reliability, product performance and other factors. Sources and providers of energy, other than those described under this “Competition” heading, do not compete with the Company to any significant extent.
Competition: The Exploration and Production Segment
The Exploration and Production segment competes with other oil and natural gas producers and marketers with respect to sales of oil and natural gas. The Exploration and Production segment also competes, by competitive bidding and otherwise, with other oil and natural gas producers with respect to exploration and development prospects and mineral leaseholds.
To compete in this environment, Seneca originates and acts as operator on certain of its prospects, seeks to minimize the risk of exploratory efforts through partnership-type arrangements, utilizes technology for both exploratory studies and drilling operations, and seeks market niches based on size, operating expertise and financial criteria.
-8-
Competition: The Pipeline and Storage Segment
Supply Corporation competes for market growth in the natural gas market with other pipeline companies transporting gas in the northeast United States and with other companies providing gas storage services. Supply Corporation has some unique characteristics which enhance its competitive position, as described below. Most of Supply Corporation’s facilities are in or near areas overlying the Marcellus and Utica Shale production areas in Pennsylvania, and it has established interconnections with producers and other pipelines to access these supplies. Its facilities are also located adjacent to the Canadian border at the Niagara River (Niagara) providing access to markets in Canada and, through TransCanada Pipeline, to markets in the northeastern and midwestern United States. Supply Corporation has developed and placed into service a number of pipeline expansion projects to receive natural gas produced from the Marcellus Shale and transport it to key markets within New York and Pennsylvania, the northeastern United States, Canada, and most recently to long-haul pipelines moving gas into the U.S. Midwest and even back to the gulf coast. For further discussion of Pipeline and Storage projects, refer to Item 7, MD&A under the headings “Investing Cash Flow.”
Empire competes for market growth in the natural gas market with other pipeline companies transporting gas in the northeast United States and upstate New York in particular. Empire is well situated to provide transportation of Appalachian-sourced gas as well as gas received at the Niagara River at Chippawa. Empire’s location provides it the opportunity to compete for an increased share of the gas transportation markets both for delivery to the New York and Northeast markets and from and into Canada. As noted above, the Empire Connector and other projects expanded Empire’s natural gas pipeline and enables Empire to serve new markets in New York and elsewhere in the Northeast, and to attach to prolific Marcellus and Utica supplies principally from Tioga and Bradford Counties in Pennsylvania. Like Supply Corporation, Empire’s expanded system facilitates transportation of Marcellus Shale gas to key markets within New York State, the northeastern United States and Canada.
Competition: The Gathering Segment
The Gathering segment provides gathering services for Seneca’s production and competes with other companies that gather and process natural gas in the Appalachian region.
Competition: The Utility Segment
With respect to gas commodity service, in New York and Pennsylvania, both of which have implemented “unbundling” policies that allow customers to choose their gas commodity supplier, Distribution Corporation has retained a substantial majority of small sales customers. In New York, approximately 20%, and in Pennsylvania, approximately 14%, of Distribution Corporation’s small-volume residential and commercial customers purchase their supplies from unregulated marketers. In contrast, almost all large-volume load is served by unregulated retail marketers. However, retail competition for gas commodity service does not pose an acute competitive threat for Distribution Corporation, because in both jurisdictions, utility cost of service is recovered through rates and charges for gas delivery service, not gas commodity service. Over the longer run, it is possible that rate design changes resulting from further customer migration to marketer service could expose utility companies such as Distribution Corporation to stranded costs and revenue erosion in the absence of compensating rate relief.
Competition for transportation service to large-volume customers continues with local producers or pipeline companies attempting to sell or transport gas directly to end-users located within the Utility segment’s service territories without use of the utility’s facilities (i.e., bypass). In addition, competition continues with fuel oil suppliers.
The Utility segment competes in its most vulnerable markets (the large commercial and industrial markets) by offering unbundled, flexible, high quality services. The Utility segment continues to develop or promote new uses of natural gas as well as new services, rates and contracts.
Competition: The Energy Marketing Segment
The Energy Marketing segment competes with other marketers of natural gas and with other providers of energy supply. Competition in this area is well developed with regard to price and services from local, regional and national marketers.
-9-
Seasonality
Variations in weather conditions can materially affect the volume of natural gas delivered by the Utility segment, as virtually all of its residential and commercial customers use natural gas for space heating. The effect that this has on Utility segment margins in New York is mitigated by a WNC, which covers the eight-month period from October through May. Weather that is warmer than normal results in an upward adjustment to customers’ current bills, while weather that is colder than normal results in a downward adjustment, so that in either case projected operating costs calculated at normal temperatures will be recovered.
Volumes transported and stored by Supply Corporation and volumes transported by Empire may vary materially depending on weather, without materially affecting the revenues of those companies. Supply Corporation’s and Empire’s allowed rates are based on a straight fixed-variable rate design which allows recovery of fixed costs in fixed monthly reservation charges. Variable charges based on volumes are designed to recover only the variable costs associated with actual transportation or storage of gas.
Variations in weather conditions materially affect the volume of gas consumed by customers of the Energy Marketing segment. Volume variations have a corresponding impact on revenues within this segment.
Capital Expenditures
A discussion of capital expenditures by business segment is included in Item 7, MD&A under the heading “Investing Cash Flow.”
Environmental Matters
A discussion of material environmental matters involving the Company is included in Item 7, MD&A under the heading “Environmental Matters” and in Item 8, Note I — Commitments and Contingencies.
Miscellaneous
The Company and its wholly owned or majority-owned subsidiaries had a total of 2,100 full-time employees at September 30, 2017.
The Company has agreements in place with collective bargaining units in New York and Pennsylvania. Agreements covering employees in collective bargaining units in New York are scheduled to expire in February 2021. Agreements covering employees in collective bargaining units in Pennsylvania are scheduled to expire in April 2018 and May 2018. The Company is scheduled to begin negotiation discussions with these bargaining units in early 2018.
The Utility segment has numerous municipal franchises under which it uses public roads and certain other rights-of-way and public property for the location of facilities. When necessary, the Utility segment renews such franchises.
The Company makes its annual report on Form 10-K, quarterly reports on Form 10-Q, current reports on Form 8-K, and any amendments to those reports, available free of charge on the Company’s internet website, www.nationalfuelgas.com, as soon as reasonably practicable after they are electronically filed with or furnished to the SEC. The information available at the Company’s internet website is not part of this Form 10-K or any other report filed with or furnished to the SEC.
-10-
Executive Officers of the Company as of November 15, 2017(1)
Name and Age (as of November 15, 2017) | Current Company Positions and Other Material Business Experience During Past Five Years | |
Ronald J. Tanski (65) | Chief Executive Officer of the Company since April 2013 and President of the Company since July 2010. Mr. Tanski previously served as Chief Operating Officer of the Company from July 2010 through March 2013. | |
John R. Pustulka (65) | Chief Operating Officer of the Company since February 2016. Mr. Pustulka previously served as President of Supply Corporation from July 2010 through January 2016. | |
David P. Bauer (48) | President of Supply Corporation since February 2016. Treasurer and Principal Financial Officer of the Company since July 2010. Treasurer of Seneca since April 2015; Treasurer of Distribution Corporation since April 2015; Treasurer of Midstream Corporation since April 2013; Treasurer of Supply Corporation since June 2007; and Treasurer of Empire since June 2007. Mr. Bauer previously served as Assistant Treasurer of Distribution Corporation from April 2004 through March 2015. | |
Carl M. Carlotti (62) | President of Distribution Corporation since February 2016. Mr. Carlotti previously served as Senior Vice President of Distribution Corporation from January 2008 through January 2016. | |
Ronald C. Kraemer (61) | President of Empire Pipeline, Inc. since August 2008 and Senior Vice President of Supply Corporation since June 2016. Mr. Kraemer previously served as Vice President of Supply Corporation from August 2008 through May 2016. | |
John P. McGinnis (57) | President of Seneca Resources Corporation since May 2016. Mr. McGinnis previously served as Chief Operating Officer of Seneca Resources Corporation from October 2015 through April 2016 and Senior Vice President of Seneca Resources Corporation from March 2007 through September 2015. | |
Paula M. Ciprich (57) | Senior Vice President of the Company since April 2015; Secretary of the Company since July 2008; General Counsel of the Company since January 2005; Secretary of Distribution Corporation since July 2008. | |
Karen M. Camiolo (58) | Controller and Principal Accounting Officer of the Company since April 2004; Vice President of Distribution Corporation since April 2015; Controller of Midstream Corporation since April 2013; Controller of Empire since June 2007; and Controller of Distribution Corporation and Supply Corporation since April 2004. | |
Donna L. DeCarolis (58) | Vice President Business Development of the Company since October 2007. | |
Ann M. Wegrzyn (59) | Chief Information Officer of the Company since February 2017. Mrs. Wegrzyn previously served as Vice President of Distribution Corporation from December 2010 through January 2017. | |
(1) | The executive officers serve at the pleasure of the Board of Directors. The information provided relates to the Company and its principal subsidiaries. Many of the executive officers also have served or currently serve as officers or directors of other subsidiaries of the Company. |
-11-
Item 1A | Risk Factors |
As a holding company, the Company depends on its operating subsidiaries to meet its financial obligations.
The Company is a holding company with no significant assets other than the stock of its operating subsidiaries. In order to meet its financial needs, the Company relies exclusively on repayments of principal and interest on intercompany loans made by the Company to its operating subsidiaries and income from dividends and other cash flow from the subsidiaries. Such operating subsidiaries may not generate sufficient net income to pay upstream dividends or generate sufficient cash flow to make payments of principal or interest on such intercompany loans.
The Company is dependent on capital and credit markets to successfully execute its business strategies.
The Company relies upon short-term bank borrowings, commercial paper markets and longer-term capital markets to finance capital requirements not satisfied by cash flow from operations. The Company is dependent on these capital sources to provide capital to its subsidiaries to fund operations, acquire, maintain and develop properties, and execute growth strategies. The availability and cost of credit sources may be cyclical and these capital sources may not remain available to the Company. Turmoil in credit markets may make it difficult for the Company to obtain financing on acceptable terms or at all for working capital, capital expenditures and other investments, or to refinance maturing debt on favorable terms. These difficulties could adversely affect the Company's growth strategies, operations and financial performance. The Company's ability to borrow under its credit facilities and commercial paper agreements, and its ability to issue long-term debt under its indentures, depend on the Company's compliance with its obligations under the facilities, agreements and indentures.
In addition, the Company's short-term bank loans are in the form of floating rate debt or debt that may have rates fixed for very short periods of time, resulting in exposure to interest rate fluctuations in the absence of interest rate hedging transactions. The cost of long-term debt, the interest rates on the Company's short-term bank loans and the ability of the Company to issue commercial paper are affected by its debt credit ratings published by S&P, Moody's Investors Service, Inc. and Fitch Ratings. A downgrade in the Company's credit ratings could increase borrowing costs, negatively impact the availability of capital from banks, commercial paper purchasers and other sources, and require the Company’s subsidiaries to post letters of credit, cash or other assets as collateral with certain counterparties. Additionally, $300 million of the Company’s outstanding long-term debt would be subject to an interest rate increase if certain fundamental changes occur that involve a material subsidiary and result in a downgrade of the credit ratings assigned to the notes below investment grade. If the Company is not able to maintain investment-grade credit ratings, it may not be able to access commercial paper markets.
The Company may be adversely affected by economic conditions and their impact on our suppliers and customers.
Periods of slowed economic activity generally result in decreased energy consumption, particularly by industrial and large commercial companies. As a consequence, national or regional recessions or other downturns in economic activity could adversely affect the Company’s revenues and cash flows or restrict its future growth. Economic conditions in the Company’s utility service territories and energy marketing territories also impact its collections of accounts receivable. All of the Company’s segments are exposed to risks associated with the creditworthiness or performance of key suppliers and customers, many of which may be adversely affected by volatile conditions in the financial markets. These conditions could result in financial instability or other adverse effects at any of our suppliers or customers. For example, counterparties to the Company’s commodity hedging arrangements or commodity sales contracts might not be able to perform their obligations under these arrangements or contracts. Customers of the Company’s Utility and Energy Marketing segments may have particular trouble paying their bills during periods of declining economic activity or high commodity prices, potentially resulting in increased bad debt expense and reduced earnings. Similarly, if reductions were to occur in funding of the federal Low Income Home Energy Assistance Program, bad debt expense could increase and earnings could decrease. In addition, oil and gas exploration and production companies that are customers of the Company’s Pipeline and Storage segment may decide not to renew contracts for the same transportation capacity during periods of reduced
-12-
production due to persistent low commodity prices. Any of these events could have a material adverse effect on the Company’s results of operations, financial condition and cash flows.
The Company’s credit ratings may not reflect all the risks of an investment in its securities.
The Company’s credit ratings are an independent assessment of its ability to pay its obligations. Consequently, real or anticipated changes in the Company’s credit ratings will generally affect the market value of the specific debt instruments that are rated, as well as the market value of the Company’s common stock. The Company’s credit ratings, however, may not reflect the potential impact on the value of its common stock of risks related to structural, market or other factors discussed in this Form 10-K.
The Company’s need to comply with comprehensive, complex, and the sometimes unpredictable enforcement of government regulations may increase its costs and limit its revenue growth, which may result in reduced earnings.
While the Company generally refers to its Utility segment and its Pipeline and Storage segment as its "regulated segments," there are many governmental laws and regulations that have an impact on almost every aspect of the Company's businesses including, but not limited to, tax law and environmental law. Existing statutes and regulations may be revised or reinterpreted and new laws and regulations may be adopted or become applicable to the Company, such as tax legislation, which may increase the Company's costs or affect its business in ways that the Company cannot predict. Administrative agencies may apply existing laws and regulations in unanticipated, inconsistent or legally unsupportable ways, making it difficult to develop and complete projects, and harming the economic climate generally. New York State, for example, under the current executive administration, appears intent on imposing unattainable regulatory standards, at least with respect to certain fossil fuel energy infrastructure projects.
In the Company's Utility segment, the operations of Distribution Corporation are subject to the jurisdiction of the NYPSC, the PaPUC and, with respect to certain transactions, the FERC. The NYPSC and the PaPUC, among other things, approve the rates that Distribution Corporation may charge to its utility customers. Those approved rates also impact the returns that Distribution Corporation may earn on the assets that are dedicated to those operations. If Distribution Corporation is required in a rate proceeding to reduce the rates it charges its utility customers, or to the extent Distribution Corporation is unable to obtain approval for rate increases from these regulators, particularly when necessary to cover increased costs (including costs that may be incurred in connection with governmental investigations or proceedings or mandated infrastructure inspection, maintenance or replacement programs), earnings may decrease.
In addition to their historical methods of utility regulation, both the PaPUC and NYPSC have established competitive markets in which customers may purchase gas commodity from unregulated marketers, in addition to utility companies. Retail competition for gas commodity service does not pose an acute competitive threat for Distribution Corporation because in both jurisdictions it recovers its cost of service through delivery rates and charges, and not through any mark-up on the gas commodity purchased by its customers. Over the longer run, however, rate design changes resulting from customer migration to marketer service ("unbundling") can expose utilities such as Distribution Corporation to stranded costs and revenue erosion in the absence of compensating rate relief.
Both the NYPSC and the PaPUC have, from time-to-time, instituted proceedings for the purpose of promoting conservation of energy commodities, including natural gas. In New York, Distribution Corporation implemented a Conservation Incentive Program that promotes conservation and efficient use of natural gas by offering customer rebates for the installation of high-efficiency appliances, among other things. The intent of conservation and efficiency programs is to reduce customer usage of natural gas. Under traditional volumetric rates, reduced usage by customers results in decreased revenues to the Utility. To prevent revenue erosion caused by conservation, the NYPSC approved a "revenue decoupling mechanism" that renders Distribution Corporation's New York division financially indifferent to the effects of conservation. In Pennsylvania, the PaPUC has not directed Distribution Corporation to implement a conservation program. If the NYPSC were to revoke the revenue decoupling mechanism in a future proceeding or the PaPUC were to adopt a conservation program without revenue decoupling mechanism or other changes in rate design, reduced customer usage could decrease revenues, forcing Distribution Corporation to file for rate relief. If Distribution Corporation were unable to obtain adequate rate relief, its financial condition, results of operations and cash flows would be adversely affected.
-13-
In New York, aggressive generic statewide programs created under the label of efficiency or conservation continue to generate a sizable utility funding requirement for state agencies that administer those programs. Although utilities are authorized to recover the cost of efficiency and conservation program funding through special rates and surcharges, the resulting upward pressure on customer rates, coupled with increased assessments and taxes, could affect future tolerance for traditional utility rate increases, especially if natural gas commodity costs were to increase.
The Company is subject to the jurisdiction of the FERC with respect to Supply Corporation, Empire and some transactions performed by other Company subsidiaries, including Seneca, Distribution Corporation and NFR. The FERC, among other things, approves the rates that Supply Corporation and Empire may charge to their natural gas transportation and/or storage customers. Those approved rates also impact the returns that Supply Corporation and Empire may earn on the assets that are dedicated to those operations. Pursuant to the petition of a customer or state commission, or on the FERC's own initiative, the FERC has the authority to investigate whether Supply Corporation's and Empire's rates are still "just and reasonable" as required by the NGA, and if not, to adjust those rates prospectively. If Supply Corporation or Empire is required in a rate proceeding to adjust the rates it charges its natural gas transportation and/or storage customers, or if either Supply Corporation or Empire is unable to obtain approval for rate increases, particularly when necessary to cover increased costs, Supply Corporation's or Empire's earnings may decrease. The FERC also possesses significant penalty authority with respect to violations of the laws and regulations it administers. Supply Corporation, Empire and, to the extent subject to FERC jurisdiction, the Company's other subsidiaries are subject to the FERC's penalty authority. In addition, the FERC exercises jurisdiction over the construction and operation of facilities used in interstate gas transmission. Also, decisions of Canadian regulators such as the National Energy Board and the Ontario Energy Board could affect the viability and profitability of Supply Corporation and Empire projects designed to transport gas between Canada and the U.S.
The Company is also subject to the jurisdiction of the Pipeline and Hazardous Materials Safety Administration (PHMSA). PHMSA issues regulations and conducts evaluations, among other things, that set safety standards for pipelines and underground storage facilities. Compliance with new legislation could increase costs to the Company. Non-compliance with this legislation could result in civil penalties for pipeline safety violations. If as a result of these or similar new laws or regulations the Company incurs material costs that it is unable to recover fully through rates or otherwise offset, the Company's financial condition, results of operations, and cash flows could be adversely affected.
In the Company's Exploration and Production segment, various aspects of Seneca's operations are subject to regulation by, among others, the EPA, the U.S. Fish and Wildlife Service, the U.S. Forestry Service, the Bureau of Land Management, the PaDEP, the Pennsylvania Department of Conservation and Natural Resources, the Division of Oil, Gas and Geothermal Resources of the California Department of Conservation, the California Department of Fish and Wildlife, and in some areas, locally adopted ordinances. Administrative proceedings or increased regulation by these or other agencies could lead to operational delays or restrictions and increased expense for Seneca.
The nature of the Company’s operations presents inherent risks of loss that could adversely affect its results of operations, financial condition and cash flows.
The Company’s operations in its various reporting segments are subject to inherent hazards and risks such as: fires; natural disasters; explosions; geological formations with abnormal pressures; blowouts during well drilling; collapses of wellbore casing or other tubulars; pipeline ruptures; spills; and other hazards and risks that may cause personal injury, death, property damage, environmental damage or business interruption losses. Additionally, the Company’s facilities, machinery, and equipment may be subject to sabotage. Any of these events could cause a loss of hydrocarbons, environmental pollution, claims for personal injury, death, property damage or business interruption, or governmental investigations, recommendations, claims, fines or penalties. As protection against operational hazards, the Company maintains insurance coverage against some, but not all, potential losses. In addition, many of the agreements that the Company executes with contractors provide for the division of responsibilities between the contractor and the Company, and the Company seeks to obtain an indemnification from the contractor for certain of these risks. The Company is not always able, however, to secure written agreements with its contractors that contain indemnification, and sometimes the Company is required to indemnify others.
-14-
Insurance or indemnification agreements, when obtained, may not adequately protect the Company against liability from all of the consequences of the hazards described above. The occurrence of an event not fully insured or indemnified against, the imposition of fines, penalties or mandated programs by governmental authorities, the failure of a contractor to meet its indemnification obligations, or the failure of an insurance company to pay valid claims could result in substantial losses to the Company. In addition, insurance may not be available, or if available may not be adequate, to cover any or all of these risks. It is also possible that insurance premiums or other costs may rise significantly in the future, so as to make such insurance prohibitively expensive.
Hazards and risks faced by the Company, and insurance and indemnification obtained or provided by the Company, may subject the Company to litigation or administrative proceedings from time to time. Such litigation or proceedings could result in substantial monetary judgments, fines or penalties against the Company or be resolved on unfavorable terms, the result of which could have a material adverse effect on the Company’s results of operations, financial condition and cash flows.
Environmental regulation significantly affects the Company’s business.
The Company’s business operations are subject to federal, state, and local laws and regulations relating to environmental protection. These laws and regulations concern the generation, storage, transportation, disposal, emission or discharge of pollutants, contaminants, hazardous substances and greenhouse gases into the environment, the reporting of such matters, and the general protection of public health, natural resources, wildlife and the environment. For example, currently applicable environmental laws and regulations restrict the types, quantities and concentrations of materials that can be released into the environment in connection with regulated activities, limit or prohibit activities in certain protected areas, and may require the Company to investigate and/or remediate contamination at certain current and former properties regardless of whether such contamination resulted from the Company’s actions or whether such actions were in compliance with applicable laws and regulations at the time they were taken. Moreover, spills or releases of regulated substances or the discovery of currently unknown contamination could expose the Company to material losses, expenditures and environmental, health and safety liabilities. Such liabilities could include penalties, sanctions or claims for damages to persons, property or natural resources brought on behalf of the government or private litigants that could cause the Company to incur substantial costs or uninsured losses.
In addition, the Company must obtain, maintain and comply with numerous permits, leases, approvals, consents and certificates from various governmental authorities before commencing regulated activities. In connection with such activities, the Company may need to make significant capital and operating expenditures to detect, repair and/or control air emissions, to control water discharges or to perform certain corrective actions to meet the conditions of the permits issued pursuant to applicable environmental laws and regulations. Any failure to comply with applicable environmental laws and regulations and the terms and conditions of its environmental permits and authorizations could result in the assessment of significant administrative, civil and/or criminal penalties, the imposition of investigatory or remedial obligations and corrective actions, the revocation of required permits, or the issuance of injunctions limiting or prohibiting certain of the Company’s operations.
Costs of compliance and liabilities could negatively affect the Company’s results of operations, financial condition and cash flows. In addition, compliance with environmental laws and regulations could require unexpected capital expenditures at the Company’s facilities, temporarily shut down the Company’s facilities or delay or cause the cancellation of expansion projects or oil and natural gas drilling activities. Because the costs of complying with environmental regulations are significant, additional regulation could negatively affect the Company’s business. Although the Company cannot predict the impact of the interpretation or enforcement of EPA standards or other federal, state and local laws or regulations, the Company’s costs could increase if environmental laws and regulations change.
Legislative and regulatory measures to address climate change and greenhouse gas emissions are in various phases of discussion or implementation. Under the federal Clean Air Act, the EPA requires that new stationary sources of significant greenhouse gas emissions or major modifications of existing facilities obtain permits prior to construction or modification. The EPA previously adopted final regulations that set methane emissions standards for new oil and natural gas emission sources. In addition, the EPA issued draft guidelines for voluntarily reducing emissions from existing equipment and processes in the oil and natural gas industry. The current U.S. presidential
-15-
administration has issued executive orders to roll back many of these regulations, and, in turn, litigation (not involving the Company) has been instituted to challenge the administration’s efforts. The Company must continue to comply with all applicable regulations. Further, the U.S. Congress has from time to time considered bills that would establish a cap-and-trade program to reduce emissions of greenhouse gases. A number of states have adopted energy strategies or plans with goals that include the reduction of greenhouse gas emissions. New York’s State Energy Plan, which includes Reforming the Energy Vision (REV) initiatives, sets greenhouse gas emission reduction targets of 40% by 2030 and 80% by 2050. Additionally, the Plan targets that 50% of electric generation must come from renewable energy sources by 2030. With respect to its operations in California, the Company currently complies with California cap-and-trade guidelines, which increases the Company’s cost of environmental compliance in its Exploration and Production segment operations. Legislation or regulation that aims to reduce greenhouse gas emissions could also include carbon taxes, restrictive permitting, increased efficiency standards, and incentives or mandates to conserve energy or use renewable energy sources. Federal, state or local governments may, for example, provide tax advantages and other subsidies to support alternative energy sources, mandate the use of specific fuels or technologies, or promote research into new technologies to reduce the cost and increase the scalability of alternative energy sources. These climate change and greenhouse gas initiatives could increase the Company’s cost of environmental compliance by requiring the Company to install new equipment to reduce emissions from larger facilities and/or purchase emission allowances. They could also delay or otherwise negatively affect efforts to obtain permits and other regulatory approvals with regard to existing and new facilities, impose additional monitoring and reporting requirements, and reduce demand for oil and natural gas.
Third parties may attempt to breach the Company’s network security, which could disrupt the Company’s operations and adversely affect its financial results.
The Company’s information technology systems are subject to attempts by others to gain unauthorized access through the Internet, or to otherwise introduce malicious software. These attempts might be the result of industrial or other espionage, or actions by hackers seeking to harm the Company, its services or customers. Attempts to breach the Company’s network security may result in disruption of the Company’s business operations and services, delays in production, theft of sensitive and valuable data, damage to our physical systems, and reputational harm. Significant expenditures may be required to remedy breaches, including restoration of customer service and enhancement of information technology systems. The Company seeks to prevent, detect and investigate these security incidents, but in some cases the Company might be unaware of an incident or its magnitude and effects. The Company has experienced attempts to breach its network security, and although the scope of such incidents is sometimes unknown, they could prove to be material to the Company. These security incidents may have an adverse impact on the Company’s operations, earnings and financial condition.
Delays or changes in plans or costs with respect to Company projects, including regulatory delays or denials with respect to necessary approvals, permits or orders, could delay or prevent anticipated project completion and may result in asset write-offs and reduced earnings.
Construction of the Pipeline and Storage segment’s planned pipelines and storage facilities, as well as the expansion of existing facilities, is subject to various regulatory, environmental, political, legal, economic and other development risks, including the ability to obtain necessary approvals and permits from regulatory agencies on a timely basis and on acceptable terms, or at all. For example, the Company has in the past encountered, and may in the future encounter, delays or denials by regulatory agencies in connection with certain projects, most significantly the Northern Access 2016 project. Existing or potential third party opposition, such as opposition from landowner and environmental groups, which are beyond our control, could interfere significantly with or delay the Company’s receipt of such approvals or permits, which could materially affect the anticipated construction of a project. In addition, third parties could impede the Gathering segment’s acquisition, expansion or renewal of rights-of-way or land rights on a timely basis and on acceptable terms. Any delay in project construction may prevent a planned project from going into service when anticipated, which could cause a delay in the receipt of revenues from those facilities. A significant construction delay in a material project, whatever the cause, or a final judgment denying a necessary permit, may result in asset write-offs and reduced earnings and an inability to complete projects as initially planned, or at all. These events could have a material adverse impact on anticipated operating results.
-16-
The Company could be adversely affected by the disallowance of purchased gas costs incurred by the Utility segment.
Tariff rate schedules in each of the Utility segment’s service territories contain purchased gas adjustment clauses which permit Distribution Corporation to file with state regulators for rate adjustments to recover increases in the cost of purchased gas. Assuming those rate adjustments are granted, increases in the cost of purchased gas have no direct impact on profit margins. Distribution Corporation is required to file an accounting reconciliation with the regulators in each of the Utility segment’s service territories regarding the costs of purchased gas. There is a risk of disallowance of full recovery of these costs if regulators determine that Distribution Corporation was imprudent in making its gas purchases. Any material disallowance of purchased gas costs could have a material adverse effect on cash flow and earnings.
Changes in interest rates may affect the Company’s ability to finance capital expenditures and to refinance maturing debt.
The Company’s ability to cost-effectively finance capital expenditures and to refinance maturing debt will depend in part upon interest rates. The direction in which interest rates may move is uncertain. Declining interest rates have generally been believed to be favorable to utilities, while rising interest rates are generally believed to be unfavorable, because of the levels of debt that utilities may have outstanding. In addition, the Company’s authorized rate of return in its regulated businesses is based upon certain assumptions regarding interest rates. If interest rates are lower than assumed rates, the Company’s authorized rate of return could be reduced. If interest rates are higher than assumed rates, the Company’s ability to earn its authorized rate of return may be adversely impacted.
Fluctuations in oil and natural gas prices could adversely affect revenues, cash flows and profitability.
Operations in the Company’s Exploration and Production segment are materially dependent on prices received for its oil and natural gas production. Both short-term and long-term price trends affect the economics of exploring for, developing, producing, gathering and processing oil and natural gas. Oil and natural gas prices can be volatile and can be affected by: weather conditions, natural disasters, the supply and price of foreign oil and natural gas, the level of consumer product demand, national and worldwide economic conditions, economic disruptions caused by terrorist activities, acts of war or major accidents, political conditions in foreign countries, the price and availability of alternative fuels, the proximity to, and availability of, capacity on transportation facilities, regional levels of supply and demand, energy conservation measures, and government regulations, such as regulation of greenhouse gas emissions and natural gas transportation, royalties, and price controls. The Company sells the oil and natural gas that it produces at a combination of current market prices, indexed prices or through fixed-price contracts. The Company hedges a significant portion of future sales that are based on indexed prices utilizing the physical sale counter-party or the financial markets. The prices the Company receives depend upon factors beyond the Company’s control, including the factors affecting price mentioned above. The Company believes that any prolonged reduction in oil and natural gas prices could restrict its ability to continue the level of exploration and production activity the Company otherwise would pursue, which could have a material adverse effect on its revenues, cash flows and results of operations.
To the extent that the natural gas the Company produces is priced in local markets where production occurs, the price may be affected by local or regional supply and demand factors as well as other local market dynamics such as regional pipeline capacity. Currently, the prices the Company receives for its natural gas production in the local markets where production occurs are generally lower than the relevant benchmark prices, such as NYMEX, that are used for commodity trading purposes. The difference between the benchmark price and the price the Company receives is called a differential. The Company may be unable to accurately predict natural gas differentials, which may widen significantly in the future. Numerous factors may influence local commodity pricing, such as pipeline takeaway capacity and specifications, localized storage capacity, disruptions in the midstream or downstream sectors of the industry, trade restrictions and governmental regulations. Insufficient pipeline or storage capacity, or a lack of demand or surplus of supply in any given operating area may cause the differential to widen in that area compared to other natural gas producing areas. Increases in the differential could lead to production curtailments or otherwise have a material adverse effect on the Company’s revenues, cash flows and results of operations.
-17-
In the Company’s Pipeline and Storage segment, significant changes in the price differential between equivalent quantities of natural gas at different geographic locations could adversely impact the Company. For example, if the price of natural gas at a particular receipt point on the Company’s pipeline system increases relative to the price of natural gas at other locations, then the volume of natural gas received by the Company at the relatively more expensive receipt point may decrease, or the price the Company charges to transport that natural gas may decrease. Changes in price differentials can cause shippers to seek alternative lower priced gas supplies and, consequently, alternative transportation routes. In some cases, shippers may decide not to renew transportation contracts due to changes in price differentials. While much of the impact of lower volumes under existing contracts would be offset by the straight fixed-variable rate design utilized by Supply Corporation and Empire, this rate design does not protect Supply Corporation or Empire where shippers do not contract for expiring capacity at the same quantity and rate. If contract renewals were to decrease, revenues and earnings in the Pipeline and Storage segment may decrease. Significant changes in the price differential between futures contracts for natural gas having different delivery dates could also adversely impact the Company. For example, if the prices of natural gas futures contracts for winter deliveries to locations served by the Pipeline and Storage segment decline relative to the prices of such contracts for summer deliveries (as a result, for instance, of increased production of natural gas within the Pipeline and Storage segment’s geographic area or other factors), then demand for the Company’s natural gas storage services driven by that price differential could decrease. Such changes in price differential could also affect the Energy Marketing segment’s ability to offset its natural gas storage costs through hedging transactions. These changes could adversely affect revenues, cash flows and results of operations.
The Company has significant transactions involving price hedging of its oil and natural gas production as well as its fixed price purchase and sale commitments.
In order to protect itself to some extent against unusual price volatility and to lock in fixed pricing on oil and natural gas production for certain periods of time, the Company’s Exploration and Production segment regularly enters into commodity price derivatives contracts (hedging arrangements) with respect to a portion of its expected production. These contracts may at any time cover as much as approximately 80% of the Company’s expected energy production during the upcoming 12-month period. These contracts reduce exposure to subsequent price drops but can also limit the Company’s ability to benefit from increases in commodity prices. In addition, the Energy Marketing segment enters into certain hedging arrangements, primarily with respect to its fixed price purchase and sales commitments and its gas stored underground.
Under applicable accounting rules currently in effect, the Company’s hedging arrangements are subject to quarterly effectiveness tests. Inherent within those effectiveness tests are assumptions concerning the long-term price differential between different types of crude oil, assumptions concerning the difference between published natural gas price indexes established by pipelines into which hedged natural gas production is delivered and the reference price established in the hedging arrangements, assumptions regarding the levels of production that will be achieved and, with regard to fixed price commitments, assumptions regarding the creditworthiness of certain customers and their forecasted consumption of natural gas. Depending on market conditions for natural gas and crude oil and the levels of production actually achieved, it is possible that certain of those assumptions may change in the future, and, depending on the magnitude of any such changes, it is possible that a portion of the Company’s hedges may no longer be considered highly effective. In that case, gains or losses from the ineffective derivative financial instruments would be marked-to-market on the income statement without regard to an underlying physical transaction. For example, in the Exploration and Production segment, where the Company uses short positions (i.e. positions that pay off in the event of commodity price decline) to hedge forecasted sales, gains would occur to the extent that natural gas and crude oil hedge prices exceed market prices for the Company’s natural gas and crude oil production, and losses would occur to the extent that market prices for the Company’s natural gas and crude oil production exceed hedge prices.
Use of energy commodity price hedges also exposes the Company to the risk of non-performance by a contract counterparty. These parties might not be able to perform their obligations under the hedge arrangements. In addition, the Company enters into certain commodity price hedges that are cleared through the NYMEX or ICE by futures commission merchants. Under NYMEX and ICE rules, the Company is required to post collateral in connection with such hedges, with such collateral being held by its futures commission merchants. The Company is exposed to the risk of loss of such collateral from occurrences such as financial failure of its futures commission
-18-
merchants, or misappropriation or mishandling of clients’ funds or other similar actions by its futures commission merchants. In addition, the Company is exposed to potential hedging ineffectiveness in the event of a failure by one of its futures commission merchants or contract counterparties.
It is the Company’s practice that the use of commodity derivatives contracts comply with various policies in effect in respective business segments. For example, in the Exploration and Production segment, commodity derivatives contracts must be confined to the price hedging of existing and forecast production, and in the Energy Marketing segment, commodity derivatives with respect to fixed price purchase and sales commitments must be matched against commitments reasonably certain to be fulfilled. The Company maintains a system of internal controls to monitor compliance with its policy. However, unauthorized speculative trades, if they were to occur, could expose the Company to substantial losses to cover positions in its derivatives contracts. In addition, in the event the Company’s actual production of oil and natural gas falls short of hedged forecast production, the Company may incur substantial losses to cover its hedges.
The Dodd-Frank Act increased federal oversight and regulation of the over-the-counter derivatives markets and certain entities that participate in those markets. The act requires the CFTC, the SEC and various banking regulators to promulgate rules and regulations implementing the act. Although regulators have issued certain regulations, other rules that may be relevant to the Company have yet to be finalized. For purposes of the Dodd-Frank Act, under rules adopted by the SEC and/or CFTC, the Company believes that it qualifies as a non-financial end user of derivatives, that is, as a non-financial entity that uses derivatives to hedge or mitigate commercial risk. Nevertheless, other rules that are being developed could have a significant impact on the Company. For example, the CFTC has imposed numerous registration, swaps documentation, business conduct, reporting, and recordkeeping requirements on swap dealers and major swap participants, which frequently are counterparties to the Company’s derivative hedging transactions. Regardless of the final capital and margin rules, concern remains that swap dealers and major swap participants will pass along their increased costs stemming from the final and proposed rules through higher transaction costs and prices or other direct or indirect costs. In addition, while the Company expects to be exempt from the Dodd-Frank Act’s requirement that swaps be cleared and traded on exchanges or swap execution facilities, the cost of entering into a non-exchange cleared swap that is available as an exchange cleared swap may be greater. The Dodd-Frank Act may also increase costs for derivative recordkeeping, reporting, position limit compliance, and other compliance; cause parties to materially alter the terms of derivative contracts; cause parties to restructure certain derivative contracts; reduce the availability of derivatives to protect against risks that the Company encounters or to optimize assets; reduce the Company’s ability to monetize or restructure existing derivative contracts; and increase the Company’s exposure to less creditworthy counterparties, all of which could increase the Company’s business costs.
You should not place undue reliance on reserve information because such information represents estimates.
This Form 10-K contains estimates of the Company’s proved oil and natural gas reserves and the future net cash flows from those reserves that were prepared by the Company’s petroleum engineers and audited by independent petroleum engineers. Petroleum engineers consider many factors and make assumptions in estimating oil and natural gas reserves and future net cash flows. These factors include: historical production from the area compared with production from other producing areas; the assumed effect of governmental regulation; and assumptions concerning oil and natural gas prices, production and development costs, severance and excise taxes, and capital expenditures. Lower oil and natural gas prices generally cause estimates of proved reserves to be lower. Estimates of reserves and expected future cash flows prepared by different engineers, or by the same engineers at different times, may differ substantially. Ultimately, actual production, revenues and expenditures relating to the Company’s reserves will vary from any estimates, and these variations may be material. Accordingly, the accuracy of the Company’s reserve estimates is a function of the quality of available data and of engineering and geological interpretation and judgment.
If conditions remain constant, then the Company is reasonably certain that its reserve estimates represent economically recoverable oil and natural gas reserves and future net cash flows. If conditions change in the future, then subsequent reserve estimates may be revised accordingly. You should not assume that the present value of future net cash flows from the Company’s proved reserves is the current market value of the Company’s estimated oil and natural gas reserves. In accordance with SEC requirements, the Company bases the estimated discounted
-19-
future net cash flows from its proved reserves on a 12-month average of historical prices for oil and natural gas (based on first day of the month prices and adjusted for hedging) and on costs as of the date of the estimate. Actual future prices and costs may differ materially from those used in the net present value estimate. Any significant price changes will have a material effect on the present value of the Company’s reserves.
Petroleum engineering is a subjective process of estimating underground accumulations of natural gas and other hydrocarbons that cannot be measured in an exact manner. The process of estimating oil and natural gas reserves is complex. The process involves significant decisions and assumptions in the evaluation of available geological, geophysical, engineering and economic data for each reservoir. Future economic and operating conditions are uncertain, and changes in those conditions could cause a revision to the Company’s reserve estimates in the future. Estimates of economically recoverable oil and natural gas reserves and of future net cash flows depend upon a number of variable factors and assumptions, including historical production from the area compared with production from other comparable producing areas, and the assumed effects of regulations by governmental agencies. Because all reserve estimates are to some degree subjective, each of the following items may differ materially from those assumed in estimating reserves: the quantities of oil and natural gas that are ultimately recovered, the timing of the recovery of oil and natural gas reserves, the production and operating costs incurred, the amount and timing of future development and abandonment expenditures, and the price received for the production.
The amount and timing of actual future oil and natural gas production and the cost of drilling are difficult to predict and may vary significantly from reserves and production estimates, which may reduce the Company’s earnings.
There are many risks in developing oil and natural gas, including numerous uncertainties inherent in estimating quantities of proved oil and natural gas reserves and in projecting future rates of production and timing of development expenditures. The future success of the Company’s Exploration and Production segment depends on its ability to develop additional oil and natural gas reserves that are economically recoverable, and its failure to do so may reduce the Company’s earnings. The total and timing of actual future production may vary significantly from reserves and production estimates. The Company’s drilling of development wells can involve significant risks, including those related to timing, success rates, and cost overruns, and these risks can be affected by lease and rig availability, geology, and other factors. Drilling for oil and natural gas can be unprofitable, not only from non-productive wells, but from productive wells that do not produce sufficient revenues to return a profit. Also, title problems, weather conditions, governmental requirements, including completion of environmental impact analyses and compliance with other environmental laws and regulations, and shortages or delays in the delivery of equipment and services can delay drilling operations or result in their cancellation. The cost of drilling, completing, and operating wells is significant and often uncertain, and new wells may not be productive or the Company may not recover all or any portion of its investment. Production can also be delayed or made uneconomic if there is insufficient gathering, processing and transportation capacity available at an economic price to get that production to a location where it can be profitably sold. Without continued successful exploitation or acquisition activities, the Company’s reserves and revenues will decline as a result of its current reserves being depleted by production. The Company cannot make assurances that it will be able to find or acquire additional reserves at acceptable costs.
Financial accounting requirements regarding exploration and production activities may affect the Company's profitability.
The Company accounts for its exploration and production activities under the full cost method of accounting. Each quarter, the Company must perform a "ceiling test" calculation, comparing the level of its unamortized investment in oil and natural gas properties to the present value of the future net revenue projected to be recovered from those properties according to methods prescribed by the SEC. In determining present value, the Company uses a 12-month historical average price for oil and natural gas (based on first day of the month prices and adjusted for hedging). If, at the end of any quarter, the amount of the unamortized investment exceeds the net present value of the projected future cash flows, such investment may be considered to be "impaired," and the full cost accounting rules require that the investment must be written down to the calculated net present value. Such an instance would require the Company to recognize an immediate expense in that quarter, and its earnings would be reduced. Depending on the magnitude of any decrease in average prices, that charge could be material. For the fiscal year
-20-
ended September 30, 2015, the Company recognized pre-tax impairment charges on its oil and natural gas properties of $1.1 billion. For the fiscal year ended September 30, 2016, the Company recognized a pre-tax impairment charge on its oil and natural gas properties of $948.3 million.
Increased regulation of exploration and production activities, including hydraulic fracturing, could adversely impact the Company.
Due to the burgeoning Marcellus Shale natural gas play in the northeast United States, together with the fiscal difficulties faced by state governments in Pennsylvania, various state legislative and regulatory initiatives regarding the exploration and production business have been proposed or adopted. These initiatives include potential new or updated statutes and regulations governing the drilling, casing, cementing, testing, abandonment and monitoring of wells, the protection of water supplies and restrictions on water use and water rights, hydraulic fracturing operations, surface owners’ rights and damage compensation, the spacing of wells, use and disposal of potentially hazardous materials, and environmental and safety issues regarding natural gas pipelines. New permitting fees and/or severance taxes for oil and gas production are also possible. Additionally, legislative initiatives in the U.S. Congress and regulatory studies, proceedings or rule-making initiatives at federal, state or local agencies focused on the hydraulic fracturing process and related operations could result in additional permitting, compliance, reporting and disclosure requirements. For example, the EPA has adopted regulations that establish emission performance standards for hydraulic fracturing operations as well as natural gas gathering and transmission operations. Other EPA initiatives could expand water quality and hazardous waste regulation of hydraulic fracturing and related operations. In California, legislation regarding well stimulation, including hydraulic fracturing, has been adopted. The law mandates technical standards for well construction, hydraulic fracturing water management, groundwater monitoring, seismicity monitoring during hydraulic fracturing operations and public disclosure of hydraulic fracturing fluid constituents. Additionally, the California Division of Oil, Gas & Geothermal Resources (DOGGR) adopted regulations intended to bring California’s Class II Underground Injection Control (UIC) program into compliance with the federal Safe Drinking Water Act, under which some wells may require an aquifer exemption. DOGGR began reviewing all active UIC projects, regardless of whether an exemption is required. These and any other new state, federal or local legislative or regulatory measures could lead to operational delays or restrictions, increased operating costs, additional regulatory burdens and increased risks of litigation for the Company.
The increasing costs of certain employee and retiree benefits could adversely affect the Company’s results.
The Company’s earnings and cash flow may be impacted by the amount of income or expense it expends or records for employee benefit plans. This is particularly true for pension and other post-retirement benefit plans, which are dependent on actual plan asset returns and factors used to determine the value and current costs of plan benefit obligations. In addition, if medical costs rise at a rate faster than the general inflation rate, the Company might not be able to mitigate the rising costs of medical benefits. Increases to the costs of pension, other post-retirement and medical benefits could have an adverse effect on the Company’s financial results.
Significant shareholders or potential shareholders may attempt to effect changes at the Company or acquire control over the Company, which could adversely affect the Company’s results of operations and financial condition.
Shareholders of the Company may from time to time engage in proxy solicitations, advance shareholder proposals or otherwise attempt to effect changes or acquire control over the Company. Campaigns by shareholders to effect changes at publicly traded companies are sometimes led by investors seeking to increase short-term shareholder value through actions such as financial restructuring, increased debt, special dividends, stock repurchases or sales of assets or the entire company. Additionally, activist shareholders may submit proposals to promote an environmental, social or governance position. Responding to proxy contests and other actions by activist shareholders can be costly and time-consuming, disrupting the Company’s operations and diverting the attention of the Company’s Board of Directors and senior management from the pursuit of business strategies. As a result, shareholder campaigns could adversely affect the Company’s results of operations and financial condition.
-21-
Item 1B | Unresolved Staff Comments |
None.
Item 2 | Properties |
General Information on Facilities
The net investment of the Company in property, plant and equipment was $4.7 billion at September 30, 2017. The Exploration and Production segment constitutes 25.6% of this investment, and is primarily located in California and in the Appalachian region of the United States. Approximately 63.3% of the Company's investment in net property, plant and equipment was in the Utility and Pipeline and Storage segments, whose operations are located primarily in western and central New York and northwestern Pennsylvania. The Gathering segment constitutes 9.8% of the Company’s investment in net property, plant and equipment, and is located in northwestern Pennsylvania. The remaining net investment in property, plant and equipment consisted of the All Other category and Corporate operations (1.3%), or $0.1 billion. During the past five years, the Company has made additions to property, plant and equipment in order to expand its exploration and production operations in the Appalachian region of the United States and to expand and improve transmission facilities for transportation customers in New York and Pennsylvania. Net property, plant and equipment has decreased $66 million, or 1.4%, since September 30, 2012.
The Exploration and Production segment had a net investment in property, plant and equipment of $1.2 billion at September 30, 2017.
The Pipeline and Storage segment had a net investment of $1.5 billion in property, plant and equipment at September 30, 2017. Transmission pipeline represents 36% of this segment’s total net investment and includes 2,274 miles of pipeline utilized to move large volumes of gas throughout its service area. Storage facilities represent 16% of this segment’s total net investment and consist of 31 storage fields operating at a combined working gas level of 73.4 Bcf, four of which are jointly owned and operated with other interstate gas pipeline companies, and 393 miles of pipeline. Net investment in storage facilities includes $82.8 million of gas stored underground-noncurrent, representing the cost of the gas utilized to maintain pressure levels for normal operating purposes as well as gas maintained for system balancing and other purposes, including that needed for no-notice transportation service. The Pipeline and Storage segment has 32 compressor stations with 170,707 installed compressor horsepower that represent 25% of this segment’s total net investment in property, plant and equipment.
The Gathering segment had a net investment of $0.5 billion in property, plant and equipment at September 30, 2017. Gathering lines and related compressors represent substantially all of this segment’s total net investment, including 135 miles of lines utilized to move Appalachian production (including Marcellus Shale) to various transmission pipeline receipt points. The Gathering segment has 5 compressor stations with 51,920 installed compressor horsepower.
The Utility segment had a net investment in property, plant and equipment of $1.4 billion at September 30, 2017. The net investment in its gas distribution network (including 14,895 miles of distribution pipeline) and its service connections to customers represent approximately 48% and 33%, respectively, of the Utility segment’s net investment in property, plant and equipment at September 30, 2017.
The Pipeline and Storage segments’ facilities provided the capacity to meet Supply Corporation’s 2017 peak day sendout for transportation service of 2,252 MMcf, which occurred on January 8, 2017. Withdrawals from storage of 624.3 MMcf provided approximately 28% of the requirements on that day.
Company maps are included in Exhibit 99.2 of this Form 10-K and are incorporated herein by reference.
Exploration and Production Activities
The Company is engaged in the exploration for and the development of natural gas and oil reserves in California and the Appalachian region of the United States. The Company has been increasing its emphasis in the Appalachian region, primarily in the Marcellus Shale. Further discussion of oil and gas producing activities is
-22-
included in Item 8, Note M - Supplementary Information for Oil and Gas Producing Activities. Note M sets forth proved developed and undeveloped reserve information for Seneca. The September 30, 2017, 2016 and 2015 reserves shown in Note M are valued using an unweighted arithmetic average of the first day of the month oil and gas prices for each month within the twelve-month period prior to the end of the reporting period. The reserves were estimated by Seneca’s geologists and engineers and were audited by independent petroleum engineers from Netherland, Sewell & Associates, Inc. Note M discusses the qualifications of the Company's reservoir engineers, internal controls over the reserve estimation process and audit of the reserve estimates and changes in proved developed and undeveloped oil and natural gas reserves year over year.
Seneca’s proved developed and undeveloped natural gas reserves increased from 1,675 Bcf at September 30, 2016 to 1,973 Bcf at September 30, 2017. This increase is attributed to extensions and discoveries of 386 Bcf and upward revisions of previous estimates of 91 Bcf, partially offset by production of 157 Bcf and sales of minerals in place of 22 Bcf. Of the total upward gas revisions of 91 Bcf, 125 Bcf were a result of higher gas prices for Marcellus Shale, Utica Shale and other reservoirs, and 20 Bcf were a result of upward revisions due to performance improvements and lease operating expense reductions, partially offset by 54 Bcf of PUD locations that were removed. The sales of minerals in place were the result of Marcellus and Utica reserves that were sold in the Western Development Area (primarily in Forest, Elk, McKean and Cameron counties in Pennsylvania) in September 2017.
Seneca’s proved developed and undeveloped oil reserves increased from 29,009 Mbbl at September 30, 2016 to 30,207 Mbbl at September 30, 2017. The increase is attributed to extensions and discoveries of 674 Mbbl and upward revisions of previous estimates of 3,293 Mbbl, partially offset by production of 2,740 Mbbl, primarily occurring in the West Coast region, and sales of minerals in place of 29 Mbbl. Upward revisions of 3,293 Mbbl were a result of both higher oil prices of 1,623 Mbbl and upward revisions associated with performance improvements of 1,670 Mbbl. The sales of minerals in place were the result of aforementioned sales of reserves in the Western Development Area.
On a Bcfe basis, Seneca’s proved developed and undeveloped reserves increased from 1,849 Bcfe at September 30, 2016 to 2,154 Bcfe at September 30, 2017. Total revisions of previous estimates was an increase of 110 Bcfe, primarily a result of higher oil and gas prices.
Seneca’s proved developed and undeveloped natural gas reserves decreased from 2,142 Bcf at September 30, 2015 to 1,675 Bcf at September 30, 2016. Extensions and discoveries of 186 Bcf were exceeded by production of 144 Bcf, downward revisions of previous estimates of 248 Bcf, and sales of minerals in place of 261 Bcf. Of the total downward gas revisions of 248 Bcf, 204 Bcf were a result of lower gas prices for Marcellus Shale and Upper Devonian reservoirs, and 74 Bcf were a result of PUD locations that were removed for reasons other than lower gas prices, partially offset by 30 Bcf in upward revisions due to performance improvements and lease operating expense reductions. The sales of minerals in place were primarily the result of reserves that were sold to IOG CRV-Marcellus, LLC (IOG) as part of the joint development agreement coupled with the sale of the majority of Seneca’s Upper Devonian wells and associated reserves in Pennsylvania.
Seneca’s proved developed and undeveloped oil reserves decreased from 33,722 Mbbl at September 30, 2015 to 29,009 Mbbl at September 30, 2016. Extensions and discoveries of 530 Mbbl were exceeded by production of 2,923 Mbbl, primarily occurring in the West Coast region, downward revisions of previous estimates of 2,247 Mbbl, and sales of minerals in place of 73 Mbbl. Downward revisions of 2,247 Mbbl were primarily a result of lower oil prices of 3,900 Mbbl partially offset by upward revisions associated with performance improvements and lease operating expense reductions of 1,653 Mbbl. The sales of minerals in place were reserves related to the aforementioned sale of Upper Devonian Wells.
On a Bcfe basis, Seneca’s proved developed and undeveloped reserves decreased from 2,344 Bcfe at September 30, 2015 to 1,849 Bcfe at September 30, 2016. Total revisions of previous estimates was a decrease of 262 Bcfe, primarily a result of lower oil and gas prices.
At September 30, 2017, the Company’s Exploration and Production segment had delivery commitments of 2,187 Bcfe (mostly natural gas as commitments for crude oil were insignificant). The Company expects to meet those commitments through proved reserves, including the future development of reserves that are currently classified as proved undeveloped reserves and future exploration.
-23-
The following is a summary of certain oil and gas information taken from Seneca’s records. All monetary amounts are expressed in U.S. dollars.
Production
For The Year Ended September 30 | ||||||||||||||
2017 | 2016 | 2015 | ||||||||||||
United States | ||||||||||||||
Appalachian Region | ||||||||||||||
Average Sales Price per Mcf of Gas | $ | 2.52 | (1) | $ | 1.94 | (1) | $ | 2.48 | (1) | |||||
Average Sales Price per Barrel of Oil | $ | 48.27 | $ | 52.15 | $ | 57.44 | ||||||||
Average Sales Price per Mcf of Gas (after hedging) | $ | 2.93 | $ | 3.01 | $ | 3.35 | ||||||||
Average Sales Price per Barrel of Oil (after hedging) | $ | 48.27 | $ | 52.15 | $ | 57.44 | ||||||||
Average Production (Lifting) Cost per Mcf Equivalent of Gas and Oil Produced | $ | 0.71 | (1) | $ | 0.73 | (1) | $ | 0.81 | (1) | |||||
Average Production per Day (in MMcf Equivalent of Gas and Oil Produced) | 422 | (1) | 385 | (1) | 374 | (1) | ||||||||
West Coast Region | ||||||||||||||
Average Sales Price per Mcf of Gas | $ | 4.00 | $ | 3.25 | $ | 4.11 | ||||||||
Average Sales Price per Barrel of Oil | $ | 46.14 | $ | 35.26 | $ | 51.37 | ||||||||
Average Sales Price per Mcf of Gas (after hedging) | $ | 4.00 | $ | 3.25 | $ | 4.52 | ||||||||
Average Sales Price per Barrel of Oil (after hedging) | $ | 53.85 | $ | 57.97 | $ | 70.49 | ||||||||
Average Production (Lifting) Cost per Mcf Equivalent of Gas and Oil Produced | $ | 2.91 | $ | 2.47 | $ | 2.69 | ||||||||
Average Production per Day (in MMcf Equivalent of Gas and Oil Produced) | 53 | 56 | 58 | |||||||||||
Total Company | ||||||||||||||
Average Sales Price per Mcf of Gas | $ | 2.55 | $ | 1.97 | $ | 2.51 | ||||||||
Average Sales Price per Barrel of Oil | $ | 46.18 | $ | 35.42 | $ | 51.43 | ||||||||
Average Sales Price per Mcf of Gas (after hedging) | $ | 2.95 | $ | 3.02 | $ | 3.38 | ||||||||
Average Sales Price per Barrel of Oil (after hedging) | $ | 53.87 | $ | 57.91 | $ | 70.36 | ||||||||
Average Production (Lifting) Cost per Mcf Equivalent of Gas and Oil Produced | $ | 0.96 | $ | 0.96 | $ | 1.06 | ||||||||
Average Production per Day (in MMcf Equivalent of Gas and Oil Produced) | 475 | 441 | 432 | |||||||||||
(1) | The Marcellus Shale fields (which exceed 15% of total reserves at September 30, 2017, 2016 and 2015) contributed 399 MMcfe, 372 MMcfe and 357 MMcfe of daily production in 2017, 2016 and 2015, respectively. The average sales price (per Mcfe) was $2.52 ($2.93 after hedging) in 2017, $1.94 ($3.01 after hedging) in 2016 and $2.48 ($3.35 after hedging) in 2015. The average lifting costs (per Mcfe) were $0.71 in 2017, $0.72 in 2016 and $0.79 in 2015. |
-24-
Productive Wells
Appalachian Region | West Coast Region | Total Company | |||||||||||||||
At September 30, 2017 | Gas | Oil | Gas | Oil | Gas | Oil | |||||||||||
Productive Wells — Gross | 423 | — | — | 2,224 | 423 | 2,224 | |||||||||||
Productive Wells — Net | 328 | — | — | 2,173 | 328 | 2,173 | |||||||||||
Developed and Undeveloped Acreage
At September 30, 2017 | Appalachian Region | West Coast Region | Total Company | ||||||
Developed Acreage | |||||||||
— Gross | 541,528 | 23,269 | 564,797 | ||||||
— Net | 532,435 | 21,531 | 553,966 | ||||||
Undeveloped Acreage | |||||||||
— Gross | 356,080 | 4,518 | 360,598 | ||||||
— Net | 342,015 | 689 | 342,704 | ||||||
Total Developed and Undeveloped Acreage | |||||||||
— Gross | 897,608 | 27,787 | 925,395 | ||||||
— Net | 874,450 | (1 | ) | 22,220 | 896,670 | ||||
(1) | Of the 874,450 Total Developed and Undeveloped Net Acreage in the Appalachian region as of September 30, 2017, there are a total of 800,747 net acres in Pennsylvania. Of the 800,747 total net acres in Pennsylvania, shale development in the Marcellus, Utica or Geneseo shales has occurred on approximately 50,467 net acres, or only 6.3% of Seneca’s total net acres in Pennsylvania. The high amount of developed acreage in the table largely reflects development in the Upper Devonian geological formation and masks the potential for development beneath this formation, which includes the Marcellus, Utica and Geneseo shales. |
As of September 30, 2017, the aggregate amount of gross undeveloped acreage expiring in the next three years and thereafter are as follows: 1,160 acres in 2018 (580 net acres), 4,286 acres in 2019 (3,829 net acres), 1,447 acres in 2020 (1,447 net acres) and 40,428 acres thereafter (36,511 net acres). The remaining 313,277 gross acres (300,337 net acres) represent non-expiring oil and gas rights owned by the Company. Of the acreage that is currently scheduled to expire in 2018, 2019 and 2020, Seneca has no associated proved undeveloped gas reserves. As a part of its management approved development plan, Seneca generally commences development of these reserves prior to the expiration of the leases and/or proactively extends/renews these leases.
-25-
Drilling Activity
Productive | Dry | ||||||||||||||||
For the Year Ended September 30 | 2017 | 2016 | 2015 | 2017 | 2016 | 2015 | |||||||||||
United States | |||||||||||||||||
Appalachian Region | |||||||||||||||||
Net Wells Completed | |||||||||||||||||
— Exploratory | 9.000 | 1.000 | 3.000 | — | — | — | |||||||||||
— Development | 25.400 | 31.800 | 49.000 | 3.000 | 1.000 | 2.000 | |||||||||||
West Coast Region | |||||||||||||||||
Net Wells Completed | |||||||||||||||||
— Exploratory | — | — | — | — | — | — | |||||||||||
— Development | 14.000 | 25.000 | 45.000 | — | — | 1.000 | |||||||||||
Total Company | |||||||||||||||||
Net Wells Completed | |||||||||||||||||
— Exploratory | 9.000 | 1.000 | 3.000 | — | — | — | |||||||||||
— Development | 39.400 | 56.800 | 94.000 | 3.000 | 1.000 | 3.000 | |||||||||||
Present Activities
At September 30, 2017 | Appalachian Region | West Coast Region | Total Company | |||||
Wells in Process of Drilling(1) | ||||||||
— Gross | 84.000 | — | 84.000 | |||||
— Net | 69.500 | — | 69.500 | |||||
(1) | Includes wells awaiting completion. |
Item 3 | Legal Proceedings |
On September 13, 2017, the PaDEP sent a draft Consent Assessment of Civil Penalty (CACP) to Seneca, in relation to an alleged violation of the Pennsylvania Oil and Gas Act, as well as PaDEP rules and regulations regarding gas migration relating to Seneca’s drilling activities. The amount of the penalty sought by the PaDEP is not material to the Company. The draft CACP alleges a violation identified by the PaDEP in 2011. Seneca disputes the alleged violation and will vigorously defend its position in negotiations with the PaDEP.
For a discussion of various environmental and other matters, refer to Part II, Item 7, MD&A and Item 8 at Note I — Commitments and Contingencies.
For a discussion of certain rate matters involving the NYPSC, refer to Part II, Item 7, MD&A of this report under the heading "Other Matters - Rate and Regulatory Matters."
Item 4 | Mine Safety Disclosures |
Not Applicable.
-26-
PART II
Item 5 | Market for the Registrant’s Common Equity, Related Stockholder Matters and Issuer Purchases of Equity Securities |
Information regarding the market for the Company’s common equity and related stockholder matters appears under Item 12 at Security Ownership of Certain Beneficial Owners and Management and Related Stockholder Matters, Item 8 at Note E — Capitalization and Short-Term Borrowings, and at Note L — Market for Common Stock and Related Shareholder Matters (unaudited).
On July 3, 2017, the Company issued a total of 7,011 unregistered shares of Company common stock to the nine non-employee directors of the Company then serving on the Board of Directors of the Company, 779 shares to each such director. All of these unregistered shares were issued under the Company’s 2009 Non-Employee Director Equity Compensation Plan as partial consideration for such directors’ services during the quarter ended September 30, 2017. These transactions were exempt from registration under Section 4(a)(2) of the Securities Act of 1933, as transactions not involving a public offering.
Issuer Purchases of Equity Securities
Period | Total Number of Shares Purchased(a) | Average Price Paid per Share | Total Number of Shares Purchased as Part of Publicly Announced Share Repurchase Plans or Programs | Maximum Number of Shares that May Yet Be Purchased Under Share Repurchase Plans or Programs(b) | ||||||||
July 1-31, 2017 | — | N/A | — | 6,971,019 | ||||||||
Aug. 1-31, 2017 | 469 | $ | 58.65 | — | 6,971,019 | |||||||
Sept. 1-30, 2017 | 5,310 | $ | 58.72 | — | 6,971,019 | |||||||
Total | 5,779 | $ | 58.71 | — | 6,971,019 | |||||||
(a) | Represents shares of common stock of the Company tendered to the Company by holders of stock options, SARs, restricted stock units or shares of restricted stock for the payment of option exercise prices or applicable withholding taxes. During the quarter ended September 30, 2017, the Company did not purchase any shares of its common stock pursuant to its publicly announced share repurchase program. |
(b) | In September 2008, the Company’s Board of Directors authorized the repurchase of eight million shares of the Company’s common stock. The repurchase program has no expiration date. The Company has not repurchased any shares since September 17, 2008 and has no plans to make further purchases in the near future. |
-27-
Performance Graph
The following graph compares the Company’s common stock performance with the performance of the S&P 500 Index, the PHLX Utility Sector Index and the S&P 500 Oil & Gas Exploration & Production SUB Industry Index GICS Level 4 for the period September 30, 2012 through September 30, 2017. The graph assumes that the value of the investment in the Company’s common stock and in each index was $100 on September 30, 2012 and that all dividends were reinvested.
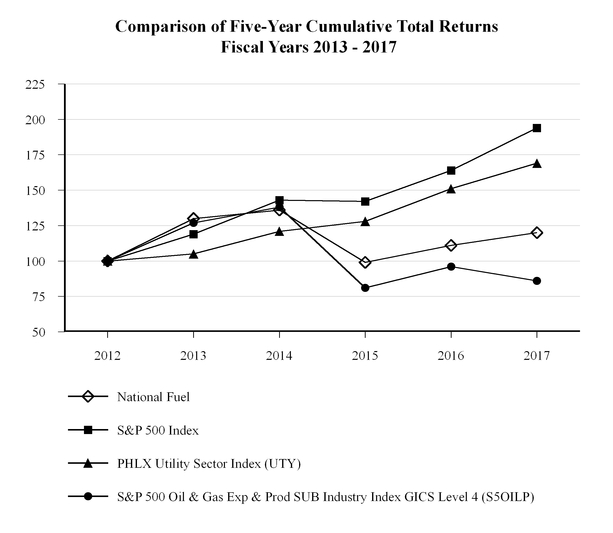
2012 | 2013 | 2014 | 2015 | 2016 | 2017 | |
National Fuel | $100 | $130 | $136 | $99 | $111 | $120 |
S&P 500 Index | $100 | $119 | $143 | $142 | $164 | $194 |
PHLX Utility Sector Index (UTY) | $100 | $105 | $121 | $128 | $151 | $169 |
S&P 500 Oil & Gas Exp & Prod SUB Industry Index GICS Level 4 (S5OILP) | $100 | $127 | $138 | $81 | $96 | $86 |
Source: Bloomberg
The performance graph above is furnished and not filed for purposes of Section 18 of the Securities Exchange Act of 1934 and will not be incorporated by reference into any registration statement filed under the Securities Act of 1933 unless specifically identified therein as being incorporated therein by reference. The performance graph is not soliciting material subject to Regulation 14A.
-28-
Item 6 | Selected Financial Data |
Year Ended September 30 | |||||||||||||||||||
2017 | 2016 | 2015 | 2014 | 2013 | |||||||||||||||
(Thousands, except per share amounts and number of registered shareholders) | |||||||||||||||||||
Summary of Operations | |||||||||||||||||||
Operating Revenues: | |||||||||||||||||||
Utility and Energy Marketing Revenues | $ | 755,485 | $ | 624,602 | $ | 860,618 | $ | 1,103,149 | $ | 942,309 | |||||||||
Exploration and Production and Other Revenues | 617,666 | 611,766 | 696,709 | 808,595 | 707,734 | ||||||||||||||
Pipeline and Storage and Gathering Revenues | 206,730 | 216,048 | 203,586 | 201,337 | 179,508 | ||||||||||||||
1,579,881 | 1,452,416 | 1,760,913 | 2,113,081 | 1,829,551 | |||||||||||||||
Operating Expenses: | |||||||||||||||||||
Purchased Gas | 275,254 | 147,982 | 349,984 | 605,838 | 460,432 | ||||||||||||||
Operation and Maintenance: | |||||||||||||||||||
Utility and Energy Marketing | 199,293 | 192,512 | 203,249 | 196,534 | 180,997 | ||||||||||||||
Exploration and Production and Other | 145,099 | 160,201 | 184,024 | 188,622 | 175,014 | ||||||||||||||
Pipeline and Storage and Gathering | 98,200 | 88,801 | 82,730 | 77,922 | 86,079 | ||||||||||||||
Property, Franchise and Other Taxes | 84,995 | 81,714 | 89,564 | 90,711 | 82,431 | ||||||||||||||
Depreciation, Depletion and Amortization | 224,195 | 249,417 | 336,158 | 383,781 | 326,760 | ||||||||||||||
Impairment of Oil and Gas Producing Properties | — | 948,307 | 1,126,257 | — | — | ||||||||||||||
1,027,036 | 1,868,934 | 2,371,966 | 1,543,408 | 1,311,713 | |||||||||||||||
Operating Income (Loss) | 552,845 | (416,518 | ) | (611,053 | ) | 569,673 | 517,838 | ||||||||||||
Other Income (Expense): | |||||||||||||||||||
Other Income | 4,113 | 9,820 | 8,039 | 9,461 | 4,697 | ||||||||||||||
Interest Income | 7,043 | 4,235 | 3,922 | 4,170 | 4,335 | ||||||||||||||
Interest Expense on Long-Term Debt | (116,471 | ) | (117,347 | ) | (95,916 | ) | (90,194 | ) | (90,273 | ) | |||||||||
Other Interest Expense | (3,366 | ) | (3,697 | ) | (3,555 | ) | (4,083 | ) | (3,838 | ) | |||||||||
Income (Loss) Before Income Taxes | 444,164 | (523,507 | ) | (698,563 | ) | 489,027 | 432,759 | ||||||||||||
Income Tax Expense (Benefit) | 160,682 | (232,549 | ) | (319,136 | ) | 189,614 | 172,758 | ||||||||||||
Net Income (Loss) Available for Common Stock | $ | 283,482 | $ | (290,958 | ) | $ | (379,427 | ) | $ | 299,413 | $ | 260,001 | |||||||
Per Common Share Data | |||||||||||||||||||
Basic Earnings (Loss) per Common Share | $ | 3.32 | $ | (3.43 | ) | $ | (4.50 | ) | $ | 3.57 | $ | 3.11 | |||||||
Diluted Earnings (Loss) per Common Share | $ | 3.30 | $ | (3.43 | ) | $ | (4.50 | ) | $ | 3.52 | $ | 3.08 | |||||||
Dividends Declared | $ | 1.64 | $ | 1.60 | $ | 1.56 | $ | 1.52 | $ | 1.48 | |||||||||
Dividends Paid | $ | 1.63 | $ | 1.59 | $ | 1.55 | $ | 1.51 | $ | 1.47 | |||||||||
Dividend Rate at Year-End | $ | 1.66 | $ | 1.62 | $ | 1.58 | $ | 1.54 | $ | 1.50 | |||||||||
At September 30: | |||||||||||||||||||
Number of Registered Shareholders | 11,211 | 11,751 | 12,147 | 12,654 | 13,215 | ||||||||||||||
-29-
Year Ended September 30 | |||||||||||||||||||
2017 | 2016 | 2015 | 2014 | 2013 | |||||||||||||||
(Thousands, except per share amounts and number of registered shareholders) | |||||||||||||||||||
Net Property, Plant and Equipment | |||||||||||||||||||
Exploration and Production | $ | 1,196,521 | $ | 1,083,804 | $ | 2,126,265 | $ | 2,897,744 | $ | 2,600,448 | |||||||||
Pipeline and Storage | 1,524,197 | 1,463,541 | 1,387,516 | 1,187,924 | 1,074,079 | ||||||||||||||
Gathering | 455,701 | 439,660 | 400,409 | 292,793 | 161,111 | ||||||||||||||
Utility | 1,435,414 | 1,403,286 | 1,351,504 | 1,297,179 | 1,246,943 | ||||||||||||||
Energy Marketing | 1,503 | 1,745 | 1,989 | 2,070 | 2,002 | ||||||||||||||
All Other | 57,960 | 59,054 | 60,404 | 61,236 | 62,554 | ||||||||||||||
Corporate | 2,778 | 3,392 | 3,808 | 4,145 | 4,589 | ||||||||||||||
Total Net Plant | $ | 4,674,074 | $ | 4,454,482 | $ | 5,331,895 | $ | 5,743,091 | $ | 5,151,726 | |||||||||
Total Assets | $ | 6,103,320 | $ | 5,636,387 | $ | 6,564,939 | $ | 6,687,717 | $ | 6,125,618 | |||||||||
Capitalization | |||||||||||||||||||
Comprehensive Shareholders’ Equity | $ | 1,703,735 | $ | 1,527,004 | $ | 2,025,440 | $ | 2,410,683 | $ | 2,194,729 | |||||||||
Long-Term Debt, Net of Current Portion and Unamortized Discount and Debt Issuance Costs | 2,083,681 | 2,086,252 | 2,084,009 | 1,637,443 | 1,635,630 | ||||||||||||||
Total Capitalization | $ | 3,787,416 | $ | 3,613,256 | $ | 4,109,449 | $ | 4,048,126 | $ | 3,830,359 | |||||||||
Item 7 | Management’s Discussion and Analysis of Financial Condition and Results of Operations |
OVERVIEW
The Company is a diversified energy company engaged principally in the production, gathering, transportation, distribution and marketing of natural gas. The Company operates an integrated business, with assets centered in western New York and Pennsylvania, being utilized for, and benefiting from, the production and transportation of natural gas from the Appalachian basin. Current development activities are focused primarily in the Marcellus and Utica Shale. The common geographic footprint of the Company’s subsidiaries enables them to share management, labor, facilities and support services across various businesses and pursue coordinated projects designed to produce and transport natural gas from the Appalachian basin to markets in Canada and the eastern United States. The Company's efforts in this regard are not limited to affiliated projects. The Company has also been designing and building pipeline projects for the transportation of natural gas for non-affiliated natural gas producers in the Appalachian basin. The Company also develops and produces oil reserves, primarily in California. The Company reports financial results for five business segments. Refer to Item 1, Business, for a more detailed description of each of the segments.
Corporate Responsibility
The Board of Directors and management recognize that the long-term interests of stockholders are served by considering the interests of customers, employees and the communities in which the Company operates. In addition, the Company strives to comply with all applicable legal and regulatory requirements and to adhere to high standards of ethics and integrity. The Board retains oversight of environmental, social and corporate governance concerns and any related health and safety issues that might arise from the Company’s operations. The Board directs management to integrate these corporate responsibility concerns into decision-making throughout the organization. The Company takes very seriously its role as a corporate citizen and remains committed to the welfare of the areas in which it operates, as it has for over 100 years.
The Company recognizes the ongoing debate regarding climate change, including questions surrounding potential physical, technological, regulatory and social risks as well as corresponding opportunities. The Board and management consider these risks and opportunities in their strategic and capital spending decision process.
-30-
Further, since the Company operates an integrated business with assets being utilized for, and benefiting from, the production and transportation of natural gas, the Board and management consider the impact of the climate change debate on future natural gas usage.
The U.S. Energy Information Administration (EIA) provides relevant data and projections in this regard. The EIA’s 2017 International Energy Outlook projects that worldwide natural gas consumption will increase 43% from 2015 through 2040. Natural gas is a versatile fuel and this increase is projected to transcend all sectors, with the largest increases seen in the industrial and electric generation sectors. The EIA’s 2017 Annual Energy Outlook further projects that, through 2040, U.S. natural gas consumption will increase more than any other fuel source. The EIA anticipates that shale gas production could potentially account for 70% of U.S. natural gas production in 2040 as companies leverage technological advances in horizontal drilling and hydraulic fracturing to develop previously uneconomic or unreachable reserves. The Board considers such projections in setting and reviewing the Company’s capital budget.
The Company believes that its conservative approach to capital investments combined with its history, experience, assets, and fully-integrated approach put it in a position for success in the current and evolving regulatory landscape. As recognized by the EIA, natural gas is a relatively clean fossil fuel compared to other fossil fuels such as oil or coal with respect to greenhouse gas emissions. The New York State Energy Research and Development Authority, in its 2016 New York State Greenhouse Gas Inventory Report, noted that from 1990 to 2014, “emissions from electricity generated in-State dropped 52 percent during this same period, acting as a major driver of the State’s decreasing GHG emissions. This drop is largely due to the significant decrease in the burning of coal and petroleum products in the electricity generation sector. Emissions from residential, commercial and industrial buildings also decreased, showing a reduction of approximately 15 percent from 1990-2014. This reduction in emissions was primarily the result of a decrease in the use of coal and petroleum and an increase in the use of natural gas.”
The Company recognizes that there exists an evolving landscape of international accords and federal, state and local laws and regulations regarding greenhouse gas emissions or climate change initiatives. Changing market conditions and new regulatory requirements, as well as the unanticipated or inconsistent application of existing laws and regulations by administrative agencies, make it difficult to predict a long-term business impact across twenty or more years. The Company adjusts its capital investment approach to regulatory change. For instance, given what appears to be the imposition of unattainable regulatory standards by the current executive administration of one of the states in which the Company does business, the Company is shifting its investment focus away from that state with respect to new pipeline expansion projects.
While natural gas has relatively lower greenhouse gas emissions than other fossil fuels, the natural gas value chain does result in greenhouse gas emissions. The Company recognizes the important role of ongoing system modernization and efficiency in reducing greenhouse gas emissions. In its Utility, the Company directs capital spending to replacement and to other investments (such as the purchase of vehicles and equipment necessary for that activity) that support its statutory obligation to provide safe and reliable service. In its Pipeline and Storage businesses, a significant portion of the capital budget is spent on modernization. The Company’s replacement of aging natural gas infrastructure leads to fewer leaks and directly results in lower greenhouse gas emissions. For instance, as a result of system modernization, the Utility segment, since 2012, has seen a 13.5% reduction in greenhouse gas emissions reported to the EPA under Subpart W of 40 CFR Part 98. The Company also works with various regulatory commissions to develop ratemaking initiatives to increase end use efficiency while reducing downside risk from demand fluctuation. In its Exploration and Production segment, the Company has implemented a number of initiatives and standardized a variety of practices throughout the drilling process that are aimed at minimizing greenhouse gas emissions and improving air quality, including green completion techniques and deploying leak detection technologies.
-31-
Fiscal 2017 Highlights
This Item 7, MD&A, provides information concerning:
1. | The critical accounting estimates of the Company; |
2. | Changes in revenues and earnings of the Company under the heading, “Results of Operations;” |
3. | Operating, investing and financing cash flows under the heading “Capital Resources and Liquidity;” |
4. | Off-Balance Sheet Arrangements; |
5. | Contractual Obligations; and |
6. | Other Matters, including: (a) 2017 and projected 2018 funding for the Company’s pension and other post-retirement benefits; (b) disclosures and tables concerning market risk sensitive instruments; (c) rate and regulatory matters in the Company’s New York, Pennsylvania and FERC-regulated jurisdictions; (d) environmental matters; and (e) new authoritative accounting and financial reporting guidance. |
The information in MD&A should be read in conjunction with the Company’s financial statements in Item 8 of this report.
For the year ended September 30, 2017 compared to the year ended September 30, 2016, the Company experienced an increase in earnings of $574.5 million primarily due to higher earnings in the Exploration and Production segment. During the year ended September 30, 2016, the Company recorded impairment charges of $948.3 million ($550.0 million after-tax) that did not recur during the year ended September 30, 2017. In the Company's Exploration and Production segment, oil and gas property acquisition, exploration and development costs are capitalized under the full cost method of accounting. Such costs are subject to a quarterly ceiling test prescribed by SEC Regulation S-X Rule 4-10 that determines a limit, or ceiling, on the amount of property acquisition, exploration and development costs that can be capitalized. The book value of the Company's oil and gas properties exceeded the ceiling at the end of each of the four quarters of fiscal 2016 due to significant declines in crude oil and natural gas commodity prices over the previous twelve months, resulting in the impairment charges mentioned above during fiscal 2016. For further discussion of the ceiling test and a sensitivity analysis concerning changes in crude oil and natural gas commodity prices and their impact on the ceiling test, refer to the Critical Accounting Estimates section below. For further discussion of the Company’s earnings, refer to the Results of Operations section below.
On February 3, 2017, the Company, in its Pipeline and Storage segment, received FERC approval of a project to move significant prospective Marcellus production from Seneca’s Western Development Area at Clermont to an Empire interconnection with TransCanada Pipeline at Chippawa and an interconnection with Tennessee Gas Pipeline’s 200 Line in East Aurora, New York (“Northern Access 2016”). On April 7, 2017, the NYDEC issued a Notice of Denial of the federal Clean Water Act Section 401 Water Quality Certification and other state stream and wetland permits for the New York portion of the project (the Water Quality Certification for the Pennsylvania portion of the project was received on January 27, 2017). The Company remains committed to the project. On April 21, 2017, the Company appealed the NYDEC's decision with regard to the Water Quality Certification to the United States Court of Appeals for the Second Circuit, and on May 11, 2017, the Company commenced legal action in New York State Supreme Court challenging the NYDEC's actions with regard to various state permits. The Company also has pending with FERC a proceeding asserting, among other things, that the NYDEC exceeded the reasonable time frame to take action under the Clean Water Act and, therefore, waived its opportunity to approve or deny the Water Quality Certification. Approximately $75.8 million in costs have been incurred on this project through September 30, 2017, with the costs residing either in Construction Work in Progress, a component of Property, Plant and Equipment on the Consolidated Balance Sheet, or Deferred Charges. For further discussion of the Northern Access 2016 project, refer to Item 8 at Note I - Commitments and Contingencies.
Seneca has two downstream Canadian transportation contracts to move incremental volumes associated with the Northern Access 2016 project. One of the contracts has a term expiring on March 31, 2023 with a remaining commitment of approximately $27.0 million (using a 1.2468 Exchange Rate). The other transportation precedent
-32-
agreement was suspended until the Northern Access 2016 project has received all its necessary permits. Seneca paid $2.4 million associated with this suspension during the quarter ended September 30, 2017 and will be reimbursed this amount if the project is reinstated. As noted above, the Company remains committed to the Northern Access 2016 project. Seneca has mitigated a portion of the current capacity costs through capacity release arrangements.
From a financing perspective, in September 2017, the Company issued $300.0 million of 3.95% notes due in September 2027. The proceeds of the debt issuance were used for the October 2017 redemption of $300.0 million of the Company's 6.50% notes that were scheduled to mature in April 2018. The Company expects to use cash on hand and cash from operations to meet its capital expenditure needs for fiscal 2018 and may issue short-term and/or long-term debt during fiscal 2018 as needed.
CRITICAL ACCOUNTING ESTIMATES
The Company has prepared its consolidated financial statements in conformity with GAAP. The preparation of these financial statements requires management to make estimates and assumptions that affect the reported amounts of assets and liabilities and disclosure of contingent assets and liabilities at the date of the financial statements and the reported amounts of revenues and expenses during the reporting period. Actual results could differ from those estimates. In the event estimates or assumptions prove to be different from actual results, adjustments are made in subsequent periods to reflect more current information. The following is a summary of the Company’s most critical accounting estimates, which are defined as those estimates whereby judgments or uncertainties could affect the application of accounting policies and materially different amounts could be reported under different conditions or using different assumptions. For a complete discussion of the Company’s significant accounting policies, refer to Item 8 at Note A — Summary of Significant Accounting Policies.
Oil and Gas Exploration and Development Costs. In the Company’s Exploration and Production segment, oil and gas property acquisition, exploration and development costs are capitalized under the full cost method of accounting. Under this accounting methodology, all costs associated with property acquisition, exploration and development activities are capitalized, including internal costs directly identified with acquisition, exploration and development activities. The internal costs that are capitalized do not include any costs related to production, general corporate overhead, or similar activities. The Company does not recognize any gain or loss on the sale or other disposition of oil and gas properties unless the gain or loss would significantly alter the relationship between capitalized costs and proved reserves of oil and gas attributable to a cost center.
Proved reserves are estimated quantities of reserves that, based on geologic and engineering data, appear with reasonable certainty to be producible under existing economic and operating conditions. Such estimates of proved reserves are inherently imprecise and may be subject to substantial revisions as a result of numerous factors including, but not limited to, additional development activity, evolving production history and continual reassessment of the viability of production under varying economic conditions. The estimates involved in determining proved reserves are critical accounting estimates because they serve as the basis over which capitalized costs are depleted under the full cost method of accounting (on a units-of-production basis). Unproved properties are excluded from the depletion calculation until proved reserves are found or it is determined that the unproved properties are impaired. All costs related to unproved properties are reviewed quarterly to determine if impairment has occurred. The amount of any impairment is transferred to the pool of capitalized costs being amortized.
In addition to depletion under the units-of-production method, proved reserves are a major component in the SEC full cost ceiling test. The full cost ceiling test is an impairment test prescribed by SEC Regulation S-X Rule 4-10. The ceiling test, which is performed each quarter, determines a limit, or ceiling, on the amount of property acquisition, exploration and development costs that can be capitalized. The ceiling under this test represents (a) the present value of estimated future net cash flows, excluding future cash outflows associated with settling asset retirement obligations that have been accrued on the balance sheet, using a discount factor of 10%, which is computed by applying an unweighted arithmetic average of the first day of the month oil and gas prices for each month within the twelve-month period prior to the end of the reporting period (as adjusted for hedging) to estimated future production of proved oil and gas reserves as of the date of the latest balance sheet, less estimated future expenditures, plus (b) the cost of unevaluated properties not being depleted, less (c) income tax effects related to the differences between the book and tax basis of the properties. The estimates of future production and future
-33-
expenditures are based on internal budgets that reflect planned production from current wells and expenditures necessary to sustain such future production. The amount of the ceiling can fluctuate significantly from period to period because of additions to or subtractions from proved reserves and significant fluctuations in oil and gas prices. The ceiling is then compared to the capitalized cost of oil and gas properties less accumulated depletion and related deferred income taxes. If the capitalized costs of oil and gas properties less accumulated depletion and related deferred taxes exceeds the ceiling at the end of any fiscal quarter, a non-cash impairment charge must be recorded to write down the book value of the reserves to their present value. This non-cash impairment cannot be reversed at a later date if the ceiling increases. It should also be noted that a non-cash impairment to write down the book value of the reserves to their present value in any given period causes a reduction in future depletion expense. At September 30, 2017, the ceiling exceeded the book value of the oil and gas properties by approximately $286.4 million. The 12-month average of the first day of the month price for crude oil for each month during 2017, based on posted Midway Sunset prices, was $45.19 per Bbl. The 12-month average of the first day of the month price for natural gas for each month during 2017, based on the quoted Henry Hub spot price for natural gas, was $3.00 per MMBtu. (Note — because actual pricing of the Company’s various producing properties varies depending on their location and hedging, the prices used to calculate the ceiling may differ from the Midway Sunset and Henry Hub prices, which are only indicative of the 12-month average prices for 2017. Pricing differences would include adjustments for regional market differentials, transportation fees and contractual arrangements.) The following table illustrates the sensitivity of the ceiling test calculation to commodity price changes, specifically showing the amounts the ceiling would have exceeded the book value of the Company's oil and gas properties at September 30, 2017 (which would not have resulted in an impairment charge) if natural gas prices were $0.25 per MMBtu lower than the average prices used at September 30, 2017, if crude oil prices were $5 per Bbl lower than the average prices used at September 30, 2017, and if both natural gas prices and crude oil prices were $0.25 per MMBtu and $5 per Bbl lower than the average prices used at September 30, 2017 (all amounts are presented after-tax). These calculated amounts are based solely on price changes and do not take into account any other changes to the ceiling test calculation, including, among others, changes in reserve quantities and future cost estimates.
Ceiling Testing Sensitivity to Commodity Price Changes
(Millions) | $0.25/MMBtu Decrease in Natural Gas Prices | $5.00/Bbl Decrease in Crude Oil Prices | $0.25/MMBtu Decrease in Natural Gas Prices and $5.00/Bbl Decrease in Crude Oil Prices | ||||||||
Excess of Ceiling over Book Value under Sensitivity Analysis | $ | 157.2 | $ | 250.8 | $ | 121.7 | |||||
It is difficult to predict what factors could lead to future impairments under the SEC’s full cost ceiling test. As discussed above, fluctuations in or subtractions from proved reserves, increases in development costs for undeveloped reserves and significant fluctuations in oil and gas prices have an impact on the amount of the ceiling at any point in time.
In accordance with the current authoritative guidance for asset retirement obligations, the Company records an asset retirement obligation for plugging and abandonment costs associated with the Exploration and Production segment’s crude oil and natural gas wells and capitalizes such costs in property, plant and equipment (i.e. the full cost pool). Under the current authoritative guidance for asset retirement obligations, since plugging and abandonment costs are already included in the full cost pool, the units-of-production depletion calculation excludes from the depletion base any estimate of future plugging and abandonment costs that are already recorded in the full cost pool.
As discussed above, the full cost method of accounting provides a ceiling to the amount of costs that can be capitalized in the full cost pool. In accordance with current authoritative guidance, the future cash outflows associated with plugging and abandoning wells are excluded from the computation of the present value of estimated future net revenues for purposes of the full cost ceiling calculation.
-34-
Regulation. The Company is subject to regulation by certain state and federal authorities. The Company, in its Utility and Pipeline and Storage segments, has accounting policies which conform to the FASB authoritative guidance regarding accounting for certain types of regulations, and which are in accordance with the accounting requirements and ratemaking practices of the regulatory authorities. The application of these accounting principles for certain types of rate-regulated activities provide that certain actual or anticipated costs that would otherwise be charged to expense can be deferred as regulatory assets, based on the expected recovery from customers in future rates. Likewise, certain actual or anticipated credits that would otherwise reduce expense can be deferred as regulatory liabilities, based on the expected flowback to customers in future rates. Management’s assessment of the probability of recovery or pass through of regulatory assets and liabilities requires judgment and interpretation of laws and regulatory commission orders. If, for any reason, the Company ceases to meet the criteria for application of regulatory accounting treatment for all or part of its operations, the regulatory assets and liabilities related to those portions ceasing to meet such criteria would be eliminated from the balance sheet and included in the income statement for the period in which the discontinuance of regulatory accounting treatment occurs. Such amounts would be classified as an extraordinary item. For further discussion of the Company’s regulatory assets and liabilities, refer to Item 8 at Note C — Regulatory Matters.
Accounting for Derivative Financial Instruments. The Company uses a variety of derivative financial instruments to manage a portion of the market risk associated with fluctuations in the price of natural gas and crude oil in its Exploration and Production and Energy Marketing segments. These instruments are categorized as price swap agreements and futures contracts. In accordance with the authoritative guidance for derivative instruments and hedging activities, the Company primarily accounts for these instruments as effective cash flow hedges or fair value hedges. In addition, the Company also enters into foreign exchange forward contracts to manage the risk of currency fluctuations associated with transportation costs denominated in Canadian currency in the Exploration and Production segment. These instruments are accounted for as cash flow hedges. Gains or losses associated with the derivative financial instruments that are accounted for as cash flow or fair value hedges are matched with gains or losses resulting from the underlying physical transaction that is being hedged. To the extent that such derivative financial instruments would ever be deemed to be ineffective based on effectiveness testing, mark-to-market gains or losses from such derivative financial instruments would be recognized in the income statement without regard to an underlying physical transaction. Refer to the “Market Risk Sensitive Instruments” section below for further discussion of the Company’s derivative financial instruments and refer to Item 8 at Note F— Fair Value Measurements for discussion of the determination of fair value for derivative financial instruments.
Pension and Other Post-Retirement Benefits. The amounts reported in the Company’s financial statements related to its pension and other post-retirement benefits are determined on an actuarial basis, which uses many assumptions in the calculation of such amounts. These assumptions include the discount rate, the expected return on plan assets, the rate of compensation increase and, for other post-retirement benefits, the expected annual rate of increase in per capita cost of covered medical and prescription benefits. Beginning in fiscal 2018, the Company refined the method used to determine the service and interest cost components of net periodic benefit cost. Using the refined method, known as the spot rate approach, the Company will use individual spot rates along the yield curve that correspond to the timing of each benefit payment to determine the discount rate. The individual spot rates along the yield curve will continue to be determined by an above mean methodology in that the coupon interest rates that are in the lower 50th percentile will be excluded based on the assumption that the Company would not utilize more expensive (i.e. lower yield) instruments to settle its liabilities. The impact on the benefit obligation, as of September 30, 2017, is immaterial. This change will provide a more precise measurement of service and interest costs by improving the correlation between projected cash outflows and corresponding spot rates on the yield curve. Compared to the previous method, the spot rate approach will decrease the service and interest components of net periodic benefit costs in fiscal 2018. The Company will account for this change prospectively as a change in accounting estimate. The expected return on plan assets assumption used by the Company reflects the anticipated long-term rate of return on the plan’s current and future assets. The Company utilizes historical investment data, projected capital market conditions, and the plan’s target asset class and investment manager allocations to set the assumption regarding the expected return on plan assets. Changes in actuarial assumptions and actuarial experience, including deviations between actual versus expected return on plan assets, could have a material impact on the amount of pension and post-retirement benefit costs and funding requirements experienced by the Company. However, the Company expects to recover a substantial portion of its net periodic pension and
-35-
other post-retirement benefit costs attributable to employees in its Utility and Pipeline and Storage segments in accordance with the applicable regulatory commission authorization, subject to applicable accounting requirements for rate-regulated activities, as discussed above under “Regulation.”
Changes in actuarial assumptions and actuarial experience could also have an impact on the benefit obligation and the funded status related to the Company’s pension and other post-retirement benefits and could impact the Company’s equity. For example, the discount rate used to determine benefit obligations of the Company's other post-retirement benefits changed from 3.70% in 2016 to 3.81% in 2017. The change in the discount rate from 2016 to 2017 decreased the accumulated post-retirement benefit obligation by $6.2 million. The discount rate used to determine benefit obligations of the Retirement Plan changed from 3.60% in 2016 to 3.77% in 2017. The change in the discount rate from 2016 to 2017 decreased the Retirement Plan projected benefit obligation by $20.5 million. Other examples include actual versus expected return on plan assets, which has an impact on the funded status of the plans, and actual versus expected benefit payments, which has an impact on the pension plan projected benefit obligation and the accumulated post-retirement benefit obligation. For 2017, the actual return on plan assets was higher than the expected return, which resulted in an increase to the funded status of the Retirement Plan ($24.6 million) as well as an increase to the funded status of the VEBA trusts and 401(h) accounts ($8.7 million). The actual versus expected benefit payments for 2017 caused a decrease of $2.1 million to the accumulated post-retirement benefit obligation. In addition, changes in per-capita claim costs, premiums, retiree contributions and retiree drug subsidy assumptions in order to better reflect anticipated experience based on actual experience resulted in a decrease to the accumulated post-retirement benefit obligation of $48.4 million. In calculating the projected benefit obligation for the Retirement Plan and the accumulated post-retirement obligation, the actuary takes into account the average remaining service life of active participants. The average remaining service life of active participants is 7 years for the Retirement Plan and 6 years for those eligible for other post-retirement benefits. For further discussion of the Company’s pension and other post-retirement benefits, refer to Other Matters in this Item 7, which includes a discussion of funding for the current year, and to Item 8 at Note H — Retirement Plan and Other Post Retirement Benefits.
RESULTS OF OPERATIONS
EARNINGS
2017 Compared with 2016
The Company's earnings were $283.5 million in 2017 compared to a loss of $291.0 million in 2016. The increase in earnings of $574.5 million was primarily a result of higher earnings in the Exploration and Production segment and Gathering segment. Lower earnings in the Pipeline and Storage segment, Utility segment and Energy Marketing segment, as well as losses in the Corporate and All Other categories, partially offset these increases. In the discussion that follows, all amounts used in the earnings discussions are after-tax amounts, unless otherwise noted. Earnings were impacted by the following events in 2016:
2016 Events
• | Non-cash impairment charges of $948.3 million ($550.0 million after tax) recorded during 2016 for the Exploration and Production segment’s oil and gas producing properties. |
• | Joint development agreement professional fees of $4.6 million recorded in the Exploration and Production segment. The joint development agreement professional fees incurred were related to professional services associated with the Marcellus Shale drilling joint development agreement with IOG executed on December 1, 2015 and subsequently extended on June 13, 2016. |
2016 Compared with 2015
The Company recorded a loss of $291.0 million in 2016 compared with a loss of $379.4 million in 2015. The reduction in loss was primarily the result of lower losses in the Exploration and Production segment and the Corporate category. The Utility segment, Pipeline and Storage segment, Energy Marketing segment and Gathering segment experienced a decline in earnings, offset by higher earnings in the All Other category. Earnings were impacted by the 2016 events discussed above and the following events in 2015:
-36-
2015 Events
• | Non-cash impairment charges of $1.1 billion ($650.2 million after tax) recorded during 2015 for the Exploration and Production segment’s oil and gas producing properties. |
• | A $4.7 million reversal of stock-based compensation expense related to performance based restricted stock units since performance conditions, which do not include any market conditions, were not met. The $4.7 million was allocated across the Exploration and Production segment, Pipeline and Storage segment, Utility segment and the All Other and Corporate category. |
Earnings (Loss) by Segment
Year Ended September 30 | |||||||||||
2017 | 2016 | 2015 | |||||||||
(Thousands) | |||||||||||
Exploration and Production | $ | 129,326 | $ | (452,842 | ) | $ | (556,974 | ) | |||
Pipeline and Storage | 68,446 | 76,610 | 80,354 | ||||||||
Gathering | 40,377 | 30,499 | 31,849 | ||||||||
Utility | 46,935 | 50,960 | 63,271 | ||||||||
Energy Marketing | 1,509 | 4,348 | 7,766 | ||||||||
Total Reported Segments | 286,593 | (290,425 | ) | (373,734 | ) | ||||||
All Other | (342 | ) | 778 | (2 | ) | ||||||
Corporate | (2,769 | ) | (1,311 | ) | (5,691 | ) | |||||
Total Consolidated | $ | 283,482 | $ | (290,958 | ) | $ | (379,427 | ) | |||
EXPLORATION AND PRODUCTION
Revenues
Exploration and Production Operating Revenues
Year Ended September 30 | |||||||||||
2017 | 2016 | 2015 | |||||||||
(Thousands) | |||||||||||
Gas (after Hedging) | $ | 462,976 | $ | 433,357 | $ | 471,657 | |||||
Oil (after Hedging) | 147,599 | 169,263 | 213,488 | ||||||||
Gas Processing Plant | 3,181 | 2,411 | 2,891 | ||||||||
Other | 843 | 2,082 | 5,405 | ||||||||
Operating Revenues | $ | 614,599 | $ | 607,113 | $ | 693,441 | |||||
Production
Year Ended September 30 | ||||||||
2017 | 2016 | 2015 | ||||||
Gas Production (MMcf) | ||||||||
Appalachia | 154,093 | 140,457 | 136,404 | |||||
West Coast | 2,995 | 3,090 | 3,159 | |||||
Total Production | 157,088 | 143,547 | 139,563 | |||||
Oil Production (Mbbl) | ||||||||
Appalachia | 4 | 28 | 30 | |||||
West Coast | 2,736 | 2,895 | 3,004 | |||||
Total Production | 2,740 | 2,923 | 3,034 | |||||
-37-
Average Prices
Year Ended September 30 | |||||||||||
2017 | 2016 | 2015 | |||||||||
Average Gas Price/Mcf | |||||||||||
Appalachia | $ | 2.52 | $ | 1.94 | $ | 2.48 | |||||
West Coast | $ | 4.00 | $ | 3.25 | $ | 4.11 | |||||
Weighted Average | $ | 2.55 | $ | 1.97 | $ | 2.51 | |||||
Weighted Average After Hedging(1) | $ | 2.95 | $ | 3.02 | $ | 3.38 | |||||
Average Oil Price/Barrel (Bbl) | |||||||||||
Appalachia | $ | 48.27 | $ | 52.15 | $ | 57.44 | |||||
West Coast | $ | 46.14 | $ | 35.26 | $ | 51.37 | |||||
Weighted Average | $ | 46.18 | $ | 35.42 | $ | 51.43 | |||||
Weighted Average After Hedging(1) | $ | 53.87 | $ | 57.91 | $ | 70.36 | |||||
(1) | Refer to further discussion of hedging activities below under “Market Risk Sensitive Instruments” and in Note G — Financial Instruments in Item 8 of this report. |
2017 Compared with 2016
Operating revenues for the Exploration and Production segment increased $7.5 million in 2017 as compared with 2016. Gas production revenue after hedging increased $29.6 million primarily due to a large increase in gas production partially offset by a $0.07 per Mcf decrease in the weighted average price of gas after hedging. The increase in production was primarily due to a significant decrease in price-related curtailments during fiscal 2017 compared to fiscal 2016. This was partially offset by the impact of a joint development agreement with IOG - CRV Marcellus, LLC (IOG) (lower net revenue interest in producing wells), production declines on wells in the Eastern Development Area (Tioga and Lycoming counties in Pennsylvania) and the expected impact of changing from a 3-drilling rig program to a 1-drilling rig program. For further discussion of the joint development agreement with IOG, refer to Item 8 at Note A - Summary of Significant Accounting Policies under the heading "Property, Plant and Equipment." In addition, gas processing plant revenue increased $0.8 million due to an increase in price and volumes. These increases to operating revenues were partially offset by a decrease in oil production revenue after hedging of $21.7 million due to a decrease in crude oil production coupled with a $4.04 per Bbl decrease in the weighted average price of oil after hedging. The decrease in crude oil production was largely due to the current year impact of decreased steam operations and well workover activity at its North Midway Sunset field in prior years (due to lower crude oil prices). In addition, other revenue decreased $1.2 million largely due to the impact of mark-to-market adjustments related to hedging ineffectiveness.
Refer to further discussion of derivative financial instruments in the “Market Risk Sensitive Instruments” section that follows. Refer to the tables above for production and price information.
2016 Compared with 2015
Operating revenues for the Exploration and Production segment decreased $86.3 million in 2016 as compared with 2015. Gas production revenue after hedging decreased $38.3 million primarily due to a $0.36 per Mcf decrease in the weighted average price of gas after hedging partially offset by an increase in gas production. Oil production revenue after hedging decreased $44.2 million due to a $12.45 per Bbl decrease in the weighted average price of oil after hedging coupled with a decrease in crude oil production. In addition, other revenue decreased $3.3 million primarily due to the positive impact of mark-to-market adjustments related to hedging ineffectiveness that occurred during the year ended September 30, 2015, which did not recur during the year ended September 30, 2016.
-38-
Earnings
2017 Compared with 2016
The Exploration and Production segment’s earnings for 2017 were $129.3 million, an increase of $582.1 million when compared with a loss of $452.8 million for 2016. The increase in earnings primarily reflects the non-recurrence of the aforementioned impairment charges ($550.0 million). It also reflects higher natural gas production ($26.6 million), lower depletion expense ($17.8 million), lower other operating expenses ($2.2 million), lower interest expense ($1.1 million), the non-recurrence of joint development agreement professional fees ($4.6 million) and lower income tax expense ($10.6 million). The decrease in depletion expense was primarily due to a lower level of capitalized costs as a result of the impairment charges recognized in fiscal 2015 and fiscal 2016. The decrease in other operating expenses was primarily due to a decrease in personnel costs coupled with a decrease in plugging and abandonment expense (as a result of the sale of Upper Devonian wells in Pennsylvania in June 2016), which was partially offset by a contract suspension payment to TransCanada related to transportation services for Northern Access 2016 project. The decrease in interest expense was largely due to a decrease in the Exploration and Production segment’s intercompany short-term borrowings. The decrease in income tax expense was largely due to an increase in anticipated firm transportation of natural gas to delivery points outside of Pennsylvania as a result of forecasted deliveries to the Atlantic Sunrise Pipeline. This had the effect of decreasing the effective tax rate used in the calculation of deferred tax expense. Income tax expense also decreased due to an enhanced oil recovery tax credit related to Seneca's California properties, which was applicable this year as a result of relatively low domestic crude oil prices. The joint development agreement professional fees incurred were related to professional services associated with the Marcellus Shale drilling joint development agreement with IOG executed in December 2015 and extended in June 2016. These fees did not recur during fiscal 2017. These factors, which contributed to increased earnings during fiscal 2017 compared to fiscal 2016, were partially offset by lower crude oil prices after hedging ($7.2 million), lower natural gas prices after hedging ($7.3 million), lower crude oil production ($6.9 million), higher production costs ($7.9 million) and higher other taxes ($1.1 million). The increase in production costs was largely due to an increase in transportation costs associated with higher gas production volume (mostly transported by Midstream Corporation) coupled with increased well repairs, equipment rentals, contract labor and steam fuel costs in the West Coast region, which will support production in future years. These were partially offset by lower repair and maintenance costs associated with operating wells in Appalachia (impacted by the sale of Upper Devonian related wells in June 2016). The increase in other taxes was largely due to higher impact fees related to Appalachian production in fiscal 2017 compared to fiscal 2016. Impact fees were significantly lower in fiscal 2016 as a result of IOG's reimbursement of such costs for years prior to fiscal 2016. The increase in other taxes also reflects an increase in Appalachian franchise taxes, partially offset by a decrease in Kern, Ventura and Coalinga County taxes in the West Coast region due to lower crude oil prices.
2016 Compared with 2015
The Exploration and Production segment’s loss for 2016 was $452.8 million, compared with a loss of $557.0 million for 2015. The reduction in loss was attributed to lower impairment charges ($100.1 million), lower depletion expense ($64.9 million), higher natural gas production ($8.8 million), lower production costs ($9.0 million), lower income tax ($3.2 million), lower other taxes ($4.1 million) and lower other operating expenses ($3.3 million). The decrease in depletion expense was primarily due to the impact of impairment charges recognized in fiscal 2015 and fiscal 2016. The decrease in production costs was largely due to a decrease in well repair costs and a decrease in steam fuel costs associated with crude oil production in the West Coast region (due to lower fuel prices) coupled with a decrease in seasonal road maintenance (due to a milder winter) and decreases in equipment repair and rental costs, salt water disposal costs, and compressor and pumper costs in the Appalachian region. The decrease in income tax expense was primarily due to a solar tax credit received coupled with favorable benefits associated with the tax sharing agreement with affiliated companies. The decrease in other taxes was largely due to IOG being billed for its share of previously incurred impact fees in accordance with the joint development agreement executed in December 2015, coupled with a decrease in Kern and Ventura County taxes (due to a decrease in crude oil prices). The decrease in other operating expenses was primarily due to a decrease in emissions expense and personnel costs, partially offset by higher stock-based compensation expense. These factors, which contributed to less of a loss in 2016 compared to 2015, were partially offset by the impact of joint development agreement professional fees ($4.6 million), lower crude oil prices after hedging ($23.6 million), lower natural gas
-39-
prices after hedging ($33.6 million), lower crude oil production ($5.1 million), the impact of mark-to-market adjustments discussed above ($2.1 million), lower interest income ($1.1 million) and higher interest expense ($5.7 million). The joint development agreement professional fees incurred were related to professional services associated with the Marcellus Shale drilling joint development agreement with IOG that was executed in December 2015 and extended in June 2016. The increase in interest expense was largely due to the Exploration and Production segment's share of the Company's $450 million long-term debt issuance in June 2015. From an income tax perspective, there were favorable adjustments to Seneca’s deferred income tax liability in the amount of $13.2 million in 2015 that did not recur in 2016. The deferred tax adjustments in 2015 were largely the result of an increase in firm transportation of natural gas to Canadian delivery points (with a corresponding decrease in the effective tax rate) and other adjustments.
PIPELINE AND STORAGE
Revenues
Pipeline and Storage Operating Revenues
Year Ended September 30 | |||||||||||
2017 | 2016 | 2015 | |||||||||
(Thousands) | |||||||||||
Firm Transportation | $ | 221,609 | $ | 229,895 | $ | 214,611 | |||||
Interruptible Transportation | 1,690 | 3,995 | 2,971 | ||||||||
223,299 | 233,890 | 217,582 | |||||||||
Firm Storage Service | 69,963 | 70,351 | 70,732 | ||||||||
Interruptible Storage Service | 19 | 143 | 3 | ||||||||
69,982 | 70,494 | 70,735 | |||||||||
Other | 1,144 | 2,045 | 3,023 | ||||||||
$ | 294,425 | $ | 306,429 | $ | 291,340 | ||||||
Pipeline and Storage Throughput — (MMcf)
Year Ended September 30 | ||||||||
2017 | 2016 | 2015 | ||||||
Firm Transportation | 779,382 | 740,875 | 737,206 | |||||
Interruptible Transportation | 5,805 | 23,548 | 12,874 | |||||
785,187 | 764,423 | 750,080 | ||||||
2017 Compared with 2016
Operating revenues for the Pipeline and Storage segment decreased $12.0 million in 2017 as compared with 2016. The decrease was primarily due to a decrease in transportation revenues of $10.6 million. The decline in transportation revenues was due partially to a 2% reduction in Supply Corporation's rates effective November 1, 2015 and an additional 2% reduction in Supply Corporation's rates effective November 1, 2016, both of which were required by the rate case settlement approved by FERC on November 13, 2015. The decrease also reflects reductions in Empire's rates effective July 1, 2016 as required by the rate case settlement approved by FERC on December 13, 2016 combined with a decline in demand charges for transportation services as a result of contract terminations and contract restructuring, as well as lower demand for short-term interruptible transportation service. Partially offsetting these decreases, transportation revenues benefited from a full year of revenue from Supply Corporation's Northern Access 2015 project, which was placed in service on an interim basis in November 2015 and became fully operational in December 2015, and transportation revenues also benefited from a full year of revenue from Empire's Tuscarora Lateral Project, which was placed in service in November 2015.
Transportation volume increased by 20.8 Bcf in 2017 as compared with 2016. The increase in transportation volume primarily reflects the impact of a full year of transportation service from the Northern Access 2015 project
-40-
and the Tuscarora Lateral Project, both of which are discussed in the previous paragraph. Volume fluctuations, other than those caused by the addition or deletion of contracts, generally do not have a significant impact on revenues as a result of the straight fixed-variable rate design utilized by Supply Corporation and Empire.
2016 Compared with 2015
Operating revenues for the Pipeline and Storage segment increased $15.1 million in 2016 as compared with 2015. The increase was primarily due to an increase in transportation revenues of $16.3 million. The increase in transportation revenues was largely due to demand charges for transportation service from Supply Corporation’s Westside Expansion and Modernization Project and Supply Corporation's Northern Access 2015 project, which were both fully placed in service during the first quarter of fiscal 2016, and Empire's Tuscarora Lateral Project, which was placed in service in November 2015. The increase in transportation revenues was partially offset by a decrease in short-term seasonal contracts for both Empire and Supply Corporation. Operating revenues were also impacted by a 2% reduction in Supply Corporation's rates effective November 1, 2015 as required by the rate case settlement mentioned above.
Transportation volume increased by 14.3 Bcf in 2016 as compared with 2015. The increase in transportation volume primarily reflected the impact of the above mentioned expansion projects being placed in service.
Earnings
2017 Compared with 2016
The Pipeline and Storage segment’s earnings in 2017 were $68.4 million, a decrease of $8.2 million when compared with earnings of $76.6 million in 2016. The decrease in earnings was primarily due to the earnings impact of lower transportation revenues of $6.9 million, as discussed above, combined with higher operating expenses ($4.4 million), an increase in property taxes ($0.8 million) and a decrease in the allowance for funds used during construction (equity component) of $0.5 million. The increase in operating expenses primarily reflects an increase in compressor station costs due primarily to costs associated with the overhaul of two compressor stations, higher pension and other post-retirement benefit costs and increased personnel costs. The decrease in allowance for funds used during construction reflects the completion of Supply Corporation’s Westside Expansion and Modernization Project, Supply Corporation's Northern Access 2015 project and Empire's Tuscarora Lateral Project in the first quarter of fiscal 2016. These earnings decreases were partially offset by a decrease in depreciation expense ($1.4 million) and lower income tax expense ($3.2 million). The decrease in depreciation expense was attributable to a decrease in Empire's depreciation rates effective July 1, 2016 associated with Empire's rate case settlement offset partially by the incremental depreciation expense related to expansion projects that were placed in service within the last year. Income tax expense was lower due to provision-to-return adjustments combined with lower state taxes, an increase in benefits associated with the tax sharing agreement with affiliated companies and the adoption of the new accounting guidance regarding stock-based compensation.
2016 Compared with 2015
The Pipeline and Storage segment’s earnings in 2016 were $76.6 million, a decrease of $3.8 million when compared with earnings of $80.4 million in 2015. The decrease in earnings was primarily due to higher operating expenses ($2.4 million), an increase in depreciation expense ($3.3 million), an increase in property taxes ($0.9 million), higher interest expense ($3.7 million), higher income taxes ($2.7 million) and a decrease in the allowance for funds used during construction (equity component) of $0.9 million. The increase in operating expenses primarily reflected higher pension and other post-retirement benefit costs, higher pipeline integrity program expenses, higher compressor station expenses and higher stock-based compensation expense. The increase in depreciation expense was attributable to projects that were placed in service during fiscal 2016. The increase in property taxes was attributable to various expansion projects constructed over the last few years. The increase in interest expense was largely due to Supply Corporation's share of the Company's $450 million long-term debt issuance in June 2015. The increase in income taxes was a result of a reduction in benefits associated with the tax sharing agreement with affiliated companies combined with Empire's provision-to-return adjustments. The decrease in allowance for funds used during construction was mainly due to the above mentioned expansion projects being placed in service in the
-41-
first quarter of fiscal 2016. The factors contributing to the earnings decrease were partially offset by the positive earnings impact of higher transportation revenues ($10.6 million), as discussed above.
GATHERING
Revenues
Gathering Operating Revenues
Year Ended September 30 | |||||||||||
2017 | 2016 | 2015 | |||||||||
(Thousands) | |||||||||||
Gathering | $ | 107,566 | $ | 89,073 | $ | 76,709 | |||||
Processing and Other Revenues | 115 | 374 | 497 | ||||||||
$ | 107,681 | $ | 89,447 | $ | 77,206 | ||||||
Gathering Volume — (MMcf)
Year Ended September 30 | ||||||||
2017 | 2016 | 2015 | ||||||
Gathered Volume | 194,921 | 161,955 | 139,629 | |||||
2017 Compared with 2016
Operating revenues for the Gathering segment increased $18.2 million in 2017 as compared with 2016. This increase was due to an increase in gathering revenues driven by a 33.0 Bcf increase in gathered volume. The overall increase in gathered volume was due to a 22.5 Bcf increase in gathered volume on Midstream Corporation’s Clermont Gathering System (Clermont), a 4.7 Bcf increase in gathered volume on Midstream Corporation's Wellsboro Gathering System (Wellsboro), a 3.0 Bcf increase in gathered volume on Midstream Corporation's Trout Run Gathering System (Trout Run) and a 2.9 Bcf increase in gathered volume on Midstream Corporation's Covington Gathering System (Covington). The increases in the aforementioned volumes were largely due to increases in Seneca's Marcellus Shale production due to a significant decrease in price-related curtailments during fiscal 2017 compared to fiscal 2016.
2016 Compared with 2015
Operating revenues for the Gathering segment increased $12.2 million in 2016 as compared with 2015. This increase was due to an increase in gathering revenues driven by a 22.3 Bcf increase in gathered volume. The overall increase in gathered volume was largely due to a 47.0 Bcf increase in gathered volume on Clermont, largely attributable to the connection of additional wells to the gathering system as a result of the completion of the Northern Access 2015 project in November and December 2015. This increase in gathered volume was partially offset by a 21.8 Bcf decrease in gathered volume on Trout Run and a 3.1 Bcf decrease in gathered volume on Covington. These decreases were largely due to price-related curtailments of Seneca's Marcellus Shale production.
Earnings
2017 Compared with 2016
The Gathering segment’s earnings in 2017 were $40.4 million, an increase of $9.9 million when compared with earnings of $30.5 million in 2016. The increase in earnings was mainly due to an increase in gathering revenues ($12.0 million). The increase in gathering revenues was due to the increases in gathered volume discussed above. These were partially offset by higher operating expenses ($1.8 million) and higher depreciation expense ($0.6 million). The increase in operating expenses were largely due to the ramp up in gathering operations as a result of increases in Seneca's Marcellus Shale production. An increase in gas plant balances (mostly in Clermont), led to an increase in depreciation expense.
-42-
2016 Compared with 2015
The Gathering segment’s earnings in 2016 were $30.5 million, a decrease of $1.3 million when compared with earnings of $31.8 million in 2015. While gathering revenues increased $8.0 million, as discussed above, the increase in revenues was more than offset by higher interest expense ($4.7 million), higher depreciation expense ($2.9 million) and higher operating expenses ($1.6 million). The increase in interest expense was largely due to the Gathering segment's share of the Company's $450 million long-term debt issuance in June 2015 coupled with a decrease in capitalized interest, which was due to various Clermont projects being placed in service. A large increase in plant balances (largely due to various Clermont projects being placed in service), partially offset by the non-recurrence of long-lived asset impairment charges recorded in March 2015 related to the gathering facilities at Tionesta, led to an overall increase in depreciation expense. The increase in operating expenses was largely due to the significant growth of Clermont and its impact on maintenance expense.
UTILITY
Revenues
Utility Operating Revenues
Year Ended September 30 | |||||||||||
2017 | 2016 | 2015 | |||||||||
(Thousands) | |||||||||||
Retail Revenues: | |||||||||||
Residential | $ | 435,357 | $ | 360,648 | $ | 480,163 | |||||
Commercial | 58,988 | 44,994 | 61,099 | ||||||||
Industrial | 2,376 | 1,785 | 2,655 | ||||||||
496,721 | 407,427 | 543,917 | |||||||||
Off-System Sales | 3,997 | 1,877 | 11,773 | ||||||||
Transportation | 129,509 | 124,120 | 142,289 | ||||||||
Other | 9,744 | 10,723 | 18,288 | ||||||||
$ | 639,971 | $ | 544,147 | $ | 716,267 | ||||||
Utility Throughput — million cubic feet (MMcf)
Year Ended September 30 | ||||||||
2017 | 2016 | 2015 | ||||||
Retail Sales: | ||||||||
Residential | 52,394 | 49,971 | 59,600 | |||||
Commercial | 7,927 | 7,247 | 8,710 | |||||
Industrial | 333 | 244 | 337 | |||||
60,654 | 57,462 | 68,647 | ||||||
Off-System Sales | 1,301 | 1,243 | 3,787 | |||||
Transportation | 71,040 | 70,847 | 78,749 | |||||
132,995 | 129,552 | 151,183 | ||||||
-43-
Degree Days
Percent (Warmer) Colder Than | |||||||||||||
Year Ended September 30 | Normal | Actual | Normal(1) | Prior Year(1) | |||||||||
2017 | Buffalo | 6,617 | 5,708 | (13.7 | )% | 1.7 | % | ||||||
Erie | 6,147 | 5,179 | (15.7 | )% | (0.1 | )% | |||||||
2016 | Buffalo | 6,653 | (2) | 5,611 | (15.7 | )% | (19.5 | )% | |||||
Erie | 6,181 | (2) | 5,182 | (16.2 | )% | (21.3 | )% | ||||||
2015 | Buffalo | 6,617 | 6,968 | 5.3 | % | (1.7 | )% | ||||||
Erie | 6,147 | 6,586 | 7.1 | % | (2.3 | )% | |||||||
(1) | Percents compare actual degree days to normal degree days and actual degree days to actual prior year degree days. |
(2) | Normal degree day estimates changed to 6,653 for Buffalo and 6,181 for Erie as a result of updated information from the National Oceanic and Atmospheric Administration. In addition, normal degree days for 2016 reflect the fact that 2016 was a leap year. |
2017 Compared with 2016
Operating revenues for the Utility segment increased $95.8 million in 2017 compared with 2016. The increase largely resulted from an $89.3 million increase in retail gas sales revenues. In addition, there was a $5.4 million increase in transportation revenues, and a $2.1 million increase in off-system sales (due to higher sales prices coupled with slightly higher volumes). The increase in retail gas sales revenues was largely a result of an increase in the cost of gas sold (per Mcf) coupled with an increase in volumes due to higher usage. The increase in transportation revenues was due to the increase in the price paid by marketers to cash-out their imbalances and an increase in those imbalances owed to the Utility segment as transportation throughput was relatively flat. Due to profit sharing with retail customers, the margins related to off-system sales are minimal.
2016 Compared with 2015
Operating revenues for the Utility segment decreased $172.1 million in 2016 compared with 2015. This decrease largely resulted from a $136.5 million decrease in retail gas sales revenues. In addition, there was a $9.9 million decrease in off-system sales, an $18.2 million decrease in transportation revenues, and a $7.5 million decrease in other revenues. The decrease in retail gas sales revenue was largely a result of a decrease in the cost of gas sold (per Mcf) coupled with lower volumes due to warmer weather. The $18.2 million decrease in transportation revenues was primarily due to a 7.9 Bcf decrease in transportation throughput due to warmer weather experienced during the fiscal 2016 winter relative to the fiscal 2015 winter. The decrease in off-system sales was due to market conditions that have continued to reduce the volumes and the price at which off-system gas could be sold. Due to profit sharing with retail customers, the margins resulting from off-system sales are minimal. The decrease in other revenues was largely due to the non-recurrence of a regulatory adjustment recorded during fiscal 2015 to recognize an under collection of a New York State regulatory assessment from customers. In addition, a reversal of an accrual for an estimated sharing refund provision in New York did not recur in 2016.
Purchased Gas
The cost of purchased gas is the Company’s single largest operating expense. Annual variations in purchased gas costs are attributed directly to changes in gas sales volume, the price of gas purchased and the operation of purchased gas adjustment clauses. Distribution Corporation recorded $252.8 million, $166.2 million and $307.7 million of Purchased Gas expense during 2017, 2016 and 2015, respectively. Under its purchased gas adjustment clauses in New York and Pennsylvania, Distribution Corporation is not allowed to profit from fluctuations in gas costs. Purchased gas expense recorded on the consolidated income statement matches the revenues collected from customers, a component of Operating Revenues on the consolidated income statement. Under mechanisms approved by the NYPSC in New York and the PaPUC in Pennsylvania, any difference between
-44-
actual purchased gas costs and what has been collected from the customer is deferred on the consolidated balance sheet as either an asset, Unrecovered Purchased Gas Costs, or a liability, Amounts Payable to Customers. These deferrals are subsequently collected from the customer or passed back to the customer, subject to review by the NYPSC and the PaPUC. Absent disallowance of full recovery of Distribution Corporation’s purchased gas costs, such costs do not impact the profitability of the Company. Purchased gas costs impact cash flow from operations due to the timing of recovery of such costs versus the actual purchased gas costs incurred during a particular period. Distribution Corporation’s purchased gas adjustment clauses seek to mitigate this impact by adjusting revenues on either a quarterly or monthly basis.
Distribution Corporation contracts for firm long-term transportation and storage capacity with rights-of-first-refusal from nine upstream pipeline companies including Supply Corporation for transportation and storage and Empire Pipeline, Inc. for transportation. Distribution Corporation contracts for firm gas supplies on term and spot bases with various producers, marketers and one local distribution company to meet its gas purchase requirements. Additional discussion of the Utility segment’s gas purchases appears under the heading “Sources and Availability of Raw Materials” in Item 1.
Earnings
2017 Compared with 2016
The Utility segment’s earnings in 2017 were $46.9 million, a decrease of $4.1 million when compared with earnings of $51.0 million in 2016. The decrease in earnings was largely attributable to higher operating expenses of $3.3 million (primarily due to higher personnel costs including the impact of post-implementation costs related to the replacement of the Utility segment’s legacy mainframe system), higher depreciation expense of $2.6 million (largely due to higher plant balances including the impact of the legacy mainframe system replacement), a decrease in the allowance for funds used during construction (equity component) of $0.9 million (due to the May 2016 completion of the Utility segment’s legacy mainframe system), higher income tax expense of $0.9 million (largely due to the aforementioned reduction in the allowance for funds used during construction in the current year which is non-taxable), lower interest income of $0.6 million (due to a lower balance in a regulatory asset and its impact on accrued income) and higher interest expense of $0.6 million (largely due to the impact of a regulatory adjustment coupled with a reduction in the allowance for borrowed funds used during construction due to the May 2016 completion of the Utility segment’s legacy mainframe system). These were partially offset by the positive earnings impact associated with higher usage ($2.5 million) and the impact of regulatory adjustments ($1.9 million, including the $1.5 million margin impact related to the new rate order issued by the NYPSC effective April 1, 2017). Usage refers to consumption after factoring out any impact that weather may have had on consumption.
The impact of weather variations on earnings in the Utility segment’s New York rate jurisdiction is mitigated by that jurisdiction’s weather normalization clause (WNC). The WNC in New York, which covers the eight-month period from October through May, has had a stabilizing effect on earnings for the New York rate jurisdiction. In addition, in periods of colder than normal weather, the WNC benefits the Utility segment’s New York customers. For 2017, the WNC increased earnings by approximately $4.3 million as the weather was warmer than normal. In 2016, the WNC increased earnings by approximately $4.4 million as the weather was warmer than normal.
2016 Compared with 2015
The Utility segment’s earnings in 2016 were $51.0 million, a decrease of $12.3 million when compared with earnings of $63.3 million in 2015. The decrease in earnings was largely attributable to the impact of warmer weather in fiscal 2016 compared to fiscal 2015 ($12.5 million), a $2.0 million increase in depreciation expense (largely due to higher plant balances) and $3.4 million of regulatory adjustments, as discussed above. The negative earnings impact associated with these factors was partially offset by the positive earnings impact associated with a decrease in operating expenses of $5.6 million (primarily due to a reduction in personnel costs partially offset by higher stock-based compensation expense).
-45-
ENERGY MARKETING
Revenues
Energy Marketing Operating Revenues
Year Ended September 30 | |||||||||||
2017 | 2016 | 2015 | |||||||||
(Thousands) | |||||||||||
Natural Gas (after Hedging) | $ | 129,317 | $ | 94,028 | $ | 160,651 | |||||
Other | 63 | 434 | 55 | ||||||||
$ | 129,380 | $ | 94,462 | $ | 160,706 | ||||||
Energy Marketing Volume
Year Ended September 30 | ||||||||
2017 | 2016 | 2015 | ||||||
Natural Gas — (MMcf) | 38,901 | 39,849 | 46,752 | |||||
2017 Compared with 2016
Operating revenues for the Energy Marketing segment increased $34.9 million in 2017 as compared with 2016. The increase was primarily due to an increase in gas sales revenue due to a higher average price of natural gas period over period, slightly offset by a decrease in volume sold to retail customers.
2016 Compared with 2015
Operating revenues for the Energy Marketing segment decreased $66.2 million in 2016 as compared with 2015. The decrease was primarily due to a decline in gas sales revenue due to a lower average price of natural gas period over period. A decrease in volume sold to retail customers as a result of warmer weather also contributed to the decline in operating revenues.
Earnings
2017 Compared with 2016
The Energy Marketing segment’s earnings in 2017 were $1.5 million, a decrease of $2.8 million when compared with earnings of $4.3 million in 2016. This decrease in earnings was primarily attributable to lower margin of $2.6 million. The decrease in margin largely reflects a decline in average margin per Mcf primarily due to stronger natural gas prices at local purchase points relative to NYMEX-based sales contracts, combined with the margin impact associated with the decrease in volume sold to retail customers during the year ended September 30, 2017 compared to the year ended September 30, 2016.
2016 Compared with 2015
The Energy Marketing segment’s earnings in 2016 were $4.3 million, a decrease of $3.5 million when compared with earnings of $7.8 million in 2015. This decrease in earnings was largely attributable to lower margin of $3.6 million. The decrease in margin largely reflected the margin impact associated with the decrease in volume sold to retail customers as a result of warmer weather during the year ended September 30, 2016 compared to the year ended September 30, 2015. Margin was also negatively impacted by changes in natural gas prices at local purchase points relative to NYMEX-based customer sales contracts. This decrease was partially offset by an increase to margin due to an increase in the benefit the Energy Marketing segment realized from its contracts for storage capacity.
-46-
ALL OTHER AND CORPORATE OPERATIONS
All Other and Corporate operations primarily includes the operations of Seneca’s Northeast Division and corporate operations. Seneca’s Northeast Division markets timber from its New York and Pennsylvania land holdings.
Earnings
2017 Compared with 2016
All Other and Corporate operations recorded a loss of $3.1 million in 2017, which was $2.6 million higher than the loss of $0.5 million in 2016. The increase in loss was primarily due to higher operating expenses ($1.2 million) largely due to higher personnel costs, higher income tax expense ($0.5 million) and lower margins ($1.0 million) from the sale of standing timber by Seneca’s land and timber division.
2016 Compared with 2015
All Other and Corporate operations recorded a loss of $0.5 million in 2016, which was $5.2 million lower than the loss of $5.7 million in 2015. The reduction in loss can be attributed to a death benefit gain on life insurance of $1.7 million that was recognized during the year ended September 30, 2016 and was recorded in Other Income. In addition, lower operating expenses of $0.5 million (primarily due to a decrease in personnel costs partially offset by higher stock-based compensation expense), higher margins of $0.9 million (from the sale of standing timber and stumpage tracts by Seneca's land and timber division) and the impact of lower income tax expense of $1.6 million (primarily due to consolidated tax sharing adjustments) further reduced the loss during the year ended September 30, 2016.
INTEREST CHARGES
Although most of the variances in Interest Charges are discussed in the earnings discussion by segment above, the following is a summary on a consolidated basis (amounts below are pre-tax amounts):
Interest on long-term debt decreased $0.9 million in 2017 as compared to 2016. This decrease was primarily due to an increase in the capitalization of interest costs (mostly in Midstream Corporation) which decreased interest expense for the year ended September 30, 2017 as compared to the year ended September 30, 2016.
Interest on long-term debt increased $21.4 million in 2016 as compared to 2015. This increase was primarily due to additional long-term debt that was issued in fiscal 2015. The Company issued $450 million of 5.20% notes in June 2015. Additionally, capitalized interest decreased as a result of various projects being placed into service, which increased interest expense for the year ended September 30, 2016 as compared to the year ended September 30, 2015.
-47-
CAPITAL RESOURCES AND LIQUIDITY
The primary sources and uses of cash during the last three years are summarized in the following condensed statement of cash flows:
Year Ended September 30 | |||||||||||
2017 | 2016 | 2015 | |||||||||
(Millions) | |||||||||||
Provided by Operating Activities | $ | 684.3 | $ | 589.0 | $ | 853.6 | |||||
Capital Expenditures | (450.3 | ) | (581.6 | ) | (1,018.2 | ) | |||||
Net Proceeds from Sale of Oil and Gas Producing Properties | 26.6 | 137.3 | — | ||||||||
Other Investing Activities | 1.2 | (9.2 | ) | (6.6 | ) | ||||||
Change in Notes Payable to Banks and Commercial Paper | — | — | (85.6 | ) | |||||||
Net Proceeds from Issuance of Long-Term Debt | 295.2 | — | 444.6 | ||||||||
Net Proceeds from Issuance of Common Stock | 7.7 | 13.8 | 10.5 | ||||||||
Dividends Paid on Common Stock | (139.1 | ) | (134.8 | ) | (130.7 | ) | |||||
Excess Tax Benefits Associated with Stock-Based Compensation Awards | — | 1.9 | 9.1 | ||||||||
Net Increase in Cash and Temporary Cash Investments | $ | 425.6 | $ | 16.4 | $ | 76.7 | |||||
OPERATING CASH FLOW
Internally generated cash from operating activities consists of net income available for common stock, adjusted for non-cash expenses, non-cash income and changes in operating assets and liabilities. Non-cash items include depreciation, depletion and amortization, impairment of oil and gas producing properties, deferred income taxes and stock-based compensation.
Cash provided by operating activities in the Utility and Pipeline and Storage segments may vary substantially from year to year because of the impact of rate cases. In the Utility segment, supplier refunds, over- or under-recovered purchased gas costs and weather may also significantly impact cash flow. The impact of weather on cash flow is tempered in the Utility segment’s New York rate jurisdiction by its WNC and in the Pipeline and Storage segment by the straight fixed-variable rate design used by Supply Corporation and Empire.
Cash provided by operating activities in the Exploration and Production segment may vary from year to year as a result of changes in the commodity prices of natural gas and crude oil as well as changes in production. The Company uses various derivative financial instruments, including price swap agreements and futures contracts in an attempt to manage this energy commodity price risk.
Net cash provided by operating activities totaled $684.3 million in 2017, an increase of $95.3 million compared with the $589.0 million provided by operating activities in 2016. The increase in cash provided by operating activities reflects higher cash provided by operating activities in the Exploration and Production and Gathering segments primarily due to higher cash receipts from natural gas production and gathering services in the Appalachian region.
Net cash provided by operating activities totaled $589.0 million in 2016, a decrease of $264.6 million compared with the $853.6 million provided by operating activities in 2015. The decrease in cash provided by operating activities reflected lower cash provided by operating activities in the Exploration and Production segment and the Utility segment. The decrease in the Exploration and Production segment was primarily due to lower cash receipts from crude oil and natural gas production as a result of lower crude oil and natural gas prices and curtailed production. The decrease in the Utility segment was primarily due to the timing of gas cost recovery.
-48-
INVESTING CASH FLOW
Expenditures for Long-Lived Assets
The Company’s expenditures for long-lived assets, including non-cash capital expenditures, totaled $462.1 million, $523.1 million and $1.0 billion in 2017, 2016 and 2015, respectively. The table below presents these expenditures:
Year Ended September 30 | ||||||||||||||
2017 | 2016 | 2015 | ||||||||||||
(Millions) | ||||||||||||||
Exploration and Production: | ||||||||||||||
Capital Expenditures | $ | 253.1 | (1) | $ | 256.1 | (2) | $ | 557.3 | (3) | |||||
Pipeline and Storage: | ||||||||||||||
Capital Expenditures | 95.3 | (1) | 114.3 | (2) | 230.2 | (3) | ||||||||
Gathering: | ||||||||||||||
Capital Expenditures | 32.6 | (1) | 54.3 | (2) | 118.2 | (3) | ||||||||
Utility: | ||||||||||||||
Capital Expenditures | 80.9 | (1) | 98.0 | (2) | 94.4 | (3) | ||||||||
All Other and Corporate: | ||||||||||||||
Capital Expenditures | 0.2 | 0.4 | 0.4 | |||||||||||
Total Expenditures | $ | 462.1 | $ | 523.1 | $ | 1,000.5 | ||||||||
(1) | 2017 capital expenditures for the Exploration and Production segment, the Pipeline and Storage segment, the Gathering segment and the Utility segment include $36.5 million, $25.1 million, $3.9 million and $6.7 million, respectively, of non-cash capital expenditures. The capital expenditures for the Exploration and Production segment do not include any proceeds received from the sale of oil and gas assets to IOG under the joint development agreement. |
(2) | 2016 capital expenditures for the Exploration and Production segment, the Pipeline and Storage segment, the Gathering segment and the Utility segment include $25.2 million, $18.7 million, $5.3 million and $11.2 million, respectively, of non-cash capital expenditures. The capital expenditures for the Exploration and Production segment do not include any proceeds from the sale of oil and gas assets to IOG under the joint development agreement. |
(3) | 2015 capital expenditures for the Exploration and Production segment, the Pipeline and Storage segment, the Gathering segment and the Utility segment include $46.2 million, $33.9 million, $22.4 million and $16.5 million, respectively, of non-cash capital expenditures. |
Exploration and Production
In 2017, the Exploration and Production segment capital expenditures were primarily well drilling and completion expenditures and included approximately $213.8 million for the Appalachian region (including $168.2 million in the Marcellus Shale area) and $39.3 million for the West Coast region. These amounts included approximately $101.1 million spent to develop proved undeveloped reserves.
On December 1, 2015, Seneca and IOG - CRV Marcellus, LLC (IOG), an affiliate of IOG Capital, LP, and funds managed by affiliates of Fortress Investment Group, LLC, executed a joint development agreement that allows IOG to participate in the development of certain oil and gas interests owned by Seneca in Elk, McKean and Cameron Counties, Pennsylvania. On June 13, 2016, Seneca and IOG executed an extension of the joint development agreement. Under the terms of the extended agreement, Seneca and IOG will jointly participate in a program to develop up to 75 Marcellus wells, with Seneca serving as program operator. IOG will hold an 80% working interest in all of the joint development wells. In total, IOG is expected to fund approximately $325 million for its 80% working interest in the 75 joint development wells. Of this amount, IOG has funded $262.6 million as of September 30, 2017, which includes $163.9 million of cash ($137.3 million in fiscal 2016 and $26.6 million in fiscal 2017) that Seneca had received in recognition of IOG funding that is due to Seneca for costs previously
-49-
incurred to develop a portion of the first 75 joint development wells. The cash proceeds were recorded by Seneca as a $163.9 million reduction of property, plant and equipment. The remainder funded joint development expenditures. For further discussion of the extended joint development agreement, refer to Item 8 at Note A - Summary of Significant Accounting Policies under the heading “Property, Plant and Equipment.”
On June 30, 2016, Seneca sold the majority of its Upper Devonian wells in Pennsylvania. While the proceeds from the sale were not significant, it did result in a $58.4 million reduction of its Asset Retirement Obligation for the year ended September 30, 2016.
In 2016, the Exploration and Production segment capital expenditures were primarily well drilling and completion expenditures and included approximately $217.3 million for the Appalachian region (including $201.8 million in the Marcellus Shale area) and $38.8 million for the West Coast region. These amounts included approximately $92.8 million spent to develop proved undeveloped reserves.
In 2015, the Exploration and Production segment capital expenditures were primarily well drilling and completion expenditures and included approximately $500.2 million for the Appalachian region (including $458.6 million in the Marcellus Shale area) and $57.1 million for the West Coast region. These amounts included approximately $161.8 million spent to develop proved undeveloped reserves.
Pipeline and Storage
The majority of the Pipeline and Storage segment’s capital expenditures for 2017 were related to additions, improvements and replacements to this segment’s transmission and gas storage systems. In addition, the Pipeline and Storage segment capital expenditures for 2017 include expenditures related to Empire and Supply Corporation's Northern Access 2016 Project ($22.1 million) and Supply Corporation's Line D Expansion Project ($14.4 million), as discussed below.
The majority of the Pipeline and Storage segment’s capital expenditures for 2016 were mainly for expenditures related to Empire and Supply Corporation's Northern Access 2016 Project ($26.7 million), Supply Corporation's Northern Access 2015 Project ($13.1 million), Supply Corporation's Westside Expansion and Modernization Project ($11.1 million), Supply Corporation's Line D Expansion Project ($10.4 million) and Empire and Supply Corporation's Tuscarora Lateral Project ($7.6 million). In addition, the Pipeline and Storage segment capital expenditures for 2016 also included additions, improvements and replacements to this segment’s transmission and gas storage systems.
The majority of the Pipeline and Storage segment’s capital expenditures for 2015 were mainly for expenditures related to Supply Corporation's Westside Expansion and Modernization Project ($63.0 million), Empire and Supply Corporation's Tuscarora Lateral Project ($53.7 million), Supply Corporation's Northern Access 2015 Project ($40.4 million), Supply Corporation's Northern Access 2016 Project ($5.9 million) and Supply Corporation's Mercer Expansion Project ($5.4 million). In addition, the Pipeline and Storage segment capital expenditures for 2015 also included additions, improvements and replacements to this segment’s transmission and gas storage systems.
Gathering
The majority of the Gathering segment’s capital expenditures for 2017, 2016 and 2015 were for the construction and/or continued buildout of Midstream Corporation’s Clermont Gathering System, which is discussed below. Midstream Corporation spent $21.7 million in 2017, $43.2 million in 2016 and $117.3 million in 2015 for the development of this system.
Utility
The majority of the Utility segment’s capital expenditures for 2017, 2016 and 2015 were made for main and service line improvements and replacements, as well as main extensions. The capital expenditures for 2016 and 2015 included $16.4 million and $18.4 million, respectively, related to the replacement of the Utility segment’s customer information system, which was placed in service in May 2016.
-50-
Estimated Capital Expenditures
The Company’s estimated capital expenditures for the next three years are:
Year Ended September 30 | |||||||||||
2018 | 2019 | 2020 | |||||||||
(Millions) | |||||||||||
Exploration and Production(1) | $ | 320 | $ | 345 | $ | 320 | |||||
Pipeline and Storage | 125 | 215 | 145 | ||||||||
Gathering | 70 | 50 | 30 | ||||||||
Utility | 95 | 95 | 95 | ||||||||
All Other | — | — | — | ||||||||
$ | 610 | $ | 705 | $ | 590 | ||||||
(1) | Includes estimated expenditures for the years ended September 30, 2018, 2019 and 2020 of approximately $186 million, $98 million and $28 million, respectively, to develop proved undeveloped reserves. The Company is committed to developing its proved undeveloped reserves within five years as required by the SEC’s final rule on Modernization of Oil and Gas Reporting. The capital expenditures for the Exploration and Production segment do not include any proceeds received from the sale of oil and gas assets to IOG under the joint development agreement. |
Exploration and Production
Estimated capital expenditures in 2018 for the Exploration and Production segment include approximately $295 million for the Appalachian region and $25 million for the West Coast region.
Estimated capital expenditures in 2019 for the Exploration and Production segment include approximately $310 million for the Appalachian region and $35 million for the West Coast region.
Estimated capital expenditures in 2020 for the Exploration and Production segment include approximately $290 million for the Appalachian region and $30 million for the West Coast region.
Pipeline and Storage
Capital expenditures for the Pipeline and Storage segment in 2018 through 2020 are expected to include: construction of new pipeline and compressor stations to support expansion projects, the replacement of transmission and storage lines, the reconditioning of storage wells and improvements of compressor stations. Expansion projects where the Company has begun to make significant investments of preliminary survey and investigation costs and/or where shipper agreements have been executed are described below.
In light of the continuing demand for pipeline capacity to move natural gas from new wells being drilled in Appalachia — specifically in the Marcellus and Utica Shale producing areas — Supply Corporation and Empire have recently completed and are actively pursuing several expansion projects designed to move anticipated Marcellus and Utica production gas to other interstate pipelines and to on-system markets, and markets beyond the Supply Corporation and Empire pipeline systems, and incurring preliminary survey and investigation costs, which are initially recorded as Deferred Charges on the Consolidated Balance Sheet. An offsetting reserve is established as those preliminary survey and investigation costs are incurred, which reduces the Deferred Charges balance and increases Operation and Maintenance Expense on the Consolidated Statement of Income. The Company reviews all projects on a quarterly basis, and, for those projects for which a reserve had been established, if it is determined that it is highly probable that the project will be built, the reserve is reversed. This reversal reduces Operation and Maintenance Expense and reestablishes the original balance in Deferred Charges. After the reversal of the reserve, the amounts remain in Deferred Charges until such time as capital expenditures for the project have been incurred and activities that are necessary to get the construction project ready for its intended use are in progress. At that point, the balance is transferred from Deferred Charges to Construction Work in Progress, a component of Property, Plant and Equipment on the Consolidated Balance Sheet. As of September 30, 2017, the
-51-
total amount reserved for the Pipeline and Storage segment’s preliminary survey and investigation costs was $7.1 million.
Supply Corporation and Empire are developing a project which would move significant prospective Marcellus production from Seneca's Western Development Area at Clermont to an Empire interconnection with TransCanada Pipeline at Chippawa and an interconnection with TGP's 200 Line in East Aurora, New York (“Northern Access 2016”). The Northern Access 2016 project would provide an outlet to Dawn-indexed markets in Canada and to the TGP line serving the U.S. Northeast. The Northern Access 2016 project involves the construction of approximately 99 miles of largely 24” pipeline and approximately 27,500 horsepower of compression on the two systems. The preliminary cost estimate for the Northern Access 2016 project is approximately $500 million. Supply Corporation, Empire and Seneca executed anchor shipper agreements for 350,000 Dth per day of firm transportation delivery capacity to Chippawa and 140,000 Dth per day of firm transportation capacity to a new interconnection with TGP's 200 Line on this project. On February 3, 2017, the Company received FERC approval of the project. On April 7, 2017, the NYDEC issued a Notice of Denial of the federal Clean Water Act Section 401 Water Quality Certification and other state stream and wetland permits for the New York portion of the project (the Water Quality Certification for the Pennsylvania portion of the project was received on January 27, 2017). The Company remains committed to the project. On April 21, 2017, the Company appealed the NYDEC's decision with regard to the Water Quality Certification to the United States Court of Appeals for the Second Circuit, and on May 11, 2017, the Company commenced legal action in New York State Supreme Court challenging the NYDEC's actions with regard to various state permits. The Company also has pending with FERC a proceeding asserting, among other things, that the NYDEC exceeded the reasonable time frame to take action under the Clean Water Act and, therefore, waived its opportunity to approve or deny the Water Quality Certification. In light of these pending legal actions, the Company has not yet determined a target in-service date. As of September 30, 2017, approximately $75.8 million has been spent on the Northern Access 2016 project, including $21.1 million that has been spent to study the project, for which no reserve has been established. The remaining $54.7 million spent on the project has been capitalized as Construction Work in Progress.
On November 21, 2014, Supply Corporation concluded an Open Season for an expansion of its Line D pipeline (“Line D Expansion”) that is intended to allow growing on-system markets to avail themselves of economical gas supply on the TGP 300 line, at an existing interconnect at Lamont, Pennsylvania, and provide increased capacity into the Erie, Pennsylvania market area. Supply Corporation has executed Service Agreements for a total of 77,500 Dth per day for terms of six to ten years. The project involves construction of a new 4,140 horsepower Keelor Compressor Station and modifications to the Bowen compressor station at an estimated capital cost of approximately $27.9 million. The project will also provide system modernization benefits. Supply Corporation filed on December 22, 2015 for authorization to construct this project under its FERC blanket certificate and completed the FERC notice period on February 26, 2016. Construction on both pieces of this project has been completed. The project went in-service on November 1, 2017. As of September 30, 2017, approximately $24.8 million has been capitalized as Construction Work in Progress for the Line D Expansion project. The remaining expenditures expected to be spent in fiscal 2018 are included in Pipeline and Storage estimated capital expenditures in the table above.
Empire concluded an Open Season on November 18, 2015, for a project that would allow for the transportation of additional shale supplies from Millennium Pipeline at Corning, from Supply Corporation at Tuscarora, or from interconnections in Tioga County, Pennsylvania, to the TransCanada Pipeline, the TGP 200 Line and potentially other on-system points (“Empire North Project”). Empire has executed a Precedent Agreement with a foundation shipper for 150,000 Dth per day of transportation capacity and with two other shippers for 35,000 Dth per day and 5,000 Dth per day, respectively. Empire continues to negotiate precedent agreements with other prospective shippers. The project, which has a projected in-service date of November 1, 2019, is expected to be designed for up to 205,000 Dth per day; capital costs are expected to be approximately $135 million. These expenditures are included as Pipeline and Storage segment estimated capital expenditures in the table above. As of September 30, 2017, approximately $0.9 million has been spent to study this project, all of which has been included in preliminary survey and investigation charges and has been fully reserved for at September 30, 2017.
Supply Corporation has entered into a foundation shipper Precedent Agreement to provide incremental natural gas transportation services from Line N to the ethylene cracker facility being constructed by Shell Chemical
-52-
Appalachia, LLC in Potter Township, Pennsylvania. Supply Corporation has completed an Open Season for the project and has secured incremental firm transportation capacity commitments totaling 133,000 Dth per day on Line N and on the proposed pipeline extension of approximately 4.5 miles from Line N to the facility. The proposed in-service date for this project is as early as July 1, 2019 and capital costs are expected to be $17 million. These expenditures are included as Pipeline and Storage segment estimated capital expenditures in the table above. As of September 30, 2017, approximately $0.2 million has been spent to study this project, all of which has been included in preliminary survey and investigation charges and has been fully reserved for at September 30, 2017.
Gathering
The majority of the Gathering segment capital expenditures in 2018 through 2020 are expected to be for construction and expansion of gathering systems, as discussed below.
NFG Midstream Clermont, LLC, a wholly owned subsidiary of Midstream Corporation, is building an extensive gathering system with compression in the Pennsylvania counties of McKean, Elk and Cameron. The total cost estimate for the continued buildout will be dependent on the nature and timing of the shippers', including Seneca's, long-term plans. As of September 30, 2017, approximately $281.3 million has been spent on the Clermont Gathering System, including approximately $21.7 million spent during the year ended September 30, 2017, all of which is included in Property, Plant and Equipment on the Consolidated Balance Sheet at September 30, 2017.
NFG Midstream Trout Run, LLC, a wholly owned subsidiary of Midstream Corporation, continues to develop its Trout Run Gathering System in Lycoming County, Pennsylvania. The Trout Run Gathering System was initially placed in service in May 2012. The current system consists of approximately 42 miles of backbone and in-field gathering pipelines and two compressor stations. Estimated capital expenditures in 2018 through 2020 include anticipated expenditures in the range of $50 million to $100 million for the continued expansion of the Trout Run Gathering System. As of September 30, 2017, the Company has spent approximately $177.4 million in costs related to this project, all of which is included in Property, Plant and Equipment on the Consolidated Balance Sheet at September 30, 2017.
NFG Midstream Wellsboro, LLC, a wholly owned subsidiary of Midstream Corporation, continues to develop its Wellsboro Gathering System in Tioga County, Pennsylvania. Estimated capital expenditures in 2018 through 2020 include anticipated expenditures in the range of $30 million to $60 million for the continued expansion of the Wellsboro Gathering System. The Company has spent approximately $6.7 million in costs related to this project, all of which is included in Property, Plant and Equipment on the Consolidated Balance Sheet at September 30, 2017.
Utility
Capital expenditures for the Utility segment in 2018 through 2020 are expected to be concentrated in the areas of main and service line improvements and replacements and, to a lesser extent, the purchase of new equipment.
Project Funding
The Company has been financing the Pipeline and Storage segment and Gathering segment projects mentioned above, as well as the Exploration and Production segment capital expenditures, with cash from operations and both short and long-term borrowings. Going forward, while the Company expects to use cash on hand and cash from operations as the first means of financing these projects, the Company may issue short-term and/or long-term debt as necessary during fiscal 2018 to help meet its capital expenditures needs. The level of short-term and long-term borrowings will depend upon the amounts of cash provided by operations, which, in turn, will likely be impacted by natural gas and crude oil prices combined with production from existing wells.
The Company continuously evaluates capital expenditures and potential investments in corporations, partnerships, and other business entities. The amounts are subject to modification for opportunities such as the acquisition of attractive oil and gas properties, natural gas storage facilities and the expansion of natural gas transmission line capacities. While the majority of capital expenditures in the Utility segment are necessitated by the continued need for replacement and upgrading of mains and service lines, the magnitude of future capital
-53-
expenditures or other investments in the Company’s other business segments depends, to a large degree, upon market conditions.
FINANCING CASH FLOW
The Company did not have any consolidated short-term debt outstanding at September 30, 2017 or September 30, 2016, nor was there any short-term debt outstanding during the year ended September 30, 2017. The Company continues to consider short-term debt (consisting of short-term notes payable to banks and commercial paper) an important source of cash for temporarily financing capital expenditures, gas-in-storage inventory, unrecovered purchased gas costs, margin calls on derivative financial instruments, exploration and development expenditures, other working capital needs and repayment of long-term debt. Fluctuations in these items can have a significant impact on the amount and timing of short-term debt.
On September 9, 2016, the Company entered into a Third Amended and Restated Credit Agreement (Credit Agreement) with a syndicate of what now numbers 13 banks. This Credit Agreement provides a $750.0 million multi-year unsecured committed revolving credit facility through December 5, 2019. The Credit Agreement also provided a $500.0 million 364-day unsecured committed revolving credit facility with 11 of the 13 banks, which expired on September 8, 2017 and was not subsequently renewed. The Company also has a number of individual uncommitted or discretionary lines of credit with certain financial institutions for general corporate purposes. Borrowings under the uncommitted lines of credit are made at competitive market rates. The uncommitted credit lines are revocable at the option of the financial institutions and are reviewed on an annual basis. The Company anticipates that its uncommitted lines of credit generally will be renewed or substantially replaced by similar lines.
The total amount available to be issued under the Company’s commercial paper program is $500.0 million. The commercial paper program is backed by the Credit Agreement, which provides that the Company's debt to capitalization ratio will not exceed .675 at the last day of any fiscal quarter through September 30, 2017, or .65 at the last day of any fiscal quarter from October 1, 2017 through December 5, 2019. At September 30, 2017, the Company’s debt to capitalization ratio (as calculated under the facility) was .58. The constraints specified in the Credit Agreement would have permitted an additional $1.15 billion in short-term and/or long-term debt to be outstanding (further limited by the indenture covenants discussed below) before the Company’s debt to capitalization ratio exceeded .675.
A downgrade in the Company’s credit ratings could increase borrowing costs, negatively impact the availability of capital from banks, commercial paper purchasers and other sources, and require the Company's subsidiaries to post letters of credit, cash or other assets as collateral with certain counterparties. If the Company is not able to maintain investment-grade credit ratings, it may not be able to access commercial paper markets. However, the Company expects that it could borrow under its credit facilities or rely upon other liquidity sources, including cash provided by operations.
The Credit Agreement contains a cross-default provision whereby the failure by the Company or its significant subsidiaries to make payments under other borrowing arrangements, or the occurrence of certain events affecting those other borrowing arrangements, could trigger an obligation to repay any amounts outstanding under the Credit Agreement. In particular, a repayment obligation could be triggered if (i) the Company or any of its significant subsidiaries fails to make a payment when due of any principal or interest on any other indebtedness aggregating $40.0 million or more or (ii) an event occurs that causes, or would permit the holders of any other indebtedness aggregating $40.0 million or more to cause, such indebtedness to become due prior to its stated maturity. As of September 30, 2017, the Company did not have any debt outstanding under the Credit Agreement.
On September 18, 2017, the Company issued $300.0 million of 3.95% notes due September 15, 2027. After deducting underwriting discounts, commissions and other debt issuance costs, the net proceeds to the Company amounted to $295.2 million. The holders of the notes may require the Company to repurchase their notes at a price equal to 101% of the principal amount in the event of a change in control and a ratings downgrade to a rating below investment grade. Additionally, the interest rate payable on the notes will be subject to adjustment from time to time, with a maximum of 2.00%, if certain change of control events involving a material subsidiary result in a downgrade of the credit rating assigned to the notes to below investment grade (or if the credit rating assigned to the notes is subsequently upgraded). The proceeds of this debt issuance were used to redeem $300.0 million of
-54-
the Company's 6.50% notes on October 18, 2017. The 6.50% notes were scheduled to mature in April 2018 and were classified as Current Portion of Long-Term Debt at September 30, 2017. The Company redeemed the notes for $307.0 million, plus accrued interest.
On June 25, 2015, the Company issued $450.0 million of 5.20% notes due July 15, 2025. After deducting underwriting discounts and commissions, the net proceeds to the Company amounted to $444.6 million. The holders of the notes may require the Company to repurchase their notes at a price equal to 101% of the principal amount in the event of a change in control and a ratings downgrade to a rating below investment grade. The proceeds of this debt issuance were used for general corporate purposes, including the reduction of short-term debt.
As discussed above, the Current Portion of Long-Term Debt at September 30, 2017 consisted of $300.0 million aggregate principal amount of 6.50% notes scheduled to mature in April 2018. None of the Company’s long-term debt at September 30, 2016 had a maturity date within the following twelve-month period.
The Company’s embedded cost of long-term debt was 5.34% and 5.53% at September 30, 2017 and September 30, 2016, respectively. Refer to “Interest Rate Risk” in this Item for a more detailed breakdown of the Company’s embedded cost of long-term debt.
Under the Company’s existing indenture covenants at September 30, 2017, the Company would have been permitted to issue up to a maximum of $126.0 million in additional long-term indebtedness at then current market interest rates in addition to being able to issue new indebtedness to replace maturing debt. However, that amount does not take into account the October 18, 2017 redemption of the 6.50% notes discussed above. After the redemption, the Company would have been permitted to issue up to a maximum of $426.0 million in additional long-term indebtedness at then current market rates in addition to being able to issue new indebtedness to replace maturing debt. The Company's present liquidity position is believed to be adequate to satisfy known demands. However, if the Company were to experience a significant loss in the future (for example, as a result of an impairment of oil and gas properties), it is possible, depending on factors including the magnitude of the loss, that these indenture covenants would restrict the Company's ability to issue additional long-term unsecured indebtedness for a period of up to nine calendar months, beginning with the fourth calendar month following the loss. This would not preclude the Company from issuing new indebtedness to replace maturing debt. Please refer to the Critical Accounting Estimates section above for a sensitivity analysis concerning commodity price changes and their impact on the ceiling test.
The Company’s 1974 indenture pursuant to which $98.7 million (or 4.1%) of the Company’s long-term debt (as of September 30, 2017) was issued, contains a cross-default provision whereby the failure by the Company to perform certain obligations under other borrowing arrangements could trigger an obligation to repay the debt outstanding under the indenture. In particular, a repayment obligation could be triggered if the Company fails (i) to pay any scheduled principal or interest on any debt under any other indenture or agreement or (ii) to perform any other term in any other such indenture or agreement, and the effect of the failure causes, or would permit the holders of the debt to cause, the debt under such indenture or agreement to become due prior to its stated maturity, unless cured or waived.
OFF-BALANCE SHEET ARRANGEMENTS
The Company has entered into certain off-balance sheet financing arrangements. These financing arrangements are primarily operating leases. The Company’s consolidated subsidiaries have operating leases, the majority of which are with the Exploration and Production segment and Corporate operations, having a remaining lease commitment of approximately $24.7 million. These leases have been entered into for the use of compressors, drilling rigs, buildings and other items and are accounted for as operating leases.
-55-
CONTRACTUAL OBLIGATIONS
The following table summarizes the Company’s expected future contractual cash obligations as of September 30, 2017, and the twelve-month periods over which they occur:
Payments by Expected Maturity Dates | |||||||||||||||||||||||||||
2018 | 2019 | 2020 | 2021 | 2022 | Thereafter | Total | |||||||||||||||||||||
(Millions) | |||||||||||||||||||||||||||
Long-Term Debt, including interest expense(1) | $ | 409.3 | $ | 348.6 | $ | 85.8 | $ | 85.8 | $ | 565.5 | $ | 1,493.6 | $ | 2,988.6 | |||||||||||||
Operating Lease Obligations | $ | 10.8 | $ | 4.6 | $ | 3.7 | $ | 2.2 | $ | 1.5 | $ | 1.9 | $ | 24.7 | |||||||||||||
Purchase Obligations: | |||||||||||||||||||||||||||
Gas Purchase Contracts(2) | $ | 198.6 | $ | 21.0 | $ | 12.5 | $ | — | $ | — | $ | — | $ | 232.1 | |||||||||||||
Transportation and Storage Contracts(3) | $ | 63.8 | $ | 63.6 | $ | 65.4 | $ | 70.9 | $ | 61.7 | $ | 504.9 | $ | 830.3 | |||||||||||||
Hydraulic Fracturing and Fuel Obligations | $ | 79.5 | $ | 98.0 | $ | 17.1 | $ | — | $ | — | $ | — | $ | 194.6 | |||||||||||||
Pipeline, Compressor and Gathering Projects | $ | 61.7 | $ | 0.7 | $ | 0.2 | $ | 0.3 | $ | 0.3 | $ | 1.1 | $ | 64.3 | |||||||||||||
Other | $ | 20.4 | $ | 13.7 | $ | 11.1 | $ | 9.8 | $ | 7.9 | $ | 26.6 | $ | 89.5 | |||||||||||||
(1) | Refer to Note E — Capitalization and Short-Term Borrowings, as well as the table under Interest Rate Risk in the Market Risk Sensitive Instruments section below, for the amounts excluding interest expense. As noted in Note E, the Company redeemed its $300.0 million 6.50% notes in October 2017. These notes were scheduled to mature in April 2018. The impact of the October redemption is reflected in the table. |
(2) | Gas prices are variable based on the NYMEX prices adjusted for basis. |
(3) | Transportation service contractual obligations include the following precedent agreements executed by the Exploration and Production segment for transportation of Appalachian gas: $20.1 million for 2018, $21.5 million for 2019, $21.6 million for 2020, $27.3 million for 2021, $33.2 million for 2022 and $453.7 million thereafter. |
The Company has other long-term obligations recorded on its Consolidated Balance Sheets that are not reflected in the table above. Such long-term obligations include pension and other post-retirement liabilities, asset retirement obligations, deferred income tax liabilities, various regulatory liabilities, derivative financial instrument liabilities and other deferred credits (the majority of which consist of liabilities for non-qualified benefit plans, deferred compensation liabilities, environmental liabilities and workers compensation liabilities).
The Company has made certain other guarantees on behalf of its subsidiaries. The guarantees relate primarily to: (i) obligations under derivative financial instruments, which are included on the Consolidated Balance Sheets in accordance with the authoritative guidance (see Item 7, MD&A under the heading “Critical Accounting Estimates - Accounting for Derivative Financial Instruments”); (ii) NFR obligations to purchase gas or to purchase gas transportation/storage services where the amounts due on those obligations each month are included on the Consolidated Balance Sheets as a current liability; and (iii) other obligations which are reflected on the Consolidated Balance Sheets. The Company believes that the likelihood it would be required to make payments under the guarantees is remote, and therefore has not included them in the table above.
OTHER MATTERS
In addition to the environmental and other matters discussed in this Item 7 and in Item 8 at Note I — Commitments and Contingencies, the Company is involved in other litigation and regulatory matters arising in the normal course of business. These other matters may include, for example, negligence claims and tax, regulatory or other governmental audits, inspections, investigations or other proceedings. These matters may involve state and federal taxes, safety, compliance with regulations, rate base, cost of service and purchased gas cost issues, among other things. While these normal-course matters could have a material effect on earnings and cash flows
-56-
in the period in which they are resolved, they are not expected to change materially the Company’s present liquidity position, nor are they expected to have a material adverse effect on the financial condition of the Company.
The Company has a tax-qualified, noncontributory defined-benefit retirement plan (Retirement Plan). The Company has been making contributions to the Retirement Plan over the last several years and anticipates that it will continue making contributions to the Retirement Plan. During 2017, the Company contributed $17.1 million to the Retirement Plan. The Company anticipates that the annual contribution to the Retirement Plan in 2018 will be in the range of $15.0 million to $40.0 million. The Company expects that all subsidiaries having employees covered by the Retirement Plan will make contributions to the Retirement Plan. The funding of such contributions will come from amounts collected in rates in the Utility and Pipeline and Storage segments or through cash on hand, cash from operations or short-term borrowings.
The Company provides health care and life insurance benefits (other post-retirement benefits) for a majority of its retired employees. The Company has established VEBA trusts and 401(h) accounts for its other post-retirement benefits. The Company has been making contributions to its VEBA trusts and/or 401(h) accounts over the last several years and anticipates that it will continue making contributions to the VEBA trusts and/or 401(h) accounts. During 2017, the Company contributed $3.8 million to its VEBA trusts. The Company anticipates that the annual contribution to its VEBA trusts in 2018 will be in the range of $2.5 million to $4.0 million. The funding of such contributions will come from amounts collected in rates in the Utility and Pipeline and Storage segments.
MARKET RISK SENSITIVE INSTRUMENTS
Energy Commodity Price Risk
The Company uses various derivative financial instruments (derivatives), including price swap agreements and futures contracts, as part of the Company’s overall energy commodity price risk management strategy in its Exploration and Production and Energy Marketing segments. Under this strategy, the Company manages a portion of the market risk associated with fluctuations in the price of natural gas and crude oil, thereby attempting to provide more stability to operating results. The Company has operating procedures in place that are administered by experienced management to monitor compliance with the Company’s risk management policies. The derivatives are not held for trading purposes. The fair value of these derivatives, as shown below, represents the amount that the Company would receive from, or pay to, the respective counterparties at September 30, 2017 to terminate the derivatives. However, the tables below and the fair value that is disclosed do not consider the physical side of the natural gas and crude oil transactions that are related to the financial instruments.
On July 21, 2010, the Dodd-Frank Act was signed into law. The Dodd-Frank Act includes provisions related to the swaps and over-the-counter derivatives markets. Certain provisions of the Dodd-Frank Act related to derivatives became effective July 16, 2011, but other provisions related to derivatives have or will become effective as federal agencies (including the CFTC, various banking regulators and the SEC) adopt rules to implement the law. Among other things, the Dodd-Frank Act (1) regulates certain participants in the swaps markets, including new entities defined as “swap dealers” and “major swap participants,” (2) requires clearing and exchange-trading of certain swaps that the CFTC determines must be cleared, (3) requires reporting and recordkeeping of swaps, and (4) enhances the CFTC’s enforcement authority, including the authority to establish position limits on derivatives and increases penalties for violations of the Commodity Exchange Act. For purposes of the Dodd-Frank Act, under rules adopted by the SEC and/or CFTC, the Company believes that it qualifies as a non-financial end user of derivatives, that is, as a non-financial entity that uses derivatives to hedge or mitigate commercial risk. Nevertheless, other rules that have been adopted or are being developed could have a significant impact on the Company. For example, the CFTC has imposed numerous registration, swaps documentation, business conduct, reporting, and recordkeeping requirements on swap dealers and major swap participants, which frequently are counterparties to the Company’s derivative hedging transactions. While many of the final rules adopted by the CFTC and other regulators place specific conditions on the operations of swap dealers and major swap participants, concern remains that swap dealers and major swap participants will pass along their increased costs stemming from the final and proposed rules through higher transaction costs and prices or other direct or indirect costs. For example, the Dodd-Frank Act requires that certain swaps be cleared and traded on exchanges or swap execution facilities, with certain exceptions for swaps that end-users such as the Company use to hedge or mitigate commercial risk. While the Company expects to be excluded from these clearing and trading requirements for swaps used to
-57-
hedge its commercial risks, there may be increased transaction costs or decreased liquidity with respect to entering into such uncleared and non-exchange traded swaps. Also, during 2015, the bank regulators and the CFTC, respectively, adopted final margin rules that apply to swap dealers and major swap participants with respect to uncleared swaps. While these rules do not impose a requirement on swap dealers and major swap participants to collect margin for uncleared swaps from non-financial end users such as the Company, the obligations may increase the costs of uncleared swaps. For example, among other things, to fulfill obligations imposed on them under the rules, swap dealers may seek to negotiate collateral or other credit arrangements in their swap agreements with counterparties, which would increase the cost of transactions in uncleared swaps and affect the Company’s liquidity and reduce our available cash. In 2016, the CFTC issued a reproposal to its position limit rules that would impose speculative position limits on positions in 28 core physical commodity contracts as well as economically equivalent futures, options and swaps. While the Company does not intend to enter into positions on a speculative basis, such rules could nevertheless impact the ability of the Company to enter into certain derivative hedging transactions with respect to such commodities. If we reduce our use of hedging transactions as a result of final regulations to be issued by the CFTC, our results of operations may become more volatile and our cash flows may be less predictable. The Dodd-Frank Act may also increase costs for derivative recordkeeping, reporting, documentation, position limit compliance, and other compliance; cause parties to materially alter the terms of derivative contracts; cause parties to restructure certain derivative contracts; reduce the availability of derivatives to protect against risks that the Company encounters or to optimize assets; reduce the Company’s ability to monetize or restructure existing derivative contracts; and increase the Company’s exposure to less creditworthy counterparties, all of which could increase the Company’s business costs. Finally, given the additional anti-market manipulation, anti-fraud and disruptive trading practices regulations that prohibit, among other things, fraud and price manipulation in the physical commodities, futures, options and swaps markets, it is difficult to predict how the evolving enforcement priorities of the CFTC will impact our business. Should we violate the laws regulating hedging activities or regulations promulgated by the CFTC, we could be subject to CFTC enforcement action and material penalties and sanctions. The Company continues to monitor these developments but cannot predict the impact the Dodd-Frank Act may ultimately have on its operations.
The accounting rules for fair value measurements and disclosures require consideration of the impact of nonperformance risk (including credit risk) from a market participant perspective in the measurement of the fair value of assets and liabilities. At September 30, 2017, the Company determined that nonperformance risk would have no material impact on its financial position or results of operation. To assess nonperformance risk, the Company considered information such as any applicable collateral posted, master netting arrangements, and applied a market-based method by using the counterparty's (assuming the derivative is in a gain position) or the Company’s (assuming the derivative is in a loss position) credit default swaps rates.
The following tables disclose natural gas and crude oil price swap information by expected maturity dates for agreements in which the Company receives a fixed price in exchange for paying a variable price as quoted in various national natural gas publications or on the NYMEX. Notional amounts (quantities) are used to calculate the contractual payments to be exchanged under the contract. The weighted average variable prices represent the weighted average settlement prices by expected maturity date as of September 30, 2017. At September 30, 2017, the Company had not entered into any natural gas or crude oil price swap agreements extending beyond 2022 (the natural gas price swap agreements maturing in 2023 were insignificant).
Natural Gas Price Swap Agreements
Expected Maturity Dates | |||||||||||||||||||||||
2018 | 2019 | 2020 | 2021 | 2022 | Total | ||||||||||||||||||
Notional Quantities (Equivalent Bcf) | 51.3 | 33.8 | 23.5 | 5.3 | 0.1 | 114.0 | |||||||||||||||||
Weighted Average Fixed Rate (per Mcf) | $ | 3.44 | $ | 3.26 | $ | 3.17 | $ | 3.13 | $ | 3.05 | $ | 3.32 | |||||||||||
Weighted Average Variable Rate (per Mcf) | $ | 3.16 | $ | 3.01 | $ | 2.90 | $ | 3.01 | $ | 3.00 | $ | 3.06 | |||||||||||
Of the total Bcf above, 1.6 Bcf is accounted for as fair value hedges at a weighted average fixed rate of $3.61 per Mcf. The remaining 112.4 Bcf are accounted for as cash flow hedges at a weighted average fixed rate of $3.18 per Mcf.
-58-
At September 30, 2017, the Company had long (purchased) swaps covering 2.0 Bcf extending through 2022 at a weighted average fixed rate of $3.45 per Mcf and a weighted average settlement rate of $3.09 per Mcf. The Company had short (sold) swaps covering 112.0 Bcf extending through 2020 at a weighted average fixed rate of $3.31 per Mcf and a weighted average settlement rate of $3.06 per Mcf at September 30, 2017. At September 30, 2017, the Company would have received from its respective counterparties an aggregate of approximately $27.3 million to terminate the natural gas price swap agreements outstanding at that date.
At September 30, 2016, the Company had natural gas price swap agreements covering 158.6 Bcf at a weighted average fixed rate of $3.68 per Mcf, which included long (purchased) swaps covering 2.3 Bcf extending through 2019 at a weighted average fixed rate of $3.64 per Mcf and a weighted average settlement rate of $3.13 per Mcf and short (sold) swaps covering 156.3 Bcf extending through 2021 at a weighted average fixed rate of $3.68 per Mcf and a weighted average settlement rate of $3.05 per Mcf.
Crude Oil Price Swap Agreements
2018 | 2019 | 2020 | 2021 | 2022 | Total | ||||||||||||||||||
Notional Quantities (Equivalent Bbls) | 1,755,000 | 1,068,000 | 324,000 | 156,000 | 156,000 | 3,459,000 | |||||||||||||||||
Weighted Average Fixed Rate (per Bbl) | $ | 54.30 | $ | 53.42 | $ | 50.52 | $ | 51.00 | $ | 51.00 | $ | 53.38 | |||||||||||
Weighted Average Variable Rate (per Bbl) | $ | 52.04 | $ | 51.13 | $ | 50.59 | $ | 50.58 | $ | 50.82 | $ | 51.50 | |||||||||||
At September 30, 2017, the Company would have received from its respective counterparties an aggregate of approximately $6.4 million to terminate the crude oil price swap agreements outstanding at that date.
At September 30, 2016, the Company had crude oil price swap agreements covering 1,755,000 Bbls at a weighted average fixed rate of $62.73 per Bbl.
Futures Contracts
The following table discloses the net contract volume purchased (sold), weighted average contract prices and weighted average settlement prices by expected maturity date for futures contracts used to manage natural gas price risk. At September 30, 2017, the Company did not hold any futures contracts with maturity dates extending beyond 2023.
Expected Maturity Dates | |||||||||||||||||||||||||||
2018 | 2019 | 2020 | 2021 | 2022 | 2023 | Total | |||||||||||||||||||||
Net Contract Volume Purchased (Sold) (Equivalent Bcf) | 4.4 | 4.4 | 1.4 | 0.8 | 0.7 | 0.1 | 11.8 | ||||||||||||||||||||
Weighted Average Contract Price (per Mcf) | $ | 3.41 | $ | 3.12 | $ | 3.08 | $ | 2.99 | $ | 2.99 | $ | 2.99 | $ | 3.32 | |||||||||||||
Weighted Average Settlement Price (per Mcf) | $ | 3.34 | $ | 3.18 | $ | 3.10 | $ | 2.96 | $ | 2.96 | $ | 3.15 | $ | 3.27 | |||||||||||||
At September 30, 2017, the Company had long (purchased) contracts covering 15.3 Bcf of gas extending through 2023 at a weighted average contract price of $3.15 per Mcf and a weighted average settlement price of $3.16 per Mcf. All of this is accounted for as fair value hedges and are used by the Company’s Energy Marketing segment to hedge against rising prices, a risk to which this segment is exposed due to the fixed price gas sales commitments that it enters into with certain residential, commercial, industrial, public authority and wholesale customers. The Company would have received $0.1 million to terminate these contracts at September 30, 2017.
At September 30, 2017, the Company had short (sold) contracts covering 3.5 Bcf of gas extending through 2020 at a weighted average contract price of $3.47 per Mcf and a weighted average settlement price of $3.37 per Mcf. Of this amount, 2.4 Bcf is accounted for as cash flow hedges as these contracts relate to the anticipated sale of natural gas by the Company's Energy Marketing segment. The remaining 1.1 Bcf is accounted for as fair value hedges, the majority of which are used to hedge against falling prices, a risk to which the Energy Marketing segment
-59-
is exposed due to the fixed price gas purchase commitments that it enters into with certain natural gas suppliers. The Company would have received $0.4 million to terminate these contracts at September 30, 2017.
At September 30, 2016, the Company had long (purchased) contracts covering 10.5 Bcf of gas extending through 2019 at a weighted average contract price of $3.46 per Mcf and a weighted average settlement price of $3.39 per Mcf.
At September 30, 2016, the Company had short (sold) contracts covering 3.5 Bcf of gas extending through 2019 at a weighted average contract price of $3.71 per Mcf and a weighted average settlement price of $3.37 per Mcf.
Foreign Exchange Risk
The Company uses foreign exchange forward contracts to manage the risk of currency fluctuations associated with transportation costs denominated in Canadian currency in the Exploration and Production segment. All of these transactions are forecasted.
The following table discloses foreign exchange contract information by expected maturity dates. The Company receives a fixed price in exchange for paying a variable price as noted in the Canadian to U.S. dollar forward exchange rates. Notional amounts (Canadian dollars) are used to calculate the contractual payments to be exchanged under contract. The weighted average variable prices represent the weighted average settlement prices by expected maturity date as of September 30, 2017. At September 30, 2017, the Company had not entered into any foreign currency exchange contracts extending beyond 2026.
Expected Maturity Dates | |||||||||||||||||||||||||||
2018 | 2019 | 2020 | 2021 | 2022 | Thereafter | Total | |||||||||||||||||||||
Notional Quantities (Canadian Dollar in millions) | $ | 14.4 | $ | 14.4 | $ | 14.4 | $ | 11.1 | $ | 11.1 | $ | 23.8 | $ | 89.2 | |||||||||||||
Weighted Average Fixed Rate ($Cdn/$US) | $ | 1.25 | $ | 1.25 | $ | 1.24 | $ | 1.30 | $ | 1.29 | $ | 1.27 | $ | 1.26 | |||||||||||||
Weighted Average Variable Rate ($Cdn/$US) | $ | 1.24 | $ | 1.25 | $ | 1.25 | $ | 1.27 | $ | 1.26 | $ | 1.26 | $ | 1.25 | |||||||||||||
At September 30, 2017, absent other positions with the same counterparties, the Company would have received from its respective counterparties an aggregate of $0.8 million to terminate these foreign exchange contracts.
Refer to Item 8 at Note G — Financial Instruments for a discussion of the Company’s exposure to credit risk related to its derivative financial instruments.
Interest Rate Risk
The fair value of long-term fixed rate debt is $2.5 billion at September 30, 2017. This fair value amount is not intended to reflect principal amounts that the Company will ultimately be required to pay. The following table presents the principal cash repayments and related weighted average interest rates by expected maturity date for the Company’s long-term fixed rate debt:
Principal Amounts by Expected Maturity Dates | |||||||||||||||||||||||||||
2018 | 2019 | 2020 | 2021 | 2022 | Thereafter | Total | |||||||||||||||||||||
(Dollars in millions) | |||||||||||||||||||||||||||
Long-Term Fixed Rate Debt | $ | 300.0 | $ | 250.0 | $ | — | $ | — | $ | 500.0 | $ | 1,349.0 | $ | 2,399.0 | |||||||||||||
Weighted Average Interest Rate Paid | 6.5 | % | 8.8 | % | — | — | 4.9 | % | 4.5 | % | 5.3 | % | |||||||||||||||
RATE AND REGULATORY MATTERS
Utility Operation
Delivery rates for both the New York and Pennsylvania divisions are regulated by the states’ respective public utility commissions and typically are changed only when approved through a procedure known as a “rate case.”
-60-
Although the Pennsylvania division does not have a rate case on file, see below for a description of the current rate proceedings affecting the New York division. In both jurisdictions, delivery rates do not reflect the recovery of purchased gas costs. Prudently-incurred gas costs are recovered through operation of automatic adjustment clauses, and are collected primarily through a separately-stated “supply charge” on the customer bill.
New York Jurisdiction
On April 28, 2016, Distribution Corporation commenced a rate case by filing proposed tariff amendments and supporting testimony requesting approval to increase its annual revenues by approximately $41.7 million. Distribution Corporation explained in the filing that its request for rate relief was necessitated by a revenue requirement driven primarily by rate base growth, higher operating expense and higher depreciation expense, among other things. On January 23, 2017, the administrative law judge assigned to the proceeding issued a recommended decision (RD) in the case. The RD, as revised on January 26, 2017, recommended a rate increase designed to provide additional annual revenues of $8.5 million, an equity ratio, subject to update of 42.3% based on the Company’s equity ratio, and a cost of equity, subject to update of 8.6%. On April 20, 2017, the NYPSC issued an Order adopting some provisions of the RD and modifying or rejecting others. The Order provides for an annual rate increase of $5.9 million. The rate increase became effective May 1, 2017. The Order further provides for a return on equity of 8.7%, and established an equity ratio of 42.9%. The Order also directs the implementation of an earnings sharing mechanism to be in place beginning on April 1, 2018.
On July 28, 2017, Distribution Corporation filed an appeal with New York State Supreme Court, Albany County, seeking review of the Order. The appeal contends that portions of the Order should be invalidated because they fail to meet the applicable legal standard for agency decisions. On October 13, 2017, the NYPSC filed an answer which contained a request that the appeal be transferred to the Appellate Division. The Company cannot predict the outcome of the appeal at this time.
Pennsylvania Jurisdiction
Distribution Corporation’s current delivery charges in its Pennsylvania jurisdiction were approved by the PaPUC on November 30, 2006 as part of a settlement agreement that became effective January 1, 2007.
Pipeline and Storage
Supply Corporation currently has no active rate case on file. Supply Corporation's current rate settlement requires a rate case filing no later than December 31, 2019.
Empire currently has no active rate case on file. Empire’s current rate settlement requires a rate case filing no later than July 1, 2021.
ENVIRONMENTAL MATTERS
The Company is subject to various federal, state and local laws and regulations relating to the protection of the environment. The Company has established procedures for the ongoing evaluation of its operations to identify potential environmental exposures and comply with regulatory requirements.
For further discussion of the Company's environmental exposures, refer to Item 8 at Note I — Commitments and Contingencies under the heading “Environmental Matters.”
Legislative and regulatory measures to address climate change and greenhouse gas emissions are in various phases of discussion or implementation. In the United States, these efforts include legislative proposals and EPA regulations at the federal level, actions at the state level, and private party litigation related to greenhouse gas emissions. While the U.S. Congress has from time to time considered legislation aimed at reducing emissions of greenhouse gases, Congress has not yet passed any federal climate change legislation and we cannot predict when or if Congress will pass such legislation and in what form. In the absence of such legislation, the EPA is regulating greenhouse gas emissions pursuant to the authority granted to it by the federal Clean Air Act. For example, in April 2012, the EPA adopted rules which restrict emissions associated with oil and natural gas drilling. The EPA previously adopted final regulations that set methane and volatile organic compound emissions standards for new or modified
-61-
oil and gas emissions sources. These rules impose more stringent leak detection and repair requirements, and further address reporting and control of methane and volatile organic compound emissions. The current administration has issued executive orders to roll back many of these regulations, and, in turn, litigation (not involving the Company) has been instituted to challenge the administration's efforts. The Company must continue to comply with all applicable regulations. In addition, the U.S. Congress has from time to time considered bills that would establish a cap-and-trade program to reduce emissions of greenhouse gases. A number of states have adopted energy strategies or plans with goals that include the reduction of greenhouse gas emissions. New York’s State Energy Plan, which includes Reforming the Energy Vision (REV) initiatives, sets greenhouse gas emission reduction targets of 40% by 2030 and 80% by 2050. Additionally, the Plan targets that 50% of electric generation must come from renewable energy sources by 2030. With respect to its operations in California, the Company currently complies with California cap-and-trade guidelines, which increases the Company's cost of environmental compliance in its Exploration and Production segment operations. Legislation or regulation that aims to reduce greenhouse gas emissions could also include carbon taxes, restrictive permitting, increased efficiency standards, and incentives or mandates to conserve energy or use renewable energy sources. Federal, state or local governments may, for example, provide tax advantages and other subsidies to support alternative energy sources, mandate the use of specific fuels or technologies, or promote research into new technologies to reduce the cost and increase the scalability of alternative energy sources. These climate change and greenhouse gas initiatives could increase the Company’s cost of environmental compliance by requiring the Company to install new equipment to reduce emissions from larger facilities and/or purchase emission allowances. They could also delay or otherwise negatively affect efforts to obtain permits and other regulatory approvals with regard to existing and new facilities, impose additional monitoring and reporting requirements, and reduce demand for oil and natural gas. But legislation or regulation that sets a price on or otherwise restricts carbon emissions could also benefit the Company by increasing demand for natural gas, because substantially fewer carbon emissions per Btu of heat generated are associated with the use of natural gas than with certain alternate fuels such as coal and oil. The effect (material or not) on the Company of any new legislative or regulatory measures will depend on the particular provisions that are ultimately adopted.
NEW AUTHORITATIVE ACCOUNTING AND FINANCIAL REPORTING GUIDANCE
For discussion of the recently issued authoritative accounting and financial reporting guidance, refer to Item 8 at Note A — Summary of Significant Accounting Policies under the heading “New Authoritative Accounting and Financial Reporting Guidance.”
EFFECTS OF INFLATION
Although the rate of inflation has been relatively low over the past few years, the Company’s operations remain sensitive to increases in the rate of inflation because of its capital spending and the regulated nature of a significant portion of its business.
SAFE HARBOR FOR FORWARD-LOOKING STATEMENTS
The Company is including the following cautionary statement in this Form 10-K to make applicable and take advantage of the safe harbor provisions of the Private Securities Litigation Reform Act of 1995 for any forward-looking statements made by, or on behalf of, the Company. Forward-looking statements include statements concerning plans, objectives, goals, projections, strategies, future events or performance, and underlying assumptions and other statements which are other than statements of historical facts. From time to time, the Company may publish or otherwise make available forward-looking statements of this nature. All such subsequent forward-looking statements, whether written or oral and whether made by or on behalf of the Company, are also expressly qualified by these cautionary statements. Certain statements contained in this report, including, without limitation, statements regarding future prospects, plans, objectives, goals, projections, estimates of oil and gas quantities, strategies, future events or performance and underlying assumptions, capital structure, anticipated capital expenditures, completion of construction projects, projections for pension and other post-retirement benefit obligations, impacts of the adoption of new accounting rules, and possible outcomes of litigation or regulatory proceedings, as well as statements that are identified by the use of the words “anticipates,” “estimates,” “expects,” “forecasts,” “intends,” “plans,” “predicts,” “projects,” “believes,” “seeks,” “will,” “may,” and similar expressions,
-62-
are “forward-looking statements” as defined in the Private Securities Litigation Reform Act of 1995 and accordingly involve risks and uncertainties which could cause actual results or outcomes to differ materially from those expressed in the forward-looking statements. The Company’s expectations, beliefs and projections are expressed in good faith and are believed by the Company to have a reasonable basis, but there can be no assurance that management’s expectations, beliefs or projections will result or be achieved or accomplished. In addition to other factors and matters discussed elsewhere herein, the following are important factors that, in the view of the Company, could cause actual results to differ materially from those discussed in the forward-looking statements:
1. | Delays or changes in costs or plans with respect to Company projects or related projects of other companies, including difficulties or delays in obtaining necessary governmental approvals, permits or orders or in obtaining the cooperation of interconnecting facility operators; |
2. | Governmental/regulatory actions, initiatives and proceedings, including those involving rate cases (which address, among other things, target rates of return, rate design and retained natural gas), environmental/safety requirements, affiliate relationships, industry structure, and franchise renewal; |
3. | Changes in laws, regulations or judicial interpretations to which the Company is subject, including those involving derivatives, taxes, safety, employment, climate change, other environmental matters, real property, and exploration and production activities such as hydraulic fracturing; |
4. | Impairments under the SEC’s full cost ceiling test for natural gas and oil reserves; |
5. | Changes in the price of natural gas or oil; |
6. | Financial and economic conditions, including the availability of credit, and occurrences affecting the Company’s ability to obtain financing on acceptable terms for working capital, capital expenditures and other investments, including any downgrades in the Company’s credit ratings and changes in interest rates and other capital market conditions; |
7. | Factors affecting the Company’s ability to successfully identify, drill for and produce economically viable natural gas and oil reserves, including among others geology, lease availability, title disputes, weather conditions, shortages, delays or unavailability of equipment and services required in drilling operations, insufficient gathering, processing and transportation capacity, the need to obtain governmental approvals and permits, and compliance with environmental laws and regulations; |
8. | Increasing health care costs and the resulting effect on health insurance premiums and on the obligation to provide other post-retirement benefits; |
9. | Changes in price differentials between similar quantities of natural gas or oil at different geographic locations, and the effect of such changes on commodity production, revenues and demand for pipeline transportation capacity to or from such locations; |
10. | Other changes in price differentials between similar quantities of natural gas or oil having different quality, heating value, hydrocarbon mix or delivery date; |
11. | The cost and effects of legal and administrative claims against the Company or activist shareholder campaigns to effect changes at the Company; |
12. | Uncertainty of oil and gas reserve estimates; |
13. | Significant differences between the Company’s projected and actual production levels for natural gas or oil; |
14. | Changes in demographic patterns and weather conditions; |
15. | Changes in the availability, price or accounting treatment of derivative financial instruments; |
16. | Changes in laws, actuarial assumptions, the interest rate environment and the return on plan/trust assets related to the Company’s pension and other post-retirement benefits, which can affect future funding obligations and costs and plan liabilities; |
-63-
17. | Changes in economic conditions, including global, national or regional recessions, and their effect on the demand for, and customers’ ability to pay for, the Company’s products and services; |
18. | The creditworthiness or performance of the Company’s key suppliers, customers and counterparties; |
19. | Economic disruptions or uninsured losses resulting from major accidents, fires, severe weather, natural disasters, terrorist activities, acts of war, cyber attacks or pest infestation; |
20. | Significant differences between the Company’s projected and actual capital expenditures and operating expenses; or |
21. | Increasing costs of insurance, changes in coverage and the ability to obtain insurance. |
The Company disclaims any obligation to update any forward-looking statements to reflect events or circumstances after the date hereof.
INDUSTRY AND MARKET DATA DISCLOSURE
The market data and certain other statistical information used throughout this Form 10-K are based on independent industry publications, government publications or other published independent sources. Some data is also based on the Company's good faith estimates. Although the Company believes these third-party sources are reliable and that the information is accurate and complete, it has not independently verified the information.
Item 7A | Quantitative and Qualitative Disclosures About Market Risk |
Refer to the “Market Risk Sensitive Instruments” section in Item 7, MD&A.
-64-
Item 8 | Financial Statements and Supplementary Data |
Index to Financial Statements
Page | |
Financial Statements and Financial Statement Schedule: | |
All other schedules are omitted because they are not applicable or the required information is shown in the Consolidated Financial Statements or Notes thereto.
Supplementary Data
Supplementary data that is included in Note K — Quarterly Financial Data (unaudited) and Note M — Supplementary Information for Oil and Gas Producing Activities (unaudited), appears under this Item, and reference is made thereto.
-65-
REPORT OF INDEPENDENT REGISTERED PUBLIC ACCOUNTING FIRM
To the Board of Directors and Shareholders of National Fuel Gas Company:
In our opinion, the consolidated financial statements listed in the accompanying index, present fairly, in all material respects, the financial position of National Fuel Gas Company and its subsidiaries as of September 30, 2017 and September 30, 2016, and the results of their operations and their cash flows for each of the three years in the period ended September 30, 2017 in conformity with accounting principles generally accepted in the United States of America. In addition, in our opinion, the financial statement schedule listed in the accompanying index presents fairly, in all material respects, the information set forth therein when read in conjunction with the related consolidated financial statements. Also in our opinion, the Company maintained, in all material respects, effective internal control over financial reporting as of September 30, 2017, based on criteria established in Internal Control - Integrated Framework (2013) issued by the Committee of Sponsoring Organizations of the Treadway Commission (COSO). The Company's management is responsible for these financial statements and financial statement schedule, for maintaining effective internal control over financial reporting and for its assessment of the effectiveness of internal control over financial reporting, included in Management's Annual Report on Internal Control over Financial Reporting under item 9A. Our responsibility is to express opinions on these financial statements, on the financial statement schedule, and on the Company's internal control over financial reporting based on our integrated audits. We conducted our audits in accordance with the standards of the Public Company Accounting Oversight Board (United States). Those standards require that we plan and perform the audits to obtain reasonable assurance about whether the financial statements are free of material misstatement and whether effective internal control over financial reporting was maintained in all material respects. Our audits of the financial statements included examining, on a test basis, evidence supporting the amounts and disclosures in the financial statements, assessing the accounting principles used and significant estimates made by management, and evaluating the overall financial statement presentation. Our audit of internal control over financial reporting included obtaining an understanding of internal control over financial reporting, assessing the risk that a material weakness exists, and testing and evaluating the design and operating effectiveness of internal control based on the assessed risk. Our audits also included performing such other procedures as we considered necessary in the circumstances. We believe that our audits provide a reasonable basis for our opinions.
A company’s internal control over financial reporting is a process designed to provide reasonable assurance regarding the reliability of financial reporting and the preparation of financial statements for external purposes in accordance with generally accepted accounting principles. A company’s internal control over financial reporting includes those policies and procedures that (i) pertain to the maintenance of records that, in reasonable detail, accurately and fairly reflect the transactions and dispositions of the assets of the company; (ii) provide reasonable assurance that transactions are recorded as necessary to permit preparation of financial statements in accordance with generally accepted accounting principles, and that receipts and expenditures of the company are being made only in accordance with authorizations of management and directors of the company; and (iii) provide reasonable assurance regarding prevention or timely detection of unauthorized acquisition, use, or disposition of the company’s assets that could have a material effect on the financial statements.
Because of its inherent limitations, internal control over financial reporting may not prevent or detect misstatements. Also, projections of any evaluation of effectiveness to future periods are subject to the risk that controls may become inadequate because of changes in conditions, or that the degree of compliance with the policies or procedures may deteriorate.
/s/ PRICEWATERHOUSECOOPERS LLP
Buffalo, New York
November 17, 2017
-66-
NATIONAL FUEL GAS COMPANY
CONSOLIDATED STATEMENTS OF INCOME AND EARNINGS
REINVESTED IN THE BUSINESS
Year Ended September 30 | |||||||||||
2017 | 2016 | 2015 | |||||||||
(Thousands of dollars, except per common share amounts) | |||||||||||
INCOME | |||||||||||
Operating Revenues: | |||||||||||
Utility and Energy Marketing Revenues | $ | 755,485 | $ | 624,602 | $ | 860,618 | |||||
Exploration and Production and Other Revenues | 617,666 | 611,766 | 696,709 | ||||||||
Pipeline and Storage and Gathering Revenues | 206,730 | 216,048 | 203,586 | ||||||||
1,579,881 | 1,452,416 | 1,760,913 | |||||||||
Operating Expenses: | |||||||||||
Purchased Gas | 275,254 | 147,982 | 349,984 | ||||||||
Operation and Maintenance: | |||||||||||
Utility and Energy Marketing | 199,293 | 192,512 | 203,249 | ||||||||
Exploration and Production and Other | 145,099 | 160,201 | 184,024 | ||||||||
Pipeline and Storage and Gathering | 98,200 | 88,801 | 82,730 | ||||||||
Property, Franchise and Other Taxes | 84,995 | 81,714 | 89,564 | ||||||||
Depreciation, Depletion and Amortization | 224,195 | 249,417 | 336,158 | ||||||||
Impairment of Oil and Gas Producing Properties | — | 948,307 | 1,126,257 | ||||||||
1,027,036 | 1,868,934 | 2,371,966 | |||||||||
Operating Income (Loss) | 552,845 | (416,518 | ) | (611,053 | ) | ||||||
Other Income (Expense): | |||||||||||
Other Income | 7,043 | 9,820 | 8,039 | ||||||||
Interest Income | 4,113 | 4,235 | 3,922 | ||||||||
Interest Expense on Long-Term Debt | (116,471 | ) | (117,347 | ) | (95,916 | ) | |||||
Other Interest Expense | (3,366 | ) | (3,697 | ) | (3,555 | ) | |||||
Income (Loss) Before Income Taxes | 444,164 | (523,507 | ) | (698,563 | ) | ||||||
Income Tax Expense (Benefit) | 160,682 | (232,549 | ) | (319,136 | ) | ||||||
Net Income (Loss) Available for Common Stock | 283,482 | (290,958 | ) | (379,427 | ) | ||||||
EARNINGS REINVESTED IN THE BUSINESS | |||||||||||
Balance at Beginning of Year | 676,361 | 1,103,200 | 1,614,361 | ||||||||
959,843 | 812,242 | 1,234,934 | |||||||||
Dividends on Common Stock | (140,090 | ) | (135,881 | ) | (131,734 | ) | |||||
Cumulative Effect of Adoption of Authoritative Guidance for Stock-Based Compensation | 31,916 | — | — | ||||||||
Balance at End of Year | $ | 851,669 | $ | 676,361 | $ | 1,103,200 | |||||
Earnings Per Common Share: | |||||||||||
Basic: | |||||||||||
Net Income (Loss) Available for Common Stock | $ | 3.32 | $ | (3.43 | ) | $ | (4.50 | ) | |||
Diluted: | |||||||||||
Net Income (Loss) Available for Common Stock | $ | 3.30 | $ | (3.43 | ) | $ | (4.50 | ) | |||
Weighted Average Common Shares Outstanding: | |||||||||||
Used in Basic Calculation | 85,364,929 | 84,847,993 | 84,387,755 | ||||||||
Used in Diluted Calculation | 86,021,386 | 84,847,993 | 84,387,755 | ||||||||
See Notes to Consolidated Financial Statements
-67-
NATIONAL FUEL GAS COMPANY
CONSOLIDATED STATEMENTS OF COMPREHENSIVE INCOME
Year Ended September 30 | |||||||||||
2017 | 2016 | 2015 | |||||||||
(Thousands of dollars) | |||||||||||
Net Income (Loss) Available for Common Stock | $ | 283,482 | $ | (290,958 | ) | $ | (379,427 | ) | |||
Other Comprehensive Income (Loss), Before Tax: | |||||||||||
Increase (Decrease) in the Funded Status of the Pension and Other Post-Retirement Benefit Plans | 15,661 | (21,378 | ) | (31,538 | ) | ||||||
Reclassification Adjustment for Amortization of Prior Year Funded Status of the Pension and Other Post-Retirement Benefit Plans | 13,433 | 10,068 | 9,217 | ||||||||
Unrealized Gain (Loss) on Securities Available for Sale Arising During the Period | 4,008 | 1,524 | (3,234 | ) | |||||||
Unrealized Gain (Loss) on Derivative Financial Instruments Arising During the Period | 5,347 | 60,493 | 381,018 | ||||||||
Reclassification Adjustment for Realized (Gains) Losses on Securities Available for Sale in Net Income | (1,575 | ) | (1,374 | ) | (591 | ) | |||||
Reclassification Adjustment for Realized (Gains) Losses on Derivative Financial Instruments in Net Income | (81,605 | ) | (220,919 | ) | (184,953 | ) | |||||
Other Comprehensive Income (Loss), Before Tax | (44,731 | ) | (171,586 | ) | 169,919 | ||||||
Income Tax Expense (Benefit) Related to the Increase (Decrease) in the Funded Status of the Pension and Other Post-Retirement Benefit Plans | 6,175 | (8,351 | ) | (11,922 | ) | ||||||
Reclassification Adjustment for Income Tax Benefit Related to the Amortization of the Prior Year Funded Status of the Pension and Other Post-Retirement Benefit Plans | 4,929 | 3,723 | 3,375 | ||||||||
Income Tax Expense (Benefit) Related to Unrealized Gain (Loss) on Securities Available for Sale Arising During the Period | 1,505 | 592 | (1,195 | ) | |||||||
Income Tax Expense (Benefit) Related to Unrealized Gain (Loss) on Derivative Financial Instruments Arising During the Period | 2,009 | 18,648 | 160,872 | ||||||||
Reclassification Adjustment for Income Tax Benefit (Expense) on Realized Losses (Gains) from Securities Available for Sale in Net Income | (580 | ) | (527 | ) | (217 | ) | |||||
Reclassification Adjustment for Income Tax Benefit (Expense) on Realized Losses (Gains) from Derivative Financial Instruments in Net Income | (34,286 | ) | (86,659 | ) | (78,345 | ) | |||||
Income Taxes — Net | (20,248 | ) | (72,574 | ) | 72,568 | ||||||
Other Comprehensive Income (Loss) | (24,483 | ) | (99,012 | ) | 97,351 | ||||||
Comprehensive Income (Loss) | $ | 258,999 | $ | (389,970 | ) | $ | (282,076 | ) | |||
See Notes to Consolidated Financial Statements
-68-
NATIONAL FUEL GAS COMPANY
CONSOLIDATED BALANCE SHEETS
At September 30 | |||||||
2017 | 2016 | ||||||
(Thousands of dollars) | |||||||
ASSETS | |||||||
Property, Plant and Equipment | $ | 9,945,560 | $ | 9,539,581 | |||
Less — Accumulated Depreciation, Depletion and Amortization | 5,271,486 | 5,085,099 | |||||
4,674,074 | 4,454,482 | ||||||
Current Assets | |||||||
Cash and Temporary Cash Investments | 555,530 | 129,972 | |||||
Hedging Collateral Deposits | 1,741 | 1,484 | |||||
Receivables — Net of Allowance for Uncollectible Accounts of $22,526 and $21,109, Respectively | 112,383 | 133,201 | |||||
Unbilled Revenue | 22,883 | 18,382 | |||||
Gas Stored Underground | 35,689 | 34,332 | |||||
Materials and Supplies — at average cost | 33,926 | 33,866 | |||||
Unrecovered Purchased Gas Costs | 4,623 | 2,440 | |||||
Other Current Assets | 51,505 | 59,354 | |||||
818,280 | 413,031 | ||||||
Other Assets | |||||||
Recoverable Future Taxes | 181,363 | 177,261 | |||||
Unamortized Debt Expense | 1,159 | 1,688 | |||||
Other Regulatory Assets | 174,433 | 320,750 | |||||
Deferred Charges | 30,047 | 20,978 | |||||
Other Investments | 125,265 | 110,664 | |||||
Goodwill | 5,476 | 5,476 | |||||
Prepaid Post-Retirement Benefit Costs | 56,370 | 17,649 | |||||
Fair Value of Derivative Financial Instruments | 36,111 | 113,804 | |||||
Other | 742 | 604 | |||||
610,966 | 768,874 | ||||||
Total Assets | $ | 6,103,320 | $ | 5,636,387 | |||
CAPITALIZATION AND LIABILITIES | |||||||
Capitalization: | |||||||
Comprehensive Shareholders’ Equity | |||||||
Common Stock, $1 Par Value; Authorized - 200,000,000 Shares; Issued and Outstanding - 85,543,125 Shares and 85,118,886 Shares, Respectively | $ | 85,543 | $ | 85,119 | |||
Paid In Capital | 796,646 | 771,164 | |||||
Earnings Reinvested in the Business | 851,669 | 676,361 | |||||
Accumulated Other Comprehensive Loss | (30,123 | ) | (5,640 | ) | |||
Total Comprehensive Shareholders’ Equity | 1,703,735 | 1,527,004 | |||||
Long-Term Debt, Net of Current Portion and Unamortized Discount and Debt Issuance Costs | 2,083,681 | 2,086,252 | |||||
Total Capitalization | 3,787,416 | 3,613,256 | |||||
Current and Accrued Liabilities | |||||||
Notes Payable to Banks and Commercial Paper | — | — | |||||
Current Portion of Long-Term Debt | 300,000 | — | |||||
Accounts Payable | 126,443 | 108,056 | |||||
Amounts Payable to Customers | — | 19,537 | |||||
Dividends Payable | 35,500 | 34,473 | |||||
Interest Payable on Long-Term Debt | 35,031 | 34,900 | |||||
Customer Advances | 15,701 | 14,762 | |||||
Customer Security Deposits | 20,372 | 16,019 | |||||
Other Accruals and Current Liabilities | 111,889 | 74,430 | |||||
Fair Value of Derivative Financial Instruments | 1,103 | 1,560 | |||||
646,039 | 303,737 | ||||||
Deferred Credits | |||||||
Deferred Income Taxes | 891,287 | 823,795 | |||||
Taxes Refundable to Customers | 95,739 | 93,318 | |||||
Cost of Removal Regulatory Liability | 204,630 | 193,424 | |||||
Other Regulatory Liabilities | 113,716 | 99,789 | |||||
Pension and Other Post-Retirement Liabilities | 149,079 | 277,113 | |||||
Asset Retirement Obligations | 106,395 | 112,330 | |||||
Other Deferred Credits | 109,019 | 119,625 | |||||
1,669,865 | 1,719,394 | ||||||
Commitments and Contingencies (Note I) | — | — | |||||
Total Capitalization and Liabilities | $ | 6,103,320 | $ | 5,636,387 | |||
See Notes to Consolidated Financial Statements
-69-
NATIONAL FUEL GAS COMPANY
CONSOLIDATED STATEMENTS OF CASH FLOWS
Year Ended September 30 | |||||||||||
2017 | 2016 | 2015 | |||||||||
(Thousands of dollars) | |||||||||||
Operating Activities | |||||||||||
Net Income (Loss) Available for Common Stock | $ | 283,482 | $ | (290,958 | ) | $ | (379,427 | ) | |||
Adjustments to Reconcile Net Income (Loss) to Net Cash Provided by Operating Activities: | |||||||||||
Impairment of Oil and Gas Producing Properties | — | 948,307 | 1,126,257 | ||||||||
Depreciation, Depletion and Amortization | 224,195 | 249,417 | 336,158 | ||||||||
Deferred Income Taxes | 117,975 | (246,794 | ) | (357,587 | ) | ||||||
Excess Tax Benefits Associated with Stock-Based Compensation Awards | — | (1,868 | ) | (9,064 | ) | ||||||
Stock-Based Compensation | 12,262 | 5,755 | 3,208 | ||||||||
Other | 16,476 | 12,620 | 9,823 | ||||||||
Change in: | |||||||||||
Hedging Collateral Deposits | (257 | ) | 9,640 | (8,390 | ) | ||||||
Receivables and Unbilled Revenue | (3,380 | ) | (6,408 | ) | 51,638 | ||||||
Gas Stored Underground and Materials and Supplies | (1,417 | ) | (3,532 | ) | 3,438 | ||||||
Unrecovered Purchased Gas Costs | (2,183 | ) | (2,440 | ) | — | ||||||
Other Current Assets | 7,849 | 3,179 | 3,150 | ||||||||
Accounts Payable | 17,192 | (40,664 | ) | 34,687 | |||||||
Amounts Payable to Customers | (19,537 | ) | (37,241 | ) | 23,033 | ||||||
Customer Advances | 939 | (1,474 | ) | (2,769 | ) | ||||||
Customer Security Deposits | 4,353 | (471 | ) | 729 | |||||||
Other Accruals and Current Liabilities | 27,004 | 3,453 | (7,173 | ) | |||||||
Other Assets | (2,885 | ) | 1,941 | 2,696 | |||||||
Other Liabilities | 2,183 | (13,483 | ) | 23,173 | |||||||
Net Cash Provided by Operating Activities | 684,251 | 588,979 | 853,580 | ||||||||
Investing Activities | |||||||||||
Capital Expenditures | (450,335 | ) | (581,576 | ) | (1,018,179 | ) | |||||
Net Proceeds from Sale of Oil and Gas Producing Properties | 26,554 | 137,316 | — | ||||||||
Other | 1,216 | (9,236 | ) | (6,611 | ) | ||||||
Net Cash Used in Investing Activities | (422,565 | ) | (453,496 | ) | (1,024,790 | ) | |||||
Financing Activities | |||||||||||
Change in Notes Payable to Banks and Commercial Paper | — | — | (85,600 | ) | |||||||
Excess Tax Benefits Associated with Stock-Based Compensation Awards | — | 1,868 | 9,064 | ||||||||
Net Proceeds from Issuance of Long-Term Debt | 295,151 | — | 444,635 | ||||||||
Net Proceeds from Issuance of Common Stock | 7,784 | 13,849 | 10,540 | ||||||||
Dividends Paid on Common Stock | (139,063 | ) | (134,824 | ) | (130,719 | ) | |||||
Net Cash Provided by (Used in) Financing Activities | 163,872 | (119,107 | ) | 247,920 | |||||||
Net Increase in Cash and Temporary Cash Investments | 425,558 | 16,376 | 76,710 | ||||||||
Cash and Temporary Cash Investments At Beginning of Year | 129,972 | 113,596 | 36,886 | ||||||||
Cash and Temporary Cash Investments At End of Year | $ | 555,530 | $ | 129,972 | $ | 113,596 | |||||
Supplemental Disclosure of Cash Flow Information | |||||||||||
Cash Paid For: | |||||||||||
Interest | $ | 116,894 | $ | 119,563 | $ | 90,747 | |||||
Income Taxes | $ | 34,826 | $ | 34,240 | $ | 18,657 | |||||
Non-Cash Investing Activities: | |||||||||||
Non-Cash Capital Expenditures | $ | 72,216 | $ | 60,434 | $ | 118,959 | |||||
Receivable from Sale of Oil and Gas Producing Properties | $ | — | $ | 19,543 | $ | — | |||||
See Notes to Consolidated Financial Statements
-70-
NATIONAL FUEL GAS COMPANY
NOTES TO CONSOLIDATED FINANCIAL STATEMENTS
Note A — Summary of Significant Accounting Policies
Principles of Consolidation
The Company consolidates all entities in which it has a controlling financial interest. All significant intercompany balances and transactions are eliminated. The Company uses proportionate consolidation when accounting for drilling arrangements related to oil and gas producing properties accounted for under the full cost method of accounting.
The preparation of the consolidated financial statements in conformity with GAAP requires management to make estimates and assumptions that affect the reported amounts of assets and liabilities and disclosure of contingent assets and liabilities at the date of the financial statements and the reported amounts of revenues and expenses during the reporting period. Actual results could differ from those estimates.
Reclassification
Certain prior year amounts have been reclassified to conform with current year presentation.
Regulation
The Company is subject to regulation by certain state and federal authorities. The Company has accounting policies which conform to GAAP, as applied to regulated enterprises, and are in accordance with the accounting requirements and ratemaking practices of the regulatory authorities. Reference is made to Note C — Regulatory Matters for further discussion.
Revenue Recognition
The Company’s Exploration and Production segment records revenue based on entitlement, which means that revenue is recorded based on the actual amount of gas or oil that is delivered to a pipeline and the Company’s ownership interest in the producing well. If a production imbalance occurs between what was supposed to be delivered to a pipeline and what was actually produced and delivered, the Company accrues the difference as an imbalance.
The Company’s Pipeline and Storage segment records revenue for natural gas transportation and storage services. Revenue from reservation charges on firm contracted capacity is recognized through equal monthly charges over the contract period regardless of the amount of gas that is transported or stored. Commodity charges on firm contracted capacity and interruptible contracts are recognized as revenue when physical deliveries of natural gas are made at the agreed upon delivery point or when gas is injected or withdrawn from the storage field. The point of delivery into the pipeline or injection or withdrawal from storage is the point at which ownership and risk of loss transfers to the buyer of such transportation and storage services.
In the Company’s Gathering segment, revenue is recorded at the point at which gathered volumes are delivered into interstate pipelines.
The Company’s Utility segment records revenue for gas sales and transportation in the period that gas is delivered to customers. This includes the recording of receivables for gas delivered but not yet billed to customers based on the Company's estimate of the amount of gas delivered between the last meter reading date and the end of the accounting period. Such receivables are a component of Unbilled Revenue on the Consolidated Balance Sheets.
The Company’s Energy Marketing segment records revenue for gas sales in the period that gas is delivered to customers. This includes the recording of receivables for gas delivered but not yet billed to customers based on the Company's estimate of the amount of gas delivered between the last meter reading date and the end of the accounting period. Such receivables are a component of Unbilled Revenue on the Consolidated Balance Sheets.
-71-
NATIONAL FUEL GAS COMPANY
NOTES TO CONSOLIDATED FINANCIAL STATEMENTS - (Continued)
Allowance for Uncollectible Accounts
The allowance for uncollectible accounts is the Company’s best estimate of the amount of probable credit losses in the existing accounts receivable. The allowance is determined based on historical experience, the age and other specific information about customer accounts. Account balances are charged off against the allowance twelve months after the account is final billed or when it is anticipated that the receivable will not be recovered.
Regulatory Mechanisms
The Company’s rate schedules in the Utility segment contain clauses that permit adjustment of revenues to reflect price changes from the cost of purchased gas included in base rates. Differences between amounts currently recoverable and actual adjustment clause revenues, as well as other price changes and pipeline and storage company refunds not yet includable in adjustment clause rates, are deferred and accounted for as either unrecovered purchased gas costs or amounts payable to customers. Such amounts are generally recovered from (or passed back to) customers during the following fiscal year.
Estimated refund liabilities to ratepayers represent management’s current estimate of such refunds. Reference is made to Note C — Regulatory Matters for further discussion.
The impact of weather on revenues in the Utility segment’s New York rate jurisdiction is tempered by a WNC, which covers the eight-month period from October through May. The WNC is designed to adjust the rates of retail customers to reflect the impact of deviations from normal weather. Weather that is warmer than normal results in a surcharge being added to customers’ current bills, while weather that is colder than normal results in a refund being credited to customers’ current bills. Since the Utility segment’s Pennsylvania rate jurisdiction does not have a WNC, weather variations have a direct impact on the Pennsylvania rate jurisdiction’s revenues.
The impact of weather normalized usage per customer account in the Utility segment’s New York rate jurisdiction is tempered by a revenue decoupling mechanism. The effect of the revenue decoupling mechanism is to render the Company financially indifferent to throughput decreases resulting from conservation. Weather normalized usage per account that exceeds the average weather normalized usage per customer account results in a refund being credited to customers’ bills. Weather normalized usage per account that is below the average weather normalized usage per account results in a surcharge being added to customers’ bills. The surcharge or credit is calculated over a twelve-month period ending December 31st, and applied to customer bills annually, beginning March 1st.
In the Pipeline and Storage segment, the allowed rates that Supply Corporation and Empire bill their customers are based on a straight fixed-variable rate design, which allows recovery of all fixed costs, including return on equity and income taxes, through fixed monthly reservation charges. Because of this rate design, changes in throughput due to weather variations do not have a significant impact on the revenues of Supply Corporation or Empire.
Property, Plant and Equipment
In the Company’s Exploration and Production segment, oil and gas property acquisition, exploration and development costs are capitalized under the full cost method of accounting. Under this methodology, all costs associated with property acquisition, exploration and development activities are capitalized, including internal costs directly identified with acquisition, exploration and development activities. The internal costs that are capitalized do not include any costs related to production, general corporate overhead, or similar activities. The Company does not recognize any gain or loss on the sale or other disposition of oil and gas properties unless the gain or loss would significantly alter the relationship between capitalized costs and proved reserves of oil and gas attributable to a cost center. For further discussion of capitalized costs, refer to Note M — Supplementary Information for Oil and Gas Producing Activities.
Capitalized costs are subject to the SEC full cost ceiling test. The ceiling test, which is performed each quarter, determines a limit, or ceiling, on the amount of property acquisition, exploration and development costs
-72-
NATIONAL FUEL GAS COMPANY
NOTES TO CONSOLIDATED FINANCIAL STATEMENTS - (Continued)
that can be capitalized. The ceiling under this test represents (a) the present value of estimated future net cash flows, excluding future cash outflows associated with settling asset retirement obligations that have been accrued on the balance sheet, using a discount factor of 10%, which is computed by applying prices of oil and gas (as adjusted for hedging) to estimated future production of proved oil and gas reserves as of the date of the latest balance sheet, less estimated future expenditures, plus (b) the cost of unevaluated properties not being depleted, less (c) income tax effects related to the differences between the book and tax basis of the properties. The natural gas and oil prices used to calculate the full cost ceiling are based on an unweighted arithmetic average of the first day of the month oil and gas prices for each month within the twelve-month period prior to the end of the reporting period. If capitalized costs, net of accumulated depreciation, depletion and amortization and related deferred income taxes, exceed the ceiling at the end of any quarter, a permanent impairment is required to be charged to earnings in that quarter. At September 30, 2017, the ceiling exceeded the book value of the oil and gas properties by $286.4 million. In adjusting estimated future net cash flows for hedging under the ceiling test at September 30, 2017, 2016, and 2015, estimated future net cash flows were increased by $30.5 million, $215.3 million and $194.5 million, respectively.
On December 1, 2015, Seneca and IOG - CRV Marcellus, LLC (IOG), an affiliate of IOG Capital, LP, and funds managed by affiliates of Fortress Investment Group, LLC, executed a joint development agreement that allows IOG to participate in the development of certain oil and gas interests owned by Seneca in Elk, McKean and Cameron Counties, Pennsylvania. On June 13, 2016, Seneca and IOG executed an extension of the joint development agreement. Under the terms of the extended agreement, Seneca and IOG will jointly participate in a program to develop up to 75 Marcellus wells, with Seneca serving as program operator. IOG will hold an 80% working interest in all of the joint development wells. In total, IOG is expected to fund approximately $325 million for its 80% working interest in the 75 joint development wells. Of this amount, IOG has funded $262.6 million as of September 30, 2017, which includes $163.9 million of cash ($137.3 million in fiscal 2016 and $26.6 million in fiscal 2017) that Seneca had received in recognition of IOG funding that is due to Seneca for costs previously incurred to develop a portion of the first 75 joint development wells. The cash proceeds were recorded by Seneca as a $163.9 million reduction of property, plant and equipment. The remainder funded joint development expenditures. As the fee-owner of the property’s mineral rights, Seneca retains a 7.5% royalty interest and the remaining 20% working interest (which results in a 26% net revenue interest) in 56 of the joint development wells. In the remaining 19 wells, Seneca retains a 20% working and net revenue interest. Seneca’s working interest under the agreement will increase to 85% after IOG achieves a 15% internal rate of return.
The principal assets of the Utility and Pipeline and Storage segments, consisting primarily of gas plant in service, are recorded at the historical cost when originally devoted to service.
Maintenance and repairs of property and replacements of minor items of property are charged directly to maintenance expense. The original cost of the regulated subsidiaries’ property, plant and equipment retired, and the cost of removal less salvage, are charged to accumulated depreciation.
Depreciation, Depletion and Amortization
For oil and gas properties, depreciation, depletion and amortization is computed based on quantities produced in relation to proved reserves using the units of production method. The cost of unproved oil and gas properties is excluded from this computation. In the All Other category, for timber properties, depletion, determined on a property by property basis, is charged to operations based on the actual amount of timber cut in relation to the total amount of recoverable timber. For all other property, plant and equipment, depreciation and amortization is computed using the straight-line method in amounts sufficient to recover costs over the estimated service lives of property in service. The following is a summary of depreciable plant by segment:
-73-
NATIONAL FUEL GAS COMPANY
NOTES TO CONSOLIDATED FINANCIAL STATEMENTS - (Continued)
As of September 30 | |||||||
2017 | 2016 | ||||||
(Thousands) | |||||||
Exploration and Production | $ | 4,925,409 | $ | 4,645,226 | |||
Pipeline and Storage | 2,002,736 | 1,956,708 | |||||
Gathering | 484,768 | 454,343 | |||||
Utility | 2,045,074 | 1,998,605 | |||||
Energy Marketing | 3,564 | 3,528 | |||||
All Other and Corporate | 109,128 | 109,455 | |||||
$ | 9,570,679 | $ | 9,167,865 | ||||
Average depreciation, depletion and amortization rates are as follows:
Year Ended September 30 | |||||||||||
2017 | 2016 | 2015 | |||||||||
Exploration and Production, per Mcfe(1) | $ | 0.65 | $ | 0.87 | $ | 1.52 | |||||
Pipeline and Storage | 2.2 | % | 2.4 | % | 2.4 | % | |||||
Gathering | 3.4 | % | 4.0 | % | 4.0 | % | |||||
Utility | 2.8 | % | 2.7 | % | 2.6 | % | |||||
Energy Marketing | 7.9 | % | 7.9 | % | 6.1 | % | |||||
All Other and Corporate | 1.3 | % | 1.8 | % | 1.4 | % | |||||
(1) | Amounts include depletion of oil and gas producing properties as well as depreciation of fixed assets. As disclosed in Note M — Supplementary Information for Oil and Gas Producing Activities, depletion of oil and gas producing properties amounted to $0.63, $0.85 and $1.49 per Mcfe of production in 2017, 2016 and 2015, respectively. |
Goodwill
The Company has recognized goodwill of $5.5 million as of September 30, 2017 and 2016 on its Consolidated Balance Sheets related to the Company’s acquisition of Empire in 2003. The Company accounts for goodwill in accordance with the current authoritative guidance, which requires the Company to test goodwill for impairment annually. At September 30, 2017, 2016 and 2015, the fair value of Empire was greater than its book value. As such, the goodwill was not considered impaired at those dates. Going back to the origination of the goodwill in 2003, the Company has never recorded an impairment of its goodwill balance.
Financial Instruments
Unrealized gains or losses from the Company’s investments in an equity mutual fund, a fixed income mutual fund and the stock of an insurance company (securities available for sale) are recorded as a component of accumulated other comprehensive income (loss). Reference is made to Note G — Financial Instruments for further discussion.
The Company uses a variety of derivative financial instruments to manage a portion of the market risk associated with fluctuations in the price of natural gas and crude oil and to manage a portion of the risk of currency fluctuations associated with transportation costs denominated in Canadian currency. These instruments include price swap agreements and futures contracts. The Company accounts for these instruments as either cash flow hedges or fair value hedges. In both cases, the fair value of the instrument is recognized on the Consolidated Balance Sheets as either an asset or a liability labeled Fair Value of Derivative Financial Instruments. Reference
-74-
NATIONAL FUEL GAS COMPANY
NOTES TO CONSOLIDATED FINANCIAL STATEMENTS - (Continued)
is made to Note F — Fair Value Measurements for further discussion concerning the fair value of derivative financial instruments.
For effective cash flow hedges, the offset to the asset or liability that is recorded is a gain or loss recorded in accumulated other comprehensive income (loss) on the Consolidated Balance Sheets. The gain or loss recorded in accumulated other comprehensive income (loss) remains there until the hedged transaction occurs, at which point the gains or losses are reclassified to operating revenues, purchased gas expense or operation and maintenance expense on the Consolidated Statements of Income. Reference is made to Note G - Financial Instruments for further discussion concerning cash flow hedges.
For fair value hedges, the offset to the asset or liability that is recorded is a gain or loss recorded to operating revenues or purchased gas expense on the Consolidated Statements of Income. However, in the case of fair value hedges, the Company also records an asset or liability on the Consolidated Balance Sheets representing the change in fair value of the asset or firm commitment that is being hedged (see Other Current Assets section in this footnote). The offset to this asset or liability is a gain or loss recorded to operating revenues or purchased gas expense on the Consolidated Statements of Income as well. If the fair value hedge is effective, the gain or loss from the derivative financial instrument is offset by the gain or loss that arises from the change in fair value of the asset or firm commitment that is being hedged. Reference is made to Note G - Financial Instruments for further discussion concerning fair value hedges.
Accumulated Other Comprehensive Income (Loss)
The components of Accumulated Other Comprehensive Income (Loss) and changes for the year ended September 30, 2017, net of related tax effect, are as follows (amounts in parentheses indicate debits) (in thousands):
Gains and Losses on Derivative Financial Instruments | Gains and Losses on Securities Available for Sale | Funded Status of the Pension and Other Post-Retirement Benefit Plans | Total | ||||||||||||
Year Ended September 30, 2017 | |||||||||||||||
Balance at October 1, 2016 | $ | 64,782 | $ | 6,054 | $ | (76,476 | ) | $ | (5,640 | ) | |||||
Other Comprehensive Gains and Losses Before Reclassifications | 3,338 | 2,503 | 9,486 | 15,327 | |||||||||||
Amounts Reclassified From Other Comprehensive Loss | (47,319 | ) | (995 | ) | 8,504 | (39,810 | ) | ||||||||
Balance at September 30, 2017 | $ | 20,801 | $ | 7,562 | $ | (58,486 | ) | $ | (30,123 | ) | |||||
Year Ended September 30, 2016 | |||||||||||||||
Balance at October 1, 2015 | $ | 157,197 | $ | 5,969 | $ | (69,794 | ) | $ | 93,372 | ||||||
Other Comprehensive Gains and Losses Before Reclassifications | 41,845 | 932 | (13,027 | ) | 29,750 | ||||||||||
Amounts Reclassified From Other Comprehensive Loss | (134,260 | ) | (847 | ) | 6,345 | (128,762 | ) | ||||||||
Balance at September 30, 2016 | $ | 64,782 | $ | 6,054 | $ | (76,476 | ) | $ | (5,640 | ) | |||||
The amounts included in accumulated other comprehensive income (loss) related to the funded status of the Company’s pension and other post-retirement benefit plans consist of prior service costs and accumulated losses. The total amount for prior service cost was $1.2 million and $1.3 million at September 30, 2017 and 2016, respectively. The total amount for accumulated losses was $57.3 million and $75.2 million at September 30, 2017 and 2016, respectively.
-75-
NATIONAL FUEL GAS COMPANY
NOTES TO CONSOLIDATED FINANCIAL STATEMENTS - (Continued)
Reclassifications Out of Accumulated Other Comprehensive Income (Loss)
The details about the reclassification adjustments out of accumulated other comprehensive loss for the year ended September 30, 2017 are as follows (amounts in parentheses indicate debits to the income statement) (in thousands):
Details About Accumulated Other Comprehensive Income (Loss) Components | Amount of Gain or (Loss) Reclassified from Accumulated Other Comprehensive Income (Loss) for the Year Ended September 30, | Affected Line Item in the Statement Where Net Income (Loss) is Presented | ||||||||
2017 | 2016 | |||||||||
Gains (Losses) on Derivative Financial Instrument Cash Flow Hedges: | ||||||||||
Commodity Contracts | $83,983 | $216,823 | Operating Revenues | |||||||
Commodity Contracts | (1,921 | ) | 4,520 | Purchased Gas | ||||||
Foreign Currency Contracts | (457 | ) | (424 | ) | Operation and Maintenance Expense | |||||
Gains (Losses) on Securities Available for Sale | 1,575 | 1,374 | Other Income | |||||||
Amortization of Prior Year Funded Status of the Pension and Other Post-Retirement Benefit Plans: | ||||||||||
Prior Service Credit | (288 | ) | (333 | ) | (1) | |||||
Net Actuarial Loss | (13,145 | ) | (9,735 | ) | (1) | |||||
69,747 | 212,225 | Total Before Income Tax | ||||||||
(29,937 | ) | (83,463 | ) | Income Tax Expense | ||||||
$39,810 | $128,762 | Net of Tax | ||||||||
(1) | These accumulated other comprehensive income (loss) components are included in the computation of net periodic benefit cost. Refer to Note H — Retirement Plan and Other Post-Retirement Benefits for additional details. |
Gas Stored Underground
In the Utility segment, gas stored underground in the amount of $26.7 million is carried at lower of cost or net realizable value, on a LIFO method. Based upon the average price of spot market gas purchased in September 2017, including transportation costs, the current cost of replacing this inventory of gas stored underground exceeded the amount stated on a LIFO basis by approximately $17.1 million at September 30, 2017. All other gas stored underground, which is in the Energy Marketing segment, is carried at an average cost method, subject to lower of cost or net realizable value adjustments.
Unamortized Debt Expense
Costs associated with the reacquisition of debt related to rate-regulated subsidiaries are deferred and amortized over the remaining life of the issue or the life of the replacement debt in order to match regulatory treatment. At September 30, 2017, the remaining weighted average amortization period for such costs was approximately 2 years.
-76-
NATIONAL FUEL GAS COMPANY
NOTES TO CONSOLIDATED FINANCIAL STATEMENTS - (Continued)
Income Taxes
The Company and its subsidiaries file a consolidated federal income tax return. State tax returns are filed on a combined or separate basis depending on the applicable laws in the jurisdictions where tax returns are filed. The investment tax credit, prior to its repeal in 1986, was deferred and is being amortized over the estimated useful lives of the related property, as required by regulatory authorities having jurisdiction.
The Company follows the asset and liability approach in accounting for income taxes, which requires the recognition of deferred income taxes for the expected future tax consequences of net operating losses, credits and temporary differences between the financial statement carrying amounts and the tax basis of assets and liabilities. A valuation allowance is provided on deferred tax assets if it is determined, within each taxing jurisdiction, that it is more likely than not that the asset will not be realized.
The Company reports a liability or a reduction of deferred tax assets for unrecognized tax benefits resulting from uncertain tax positions taken or expected to be taken in a tax return. When applicable, the Company recognizes interest relating to uncertain tax positions in Other Interest Expense and penalties in Other Income.
Consolidated Statement of Cash Flows
For purposes of the Consolidated Statement of Cash Flows, the Company considers all highly liquid debt instruments purchased with a maturity of generally three months or less to be cash equivalents.
Hedging Collateral Deposits
This is an account title for cash held in margin accounts funded by the Company to serve as collateral for hedging positions. In accordance with its accounting policy, the Company does not offset hedging collateral deposits paid or received against related derivative financial instrument liability or asset balances.
Other Current Assets
The components of the Company’s Other Current Assets are as follows:
Year Ended September 30 | |||||||
2017 | 2016 | ||||||
(Thousands) | |||||||
Prepayments | $ | 10,927 | $ | 10,919 | |||
Prepaid Property and Other Taxes | 13,974 | 13,138 | |||||
Federal Income Taxes Receivable | — | 11,758 | |||||
State Income Taxes Receivable | 9,689 | 3,961 | |||||
Fair Values of Firm Commitments | 1,031 | 3,962 | |||||
Regulatory Assets | 15,884 | 15,616 | |||||
$ | 51,505 | $ | 59,354 | ||||
-77-
NATIONAL FUEL GAS COMPANY
NOTES TO CONSOLIDATED FINANCIAL STATEMENTS - (Continued)
Other Accruals and Current Liabilities
The components of the Company’s Other Accruals and Current Liabilities are as follows:
Year Ended September 30 | |||||||
2017 | 2016 | ||||||
(Thousands) | |||||||
Accrued Capital Expenditures | $ | 37,382 | $ | 26,796 | |||
Regulatory Liabilities | 34,059 | 14,725 | |||||
Federal Income Taxes Payable | 1,775 | — | |||||
Other | 38,673 | 32,909 | |||||
$ | 111,889 | $ | 74,430 | ||||
Customer Advances
The Company’s Utility and Energy Marketing segments have balanced billing programs whereby customers pay their estimated annual usage in equal installments over a twelve-month period. Monthly payments under the balanced billing programs are typically higher than current month usage during the summer months. During the winter months, monthly payments under the balanced billing programs are typically lower than current month usage. At September 30, 2017 and 2016, customers in the balanced billing programs had advanced excess funds of $15.7 million and $14.8 million, respectively.
Customer Security Deposits
The Company, in its Utility, Pipeline and Storage, and Energy Marketing segments, often times requires security deposits from marketers, producers, pipeline companies, and commercial and industrial customers before providing services to such customers. At September 30, 2017 and 2016, the Company had received customer security deposits amounting to $20.4 million and $16.0 million, respectively.
Earnings Per Common Share
Basic earnings per common share is computed by dividing income or loss by the weighted average number of common shares outstanding for the period. Diluted earnings per common share reflects the potential dilution that could occur if securities or other contracts to issue common stock were exercised or converted into common stock. For purposes of determining earnings per common share, the potentially dilutive securities the Company has outstanding are stock options, SARs, restricted stock units and performance shares. For the year ended September 30, 2017, the diluted weighted average shares outstanding shown on the Consolidated Statements of Income reflects the potential dilution as a result of these securities as determined using the Treasury Stock Method. Stock options, SARs, restricted stock units and performance shares that are antidilutive are excluded from the calculation of diluted earnings per common share. There were 157,649 shares excluded as being antidilutive for the year ended September 30, 2017. As the Company recognized net losses for the years ended September 30, 2016 and 2015, the aforementioned potentially dilutive securities, amounting to 431,408 shares and 709,063 shares, respectively, were not recognized in the diluted earnings per share calculation for 2016 and 2015.
Stock-Based Compensation
The Company has various stock option and stock award plans which provide or provided for the issuance of one or more of the following to key employees: incentive stock options, nonqualified stock options, SARs, restricted stock, restricted stock units, performance units or performance shares. The Company follows authoritative guidance which requires the measurement and recognition of compensation cost at fair value for all share-based payments. Stock options and SARs under all plans have exercise prices equal to the average market price of Company common stock on the date of grant, and generally no stock option or SAR is exercisable less than one year or more than ten years after the date of each grant. The Company has chosen the Black-Scholes-Merton closed
-78-
NATIONAL FUEL GAS COMPANY
NOTES TO CONSOLIDATED FINANCIAL STATEMENTS - (Continued)
form model to calculate the compensation expense associated with stock options and SARs. For all Company stock awards, forfeitures are recognized as they occur.
Restricted stock is subject to restrictions on vesting and transferability. Restricted stock awards entitle the participants to full dividend and voting rights. The market value of restricted stock on the date of the award is recorded as compensation expense over the vesting period. Certificates for shares of restricted stock awarded under the Company’s stock option and stock award plans are held by the Company during the periods in which the restrictions on vesting are effective. Restrictions on restricted stock awards generally lapse ratably over a period of not more than ten years after the date of each grant. Restricted stock units also are subject to restrictions on vesting and transferability. Restricted stock units, both performance and non-performance based, represent the right to receive shares of common stock of the Company (or the equivalent value in cash or a combination of cash and shares of common stock of the Company, as determined by the Company) at the end of a specified time period. The performance based and non-performance based restricted stock units do not entitle the participants to dividend and voting rights. The accounting for performance based and non-performance based restricted stock units is the same as the accounting for restricted share awards, except that the fair value at the date of grant of the restricted stock units (represented by the market value of Company common stock on the date of the award) must be reduced by the present value of forgone dividends over the vesting term of the award. The fair value of restricted stock units on the date of award is recorded as compensation expense over the vesting period.
Performance shares are an award constituting units denominated in common stock of the Company, the number of which may be adjusted over a performance cycle based upon the extent to which performance goals have been satisfied. Earned performance shares may be distributed in the form of shares of common stock of the Company, an equivalent value in cash or a combination of cash and shares of common stock of the Company, as determined by the Company. The performance shares do not entitle the participant to receive dividends during the vesting period. For performance shares based on a return on capital goal, the fair value at the date of grant of the performance shares is determined by multiplying the expected number of performance shares to be issued by the market value of Company common stock on the date of grant reduced by the present value of forgone dividends. For performance shares based on a total shareholder return goal, the Company uses the Monte Carlo simulation technique to estimate the fair value price at the date of grant.
Refer to Note E — Capitalization and Short-Term Borrowings under the heading “Stock Option and Stock Award Plans” for additional disclosures related to stock-based compensation awards for all plans.
New Authoritative Accounting and Financial Reporting Guidance
In May 2014, the FASB issued authoritative guidance regarding revenue recognition. The authoritative guidance provides a single, comprehensive revenue recognition model for all contracts with customers to improve comparability. The revenue standard contains principles that an entity will apply to determine the measurement of revenue and timing of when it is recognized. The original effective date of this authoritative guidance was as of the Company's first quarter of fiscal 2018. However, the FASB has delayed the effective date of the new revenue standard by one year, and the guidance will now be effective as of the Company's first quarter of fiscal 2019. Working towards this implementation date, the Company is currently evaluating the guidance and the various issues identified by industry based revenue recognition task forces. The Company does not believe that its revenue recognition policies will change materially, although the Company is still assessing the impact. The Company will need to enhance its financial statement disclosures to comply with the new authoritative guidance.
In May 2015, the FASB issued authoritative guidance related to the presentation of investments for which fair value was measured using net asset value per share (or its equivalent). In fiscal 2017, the Company adopted this authoritative guidance. As a result, the presentation of Retirement Plan Investments and Other Post-Retirement Benefit Assets has been adjusted (see tables in Note H — Retirement Plan and Other Post-Retirement Benefits).
In February 2016, the FASB issued authoritative guidance requiring organizations that lease assets to recognize on the balance sheet the assets and liabilities for the rights and obligations created by all leases, regardless
-79-
NATIONAL FUEL GAS COMPANY
NOTES TO CONSOLIDATED FINANCIAL STATEMENTS - (Continued)
of whether they are considered to be capital leases or operating leases. The FASB’s previous authoritative guidance required organizations that lease assets to recognize on the balance sheet the assets and liabilities for the rights and obligations created by capital leases while excluding operating leases from balance sheet recognition. The new authoritative guidance will be effective as of the Company’s first quarter of fiscal 2020, with early adoption permitted. The Company does not anticipate early adoption and is currently evaluating the provisions of the revised guidance.
In March 2016, the FASB issued authoritative guidance simplifying several aspects of the accounting for stock-based compensation. The Company adopted this guidance effective as of October 1, 2016, recognizing a cumulative effect adjustment that increased retained earnings by $31.9 million. The cumulative effect represents the tax benefit of previously unrecognized tax deductions in excess of stock compensation recorded for financial reporting purposes. On a prospective basis, the tax effect of all future differences between stock compensation recorded for financial reporting purposes and actual tax deductions for stock compensation will be recognized upon vesting or settlement as income tax expense or benefit in the income statement. From a statement of cash flows perspective, the tax benefits relating to differences between stock compensation recorded for financial reporting purposes and actual tax deductions for stock compensation are now included in cash provided by operating activities instead of cash provided by financing activities. The changes to the statement of cash flows have been applied prospectively and prior periods have not been adjusted.
In March 2017, the FASB issued authoritative guidance related to the presentation of net periodic pension cost and net periodic postretirement benefit cost. The new guidance requires segregation of the service cost component from the other components of net periodic pension cost and net periodic postretirement benefit cost for financial reporting purposes. The service cost component is to be presented on the income statement in the same line items as other compensation costs included within Operating Expenses and the other components of net periodic pension cost and net periodic postretirement benefit cost are to be presented on the income statement below the subtotal labeled Operating Income (Loss). Under this guidance, the service cost component shall be the only component eligible to be capitalized as part of the cost of inventory or property, plant and equipment. The new guidance will be effective as of the Company’s first quarter of fiscal 2019, with early adoption permitted. The Company does not anticipate early adoption and is currently evaluating the interaction of this authoritative guidance with the various regulatory provisions concerning pension and postretirement benefit costs in the Company’s Utility and Pipeline and Storage segments.
Note B — Asset Retirement Obligations
The Company accounts for asset retirement obligations in accordance with the authoritative guidance that requires entities to record the fair value of a liability for an asset retirement obligation in the period in which it is incurred. An asset retirement obligation is defined as a legal obligation associated with the retirement of a tangible long-lived asset in which the timing and/or method of settlement may or may not be conditional on a future event that may or may not be within the control of the Company. When the liability is initially recorded, the entity capitalizes the estimated cost of retiring the asset as part of the carrying amount of the related long-lived asset. Over time, the liability is adjusted to its present value each period and the capitalized cost is depreciated over the useful life of the related asset. The Company estimates the fair value of its asset retirement obligations based on the discounting of expected cash flows using various estimates, assumptions and judgments regarding certain factors such as the existence of a legal obligation for an asset retirement obligation; estimated amounts and timing of settlements; the credit-adjusted risk-free rate to be used; and inflation rates. Asset retirement obligations incurred in the current period were Level 3 fair value measurements as the inputs used to measure the fair value are unobservable.
The Company has recorded an asset retirement obligation representing plugging and abandonment costs associated with the Exploration and Production segment’s crude oil and natural gas wells and has capitalized such costs in property, plant and equipment (i.e. the full cost pool).
-80-
NATIONAL FUEL GAS COMPANY
NOTES TO CONSOLIDATED FINANCIAL STATEMENTS - (Continued)
In addition to the asset retirement obligation recorded in the Exploration and Production segment, the Company has recorded future asset retirement obligations associated with the plugging and abandonment of natural gas storage wells in the Pipeline and Storage segment and the removal of asbestos and asbestos-containing material in various facilities in the Utility and Pipeline and Storage segments. The Company has also recorded asset retirement obligations for certain costs connected with the retirement of the distribution mains and services components of the pipeline system in the Utility segment, the transmission mains and other components in the pipeline system in the Pipeline and Storage segment, and the gathering lines and other components in the Gathering segment. The retirement costs within the distribution, transmission and gathering systems are primarily for the capping and purging of pipe, which are generally abandoned in place when retired, as well as for the clean-up of PCB contamination associated with the removal of certain pipe.
On June 30, 2016, Seneca sold the majority of its Upper Devonian wells in Pennsylvania. While the proceeds from the sale were not significant, it did result in a $58.4 million reduction of its Asset Retirement Obligation at September 30, 2016, which is reflected in Liabilities Settled in the table below. The following is a reconciliation of the change in the Company’s asset retirement obligations:
Year Ended September 30 | |||||||||||
2017 | 2016 | 2015 | |||||||||
(Thousands) | |||||||||||
Balance at Beginning of Year | $ | 112,330 | $ | 156,805 | $ | 117,713 | |||||
Liabilities Incurred | 2,963 | 2,719 | 4,433 | ||||||||
Revisions of Estimates | (10,578 | ) | 16,721 | 33,717 | |||||||
Liabilities Settled | (4,967 | ) | (72,215 | ) | (6,825 | ) | |||||
Accretion Expense | 6,647 | 8,300 | 7,767 | ||||||||
Balance at End of Year | $ | 106,395 | $ | 112,330 | $ | 156,805 | |||||
Note C — Regulatory Matters
Regulatory Assets and Liabilities
The Company has recorded the following regulatory assets and liabilities:
At September 30 | |||||||
2017 | 2016 | ||||||
(Thousands) | |||||||
Regulatory Assets(1): | |||||||
Pension Costs(2) (Note H) | $ | 125,175 | $ | 203,755 | |||
Post-Retirement Benefit Costs(2) (Note H) | 13,886 | 74,802 | |||||
Recoverable Future Taxes (Note D) | 181,363 | 177,261 | |||||
Environmental Site Remediation Costs(2) (Note I) | 19,665 | 23,392 | |||||
Asset Retirement Obligations(2) (Note B) | 12,764 | 12,490 | |||||
Unamortized Debt Expense (Note A) | 1,159 | 1,688 | |||||
Other(3) | 18,827 | 21,927 | |||||
Total Regulatory Assets | 372,839 | 515,315 | |||||
Less: Amounts Included in Other Current Assets | (15,884 | ) | (15,616 | ) | |||
Total Long-Term Regulatory Assets | $ | 356,955 | $ | 499,699 | |||
-81-
NATIONAL FUEL GAS COMPANY
NOTES TO CONSOLIDATED FINANCIAL STATEMENTS - (Continued)
At September 30 | |||||||
2017 | 2016 | ||||||
(Thousands) | |||||||
Regulatory Liabilities: | |||||||
Cost of Removal Regulatory Liability | $ | 204,630 | $ | 193,424 | |||
Taxes Refundable to Customers (Note D) | 95,739 | 93,318 | |||||
Post-Retirement Benefit Costs (Note H) | 102,891 | 67,204 | |||||
Amounts Payable to Customers (See Regulatory Mechanisms in Note A) | — | 19,537 | |||||
Other(4) | 44,884 | 47,310 | |||||
Total Regulatory Liabilities | 448,144 | 420,793 | |||||
Less: Amounts included in Current and Accrued Liabilities | (34,059 | ) | (34,262 | ) | |||
Total Long-Term Regulatory Liabilities | $ | 414,085 | $ | 386,531 | |||
(1) | The Company recovers the cost of its regulatory assets but generally does not earn a return on them. There are a few exceptions to this rule. For example, the Company does earn a return on Unrecovered Purchased Gas Costs and, in the New York jurisdiction of its Utility segment, earns a return, within certain parameters, on the excess of cumulative funding to the pension plan over the cumulative amount collected in rates. |
(2) | Included in Other Regulatory Assets on the Consolidated Balance Sheets. |
(3) | $15,884 and $15,616 are included in Other Current Assets on the Consolidated Balance Sheets at September 30, 2017 and 2016, respectively, since such amounts are expected to be recovered from ratepayers in the next 12 months. $2,943 and $6,311 are included in Other Regulatory Assets on the Consolidated Balance Sheets at September 30, 2017 and 2016, respectively. |
(4) | $34,059 and $14,725 are included in Other Accruals and Current Liabilities on the Consolidated Balance Sheets at September 30, 2017 and 2016, respectively, since such amounts are expected to be recovered from ratepayers in the next 12 months. $10,825 and $32,585 are included in Other Regulatory Liabilities on the Consolidated Balance Sheets at September 30, 2017 and 2016, respectively. |
If for any reason the Company ceases to meet the criteria for application of regulatory accounting treatment for all or part of its operations, the regulatory assets and liabilities related to those portions ceasing to meet such criteria would be eliminated from the Consolidated Balance Sheets and included in income of the period in which the discontinuance of regulatory accounting treatment occurs.
Cost of Removal Regulatory Liability
In the Company’s Utility and Pipeline and Storage segments, costs of removing assets (i.e. asset retirement costs) are collected from customers through depreciation expense. These amounts are not a legal retirement obligation as discussed in Note B — Asset Retirement Obligations. Rather, they are classified as a regulatory liability in recognition of the fact that the Company has collected dollars from the customer that will be used in the future to fund asset retirement costs.
NYPSC Rate Proceeding
On April 28, 2016, Distribution Corporation commenced a rate case by filing proposed tariff amendments and supporting testimony requesting approval to increase its annual revenues by approximately $41.7 million. Distribution Corporation explained in the filing that its request for rate relief was necessitated by a revenue requirement driven primarily by rate base growth, higher operating expense and higher depreciation expense, among other things. On January 23, 2017, the administrative law judge assigned to the proceeding issued a recommended decision (RD) in the case. The RD, as revised on January 26, 2017, recommended a rate increase
-82-
NATIONAL FUEL GAS COMPANY
NOTES TO CONSOLIDATED FINANCIAL STATEMENTS - (Continued)
designed to provide additional annual revenues of $8.5 million, an equity ratio, subject to update of 42.3% based on the Company’s equity ratio, and a cost of equity, subject to update of 8.6%. On April 20, 2017, the NYPSC issued an Order adopting some provisions of the RD and modifying or rejecting others. The Order provides for an annual rate increase of $5.9 million. The rate increase became effective May 1, 2017. The Order further provides for a return on equity of 8.7%, and established an equity ratio of 42.9%. The Order also directs the implementation of an earnings sharing mechanism to be in place beginning on April 1, 2018.
On July 28, 2017, Distribution Corporation filed an appeal with New York State Supreme Court, Albany County, seeking review of the Order. The appeal contends that portions of the Order should be invalidated because they fail to meet the applicable legal standard for agency decisions. On October 13, 2017, the NYPSC filed an answer which contained a request that the appeal be transferred to the Appellate Division. The Company cannot predict the outcome of the appeal at this time.
FERC Rate Proceedings
Supply Corporation currently has no active rate case on file. Supply Corporation's current rate settlement requires a rate case filing no later than December 31, 2019.
Empire currently has no active rate case on file. Empire’s current rate settlement requires a rate case filing no later than July 1, 2021.
Note D — Income Taxes
The components of federal and state income taxes included in the Consolidated Statements of Income are as follows:
Year Ended September 30 | |||||||||||
2017 | 2016 | 2015 | |||||||||
(Thousands) | |||||||||||
Current Income Taxes — | |||||||||||
Federal | $ | 32,034 | $ | (6,658 | ) | $ | 25,064 | ||||
State | 10,673 | 20,903 | 13,387 | ||||||||
Deferred Income Taxes — | |||||||||||
Federal | 103,046 | (164,818 | ) | (244,336 | ) | ||||||
State | 14,929 | (81,976 | ) | (113,251 | ) | ||||||
160,682 | (232,549 | ) | (319,136 | ) | |||||||
Deferred Investment Tax Credit | (173 | ) | (348 | ) | (414 | ) | |||||
Total Income Taxes | $ | 160,509 | $ | (232,897 | ) | $ | (319,550 | ) | |||
Presented as Follows: | |||||||||||
Other Income | $ | (173 | ) | $ | (348 | ) | $ | (414 | ) | ||
Income Tax Expense (Benefit) | 160,682 | (232,549 | ) | (319,136 | ) | ||||||
Total Income Taxes | $ | 160,509 | $ | (232,897 | ) | $ | (319,550 | ) | |||
-83-
NATIONAL FUEL GAS COMPANY
NOTES TO CONSOLIDATED FINANCIAL STATEMENTS - (Continued)
Total income taxes as reported differ from the amounts that were computed by applying the federal income tax rate to income (loss) before income taxes. The following is a reconciliation of this difference:
Year Ended September 30 | |||||||||||
2017 | 2016 | 2015 | |||||||||
(Thousands) | |||||||||||
U.S. Income (Loss) Before Income Taxes | $ | 443,991 | $ | (523,855 | ) | $ | (698,977 | ) | |||
Income Tax Expense (Benefit), Computed at U.S. Federal Statutory Rate of 35% | $ | 155,397 | $ | (183,349 | ) | $ | (244,642 | ) | |||
State Income Taxes (Benefit) | 16,641 | (39,697 | ) | (64,912 | ) | ||||||
Federal Tax Credits | (6,679 | ) | (3,262 | ) | (732 | ) | |||||
Miscellaneous | (4,850 | ) | (6,589 | ) | (9,264 | ) | |||||
Total Income Taxes | $ | 160,509 | $ | (232,897 | ) | $ | (319,550 | ) | |||
The 2017 state income taxes (benefit) shown above includes income tax benefits related to state enhanced oil recovery tax credits and a decrease in the estimated state effective tax rates utilized in the calculation of deferred income taxes.
Significant components of the Company’s deferred tax liabilities and assets were as follows:
At September 30 | |||||||
2017 | 2016 | ||||||
(Thousands) | |||||||
Deferred Tax Liabilities: | |||||||
Property, Plant and Equipment | $ | 1,141,432 | $ | 1,049,100 | |||
Pension and Other Post-Retirement Benefit Costs | 79,516 | 151,903 | |||||
Unrealized Hedging Gains | 19,127 | 50,179 | |||||
Other | 57,919 | 55,457 | |||||
Total Deferred Tax Liabilities | 1,297,994 | 1,306,639 | |||||
Deferred Tax Assets: | |||||||
Pension and Other Post-Retirement Benefit Costs | (123,532 | ) | (195,829 | ) | |||
Tax Loss and Credit Carryforwards | (200,344 | ) | (194,875 | ) | |||
Other | (82,831 | ) | (92,140 | ) | |||
Total Deferred Tax Assets | (406,707 | ) | (482,844 | ) | |||
Total Net Deferred Income Taxes | $ | 891,287 | $ | 823,795 | |||
As explained in Note A - Summary of Significant Accounting Policies under the heading "New Authoritative Accounting and Financial Reporting Guidance," the Company adopted authoritative guidance issued by the FASB simplifying several aspects of the accounting for stock-based compensation effective as of October 1, 2016. Under this guidance, the Company recognizes excess tax benefits as incurred. As of September 30, 2016, the table of deferred tax liabilities and assets shown above does not include deferred tax assets of $31.9 million that arose directly from excess tax benefits related to stock-based compensation in prior periods. This amount was recognized as a cumulative effect adjustment, increasing retained earnings at October 1, 2016.
Regulatory liabilities representing the reduction of previously recorded deferred income taxes associated with rate-regulated activities that are expected to be refundable to customers amounted to $95.7 million and $93.3 million at September 30, 2017 and 2016, respectively. Also, regulatory assets representing future amounts collectible from customers, corresponding to additional deferred income taxes not previously recorded because of ratemaking practices, amounted to $181.4 million and $177.3 million at September 30, 2017 and 2016, respectively. Included in the above are regulatory liabilities and assets relating to the tax accounting method change noted below.
-84-
NATIONAL FUEL GAS COMPANY
NOTES TO CONSOLIDATED FINANCIAL STATEMENTS - (Continued)
The amounts are as follows: regulatory liabilities of $52.6 million as of September 30, 2017 and 2016 and regulatory assets of $99.4 million and $94.2 million as of September 30, 2017 and 2016, respectively.
The following is a reconciliation of the change in unrecognized tax benefits:
Year Ended September 30 | |||||||||||
2017 | 2016 | 2015 | |||||||||
(Thousands) | |||||||||||
Balance at Beginning of Year | $ | 396 | $ | 5,085 | $ | 3,147 | |||||
Additions for Tax Positions of Prior Years | 1,251 | 396 | 2,504 | ||||||||
Reductions for Tax Positions of Prior Years | (396 | ) | (1,314 | ) | (566 | ) | |||||
Reductions Related to Settlements with Taxing Authorities | — | (3,771 | ) | — | |||||||
Balance at End of Year | $ | 1,251 | $ | 396 | $ | 5,085 | |||||
As a result of certain examinations in progress (discussed below), the Company anticipates the balance of unrecognized tax benefits could be reduced during the next 12 months. As of September 30, 2017, the entire balance of unrecognized tax benefits would favorably impact the effective tax rate, if recognized.
The IRS is currently conducting examinations of the Company for fiscal 2017 in accordance with the Compliance Assurance Process (“CAP”). The CAP audit employs a real time review of the Company’s books and tax records by the IRS that is intended to permit issue resolution prior to the filing of the tax return. The federal statute of limitations remains open for fiscal 2009 and later years. During fiscal 2009, consent was received from the IRS National Office approving the Company’s application to change its tax method of accounting for certain capitalized costs relating to its utility property. While local IRS examiners issued no-change reports for fiscal 2009 through 2016, the IRS has reserved the right to re-examine these years, pending the anticipated issuance of IRS guidance addressing the issue for natural gas utilities.
The Company is also subject to various routine state income tax examinations. The Company’s principal subsidiaries operate mainly in four states which have statutes of limitations that generally expire between three to four years from the date of filing of the income tax return.
As of September 30, 2017, the Company has the following carryforwards available:
Jurisdiction | Tax Attribute | Amount (Thousands) | Expires | |||||
Federal | Net Operating Loss | $ | 184,289 | 2028-2033 | ||||
Pennsylvania | Net Operating Loss | 324,572 | 2030-2035 | |||||
California | Net Operating Loss | 169,723 | 2029-2035 | |||||
Federal | Alternative Minimum Tax Credit | 81,683 | Unlimited | |||||
California | Alternative Minimum Tax Credit | 5,873 | Unlimited | |||||
Federal | Enhanced Oil Recovery Credit | 10,502 | 2029-2037 | |||||
California | Enhanced Oil Recovery Credit | 5,061 | 2021-2037 | |||||
Federal | R&D Tax Credit | 5,694 | 2031-2036 | |||||
Approximately $1.8 million of the federal Net Operating Loss carryforward is subject to certain annual limitations.
Subsequent to year-end, federal tax reform legislation was introduced which could have a material effect on the Company if enacted into law.
-85-
NATIONAL FUEL GAS COMPANY
NOTES TO CONSOLIDATED FINANCIAL STATEMENTS - (Continued)
Note E — Capitalization and Short-Term Borrowings
Summary of Changes in Common Stock Equity
Common Stock | Paid In Capital | Earnings Reinvested in the Business | Accumulated Other Comprehensive Income (Loss) | |||||||||||||||
Shares | Amount | |||||||||||||||||
(Thousands, except per share amounts) | ||||||||||||||||||
Balance at September 30, 2014 | 84,157 | $ | 84,157 | $ | 716,144 | $ | 1,614,361 | $ | (3,979 | ) | ||||||||
Net Income (Loss) Available for Common Stock | (379,427 | ) | ||||||||||||||||
Dividends Declared on Common Stock ($1.56 Per Share) | (131,734 | ) | ||||||||||||||||
Other Comprehensive Income, Net of Tax | 97,351 | |||||||||||||||||
Share-Based Payment Expense(2) | 2,207 | |||||||||||||||||
Common Stock Issued Under Stock and Benefit Plans(1) | 437 | 437 | 25,923 | |||||||||||||||
Balance at September 30, 2015 | 84,594 | 84,594 | 744,274 | 1,103,200 | 93,372 | |||||||||||||
Net Income (Loss) Available for Common Stock | (290,958 | ) | ||||||||||||||||
Dividends Declared on Common Stock ($1.60 Per Share) | (135,881 | ) | ||||||||||||||||
Other Comprehensive Loss, Net of Tax | (99,012 | ) | ||||||||||||||||
Share-Based Payment Expense(2) | 4,843 | |||||||||||||||||
Common Stock Issued Under Stock and Benefit Plans(1) | 525 | 525 | 22,047 | |||||||||||||||
Balance at September 30, 2016 | 85,119 | 85,119 | 771,164 | 676,361 | (5,640 | ) | ||||||||||||
Net Income Available for Common Stock | 283,482 | |||||||||||||||||
Dividends Declared on Common Stock ($1.64 Per Share) | (140,090 | ) | ||||||||||||||||
Cumulative Effect of Adoption of Authoritative Guidance for Stock-Based Compensation | 31,916 | |||||||||||||||||
Other Comprehensive Loss, Net of Tax | (24,483 | ) | ||||||||||||||||
Share-Based Payment Expense(2) | 10,902 | |||||||||||||||||
Common Stock Issued Under Stock and Benefit Plans | 424 | 424 | 14,580 | |||||||||||||||
Balance at September 30, 2017 | 85,543 | $ | 85,543 | $ | 796,646 | $ | 851,669 | (3) | $ | (30,123 | ) | |||||||
(1) | Paid in Capital includes tax benefits of $1.9 million and $9.1 million for September 30, 2016 and 2015, respectively, related to stock-based compensation. |
(2) | Paid in Capital includes compensation costs associated with stock option, SARs, performance share and/or restricted stock awards. The expense is included within Net Income Available For Common Stock, net of tax benefits. |
(3) | The availability of consolidated earnings reinvested in the business for dividends payable in cash is limited under terms of the indentures covering long-term debt. At September 30, 2017, $707.5 million of accumulated earnings was free of such limitations. |
-86-
NATIONAL FUEL GAS COMPANY
NOTES TO CONSOLIDATED FINANCIAL STATEMENTS - (Continued)
Common Stock
The Company has various plans which allow shareholders, employees and others to purchase shares of the Company common stock. The National Fuel Gas Company Direct Stock Purchase and Dividend Reinvestment Plan allows shareholders to reinvest cash dividends and make cash investments in the Company’s common stock and provides investors the opportunity to acquire shares of the Company common stock without the payment of any brokerage commissions in connection with such acquisitions. The 401(k) Plans allow employees the opportunity to invest in the Company common stock, in addition to a variety of other investment alternatives. Generally, at the discretion of the Company, shares purchased under these plans are either original issue shares purchased directly from the Company or shares purchased on the open market by an independent agent. During 2017, the Company issued 180,247 original issue shares of common stock for the Direct Stock Purchase and Dividend Reinvestment Plan and 103,602 original issue shares of common stock for the Company's 401(k) plans.
During 2017, the Company issued 45,912 original issue shares of common stock as a result of stock option and SARs exercises, 80,530 original issue shares of common stock for restricted stock units that vested and 43,484 original issue shares of common stock for performance shares that vested. Holders of stock options, SARs, restricted share awards or restricted stock units will often tender shares of common stock to the Company for payment of option exercise prices and/or applicable withholding taxes. During 2017, 53,564 shares of common stock were tendered to the Company for such purposes. The Company considers all shares tendered as cancelled shares restored to the status of authorized but unissued shares, in accordance with New Jersey law.
The Company also has a director stock program under which it issues shares of Company common stock to the non-employee directors of the Company who receive compensation under the Company’s 2009 Non-Employee Director Equity Compensation Plan, as partial consideration for the directors’ services during the fiscal year. Under this program, the Company issued 24,028 original issue shares of common stock during 2017.
Shareholder Rights Plan
In 1996, the Company’s Board of Directors adopted a shareholder rights plan (Plan). The Plan has been amended several times since it was adopted and is now embodied in an Amended and Restated Rights Agreement effective December 4, 2008, a copy of which was included as an exhibit to the Form 8-K filed by the Company on December 4, 2008.
Pursuant to the Plan, the holders of the Company’s common stock have one right (Right) for each of their shares. Each Right is initially evidenced by the Company’s common stock certificates representing the outstanding shares of common stock.
The Rights have anti-takeover effects because they will cause substantial dilution of the Company’s common stock if a person (an Acquiring Person) attempts to acquire the Company on terms not approved by the Board of Directors.
The Rights become exercisable upon the occurrence of a Distribution Date as described below, but after a Distribution Date, Rights that are owned by an Acquiring Person will be null and void. At any time following a Distribution Date, each holder of a Right may exercise its right to receive, upon payment of an amount calculated under the Rights Agreement, common stock of the Company (or, under certain circumstances, other securities or assets of the Company) having a value equal to two times the amount paid to exercise the Right. However, the Rights are subject to redemption or exchange by the Company prior to their exercise as described below.
A Distribution Date would occur upon the earlier of (i) ten days after the public announcement that a person or group has acquired, or obtained the right to acquire, beneficial ownership of the Company’s common stock or other voting stock (including Synthetic Long Positions as defined in the Plan) having 10% or more of the total voting power of the Company’s common stock and other voting stock or (ii) ten days after the commencement or announcement by a person or group of an intention to make a tender or exchange offer that would result in that person acquiring, or obtaining the right to acquire, beneficial ownership of the Company’s common stock or other
-87-
NATIONAL FUEL GAS COMPANY
NOTES TO CONSOLIDATED FINANCIAL STATEMENTS - (Continued)
voting stock having 10% or more of the total voting power of the Company’s common stock and other voting stock.
In certain situations after a person or group has acquired beneficial ownership of 10% or more of the total voting power of the Company’s stock as described above, each holder of a Right will have the right to receive, upon exercise of the Right, common stock of the acquiring company having a value equal to two times the amount paid to exercise the Right. These situations would arise if the Company is acquired in a merger or other business combination or if 50% or more of the Company’s assets or earning power is sold or transferred.
At any time prior to the end of the business day on the tenth day following the Distribution Date, the Company may redeem the Rights in whole, but not in part, at a price of $0.005 per Right, payable in cash or stock. A decision to redeem the Rights requires the vote of 75% of the Company’s full Board of Directors. Also, at any time following the Distribution Date, 75% of the Company’s full Board of Directors may vote to exchange the Rights, in whole or in part, at an exchange rate of one share of common stock, or other property deemed to have the same value, per Right, subject to certain adjustments.
Upon exercise of the Rights, the Company may need additional regulatory approvals to satisfy the requirements of the Rights Agreement. The Rights will expire on July 31, 2018, unless earlier than that date, they are exchanged or redeemed or the Plan is amended to extend the expiration date.
Stock Option and Stock Award Plans
The Company has various stock option and stock award plans which provide or provided for the issuance of one or more of the following to key employees: incentive stock options, nonqualified stock options, SARs, restricted stock, restricted stock units, performance units or performance shares.
Stock-based compensation expense for the years ended September 30, 2017, 2016 and 2015 was approximately $10.8 million, $4.8 million and $2.1 million, respectively. Stock-based compensation expense is included in operation and maintenance expense on the Consolidated Statements of Income. The total income tax benefit related to stock-based compensation expense during the years ended September 30, 2017, 2016 and 2015 was approximately $4.4 million, $1.9 million and $0.9 million, respectively. A portion of stock-based compensation expense is subject to capitalization under IRS uniform capitalization rules. Stock-based compensation of $0.1 million, $0.1 million and $0.1 million was capitalized under these rules during the years ended September 30, 2017, 2016 and 2015, respectively. The tax benefit recognized from stock-based compensation exercises and vestings was $0.5 million for the year ended September 30, 2017.
-88-
NATIONAL FUEL GAS COMPANY
NOTES TO CONSOLIDATED FINANCIAL STATEMENTS - (Continued)
Stock Options
Transactions involving option shares for all plans are summarized as follows:
Number of Shares Subject to Option | Weighted Average Exercise Price | Weighted Average Remaining Contractual Life (Years) | Aggregate Intrinsic Value (In thousands) | ||||||||||
Outstanding at September 30, 2016 | 19,000 | $ | 39.48 | ||||||||||
Granted in 2017 | — | $ | — | ||||||||||
Exercised in 2017 | (19,000 | ) | $ | 39.48 | |||||||||
Forfeited in 2017 | — | $ | — | ||||||||||
Outstanding at September 30, 2017 | — | $ | — | — | $ | — | |||||||
Option shares exercisable at September 30, 2017 | — | $ | — | — | $ | — | |||||||
Shares available for future grant at September 30, 2017(1) | 2,182,243 | ||||||||||||
(1) | Includes shares available for options, SARs, restricted stock and performance share grants. |
The total intrinsic value of stock options exercised during the years ended September 30, 2017, 2016 and 2015 totaled approximately $0.3 million, $4.1 million, and $5.1 million, respectively. For 2017, 2016 and 2015, the amount of cash received by the Company from the exercise of such stock options was approximately $0.8 million, $8.0 million, and $5.6 million, respectively. The Company last granted stock options in fiscal 2007 and all stock options have been fully vested since fiscal 2010.
SARs
Transactions involving SARs for all plans are summarized as follows:
Number of Shares Subject To Option | Weighted Average Exercise Price | Weighted Average Remaining Contractual Life (Years) | Aggregate Intrinsic Value (In thousands) | |||||||||
Outstanding at September 30, 2016 | 1,590,988 | $ | 48.19 | |||||||||
Granted in 2017 | — | $ | — | |||||||||
Exercised in 2017 | (82,077 | ) | $ | 39.77 | ||||||||
Forfeited in 2017 | — | $ | — | |||||||||
Expired in 2017 | (3,000 | ) | $ | 52.10 | ||||||||
Outstanding at September 30, 2017 | 1,505,911 | $ | 48.64 | 2.52 | $ | 13,144 | ||||||
SARs exercisable at September 30, 2017 | 1,505,911 | $ | 48.64 | 2.52 | $ | 13,144 | ||||||
The Company did not grant any SARs during the years ended September 30, 2016 and 2015. The Company’s SARs include both performance based and non-performance based SARs, but the performance conditions associated with the performance based SARs at the time of grant have all been subsequently met. The SARs are considered equity awards under the current authoritative guidance for stock-based compensation. The accounting for SARs is the same as the accounting for stock options.
The total intrinsic value of SARs exercised during the years ended September 30, 2017, 2016 and 2015 totaled approximately $1.6 million, $0.4 million, and $2.0 million, respectively. For the years ended September 30, 2017, 2016 and 2015, 5,000 SARs, 113,082 SARs and 157,386 SARs, respectively, became fully vested. The total
-89-
NATIONAL FUEL GAS COMPANY
NOTES TO CONSOLIDATED FINANCIAL STATEMENTS - (Continued)
fair value of the SARs that became vested during each of the years ended September 30, 2017, 2016 and 2015 was approximately $0.1 million, $1.2 million and $1.7 million, respectively.
Restricted Share Awards
Transactions involving restricted share awards for all plans are summarized as follows:
Number of Restricted Share Awards | Weighted Average Fair Value per Award | |||||
Outstanding at September 30, 2016 | 20,000 | $ | 47.46 | |||
Granted in 2017 | — | $ | — | |||
Vested in 2017 | — | $ | — | |||
Forfeited in 2017 | — | $ | — | |||
Outstanding at September 30, 2017 | 20,000 | $ | 47.46 | |||
The Company did not grant any restricted share awards (non-vested stock as defined by the current accounting literature) during the years ended September 30, 2016 and 2015. As of September 30, 2017, unrecognized compensation expense related to restricted share awards totaled approximately $0.3 million, which will be recognized over a weighted average period of 3.1 years.
Vesting restrictions for the 20,000 outstanding shares of non-vested restricted stock at September 30, 2017 will lapse in 2021.
Restricted Stock Units
Transactions involving non-performance based restricted stock units for all plans are summarized as follows:
Number of Restricted Stock Units | Weighted Average Fair Value per Award | |||||
Outstanding at September 30, 2016 | 239,151 | $ | 49.67 | |||
Granted in 2017 | 87,143 | $ | 52.13 | |||
Vested in 2017 | (80,530 | ) | $ | 53.38 | ||
Forfeited in 2017 | (12,565 | ) | $ | 53.75 | ||
Outstanding at September 30, 2017 | 233,199 | $ | 48.99 | |||
The Company also granted 101,943 and 88,899 non-performance based restricted stock units during the years ended September 30, 2016 and 2015, respectively. The weighted average fair value of such non-performance based restricted stock units granted in 2016 and 2015 was $35.89 per share and $64.04 per share, respectively. As of September 30, 2017, unrecognized compensation expense related to non-performance based restricted stock units totaled approximately $4.7 million, which will be recognized over a weighted average period of 2.2 years.
Vesting restrictions for the non-performance based restricted stock units outstanding at September 30, 2017 will lapse as follows: 2018 — 73,819 units; 2019 — 65,265 units; 2020 — 52,641 units; 2021 - 27,976 units; and 2022 - 13,498 units.
-90-
NATIONAL FUEL GAS COMPANY
NOTES TO CONSOLIDATED FINANCIAL STATEMENTS - (Continued)
Performance Shares
Transactions involving performance shares for all plans are summarized as follows:
Number of Performance Shares | Weighted Average Fair Value per Award | |||||
Outstanding at September 30, 2016 | 438,234 | $ | 44.98 | |||
Granted in 2017 | 184,148 | $ | 56.39 | |||
Vested in 2017 | (43,484 | ) | $ | 69.13 | ||
Forfeited in 2017 | (51,150 | ) | $ | 60.74 | ||
Outstanding at September 30, 2017 | 527,748 | $ | 45.44 | |||
The Company also granted 309,996 and 107,044 performance shares during the years ended September 30, 2016 and 2015, respectively. The weighted average grant date fair value of such performance shares granted in 2016 and 2015 was $30.71 per share and $65.26 per share, respectively. As of September 30, 2017, unrecognized compensation expense related to performance shares totaled approximately $10.1 million, which will be recognized over a weighted average period of 1.7 years. Vesting restrictions for the outstanding performance shares at September 30, 2017 will lapse as follows: 2018 - 88,132 shares; 2019 - 255,468 shares; and 2020 - 184,148 shares.
Half of the performance shares granted during the year ended September 30, 2017 must meet a performance goal related to relative return on capital over the performance cycle of October 1, 2016 to September 30, 2019. In addition, half of the performance shares granted during the year ended September 30, 2016 must meet a performance goal related to relative return on capital over the performance cycle of October 1, 2015 to September 30, 2018, and half of the performance shares granted during the year ended September 30, 2015 must meet a performance goal related to relative return on capital over the performance cycle of October 1, 2014 to September 30, 2017. The performance goals over their respective performance cycles for these performance shares granted during 2017, 2016 and 2015 is the Company’s total return on capital relative to the total return on capital of other companies in a group selected by the Compensation Committee (“Report Group”). Total return on capital for a given company means the average of the Report Group companies’ returns on capital for each twelve month period corresponding to each of the Company’s fiscal years during the performance cycle, based on data reported for the Report Group companies in the Bloomberg database. The number of these performance shares that will vest and be paid will depend upon the Company’s performance relative to the Report Group and not upon the absolute level of return achieved by the Company. The fair value of these performance shares is calculated by multiplying the expected number of shares that will be issued by the average market price of Company common stock on the date of grant reduced by the present value of forgone dividends over the vesting term of the award. The fair value is recorded as compensation expense over the vesting term of the award.
The other half of the performance shares granted during the year ended September 30, 2017 must meet a performance goal related to relative total shareholder return over the performance cycle of October 1, 2016 to September 30, 2019. In addition, the other half of the performance shares granted during the year ended September 30, 2016 must meet a performance goal related to relative total shareholder return over the performance cycle of October 1, 2015 to September 30, 2018, and the other half of the performance shares granted during the year ended September 30, 2015 must meet a performance goal related to relative total shareholder return over the performance cycle of October 1, 2014 to September 30, 2017. The performance goals over their respective performance cycles for these total shareholder return performance shares ("TSR performance shares") granted during 2017, 2016 and 2015 is the Company’s three-year total shareholder return relative to the three-year total shareholder return of the other companies in the Report Group. Three-year shareholder return for a given company will be based on the data reported for that company (with the starting and ending stock prices over the performance cycle calculated as the average closing stock price for the prior calendar month and with dividends reinvested in that company’s securities at each ex-dividend date) in the Bloomberg database. The number of these TSR
-91-
NATIONAL FUEL GAS COMPANY
NOTES TO CONSOLIDATED FINANCIAL STATEMENTS - (Continued)
performance shares that will vest and be paid will depend upon the Company’s performance relative to the Report Group and not upon the absolute level of return achieved by the Company. The fair value price at the date of grant for the TSR performance shares is determined using a Monte Carlo simulation technique, which includes a reduction in value for the present value of forgone dividends over the vesting term of the award. This price is multiplied by the number of TSR performance shares awarded, the result of which is recorded as compensation expense over the vesting term of the award. In calculating the fair value of the award, the risk-free interest rate is based on the yield of a Treasury Note with a term commensurate with the remaining term of the TSR performance shares. The remaining term is based on the remainder of the performance cycle as of the date of grant. The expected volatility is based on historical daily stock price returns. For the TSR performance shares, it was assumed that there would be no forfeitures, based on the vesting term and the number of grantees. The following assumptions were used in estimating the fair value of the TSR performance shares at the date of grant:
Year Ended September 30 | ||||||||
2017 | 2016 | 2015 | ||||||
Risk-Free Interest Rate | 1.54 | % | 1.26 | % | 1.01 | % | ||
Remaining Term at Date of Grant (Years) | 2.79 | 2.79 | 2.78 | |||||
Expected Volatility | 22.6 | % | 20.5 | % | 20.1 | % | ||
Expected Dividend Yield (Quarterly) | N/A | N/A | N/A | |||||
Redeemable Preferred Stock
As of September 30, 2017, there were 10,000,000 shares of $1 par value Preferred Stock authorized but unissued.
Long-Term Debt
The outstanding long-term debt is as follows:
At September 30 | |||||||
2017 | 2016 | ||||||
(Thousands) | |||||||
Medium-Term Notes(1): | |||||||
7.4% due March 2023 to June 2025 | $ | 99,000 | $ | 99,000 | |||
Notes(1)(3)(4): | |||||||
3.75% to 8.75% due April 2018 to September 2027 | 2,300,000 | 2,000,000 | |||||
Total Long-Term Debt | 2,399,000 | 2,099,000 | |||||
Less Unamortized Discount and Debt Issuance Costs | 15,319 | 12,748 | |||||
Less Current Portion(2) | 300,000 | — | |||||
$ | 2,083,681 | $ | 2,086,252 | ||||
(1) | The Medium-Term Notes and Notes are unsecured. |
(2) | Current Portion of Long-Term Debt at September 30, 2017 consisted of $300.0 million of 6.50% notes scheduled to mature in April 2018. The Company redeemed these notes on October 18, 2017 for $307.0 million, plus accrued interest. The call premium was recorded to Unamortized Debt Expense on the Consolidated Balance Sheet in October 2017. |
(3) | The holders of these notes may require the Company to repurchase their notes at a price equal to 101% of the principal amount in the event of both a change in control and a ratings downgrade to a rating below investment grade. |
-92-
NATIONAL FUEL GAS COMPANY
NOTES TO CONSOLIDATED FINANCIAL STATEMENTS - (Continued)
(4) | The interest rate payable on $300.0 million of 3.95% notes will be subject to adjustment from time to time, with a maximum of 2.00%, if certain change of control events involving a material subsidiary result in a downgrade of the credit rating assigned to the notes to below investment grade (or if the credit rating assigned to the notes is subsequently upgraded). |
On September 18, 2017, the Company issued $300.0 million of 3.95% notes due September 15, 2027. After deducting underwriting discounts, commissions and other debt issuance costs, the net proceeds to the Company amounted to $295.2 million. The proceeds of this debt issuance were used to redeem $300.0 million of 6.50% notes in October 2017.
As of September 30, 2017, the aggregate principal amounts of long-term debt maturing during the next five years and thereafter are as follows: $300.0 million in 2018, $250.0 million in 2019, zero in 2020 and 2021, $500.0 million in 2022, and $1,349.0 million thereafter.
Short-Term Borrowings
The Company historically has obtained short-term funds either through bank loans or the issuance of commercial paper. On September 9, 2016, the Company entered into a Third Amended and Restated Credit Agreement (Credit Agreement) with a syndicate of what now numbers 13 banks. This Credit Agreement provides a $750.0 million multi-year unsecured committed revolving credit facility through December 5, 2019. The Credit Agreement also provided a $500.0 million 364-day unsecured committed revolving credit facility with 11 of the 13 banks, which expired on September 8, 2017 and was not subsequently renewed. The Company also has a number of individual uncommitted or discretionary lines of credit with certain financial institutions for general corporate purposes. Borrowings under the uncommitted lines of credit are made at competitive market rates. The uncommitted credit lines are revocable at the option of the financial institutions and are reviewed on an annual basis. The Company anticipates that its uncommitted lines of credit generally will be renewed or substantially replaced by similar lines. The total amount available to be issued under the Company’s commercial paper program is $500.0 million. At September 30, 2017, the commercial paper program was backed by the Credit Agreement.
The Company did not have any outstanding commercial paper or short term notes payable to banks at September 30, 2017 and 2016.
Debt Restrictions
The Credit Agreement provides that the Company's debt to capitalization ratio will not exceed .675 at the last day of any fiscal quarter through September 30, 2017, or .65 at the last day of any fiscal quarter from October 1, 2017 through December 5, 2019. At September 30, 2017, the Company’s debt to capitalization ratio (as calculated under the facility) was .58. The constraints specified in the Credit Agreement would have permitted an additional $1.15 billion in short-term and/or long-term debt to be outstanding (further limited by the indenture covenants discussed below) before the Company’s debt to capitalization ratio exceeded .675.
A downgrade in the Company’s credit ratings could increase borrowing costs, negatively impact the availability of capital from banks, commercial paper purchasers and other sources, and require the Company's subsidiaries to post letters of credit, cash or other assets as collateral with certain counterparties. If the Company is not able to maintain investment-grade credit ratings, it may not be able to access commercial paper markets. However, the Company expects that it could borrow under its credit facilities or rely upon other liquidity sources, including cash provided by operations.
The Credit Agreement contains a cross-default provision whereby the failure by the Company or its significant subsidiaries to make payments under other borrowing arrangements, or the occurrence of certain events affecting those other borrowing arrangements, could trigger an obligation to repay any amounts outstanding under the Credit Agreement. In particular, a repayment obligation could be triggered if (i) the Company or any of its significant subsidiaries fails to make a payment when due of any principal or interest on any other indebtedness aggregating $40.0 million or more, or (ii) an event occurs that causes, or would permit the holders of any other indebtedness
-93-
NATIONAL FUEL GAS COMPANY
NOTES TO CONSOLIDATED FINANCIAL STATEMENTS - (Continued)
aggregating $40.0 million or more to cause, such indebtedness to become due prior to its stated maturity. As of September 30, 2017, the Company had no debt outstanding under the Credit Agreement.
Under the Company’s existing indenture covenants, at September 30, 2017, the Company would have been permitted to issue up to a maximum of $126.0 million in additional long-term indebtedness at then current market interest rates in addition to being able to issue new indebtedness to replace maturing debt. However, if the Company were to experience a significant loss in the future (for example, as a result of an impairment of oil and gas properties), it is possible, depending on factors including the magnitude of the loss, that these indenture covenants would restrict the Company's ability to issue additional long-term unsecured indebtedness for a period of up to nine calendar months, beginning with the fourth calendar month following the loss. This would not preclude the Company from issuing new indebtedness to replace maturing debt. The Company's present liquidity position is believed to be adequate to satisfy known demands.
The Company’s 1974 indenture pursuant to which $98.7 million (or 4.1%) of the Company’s long-term debt (as of September 30, 2017) was issued, contains a cross-default provision whereby the failure by the Company to perform certain obligations under other borrowing arrangements could trigger an obligation to repay the debt outstanding under the indenture. In particular, a repayment obligation could be triggered if the Company fails (i) to pay any scheduled principal or interest on any debt under any other indenture or agreement, or (ii) to perform any other term in any other such indenture or agreement, and the effect of the failure causes, or would permit the holders of the debt to cause, the debt under such indenture or agreement to become due prior to its stated maturity, unless cured or waived.
Note F — Fair Value Measurements
The FASB authoritative guidance regarding fair value measurements establishes a fair-value hierarchy and prioritizes the inputs used in valuation techniques that measure fair value. Those inputs are prioritized into three levels. Level 1 inputs are unadjusted quoted prices in active markets for assets or liabilities that the Company can access at the measurement date. Level 2 inputs are inputs other than quoted prices included within Level 1 that are observable for the asset or liability, either directly or indirectly at the measurement date. Level 3 inputs are unobservable inputs for the asset or liability at the measurement date. The Company’s assessment of the significance of a particular input to the fair value measurement requires judgment, and may affect the valuation of fair value assets and liabilities and their placement within the fair value hierarchy levels.
The following table sets forth, by level within the fair value hierarchy, the Company’s financial assets and liabilities (as applicable) that were accounted for at fair value on a recurring basis as of September 30, 2017 and 2016. Financial assets and liabilities are classified in their entirety based on the lowest level of input that is significant to the fair value measurement. The fair value presentation for over-the-counter swaps combines gas and oil swaps because a significant number of the counterparties enter into both gas and oil swap agreements with the Company.
-94-
NATIONAL FUEL GAS COMPANY
NOTES TO CONSOLIDATED FINANCIAL STATEMENTS - (Continued)
At Fair Value as of September 30, 2017 | |||||||||||||||||||
Recurring Fair Value Measures | Level 1 | Level 2 | Level 3 | Netting Adjustments(1) | Total(1) | ||||||||||||||
(Dollars in thousands) | |||||||||||||||||||
Assets: | |||||||||||||||||||
Cash Equivalents — Money Market Mutual Funds | $ | 527,978 | $ | — | $ | — | $ | — | $ | 527,978 | |||||||||
Derivative Financial Instruments: | |||||||||||||||||||
Commodity Futures Contracts — Gas | 1,483 | — | — | (963 | ) | 520 | |||||||||||||
Over the Counter Swaps — Gas and Oil | — | 38,977 | — | (4,206 | ) | 34,771 | |||||||||||||
Foreign Currency Contracts | — | 1,227 | — | (407 | ) | 820 | |||||||||||||
Other Investments: | |||||||||||||||||||
Balanced Equity Mutual Fund | 37,033 | — | — | — | 37,033 | ||||||||||||||
Fixed Income Mutual Fund | 45,727 | — | — | — | 45,727 | ||||||||||||||
Common Stock — Financial Services Industry | 3,150 | — | — | — | 3,150 | ||||||||||||||
Hedging Collateral Deposits | 1,741 | — | — | — | 1,741 | ||||||||||||||
Total | $ | 617,112 | $ | 40,204 | $ | — | $ | (5,576 | ) | $ | 651,740 | ||||||||
Liabilities: | |||||||||||||||||||
Derivative Financial Instruments: | |||||||||||||||||||
Commodity Futures Contracts — Gas | $ | 963 | $ | — | $ | — | $ | (963 | ) | $ | — | ||||||||
Over the Counter Swaps — Gas and Oil | — | 5,309 | — | (4,206 | ) | 1,103 | |||||||||||||
Foreign Currency Contracts | — | 407 | — | (407 | ) | — | |||||||||||||
Total | $ | 963 | $ | 5,716 | $ | — | $ | (5,576 | ) | $ | 1,103 | ||||||||
Total Net Assets/(Liabilities) | $ | 616,149 | $ | 34,488 | $ | — | $ | — | $ | 650,637 | |||||||||
At Fair Value as of September 30, 2016 | |||||||||||||||||||
Recurring Fair Value Measures | Level 1 | Level 2 | Level 3 | Netting Adjustments(1) | Total(1) | ||||||||||||||
(Dollars in thousands) | |||||||||||||||||||
Assets: | |||||||||||||||||||
Cash Equivalents — Money Market Mutual Funds | $ | 113,407 | $ | — | $ | — | $ | — | $ | 113,407 | |||||||||
Derivative Financial Instruments: | |||||||||||||||||||
Commodity Futures Contracts — Gas | 2,623 | — | — | (2,276 | ) | 347 | |||||||||||||
Over the Counter Swaps — Gas and Oil | — | 119,654 | — | (3,860 | ) | 115,794 | |||||||||||||
Foreign Currency Contracts | — | — | — | (2,337 | ) | (2,337 | ) | ||||||||||||
Other Investments: | |||||||||||||||||||
Balanced Equity Mutual Fund | 36,658 | — | — | — | 36,658 | ||||||||||||||
Fixed Income Mutual Fund | 31,395 | — | — | — | 31,395 | ||||||||||||||
Common Stock — Financial Services Industry | 2,902 | — | — | — | 2,902 | ||||||||||||||
Hedging Collateral Deposits | 1,484 | — | — | — | 1,484 | ||||||||||||||
Total | $ | 188,469 | $ | 119,654 | $ | — | $ | (8,473 | ) | $ | 299,650 | ||||||||
Liabilities: | |||||||||||||||||||
Derivative Financial Instruments: | |||||||||||||||||||
Commodity Futures Contracts — Gas | $ | 2,276 | $ | — | $ | — | $ | (2,276 | ) | $ | — | ||||||||
Over the Counter Swaps — Gas and Oil | — | 5,322 | — | (3,860 | ) | 1,462 | |||||||||||||
Foreign Currency Contracts | — | 2,337 | — | (2,337 | ) | — | |||||||||||||
Total | $ | 2,276 | $ | 7,659 | $ | — | $ | (8,473 | ) | $ | 1,462 | ||||||||
Total Net Assets/(Liabilities) | $ | 186,193 | $ | 111,995 | $ | — | $ | — | $ | 298,188 | |||||||||
-95-
NATIONAL FUEL GAS COMPANY
NOTES TO CONSOLIDATED FINANCIAL STATEMENTS - (Continued)
(1) | Netting Adjustments represent the impact of legally-enforceable master netting arrangements that allow the Company to net gain and loss positions held with the same counterparties. The net asset or net liability for each counterparty is recorded as an asset or liability on the Company’s balance sheet. |
Derivative Financial Instruments
At September 30, 2017 and 2016, the derivative financial instruments reported in Level 1 consist of natural gas NYMEX and ICE futures contracts used in the Company’s Energy Marketing segment. Hedging collateral deposits of $1.7 million (at September 30, 2017) and $1.5 million (at September 30, 2016), which are associated with these futures contracts, have been reported in Level 1 as well. The derivative financial instruments reported in Level 2 at September 30, 2017 and 2016 consist of natural gas price swap agreements used in the Company’s Exploration and Production and Energy Marketing segments, the majority of the crude oil price swap agreements used in the Company’s Exploration and Production segment and foreign currency contracts used in the Company's Exploration and Production segment. The fair value of the Level 2 price swap agreements is based on an internal, discounted cash flow model that uses observable inputs (i.e. LIBOR based discount rates and basis differential information, if applicable, at active natural gas and crude oil trading markets). The fair value of the Level 2 foreign currency contracts is determined using the market approach based on observable market transactions of forward Canadian currency rates.
The accounting rules for fair value measurements and disclosures require consideration of the impact of nonperformance risk (including credit risk) from a market participant perspective in the measurement of the fair value of assets and liabilities. At September 30, 2017, the Company determined that nonperformance risk would have no material impact on its financial position or results of operation. To assess nonperformance risk, the Company considered information such as any applicable collateral posted, master netting arrangements, and applied a market-based method by using the counterparty's (assuming the derivative is in a gain position) or the Company’s (assuming the derivative is in a loss position) credit default swaps rates.
For the years ended September 30, 2017 and 2016, there were no assets or liabilities measured at fair value and classified as Level 3. The Company's Exploration and Production segment had a small portion of their crude oil price swap agreements reported as Level 3 at October 1, 2015 that settled during the first quarter of fiscal 2016. For the years ended September 30, 2017 and September 30, 2016, no transfers in or out of Level 1 or Level 2 occurred.
Note G — Financial Instruments
Long-Term Debt
The fair market value of the Company’s debt, as presented in the table below, was determined using a discounted cash flow model, which incorporates the Company’s credit ratings and current market conditions in determining the yield, and subsequently, the fair market value of the debt. Based on these criteria, the fair market value of long-term debt, including current portion, was as follows:
At September 30 | |||||||||||||||
2017 Carrying Amount | 2017 Fair Value | 2016 Carrying Amount | 2016 Fair Value | ||||||||||||
(Thousands) | |||||||||||||||
Long-Term Debt | $ | 2,383,681 | $ | 2,523,639 | $ | 2,086,252 | $ | 2,255,562 | |||||||
The fair value amounts are not intended to reflect principal amounts that the Company will ultimately be required to pay. Carrying amounts for other financial instruments recorded on the Company’s Consolidated Balance
-96-
NATIONAL FUEL GAS COMPANY
NOTES TO CONSOLIDATED FINANCIAL STATEMENTS - (Continued)
Sheets approximate fair value. The fair value of long-term debt was calculated using observable inputs (U.S. Treasuries/LIBOR for the risk-free component and company specific credit spread information — generally obtained from recent trade activity in the debt). As such, the Company considers the debt to be Level 2.
Any temporary cash investments, notes payable to banks and commercial paper are stated at cost. Temporary cash investments are considered Level 1, while notes payable to banks and commercial paper are considered to be Level 2. Given the short-term nature of the notes payable to banks and commercial paper, the Company believes cost is a reasonable approximation of fair value.
Other Investments
Investments in life insurance are stated at their cash surrender values or net present value as discussed below. Investments in an equity mutual fund, a fixed income mutual fund and the stock of an insurance company (marketable equity securities), as discussed below, are stated at fair value based on quoted market prices.
Other investments include cash surrender values of insurance contracts (net present value in the case of split-dollar collateral assignment arrangements) and marketable equity and fixed income securities. The values of the insurance contracts amounted to $39.4 million and $39.7 million at September 30, 2017 and 2016, respectively. The fair value of the equity mutual fund was $37.0 million and $36.7 million at September 30, 2017 and 2016, respectively. The gross unrealized gain on this equity mutual fund was $9.9 million at September 30, 2017 and $7.9 million at September 30, 2016. The fair value of the fixed income mutual fund was $45.7 million and $31.4 million at September 30, 2017 and 2016, respectively. The gross unrealized loss on this fixed income mutual fund was less than $0.1 million at September 30, 2017 and the gross unrealized gain on this fixed income mutual fund was less than $0.1 million at September 30, 2016. The fair value of the stock of an insurance company was $3.2 million and $2.9 million at September 30, 2017 and 2016, respectively. The gross unrealized gain on this stock was $2.2 million and $1.6 million at September 30, 2017 and 2016, respectively. The insurance contracts and marketable equity and fixed income securities are primarily informal funding mechanisms for various benefit obligations the Company has to certain employees.
Derivative Financial Instruments
The Company uses derivative financial instruments to manage commodity price risk in the Exploration and Production segment as well as the Energy Marketing segment. The Company enters into futures contracts and over-the-counter swap agreements for natural gas and crude oil to manage the price risk associated with forecasted sales of gas and oil. In addition, the Company also enters into foreign exchange forward contracts to manage the risk of currency fluctuations associated with transportation costs denominated in Canadian currency in the Exploration and Production segment. These instruments are accounted for as cash flow hedges. The Company also enters into futures contracts and swaps, which are accounted for as cash flow hedges, to manage the price risk associated with forecasted gas purchases. The Company enters into futures contracts and swaps to mitigate risk associated with fixed price sales commitments, fixed price purchase commitments, and the decline in value of natural gas held in storage. These instruments are accounted for as fair value hedges. The length of the Company’s combined cash flow and fair value hedges does not typically exceed 6 years while the foreign currency forward contracts do not exceed 9 years. The Exploration and Production segment holds the majority of the Company’s derivative financial instruments.
The Company has presented its net derivative assets and liabilities as “Fair Value of Derivative Financial Instruments” on its Consolidated Balance Sheets at September 30, 2017 and September 30, 2016. Substantially all of the derivative financial instruments reported on those line items relate to commodity contracts and a small portion relates to foreign currency forward contracts.
-97-
NATIONAL FUEL GAS COMPANY
NOTES TO CONSOLIDATED FINANCIAL STATEMENTS - (Continued)
Cash Flow Hedges
For derivative instruments that are designated and qualify as a cash flow hedge, the effective portion of the gain or loss on the derivative is reported as a component of other comprehensive income (loss) and reclassified into earnings in the period or periods during which the hedged transaction affects earnings. Gains and losses on the derivative representing either hedge ineffectiveness or hedge components excluded from the assessment of effectiveness are recognized in current earnings.
As of September 30, 2017, the Company had the following commodity derivative contracts (swaps and futures contracts) outstanding:
Commodity | Units | ||
Natural Gas | 114.3 | Bcf (short positions) | |
Natural Gas | 1.0 | Bcf (long positions) | |
Crude Oil | 3,459,000 | Bbls (short positions) | |
As of September 30, 2017, the Company was hedging a total of $89.2 million of forecasted transportation costs denominated in Canadian dollars with foreign currency forward contracts (long positions).
As of September 30, 2017, the Company had $35.5 million ($20.8 million after tax) of net hedging gains included in the accumulated other comprehensive income (loss) balance. It is expected that $18.0 million ($10.6 million after tax) of such unrealized gains will be reclassified into the Consolidated Statement of Income within the next 12 months as the underlying hedged transactions are recorded in earnings.
The Effect of Derivative Financial Instruments on the Statement of Financial Performance for the Year Ended September 30, 2017 and 2016 (Dollar Amounts in Thousands) | ||||||||||||||||||||||||||||
Derivatives in Cash Flow Hedging Relationships | Amount of Derivative Gain or (Loss) Recognized in Other Comprehensive Income (Loss) on the Consolidated Statement of Comprehensive Income (Loss) (Effective Portion) for the Year Ended September 30, | Location of Derivative Gain or (Loss) Reclassified from Accumulated Other Comprehensive Income (Loss) on the Consolidated Balance Sheet into the Consolidated Statement of Income (Effective Portion) | Amount of Derivative Gain or (Loss) Reclassified from Accumulated Other Comprehensive Income (Loss) on the Consolidated Balance Sheet into the Consolidated Statement of Income (Effective Portion) for the Year Ended September 30, | Location of Derivative Gain or (Loss) Recognized in the Consolidated Statement of Income (Ineffective Portion and Amount Excluded from Effectiveness Testing) | Derivative Gain or (Loss) Recognized in the Consolidated Statement of Income (Ineffective Portion and Amount Excluded from Effectiveness Testing) for the Year Ended September 30, | |||||||||||||||||||||||
2017 | 2016 | 2017 | 2016 | 2017 | 2016 | |||||||||||||||||||||||
Commodity Contracts | $ | 2,811 | $ | 58,714 | Operating Revenue | $ | 83,983 | $ | 216,823 | Operating Revenue | $ | (100 | ) | $ | 392 | |||||||||||||
Commodity Contracts | (164 | ) | 1,585 | Purchased Gas | (1,921 | ) | 4,520 | Not Applicable | — | — | ||||||||||||||||||
Foreign Currency Contracts | 2,700 | 194 | Operation and Maintenance Expense | (457 | ) | (424 | ) | Not Applicable | — | — | ||||||||||||||||||
Total | $ | 5,347 | $ | 60,493 | $ | 81,605 | $ | 220,919 | $ | (100 | ) | $ | 392 | |||||||||||||||
Fair Value Hedges
The Company utilizes fair value hedges to mitigate risk associated with fixed price sales commitments, fixed price purchase commitments, and the decline in the value of certain natural gas held in storage. With respect to fixed price sales commitments, the Company enters into long positions to mitigate the risk of price increases for natural gas supplies that could occur after the Company enters into fixed price sales agreements with its customers.
-98-
NATIONAL FUEL GAS COMPANY
NOTES TO CONSOLIDATED FINANCIAL STATEMENTS - (Continued)
With respect to fixed price purchase commitments, the Company enters into short positions to mitigate the risk of price decreases that could occur after the Company locks into fixed price purchase deals with its suppliers. With respect to storage hedges, the Company enters into short positions to mitigate the risk of price decreases that could result in a lower of cost or net realizable value writedown of the value of natural gas in storage that is recorded in the Company’s financial statements. As of September 30, 2017, the Company’s Energy Marketing segment had fair value hedges covering approximately 17.5 Bcf (16.4 Bcf of fixed price sales commitments and 1.1 Bcf of commitments related to the withdrawal of storage gas). For derivative instruments that are designated and qualify as a fair value hedge, the gain or loss on the derivative as well as the offsetting gain or loss on the hedged item attributable to the hedged risk completely offset each other in current earnings, as shown below.
Derivatives in Fair Value Hedging Relationships | Location of Gain or (Loss) on Derivative and Hedged Item Recognized in the Consolidated Statement of Income | Amount of Gain or (Loss) on Derivative Recognized in the Consolidated Statement of Income for the Year Ended September 30, 2017 | Amount of Gain or (Loss) on Hedged Item Recognized in the Consolidated Statement of Income for the Year Ended September 30, 2017 | |||||||
(In thousands) | ||||||||||
Commodity Contracts | Operating Revenues | $ | 1,655 | $ | (1,655 | ) | ||||
Commodity Contracts | Purchased Gas | 464 | (464 | ) | ||||||
$ | 2,119 | $ | (2,119 | ) | ||||||
Credit Risk
The Company may be exposed to credit risk on any of the derivative financial instruments that are in a gain position. Credit risk relates to the risk of loss that the Company would incur as a result of nonperformance by counterparties pursuant to the terms of their contractual obligations. To mitigate such credit risk, management performs a credit check, and then on a quarterly basis monitors counterparty credit exposure. The majority of the Company’s counterparties are financial institutions and energy traders. The Company has over-the-counter swap positions and applicable foreign currency forward contracts with seventeen counterparties of which sixteen are in a net gain position. On average, the Company had $2.2 million of credit exposure per counterparty in a gain position at September 30, 2017. The maximum credit exposure per counterparty in a gain position at September 30, 2017 was $6.0 million. As of September 30, 2017, no collateral was received from the counterparties by the Company. The Company's gain position on such derivative financial instruments had not exceeded the established thresholds at which the counterparties would be required to post collateral, nor had the counterparties' credit ratings declined to levels at which the counterparties were required to post collateral.
As of September 30, 2017, fourteen of the seventeen counterparties to the Company’s outstanding derivative instrument contracts (specifically the over-the-counter swaps and applicable foreign currency forward contracts) had a common credit-risk related contingency feature. In the event the Company’s credit rating increases or falls below a certain threshold (applicable debt ratings), the available credit extended to the Company would either increase or decrease. A decline in the Company’s credit rating, in and of itself, would not cause the Company to be required to increase the level of its hedging collateral deposits (in the form of cash deposits, letters of credit or treasury debt instruments). If the Company’s outstanding derivative instrument contracts were in a liability position (or if the liability were larger) and/or the Company’s credit rating declined, then additional hedging collateral deposits may be required. At September 30, 2017, the fair market value of the derivative financial instrument assets with a credit-risk related contingency feature was $26.0 million according to the Company’s internal model (discussed in Note F — Fair Value Measurements). For its over-the-counter swap agreements and foreign currency forward contracts, no hedging collateral deposits were required to be posted by the Company at September 30, 2017.
For its exchange traded futures contracts, the Company was required to post $1.7 million in hedging collateral deposits as of September 30, 2017. As these are exchange traded futures contracts, there are no specific credit-
-99-
NATIONAL FUEL GAS COMPANY
NOTES TO CONSOLIDATED FINANCIAL STATEMENTS - (Continued)
risk related contingency features. The Company posts or receives hedging collateral based on open positions and margin requirements it has with its counterparties.
The Company’s requirement to post hedging collateral deposits and the Company's right to receive hedging collateral deposits is based on the fair value determined by the Company’s counterparties, which may differ from the Company’s assessment of fair value. Hedging collateral deposits may also include closed derivative positions in which the broker has not cleared the cash from the account to offset the derivative liability. The Company records liabilities related to closed derivative positions in Other Accruals and Current Liabilities on the Consolidated Balance Sheet. These liabilities are relieved when the broker clears the cash from the hedging collateral deposit account. This is discussed in Note A under Hedging Collateral Deposits.
Note H — Retirement Plan and Other Post-Retirement Benefits
The Company has a tax-qualified, noncontributory, defined-benefit retirement plan (Retirement Plan). The Retirement Plan covers certain non-collectively bargained employees hired before July 1, 2003 and certain collectively bargained employees hired before November 1, 2003. Certain non-collectively bargained employees hired after June 30, 2003 and certain collectively bargained employees hired after October 31, 2003 are eligible for a Retirement Savings Account benefit provided under the Company’s defined contribution Tax-Deferred Savings Plans. Costs associated with the Retirement Savings Account were $2.9 million, $2.6 million and $2.3 million for the years ended September 30, 2017, 2016 and 2015, respectively. Costs associated with the Company’s contributions to the Tax-Deferred Savings Plans, exclusive of the costs associated with the Retirement Savings Account, were $5.9 million, $5.9 million, and $5.8 million for the years ended September 30, 2017, 2016 and 2015, respectively.
The Company provides health care and life insurance benefits (other post-retirement benefits) for a majority of its retired employees. The other post-retirement benefits cover certain non-collectively bargained employees hired before January 1, 2003 and certain collectively bargained employees hired before October 31, 2003.
The Company’s policy is to fund the Retirement Plan with at least an amount necessary to satisfy the minimum funding requirements of applicable laws and regulations and not more than the maximum amount deductible for federal income tax purposes. The Company has established VEBA trusts for its other post-retirement benefits. Contributions to the VEBA trusts are tax deductible, subject to limitations contained in the Internal Revenue Code and regulations and are made to fund employees’ other post-retirement benefits, as well as benefits as they are paid to current retirees. In addition, the Company has established 401(h) accounts for its other post-retirement benefits. They are separate accounts within the Retirement Plan trust used to pay retiree medical benefits for the associated participants in the Retirement Plan. Although these accounts are in the Retirement Plan trust, for funding status purposes as shown below, the 401(h) accounts are included in Fair Value of Assets under Other Post-Retirement Benefits. Contributions are tax-deductible when made, subject to limitations contained in the Internal Revenue Code and regulations.
The expected return on Retirement Plan assets, a component of net periodic benefit cost shown in the tables below, is applied to the market-related value of plan assets. The market-related value of plan assets is the market value as of the measurement date adjusted for variances between actual returns and expected returns (from previous years) that have not been reflected in net periodic benefit costs. The expected return on other post-retirement benefit assets (i.e. the VEBA trusts and 401(h) accounts), which is a component of net periodic benefit cost shown in the tables below, is applied to the fair value of assets as of the measurement date.
Reconciliations of the Benefit Obligations, Plan Assets and Funded Status, as well as the components of Net Periodic Benefit Cost and the Weighted Average Assumptions of the Retirement Plan and other post-retirement benefits are shown in the tables below. The date used to measure the Benefit Obligations, Plan Assets and Funded Status is September 30 for fiscal years 2017, 2016 and 2015.
-100-
NATIONAL FUEL GAS COMPANY
NOTES TO CONSOLIDATED FINANCIAL STATEMENTS - (Continued)
Retirement Plan | Other Post-Retirement Benefits | ||||||||||||||||||||||
Year Ended September 30 | Year Ended September 30 | ||||||||||||||||||||||
2017 | 2016 | 2015 | 2017 | 2016 | 2015 | ||||||||||||||||||
(Thousands) | |||||||||||||||||||||||
Change in Benefit Obligation | |||||||||||||||||||||||
Benefit Obligation at Beginning of Period | $ | 1,097,421 | $ | 1,026,190 | $ | 999,499 | $ | 526,138 | $ | 464,987 | $ | 465,583 | |||||||||||
Service Cost | 11,969 | 11,710 | 12,047 | 2,449 | 2,331 | 2,693 | |||||||||||||||||
Interest Cost | 38,383 | 42,315 | 41,217 | 19,007 | 20,386 | 19,285 | |||||||||||||||||
Plan Participants’ Contributions | — | — | — | 2,717 | 2,558 | 2,242 | |||||||||||||||||
Retiree Drug Subsidy Receipts | — | — | — | 1,553 | 1,925 | 1,338 | |||||||||||||||||
Amendments(1) | — | — | 7,752 | — | — | — | |||||||||||||||||
Actuarial (Gain) Loss | (32,466 | ) | 76,309 | 23,426 | (62,215 | ) | 60,402 | (1,575 | ) | ||||||||||||||
Benefits Paid | (60,481 | ) | (59,103 | ) | (57,751 | ) | (27,030 | ) | (26,451 | ) | (24,579 | ) | |||||||||||
Benefit Obligation at End of Period | $ | 1,054,826 | $ | 1,097,421 | $ | 1,026,190 | $ | 462,619 | $ | 526,138 | $ | 464,987 | |||||||||||
Change in Plan Assets | |||||||||||||||||||||||
Fair Value of Assets at Beginning of Period | $ | 869,775 | $ | 834,870 | $ | 869,791 | $ | 494,320 | $ | 477,959 | $ | 497,601 | |||||||||||
Actual Return on Plan Assets | 84,279 | 87,008 | (13,370 | ) | 40,157 | 37,415 | 534 | ||||||||||||||||
Employer Contributions | 17,146 | 7,000 | 36,200 | 3,853 | 2,839 | 2,161 | |||||||||||||||||
Plan Participants’ Contributions | — | — | — | 2,717 | 2,558 | 2,242 | |||||||||||||||||
Benefits Paid | (60,481 | ) | (59,103 | ) | (57,751 | ) | (27,030 | ) | (26,451 | ) | (24,579 | ) | |||||||||||
Fair Value of Assets at End of Period | $ | 910,719 | $ | 869,775 | $ | 834,870 | $ | 514,017 | $ | 494,320 | $ | 477,959 | |||||||||||
Net Amount Recognized at End of Period (Funded Status) | $ | (144,107 | ) | $ | (227,646 | ) | $ | (191,320 | ) | $ | 51,398 | $ | (31,818 | ) | $ | 12,972 | |||||||
Amounts Recognized in the Balance Sheets Consist of: | |||||||||||||||||||||||
Non-Current Liabilities | $ | (144,107 | ) | $ | (227,646 | ) | $ | (191,320 | ) | $ | (4,972 | ) | $ | (49,467 | ) | $ | (11,487 | ) | |||||
Non-Current Assets | — | — | — | 56,370 | 17,649 | 24,459 | |||||||||||||||||
Net Amount Recognized at End of Period | $ | (144,107 | ) | $ | (227,646 | ) | $ | (191,320 | ) | $ | 51,398 | $ | (31,818 | ) | $ | 12,972 | |||||||
Accumulated Benefit Obligation | $ | 1,010,179 | $ | 1,039,408 | $ | 968,984 | N/A | N/A | N/A | ||||||||||||||
Weighted Average Assumptions Used to Determine Benefit Obligation at September 30 | |||||||||||||||||||||||
Discount Rate | 3.77 | % | 3.60 | % | 4.25 | % | 3.81 | % | 3.70 | % | 4.50 | % | |||||||||||
Rate of Compensation Increase | 4.70 | % | 4.70 | % | 4.75 | % | 4.70 | % | 4.70 | % | 4.75 | % | |||||||||||
-101-
NATIONAL FUEL GAS COMPANY
NOTES TO CONSOLIDATED FINANCIAL STATEMENTS - (Continued)
Retirement Plan | Other Post-Retirement Benefits | ||||||||||||||||||||||
Year Ended September 30 | Year Ended September 30 | ||||||||||||||||||||||
2017 | 2016 | 2015 | 2017 | 2016 | 2015 | ||||||||||||||||||
(Thousands) | |||||||||||||||||||||||
Components of Net Periodic Benefit Cost | |||||||||||||||||||||||
Service Cost | $ | 11,969 | $ | 11,710 | $ | 12,047 | $ | 2,449 | $ | 2,331 | $ | 2,693 | |||||||||||
Interest Cost | 38,383 | 42,315 | 41,217 | 19,007 | 20,386 | 19,285 | |||||||||||||||||
Expected Return on Plan Assets | (59,718 | ) | (59,369 | ) | (59,615 | ) | (31,458 | ) | (31,535 | ) | (34,089 | ) | |||||||||||
Amortization of Prior Service Cost (Credit) | 1,058 | 1,234 | 183 | (429 | ) | (912 | ) | (1,913 | ) | ||||||||||||||
Recognition of Actuarial Loss(2) | 42,687 | 32,248 | 36,129 | 18,415 | 5,530 | 4,148 | |||||||||||||||||
Net Amortization and Deferral for Regulatory Purposes | 469 | 3,957 | 7,739 | 6,108 | 17,123 | 20,322 | |||||||||||||||||
Net Periodic Benefit Cost | $ | 34,848 | $ | 32,095 | $ | 37,700 | $ | 14,092 | $ | 12,923 | $ | 10,446 | |||||||||||
Weighted Average Assumptions Used to Determine Net Periodic Benefit Cost at September 30 | |||||||||||||||||||||||
Discount Rate | 3.60 | % | 4.25 | % | 4.25 | % | 3.70 | % | 4.50 | % | 4.25 | % | |||||||||||
Expected Return on Plan Assets | 7.00 | % | 7.25 | % | 7.50 | % | 6.50 | % | 6.75 | % | 7.00 | % | |||||||||||
Rate of Compensation Increase | 4.75 | % | 4.75 | % | 4.75 | % | 4.75 | % | 4.75 | % | 4.75 | % | |||||||||||
(1) | In fiscal 2015, the Company passed an amendment which updated the mortality table used in the Retirement Plan's definition of "actuarially equivalent" effective July 1, 2015. This increased the benefit obligation of the Retirement Plan. |
(2) | Distribution Corporation’s New York jurisdiction calculates the amortization of the actuarial loss on a vintage year basis over 10 years, as mandated by the NYPSC. All the other subsidiaries of the Company utilize the corridor approach. |
The Net Periodic Benefit Cost in the table above includes the effects of regulation. The Company recovers pension and other post-retirement benefit costs in its Utility and Pipeline and Storage segments in accordance with the applicable regulatory commission authorizations. Certain of those commission authorizations established tracking mechanisms which allow the Company to record the difference between the amount of pension and other post-retirement benefit costs recoverable in rates and the amounts of such costs as determined under the existing authoritative guidance as either a regulatory asset or liability, as appropriate. Any activity under the tracking mechanisms (including the amortization of pension and other post-retirement regulatory assets and liabilities) is reflected in the Net Amortization and Deferral for Regulatory Purposes line item above.
In addition to the Retirement Plan discussed above, the Company also has Non-Qualified benefit plans that cover a group of management employees designated by the Chief Executive Officer of the Company. These plans provide for defined benefit payments upon retirement of the management employee, or to the spouse upon death of the management employee. The net periodic benefit costs associated with these plans were $7.6 million, $7.5 million and $7.0 million in 2017, 2016 and 2015, respectively. The accumulated benefit obligations for the plans were $72.5 million, $72.4 million and $66.0 million at September 30, 2017, 2016 and 2015, respectively. The projected benefit obligations for the plans were $88.9 million, $91.7 million and $85.8 million at September 30, 2017, 2016 and 2015, respectively. At September 30, 2017, $14.1 million of the projected benefit obligation is recorded in Other Accruals and Current Liabilities and the remaining $74.8 million is recorded in Other Deferred Credits on the Consolidated Balance Sheets. At September 30, 2016, $9.8 million of the projected benefit obligation
-102-
NATIONAL FUEL GAS COMPANY
NOTES TO CONSOLIDATED FINANCIAL STATEMENTS - (Continued)
was recorded in Other Accruals and Current Liabilities and the remaining $81.9 million was recorded in Other Deferred Credits on the Consolidated Balance Sheets. At September 30, 2015, $4.5 million of the projected benefit obligation was recorded in Other Accruals and Current Liabilities and the remaining $81.3 million was recorded in Other Deferred Credits on the Consolidated Balance Sheets. The weighted average discount rates for these plans were 3.22%, 2.80% and 3.50% as of September 30, 2017, 2016 and 2015, respectively and the weighted average rates of compensation increase for these plans were 7.75%, 7.75% and 7.75% as of September 30, 2017, 2016 and 2015, respectively.
The cumulative amounts recognized in accumulated other comprehensive income (loss), regulatory assets, and regulatory liabilities through fiscal 2017, the changes in such amounts during 2017, as well as the amounts expected to be recognized in net periodic benefit cost in fiscal 2018 are presented in the table below:
Retirement Plan | Other Post-Retirement Benefits | Non-Qualified Benefit Plans | |||||||||
(Thousands) | |||||||||||
Amounts Recognized in Accumulated Other Comprehensive Income (Loss), Regulatory Assets and Regulatory Liabilities(1) | |||||||||||
Net Actuarial Loss | $ | (203,887 | ) | $ | (19,578 | ) | $ | (24,332 | ) | ||
Prior Service (Cost) Credit | (6,133 | ) | 3,687 | — | |||||||
Net Amount Recognized | $ | (210,020 | ) | $ | (15,891 | ) | $ | (24,332 | ) | ||
Changes to Accumulated Other Comprehensive Income (Loss), Regulatory Assets and Regulatory Liabilities Recognized During Fiscal 2017(1) | |||||||||||
Decrease (Increase) in Actuarial Loss, excluding amortization(2) | $ | 57,028 | $ | 70,915 | $ | (1,351 | ) | ||||
Change due to Amortization of Actuarial Loss | 42,687 | 18,415 | 4,059 | ||||||||
Prior Service (Cost) Credit | 1,058 | (429 | ) | — | |||||||
Net Change | $ | 100,773 | $ | 88,901 | $ | 2,708 | |||||
Amounts Expected to be Recognized in Net Periodic Benefit Cost in the Next Fiscal Year(1) | |||||||||||
Net Actuarial Loss | $ | (37,205 | ) | $ | (10,558 | ) | $ | (3,549 | ) | ||
Prior Service (Cost) Credit | (938 | ) | 429 | — | |||||||
Net Amount Expected to be Recognized | $ | (38,143 | ) | $ | (10,129 | ) | $ | (3,549 | ) | ||
(1) | Amounts presented are shown before recognizing deferred taxes. |
(2) | Amounts presented include the impact of actuarial gains/losses related to return on assets, as well as the Actuarial (Gain) Loss amounts presented in the Change in Benefit Obligation. |
In order to adjust the funded status of its pension (tax-qualified and non-qualified) and other post-retirement benefit plans at September 30, 2017, the Company recorded a $163.3 million decrease to Other Regulatory Assets in the Company’s Utility and Pipeline and Storage segments and a $29.1 million (pre-tax) increase to Accumulated Other Comprehensive Income.
The effect of the discount rate change for the Retirement Plan in 2017 was to decrease the projected benefit obligation of the Retirement Plan by $20.5 million. The mortality improvement projection scale was updated, which decreased the projected benefit obligation of the Retirement Plan in 2017 by $8.3 million. In addition, other actuarial experience decreased the projected benefit obligation for the Retirement Plan in 2017 by $3.6 million. The effect of the discount rate change for the Retirement Plan in 2016 was to increase the projected benefit obligation
-103-
NATIONAL FUEL GAS COMPANY
NOTES TO CONSOLIDATED FINANCIAL STATEMENTS - (Continued)
of the Retirement Plan by $78.5 million. The effect of the mortality assumption change for the Retirement Plan in 2015 was to increase the projected benefit obligation of the Retirement Plan by $24.2 million.
The Company made cash contributions totaling $17.1 million to the Retirement Plan during the year ended September 30, 2017. The Company expects that the annual contribution to the Retirement Plan in 2018 will be in the range of $15.0 million to $40.0 million.
The following Retirement Plan benefit payments, which reflect expected future service, are expected to be paid by the Retirement Plan during the next five years and the five years thereafter: $64.4 million in 2018; $65.0 million in 2019; $65.4 million in 2020; $65.8 million in 2021; $66.2 million in 2022; and $331.1 million in the five years thereafter.
The effect of the discount rate change in 2017 was to decrease the other post-retirement benefit obligation by $6.2 million. The mortality improvement projection scale was updated, which decreased the other post-retirement benefit obligation in 2017 by $5.7 million. Other actuarial experience decreased the other post-retirement benefit obligation in 2017 by $50.3 million primarily attributable to a revision in assumed per-capita claims cost, premiums, retiree contributions and retiree drug subsidy assumptions based on actual experience.
The effect of the discount rate change in 2016 was to increase the other post-retirement benefit obligation by $49.4 million. Other actuarial experience increased the other post-retirement benefit obligation in 2016 by $11.0 million primarily attributable to a revision in assumed per-capita claims cost, premiums, participant contributions and drug subsidy assumptions based on actual experience.
The effect of the discount rate change in 2015 was to decrease the other post-retirement benefit obligation by $14.3 million. Other actuarial experience increased the other post-retirement benefit obligation in 2015 by $12.8 million primarily attributable to the change in mortality assumption.
The Medicare Prescription Drug, Improvement, and Modernization Act of 2003 provides for a prescription drug benefit under Medicare (Medicare Part D), as well as a federal subsidy to sponsors of retiree health care benefit plans that provide a benefit that is at least actuarially equivalent to Medicare Part D.
The estimated gross other post-retirement benefit payments and gross amount of Medicare Part D prescription drug subsidy receipts are as follows (dollars in thousands):
Benefit Payments | Subsidy Receipts | ||||||
2018 | $ | 26,483 | $ | (1,910 | ) | ||
2019 | $ | 27,456 | $ | (2,074 | ) | ||
2020 | $ | 28,359 | $ | (2,225 | ) | ||
2021 | $ | 29,173 | $ | (2,369 | ) | ||
2022 | $ | 29,757 | $ | (2,515 | ) | ||
2023 through 2027 | $ | 152,957 | $ | (14,271 | ) | ||
-104-
NATIONAL FUEL GAS COMPANY
NOTES TO CONSOLIDATED FINANCIAL STATEMENTS - (Continued)
Assumed health care cost trend rates as of September 30 were:
2017 | 2016 | 2015 | |||||||||
Rate of Medical Cost Increase for Pre Age 65 Participants | 5.67 | % | (1) | 5.75 | % | (1) | 6.93 | % | (2) | ||
Rate of Medical Cost Increase for Post Age 65 Participants | 4.75 | % | (1) | 4.75 | % | (1) | 6.68 | % | (2) | ||
Annual Rate of Increase in the Per Capita Cost of Covered Prescription Drug Benefits | 8.45 | % | (1) | 9.00 | % | (1) | 7.17 | % | (2) | ||
Annual Rate of Increase in the Per Capita Medicare Part B Reimbursement | 4.75 | % | (1) | 4.75 | % | (1) | 6.68 | % | (2) | ||
Annual Rate of Increase in the Per Capita Medicare Part D Subsidy | 7.33 | % | (1) | 7.20 | % | (1) | 6.65 | % | (2) | ||
(1) | It was assumed that this rate would gradually decline to 4.5% by 2039. |
(2) | It was assumed that this rate would gradually decline to 4.5% by 2028. |
The health care cost trend rate assumptions used to calculate the per capita cost of covered medical care benefits have a significant effect on the amounts reported. If the health care cost trend rates were increased by 1% in each year, the other post-retirement benefit obligation as of October 1, 2017 would increase by $57.9 million. This 1% change would also have increased the aggregate of the service and interest cost components of net periodic post-retirement benefit cost for 2017 by $3.3 million. If the health care cost trend rates were decreased by 1% in each year, the other post-retirement benefit obligation as of October 1, 2017 would decrease by $48.5 million. This 1% change would also have decreased the aggregate of the service and interest cost components of net periodic post-retirement benefit cost for 2017 by $2.7 million.
The Company made cash contributions totaling $3.8 million to its VEBA trusts during the year ended September 30, 2017. In addition, the Company made direct payments of $0.1 million to retirees not covered by the VEBA trusts and 401(h) accounts during the year ended September 30, 2017. The Company expects that the annual contribution to its VEBA trusts in 2018 will be in the range of $2.5 million to $4.0 million.
Investment Valuation
The Retirement Plan assets and other post-retirement benefit assets are valued under the current fair value framework. See Note F — Fair Value Measurements for further discussion regarding the definition and levels of fair value hierarchy established by the authoritative guidance.
The inputs or methodologies used for valuing securities are not necessarily an indication of the risk associated with investing in those securities. Below is a listing of the major categories of plan assets held as of September 30, 2017 and 2016, as well as the associated level within the fair value hierarchy in which the fair value measurements in their entirety fall, based on the lowest level input that is significant to the fair value measurement in its entirety (dollars in thousands):
-105-
NATIONAL FUEL GAS COMPANY
NOTES TO CONSOLIDATED FINANCIAL STATEMENTS - (Continued)
Total Fair Value Amounts at September 30, 2017 | Level 1 | Level 2 | Level 3 | Measured at NAV(7) | |||||||||||||||
Retirement Plan Investments | |||||||||||||||||||
Domestic Equities(1) | $ | 290,716 | $ | 209,421 | $ | — | $ | — | $ | 81,295 | |||||||||
International Equities(2) | 123,069 | — | — | — | 123,069 | ||||||||||||||
Global Equities(3) | 121,008 | — | — | — | 121,008 | ||||||||||||||
Domestic Fixed Income(4) | 348,501 | 1,664 | 346,837 | — | — | ||||||||||||||
International Fixed Income(5) | 422 | 422 | — | — | — | ||||||||||||||
Global Fixed Income(6) | 75,428 | — | — | — | 75,428 | ||||||||||||||
Real Estate | 3,391 | — | — | 3,391 | — | ||||||||||||||
Cash Held in Collective Trust Funds | 26,058 | — | — | — | 26,058 | ||||||||||||||
Total Retirement Plan Investments | 988,593 | 211,507 | 346,837 | 3,391 | 426,858 | ||||||||||||||
401(h) Investments | (64,728 | ) | (14,026 | ) | (23,001 | ) | (225 | ) | (27,476 | ) | |||||||||
Total Retirement Plan Investments (excluding 401(h) Investments) | $ | 923,865 | $ | 197,481 | $ | 323,836 | $ | 3,166 | $ | 399,382 | |||||||||
Miscellaneous Accruals, Interest Receivables, and Non-Interest Cash | (13,146 | ) | |||||||||||||||||
Total Retirement Plan Assets | $ | 910,719 | |||||||||||||||||
Total Fair Value Amounts at September 30, 2016 | Level 1 | Level 2 | Level 3 | Measured at NAV(7) | |||||||||||||||
Retirement Plan Investments | |||||||||||||||||||
Domestic Equities(1) | $ | 256,796 | $ | 188,253 | $ | — | $ | — | $ | 68,543 | |||||||||
International Equities(2) | 104,592 | — | — | — | 104,592 | ||||||||||||||
Global Equities(3) | 120,025 | — | — | — | 120,025 | ||||||||||||||
Domestic Fixed Income(4) | 342,442 | 1,647 | 340,795 | — | — | ||||||||||||||
International Fixed Income(5) | 744 | 407 | 337 | — | — | ||||||||||||||
Global Fixed Income(6) | 81,146 | — | — | — | 81,146 | ||||||||||||||
Real Estate | 2,970 | — | — | 2,970 | — | ||||||||||||||
Cash Held in Collective Trust Funds | 24,812 | — | — | — | 24,812 | ||||||||||||||
Total Retirement Plan Investments | 933,527 | 190,307 | 341,132 | 2,970 | 399,118 | ||||||||||||||
401(h) Investments | (58,707 | ) | (12,025 | ) | (21,555 | ) | (188 | ) | (24,939 | ) | |||||||||
Total Retirement Plan Investments (excluding 401(h) Investments) | $ | 874,820 | $ | 178,282 | $ | 319,577 | $ | 2,782 | $ | 374,179 | |||||||||
Miscellaneous Accruals, Interest Receivables, and Non-Interest Cash | (5,045 | ) | |||||||||||||||||
Total Retirement Plan Assets | $ | 869,775 | |||||||||||||||||
(1) | Domestic Equities include mostly collective trust funds, common stock, and exchange traded funds. |
(2) | International Equities are comprised of collective trust funds. |
(3) | Global Equities are comprised of collective trust funds. |
(4) | Domestic Fixed Income securities include mostly collective trust funds, corporate/government bonds and mortgages, and exchange traded funds. |
-106-
NATIONAL FUEL GAS COMPANY
NOTES TO CONSOLIDATED FINANCIAL STATEMENTS - (Continued)
(5) | International Fixed Income securities are comprised mostly of an exchange traded fund. |
(6) | Global Fixed Income securities are comprised of a collective trust fund. |
(7) | Reflects the adoption of the new authoritative guidance related to investments measured at the net asset value (NAV) practical expedient. |
Total Fair Value Amounts at September 30, 2017 | Level 1 | Level 2 | Level 3 | Measured at NAV(1) | |||||||||||||||
Other Post-Retirement Benefit Assets held in VEBA Trusts | |||||||||||||||||||
Collective Trust Funds — Domestic Equities | $ | 130,864 | $ | — | $ | — | $ | — | $ | 130,864 | |||||||||
Collective Trust Funds — International Equities | 52,063 | — | — | — | 52,063 | ||||||||||||||
Exchange Traded Funds — Fixed Income | 256,099 | 256,099 | — | — | — | ||||||||||||||
Cash Held in Collective Trust Funds | 9,569 | — | — | — | 9,569 | ||||||||||||||
Total VEBA Trust Investments | 448,595 | 256,099 | — | — | 192,496 | ||||||||||||||
401(h) Investments | 64,728 | 14,026 | 23,001 | 225 | 27,476 | ||||||||||||||
Total Investments (including 401(h) Investments) | $ | 513,323 | $ | 270,125 | $ | 23,001 | $ | 225 | $ | 219,972 | |||||||||
Miscellaneous Accruals (Including Current and Deferred Taxes, Claims Incurred But Not Reported, Administrative) | 694 | ||||||||||||||||||
Total Other Post-Retirement Benefit Assets | $ | 514,017 | |||||||||||||||||
Total Fair Value Amounts at September 30, 2016 | Level 1 | Level 2 | Level 3 | Measured at NAV(1) | |||||||||||||||
Other Post-Retirement Benefit Assets held in VEBA Trusts | |||||||||||||||||||
Collective Trust Funds — Domestic Equities | $ | 139,617 | $ | — | $ | — | $ | — | $ | 139,617 | |||||||||
Collective Trust Funds — International Equities | 51,488 | — | — | — | 51,488 | ||||||||||||||
Exchange Traded Funds — Fixed Income | 230,761 | 230,761 | — | — | — | ||||||||||||||
Cash Held in Collective Trust Funds | 13,176 | — | — | — | 13,176 | ||||||||||||||
Total VEBA Trust Investments | 435,042 | 230,761 | — | — | 204,281 | ||||||||||||||
401(h) Investments | 58,707 | 12,025 | 21,555 | 188 | 24,939 | ||||||||||||||
Total Investments (including 401(h) Investments) | $ | 493,749 | $ | 242,786 | $ | 21,555 | $ | 188 | $ | 229,220 | |||||||||
Miscellaneous Accruals (Including Current and Deferred Taxes, Claims Incurred But Not Reported, Administrative) | 571 | ||||||||||||||||||
Total Other Post-Retirement Benefit Assets | $ | 494,320 | |||||||||||||||||
-107-
NATIONAL FUEL GAS COMPANY
NOTES TO CONSOLIDATED FINANCIAL STATEMENTS - (Continued)
(1) | Reflects the adoption of the new authoritative guidance related to investments measured at the net asset value (NAV) practical expedient. |
The fair values disclosed in the above tables may not be indicative of net realizable value or reflective of future fair values. Furthermore, although the Company believes its valuation methods are appropriate and consistent with other market participants, the use of different methodologies or assumptions to determine the fair value of certain financial instruments could result in a different fair value measurement at the reporting date.
The following tables provide a reconciliation of the beginning and ending balances of the Retirement Plan and other post-retirement benefit assets measured at fair value on a recurring basis where the determination of fair value includes significant unobservable inputs (Level 3). For the years ended September 30, 2017 and September 30, 2016, there were no transfers from Level 1 to Level 2. In addition, as shown in the following tables, there were no transfers in or out of Level 3.
Retirement Plan Level 3 Assets (Thousands) | ||||||||||||||||
Hedge Funds | Real Estate | Excluding 401(h) Investments | Total | |||||||||||||
Balance at September 30, 2015 | $ | 26,490 | $ | 4,724 | $ | (1,885 | ) | $ | 29,329 | |||||||
Realized Gains/(Losses) | 5,878 | — | (354 | ) | 5,524 | |||||||||||
Unrealized Gains/(Losses) | (5,445 | ) | (404 | ) | 344 | (5,505 | ) | |||||||||
Sales | (26,923 | ) | (1,350 | ) | 1,707 | (26,566 | ) | |||||||||
Balance at September 30, 2016 | — | 2,970 | (188 | ) | 2,782 | |||||||||||
Unrealized Gains/(Losses) | — | 421 | (37 | ) | 384 | |||||||||||
Balance at September 30, 2017 | $ | — | $ | 3,391 | $ | (225 | ) | $ | 3,166 | |||||||
Other Post-Retirement Benefit Level 3 Assets (Thousands) | ||||
401(h) Investments | ||||
Balance at September 30, 2015 | $ | 1,885 | ||
Realized Gains/(Losses) | 354 | |||
Unrealized Gains/(Losses) | (344 | ) | ||
Sales | (1,707 | ) | ||
Balance at September 30, 2016 | 188 | |||
Unrealized Gains/(Losses) | 37 | |||
Balance at September 30, 2017 | $ | 225 | ||
The Company’s assumption regarding the expected long-term rate of return on plan assets is 7.00% (Retirement Plan) and 6.25% (other post-retirement benefits), effective for fiscal 2018. The return assumption reflects the anticipated long-term rate of return on the plan’s current and future assets. The Company utilizes projected capital market conditions and the plan’s target asset class and investment manager allocations to set the assumption regarding the expected return on plan assets.
The long-term investment objective of the Retirement Plan trust, the VEBA trusts and the 401(h) accounts is to achieve the target total return in accordance with the Company’s risk tolerance. Assets are diversified utilizing
-108-
NATIONAL FUEL GAS COMPANY
NOTES TO CONSOLIDATED FINANCIAL STATEMENTS - (Continued)
a mix of equities, fixed income and other securities (including real estate). The target allocation for the Retirement Plan and the VEBA trusts (including 401(h) accounts) is 40-60% equity securities, 40-60% fixed income securities and 0-15% other. Risk tolerance is established through consideration of plan liabilities, plan funded status and corporate financial condition. The assets of the Retirement Plan trusts, VEBA trusts and the 401(h) accounts have no significant concentrations of risk in any one country (other than the United States), industry or entity.
Investment managers are retained to manage separate pools of assets. Comparative market and peer group performance of individual managers and the total fund are monitored on a regular basis, and reviewed by the Company’s Retirement Committee on at least a quarterly basis.
Beginning in fiscal 2018, the Company refined the method used to determine the service and interest cost components of net periodic benefit cost. Using the refined method, known as the spot rate approach, the Company will use individual spot rates along the yield curve that correspond to the timing of each benefit payment to determine the discount rate. The individual spot rates along the yield curve will continue to be determined by an above mean methodology in that the coupon interest rates that are in the lower 50th percentile will be excluded based on the assumption that the Company would not utilize more expensive (i.e. lower yield) instruments to settle its liabilities. The impact on the benefit obligation, as of September 30, 2017, is immaterial. This change will provide a more precise measurement of service and interest costs by improving the correlation between projected cash outflows and corresponding spot rates on the yield curve. Compared to the previous method, the spot rate approach will decrease the service and interest components of net periodic benefit costs in fiscal 2018. The Company will account for this change prospectively as a change in accounting estimate.
Note I — Commitments and Contingencies
Environmental Matters
The Company is subject to various federal, state and local laws and regulations relating to the protection of the environment. The Company has established procedures for the ongoing evaluation of its operations to identify potential environmental exposures and to comply with regulatory requirements.
It is the Company’s policy to accrue estimated environmental clean-up costs (investigation and remediation) when such amounts can reasonably be estimated and it is probable that the Company will be required to incur such costs. At September 30, 2017, the Company has estimated its remaining clean-up costs related to former manufactured gas plant sites will be approximately $3.1 million. This estimated liability has been recorded in Other Deferred Credits on the Consolidated Balance Sheet at September 30, 2017. The Company expects to recover its environmental clean-up costs through rate recovery over a period of approximately 4 years. The Company is currently not aware of any material additional exposure to environmental liabilities. However, changes in environmental laws and regulations, new information or other factors could could have an adverse financial impact on the Company.
Northern Access 2016 Project
On February 3, 2017, Supply Corporation and Empire received FERC approval of the Northern Access 2016 project described herein. On April 7, 2017, the NYDEC issued a Notice of Denial of the federal Clean Water Act Section 401 Water Quality Certification and other state stream and wetland permits for the New York portion of the project (the Water Quality Certification for the Pennsylvania portion of the project was received on January 27, 2017). On April 21, 2017, Supply Corporation and Empire filed a Petition for Review in the United States Court of Appeals for the Second Circuit of the NYDEC's Notice of Denial with respect to National Fuel's application for the Water Quality Certification, and on May 11, 2017, the Company commenced legal action in New York State Supreme Court challenging the NYDEC's actions with regard to various state permits. The Company also has pending with FERC a proceeding asserting, among other things, that the NYDEC exceeded the reasonable time frame to take action under the Clean Water Act and, therefore, waived its opportunity to approve or deny the Water Quality Certification. In light of these pending legal actions, the Company has not yet determined a target
-109-
NATIONAL FUEL GAS COMPANY
NOTES TO CONSOLIDATED FINANCIAL STATEMENTS - (Continued)
in-service date. As a result of the decision of the NYDEC, Supply Corporation and Empire evaluated the capitalized project costs for impairment as of September 30, 2017 and determined that an impairment charge was not required. The evaluation considered probability weighted scenarios of undiscounted future net cash flows, including a scenario assuming successful resolution with the NYDEC and construction of the pipeline, as well as a scenario where the project does not proceed. Further developments or indicators of an unfavorable resolution could result in the impairment of a significant portion of the project costs, which totaled $75.8 million at September 30, 2017. The project costs are included within Property, Plant and Equipment and Deferred Charges on the Consolidated Balance Sheet.
Other
The Company, in its Utility segment, Energy Marketing segment, and Exploration and Production segment, has entered into contractual commitments in the ordinary course of business, including commitments to purchase gas, transportation, and storage service to meet customer gas supply needs. The future gas purchase, transportation and storage contract commitments during the next five years and thereafter are as follows: $262.4 million in 2018, $84.6 million in 2019, $77.9 million in 2020, $70.9 million in 2021, $61.7 million in 2022 and $504.9 million thereafter. Gas prices within the gas purchase contracts are variable based on NYMEX prices adjusted for basis. In the Utility segment, these costs are subject to state commission review, and are being recovered in customer rates. Management believes that, to the extent any stranded pipeline costs are generated by the unbundling of services in the Utility segment’s service territory, such costs will be recoverable from customers.
The Company has entered into leases for the use of compressors, drilling rigs, buildings and other items. These leases are accounted for as operating leases. The future lease commitments during the next five years and thereafter are as follows: $10.8 million in 2018, $4.6 million in 2019, $3.7 million in 2020, $2.2 million in 2021, $1.5 million in 2022 and $1.9 million thereafter.
The Company, in its Pipeline and Storage segment, Gathering segment and Utility segment, has entered into several contractual commitments associated with various pipeline, compressor and gathering system modernization and expansion projects. As of September 30, 2017, the future contractual commitments related to the system modernization and expansion projects are $61.7 million in 2018, $0.7 million in 2019, $0.2 million in 2020, $0.3 million in 2021, $0.3 million in 2022 and $1.1 million thereafter.
The Company, in its Exploration and Production segment, has entered into contractual obligations associated with hydraulic fracturing and fuel. The future contractual commitments are $79.5 million in 2018, $98.0 million in 2019 and $17.1 million in 2020. There are no contractual commitments extending beyond 2020.
The Company is involved in other litigation arising in the normal course of business. In addition to the regulatory matters discussed in Note C — Regulatory Matters, the Company is involved in other regulatory matters arising in the normal course of business. These other litigation and regulatory matters may include, for example, negligence claims and tax, regulatory or other governmental audits, inspections, investigations and other proceedings. These matters may involve state and federal taxes, safety, compliance with regulations, rate base, cost of service and purchased gas cost issues, among other things. While these other matters arising in the normal course of business could have a material effect on earnings and cash flows in the period in which they are resolved, an estimate of the possible loss or range of loss, if any, cannot be made at this time.
Note J — Business Segment Information
The Company reports financial results for five segments: Exploration and Production, Pipeline and Storage, Gathering, Utility and Energy Marketing. The division of the Company’s operations into reportable segments is based upon a combination of factors including differences in products and services, regulatory environment and geographic factors.
The Exploration and Production segment, through Seneca, is engaged in exploration for and development of natural gas and oil reserves in California and the Appalachian region of the United States.
-110-
NATIONAL FUEL GAS COMPANY
NOTES TO CONSOLIDATED FINANCIAL STATEMENTS - (Continued)
The Pipeline and Storage segment operations are regulated by the FERC for both Supply Corporation and Empire. Supply Corporation transports and stores natural gas for utilities (including Distribution Corporation), natural gas marketers (including NFR), exploration and production companies (including Seneca) and pipeline companies in the northeastern United States markets. Empire transports and stores natural gas for major industrial companies, utilities (including Distribution Corporation) and power producers in New York State. Empire also transports natural gas for natural gas marketers along with exploration and production companies from natural gas producing areas in Pennsylvania to markets in New York and to interstate pipeline delivery points for additional markets in the northeastern United States and Canada.
The Gathering segment is comprised of Midstream Corporation’s operations. Midstream Corporation builds, owns and operates natural gas processing and pipeline gathering facilities in the Appalachian region and currently provides gathering services to Seneca.
The Utility segment operations are regulated by the NYPSC and the PaPUC and are carried out by Distribution Corporation. Distribution Corporation sells natural gas to retail customers and provides natural gas transportation services in western New York and northwestern Pennsylvania.
The Energy Marketing segment is comprised of NFR’s operations. NFR markets natural gas to industrial, wholesale, commercial, public authority and residential customers primarily in western and central New York and northwestern Pennsylvania, offering competitively priced natural gas for its customers.
The data presented in the tables below reflects financial information for the segments and reconciliations to consolidated amounts. The accounting policies of the segments are the same as those described in Note A — Summary of Significant Accounting Policies. Sales of products or services between segments are billed at regulated rates or at market rates, as applicable. The Company evaluates segment performance based on income before discontinued operations, extraordinary items and cumulative effects of changes in accounting (when applicable). When these items are not applicable, the Company evaluates performance based on net income.
Year Ended September 30, 2017 | |||||||||||||||||||||||||||||||||||
Exploration and Production | Pipeline and Storage | Gathering | Utility | Energy Marketing | Total Reportable Segments | All Other | Corporate and Intersegment Eliminations | Total Consolidated | |||||||||||||||||||||||||||
(Thousands) | |||||||||||||||||||||||||||||||||||
Revenue from External Customers(1) | $ | 614,599 | $ | 206,615 | $ | 115 | $ | 626,899 | $ | 128,586 | $ | 1,576,814 | $ | 2,173 | $ | 894 | $ | 1,579,881 | |||||||||||||||||
Intersegment Revenues | $ | — | $ | 87,810 | $ | 107,566 | $ | 13,072 | $ | 794 | $ | 209,242 | $ | — | $ | (209,242 | ) | $ | — | ||||||||||||||||
Interest Income | $ | 707 | $ | 1,467 | $ | 994 | $ | 1,051 | $ | 571 | $ | 4,790 | $ | 213 | $ | (890 | ) | $ | 4,113 | ||||||||||||||||
Interest Expense | $ | 53,702 | $ | 33,717 | $ | 9,142 | $ | 28,492 | $ | 47 | $ | 125,100 | $ | — | $ | (5,263 | ) | $ | 119,837 | ||||||||||||||||
Depreciation, Depletion and Amortization | $ | 112,565 | $ | 41,196 | $ | 16,162 | $ | 52,582 | $ | 279 | $ | 222,784 | $ | 661 | $ | 750 | $ | 224,195 | |||||||||||||||||
Income Tax Expense (Benefit) | $ | 66,093 | $ | 40,947 | $ | 29,694 | $ | 24,894 | $ | 891 | $ | 162,519 | $ | (247 | ) | $ | (1,590 | ) | $ | 160,682 | |||||||||||||||
Segment Profit: Net Income (Loss) | $ | 129,326 | $ | 68,446 | $ | 40,377 | $ | 46,935 | $ | 1,509 | $ | 286,593 | $ | (342 | ) | $ | (2,769 | ) | $ | 283,482 | |||||||||||||||
Expenditures for Additions to Long-Lived Assets | $ | 253,057 | $ | 95,336 | $ | 32,645 | $ | 80,867 | $ | 36 | $ | 461,941 | $ | 39 | $ | 137 | $ | 462,117 | |||||||||||||||||
At September 30, 2017 | |||||||||||||||||||||||||||||||||||
(Thousands) | |||||||||||||||||||||||||||||||||||
Segment Assets | $ | 1,407,152 | $ | 1,929,788 | $ | 580,051 | $ | 2,013,123 | $ | 60,937 | $ | 5,991,051 | $ | 76,861 | $ | 35,408 | $ | 6,103,320 | |||||||||||||||||
-111-
NATIONAL FUEL GAS COMPANY
NOTES TO CONSOLIDATED FINANCIAL STATEMENTS - (Continued)
Year Ended September 30, 2016 | |||||||||||||||||||||||||||||||||||
Exploration and Production | Pipeline and Storage | Gathering | Utility | Energy Marketing | Total Reportable Segments | All Other | Corporate and Intersegment Elimination | Total Consolidated | |||||||||||||||||||||||||||
(Thousands) | |||||||||||||||||||||||||||||||||||
Revenue from External Customers(1) | $ | 607,113 | $ | 215,674 | $ | 374 | $ | 531,024 | $ | 93,578 | $ | 1,447,763 | $ | 3,753 | $ | 900 | $ | 1,452,416 | |||||||||||||||||
Intersegment Revenues | $ | — | $ | 90,755 | $ | 89,073 | $ | 13,123 | $ | 884 | $ | 193,835 | $ | — | $ | (193,835 | ) | $ | — | ||||||||||||||||
Interest Income | $ | 858 | $ | 770 | $ | 297 | $ | 1,737 | $ | 422 | $ | 4,084 | $ | 117 | $ | 34 | $ | 4,235 | |||||||||||||||||
Interest Expense | $ | 55,434 | $ | 33,327 | $ | 8,872 | $ | 27,582 | $ | 49 | $ | 125,264 | $ | — | $ | (4,220 | ) | $ | 121,044 | ||||||||||||||||
Depreciation, Depletion and Amortization | $ | 139,963 | $ | 43,273 | $ | 15,282 | $ | 48,618 | $ | 278 | $ | 247,414 | $ | 1,260 | $ | 743 | $ | 249,417 | |||||||||||||||||
Income Tax Expense (Benefit) | $ | (334,029 | ) | $ | 50,241 | $ | 24,334 | $ | 25,602 | $ | 2,460 | $ | (231,392 | ) | $ | 561 | $ | (1,718 | ) | $ | (232,549 | ) | |||||||||||||
Significant Non-Cash Item: Impairment of Oil and Gas Producing Properties | $ | 948,307 | $ | — | $ | — | $ | — | $ | — | $ | 948,307 | $ | — | $ | — | $ | 948,307 | |||||||||||||||||
Segment Profit: Net Income (Loss) | $ | (452,842 | ) | $ | 76,610 | $ | 30,499 | $ | 50,960 | $ | 4,348 | $ | (290,425 | ) | $ | 778 | $ | (1,311 | ) | $ | (290,958 | ) | |||||||||||||
Expenditures for Additions to Long-Lived Assets | $ | 256,104 | $ | 114,250 | $ | 54,293 | $ | 98,007 | $ | 34 | $ | 522,688 | $ | 37 | $ | 326 | $ | 523,051 | |||||||||||||||||
At September 30, 2016 | |||||||||||||||||||||||||||||||||||
(Thousands) | |||||||||||||||||||||||||||||||||||
Segment Assets | $ | 1,323,081 | $ | 1,680,734 | $ | 534,259 | $ | 2,021,514 | $ | 63,392 | $ | 5,622,980 | $ | 77,138 | $ | (63,731 | ) | $ | 5,636,387 | ||||||||||||||||
Year Ended September 30, 2015 | |||||||||||||||||||||||||||||||||||
Exploration and Production | Pipeline and Storage | Gathering | Utility | Energy Marketing | Total Reportable Segments | All Other | Corporate and Intersegment Eliminations | Total Consolidated | |||||||||||||||||||||||||||
(Thousands) | |||||||||||||||||||||||||||||||||||
Revenue from External Customers(1) | $ | 693,441 | $ | 203,089 | $ | 497 | $ | 700,761 | $ | 159,857 | $ | 1,757,645 | $ | 2,352 | $ | 916 | $ | 1,760,913 | |||||||||||||||||
Intersegment Revenues | $ | — | $ | 88,251 | $ | 76,709 | $ | 15,506 | $ | 849 | $ | 181,315 | $ | — | $ | (181,315 | ) | $ | — | ||||||||||||||||
Interest Income | $ | 2,554 | $ | 474 | $ | 140 | $ | 2,220 | $ | 195 | $ | 5,583 | $ | 66 | $ | (1,727 | ) | $ | 3,922 | ||||||||||||||||
Interest Expense | $ | 46,726 | $ | 27,658 | $ | 1,627 | $ | 28,176 | $ | 27 | $ | 104,214 | $ | — | $ | (4,743 | ) | $ | 99,471 | ||||||||||||||||
Depreciation, Depletion and Amortization | $ | 239,818 | $ | 38,178 | $ | 10,829 | $ | 45,616 | $ | 209 | $ | 334,650 | $ | 832 | $ | 676 | $ | 336,158 | |||||||||||||||||
Income Tax Expense (Benefit) | $ | (428,217 | ) | $ | 48,113 | $ | 24,721 | $ | 33,143 | $ | 4,547 | $ | (317,693 | ) | $ | 13 | $ | (1,456 | ) | $ | (319,136 | ) | |||||||||||||
Significant Non-Cash Item: Impairment of Oil and Gas Producing Properties | $ | 1,126,257 | $ | — | $ | — | $ | — | $ | — | $ | 1,126,257 | $ | — | $ | — | $ | 1,126,257 | |||||||||||||||||
Segment Profit: Net Income (Loss) | $ | (556,974 | ) | $ | 80,354 | $ | 31,849 | $ | 63,271 | $ | 7,766 | $ | (373,734 | ) | $ | (2 | ) | $ | (5,691 | ) | $ | (379,427 | ) | ||||||||||||
Expenditures for Additions to Long-Lived Assets | $ | 557,313 | $ | 230,192 | $ | 118,166 | $ | 94,371 | $ | 128 | $ | 1,000,170 | $ | — | $ | 339 | $ | 1,000,509 | |||||||||||||||||
At September 30, 2015 | |||||||||||||||||||||||||||||||||||
(Thousands) | |||||||||||||||||||||||||||||||||||
Segment Assets | $ | 2,439,801 | $ | 1,590,524 | $ | 444,358 | $ | 1,934,731 | $ | 90,676 | $ | 6,500,090 | $ | 77,350 | $ | (12,501 | ) | $ | 6,564,939 | ||||||||||||||||
-112-
NATIONAL FUEL GAS COMPANY
NOTES TO CONSOLIDATED FINANCIAL STATEMENTS - (Continued)
(1) | All Revenue from External Customers originated in the United States. |
Geographic Information | At September 30 | ||||||||||
2017 | 2016 | 2015 | |||||||||
(Thousands) | |||||||||||
Long-Lived Assets: | |||||||||||
United States | $ | 5,285,040 | $ | 5,223,356 | $ | 6,189,138 | |||||
Note K — Quarterly Financial Data (unaudited)
In the opinion of management, the following quarterly information includes all adjustments necessary for a fair statement of the results of operations for such periods. Per common share amounts are calculated using the weighted average number of shares outstanding during each quarter. The total of all quarters may differ from the per common share amounts shown on the Consolidated Statements of Income. Those per common share amounts are based on the weighted average number of shares outstanding for the entire fiscal year. Because of the seasonal nature of the Company’s heating business, there are substantial variations in operations reported on a quarterly basis.
Quarter Ended | Operating Revenues | Operating Income (Loss) | Net Income (Loss) Available for Common Stock | Earnings (Loss) per Common Share | ||||||||||||||||
Basic | Diluted | |||||||||||||||||||
(Thousands, except per common share amounts) | ||||||||||||||||||||
2017 | ||||||||||||||||||||
9/30/2017 | $ | 286,937 | $ | 87,395 | $ | 45,577 | $ | 0.53 | $ | 0.53 | ||||||||||
6/30/2017 | $ | 348,369 | $ | 123,354 | $ | 59,714 | $ | 0.70 | $ | 0.69 | ||||||||||
3/31/2017 | $ | 522,075 | $ | 169,957 | $ | 89,283 | $ | 1.05 | $ | 1.04 | ||||||||||
12/31/2016 | $ | 422,500 | $ | 172,139 | $ | 88,908 | $ | 1.04 | $ | 1.04 | ||||||||||
2016 | ||||||||||||||||||||
9/30/2016 | $ | 292,472 | $ | 81,244 | $ | 37,553 | (1) | $ | 0.44 | $ | 0.44 | |||||||||
6/30/2016 | $ | 335,617 | $ | 45,162 | $ | 8,286 | (2) | $ | 0.10 | $ | 0.10 | |||||||||
3/31/2016 | $ | 449,132 | $ | (237,000 | ) | $ | (147,688 | ) | (3) | $ | (1.74 | ) | $ | (1.74 | ) | |||||
12/31/2015 | $ | 375,195 | $ | (305,924 | ) | $ | (189,109 | ) | (4) | $ | (2.23 | ) | $ | (2.23 | ) | |||||
(1) | Includes a non-cash $32.7 million impairment charge ($19.0 million after tax) associated with the Exploration and Production segment's oil and gas producing properties. |
(2) | Includes a non-cash $82.7 million impairment charge ($47.9 million after tax) associated with the Exploration and Production segment's oil and gas producing properties. |
(3) | Includes a non-cash $397.4 million impairment charge ($230.5 million after tax) associated with the Exploration and Production segment's oil and gas producing properties. |
(4) | Includes a non-cash $435.5 million impairment charge ($252.6 million after tax) associated with the Exploration and Production segment's oil and gas producing properties. |
-113-
NATIONAL FUEL GAS COMPANY
NOTES TO CONSOLIDATED FINANCIAL STATEMENTS - (Continued)
Note L — Market for Common Stock and Related Shareholder Matters (unaudited)
At September 30, 2017, there were 11,211 registered shareholders of Company common stock. The common stock is listed and traded on the New York Stock Exchange. Information related to restrictions on the payment of dividends can be found in Note E — Capitalization and Short-Term Borrowings. The quarterly price ranges (based on intra-day prices) and quarterly dividends declared for the fiscal years ended September 30, 2017 and 2016, are shown below:
Price Range | Dividends Declared | ||||||||||
Quarter Ended | High | Low | |||||||||
2017 | |||||||||||
9/30/2017 | $ | 59.92 | $ | 54.89 | $ | 0.415 | |||||
6/30/2017 | $ | 61.20 | $ | 53.03 | $ | 0.415 | |||||
3/31/2017 | $ | 61.25 | $ | 54.67 | $ | 0.405 | |||||
12/31/2016 | $ | 58.78 | $ | 50.61 | $ | 0.405 | |||||
2016 | |||||||||||
9/30/2016 | $ | 59.62 | $ | 53.81 | $ | 0.405 | |||||
6/30/2016 | $ | 57.06 | $ | 47.49 | $ | 0.405 | |||||
3/31/2016 | $ | 51.53 | $ | 39.79 | $ | 0.395 | |||||
12/31/2015 | $ | 56.64 | $ | 37.03 | $ | 0.395 | |||||
Note M — Supplementary Information for Oil and Gas Producing Activities (unaudited, except for Capitalized Costs Relating to Oil and Gas Producing Activities)
The Company follows authoritative guidance related to oil and gas exploration and production activities that aligns the reserve estimation and disclosure requirements with the requirements of the SEC Modernization of Oil and Gas Reporting rule, which the Company also follows. The SEC rules require companies to value their year-end reserves using an unweighted arithmetic average of the first day of the month oil and gas prices for each month within the twelve month period prior to the end of the reporting period.
The following supplementary information is presented in accordance with the authoritative guidance regarding disclosures about oil and gas producing activities and related SEC accounting rules. All monetary amounts are expressed in U.S. dollars.
Capitalized Costs Relating to Oil and Gas Producing Activities
At September 30 | |||||||
2017 | 2016 | ||||||
(Thousands) | |||||||
Proved Properties(1) | $ | 4,832,301 | $ | 4,554,929 | |||
Unproved Properties | 80,932 | 135,285 | |||||
4,913,233 | 4,690,214 | ||||||
Less — Accumulated Depreciation, Depletion and Amortization | 3,765,710 | 3,657,239 | |||||
$ | 1,147,523 | $ | 1,032,975 | ||||
(1) | Includes asset retirement costs of $54.4 million and $63.6 million at September 30, 2017 and 2016, respectively. |
-114-
NATIONAL FUEL GAS COMPANY
NOTES TO CONSOLIDATED FINANCIAL STATEMENTS - (Continued)
Costs related to unproved properties are excluded from amortization until proved reserves are found or it is determined that the unproved properties are impaired. All costs related to unproved properties are reviewed quarterly to determine if impairment has occurred. The amount of any impairment is transferred to the pool of capitalized costs being amortized. Although the timing of the ultimate evaluation or disposition of the unproved properties cannot be determined, the Company expects the majority of its acquisition costs associated with unproved properties to be transferred into the amortization base by 2023. It expects the majority of its development and exploration costs associated with unproved properties to be transferred into the amortization base by 2018. Following is a summary of costs excluded from amortization at September 30, 2017:
Total as of September 30, 2017 | Year Costs Incurred | ||||||||||||||||||
2017 | 2016 | 2015 | Prior | ||||||||||||||||
(Thousands) | |||||||||||||||||||
Acquisition Costs | $ | 55,193 | $ | — | $ | — | $ | — | $ | 55,193 | |||||||||
Development Costs | 11,879 | 4,388 | 6,707 | 416 | 368 | ||||||||||||||
Exploration Costs | 13,388 | 2,376 | 7,593 | 3,419 | — | ||||||||||||||
Capitalized Interest | 472 | 235 | 149 | 88 | — | ||||||||||||||
$ | 80,932 | $ | 6,999 | $ | 14,449 | $ | 3,923 | $ | 55,561 | ||||||||||
Costs Incurred in Oil and Gas Property Acquisition, Exploration and Development Activities
Year Ended September 30 | |||||||||||
2017 | 2016 | 2015 | |||||||||
(Thousands) | |||||||||||
United States | |||||||||||
Property Acquisition Costs: | |||||||||||
Proved | $ | 8,908 | $ | 1,342 | $ | 1,767 | |||||
Unproved | 262 | 2,165 | 19,998 | ||||||||
Exploration Costs(1) | 40,975 | 27,561 | 53,222 | ||||||||
Development Costs(2) | 200,639 | 219,386 | 454,605 | ||||||||
Asset Retirement Costs | (9,175 | ) | (49,653 | ) | 37,595 | ||||||
$ | 241,609 | $ | 200,801 | $ | 567,187 | ||||||
(1) | Amounts for 2017, 2016 and 2015 include capitalized interest of $0.3 million, $0.3 million and $0.4 million, respectively. |
(2) | Amounts for 2017, 2016 and 2015 include capitalized interest of $0.2 million, $0.2 million and $0.5 million, respectively. |
For the years ended September 30, 2017, 2016 and 2015, the Company spent $101.1 million, $92.8 million and $161.8 million, respectively, developing proved undeveloped reserves.
-115-
NATIONAL FUEL GAS COMPANY
NOTES TO CONSOLIDATED FINANCIAL STATEMENTS - (Continued)
Results of Operations for Producing Activities
Year Ended September 30 | |||||||||||
2017 | 2016 | 2015 | |||||||||
United States | (Thousands, except per Mcfe amounts) | ||||||||||
Operating Revenues: | |||||||||||
Natural Gas (includes transfers to operations of $2,357, $1,765 and $1,946, respectively)(1) | $ | 399,975 | $ | 282,619 | $ | 350,673 | |||||
Oil, Condensate and Other Liquids | 126,517 | 103,533 | 156,048 | ||||||||
Total Operating Revenues(2) | 526,492 | 386,152 | 506,721 | ||||||||
Production/Lifting Costs | 165,991 | 153,914 | 167,800 | ||||||||
Franchise/Ad Valorem Taxes | 15,372 | 13,794 | 20,167 | ||||||||
Purchased Emission Allowance Expense | 1,391 | 700 | 3,089 | ||||||||
Accretion Expense | 4,896 | 6,663 | 6,186 | ||||||||
Depreciation, Depletion and Amortization ($0.63, $0.85 and $1.49 per Mcfe of production, respectively) | 108,471 | 136,579 | 234,480 | ||||||||
Impairment of Oil and Gas Producing Properties | — | 948,307 | 1,126,257 | ||||||||
Income Tax Expense (Benefit) | 86,657 | (368,940 | ) | (444,393 | ) | ||||||
Results of Operations for Producing Activities (excluding corporate overheads and interest charges) | $ | 143,714 | $ | (504,865 | ) | $ | (606,865 | ) | |||
(1) | There were no revenues from sales to affiliates for all years presented. |
(2) | Exclusive of hedging gains and losses. See further discussion in Note G — Financial Instruments. |
Reserve Quantity Information
The Company's proved oil and gas reserve estimates are prepared by the Company's reservoir engineers who meet the qualifications of Reserve Estimator per the "Standards Pertaining to the Estimating and Auditing of Oil and Gas Reserve Information" promulgated by the Society of Petroleum Engineers as of February 19, 2007. The Company maintains comprehensive internal reserve guidelines and a continuing education program designed to keep its staff up to date with current SEC regulations and guidance.
The Company's Vice President of Reservoir Engineering is the primary technical person responsible for overseeing the Company's reserve estimation process and engaging and overseeing the third party reserve audit. His qualifications include a Bachelor of Science Degree in Petroleum Engineering and over 30 years of Petroleum Engineering experience with both major and independent oil and gas companies. He has maintained oversight of the Company's reserve estimation process since 2003. He is a member of the Society of Petroleum Evaluation Engineers and a Registered Professional Engineer in the State of Texas.
The Company maintains a system of internal controls over the reserve estimation process. Management reviews the price, heat content, lease operating cost and future investment assumptions used in the economic model to determine the reserves. The Vice President of Reservoir Engineering reviews and approves all new reserve assignments and significant reserve revisions. Access to the Reserve database is restricted. Significant changes to the reserve report are reviewed by senior management on a quarterly basis. Periodically, the Company's internal audit department assesses the design of these controls and performs testing to determine the effectiveness of such controls.
All of the Company's reserve estimates are audited annually by Netherland, Sewell and Associates, Inc. (NSAI). Since 1961, NSAI has evaluated gas and oil properties and independently certified petroleum reserve quantities in the United States and internationally under the Texas Board of Professional Engineers Registration No. F-002699. The primary technical persons (employed by NSAI) that are responsible for leading the audit include
-116-
NATIONAL FUEL GAS COMPANY
NOTES TO CONSOLIDATED FINANCIAL STATEMENTS - (Continued)
a professional engineer registered with the State of Texas (consulting at NSAI since 2004 and with over 5 years of prior industry experience in petroleum engineering) and a professional geoscientist registered in the State of Texas (consulting at NSAI since 2008 and with over 11 years of prior industry experience in petroleum geosciences). NSAI was satisfied with the methods and procedures used by the Company to prepare its reserve estimates at September 30, 2017 and did not identify any problems which would cause it to take exception to those estimates.
The reliable technologies that were utilized in estimating the reserves include wire line open-hole log data, performance data, log cross sections, core data, 2D and 3D seismic data and statistical analysis. The statistical method utilized production performance from both the Company's and competitors’ wells. Geophysical data includes data from the Company's wells, published documents and state data-sites, and 2D and 3D seismic data. These were used to confirm continuity of the formation.
Gas MMcf | ||||||||
U. S. | ||||||||
Appalachian Region | West Coast Region | Total Company | ||||||
Proved Developed and Undeveloped Reserves: | ||||||||
September 30, 2014 | 1,624,062 | 58,822 | 1,682,884 | |||||
Extensions and Discoveries | 633,360 | (1) | — | 633,360 | ||||
Revisions of Previous Estimates | (28,124 | ) | (6,317 | ) | (34,441 | ) | ||
Production | (136,404 | ) | (2) | (3,159 | ) | (139,563 | ) | |
Sale of Minerals in Place | (112 | ) | — | (112 | ) | |||
September 30, 2015 | 2,092,782 | 49,346 | 2,142,128 | |||||
Extensions and Discoveries | 185,347 | (1) | — | 185,347 | ||||
Revisions of Previous Estimates | (245,029 | ) | (3,132 | ) | (248,161 | ) | ||
Production | (140,457 | ) | (2) | (3,090 | ) | (143,547 | ) | |
Sale of Minerals in Place | (261,192 | ) | — | (261,192 | ) | |||
September 30, 2016 | 1,631,451 | 43,124 | 1,674,575 | |||||
Extensions and Discoveries | 386,649 | (1) | 8 | 386,657 | ||||
Revisions of Previous Estimates | 84,480 | 6,369 | 90,849 | |||||
Production | (154,093 | ) | (2) | (2,995 | ) | (157,088 | ) | |
Sale of Minerals in Place | (21,873 | ) | — | (21,873 | ) | |||
September 30, 2017 | 1,926,614 | 46,506 | 1,973,120 | |||||
Proved Developed Reserves: | ||||||||
September 30, 2014 | 1,119,901 | 57,907 | 1,177,808 | |||||
September 30, 2015 | 1,267,498 | 49,346 | 1,316,844 | |||||
September 30, 2016 | 1,089,492 | 43,124 | 1,132,616 | |||||
September 30, 2017 | 1,316,596 | 46,506 | 1,363,102 | |||||
Proved Undeveloped Reserves: | ||||||||
September 30, 2014 | 504,161 | 915 | 505,076 | |||||
September 30, 2015 | 825,284 | — | 825,284 | |||||
September 30, 2016 | 541,959 | — | 541,959 | |||||
September 30, 2017 | 610,018 | — | 610,018 | |||||
(1) | Extensions and discoveries include 598 Bcf (during 2015), 179 Bcf (during 2016) and 181 Bcf (during 2017), of Marcellus Shale gas in the Appalachian region. |
(2) | Production includes 130,291 MMcf (during 2015), 135,598 MMcf (during 2016) and 145,452 MMcf (during 2017), from Marcellus Shale fields (which exceed 15% of total reserves). |
-117-
NATIONAL FUEL GAS COMPANY
NOTES TO CONSOLIDATED FINANCIAL STATEMENTS - (Continued)
Oil Mbbl | ||||||||
U. S. | ||||||||
Appalachian Region | West Coast Region | Total Company | ||||||
Proved Developed and Undeveloped Reserves: | ||||||||
September 30, 2014 | 253 | 38,224 | 38,477 | |||||
Extensions and Discoveries | — | 533 | 533 | |||||
Revisions of Previous Estimates | (3 | ) | (2,251 | ) | (2,254 | ) | ||
Production | (30 | ) | (3,004 | ) | (3,034 | ) | ||
September 30, 2015 | 220 | 33,502 | 33,722 | |||||
Extensions and Discoveries | — | 530 | 530 | |||||
Revisions of Previous Estimates | (46 | ) | (2,201 | ) | (2,247 | ) | ||
Production | (28 | ) | (2,895 | ) | (2,923 | ) | ||
Sales of Minerals in Place | (73 | ) | — | (73 | ) | |||
September 30, 2016 | 73 | 28,936 | 29,009 | |||||
Extensions and Discoveries | — | 674 | 674 | |||||
Revisions of Previous Estimates | (12 | ) | 3,305 | 3,293 | ||||
Production | (4 | ) | (2,736 | ) | (2,740 | ) | ||
Sales of Minerals in Place | (29 | ) | — | (29 | ) | |||
September 30, 2017 | 28 | 30,179 | 30,207 | |||||
Proved Developed Reserves: | ||||||||
September 30, 2014 | 253 | 37,002 | 37,255 | |||||
September 30, 2015 | 220 | 33,150 | 33,370 | |||||
September 30, 2016 | 73 | 28,698 | 28,771 | |||||
September 30, 2017 | 28 | 29,771 | 29,799 | |||||
Proved Undeveloped Reserves: | ||||||||
September 30, 2014 | — | 1,222 | 1,222 | |||||
September 30, 2015 | — | 352 | 352 | |||||
September 30, 2016 | — | 238 | 238 | |||||
September 30, 2017 | — | 408 | 408 | |||||
The Company’s proved undeveloped (PUD) reserves increased from 543 Bcfe at September 30, 2016 to 612 Bcfe at September 30, 2017. PUD reserves in the Marcellus Shale decreased from 542 Bcfe at September 30, 2016 to 456 Bcfe at September 30, 2017. The Company’s total PUD reserves were 28% of total proved reserves at September 30, 2017, down from 29% of total proved reserves at September 30, 2016.
The Company’s PUD reserves decreased from 827 Bcfe at September 30, 2015 to 543 Bcfe at September 30, 2016. PUD reserves in the Marcellus Shale decreased from 825 Bcfe at September 30, 2015 to 542 Bcfe at September 30, 2016. The Company’s total PUD reserves were 29% of total proved reserves at September 30, 2016, down from 35% of total proved reserves at September 30, 2015.
The increase in PUD reserves in 2017 of 69 Bcfe is a result of 269 Bcfe in new PUD reserve additions (113 Bcfe from the Marcellus Shale, 154 Bcfe from the Utica Shale and 2 Bcfe from the West Coast region) and 13 Bcfe in upward revisions to remaining PUD reserves, partially offset by 159 Bcfe in PUD conversions to developed reserves (158 Bcfe from the Marcellus Shale and 1 Bcfe from the West Coast region) and 54 Bcfe in PUD reserves removed. The PUD reserves removed were all in the Marcellus Shale and were due to a couple of factors. PUD reserves of 36 Bcfe associated with a few wells were removed due to development timing no longer scheduled to meet the five year requirement for proved reserves. Seneca successfully leased an adjacent tract to these wells in
-118-
NATIONAL FUEL GAS COMPANY
NOTES TO CONSOLIDATED FINANCIAL STATEMENTS - (Continued)
2017 and intends to develop the wells now with longer laterals drilled into this adjacent tract. This will now take longer than the five year time horizon from original booking. PUD reserves of 18 Bcfe were removed due to a change in plans this year and its impact on a few wells. As part of Seneca’s transition toward a Utica focused development program in the Western Development Area, certain Marcellus wells have been replaced with Utica wells in our development plan.
The decrease in PUD reserves in 2016 of 284 Bcfe was a result of 102 Bcfe in new PUD reserve additions (102 Bcfe from the Marcellus Shale), offset by sales of 166 Bcfe associated with a joint development agreement (JDA) that Seneca entered into in December 2015, 14 Bcfe in downward revisions to remaining PUD reserves, offset by 110 Bcfe in PUD conversions to developed reserves and 96 Bcfe in PUD reserves removed. The PUD reserves removed were primarily in the Marcellus Shale (74 Bcfe) and were due to several factors including schedule changes, lower performance expectations and lower natural gas pricing. Geneseo Shale PUD reserves of 23 Bcfe were removed solely due to lower gas pricing as they were uneconomic at trailing twelve month pricing.
The Company invested $101 million during the year ended September 30, 2017 to convert 147 Bcfe (159 Bcfe before revisions) of Marcellus PUD reserves to developed reserves. This represents 27% of the net PUD reserves booked at September 30, 2016. In fiscal 2017, the Company developed 37 (or 41%) of its wells that were recorded at September 30, 2016. The vast majority of these wells were in the Appalachian region.
The Company invested $93 million (includes $36 million of drilling carry costs for a JDA partner that were later reimbursed) during the year ended September 30, 2016 to convert 92 Bcfe (110 Bcfe before revisions) of PUD reserves to developed reserves. This represents 11% of the net PUD reserves recorded at September 30, 2015. In 2016, the majority of Seneca's planned PUD reserves development was funded by a JDA partner, which reduced Seneca's working interest, as discussed in Note A — Summary of Significant Accounting Policies under the heading “Property, Plant and Equipment.” In fiscal 2016, the Company developed 31 (or 28%) of its gross Marcellus Shale wells that were recorded at September 30, 2015. The majority of these wells were included in the JDA. Including the impact of JDA sales, the Company developed 207 Bcfe (or 25%) of its net PUD reserves recorded at September 30, 2015. In addition, as stated above, the sales associated with the JDA further decreased PUD reserves.
As part of Seneca’s JDA in the Marcellus Shale, Seneca anticipates it will sell approximately 60 Bcfe of its working interest PUD reserves in 2018 to its JDA partner as it develops the last group of wells included in the JDA.
In 2018, the Company estimates that it will invest approximately $186 million to develop its PUD reserves. The Company is committed to developing its PUD reserves within five years as required by the SEC’s final rule on Modernization of Oil and Gas Reporting. Since that rule, and over the last five years, the Company developed 39% of its beginning year PUD reserves in fiscal 2013, 51% of its beginning year PUD reserves in fiscal 2014, 33% of its beginning year PUD reserves in fiscal 2015, 25% of its beginning year PUD reserves in fiscal 2016 and 27% of its beginning year PUD reserves in fiscal 2017.
At September 30, 2017, the Company does not have a material concentration of proved undeveloped reserves that have been on the books for more than five years at the corporate level, country level or field level. All of the Company’s proved reserves are in the United States.
Standardized Measure of Discounted Future Net Cash Flows Relating to Proved Oil and Gas Reserves
The Company cautions that the following presentation of the standardized measure of discounted future net cash flows is intended to be neither a measure of the fair market value of the Company’s oil and gas properties, nor an estimate of the present value of actual future cash flows to be obtained as a result of their development and production. It is based upon subjective estimates of proved reserves only and attributes no value to categories of reserves other than proved reserves, such as probable or possible reserves, or to unproved acreage. Furthermore, in accordance with the SEC’s final rule on Modernization of Oil and Gas Reporting, it is based on the unweighted
-119-
NATIONAL FUEL GAS COMPANY
NOTES TO CONSOLIDATED FINANCIAL STATEMENTS - (Continued)
arithmetic average of the first day of the month oil and gas prices for each month within the twelve-month period prior to the end of the reporting period and costs adjusted only for existing contractual changes. It assumes an arbitrary discount rate of 10%. Thus, it gives no effect to future price and cost changes certain to occur under widely fluctuating political and economic conditions.
The standardized measure is intended instead to provide a means for comparing the value of the Company’s proved reserves at a given time with those of other oil- and gas-producing companies than is provided by a simple comparison of raw proved reserve quantities.
Year Ended September 30 | |||||||||||
2017 | 2016 | 2015 | |||||||||
(Thousands) | |||||||||||
United States | |||||||||||
Future Cash Inflows | $ | 6,144,317 | $ | 3,768,463 | $ | 6,916,775 | |||||
Less: | |||||||||||
Future Production Costs | 2,378,262 | 1,994,916 | 2,854,142 | ||||||||
Future Development Costs | 411,578 | 375,152 | 761,922 | ||||||||
Future Income Tax Expense at Applicable Statutory Rate | 1,160,469 | 303,397 | 1,117,433 | ||||||||
Future Net Cash Flows | 2,194,008 | 1,094,998 | 2,183,278 | ||||||||
Less: | |||||||||||
10% Annual Discount for Estimated Timing of Cash Flows | 1,080,962 | 452,470 | 860,244 | ||||||||
Standardized Measure of Discounted Future Net Cash Flows | $ | 1,113,046 | $ | 642,528 | $ | 1,323,034 | |||||
The principal sources of change in the standardized measure of discounted future net cash flows were as follows:
Year Ended September 30 | |||||||||||
2017 | 2016 | 2015 | |||||||||
(Thousands) | |||||||||||
United States | |||||||||||
Standardized Measure of Discounted Future | |||||||||||
Net Cash Flows at Beginning of Year | $ | 642,528 | $ | 1,323,034 | $ | 2,066,878 | |||||
Sales, Net of Production Costs | (345,075 | ) | (218,444 | ) | (318,753 | ) | |||||
Net Changes in Prices, Net of Production Costs | 828,187 | (1,066,593 | ) | (1,752,843 | ) | ||||||
Extensions and Discoveries | 170,500 | 47,742 | 266,159 | ||||||||
Changes in Estimated Future Development Costs | 8,816 | 143,752 | 164,510 | ||||||||
Sales of Minerals in Place | (9,849 | ) | (95,849 | ) | (1 | ) | |||||
Previously Estimated Development Costs Incurred | 101,134 | 92,840 | 161,833 | ||||||||
Net Change in Income Taxes at Applicable Statutory Rate | (393,353 | ) | 387,739 | 545,442 | |||||||
Revisions of Previous Quantity Estimates | 39,078 | 6,202 | (16,573 | ) | |||||||
Accretion of Discount and Other | 71,080 | 22,105 | 206,382 | ||||||||
Standardized Measure of Discounted Future Net Cash Flows at End of Year | $ | 1,113,046 | $ | 642,528 | $ | 1,323,034 | |||||
-120-
Schedule II — Valuation and Qualifying Accounts
Description | Balance at Beginning of Period | Additions Charged to Costs and Expenses | Additions Charged to Other Accounts(1) | Deductions (2) | Balance at End of Period | ||||||||||||||
Year Ended September 30, 2017 | |||||||||||||||||||
Allowance for Uncollectible Accounts | $ | 21,109 | $ | 6,301 | $ | 1,774 | $ | 6,658 | $ | 22,526 | |||||||||
Year Ended September 30, 2016 | |||||||||||||||||||
Allowance for Uncollectible Accounts | $ | 29,029 | $ | 6,819 | $ | 1,521 | $ | 16,260 | $ | 21,109 | |||||||||
Year Ended September 30, 2015 | |||||||||||||||||||
Allowance for Uncollectible Accounts | $ | 31,811 | $ | 9,316 | $ | 2,585 | $ | 14,683 | $ | 29,029 | |||||||||
(1) | Represents the discount on accounts receivable purchased in accordance with the Utility segment’s 2005 New York rate agreement. |
(2) | Amounts represent net accounts receivable written-off. |
Item 9 | Changes in and Disagreements with Accountants on Accounting and Financial Disclosure |
None.
Item 9A | Controls and Procedures |
Evaluation of Disclosure Controls and Procedures
The term “disclosure controls and procedures” is defined in Rules 13a-15(e) and 15d-15(e) under the Exchange Act. These rules refer to the controls and other procedures of a company that are designed to ensure that information required to be disclosed by a company in the reports that it files or submits under the Exchange Act is recorded, processed, summarized and reported within the time periods specified in the SEC’s rules and forms. Disclosure controls and procedures include, without limitation, controls and procedures designed to ensure that information required to be disclosed is accumulated and communicated to the company’s management, including its principal executive and principal financial officers, as appropriate to allow timely decisions regarding required disclosure. The Company’s management, including the Chief Executive Officer and Principal Financial Officer, evaluated the effectiveness of the Company’s disclosure controls and procedures as of the end of the period covered by this report. Based upon that evaluation, the Company’s Chief Executive Officer and Principal Financial Officer concluded that the Company’s disclosure controls and procedures were effective as of September 30, 2017.
Management’s Annual Report on Internal Control over Financial Reporting
The management of the Company is responsible for establishing and maintaining adequate internal control over financial reporting as defined in Rules 13a-15(f) and 15d-15(f) under the Exchange Act. The Company’s internal control over financial reporting is designed to provide reasonable assurance regarding the reliability of financial reporting and preparation of financial statements for external purposes in accordance with GAAP. Because of its inherent limitations, internal control over financial reporting may not prevent or detect misstatements.
The Company’s management assessed the effectiveness of the Company’s internal control over financial reporting as of September 30, 2017. In making this assessment, management used the framework and criteria set forth by the Committee of Sponsoring Organizations of the Treadway Commission (COSO) in Internal Control — Integrated Framework, published in 2013. Based on this assessment, management concluded that the Company maintained effective internal control over financial reporting as of September 30, 2017.
PricewaterhouseCoopers LLP, the independent registered public accounting firm that audited the Company’s consolidated financial statements included in this Annual Report on Form 10-K, has issued an attestation report on the effectiveness of the Company’s internal control over financial reporting as of September 30, 2017. The report appears in Part II, Item 8 of this Annual Report on Form 10-K.
-121-
Changes in Internal Control over Financial Reporting
There were no changes in the Company’s internal control over financial reporting that occurred during the quarter ended September 30, 2017 that have materially affected, or are reasonably likely to materially affect, the Company’s internal control over financial reporting.
Item 9B | Other Information |
None.
PART III
Item 10 | Directors, Executive Officers and Corporate Governance |
The information concerning directors will be set forth in the definitive Proxy Statement under the headings entitled “Nominees for Election as Directors for Three-Year Terms to Expire in 2021,” “Directors Whose Terms Expire in 2020,” “Directors Whose Terms Expire in 2019,” and “Section 16(a) Beneficial Ownership Reporting Compliance” and is incorporated herein by reference. The information concerning corporate governance will be set forth in the definitive Proxy Statement under the heading entitled “Meetings of the Board of Directors and Standing Committees” and is incorporated herein by reference. Information concerning the Company’s executive officers can be found in Part I, Item 1, of this report.
The Company has adopted a Code of Business Conduct and Ethics that applies to the Company’s directors, officers and employees and has posted such Code of Business Conduct and Ethics on the Company’s website, www.nationalfuelgas.com, together with certain other corporate governance documents. Copies of the Company’s Code of Business Conduct and Ethics, charters of important committees, and Corporate Governance Guidelines will be made available free of charge upon written request to Investor Relations, National Fuel Gas Company, 6363 Main Street, Williamsville, New York 14221.
The Company intends to satisfy the disclosure requirement under Item 5.05 of Form 8-K regarding an amendment to, or a waiver from, a provision of its code of ethics that applies to the Company’s principal executive officer, principal financial officer, principal accounting officer or controller, or persons performing similar functions, and that relates to any element of the code of ethics definition enumerated in paragraph (b) of Item 406 of the SEC’s Regulation S-K, by posting such information on its website, www.nationalfuelgas.com.
Item 11 | Executive Compensation |
The information concerning executive compensation will be set forth in the definitive Proxy Statement under the headings “Executive Compensation” and “Compensation Committee Interlocks and Insider Participation” and, excepting the “Report of the Compensation Committee,” is incorporated herein by reference.
Item 12 | Security Ownership of Certain Beneficial Owners and Management and Related Stockholder Matters |
Equity Compensation Plan Information
The equity compensation plan information will be set forth in the definitive Proxy Statement under the heading “Equity Compensation Plan Information” and is incorporated herein by reference.
Security Ownership and Changes in Control
(a) Security Ownership of Certain Beneficial Owners
The information concerning security ownership of certain beneficial owners will be set forth in the definitive Proxy Statement under the heading “Security Ownership of Certain Beneficial Owners and Management” and is incorporated herein by reference.
-122-
(b) Security Ownership of Management
The information concerning security ownership of management will be set forth in the definitive Proxy Statement under the heading “Security Ownership of Certain Beneficial Owners and Management” and is incorporated herein by reference.
(c) Changes in Control
None.
Item 13 | Certain Relationships and Related Transactions, and Director Independence |
The information regarding certain relationships and related transactions will be set forth in the definitive Proxy Statement under the headings “Compensation Committee Interlocks and Insider Participation” and “Related Person Transactions” and is incorporated herein by reference. The information regarding director independence is set forth in the definitive Proxy Statement under the heading “Director Independence” and is incorporated herein by reference.
Item 14 | Principal Accountant Fees and Services |
The information concerning principal accountant fees and services will be set forth in the definitive Proxy Statement under the heading “Audit Fees” and is incorporated herein by reference.
PART IV
Item 15 | Exhibits and Financial Statement Schedules |
(a)1. | Financial Statements |
Financial statements filed as part of this report are listed in the index included in Item 8 of this Form 10-K, and reference is made thereto.
(a)2. | Financial Statement Schedules |
Financial statement schedules filed as part of this report are listed in the index included in Item 8 of this Form 10-K, and reference is made thereto.
(a)3. | Exhibits |
All documents referenced below were filed pursuant to the Securities Exchange Act of 1934 by National Fuel Gas Company (File No. 1-3880), unless otherwise noted.
Exhibit Number | Description of Exhibits |
3(i) | Articles of Incorporation: |
• | |
3(ii) | By-Laws: |
• | |
-123-
Exhibit Number | Description of Exhibits |
4 | Instruments Defining the Rights of Security Holders, Including Indentures: |
• | Indenture, dated as of October 15, 1974, between the Company and The Bank of New York Mellon (formerly Irving Trust Company) (Exhibit 2(b) in File No. 2-51796) |
• | Third Supplemental Indenture, dated as of December 1, 1982, to Indenture dated as of October 15, 1974, between the Company and The Bank of New York Mellon (formerly Irving Trust Company) (Exhibit 4(a)(4) in File No. 33-49401) |
• | Eleventh Supplemental Indenture, dated as of May 1, 1992, to Indenture dated as of October 15, 1974, between the Company and The Bank of New York Mellon (formerly Irving Trust Company) (Exhibit 4(b), Form 8-K dated February 14, 1992) |
• | Twelfth Supplemental Indenture, dated as of June 1, 1992, to Indenture dated as of October 15, 1974, between the Company and The Bank of New York Mellon (formerly Irving Trust Company) (Exhibit 4(c), Form 8-K dated June 18, 1992) |
• | Thirteenth Supplemental Indenture, dated as of March 1, 1993, to Indenture dated as of October 15, 1974, between the Company and The Bank of New York Mellon (formerly Irving Trust Company) (Exhibit 4(a)(14) in File No. 33-49401) |
• | Fourteenth Supplemental Indenture, dated as of July 1, 1993, to Indenture dated as of October 15, 1974, between the Company and The Bank of New York Mellon (formerly Irving Trust Company) (Exhibit 4.1, Form 10-K for fiscal year ended September 30, 1993) |
• | |
• | |
• | |
• | |
• | |
• | |
• | |
• | |
10 | Material Contracts: |
• | |
• | |
-124-
Exhibit Number | Description of Exhibits |
Management Contracts and Compensatory Plans and Arrangements: | |
• | |
10.1 | |
• | |
• | |
• | |
• | |
• | |
• | |
• | |
• | |
• | |
• | |
• | |
• | |
• | |
• | |
• | |
• | |
-125-
Exhibit Number | Description of Exhibits |
• | |
• | |
• | |
• | |
• | |
• | |
• | |
• | |
• | |
• | |
• | |
• | |
• | |
• | |
• | |
• | |
-126-
Exhibit Number | Description of Exhibits |
• | |
12 | |
21 | |
23 | Consents of Experts: |
23.1 | |
23.2 | |
31 | Rule 13a-14(a)/15d-14(a) Certifications: |
31.1 | |
31.2 | |
32•• | |
99 | Additional Exhibits: |
99.1 | |
99.2 | |
101 | Interactive data files submitted pursuant to Regulation S-T: (i) the Consolidated Statements of Income and Earnings Reinvested in the Business for the years ended September 30, 2017, 2016 and 2015, (ii) the Consolidated Statements of Comprehensive Income for the years ended September 30, 2017, 2016 and 2015 (iii) the Consolidated Balance Sheets at September 30, 2017 and September 30, 2016, (iv) the Consolidated Statements of Cash Flows for the years ended September 30, 2017, 2016 and 2015 and (v) the Notes to Consolidated Financial Statements. |
• | Incorporated herein by reference as indicated. |
All other exhibits are omitted because they are not applicable or the required information is shown elsewhere in this Annual Report on Form 10-K. | |
•• | In accordance with Item 601(b)(32)(ii) of Regulation S-K and SEC Release Nos. 33-8238 and 34-47986, Final Rule: Management’s Reports on Internal Control Over Financial Reporting and Certification of Disclosure in Exchange Act Periodic Reports, the material contained in Exhibit 32 is “furnished” and not deemed “filed” with the SEC and is not to be incorporated by reference into any filing of the Registrant under the Securities Act of 1933 or the Exchange Act, whether made before or after the date hereof and irrespective of any general incorporation language contained in such filing, except to the extent that the Registrant specifically incorporates it by reference. |
-127-
Signatures
Pursuant to the requirements of Section 13 or 15(d) of the Securities Exchange Act of 1934, the registrant has duly caused this report to be signed on its behalf by the undersigned, thereunto duly authorized.
National Fuel Gas Company | ||
(Registrant) | ||
By | /s/ R. J. Tanski | |
R. J. Tanski | ||
President and Chief Executive Officer | ||
Date: November 17, 2017
Pursuant to the requirements of the Securities Exchange Act of 1934, this report has been signed below by the following persons on behalf of the registrant and in the capacities and on the dates indicated.
Signature | Title | |||
/s/ D. F. Smith | Chairman of the Board and Director | Date: November 17, 2017 | ||
D. F. Smith | ||||
/s/ P. C. Ackerman | Director | Date: November 17, 2017 | ||
P. C. Ackerman | ||||
/s/ D. C. Carroll | Director | Date: November 17, 2017 | ||
D. C. Carroll | ||||
/s/ S. E. Ewing | Director | Date: November 17, 2017 | ||
S. E. Ewing | ||||
/s/ J. N. Jaggers | Director | Date: November 17, 2017 | ||
J. N. Jaggers | ||||
/s/ C. G. Matthews | Director | Date: November 17, 2017 | ||
C. G. Matthews | ||||
/s/ R. Ranich | Director | Date: November 17, 2017 | ||
R. Ranich | ||||
/s/ J. W. Shaw | Director | Date: November 17, 2017 | ||
J. W. Shaw | ||||
/s/ T. E. Skains | Director | Date: November 17, 2017 | ||
T. E. Skains | ||||
/s/ R. J. Tanski | President, Chief Executive Officer and Director | Date: November 17, 2017 | ||
R. J. Tanski | ||||
/s/ D. P. Bauer | Treasurer and Principal Financial Officer | Date: November 17, 2017 | ||
D. P. Bauer | ||||
/s/ K. M. Camiolo | Controller and Principal Accounting Officer | Date: November 17, 2017 | ||
K. M. Camiolo | ||||
-128-