Attached files
| file | filename |
|---|---|
| 8-K - FORM 8-K - Arlington Asset Investment Corp. | v393677_8k.htm |
Exhibit 99.1

Investor Presentation November 7, 2014

1 Information Related to Forward - Looking Statements This presentation contains “forward - looking statements” within the meaning of the Private Securities Litigation Reform Act of 19 95. These include statements regarding future results or expectations about our investments, returns on invested capital, investment st rat egy, taxes, portfolio, earnings, book value, core income, growth in capital, agency MBS spreads, prepayments, hedging instruments, durati on, credit performance of private - label MBS, cash flow and benefit of deferred tax asset value. Forward - looking statements can be identifi ed by forward - looking language, including words such as “believes,” “anticipates,” “views,” “expects,” “estimates,” “intends,” “may,” “plans,” “projects,” “potential,” “prospective,” “will” and similar expressions, or the negative of these words. Such forward - looking sta tements are based on facts and conditions as they exist at the time such statements are made. Forward - looking statements are also based on predictions as to future facts and conditions, the accurate prediction of which may be difficult and involve the assessment of events beyond ou r control. Forward - looking statements are further based on various operating and return assumptions. Caution must be exercised in relying o n forward - looking statements. Due to known and unknown risks, actual results may differ materially from expectations or projections. You should carefully consider these risks when you make a decision concerning an investment in our common stock or senior not es , along with the following factors, among others, that may cause our actual results to differ materially from those described in any for ward - looking statements: availability of, and our ability to deploy, capital; growing our business primarily through a strategy focused on ac quiring primarily private - label mortgage - backed securities (“MBS”) and agency - backed MBS; yields on MBS; our ability to successfully implement our hedging strategy; our ability to realize reflation on our private - label MBS; our ability to effectively migrate capital invested in priv ate - label MBS to agency - backed MBS; the credit performance of our private - label MBS; our ability to potentially realize a higher return on capita l reallocated to agency - backed MBS; current conditions and adverse developments in the residential mortgage market and the overall economy; poten tial risk attributable to our mortgage - related portfolios; impacts of regulatory changes, including actions taken by the SEC, the U.S. Fed eral Reserve and the U.S. Treasury and changes affecting Fannie Mae and Freddie Mac; overall interest rate environment and changes in inte res t rates, interest rate spreads, the yield curve and prepayment rates; changes in anticipated earnings and returns; the amount and grow th in our cash earnings and distributable income; growth in our book value per share; our ability to maintain adequate liquidity; our use of le verage and dependence on repurchase agreements and other short - term borrowings to finance our mortgage - related holdings; the loss of our ex clusion from the definition of “investment company” under the Investment Company Act of 1940; our ability to forecast our tax attribu tes and protect and use our net operating loss carry - forwards and net capital loss carry - forwards to offset future taxable income and gains; cha nges in our business, acquisition, leverage, asset allocation, operational, hedging and financing strategies and policies; our ability an d w illingness to make future dividends; changes in, and our ability to remain in compliance with, law, regulations or governmental policies affecti ng our business; and the factors described in the sections entitled “Risk Factors” in our Annual Report on Form 10 - K for the year ended December 31, 2013 and other documents filed by the Company with the SEC from time to time. You should not place undue reliance on these forward - looki ng statements, which apply only as of the date of this presentation. We undertake no obligation to update or revise any forward - lo oking statement, whether written or oral, relating to matters discussed in this presentation, except as may be required by applicab le securities laws.

2 Company Overview Arlington Asset Investment Corp. (“AI” or the “Company”) is a principal investment firm focused on securitized residential mortgage assets - Invests in high quality liquid assets with predictable cash flows and substantial hedges - Attractive returns on invested capital - Internally - managed - Structured as a C - corp to optimize investment strategy and taxes $183.1 million of net operating loss carry - forwards and $50.8 million net capital loss carry - forwards as of 12/31/13 (1) Our hybrid investment portfolio is positioned to benefit from normalization of interest rates and the housing market - Portfolio consists of private - label and agency MBS We expect to generate attractive risk adjusted returns with low leverage and offer growth potential in earnings and book value NYSE Ticker AI Share Price (11/6/14) $27.38 Market Cap (11/6 /14) $629 million Total Assets (9/30/14) $3.76 billion Book Value P er Share (9/30/14) $30.43 ( 1 ) The NCL carry - forwards are available to offset taxable capital gains through 2014 , and the NOL carry - forwards will begin to expire in 2027 .
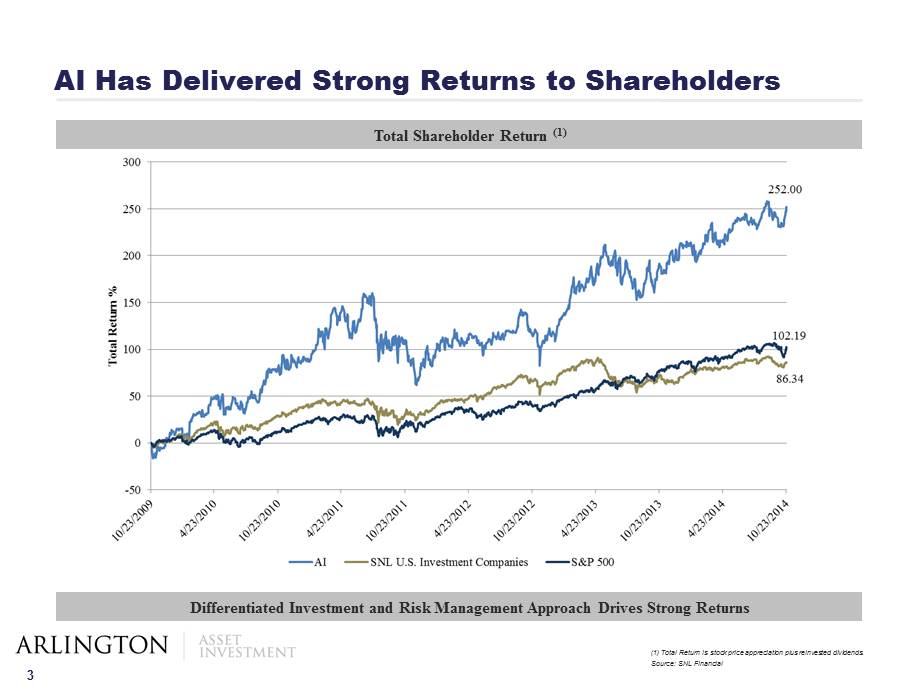
3 AI Has Delivered Strong Returns to Shareholders Total Shareholder Return (1) Differentiated Investment and Risk Management Approach Drives Strong Returns ( 1 ) Total Return is stock price appreciation plus reinvested dividends . Source : SNL Financial

4 Investment Highlights 1 2 3 4 Corporate structure provides flexibility and capital growth Strong, growing core income drives attractive risk adjusted return on capital High - quality, liquid MBS portfolio Differentiated investment approach drives consistent book value

5 Complementary hybrid portfolio comprised of ~$3.5 billion of high - quality, liquid securities - Floating rate private - label MBS in Re - Remic form backed by prime collateral - Hedged, prepayment protected agency MBS Portfolio and deposits comprise ~95% of total assets as of September 30, 2014 High - Quality, Liquid MBS Portfolio 1 ( 1 ) Agency MBS allocated capital is composed of MBS and its related interest receivable, repo, its related interest and derivative instruments, and its related deposits and cash . Private - label MBS allocated capital is composed of MBS and repo and its related interest . Investment Portfolio Allocated Capital (1)

6 Attractive agency MBS portfolio spreads in current environment - 100% selected for prepayment protections: 40% HARP, high LTV, low balance loan - 3 - month portfolio CPR of 7.04% with 106.1 cost and 105.9 fair market value Well hedged to protect against increasing interest rates as economic environment shifts - Mix of Eurodollar futures and 10 year Swaps - Seek to maintain neutral to negative net duration ( 1 ) As of 9/30/14. Focus on Prime Jumbo & Alt - A securities at deep discounts - No subprime, no option arms - Improving credit performance, attractive yield, positive technicals Agency MBS Portfolio (1) Private - Label MBS Portfolio High - Quality, Liquid MBS Portfolio (Cont’d) 1 Private - Label MBS Portfolio Statistics Face Value $389M Weighted Average Cost/Mark 54% / 75% Purchase Discount $152M Average Loan Size $559,794 Coupon 3.00% Orig FICO 723 Orig LTV 68% WALA 96 Credit Enhancement 0.3% 60+ Delinquency 15% 3 month Severity 42% 3 month CPR 12% as of 9/30/14
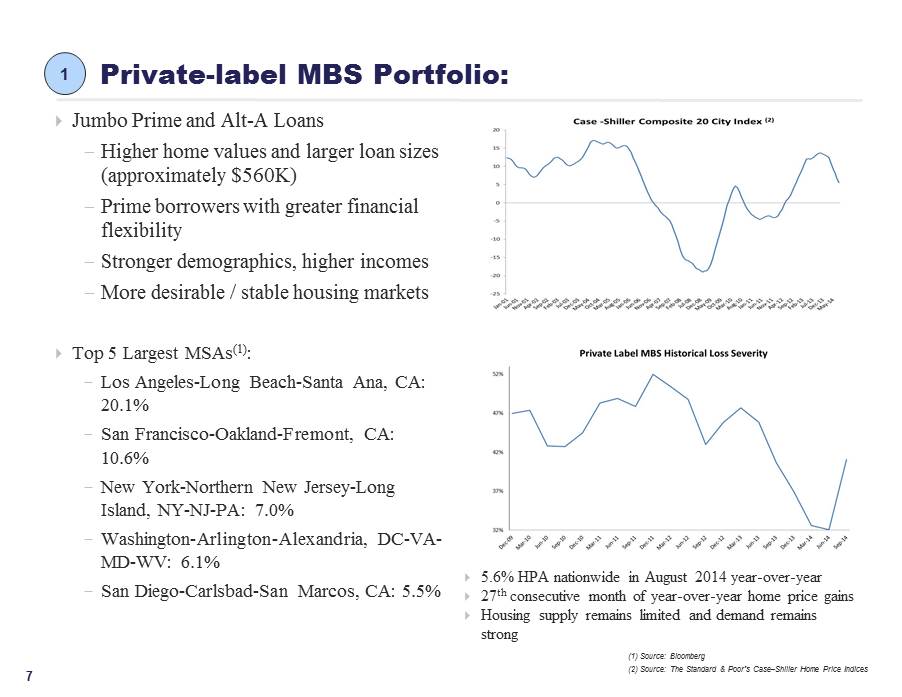
7 Private - label MBS Portfolio: Jumbo Prime and Alt - A Loans - Higher home values and larger loan sizes (approximately $560K) - Prime borrowers with greater financial flexibility - Stronger demographics, higher incomes - More desirable / stable housing markets Top 5 Largest MSAs (1) : - Los Angeles - Long Beach - Santa Ana, CA: 20.1% - San Francisco - Oakland - Fremont, CA: 10.6% - New York - Northern New Jersey - Long Island, NY - NJ - PA: 7.0% - Washington - Arlington - Alexandria, DC - VA - MD - WV: 6.1% - San Diego - Carlsbad - San Marcos, CA: 5.5% 5.6% HPA nationwide in August 2014 year - over - year 27 th consecutive month of year - over - year home price gains Housing supply remains limited and demand remains strong ( 1 ) Source : Bloomberg (2) Source: The Standard & Poor's Case – Shiller Home Price Indices 1

8 Our investment approach resulted in low book value volatility despite significant increase in interest rates - Stable book value drives future earnings power We achieved this by constructing a portfolio with current market conditions in mind - Attractive agency MBS portfolio selected for prepayment protections - Well hedged against increasing interest rates as economic environment shifts - Private - label MBS portfolio purchased at a deep discount with improving credit performance - Low leverage of ~4x compared to Hybrid and Agency Mortgage REIT peers at ~5x to 7x Differentiated Investment Approach Drives Consistent Book Value 2 Book Value Per Share

9 Growing core net income driven by a larger investment portfolio - Increased from $20.0 million for the quarter ended 9/30/13 to $28.7 million for the quarter ended 9/30/14 - Provides significant cash flow to service debt obligations Strong growth in earnings potential driven by: - Full deployment of proceeds from our September 2014 equity raise - Redeployment of appreciated private - label capital to agency MBS opportunities - Internally - managed structure provides operating leverage - Ratio of core expenses to capital improved by approximately 30 bps post the September 2014 equity raise Cash Operating Expenses as % of Avg. Equity Strong, Growing Core Income Drives Attractive Risk Adjusted Return on Capital 3

10 Our C - corp structure provides flexibility as we are not required to distribute taxable earnings to stockholders - Protects debt holders as cash earnings are available to service debt without any negative tax implications - Provides option to reinvest earnings and opportunistically benefit from market dislocation - Allows complete investment flexibility as we are not bound by any substantial restrictions Benefits stockholders by providing tax - advantaged dividend as we continue to utilize our net operating loss carry - forwards - 13% annualized dividend yield (1)(2) (17% annualized dividend yield, on a tax adjusted basis, assuming 23.8% Federal income tax on C - corp.) (3) - $148 million of deferred tax asset value or $6.43 per share if all are realized ( 1 ) Based on the Company’s Class A common stock closing price on the NYSE of $ 27 . 38 on 11 / 6 / 2014 . (2) The annual dividend rate presented is calculated by annualizing the 3 rd quarter of 2014 dividend payment of $0.875 per share of Class A common stock. The Company maintains a variable dividend policy and the Board of Directors, in its sole discretion, approves the payment of dividends. Actual divid end s in the future may differ materially from historical practice and from the annualized dividend rate presented. (3) The Company's dividends are eligible for the 23.8% federal income tax rate on qualified dividend income, whereas dividends p aid by REITs are generally subject to tax at ordinary income rates (currently at a maximum marginal federal rate of 43.4%). To provide the same after - tax return to a shareholder eli gible for the 23.8% rate on qualified dividend income and otherwise subject to the maximum marginal rate on ordinary income, a REIT would be required to pay dividends providing a 17% yield. Corporate Structure Provides Flexibility and Capital Growth 4

11 Conclusion 1 2 3 4 Corporate structure provides flexibility and capital growth Strong, growing core income drives attractive risk adjusted return on capital High - quality, liquid MBS portfolio Differentiated investment approach drives consistent book value

12 Appendix

13 Balance Sheet CONSOLIDATED BALANCE SHEETS (Dollars and shares in thousands, except per share amounts) (Unaudited) ASSETS September 30, 2014 December 31, 2013 Cash and cash equivalents 31,093$ 48,628$ Receivables Interest 9,259 5,173 Sold securities receivable - - Other 222 212 Mortgage-backed securities, at fair value Available-for-sale 292,849 341,346 Trading 3,176,135 1,576,452 Other investments 1,891 2,065 Derivative assets, at fair value 8,966 8,424 Deferred tax asset, net 147,686 165,851 Deposits 95,216 45,504 Prepaid expenses and other assets 1,379 1,311 Total assets 3,764,696$ 2,194,966$ LIABILITIES AND EQUITY Liabilities: Repurchase agreements 2,668,566$ 1,547,630$ Interest payable 901 774 Accrued compensation and benefits 4,367 5,584 Dividend payable 20,199 14,630 Derivative liabilities, at fair value 67,410 33,129 Purchased securities payable 263,425 - Accounts payable, accrued expenses and other liabilities 851 1,391 Long-term debt 40,000 40,000 Total liabilities 3,065,719 1,643,138 Equity 698,977 551,828 Total liabilities and equity 3,764,696$ 2,194,966$

14 Income Statement and Core Operating Income YTD QTD QTD QTD YTD QTD September September June March September September 2014 2014 2014 2014 2013 2013 SUMMARY INCOME STATEMENT Investment $ ( 4,978,855 ) $ ( 6,977,159 ) $ 7,909,540 $ ( 5,911,236 ) $ ( 35,882,893 ) $ ( 11,100,119 ) Interest Income Interest Income - Principal Investing 87,230,918 33,300,714 30,062,969 23,867,235 64,467,078 22,994,721 Dividends Income - - - - - - Total Gross Revenues 82,252,063 26,323,555 37,972,509 17,955,999 28,584,185 11,894,602 Interest Expense 7,936,811 2,976,402 2,675,423 2,284,986 6,137,379 2,313,578 Net Revenues 74,315,252 23,347,153 35,297,086 15,671,013 22,446,806 9,581,024 Non - Interest Expenses Fixed Compensation 5,240,475 2,296,613 1,526,667 1,417,195 3,813,061 1,460,064 Variable Compensation 1,626,075 551,250 551,251 523,574 1,196,253 398,751 NEO Variable Compensation 2,719,790 1,010,208 1,010,208 699,374 2,615,755 1,084,245 Employee Benefits 555,031 137,123 97,291 320,617 409,035 99,237 Total Compensation and Benefits 10,141,371 3,995,194 3,185,417 2,960,760 8,034,104 3,042,297 Business Development 132,127 44,999 56,274 30,854 106,603 44,878 Professional Services 1,200,946 290,724 394,499 515,723 1,972,261 296,820 Occupancy and Equipment 325,830 106,762 120,308 98,760 327,837 96,004 Communications 146,501 46,647 52,190 47,664 142,271 49,197 Other Operating Expenses 1,642,640 569,679 571,473 501,488 1,142,097 500,310 Total Non - Interest Expense 13,589,415 5,054,005 4,380,161 4,155,249 11,725,173 4,029,506 Operating Income 60,725,837 18,293,148 30,916,925 11,515,764 10,721,633 5,551,518 Other Income Other Income/(Expenses) ( 10,971 ) (3,657) (3,657) (3,657) ( 10,971 ) (3,657) Net Income before Income Tax Provision 60,714,866 18,289,491 30,913,268 11,512,107 10,710,662 5,547,861 Income Taxes 21,995,248 5,442,061 12,073,515 4,479,672 1,247,216 2,455,594 Net Income $ 38,719,618 $ 12,847,430 $ 18,839,753 $ 7,032,435 $ 9,463,446 $ 3,092,267 Core Income per Press Release GAAP net income $ 38,719,618 $ 12,847,430 $ 18,839,753 $ 7,032,435 $ 9,463,446 $ 3,092,267 Adjustments: Non - recurring costs, inc. settlements 54,051 205 42,999 10,847 551,240 (24,286) Non - recurring (benefit) costs - tax related 21,099,338 5,114,292 11,782,006 4,203,040 725,335 2,170,032 Stock compensation 2,980,428 1,523,922 779,110 677,396 1,666,376 729,201 Net unrealized MTM on trading MBS & hedges (10,492,508) (1,426,430) (13,218,949) 4,152,871 40,420,665 12,953,124 Net realized (gain) loss on trading MBS & hedges 28,556,673 11,893,609 10,106,155 6,556,909 7,682,839 2,651,588 TRUPs hedges (256,250) (93,188) (86,562) (76,500) ( 199,875 ) (54,500) OTTI/ED Hedges 150,780 70,726 80,054 - 1,269,688 379,667 Adjusted interest related to discount accretion (7,634,308) (1,256,308) (3,934,482) (2,443,518) ( 3,091,358 ) (1,914,725) Non - GAAP core operating income - Revised $ 73,177,822 $ 28,674,258 $ 24,390,084 $ 20,113,480 $ 58,488,356 $ 19,982,368 Non - GAAP core operating income - Annualized $ 97,570,429 $ 114,697,032 $ 97,560,336 $ 80,453,920 $ 77,984,474 $ 79,929,472 Weighted average shares outstanding (diluted) 19,413,226 21,054,742 20,059,926 17,081,433 16,189,489 16,844,936

15 Disclaimer : The numbers contained in the examples above are for illustrative purposes only and do not reflect Arlington Asset’s projections or forecasts . Any assumptions and estimates used may not be accurate and cannot be relied upon . Arlington Asset’s ROE for any given period may differ materially from these examples . The foregoing is not an example of, and does not represent, expected returns from an investment in Arlington Asset’s common stock . ( 1 ) Represents market value minus repo financing plus hedges, deposits and related net working capital . ( 2 ) Based on 9 / 30 / 2014 contract balances and estimated 2014 forward curve funding costs . ( 3 ) Cash accretion based on average market value during the 3 rd quarter of 2014 . Agency Portfolio Highlights At 9/30/14 ($mm) Private - label Portfolio Highlights At 9/30/14 ($mm) Market Value $3,176 Face Value $389 Repo Financing $2,610 Market Value $293 Capital Allocation (1) $380 Capital Allocation $234 Agency Portfolio Economics Private - label Portfolio Economics Expected Yield (w/ 5.0 CPR) 3.40% Cash Yield (3) 4.0% Cash Repo Cost 0.3% Cash Repo Cost 2.0% Hedge Cost (2) 1.70% Net Spread 1.40% Net Spread (3) 2.0% Target Leverage 8.0x Target Leverage 0.2x ROE 14.6% ROE (excluding appreciation) 4.4% Illustrative MBS Portfolio Returns

16 Served as a Director of AI since co - founding the Company in 1989 Served as Vice Chairman and Chief Operating Officer from 1989 to 1999, Vice Chairman and Co - Chief Executive Officer from 1999 to 2003, Co - Chairman and Co - Chief Executive Officer from 2003 to 2005 and Chairman and Chief Executive Officer from 2005 to 2014 Over 30 years experience Served as Chief Executive Officer since 2014, Chief Operating Officer since 2007, and a Director of AI since March 2007 From 2004 to 2007, Mr. Tonkel served as President and Head of Investment Banking at FBR & Co. Over 29 years experience J. Rock Tonkel, Jr President and Chief Executive Officer Kurt R. Harrington EVP and Chief Financial Officer Brian J. Bowers Chief Investment Officer and Portfolio Manager Previously, Mr. Harrington was the EVP, Chief Financial Officer and Treasurer of FBR & Co. between 2000 and 2008 Over 35 years experience Mr. Bowers joined the Company in 2000 Previously, he was the Chief Portfolio Strategist for BB&T Capital Markets and the Portfolio Manager/Plan Sponsor of CareFirst, Inc. Over 29 years experience Experienced Management Team Through Numerous Cycles Management Interests Are Aligned With Investors As We Hold Significant Equity In Arlington Eric F. Billings Executive Chairman