Attached files
Table of Contents
UNITED STATES
SECURITIES AND EXCHANGE COMMISSION
Washington, D.C. 20549
FORM 10-K
(Mark One)
| x | ANNUAL REPORT PURSUANT TO SECTION 13 OR 15(d) OF THE SECURITIES EXCHANGE ACT OF 1934 |
For the fiscal year ended December 31, 2010
OR
| ¨ | TRANSITION REPORT PURSUANT TO SECTION 13 OR 15(d) OF THE SECURITIES EXCHANGE ACT OF 1934 |
For the transition period from to
Commission File Number: 000-50230
ARLINGTON ASSET INVESTMENT CORP.
(Exact name of registrant as specified in its charter)
| Virginia | 54-1873198 | |
| (State or Other Jurisdiction of Incorporation or Organization) |
(I.R.S. Employer Identification No.) |
1001 Nineteenth Street North,
Arlington, VA 22209
(Address of Principal Executive Offices) (Zip Code)
(703) 373-0200
(Registrant’s telephone number, including area code)
Securities registered pursuant to Section 12(b) of the Act:
| Title of Each Class of Securities |
Name of Each Exchange on Which Registered | |
| Class A Common Stock, Par Value $0.01 | New York Stock Exchange |
Securities registered pursuant to Section 12(g) of the Act: None
Indicate by check mark if the registrant is a well-known seasoned issuer, as defined in Rule 405 of the Securities Act: Yes ¨ No x
Indicate by check mark if the registrant is not required to file reports pursuant to Section 13 or Section 15(d) of the Act: Yes ¨ No x
Indicate by check mark whether the registrant (1) has filed all reports required to be filed by Section 13 or 15(d) of the Securities Exchange Act of 1934 during the preceding 12 months (or for such shorter period that the registrant was required to file such reports), and (2) has been subject to such filing requirements for the past 90 days: Yes x No ¨
Indicate by check mark whether the registrant has submitted electronically and posted on its corporate Web site, if any, every Interactive Data File required to be submitted and posted pursuant to Rule 405 of Regulation S-T (§ 232.405 of this chapter) during the preceding 12 months (or for such shorter period that the registrant was required to submit and post such files): Yes ¨ No ¨
Indicate by check mark if disclosure of delinquent filers pursuant to Item 405 of Regulation S-K is not contained herein, and will not be contained, to the best of registrant’s knowledge, in definitive proxy or information statements incorporated by reference in Part III of this Form 10-K or any amendment to this Form 10-K: x
Indicate by check mark whether the registrant is a large accelerated filer, an accelerated filer, a non-accelerated filer or a smaller reporting company. See definition of “large accelerated filer,” “accelerated filer” and “smaller reporting company” in Rule 12b-2 of the Exchange Act. (Check one):
| Large Accelerated Filer ¨ | Accelerated Filer x | Non-Accelerated Filer ¨ | Smaller Reporting Company ¨ |
Indicate by check mark whether the registrant is a shell company (as defined in Rule 12b-2 of the Exchange Act): Yes ¨ No x
The aggregate market value of the registrant’s Class A and Class B common stock held by non-affiliates computed by reference to the price at which the registrant’s Class A common stock was last sold on June 30, 2010 was approximately $129 million. There is no public trading market for the registrant’s Class B common stock; however, the Class B common stock is convertible into Class A common stock on a share-for-share basis.
As of January 31, 2011, there were 7,106,330 shares of the registrant’s Class A common stock outstanding and 566,112 shares of the registrant’s Class B common stock outstanding.
Documents incorporated by reference: Portions of the registrant’s Definitive Proxy Statement for the 2011 Annual Meeting of Shareholders (to be filed with the Securities and Exchange Commission on or before April 29, 2011) are incorporated by reference in this Annual Report on Form 10-K in response to Part III, Items 10, 11, 12, 13 and 14.
Table of Contents
Table of Contents
CAUTIONARY STATEMENT ABOUT FORWARD-LOOKING INFORMATION
This Annual Report on Form 10-K and the information incorporated by reference in this Annual Report on Form 10-K include forward-looking statements within the meaning of Section 27A of the Securities Act of 1933, as amended (Securities Act), and Section 21E of the Securities Exchange Act of 1934, as amended (Exchange Act). Some of the forward-looking statements can be identified by the use of forward-looking words such as “believes,” “expects,” “may,” “will,” “should,” “seeks,” “approximately,” “plans,” “estimates” or “anticipates” or the negative of those words or other comparable terminology. Statements concerning projections, future performance developments, events, revenues, expenses, earnings, run rates, and any other guidance on present or future periods constitute forward-looking statements. Such statements include, but are not limited to, those relating to the effects of our current strategy, our principal acquisitions activities, levels of assets under management and our equity capital levels and liquidity. Forward-looking statements involve risks and uncertainties and you should not unduly rely on these statements. You should be aware that a number of important factors could cause our actual results to differ materially from those in the forward-looking statements. These factors include, but are not limited to:
| • | the availability and terms of, and our ability to deploy, capital and our ability to grow our business through a strategy focused on acquiring primarily residential mortgage-backed securities (MBS) issued by private organizations (private-label MBS), generally on a non-leveraged basis, and MBS that are either issued by a U.S. government agency or guaranteed as to principal and interest by U.S. government agencies or U.S. government sponsored agencies (agency-backed MBS), on a leveraged basis; |
| • | our ability to forecast our tax attributes, which are based upon various facts and assumptions, and our ability to protect and use our net operating losses (NOLs) and net capital losses (NCLs) to offset future taxable income and gains, including whether our shareholder rights plan will be effective in preventing an ownership change that would significantly limit our ability to utilize such losses; |
| • | the overall environment for interest rates, changes in interest rates, interest rate spreads, the yield curve and prepayment rates; |
| • | our ability to realize any reflation of our assets; |
| • | current conditions in the residential mortgage market and further adverse developments in that market; |
| • | current economic conditions and further adverse developments in the overall economy; |
| • | potential risk attributable to our mortgage-related portfolios, including changes in fair value; |
| • | our use of leverage and our dependence on repurchase agreements and other short-term borrowings to finance our mortgage-related holdings; |
| • | the availability of certain short-term liquidity; |
| • | the federal conservatorship of the Federal National Mortgage Association (Fannie Mae) and the Federal Home Loan Mortgage Corporation (Freddie Mac) and related efforts, along with any changes in laws and regulations affecting the relationship between Fannie Mae and Freddie Mac and the federal government; |
| • | mortgage loan modification programs and future legislative action; |
| • | changes in our acquisition, hedging and leverage strategies, changes in our asset allocation and changes in our operational policies, all of which may be changed by us without shareholder approval; |
| • | competition for investment opportunities, including competition from the U.S. Department of Treasury (U.S. Treasury) for investments in agency-backed MBS; |
| • | our decisions with respect to, and ability to make, future dividends; |
| • | failure of sovereign or municipal entities to meet their debt obligations; |
1
Table of Contents
| • | competition for qualified personnel; |
| • | available technologies; |
| • | malfunctioning or failure in our operations and infrastructure; |
| • | the effect of government regulation and of general economic conditions on our business; |
| • | fluctuating quarterly operating results; |
| • | our ability to retain key professionals; |
| • | effects of litigation and contractual claims against us, our officers and directors, including the potential settlement and litigation of such claims; |
| • | risk from strategic investments or acquisitions and joint ventures or our entry into new business areas; |
| • | failure to maintain effective internal controls; |
| • | changes in laws and regulations and industry practices that may adversely affect our business; |
| • | the loss of our exclusion from the definition of “investment company” under the Investment Company Act of 1940, as amended (the 1940 Act); |
| • | volatility of the securities markets; |
| • | activity in the secondary securities markets; and |
| • | the factors described in Item 1A of this Annual Report on Form 10-K under the heading “Risk Factors.” |
We will not necessarily update the information presented or incorporated by reference in this Annual Report on Form 10-K if any of these forward looking statements turn out to be inaccurate. Risks affecting our business are described throughout this Annual Report on Form 10-K. This entire Annual Report on Form 10-K, including the consolidated financial statements and the notes and any other documents incorporated by reference into this Annual Report on Form 10-K should be read for a complete understanding of our business and the risks associated with that business.
2
Table of Contents
PART I
| ITEM 1. | BUSINESS |
Unless the context otherwise requires or indicates, all references in this Annual Report on Form 10-K to “we,” “us,” “our,” the “Company,” “AAIC,” and “Arlington Asset” refer to Arlington Asset Investment Corp. and its consolidated subsidiaries.
Our Company
Arlington Asset Investment Corp. is a principal investment firm that acquires mortgage-related and other assets. We acquire, on a leveraged basis, residential mortgage-backed securities (MBS), either issued by a U.S. Government agency, or guaranteed as to principal and interest by U.S. Government agencies or U.S. Government-sponsored entities (agency-backed MBS). We also acquire MBS issued by private organizations (private-label MBS), subject to maintaining our exemption from regulation as an investment company under the Investment Company Act of 1940, as amended (1940 Act).
We are a Virginia corporation and taxed as a C corporation for U.S. federal tax purposes. We are subject to corporate income tax on our taxable income and gains that are not offset by our NOL and NCL carry-forwards. At December 31, 2010, we had $306.8 million of NOL carry-forwards and $566.7 million of NCL carry-forwards. Our NCL carry-forwards and NOL carry-forwards will begin to expire in 2011 and 2027, respectively. Even though we are able to use NOL and NCL carry-forwards against our taxable income and capital gains, we still have some tax liability that is attributable to federal alternative minimum tax and various state and local taxes.
We revoked our status as a real estate investment trust (REIT) effective as of January 1, 2009. Revoking our REIT status freed us from having to satisfy the income, asset, distribution, and stock ownership requirements applicable to REITs, which provides us with more flexibility in executing our business strategy. Specifically, because we are no longer required to derive a significant portion of our income from mortgage or other real estate related acquisitions, we have greater flexibility to acquire other types of assets as part of our principal acquisition activity, subject to maintaining compliance with our exclusion from regulation as an investment company under the 1940 Act. In addition, because we are no longer subject to the REIT distribution requirement, we have greater flexibility to retain our earnings to fund future growth.
Our principal executive offices are located at Potomac Tower, 1001 Nineteenth Street North, Arlington, Virginia, 22209.
Recent Developments
Shelf Registration Statement
On January 4, 2011, we filed a shelf registration statement on Form S-3 (File No. 333-171537) with the Securities and Exchange Commission (SEC). The shelf registration statement was declared effective on January 20, 2011. Pursuant to the shelf registration statement, we may issue and publicly distribute various types of securities, including Class A common stock, preferred stock, debt securities, warrants and units, or any combination of such securities, from time to time, in one or more offerings, up to an aggregate amount of $500.0 million. We filed the shelf registration statement to gain additional flexibility in accessing capital markets for, among other things, the acquisition of MBS and other assets, the repayment of outstanding indebtedness, the pursuit of growth initiatives that may include acquisitions, working capital, and for liquidity needs. There is no assurance, however, that we will be able to access the capital markets on favorable terms or at all.
Our MBS Portfolio
We manage our portfolio of mortgage holdings with the goal of obtaining a high risk-adjusted return on capital. During 2010, our principal investing strategy has been to acquire predominantly adjustable-rate, private-label MBS, focusing on securities with credit enhancement features as further discussed below, and to finance
3
Table of Contents
these acquisitions with available capital, generally on a non-leveraged basis. Although the coupon on adjustable-rate MBS will change over time, there are aspects of the security that result in the coupon being fixed for a period of time or the change in the coupon being limited. We will seek to maintain a certain level of whole-pool agency-backed MBS, due to our review of the long-term attractiveness of the asset class and for purposes of our exemption under the 1940 Act.
As of December 31, 2010, the majority of our principal acquisitions activity consists of acquiring and holding agency-backed MBS, on a leveraged basis, and private-label MBS, generally on a non-leveraged basis. We evaluate the rates of return that can be achieved in each asset class and for each individual security within an asset class in which we participate. We then evaluate opportunities against the returns available in each of our investment alternatives and attempt to allocate our assets and capital with an emphasis toward what we believe to be the highest risk-adjusted return available. We expect this strategy will cause us to have different allocations of capital and leverage in different environments.
We may change our acquisition strategy, hedging strategy, asset allocation and operational policies at any time without the consent of our shareholders, which could result in our making investments or hedges that are different from, and possibly riskier than, the investments and hedges described in this Annual Report on Form 10-K. A change in our investment or hedging strategy may increase our exposure to interest rate and real estate market fluctuations. Our Board of Directors oversees our operational policies, including those with respect to our acquisitions, growth, operations, indebtedness, capitalization and variable distributions, or approves transactions that deviate from these policies, without a vote of, or notice to, our shareholders. Operational policy changes could adversely affect the market value of our common stock and our ability to make distributions to our shareholders.
Liquidity, or ready access to funds, is essential to our business. Failures of similar businesses have often been attributable in large part to insufficient liquidity. Liquidity is of particular importance to our business and perceived liquidity issues may affect our clients’ and counterparties’ willingness to engage in transactions with us. Our liquidity could be impaired due to circumstances that we may be unable to control, such as a general market disruption or an operational problem that affects us or third parties. Further, our ability to sell assets may be impaired if other market participants are seeking to sell similar assets at the same time or the market is experiencing significant volatility. If we cannot obtain funding from third parties or from our subsidiaries, our results of operations could be negatively impacted.
As of December 31, 2010, the fair value of our MBS portfolio was $427.0 million. The yield on our MBS for the year ended December 31, 2010 was 11.94%, including 18.42% on private-label MBS, with a corresponding cost of funds of 0.37%. The yield on our MBS is calculated based upon the adjusted par value which includes the effects of any other-than-temporary impairments recorded by us as well as an adjustment for any principal and interest for which collection is not probable. The yield based on unadjusted par value was 10.69% for the year ended December 31, 2010.
The following table summarizes our principal investing portfolio including principal receivable on MBS, as of December 31, 2010 (dollars in thousands):
| Face Amount | Fair Value | |||||||
| Trading |
||||||||
| Agency-backed MBS |
||||||||
| Fannie Mae |
$ | 167,614 | $ | 174,055 | ||||
| Available-for-sale |
||||||||
| Agency-backed MBS |
||||||||
| Fannie Mae |
163 | 174 | ||||||
| Private-label MBS |
||||||||
| Senior securities |
63,973 | 51,038 | ||||||
| Re-REMIC securities |
321,873 | 201,697 | ||||||
| Other mortgage related assets |
181,135 | 6,327 | ||||||
| Total |
$ | 734,758 | $ | 433,291 | ||||
4
Table of Contents
Agency-Backed MBS
We acquire direct interests in residential MBS guaranteed as to principal and interest by Fannie Mae or Freddie Mac (referred to as agency-backed MBS). The market value of these securities, however, is not guaranteed by these companies. The following is a description of the agency-backed MBS we may acquire:
| • | Fannie Mae MBS. The Federal National Mortgage Association, better known as “Fannie Mae,” is a privately-owned, federally-chartered corporation organized and existing under the Federal National Mortgage Association Charter Act. Fannie Mae provides funds to the mortgage market primarily by purchasing home mortgage loans from local lenders, thereby replenishing their funds for additional lending. Fannie Mae guarantees to registered holders of Fannie Mae certificates that it will distribute amounts representing scheduled principal and interest (at the rate provided by the Fannie Mae certificate) on the mortgage loans in the pool underlying the Fannie Mae certificate, whether or not received, and the full principal amount of any mortgage loan foreclosed or otherwise finally liquidated, whether or not the principal amount is actually received by Fannie Mae. |
| • | Freddie Mac MBS. The Federal Home Loan Mortgage Corporation, better known as “Freddie Mac,” is a privately-owned government-sponsored enterprise created pursuant to Title III of the Emergency Home Finance Act of 1970. Freddie Mac’s principal activities currently consist of the purchase of mortgage loans or participation interests in mortgage loans and the resale of the loans and participations in the form of guaranteed MBS. Freddie Mac guarantees to holders of Freddie Mac certificates the timely payment of interest at the applicable pass-through rate and ultimate collection of all principal on the holder’s pro rata share of the unpaid principal balance of the underlying mortgage loans, but does not guarantee the timely payment of scheduled principal on the underlying mortgage loans. |
On September 6, 2008, the Federal Housing Finance Agency (FHFA), placed Fannie Mae and Freddie Mac into conservatorship and appointed FHFA as the conservator. As the conservator of Fannie Mae and Freddie Mac, the FHFA now controls and directs the operations of Fannie Mae and Freddie Mac and may (i) take over the assets of and operate Fannie Mae and Freddie Mac with all the powers of the shareholders, the directors, and the officers of Fannie Mae and Freddie Mac and conduct all business of Fannie Mae and Freddie Mac; (ii) collect all obligations and money due to Fannie Mae and Freddie Mac; (iii) perform all functions of Fannie Mae and Freddie Mac which are consistent with the conservator’s appointment; (iv) preserve and conserve the assets and property of Fannie Mae and Freddie Mac; and (v) contract for assistance in fulfilling any function, activity, action or duty of the conservator. In the event the conservator were to repudiate the guarantee obligations of Fannie Mae and Freddie Mac, the ability of holders of Fannie Mae and Freddie Mac certificates to enforce the guarantee obligations would be limited to actual direct compensatory damages. The rights of holders of Fannie Mae and Freddie Mac certificates to bring proceedings against the U.S. Treasury are limited if Fannie Mae and Freddie Mac fail to pay under their respective guarantees. The obligations of Fannie Mae and Freddie Mac under their respective guarantees are solely those of Fannie Mae and Freddie Mac and are not backed by the full faith and credit of the United States. If Fannie Mae and Freddie Mac were unable to satisfy their obligations, distributions to holders of Fannie Mae and Freddie Mac certificates would consist solely of payments and other recoveries on the underlying mortgage loans and, accordingly, defaults and delinquencies on the underlying mortgage loans would adversely affect monthly distributions to holders of these certificates.
The securities issued by Fannie Mae and Freddie Mac are not rated by any rating agency; however, they are commonly thought of as having an implied rating of “AAA.” There is no assurance, however, that these securities would receive such a rating if they were ever rated by a rating agency.
Private-Label MBS
We also acquire and hold non-agency private-label MBS. Private-label MBS are MBS that are not issued by a U.S. Government agency or a U.S. Government-sponsored entity, such as Fannie Mae or Freddie Mac, and that are generally backed by a pool of single-family residential mortgage loans. These certificates are issued by
5
Table of Contents
originators of, investors in, and other owners of residential mortgage loans, including savings and loan associations, savings banks, commercial banks, mortgage banks, investment banks and special purpose “conduit” subsidiaries of these institutions. While agency-backed MBS are backed by the express obligation or guarantee of Fannie Mae or Freddie Mae as described above, private-label MBS are generally supported by one or more forms of private (i.e., non-governmental) credit enhancement. These credit enhancements provide an extra layer of loss coverage in the event that losses are incurred upon foreclosure sales or other liquidations of underlying mortgaged properties in amounts that exceed the equity holder’s equity interest in the property. Forms of credit enhancement include limited issuer guarantees, reserve funds, private mortgage guaranty pool insurance, overcollateralization and subordination. We may purchase private-label MBS without private credit enhancement. Subordination is a form of credit enhancement frequently used and involves the issuance of classes of senior and subordinated MBS to allocate losses on the underlying mortgage loans. Typically, one or more classes of senior MBS were created, which were generally initially rated in one of the two highest rating levels by one or more nationally recognized rating agencies. However, these MBS are generally rated below investment grade or unrated. The following is a description of the various private-label MBS we may acquire:
| • | Residential Prime Senior MBS. Residential prime securities are MBS backed by prime residential mortgage loans. We believe prime residential mortgage loans are generally high credit-quality loans, and generally have balances greater than conforming loan limits. Prime securities are typically backed by loans that have relatively high weighted average FICO scores (700 or higher), low weighted average loan-to-value ratios (75% or less), limited concentrations of investor properties, and a low percentages of loans with low FICO scores or high loan-to-value ratios. Senior securities are those interests in a securitization that have the first right to cash flows and are last in line to absorb losses, therefore have the least credit risk in a securitization transaction. To further reduce credit risk, most, if not all, principal collected from the underlying asset pool is used to pay down the senior securities until certain performance tests are satisfied. If certain performance tests are satisfied, principal payments are allocated, generally on a pro rata basis, between the senior securities and the subordinated securities. |
| • | Residential Non-Prime Senior MBS. Residential non-prime securities are MBS backed by non-prime residential mortgage loans. Non-prime residential loans include Alt-A loans, which generally have higher credit quality than subprime and lower credit quality than prime loans. Alt-A loans originally represented loans with alternative documentation, but the definition has shifted over time to include loans with additional risk characteristics and a higher percentage of investor loans. In an Alt-A loan, the borrower’s income may not be verified, and in some cases, may not be disclosed on the loan application. Alt-A loans may also have expanded criteria that allow for higher debt-to-income ratios with higher accompanying loan-to-value ratios than would otherwise be permissible for prime loans. Residential non-prime senior securities are those interests in a securitization that have the first right to cash flows and are last in line to absorb losses. Delinquencies are expected to be higher than the prime senior MBS; however, the levels of credit and structural support are also higher and, as a result, the non-prime senior MBS is expected to better withstand the higher levels of credit losses than subordinate securities of the same securitization. Credit support is the face amount of securities subordinate to the applicable security that protects the security from credit losses and is generally expressed as a percentage of the securitization’s underlying pool balance. |
| • | Residential Subordinate MBS. Subordinate securities are the interests in a securitization that are not senior interests. The most subordinate securities are those interests in a securitization that have the last right to cash flows and are first in line to absorb losses. Subordinate securities absorb the initial credit losses from a securitization structure, thus protecting the senior securities. Subordinate securities have a lower priority to receive principal and interest payments than the senior securities. Subordinate securities receive few, if any, principal payments until certain performance tests are satisfied. If certain performance tests are satisfied, principal payments are shared between the senior securities and the subordinated securities. Subordinate securities generally receive interest payments even if they do not receive principal payments. Residential subordinate securities can be backed by prime and non-prime residential loans. |
6
Table of Contents
| • | Residential Re-REMIC Support MBS. A re-REMIC MBS is a re-securitization of MBS. Depending on the structure of the re-REMIC MBS, the cash flows from, and any credit losses absorbed by, the underlying MBS are allocated among the re-REMIC MBS issued in the re-securitization transaction in a variety of ways. For instance, when one or more prime residential senior securities are pooled and securitized to create a two-tranche structure with a re-REMIC senior security and a re-REMIC support security, all principal payments from the underlying senior securities are directed to the re-REMIC senior security until its face value is zero. Thereafter, all principal payments are directed to the re-REMIC support security. Credit losses, if any, are first absorbed by the re-REMIC support security; however, these credit losses occur only when credit losses exceed the credit protection provided to the underlying senior securities by the subordinate securities within their respective securitization structures. Both the re-REMIC senior security and the re-REMIC support security generally receive interest while any face value is outstanding. |
MBS differ from other forms of traditional fixed-income securities which normally provide for periodic payments of interest in fixed amounts with principal payments at maturity. Instead, MBS provide for a monthly payment that consists of both interest and principal. In effect, these payments are a “pass-through” of the monthly interest and principal payments made by borrowers on their mortgage loans, net of any fees paid to the servicer or guarantor of the MBS securities. In addition, outstanding principal on the MBS may be prepaid at any time due to prepayments on the underlying mortgage loans. These differences can result in significantly greater price and yield volatility than is the case with more traditional fixed-income securities. Whole mortgage loans and other mortgage assets share many of the characteristics of MBS.
Use of Leverage
Because of the credit and interest rate risks inherent in our strategy, we closely monitor the leverage (debt-to-equity ratio) of our MBS portfolio. However, from time to time, the leverage may increase or decrease due to several factors, including changes in the value of the underlying portfolio holdings and the timing and amount of acquisitions.
We may reduce the amount of equity capital we have invested in agency-backed MBS or other mortgage assets, by funding a portion of those acquisitions with repurchase agreements, commercial paper, to the extent commercial paper is available on favorable terms or at all, or other borrowing arrangements. To the extent that revenue derived from those assets exceeds our interest expense and other costs of the financing, our net income will be greater than if we had not borrowed funds and had not invested in the assets. Conversely, if the revenue from our MBS and other mortgage assets does not sufficiently cover the interest expense and other costs of the financing, our net income will be less or our net loss will be greater than if we had not borrowed funds.
We believe the current financial environment is driven by exceptional monetary easing. Funding through repurchase agreements remains available to us at attractive rates from multiple counterparties.
Hedging and Interest Rate Risk Management Strategy
We follow an interest rate risk management program intended to protect our MBS portfolio against the effects of major interest rate changes. Generally, our interest rate risk management program is formulated with the intent to mitigate the potential adverse effects resulting from differences in the amount and timing of rate adjustment to our assets versus those affecting our corresponding liability. Our agency-backed MBS hedging strategy includes an element of reliance on coupon repricing of assets in addition to hedging our liability cost.
Additionally, our interest rate risk management program may encompass from time to time a number of procedures including structuring some borrowings to have interest rate adjustment indices and interest rate adjustment periods that, on an aggregate basis, generally correspond to the interest rate adjustment indices and interest rate adjustment periods of our adjustable-rate MBS and other mortgage assets.
7
Table of Contents
We adjust the average maturity adjustment periods of our borrowings on an ongoing basis by changing the mix of maturities and interest rate adjustment periods as borrowings come due and are renewed. Through use of these procedures, we attempt to minimize the differences between the interest rate adjustment periods of our MBS and other mortgage assets and related borrowings that may occur.
Historically, we have from time-to-time purchased interest rate swaps, interest rate collars, interest rate caps or floors, forward sales, and similar financial instruments to attempt to mitigate the risk of the cost of our variable rate liabilities increasing at a faster rate than the yield on our assets during a period of rising interest rates or to mitigate prepayment risk. It is not our policy to use derivatives to speculate on interest rates. These derivative instruments had an active secondary market and were intended to provide income and cash flow to offset potential reduced interest income and cash flow under certain interest rate environments. Certain of our interest rate management activities qualified for hedge accounting in accordance with accounting principles related to accounting for derivative instruments and hedging activities. We reported the derivative financial instruments and any related margin accounts on our consolidated balance sheets at their fair value. We may hedge as much of the interest rate risk as our management determines is in our best interests, given the cost of the hedging transactions. This determination may result in our electing to bear a level of interest rate or prepayment risk that could otherwise be hedged when management believes, based on all relevant facts, that the cost of hedging exceeds the level of risk that management believes is present.
We seek to build a balance sheet and undertake an interest rate risk management program that we believe is likely to generate positive earnings and maintain an equity liquidation value sufficient to maintain operations given a variety of potential environments. Our interest rate risk management strategies also provide support for our leverage strategies. In determining our target leverage, we monitor, among other things, our “duration.” This is the expected percentage change in market value of our assets that would be caused by a 1% change in short and long-term interest rates. To monitor duration and the related risks of fluctuations in the liquidation value of our equity, we model the impact of various economic scenarios on the market value of our MBS and other mortgage assets and liabilities. See additional discussion of interest rate risk relative to our leveraged portfolio of MBS and other mortgage assets included in “Quantitative and Qualitative Disclosures about Market Risk” in Part II, Item 7A, of this Annual Report on Form 10-K. We believe that our interest rate risk management program will allow us to maintain operations throughout a wide variety of potentially adverse circumstances. Nevertheless, in order to further preserve our capital base during periods when we believe a trend of rapidly rising interest rates has been established, we may decide to enter into or increase hedging activities or to sell assets. Each of these actions may lower our earnings and dividends in the short term to further our objective of maintaining attractive levels of earnings and dividends over the long term. There is no assurance, however, that any of these strategies will be successful.
We believe that we maintain a cost-effective asset/liability management program to provide a level of protection against interest rate and prepayment risks. However, no strategy can completely insulate us from interest rate changes and prepayment risks. In addition, asset/liability management involves transaction costs which increase dramatically as the period covered by the hedging protection increases. Therefore, we may be unable to hedge effectively our interest rate and prepayment risks.
Credit Risk Management
Although we do not expect to encounter credit risk in our agency-backed MBS portfolio assuming Fannie Mae and Freddie Mac remain solvent, we are exposed to credit risk in our private-label MBS portfolio. With respect to our private-label MBS, credit support contained in these MBS deal structures provides a level of protection from losses, as do the discounted purchase prices in the event of the return of less than 100% of par. We also evaluate the impact of credit risk on our acquisitions through a comprehensive review and a selection process, which is predominantly focused on quantifying and pricing credit risk. We review our private-label MBS based on quantitative and qualitative analysis of the risk-adjusted returns on such acquisitions. Through modeling and scenario analysis, we seek to evaluate each security’s credit risk. Credit risk is also monitored through our ongoing asset surveillance. Despite these measures to manage credit risk, unanticipated credit losses could nevertheless occur which could adversely impact our operating results.
8
Table of Contents
Accounting, Administration and Operations
Our accounting, administration and operations personnel are responsible for financial controls, internal and external financial reporting, human resources and personnel services, office operations, information technology and telecommunications systems, the processing of securities transactions, and corporate communications. With the exception of payroll processing, which is performed by an outside service bureau, most data processing functions are performed internally.
Compliance, Legal, Risk Management and Internal Audit
We are responsible for our compliance procedures with regard to the legal and regulatory requirements of our company and our operating businesses and for our procedures with regard to our exposure to market, credit, operations, liquidity, compliance, legal, reputational and equity ownership risk. In addition, our internal audit personnel (staffed through an external service firm) test and audit for compliance by our personnel with our policies and procedures. Our outside legal counsel also provides legal service to our company, including advice on managing legal risk. The supervisory personnel in these areas have direct access to, and meet regularly with, our executive management and with the Audit Committee of our Board of Directors to ensure their independence in performing these functions. Pursuant to its charter, the Audit Committee has oversight of the staffing, qualifications and performance of our internal audit function. In addition to our internal compliance, and risk management personnel, we outsource certain functions to outside consultants and attorneys for their expertise.
Competition
Our success depends, in large part, on our ability to acquire MBS at favorable spreads over our borrowing costs. In acquiring these assets, we compete with mortgage finance and specialty finance companies, savings and loan associations, banks, mortgage bankers, insurance companies, mutual funds, institutional investors, mortgage REITs, investment banking firms, other lenders, governmental bodies and other entities. In addition, there are numerous entities with similar asset acquisition objectives and others may be organized in the future. The effect of the existence of additional entities may be to increase competition for the available supply of agency-backed MBS, including collateralized mortgage obligations (CMOs), private-label MBS and other mortgage-related assets suitable for purchase by us. Moreover, our success depends on our ability to acquire MBS issued by Fannie Mae or Freddie Mac, and we cannot predict what role Fannie Mae and Freddie Mac will play in the future housing market. The U.S. Treasury has signaled that it will announce plans for the future of Fannie Mae and Freddie Mac in late February 2011. The future roles of Fannie Mae and Freddie Mac could be significantly reduced and the nature of their guarantees could be considerably limited relative to historical measurements. Any changes to the nature of the guarantees provided by Fannie Mae and Freddie Mac could redefine what constitutes an agency security and could have broad adverse market implications and significant implications for our own business.
In addition, competition is also intense for the recruitment and retention of qualified professionals. Our ability to continue to compete effectively in our businesses will depend upon our continued ability to attract new professionals and retain and motivate our existing professionals. For a further discussion of the competitive factors affecting our business, see “Risk Factors” in Part I, Item 1A, of this Annual Report on Form 10-K.
Risk Management
In conducting our business, we are exposed to a range of risks including, without limitation:
| • | Market risk. Market risk is the risk to our earnings or capital resulting from adverse changes in the values of assets resulting from movement in market interest rates, equity prices, as well as market expectations concerning the underlying assets. |
| • | Credit risk. Credit risk is the risk of loss due to a borrower’s or institutional counterparty’s unwillingness or inability to pay its obligations. |
9
Table of Contents
| • | Operations risk. Operations risk is the risk of loss resulting from systems failure, inadequate controls, human error, fraud or unforeseen catastrophes. |
| • | Liquidity risk. Liquidity risk is the risk that we may be unable to meet our obligations as they come due because of our inability to liquidate assets or obtain funding. Liquidity risk also includes the risk of having to sell assets at a loss to generate liquid funds. |
| • | Regulatory risk. Regulatory risk is the risk of loss, including fines, penalties or restrictions in our activities from failing to comply with current or future federal, state or local laws, rules and regulations pertaining to financial services activities, including the loss of our exclusion from regulation as an investment company under the 1940 Act. |
| • | Legal risk. Legal risk is the risk of loss, disruption or other negative effect on our operations or condition that arises from unenforceable contracts, lawsuits, adverse judgments, or adverse governmental or regulatory proceedings, or the threat thereof. |
| • | Reputational risk. Reputational risk is the risk that negative publicity regarding our practices, whether true or not, will cause a decline in the customer base, resulting in costly litigation, or reduce our revenues. |
| • | Equity ownership risk. Equity ownership risk arises from making equity investments that create an ownership interest in portfolio companies, and is a combination of credit, market, operational, liquidity, compliance and reputation risks. |
Our risk management program is designed to focus on the following:
| • | identifying, assessing and reporting on risk exposures and trends; |
| • | establishing and revising as necessary policies, procedures and risk limits; |
| • | monitoring and reporting on adherence with risk policies and limits; |
| • | developing and applying new measurement methods to the risk process as appropriate; and |
| • | approving new business initiatives. |
Although we believe that our risk management program and our internal controls are appropriately designed to address the risks to which we are exposed, we cannot provide assurance that our risk management program or our internal controls will prevent or reduce such risks.
Our Tax Status
We are subject to corporate income tax on our taxable income and gains that are not offset by our NOL and NCL carry-forwards. At December 31, 2010, we had $306.8 million of NOL carry-forwards and $566.7 million of NCL carry-forwards. Our NCL carry-forwards and NOL carry-forwards will begin to expire in 2011 and 2027, respectively (see Note 7 to our consolidated financial statements). Even though we are able to use NOL and NCL carry-forwards against our taxable income and capital gains, we still have some tax liability that is attributable to federal alternative minimum tax and various state and local taxes.
Our ability to use our NOL and NCL carry-forwards to offset future taxable income would be severely limited if we experienced an “ownership change” under Sections 382 and 383 of the Internal Revenue Code of 1986, as amended (the Code). We adopted our shareholder rights plan (the Rights Plan) on June 1, 2009 in an effort to protect against the occurrence of an “ownership change.” The Rights Plan is intended to act as a deterrent to any person or group acquiring 4.9% or more of our outstanding Class A common stock (an Acquiring Person) without the approval of our Board of Directors. Our Rights Plan, however, does not protect against all transactions that could cause an ownership change, such as dispositions by existing 5% shareholders and transactions in our Class B common stock. Accordingly, we may experience an “ownership change” that would severely limit our ability to use our NOL and NCL carry-forwards.
10
Table of Contents
Our Exclusion from Regulation as an Investment Company
We intend to operate so as to be excluded from regulation under the 1940 Act. Historically, we have relied on Section 3(c)(5)(C) of the 1940 Act, which provides an exclusion for entities that are “primarily engaged in purchasing or otherwise acquiring . . . interests in real estate.” In 2008, in response to deteriorating market conditions, we began to decrease our real estate related acquisitions. As a result, we are now a holding company relying on the exclusion provided by Section 3(a)(1)(C) of the 1940 Act, and we conduct our mortgage business through a subsidiary that relies on Section 3(c)(5)(C). Section 3(a)(1)(C) requires that we neither engage nor propose to engage in the business of investing, reinvesting, owning, holding or trading in securities and not own or propose to acquire “investment securities” having a value exceeding 40% of the value of our total assets on an unconsolidated basis. For purposes of the 1940 Act, the term “investment securities” excludes U.S. government securities and securities of majority-owned subsidiaries that are not themselves investment companies and are not relying on the exemption under Section 3(c)(1) or Section 3(c)(7) of the 1940 Act. Accordingly, we need to ensure that no more than 40% of our assets, on an unconsolidated basis, excluding cash and government securities, consist of investment securities, in order to satisfy the 40% test.
We are a holding company that conducts our business through subsidiaries, including a subsidiary that relies on Section 3(c)(5)(C). Section 3(c)(5)(C) provides an exclusion from registration for a company if at least 55% of its assets, on an unconsolidated basis, consist of qualified assets such as whole loans and whole pool agency certificates, and if at least 80% of its assets, on an unconsolidated basis, are real estate related assets. Because this subsidiary is a majority-owned subsidiary and is not relying on Section 3(c)(1) or Section 3(c)(7) for its exemption, our interests in this subsidiary are not investment securities. We will need to ensure not only that we qualify for an exclusion or exemption from regulation under the 1940 Act, but also that each of our subsidiaries qualifies for such an exclusion or exemption. We intend to maintain our exclusion by monitoring the value of our interests in our subsidiaries. We may not be successful in this regard.
If we fail to maintain our exclusion and another exclusion or exemption is not available, we may be required to register as an investment company, or we may be required to acquire or dispose of assets in order to meet our exemption. Any such asset acquisitions or dispositions may include assets that we would not acquire or dispose of in the ordinary course of business, may be at unfavorable prices and result in a decline in the price of our common stock. If we are required to register under the 1940 Act, we would become subject to substantial regulation with respect to our capital structure (including our ability to use leverage), management, operations, transactions with affiliated persons (as defined in the 1940 Act), and portfolio composition, including restrictions with respect to diversification and industry concentration and other matters. Accordingly, registration under the 1940 Act could limit our ability to follow our current investment and financing strategies and result in a decline in the price of our common stock.
Available Information
You may read and copy the definitive proxy materials and any other reports, statements or other information that we file with the SEC at the SEC’s public reference room at 100 F Street, N.E., Washington, DC 20549. You may call the SEC at 1-800-SEC-0330 for further information on the public reference room. Our SEC filings are also available to the public from commercial document retrieval services and at the Internet worldwide web site maintained by the SEC at http://www.sec.gov. These SEC filings may also be inspected at the offices of the New York Stock Exchange (NYSE), which is located at 20 Broad Street, New York, New York 10005.
Our website address is http://www.arlingtonasset.com. We make available free of charge through our website this Annual Report on Form 10-K, quarterly reports on Form 10-Q, current reports on Form 8-K and amendments to those reports filed or furnished pursuant to Section 13(a) or 15(d) of the Exchange Act, as well as the annual report to shareholders and Section 16 reports on Forms 3, 4 and 5 as soon as reasonably practicable after such documents are electronically filed with, or furnished to, the SEC. In addition, our Bylaws, Statement of Business Principles (our code of ethics), Corporate Governance Guidelines, and the charters of our Audit,
11
Table of Contents
Compensation, and Nominating and Governance Committees are available on our website and are available in print, without charge, to any shareholder upon written request in writing c/o our Secretary at 1001 Nineteenth Street North, Arlington, Virginia 22209. Information on our website should not be deemed to be a part of this report or incorporated into any other filings we make with the SEC.
Employees
As of December 31, 2010, we had 10 employees. Our employees are not subject to any collective bargaining agreement and we believe that we have good relations with our employees.
12
Table of Contents
| ITEM 1A. | RISK FACTORS |
Investing in our company involves various risks, including the risk that you might lose your entire investment. Our results of operations depend upon many factors including our ability to implement our business strategy, the availability of opportunities to acquire assets, the level and volatility of interest rates, the cost and availability of short- and long-term credit, financial market conditions, and general economic conditions.
The following discussion concerns the material risks associated with our business. These risks are interrelated, and you should consider them as a whole. Additional risks and uncertainties not presently known to us may also materially and adversely affect the value of our common stock and our ability to pay dividends to our shareholders. In connection with the forward-looking statements that appear in this Annual Report on Form 10-K, including these risk factors and elsewhere, you should carefully review the section entitled “Cautionary Statement About Forward-Looking Information.”
General Risks Related to our Business
In general, changes in market conditions could further adversely and materially affect our business and the value of our common stock could be negatively impacted.
Risk is an inherent part of our business. Our business, by its nature, does not produce predictable earnings, and our business is materially affected by conditions in the global financial markets and economic conditions generally. In recent years, these conditions have changed suddenly and negatively and may continue to change adversely in 2011 and future periods.
In response to the financial issues affecting the banking system and the financial markets, governments, regulators and central banks in the United States and worldwide have taken numerous steps to increase liquidity and to restore investor confidence. In the event of further adverse changes in market conditions, such as changes in interest or foreign exchange rates, equity, fixed income, commodity or real estate valuations, liquidity, availability of credit or volatility, and drops in confidence, our business could be materially adversely affected in many ways.
The voting power of our principal shareholders and other executive officers, directors and nominees may result in corporate action with which you do not agree and may discourage third party acquisitions of our company and prevent our shareholders from receiving any premium above market price for their shares.
Eric F. Billings has significant influence over our operations through his ownership of our common stock, which, as of January 31, 2011, represents approximately 17.7% of the total voting power of our common stock. In addition, Mr. Billings serves as Chairman of our Board of Directors and as our Chief Executive Officer. As of January 31, 2011, Mr. Billings and all of our other executive officers, directors and nominees, as a group, control approximately 21.1% of our total voting power. The extent of the influence that Mr. Billings and our other officers, directors and nominees have over us may have the effect of discouraging offers to acquire control of our company and may preclude holders of our common stock from receiving any premium above market price for their shares that may be offered in connection with any attempt to acquire control of our company without the approval of Mr. Billings. Mr. Billings could have interests that are different than those of our other investors and could take or influence actions with which our other investors disagree.
Our shareholder rights plan could inhibit a change in our control and we may not be successful in protecting our anticipated tax benefits.
On June 1, 2009, our Board of Directors implemented a Rights Plan in an effort to protect against a possible limitation on our ability to use our NOLs, NCLs and built-in losses by dissuading investors from aggregating ownership of our Class A common stock and triggering an “ownership change” for purposes of Sections 382 and 383 of the Code. The Rights Plan may not be successful in preventing an “ownership change” within the meaning of Sections 382 and 383 of the Code, and we may lose all or most of the anticipated tax benefits associated with
13
Table of Contents
our prior losses. Under the terms of the Rights Plan, in general, if a person or group acquires or commences a tender or exchange offer for beneficial ownership of 4.9% or more of the outstanding shares of our Class A common stock upon a determination by our Board of Directors, all of our other Class A and Class B common shareholders will have the right to purchase securities from us at a discount to such securities’ fair market value, thus causing substantial dilution to the Acquiring Person. The Rights Plan may have the effect of inhibiting or impeding a change in control not approved by our Board of Directors and, notwithstanding its purpose, could adversely affect our shareholders’ ability to realize a premium over the then-prevailing market price for our common stock in connection with such a transaction. In addition, since our Board can prevent the Rights Plan from operating, in the event our Board of Directors approves of an Acquiring Person, the Rights Plan gives our Board of Directors significant discretion over whether a potential acquirer’s efforts to acquire a large interest in us will be successful. Consequently, the Rights Plan may not succeed in protecting anticipated tax benefits and could impede transactions that would otherwise benefit our shareholders.
The trading prices of our Class A common stock may be adversely affected by factors outside of our control.
Any negative changes in the public’s perception of the prospects for our business or the types of assets in which we invest could depress our stock price regardless of our results. The following factors could contribute to the volatility of the price of our Class A common stock:
| • | actual or unanticipated variations in our quarterly results; |
| • | changes in our financial estimates by securities analysts; |
| • | conditions or trends affecting companies that make investments similar to ours; |
| • | changes in interest rate environments and the mortgage market that cause our borrowing costs to increase, our reported yields on our MBS portfolio to decrease or that cause the value of our MBS portfolio to decrease; |
| • | changes in the market valuations of the securities in our MBS portfolio and other principal investments; |
| • | negative changes in the public’s perception of the prospects of investment or financial services companies; |
| • | changes in the regulatory environment in which our business operates; |
| • | dilution resulting from new equity issuances or the conversion of Class B common stock into Class A common stock; |
| • | general economic conditions such as a recession, or interest rate or currency rate fluctuations; and |
| • | additions or departures of our key personnel. |
Many of these factors are beyond our control.
We may experience significant fluctuations in quarterly operating results.
Our revenues and operating results may fluctuate from quarter to quarter and from year to year due to a combination of factors which are beyond our control, including the market value of the MBS we acquire, prepayment rates and changes in interest rates. As a result, we may fail to meet profitability or dividend expectations which could negatively affect the market price of our Class A common stock and our ability to pay dividends to our shareholders.
We cannot assure you that we will be able to pay dividends in the future.
Pursuant to our variable dividend policy, our Board of Directors, in its sole discretion, reinstated the payment of a cash dividend during 2010. However, there can be no assurances that they will continue to do so. The amount and timing of any distributions we may make is in the sole discretion of our Board of Directors.
14
Table of Contents
Loss of our exclusion from regulation as an investment company under the 1940 Act would adversely affect us and may reduce the market price of our shares.
We rely on Section 3(a)(1)(C) for our exclusion from the registration requirements of the 1940 Act. This provision requires that we neither engage nor propose to engage in the business of investing, reinvesting, owning, holding or trading in securities and not own or propose to acquire “investment securities” having a value exceeding 40% of the value of our total assets on an unconsolidated basis. For purposes of the 1940 Act, the term “investment securities” excludes U.S. government securities and securities of majority-owned subsidiaries that are not themselves investment companies and are not relying on the exemption under Section 3(c)(1) or Section 3(c)(7) of the 1940 Act. Accordingly, we need to ensure that no more than 40% of our assets, on an unconsolidated basis, excluding cash and government securities, consist of investment securities for purposes of the 40% test.
We are a holding company that conducts our business through subsidiaries, including a subsidiary that relies on Section 3(c)(5)(C). Because this subsidiary is a majority-owned subsidiary and is not relying on Section 3(c)(1) or Section 3(c)(7) for its exemption, our interests in this subsidiary are not investment securities. We will need to ensure not only that we qualify for an exclusion or exemption from regulation under the 1940 Act, but also that each of our subsidiaries qualifies for such an exclusion or exemption. We intend to maintain our exclusion by monitoring the value of our interests in our subsidiaries. We may not be successful in this regard.
If we fail to maintain our exclusion and another exclusion or exemption is not available, we may be required to register as an investment company, or we may be required to acquire or dispose of assets in order to meet our exemption. Any such asset acquisitions or dispositions may include assets that we would not acquire or dispose of in the ordinary course of business, may be at unfavorable prices and result in a decline in the price of our common stock. If we are required to register under the 1940 Act, we would become subject to substantial regulation with respect to our capital structure (including our ability to use leverage), management, operations, transactions with affiliated persons (as defined in the 1940 Act), and portfolio composition, including restrictions with respect to diversification and industry concentration and other matters. Accordingly, registration under the 1940 Act could limit our ability to follow our current investment and financing strategies and result in a decline in the price of our common stock.
We face competition for personnel which could adversely affect our business and in turn negatively affect the market price of our Class A common stock and our ability to pay dividends to our shareholders.
We are dependent on the highly skilled, and often highly specialized, individuals we employ. Retention of specialists to manage our portfolio is particularly important to our prospects. Competition for the recruiting and retention of employees may increase elements of our compensation costs. We may not be able to recruit and hire new employees with our desired qualifications in a timely manner. Our incentives may be insufficient to recruit and retain our employees. Increased compensation costs could adversely affect the amount of cash available for distribution to shareholders and our failure to recruit and retain qualified employees could materially and adversely affect our future operating results.
We are dependent on a small number of key senior professionals and loss of any of these individuals could adversely affect our results which may, in turn, negatively affect the market price of our Class A common stock and our ability to pay dividends.
We generally do not have employment agreements with our senior officers and other key professionals. The loss of any members of our senior management and other key professionals could materially and adversely affect our operating results. We cannot guarantee that we will continue to have access to members of our senior management team or other key professionals.
We are highly dependent on systems and third parties, and systems failures could significantly disrupt our business, which may, in turn, negatively affect the market price of our Class A common stock and our ability to pay dividends.
Our business is highly dependent on communications and information systems, including systems provided by other third parties. Any failure or interruption of our systems or third-party trading or information systems
15
Table of Contents
could cause delays or other problems in our securities trading activities, including MBS trading activities, which could have a material adverse effect on our operating results and negatively affect the market price of our common stock and our ability to pay dividends.
Indemnification agreements with our affiliates may increase the costs to us of litigation against our company.
Our charter documents allow indemnification of our officers, directors and agents to the maximum extent permitted by Virginia law, as may the charter documents of our subsidiaries in their respective jurisdictions of incorporation. We have entered into indemnification agreements with these persons. In the future we may be the subject of indemnification assertions under these charter documents or agreements by our affiliates who are or may become defendants in litigation. Amounts paid pursuant to these indemnification agreements could adversely affect our financial results and the amount of cash available for distribution to shareholders.
Risks Related to our Principal Investing Activities
Continued adverse developments in the residential mortgage market may adversely affect the value of our securities and our ability to borrow against our security assets.
Since mid-2007, the residential mortgage market in the United States has experienced a variety of difficulties and changed economic conditions that may adversely affect the performance and market value of the mortgage securities we acquire. Securities backed by residential mortgage loans originated in 2006 and 2007 have experienced a higher and earlier than expected rate of delinquencies. Additionally, other earlier vintages of MBS may not be performing as expected. Many MBS have been downgraded by the rating agencies in recent years and the rating agencies may in the future downgrade MBS. As a result, the market for these securities may be adversely affected for a significant period of time.
During 2010, housing prices and appraisal values in many states continued to decline. A continued decline or an extended flattening of those values may result in additional increases in delinquencies and losses on residential mortgage loans generally, particularly with respect to second homes and investor properties and with respect to any residential mortgage loans whose aggregate loan amounts (including any subordinate liens) are close to or greater than the related property values.
Current market conditions may impair borrowers’ ability to refinance or sell their properties, which may contribute to higher delinquency and default rates. Borrowers seeking to avoid increased monthly payments by refinancing may no longer be able to find available replacement loans at comparably low interest rates. A continued decline in housing prices may also leave borrowers with insufficient equity in their homes to permit them to refinance. Borrowers who intended to sell their homes or refinance their existing mortgage loans on or before the expiration of the fixed rate periods on their mortgage loans may find that they cannot sell their property for an amount equal to or greater than the unpaid principal balance of their loans or obtain new financing at lower rates. In addition, some mortgage loans may include prepayment premiums that may further inhibit refinancing.
Servicers of residential mortgage loans also have the authority to modify mortgage loans that are in default, or for which default is reasonably foreseeable, if such modifications are in the best interests of the holders of the mortgage securities and such modifications are done in accordance with the terms of the relevant agreements. Loan modifications are more likely to be used when borrowers are less able to refinance or sell their homes due to market conditions, and when the potential recovery from a foreclosure is reduced due to lower property values. A significant number of loan modifications could result in a significant reduction in cash flows to the holders of the mortgage securities on an ongoing basis.
Various federal, state and local regulatory authorities have taken or proposed actions that could hinder the ability of the servicer to foreclose promptly on defaulted mortgage loans. Any such actions may adversely affect the performance of the loans and the yield on and value of the mortgage securities.
16
Table of Contents
Investors should consider that the general market conditions discussed above may adversely affect the market value of the securities in our MBS portfolio and make it difficult or more expensive for us to borrow against those securities.
The conservatorship of Fannie Mae and Freddie Mac and related efforts, along with any changes in laws and regulations affecting the relationship between Fannie Mae and Freddie Mac and the federal government, may adversely affect our business.
Due to increased market concerns about Fannie Mae and Freddie Mac’s ability to withstand future credit losses associated with securities held in their investment portfolios, and on which they provide guarantees, without the direct support of the federal government, on July 30, 2008, the government passed the Housing and Economic Recovery Act of 2008 (HERA). On September 6, 2008, the FHFA placed Fannie Mae and Freddie Mac into conservatorship and, together with the U.S. Treasury, established a program designed to boost investor confidence in Fannie Mae’s and Freddie Mac’s debt and mortgage-backed securities. As the conservator of Fannie Mae and Freddie Mac, the FHFA controls and directs the operations of Fannie Mae and Freddie Mac and may (1) take over the assets of and operate Fannie Mae and Freddie Mac with all the powers of the shareholders, the directors and the officers of Fannie Mae and Freddie Mac and conduct all business of Fannie Mae and Freddie Mac; (2) collect all obligations and money due to Fannie Mae and Freddie Mac; (3) perform all functions of Fannie Mae and Freddie Mac which are consistent with the conservator’s appointment; (4) preserve and conserve the assets and property of Fannie Mae and Freddie Mac; and (5) contract for assistance in fulfilling any function, activity, action or duty of the conservator. A primary focus of this legislation is to increase the availability of mortgage financing by allowing Fannie Mae and Freddie Mac to continue to grow their guarantee business without limit, while limiting net purchases of agency-backed MBS. Beginning in 2010, Fannie Mae and Freddie Mac have been required gradually to reduce their agency security portfolios.
In addition to FHFA becoming the conservator of Fannie Mae and Freddie Mac, the U.S. Treasury, took three additional actions, including the establishment of preferred stock purchase agreements between the U.S. Treasury and Fannie Mae and Freddie Mac pursuant to which the U.S. Treasury will ensure that each of Fannie Mae and Freddie Mac maintains a positive net worth in any calendar quarter through 2012. Although the U.S. Treasury has committed capital to Fannie Mae and Freddie Mac, there can be no assurance that these actions will be adequate for their needs. If these actions are inadequate, Fannie Mae and Freddie Mac could continue to suffer losses and could fail to honor their guarantees and other obligations.
On July 21, 2010, President Obama signed into law financial regulatory reform legislation known as the Dodd-Frank Wall Street Reform and Consumer Protection Act (the Dodd-Frank Act). The Dodd-Frank Act will significantly change the regulation of the financial services industry, including by its creation of new standards related to regulatory oversight of systemically important financial companies, derivatives transactions, asset-backed securitization, mortgage underwriting and consumer financial protection. The Dodd-Frank Act will directly affect Fannie Mae’s and Freddie Mac’s business in that new and additional regulatory oversight and standards will apply to them. Extensive regulatory guidance is needed to implement and clarify many of the provisions of the Dodd-Frank Act, and agencies have just begun to initiate the required administrative processes. It is therefore difficult to assess fully the impact of this legislation on Fannie Mae and Freddie Mac and, in turn, on us and the rest of the mortgage industry, at this time.
The U.S. Treasury has signaled that it will announce plans for the future of Fannie Mae and Freddie Mac in late February 2011. We cannot predict what role Fannie Mae and Freddie Mac will play in the future housing market. The future roles of Fannie Mae and Freddie Mac could be significantly reduced and the nature of their guarantees could be considerably limited relative to historical measurements. Any changes to the nature of the guarantees provided by Fannie Mae and Freddie Mac could redefine what constitutes an agency security and could have broad adverse market implications and significant implications for our own business.
Our income could be negatively affected in a number of ways depending on the manner in which related events unfold. For example, the current credit support provided by the U.S. Treasury to Fannie Mae and
17
Table of Contents
Freddie Mac, and any additional credit support it may provide in the future, could have the effect of lowering the interest rate we expect to receive from agency-backed MBS that we seek to acquire, thereby tightening the spread between the interest we earn on our portfolio of targeted assets and our cost of financing that portfolio. A reduction in the supply of agency-backed MBS could also negatively affect the pricing of agency-backed MBS we seek to acquire by reducing the spread between the interest we earn on our portfolio of targeted assets and our cost of financing that portfolio.
As indicated above, recent legislation has changed the relationship between Fannie Mae and Freddie Mac and the federal government and requires Fannie Mae and Freddie Mac to reduce the amount of mortgage loans they own or for which they provide guarantees on agency-backed MBS. Future legislation could further change the relationship between Fannie Mae and Freddie Mac and the federal government, and could also nationalize or eliminate such entities entirely. Any law affecting these government-sponsored entities (GSEs) may create market uncertainty and have the effect of reducing the actual or perceived credit quality of securities issued or guaranteed by Fannie Mae or Freddie Mac. As a result, such laws could increase the risk of loss on investments in Fannie Mae and/or Freddie Mac agency securities. It also is possible that such laws could adversely impact the market for such securities and spreads at which they trade. All of the foregoing could materially adversely affect our business, operations and financial condition.
To the extent that we invest in agency-backed MBS that are guaranteed by Fannie Mae and Freddie Mac, we are subject to the risk that these GSEs may not be able to fully satisfy their guarantee obligations or that these guarantee obligations may be repudiated, which would adversely affect the value of our investment portfolio and our ability to sell or finance these securities.
The interest and principal payments we receive on the agency-backed MBS that we acquire are guaranteed by Fannie Mae or Freddie Mac. The principal and interest on securities issued by Fannie Mae and Freddie Mac are not guaranteed by the U.S. government. All the agency-backed MBS in which we invest depend on a steady stream of payments on the mortgages underlying the securities. To the extent these GSEs are not able to fully satisfy their guarantee obligations or that these guarantee obligations are repudiated, the value of our investment portfolio and our ability to sell or finance these securities would be adversely affected.
Market conditions may upset the historical relationship between interest rate changes and prepayment trends, which would make it more difficult for us to analyze our investment portfolio.
Our success depends on our ability to analyze the relationship of changing interest rates on prepayments of the mortgage loans that underlie our MBS. Changes in interest rates and prepayments affect the market price of MBS that we intend to purchase and any MBS that we hold at a given time. As part of our overall portfolio risk management, we analyze interest rate changes and prepayment trends separately and collectively to assess their effects on our investment portfolio. In conducting our analysis, we depend on certain assumptions based upon historical trends with respect to the relationship between interest rates and prepayments under normal market conditions. If the dislocations in the residential mortgage market or other developments change the way that prepayment trends have historically responded to interest rate changes, our ability to (i) assess the market value of our investment portfolio, (ii) implement our hedging strategies and (iii) implement techniques to reduce our prepayment rate volatility would be significantly affected, which could materially adversely affect our financial position and results of operations. We may be unable to accurately forecast interest and prepayment rates.
Mortgage loan modification programs, future legislative action and changes in the requirements necessary to qualify for refinancing a mortgage with Fannie Mae, Freddie Mac or Ginnie Mae may adversely affect the value of, and the returns on, the MBS in which we invest.
The U.S. government, through the Federal Housing Administration (FHA) and the Federal Deposit Insurance Corporation (FDIC), commenced implementation of programs designed to provide homeowners with assistance in avoiding residential mortgage loan foreclosures, including the Hope for Homeowners Act of 2008,
18
Table of Contents
which allows certain distressed borrowers to refinance their mortgages into FHA-insured loans. In addition, Fannie Mae and Freddie Mac instituted programs designed to assist distressed homeowners to avoid foreclosure. These programs may involve, among other things, the modification of mortgage loans to reduce the principal amount of the loans or the rate of interest payable on the loans, or to extend the payment terms of the loans. These loan modification programs, future legislative or regulatory actions, including amendments to the bankruptcy laws, that result in the modification of outstanding mortgage loans, as well as changes in the requirements necessary to qualify for refinancing a mortgage with Fannie Mae, Freddie Mac or Ginnie Mae may adversely affect the value of, and the returns on, our MBS. Depending on whether or not the bond was purchased at a premium or discount, the yield may be positively or negatively impacted.
We may be required to repurchase mortgage loans that we previously sold or securitized or indemnify investors and other third parties if the loans that we sold do not comply with certain representations and warranties, which could harm our earnings and have a material adverse effect on our liquidity and financial condition.
Through early 2007, we sold loans in connection with securitization transactions. As a standard practice, we were required to make customary representations and warranties about the loans to the securitization trusts regarding, among other things, certain characteristics of those assets. The securitization documents generally require us to repurchase a loan in the event that the loan is materially out of compliance with these representations and warranties and such failure causes a loss to the related securitization trust. If a securitization trust enforces a loan repurchase right against us, we may have a corresponding remedy against the party that originally sold the loan to us. However, because the parties that sold loans to us often are no longer in business, the burden of any such loan repurchase obligation generally may fall on us. Significant repurchase claims and obligations could harm our business, financial condition, liquidity, results of operations and our ability to make distributions to our shareholders.
Declines in the market values of the securities in our MBS portfolio may adversely affect periodic reported results and credit availability, which may reduce earnings and, in turn, cash available for distribution to our shareholders.
A substantial portion of our assets are classified for accounting purposes either as “trading securities” or as “available-for-sale.” Changes in the market values of those assets will be directly charged or credited to shareholders’ equity. As a result, a decline in value may reduce the book value of our assets. Moreover, if the decline in value of an available-for-sale security is other-than-temporary, such decline will reduce earnings, as will a decline in the value of our securities classified as trading securities for accounting purposes.
A decline in the market value of the securities in our MBS portfolio may adversely affect us particularly in instances where we have borrowed money based on the market value of those assets. If the market value of those assets declines, the lender may require us to post additional collateral to support the loan. If we were unable to post the additional collateral, we would have to sell the assets at a time when we might not otherwise choose to do so. A reduction in credit available may reduce our earnings and, in turn, cash available for distribution to shareholders.
Our mortgage investing strategy involves leverage, which could adversely affect our operations and negatively affect cash available for distribution to our shareholders.
Using debt to finance the purchase of MBS will expose us to the risk that margin calls will be made and that we will not be able to meet those margin calls. To meet margin calls, we may sell the applicable mortgage-related securities and such sales could result in realized losses, and negatively affect cash available for distribution to our shareholders. A leveraged company’s income and net assets will tend to increase or decrease at a greater rate than if borrowed money were not used.
19
Table of Contents
Changes in interest rates could negatively affect the value of our MBS, which could result in reduced earnings or losses and negatively affect the cash available for distribution to our shareholders.
We acquire indirect interests in mortgage loans by purchasing MBS and we currently intend to continue this strategy. Under a normal yield curve, an investment in MBS will decline in value if long-term interest rates increase. Despite Fannie Mae or Freddie Mac guarantees of the agency-backed MBS we own, those guarantees do not protect us from declines in market value caused by changes in interest rates. Declines in market value may ultimately reduce earnings or result in losses to us, which may negatively affect cash available for distribution to our shareholders.
A significant risk associated with our portfolio of mortgage-related assets is the risk that both long-term and short-term interest rates will increase significantly. If long-term rates were to increase significantly, the market value of these MBS would decline and the weighted average life of the investments would increase. We could realize a loss in the future if the MBS were sold. At the same time, an increase in short-term interest rates would increase the amount of interest owed on the repurchase agreements we enter into in order to finance the purchase of MBS. Market values of MBS may decline without any general increase in interest rates for a number of reasons, such as increases in defaults, increases in voluntary prepayments and widening of credit spreads.
Limitations on our access to capital could impair our liquidity and our ability to conduct our business.
Liquidity, or ready access to funds, is essential to our business. Failures of similar businesses have often been attributable in large part to insufficient liquidity. Liquidity is of particular importance to our business and perceived liquidity issues may affect our clients’ and counterparties’ willingness to engage in transactions with us. Our liquidity could be impaired due to circumstances that we may be unable to control, such as a general market disruption or an operational problem that affects us or third parties. Further, our ability to sell assets may be impaired if other market participants are seeking to sell similar assets at the same time or the market is experiencing significant volatility. Our inability to maintain adequate liquidity would materially harm our business and operations.
The nature of the securities we hold exposes us to concentrated credit risk that could reduce our earnings, dividends, cash flows, and access to liquidity, and otherwise negatively affect our business.
Our MBS portfolio has concentrated risks with respect to residential real estate loans. In general, losses on an asset securing a residential real estate loan included in a securitization will be borne first by the owner of the property (i.e. the owner will first lose the equity invested in the property) and, thereafter, by mezzanine or preferred equity investors, if any, then by a cash reserve fund or letter of credit, if any, then by the first-loss holder, and then by holders of more senior securities. In the event the losses incurred upon default on the loan exceed any equity support, reserve fund, letter of credit, and classes of securities junior to those in which we invest (if any), we may not be able to recover any or all of our investment in the securities we hold. In addition, if the underlying properties have been overvalued by the originating appraisal or if the values subsequently declined and, as a result, less collateral is available to satisfy interest and principal payments due on the related MBS, then the first-loss securities may suffer a total loss of principal, followed by losses on the second-loss and so on. Any credit enhancement we may have with respect to our MBS could be insufficient to protect us from a complete loss.
Our due diligence of potential investments may not reveal all of the liabilities associated with such investments and may not reveal aspects of such investments which could lead to investment losses, and our ability to manage exposures to assets in which we have an indirect interest is limited.
Before making certain acquisitions, we may undertake due diligence efforts with respect to various aspects of the acquisition, including investigating the strengths and weaknesses of the originator or issuer of the asset and, in the case of acquisitions of private-label MBS, verifying certain aspects of the underlying assets themselves as well as other factors and characteristics that may be material to the performance of the acquisition. In making the assessment and otherwise conducting due diligence, we rely on resources available to us and, in some cases, third party information. There can be no assurance that any due diligence process that we conduct will uncover relevant facts that could be determinative of whether or not an investment will be successful.
20
Table of Contents
Moreover, our ability to manage our exposures is significantly limited by contractual and other constraints of the securitization vehicle structures in which such assets are held.
The securities and loans we own are likely to lead to variable returns.
We actively manage the risks associated with acquiring, holding, and disposing of MBS. No amount of risk management or mitigation, however, can change the variable nature of the cash flows, fair values of, and financial results generated by these loans and securities. Changes in the credit performance or the prepayments on the loans underlying these securities and changes in interest rates impact the cash flows on these securities, and the impact could be significant for our securities with concentrated risks. Changes in cash flows lead to changes in our return and also to potential variability in reported income.
The revenue recognized on most of our assets is based on an estimate of the yield over the remaining life of the asset. Thus, changes in our estimates of expected cash flow from an asset will result in changes in our reported earnings on that asset in the current reporting period. We may be forced to recognize adverse changes in expected future cash flows as a current expense, further adding to earnings volatility.
Changes in the fair values of our MBS may have various negative effects on us, reduced earnings, increased earnings volatility, and volatility in our book value.
Fair values for our MBS can be volatile. The fair values can change rapidly and significantly and changes can result from changes in interest rates, actual and perceived risk, supply, demand, and actual and projected cash flows and prepayments and credit performance. A decrease in fair value may not necessarily be the result of deterioration in future cash flows.
A decrease in the fair value of MBS we own may result in a reduction in our book value due to the accounting standards we are required to apply. Reporting a low book value could have adverse effects even if that book value is not indicative of the actual value of our net investments in assets. The adverse effects include the inability to meet or agree upon covenants with counterparties, to enter into derivative contracts, or a reduction in the market price of our common stock.
Our calculations of the fair value of our MBS are based upon assumptions that are inherently subjective and involve a high degree of management judgment. The use of different assumptions could materially affect our fair value calculations and our results of operations and financial condition.
We report our securities at fair value on our consolidated balance sheets. In computing the fair values for MBS for which there are limited observable third-party trades, we make a number of market-based assumptions, including assumptions regarding future interest rates, prepayment rates, discount rates, credit loss rates, and the timing of credit losses. These assumptions are inherently subjective and involve a high degree of management judgment. Use of different assumptions could materially affect our fair value calculations and our results of operations and financial condition. Although we rely on our internal calculations to compute the fair value of securities we own, we also request and consider indications of value (marks) from third-party dealers to assist us in our valuation process. Recent market disruptions have generated fewer third-party data points for us to consider in connection with our estimates of the fair value of our securities than were available to us in the past. Our reported fair value may not reflect what a willing buyer would pay for those assets and could be materially higher than the price we could obtain.
Credit ratings assigned to debt securities by the credit rating agencies may not accurately reflect the risks associated with those securities.
Rating agencies rate debt securities based upon their assessment of the safety of the receipt of principal and interest payments. Rating agencies do not consider the risks of fluctuations in fair value or other factors that may influence the value of debt securities and, therefore, the assigned credit rating may not fully reflect the true risks
21
Table of Contents
of an investment in securities. Also, rating agencies may fail to make timely adjustments to credit ratings based on available data or changes in economic outlook or may otherwise fail to make changes in credit ratings in response to subsequent events, so that our investments may be better or worse than the ratings indicate. A credit rating may not accurately reflect the risks associated with a particular debt security.
We make our acquisition decisions after factoring in a series of data, including credit rating. However, our assessment of the quality of an investment may also prove to be inaccurate and we may incur credit losses in excess of our initial expectations. Credit rating agencies may change their methods of evaluating credit risk and determining ratings on MBS. These changes may occur quickly and often. The market’s ability to understand and absorb these changes, and the impact to the securitization market in general, are difficult to predict. Such changes will have an impact on the amount of investment-grade and non-investment-grade securities that are created or placed on the market in the future.
The assignment of an “investment grade” rating to a security by a rating agency does not mean that there is not credit risk associated with the security or that the risk of a credit loss with respect to such security is remote. For example, a large number of RMBS that were rated triple-A by one or more rating agencies have been downgraded, in many cases by several rating levels at one time. A downgrade in credit rating can materially adversely affect the fair value of a security.
New assets we acquire may not generate yields as attractive as yields on our current assets, resulting in a decline in our earnings per share over time.
We believe the assets we acquire have the potential to generate attractive economic returns and GAAP yields, but acquiring assets in an uncertain economic environment poses significant risks. Potential cash flow and mark-to-market returns from new asset acquisitions could be negative, including both new assets that are backed by newly-originated loans, as well as new acquisitions that are backed by more seasoned assets that may experience higher than expected levels of delinquency and default. In order to maintain and grow our portfolio size and our earnings, we must reinvest in new assets a portion of the cash flows we receive from principal, interest, and sales. We receive monthly payments from many of our assets, consisting of principal and interest. Principal payments reduce the size of our current portfolio and generate cash for us. We may also sell assets from time to time as part of our portfolio management and capital recycling strategies. If the assets we acquire in the future earn lower GAAP yields than the assets we currently own, our reported earnings per share will likely decline over time as the older assets pay down, are called, or are sold.
An increase in our borrowing costs relative to the interest we receive on our mortgage-related assets may adversely affect our profitability, which may negatively affect cash available for distribution to our shareholders.
As our repurchase agreements and other short-term borrowing instruments mature, we will be required either to enter into new repurchase agreements or to sell a portion of our mortgage-related assets or other investment securities. Current conditions in the credit markets may make it impracticable to enter into new repurchase agreements or other short-term facilities. See “—Risks Related to Adverse Market Conditions.”
An increase in short-term interest rates at the time that we seek to enter into new repurchase agreements would reduce the spread between our returns on our mortgage-related assets and the cost of our borrowings. This change in interest rates would adversely affect our returns on our mortgage-related assets portfolio, which might reduce earnings and, in turn, cash available for distribution to our shareholders.
Prepayment rates could negatively affect the value of our MBS purchased at a premium, which could result in reduced earnings or losses and negatively affect the cash available for distribution to our shareholders.
In the case of residential mortgage loans, there are seldom any restrictions on borrowers’ abilities to prepay their loans. Homeowners tend to prepay mortgage loans faster when interest rates decline. Consequently, owners
22
Table of Contents
of the loans have to reinvest the money received from the prepayments at the lower prevailing interest rates. Conversely, homeowners tend not to prepay mortgage loans when interest rates increase. Consequently, owners of the loans are unable to reinvest money that would have otherwise been received from prepayments at the higher prevailing interest rates. This volatility in prepayment rates may affect our ability to maintain targeted amounts of leverage on our mortgage-based securities portfolio and may result in reduced earnings or losses for us and negatively affect the cash available for distribution to our shareholders. Despite Fannie Mae or Freddie Mac guarantees of principal and interest related to the agency-backed MBS we own, those guarantees do not protect us against prepayment risks.
Rapid changes in the values of our investments may make it more difficult for us to maintain our exemption from the 1940 Act.
Changes in the market value or income potential of certain of our investments may prevent us from maintaining our exemption from the 1940 Act. We may have to make investment decisions that we otherwise would not make absent the 1940 Act requirements.
Hedging against interest rate exposure may adversely affect our earnings, which could adversely affect cash available for distribution to our shareholders.
We have historically entered into and may enter into interest rate swap agreements, Euro-dollar futures or pursue other hedging strategies. Our hedging activity will vary in scope based on the level and volatility of interest rates and principal prepayments, the type of MBS held, and other changing market conditions. Interest rate hedging may fail to protect or could adversely affect us because, among other things:
| • | interest rate hedging can be expensive, particularly during periods of rising and volatile interest rates; |
| • | available interest rate hedging may not correspond directly with the interest rate risk for which protection is sought; |
| • | the duration of the hedge may not match the duration of the related liability; |
| • | the credit quality of the party owing money on the hedge may be downgraded to such an extent that it impairs our ability to sell or assign our side of the hedging transaction; and |
| • | the party owing money in the hedging transaction may default on its obligation to pay. |
Our hedging activity may adversely affect our earnings, which could adversely affect cash available for distribution to our shareholders.
We may change our mortgage investment strategy, hedging strategy, asset allocation and operational policies without shareholder consent, which may result in riskier investments and adversely affect the market value of our common stock and our ability to make distributions to our shareholders.
We may change our mortgage investment strategy, hedging strategy, asset allocation and operational policies at any time without the consent of our shareholders, which could result in our making investments or hedges that are different from, and possibly riskier than, the investments and hedges described in this Annual Report on Form 10-K. A change in our investment or hedging strategy may increase our exposure to interest rate, and real estate market fluctuations. A change in our asset allocation could result in us making investments in instrument categories different from those described in this Annual Report on Form 10-K. Our Board of Directors oversees our operational policies, including those with respect to our acquisitions, growth, operations, indebtedness, capitalization and distributions or approves transactions that deviate from these policies without a vote of, or notice to, our shareholders. Operational policy changes could adversely affect the market value of our common stock and our ability to make distributions to our shareholders.
23
Table of Contents
The market for investment opportunities is competitive, which could make it difficult for us to purchase or originate investments at attractive yields, which could have an adverse effect on cash available for distribution to our shareholders.
We gain access to investment opportunities only to the extent that they become known to us. Gaining access to investment opportunities is highly competitive. We compete with other companies that have greater capital, more long-standing relationships, broader product offerings and other advantages. Additionally, in response to the recent financial issues affecting the banking system and financial markets and going concern threats to investment banks and other financial institutions, the U.S. government established programs such as the Legacy Securities Public-Private Investment Program (PPIP), which are designed, in part, to restart the market for certain of our target investments. The establishment of these or similar programs may result in increased competition for attractive opportunities in our target investments. It is also possible that our competitors may successfully utilize these programs, which would provide them with attractive debt and equity capital funding from the U.S. government. Increased competition would make it more difficult for us to purchase or originate our target investments at attractive yields, which could have an adverse effect on cash available for distribution to our shareholders.
Tax Risks of our Business and Structure
Our ability to use NOL carry-forwards and NCL carry-forwards to reduce our taxable income may be limited.
We revoked our status as a REIT effective as of January 1, 2009, in part to maximize the use of potential tax benefits flowing from our existing NOLs or NCLs and certain other tax attributes. We must have taxable income or gains to benefit from theses NOLs, NCLs and certain other tax attributes. Although we believe that a significant portion of our NOLs will be utilized to offset the taxable income, no assurance can be provided that we will have taxable income or gains in the future to apply against our remaining NOLs and NCLs.
In addition, our NOL and NCL carry-forwards may be limited by Sections 382 and 383 of the Code if we experience an “ownership change.” In general, an “ownership change” occurs if 5% shareholders increase their collective ownership of the aggregate amount of the outstanding shares of our company by more than 50 percentage points looking back over the relevant testing period. If an ownership change occurs, our ability to use our NOLs, NCLs and certain recognized built-in losses to reduce our taxable income in a future year would be limited to a Section 382 limitation equal to the fair market value of our stock immediately prior to the ownership change multiplied by the long-term tax-exempt interest rate in effect for the month of the ownership change. The long-term tax-exempt rate for February 2011 is 4.47%. In the event of an ownership change, NOLs and NCLs that exceed the Section 382 limitation in any year will continue to be allowed as carry-forwards for the remainder of the carry-forward period and such losses can be used to offset taxable income for years within the carry-forward period subject to the Section 382 limitation in each year. However, if the carry-forward period for any NOL or NCL were to expire before that loss had been fully utilized, the unused portion of that loss would be lost. The carry-forward period for NOLs is 20 years from the year in which the losses giving rise to the NOLs were incurred, and the carry-forward period for NCL is five years from the year in which the losses giving rise to the NCL were incurred. Our use of new NOLs or NCLs arising after the date of an ownership change would not be affected by the Section 382 limitation (unless there were another ownership change after those new losses arose).
On June 1, 2009, our Board of Directors adopted the Rights Plan in an effort to protect against the occurrence of an ownership change. The Rights Plan is intended to act as a deterrent to any person or group acquiring 4.9% or more of our outstanding Class A common stock without the approval of our Board of Directors. Shareholders who own 4.9% or more of our outstanding Class A common stock as of the close of business on June 5, 2009 will not trigger the Rights Plan so long as they do not (i) acquire any additional shares of Class A common stock or (ii) fall under 4.9% ownership of Class A common stock and then re-acquire additional shares so that they own 4.9% or more of the Class A common stock. The Rights Plan does not exempt any future acquisitions of Class A common stock by such persons. Any Rights held by an Acquiring Person are
24
Table of Contents
void and may not be exercised. No Person shall be an Acquiring Person unless our Board of Directors shall have affirmatively determined, in its sole and absolute discretion, within ten (10) business days (or such later time as the Board of Directors may determine) after such person has otherwise met the requirements of becoming an Acquiring Person, that such person shall be an Acquiring Person. The Rights Plan, however, does not protect against all transactions that could cause an ownership change, such as dispositions by existing 5% shareholders and transactions in our Class B common stock. The Rights Plan was ratified by the shareholders in June 2010.
Based on our knowledge of our stock ownership, we do not believe that an ownership change has occurred since our losses were generated. Accordingly, we believe that at the current time there is no annual limitation imposed on our use of our NOLs and NCLs to reduce future taxable income. The determination of whether an ownership change has occurred or will occur is complicated and depends on changes in percentage stock ownership among shareholders. Other than the Rights Plan, there are currently no restrictions on the transfer of our stock that would discourage or prevent transactions that could cause an ownership change, although we may adopt such restrictions in the future. As discussed above, the Rights Plan is intended to discourage transactions that could cause an ownership change. The Rights Plan, however, does not protect against all transactions that could cause an ownership change. In addition, we have not obtained, and currently do not plan to obtain, a ruling from the Internal Revenue Service, regarding our conclusion as to whether our losses are subject to any such limitations. Furthermore, we may decide in the future that it is necessary or in our interest to take certain actions that could result in an ownership change. Therefore, no assurance can be provided as to whether an ownership change has occurred or will occur in the future.
Preserving the ability to use our NOLs and NCLs may cause us to forgo otherwise attractive opportunities.
Limitations imposed by Sections 382 and 383 of the Code may discourage us from, among other things, redeeming our stock or issuing additional stock to raise capital or to acquire businesses or assets. Accordingly, our desire to preserve our NOLs and NCLs may cause us to forgo otherwise attractive opportunities.
| ITEM 1B. | UNRESOLVED STAFF COMMENTS |
None.
| ITEM 2. | PROPERTIES |
Our principal executive offices are located at Potomac Tower, 1001 Nineteenth Street North, Arlington, Virginia 22209.
We sublease office space to Billings Capital Management, LLC (BCM) which is an investment management company owned and operated by Eric F. Billings, our Chairman and Chief Executive Officer, and his sons. The lease term is month-to-month, based on pro-rata share of the space occupied by BCM. The lease payments to us totaled $46 thousand for the year ended December 31, 2010.
| ITEM 3. | LEGAL PROCEEDINGS |
As of February 11, 2011, we are not a defendant or a plaintiff in any lawsuits or arbitrations or involved in any governmental or SRO matters that are expected to have a material adverse effect on our financial condition, results of operations or liquidity. We are from time to time involved in civil lawsuits and arbitration matters relating to our businesses that we consider to be in the ordinary course. There can be no assurance that these matters individually or in aggregate will not have a material adverse effect on our financial condition or results of operations in a future period. We are also subject to the risk of litigation, including litigation that may be without merit. As we intend to actively defend such litigation, significant legal expenses could be incurred. An adverse resolution of any future litigation against us could materially affect our financial condition, results of operations and liquidity.
25
Table of Contents
PART II
| ITEM 5. | MARKET FOR REGISTRANT’S COMMON EQUITY, RELATED STOCKHOLDER MATTERS AND ISSUER PURCHASES OF EQUITY SECURITIES |
Our Class A common stock is listed on the NYSE under the symbol “AI.” The following table shows the high and low sales prices of our Class A common stock and cash dividends declared during each fiscal quarter during the years ended December 31, 2010 and 2009. Share prices have been adjusted based on the reverse stock split effective on October 6, 2009.
| Price Range of Class A Common Stock |
Cash Dividends Per Share of Class A Common Stock |
|||||||||||
| High | Low | |||||||||||
| Year Ended December 31, 2010 |
||||||||||||
| Fourth Quarter |
$ | 25.95 | $ | 22.70 | $ | 0.60 | ||||||
| Third Quarter |
24.23 | 17.23 | 0.60 | |||||||||
| Second Quarter |
21.25 | 16.81 | 0.35 | |||||||||
| First Quarter |
18.98 | 14.18 | 0.35 | |||||||||
| Year Ended December 31, 2009 |
||||||||||||
| Fourth Quarter |
16.21 | 8.40 | — | |||||||||
| Third Quarter |
12.40 | 6.80 | — | |||||||||
| Second Quarter |
12.00 | 3.80 | — | |||||||||
| First Quarter |
6.60 | 2.20 | — | |||||||||
On January 31, 2011, there were approximately 267 record holders of our Class A common stock. There is no established public trading market for our Class B common stock and on January 31, 2011, there were approximately 23 record holders of our Class B common stock. If declared, Class B shares receive dividends in the same amounts and on the same dates as Class A shares.
Pursuant to our variable dividend policy, our Board of Directors evaluates dividends on a quarterly basis and, in its sole discretion, approves the payment of dividends. Our dividend payments, if any, may vary significantly from quarter to quarter. The Board of Directors approved and we declared and paid the following dividends for 2010:
| Quarter Ended |
Dividend Amount |
Declaration Date |
Record Date |
Pay Date | ||||
| December 31 | $0.60 | December 20 | December 31 | January 31, 2011 | ||||
| September 30 | 0.60 | September 20 | September 30 | October 29 | ||||
| June 30 | 0.35 | May 26 | June 30 | July 30 | ||||
| March 31 | 0.35 | February 10 | March 31 | April 30 |
We did not declare or pay out dividends on our Class A or Class B common stock during 2009.
Purchases of Equity Securities by the Issuer
The following table provides information on our share repurchases during the quarter ended December 31, 2010:
| Period |
Total Number of Shares Purchased |
Average Price Paid Per Share |
Total Number of Shares Purchased as Part of Publicly Announced Plans or Programs(1) |
Maximum Number of Shares that May Yet Be Purchased Under the Plans or Programs(1) |
||||||||||||
| October 1 to October 31, 2010 |
— | $ | — | — | — | |||||||||||
| November 1 to November 30, 2010 |
— | — | — | — | ||||||||||||
| December 1 to December 31, 2010 |
20,969 | 23.96 | 20,969 | 256,185 | ||||||||||||
| Total |
20,969 | $ | 23.96 | 20,969 | 256,185 | |||||||||||
26
Table of Contents
| (1) | On July 28, 2010, our Board of Directors announced that it had authorized a new share repurchase program (the 2010 Repurchase Program) in order to better position us to continue share repurchases while preserving our ability to use our NCL and NOL carryforwards. Under the 2010 Repurchase Program, we may repurchase up to 500,000 shares of our Class A common stock. Repurchases under the 2010 Repurchase Program may be made from time to time on the open market and in private transactions at management’s discretion in accordance with applicable federal securities laws. The timing of repurchases and the exact number of shares of Class A common stock to be purchased will depend upon market conditions and other factors. The 2010 Repurchase Program is funded using our cash on hand and cash generated from operations. The 2010 Repurchase Program has no expiration date and may be suspended or terminated at any time without prior notice. |
During the three months ended December 31, 2010, we repurchased 20,969 shares of our Class A common stock at an average price of $23.96 per share and a total cost of $0.5 million. During the year ended December 31, 2010, we repurchased 243,815 shares of our Class A common stock at an average price of $20.08 per share and a total cost of $4.9 million.
27
Table of Contents
Stock Comparison Graph
The following graph compares the change in the cumulative total shareholder return for our Class A common stock from December 31, 2005 to December 31, 2010 with the comparable cumulative return of four indexes: the Standard & Poors (S&P) 500 Stock Index and our Peer Group Index (New) and Peer Group Index (Old) published by Financial Service Analytics, Inc. The New Peer Group Index is consistent with the peer group approved by the Compensation Committee of our Board of Directors.
Our Class A common stock trades on the NYSE. The graph assumes $100 invested on December 31, 2005 in our Class A common stock and $100 invested at the same time in each of the above-mentioned indexes. The comparison assumes that all dividends are reinvested.
Comparison of 5-Year Cumulative Total Return Among Arlington Asset Investment Corp.,
the Peer Group Index (Old), the Peer Group Index (New) and the S&P 500 Index
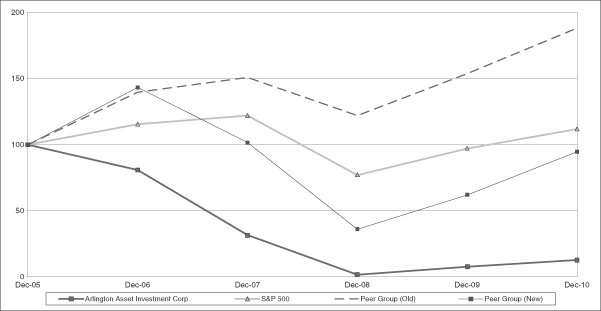
| AAIC Prices(1) |
AAIC Indexed |
Peer Group (Old)(2) |
Peer Group (New)(3) |
S&P 500 Indexed |
||||||||||||||||
| December 31, 2005 |
$ | 198.00 | $ | 100.00 | $ | 100.00 | $ | 100.00 | $ | 100.00 | ||||||||||
| December 31, 2006 |
160.00 | 81.00 | 139.79 | 143.46 | 115.73 | |||||||||||||||
| December 31, 2007 |
62.80 | 31.85 | 150.96 | 101.70 | 122.08 | |||||||||||||||
| December 31, 2008 |
3.40 | 1.72 | 122.23 | 36.09 | 76.98 | |||||||||||||||
| December 31, 2009 |
15.23 | 7.72 | 153.85 | 62.08 | 97.29 | |||||||||||||||
| December 31, 2010 |
23.99 | 12.91 | 188.30 | 94.75 | 111.92 | |||||||||||||||
| (1) | Closing price of our Class A common stock on the NYSE on the last trading day of each year as shown adjusted for the impact of 1-for-20 reverse stock split effective on October 6, 2009. |
| (2) | Our Peer Group Index (Old) includes the following companies: Annaly Capital Management, Inc., Chimera Investment Corporation, Dynex Capital, Inc., Invesco Mortgage Investment Trust, MFA Financial, Inc., PennyMac Mortgage Investment Trust, Redwood Trust Inc., and Two Harbors Investment Corp. |
| (3) | Our Peer Group Index (New) includes the following companies: Allied Capital Corporation, American Capital, Ltd., Anworth Mortgage Asset Corporation, Arbor Realty Trust, Inc., Capital Trust, Inc., Capstead Mortgage Corporation, MCG Capital Corporation, MFA Financial, Inc., Newstar Financial, Inc., NorthStar Realty Finance Corp., RAIT Financial Trust, and Redwood Trust Inc. |
28
Table of Contents
| ITEM 6. | SELECTED FINANCIAL DATA |
SELECTED CONSOLIDATED FINANCIAL INFORMATION
(Dollars in thousands, except per share amounts)
| Year Ended December 31, | ||||||||||||||||||||
| 2010 | 2009 | 2008 | 2007 | 2006 | ||||||||||||||||
| Consolidated Statements of Operations |
||||||||||||||||||||
| Interest income |
||||||||||||||||||||
| Interest on MBS |
$ | 39,566 | $ | 13,940 | $ | 77,954 | $ | 249,996 | $ | 203,517 | ||||||||||
| Interest on loans held for investment |
— | — | — | 225,234 | 382,118 | |||||||||||||||
| Interest on loans held for sale |
— | — | 37 | 51,194 | 88,621 | |||||||||||||||
| Dividends |
— | 112 | 724 | 2,481 | 14,551 | |||||||||||||||
| Other interest income |
1 | 27 | 2,379 | 6,779 | 743 | |||||||||||||||
| Total interest income |
39,567 | 14,079 | 81,094 | 535,684 | 689,550 | |||||||||||||||
| Interest expense |
||||||||||||||||||||
| Interest on short-term debt |
593 | 495 | 50,554 | 217,673 | 165,450 | |||||||||||||||
| Interest on long-term debt |
562 | 3,150 | 21,764 | 26,874 | 26,207 | |||||||||||||||
| Interest on mortgage loans and mortgage banking operations |
— | — | 401 | 222,187 | 363,310 | |||||||||||||||
| Other interest expense |
— | — | 32 | 5,366 | 2,290 | |||||||||||||||
| Total interest expense |
1,155 | 3,645 | 72,751 | 472,100 | 557,257 | |||||||||||||||
| Net interest income |
38,412 | 10,434 | 8,343 | 63,584 | 132,293 | |||||||||||||||
| Other income (loss), net |
||||||||||||||||||||
| Investment gain (loss) |
3,328 | 3,926 | (390,378 | ) | (211,933 | ) | (187,407 | ) | ||||||||||||
| Other (loss) income |
(14 | ) | (151 | ) | 83,947 | (119,988 | ) | 191,444 | ||||||||||||
| Gain on extinguishment of long-term debt |
— | 160,435 | 39,083 | — | — | |||||||||||||||
| Total other income (loss), net |
3,314 | 164,210 | (267,348 | ) | (331,921 | ) | 4,037 | |||||||||||||
| Income (loss) from continuing operations before other expenses |
41,726 | 174,644 | (259,005 | ) | (268,337 | ) | 136,330 | |||||||||||||
| Other expenses |
||||||||||||||||||||
| Compensation and benefits |
10,660 | 14,366 | 21,780 | 81,406 | 83,352 | |||||||||||||||
| Professional services |
1,263 | 7,053 | 6,056 | 10,439 | 16,009 | |||||||||||||||
| Business development |
97 | 6,577 | 604 | 6,161 | 8,379 | |||||||||||||||
| Occupancy and equipment |
388 | 538 | 1,248 | 19,104 | 20,013 | |||||||||||||||
| Communications |
204 | 246 | 237 | 6,256 | 4,359 | |||||||||||||||
| Other operating expenses |
2,022 | 5,709 | 18,771 | 268,468 | 77,263 | |||||||||||||||
| Total other expenses |
14,634 | 34,489 | 48,696 | 391,834 | 209,375 | |||||||||||||||
| Income (loss) from continuing operations before income taxes |
27,092 | 140,155 | (307,701 | ) | (660,171 | ) | (73,045 | ) | ||||||||||||
| Income tax provision (benefit) |
506 | 9,522 | 1,899 | 2,899 | (11,410 | ) | ||||||||||||||
| Net income (loss) from continuing operations |
26,586 | 130,633 | (309,600 | ) | (663,070 | ) | (61,635 | ) | ||||||||||||
| (Loss) income from discontinued operations, net of taxes |
— | (25,547 | ) | (194,730 | ) | 5,244 | (9,841 | ) | ||||||||||||
| Net income (loss) |
26,586 | 105,086 | (504,330 | ) | (657,826 | ) | (71,476 | ) | ||||||||||||
| Net (loss) income attributable to noncontrolling interests |
— | (11,459 | ) | (86,867 | ) | 774 | (2,751 | ) | ||||||||||||
| Net income (loss) attributable to Arlington Asset Investment Corp. shareholders |
$ | 26,586 | $ | 116,545 | $ | (417,463 | ) | $ | (658,600 | ) | $ | (68,725 | ) | |||||||
29
Table of Contents
| December 31, | ||||||||||||||||||||
| 2010 | 2009 | 2008 | 2007 | 2006 | ||||||||||||||||
| Consolidated Balance Sheet Data |
||||||||||||||||||||
| Assets |
||||||||||||||||||||
| Cash and cash equivalents |
$ | 12,412 | $ | 10,123 | $ | 46,851 | $ | 322,968 | $ | 38,671 | ||||||||||
| Receivables |
||||||||||||||||||||
| Interest |
2,345 | 2,011 | 1,130 | 7,059 | 66,172 | |||||||||||||||
| Other |
219 | 20 | 356 | 44,071 | 102,580 | |||||||||||||||
| Investments |
||||||||||||||||||||
| Mortgage-backed securities, at fair value |
||||||||||||||||||||
| Available-for-sale |
252,909 | 295,600 | 139,955 | 1,791,480 | 6,452,580 | |||||||||||||||
| Trading |
174,055 | — | — | — | 2,690 | |||||||||||||||
| U.S. Treasury bonds, at fair value |
— | — | 550,000 | — | — | |||||||||||||||
| Loans held for sale |
— | — | — | 65,074 | 5,367,934 | |||||||||||||||
| Other investments |
8,287 | 2,580 | 13,802 | 85,198 | 153,148 | |||||||||||||||
| Derivative assets, at fair value |
— | — | — | 3,514 | 36,875 | |||||||||||||||
| Goodwill and intangible assets, net |
— | — | — | — | 173,590 | |||||||||||||||
| Deposits |
4,748 | 2,589 | ||||||||||||||||||
| Prepaid expenses and other assets |
358 | 726 | 7,475 | 23,555 | 193,068 | |||||||||||||||
| Assets of discontinued operation |
— | — | 800,722 | 602,036 | 765,210 | |||||||||||||||
| Total assets |
$ | 455,333 | $ | 313,649 | $ | 1,560,291 | $ | 2,944,955 | $ | 13,352,518 | ||||||||||
| Liabilities |
||||||||||||||||||||
| Repurchase agreements |
$ | 190,220 | $ | 126,830 | $ | 647,003 | $ | 1,744,377 | $ | 2,870,175 | ||||||||||
| Interest payable |
187 | 124 | 2,019 | 2,985 | 11,902 | |||||||||||||||
| Accrued compensation and benefits |
7,201 | 5,921 | 3,339 | 11,568 | 13,391 | |||||||||||||||
| Dividend payable |
4,655 | — | — | — | 8,743 | |||||||||||||||
| Derivative liabilities, at fair value |
2,398 | — | — | 3,558 | 44,582 | |||||||||||||||
| Accounts payable, accrued expenses and other liabilities |
18,928 | 13,904 | 13,322 | 62,863 | 34,527 | |||||||||||||||
| Long-term debt |
15,000 | 16,857 | 254,357 | 387,556 | 324,453 | |||||||||||||||
| Commercial paper |
— | — | — | — | 3,971,389 | |||||||||||||||
| Securitization financing, net |
— | — | — | — | 4,486,046 | |||||||||||||||
| Liabilities of discontinued operation |
— | — | 496,995 | 95,296 | 280,822 | |||||||||||||||
| Total liabilities |
238,589 | 163,636 | 1,417,035 | 2,308,203 | 12,046,030 | |||||||||||||||
| Equity |
||||||||||||||||||||
| Common Stock and Additional Paid in Capital |
1,506,048 | 1,507,474 | 1,494,722 | 1,470,320 | 1,564,244 | |||||||||||||||
| Accumulated other comprehensive income (loss), net of taxes |
63,495 | 7,015 | (118 | ) | (13,071 | ) | (13,708 | ) | ||||||||||||
| Accumulated deficit |
(1,352,799 | ) | (1,364,476 | ) | (1,481,021 | ) | (1,063,558 | ) | (379,491 | ) | ||||||||||
| Total Arlington Asset Investment Corp. shareholders’ equity |
216,744 | 150,013 | 13,583 | 393,691 | 1,171,045 | |||||||||||||||
| Noncontrolling interest |
— | — | 129,673 | 243,061 | 135,443 | |||||||||||||||
| Total equity |
216,744 | 150,013 | 143,256 | 636,752 | 1,306,488 | |||||||||||||||
| Total liabilities and equity |
$ | 455,333 | $ | 313,649 | $ | 1,560,291 | $ | 2,944,955 | $ | 13,352,518 | ||||||||||
| Statistical Data |
||||||||||||||||||||
| Basic earnings (loss) per share(3) |
$ | 3.44 | $ | 15.19 | $ | (55.23 | ) | $ | (78.88 | ) | $ | (8.01 | ) | |||||||
| Diluted earnings (loss) per share(3) |
$ | 3.38 | $ | 14.89 | $ | (55.23 | ) | $ | (78.88 | ) | $ | (8.01 | ) | |||||||
| Book value per share(1) (3) |
$ | 28.46 | $ | 19.54 | (2) | $ | 1.80 | (2) | $ | 52.26 | (2) | $ | 135.57 | (2) | ||||||
| Total employees(1) |
10 | 10 | 579 | 1,025 | 3,019 | |||||||||||||||
| Return on average assets |
7 | % | 25 | % | (16 | )% | (7 | )% | (1 | )% | ||||||||||
| Return on average equity |
15 | % | 65 | % | (98 | )% | (59 | )% | (5 | )% | ||||||||||
| Dividend payout ratio |
55 | % | — | — | (4 | )% | (125 | )% | ||||||||||||
| Average Equity to assets ratio |
46 | % | 38 | % | 17 | % | 11 | % | 11 | % | ||||||||||
| Basic weighted average shares outstanding (in thousands)(3) |
7,734 | 7,675 | 7,558 | 8,349 | 8,583 | |||||||||||||||
| Diluted weighted average shares outstanding (in thousands)(3) |
7,873 | 7,825 | 7,558 | 8,349 | 8,583 | |||||||||||||||
| Cash dividends per common share(3) |
$ | 1.90 | $ | — | $ | — | $ | 3.00 | $ | 10.00 | ||||||||||
| (1) | As of end of the period reported. |
| (2) | Excludes employee stock and purchase loan receivable shares of 80 shares pledged as collateral as of December 31, 2009, 2008, 2007 and 2006. |
| (3) | Reflects the impact of 1-for-20 reverse stock split effective on October 6, 2009. |
30
Table of Contents
| ITEM 7. | MANAGEMENT’S DISCUSSION AND ANALYSIS OF FINANCIAL CONDITION AND RESULTS OF OPERATIONS |
Overview
Arlington Asset Investment Corp. is a principal investment firm that acquires and holds mortgage-related and other assets. We acquire, on a leveraged basis, residential mortgage-backed securities (MBS), either issued by a U.S. Government agency, or guaranteed as to principal and interest by U.S. Government agencies or U.S. Government-sponsored entities (agency-backed MBS). We also acquire MBS issued by private organizations (private-label MBS) subject to maintaining our exemption from regulation as an investment company under the Investment Company Act of 1940, as amended (1940 Act).
When we use the terms “Arlington Asset,” “AAIC,” “we” “us” “our” and “the Company,” we mean Arlington Asset Investment Corp. and its consolidated subsidiaries. We are taxed as a C corporation for federal income tax purposes. We operate primarily in the United States.
Business Environment
Our MBS portfolio is affected by general U.S. residential real estate market conditions and the overall U.S. economic environment. In particular, our MBS strategy and the performance of our MBS portfolio is influenced by the specific characteristics of these markets, including prepayment rates, credit losses, interest rates and the interest rate yield curve. Our results of operations with respect to our MBS portfolio primarily depend on, among other things, the level of our interest income and the amount and cost of borrowings we may obtain by pledging our investment portfolio as collateral for the borrowings. Our interest income, which includes the amortization of purchase premiums and accretion of discounts, varies primarily as a result of changes in prepayment speeds of the securities in our MBS portfolio. Our borrowing cost varies based on changes in interest rates and changes in the amount we can borrow which is generally based on the fair value of the MBS portfolio and the advance rate the lenders are willing to lend against the collateral provided.
The payment of principal and interest on the agency-backed MBS that we acquire and hold is guaranteed by Freddie Mac or Fannie Mae. The payment of principal and interest on agency-backed MBS issued by the Federal Home Loan Mortgage Corporation (Freddie Mac) or the Federal National Mortgage Association (Fannie Mae) is not guaranteed by the U.S. government. Any failure to honor its guarantee of agency-backed MBS by Freddie Mac or Fannie Mae or any downgrade of securities issued by Freddie Mac or Fannie Mae by the rating agencies could cause a significant decline in the value of and cash flow from, any agency-backed MBS we own that are guaranteed by such entity.
Due to increased market concerns about Fannie Mae and Freddie Mac’s ability to withstand future credit losses associated with securities held in their investment portfolios, and on which they provide guarantees, without the direct support of the federal government, the government passed the Housing and Economic Recovery Act of 2008 (HERA) on July 30, 2008. As a result of this legislation, Fannie Mae and Freddie Mac have been placed into the conservatorship of the Federal Housing Finance Agency (FHFA), their federal regulator, pursuant to its powers under the HERA. As the conservator of Fannie Mae and Freddie Mac, the FHFA now controls and directs the operations of Fannie Mae and Freddie Mac and may (i) take over the assets of and operate Fannie Mae and Freddie Mac with all the powers of the shareholders, the directors, and the officers of Fannie Mae and Freddie Mac and conduct all business of Fannie Mae and Freddie Mac; (ii) collect all obligations and money due to Fannie Mae and Freddie Mac; (iii) perform all functions of Fannie Mae and Freddie Mac which are consistent with the conservator’s appointment; (iv) preserve and conserve the assets and property of Fannie Mae and Freddie Mac; and (v) contract for assistance in fulfilling any function, activity, action or duty of the conservator. A primary focus of this new legislation is to increase the availability of mortgage financing by allowing Fannie Mae and Freddie Mac to continue to grow their guarantee business without limit, while requiring Fannie Mae and Freddie Mac to gradually reduce their agency security portfolios.
Conditions in the markets improved during 2010 despite a slow recovery for the U.S. economy. The recovery in the markets, however, remains uneven and vulnerable to changes in investor sentiment. While U.S.
31
Table of Contents
corporate bond markets increased new issue volumes during 2010, securitization markets have been slower to recover and conditions in certain segments remain uncertain. While the trading activity has increased in the private-label MBS market, the supply of newly issued securities is still limited. As a result, the overall value of these private-label MBS has increased. The increase in competition for the available supply of the private-label MBS may prohibit us from acquiring the private-label MBS at a favorable price.
The U.S. Treasury has signaled that it will announce plans for the future of Fannie Mae and Freddie Mac in late February 2011. The future roles of Fannie Mae and Freddie Mac could be significantly reduced and the nature of their guarantees could be considerably limited relative to historical measurements. In addition, the U.S. Treasury, the Federal Reserve and other governmental and regulatory bodies have taken or are considering taking other actions to address the financial crisis. We cannot predict whether or when such actions may occur or what impact, if any, such actions could have on our business, results of operations and financial condition.
We believe the general business environment will continue to be challenging. Our growth outlook is dependent in part on the extent and severity of the financial market dislocation, results from fiscal and monetary policy actions, and the overall market value of U.S. equities and liquidity. For further discussions on how markets conditions may affect our business see “Risk Factors.”
Executive Summary
During the year ended December 31, 2010, we continued our strategic initiatives designed to strengthen and stabilize our financial and operational positions to maximize the returns to our shareholders and increase our shareholder value. We evaluate the rates of return that can be achieved in each asset class and for each individual security within an asset class in which we participate. Historically, based on market conditions, we believe our MBS investments have provided us with higher relative risk-adjusted rates of return than most other investment opportunities we have evaluated. Consequently, we have maintained a high allocation of our assets and capital in this sector. We intend to continue to evaluate investment opportunities against the returns available in each of our investment alternatives and endeavor to allocate our assets and capital with an emphasis toward what we believe will generate the highest risk-adjusted return available. This strategy may cause us to have different allocations of capital in different environments.
32
Table of Contents
For the year ended December 31, 2010, we had net income of $26.6 million, or $3.38 per share (diluted). As of December 31, 2010, the Company’s book value per share was $28.46. For the year ended December 31, 2010, our income from continuing operations was $26.6 million compared to $130.6 million for the year ended December 31, 2009. Our income from continuing operations includes net interest income of $38.4 million for the year ended December 31, 2010 compared to $10.4 million and a gain on extinguishment of long-term debt of $160.4 million for the year ended December 31, 2009. Our other expenses decreased to $14.6 million during the year ended December 31, 2010 compared to $34.5 million for the year ended December 31, 2009, primarily as a result of a $3.7 million reduction in compensation and benefits primarily related to a $4.1 million reduction in non-cash compensation amortization of restricted stock and our effort to reduce operating expenses in all categories and a $12.3 million reduction in expenses associated with professional services and business development, including a $6.5 million elimination in 2010 of costs that were attributable to the FBR Open. Our net income attributable to the shareholders of Arlington Asset Investment Corp. for the year ended December 31, 2009 included a loss from discontinued operations of $25.5 million.
| Year Ended December 31, | ||||||||||||
| (Dollars in thousands) | 2010 | 2009 | 2008 | |||||||||
| Net interest income |
$ | 38,412 | $ | 10,434 | $ | 8,343 | ||||||
| Other income (loss), net |
3,314 | 164,210 | (267,348 | ) | ||||||||
| Other expenses |
14,634 | 34,489 | 48,696 | |||||||||
| Income (loss) from continuing operations before income taxes |
27,092 | 140,155 | (307,701 | ) | ||||||||
| Income tax provision |
506 | 9,522 | 1,899 | |||||||||
| Net income (loss) from continuing operations |
26,586 | 130,633 | (309,600 | ) | ||||||||
| Loss from discontinued operations, net of taxes |
— | (25,547 | ) | (194,730 | ) | |||||||
| Net loss attributable to noncontrolling interests |
— | (11,459 | ) | (86,867 | ) | |||||||
| Net income (loss) attributable to Arlington Asset Investment Corp. shareholders |
$ | 26,586 | $ | 116,545 | $ | (417,463 | ) | |||||
As of December 31, 2010, our private-label MBS portfolio consisted of $385.8 million in face value with an amortized cost basis of $190.0 million, was fair valued at $252.7 million and had $189.1 million in unaccreted purchase discount. During the year ended December 31, 2010, we recognized net interest income of $31.9 million, representing an 18.3% annualized yield, including coupon and accretion of purchase discount, from our private-label MBS portfolio. Previously, our agency-backed MBS portfolio was structured to substantially eliminate market price risk and had a nominal impact on income. However, as of December 31, 2010, we completed the migration of our agency-backed MBS portfolio to a position in which our funding is hedged with Eurodollar futures to mitigate interest rate risk. These Eurodollar futures mature through September 30, 2015 and have a lifetime weighted average rate of 2.72% as of December 31, 2010. As of December 31, 2010, we owned $174.2 million in fair value, with $167.8 million in face value, of securities in our leveraged agency-backed MBS portfolio.
Our private-label MBS are primarily senior and re-REMIC tranches in securitization trusts issued between 2005 and 2010. The senior securities represent interests in securitizations that have the first right to cash flows and absorb losses last. The re-REMIC securities category represents interests in re-securitizations of senior residential mortgage-backed securities (RMBS) and pro-rata mezzanine securities. For re-REMIC securities, the cash flows from, and any credit losses absorbed by, the underlying RMBS are allocated among the re-REMIC securities issued in the re-securitization transactions based on the re-REMIC structure. For example, prime and non-prime residential senior securities have been resecuritized to create a two-tranche structure with a re-REMIC senior security and a re-REMIC subordinated security. In these re-REMIC securities, all principal payments from the underlying securities are directed to the re-REMIC senior security until the face value is fully paid off. Thereafter, all principal payments are directed to the re-REMIC subordinated security. For pro-rata mezzanine securities, principal payments from the underlying RMBS are typically allocated concurrently and proportionally to the mezzanine securities along with senior securities. The re-REMIC subordinated and mezzanine securities
33
Table of Contents
absorb credit losses first, if any, however, these credit losses occur only when credit losses exceed the credit protection provided to the underlying securities. Senior, re-REMIC, and mezzanine securities receive interest while any face value is outstanding. Our private-label MBS have approximately 10% credit enhancement, which provides protection to our invested capital in addition to our purchase discount.
We generally purchase these private-label MBS at a discount to face value. We estimate, at minimum on a quarterly basis, the future expected cash flows based on our observation of current information and events and applying a number of assumptions related to prepayment rates, interest rates, default rates, and the timing and amount of credit losses. These assumptions are difficult to predict as they are subject to uncertainties and contingencies related to future events that may impact our estimates and interest income.
Based on our estimates of the expected cash flows associated with our discounted private-label MBS, a portion of the purchase discount that we are entitled to earn which we consider to be a credit reserve against future potential credit losses, may not be accreted into interest income. The amount designated as credit reserve may be adjusted over time, based on the actual performance of the security, its underlying collateral, actual and projected cash flow from such collateral, economic conditions and other factors. If the performance of a security with a credit reserve is more favorable than forecasted, a portion of the amount designated as credit reserve may be accreted into interest income over time. Conversely, if the performance of a security with a credit reserve is less favorable than forecasted, additional amounts of the purchase discount may be designated as a credit reserve, or impairment charges and write-downs of such securities to a new cost basis could result. As of December 31, 2010, we designated $6.4 million as a credit reserve of the $189.1 million purchase discount on such securities.
We have been and will continue to evaluate the potential impact of recent developments related to foreclosure suspensions, affidavit errors, and various state and federal government actions on the market price of MBS and related derivative securities. While it is predictably difficult to foresee the short-term and long-term impact from the foreclosure issues given all the uncertainties, we anticipate the current foreclosure issues to not have a material negative effect on our overall position and results of operations at this time.
In our private-label MBS, we have continued to benefit from the increased allocation of capital to re-REMIC mezzanine securities as well as an average purchase price basis of 50% of face value. Continued expectations of stabilization and improvement in housing, increased liquidity and available leverage have raised prices for private-label MBS, particularly among re-REMIC mezzanine securities. Our re-REMIC securities are predominantly held in the subordinate tranches and we will continue to closely monitor the performance of these securities. We believe we have constructed a private-label MBS portfolio with attractive characteristics and will continue to monitor relative value between the various classes of MBS including agency-backed MBS and may re-allocate our portfolio at any time based on management’s view of the market. We will continue to seek to identify potential opportunities to strengthen our position and to maximize return to our shareholders.
In addition to the financial results reported in accordance with generally accepted accounting principles as consistently applied in the United States (GAAP), we calculate non-GAAP core operating income for the year ended December 31, 2010. Our core operating income for the year ended December 31, 2010 was $31.2 million. In determining core operating income, we excluded certain costs and the following non-cash expenses: (1) compensation costs associated with stock-based awards, (2) accretion of MBS purchase discounts adjusted for principal repayments in excess of proportionate invested capital, and (3) unrealized mark-to-market adjustments on the trading MBS and interest rate hedge instruments. This non-GAAP measurement is used by management to analyze and assess the operating results and dividends. We believe that this non-GAAP measurement assists investors in understanding the impact of these non-core items and non-cash expenses on our performance and provides additional clarity around our forward earnings capacity and trend. A limitation of utilizing this non-GAAP measure is that the GAAP accounting effects of these events do in fact reflect the underlying financial results of our business and these effects should not be ignored in evaluating and analyzing our financial results. Therefore, we believe net income on a GAAP basis and core operating income on a non-GAAP basis should be considered together.
34
Table of Contents
The following is a reconciliation of GAAP net income to non-GAAP core operating income for the year ended December 31, 2010 (dollars in thousands):
| GAAP net income |
$ | 26,586 | ||
| Adjustments |
||||
| Adjusted expenses(1) |
(63 | ) | ||
| Stock compensation |
3,345 | |||
| Net unrealized mark-to-market loss on trading MBS and interest rate hedge instruments |
3,299 | |||
| Adjusted interest related to purchase discount accretion(2) |
(1,951 | ) | ||
| Non-GAAP core operating income |
$ | 31,216 | ||
| (1) | Adjusted expenses represents certain professional fees and income taxes that are not considered representative of routine or core operating related activities of the Company. |
| (2) | Adjusted interest related to purchase discount accretion represents purchase discount accretion in excess of principal repayment in excess of proportional share of invested capital. |
MBS Portfolio
The following table summarizes our principal investing portfolio including principal receivable on MBS, as of December 31, 2010 (dollars in thousands):
| Face Amount | Fair Value | |||||||
| Trading |
||||||||
| Agency-backed MBS |
||||||||
| Fannie Mae |
$ | 167,614 | $ | 174,055 | ||||
| Available-for-sale |
||||||||
| Agency-backed MBS |
||||||||
| Fannie Mae |
163 | 174 | ||||||
| Private-label MBS |
||||||||
| Senior securities |
63,973 | 51,038 | ||||||
| Re-REMIC securities |
321,873 | 201,697 | ||||||
| Other mortgage related assets |
181,135 | 6,327 | ||||||
| Total |
$ | 734,758 | $ | 433,291 | ||||
Income from Continuing Operations
Our income from continuing operations consists primarily of net interest income, net investment gain, dividends from investments and investment fund earnings.
Expenses
Interest expense includes the costs of our repurchase agreement borrowings and long-term debt securities. Interest expense also includes costs of subordinated credit lines, bank deposits and other financing, when used.
Compensation and benefits expense includes base salaries as well as incentive compensation. Salaries, payroll taxes and employee benefits are relatively fixed in nature. In addition, compensation and benefits includes non-cash expenses associated with all stock-based awards granted to employees.
Professional services expense includes accounting, legal and consulting fees. Many of these expenses, such as legal fees, are to a large extent variable related to level of transactions, ongoing litigation and initiatives.
35
Table of Contents
Business development expense includes primarily travel and entertainment expenses.
Occupancy and equipment includes rental costs for our facilities, depreciation and amortization of equipment and software. These expenses are largely fixed in nature.
Communications expenses include voice, data and internet service fees, and data processing costs.
Other operating expenses include professional liability and property insurance, directors fees including cash and stock awards, printing and copying, business licenses and taxes, offices supplies, penalties and fees, charitable contributions and other miscellaneous office expenses.
Results of Operations
Comparison of the years ended December 31, 2010 and 2009
We reported net income attributable to Arlington Asset Investment Corp. shareholders of $26.6 million for the year ended December 31, 2010 compared to $116.5 million for the year ended December 31, 2009. Net income included the following results for the periods indicated (dollars in thousands):
| Year Ended December 31, | ||||||||
| 2010 | 2009 | |||||||
| Interest income |
$ | 39,567 | $ | 14,079 | ||||
| Interest expense |
1,155 | 3,645 | ||||||
| Net interest income |
38,412 | 10,434 | ||||||
| Other income, net |
||||||||
| Investment gain |
3,328 | 3,926 | ||||||
| Gain on extinguishment of long-term debt |
— | 160,435 | ||||||
| Other loss |
(14 | ) | (151 | ) | ||||
| Total other income, net |
3,314 | 164,210 | ||||||
| Other expenses |
14,634 | 34,489 | ||||||
| Income from continuing operations before income taxes |
27,092 | 140,155 | ||||||
| Income tax provision |
506 | 9,522 | ||||||
| Income from continuing operations |
26,586 | 130,633 | ||||||
| Loss from discontinued operations, net of taxes |
— | (25,547 | ) | |||||
| Net income |
26,586 | 105,086 | ||||||
| Net loss attributable to noncontrolling interests |
— | (11,459 | ) | |||||
| Net income attributable to Arlington Asset Investment Corp. shareholders |
$ | 26,586 | $ | 116,545 | ||||
Net income attributable to Arlington Asset Investment Corp. shareholders decreased $89.9 million (77.2%) from $116.5 million for the year ended December 31, 2009 to $26.6 million for the year ended December 31, 2010 due to the following changes:
We recorded a $160.4 million gain on extinguishment of $236.7 million in long-term debt for the year ended December 31, 2009. There were no such extinguishments for the year ended December 31, 2010.
Net interest income increased $28.0 million from $10.4 million for the year ended December 31, 2009 to $38.4 million for the year ended December 31, 2010. The increase is the result of fully deploying our investable capital to our MBS portfolio.
Investment gain decreased $0.6 million (15.4%) from $3.9 million for the year ended December 31, 2009 to $3.3 million for the year ended December 31, 2010. See below for additional discussion on the results of our principal investing portfolio.
36
Table of Contents
The following table summarizes the components of income from our principal investment activities, net of related interest expense (dollars in thousands):
| Year Ended December 31, | ||||||||
| 2010 | 2009 | |||||||
| Net interest income |
$ | 38,974 | $ | 13,472 | ||||
| Net investment gain |
3,328 | 3,926 | ||||||
| Dividend income |
— | 112 | ||||||
| $ | 42,302 | $ | 17,510 | |||||
The components of net interest income from our MBS related portfolio is summarized in the following table (dollars in thousands):
| Year Ended December 31, | ||||||||||||||||||||||||
| 2010 | 2009 | |||||||||||||||||||||||
| Average Balance |
Income (Expense) |
Yield/ Cost |
Average Balance |
Income (Expense) |
Yield/ Cost |
|||||||||||||||||||
| MBS |
$ | 330,081 | $ | 39,427 | 11.94 | % | $ | 141,969 | $ | 13,940 | 9.82 | % | ||||||||||||
| Other investments |
1,216 | 139 | 11.47 | % | — | — | — | |||||||||||||||||
| $ | 331,297 | 39,566 | 11.94 | % | $ | 141,969 | 13,940 | 9.82 | % | |||||||||||||||
|
Other(1) |
1 | 27 | ||||||||||||||||||||||
| 39,567 | 13,967 | |||||||||||||||||||||||
| Repurchase agreements |
$ | 157,968 | (593 | ) | (0.37 | )% | $ | 89,554 | (495 | ) | (0.55 | )% | ||||||||||||
| Net interest income/spread |
$ | 38,974 | 11.57 | % | $ | 13,472 | 9.27 | % | ||||||||||||||||
| (1) | Includes interest income on cash and other miscellaneous interest-earning assets. |
The change in the composition of our MBS portfolio from the year ended December 31, 2009 to the year ended December 31, 2010 and related increase in net interest income by $25.5 million from the same periods in 2009 to 2010 was due to the repositioning of the portfolio. Interest income from other investments represents interest on interest-only MBS securities.
As discussed above, we realized net investment gain of $3.3 million for the year ended December 31, 2010 compared to $3.9 million for the year ended December 31, 2009. The following table summarizes the components of net investment gain (dollars in thousands):
| Year Ended December 31, | ||||||||
| 2010 | 2009 | |||||||
| Realized gains on sale of available-for-sale investments, net |
$ | 10,051 | $ | 4,947 | ||||
| Available-for-sale and cost method securities—other-than-temporary impairments |
— | (1,086 | ) | |||||
| Losses on trading investments, net |
(4,471 | ) | — | |||||
| Gains (losses) from investment funds |
5 | (737 | ) | |||||
| Losses from derivative instruments |
(3,046 | ) | — | |||||
| Other, net |
789 | 802 | ||||||
| $ | 3,328 | $ | 3,926 | |||||
As part of our quarterly assessments of unrealized losses in our MBS portfolio for potential other-than-temporary impairment, we recognized no other-than-temporary impairment charges for the years ended
37
Table of Contents
December 31, 2010 and 2009. In previous years, in determining the lower-of-cost or market value of the securitized mortgage loans, we considered various factors affecting the overall value of the portfolio, including but not limited to factors such as prepayment speeds, default rates, loss assumption, geographic locations, collateral values and mortgage insurance coverage. Based on such factors, we assessed the present value of expected loan cash flows considering the specific characteristics of each individual loan. Significant assumptions used by us in determining this value were supported by comparisons to market data for similar portfolios and transactions, when available.
As part of our quarterly assessments of unrealized losses in our portfolio of marketable equity securities for other-than-temporary impairments and our assessment of cost method investments, we recognized other-than-temporary impairment charges of $1.1 million relating to marketable equity securities and cost method investments for the year ended December 31, 2009. No other-than-temporary impairment charges were recognized for the year ended December 31, 2010.
The realized gains on sale of available-for-sale investments, net, recognized for the year ended December 31, 2010 were primarily the result of sales of $243.1 million in MBS at a net gain of $10.0 million as compared to the result of sales of $596.6 million in MBS at a net gain of $4.6 million for the year ended December 31, 2009.
The losses on trading investments, net, recognized for the year ended December 31, 2010 were primarily the result of realized net losses of $3.6 million from sales of trading investments and unrealized mark-to-market net loss adjustments of our trading MBS portfolio of $0.9 million.
Losses from derivative instruments recognized for the year ended December 31, 2010 was the result of realized net losses of $0.6 million and unrealized mark-to-market loss adjustments of $2.4 million on our Eurodollar futures contracts. There were no derivative related transactions during the year ended December 31, 2009.
Other net investment gain primarily includes miscellaneous activities related to various investment portfolios such as liquidation proceeds on previously impaired investments.
Interest expense unrelated to our principal investing activity relates to long-term debt. These costs decreased to $0.6 million for the year ended December 31, 2010 from $3.2 million for the year ended December 31, 2009 as a result of extinguishments as discussed above.
Other expenses decreased by $19.9 million (57.7%) from $34.5 million for the year ended December 31, 2009 to $14.6 million for the year ended December 31, 2010, primarily as a result of our effort to reduce operating expenses in all categories. The most significant reductions were related to non-cash compensation of restricted stock amortization, professional services and business development, including elimination of costs attributable to the FBR Open.
The total income tax provision decreased from a provision of $9.5 million for the year ended December 31, 2009 to a provision of $0.5 million for the year ended December 31, 2010 due to the gain on extinguishment of trust preferred debt recognized in the year ended December 31, 2009. Our effective tax rate was 1.9% for the year ended December 31, 2010 as compared to 6.8% for the same period in 2009. The effective tax rates for the year ended December 31, 2010 and 2009 reflect adjustments to statutory tax rates primarily due to valuation allowances recognized on deferred tax assets and the gain recognized from the extinguishment of trust preferred debt during the year ended December 31, 2009.
38
Table of Contents
Comparison of the years ended December 31, 2009 and 2008
We reported net income of $116.5 million, including net income from continuing operations of $130.6 million, for the year ended December 31, 2009 compared to a net loss of $417.5 million, including a net loss from continuing operations of $309.6 million, for the year ended December 31, 2008. Net income (loss) included the following results as of the periods indicated (dollars in thousands):
| Year Ended December 31, | ||||||||
| 2009 | 2008 | |||||||
| Interest income |
$ | 14,079 | $ | 81,094 | ||||
| Interest expense |
3,645 | 72,751 | ||||||
| Net interest income |
10,434 | 8,343 | ||||||
| Other income, net |
||||||||
| Gain on extinguishment of long-term debt |
160,435 | 39,083 | ||||||
| Investment gain (loss) |
3,926 | (390,378 | ) | |||||
| Other (loss) income |
(151 | ) | 83,947 | |||||
| Total other income (loss), net |
164,210 | (267,348 | ) | |||||
| Other expenses |
34,489 | 48,696 | ||||||
| Income (loss) from continuing operations before income taxes |
140,155 | (307,701 | ) | |||||
| Income tax provision |
9,522 | 1,899 | ||||||
| Net income (loss) from continuing operations |
130,633 | (309,600 | ) | |||||
| Loss from discontinued operations, net of taxes |
(25,547 | ) | (194,730 | ) | ||||
| Net income |
105,086 | (504,330 | ) | |||||
| Net loss attributable to noncontrolling interests |
(11,459 | ) | (86,867 | ) | ||||
| Net income (loss) attributable to Arlington Asset Investment Corp. shareholders |
$ | 116,545 | $ | (417,463 | ) | |||
Net income attributable to Arlington Asset Investment Corp. shareholders increased $534.0 million (127.9%) from a loss of $417.5 million in 2008 to $116.5 million income in 2009 due to the following changes:
We recorded a $160.4 million gain on extinguishment of $236.7 million in long-term debt in 2009 as compared to a $39.1 million gain on extinguishment of $65.8 million in long-term debt in 2008.
Investment gain (loss) increased $394.3 million (101.0%) from a loss of $390.4 million in 2008 to a gain of $3.9 million in 2009. During 2008, we liquidated approximately $2.7 billion of MBS at a net loss of approximately $234.0 million, which included $100.9 million in previously recognized other-than-temporary impairment, to reduce leverage during the unprecedented credit market disruption and uncertainty in the asset-backed financing market and liquidity. During 2009, we repositioned our MBS portfolio by investing in private-label MBS, and therefore, minimizing the liquidity risk and increasing returns. See below for additional discussion on the results of our principal investing portfolio.
Other income decreased $84.1 million (100.2%) from income of $83.9 million in 2008 to a loss of $0.2 million in 2009 primarily due to a non-cash reversal of $73.0 million negative investment in First NLC Financial Services, LLC (First NLC) because we had no continuing involvement with First NLC in 2008. There were no similar activities during 2009.
The following table summarizes the components of income (loss) from our principal investment activities, net of related interest expense (dollars in thousands):
| Year Ended December 31, | ||||||||
| 2009 | 2008 | |||||||
| Net interest income |
$ | 13,472 | $ | 29,794 | ||||
| Net investment gain (loss) |
3,926 | (390,378 | ) | |||||
| Dividend income |
112 | 724 | ||||||
| $ | 17,510 | $ | (359,860 | ) | ||||
39
Table of Contents
The components of net interest income from our MBS portfolio is summarized in the following table (dollars in thousands):
| Year Ended December 31, | ||||||||||||||||||||||||
| 2009 | 2008 | |||||||||||||||||||||||
| Average Balance |
Income / (Expense) |
Yield / Cost |
Average Balance |
Income / (Expense) |
Yield / Cost |
|||||||||||||||||||
| MBS |
$ | 141,969 | $ | 13,940 | 9.82 | % | $ | 1,870,948 | $ | 77,954 | 4.17 | % | ||||||||||||
| $ | 141,969 | 13,940 | 9.82 | % | $ | 1,870,948 | 77,954 | 4.17 | % | |||||||||||||||
|
Other(1) |
27 | 2,379 | ||||||||||||||||||||||
| 13,967 | 80,333 | |||||||||||||||||||||||
| Repurchase agreements |
$ | 89,554 | (495 | ) | (0.55 | )% | $ | 1,624,034 | (48,619 | ) | (2.95 | )% | ||||||||||||
| Derivative contracts(2) |
— | — | — | (1,920 | ) | |||||||||||||||||||
| $ | 89,554 | (495 | ) | (0.55 | )% | $ | 1,624,034 | (50,539 | ) | (3.11 | )% | |||||||||||||
| Net interest income/spread |
$ | 13,472 | 9.27 | % | $ | 29,794 | 1.06 | % | ||||||||||||||||
| (1) | Includes interest income on cash and other miscellaneous interest-earning assets. |
| (2) | Includes the effect of derivative instruments accounted for as cash flow hedges. |
The change in the composition of our MBS portfolio from 2008 to 2009 and related decrease in net interest income by $16.3 million from 2008 to 2009 was due to the reposition of the portfolio as discussed above.
In addition to net interest income, we recorded $0.1 million in dividend income from our merchant banking equity investment portfolio in 2009 compared to $0.7 million during 2008. The decrease in dividend income was primarily due to the decrease in the number of and amount of capital invested in dividend paying companies in the merchant banking portfolio as well as reduced dividend rates.
As discussed above, we realized net investment gain of $3.9 million during 2009 compared to net investment loss of $390.4 million during 2008. The following table summarizes the components of net investment gain (loss) (dollars in thousands):
| Year Ended December 31, | ||||||||
| 2009 | 2008 | |||||||
| Available-for-sale and cost method securities—other-than-temporary impairments |
$ | (1,086 | ) | $ | (224,775 | ) | ||
| Realized gains (losses) on sale of available-for-sale investments, net |
4,947 | (129,939 | ) | |||||
| Losses from investments funds |
(737 | ) | (4,626 | ) | ||||
| Residual interests in securitization—other-than-temporary impairments |
— | (15,271 | ) | |||||
| Other, net |
802 | (15,767 | ) | |||||
| $ | 3,926 | $ | (390,378 | ) | ||||
As part of our quarterly assessments of unrealized losses in our MBS portfolio for potential other-than-temporary impairment, we recognized no other-than-temporary impairment charges in 2009 as compared to $200.6 million in 2008.
As part of our quarterly assessments of unrealized losses in our portfolio of marketable equity securities for other-than-temporary impairments and our assessment of cost method investments, we recognized other-than-temporary impairment charges of $1.1 million relating to marketable equity securities and cost method investments in 2009 as compared to $36.8 million in 2008.
40
Table of Contents
The realized gains recognized in 2009 were primarily the result of the liquidation of $596.6 million of MBS during 2009 at a net gain of $4.6 million. The realized losses recognized in 2008 were primarily the result of the liquidation of $2.7 billion of MBS at a net loss of $234.0 million, which included $100.9 million in previously recognized other-than-temporary impairment.
Other net investment gain (loss) primarily includes miscellaneous activities related to various investment portfolios such as liquidation proceeds and, in prior years, net gains and losses from derivatives not designated as cash flow hedges.
Loss from investment funds reflects our losses from investments in proprietary investment partnerships. See Note 4 to the financial statements for further information on investment funds, other gains and losses, as well as realized gains on sales of equity investments and MBS.
Interest expense unrelated to our principal investing relates to long-term debt and short-term financing. These costs decreased to $3.2 million in 2009 from $22.2 million in 2008 as a result of extinguishments as discussed above.
Other expenses decreased by $14.2 million (29.2%) from $48.7 million in 2008 to $34.5 million in 2009 primarily as a result of overall cost reduction initiatives implemented during 2009. Other operating expense decreased by $13.1 million due to reduction in fees paid to directors, D&O insurance premium and allocated costs from FBR Capital Markets Corporation (FBR Capital Markets) prior to its separation from our operations.
The total income tax provision increased from $1.9 million in 2008 to $9.5 million in 2009 due to the gain on extinguishment of trust preferred debt. Our effective tax rate was 6.8% in 2009 as compared to 1.9% in 2008. The effective tax rates for the year ended December 31, 2009 and 2008, represent adjustments to statutory tax rates primarily due to valuation allowances recognized on deferred tax assets and liabilities, the reversal of a negative investment in First NLC, and the recording of a deferred tax liability on the investment in FBR Capital Markets and the effect of a refund claim due to a change in tax law.
Net loss attributable to noncontrolling interest represents the proportionate share of FBR Capital Markets’ net loss in 2009 and 2008 that was allocated to the minority interest holders of FBR Capital Markets. During the years ended December 31, 2009 and 2008, $11.5 million and $86.9 million of losses, respectively, were deducted from consolidated results to derive net income (loss) attributable to Arlington Asset Investment Corp. shareholders.
Liquidity and Capital Resources
Liquidity is a measurement of our ability to meet potential cash requirements including ongoing commitments to repay borrowings, fund investments, and for other general business purposes. Our primary sources of funds for liquidity consist of short-term borrowings (e.g., repurchase agreements), principal and interest payments on MBS, dividends on equity securities and proceeds from sales of MBS.
Liquidity, or ready access to funds, is essential to our business. Failures of similar businesses have often been attributable in large part to insufficient liquidity. Liquidity is of particular importance to our business and perceived liquidity issues may affect our clients’ and counterparties’ willingness to engage in transactions with us. Our liquidity could be impaired due to circumstances that we may be unable to control, such as a general market disruption or an operational problem that affects us or third parties. Further, our ability to sell assets may be impaired if other market participants are seeking to sell similar assets at the same time. If we cannot obtain funding from third parties or from our subsidiaries, our results of operations could be negatively impacted.
Potential future sources of liquidity for us include existing cash balances, borrowing capacity through margin accounts and repurchase agreements and cash flows from operations, future issuances of common stock, preferred stock, debt securities or derivatives of those securities. Funding for agency MBS through repurchase agreements continues to be available to us at rates we consider to be attractive from multiple counterparties and
41
Table of Contents
we have observed increased availability for funding for private-label MBS through repurchase agreements. Although the availability of the third-party sources of liquidity has improved, we have observed that market conditions are still constraining access to debt capital relative to pre-crisis levels of 2007. As a result, the availability of certain short-term liquidity such as commercial paper borrowings was still limited as of December 31, 2010.
On January 4, 2011, we filed a shelf registration statement on Form S-3 (File No. 333-171537) with the SEC. The shelf registration statement was declared effective on January 20, 2011. Pursuant to the shelf registration statement, we may issue and publicly distribute various types of securities, including Class A common stock, preferred stock, debt securities, warrants and units, or any combination of such securities, from time to time, in one or more offerings, up to an aggregate amount of $500.0 million. We filed the shelf registration statement to gain additional flexibility in accessing capital markets for, among other things, the acquisition of MBS and other assets, the repayment of outstanding indebtedness, the pursuit of growth initiatives that may include acquisitions, working capital, and for liquidity needs. There is no assurance, however, that we will be able to access the capital markets on favorable terms or at all.
Cash Flows
As of December 31, 2010, our cash and cash equivalents totaled $12.4 million representing a net increase in the balance of $2.3 million from $10.1 million as of December 31, 2009 from continuing operations.
Cash provided by operating activities of $16.4 million during 2010 was offset by net cash outflows of $62.6 million from investing activities and net cash inflows of $48.6 million from financing activities. Cash provided by operating activity was attributable primarily to cash operating income and net changes in operating assets and liabilities from continuing operations.
Our investing activities during 2010 included proceeds from sales of, and receipt of principal payments from MBS totaling $406.9 million. These cash inflows were offset by $470.4 million used to purchase MBS. Our financing activities reflected net proceeds from repurchase agreement borrowings of $63.4 million and $10.3 million in dividends paid.
As of December 31, 2009, our cash and cash equivalents totaled $10.1 million representing a net decrease in the balance of $36.8 million from $46.9 million as of December 31, 2008 from continuing operations. Our cash and cash equivalents held by discontinued operations were $-0- and $207.8 million as of December 31, 2009 and 2008, respectively.
Cash used in operating activities of $77.6 million during 2009 was offset by net cash inflows of $753.3 million from investing activities and net cash outflows of $920.3 million from financing activities. Cash used in operating activity was attributable primarily to cash operating losses and net changes in operating assets and liabilities for both continuing and discontinued operations.
Our investing activities during 2009 included proceeds from sales of, and receipt of principal payments from MBS totaling $1.1 billion and proceeds of $550.0 million from U.S. Treasury bond maturity. These cash inflows were offset by $763.5 million used to purchase MBS. Our financing activities reflected net repayments of repurchase agreement borrowings of $936.2 million, $75.8 million related to the extinguishment of long-term debt, and $165.0 million proceeds from the sale of FBR Capital Markets common stock during 2009.
Sources of Funding
We believe that our existing cash balances, investment in private-label MBS, net investments in agency-backed MBS, cash flows from operations, borrowing capacity and other sources of liquidity will be sufficient to meet our cash requirements for at least the next 12 months. We have obtained, and believe we will be able to continue to obtain, short-term financing in amounts and at interest rates consistent with our financing objectives. We may, however, seek debt or equity financings, in public or private transactions, to provide capital for
42
Table of Contents
corporate purposes and/or strategic business opportunities, including possible acquisitions, joint ventures, alliances or other business arrangements which could require substantial capital outlays. Our policy is to evaluate strategic business opportunities, including acquisitions and divestitures, as they arise. There can be no assurance that we will be able to generate sufficient funds from future operations, or raise sufficient debt or equity on acceptable terms, to take advantage of investment opportunities that become available. Should our needs ever exceed these sources of liquidity, we believe that most of our investments could be sold, in most circumstances, to provide cash. However, we may be required to sell our assets at depressed prices.
As of December 31, 2010, our liabilities totaled $238.6 million. In addition to other payables and accrued expenses, our indebtedness consisted of repurchase agreements and long-term debentures. These long-term debt securities accrue and require payments of interest quarterly at annual rates of three-month LIBOR plus 2.25% to 3.00%, mature between 2033 and 2035, and are currently redeemable by us, in whole or in part, without penalty. As of December 31, 2010, we had $15.0 million of total long-term debt.
We also have short-term financing facilities that are structured as repurchase agreements with various financial institutions to primarily fund our portfolio of agency-backed MBS. As of December 31, 2010, the weighted average interest rate under these agreements was 0.53%. Our repurchase agreements include provisions contained in the standard master repurchase agreement as published by the Securities Industry and Financial Markets Association (SIFMA) and may be amended and supplemented in accordance with industry standards for repurchase facilities. Our repurchase agreements include financial covenants, with which the failure to comply would constitute an event of default under the applicable repurchase agreement. Similarly, each repurchase agreement includes events of insolvency and events of default on other indebtedness. As provided in the standard master repurchase agreement as typically amended, upon the occurrence of an event of default or termination event the applicable counterparty has the option to terminate all repurchase transactions under such counterparty’s repurchase agreement and to demand immediate payment of any amount due from us to the counterparty.
Under our repurchase agreements, we may be required to pledge additional assets to our repurchase agreement counterparties in the event the estimated fair value of the existing pledged collateral under such agreements declines and such lenders demand additional collateral (i.e., a margin call), which may take the form of additional securities or cash. Margin calls on repurchase agreements collateralized by our MBS investments primarily result from events such as declines in the value of the underlying mortgage collateral caused by factors such as rising interest rates or prepayments.
To date, we have not had any margin calls on our repurchase agreements that we were not able to satisfy with either cash or additional pledged collateral. However, should we encounter increases in interest rates or prepayments, margin calls on our repurchase agreements could result in a manner that could cause a material adverse change in our liquidity position.
In the event that market conditions are such that we are unable to obtain financing for our investments in MBS in amounts and at interest rates consistent with our financing objectives, to the extent deemed appropriate, we may use cash to finance our investments or we may liquidate such investments. Accordingly, depending on market conditions, we may incur significant losses on any such sales of MBS.
The following table provides information regarding our outstanding repurchase agreement borrowings as of the dates and periods indicated (dollars in thousands):
| December 31, | ||||||||
| 2010 | 2009 | |||||||
| Outstanding balance |
$ | 190,220 | $ | 126,830 | ||||
| Weighted-average rate |
0.53 | % | 0.27 | % | ||||
| Weighted-average term to maturity |
15.4 days | 40.6 days | ||||||
| Maximum amount outstanding at any month-end during the year |
$ | 190,220 | $ | 126,830 | ||||
43
Table of Contents
Assets
Our principal assets consist of MBS, cash and cash equivalents, receivables, deposits and long-term investments. As of December 31, 2010, liquid assets consisted primarily of cash and cash equivalents of $12.4 million and net investments in MBS of $236.7 million. Cash equivalents consist primarily of money market funds invested in debt obligations of the U.S. Government. Our total assets increased from $313.6 million at December 31, 2009 to $455.3 million as of December 31, 2010. The increase in total assets reflects the results of implementing our strategic plan as previously discussed.
As of December 31, 2010, the total par and fair value of the MBS portfolio was $585.7 million and $427.0 million, respectively. As of December 31, 2010, the weighted average coupon of the portfolio was 5.13%.
Dividends
Pursuant to our variable dividend policy, our Board of Directors evaluates dividends on a quarterly basis and, in its sole discretion, approves the payment of dividends. Our dividend payments, if any, may vary significantly quarter to quarter. The Board of Directors approved and we declared and paid the following dividends for 2010:
| Quarter Ended |
Dividend Amount |
Declaration Date |
Record Date |
Pay Date | ||||
| December 31 | $0.60 | December 20 | December 31 | January 31, 2011 | ||||
| September 30 | 0.60 | September 20 | September 30 | October 29 | ||||
| June 30 | 0.35 | May 26 | June 30 | July 30 | ||||
| March 31 | 0.35 | February 10 | March 31 | April 30 |
The Company did not declare or pay out dividends on our Class A or Class B common stock during 2009 and 2008.
Contractual Obligations
We have contractual obligations to make future payments in connection with borrowings and non-cancelable lease agreements and other contractual commitments as well as uncalled capital commitments to various investment partnerships that may be called over the next ten years. The following table sets forth these contractual obligations by fiscal year (in thousands):
| 2011 | 2012 | 2013 | 2014 | 2015 | Thereafter | Total | ||||||||||||||||||||||
| Borrowings(1) |
$ | 970 | $ | — | $ | — | $ | — | $ | — | $ | 15,000 | $ | 15,970 | ||||||||||||||
| Minimum rental and other contractual commitments(2) |
206 | — | — | — | — | — | 206 | |||||||||||||||||||||
| Capital commitments(3) |
— | — | — | — | — | — | — | |||||||||||||||||||||
| $ | 1,176 | $ | — | $ | — | $ | — | $ | — | $ | 15,000 | $ | 16,176 | |||||||||||||||
| (1) | This table excludes interest payments to be made on our long-term debt securities. Based on the weighted average interest rate of 3.04% as of December 31, 2010, approximately $114.0 thousand in accrued interest on the current outstanding principal will be paid for the quarter ending March 31, 2011. Interest on the $15.0 million of long-term debt floats based on the 3-month LIBOR; therefore, actual coupon interest will likely differ from this estimate. These long-term debt securities mature beginning in October 2033 through July 2035. |
| (2) | Equipment and office rent expense for 2010, 2009 and 2008 was $162.1 thousand, $230.0 thousand and $774.2 thousand, respectively. |
| (3) | The table above excludes $1.5 million of uncalled capital commitments as of December 31, 2010 to various investment partnerships that may be called over the next ten years. This commitment was $1.6 million at |
44
Table of Contents
| December 31, 2009. This amount was excluded because we cannot currently determine when, if ever, the commitments will be called. Also, the table above does not include a liability for unrecognized income tax benefits of $12.8 million that are not contractual obligations by nature. We cannot determine, with any degree of certainty, the amount that would be payable or the period of cash settlement to the respective taxing jurisdiction. |
We also have short-term repurchase agreement liabilities of $190.2 million as of December 31, 2010. See Note 5 to the financial statements for further information.
Quantitative and Qualitative Disclosures about Market Risk
Market Risk
We monitor market and business risk, including credit, interest rate, equity, operations, liquidity, compliance, legal, reputational, and equity ownership risks through a number of control procedures designed to identify and evaluate the various risks to which our business and assets are exposed.
Market risk generally represents the risk of loss through a change in realizable value that can result from a change in the prices of securities, a change in the value of financial instruments as a result of changes in interest rates, a change in the volatility of interest rates or a change in the credit rating of an issuer. We are exposed to the following market risks as a result of our investments in MBS and equity investments.
Credit Risk
Although we do not expect to encounter credit risk in our agency-backed MBS portfolio assuming Fannie Mae and Freddie Mac remain solvent, we are exposed to credit risk in our private-label MBS portfolio. With respect to our private-label MBS, credit support contained in these MBS deal structures provides a level of protection from losses, as do the discounted purchase prices in the event of the return of less than 100% of par. We also evaluate the impact of credit risk on our investments through a comprehensive investment review and a selection process, which is predominantly focused on quantifying and pricing credit risk. We review our private-label MBS based on quantitative and qualitative analysis of the risk-adjusted returns on such investments. Through modeling and scenario analysis, we seek to evaluate each investment’s credit risk. Credit risk is also monitored through our ongoing asset surveillance. Despite these measures to manage credit risk, unanticipated credit losses could nevertheless occur which could adversely impact our operating results.
Our private-label MBS are generally purchased at a discount. We estimate the future expected cash flows based on our observation of current information and events and applying a number of assumptions related to prepayment rates, interest rates, default rates, and the timing and amount of credit losses. These assumptions are difficult to predict as they are subject to uncertainties and contingencies related to future events that may impact our estimates and interest income.
Based on the expected cash flows, to the extent that a security has a probability of incurring credit loss, a portion of the purchase discount that we are entitled to earn which we consider to be a credit reserve against future potential credit losses, may not be accreted into interest income. The amount designated as credit reserve may be adjusted over time, based on the actual performance of the security, its underlying collateral, actual and projected cash flow from such collateral, economic conditions and other factors. If the performance of a security with a credit reserve is more favorable than forecasted, a portion of the amount designated as credit reserve may be accreted into interest income over time. Conversely, if the performance of a security with a credit reserve is less favorable than forecasted, additional amounts of the purchase discount may be designated as credit reserve, or impairment charges and write-downs of such securities to a new cost basis could result. As of and for the year ended December 31, 2010, we designated $6.4 million as credit reserve on such securities which is net of a $6.5 million reclassification from credit reserve to accretable discount as a result of improvements in actual and projected performance of the securities.
45
Table of Contents
The following table represents certain statistics of our non-agency MBS portfolio as of and for the year ended December 31, 2010:
| Senior Securities |
Re-REMIC Securities |
Total | ||||||||||
| Yield (% of Amortized Cost) |
16.1 | % | 19.8 | % | 18.4 | % | ||||||
| Average cost (% of Face Value) |
67.0 | % | 45.6 | % | 49.1 | % | ||||||
| Weighted Average Coupon |
4.3 | % | 5.5 | % | 5.3 | % | ||||||
| Delinquencies Greater Than 60 Plus Days |
23.2 | % | 19.6 | % | 20.2 | % | ||||||
| Credit Enhancement |
9.8 | % | 9.6 | % | 9.6 | % | ||||||
| Severity (Three Months Average) |
50.1 | % | 43.4 | % | 44.5 | % | ||||||
| Constant Prepayment Rate (Three Months Average) |
15.6 | % | 17.7 | % | 17.3 | % | ||||||
Key credit and prepayment measures in our non-agency MBS portfolio continued a positive trend during the year ended December 31, 2010. Total 60 day plus delinquencies in the Company’s non-agency MBS portfolio declined to 20.2% at December 31, 2010 from 20.8% at December 31, 2009 and trailing three month average loss severities on liquidated loans declined to 44.5% at December 31, 2010 from 45.1% at December 31, 2009.
The table that follows shows the expected change in fair value for our current MBS related to our principal investing activities under several hypothetical credit loss scenarios. Our private-label MBS are classified as Level 3 assets of the fair value hierarchy as they are valued using present value techniques based on estimated cash flows of the security taking into consideration various assumptions derived by management and used by other market participants. These assumptions include, among others, interest rates, prepayment rates, discount rates, credit loss rates, and the timing of credit losses. Credit default and loss severity rates can significantly affect the prices of private-label MBS. While it is impossible to project exact amount of changes in value, the table below illustrates the impact a 10% increase and a 10% decrease in the credit default and loss severity rates, from those used as our valuation assumptions, would have on the value of our total assets and our book value as of December 31, 2010. The changes in rates are assumed to occur instantaneously. Actual changes in market conditions are likely to be different from these assumptions (dollars in thousands, except per share amounts).
| Value
at December 31, 2010 |
Value
at December 31, 2010 with 10% Increase in Default Rate |
Percent Change |
Value
at December 31, 2010 with 10% Decrease in Default Rate |
Percent Change |
Value
at December 31, 2010 with 10% Increase in Loss Severity Rate |
Percent Change |
Value
at December 31, 2010 with 10% Decrease in Loss Severity Rate |
Percent Change |
||||||||||||||||||||||||||||
| Assets |
||||||||||||||||||||||||||||||||||||
| MBS |
$ | 426,964 | $ | 422,186 | (1.12 | )% | $ | 431,683 | 1.11 | % | $ | 418,550 | (1.97 | )% | $ | 434,893 | 1.86 | % | ||||||||||||||||||
| Other |
28,369 | 28,369 | — | 28,369 | — | 28,369 | — | 28,369 | — | |||||||||||||||||||||||||||
| Total assets |
$ | 455,333 | $ | 450,555 | (1.05 | )% | $ | 460,052 | 1.04 | % | $ | 446,919 | (1.85 | )% | $ | 463,262 | 1.74 | % | ||||||||||||||||||
| Liabilities |
$ | 238,589 | $ | 238,589 | — | $ | 238,589 | — | $ | 238,589 | — | $ | 238,589 | — | ||||||||||||||||||||||
| Equity |
216,744 | 211,966 | (2.20 | )% | 221,463 | 2.18 | % | 208,330 | (3.88 | )% | 224,673 | 3.66 | % | |||||||||||||||||||||||
| Total liabilities and equity |
$ | 455,333 | $ | 450,555 | (1.05 | )% | $ | 460,052 | 1.04 | % | $ | 446,919 | (1.85 | )% | $ | 463,262 | 1.74 | % | ||||||||||||||||||
| Book value per share |
$ | 28.46 | $ | 27.83 | (2.20 | )% | $ | 29.07 | 2.18 | % | $ | 27.35 | (3.88 | )% | $ | 29.50 | 3.66 | % | ||||||||||||||||||
Interest Rate Risk
Leveraged MBS
We are also subject to interest-rate risk as a result of our principal investment activities. Through our principal investment activities, we invest in agency-backed MBS and finance these investments with repurchase agreements which are interest rate sensitive financial instruments. We are exposed to interest rate risk that fluctuates based on changes in the level or volatility of interest rates and mortgage prepayments and in the shape
46
Table of Contents
and slope of the yield curve. We attempt to hedge a portion of our exposure to interest rate fluctuations primarily through the use of Eurodollar futures. The counterparties to our derivative agreements at December 31, 2010 are U.S. financial institutions. We assess and monitor the counterparties’ non-performance risk and credit risk on a regular basis.
Our primary risk is related to changes in both short- and long-term interest rates, which affect us in several ways. As interest rates increase, the market value of the MBS may be expected to decline, prepayment rates may be expected to go down, and duration may be expected to extend. An increase in interest rates is beneficial to the market value of our derivative instruments. For example, for interest rate swap positions, the cash flows from receiving the floating rate portion increase and the fixed rate paid remains the same under this scenario. If interest rates decline, the reverse is true for MBS, paying fixed and receiving floating interest rate swaps, interest rate caps, and Eurodollar futures and put option contracts.
The table that follows shows the expected change in fair value for our current MBS and derivatives related to our principal investing activities under several hypothetical interest-rate scenarios. Interest rates are defined by the U.S. Treasury yield curve. The changes in rates are assumed to occur instantaneously. It is further assumed that the changes in rates occur uniformly across the yield curve and that the level of LIBOR changes by the same amount as the yield curve. Actual changes in market conditions are likely to be different from these assumptions.
Changes in value are measured as percentage changes from their respective values presented in the column labeled “Value at December 31, 2010.” Management’s estimate of change in value for MBS is based on the same assumptions it uses to manage the impact of interest rates on the portfolio. Actual results could differ significantly from these estimates. For MBS, the estimated change in value of the MBS reflects an effective duration of 2.23 in a rising interest rate environment and 1.28 in a declining interest rate environment.
The effective durations are based on observed market value changes, as well as management’s own estimate of the effect of interest rate changes on the fair value of the investments including assumptions regarding prepayments based, in part, on age of and interest rate on the mortgages underlying the MBS, prior exposure to refinancing opportunities, and an overall analysis of historical prepayment patterns under a variety of past interest rate conditions (dollars in thousands, except per share amounts).
| Value at December 31, 2010 |
Value at December 31, 2010 with 100 basis point increase in interest rates |
Percent Change |
Value at December 31, 2010 with 100 basis point decrease in interest rates |
Percent Change |
||||||||||||||||
| Assets |
||||||||||||||||||||
| MBS |
$ | 426,964 | $ | 417,433 | (2.23 | )% | $ | 432,427 | 1.28 | % | ||||||||||
| Other |
28,369 | 28,369 | — | 28,369 | — | |||||||||||||||
| Total assets |
$ | 455,333 | $ | 445,802 | (2.09 | )% | $ | 460,796 | 1.20 | % | ||||||||||
| Liabilities |
||||||||||||||||||||
| Repurchase agreements |
$ | 190,220 | $ | 190,220 | — | $ | 190,220 | — | ||||||||||||
| Derivative liabilities |
2,398 | (602 | ) | (125.10 | )% | 5,398 | 125.10 | % | ||||||||||||
| Other |
45,971 | 45,971 | — | 45,971 | — | |||||||||||||||
| Total liabilities |
238,589 | 235,589 | (1.26 | )% | 241,589 | 1.26 | % | |||||||||||||
| Equity |
216,744 | 210,213 | (3.01 | )% | 219,207 | 1.14 | % | |||||||||||||
| Total liabilities and equity |
$ | 455,333 | $ | 445,802 | (2.09 | )% | $ | 460,796 | 1.20 | % | ||||||||||
| Book value per share |
$ | 28.46 | $ | 27.60 | (3.01 | )% | $ | 28.78 | 1.14 | % | ||||||||||
As shown above, our portfolio of MBS generally will be more adversely affected by a 10% increase in interest rates than the same scale decrease in interest rates.
47
Table of Contents
Equity Price Risk
Although limited, we are exposed to equity price risk as a result of our investments in marketable equity securities and investment partnerships. Equity price risk changes as the volatility of equity prices changes or the values of corresponding equity indices change.
While it is impossible to exactly project what factors may affect the prices of equity sectors and how much the effect might be, the table below illustrates the impact a 10% increase and a 10% decrease in the price of the equities held by us would have on the value of our total assets and our book value as of December 31, 2010 (dollars in thousands, except per share amounts).
| Value at December 31, 2010 |
Value of Equity at December 31, 2010 with 10% Increase in Price |
Percent Change |
Value of Equity at December 31, 2010 with 10% Decrease in Price |
Percent Change |
||||||||||||||||
| Assets |
||||||||||||||||||||
| Equity and cost method investments |
$ | 1,960 | $ | 2,156 | 10.00 | % | $ | 1,764 | (10.00 | )% | ||||||||||
| Other |
453,373 | 453,373 | — | 453,373 | — | |||||||||||||||
| Total assets |
$ | 455,333 | $ | 455,529 | 0.04 | % | $ | 455,137 | (0.04 | )% | ||||||||||
| Liabilities |
$ | 238,589 | $ | 238,589 | — | $ | 238,589 | — | ||||||||||||
| Equity |
216,744 | 216,940 | 0.09 | % | 216,548 | (0.09 | )% | |||||||||||||
| Total liabilities and equity |
$ | 455,333 | $ | 455,529 | 0.04 | % | $ | 455,137 | (0.04 | )% | ||||||||||
| Book value per share |
$ | 28.46 | $ | 28.48 | 0.09 | % | $ | 28.43 | (0.09 | )% | ||||||||||
Except to the extent that we sell our marketable equity securities or other investments, or a decrease in their fair value is deemed to be other-than-temporary, an increase or decrease in the fair value of those assets will not directly affect our earnings; however, an increase or decrease in the value of equity method investments will directly affect our earnings.
Critical Accounting Policies
Our financial statements are prepared in conformity with GAAP and follow general practices within the industries in which it operates. The preparation of our financial statements requires us to make estimates and assumptions. These estimates and assumptions affect the reported amounts of assets and liabilities at the date of the financial statements and the reported amounts of revenues and expenses during the reporting period. Although we base our estimates and assumptions on historical experience, when available, and on various other factors that we believe to be reasonable under the circumstances, management exercises significant judgment in the final determination of our estimates. Actual results may differ from these estimates.
Our significant accounting policies are presented in Note 2 to the consolidated financial statements. Our most critical policies that are both very important to the portrayal of our financial condition and results of operations and require management’s most difficult, subjective or complex judgments or estimates are discussed below.
Principal Investing Securities
We account for our holdings in MBS and marketable equity securities in accordance with accounting principles related to accounting for certain investments in debt and equity securities. These principles require that investments in debt securities be designated at the time of acquisition as “held-to-maturity,” “available-for-sale” or “trading,” and investments in equity securities be designated as either “available-for-sale” or “trading.” Nearly
48
Table of Contents
all of our MBS and marketable equity securities are designated as available-for-sale and are carried at their estimated fair values with unrealized gains and losses excluded from earnings and reported in other comprehensive income or loss, a component of equity.
Although we generally intend to hold our MBS until maturity, we may, from time to time, sell any of our MBS as part of the overall management of our business. The available-for-sale designation provides us with the flexibility to sell our MBS in order to act on potential market opportunities or changes in economic conditions to ensure future liquidity and to meet other general corporate purposes as they arise.
The accounting principles related to fair value measurements define fair value as the price that would be received to sell an asset or paid to transfer a liability in an orderly transaction between market participants at the measurement date, not adjusted for transaction costs. These accounting principles also establish a fair value hierarchy that prioritizes the inputs to valuation techniques used to measure fair value into three broad levels giving the highest priority to quoted prices in active markets for identical assets or liabilities (Level 1) and the lowest priority to unobservable inputs (Level 3) as described below:
| Level 1 Inputs— | Unadjusted quoted prices in active markets for identical assets or liabilities that is accessible by us; | |
| Level 2 Inputs— | Quoted prices in markets that are not active or financial instruments for which all significant inputs are observable, either directly or indirectly; and | |
| Level 3 Inputs— | Unobservable inputs for the asset or liability, including our significant assumptions and other market participants. |
Our agency-backed MBS, which are guaranteed by Fannie Mae or Freddie Mac, and other AAA-rated private-label MBS, if any, are generally classified within Level 2 of the fair value hierarchy as they are valued using quoted market prices provided by a broker or dealer, or alternative pricing sources with reasonable levels of price transparency. The independent brokers and dealers providing market prices are those who make markets in these financial instruments.
We classify certain non-agency MBS within Level 3 of the fair value hierarchy because they trade infrequently and, therefore, have little or no price transparency. These MBS include private-label MBS, residual interests in securitizations of non-prime mortgage loans, and collateralized mortgage obligations. We utilize present value techniques based on estimated cash flows of the instrument taking into consideration various assumptions derived by management and used by other market participants. These assumptions are corroborated by evidence such as historical data, risk characteristics, transactions in similar instruments, and completed or pending transactions, when available.
Establishing market value is inherently subjective given the volatile and sometimes illiquid markets for some of our MBS and requires us to make a number of assumptions, including assumptions about the future of interest rates, prepayment rates, discount rates, credit loss rates, and the timing of credit losses. The assumptions we apply are specific to each MBS.
Although we rely on our internal calculations to compute the fair value of these MBS, we request and consider indications of value (mark) from third-party dealers to assist us in our valuation process.
We evaluate available-for-sale securities and equity securities of non-public companies carried at cost for other-than-temporary impairment at least on a quarterly basis, and more frequently when economic or market concerns warrant such evaluation. The value of our MBS and our investments in marketable equity securities can fluctuate significantly. In evaluating these investments for other-than-temporary impairment, consideration is given to (1) the length of time and the extent to which the fair value has been lower than carrying value, (2) the severity of the decline in fair value, (3) the financial condition and near-term prospects of the issuer, (4) our intent to sell, and (5) whether it is more likely than not we would be required to sell the security before
49
Table of Contents
anticipated recovery. If it is determined that an investment impairment is other-than-temporary then the amount that the fair value is below its current basis is recorded as an impairment charge and recorded through earnings. For unrealized losses that are determined to be temporary, a further evaluation is performed to determine the credit portion of the other-than-temporary impairment and the credit portion is recorded through our income statement.
We continue to evaluate unrealized losses recorded in accumulated other comprehensive income (loss) at each reporting date and if we determine at a future date that impairment is other-than-temporary, the applicable unrealized loss will be reclassified from accumulated other comprehensive income (loss) and recorded as a realized loss at the time the determination is made.
For the year ended December 31, 2010, we recorded no other-than-temporary impairment write-downs on the MBS portfolio.
Accounting for Taxes
We provided for income taxes using the asset and liability method. Deferred tax assets and liabilities represent the differences between the financial statement and income tax bases of assets and liabilities using enacted tax rates. The measurement of net deferred tax assets is adjusted by a valuation allowance if, based on our evaluation, it is more likely than not that they will not be realized. We recognize tax positions in the financial statements only when it is more likely than not that the position will be sustained upon examination by the relevant taxing authority based on the technical merits of the position. A position that meets this standard is measured at the largest amount of benefit that will more likely than not be realized upon settlement. A liability is established for differences between positions taken in a tax return and the financial statements.
Recently Issued Accounting Pronouncements
In January 2010, the Financial Accounting Standards Board (FASB) issued amended accounting principles related to accounting for fair value measurements and disclosures. This amendment improved the disclosure requirements related to fair value measurements and disclosures. We adopted this guidance effective June 30, 2010. The adoption of this guidance did not have a significant impact on our consolidated financial statements.
In June 2009, the FASB issued amended accounting principles related to accounting for transfers of financial assets. This amendment improved financial reporting by eliminating the exceptions for qualified special-purpose entities from the consolidation guidance and the exception that permitted sale accounting for certain mortgage securitizations when a transferor has not surrendered control over the transferred financial assets. In addition, comparability and consistency in accounting for transferred financial assets was improved through clarifications of the requirements for isolation and limitations on portions of financial assets that are eligible for sale accounting. We adopted this guidance effective January 1, 2010. The adoption of this guidance did not have a significant impact on our consolidated financial statements.
In June 2009, the FASB issued amended accounting principles related to the consolidation of variable-interest entities. This amendment replaced the quantitative-based risks and rewards calculation for determining which enterprise, if any, has a controlling financial interest in a variable interest entity with an approach focused on identifying which enterprise has the power to direct the activities of a variable interest entity that most significantly impact the entity’s economic performance and the obligation to absorb losses of the entity or the right to receive benefits from the entity. An approach that is expected to be primarily qualitative is considered more effective for identifying which enterprise has a controlling financial interest in a variable interest entity. We adopted this guidance effective January 1, 2010. The adoption of this guidance did not have a significant impact on our consolidated financial statements.
50
Table of Contents
| ITEM 7A. | QUANTITATIVE AND QUALITATIVE DISCLOSURES ABOUT MARKET RISK |
See Item 7 of this Annual Report on Form 10-K, “Management’s Discussion and Analysis of Financial Condition and Results of Operations—Quantitative and Qualitative Disclosures about Market Risk”
| ITEM 8. | FINANCIAL STATEMENTS AND SUPPLEMENTARY DATA |
The information required by this item appears in a subsequent section of this report. See “Index to Consolidated Financial Statements of Arlington Asset Investment Corp.” on page F-1.
| ITEM 9. | CHANGES IN AND DISAGREEMENTS WITH ACCOUNTANTS ON ACCOUNTING AND FINANCIAL DISCLOSURE |
None.
| ITEM 9A. | CONTROLS AND PROCEDURES |
Conclusion Regarding the Effectiveness of Disclosure Controls and Procedures
As of the end of the period covered by this Annual Report on Form 10-K, our management, with the participation of our Chief Executive Officer, Eric F. Billings, and our Chief Financial Officer, Kurt R. Harrington, carried out an evaluation of the effectiveness of our disclosure controls and procedures (as defined under Rule 13a-15(e) under the Securities Exchange Act of 1934, as amended (the Exchange Act)) pursuant to Rule 13a-15(b) of the Exchange Act. Based upon that evaluation, our Chief Executive Officer and Chief Financial Officer concluded that our disclosure controls and procedures, as of the end of the period covered by this Annual Report on Form 10-K, are effective to ensure that information required to be disclosed by us in the reports that we file or submit under the Exchange Act is recorded, processed, summarized and reported, within the time periods specified in the SEC’s rules and forms, and that such information is accumulated and communicated to our management, including our Chief Executive Officer and Chief Financial Officer, as appropriate, to allow timely decisions regarding disclosure.
Management’s Annual Report on Internal Control Over Financial Reporting
Our management is responsible for establishing and maintaining adequate internal control over financial reporting (as defined in Rule 13a-15(f) under the Exchange Act). Our internal control over financial reporting is designed under the supervision of our Chief Executive Officer and Chief Financial Officer to provide reasonable assurance regarding the reliability of financial reporting and the preparation of our financial statements for external purposes in accordance with GAAP.
Our internal control over financial reporting includes policies and procedures that pertain to the maintenance of records that, in reasonable detail, accurately and fairly reflect transactions and dispositions of assets; provide reasonable assurance that transactions are recorded as necessary to permit preparation of financial statements in accordance with generally accepted accounting principles, and that receipts and expenditures are being made only in accordance with authorizations of management and the directors; and provide reasonable assurance regarding prevention or timely detection of unauthorized acquisitions, use or disposition of our assets that could have a material effect on our financial statements.
Because of its inherent limitations, internal control over financial reporting may not prevent or detect misstatements. Also, projections of any evaluation of effectiveness to future periods are subject to the risk that controls may become inadequate because of changes in conditions, or that the degree of compliance with the policies and procedures may deteriorate.
As of December 31, 2010, management conducted an assessment of the effectiveness of our internal control over financial reporting based on the framework established in Internal Control—Integrated Framework issued
51
Table of Contents
by the Committee of Sponsoring Organizations of the Treadway Commission (COSO). Based on this assessment, management has concluded that we maintained effective internal control over financial reporting as of December 31, 2010.
The effectiveness of our internal control over financial reporting as of December 31, 2010 has been audited by PricewaterhouseCoopers LLP, an independent registered public accounting firm, as stated in their report appearing on page F-2, which expresses an unqualified opinion on the effectiveness of our internal control over financial reporting as of December 31, 2010.
Changes In Internal Control Over Financial Reporting
There has been no change in our internal control over financial reporting during the quarter ended December 31, 2010 that has materially affected, or is reasonably likely to materially affect, our internal control over financial reporting.
| ITEM 9B. | OTHER INFORMATION |
None.
52
Table of Contents
PART III
| ITEM 10. | DIRECTORS, EXECUTIVE OFFICERS AND CORPORATE GOVERNANCE |
The information required by Part III, Item 10 of this Annual Report on Form 10-K will be provided in our 2011 Proxy Statement and is hereby incorporated by reference.
| ITEM 11. | EXECUTIVE COMPENSATION |
The information required by Part III, Item 11 of this Annual Report on Form 10-K will be provided in our 2011 Proxy Statement and is hereby incorporated by reference.
| ITEM 12. | SECURITY OWNERSHIP OF CERTAIN BENEFICIAL OWNERS AND MANAGEMENT AND RELATED STOCKHOLDER MATTERS |
The information required by Part III, Item 12 of this Annual Report on Form 10-K will be provided in our 2011 Proxy Statement and is hereby incorporated by reference.
| ITEM 13. | CERTAIN RELATIONSHIPS AND RELATED TRANSACTIONS, AND DIRECTOR INDEPENDENCE |
The information required by Part III, Item 13 of this Annual Report on Form 10-K will be provided in our 2011 Proxy Statement and is hereby incorporated by reference.
| ITEM 14. | PRINCIPAL ACCOUNTANT FEES AND SERVICES |
The information required by Part III, Item 14 of this Annual Report on Form 10-K will be provided in our 2011 Proxy Statement and is hereby incorporated by reference.
53
Table of Contents
PART IV
| ITEM 15. | EXHIBITS AND FINANCIAL STATEMENT SCHEDULES |
(a) (1) Financial Statements. The Arlington Asset Investment Corp. consolidated financial statements for the year ended December 31, 2010, included in Part II, Item 8, of this Annual Report on Form 10-K, are incorporated by reference into this Part IV, Item 15:
| • | Report of Independent Registered Public Accounting Firm (page F-2) |
| • | Consolidated Balance Sheets—Years ended 2010 and 2009 (page F-3) |
| • | Consolidated Statements of Operations—Years ended 2010, 2009 and 2008 (page F-4) |
| • | Consolidated Statements of Changes in Equity—Years ended 2010, 2009 and 2008 (page F-5) |
| • | Consolidated Statements of Cash Flows—Years ended 2010, 2009 and 2008 (page F-8) |
| • | Notes to Consolidated Financial Statements (page F-9) |
(2) Financial Statement Schedules. All schedules are omitted because they are not required or because the information is shown in the financial statements or notes thereto.
(3) Exhibits
| Exhibit |
Exhibit Title | |
| 3.01 | Amended and Restated Articles of Incorporation, as amended (incorporated by reference to Exhibit 3.1 to the Quarterly Report on Form 10-Q filed on November 9, 2009). | |
| 3.02 | Bylaws, as amended (incorporated by reference to Exhibit 3.1 to the Registrant’s Current Report on Form 8-K filed on January 3, 2011). | |
| 4.01 | Form of Specimen Certificate for Class A Common Stock (incorporated by reference to Exhibit 4.01 to the Registrant’s Annual Report on Form 10-K filed on February 24, 2010). | |
| 4.02 | Shareholder Rights Agreement, dated June 5, 2009 (incorporated by reference to Exhibit 4.1 to the Registrant’s Current Report on Form 8-K filed on June 5, 2009). | |
| 10.01 | Friedman, Billings, Ramsey Group, Inc. 2004 Long-Term Incentive Plan (incorporated by reference to Appendix A to the Registrant’s Definitive Proxy Statement filed on April 29, 2004). | |
| 11.01 | Statement regarding Computation of Per Share Earnings (included in Part II, Item 8, and Note 2 to the Registrant’s Consolidated Financial Statements).† | |
| 12.01 | Computation of Ratio of Earnings to Fixed Charges.† | |
| 21.01 | List of Subsidiaries of the Registrant.† | |
| 23.01 | Consent of PricewaterhouseCoopers LLP.† | |
| 24.01 | Power of Attorney (included on the signature page to this Annual Report on Form 10-K and incorporated by reference herein).† | |
| 31.01 | Certification of Chief Executive Officer pursuant to Rule 13a-14(a)/15d-14(a), as adopted pursuant to Section 302 of the Sarbanes-Oxley Act of 2002.† | |
| 31.02 | Certification of Chief Financial Officer pursuant to Rule 13a-14(a)/15d-14(a), as adopted pursuant to Section 302 of the Sarbanes-Oxley Act of 2002.† | |
| 32.01 | Certification of Chief Executive Officer pursuant to 18 U.S.C. Section 1350, as adopted pursuant to Section 906 of the Sarbanes-Oxley Act of 2002.† | |
| 32.02 | Certification of Chief Financial Officer pursuant to 18 U.S.C. Section 1350, as adopted pursuant to Section 906 of the Sarbanes-Oxley Act of 2002.† | |
| † | Filed herewith. |
54
Table of Contents
Pursuant to the requirements of Section 13 or 15(d) of the Securities Exchange Act of 1934, the registrant has duly caused this report to be signed on its behalf by the undersigned, thereunto duly authorized.
| ARLINGTON ASSET INVESTMENT CORP. | ||||||
| Date: February 11, 2011 | By: | /s/ ERIC F. BILLINGS | ||||
| Eric F. Billings | ||||||
| Chief Executive Officer | ||||||
POWER OF ATTORNEY
KNOW ALL MEN BY THESE PRESENTS, that each person whose signature appears below hereby constitutes and appoints Eric F. Billings and Kurt R. Harrington and each of them as his true and lawful attorney-in-fact and agent, with full power of substitution and resubstitution, for him and in his name, place and stead, in any and all capacities, to sign any and all amendments to this Annual Report on Form 10-K for the fiscal year ended December 31, 2010, and to file the same, with all exhibits thereto, and any other documents in connection therewith, with the Securities and Exchange Commission, granting unto said attorneys-in-fact and agents full power and authority to do and perform each and every act and thing requisite and necessary to be done in and about the premises, as fully to all intents and purposes as he might or could do in person, hereby ratifying and confirming all that said attorneys-in-fact and agents or any of them, or their substitute or substitutes, may lawfully do or cause to be done by virtue hereof.
Pursuant to the requirements of the Securities Exchange Act of 1934, this report has been signed below by the following persons on behalf of the registrant and in the capacities and on the dates indicated.
| Signature |
Title |
Date | ||
| /s/ ERIC F. BILLINGS ERIC F. BILLINGS |
Chairman, Chief Executive Officer and Director (Principal Executive Officer) | February 11, 2011 | ||
| /s/ J. ROCK TONKEL, JR. J. ROCK TONKEL, JR. |
President, Chief Operating Officer and Director | February 11, 2011 | ||
| /s/ KURT R. HARRINGTON KURT R. HARRINGTON |
Executive Vice President and Chief Financial Officer (Principal Financial Officer) | February 11, 2011 | ||
| /s/ DANIEL J. ALTOBELLO DANIEL J. ALTOBELLO |
Director | February 11, 2011 | ||
| /s/ DANIEL E. BERCE DANIEL E. BERCE |
Director | February 11, 2011 | ||
| /s/ PETER A. GALLAGHER PETER A. GALLAGHER |
Director | February 11, 2011 | ||
| /s/ RALPH S. MICHAEL III RALPH S. MICHAEL III |
Director | February 11, 2011 | ||
| /s/ WALLACE L. TIMMENY WALLACE L. TIMMENY |
Director | February 11, 2011 | ||
55
Table of Contents
FINANCIAL STATEMENTS OF ARLINGTON ASSET INVESTMENT CORP.
Index to Arlington Asset Investment Corp. Consolidated Financial Statements
F-1
Table of Contents
Report of Independent Registered Public Accounting Firm
To The Board of Directors and Shareholders of
Arlington Asset Investment Corp.:
In our opinion, the accompanying consolidated balance sheets and the related consolidated statements of operations, of changes in equity and of cash flows present fairly, in all material respects, the financial position of Arlington Asset Investment Corp. and its subsidiaries (the “Company”) at December 31, 2010 and 2009, and the results of their operations and their cash flows for each of the three years in the period ended December 31, 2010 in conformity with accounting principles generally accepted in the United States of America. Also in our opinion, the Company maintained, in all material respects, effective internal control over financial reporting as of December 31, 2010, based on criteria established in Internal Control—Integrated Framework issued by the Committee of Sponsoring Organizations of the Treadway Commission (COSO). The Company’s management is responsible for these financial statements, for maintaining effective internal control over financial reporting and for its assessment of the effectiveness of internal control over financial reporting, included in the Management’s Annual Report on Internal Control over Financial Reporting appearing under Item 9A. Our responsibility is to express opinions on these financial statements and on the Company’s internal control over financial reporting based on our integrated audits. We conducted our audits in accordance with the standards of the Public Company Accounting Oversight Board (United States). Those standards require that we plan and perform the audits to obtain reasonable assurance about whether the financial statements are free of material misstatement and whether effective internal control over financial reporting was maintained in all material respects. Our audits of the financial statements included examining, on a test basis, evidence supporting the amounts and disclosures in the financial statements, assessing the accounting principles used and significant estimates made by management, and evaluating the overall financial statement presentation. Our audit of internal control over financial reporting included obtaining an understanding of internal control over financial reporting, assessing the risk that a material weakness exists, and testing and evaluating the design and operating effectiveness of internal control based on the assessed risk. Our audits also included performing such other procedures as we considered necessary in the circumstances. We believe that our audits provide a reasonable basis for our opinions.
A company’s internal control over financial reporting is a process designed to provide reasonable assurance regarding the reliability of financial reporting and the preparation of financial statements for external purposes in accordance with generally accepted accounting principles. A company’s internal control over financial reporting includes those policies and procedures that (i) pertain to the maintenance of records that, in reasonable detail, accurately and fairly reflect the transactions and dispositions of the assets of the company; (ii) provide reasonable assurance that transactions are recorded as necessary to permit preparation of financial statements in accordance with generally accepted accounting principles, and that receipts and expenditures of the company are being made only in accordance with authorizations of management and directors of the company; and (iii) provide reasonable assurance regarding prevention or timely detection of unauthorized acquisition, use, or disposition of the company’s assets that could have a material effect on the financial statements.
Because of its inherent limitations, internal control over financial reporting may not prevent or detect misstatements. Also, projections of any evaluation of effectiveness to future periods are subject to the risk that controls may become inadequate because of changes in conditions, or that the degree of compliance with the policies or procedures may deteriorate.
/s/ PricewaterhouseCoopers LLP
McLean, VA
February 11, 2011
F-2
Table of Contents
ARLINGTON ASSET INVESTMENT CORP.
CONSOLIDATED BALANCE SHEETS
(Dollars in thousands, except per share amounts)
| December 31, | ||||||||
| 2010 | 2009 | |||||||
| ASSETS | ||||||||
| Cash and cash equivalents |
$ | 12,412 | $ | 10,123 | ||||
| Receivables |
||||||||
| Interest |
2,345 | 2,011 | ||||||
| Other |
219 | 20 | ||||||
| Mortgage-backed securities, at fair value |
||||||||
| Available-for-sale |
252,909 | 295,600 | ||||||
| Trading |
174,055 | — | ||||||
| Other investments |
8,287 | 2,580 | ||||||
| Deposits |
4,748 | 2,589 | ||||||
| Prepaid expenses and other assets |
358 | 726 | ||||||
| Total assets |
$ | 455,333 | $ | 313,649 | ||||
| LIABILITIES AND EQUITY | ||||||||
| Liabilities: |
||||||||
| Repurchase agreements |
$ | 190,220 | $ | 126,830 | ||||
| Purchased securities payable |
2,555 | — | ||||||
| Interest payable |
187 | 124 | ||||||
| Dividend payable |
4,655 | — | ||||||
| Derivative liabilities, at fair value |
2,398 | — | ||||||
| Accounts payable, accrued expenses and other liabilities |
16,373 | 13,904 | ||||||
| Accrued compensation and benefits |
7,201 | 5,921 | ||||||
| Long-term debt |
15,000 | 16,857 | ||||||
| Total liabilities |
238,589 | 163,636 | ||||||
| Commitments and Contingencies (Note 8) |
||||||||
| Equity: |
||||||||
| Preferred Stock, $0.01 par value, 25,000,000 shares authorized, none issued and outstanding |
— | — | ||||||
| Class A Common Stock, $0.01 par value, 450,000,000 shares authorized, 7,106,330 and 7,352,774 shares issued and outstanding, respectively |
71 | 74 | ||||||
| Class B Common Stock $0.01 par value, 100,000,000 shares authorized, 566,112 shares issued and outstanding |
6 | 6 | ||||||
| Additional paid-in capital |
1,505,971 | 1,507,394 | ||||||
| Accumulated other comprehensive income, net of taxes |
63,495 | 7,015 | ||||||
| Accumulated deficit |
(1,352,799 | ) | (1,364,476 | ) | ||||
| Total equity |
216,744 | 150,013 | ||||||
| Total liabilities and equity |
$ | 455,333 | $ | 313,649 | ||||
The accompanying notes are an integral part of these consolidated financial statements.
F-3
Table of Contents
ARLINGTON ASSET INVESTMENT CORP.
CONSOLIDATED STATEMENTS OF OPERATIONS
(Dollars in thousands except per share amounts)
| Year Ended December 31, | ||||||||||||
| 2010 | 2009 | 2008 | ||||||||||
| Interest income |
||||||||||||
| Interest on investment securities |
$ | 39,566 | $ | 13,940 | $ | 77,954 | ||||||
| Dividends and other interest income |
1 | 139 | 3,103 | |||||||||
| Interest on loans held for sale |
— | — | 37 | |||||||||
| Total interest income |
39,567 | 14,079 | 81,094 | |||||||||
| Interest expense |
||||||||||||
| Interest on short-term debt |
593 | 495 | 50,554 | |||||||||
| Interest on long-term debt |
562 | 3,150 | 21,764 | |||||||||
| Interest on mortgage loans and mortgage banking operations |
— | — | 401 | |||||||||
| Other interest expense |
— | — | 32 | |||||||||
| Total interest expense |
1,155 | 3,645 | 72,751 | |||||||||
| Net interest income |
38,412 | 10,434 | 8,343 | |||||||||
| Other income (loss), net |
||||||||||||
| Investment gain (loss) |
3,328 | 3,926 | (390,378 | ) | ||||||||
| Other (loss) income |
(14 | ) | (151 | ) | 83,947 | |||||||
| Gain on extinguishment of long-term debt |
— | 160,435 | 39,083 | |||||||||
| Total other income (loss), net |
3,314 | 164,210 | (267,348 | ) | ||||||||
| Income (loss) from continuing operations before other expenses |
41,726 | 174,644 | (259,005 | ) | ||||||||
| Other expenses |
||||||||||||
| Compensation and benefits |
10,660 | 14,366 | 21,780 | |||||||||
| Professional services |
1,263 | 7,053 | 6,056 | |||||||||
| Business development |
97 | 6,577 | 604 | |||||||||
| Occupancy and equipment |
388 | 538 | 1,248 | |||||||||
| Communications |
204 | 246 | 237 | |||||||||
| Other operating expenses |
2,022 | 5,709 | 18,771 | |||||||||
| Total other expenses |
14,634 | 34,489 | 48,696 | |||||||||
| Income (loss) from continuing operations before income taxes |
27,092 | 140,155 | (307,701 | ) | ||||||||
| Income tax provision |
506 | 9,522 | 1,899 | |||||||||
| Net income (loss) from continuing operations, net of taxes |
26,586 | 130,633 | (309,600 | ) | ||||||||
| Loss from discontinued operations, net of taxes |
— | (25,547 | ) | (194,730 | ) | |||||||
| Net income (loss) |
26,586 | 105,086 | (504,330 | ) | ||||||||
| Net loss attributable to noncontrolling interests |
— | (11,459 | ) | (86,867 | ) | |||||||
| Net income (loss) attributable to Arlington Asset Investment Corp. shareholders |
$ | 26,586 | $ | 116,545 | $ | (417,463 | ) | |||||
| Amounts attributable to Arlington Asset Investment Corp. shareholders |
||||||||||||
| Income (loss) from continuing operations, net of taxes |
$ | 26,586 | $ | 130,633 | $ | (309,600 | ) | |||||
| Discontinued operations, net of taxes |
— | (14,088 | ) | (107,863 | ) | |||||||
| Net income (loss) |
$ | 26,586 | $ | 116,545 | $ | (417,463 | ) | |||||
| Earnings per share—basic, attributable to Arlington Asset Investment Corp. shareholders: |
||||||||||||
| Income (loss) from continuing operations |
$ | 3.44 | $ | 17.02 | $ | (40.96 | ) | |||||
| Loss from discontinued operations |
— | (1.83 | ) | (14.27 | ) | |||||||
| Net income (loss) |
$ | 3.44 | $ | 15.19 | $ | (55.23 | ) | |||||
| Earnings per share—diluted, attributable to Arlington Asset Investment Corp. shareholders: |
||||||||||||
| Income (loss) from continuing operations |
$ | 3.38 | $ | 16.69 | $ | (40.96 | ) | |||||
| Loss from discontinued operations |
— | (1.80 | ) | (14.27 | ) | |||||||
| Net income (loss) |
$ | 3.38 | $ | 14.89 | $ | (55.23 | ) | |||||
The accompanying notes are an integral part of these consolidated financial statements.
F-4
Table of Contents
ARLINGTON ASSET INVESTMENT CORP.
CONSOLIDATED STATEMENTS OF CHANGES IN EQUITY
(Dollars in thousands)
| Class A Common Stock (#) |
Class A Amount ($) |
Class B Common Stock (#) |
Class B Amount ($) |
Additional Paid-In Capital |
Accumulated Other Compre- hensive Income (Loss) |
Accumulated Deficit |
Noncontrolling Interest |
Total | Compre- hensive Income (Loss) |
|||||||||||||||||||||||||||||||
| Balances, December 31, |
6,963,323 | $ | 70 | 630,812 | $ | 6 | $ | 1,470,244 | $ | (13,071 | ) | $ | (1,063,558 | ) | $ | 243,061 | $ | 636,752 | ||||||||||||||||||||||
| Net loss |
— | — | — | — | — | — | (417,463 | ) | (86,867 | ) | (504,330 | ) | $ | (504,330 | ) | |||||||||||||||||||||||||
| Conversion of Class B shares to Class A shares |
52,229 | — | (52,228 | ) | — | — | — | — | — | — | — | |||||||||||||||||||||||||||||
| Issuance of Class A common stock |
393,381 | 4 | — | — | 506 | — | — | — | 510 | — | ||||||||||||||||||||||||||||||
| Forfeitures of Class A common stock |
(20,702 | ) | — | — | — | (1,739 | ) | — | — | — | (1,739 | ) | — | |||||||||||||||||||||||||||
| Repurchase of Class A common stock |
(5,966 | ) | — | — | — | (48 | ) | — | — | — | (48 | ) | — | |||||||||||||||||||||||||||
| Stock compensation expense for stock options |
— | — | — | — | 108 | — | — | — | 108 | — | ||||||||||||||||||||||||||||||
| Amortization of Class A common shares issued as stock-based awards |
— | — | — | — | 14,408 | — | — | — | 14,408 | — | ||||||||||||||||||||||||||||||
| Equity in issuance of subsidiary common shares to employees |
— | — | — | — | 11,163 | — | — | — | 11,163 | — | ||||||||||||||||||||||||||||||
| Net decrease in equity related to subsidiary stock compensation transactions |
— | — | — | — | — | — | — | (26,430 | ) | (26,430 | ) | — | ||||||||||||||||||||||||||||
| Other comprehensive income (loss): |
||||||||||||||||||||||||||||||||||||||||
| Net change in unrealized gain (loss) on available-for-sale investment securities, (net of taxes of $-0-) |
— | — | — | — | — | (227 | ) | — | (91 | ) | (318 | ) | (318 | ) | ||||||||||||||||||||||||||
| Net change in unrealized gain (loss) on cash flow hedges (net of taxes of $-0-) |
— | — | — | — | — | 13,180 | — | — | 13,180 | 13,180 | ||||||||||||||||||||||||||||||
| Comprehensive loss |
$ | (491,468 | ) | |||||||||||||||||||||||||||||||||||||
| Balances, December 31, |
7,382,265 | $ | 74 | 578,584 | $ | 6 | $ | 1,494,642 | $ | (118 | ) | $ | (1,481,021 | ) | $ | 129,673 | $ | 143,256 | ||||||||||||||||||||||
F-5
Table of Contents
ARLINGTON ASSET INVESTMENT CORP.
CONSOLIDATED STATEMENTS OF CHANGES IN EQUITY—(Continued)
(Dollars in thousands)
| Class A Common Stock (#) |
Class A Amount ($) |
Class B Common Stock (#) |
Class B Amount ($) |
Additional Paid-In Capital |
Accumulated Other Compre- hensive Income (Loss) |
Accumulated Deficit |
Noncontrolling Interest |
Total | Compre- hensive Income (Loss) |
|||||||||||||||||||||||||||||||
| Balances, December 31, 2008 |
7,382,265 | $ | 74 | 578,584 | $ | 6 | $ | 1,494,642 | $ | (118 | ) | $ | (1,481,021 | ) | $ | 129,673 | $ | 143,256 | ||||||||||||||||||||||
| Net income (loss) |
— | — | — | — | — | — | 116,545 | (11,459 | ) | 105,086 | $ | 105,086 | ||||||||||||||||||||||||||||
| Conversion of Class B shares to Class A shares |
12,469 | — | (12,469 | ) | — | — | — | — | — | — | — | |||||||||||||||||||||||||||||
| Issuance of Class A common stock |
1,816 | — | — | — | 364 | — | — | — | 364 | — | ||||||||||||||||||||||||||||||
| Retirement of Class A common stock |
(27,500 | ) | — | — | — | (275 | ) | — | — | — | (275 | ) | ||||||||||||||||||||||||||||
| Forfeitures of Class A common stock |
(16,276 | ) | — | (3 | ) | — | (213 | ) | — | — | — | (213 | ) | — | ||||||||||||||||||||||||||
| Stock compensation expense for stock options |
— | — | — | — | 23 | — | — | — | 23 | — | ||||||||||||||||||||||||||||||
| Amortization of Class A common shares issued as stock-based awards |
— | — | — | — | 7,795 | — | — | — | 7,795 | — | ||||||||||||||||||||||||||||||
| Equity in issuance of subsidiary common shares to employees |
— | — | — | — | 5,058 | — | — | — | 5,058 | — | ||||||||||||||||||||||||||||||
| Elimination of noncontrolling interest resulting from sale of subsidiary |
— | — | — | — | — | — | — | (118,269 | ) | (118,269 | ) | — | ||||||||||||||||||||||||||||
| Other comprehensive income (loss): |
||||||||||||||||||||||||||||||||||||||||
| Net change in unrealized gain (loss) on available-for-sale investment securities, (net of taxes of $-0-) |
— | — | — | — | — | 7,133 | — | 55 | 7,188 | 7,188 | ||||||||||||||||||||||||||||||
| Comprehensive income |
$ | 112,274 | ||||||||||||||||||||||||||||||||||||||
| Balances, December 31, 2009 |
7,352,774 | $ | 74 | 566,112 | $ | 6 | $ | 1,507,394 | $ | 7,015 | $ | (1,364,476 | ) | $ | — | $ | 150,013 | |||||||||||||||||||||||
F-6
Table of Contents
ARLINGTON ASSET INVESTMENT CORP.
CONSOLIDATED STATEMENTS OF CHANGES IN EQUITY—(Continued)
(Dollars in thousands)
| Class A Common Stock (#) |
Class A Amount ($) |
Class B Common Stock (#) |
Class B Amount ($) |
Additional Paid-In Capital |
Accumulated Other Compre- hensive Income (Loss) |
Accumulated Deficit |
Noncontrolling Interest |
Total | Compre- hensive Income (Loss) |
|||||||||||||||||||||||||||||||
| Balances, December 31, 2009 |
7,352,774 | $ | 74 | 566,112 | $ | 6 | $ | 1,507,394 | $ | 7,015 | $ | (1,364,476 | ) | $ | — | $ | 150,013 | |||||||||||||||||||||||
| Net income |
— | — | — | — | — | — | 26,586 | — | 26,586 | $ | 26,586 | |||||||||||||||||||||||||||||
| Issuance of Class A common stock |
4,353 | — | — | — | 447 | — | — | — | 447 | — | ||||||||||||||||||||||||||||||
| Repurchase of Class A common stock |
(243,815 | ) | (2 | ) | — | — | (4,901 | ) | — | — | — | (4,903 | ) | — | ||||||||||||||||||||||||||
| Forfeitures of Class A common stock |
(6,982 | ) | (1 | ) | — | — | (122 | ) | — | — | — | (123 | ) | — | ||||||||||||||||||||||||||
| Amortization of Class A common shares issued as stock-based awards |
— | — | — | — | 3,153 | — | — | — | 3,153 | — | ||||||||||||||||||||||||||||||
| Other comprehensive income (loss): |
||||||||||||||||||||||||||||||||||||||||
| Net change in unrealized gain (loss) on available-for-sale investment securities, (net of taxes of $-0-) |
— | — | — | — | — | 56,480 | — | — | 56,480 | 56,480 | ||||||||||||||||||||||||||||||
| Comprehensive income |
$ | 83,066 | ||||||||||||||||||||||||||||||||||||||
| Dividends |
(14,909 | ) | (14,909 | ) | ||||||||||||||||||||||||||||||||||||
| Balances, December 31, 2010 |
7,106,330 | $ | 71 | 566,112 | $ | 6 | $ | 1,505,971 | $ | 63,495 | $ | (1,352,799 | ) | $ | — | $ | 216,744 | |||||||||||||||||||||||
The accompanying notes are an integral part of these consolidated financial statements.
F-7
Table of Contents
ARLINGTON ASSET INVESTMENT CORP.
CONSOLIDATED STATEMENTS OF CASH FLOWS
(Dollars in thousands)
| Year Ended December 31, | ||||||||||||
| 2010 | 2009 | 2008 | ||||||||||
| Cash flows from operating activities |
||||||||||||
| Net income (loss) |
$ | 26,586 | $ | 105,086 | $ | (504,330 | ) | |||||
| Adjustments to reconcile net income (loss) to net cash provided by (used in) operating activities |
||||||||||||
| Net (income) loss from investments, mortgage-backed securities, and mortgage portfolios |
(3,328 | ) | (13,651 | ) | 459,388 | |||||||
| Net discount/premium (accretion)/amortization on MBS and loans held for investments |
(12,250 | ) | (2,422 | ) | 1,101 | |||||||
| Gain on extinguishment of long-term debt |
— | (160,435 | ) | (39,083 | ) | |||||||
| Gain on disposition of subsidiary |
— | — | (73,040 | ) | ||||||||
| Depreciation and amortization |
42 | 4,718 | 10,866 | |||||||||
| Other |
3,155 | 26,031 | 38,233 | |||||||||
| Changes in operating assets |
||||||||||||
| Receivables |
||||||||||||
| Interest receivable |
(463 | ) | (1,018 | ) | 4,168 | |||||||
| Other |
(198 | ) | (858 | ) | 28,572 | |||||||
| Due from servicer |
— | — | 1,038 | |||||||||
| Due from clearing broker |
— | (7,132 | ) | (4,024 | ) | |||||||
| Trading securities |
— | (26,517 | ) | (10,067 | ) | |||||||
| Prepaid expenses and other assets |
(1,806 | ) | 7,899 | 21,007 | ||||||||
| Changes in operating liabilities |
||||||||||||
| Accounts payable and accrued expenses |
803 | (5,047 | ) | (29,348 | ) | |||||||
| Purchased securities payable |
2,555 | — | — | |||||||||
| Accrued compensation and benefits |
1,280 | (16,604 | ) | (2,480 | ) | |||||||
| Trading account securities sold but not yet purchased |
— | 12,339 | 8,118 | |||||||||
| Net cash provided by (used in) operating activities |
16,376 | (77,611 | ) | (89,881 | ) | |||||||
| Cash flows from investing activities |
||||||||||||
| Purchases of available-for-sale mortgage-backed securities |
(165,892 | ) | (763,459 | ) | (2,338,797 | ) | ||||||
| Purchases of trading mortgage-backed securities |
(304,494 | ) | — | — | ||||||||
| Proceeds from sales of available-for-sale mortgage-backed securities |
253,760 | 1,050,721 | 2,930,463 | |||||||||
| Proceeds from sales of trading mortgage-backed securities |
113,626 | — | — | |||||||||
| Receipt of principal payments on available-for-sale mortgage-backed securities |
27,191 | 25,394 | 246,923 | |||||||||
| Receipt of principal payments on trading mortgage-backed securities |
12,346 | — | — | |||||||||
| Proceeds from sales of and distributions from other investments |
833 | 14,357 | 39,894 | |||||||||
| Purchases of U.S. Treasury bonds |
— | — | (550,000 | ) | ||||||||
| Proceeds from U.S. Treasury bond maturities |
— | 550,000 | — | |||||||||
| Deconsolidation of FBR Capital Markets cash balance |
— | (122,752 | ) | — | ||||||||
| Other |
(14 | ) | (930 | ) | (11,891 | ) | ||||||
| Net cash (used in) provided by investing activities |
(62,644 | ) | 753,331 | 316,592 | ||||||||
| Cash flows from financing activities |
||||||||||||
| Proceeds from (repayments of) repurchase agreements, net |
63,390 | (936,210 | ) | (618,782 | ) | |||||||
| Dividends paid |
(10,254 | ) | — | — | ||||||||
| Repurchase of common stock and subsidiary stock |
(4,579 | ) | (73,319 | ) | (33,950 | ) | ||||||
| Repayments of long-term debt |
— | (75,769 | ) | (26,643 | ) | |||||||
| Proceeds from subsidiary stock transactions |
— | 165,048 | 791 | |||||||||
| Net cash provided by (used in) financing activities |
48,557 | (920,250 | ) | (678,584 | ) | |||||||
| Net increase (decrease) in cash and cash equivalents |
2,289 | (244,530 | ) | (451,873 | ) | |||||||
| Cash and cash equivalents, beginning of year |
10,123 | 254,653 | 706,526 | |||||||||
| Less: Cash and cash equivalents held by discontinued operations, beginning of year |
— | 207,802 | 383,558 | |||||||||
| Cash and cash equivalents held by continuing operations, beginning of year |
10,123 | 46,851 | 322,968 | |||||||||
| Cash and cash equivalents, end of year |
12,412 | 10,123 | 254,653 | |||||||||
| Less: Cash and cash equivalents held by discontinued operations, end of year |
— | — | 207,802 | |||||||||
| Cash and cash equivalents held by continuing operations, end of year |
$ | 12,412 | $ | 10,123 | $ | 46,851 | ||||||
| Supplemental Cash Flow Information |
||||||||||||
| Cash payments for interest |
$ | 1,001 | $ | 3,666 | $ | 83,023 | ||||||
| Cash payments for taxes |
$ | 700 | $ | 2,623 | $ | 667 | ||||||
Note: See Note 12 for supplemental cash flow information, non-cash transactions.
The accompanying notes are an integral part of these consolidated financial statements.
F-8
Table of Contents
ARLINGTON ASSET INVESTMENT CORP.
NOTES TO CONSOLIDATED FINANCIAL STATEMENTS
(Dollars in thousands, except per share amounts)
Note 1. Organization and Nature of Operations:
Arlington Asset Investment Corp. (the Company or AAIC), formerly known as Friedman, Billings, Ramsey Group, Inc. (FBR Group), is a Virginia corporation. The Company began doing business as Arlington Asset Investment Corp. in the first quarter of 2009. The Company acquires and holds mortgage-related and other assets. The Company’s portfolio consists primarily of agency-backed mortgage-backed securities (agency-backed MBS) and non-agency residential mortgage-backed securities (private-label MBS).
Note 2. Summary of Significant Accounting Policies:
Principles of Consolidation
The consolidated financial statements include the accounts of the Company and its subsidiaries as well as variable interest entities where the Company is determined to be the primary beneficiary in accordance with accounting principles related to consolidation of variable interest entities. All significant intercompany accounts and transactions have been eliminated in consolidation. Certain amounts in the consolidated financial statements and notes for prior periods have been reclassified to conform to the current year’s presentation. These reclassifications had no impact on the previously reported net income, other comprehensive income, total assets or total liabilities.
Use of Estimates
The preparation of the Company’s financial statements, in conformity with accounting principles generally accepted in the United States of America (GAAP), requires the Company to make estimates and assumptions affecting the reported amounts of assets and liabilities at the date of the financial statements and the reported amounts of revenues and expenses during the reporting period. Although the Company based the estimates and assumptions on historical experience, when available, market information, and on various other factors that the Company believes to be reasonable under the circumstances, management exercises significant judgment in the final determination of the estimates. Actual results may differ from these estimates.
Cash Equivalents
Cash equivalents include demand deposits with banks, money market accounts and highly liquid investments with original maturities of three months or less that are not held for sale in the ordinary course of business. As of December 31, 2010 and 2009, approximately 98% and 96%, respectively, of the Company’s cash equivalents were invested in money market funds that invest primarily in U.S. Treasuries and other securities backed by the U.S. government.
Financial Instruments
MBS transactions are recorded as purchases and sales on the date the securities are settled unless the transaction qualifies as a regular-way trade, in which case the transactions are accounted for as purchases or sales on a trade date basis. Any amounts payable or receivable for unsettled trades are recorded as “sold securities receivable” or “purchased securities payable” in the consolidated balance sheets.
Investments in marketable equity securities and MBS are classified as either available-for-sale or trading investments pursuant to accounting principles related to accounting for certain investments in debt and equity securities. These investments are carried at fair value with resulting unrealized gains and losses on
F-9
Table of Contents
available-for-sale securities reflected in accumulated other comprehensive income (loss) in the consolidated balance sheets and unrealized gains and losses on trading securities reflected in net investment gain (loss) in the consolidated statements of operations. Investments in equity securities of non-public companies are carried at cost.
Although the Company generally intends to hold its MBS until maturity, it may, from time to time, sell any of its MBS as part of the overall management of its business. The available-for-sale designation provides the Company with the flexibility to sell its MBS in order to act on potential market opportunities or changes in economic conditions to ensure future liquidity and to meet other general corporate purposes as they arise.
The Company evaluates available-for-sale securities and investments in equity securities of non-public companies carried at cost for other-than-temporary impairment at least on a quarterly basis, and more frequently when economic or market concerns warrant such evaluation. The value of the Company’s investments in marketable equity securities designated as available-for-sale can fluctuate significantly. In evaluating these investments for other-than-temporary impairment, consideration is given to (1) the length of time and the extent to which the fair value has been lower than carrying value, (2) the severity of the decline in fair value, (3) the financial condition and near-term prospects of the issuer, (4) the Company’s intent to sell, and (5) whether it is more likely than not the Company would be required to sell the security before anticipated recovery. If it is determined that an investment impairment is other-than-temporary, then the amount that the fair value is below its current basis is recorded as an impairment charge and recorded through earnings. For unrealized losses that are determined to be temporary, a further evaluation is performed to determine the credit portion of the other-than-temporary impairment and the credit portion is recorded through the Company’s statement of operations.
The Company evaluates unrealized losses recorded in accumulated other comprehensive income (loss) at each reporting date to determine whether the unrealized loss is indicative of an impairment that is other-than-temporary, the applicable unrealized loss will be reclassified from accumulated other comprehensive income (loss) and recorded as a realized loss at the time the determination is made.
Realized gains and losses on sales of non-MBS are determined using the specific identification method. Declines in the value of available-for-sale investments below the Company’s cost basis that are determined to be other-than-temporary are reclassified from accumulated other comprehensive income (loss) and included in net investment gain (loss) in the consolidated statements of operations. Declines in the value of cost method investments below the Company’s basis that are determined to be other-than-temporary are included in net investment gain (loss) in the consolidated statement of operations.
Fair Value of Financial Instruments
The accounting principles related to fair value measurements define fair value as the price that would be received to sell an asset or paid to transfer a liability in an orderly transaction between market participants at the measurement date, not adjusted for transaction costs. These accounting principles also establish a fair value hierarchy that prioritizes the inputs to valuation techniques used to measure fair value into three broad levels giving the highest priority to quoted prices in active markets for identical assets or liabilities (Level 1) and the lowest priority to unobservable inputs (Level 3) as described below:
| Level 1 Inputs— | Unadjusted quoted prices in active markets for identical assets or liabilities that are accessible by the Company; | |
| Level 2 Inputs— | Quoted prices in markets that are not active or financial instruments for which all significant inputs are observable, either directly or indirectly; and | |
| Level 3 Inputs— | Unobservable inputs for the asset or liability, including significant assumptions of the Company and other market participants. | |
F-10
Table of Contents
The Company determines fair values for the following assets and liabilities:
Mortgage-backed securities, at fair value—The Company’s agency-backed MBS, which are generally guaranteed by Fannie Mae or Freddie Mac, and other AAA-rated non-agency or private-label MBS are generally classified within Level 2 of the fair value hierarchy as they are valued after considering quoted market prices provided by a broker or dealer, or alternative pricing sources with reasonable levels of price transparency. The Company reviews broker or pricing service quotes to determine whether the quotes are relevant, for example, whether an active market exists to provide price transparency or whether the quote is an indicative price or a binding offer. The independent brokers and dealers providing market prices are those who make markets in these financial instruments.
The Company classifies certain other non-agency MBS within Level 3 of the fair value hierarchy because they trade infrequently and, therefore, have little or no price transparency. These MBS include private-label MBS. The Company utilizes present value techniques based on estimated cash flows of the instrument taking into consideration various assumptions derived by management and other assumptions used by other market participants. These assumptions are corroborated by evidence such as historical data, risk characteristics, transactions in similar instruments, and completed or pending transactions, when available.
Establishing fair value is inherently subjective given the volatile and sometimes illiquid markets for some of the Company’s MBS and requires management to make a number of assumptions, including assumptions about the future of interest rates, prepayment rates, discount rates, credit loss rates, and the timing of credit losses. The assumptions the Company applies are specific to each MBS. Although the Company relies on the internal calculations to compute the fair value of these MBS, the Company requests and considers indications of value (mark) from third-party dealers to assist in the valuation process.
Other investments—The Company’s other investments consists of investment in equity securities, investment funds, interest-only MBS and other MBS related securities. The Company’s equity securities are classified within Level 1 of the fair value hierarchy if they are valued using quoted market prices. Interest-only MBS and residual interest in securitization of which the Company is not considered the primary beneficiary are classified within Level 3 of the fair value hierarchy.
Derivative instruments—In the normal course of the Company’s operations, the Company is a party to various financial instruments that are accounted for as derivatives in accordance with the accounting principles related to accounting for derivative instruments and hedging activities. These derivatives are generally classified within Level 2 of the fair value hierarchy because they are valued using broker or dealer quotations which are model based calculations based on market-based inputs, including, but not limited to, contractual terms, market prices, yield curves, credit curves, measures of volatility, prepayment rates and correlations of such inputs.
Other—Cash and cash equivalents, interest receivable, repurchase agreements, accounts payable, accrued expenses and other liabilities are reflected in the consolidated balance sheets at their amortized cost, which approximates fair value because of the short term nature of these instruments.
F-11
Table of Contents
The estimated fair value of the Company’s financial instruments are as follows:
| December 31, | ||||||||||||||||
| 2010 | 2009 | |||||||||||||||
| Carrying Amount |
Estimated Fair Value |
Carrying Amount |
Estimated Fair Value |
|||||||||||||
| Financial assets |
||||||||||||||||
| Cash and cash equivalents |
$ | 12,412 | $ | 12,412 | $ | 10,123 | $ | 10,123 | ||||||||
| Interest receivables |
2,345 | 2,345 | 2,011 | 2,011 | ||||||||||||
| Non-interest bearing receivables |
219 | 219 | 20 | 20 | ||||||||||||
| MBS |
||||||||||||||||
| Agency-backed MBS |
174,229 | 174,229 | 136,912 | 136,912 | ||||||||||||
| Private-label MBS |
||||||||||||||||
| Senior securities |
51,038 | 51,038 | 94,380 | 94,380 | ||||||||||||
| Re-REMIC securities |
201,697 | 201,697 | 64,308 | 64,308 | ||||||||||||
| Other investments |
8,287 | 8,287 | 2,580 | 2,580 | ||||||||||||
| Financial liabilities |
||||||||||||||||
| Repurchase agreements |
190,220 | 190,220 | 126,830 | 126,830 | ||||||||||||
| Interest payable |
187 | 187 | 124 | 124 | ||||||||||||
| Short-term debt |
970 | 970 | — | — | ||||||||||||
| Long-term debt |
15,000 | 15,000 | 16,857 | 16,857 | ||||||||||||
| Eurodollar futures |
2,398 | 2,398 | — | — | ||||||||||||
Repurchase Agreements
Securities sold under agreements to repurchase, which are treated as financing transactions for financial reporting purposes, are collateralized by MBS and are carried net by counterparty, when permitted, at the amounts at which the securities subsequently will be repurchased plus accrued interest.
Interest Income
Interest income includes contractual interest payments adjusted for the amortization of premiums and discounts and other deferred costs in accordance with amended accounting principles related to accounting for nonrefundable fees and costs associated with originating or acquiring loans and initial direct costs of leasing.
Effective January 1, 2008, the Company elected to change its method of amortizing and accreting premiums, discounts and other deferred costs on the MBS portfolio. In accordance with the accounting principles related to accounting for nonrefundable fees and costs associated with originating or acquiring loans and initial direct costs of leasing, the Company amortizes and accretes these items into interest income using the interest method over the contractual life of the assets (Contractual Method). Prior to January 1, 2008, the Company amortized and accreted these items using the retrospective method that is, using the interest method over the estimated lives of the assets. This method required a retrospective adjustment of the effective yield each time the Company updated the estimated life of the assets. Actual prepayment experience and estimates of future principal repayments were used in calculating the estimated lives. The retrospective method adjusted unamortized premium or discount amounts as if the new estimate had been known since the original acquisition date of the assets, on a cumulative basis. While both methods are acceptable under GAAP, the Company believes the Contractual Method is preferable to the retrospective method because under the Contractual Method, the income effects of premiums, discounts and other deferred costs are recognized in a manner that is reflective of the actual behavior of the underlying assets during the period in which the behavior occurs while also reflecting the contractual terms of the assets without regard to change in estimated prepayments based on assumptions about future activities.
F-12
Table of Contents
The cumulative effect of the change to the Company’s accumulated deficit as of January 1, 2008 was a decrease of $225, or 0.02%.
Based on the Company’s estimates of the expected cash flows associated with the discounted private-label MBS, a portion of the purchase discount that the Company is entitled to earn which the Company considers to be a credit reserve against future potential credit losses, are not accreted into interest income. The amount designated as credit reserve is adjusted over time, based on the actual performance of the security, its underlying collateral, actual and projected cash flow from such collateral, economic conditions and other factors. If the performance of a security with a credit reserve is more favorable than forecasted, a portion of the amount designated as credit reserve is accreted into interest income over time. Conversely, if the performance of a security with a credit reserve is less favorable than forecasted, additional amounts of the purchase discount is designated as a credit reserve.
Stock-Based Compensation
The Company accounts for stock-based compensation in accordance with accounting principles related to share-based payment which requires fair value method of accounting. Under the fair value based method, compensation cost is measured at the grant date based on the value of the award and is recognized over the service period, which is usually the vesting period. Expected forfeitures are included in determining share-based employee compensation cost. Share-based awards that do not require future services are expensed immediately.
Income Taxes
Income taxes are provided for using the asset and liability method. Deferred tax assets and liabilities represent the differences between the financial statement and income tax bases of assets and liabilities using enacted tax rates. The measurement of net deferred tax assets is adjusted by a valuation allowance if, based on the Company’s evaluation, it is more likely than not that they will not be realized. The Company recognizes tax positions in the financial statements only when it is more likely than not that the position will be sustained upon examination by the relevant taxing authority based on the technical merits of the position. A position that meets this standard is measured at the largest amount of benefit that will more likely than not be realized upon settlement. A liability is established for differences between positions taken in a tax return and the financial statements.
The Company is subject to corporate income tax on its taxable income and gains that are not offset by the net operating loss (NOL) and net capital loss (NCL) carry-forwards.
Other Comprehensive Income
Comprehensive income includes net income as currently reported by the Company on the consolidated statements of operations adjusted for other comprehensive income. Other comprehensive income for the Company represents (1) changes in unrealized gains and losses related to the Company’s MBS and equity securities accounted for as available-for-sale with changes in fair value recorded through shareholders’ equity and (2) changes in unrealized gains and losses related to cash flow hedges with changes in fair value recorded through shareholders’ equity to the extent the hedges are effective.
Reverse Stock Split
On October 1, 2009, the Company announced a 1-for-20 reverse split of its Class A and Class B common stock in accordance with the previously approved shareholder authorization. The reverse stock split was effective on October 6, 2009. Proportional adjustments were made to outstanding common stock, stock options and other equity incentive awards and equity compensation plans. The number of authorized shares of common stock did not change. (See Note 9) Therefore, the disclosures and calculations related to share information have been adjusted to reflect the impact of the reverse stock split.
F-13
Table of Contents
Earnings Per Share
Basic earnings per share includes no dilution and is computed by dividing net income or loss available to common shareholders by the weighted-average number of common shares outstanding for the respective period. Diluted earnings per share includes the impact of dilutive securities such as stock options. The following table presents the computations of basic and diluted earnings per share for the years ended December 31, 2010, 2009 and 2008:
| Year Ended December 31, | ||||||||||||||||||||||||
| 2010 | 2009 | 2008 | ||||||||||||||||||||||
| Basic | Diluted | Basic | Diluted | Basic | Diluted | |||||||||||||||||||
| Weighted average shares outstanding |
||||||||||||||||||||||||
| Common stock (in thousands) |
7,734 | 7,734 | 7,675 | 7,675 | 7,558 | 7,558 | ||||||||||||||||||
| Stock options and unvested restricted stock (in thousands) |
— | 139 | — | 150 | — | — | ||||||||||||||||||
| Weighted average common and common equivalent shares outstanding (in thousands) |
7,734 | 7,873 | 7,675 | 7,825 | 7,558 | 7,558 | ||||||||||||||||||
| Net income (loss) applicable to common stock |
$ | 26,586 | $ | 26,586 | $ | 116,545 | $ | 116,545 | $ | (417,463 | ) | $ | (417,463 | ) | ||||||||||
| Income (loss) per common share |
$ | 3.44 | $ | 3.38 | $ | 15.19 | $ | 14.89 | $ | (55.23 | ) | $ | (55.23 | ) | ||||||||||
As of December 31, 2010, 2009 and 2008, there were, 7,625, 7,625 and 27,189, respectively, options to purchase shares of common stock were outstanding. The diluted earnings per share for the years ended December 31, 2010 and 2009 did not include the antidilutive effect of 54,794 and 193,200 shares, respectively, of restricted stock units, stock options, and restricted stock. As a result of the net loss for the year ended December 31, 2008, the diluted earnings per share did not include the dilutive and antidilutive effects of 392,030 shares of restricted stock units, stock options, and restricted stock. See Note 9 for detail of total stock options outstanding.
Recent Accounting Pronouncements
In January 2010, the Financial Accounting Standards Board (FASB) issued amended accounting principles related to accounting for fair value measurements and disclosures. This amendment improved the disclosure requirements related to fair value measurements and disclosures. The Company adopted this guidance effective as of June 30, 2010. The Company’s adoption of this guidance did not have a significant impact on its consolidated financial statements.
In June 2009, the FASB issued amended accounting principles related to accounting for transfers of financial assets. This amendment improved financial reporting by eliminating the exceptions for qualified special-purpose entities from the consolidation guidance and the exception that permitted sale accounting for certain mortgage securitizations when a transferor has not surrendered control over the transferred financial assets. In addition, comparability and consistency in accounting for transferred financial assets was improved through clarifications of the requirements for isolation and limitations on portions of financial assets that are eligible for sale accounting. The Company adopted this guidance effective as of January 1, 2010. The Company’s adoption of this guidance did not have a significant impact on its consolidated financial statements.
In June 2009, the FASB issued amended accounting principles related to the consolidation of variable-interest entities. This amendment replaced the quantitative-based risks and rewards calculation for determining which enterprise, if any, has a controlling financial interest in a variable interest entity with an approach focused on identifying which enterprise has the power to direct the activities of a variable interest entity that most significantly impact the entity’s economic performance and the obligation to absorb losses of the entity or the
F-14
Table of Contents
right to receive benefits from the entity. An approach that is expected to be primarily qualitative is considered more effective for identifying which enterprise has a controlling financial interest in a variable interest entity. The Company adopted this guidance effective as of January 1, 2010. The Company’s adoption of this guidance did not have a significant impact on its consolidated financial statements.
In June 2009, the FASB issued guidance related to the FASB Accounting Standards Codification and the hierarchy of generally accepted accounting principles. This guidance established the FASB Accounting Standards Codification™ (Codification or ASC) as the single source of authoritative GAAP to be applied by nongovernmental entities. Rules and interpretive releases of the Securities and Exchange Commission (SEC) under authority of federal securities laws are also sources of authoritative GAAP for SEC registrants. Following the Codification, the Board does not issue new standards in the form of Statements, FASB Staff Positions or Emerging Issues Task Force Abstracts. Instead, it issues Accounting Standards Updates, which serves to update the Codification, provides background information about the guidance and provides the basis for conclusions on the changes to the Codification. The Company implemented the Codification in the quarter ended September 30, 2009. The implementation of the Codification did not impact the Company’s consolidated financial statements.
Note 3. Sale of FBR Capital Markets Shares and Discontinued Operations:
Prior to May 20, 2009, the Company consolidated the results of its former subsidiary FBR Capital Markets Corporation (FBR Capital Markets) because the Company’s then wholly-owned subsidiary, FBR TRS Holdings, Inc., owned 56% of the outstanding shares of FBR Capital Markets’ common stock. The Company liquidated 16,667,000, 1,500,000, 411,032 and 14,755,017 shares of FBR Capital Markets common stock on May 20, June 19, July 15, and October 28, 2009, respectively, resulting in no remaining holdings in FBR Capital Markets as of October 28, 2009. As a result, effective May 20, 2009, the Company no longer had majority control of FBR Capital Markets and therefore deconsolidated the results of FBR Capital Markets. Subsequently, with the sale of the remaining interest in FBR Capital Markets on October 28, 2009, the Company presented the results of operations related to FBR Capital Markets as discontinued operations in accordance with the guidance provided for the impairment or disposal of long-lived assets. The Company received $165,048 in net proceeds, recognizing a net gain of $833 from the sale of FBR Capital Markets common stock during 2009.
Summarized financial information for discontinued FBR Capital Markets operations is shown below.
| Year Ended December 31, | ||||||||
| 2009 | 2008 | |||||||
| Revenues |
||||||||
| Investment banking |
$ | 12,715 | $ | 96,950 | ||||
| Institutional brokerage |
62,544 | 138,575 | ||||||
| Asset management |
5,069 | 15,335 | ||||||
| Net investment loss |
(345 | ) | (81,335 | ) | ||||
| Interest income |
971 | 23,382 | ||||||
| Other |
121 | 1,458 | ||||||
| Total revenues |
81,075 | 194,365 | ||||||
| Interest expense |
252 | 12,457 | ||||||
| Revenue, net of interest expense |
$ | 80,823 | $ | 181,908 | ||||
| Total expenses and income tax provision |
$ | 107,203 | $ | 376,638 | ||||
| Net loss |
$ | (26,380 | ) | $ | (194,730 | ) | ||
| Gain on sale of FBR Capital Markets shares, net |
833 | — | ||||||
| Net loss from discontinued operations |
$ | (25,547 | ) | $ | (194,730 | ) | ||
There were no results of operations related to discontinued operations during the year ended December 31, 2010 and there were no assets and liabilities related to discontinued operations as of December 31, 2010 and 2009.
F-15
Table of Contents
Note 4. Financial Instruments:
Fair Value Hierarchy
The following tables set forth, by level within the fair value hierarchy, financial instruments accounted for under accounting principles related to fair value measurements as of December 31, 2010 and 2009. As required by these accounting principles, assets and liabilities that are measured at fair value are classified in their entirety based on the lowest level of input that is significant to the fair value measurement.
Financial Instruments Measured at Fair Value on a Recurring Basis
| December 31, 2010 | ||||||||||||||||
| Total | Level 1 | Level 2 | Level 3 | |||||||||||||
| MBS, at fair value |
||||||||||||||||
| Trading |
||||||||||||||||
| Agency-backed MBS |
$ | 174,055 | $ | — | $ | 174,055 | $ | — | ||||||||
| Available-for-sale |
||||||||||||||||
| Agency-backed MBS |
174 | — | 174 | $ | — | |||||||||||
| Private-label MBS |
||||||||||||||||
| Senior securities |
51,038 | — | — | 51,038 | ||||||||||||
| Re-REMIC securities |
201,697 | — | — | 201,697 | ||||||||||||
| Total available-for-sale |
252,909 | — | 174 | 252,735 | ||||||||||||
| Total MBS |
426,964 | — | 174,229 | 252,735 | ||||||||||||
| Eurodollar futures, at fair value |
(2,398 | ) | — | (2,398 | ) | — | ||||||||||
| Interest-only MBS, at fair value |
6,327 | — | — | 6,327 | ||||||||||||
| Total |
$ | 430,893 | $ | — | $ | 171,831 | $ | 259,062 | ||||||||
| December 31, 2009 | ||||||||||||||||
| Total | Level 1 | Level 2 | Level 3 | |||||||||||||
| MBS, at fair value |
||||||||||||||||
| Available-for-sale |
||||||||||||||||
| Agency-backed MBS |
$ | 136,912 | $ | — | $ | 136,912 | $ | — | ||||||||
| Private-label MBS |
||||||||||||||||
| Senior securities |
94,380 | — | — | 94,380 | ||||||||||||
| Re-REMIC securities |
64,308 | — | — | 64,308 | ||||||||||||
| Total MBS |
$ | 295,600 | $ | — | $ | 136,912 | $ | 158,688 | ||||||||
The total financial assets measured and reported at fair value on a recurring basis and classified within level 3 were $259,062, or 56.90% and $158,688, or 50.59% of the Company’s total assets as of December 31, 2010 and 2009, respectively.
There were no transfers of securities in or out of Levels 1, 2 or 3 during the years ended December 31, 2010 and 2009.
Level 3 Financial Instruments Measured at Fair Value on a Recurring Basis
As of December 31, 2010, the fair value of the Company’s Level 3, private-label MBS, available-for-sale was $252,735. These securities are primarily senior and re-REMIC tranches in securitization trusts issued between 2005 and 2010. The senior securities represent interests in securitizations that have the first right to cash flows and absorb losses last. The re-REMIC securities category represents interests in re-securitizations of senior
F-16
Table of Contents
residential mortgage-backed securities (RMBS) and pro-rata mezzanine securities. For re-REMIC securities, the cash flows from, and any credit losses absorbed by, the underlying RMBS are allocated among the re-REMIC securities issued in the re-securitization transactions based on the re-REMIC structure. For example, prime and non-prime residential senior securities have been resecuritized to create a two-tranche structure with a re-REMIC senior security and a re-REMIC subordinated security. In these re-REMIC securities, all principal payments from the underlying securities are directed to the re-REMIC senior security until the face value is fully paid off. Thereafter, all principal payments are directed to the re-REMIC subordinated security. For pro-rata mezzanine securities, principal payments from the underlying RMBS are typically allocated concurrently and proportionally to the mezzanine securities along with senior securities. The re-REMIC subordinated and mezzanine securities absorb credit losses first, if any, however, these credit losses occur only when credit losses exceed the credit protection provided to the underlying securities. Senior, re-REMIC and mezzanine securities receive interest while any face value is outstanding.
As of December 31, 2010, the Company’s senior securities and re-REMIC securities are collateralized by residential Prime and Alt-A mortgage loans and have an original loan-to-value of 71%, original FICO score of 727, three month prepayment rate of 17% and recent three-month loss severities of 45%. These underlying collateral loans have a weighted-average coupon rate of 5.67%. These securities are currently rated below investment grade. The significant inputs for the valuation model include the following weighted averages:
| December 31, | ||||||||||||||||
| 2010 | 2009 | |||||||||||||||
| Senior Securities |
Re-REMIC Securities |
Senior Securities |
Re-REMIC Securities |
|||||||||||||
| Discount rate |
7.46 | % | 13.64 | % | 13.20 | % | 14.83 | % | ||||||||
| Default rate |
8.15 | % | 6.22 | % | 8.25 | % | 8.22 | % | ||||||||
| Loss severity rate |
48.54 | % | 42.10 | % | 57.08 | % | 53.08 | % | ||||||||
| Prepayment rate |
15.08 | % | 15.15 | % | 14.90 | % | 14.16 | % | ||||||||
The tables below set forth changes in the fair value and gains and losses of the Company’s Level 3 financial assets and liabilities that are measured at fair value on a recurring basis for the years ended December 31, 2010 and 2009.
| Year Ended December 31, 2010 | ||||||||||||
| Senior Securities |
Re-REMIC Securities |
Total | ||||||||||
| Beginning balance, January 1, 2010 |
$ | 94,380 | $ | 64,308 | $ | 158,688 | ||||||
| Total net gains (losses) (realized/unrealized) |
||||||||||||
| Included in earnings |
6,518 | 4,316 | 10,834 | |||||||||
| Included in other comprehensive income |
3,392 | 51,599 | 54,991 | |||||||||
| Purchases |
34,153 | 125,058 | 159,211 | |||||||||
| Sales |
(78,899 | ) | (38,992 | ) | (117,891 | ) | ||||||
| Principal payoffs |
(13,649 | ) | (11,763 | ) | (25,412 | ) | ||||||
| Net accretion of discount |
5,143 | 7,171 | 12,314 | |||||||||
| Ending balance, December 31, 2010 |
$ | 51,038 | $ | 201,697 | $ | 252,735 | ||||||
| The amount of net gains (losses) for the period included in earnings attributable to the change in unrealized gains (losses) relating to Level 3 assets still held at the reporting date |
$ | — | $ | — | $ | — | ||||||
F-17
Table of Contents
| Year Ended December 31, 2009 | ||||||||||||
| Senior Securities |
Re-REMIC Securities |
Total | ||||||||||
| Beginning balance, January 1, 2009 |
$ | 61,466 | $ | 4,420 | $ | 65,886 | ||||||
| Total net gains (losses) (realized/unrealized) |
||||||||||||
| Included in earnings |
5,747 | 2,738 | 8,485 | |||||||||
| Included in other comprehensive income |
4,527 | 3,456 | 7,983 | |||||||||
| Purchases |
101,229 | 63,474 | 164,703 | |||||||||
| Sales |
(72,712 | ) | (8,100 | ) | (80,812 | ) | ||||||
| Principal payoffs |
(7,731 | ) | (2,565 | ) | (10,296 | ) | ||||||
| Net accretion of discount |
1,854 | 885 | 2,739 | |||||||||
| Ending balance, December 31, 2009 |
$ | 94,380 | $ | 64,308 | $ | 158,688 | ||||||
| The amount of net gains (losses) for the period included in earnings attributable to the change in unrealized gains (losses) relating to Level 3 assets still held at the reporting date |
$ | — | $ | 780 | $ | 780 | ||||||
Gains and losses included in earnings for the years ended December 31, 2010 and 2009 are reported in the following income statement line description as follows:
| Other income (loss), Investment gain (loss) | ||||||||
| 2010 | 2009 | |||||||
| Total gains (losses) included in earnings for the period |
$ | 10,834 | $ | 8,485 | ||||
| Change in unrealized gains (losses) relating to Level 3 assets still held at the reporting date |
$ | — | $ | 780 | ||||
Level 3 Financial Instruments Measured at Fair Value on a Non-Recurring Basis
The Company also measures certain financial assets at fair value on a non-recurring basis. Adjustments to the fair value of these assets usually result from the application of lower-of-cost-or-market accounting or write-downs of individual assets due to impairments. Due to the nature of these financial assets, enterprise values are primarily used to value these financial assets. In determining the enterprise value, the Company analyzes various financial, performance and market factors to estimate fair value, including where applicable, market trading activity. As a result, these financial assets are classified within Level 3 of the fair value hierarchy. For the year ended December 31, 2010, there were no changes to the carrying value of these financial assets. For the year ended December 31, 2009, the Company recognized $1,086 in losses reducing the carrying value of those assets measured at fair value on a non-recurring basis.
MBS, at Fair Value
MBS, at fair value(1) (2), consisted of the following as of the dates indicated:
| December 31, 2010 | December 31, 2009 | |||||||||||||||||||||||||||||||||||||||
| Fair Value |
Net Unamortized Premium (Discount) |
Percent | Weighted Average Life |
Weighted Average Rating(3) |
Fair Value |
Net Unamortized Premium (Discount) |
Percent | Weighted Average Life |
Weighted Average Rating(3) |
|||||||||||||||||||||||||||||||
| Trading |
||||||||||||||||||||||||||||||||||||||||
| Fannie Mae |
$ | 174,055 | $ | 7,329 | 40.77 | % | 4.7 | AAA | $ | — | $ | — | — | — | — | |||||||||||||||||||||||||
| Available-for-sale: |
||||||||||||||||||||||||||||||||||||||||
| Agency-backed |
||||||||||||||||||||||||||||||||||||||||
| Fannie Mae |
174 | — | 0.04 | % | 3.3 | AAA | 11,021 | 311 | 3.73 | % | 4.12 | AAA | ||||||||||||||||||||||||||||
| Freddie Mac |
— | — | — | — | — | 125,891 | 5,224 | 42.59 | % | 4.14 | AAA | |||||||||||||||||||||||||||||
| Private-label |
||||||||||||||||||||||||||||||||||||||||
| Senior securities |
51,038 | (20,812 | ) | 11.95 | % | 5.6 | CCC | 94,380 | (53,554 | ) | 31.92 | % | 6.79 | CCC | ||||||||||||||||||||||||||
| Re-REMIC securities |
201,697 | (168,282 | ) | 47.24 | % | 9.2 | NR | 64,308 | (96,507 | ) | 21.76 | % | 7.25 | NR | ||||||||||||||||||||||||||
| $ | 426,964 | $ | (181,765 | ) | 100.00 | % | $ | 295,600 | $ | (144,526 | ) | 100.00 | % | |||||||||||||||||||||||||||
F-18
Table of Contents
| (1) | The Company’s MBS portfolio is primarily comprised of adjustable-rate MBS. The weighted-average coupon of the MBS portfolio at December 31, 2010 and 2009 was 5.13% and 5.49%, respectively. |
| (2) | As of December 31, 2010 and 2009, $233,885 and $133,590, respectively, each representing fair value of the Company’s MBS investments were pledged as collateral for repurchase agreements. |
| (3) | The securities issued by Fannie Mae and Freddie Mac are not rated by any rating agency; however, they are commonly thought of as having an implied rating of “AAA.” There is no assurance, however, that these securities would receive such a rating if they were ever rated by a rating agency. |
The Company has generally purchased private-label MBS at a discount. The Company, at minimum on a quarterly basis, estimates the future expected cash flows based on the Company’s observation of current information and events and applying a number of assumptions related to prepayment rates, interest rates, default rates, and the timing and amount of credit losses. These assumptions are difficult to predict as they are subject to uncertainties and contingencies related to future events that may impact the Company’s estimates and its interest income.
Based on the Company’s estimates of the expected cash flows associated with its discounted private-label MBS, a portion of the purchase discount that the Company is entitled to earn, which the Company considers to be a credit reserve against future potential credit losses, may not be accreted into interest income. The amount designated as credit reserve may be adjusted over time, based on the actual performance of the security, its underlying collateral, actual and projected cash flow from such collateral, economic conditions and other factors. If the performance of a security with a credit reserve is more favorable than forecasted, a portion of the amount designated as credit reserve may be accreted into interest income over time. Conversely, if the performance of a security with a credit reserve is less favorable than forecasted, additional amounts of the purchase discount may be designated as a credit reserve, or impairment charges and write-downs of such securities to a new cost basis could result.
The following tables present the changes of the unamortized discount and designated credit reserves on available-for-sale, private-label MBS for the years ended December 31, 2010 and 2009.
| Year Ended December 31, 2010 | ||||||||||||||||
| Senior Securities | Re-REMIC Securities | |||||||||||||||
| Unamortized Discount |
Credit Reserve |
Unamortized Discount |
Credit Reserve |
|||||||||||||
| Beginning balance, January 1, 2010 |
$ | 51,051 | $ | 2,503 | $ | 91,610 | $ | 4,897 | ||||||||
| Accretion of discount |
(5,143 | ) | — | (7,169 | ) | — | ||||||||||
| Reclassifications, net |
2,236 | (2,236 | ) | 4,235 | (4,235 | ) | ||||||||||
| Acquisitions |
13,591 | 477 | 124,834 | 9,755 | ||||||||||||
| Sales |
(41,476 | ) | (191 | ) | (51,122 | ) | (4,523 | ) | ||||||||
| Ending balance, December 31, 2010 |
$ | 20,259 | $ | 553 | $ | 162,388 | $ | 5,894 | ||||||||
| Year Ended December 31, 2009 | ||||||||||||||||
| Senior Securities | Re-REMIC Securities | |||||||||||||||
| Unamortized Discount |
Credit Reserve |
Unamortized Discount |
Credit Reserve |
|||||||||||||
| Beginning balance, January 1, 2009 |
$ | — | $ | — | $ | — | $ | — | ||||||||
| Accretion of discount |
(1,854 | ) | — | (885 | ) | — | ||||||||||
| Acquisitions |
59,174 | 2,503 | 113,353 | 4,897 | ||||||||||||
| Sales |
(6,269 | ) | — | (20,858 | ) | — | ||||||||||
| Ending balance, December 31, 2009 |
$ | 51,051 | $ | 2,503 | $ | 91,610 | $ | 4,897 | ||||||||
For the securities acquired during the year ended December 31, 2010, the contractually required payments receivable was $490,142, the cash flow expected to be collected was $381,987 and the fair value at the acquisition date was $156,505.
F-19
Table of Contents
Other Investments
The Company’s other investments consisted of the following as of the dates indicated:
| December 31, | ||||||||
| 2010 | 2009 | |||||||
| Interest-only MBS |
$ | 6,327 | $ | — | ||||
| Non-public equity securities |
975 | 1,478 | ||||||
| Investments funds |
985 | 1,102 | ||||||
| Total other investments |
$ | 8,287 | $ | 2,580 | ||||
The Company’s available-for-sale securities consist primarily of MBS. In accordance with accounting principles related to accounting for certain investments in debt and equity securities, the securities are carried at fair value with resulting unrealized gains and losses reflected as other comprehensive income or loss. Gross unrealized gains and losses on these securities were the following as of the dates indicated:
| December 31, 2010 | ||||||||||||||||
| Amortized Cost/ Cost Basis(1) |
Unrealized | Fair Value | ||||||||||||||
| Gains | Losses | |||||||||||||||
| Agency-backed MBS |
$ | 163 | $ | 11 | $ | — | $ | 174 | ||||||||
| Private-label MBS |
||||||||||||||||
| Senior securities |
43,161 | 7,877 | — | 51,038 | ||||||||||||
| Re-REMIC securities |
146,844 | 54,853 | — | 201,697 | ||||||||||||
| Total |
$ | 190,168 | $ | 62,741 | $ | — | $ | 252,909 | ||||||||
| (1) | The amortized cost of MBS includes unamortized net discounts of $181,765 at December 31, 2010. |
| December 31, 2009 | ||||||||||||||||
| Amortized Cost/ Cost Basis(1) |
Unrealized | Fair Value | ||||||||||||||
| Gains | Losses | |||||||||||||||
| Agency-backed MBS |
$ | 137,839 | $ | 10 | $ | (937 | ) | $ | 136,912 | |||||||
| Private-label MBS |
||||||||||||||||
| Senior securities |
89,894 | 4,533 | (47 | ) | 94,380 | |||||||||||
| Re-REMIC securities |
60,851 | 3,539 | (82 | ) | 64,308 | |||||||||||
| Total |
$ | 288,584 | $ | 8,082 | $ | (1,066 | ) | $ | 295,600 | |||||||
| (1) | The amortized cost of MBS includes unamortized net discounts of $144,526 at December 31, 2009. |
The Company recorded no other-than-temporary impairments on MBS during the years ended December 31, 2010 and 2009. The Company recorded other-than-temporary impairment loss of $200,550 for the year ended December 31, 2008 related to continued deterioration in credit quality on certain MBS investments with a cost basis of $2,061,112. There were no securities with unrealized losses as of December 31, 2010.
The following table presents the results of sales of MBS for the periods indicated:
| Year Ended December 31, | ||||||||
| 2010 | 2009 | |||||||
| Proceeds from Sale |
$ | 371,258 | $ | 600,325 | ||||
| Gross Gain |
11,025 | 7,538 | ||||||
| Gross Loss |
1,107 | 2,978 | ||||||
F-20
Table of Contents
The Company recorded no other-than-temporary impairment losses on marketable equity securities during the years ended December 31, 2010 and 2009. The Company recorded other-than-temporary impairment losses of $1,225 for the year ended December 31, 2008 related to marketable equity securities with an original cost basis of $1,519. During the year ended December 31, 2008, the Company also recognized other-than-temporary impairment loss of $15,271 in a residual interest in a securitization of non-prime mortgage loans. No such losses were recognized for the years ended December 31, 2010 and 2009.
For private equity investments carried at cost, at each reporting date, the Company evaluates its portfolio of such investments for impairment, including consideration of the severity and duration of factors affecting the fair value of these investments. During the years ended December 31, 2009, and 2008, the Company recorded other-than-temporary impairment losses of $1,086 and $20,260, respectively, in the consolidated statements of operations reflecting the Company’s evaluation of the estimated fair value of private equity investments with a remaining cost basis of $452 and $10,309, respectively. No such losses were recognized for the year ended December 31, 2010.
Note 5. Borrowings:
Repurchase Agreements
The Company has entered into repurchase agreements to fund its investments in MBS and U.S. Treasury bonds. As of December 31, 2010, the amount at risk related to $19,852 of repurchase agreements with Credit Suisse Securities USA LLC was $31,943, or 14.74% of the Company’s equity with a weighted average maturity of 35 days. As of December 31, 2009, the Company had no amount at risk greater than 10% of equity. The following tables provide information regarding the Company’s outstanding repurchase agreement borrowings as of the dates and periods indicated:
| December 31, | ||||||||
| 2010 | 2009 | |||||||
| Outstanding balance |
$ | 190,220 | $ | 126,830 | ||||
| Value of assets pledged as collateral |
||||||||
| Agency-backed MBS |
174,055 | 133,590 | ||||||
| Private-label MBS |
59,830 | — | ||||||
| Cash |
1,300 | — | ||||||
| Weighted-average rate |
0.53 | % | 0.27 | % | ||||
| Weighted-average term to maturity |
15.4 days | 40.6 days | ||||||
| Weighted-average outstanding balance during the year |
$ | 157,968 | $ | 89,554 | ||||
| Weighted-average rate during the year |
0.37 | % | 0.55 | % | ||||
Long-Term Debt
As of December 31, 2010 and 2009, the Company had $15,000 of outstanding long-term debentures. The long-term debentures accrue and require payments of interest quarterly at an annual rate of three-month LIBOR plus 2.25% to 3.00%. The weighted average interest rate on these long-term debentures was 3.04% as of December 31, 2010. All of these borrowings mature between 2033 and 2035. The Company extinguished $236,689 and $65,811 of this long-term debt at a gain of $160,435 and $39,083 during 2009 and 2008, respectively. There were no extinguishments of long-term debt during the year ended December 31, 2010.
Note 6. Derivative Financial Instruments and Hedging Activities:
In the normal course of its operations, the Company is a party to financial instruments that are accounted for as derivative financial instruments in accordance with the accounting principles related to accounting for derivative instruments and hedging activities. These instruments may include interest rate swaps, Eurodollar futures contracts, and certain commitments to purchase and sell MBS.
F-21
Table of Contents
During the year ended December 31, 2010, the Company entered into Eurodollar futures contracts to hedge certain MBS and related borrowings and other long-term debt. These Eurodollar futures contracts are not designated as hedges under the accounting principles related to accounting for derivatives and hedging. The changes in fair value on these derivatives are recorded to net investment gain or loss in the statement of operations. For the year ended December 31, 2010, the Company recorded net losses of $3,046 on these derivatives. The Company had no derivative activities during the year ended December 31, 2009. The Company held the following derivative instruments as of the dates indicated:
| December 31, 2010 | December 31, 2009 | |||||||||||||||
| Notional Amount | Fair Value | Notional Amount | Fair Value | |||||||||||||
| No hedge designation |
||||||||||||||||
| Eurodollar futures contacts(1) |
$ | 1,370,000 | $ | (2,398 | ) | $ | — | $ | — | |||||||
| (1) | The $1,370,000 total notional amount of Eurodollar futures contracts as of December 31, 2010 represents the accumulation of Eurodollar futures contracts that mature on a quarterly basis between 2010 and 2015. |
Note 7. Income Taxes:
The Company, which historically was taxed as a REIT under the Internal Revenue Code, revoked its status as a REIT effective as of January 1, 2009. As a REIT, the Company was not subjected to federal income tax, at the parent company level, on earnings distributed to its shareholders. As a result of the revocation of REIT status effective January 1, 2009, the Company is taxed as a C corporation for U.S. federal tax purposes and will file a consolidated federal income tax return with its former taxable REIT subsidiaries (other than FBR Capital Markets and its subsidiaries).
During the years ended December 31, 2010, 2009 and 2008 the Company recorded $506, $9,522 and $1,899, respectively, of income tax expense for income and losses from continuing operations. The Company had taxable income from continuing operations before income taxes of $16,503, $142,720 and $99,483 in 2010, 2009, and 2008, respectively.
The provision for income taxes from continuing operations consists of the following for the years ended December 31, 2010, 2009 and 2008:
| 2010 | 2009 | 2008 | ||||||||||
| Federal |
$ | (329 | ) | $ | 1,819 | $ | — | |||||
| State |
835 | 7,703 | 1,899 | |||||||||
| $ | 506 | $ | 9,522 | $ | 1,899 | |||||||
| Current |
$ | 506 | $ | 9,522 | $ | 1,899 | ||||||
| Deferred |
— | — | — | |||||||||
| $ | 506 | $ | 9,522 | $ | 1,899 | |||||||
Deferred tax assets and liabilities consisted of the following as of December 31, 2010 and 2009:
| 2010 | 2009 | |||||||
| Unrealized investment gains and losses |
$ | 39,311 | $ | 61,768 | ||||
| Accrued compensation |
2,273 | 5,261 | ||||||
| Capital loss carry-forward |
232,345 | 236,275 | ||||||
| Other, net |
10,302 | 8,099 | ||||||
| Net operating loss |
125,796 | 113,479 | ||||||
| Valuation allowance |
(410,027 | ) | (424,882 | ) | ||||
| Net deferred tax asset |
$ | — | $ | — | ||||
F-22
Table of Contents
The provision (benefit) for income taxes results in effective tax rates that differ from the federal statutory rates. The reconciliation of the Company and its taxable REIT subsidiaries income tax attributable to net income (loss) computed at federal statutory rates to income tax expense was:
| December 31, | ||||||||||||
| 2010 | 2009 | 2008 | ||||||||||
| Federal income tax at statutory rate |
$ | 9,482 | $ | 49,055 | $ | 34,819 | ||||||
| State income taxes, net of federal benefit |
2,115 | (1,899 | ) | 1,899 | ||||||||
| Executive compensation |
1,057 | 263 | 1,954 | |||||||||
| Trading securities |
1,787 | — | — | |||||||||
| Refund claim due to change in tax law |
— | (4,268 | ) | — | ||||||||
| Establishment of FIN 48 reserve, net of federal benefit |
— | 12,618 | — | |||||||||
| Reversal of negative investment in First NLC |
— | — | (24,833 | ) | ||||||||
| Record deferred tax liability on investment in subsidiary |
— | — | 8,179 | |||||||||
| Other, net |
187 | (662 | ) | (2,250 | ) | |||||||
| Valuation allowance |
(14,122 | ) | (45,585 | ) | (17,869 | ) | ||||||
| Effective income tax rate |
$ | 506 | $ | 9,522 | $ | 1,899 | ||||||
The Company estimates that, as of December 31, 2010 and 2009, the range within which unrecognized tax benefits is $-0- to approximately $12,810, of which the Company has reserved $12,810. The total amount of accrued interest and penalties as of December 31, 2010 was $792. At December 31, 2010, there are $12,810 of unrecognized tax benefits that if recognized would affect the annual effective tax rate.
A reconciliation of the beginning and ending amount of unrecognized tax benefits is as follows:
| 2010 | 2009 | |||||||
| Balance at January 1 |
$ | 12,810 | $ | — | ||||
| Additions based on tax positions related to the current year |
— | 12,810 | ||||||
| Additions for tax positions of prior years |
— | — | ||||||
| Reductions for tax positions of prior years |
— | — | ||||||
| Settlements |
— | — | ||||||
| Balance at December 31 |
$ | 12,810 | $ | 12,810 | ||||
As of December 31, 2010 and 2009, the Company had a NCL carry-forward of $566,695 and $576,281, respectively, that can be used to offset future capital gains. These capital losses will begin to expire in 2011. In addition, as of December 31, 2010 and 2009, the Company had a NOL carry-forward of $306,820 and $276,778, respectively, that can be used to offset future taxable income. The NOL carry-forward will begin to expire in 2027. The valuation allowance relates primarily to the ability to utilize these losses.
The Company is subject to examination by the U.S. Internal Revenue Service (IRS), and other taxing authorities in jurisdictions where the Company has significant business operations, such as Virginia. As of December 31, 2010, an IRS examination of tax years 2006, 2007 and 2008 is currently ongoing.
F-23
Table of Contents
Note 8. Commitments and Contingencies:
Contractual Obligations
The Company has contractual obligations to make future payments in connection with borrowings and non-cancelable lease agreements and other contractual commitments as well as uncalled capital commitments to various investment partnerships that may be called over the next ten years. The following table sets forth these contractual obligations by fiscal year:
| 2011 | 2012 | 2013 | 2014 | 2015 | Thereafter | Total | ||||||||||||||||||||||
| Borrowings(1) |
$ | 970 | $ | — | $ | — | $ | — | $ | — | $ | 15,000 | $ | 15,970 | ||||||||||||||
| Minimum rental and other contractual commitments(2) |
206 | — | — | — | — | — | 206 | |||||||||||||||||||||
| Capital commitments(3) |
— | — | — | — | — | — | — | |||||||||||||||||||||
| $ | 1,176 | $ | — | $ | — | $ | — | $ | — | $ | 15,000 | $ | 16,176 | |||||||||||||||
| (1) | This table excludes interest payments to be made on the Company’s long-term debt securities. Based on the weighted average interest rate of 3.04% as of December 31, 2010, approximately $114 in accrued interest on the current outstanding principal will be paid for the quarter ending March 31, 2011. Interest on the $15,000 of long-term debt is based on the 3-month LIBOR; therefore, actual coupon interest will likely differ from this estimate. These long-term debt securities mature beginning in October 2033 through July 2035. |
| (2) | Equipment and office rent expense for 2010, 2009 and 2008 was $162, $230 and $774, respectively. |
| (3) | The table above excludes $1,531 of uncalled capital commitments to various investment partnerships that may be called over the next ten years. This amount was excluded because the Company cannot currently determine when, if ever, the commitments will be called. Also, the table above does not include a liability for unrecognized income tax benefits of $12,810 that are not contractual obligations by nature. The Company cannot determine, with any degree of certainty, the amount that would be payable or the period of cash settlement to the respective taxing jurisdiction. |
The Company also has short-term repurchase agreement liabilities of $190,220, as of December 31, 2010. See Note 5 for further information.
Litigation
As of December 31, 2010, the Company was not a defendant nor a plaintiff in any lawsuits or arbitrations nor involved in any governmental or SRO matters that are expected to have a material adverse effect on the Company’s financial condition, results of operations or liquidity. The Company, from time to time, is involved in civil lawsuits and arbitration matters (together, litigation) relating to its business that are considered to be in the ordinary course. There can be no assurance that these matters individually or in aggregate will not have a material adverse effect on the Company’s financial condition or results of operations in a future period.
Note 9. Shareholders’ Equity:
The Company has authorized share capital of 450,000,000 shares of Class A common stock, par value $0.01 per share; 100,000,000 shares of Class B common stock, par value $0.01 per share; and 25,000,000 shares of undesignated preferred stock. Holders of the Class A and Class B common stock are entitled to one vote and three votes per share, respectively, on all matters voted upon by the shareholders. Shares of Class B common stock convert to shares of Class A common stock at the option of the Company in certain circumstances including (i) upon sale or other transfer, (ii) at the time the holder of such shares of Class B common stock ceases to be affiliated with the Company and (iii) upon the sale of such shares in a registered public offering. The Company’s Board of Directors has the authority, without further action by the shareholders, to issue preferred stock in one or more series and to fix the terms and rights of the preferred stock. Such actions by the Board of
F-24
Table of Contents
Directors could adversely affect the voting power and other rights of the holders of common stock. Preferred stock could thus be issued quickly with terms that could delay or prevent a change in control of the Company or make removal of management more difficult. At present, the Company has no plans to issue any preferred stock.
On October 1, 2009, the Company announced a 1-for-20 reverse split of its Class A and Class B common stock in accordance with the previously approved shareholder authorization. The reverse stock split was effective on October 6, 2009. Upon the effectiveness of the reverse stock split, each twenty shares of issued and outstanding common stock were converted into one share of common stock. The Company did not issue fractional shares and shareholders received a cash payment for fractional shares based on the split-adjusted average price of the Class A common stock before the effective time. The reverse split reduced the number of shares of the Company’s common stock outstanding from 158,403,801 shares to 7,920,190 shares. Proportional adjustments were made to outstanding stock options and other equity incentive awards and equity compensation plans. The number of authorized shares of common stock did not change.
Dividends
Pursuant to the Company’s variable dividend policy, the Board of Directors evaluates dividends on a quarterly basis and, in its sole discretion, approves the payment of dividends. The Company’s dividend payments, if any, may vary significantly from quarter to quarter. The Board of Directors approved and the Company declared and paid the following dividends for 2010:
| Quarter Ended |
Dividend Amount |
Declaration Date |
Record Date |
Pay Date | ||||
| December 31 | $0.60 | December 20 | December 31 | January 31, 2011 | ||||
| September 30 | 0.60 | September 20 | September 30 | October 29 | ||||
| June 30 | 0.35 | May 26 | June 30 | July 30 | ||||
| March 31 | 0.35 | February 10 | March 31 | April 30 |
The Company did not declare or pay out dividends on our Class A or Class B common stock during 2009.
Stock Compensation Plans
FBR Group Long-Term Incentive Plan
Under the FBR Group Long-Term Incentive Plan, the Company may grant options to purchase stock, stock appreciation rights, performance awards and restricted and unrestricted stock and other stock-based awards for up to 1,245,000 shares of Class A common stock to eligible participants in the Plan. Participants include employees, officers and directors of the Company and its subsidiaries. The FBR Group Long-Term Incentive Plan has a term of 10 years and options granted may have an exercise period of up to 10 years. Options may be incentive stock options, as defined by Section 422 of the Internal Revenue Code, or nonqualified stock options. The FBR Long-Term Incentive Plan replaced the FBR Group Stock and Annual Incentive Plan and the Non-Employee Director Stock Compensation Plan (the Prior Plans), and shares that remained available for issuance under the Prior Plans became available under the FBR Long-Term Incentive Plan. As of December 31, 2010, 25,292 shares are available for issuance under the FBR Long-Term Incentive Plan.
The Company uses a fair value based measurement method in accounting for all share based payment transactions with employees. The fair value of each option grant is estimated on the date of grant using the Black-Scholes option-pricing model with the following weighted average assumptions: dividend yield, expected volatility, risk-free interest rate, and an expected life of five years for all grants. No options were granted during the years ended December 31, 2010, 2009, and 2008.
F-25
Table of Contents
A summary of option activity under the FBR Long-Term Incentive Plan and the FBR Group Stock and Annual Incentive Plan (the Stock Plans) as of December 31, 2010 and changes during the three years then ended is presented below:
| Number
of Shares |
Weighted-average Exercise Prices |
Weighted-average Contractual Life |
||||||||||
| Share Balance as of December 31, 2007 |
50,002 | $ | 289.60 | 1.9 | ||||||||
| Cancelled in 2008 |
(22,813 | ) | 283.00 | — | ||||||||
| Share Balance as of December 31, 2008 |
27,189 | 295.20 | 1.0 | |||||||||
| Cancelled in 2009 |
(19,564 | ) | 332.69 | — | ||||||||
| Share Balance as of December 31, 2009 |
7,625 | 199.22 | 1.1 | |||||||||
| Cancelled in 2010 |
— | — | — | |||||||||
| Share Balance as of December 31, 2010 |
7,625 | 199.22 | 0.3 | |||||||||
| Options Exercisable |
7,625 | 199.22 | 0.3 | |||||||||
The total intrinsic value of options exercised during the years ended December 31, 2010, 2009 and 2008 was $-0-.
As of December 31, 2010 and 2009, all options have vested and all compensation costs related to share-based compensation arrangements granted under the Stock Plans relating to options have been recognized.
Share-based compensation expense recognized in the statement of operations for stock options for the year ended December 31, 2009 was $11, with a related tax benefit of $1. There was no share-based compensation expense recognized for stock options during the year ended December 31, 2010.
FBR Group Restricted Stock
In addition, the Company grants restricted common shares to employees that vest ratably over a three to four year period or cliff-vest after two to three years for various purposes based on continued employment over these specified periods. As of December 31, 2010 and 2009, a total of 132,246 and 263,878 shares, respectively, of such restricted Class A common stock was outstanding with unamortized deferred compensation of $412 and $3,566, respectively. A summary of these unvested restricted stock awards is presented below:
| Number of Shares |
Weighted-average Grant-date Fair Value |
Weighted-average Remaining Vested Period |
||||||||||
| Share Balance as of December 31, 2007 |
60,371 | $ | 246.80 | 1.1 | ||||||||
| Granted |
387,816 | 58.20 | — | |||||||||
| Forfeitures |
(6,329 | ) | 192.80 | — | ||||||||
| Vestitures |
(30,039 | ) | 336.00 | — | ||||||||
| Share Balance as of December 31, 2008 |
411,819 | 65.00 | 2.1 | |||||||||
| Forfeitures |
(842 | ) | 183.20 | — | ||||||||
| Vestitures |
(147,099 | ) | 74.80 | — | ||||||||
| Share Balance as of December 31, 2009 |
263,878 | 59.40 | 1.2 | |||||||||
| Forfeitures |
— | — | — | |||||||||
| Vestitures |
(131,632 | ) | 59.20 | — | ||||||||
| Share Balance as of December 31, 2010 |
132,246 | 59.40 | 0.2 | |||||||||
For the years ended December 31, 2010, 2009, and 2008, the Company recognized $2,952, $7,016, and $12,258, respectively, of compensation expense related to this restricted stock.
F-26
Table of Contents
In addition, as part of the Company’s satisfaction of incentive compensation earned for past service under the Company’s variable compensation programs, employees may receive restricted Class A common stock in lieu of cash payments. These restricted Class A common stock shares are issued to an irrevocable trust and are not returnable to the Company. The Company issued 4,478 shares of FBR Group restricted common stock valued at $250 to the trust for the year ended December 31, 2008 in settlement of such accrued incentive compensation. No such shares were issued in 2010 and 2009. A summary of the undistributed restricted stock issued to the trust is presented below:
| Number of Shares |
Weighted-average Grant-date Fair Value |
Weighted-average Remaining Vesting Period |
||||||||||
| Share Balance as of December 31, 2007 |
45,810 | $ | 228.80 | 1.2 | ||||||||
| Shares issued to Trust |
4,478 | 55.80 | — | |||||||||
| Shares distributed from Trust |
(22,284 | ) | 244.80 | — | ||||||||
| Share Balance as of December 31, 2008 |
28,004 | 188.60 | 1.0 | |||||||||
| Shares issued to Trust |
— | — | — | |||||||||
| Shares distributed from Trust |
(12,589 | ) | 149.20 | — | ||||||||
| Share Balance as of December 31, 2009 |
15,415 | 247.00 | 0.8 | |||||||||
| Shares issued to Trust |
— | — | — | |||||||||
| Shares distributed from Trust |
(4,609 | ) | 84.60 | — | ||||||||
| Share Balance as of December 31, 2010 |
10,806 | 285.00 | 0.2 | |||||||||
Director Stock Compensation Plan
Under the Non-Employee Director Stock Compensation Plan and the FBR Long-Term Incentive Plan, the Company may grant options, stock or restricted stock units (RSUs) in lieu of or in addition to annual director fees to non-employee directors. The Board approved annual awards of RSUs equal in value to $80 to each director to be made in conjunction with the annual shareholders meeting. In addition, each chairman of the Board’s standing committees receives one half of his quarterly fees for service as chairman in RSUs. These RSUs vest the day before the next annual meeting of shareholders, and are convertible to Class A common stock one year following completion of the director’s service on the Board. All options, stock and RSUs awarded to non-employee directors are non-transferable other than by will or the laws of descent and distribution. During 2010, 2009, and 2008, the Company granted 18,715, 57,237, and 13,411 RSUs, respectively. For the years ended December 31, 2010, 2009, and 2008, the Company recognized $385, $477, and $553, respectively, of director fees related to these RSUs.
Share Repurchases
From time to time, the Company repurchases shares of its Class A common stock under a share repurchase program originally authorized by the Board of Directors in April 2003 (the 2003 Repurchase Program), pursuant to which the Company was authorized to repurchase up to 5,000,000 shares of its Class A common stock. On July 28, 2010, the Board of Directors replaced the 2003 Repurchase Program, which had remaining authorization for the repurchase of up to 3,782,841 shares, with a new share repurchase program (the 2010 Repurchase Program) in order to better position the Company to continue share repurchases while preserving its ability to use its NCL and NOL carryforwards. Under the 2010 Repurchase Program, the Company is authorized to repurchase up to 500,000 shares of its Class A common stock.
Repurchases under the 2010 Repurchase Program may be made from time to time on the open market and in private transactions at management’s discretion in accordance with applicable federal securities laws. The timing of repurchases and the exact number of shares of Class A common stock to be repurchased will depend upon market conditions and other factors. The 2010 Repurchase Program is funded using the Company’s cash on hand and cash generated from operations. The 2010 Repurchase Program has no expiration date and may be suspended or terminated at any time without prior notice.
F-27
Table of Contents
The following table summarizes the Company’s share repurchase activities for the periods indicated:
| Year Ended | ||||||||||||
| 2010 | 2009 | 2008 | ||||||||||
| Shares Repurchased |
243,815 | — | 5,966 | |||||||||
| Total Cost |
$ | 4,903 | $ | — | $ | 48 | ||||||
| Average Price |
$ | 20.08 | $ | — | $ | 7.96 | ||||||
As of December 31, 2010, 256,185 shares of Class A common stock remain available for repurchases under the 2010 Repurchase Program.
Note 11. Financial Instruments with Off-Balance-Sheet Risk and Credit Risk:
Financial Instruments
As of December 31, 2010 and 2009, the Company had not entered into any transactions involving financial instruments that would expose the Company to significant related off-balance-sheet risk.
Market Risk
Market risk is primarily caused by movements in market prices of the Company’s investment account securities and changes in value of the underlying securities of the investment funds in which the Company invests. The Company’s investments are also subject to interest rate volatility and possible illiquidity in markets in which the Company trades or invests. The Company seeks to manage market risk through monitoring procedures. The Company’s principal transactions are primarily long and short equity and debt transactions.
Credit Risk
The Company’s equity and debt investments include non-investment grade securities of privately held issuers. The concentration and illiquidity of these investments expose the Company to a higher degree of risk than associated with readily marketable securities.
Note 12. Supplemental Cash Flow Information—Non-cash Transactions:
During 2008, the Company recorded a non-cash reversal of its $73,040 negative investment in First NLC because the Company has no continuing involvement with First NLC. As a result of the bankruptcy and based on the Company’s review of its relationship with First NLC and an opinion of the Company’s counsel to the effect that First NLC’s creditors would not be able to pierce the corporate veil between First NLC and the Company, the Company believes it has no remaining guarantees of the debt or any other obligation of First NLC, and it is considered remote that the Company would have any further obligations related to First NLC.
Note 13. Quarterly Data (Unaudited):
The following tables set forth selected information for each of the fiscal quarters during the years ended December 31, 2010 and 2009. The selected quarterly data is derived from unaudited financial statements of the Company and has been prepared on the same basis as the annual, audited financial statements to include, in the opinion of management, all adjustments (consisting of only normal recurring adjustments) necessary for fair statement of the results for such periods.
F-28
Table of Contents
Note: The sum of quarterly earnings per share amounts may not equal full year earnings per share amounts due to differing average outstanding shares amounts for the respective periods.
| Net Interest Income | Net Income (Loss) from Continuing Operations |
Net (Loss) Income from Discontinued Operations |
Net Income (Loss) |
Basic Earnings (Loss) Per Share from Continuing Operations |
Diluted Earnings (Loss) Per Share from Continuing Operations |
|||||||||||||||||||
| 2010 |
||||||||||||||||||||||||
| First Quarter |
$ | 8,974 | $ | 4,626 | $ | — | $ | 4,626 | $ | 0.60 | $ | 0.59 | ||||||||||||
| Second Quarter |
9,773 | 8,773 | — | 8,773 | 1.12 | 1.10 | ||||||||||||||||||
| Third Quarter |
9,826 | 5,156 | — | 5,156 | 0.66 | 0.65 | ||||||||||||||||||
| Fourth Quarter |
9,839 | 8,031 | — | 8,031 | 1.05 | 1.03 | ||||||||||||||||||
| Total Year |
$ | 38,412 | $ | 26,586 | $ | — | $ | 26,586 | 3.44 | 3.38 | ||||||||||||||
| 2009 |
||||||||||||||||||||||||
| First Quarter |
$ | 89 | $ | 110,831 | $ | (16,167 | ) | $ | 101,564 | $ | 14.55 | $ | 14.54 | |||||||||||
| Second Quarter |
806 | (12,697 | ) | (24,019 | ) | (32,157 | ) | (1.65 | ) | (1.65 | ) | |||||||||||||
| Third Quarter |
3,409 | 24,404 | 18,033 | 42,437 | 3.17 | 3.09 | ||||||||||||||||||
| Fourth Quarter |
6,130 | 8,095 | (3,394 | ) | 4,701 | 1.05 | 1.02 | |||||||||||||||||
| Total Year |
$ | 10,434 | $ | 130,633 | $ | (25,547 | ) | $ | 116,545 | 17.02 | 16.69 | |||||||||||||
Note 14. Subsequent Events:
On January 4, 2011, the Company filed a shelf registration statement on Form S-3 (File No. 333-171537) with the SEC. The shelf registration statement was declared effective on January 20, 2011. Pursuant to the shelf registration statement, the Company may issue and publicly distribute various types of securities, including Class A common stock, preferred stock, debt securities, warrants and units, or any combination of such securities, from time to time, in one or more offerings, up to an aggregate amount of $500,000.
F-29