Attached files
| file | filename |
|---|---|
| EX-99.2 - EXHIBIT 99.2 - Tim Hortons Inc. | a3q14thiex-992safeharborst.htm |
| 8-K - 8-K - Tim Hortons Inc. | a3q14form8-kconferencecall.htm |

2014 Third Quarter Conference Call

Speakers Scott Bonikowsky Senior Vice-President, Corporate Affairs & Investor Relations Marc Caira President & Chief Executive Officer Cynthia Devine Chief Financial Officer 2

Safe Harbor Statement This presentation includes forward-looking statements which constitute forward-looking information within the meaning of Canadian securities laws and forward-looking statements within the meaning of the Private Securities Litigation Reform Act of 1995. These forward-looking statements are often identified by the words “may,” “might,” “believes,” “thinks,” “anticipates,” “plans,” “expects,” “intends” or similar expressions and include statements regarding (1) expectations regarding whether a transaction will be consummated, including whether conditions to the consummation of the Transaction will be satisfied, or the timing for completing the Transaction, (2) expectations for the effects of the Transaction or the ability of the new company to successfully achieve business objectives, including integrating the companies or the effects of unexpected costs, liabilities or delays, and (3) expectations for other economic, business, and/or competitive factors. Other unknown or unpredictable factors could also have material adverse effects on future results, performance or achievements of the combined company. These forward-looking statements are subject to inherent risks and uncertainties and are based on numerous assumptions which may prove incorrect and which could cause actual results or events to differ materially from the forward-looking statements. Such assumptions include, but are not limited to, the assumptions set forth in this presentation, as well as (a) that the Transaction will be completed in accordance with the terms and conditions of the arrangement agreement and plan of merger and on the timelines contemplated by the parties thereto, (b) that court, shareholder, stock exchange and regulatory approvals will be obtained on the basis and timelines anticipated by the parties, (c) that the securities of Holdings and the Partnership will be approved for listing on the New York Stock Exchange and/or the Toronto Stock Exchange, as applicable, and (d) that the other conditions to the closing of the Transaction will be satisfied. These forward-looking statements may be affected by risks and uncertainties in the business of Tim Hortons and market conditions, including that the assumptions upon which the forward-looking statements in this report are based may be incorrect in whole or in part. These forward-looking statements are qualified in their entirety by cautionary statements and risk factor disclosure contained in filings made by Tim Hortons with the U.S. Securities and Exchange Commission, including Tim Hortons annual report on Form 10-K for the year ended December 29, 2013, and Tim Hortons quarterly report on Form 10-Q expected to be filed on November 6, 2014 with the U.S. Securities and Exchange Commission and the Canadian Securities Administrators. Tim Hortons wishes to caution readers that certain important factors may have affected and could in the future affect their actual results and could cause their actual results for subsequent periods to differ materially from those expressed in or implied by any forward-looking statement made by or on behalf of Tim Hortons, including that the Transaction may not be consummated on the timelines anticipated by Tim Hortons or at all. Except as required by law, Tim Hortons does not undertake any obligation to update forward-looking statements to reflect events or circumstances after the date hereof.3

Marc Caira President & Chief Executive Officer

Q3 Overview 5 Good momentum in business Effective execution against strategic priorities Building strong foundation to support future growth

Canada: Lead, Defend & Grow 6 Extend brand reachNarrow average cheque gap Premium products Increased combo penetration Expand in urban core areas Sell into new channels

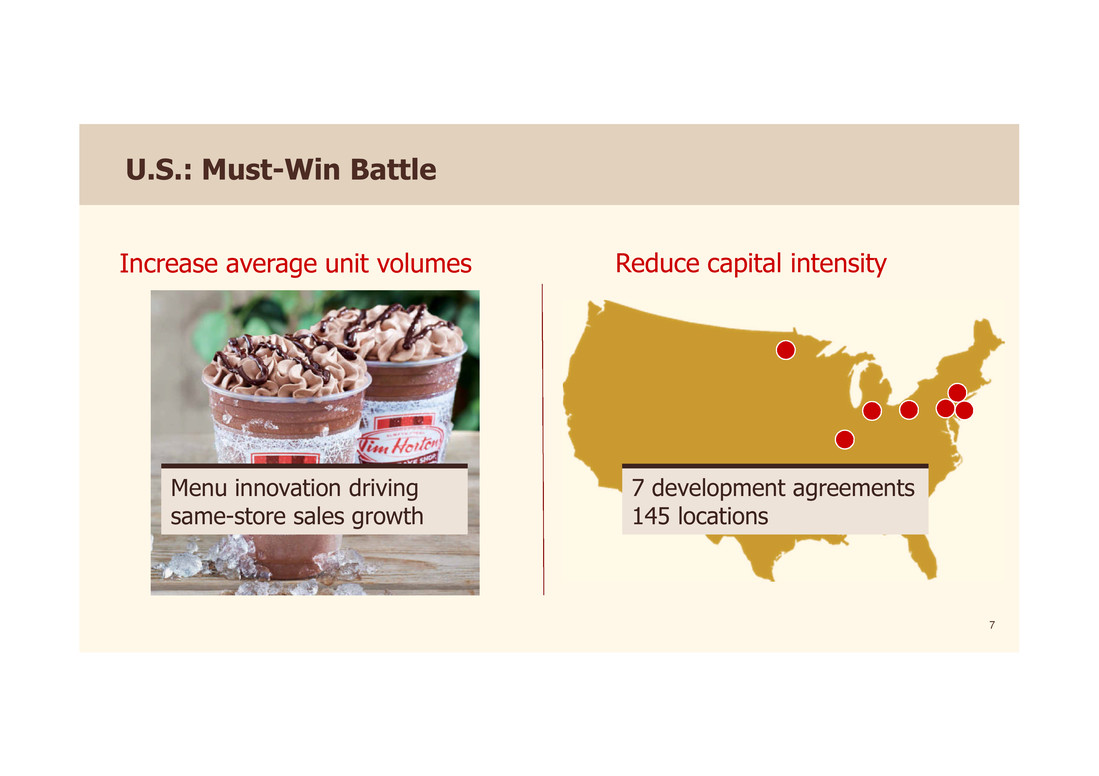
U.S.: Must-Win Battle 7 Increase average unit volumes Reduce capital intensity Menu innovation driving same-store sales growth 7 development agreements 145 locations

Differentiated innovation 8 Spicy Crispy Chicken Sandwich Steak & Cheese Panini Dark Roast Coffee Blend

Leveraging new technologies 9 Tims TV Double Double cardTimmyMe app

Reaching people in new ways 10 Dark Roast Launch “Tims Next Door”

11 Creating the foundation for long-term, sustainable growth

Cynthia Devine Chief Financial Officer

Top-Line Sales Growth 2014 Q3 2013 Q3 Systemwide Sales Growth (1)* 6.9% 4.7% 12.8% 10.8% Same-Store Sales Growth (2) 3.5% 1.7% 6.8% 3.0% Percentages represent year-over-year comparisons, unless otherwise noted. *Constant currency basis. (1) Systemwide sales growth includes restaurant sales at both Franchised and Company-operated restaurants. (2) Same-stores sales growth includes sales at Franchised and Company-operated restaurants open for 13 months or more. See information on slide 20 regarding these measures 13

Q3 2014 – Revenues ($CDN M) 2014 Q3 2013 Q3 % Change Sales Distribution sales $534.5 $473.6 12.8% Company-operated restaurant sales 6.2 6.1 1.8% Sales from VIEs 94.1 96.0 (2.0)% 634.8 575.8 10.2% Franchise revenues Rents & royalties 230.4 212.1 8.6% Franchise fees 44.0 37.5 17.4% 274.4 249.6 9.9% Total revenues $909.2 $825.4 10.2% All numbers rounded 14

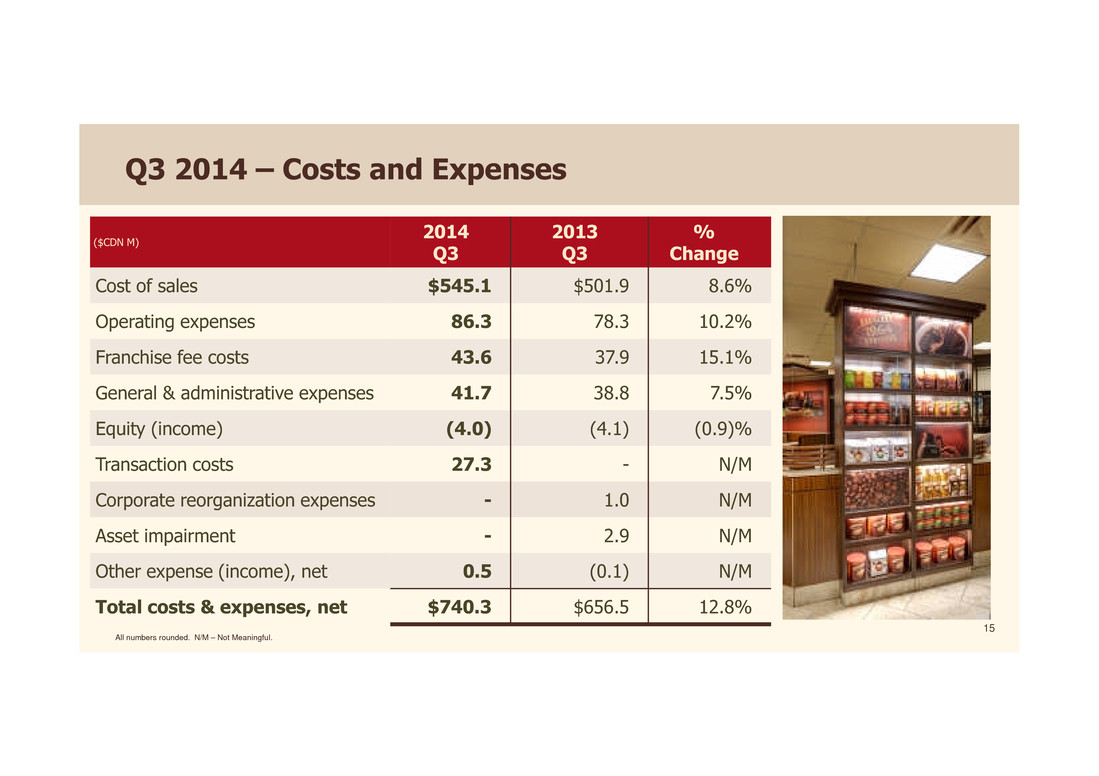
Q3 2014 – Costs and Expenses ($CDN M) 2014 Q3 2013 Q3 % Change Cost of sales $545.1 $501.9 8.6% Operating expenses 86.3 78.3 10.2% Franchise fee costs 43.6 37.9 15.1% General & administrative expenses 41.7 38.8 7.5% Equity (income) (4.0) (4.1) (0.9)% Transaction costs 27.3 - N/M Corporate reorganization expenses - 1.0 N/M Asset impairment - 2.9 N/M Other expense (income), net 0.5 (0.1) N/M Total costs & expenses, net $740.3 $656.5 12.8% All numbers rounded. N/M – Not Meaningful. 15

Q3 2014 – Earnings Highlights ($CDN M) 2014 Q3 2013 Q3 % Change Operating income $168.8 $168.8 - % Adjusted operating income(1) $196.1 $169.8 15.5% Interest expense, net (17.6) (8.5) N/M Income taxes 51.4 45.4 13.3% Net income attributable to noncontrolling interests 1.6 1.1 N/M Net income attributable to THI $98.1 $113.9 (13.8)% Diluted EPS attributable to THI $0.74 $0.75 (2.2)% Adjusted EPS(1) $0.95 $0.76 25.2% Diluted weighted average shares outstanding (millions) 132.9 150.9 (11.9)% All numbers rounded. N/M - Not Meaningful (1) Adjusted operating income and adjusted EPS are non-GAAP measures. Please refer to slide 21 for the reconciliation to Operating Income and EPS, the closest GAAP measure and details of the reconciling items. 16

Q3 2014 – Segment Results ($CDN M) 2014 Q3 2013 Q3 % Change Canada $196.2 $179.6 9.2% U.S. $7.4 $2.7 N/M Corporate Services $(9.7) $(14.3) N/M All numbers rounded. N/M – Not Meaningful. 17

Progress towards strategic objectives 18 Well positioned to continue to deliver solid returns to investors

Appendices

Systemwide Sales Growth & Same-store Sales Growth Total systemwide sales growth includes restaurant level sales at both Company-operated and franchised restaurants. Substantially all of our systemwide restaurants were franchised as at September 28, 2014. Systemwide sales growth is determined using a constant exchange rate where noted, to exclude the effects of foreign currency translation. U.S. dollar sales are converted to Canadian dollar amounts using the average exchange rate of the base year for the period covered. For the third quarter of 2014, systemwide sales on a constant currency basis increased 7.5% compared to the third quarter of 2013. Systemwide sales growth in Canadian dollars, including the effects of foreign currency translation, was 7.9% in the third quarter of 2014. Systemwide sales are important to understanding our business performance as they impact our franchise royalties and rental income, as well as our distribution income. Changes in systemwide sales are driven by changes in average same-store sales and changes in the number of systemwide restaurants, and are ultimately driven by consumer demand. We believe systemwide sales and same-store sales growth provide meaningful information to investors regarding the size of our system, the overall health and financial performance of the system, and the strength of our brand and restaurant owner base, which ultimately impacts our consolidated and segmented financial performance. Franchised restaurant sales are not generally included in our Condensed Consolidated Financial Statements (except for certain non-owned restaurants consolidated in accordance with applicable accounting rules). The amount of systemwide sales impacts our rental and royalties revenues, as well as distribution revenues. 20

Information on Non-GAAP Measures: Adjusted Operating Income and Adjusted Earnings Per Share (EPS) Reconciliation of Adjusted Operating Income Q3 2014 Q3 2013 Operating income $168.8 $168.8 Add: Transaction costs(1) 27.3 - Add: Corporate reorganization expenses - 1.0 Adjusted operating income $196.1 $169.8 * All numbers rounded. (1) Represents costs related to the proposed transaction with Burger King Worldwide, Inc., an affiliate of 3G Capital. Adjusted operating income and adjusted EPS are non-GAAP measures. Management uses adjusted operating income and adjusted EPS to assist in the evaluation of year-over-year performance and believes that it will be helpful and meaningful to investors as a measure of underlying operational growth rates. These non-GAAP measures are not intended to replace the presentation of our financial results in accordance with GAAP. The Company’s use of the terms adjusted operating income and adjusted EPS may differ from similar measures reported by other companies. The reconciliations of operating income and diluted EPS, which are GAAP measures, to adjusted operating income and adjusted EPS, which are non-GAAP measures, are set forth in the table below. Reconciliation of Adjusted EPS Q3 2014 Q3 2013 Diluted EPS $0.74 $0.75 Add: Transaction costs(1) 0.21 - Add: Corporate reorganization expenses - 0.01 Adjusted diluted EPS $0.95 $0.76 21
