Attached files
| file | filename |
|---|---|
| 8-K - 8-K - ONCOR ELECTRIC DELIVERY CO LLC | d815440d8k.htm |
| Exhibit 99.1
|

Exhibit 99.1
Third Quarter 2014
Investor Call
November 4, 2014
Oncor Electric Delivery
|
|
Forward Looking Statements
This presentation contains forward-looking statements, which are subject to various risks and uncertainties. Discussion of risks and uncertainties that could cause actual results to differ materially from management’s current projections, forecasts, estimates and expectations is contained in filings made by Oncor Electric Delivery Company LLC (Oncor) with the Securities and Exchange Commission (SEC). Specifically, Oncor makes reference to the section entitled “Risk Factors” in its annual and quarterly reports. In addition to the risks and uncertainties set forth in Oncor’s SEC filings, the forward-looking statements in this presentation could be affected by, among other things: prevailing governmental policies and regulatory actions; legal and administrative proceedings and settlements, including the exercise of equitable powers by courts and any adverse impacts on us as a result of the bankruptcy proceedings involving Energy Future Holdings Corp. and certain of its subsidiaries; weather conditions and other natural phenomena; acts of sabotage, wars or terrorist or cyber security threats or activities; economic conditions, including the impact of a recessionary environment; unanticipated population growth or decline, or changes in market demand and demographic patterns; changes in business strategy, development plans or vendor relationships; unanticipated changes in interest rates or rates of inflation; unanticipated changes in operating expenses, liquidity needs and capital expenditures; inability of various counterparties to meet their financial obligations to Oncor, including failure of counterparties to perform under agreements; general industry trends; hazards customary to the industry and the possibility that Oncor may not have adequate insurance to cover losses resulting from such hazards; changes in technology used by and services offered by Oncor; significant changes in Oncor’s relationship with its employees; changes in assumptions used to estimate costs of providing employee benefits, including pension and other post-retirement employee benefits, and future funding requirements related thereto; significant changes in critical accounting policies material to Oncor; commercial bank and financial market conditions, access to capital, the cost of such capital, and the results of financing and refinancing efforts, including availability of funds in the capital markets and the potential impact of disruptions in US credit markets; circumstances which may contribute to future impairment of goodwill, intangible or other long-lived assets; financial restrictions under Oncor’s revolving credit facility and indentures governing its debt instruments; Oncor’s ability to generate sufficient cash flow to make interest payments on its debt instruments; actions by credit rating agencies; and Oncor’s ability to effectively execute its operational strategy. Any forward-looking statement speaks only as of the date on which it is made, and Oncor undertakes no obligation to update any forward-looking statement to reflect events or circumstances after the date on which it is made or to reflect the occurrence of unanticipated events.
Regulation G
This presentation includes certain non-GAAP financial measures. A reconciliation of these measures to the most directly comparable GAAP measures is included in this presentation, which is available on Oncor’s website, www.oncor.com, in the Investor section, and also filed with the SEC.
Oncor Electric Delivery 1
|
|

3rd Quarter 2014 Investor Call Agenda
Financial Overview David Davis
Chief Financial Officer
Operational Review Bob Shapard
Chairman and CEO
Q&A
Oncor Electric Delivery
| 2 |
|
|
|
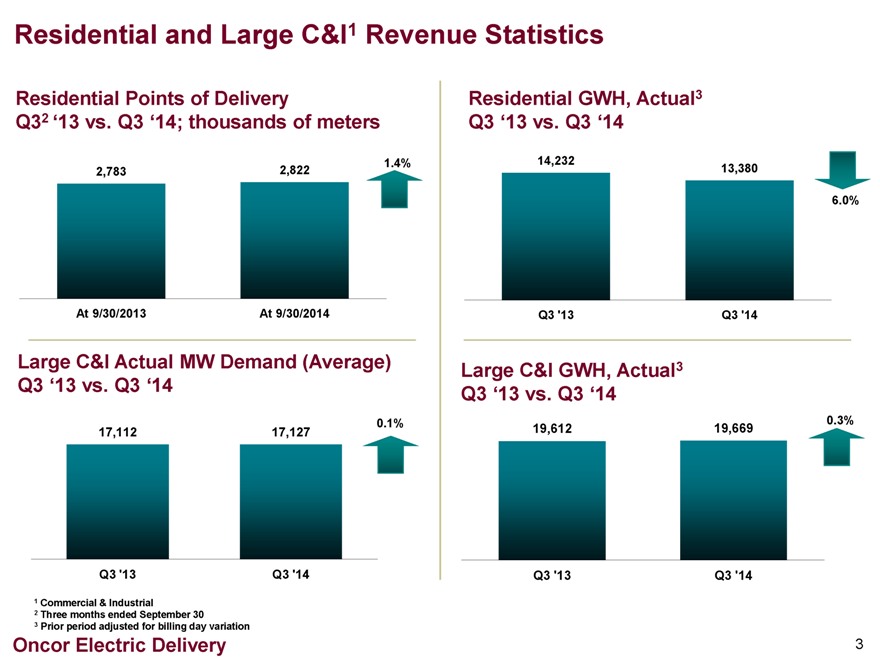
Residential and Large C&I1 Revenue Statistics
Residential Points of Delivery
Q32 ‘13 vs. Q3 ‘14; thousands of meters
2,783 2,822 1.4%
At 9/30/2013 At 9/30/2014
Residential GWH, Actual3
Q3 ‘13 vs. Q3 ‘14
14,232 13,380
6.0%
Q3 ‘13 Q3 ‘14
Large C&I Actual MW Demand (Average)
Q3 ‘13 vs. Q3 ‘14
0.1%
17,112 17,127
Q3 ‘13 Q3 ‘14
Large C&I GWH, Actual3
Q3 ‘13 vs. Q3 ‘14
19,612 19,669 0.3%
Q3 ‘13 Q3 ‘14
| 1 |
|
Commercial & Industrial |
| 2 |
|
Three months ended September 30 |
| 3 |
|
Prior period adjusted for billing day variation |
Oncor Electric Delivery
| 3 |
|
|
|
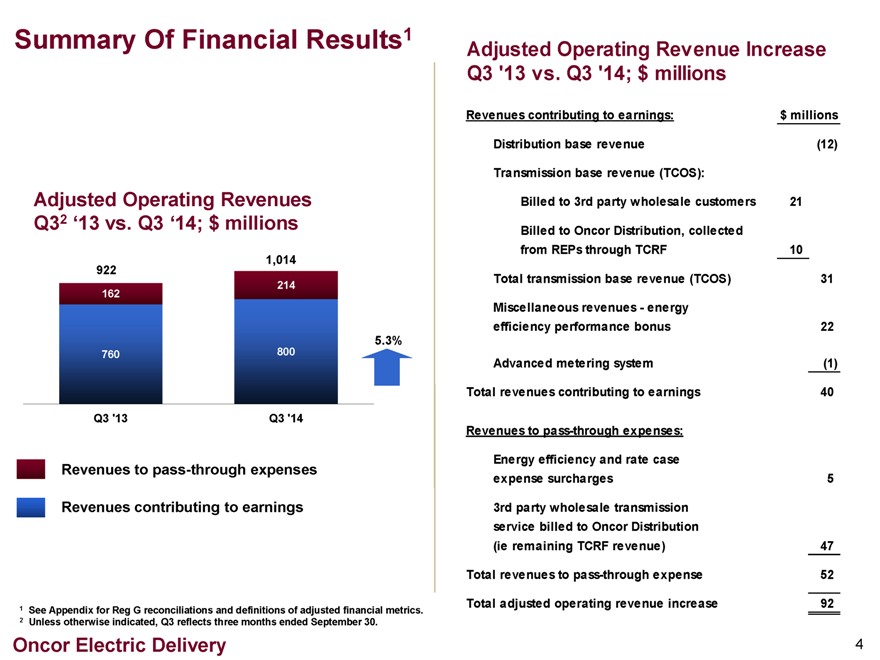
Summary Of Financial Results1
Adjusted Operating Revenues
Q32 ‘13 vs. Q3 ‘14; $ millions
1,014
922
214
162
5.3%
760 800
Q3 ‘13 Q3 ‘14
Revenues to pass-through expenses
Revenues contributing to earnings
1 See Appendix for Reg G reconciliations and definitions of adjusted financial metrics. 2 Unless otherwise indicated, Q3 reflects three months ended September 30.
Adjusted Operating Revenue Increase
Q3 ‘13 vs. Q3 ‘14; $ millions
Revenues contributing to earnings: $ millions
Distribution base revenue (12)
Transmission base revenue (TCOS):
Billed to 3rd party wholesale customers 21
Billed to Oncor Distribution, collected
from REPs through TCRF 10
Total transmission base revenue (TCOS) 31
Miscellaneous revenues—energy
efficiency performance bonus 22
Advanced metering system (1)
Total revenues contributing to earnings 40
Revenues to pass-through expenses:
Energy efficiency and rate case
expense surcharges 5
3rd party wholesale transmission
service billed to Oncor Distribution
(ie remaining TCRF revenue) 47
Total revenues to pass-through expense 52
Total adjusted operating revenue increase 92
Oncor Electric Delivery
| 4 |
|
|
|
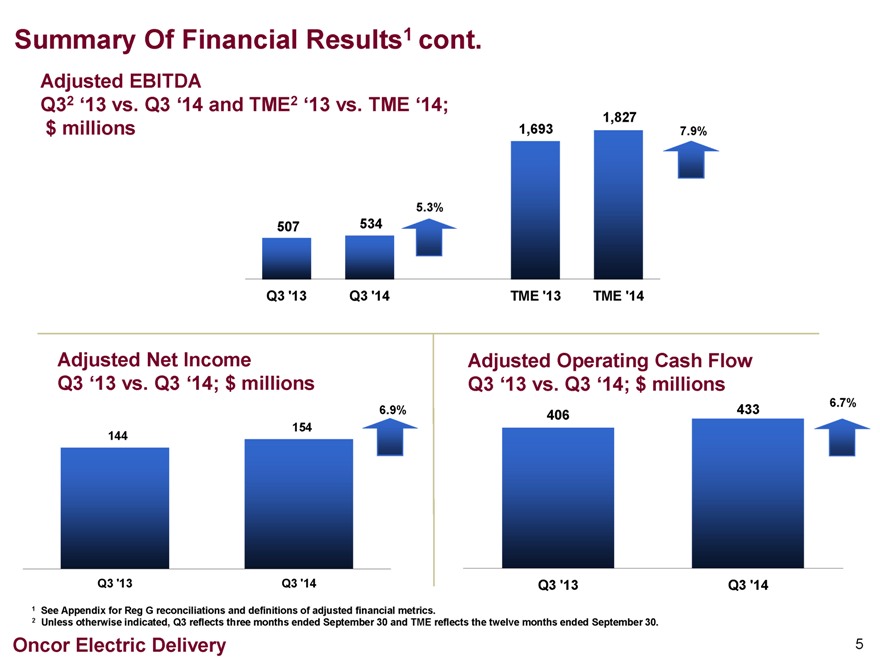
Summary Of Financial Results1 cont.
Adjusted EBITDA
Q32 ‘13 vs. Q3 ‘14 and TME2 ‘13 vs. TME ‘14;
1,827
$ millions 1,693 7.9%
5.3%
507 534
Q3 ‘13 Q3 ‘14 TME ‘13 TME ‘14
Adjusted Net Income
Q3 ‘13 vs. Q3 ‘14; $ millions
6.9%
154
144
Q3 ‘13 Q3 ‘14
Adjusted Operating Cash Flow
Q3 ‘13 vs. Q3 ‘14; $ millions
6.7%
406 433
Q3 ‘13 Q3 ‘14
| 1 |
|
See Appendix for Reg G reconciliations and definitions of adjusted financial metrics. |
2 Unless otherwise indicated, Q3 reflects three months ended September 30 and TME reflects the twelve months ended September 30.
Oncor Electric Delivery
| 5 |
|
|
|
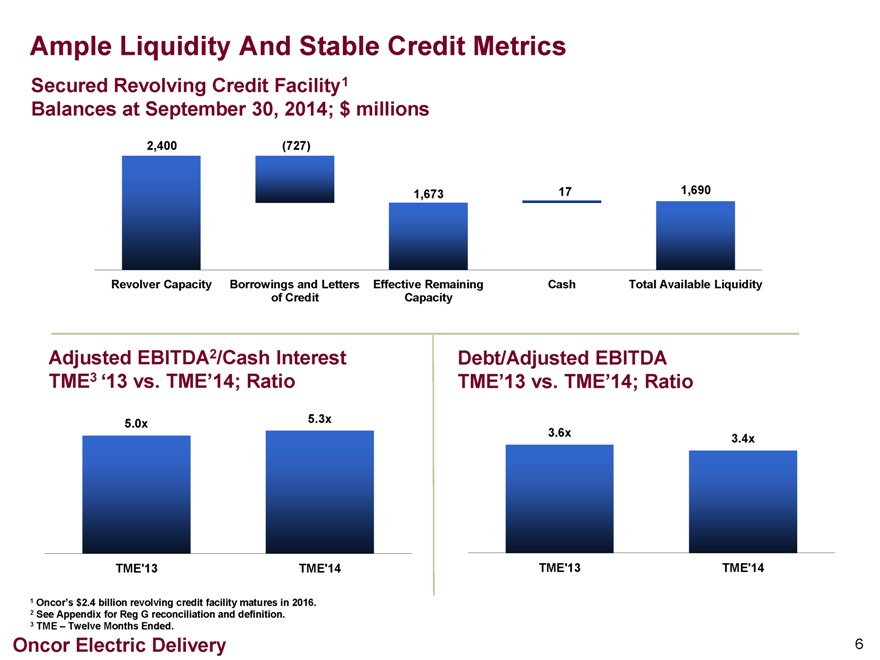
Ample Liquidity And Stable Credit Metrics
Secured Revolving Credit Facility1
Balances at September 30, 2014; $ millions
2,400 (727)
1,673 17 1,690
Revolver Capacity Borrowings and Letters of Credit Effective Remaining Capacity Cash Total Available Liquidity
Adjusted EBITDA2/Cash Interest
TME3 ‘13 vs. TME’14; Ratio
5.0x 5.3x
TME’13 TME’14
Debt/Adjusted EBITDA
TME’13 vs. TME’14; Ratio
3.6x 3.4x
TME’13 TME’14
| 1 |
|
Oncor’s $2.4 billion revolving credit facility matures in 2016. |
| 2 |
|
See Appendix for Reg G reconciliation and definition. |
| 3 |
|
TME – Twelve Months Ended. |
Oncor Electric Delivery
| 6 |
|
|
|

3rd Quarter 2014 Investor Call Agenda
Financial Overview David Davis
Chief Financial Officer
Operational Review Bob Shapard
Chairman and CEO
Q&A
Oncor Electric Delivery
| 7 |
|
|
|
Appendix—
Regulation G Reconciliations and Supplemental Data
Oncor Electric Delivery
| 8 |
|
|
|
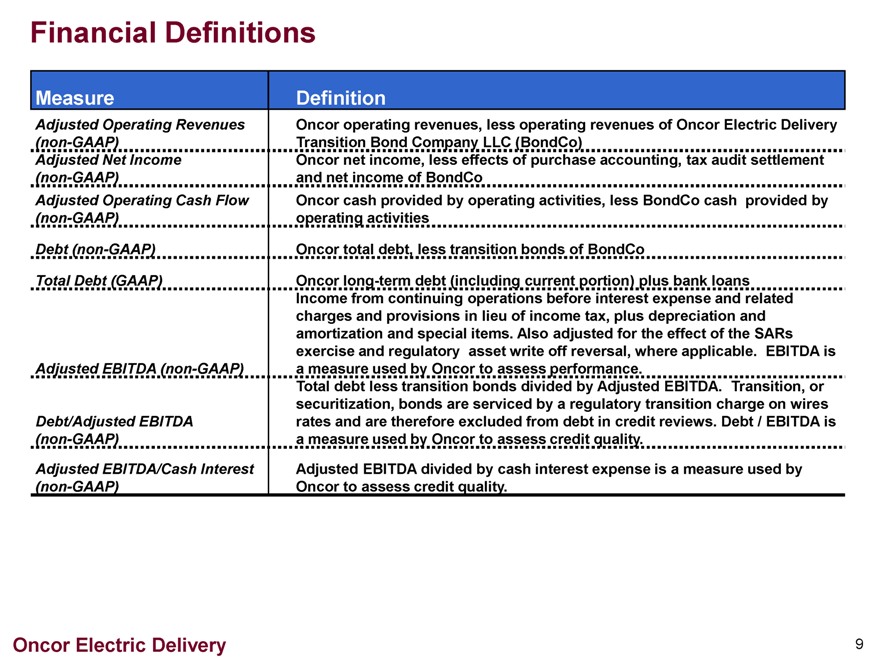
Financial Definitions
Measure Definition
Adjusted Operating Revenues (non-GAAP) Oncor operating revenues, less operating revenues of Oncor Electric Delivery
Transition Bond Company LLC (BondCo)
Adjusted Net Income (non-GAAP) Oncor net income, less effects of purchase accounting, tax audit settlement
and net income of BondCo
Adjusted Operating Cash Flow (non-GAAP) Oncor cash provided by operating activities, less BondCo cash provided by
operating activities
Debt (non-GAAP) Oncor total debt, less transition bonds of BondCo
Total Debt (GAAP) Oncor long-term debt (including current portion) plus bank loans
Income from continuing operations before interest expense and related
charges and provisions in lieu of income tax, plus depreciation and
amortization and special items. Also adjusted for the effect of the SARs
exercise and regulatory asset write off reversal, where applicable. EBITDA is a measure used by Oncor to assess performance.
Adjusted EBITDA (non-GAAP)
Total debt less transition bonds divided by Adjusted EBITDA. Transition, or
securitization, bonds are serviced by a regulatory transition charge on wires
rates and are therefore excluded from debt in credit reviews. Debt / EBITDA is
a measure used by Oncor to assess credit quality. Debt/Adjusted EBITDA (non-GAAP)
Adjusted EBITDA/Cash Interest (non-GAAP) Adjusted EBITDA divided by cash interest expense is a measure used by
Oncor to assess credit quality.
Oncor Electric Delivery
9
|
|
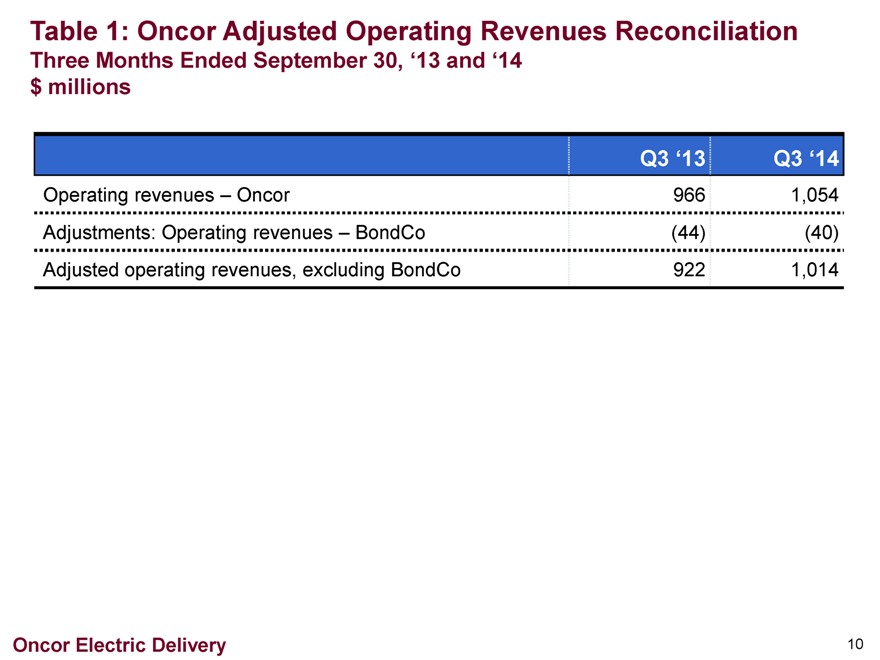
Table 1: Oncor Adjusted Operating Revenues Reconciliation
Three Months Ended September 30, ‘13 and ‘14 $ millions
Q3 ‘13 Q3 ‘14
Operating revenues – Oncor 966 1,054
Adjustments: Operating revenues – BondCo (44) (40)
Adjusted operating revenues, excluding BondCo 922 1,014
Oncor Electric Delivery
10
|
|
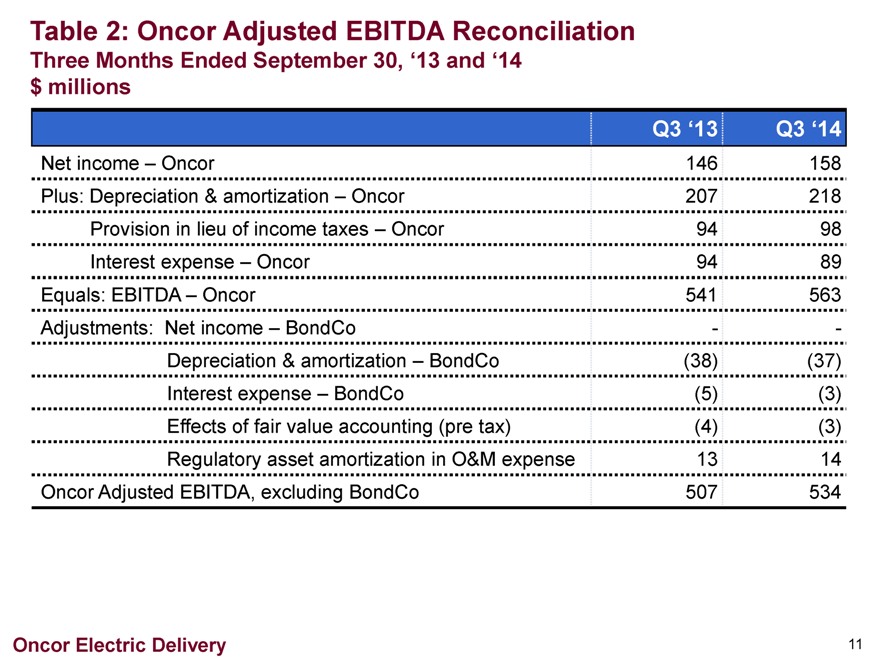
Table 2: Oncor Adjusted EBITDA Reconciliation
Three Months Ended September 30, ‘13 and ‘14 $ millions
Q3 ‘13 Q3 ‘14
Net income – Oncor 146 158
Plus: Depreciation & amortization – Oncor 207 218
Provision in lieu of income taxes – Oncor 94 98
Interest expense – Oncor 94 89
Equals: EBITDA – Oncor 541 563
Adjustments: Net income – BondCo — -
Depreciation & amortization – BondCo (38) (37)
Interest expense – BondCo (5) (3)
Effects of fair value accounting (pre tax) (4) (3)
Regulatory asset amortization in O&M expense 13 14
Oncor Adjusted EBITDA, excluding BondCo 507 534
Oncor Electric Delivery
11
|
|
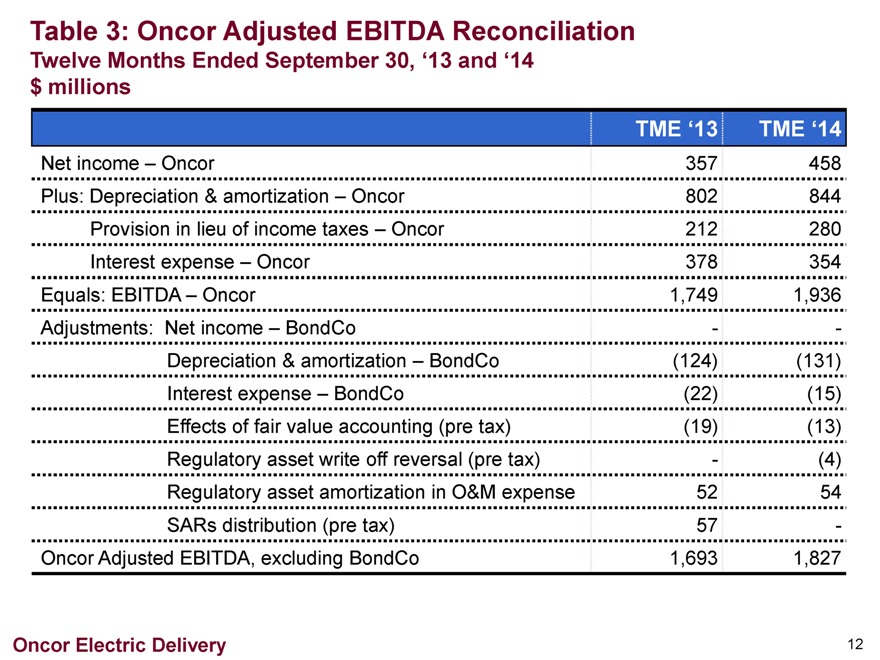
Table 3: Oncor Adjusted EBITDA Reconciliation
Twelve Months Ended September 30, ‘13 and ‘14 $ millions
TME ‘13 TME ‘14
Net income – Oncor 357 458
Plus: Depreciation & amortization – Oncor 802 844
Provision in lieu of income taxes – Oncor 212 280
Interest expense – Oncor 378 354
Equals: EBITDA – Oncor 1,749 1,936
Adjustments: Net income – BondCo — -
Depreciation & amortization – BondCo (124) (131)
Interest expense – BondCo (22) (15)
Effects of fair value accounting (pre tax) (19) (13)
Regulatory asset write off reversal (pre tax) — (4)
Regulatory asset amortization in O&M expense 52 54
SARs distribution (pre tax) 57 -
Oncor Adjusted EBITDA, excluding BondCo 1,693 1,827
Oncor Electric Delivery
12
|
|
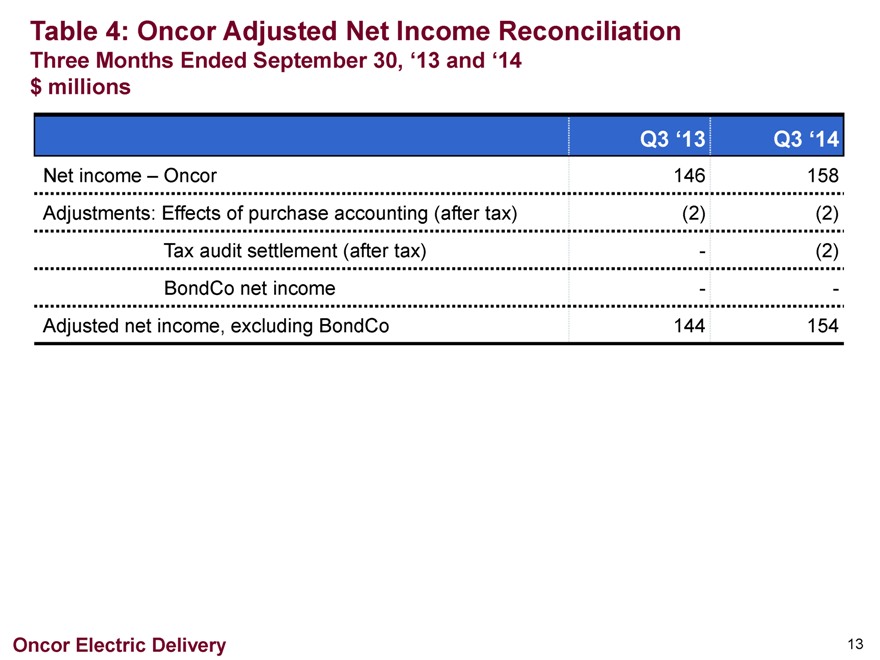
Table 4: Oncor Adjusted Net Income Reconciliation
Three Months Ended September 30, ‘13 and ‘14 $ millions
Q3 ‘13 Q3 ‘14
Net income – Oncor 146 158
Adjustments: Effects of purchase accounting (after tax) (2) (2)
Tax audit settlement (after tax) — (2)
BondCo net income — -
Adjusted net income, excluding BondCo 144 154
Oncor Electric Delivery
13
|
|
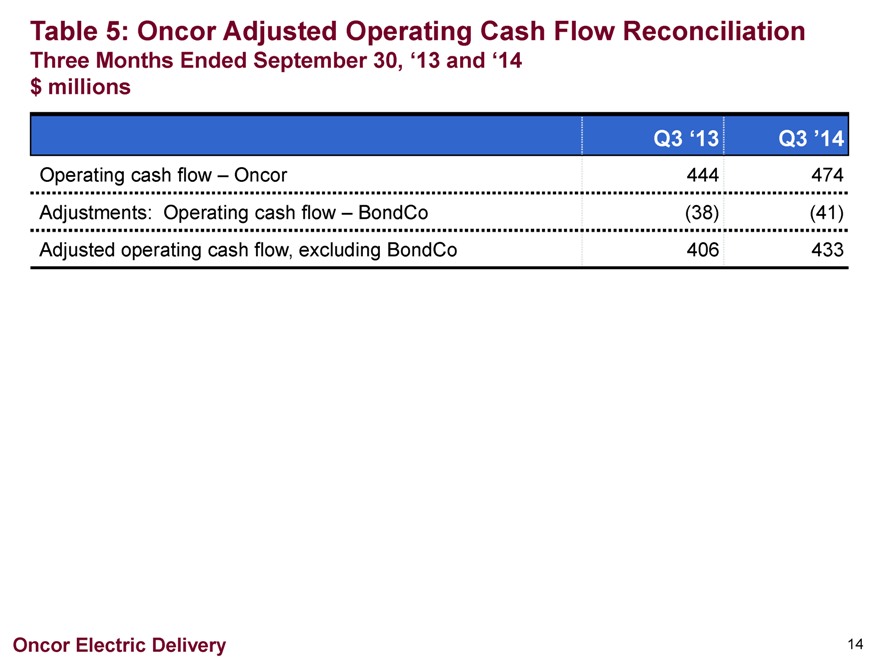
Table 5: Oncor Adjusted Operating Cash Flow Reconciliation
Three Months Ended September 30, ‘13 and ‘14 $ millions
Q3 ‘13 Q3 ’14
Operating cash flow – Oncor 444 474
Adjustments: Operating cash flow – BondCo (38) (41)
Adjusted operating cash flow, excluding BondCo 406 433
Oncor Electric Delivery
14
|
|
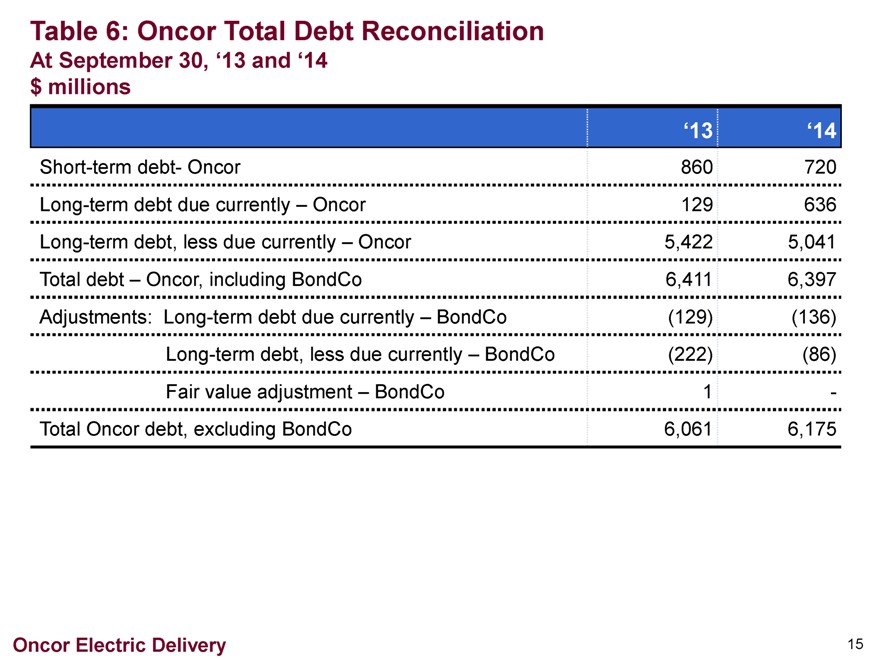
Table 6: Oncor Total Debt Reconciliation
At September 30, ‘13 and ‘14
$ millions
‘13 ‘14
Short-term debt- Oncor 860 720
Long-term debt due currently – Oncor 129 636
Long-term debt, less due currently – Oncor 5,422 5,041
Total debt – Oncor, including BondCo 6,411 6,397
Adjustments: Long-term debt due currently – BondCo (129) (136)
Long-term debt, less due currently – BondCo (222) (86)
Fair value adjustment – BondCo 1 -
Total Oncor debt, excluding BondCo 6,061 6,175
Oncor Electric Delivery
15
|
|
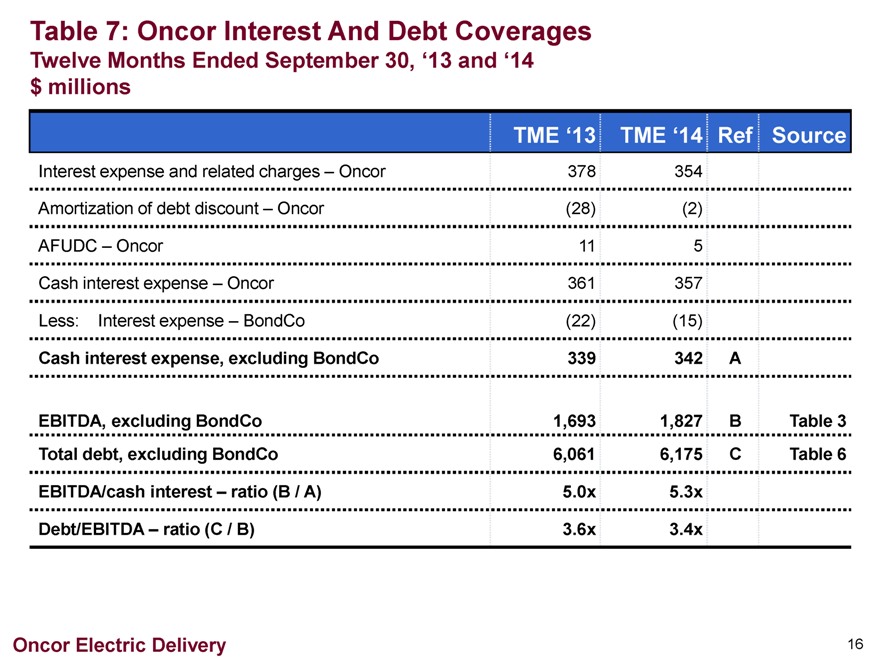
Table 7: Oncor Interest And Debt Coverages
Twelve Months Ended September 30, ‘13 and ‘14 $ millions
TME ‘13 TME ‘14 Ref Source
Interest expense and related charges – Oncor 378 354
Amortization of debt discount – Oncor (28) (2)
AFUDC – Oncor 11 5
Cash interest expense – Oncor 361 357
Less: Interest expense – BondCo (22) (15)
Cash interest expense, excluding BondCo 339 342 A
EBITDA, excluding BondCo 1,693 1,827 B Table 3
Total debt, excluding BondCo 6,061 6,175 C Table 6
EBITDA/cash interest – ratio (B / A) 5.0x 5.3x
Debt/EBITDA – ratio (C / B) 3.6x 3.4x
Oncor Electric Delivery
16