Attached files
| file | filename |
|---|---|
| 8-K - 8-K - NORTHWESTERN CORP | form8kearningsreleaseq32014.htm |
| EX-99.1 - PRESS RELEASE - NORTHWESTERN CORP | ex991pressreleaseq32014.htm |

Third Quarter 2014 Earnings Webcast 10/23/2014

On the Call Today 2 • Bob Rowe, President & CEO • Brian Bird, VP & CFO

3 Forward Looking Statements During the course of this presentation, there will be forward-looking statements within the meaning of the “safe harbor” provisions of the Private Securities Litigation Reform Act of 1995. Forward-looking statements often address our expected future business and financial performance, and often contain words such as “expects,” “anticipates,” “intends,” “plans,” “believes,” “seeks,” or “will.” The information in this presentation is based upon our current expectations as of the date hereof unless otherwise noted. Our actual future business and financial performance may differ materially and adversely from our expectations expressed in any forward-looking statements. We undertake no obligation to revise or publicly update our forward-looking statements or this presentation for any reason. Although our expectations and beliefs are based on reasonable assumptions, actual results may differ materially. The factors that may affect our results are listed in certain of our press releases and disclosed in the Company’s 10-Q which we filed with the SEC on October 23, 2014 and our other public filings with the SEC.

• Received Montana Public Service Commission (MPSC) approval of our application associated with the hydro transaction. • Non-GAAP adjusted gross margin improvement of 2.1% for the third quarter as compared to 2013. Year-to-date Non-GAAP adjusted gross margin up 5.6%. • Improvement of Net Income of approximately $14.6 million as compared with the same period in 2013, due primarily to the release of an unrecognized tax benefit and tax method change, resulting in an income tax benefit of $18.4 million in the third quarter of 2014. • Our board of directors declared a quarterly stock dividend of 40 cents per share payable December 31, 2014. Recent Significant Activities 4

Summary Financial Results 5 (in millions except EPS) 2014 2013 2014 2013 Operating Revenues 251.9$ 262.3$ 892.0$ 835.5$ Cost of Sales 94.6 104.3 374.5 343.4 Gross Margin 157.3 158.0 517.5 492.1 Operating Expenses Operating, general & administrative 68.1 72.5 214.6 208.7 Property and other taxes 27.8 26.0 84.3 77.5 Depreciation and depletion 30.5 28.1 91.1 84.7 Total Operating Expenses 126.4 126.6 390.0 370.9 Operating Income 31.0 31.4 127.4 121.1 Interest Expense (18.8) (17.1) (57.9) (51.0) Other (Expense)/Income (0.4) 3.1 4.7 6.8 Income Before Taxes 11.8 17.5 74.3 76.9 Income Tax Benefit/(Expense) 18.4 (1.8) 9.2 (9.0) Net Income 30.2$ 15.6$ 83.5$ 67.9$ Average Common Shares Outstanding 39.1 38.5 39.0 38.0 Basic Earnings Per Average Common Share 0.77$ 0.41$ 2.14$ 1.79$ Diluted Earnings Per Average Common Share 0.77$ 0.40$ 2.13$ 1.78$ Three Months Ended September 30, Nine Months Ended September 30,

6 Gross Margin Decrease in gross margin due to the following factors: $ (4.9) DSM lost revenues ($2.3 million recorded in 2013 related to prior years) $ (1.7) Operating expenses recovered in trackers $ (0.8) Natural gas and electric retail volumes $ 3.5 Electric transmission capacity $ 2.8 Natural gas production $ 0.4 Other $ (0.7) (dollars in millions) 2014 2013 Electric 127.7$ 131.8$ (4.1)$ (3.1) % Natural gas 29.6 25.8 3.8 14.7 Other - 0.4 (0.4) (100.0) Gross Margin 157.3$ 158.0$ (0.7)$ (0.4) % Variance Three Months Ended September 30,

Operating Expenses 7 Decrease in operating expenses due mainly to the following factors: $4.4 million decrease in OG&A $ (3.6) Non-employee directors deferred compensation $ (2.2) Hydro transaction costs $ (1.7) Operating expenses recovered in trackers $ (0.6) Bad debt expenses $ 2.6 Natural gas production $ 1.1 Other $1.8 million increase in property and other taxes due primarily to plant additions and higher estimated property valuations in Montana. We estimate property taxes throughout each year and update to the actual expense when we receive our Montana property tax bills in November. $2.4 million increase in depreciation and depletion expense primarily due to plant additions, including approximately $1.2 million related to natural gas production assets. (dollars in millions) 2014 2013 Operating, general & administrative 68.1$ 72.5$ (4.4)$ (6.1) % Property and other taxes 27.8 26.0 1.8 6.9 Depreciation and depletion 30.5 28.1 2.4 8.5 Operating Expenses 126.4$ 126.6$ (0.2)$ (0.2) % Variance Three Months Ended September 30,
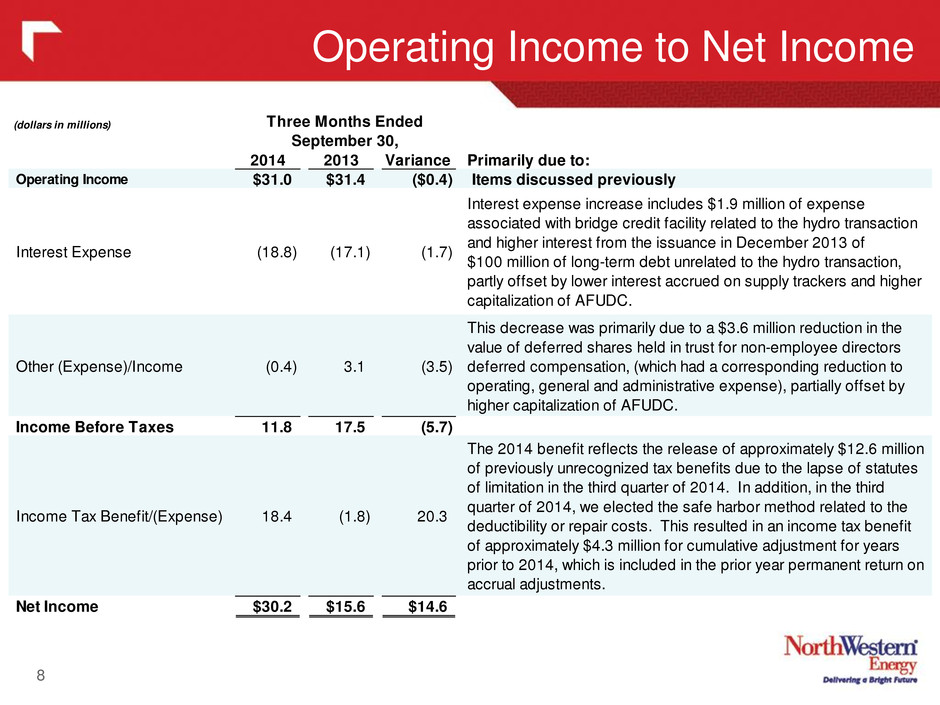
Operating Income to Net Income 8 (dollars in millions) 2014 2013 Variance Primarily due to: Operating Income $31.0 $31.4 ($0.4) Items discussed previously Interest Expense (18.8) (17.1) (1.7) Interest expense increase includes $1.9 million of expense associated with bridge credit facility related to the hydro transaction and higher interest from the issuance in December 2013 of $100 million of long-term debt unrelated to the hydro transaction, partly offset by lower interest accrued on supply trackers and higher capitalization of AFUDC. Other (Expense)/Income (0.4) 3.1 (3.5) This decrease was primarily due to a $3.6 million reduction in the value of deferred shares held in trust for non-employee directors deferred compensation, (which had a corresponding reduction to operating, general and administrative expense), partially offset by higher capitalization of AFUDC. Income Before Taxes 11.8 17.5 (5.7) Income Tax Benefit/(Expense) 18.4 (1.8) 20.3 The 2014 benefit reflects the release of approximately $12.6 million of previously unrecognized tax benefits due to the lapse of statutes of limitation in the third quarter of 2014. In addition, in the third quarter of 2014, we elected the safe harbor method related to the deductibility or repair costs. This resulted in an income tax benefit of approximately $4.3 million for cumulative adjustment for years prior to 2014, which is included in the prior year permanent return on accrual adjustments. Net Income $30.2 $15.6 $14.6 Three Months Ended September 30,

Income Tax Reconciliation 9 The $12.6 million release of unrecognized tax benefits resulted from the lapse of statute of limitation in the third quarter of 2014. In addition, we submitted a tax accounting method change related to the deductibility of repair costs to bring our existing method into alignment with the safe harbor method, resulting in an income tax benefit of approximately $4.3 million for the cumulative tax accounting method change adjustment for years prior to 2014. (in millions) Income Before Income Taxes $11.8 $17.5 Income tax calculated at 35% federal statutory rate 4.1 35.0% 6.1 35.0% Permanent or flow through adjustments: State income, net of federal provisions (0.1) -0.9% (0.7) -4.0% Release of unrecognized tax benefits (12.6) -107.3% - - Safe harbor method election (prior year impact) (4.3) -36.5% - - Other prior year permanent return to accrual adjustments (0.9) -7.5% - - Flow-through repairs deduction (3.4) -29.0% (3.1) -17.7% Plant and depreciation of flow through items (0.7) -5.8% - - Production tax credits (0.3) -2.6% (0.5) -2.9% Other, net (0.2) -2.3% - - (22.5) -191.9% (4.3) -24.6% Income tax (benefit)/expense (18.4)$ -156.9% 1.8$ 10.4% 2014 2013 Three Months Ended September 30,

Updated Effective Tax Rate Guidance 10 Even excluding the significant tax benefits recognized in the third quarter, we are lowering our full year 2014 tax rate guidance from 14% – 16% down to 12% – 14%. This reduction in our 2014 effective tax rate guidance is primarily due to the election and implementation of the safe harbors method for electric transmission and distribution repairs during the third quarter. Even with the anticipated additional income generated from the hydro assets, we anticipate flow-through tax benefits to continue to keep our book effective tax rate at or below approximately 20% through 2017. Additionally, we expect NOLs to be available into 2017 to reduce cash taxes. (in millions) Income before taxes $53.6 $8.9 $11.8 $74.3 ($2.7) $8.0 $79.6 Statutory tax rate (Federal & State) x 38.5% x 38.5% x 38.5% x 38.5% x 38.5% x 38.5% x 38.5% Tax expense before adjustments ($20.6) ($3.4) ($4.5) ($28.5) $1.0 ($3.1) ($30.6) Permanent or flow through adjustments: Flow-through repairs 9.7 1.8 3.4 14.9 14.9 Production tax credits 1.4 0.3 0.3 2.0 2.0 Release of unrecognized tax benefits 12.6 12.6 (12.6) 0.0 Return to accrual adjustments 5.2 5.2 (4.3) 0.9 Other miscellaneous adjustments 1.5 0.1 1.4 3.0 3.0 Income tax (expense) benefit ($8.0) ($1.2) $18.4 $9.2 $1.0 ($3.1) ($16.9) ($9.8) Net Income $45.6 $7.7 $30.2 $83.5 ($1.7) $4.9 ($16.9) $69.8 Effective Tax Rate 14.9% 13.5% -155.9% -12.4% 37.0% 38.8% N/A 12.3% REMOVE IMPACT OF: GAAP Non-GAAP
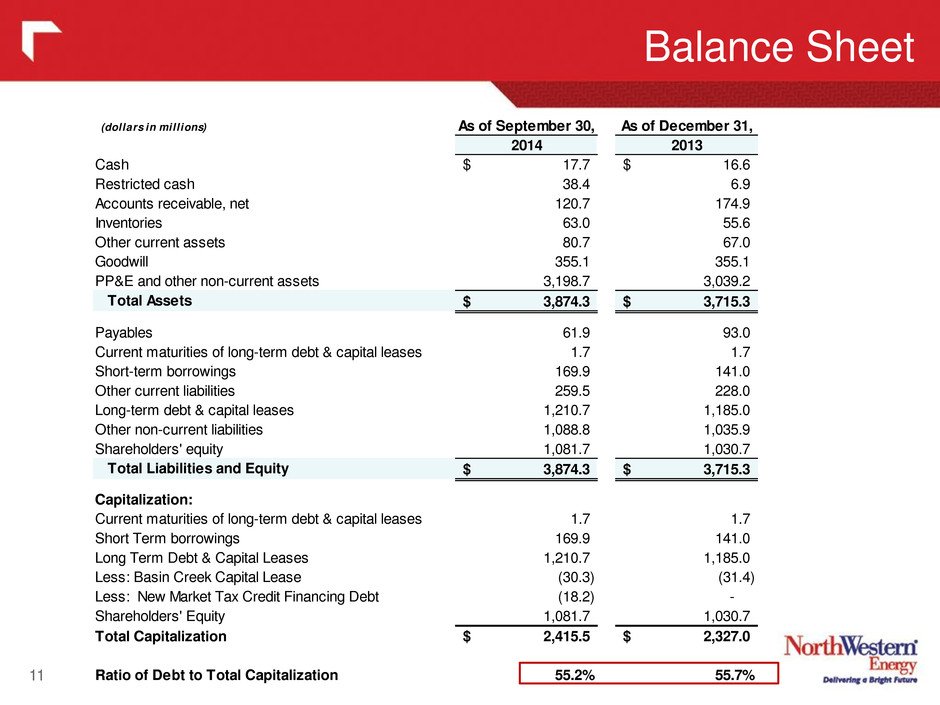
(dollars in millions) As of September 30, As of December 31, 2014 2013 Cash 17.7$ 16.6$ Restricted cash 38.4 6.9 Accounts receivable, net 120.7 174.9 Inventories 63.0 55.6 Other current assets 80.7 67.0 Goodwill 355.1 355.1 PP&E and other non-current assets 3,198.7 3,039.2 Total Assets 3,874.3$ 3,715.3$ Payables 61.9 93.0 Current maturities of long-term debt & capital leases 1.7 1.7 Short-term borrowings 169.9 141.0 Other current liabilities 259.5 228.0 Long-term debt & capital leases 1,210.7 1,185.0 Other non-current liabilities 1,088.8 1,035.9 Shareholders' equity 1,081.7 1,030.7 Total Liabilities and Equity 3,874.3$ 3,715.3$ Capitalization: Current maturities of long-term debt & capital leases 1.7 1.7 Short Term borrowings 169.9 141.0 Long Term Debt & Capital Leases 1,210.7 1,185.0 Less: Basin Creek Capital Lease (30.3) (31.4) Less: New Market Tax Credit Financing Debt (18.2) - Shareholders' Equity 1,081.7 1,030.7 Total Capitalization 2,415.5$ 2,327.0$ Ratio of Debt to Total Capitalization 55.2% 55.7% Balance Sheet 11

Cash Flow 12 $34 million year-to-date improvement in cash flow from operations as compared to 2013. (dollars in millions) 2014 2013 Operating Activities Net Income 83.5$ 67.9$ Non-Cash adjustments to net income 123.0 123.6 Changes in working capital 36.5 6.5 Other (38.1) (26.7) Cash provided by operating activities 205.0 171.3 Investing Activities PP&E additions (186.1) (154.0) Other (37.6) 3.9 Cash used in investing activities (223.7) (150.1) Financing Activities Proceeds from issuance of common stock, net 12.4 43.0 Issuance (Repayments) of long and short-term borrowings, net 54.7 (20.1) Dividends on common stock (46.4) (43.1) Financing costs (0.8) - Cash provided by (used in) financing activities 19.9 (20.2) Increase in C sh and Cash Equivalents 1.2 1.1 Beginning Cash 16.5 9.8 Ending Cash 17.7$ 10.9$ Nine Months Ending September 30,

Non-GAAP Adjusted EPS We anticipate an improvement in the fourth quarter 2014 EPS over the same quarter in 2013 due primarily to customer and load growth, a full quarter of Bear Paw South earnings contribution (asset was placed into service in December 2013), cost controls and a lower effective tax rate. 13 Note: Sum of 2014 quarterly GAAP and Adjusted EPS shown above total $2.14 and $1.79 respectively, or $0.01 greater than when calculated on a year-to-date basis ($2.13 and $1.78). This difference is due to rounding and dilutive share counts used for individual quarters vs the year-to-date calculation. 2014 Q1 Q2 Q3 YTD '14 Low High Low High Reported GAAP diluted EPS $1.17 $0.20 $0.77 $2.13 $0.82 - $0.97 $2.95 - $3.10 Non-GAAP Adjustments: Weather (0.05) 0.01 (0.04) Hydro transaction (Professional fees & bridge financing) 0.04 0.04 0.04 0.12 (0.43) (0.43) Adjusted diluted EPS $1.16 $0.25 $0.38 $1.78 $0.82 - $0.97 $2.60 - $2.75 2013 Q1 Q2 Q3 YTD '13 Reported GAAP diluted EPS $1.01 $0.37 $0.40 $1.78 Non-GAAP Adjustments: Weather (0.02) (0.02) (0.04) Hydro transaction (Professional fees & bridge financing) 0.05 0.05 Prior period DSM lost revenue (Including accrued interest) (0.04) (0.04) Adjusted diluted EPS $1.01 $0.35 $0.39 $1.75 Income Tax Benefits Release of unrecognized tax benefits and safe harbor election (prior years) (0.43) Q4 '13 (0.01) 0.06 ESTIMATED TO MEET GUIDANCE $0.68 Full Year 2013 $2.46 (0.05) $2.50 Full Year 2014 $0.75 ? ? ? Q4 '14 0.02 0.12 (0.04) 0.11 (0.02)

(in millions) Three Months Ended September 30, 2014 Fa vo ra bl e we at he r Hy dr o tra ns ac tio n ex pe ns e No n- em p. d ef er re d co m pe ns at io n Re le as e of u nr ec og ni ze d ta x be ne fit s an d sa fe h ar bo r el ec tio n (p rio r y ea rs ) Three Months Ended September 30, 2014 Three Months Ended September 30, 2013 Pr io r y ea r D SM re ve nu e No n- em p. d ef er re d co m pe ns at io n Hy dr o tra ns ac tio n ex pe ns e Fa vo ra bl e we at he r Three Months Ended September 30, 2013 Revenues $251.9 $251.9 ($6.5) -2.5% $258.4 (2.3) (1.5) $262.2 Cost of sales 94.6 94.6 (9.7) -9.3% 104.3 104.3 Gross Margin 157.3 - - - - 157.3 3.2 2.1% 154.2 (2.3) - - (1.5) 158.0 Op. Expenses OG&A 68.1 (0.6) 2.2 69.7 1.3 2.0% 68.3 (1.4) (2.8) 72.5 Prop. & other taxes 27.8 27.8 1.8 7.0% 26.0 26.0 Depreciation 30.5 30.5 2.4 8.6% 28.1 28.1 Total Op. Exp. 126.3 - (0.6) 2.2 - 127.9 5.6 4.5% 122.3 - (1.4) (2.8) - 126.5 Op. Income 31.0 - 0.6 (2.2) - 29.4 (2.4) -7.5% 31.8 (2.3) 1.4 2.8 (1.5) 31.4 Interest expense (18.8) 1.9 (16.9) 0.2 -0.8% (17.1) (17.1) Other income (0.4) 2.2 1.8 0.1 2.6% 1.7 (1.4) 3.1 Pretax Income 11.8 - 2.5 - - 14.3 (2.1) -13.1% 16.4 (2.3) - 2.8 (1.5) 17.5 Income tax 18.4 - (1.0) - (16.9) 0.6 2.0 -140.0% (1.4) 0.9 - (1.1) 0.6 (1.8) Net Income $30.2 - 1.5 - (16.9) $14.8 ($0.2) -1.1% $15.0 (1.4) - 1.7 (0.9) $15.6 ETR -156.9% - 38.5% - - -4.0% 8.7% 38.5% - 38.5% 38.5% 10.4% Diluted Shares 39.3 39.3 39.3 39.3 39.3 39.3 0.6 1.6% 38.6 38.6 38.6 38.6 38.6 38.6 Diluted EPS $0.77 - 0.04 - (0.43) $0.38 (0.01)$ -2.6% $0.39 (0.04) - 0.05 (0.02) $0.40 Incr. / (Decr.) $ % Remove Impact of: GAAP Non-GAAP Non-GAAP Remove Impact of: GAAP Third Quarter Non-GAAP Adjusted P&L 14

(in millions) Nine Months Ended September 30, 2014 Fa vo ra bl e we at he r Hy dr o tra ns ac tio n ex pe ns e No n- em p. d ef er re d co m pe ns at io n Re le as e of u nr ec og ni ze d ta x be ne fit s an d sa fe h ar bo r el ec tio n (p rio r y ea rs ) Nine Months Ended September 30, 2014 Nine Months Ended September 30, 2013 Pr io r y ea r D SM re ve nu e No n- em p. d ef er re d co m pe ns at io n Hy dr o tra ns ac tio n ex pe ns e Fa vo ra bl e we at he r Nine Months Ended September 30, 2013 Revenues $891.9 (2.7) $889.2 $58.6 7.1% $830.6 (2.3) (2.5) $835.4 Cost of sales 374.5 374.5 31.1 9.1% 343.4 343.4 Gross Margin 517.4 (2.7) - - - 514.7 27.5 5.6% 487.2 (2.3) - - (2.5) 492.0 Op. Expenses OG&A 214.6 (2.3) (0.6) 211.7 9.0 4.4% 202.7 (2.8) (3.3) 208.7 Prop. & other taxes 84.3 84.3 6.8 8.7% 77.5 77.5 Depreciation 91.1 91.1 6.5 7.6% 84.7 84.7 Total Op. Exp. 390.0 - (2.3) (0.6) - 387.1 22.2 6.1% 364.9 - (2.8) (3.3) - 371.0 Op. Income 127.4 (2.7) 2.3 0.6 - 127.6 5.3 4.3% 122.4 (2.3) 2.8 3.3 (2.5) 121.1 Interest expense (57.9) 5.6 (52.3) (1.3) 2.5% (51.0) (51.0) Other income 4.7 (0.6) 4.2 0.2 4.4% 4.0 (2.8) 6.8 Pretax Income 74.3 (2.7) 8.0 - - 79.6 4.2 5.6% 75.4 (2.3) - 3.3 (2.5) 76.9 Income tax 9.2 1.0 (3.1) - (16.9) (9.8) (1.4) 16.7% (8.4) 0.9 - (1.3) 1.0 (9.0) Net Income $83.5 (1.7) 4.9 - (16.9) $69.8 $2.8 4.2% $67.0 (1.4) - 2.0 (1.5) $67.9 ETR -12.4% 37.0% 38.8% - - 12.3% 11.1% 39.1% - 39.4% 40.3% 11.7% Diluted Shares 39.2 39.2 39.2 39.2 39.2 39.2 1.0 2.7% 38.2 38.2 38.2 38.2 38.2 38.2 Diluted EPS $2.13 (0.04) 0.12 - (0.43) $1.78 0.03$ 1.7% $1.75 (0.04) - 0.05 (0.04) $1.78 Incr. / (Decr.) $ % GAAP Remove Impact of: Non-GAAP Non-GAAP Remove Impact of: GAAP Year-to-Date Non-GAAP Adjusted P&L 15

Reaffirmed 2014 Earnings Guidance 16 We are reaffirming our 2014 guidance range of $2.60-$2.75 based upon, but not limited to, the following major assumptions and expectations: • Normal weather in our electric and natural gas service territories for the remainder of 2014; • Excludes any hydro related transaction fees (including legal and bridge financing) and, assuming FERC approval of our financing, excludes any potential income generated from the regulated operation of the hydro assets post-closing; • Excludes any potential additional impact as a result of the FERC decision regarding revenue allocation at our Dave Gates Generating Station; • A consolidated income tax rate of approximately 12% to 14% (previously 14% to 16%) of pre-tax income after removal of $16.9 million of tax benefits recognized during the third quarter that relate specifically to years prior to 2014; and • Diluted average shares outstanding of 39.3 million, which excludes additional shares we expect to issue in the fourth quarter 2014 in conjunction with the pending hydro transaction. Continued investment in our system to serve our customers and communities is expected to provide a targeted 7-10% total return to our investors through a combination of earnings growth and dividend yield. See “Non-GAAP Financial Measures” slide in appendix for “Non-GAAP “Adjusted EPS”. $2.02 $2.14 $2.53 $2.66 $2.46 $- $1.50 $1.75 $2.0 $2.25 $2.50 $2.75 $3.00 2009 2010 2011 2012 2013 2014E GAAP Diluted EPS Initial Guidance Range Non-GAAP "Adjusted" EPS Diluted Earnings Per Share $2.60 - $2.75
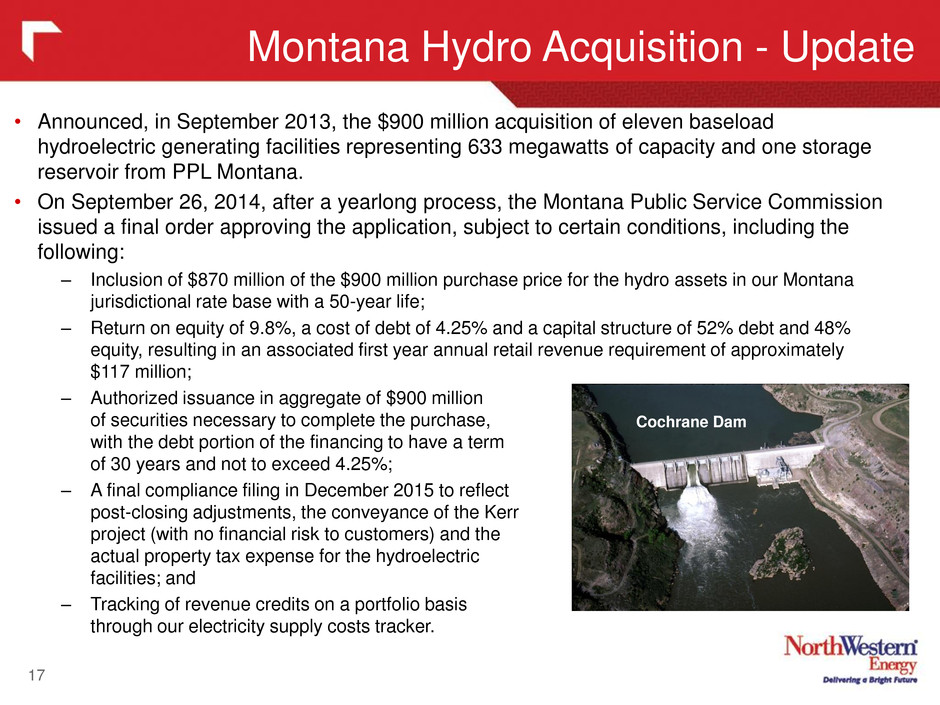
Montana Hydro Acquisition - Update 17 • Announced, in September 2013, the $900 million acquisition of eleven baseload hydroelectric generating facilities representing 633 megawatts of capacity and one storage reservoir from PPL Montana. • On September 26, 2014, after a yearlong process, the Montana Public Service Commission issued a final order approving the application, subject to certain conditions, including the following: – Inclusion of $870 million of the $900 million purchase price for the hydro assets in our Montana jurisdictional rate base with a 50-year life; – Return on equity of 9.8%, a cost of debt of 4.25% and a capital structure of 52% debt and 48% equity, resulting in an associated first year annual retail revenue requirement of approximately $117 million; – Authorized issuance in aggregate of $900 million of securities necessary to complete the purchase, with the debt portion of the financing to have a term of 30 years and not to exceed 4.25%; – A final compliance filing in December 2015 to reflect post-closing adjustments, the conveyance of the Kerr project (with no financial risk to customers) and the actual property tax expense for the hydroelectric facilities; and – Tracking of revenue credits on a portfolio basis through our electricity supply costs tracker. Cochrane Dam

Hydro – Next Steps 18 • On September 26th, following receipt of the MPSC Final Order, we requested the final necessary approval from the Federal Energy Regulatory Commission (FERC) to issue securities in connection with the hydro transaction. We anticipate FERC approval to take 30 to 60 days from the date of our filing. • Upon receipt of the FERC approval, we plan to close into permanent financing of up to $450 million of long-term debt, up to $400 million of equity and up to $50 million of cash flows. If capital market access is limited we have the option of closing into the $900 million committed Bridge Facility with Credit Suisse and Bank of America Merrill Lynch. • One of the conditions directed by the MPSC in connection with its approval is that the company issue long-term debt with an effective interest rate not to exceed 4.25%. Accordingly, on September 5, 2014, the company entered into forward starting interest rate swaps to effectively fix the benchmark interest rate associated with the anticipated $450 million debt issuance at a rate the company anticipates will meet the MPSC's condition. • A fourth quarter 2014 close is anticipated, subject to timely FERC approval. • For additional information visit: http://www.northwesternenergy.com/hydroelectric-facilities Mystic Dam
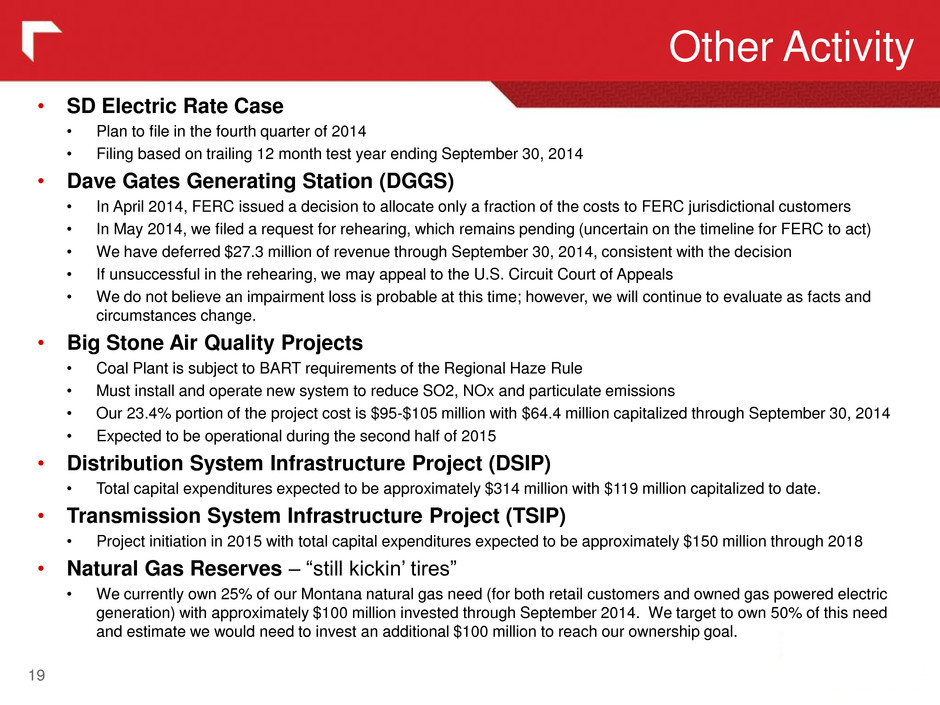
Other Activity 19 • SD Electric Rate Case • Plan to file in the fourth quarter of 2014 • Filing based on trailing 12 month test year ending September 30, 2014 • Dave Gates Generating Station (DGGS) • In April 2014, FERC issued a decision to allocate only a fraction of the costs to FERC jurisdictional customers • In May 2014, we filed a request for rehearing, which remains pending (uncertain on the timeline for FERC to act) • We have deferred $27.3 million of revenue through September 30, 2014, consistent with the decision • If unsuccessful in the rehearing, we may appeal to the U.S. Circuit Court of Appeals • We do not believe an impairment loss is probable at this time; however, we will continue to evaluate as facts and circumstances change. • Big Stone Air Quality Projects • Coal Plant is subject to BART requirements of the Regional Haze Rule • Must install and operate new system to reduce SO2, NOx and particulate emissions • Our 23.4% portion of the project cost is $95-$105 million with $64.4 million capitalized through September 30, 2014 • Expected to be operational during the second half of 2015 • Distribution System Infrastructure Project (DSIP) • Total capital expenditures expected to be approximately $314 million with $119 million capitalized to date. • Transmission System Infrastructure Project (TSIP) • Project initiation in 2015 with total capital expenditures expected to be approximately $150 million through 2018 • Natural Gas Reserves – “still kickin’ tires” • We currently own 25% of our Montana natural gas need (for both retail customers and owned gas powered electric generation) with approximately $100 million invested through September 2014. We target to own 50% of this need and estimate we would need to invest an additional $100 million to reach our ownership goal.

2014 to 2015 Preliminary Earnings & Dividend Bridge PRELIMINARY 2015 ESTIMATES Basic assumptions include, but are not limited to: • Normal weather in our electric and natural gas service territories; • Assumes successful integration and a full year earnings contribution from the pending hydro transaction; • Excludes any potential additional impact as a result of the FERC decision regarding revenue allocation at our Dave Gates Generating Station; • A consolidated effective income tax rate of approximately 15% - 19% of pre- tax income; and • Diluted average shares outstanding of approximately 49.1 million on the low end of guidance and 47.5 million at the high end of guidance. Shares outstanding for 2015 are dependent upon results of planned $400 million equity issuance to fund hydro transaction and therefor are currently shown as a range. * Other 2015 Earnings drivers shown above are calculated using a 38.5% effective tax rate. The anticipated “Incremental tax benefits” in 2015 are primarily due to increased repairs tax deductions resulting from higher maintenance capital spending and other flow-through tax impacts. 20 Low Midpoint High $2.60 - $2.75 2014 Adjusted EPS midpoint $2.68 $2.68 $2.68 2015 Earnings drivers (after-tax per share) Gross margin improvements 2.70 - 2.82 OG&A expense increases (0.95) - (0.89) Property & other taxes (0.31) - (0.29) Depreciation & depletion (0.36) - (0.34) Interest expense / other income (0.26) - (0.22) Incremental tax benefits * 0.18 - 0.22 $1.00 - $1.30 $3.68 - $3.98 Dilutive impact of $400 million share issuance (0.73) - (0.68) $2.95 - $3.30 2015 Preliminary EPS midpoint $3.13 2015 Preliminary EPS guidance range $2.95 - $3.30 2015 Preliminary targeted dividend payout ratio 60% 60% $1.77 $1.98 2015 Preliminary targeted dividend midpoint $1.88 2015 Preliminary targeted dividend range 2015 Preliminary EPS guidance range 2015 EPS prior to dilution Subtotal of anticipated improvements 2014 Non-GAAP Adjusted EPS guidance range

Net Investment in Existing Business 21 Maintenance capital expenditures have cumulatively outpaced depreciation by $190 million over the last five years (2009 to 2013), while maintaining a positive Free Cash Flow during the same period. Prior capital spending on South Dakota supply projects (Big Stone $64M, Neal $23M, Aberdeen Peaker $55M)* are not included in the capex above. We plan to seek recovery for these investments through our anticipated SD electric rate filing in the fourth quarter 2014. *South Dakota supply capital spending totals through September 30, 2014 ($150) ($100) ($50) $0 $50 $100 $150 $200 $250 2009 2010 2011 2012 2013 ($m illi on s) Maintenance Capex vs. Depreciation Distribution System Infrastructure Project (DSIP) Capital Maintenance capex Depreciation Cumulative capex in excess of depreciation

Capital Spending Forecast 22 Current estimated cumulative capital spending for 2014 through 2018 is $1.45 billion (upper chart), an increase of $330 million over last year’s estimate (bottom chart). *Similar to DSIP, Transmission System Infrastructure Project (TSIP) intends to move us beyond basic compliance by evaluating the overall performance and health of our electric and natural gas transmission system. TSIP would prioritize and address transmission needs for the long- term benefit of our customers. Note: The capital forecasts above do not include $900m purchase price for pending hydro acquisition or any potential future natural gas reserve acquisitions. $182 $200 $170 $156 $147 $52 $50 $50 $50 $38 $29 $- $50 $100 $150 $200 $250 $300 $350 2014 2015 2016 2017 2018 $M illion s As reported in the 2013 10-K $272 $279 $220 $206 $147 * 182 $197 $200 $203 $170 $52 $51 $52 $54 $24 $38 $32 $16 $39 $40 $56 $10 $9 $12 $9 $272 $306 $300 $309 $259 $- $ 1 1 $200 $250 $300 $350 2014 2015 2016 2017 2018 $M illio ns Estimate as of October 2014 Maintenance Capex DSIP Big Stone TSIP Hydro

23 Appendix

24 Third Quarter - Reconciliation NORTHWESTERN CORPORATION Three Months Ended September 30, 2014 ($millions, except EPS) Th re e M on th s E nd ed , Se pt em be r 3 0, 20 13 DS M lo st re ve nu e r ec ov er ies Op er ati ng ex pe ns es re co ve re d in tra ck er El ec tric re tai l v olu m es El ec tric tr an sm iss ion ca pa cit y Na tur al ga s p ro du cti on Na tur al ga s r eta il v olu m es No n- em plo ye e d ire cto rs de ferr ed co m pe ns ati on Hy dr o t ra ns ac tio n c os ts Ba d d eb t e xp en se Na tur al ga s p ro du cti on Pe rm an en t a nd flo w- thr ou gh ad jus tm en ts to inc om e t ax Im pa ct of hig he r s ha re co un t Al l o the r Th re e M on th s E nd ed , Se pt em be r 3 0, 20 14 Gross Margin 158.0$ (4.9) (1.7) (1.3) 3.5 2.8 0.5 0.4 157.3 Operating Expenses Op.,Gen., & Administrative 72.5 (1.7) (3.6) (2.2) (0.6) 2.6 1.1 68.1 Prop. & other taxes 26.0 1.8 27.8 Depreciation and depletion 28.1 2.4 30.5 Total Operating Expense 126.6 - (1.7) - - - - (3.6) (2.2) (0.6) 2.6 - - 5.3 126.4 Operating Income 31.4 (4.9) - (1.3) 3.5 2.8 0.5 3.6 2.2 0.6 (2.6) - - (4.8) 31.0 Interest Expense (17.1) (1.9) 0.2 (18.8) Other Income (Expense) 3.1 (3.6) 0.1 (0.4) Income Before Inc. Taxes 17.5 (4.9) - (1.3) 3.5 2.8 0.5 - 0.3 0.6 (2.6) - - (4.6) 11.8 Income Tax Benefit (Expense)1 (1.8) 1.9 - 0.5 (1.3) (1.1) (0.2) - (0.1) (0.2) 1.0 18.2 - 1.6 18.4 Net Income (Loss) 15.6$ (3.0) - (0.8) 2.2 1.7 0.3 - 0.2 0.4 (1.6) 18.2 - (3.0) 30.2 Fully Diluted Shares 38.65 0.64 - 39.28 Fully Diluted EPS 0.40$ (0.08)$ -$ (0.02)$ 0.06$ 0.04$ 0.01$ -$ 0.01$ 0.01$ (0.04)$ 0.46$ (0.01)$ (0.07)$ 0.77$ 1.) Income Tax Benefit (Expense) calculation on reconciling items assumes normal effective tax rate of 38.5%.
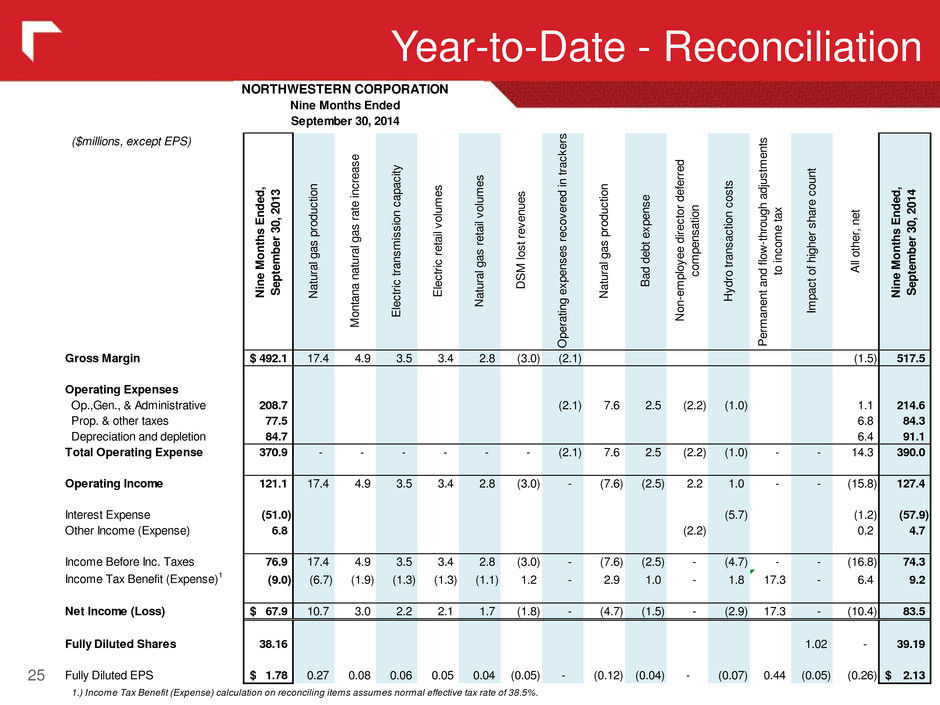
25 Year-to-Date - Reconciliation ($millions, except EPS) Ni ne M on th s En de d, Se pt em be r 3 0, 2 01 3 Na tu ra l g as p ro du ct ion M on ta na n at ur al ga s ra te in cr ea se El ec tri c tra ns m iss ion c ap ac ity El ec tri c re ta il v olu m es Na tu ra l g as re ta il v olu m es DS M lo st re ve nu es O pe ra tin g ex pe ns es re co ve re d in tra ck er s Na tu ra l g as p ro du ct ion Ba d de bt e xp en se No n- em plo ye e dir ec to r d ef err ed co m pe ns at ion Hy dr o tra ns ac tio n co st s Pe rm an en t a nd flo w- th ro ug h ad jus tm en ts to in co m e ta x Im pa ct o f h igh er s ha re c ou nt Al l o th er , n et Ni ne M on th s En de d, Se pt em be r 3 0, 2 01 4 Gross Margin 492.1$ 17.4 4.9 3.5 3.4 2.8 (3.0) (2.1) (1.5) 517.5 Operating Expenses Op.,Gen., & Administrative 208.7 (2.1) 7.6 2.5 (2.2) (1.0) 1.1 214.6 Prop. & other taxes 77.5 6.8 84.3 Depreciation and depletion 84.7 6.4 91.1 Total Operating Expense 370.9 - - - - - - (2.1) 7.6 2.5 (2.2) (1.0) - - 14.3 390.0 Operating Income 121.1 17.4 4.9 3.5 3.4 2.8 (3.0) - (7.6) (2.5) 2.2 1.0 - - (15.8) 127.4 Interest Expense (51.0) (5.7) (1.2) (57.9) Other Income (Expense) 6.8 (2.2) 0.2 4.7 Income Before Inc. Taxes 76.9 17.4 4.9 3.5 3.4 2.8 (3.0) - (7.6) (2.5) - (4.7) - - (16.8) 74.3 Income Tax Benefit (Expense)1 (9.0) (6.7) (1.9) (1.3) (1.3) (1.1) 1.2 - 2.9 1.0 - 1.8 17.3 - 6.4 9.2 Net Income (Loss) 67.9$ 10.7 3.0 2.2 2.1 1.7 (1.8) - (4.7) (1.5) - (2.9) 17.3 - (10.4) 83.5 Fully Diluted Shares 38.16 1.02 - 39.19 Fully Diluted EPS 1.78$ 0.27 0.08 0.06 0.05 0.04 (0.05) - (0.12) (0.04) - (0.07) 0.44 (0.05) (0.26) 2.13$ 1.) Income Tax Benefit (Expense) calculation on reconciling items assumes normal effective tax rate of 38.5%. NORTHWESTERN CORPORATION Nine Months Ended September 30, 2014

Effective Tax Reconciliation 26 (in millions) 2014 2013 Variance 2014 2013 Variance Income Before Income Taxes 11.8$ 17.5$ (5.7)$ 74.3$ 76.9$ (2.6)$ Income tax calculated at 35% federal statutory rate 4.1 6.1 (2.0) 26.0 26.9 (0.9) Permanent or flow through adjustments: State income, net of federal provisions (0.1) (0.7) 0.6 0.3 (2.6) 2.9 Release of unrecognized tax benefits (12.6) - (12.6) (12.6) - (12.6) Safe harbor method election (prior year impact) (4.3) - (4.3) (4.3) - (4.3) Other prior year permanent return to accrual adjustments (0.9) - (0.9) (0.9) 0.5 (1.4) Flow-through repairs deduction (3.4) (3.1) (0.3) (14.9) (12.9) (2.0) Plant and depreciation of flow through items (0.7) - (0.7) (0.2) - (0.2) Production tax credits (0.3) (0.5) 0.2 (2.1) (2.2) 0.1 Other, net (0.2) - (0.2) (0.5) (0.7) 0.2 (22.5) (4.3) (18.2) (35.2) (17.9) (17.3) Income tax (benefit)/expense (18.4)$ 1.8$ (20.2)$ (9.2)$ 9.0$ (18.2)$ Nine Months Ended September 30, Three Months Ended September 30,

27 Third Quarter - Electric Segment (dollars in millions) 2014 2013 Change Retail revenues 197.9$ 201.5$ (3.6)$ (1.8) % Regulatory amortization (2.3) 11.8 (14.1) (119.5) Total retail revenue 195.6 213.3 (17.7) (8.3) Transmission 14.7 11.2 3.5 31.3 Ancillary services 0.3 0.4 (0.1) (25.0) Wholesale 0.2 0.8 (0.6) (75.0) Other 1.6 1.4 0.2 14.3 Total Revenues 212.4 227.1 (14.7) (6.5) Total Cost of Sales 84.7 95.3 (10.6) (11.1) Gross Margin 127.7$ 131.8$ (4.1)$ (3.1) % 2014 2013 2014 2013 2014 2013 Retail Electric Montana 59,545$ 65,455$ 545 575 283,412 280,284 South Dakota 12,527 12,698 132 146 49,581 49,350 Residential 72,072 78,153 677 721 332,993 329,634 Montana 84,726 83,624 826 823 63,906 63,266 South Dakota 19,963 18,502 251 255 12,451 12,154 Commercial 104,689 102,126 1,077 1,078 76,357 75,420 Industrial 10,329 10,105 721 737 77 74 Other 10,805 11,131 86 91 8,031 7,813 Total Retail Electric 197,895$ 201,515$ 2,561 2,627 417,458 412,941 Total Wholesale Electric 202$ 845$ 12 39 - - Avg. Customer CountRevenues Results % Change (in thousands) Megawatt Hours (MWH)

28 Year-to-Date - Electric Segment (dollars in millions) 2014 2013 Change Retail revenues 583.7$ 581.5$ 2.2$ 0.4 % Regulatory amortization 21.6 11.9 9.7 81.5 Total retail revenue 605.3 593.4 11.9 2.0 Transmission 40.8 37.3 3.5 9.4 Ancillary services 1.2 1.1 0.1 9.1 Wholesale 1.2 2.0 (0.8) (40.0) Other 4.5 3.9 0.6 15.4 Total Revenues 653.0 637.7 15.3 2.4 Total Cost of Sales 273.8 260.9 12.9 4.9 Gross Margin 379.2$ 376.8$ 2.4$ 0.6 % 2014 2013 2014 2013 2014 2013 Retail Electric Montana 192,303$ 198,375$ 1,773 1,751 282,836 280,113 South Dakota 39,049 37,150 453 447 49,548 49,250 Residential 231,352 235,525 2,226 2,198 332,384 329,363 Montana 242,274 238,482 2,410 2,356 63,658 63,120 South Dakota 56,343 52,009 738 722 12,322 12,168 Commercial 298,617 290,491 3,148 3,078 75,980 75,288 Industrial 30,612 31,089 2,116 2,194 75 74 Other 23,154 24,352 156 168 6,260 6,129 Total Retail Electric 583,735$ 581,457$ 7,646 7,638 414,699 410,854 Total Wholesale Electric 1,219$ 2,022$ 72 97 - - Avg. Customer Count Results % Change (in thousands) Revenues Megawatt Hours (MWH)

29 Third Quarter - Natural Gas Segment (dollars in millions) 2014 2013 Change Retail revenues 25.4$ 22.8$ 2.6$ 11.4 % Regulatory amortization 4.0 3.2 0.8 25.0 Total retail revenue 29.4 26.0 3.4 13.1 Wholesale and other 10.1 8.8 1.3 14.8 Total Revenues 39.5 34.8 4.7 13.5 Total Cost of Sales 9.9 9.0 0.9 10.0 Gross Margin 29.6$ 25.8$ 3.8$ 14.7 % 2014 2013 2014 2013 2014 2013 Retail Gas Montana 11,057$ 9,770$ 904 807 163,474 161,988 South Dakota 2,051 1,916 116 124 38,196 37,846 Nebraska 2,299 2,257 154 157 36,480 36,315 Residential 15,407 13,943 1,174 1,088 238,150 236,149 Montana 6,567 6,042 596 581 22,580 22,457 South Dakota 1,726 1,296 210 171 6,105 5,971 Nebraska 1,457 1,281 194 185 4,571 4,538 Commercial 9,750 8,619 1,000 937 33,256 32,966 Industrial 135 145 13 12 260 262 Other 102 94 10 10 153 156 Total Retail Gas 25,394$ 22,801$ 2,197 2,047 271,819 269,533 Avg. Customer Count Results % Change (in thousands) Revenues Dekatherms (Dkt)

30 Year-to-Date - Natural Gas Segment (dollars in millions) 2014 2013 Change Retail revenues 202.7$ 173.5$ 29.2$ 16.8 % Regulatory amortization 3.7 (6.3) 10.0 (158.7) Total retail revenue 206.4 167.2 39.2 23.4 Wholesale and other 32.6 29.5 3.1 10.5 Total Revenues 239.0 196.7 42.3 21.5 Total Cost of Sales 100.7 82.5 18.2 22.1 Gross Margin 138.3$ 114.2$ 24.1$ 21.1 % 2014 2013 2014 2013 2014 2013 Retail Gas Montana 86,186$ 72,171$ 8,460 8,014 163,662 162,362 South Dakota 22,820 20,227 2,553 2,354 38,490 38,146 Nebraska 19,528 18,774 2,116 2,012 36,787 36,656 Residential 128,534 111,172 13,129 12,380 238,939 237,164 Montana 44,869 37,338 4,840 4,252 22,707 22,613 South Dakota 16,670 13,498 2,322 2,119 6,138 6,028 Nebraska 10,862 10,016 1,580 1,496 4,619 4,596 Commercial 72,401 60,852 8,742 7,867 33,464 33,237 Industrial 920 776 96 88 262 264 Other 856 720 104 97 153 157 Total Retail Gas 202,711$ 173,520$ 22,071 20,432 272,818 270,822 (in thousands) Results Revenues Dekatherms (Dkt) Avg. Customer Count % Change

31 Heating and Cooling Degree Days 3 Months ending September 30 2014 Cooling Degree-Days 2014 2013 Historic Average 2013 Historic Average M ntana 324 393 265 18% colder 22% warmer South Dakota 467 702 63 33 l r 6% cold r Degree Days 4 as compared with: Heating Degree-Days 2014 2013 Historic Average 2013 Historic Average Montana 330 231 355 43% colder 7% warmer S uth Dakota 107 60 83 78 c l r 29% cold r Nebrask 63 21 4 200% colder 47 c l er Degree Days 4 as compared with: 9 Months ending September 30 2014 Cooling Degree-Days 2014 2013 Historic Average 2013 Historic Average M ntana 332 438 306 4% colder 8% warmer South Dakota 544 752 698 28 l r 22% cold r Degree Days 4 as compared with: Heating Degree-Days 2014 2013 Historic Average 2013 Historic Average Montana 5,049 4,721 4,936 7% colder 2% colder S uth Dakota 6,265 6,174 5,602 1 c l r 1 c l r Nebrask 4,77 4,741 4, 5 % colder 4% colder Degree Days 4 as compared with:
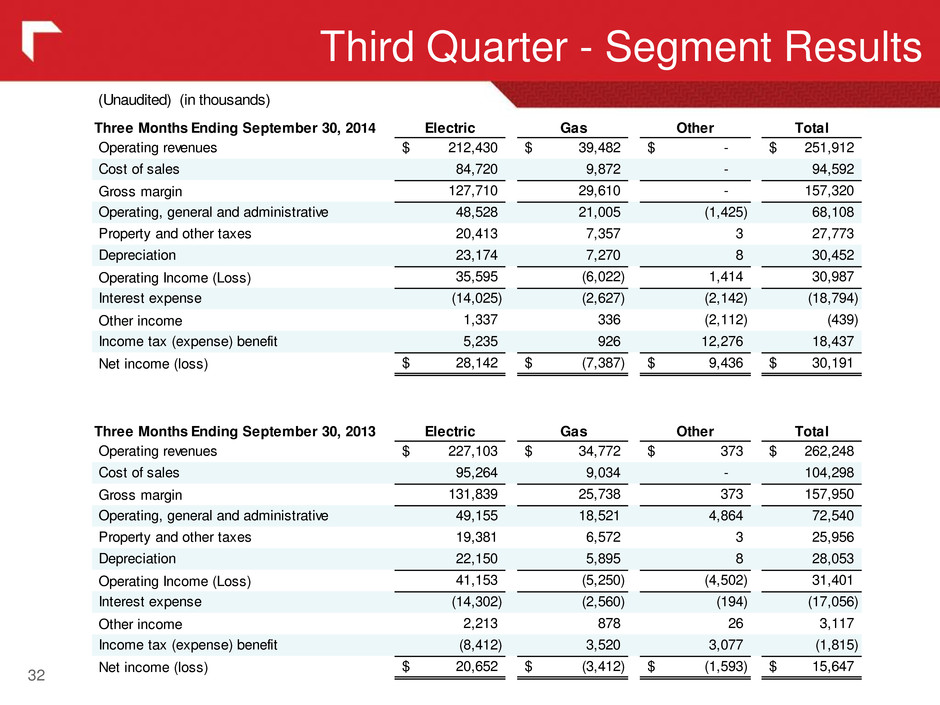
32 Third Quarter - Segment Results (Unaudited) (in thousands) Three Months Ending September 30, 2014 Electric Gas Other Total Operating revenues 212,430$ 39,482$ -$ 251,912$ Cost of sales 84,720 9,872 - 94,592 Gross margin 127,710 29,610 - 157,320 Operating, general and administrative 48,528 21,005 (1,425) 68,108 Property and other taxes 20,413 7,357 3 27,773 Depreciation 23,174 7,270 8 30,452 Operating Income (Loss) 35,595 (6,022) 1,414 30,987 Interest expense (14,025) (2,627) (2,142) (18,794) Other income 1,337 336 (2,112) (439) Income tax (expense) benefit 5,235 926 12,276 18,437 Net income (loss) 28,142$ (7,387)$ 9,436$ 30,191$ Three Months Ending September 30, 2013 Electric Gas Other Total Operating revenues 227,103$ 34,772$ 373$ 262,248$ Cost of sales 95,264 9,034 - 104,298 Gross margin 131,839 25,738 373 157,950 Operating, general and administrative 49,155 18,521 4,864 72,540 Property and other taxes 19,381 6,572 3 25,956 Depreciation 22,150 5,895 8 28,053 Operating Income (Loss) 41,153 (5,250) (4,502) 31,401 Interest expense (14,302) (2,560) (194) (17,056) Other income 2,213 878 26 3,117 Income tax (expense) benefit (8,412) 3,520 3,077 (1,815) Net income (loss) 20,652$ (3,412)$ (1,593)$ 15,647$

33 Year-to-Date - Segment Results (Unaudited) (in thousands) Nine Months Ending September 30, 2014 Electric Gas Other Total Operating revenues 652,951$ 238,965$ -$ 891,916$ Cost of sales 273,754 100,740 - 374,494 Gross margin 379,197 138,225 - 517,422 Operating, general and administrative 144,933 66,254 3,370 214,557 Property and other taxes 61,322 22,961 9 84,292 Depreciation 69,398 21,716 25 91,139 Operating Income (Loss) 103,544 27,294 (3,404) 127,434 Interest expense (43,663) (7,979) (6,245) (57,887) Other income 3,204 876 650 4,730 Income tax (expense) benefit (575) (3,334) 13,149 9,240 Net income (loss) 62,510$ 16,857$ 4,150$ 83,517$ Nine Months Ending September 30, 2013 Electric Gas Other Total Operating revenues 637,667$ 196,652$ 1,110$ 835,429$ Cost of sales 260,879 82,528 - 343,407 Gross margin 376,788 114,124 1,110 492,022 Operating, general and administrative 142,594 56,899 9,248 208,741 Property and other taxes 57,549 19,968 8 77,525 Depreciation 67,454 17,206 25 84,685 Oper ting Income (Loss) 109,191 20,051 (8,171) 121,071 Interest expense (42,840) (7,553) (583) (50,976) Other income 4,926 1,753 81 6,760 Income tax (expense) benefit (12,792) (153) 3,980 (8,965) Net income (loss) 58,485$ 14,098$ (4,693)$ 67,890$

These materials include financial information prepared in accordance with GAAP, as well as other financial measures, such as Gross Margin and Adjusted Diluted EPS, that are considered “non-GAAP financial measures.” Generally, a non-GAAP financial measure is a numerical measure of a company's financial performance, financial position or cash flows that exclude (or include) amounts that are included in (or excluded from) the most directly comparable measure calculated and presented in accordance with GAAP. Gross Margin (Revenues less Cost of Sales) is a non-GAAP financial measure due to the exclusion of depreciation from the measure. Gross Margin is used by us to determine whether we are collecting the appropriate amount of energy costs from customers to allow recovery of operating costs. Adjusted Diluted EPS is another non-GAAP measure. The Company believes the presentation of Adjusted Diluted EPS is more representative of our normal earnings than the GAAP EPS due to the exclusion (or inclusion) of certain impacts that are not reflective of ongoing earnings. The presentation of these non-GAAP measures is intended to supplement investors' understanding of our financial performance and not to replace other GAAP measures as an indicator of actual operating performance. Our measures may not be comparable to other companies' similarly titled measures. Non-GAAP Financial Measures 34 (in thousands) 2009 2010 2011 2012 2013 Reported GAAP diluted EPS 2.02$ 2.14$ 2.53$ 2.66$ 2.46$ Non-GAAP Adjustments Weather - 0.06 (0.05) 0.14 (0.05) Rate adjustments - (0.05) - - - Insurance recoveries - (0.08) - - - In me tax djustments - - (0.17) (0.06) - Tran mis ion r venue - low hydro - - 0.05 - - Dispute with f rmer employee - - 0.05 - - DGGS FERC ALJ initial decision (2011 portion) - - - 0.12 - Release of MPSC DGGS deferral - - - (0.05) - DSM Lost Revenue recovery - - - (0.05) (0.02) CELP arbitration decision - - - (0.79) - MSTI Impairment - - - 0.40 - Hydro Transaction costs - - - - 0.11 Adjusted Non-GAAP diluted EPS 2.02$ 2.07$ 2.41$ 2.37$ 2.50$ Use of Non-GAAP Financial Measures - Reconcile to Non-GAAP diluted EPS

35
