Attached files
SECURITIES AND EXCHANGE COMMISSION
Washington, D.C. 20549
FORM 10-K
x ANNUAL REPORT PURSUANT TO SECTION 13 OR 15(d) OF THE
SECURITIES EXCHANGE ACT OF 1934
For the Fiscal Year Ended June 30, 2014
o TRANSITION REPORT UNDER SECTION 13 OR 15 (d) OF THE
SECURITIES EXCHANGE ACT OF 1934
Commission File Number: 000-51151
|
ENERGIZER RESOURCES INC.
|
|
(Name of small business issuer as specified in its charter)
|
|
Minnesota
|
20-0803515
|
|
|
(State or other jurisdiction of incorporation or organization)
|
(I.R.S. Employer Identification No.)
|
520 – 141 Adelaide Street West, Toronto, Ontario, Canada M5H 3L5
(Address of principal executive offices)
(416) 364-4911
(Issuer’s telephone number)
_____________________________________________
(Former name or former address, if changed since last report)
Securities Registered under Section 12(b) of the Exchange Act:
None
Securities Registered Under Section 12(g) of the Exchange Act:
Common Stock, $0.001
Indicate by check mark if the registrant is a well-known seasoned issuer, as defined in Rule 405 of the Securities Act. Yes o No x
Indicate by check mark if the registrant is not required to file reports pursuant to Section 13 or 15(d) of the Exchange Act. Yes o No x
Indicate by check mark whether the registrant (1) has filed all reports required to be filed by Section 13 or 15(d) of the Exchange Act during the past 12 months (or for such shorter period that the registrant was required to file such reports), and (2) has been subject to such filing requirements for the past 90 days. Yes x No o
Indicate by check mark whether the registrant has submitted electronically and posted on its corporate Web site, if any, every Interactive Data File required to be submitted and posted pursuant to Rule 405 of Regulation S-T (§232.405 of this chapter) during the preceding 12 months (or for such shorter period that the registrant was required to submit and post such files). Yes o No x
Indicate by check mark if disclosure of delinquent filers pursuant to Item 405 of Regulation S-K (§ 229.405 of this chapter) is not contained herein, and will not be contained, to the best of registrant’s knowledge, in definitive proxy or information statements incorporated by reference in Part III of this Form 10K or any amendment to this Form 10-K or any amendment to this Form 10-K. x
Indicate by check mark whether the registrant is a large accelerated filer, an accelerated filer, a non-accelerated filer or a smaller reporting company. See definition of “accelerated filer and large accelerated filer” in Rule 12b-2 of the Exchange Act. (Check one):
| Large accelerated filer | o | Accelerated filer | o |
| Non-accelerated filer | o | Smaller reporting company | x |
Indicate by checkmark whether the registrant is a shell company (as defined in Rule 12b-2 of the Exchange Act). Yes o No x
The aggregate market value of the voting and non-voting common equity held by non-affiliates computed by reference to the price at which the common equity was last sold, or the average bid and asked price of such common equity, as of the last business day of the registrant's most recently completed second fiscal quarter was $26,128,520. For purposes of the above statement only, all directors, executive officers and 10% shareholders are assumed to be affiliates. This determination of affiliate status is not necessarily a conclusive determination for other purposes.
The number of shares outstanding of the registrant’s Common Stock, par value $0.01 per share (the "Common Stock"), as of September 19, 2014, was 269,198,956.
Documents Incorporated By Reference: None

Energizer Resources Inc.
|
PART I
|
|||||
|
ITEM 1.
|
Business
|
4 | |||
|
ITEM 1A.
|
Risk Factors
|
19 | |||
|
ITEM 1B.
|
Unresolved Staff Comments
|
26 | |||
|
ITEM 2.
|
Properties
|
26 | |||
|
ITEM 3.
|
Legal Proceedings
|
26 | |||
|
ITEM 4.
|
Mine Safety Disclosures
|
26 | |||
|
PART II
|
|||||
|
ITEM 5.
|
Market for Registrant’s Common Equity, Related Stockholder Matters and Issuer Purchases of Equity Securities
|
27 | |||
|
ITEM 6.
|
Selected Financial Data
|
29 | |||
|
ITEM 7.
|
Management’s Discussion and Analysis of Financial Condition and of Results Operations
|
29 | |||
|
ITEM 7A.
|
Quantitative and Qualitative Disclosures about Market Risk
|
34 | |||
|
ITEM 8.
|
Financial Statements
|
34 | |||
|
ITEM 9.
|
Changes in and Disagreements with Accountants on Accounting and Financial Disclosure
|
34 | |||
|
ITEM 9A.
|
Controls and Procedures
|
34 | |||
|
ITEM 9B.
|
Other Information
|
35 | |||
|
PART III
|
|||||
|
ITEM 10.
|
Directors, Executive Officers, and Corporate Governance
|
36 | |||
|
ITEM 11.
|
Executive Compensation
|
40 | |||
|
ITEM 12.
|
Security Ownership of Certain Beneficial Owners and Management and Related Stockholder Matters
|
47 | |||
|
ITEM 13.
|
Certain Relationships and Related Transactions, and Director Independence
|
49 | |||
|
ITEM 14.
|
Principal Accounting Fees and Services
|
52 | |||
|
PART IV
|
|||||
|
ITEM 15.
|
Exhibits, Financial Statement Schedules
|
53 | |||
|
Signatures
|
54 | ||||
CERTIFICATIONS
| Exhibit 31 – | Management certification | ||||
| Exhibit 32 – | Sarbanes-Oxley Act |
2
FORWARD-LOOKING STATEMENTS
This Annual Report contains certain forward-looking statements within the meaning of the Private Securities Litigation Reform Act of 1995 ("PSLRA") regarding management’s plans and objectives for future operations including plans and objectives relating to our planned marketing efforts and future economic performance. The forward-looking statements and associated risks set forth in this Annual Report include or relate to, among other things, (a) our growth strategies, (b) anticipated trends in the mining industry, (c) our ability to obtain and retain sufficient capital for future operations, and (d) our anticipated needs for working capital. These statements may be found under “Management’s Discussion and Analysis of Financial Condition and Results of Operations” and “Description of Business,”. Actual events or results may differ materially from those discussed in forward-looking statements as a result of various factors, including, without limitation, the risks outlined under “Risk Factors”. In light of these risks and uncertainties, there can be no assurance that the forward-looking statements contained in this report will in fact occur.
The forward-looking statements herein are based on current expectations that involve a number of risks and uncertainties. Such forward-looking statements are based on assumptions described herein. The assumptions are based on judgments with respect to, among other things, future economic, competitive and market conditions, and future business decisions, all of which are difficult or impossible to predict accurately and many of which are beyond our control. Accordingly, although we believe that the assumptions underlying the forward-looking statements are reasonable, any such assumption could prove to be inaccurate and therefore there can be no assurance that the results contemplated in forward-looking statements will be realized. In addition, as disclosed in “Risk Factors”, there are a number of other risks inherent in our business and operations, which could cause our operating results to vary markedly, and adversely from prior results or the results contemplated by the forward-looking statements. Management decisions, including budgeting, are subjective in many respects and periodic revisions must be made to reflect actual conditions and business developments, the impact of which may cause us to alter marketing, capital investment and other expenditures, which may also materially adversely affect our results of operations. In light of significant uncertainties inherent in the forward-looking information included in the report statement, the inclusion of such information should not be regarded as a representation by us or any other person that our objectives or plans will be achieved.
Any statement in this report that is not a statement of an historical fact constitutes a “forward-looking statement”. Further, when we use the words “may”, “expect”, “anticipate”, “plan”, “believe”, “seek”, “estimate”, “internal”, and similar words, we intend to identify statements and expressions that may be forward- looking statements. We believe it is important to communicate certain of our expectations to our investors. Forward-looking statements are not guarantees of future performance. They involve risks, uncertainties and assumptions that could cause our future results to differ materially from those expressed in any forward-looking statements. Many factors are beyond our ability to control or predict. You are accordingly cautioned not to place undue reliance on such forward-looking statements. Important factors that may cause our actual results to differ from such forward-looking statements include, but are not limited to, the risks outlined under “Risk Factors” herein. The reader is cautioned that our Company does not have a policy of updating or revising forward-looking statements and thus the reader should not assume that silence by management of our Company over time means that actual events are bearing out as estimated in such forward-looking statements.
All references to “dollars”, “$” or “US$” are to United States dollars and all references to “CAD$” are to Canadian dollars. United States dollar equivalents of Canadian dollar figures are based on the noon exchange rate as reported by the Bank of Canada on the applicable date. All references to “common shares” refer to the common shares in our capital stock.
3
PART I
FINANCIAL INFORMATION
As used in this report, “we”, “us”, “our”, “Energizer Resources”, “Energizer”, “Company” or “our Company” refers to Energizer Resources Inc. and all of its subsidiaries. The term NSR stands for Net Smelter Royalty.
ITEM 1. BUSINESS
BACKGROUND – COMPANY OVERVIEW
Energizer Resources Inc. (the "Company") was incorporated in the State of Nevada, United States of America on March 1, 2004 and reincorporated in the State of Minnesota on May 14, 2008. Our fiscal year end is June 30. The Company's principal business is the acquisition and exploration of mineral resources. During fiscal 2008, we incorporated Energizer Resources (Mauritius) Ltd., a Mauritius subsidiary and Energizer Resources Madagascar Sarl, a Madagascar subsidiary. During fiscal 2009, we incorporated THB Venture Ltd., a Mauritius subsidiary to hold the interest in Energizer Resources Minerals Sarl, a Madagascar subsidiary, which holds the Green Giant Property in Madagascar. During fiscal 2012, we incorporated Madagascar-ERG Joint Venture (Mauritius) Ltd., a Mauritius subsidiary and ERG (Madagascar) Sarl, a Madagascar subsidiary. ERG (Madagascar) Sarl is 100% owned by Madagascar-ERG Joint Venture (Mauritius) Ltd. which is owned 100% by Energizer Resources (Mauritius) Ltd. ERG (Madagascar) Sarl holds the Malagasy Joint Venture Ground (see note 7). During fiscal 2014, we incorporated 2391938 Ontario Inc. an Ontario, Canada subsidiary.
We have not had any bankruptcy, receivership or similar proceeding since incorporation. Except as described below, there have been no material reclassifications, mergers, consolidations or purchases or sales of any significant amount of assets not in the ordinary course of business since the date of incorporation.
Summary of Our Business
We are an exploration stage company engaged in the search for graphite, vanadium, gold, uranium and other minerals. We have an interest in properties located in the African country of Madagascar and Canada in the Province of Québec. None of the properties in which we hold an interest have known mineral reserves of any kind at this time. As such, the work programs planned by us are exploratory in nature.
Our executive offices are currently located at 520–141 Adelaide Street West, Toronto, Ontario, Canada M5H 3L5. Our telephone number is (416) 364-4911. We maintain a website at www.energizerresources.com (which website is expressly not incorporated by reference into this filing). These offices are leased on a month-to-month basis, and our monthly rental payments are currently CAD$10,000 per month.
UNTIL WE CAN VALIDATE OTHERWISE, THE PROPERTIES OUTLINED BELOW HAVE NO KNOWN MINERAL RESERVES OF ANY KIND AND WE ARE PLANNING PROGRAMS THAT ARE EXPLORATORY IN NATURE.
Further details regarding our properties, although not incorporated by reference, including the comprehensive geological report prepared in compliance with Canada’s National Instrument 43-101 on our Molo Graphite Project and our Green Giant Property in Madagascar can be found on our Company’s website: www.energizerresources.com (which website is expressly not incorporated by reference into this filing) or in our Company’s Canadian regulatory filings on www.sedar.com (which website and content is expressly not incorporated by reference into this filing).
Cautionary Note
Due to the nature of our business, we anticipate incurring operating losses for the foreseeable future. We base this expectation, in part, on the fact that very few mineral properties in the exploration stage ultimately develop into producing profitable mines. Our future financial results are also uncertain due to a number of factors, some of which are outside our control. These factors include, but are not limited to:
|
·
|
our ability to raise additional capital as required;
|
|
·
|
the market price for graphite, vanadium, gold, uranium and for any other minerals which we may find;
|
|
·
|
ongoing joint ventures;
|
|
·
|
the results of our proposed exploration programs on our mineral properties;
|
|
·
|
environmental regulations that may adversely impact cost and operations; and
|
|
·
|
our ability to find joint venture partners, as needed, for the development of our property interests.
|
4
If we are successful in completing an equity financing, as necessary, existing shareholders will experience dilution of their interest in our Company. In the event we are not successful in raising additional financing, we anticipate that we will not be able to proceed with our business plan. In such a case, we may decide to discontinue our current business plan and seek other business opportunities in the resource sector. During this period, should it ever arise, we will need to maintain our periodic filings with the appropriate regulatory authorities and, as such, will incur legal and accounting costs. In the event no other such opportunities are available and we cannot raise additional capital to sustain operations, we may be forced to discontinue our business altogether. We do not have any specific alternative business opportunities in mind and have not planned for any such contingency.
Due to our lack of operating history and present inability to generate revenues, our auditors have stated their opinion that there currently exists doubt as to our ability to continue as a going concern.
Properties
Cautionary Note Regarding Resource and Reserve Calculation – Energizer Resources Inc. reports reserve and mineralized material estimates in accordance with U.S. SEC Industry Guide 7. Canadian investors are cautioned that estimates of mineralized materials may differ from mineral resource estimates prepared in accordance with the standards of the Canadian Institute of Mining, Metallurgy and Petroleum referred to in Canadian National Instrument 43-101 - Standards of Disclosure for Mineral Projects (“NI 43-101”). Canadian investors should review the mineral resource estimates prepared in accordance with NI 43-101 standards found in section 14.10 of the Company’s NI 43-101 Molo Graphite Project technical report dated April 12, 2013.
Madagascar Properties
Molo Graphite Project, Southern Madagascar, Africa
On December 14, 2011, we entered into a Definitive Joint Venture Agreement ("JVA") with Malagasy Minerals Limited ("Malagasy"), a public company on the Australian Stock Exchange, to acquire a 75% interest to explore and develop a group of industrial minerals, including graphite, vanadium and approximately 25 other minerals. The land position covers 2,119 permits and 827.7 square kilometres and is mostly adjacent to the south and east of our 100% owned Green Giant Property. We paid $2,261,690 and issued 7,500,000 common shares valued at $1,350,000.
On October 24, 2013, the Company signed a Memorandum of Understanding ("MOU") with Malagasy to acquire the remaining 25% interest in land position. Upon execution of a signed purchase agreement, the share purchase agreement will supersede the MOU.
On April 16, 2014, we signed a Sale and Purchase Agreement and a Mineral Rights Agreement with Malagasy to acquire the remaining 25% interest. We made the following payments: CAD$400,000; issued 2,500,000 common shares subject to a 12 month voluntary vesting period and valued at $325,000; and issued 3,500,000 common share purchase warrants. We will make a cash payment of CAD$700,000 and issue 1,000,000 common shares within five days of completion of a bankable feasibility study (“BFS”) or the formal announcement of a decision to mine; and a cash payment of CAD$1,000,000 within five days of the commencement of commercial production. Malagasy retains a 1.5% net smelter return royalty ("NSR"). We also acquired a 100% interest to the industrial mineral rights on approximately 1-1/2 additional claim blocks comprising 10,811 hectares to the east and adjoining the Molo Graphite Project. We will continue to own a 100% interest in the industrial mineral rights, which includes our Canadian NI 43-101 compliant vanadium resource estimate, comprising an indicated resource of 49.5 million tonnes at an average grade of 0.693% vanadium pentoxide (V2O5) and an inferred resource of 9.7 million tonnes at an average grade of 0.632% V2O5 at a cut-off of 0.5% V2O5.
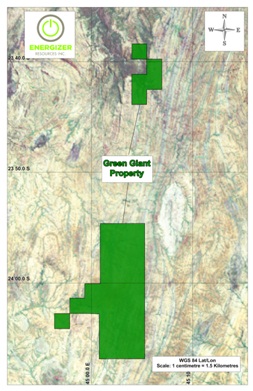
Green Giant Property, Madagascar
During 2007 we acquired a 75% interest in the property. We paid $765,000, issued 2,500,000 common shares and 1,000,000 now expired common share purchase warrants to enter into a joint venture agreement for the Green Giant Property with Madagascar Minerals and Resources Sarl ("MMR").
On July 9, 2009, we acquired the remaining 25% interest for $100,000. MMR retains a 2% NSR. The NSR can be purchased at our option, for $500,000 in cash or common shares for the first 1% and at a price of $1,000,000 in cash or common shares for the second 1%.
On April 16, 2014, we signed a Joint Venture Agreement with Malagasy, whereby Malagasy acquired a 75% interest for non-industrial minerals on the property. We retain remaining 25% and have a free carried interest through the BFS. No specific consideration was received for this transaction as it was part of the Molo Graphite Project transaction dated April 16, 2014.
5
Canadian Property
Sagar Property – Romanet Horst, Labrador Trough, Québec, Canada
During 2006, we purchased from Virginia Mines Inc. ("Virginia") a 100% interest in 382 claims located in northern Quebec, Canada. Virginia retains a 2% NSR on certain claims within this property with other unrelated vendors holding a 1% NSR on certain claims, and a 0.5% NSR on other claims. For the other vendor's NSR, we have the right to buy back half of the 1% NSR for $200,000 and half of the 0.5% NSR for $100,000.
On July 31, 2014 we revised our February 28, 2014 agreement with Honey Badger Exploration Inc. (“TUF”), a public company related by common management, to sell an interest in the Sagar Property. Under the revised agreement, in order for TUF to acquire an initial 35% interest in the property, we will receive CAD$150,000 and TUF will spend CAD$1,500,000 developing the property. TUF can earn further percentage interests up to 75% over a four year period by spending a total of CAD$9,000,000, paying the Company CAD$900,000 and issuing to us the lesser of 15% of its issued and outstanding shares or 35,000,000 shares. Once these commitments have been met, TUF can acquire the remaining interest by paying us an additional CAD$2,000,000 and issuing the lesser of 19.5% of TUF outstanding shares or up to 60,000,000 shares, including all previously issued shares.
Further details on exploration programs carried out on all our Company’s properties can be found below.
Competitive Conditions in our Industry
The mineral exploration and mining industry is competitive in all phases of exploration, development and production. We compete with a number of other entities and individuals in the search for, and acquisition of, attractive mineral properties. As a result of this competition, the majority of which is with companies with greater financial resources than us, we may not in the future be able to acquire attractive properties on terms our management considers acceptable. Furthermore, we compete with other resource companies, many of whom have greater financial resources and/or more advanced properties that are better able to attract equity investments and other capital. Factors beyond our control may affect the marketability of minerals mined or discovered by us.
Employees
As of September 19, 2014, we had 10 total employees, 7 full-time and 3 part-time employees. In addition to our full time employees, we engage consultants to serve several important managerial and non-managerial functions for us.
6
MADAGASCAR PROPERTIES
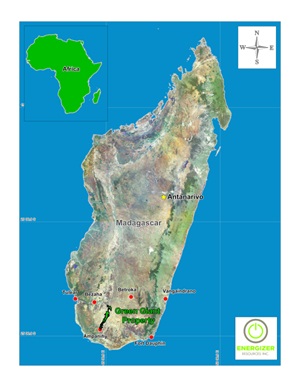
Green Giant Property Description and Location
The Green Giant Property is comprised of 6 mineral permits. The properties are located in the District of Toliara and are referenced as TN 12,306,P(R); TN 12,814, P(R); TN 12,887 P(R); TN 12,888 P(R); TN 13,020 P(R); TN 13,021 P(R) as issued by the Bureau de Cadastre Minier de Madagascar (“BCMM”) pursuant to the Mining Code 1999 (as amended) and its implementing decrees. The total land position is 225 sq. kilometres. This property can be accessed by both air and road.
7
Molo Graphite Property Description and Location
The “Molo Graphite Property” is comprised of a portion of or all of 40 mineral permits. The properties are located in the District of Toliara and are referenced as TN 3,432,P(R); TN 5,394, P(R); TN 13,064 P(R); TN 13,811 P(R); TN 14618 P(R), TN 14,619 P(R); TN 14,620 P(R); TN 14,622 P(R); TN 14,623 P(R); TN 16,747 P(R); TN 16,753 P(R); TN 19,003 P(R); TN 19,851 P(R); TN 19,932 P(R); TN 19,934 P(R); TN 19,935 P(R); TN 21,059 P(R); TN 21,060 P(R); TN 21,061 P(R); TN 21,062 P(R); TN 21,063 P(R); TN 21,064 P(R); TN 24,864 P(R); TN 25,605 P(R); TN 25,606 P(R); TN 28,340 P(R); TN 28,346 P(R); TN 28,347 P(R); TN 28,348 P(R); TN 28,349 P(R); TN 28,352 P(R); TN 28,353 P(R); TN 29,020 P(R); TN 31,734 P(R); TN 31,735 P(R); TN 38,323 P(R); TN 38,324 P(R); TN 38,325 P(R); TN 38,392 P(R); and TN 38,469 P(R) as issued by the Bureau de Cadastre Minier de Madagascar (“BCMM”) pursuant to the Mining Code 1999 (as amended) and its implementing decrees. The total land position is 940.2 sq. kilometres. This property can be accessed by both air and road.

Agreements
Molo Graphite Project, Southern Madagascar, Africa
On December 14, 2011, we entered into a Definitive Joint Venture Agreement ("JVA") with Malagasy Minerals Limited ("Malagasy"), a public company on the Australian Stock Exchange, to acquire a 75% interest to explore and develop a group of industrial minerals, including graphite, vanadium and approximately 25 other minerals. The land position covers 2,119 permits and 827.7 square kilometres and are mostly adjacent to the south and east of our 100% owned Green Giant Property. We paid $2,261,690 and issued 7,500,000 common shares valued at $1,350,000.
On April 16, 2014, we signed a Sale and Purchase Agreement and a Mineral Rights Agreement with Malagasy to acquire the remaining 25% interest. We made the following payments: CAD$400,000; issued 2,500,000 common shares subject to a 12 month voluntary vesting period and valued at $325,000; and issued 3,500,000 common share purchase warrants. We will make a cash payment of CAD$700,000 and issue 1,000,000 common shares within five days of completion of a BFS or the formal announcement of a decision to mine; and a cash payment of CAD$1,000,000 within five days of the commencement of commercial production. Malagasy retains a 1.5% net smelter return royalty ("NSR"). We also acquired a 100% interest to the industrial mineral rights on approximately 1-1/2 additional claim blocks comprising 10,811 hectares to the east and adjoining the Molo Graphite Project.
8
DRA Agreement Signed for Ability to Develop and Build Mine
During January 2012, we signed a formal agreement with South Africa's DRA Mineral Projects (“DRA”), a world-leading process engineering and mining project development management firm, for the development of our projects in Madagascar. Specific focus will be on the development of vanadium and graphite minerals. This partnership provides us with the ability to both build and manage a mining operation. It also provides DRA the option to purchase up to 5% of our Company through private placement at current market conditions.
Madagascar Historical Exploration Programs
The Green Giant Property displays extensive gossans outcroppings at surface. An examination of part of this property revealed several large areas covered with gossanous boulders, which are believed to overlie massive sulphide mineralization. Phases of the exploration projects were managed by our company’s President and COO, Craig Scherba, P. Geol., who at the time was one of our outside consultant geologists. We conducted a first phase of exploration from September to November 2007 that included the following activities:
|
·
|
Stream Sediment sampling of all stream on the property area
|
|
·
|
Detailed Geological mapping over selected startigraphic horizons
|
|
·
|
Reconnaissance geological mapping over the entire property
|
|
·
|
Soil sampling over selected target areas and prospecting over selected target areas
|
|
·
|
Limited trenching over selected targets
|
|
·
|
Construction of a cinder block base camp
|
|
·
|
Construction of a one kilometre long surfaced airstrip
|
|
·
|
Repair and surfacing of the access road from base camp to the airstrip
|
|
·
|
Airborne geophysical surveying
|
During March 2008-June 2008, a full field exploration program following up on the airborne geophysical survey and results of the 2007 exploration program was implemented. This exploration consisted of the following:
|
·
|
Infill stream sediment sampling
|
|
·
|
Detailed Geological mapping over selected stratigraphic horizons
|
|
·
|
Prospecting over selected target areas
|
|
·
|
Grid emplacement over selected target areas
|
|
·
|
Ground-based magnetometer and frequency domain EM surveys
|
|
·
|
Soil sampling over selected target areas
|
After reviewing the analytical data from the March 2008- June 2008 program, additional exploration was conducted from July 2008 to September 2008 to prepare for a drill program. This exploration consisted of the following:
|
·
|
Infill stream sediment sampling
|
|
·
|
Detailed geological mapping over selected stratigraphic horizons
|
|
·
|
Prospecting over selected target areas with the aid of a mobile XRF analyzer
|
Based on compiled analytical results obtained from the various exploration programs, a drill program was initiated on the property from September 2008-November 2008. This exploration program consisted of the following:
|
·
|
Prospecting over selected target areas with the aid of a mobile XRF analyzer
|
|
·
|
Ground-based scintillometer surveying over selected target areas
|
|
·
|
Diamond drilling of 31 holes over 4,073 metres
|
Based on early indications for vanadium on the property, another exploration program was initiated on the Green Giant Property during the spring of 2009. The program (completed between April 2009-July 2009) consisted of an extensive X-Ray Fluorescence analysis (XRF) soil sampling program coupled with mechanical trenching and scintillometer surveys over possible areas of vanadium enrichment and new areas, defined by the soil XRF survey.
We initiated a vanadium drill program during September 2009-December 2009 consisting of the following:
· XRF soil sample analyses (8,490 samples) on lines 200 metres apart covering 18 kilometre strike length
· Scintillometer surveying (112 line kilometres) on lines 200 metres apart over an 18 kilometre strike length
· Trenching (140 trenches for 17,105 metres)
· Diamond drilling of 54 diamond drill holes over 8,931 metres
9
The exploration programs to date resulted in the delineation of two vanadium pentoxide (V2O5) deposits (named the Jaky and Manga), characterized by two separate categories: oxide and primary.
Based on the results of the September 2009-December 2009 program, we conducted an additional exploration program on the property from April 2010-July 2010. This program consisted of the following activities:
|
·
|
Diamond drilling of 46 diamond drill holes over 8,952 metres
|
|
·
|
Prospecting over selected target areas with the aid of a mobile XRF analyzer (20 grab samples)
|
|
·
|
Geologic mapping over the Manga and Mainty deposits at 1:5000 scale
|
|
·
|
ERT ground geophysical survey (5.64 km)
|
|
·
|
MAG ground geophysical survey (169.53 km)
|
|
·
|
Gradient Array EM ground geophysical survey (128.82 km)
|
In 2011, the identification of graphite in the Manga, Jaky and Mainty zones led our geologists to conduct a reconnaissance exploration program (Phase I program) on the properties in September, 2011. The goal of this exploration program was to delineate new graphitic trends, and compare them to those associated with vanadium mineralization. This program consisted of the following activities:
|
·
|
Diamond drilling of 10 holes over 1,157.5 metres
|
|
·
|
Trenching (16 trenches for 1,912 metres)
|
|
·
|
Prospecting over selected target areas
|
An additional reconnaissance exploration program was conducted from November 2011-December, 2011 (Phase II program). The purpose of this program was to ascertain the industrial mineral potential on the Joint Venture Ground, and further drill testing of graphitic trends on the Green Giant Property. This program consisted of the following:
|
·
|
Diamond drilling of 20 holes over 2,842 metres
|
|
·
|
Prospecting over selected target areas
|
|
·
|
EM31 ground geophysical survey over selected target areas (160.5 km)
|
The discovery of graphite mineralization from the 2011 exploration programs resulted in the initiation of a resource delineation drill program from May 2012-August 2012. This program consisted of the following:
|
·
|
Trenching (18 trenches for 2,100 metres)
|
|
·
|
Diamond drilling of 41 diamond drill holes over 8,459 metres
|
The resource delineation drill program identified that graphite mineralization could be divided into a high grade zone (6 to 10% carbon) that produces small to large graphite flakes, and a low grade zone (4 to 6% carbon) that produces large to jumbo graphite flakes. A bulk sampling program was undertaken in May 2013 with the purpose of collecting two separate samples, in order to test the nature of the low-grade and high-grade deposits to see if they have different requirements. The two bulk samples were submitted for metallurgical test work, which is deemed to be representative of the future plant feed, and hence could be used for a Bankable Feasibility Study going forward. In order to be representative, an external geological consultant determined a sample size of 100 tonnes each was deemed sufficient.
The primary objectives for analyzing the bulk samples at a 'pilot plant scale' were as follows:
|
·
|
Confirm the robustness of the proposed metallurgical flow-sheet that was first developed on a laboratory scale under continuous conditions
|
|
·
|
Develop process design criteria for the Full Feasibility Study
|
|
·
|
Generate large samples of concentrate for evaluation by potential off take partners
|
The metallurgical results confirmed the proposed flow sheet, and that the graphite flakes from the Molo deposit can be upgraded to high-grade graphite concentrate by means of simple flotation.
Bulk sample highlights:
|
·
|
The average mass recovery into the large and extra-large flake category (greater than +80 mesh) was 43.5% based on the results of fifteen size fraction analyses of the combined concentrate;
|
|
·
|
The average grade of the extra-large flake (greater than +48 mesh) was 97.7%Ct (Total Carbon)
|
|
·
|
The average grade of the large flake (greater than +80 mesh) was 97.4%Ct;
|
|
·
|
The average grade of the medium flake (greater than +200 mesh) was 96.7% Ct; and
|
|
·
|
The majority of the impurities reported to the small flake size fractions (-400 mesh).
|
The average total carbon content of twelve pilot plant surveys was 93.7% Ct at an average carbon recovery of 90.3%. The average composition of the combined concentrate of fifteen size fraction analyses is shown in the table below.
10
Molo Average Flake Size Analysis
|
Size
mesh
|
Mass as Percentage of Total
Concentrate Mass in %
|
Grade
% C(t)
|
|
48
|
15.7
|
97.7
|
|
65
|
17.6
|
97.4
|
|
80
|
10.2
|
96.7
|
|
100
|
9.7
|
96.4
|
|
150
|
15.0
|
96.1
|
|
200
|
10.1
|
95.2
|
|
-200
|
21.6
|
88.2
|
A part of the full feasibility study, the Company conducted an infill resource delineation program from May 2014-June 2012. This program consisted of the following:
|
·
|
Trenching (9 trenches for 1,876 metres)
|
|
·
|
Diamond drilling of 32 diamond drill holes over 2,063 metres
|
Madagascar Infrastructure
· Road Access
Access to the Company’s Molo Graphite Deposit from Toliara, starts with a 70 km paved road to the village of Andranovory. From Andranovory, secondary all-season roads continue to Betioky, a distance of 93 km. From Betioky, the Molo Graphite Deposit can be reached from Ambatry to Fotadrevo, a distance of 105 km, for an overall total of 268 km, or from Betioky to Ejeda then onwards to Fotadrevo, a distance of 161 km, for an overall total of 324 km. The second route from Ejeda to Fotadrevo is used by heavy transport trucks and by all vehicles during portions of the rainy season, as the other route can become impassable. At the height of the rainy season, both routes to Fotadrevo may become impassable. From Fotadrevo, the Molo Graphite Deposit may be reached by a fairly well maintained dirt track. The map below shows the road access to the Molo Graphite Deposit from the town of Toliara.
11
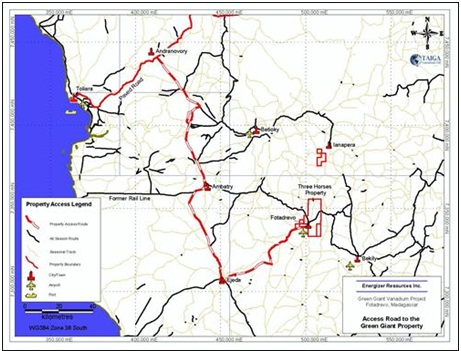
Map of Road Structure from Toliara to Fotadrevo
Air Access
With the upgrading of an existing airstrip at Fotadrevo to an all-weather airstrip during the 2008 exploration program, our Madagascar properties are accessible year-round by private aircraft out of Antananarivo, except under special circumstance caused by continuous or multiple days of heavy rain. Flying times to Fotadrevo are approximately 2.5 hours from Antananarivo and 45 minutes from Toliara.
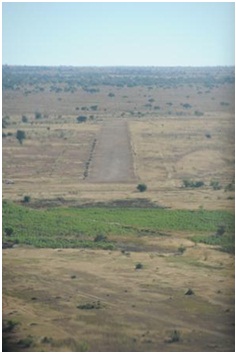
Photo of the Landing Strip at Fotadrevo
Antananarivo is currently serviced by Air France (Paris), South African Airways (Johannesburg), and Air Mauritius (Mauritius). Air Madagascar also provides service to Paris, Johannesburg, Mauritius, Nairobi, and Réunion Island. Domestically, Air Madagascar has regularly scheduled jet and propjet flights throughout the country, including daily flights between Antananarivo and Toliara.
12
The village of Fotadrevo, where our Company has its base camp, is located to the west of the Molo Graphite Deposit. The village has been a labour source during our Company’s exploration programs, and will likely provide a portion of the workforce during future exploration and development. A few basic goods are commercially available in the village, however, the main centre for support of exploration and development are the cities of Toliara and Antananarivo. Two 40 kVA diesel-powered generators provide power to the camp facility.
A cellular telephone tower is located in Fotadrevo, which provides phone and internet coverage. No potable water is currently available within the project area. A well 123 millimetre in diameter has been drilled to a depth of 42 metres within the camp compound, which provides non-potable water for the camp.
Graphite Market and Pricing
Market Overview
According to Industrial Minerals magazine, the natural graphite market is 1,015,100 tonnes of which roughly 55% is flake and 45% is low grade amorphous (or 582,800 flake, 428,300 amorphous, 4,000 vein). Graphite is produced globally, however China currently accounts for most of the graphite production with a market share of 77%. Two tables listing the current major production countries of flake and amorphous graphite are below (Source: Natural Graphite Report 2012, Industrial Minerals, www.indmin.com):
|
Country
|
Flake output
|
|
China
|
380,000
|
|
Brazil
|
96,000
|
|
India
|
35,000
|
|
North Korea
|
30,000
|
|
Canada
|
21,000
|
|
Norway
|
8,000
|
|
Zimbabwe
|
5,000
|
|
Madagascar
|
4,000
|
|
Russia
|
2,000
|
|
Ukraine
|
1,500
|
|
Germany
|
300
|
|
Total
|
582,800
|
|
Country
|
Amorphous output
|
|
China
|
400,000
|
|
Austria
|
16,000
|
|
Mexico
|
12,000
|
|
Turkey
|
300
|
|
Total
|
428,300
|
China produces 77% of the world’s graphite, however most of its production is low grade amorphous. The graphite industry in China is undergoing fundamental reforms. China is protecting its domestic supply and has imposed a combined 37% export duty and value added tax. Furthermore, China is consolidating and closing a large number of mines, between 180-200, to preserve graphite resources and address environmental concerns.
Current Demand
Graphite has many wide-ranging uses from refractories to anodes in batteries (Source: Natural Graphite Report 2012, Industrial Minerals, www.indmin.com)
|
Refractories, foundry and crucibles
|
39 | % | ||
|
Metallurgy
|
28 | % | ||
|
Parts and components
|
10 | % | ||
|
Batteries
|
9 | % | ||
|
Lubricants
|
9 | % | ||
|
Other
|
5 | % |
Future Demand
Batteries alone is the fastest growing market for graphite with growth between 15-25% a year (Source: Industrial Minerals, 2012) and future demand for graphite is expected through the uptake of lithium-ion batteries (Li-ion). There is 11 times more graphite in a Li-ion battery than there is lithium and demand for graphite in Li-ion batteries, specifically from the growth of the electric vehicle market, is expected to be significant. Other future demand drivers include pebble bed nuclear reactors, fuel cells, large-scale energy storage and graphene.
13
Graphite Pricing
Graphite pricing is a function of flake size and purity where larger flake and higher purity command premium pricing in the market. The three major categories for flake graphite are large, medium, and small (amorphous).
Graphite is not freely traded on an open market. This means determining its price is somewhat of an opaque market as prices are determined through contracts between buyers and sellers. Nevertheless, Industrial Minerals performs regular customer surveys tracking pricing trends and, from their analysis, overall graphite prices have substantially increased since 2007 due to increased demand and constrained supply. Recently however, graphite prices have decreased from their peak due to the slowdown in the global economy particularly in Europe and Asia. Despite this recent decline, future prices are predicted to remain strong as can be outlined in the graph below:
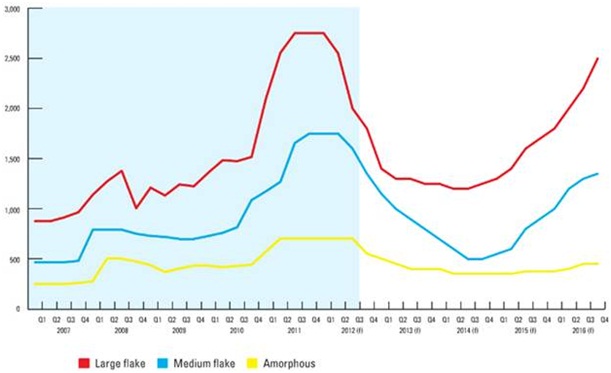
Source: Natural Graphite Report 2012, Industrial Minerals, www.indmin.com
Vanadium Market and Pricing
Source of this entire section: United States Geological Survey. Data in metric tons of vanadium content unless otherwise noted
Domestic Production and Use
Seven U.S. firms comprise most of the domestic vanadium industry produced ferrovanadium, vanadium pentoxide, vanadium metal and vanadium-bearing chemicals or specialty alloys by processing materials such as petroleum residues, spent catalysts, utility ash and vanadium-bearing pig iron slag. Metallurgical use, primarily as an alloying agent for iron and steel, accounted for about 93% of the U.S. vanadium consumption in 2011. Of the other uses for vanadium, the major non-metallurgical use was in catalysts for the production of maleic anhydride and sulfuric acid.
14
|
Salient Statistics—United States
|
2008
|
2009
|
2010
|
2011
|
2012est
|
|||||||||||||||
|
Production, mine, mill
|
520 | 230 | 1,060 | 590 | 270 | |||||||||||||||
|
Imports for consumption:
|
||||||||||||||||||||
|
Ferrovanadium
|
2,800 | 353 | 1,340 | 2,220 | 3,400 | |||||||||||||||
|
Vanadium pentoxide, anhydride
|
3,700 | 1,120 | 4,000 | 2,810 | 1,570 | |||||||||||||||
|
Oxides and hydroxides, other
|
144 | 25 | 167 | 886 | 1,210 | |||||||||||||||
|
Aluminum-vanadium master alloys (gross weight)
|
618 | 282 | 951 | 278 | 180 | |||||||||||||||
|
Ash and residues
|
1,040 | 791 | 521 | 1,420 | 1,500 | |||||||||||||||
|
Sulfates
|
2 | 16 | 48 | 42 | 40 | |||||||||||||||
|
Vanadates
|
187 | 214 | 158 | 303 | 320 | |||||||||||||||
|
Vanadium metal, including waste and scrap
|
5 | 22 | 10 | 44 | 110 | |||||||||||||||
|
Exports:
|
||||||||||||||||||||
|
Ferrovanadium
|
452 | 672 | 611 | 314 | 530 | |||||||||||||||
|
Vanadium pentoxide, anhydride
|
249 | 401 | 140 | 89 | 40 | |||||||||||||||
|
Oxides and hydroxides, other
|
1,040 | 506 | 1,100 | 254 | 190 | |||||||||||||||
|
Aluminum-vanadium master alloys (gross weight) 1,390
|
447 | 1,190 | 920 | 1,400 | ||||||||||||||||
|
Vanadium metal, including waste and scrap
|
57 | 23 | 21 | 102 | 10 | |||||||||||||||
|
Consumption:
|
||||||||||||||||||||
|
Apparent
|
5,820 | 1,040 | 5,190 | 6,963 | 6,400 | |||||||||||||||
|
Reported
|
5,170 | 4,690 | 5,030 | 5,120 | 5,200 | |||||||||||||||
|
Stocks, consumer, yearend
|
335 | 295 | 248 | 2185 | 2220 | |||||||||||||||
|
* Price, average, dollars per pound V2O5
|
$ | 12.92 | $ | 5.43 | $ | 6.46 | $ | 6.76 | $ | 6.52 | ||||||||||
|
Imports + exports + adjustments for government
|
||||||||||||||||||||
|
and industry stock changes as a percentage of
|
||||||||||||||||||||
|
apparent consumption
|
91 | % | 78 | % | 81 | % | 92 | % | 96 | % | ||||||||||
* Vanadium is not freely traded on an open market. This means determining prices for vanadium is somewhat of an opaque market as prices are determined through contracts between buyers and sellers.
Events, Trends, and Issues
U.S. apparent consumption of vanadium in 2012 decreased by 9% from its 2011 level; however, it was still almost six times higher than its level in 2009. Apparent consumption of vanadium declined dramatically in 2009 from that of 2008 owing to the global economic recession in 2009. Among the major uses for vanadium, production of carbon, full-alloy, and high-strength low-alloy steels accounted for 16%, 45%, and 33% of domestic consumption, respectively. U.S. imports for consumption of vanadium in 2012 increased 4% from those of the previous year. U.S. exports increased 29% from those of the previous year.
In the fourth quarter of 2011, vanadium pentoxide (V2O5) prices continued to decrease to a year-to-date low of $6.22 per pound of V2O5 in December 2011. In January 2012, prices continued to decrease to a year-to-date low of $5.83 per pound of V2O5 until February when prices began to slowly increase again. In August 2012, V2O5 prices averaged $6.60 per pound of V2O5, slightly more than average V2O5 prices in August 2011. In the fourth quarter of 2011, U.S. ferrovanadium (FeV) prices continued to slowly decrease to a year-to-date low of $13.19 per pound FeV (contained vanadium) in December 2011. In January 2012, prices continued to decrease until February 2012 when prices began to slowly increase. In August 2012, FeV prices averaged $15.60 per pound of FeV.
World Mine Production and Reserves
Production data for the United States were revised based on new company information.
|
Mine production
|
Reserves (thousand
|
|||||||||||
|
2011
|
2012est
|
metric tons)
|
||||||||||
|
China
|
23,000 | 23,000 | 5,100 | |||||||||
|
South Africa
|
22,000 | 22,000 | 3,500 | |||||||||
|
Russia
|
15,200 | 16,000 | 5,000 | |||||||||
|
United States
|
1,590 | 1,270 | 45 | |||||||||
|
Other countries
|
1,600 | 1,600 |
not applicable
|
|||||||||
|
World total (approximate)
|
63,390 | 63,870 | 14,000 | |||||||||
15
World Resources the Substitutes
World resources of vanadium exceed 63 million tons. Vanadium occurs in deposits of phosphate rock, titaniferous magnetite, and uraniferous sandstone and siltstone, in which it constitutes less than 2% of the host rock. Significant amounts are also present in bauxite and carboniferous materials, such as coal, crude oil, oil shale, and tar sands. Because vanadium is usually recovered as a byproduct or co-product, demonstrated world resources of the element are not fully indicative of available supplies. While domestic resources and secondary recovery are adequate to supply a large portion of domestic needs, a substantial part of U.S. demand is currently met by foreign material.
Steels containing various combinations of other alloying elements can be substituted for steels containing vanadium. Certain metals, such as manganese, molybdenum, niobium (columbium), titanium, and tungsten, are to some degree interchangeable with vanadium as alloying elements in steel. Platinum and nickel can replace vanadium compounds as catalysts in some chemical processes. There is currently no acceptable substitute for vanadium in aerospace titanium alloys.
Permitting in Madagascar
Companies in Madagascar first apply for an exploration mining permit with the Bureau de Cadastre Minier de Madagascar (“BCMM”), a government agency falling under the authority of the Minister of Mines. Permits are granted under usual circumstances are generally issued within a month. The 2014 fees per square within a mining permit range from approximately 92,500 Ariary to 500,000 Ariary (between $35 and $194 using a current exchange rate of 2,580 Madagascar Ariary = $1 USD). The number of squares varies widely by claim number. For the 2014 year, the Company paid approximately $400,000 to the BCMM to renew all of its claims in Madagascar. This fee covered both the 100% owned Green Giant Property (6 claims) and the Molo Graphite Property (39 claims). Each year the Company is required to pay a similar amount in order to maintain the claims in good standing.
The next step in the permitting process, which our Company has initiated, is to apply for an exploitation permit. Our Company has engaged a third party environmental study company in Madagascar to assist us with this process. In order to get an exploitation permit, an investment plan, exploitation work plan budget and specific ground mapping is submitted to the BCMM. This step is completed in conjunction with a submission of an environmental impact study for the BCMM. This environmental impact study includes, among other things, completion of a water study and a social impact study.
QA/QC Protocols
At all times during sample collection, storage, and shipment to the laboratory facility, the samples are in the control of our Company or parties that we have contracted to act as our agents.
When sufficient sample material (grab, trench or core) has been collected, the samples are flown or sent by truck to our storage location in Antananarivo, Madagascar. At all times samples are accompanied by an employee, consultant or agent of our Company. From there, samples are shipped to labs either in South Africa or Canada for ICP-MS analysis.
All analytical results are e-mailed directly by the lab to the Company’s project manager on site in Madagascar and to our Company’s geological and executive staff. Results are also posted on a secure website and downloaded by our Company’s personnel using a secure username and password. All of the labs that carried out the sampling and analytical work are independent of our Company.
In order to carry out QA/QC protocols on the assays, blanks, standards and duplicates were inserted into the sample streams. This was done once in every 30 samples, representing an insertion rate of 3.33% of the total.
Since the 2009 Madagascar drill program, our Company has rigorously implemented a blank protocol. For the Molo Graphite Deposit a fine-grained quartz sand sourced from a hardware store in Antananarivo was used as the blank material for the sampling campaign. A total of 208 blank samples were used in this program. A detection limit of 0.05% Carbon was used for the purpose of this exercise. To verify the reliability of the blank samples, the detection limit and the blank + 2, and 3 times the detection limit were plotted against the date. The plot shows that there are a lot of blank samples that have concentrations that exceed the blank + 3 times detection limit threshold. This, coupled with the large spread of data points, would lead to the assumption that samples may have been contaminated during their preparation for analysis.
16
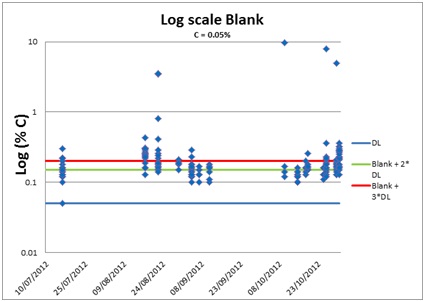
Blanks plot – Log %C versus the date of the analysis.
Since certified reference materials (“CRMs”) are essentially non-existent for graphite, our Company commissioned a third party lab in Canada to create a CRM from the remaining Molo Graphite Deposit drill core pulps from the 2011 program. As certified the third party lab standard (STD 1 C) a recommended value of 9.11 % Carbon.
To check the reliability of the standard, a plot of the recommended CRM value versus date was created. The upper and lower limits of one, two and three times the standard deviations of the recommended value are also included in the plot. All the results except for two fall within the acceptable limit of two times the standard deviation. It is however worth noting that there seems to be a negative bias towards lower concentrations in the first batch of samples that were submitted. As the campaign progressed the bias leant towards the positive side. This issue appears to have been sorted out towards the latter parts of the campaign as the data becomes less spread, and is closer to the recommended value.
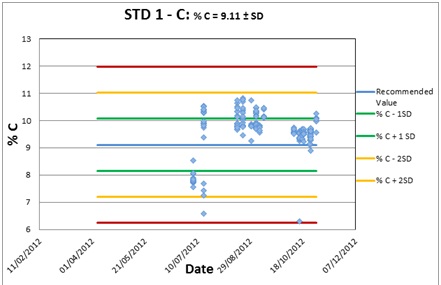
Graph showing carbon concentration as analyzed in STD 1C.
For the Molo Graphite Deposit, 205 field duplicates were prepared. To check how close these were to the original samples, a plot of the original samples with a zero, five, and ten per cent difference of the original samples was created. The majority of the samples were within the 10% difference limit. The plot also shows a good correlation between the original value and the duplicate, as is evident from the regression line with an R2 value of 0.96.
17
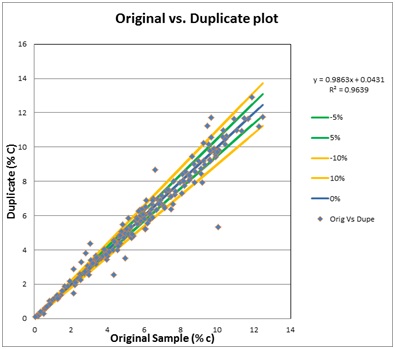
Original (“Orig”) versus Duplicate (“Dupe”) plots.
Next Steps
The Company is completing the full feasibility study for the Molo deposit, and anticipates this study to be completed in November, 2014. With this study, the Company will have the technical data to approach financiers and strategic partners for the funding of a mine.
Future Programs
The economic potential of the property rests upon the ability to extract graphite and/or vanadium using reasonable, potentially economic parameters. Initial metallurgical results indicate that an economic processing method is available to extract graphite. This will be determined within a full feasibility study anticipated for release in the fourth quarter of the calendar year of 2014. The results of this study will dictate how our management proceeds with project development.
Other Expenses
Management anticipates spending approximately $350,000 - $450,000 in ongoing general office and administration expenses and professional fees per quarter for the next twelve months. Expenses will vary in direct proportion with the level of activity relating to future acquisitions and exploration programs.
18
ITEM 1A. RISK FACTORS
Our business is subject to a variety of risks and uncertainties, including, but not limited to, the risks and uncertainties described below. If any of the risks described below, or elsewhere in this report on Form 10-K, or our Company’s other filings with the Securities and Exchange Commission (the "SEC"), were to occur, our financial condition and results of operations could suffer and the trading price of our common stock could decline. Additionally, if other risks not presently known to us, or that we do not currently believe to be significant, occur or become significant, our financial condition and results of operations could suffer and the trading price of our common stock could decline. You should carefully review the risk factors together with all other information contained in this Annual Report on Form 10-K, and in prior reports pursuant to the Securities Exchange Act of 1934, as amended and the Securities Act of 1933, as amended. Our risk factors, including but not limited to the risk factors listed below, are as follows:
SHOULD ONE OR MORE OF THE FOREGOING RISKS OR UNCERTAINTIES MATERIALIZE, OR SHOULD THE UNDERLYING ASSUMPTIONS OF OUR BUSINESS PROVE INCORRECT, ACTUAL RESULTS MAY DIFFER SIGNIFICANTLY FROM THOSE ANTICIPATED, BELIEVED, ESTIMATED, EXPECTED, INTENDED OR PLANNED.
The report of our independent registered public accounting firm contains explanatory language that substantial doubt exists about our ability to continue as a going concern.
The independent auditor’s report on our financial statements contains explanatory language that substantial doubt exists about our ability to continue as a going concern. Due to our lack of operating history and present inability to generate revenues, we have sustained operating losses since our inception. Since our inception, up to June 30, 2014, we had accumulated net losses of $86,254,224. If we are unable to obtain sufficient financing in the near term as required or achieve profitability, then we would, in all likelihood, experience severe liquidity problems and may have to curtail our operations. If we curtail our operations, we may be placed into bankruptcy or undergo liquidation, the result of which will adversely affect the value of our common shares.
We may not have access to sufficient capital to pursue our business and therefore would be unable to achieve our planned future growth.
We intend to pursue a strategy that includes development of our Company’s business plan. Currently we have limited capital, which is insufficient to pursue our plans for development and growth. Our ability to implement our Company’s plans will depend primarily on our ability to obtain additional private or public equity or debt financing. Such financing may not be available, or we may be unable to locate and secure additional capital on terms and conditions that are acceptable to us. Financing exploration plans through equity financing will have a dilutive effect on our common shares. Our failure to obtain additional capital will have a material adverse effect on our business.
Our primary exploration efforts are in the African country of Madagascar, where democratic elections occurred at the end of 2013.
Any adverse developments to the political situation in Madagascar could have a material effect on our Company’s business, results of operations and financial condition. Democratic elections in Madagascar occurred toward the end of 2013 as planned by the elections calendar jointly established between the UN and the Elections Commissions. To date, our Company has not experienced any disruptions or been placed under any constraints in our exploration efforts due to the political situation in Madagascar. Depending on future actions taken by the newly elected government, or any future government, our Company’s business operations could be impacted.
A roadmap, designed by the Southern African Development Community, and endorsed by the African Union, provided for a path for democratic elections. Presidential elections were held on October 25, 2013, while parliamentary elections and second-round presidential elections occurred on December 20, 2013. The newly elected President was inaugurated on January 25, 2014 and the lower house of Parliament took office in February 2014. A new Prime Minister was named on April 10, 2014 and a new government named on April 17, 2014.
We are actively monitoring the political climate in Madagascar and continue to hold meetings with representatives of the government and the Ministry of Mines. The transformation or amendment of exploration and research mining permits within the country continues to be suspended. Our Company has continued to pay taxes and administrative fees in Madagascar with respect to all the mining permits we hold. These payments have been acknowledged and accepted by the Madagascar government.
19
Our common shares have been subject to penny stock regulation in the United States of America.
Our common shares have been subject to the provisions of Section 15(g) and Rule 15g-9 of the (US) Securities Exchange Act of 1934, as amended (the “Exchange Act”), commonly referred to as the “penny stock” rule. Section 15(g) sets forth certain requirements for transactions in penny stocks and Rule 15g-9(d)(1) incorporates the definition of penny stock as that used in Rule 3a51-1 of the Exchange Act. The Commission generally defines penny stock to be any equity security that has a market price less than US$5.00 per share, subject to certain exceptions. Rule 3a51-1 provides that any equity security is considered to be penny stock unless that security is: registered and traded on a national securities exchange meeting specified criteria set by the Commission; issued by a registered investment company; excluded from the definition on the basis of price (at least US$5.00 per share) or the registrant’s net tangible assets; or exempted from the definition by the Commission. If our common shares are deemed to be “penny stock”, trading in common shares will be subject to additional sales practice requirements on broker/dealers who sell penny stock to persons other than established customers and accredited investors.
Financial Industry Regulatory Authority, Inc. (“FINRA”) sales practice requirements may limit a shareholder’s ability to buy and sell our common shares.
In addition to the “penny stock” rules described above, FINRA has adopted rules that require that in recommending an investment to a client, a broker-dealer must have reasonable grounds for believing that the investment is suitable for that client. Prior to recommending speculative low priced securities to their non-institutional clients, broker-dealers must make reasonable efforts to obtain information about the client’s financial status, tax status, investment objectives and other information. Under interpretations of these rules, FINRA believes that there is a high probability that speculative low priced securities will not be suitable for at least some clients. FINRA requirements make it more difficult for broker-dealers to recommend that their clients buy our common shares, which may limit your ability to buy and sell our stock and have an adverse effect on the market for our shares.
As a public company we are subject to complex legal and accounting requirements that will require us to incur significant expenses and will expose us to risk of non-compliance.
As a public company, we are subject to numerous legal and accounting requirements in both Canada and the United States of America that do not apply to private companies. The cost of compliance with many of these requirements is material, not only in absolute terms but, more importantly, in relation to the overall scope of the operations of a small company. Our relative inexperience with these requirements may increase the cost of compliance and may also increase the risk that we will fail to comply. Failure to comply with these requirements can have numerous adverse consequences including, but not limited to, our inability to file required periodic reports on a timely basis, loss of market confidence, delisting of our securities and/or governmental or private actions against us. We cannot assure you that we will be able to comply with all of these requirements or that the cost of such compliance will not prove to be a substantial competitive disadvantage vis-à-vis privately held and larger public competitors.
Compliance with changing regulation of corporate governance and public disclosure will result in additional expenses and pose challenges for our management.
Changing laws, regulations and standards relating to corporate governance and public disclosure, including the Dodd-Frank Wall Street Reform and Consumer Protection Act and the rules and regulations promulgated thereunder, the Sarbanes-Oxley Act and SEC regulations, have created uncertainty for public companies and significantly increased the costs and risks associated with accessing the U.S. public markets. Our management team needs to devote significant time and financial resources to comply with both existing and evolving standards for public companies, which will lead to increased general and administrative expenses and a diversion of management time and attention from revenue generating activities to compliance activities.
Changes in tax laws or tax rulings could materially affect our financial position and results of operations.
Changes in tax laws or tax rulings could materially affect our financial position and results of operations. For example, the current U.S. administration and key members of Congress have made public statements indicating that tax reform is a priority. Certain changes to U.S. tax laws, including limitations on the ability to defer U.S. taxation on earnings outside of the United States until those earnings are repatriated to the United States, could affect the tax treatment of our foreign earnings. In addition, many countries in the European Union, as well as a number of other countries and organizations such as the Organization for Economic Cooperation and Development, are actively considering changes to existing tax laws. Certain proposals could include recommendations that would significantly increase our tax obligations in many countries where we do business. Due to the large and expanding scale of our international business activities, any changes in the taxation of such activities may increase our worldwide effective tax rate and harm our financial position and results of operations.
20
Because we are quoted on the OTCQX instead of a national securities exchange in the United States, our U.S. investors may have more difficulty selling their stock or experience negative volatility on the market price of our stock in the United States.
In the United States, our common shares are quoted on the OTCQX. The OTCQX is marketed as an electronic exchange for high growth and early stage U.S. companies and a prospective “final step toward a NASDAQ or NYSE listing” (although no assurances can be provided that such change of market shall occur). Trades are settled and cleared in the U.S. similar to any NASDAQ or NYSE stock and trade reports are disseminated through Yahoo, Bloomberg, Reuters, and most other financial data providers. The OTCQX can be significantly illiquid, in part because it does not have a national quotation system by which potential investors can follow the market price of shares except through information received and generated by a limited number of broker-dealers that make markets in particular stocks. There is a greater chance of volatility for securities that trade on the OTCQX as compared to a national securities exchange in the United States, such as the New York Stock Exchange, the NASDAQ Stock Market or the NYSE Amex. This volatility may be caused by a variety of factors, including the lack of readily available price quotations, the absence of consistent administrative supervision of bid and ask quotations, lower trading volume, and market conditions. U.S. investors in our common shares may experience high fluctuations in the market price and volume of the trading market for our securities. These fluctuations, when they occur, have a negative effect on the market price for our common shares. Accordingly, our U.S. shareholders may not be able to realize a fair price from their shares when they determine to sell them or may have to hold them for a substantial period of time until the market for our common shares improves.
In addition to being quoted on the OTCQX, our common shares trade on the Toronto Stock Exchange (“TSX”), Canada’s national stock exchange, under the symbol EGZ and on the Frankfurt Exchange under the symbol YE5.
The price at which you purchase our common shares may not be indicative of the price that will prevail in the trading market. You may be unable to sell your common shares at or above your purchase price, which may result in substantial losses to you. The market price for our common shares is particularly volatile given our status as a relatively unknown company with a small and thinly traded public float, limited operating history and lack of profits which could lead to wide fluctuations in our share price.
The market for our common shares is characterized by significant price volatility when compared to seasoned issuers, and we expect that our share price will continue to be more volatile than a seasoned issuer. The volatility in our share price is attributable to a number of factors. First our common shares, at times, are thinly traded. As a consequence of this lack of liquidity, the trading of relatively small quantities of shares by our shareholders may disproportionately influence the price of those shares in either direction. The price for our shares could, for example, decline precipitously in the event that a large number of our common shares are sold on the market without commensurate demand, as compared to a seasoned issuer which could better absorb those sales without adverse impact on its share price. Second, we are a speculative or “risky” investment due to our limited operating history, lack of profits to date and uncertainty of future market acceptance for our potential products. As a consequence, more risk-adverse investors may, under the fear of losing all or most of their investment in the event of negative news or lack of progress, be more inclined to sell their shares on the market more quickly and at greater discounts than would be the case with the stock of a seasoned issuer. Many of these factors are beyond our control and may decrease the market price of our common shares, regardless of our performance. We cannot make any predictions as to what the prevailing market price for our common shares will be at any time or as to what effect that the sale of shares or the availability of common shares for sale at any time will have on the prevailing market price.
Shareholders should be aware that, according to SEC Release No. 34-29093, the market for penny stocks has suffered in recent years from patterns of fraud and abuse. Such patterns include control of the market for the security by one or a few broker-dealers that are often related to the promoter or issuer; manipulation of prices through prearranged matching of purchases and sales and false and misleading press releases; boiler room practices involving high-pressure sales tactics and unrealistic price projections by inexperienced sales persons; excessive and undisclosed bid-ask differential and markups by selling broker-dealers; and the wholesale dumping of the same securities by promoters and broker-dealers after prices have been manipulated to a desired level, along with the resulting inevitable collapse of those prices and with consequent investor losses. Our management is aware of the abuses that have occurred historically in the penny stock market. Although we do not expect to be in a position to dictate the behavior of the market or of broker-dealers who participate in the market, management will strive within the confines of practical limitations to prevent the described patterns from being established with respect to our securities. The occurrence of these patterns or practices could increase the volatility of our share price.
21
Volatility in our common share price may subject us to securities litigation, thereby diverting our resources that may have a material effect on our profitability and results of operations.
The market for our common shares is characterized by significant price volatility when compared to seasoned issuers, and we expect that our share price will continue to be more volatile than a seasoned issuer for the indefinite future. In the past, plaintiffs have often initiated securities class action litigation against a company following periods of volatility in the market price of its securities. We may in the future be the target of similar litigation. This type of litigation could result in substantial costs and could divert management’s attention and resources.
Failure to achieve and maintain effective internal controls in accordance with Section 404 of the Sarbanes-Oxley Act of 2002 (the “Sarbanes-Oxley Act”) could have a material adverse effect on our business and our operating results.
If we fail to comply with the requirements of Section 404 of the Sarbanes-Oxley Act regarding internal control over financial reporting or to remedy any material weaknesses in our internal controls that we may identify, such failure could result in material misstatements in our financial statements, cause investors to lose confidence in our reported financial information and have a negative effect on the trading price of our common shares.
Pursuant to Section 404 of the Sarbanes-Oxley Act and current SEC regulations, we are required to prepare assessments regarding internal controls over financial reporting. In connection with our on-going assessment of the effectiveness of our internal control over financial reporting, we may discover “material weaknesses” in our internal controls as defined in standards established by the Public Company Accounting Oversight Board, or the PCAOB. A material weakness is a significant deficiency, or combination of significant deficiencies, that results in more than a remote likelihood that a material misstatement of the annual or interim financial statements will not be prevented or detected. The PCAOB defines “significant deficiency” as a deficiency that results in more than a remote likelihood that a misstatement of the financial statements that is more than inconsequential will not be prevented or detected.
In the event that a material weakness is identified, as it has been for this report, subject to expansion of the size of our Company and our finance department, we will employ qualified personnel and adopt and implement policies and procedures to address any material weaknesses that we identify. However, the process of designing and implementing effective internal controls is a continuous effort that requires us to anticipate and react to changes in our business and the economic and regulatory environments and to expend significant resources to maintain a system of internal controls that is adequate to satisfy our reporting obligations as a public company. We cannot assure you that the measures we will take will remediate any material weaknesses that we may identify or that we will implement and maintain adequate controls over our financial process and reporting in the future.
Any failure to complete our assessment of our internal control over financial reporting, to remediate any material weaknesses that we may identify or to implement new controls, or difficulties encountered in their implementation, could harm our operating results, cause us to fail to meet our reporting obligations or result in material misstatements in our financial statements. Any such failure could adversely affect the results of the management evaluations of our internal controls. Inadequate internal controls could also cause investors to lose confidence in our reported financial information, which could have a negative effect on the trading price of our common shares.
Should we lose the services of our key executives, our financial condition and proposed expansion may be negatively impacted.
We depend on the continued contributions of our executive officers to work effectively as a team, to execute our business strategy and to manage our business. The loss of key personnel, or their failure to work effectively, could have a material adverse effect on our business, financial condition, and results of operations. Specifically, we rely on Richard E. Schler, our Chief Executive Officer, Craig Scherba, our President and Chief Operating Officer and Peter Liabotis, our Chief Financial Officer. We do not maintain key man life insurance. Should we lose any or all of their services and we are unable to replace their services with equally competent and experienced personnel, our operational goals and strategies may be adversely affected, which will negatively affect our potential revenues.
Minnesota law and our articles of incorporation protect our directors from certain types of lawsuits, which could make it difficult for us to recover damages from them in the event of a lawsuit.
Minnesota law provides that our directors will not be liable to our Company or to our stockholders for monetary damages for all but certain types of conduct as directors. Our articles of incorporation require us to indemnify our directors and officers against all damages incurred in connection with our business to the fullest extent provided or allowed by law. The exculpation provisions may have the effect of preventing stockholders from recovering damages against our directors caused by their negligence, poor judgment or other circumstances. The indemnification provisions may require our Company to use its assets to defend our directors and officers against claims, including claims arising out of their negligence, poor judgment, or other circumstances.
22
We have not identified any mineral reserves or resources and due to the speculative nature of mineral property exploration, there is substantial risk that no commercially exploitable minerals will be found and our business will fail.
Exploration for minerals is a speculative venture involving substantial risk. We cannot provide investors with any assurance that our claims and properties contain commercially exploitable reserves. The exploration work that we intend to conduct on our claims or properties may not result in the discovery of commercial quantities of graphite, vanadium, gold, uranium, or other minerals. Problems such as unusual and unexpected rock formations and other conditions are involved in mineral exploration and often result in unsuccessful exploration efforts. In such a case, we would be unable to complete our business plan.
We are a mineral exploration company with a limited operating history and expect to incur operating losses for the foreseeable future.
We are a mineral exploration company. We have not earned any revenues and we have not been profitable. Prior to completing exploration on our claims, we may incur increased operating expenses without realizing any revenues. There are numerous difficulties normally encountered by mineral exploration companies, and these companies experience a high rate of failure. The likelihood of success must be considered in light of the problems, expenses, difficulties, complications and delays encountered in connection with the exploration of the mineral properties that we plan to undertake. These potential problems include, but are not limited to, unanticipated problems relating to exploration and additional costs and expenses that may exceed current estimates. We have no history upon which to base any assumption as to the likelihood that our business will prove successful, and we can provide no assurance to investors that we will generate any operating revenues or ever achieve profitable operations.
Because of the speculative nature of mineral property exploration, there is substantial risk that no commercially exploitable minerals will be found and our business will fail.
Exploration for minerals is a speculative venture involving substantial risk. We cannot provide investors with any assurance that our claims and properties contain commercially exploitable reserves. The exploration work that we intend to conduct on our claims or properties may not result in the discovery of commercial quantities of graphite, vanadium, gold, uranium or other minerals. Uncertainties and unexpected occurrences are virtually given in mineral exploration and often result in unsuccessful exploration efforts. In such a case, we would be unable to complete our business plan.
Because of the inherent dangers involved in mineral exploration, there is a risk that we may incur liability or damages as we conduct our business.
The search for valuable minerals involves numerous hazards. As a result, we may become subject to liability for such hazards, including pollution, cave-ins and other hazards against which we cannot, or may elect not, to insure against. We currently have no such insurance, but our management intends to periodically review the availability of commercially reasonable insurance coverage. If a hazard were to occur, the costs of rectifying the hazard may exceed our asset value and cause us to liquidate all our assets.
If we confirm commercial concentrations of graphite, vanadium, gold, uranium or other minerals on our claims and interests, we can provide no assurance that we will be able to successfully bring those claims or interests into commercial production.
If our exploration programs are successful in confirming deposits of commercial tonnage and grade, we will require significant additional funds in order to place the claims and interests into commercial production. This may occur for a number of reasons, including because of regulatory or permitting difficulties, because we are unable to obtain any adequate funds or because we cannot obtain such funds on terms that we consider economically feasible.
Because access to our properties may be restricted by inclement weather or proper infrastructure, our exploration programs are likely to experience delays.
Access to most of the properties underlying our claims and interests is restricted due to their remote locations and because of weather conditions. Some of our properties are only accessible by air. As a result, any attempts to visit, test, or explore the property are generally limited to those periods when weather permits such activities. These limitations can result in significant delays in exploration efforts, as well as mining and production efforts in the event that commercial amounts of minerals are found. This could cause our business to fail.
23
As we undertake exploration of our claims and interests, we will be subject to the compliance of government regulation that may increase the anticipated time and cost of our exploration program.
There are several governmental regulations that materially restrict the exploration of minerals. We will be subject to the mining laws and regulations in force in the jurisdictions where our claims are located, and these laws and regulations may change over time. In order to comply with these regulations, we may be required to obtain work permits, post bonds, complete environmental assessments and perform remediation work for any physical disturbance to land. While our planned budget for exploration programs includes a contingency for regulatory compliance, there is a risk that new regulations could increase our costs of doing business and prevent us from carrying out our exploration program, or that our budgeted amounts are inadequate.
Our operations are subject to strict environmental regulations, which result in added costs of operations and operational delays.
Our operations are subject to environmental regulations, which could result in additional costs and operational delays. All phases of our operations are subject to environmental regulation. Environmental legislation is evolving in some countries and jurisdictions in a manner that may require stricter standards, and enforcement, increased fines and penalties for non-compliance, more stringent environmental assessments of proposed projects, and a heightened degree of responsibility for companies and their officers, directors, and employees. There is no assurance that any future changes in environmental regulation will not negatively affect our projects.
We have no insurance for environmental problems.
Insurance against environmental risks, including potential liability for pollution or other hazards as a result of the disposal of waste products occurring from exploration and production, has not been available generally in the mining industry. We have no insurance coverage for most environmental risks. In the event of a problem, the payment of environmental liabilities and costs would reduce the funds available to us for future operations. If we are unable to full pay for the cost of remedying an environmental problem, we might be required to enter into an interim compliance measure pending completion of the required remedy.
We do not intend to pay dividends.
We do not anticipate paying cash dividends on our common shares in the foreseeable future. We may not have sufficient funds to legally pay dividends. Even if funds are legally available to pay dividends, we may nevertheless decide, in our sole discretion, not to pay dividends. The declaration, payment and amount of any future dividends will be made at the discretion of our board of directors, and will depend upon, among other things, the results of our operations, cash flows and financial condition, operating and capital requirements, and other factors our board of directors may consider relevant. There is no assurance that we will pay any dividends in the future, and, if dividends are paid, there is no assurance with respect to the amount of any such dividend.
Due to external market factors in the mining business, we may not be able to market any minerals that may be found.
The mining industry, in general, is intensely competitive. Even if commercial quantities of minerals are discovered, we can provide no assurance to investors that a ready market will exist for the sale of these minerals. Numerous factors beyond our control may affect the marketability of any substances discovered. These factors include market fluctuations, the sale price of the minerals, the proximity and capacity of markets and processing equipment, and government regulations, including regulations relating to prices, taxes, royalties, land tenure, land use, mineral importing and exporting and environmental protection. The effect of these factors cannot be accurately predicted, but any combination of these factors may result in our not receiving an adequate return on invested capital.
Our performance may be subject to fluctuations in market prices of any minerals that we find.
The profitability of a mineral exploration project could be significantly affected by changes in the market price of the relevant minerals. Market prices of graphite have increased over the past several months due to possible new applications. The price of vanadium has increased due to the markets in China as well as the expanded uses including large-scale power storage application. The price of gold has fallen slightly after recently reaching record highs. Demand for gold can also be influenced by economic conditions, attractiveness as an investment vehicle and the relative strength of the U.S. dollar and local investment currencies. The market price of uranium has increased due in large measure to projections as to the number of new nuclear energy plants that will be constructed in China, the United States and other jurisdictions. A number of other factors affect the market prices for other minerals. The aggregate effect of the factors affecting the prices of various minerals is impossible to predict with accuracy. Fluctuations in mineral prices may adversely affect the value of any mineral discoveries made on the properties with which we are involved, which may in turn affect the market price and liquidity of our common shares and our ability to pursue and implement our business plan. In addition, the price of both graphite and vanadium can fluctuate significantly on a month-to-month and year-to-year basis.
24
Because from time to time we hold a significant portion of our cash reserves in Canadian dollars, we may experience losses due to foreign exchange translations.
From time to time we hold a significant portion of our cash reserves in Canadian dollars. Due to foreign exchange rate fluctuations, the value of these Canadian dollar reserves can result in translation gains or losses in U.S. dollar terms. If there was a significant decline in the Canadian dollar versus the U.S. dollar, our converted Canadian dollar cash balances presented in U.S. dollars on our balance sheet would significantly decline. If the US dollar significantly declines relative to the Canadian dollar our quoted US dollar cash position would significantly decline as it would be more expensive in US dollar terms to pay Canadian dollar expenses. We have not entered into derivative instruments to offset the impact of foreign exchange fluctuations.
We are exposed to general economic conditions, which could have a material adverse impact on our business, operating results and financial condition.
Recently there have been adverse conditions and uncertainty in the global economy as the result of unstable global financial and credit markets, inflation, and recession. These unfavorable economic conditions and the weakness of the credit market may continue to have, an impact on our Company’s business and our Company’s financial condition. The current global macroeconomic environment may affect our Company’s ability to access the capital markets may be severely restricted at a time when our Company wishes or needs to access such markets, which could have a materially adverse impact on our Company’s flexibility to react to changing economic and business conditions or carry on our operations.
Until we can full validate, the properties described herein have no known mineral reserves of any kind.
Further details regarding our Company’s properties, although not incorporated by reference, including the comprehensive geological report prepared in compliance with Canada’s National Instrument 43-101 on the Sagar Property in Northern Québec, on the Green Giant Property in Madagascar and on the Joint Venture Ground (Molo Graphite Deposit) in Madagascar, have been filed within our Company’s filings on Sedar at http://www.sedar.com (which website is expressly not incorporated by reference into this filing).
Climate change and related regulatory responses may impact our business.
Climate change as a result of emissions of greenhouse gases is a current topic of discussion and may generate government regulatory responses in the near future. It is impracticable to predict with any certainty the impact of climate change on our business or the regulatory responses to it, although we recognize that they could be significant. However, it is too soon for us to predict with any certainty the ultimate impact, either directionally or quantitatively, of climate change and related regulatory responses.
To the extent that climate change increases the risk of natural disasters or other disruptive events in the areas in which we operate, we could be harmed. While we maintain rudimentary business recovery plans that are intended to allow us to recover from natural disasters or other events that can be disruptive to our business, our plans may not fully protect us from all such disasters or events.
The current financial environment may impact our business and financial condition that we cannot predict.
The continued instability in the global financial system and related limitation on availability of credit may continue to have an impact on our business and our financial condition, and we may continue to face challenges if conditions in the financial markets do not improve. Our ability to access the capital markets has been restricted as a result of the economic downturn and related financial market conditions and may be restricted in the future when we would like, or need, to raise capital. The difficult financial environment may also limit the number of prospects for potential joint venture, asset monetization or other capital raising transactions that we may pursue in the future or reduce the values we are able to realize in those transactions, making these transactions uneconomic or difficult to consummate.
25
ITEM 1B. UNRESOLVED STAFF COMMENTS
Not applicable.
ITEM 2. PROPERTY
The Company’s executive offices are currently located at 520–141 Adelaide Street West, Toronto, Ontario, Canada M5H 3L5. These offices are leased on a month-to-month basis, and the Company’s current monthly rental payments are approximately CAD$10,000.
ITEM 3. LEGAL PROCEEDINGS
We are currently not involved in any litigation that we believe could have a material adverse effect on our financial condition or results of operations. There is no action, suit, proceeding, inquiry or investigation before or by any court, public board, government agency, self-regulatory organization or body pending or, to the knowledge of the executive officers of our Company or any of our subsidiaries, threatened against or affecting our Company, our common stock, any of our subsidiaries or of our companies or our subsidiaries' officers or directors in their capacities as such, in which an adverse decision could have a material adverse effect.
ITEM 4. MINE SAFETY DISCLOSURES
Not applicable.
26
PART II
ITEM 5. MARKET FOR REGISTRANT’S COMMON EQUITY, RELATED STOCKHOLDER MATTERS AND ISSUER PURCHASES OF EQUITY SECURITIES
Market Information
As of September 19, 2013, there were 269,198,956 common shares issued and outstanding and 74,502,376 common shares underlying outstanding options and warrants to purchase, or securities convertible into, our common shares. Our common shares are quoted on the OTCQX under the symbol “ENZR”, the TSX under the symbol “EGZ” and the Frankfurt Stock Exchange under the symbol “A1CXW3”. On September 19, 2014 the last reported sale price for our common shares on the OTCQX and TSX was US$0.165 and CAD$0.185 per share, respectively. The table below sets forth the high and low closing sale prices of our common shares for the fiscal quarters indicated as reported on the OTCQX and TSX. Over-the-counter market quotations reflect inter-dealer prices, without retail mark-up, markdown or commission and may not necessarily represent actual transactions.
|
OTCBB / OTCQX (US$)
|
TSX / TSX-V (CDN$)
|
|||
|
Period
|
High
|
Low
|
High
|
Low
|
|
Fiscal year ended June 30, 2015
|
||||
|
First quarter ended September 30, 2014 (up to September 19, 2014)
|
$0.25
|
$0.11
|
$0.28
|
$0.12
|
|
Fiscal year ended June 30, 2014
|
||||
|
First quarter ended September 30, 2013
|
$0.28
|
$0.10
|
$0.28
|
$0.11
|
|
Second quarter ended December 31, 2013
|
$0.16
|
$0.11
|
$0.18
|
$0.12
|
|
Third quarter ended March 31, 2014
|
$0.17
|
$0.12
|
$0.18
|
$0.13
|
|
Fourth quarter ended June 30, 2014
|
$0.14
|
$.011
|
$0.15
|
$0.12
|
|
Fiscal year ended June 30, 2013
|
||||
|
First quarter ended September 30, 2012
|
$0.41
|
$0.27
|
$0.39
|
$0.27
|
|
Second quarter ended December 31, 2012
|
$0.37
|
$0.29
|
$0.37
|
$0.29
|
|
Third quarter ended March 31, 2013
|
$0.34
|
$0.17
|
$0.34
|
$0.18
|
|
Fourth quarter ended June 30, 2013
|
$0.22
|
$0.12
|
$0.23
|
$0.11
|
|
Fiscal year ended June 30, 2013
|
||||
|
First quarter ended September 30, 2011
|
$0.36
|
$0.18
|
$0.34
|
$0.17
|
|
Second quarter ended December 31, 2011
|
$0.26
|
$0.15
|
$0.23
|
$0.15
|
|
Third quarter ended March 31, 2012
|
$0.44
|
$0.17
|
$0.43
|
$0.16
|
|
Fourth quarter ended June 30, 2013
|
$0.48
|
$0.22
|
$0.48
|
$0.22
|
|
Fiscal year ended June 30, 2011
|
||||
|
First quarter ended September 30, 2010
|
$0.33
|
$0.18
|
$0.34
|
$0.18
|
|
Second quarter ended December 31, 2010
|
$0.50
|
$0.195
|
$0.51
|
$0.20
|
|
Third quarter ended March 31, 2011
|
$0.58
|
$0.39
|
$0.63
|
$0.38
|
|
Fourth quarter ended June 30, 2011
|
$0.45
|
$0.30
|
$0.42
|
$0.28
|
Our common shares commenced trading on the TSX-V on May 5, 2010. Our common shares ceased trading on the TSX-V and commenced trading on the TSX on June 16, 2011. Our common shares commenced trading on the OTCQX on August 28, 2013. Prior to that our common shares traded on the OTCBB.
Holders
As of September 19, 2014, there were approximately 2,500 holders of record of common shares.
Dividends
We have never declared any cash dividends with respect to our common shares. Future payment of dividends is within the discretion of our board of directors, and will depend upon, among other things, the results of our operations, cash flows and financial condition, operating and capital requirements, and other factors our board of directors may consider relevant. Although there are no material restrictions limiting, or that are likely to limit, our ability to pay dividends on our common shares, we presently intend to retain future earnings, if any, for use in our business and have no present intention to pay cash dividends on our common shares.
27
Equity Compensation Plan Information
The following table sets forth information as of June 30, 2014 for (i) all compensation plans previously approved by the Company's security holders and (ii) all compensation plans not previously approved by the Company's security holders. Options reported below were issued under the Company's Amended 2006 Stock Option Plan.
|
Plan Category
|
Number of securities to be issued upon exercise of outstanding options, and warrants
|
Weighted-average exercise price of outstanding options and warrants
|
Number of securities remaining available for future under equity compensation plans (excluding securities reflected in column (a)
|
|
Equity compensation plans approved by security holders
|
--
|
--
|
--
|
|
Equity compensation plans not approved by security holders
|
7,630,000
|
$0.15
|
5,080,000
|
Recent Issuances of Unregistered Securities
From July 1, 2012 through June 30, 2014, the Company issued the following unregistered securities:
|
·
|
During July 2012, $105,000 was received through the exercise of 700,000 stock options at $0.15 per share.
|
|
·
|
On July 13, 2012, we issued 1,695,000 stock options to directors, officers and consultants of the Company.
|
|
·
|
During November 2012, we closed a brokered and non-brokered private placement raising $2,032,500. We issued 5,807,142 shares of common stock at $0.35 per share and 2,903,571 common share purchase warrants at an exercise price of $0.50, expiring 24 months from the date of issue. We also issued 340,028 compensation common share purchase warrants at $0.35.
|
|
·
|
On February 27, 2013, we issued 5,900,000 stock options to directors, officers and consultants of the Company.
|
|
·
|
During March 2013, we closed a private placement raising a total of $2,307,035 (CAD$2,358,000). We issued 12,350,000 shares of our common stock between $0.18 and $0.20 per share. In addition, we issued 270,000 compensation warrants at CAD$0.20.
|
|
·
|
On July 9, 2013, we issued 1,255,000 stock options to directors, officers and consultants at $0.11 per share.
|
|
·
|
Between July 26, 2013 and August 1, 2013, we closed a private placement raising $813,212 (CAD$837,500) and $1,230,000. We issued 16,950,001 common stock at prices of CAD$0.125 and $0.12 per share. We issued 402,000 compensation warrants at an exercise price of CAD$0.125 and 150,000 compensation warrants at an exercise price of $0.12.
|
|
·
|
On September 19, 2013, we issued 750,000 stock options to directors, officers and consultants at $0.15 per share.
|
|
·
|
On October 9, 2013, we issued 250,000 stock options to a director at $0.13 per share.
|
|
·
|
On December 18, 2013 we closed a non-brokered financing and raised $1,479,023 (CAD$1,566,490). We issued 11,189,215 common shares at CAD$0.14 per share. We also issued 671,353 compensation warrants at CAD$0.14 per share.
|
|
·
|
On January 10, 2014, we issued 4,625,000 stock options to directors and officers at $0.18 per share.
|
|
·
|
On January 15, 2014 and January 31, 2014, we closed a private placement raising a total of $6,906,008 (CAD$7,486,088). The Company issued 62,384,067 common shares at CAD$0.12 and 31,192,033 common share purchase warrants. We also issued 3,396,744 compensation warrants.
|
|
·
|
On February 6, 2014, we issued 250,000 stock options to a consultant at $0.18 per share.
|
|
·
|
On June 23, 2014, we issued 2,500,000 shares of our common stock to Malagasy at $0.13 per share for the Molo Graphite Project.
|
The offer and sale of all shares of our common shares and warrants listed above were affected in reliance on the exemptions for sales of securities not involving a public offering, as set forth in Regulation S promulgated under the Securities Act. The Investor acknowledged the following: Subscriber is not a United States Person, nor is the Subscriber acquiring the shares of our common stock and warrants directly or indirectly for the account or benefit of a United States Person. None of the funds used by the Subscriber to purchase the shares of our common stock and warrants have been obtained from United States Persons. For purposes of this Agreement, "United States Person" within the meaning of U.S. tax laws, means a citizen or resident of the United States, any former U.S. citizen subject to Section 877 of the Internal Revenue Code, any corporation, or partnership organized or existing under the laws of the United States of America or any state, jurisdiction, territory or possession thereof and any estate or trust the income of which is subject to U.S. federal income tax irrespective of its source, and within the meaning of U.S. securities laws, as defined in Rule 902(o) of Regulation S, means: (i) any natural person resident in the United States; (ii) any partnership or corporation organized or incorporated under the laws of the United States; (iii) any estate of which any executor or administrator is a U.S. person; (iv) any trust of which any trustee is a U.S. person; (v) any agency or branch of a foreign entity located in the United States; (vi) any non-discretionary account or similar account (other than an estate or trust) held by a dealer or other fiduciary for the benefit or account of a U.S. person; (vii) any discretionary account or similar account (other than an estate or trust) held by a dealer or other fiduciary organized, incorporated, or (if an individual) resident in the United States; and (viii) any partnership or corporation if organized under the laws of any foreign jurisdiction, and formed by a U.S. person principally for the purpose of investing in securities not registered under the Securities Act, unless it is organized or incorporated, and owned, by accredited investors (as defined in Rule 501(a)) who are not natural persons, estates or trusts. Further, we anticipate that additional funding will be in the form of equity financing from the sale of our common stock. However, we cannot provide investors with any assurance that we will be able to raise sufficient funding for additional phases of exploration. We currently believe that debt financing will not be an alternative for funding additional phases of exploration. We do not have any arrangements in place for any future equity financing.
28
Issuer Repurchases of Equity Securities
None
ITEM 6. SELECTED FINANCIAL DATA
As a “smaller reporting company”, we are not required to provide the information required by this Item. Refer to the financial statements included within this report.
ITEM 7. MANAGEMENT’S DISCUSSION AND ANALYSIS OF FINANCIAL CONDITION AND RESULTS OF OPERATION
Management’s Discussion and Analysis of Results of Financial Condition and Results of Operations (“MD&A”) should be read in conjunction with the financial statements included herein. Further, this MD&A should be read in conjunction with the Company’s Financial Statements and Notes to Financial Statements included in this Annual Report on Form 10-K for the years ended June 30, 2014 and 2013, as well as the “Business” and “Risk Factors” sections within this Annual Report on Form 10-K. The Company's financial statements have been prepared in accordance with United States generally accepted accounting principles.
Management’s Discussion and Analysis may contain various “forward looking statements” within the meaning of Section 21E of the Securities Exchange Act of 1934, as amended, regarding future events or the future financial performance of the Company that involve risks and uncertainties. Certain statements included in this Form 10-K, including, without limitation, statements related to anticipated cash flow sources and uses, and words including but not limited to “anticipates”, “believes”, “plans”, “expects”, “future” and similar statements or expressions, identify forward looking statements. Any forward-looking statements herein are subject to certain risks and uncertainties in the Company’s business and any changes in current accounting rules, all of which may be beyond the control of the Company. The Company has adopted the most conservative recognition of revenue based on the most astringent guidelines of the SEC. Management will elect additional changes to revenue recognition to comply with the most conservative SEC recognition on a forward going accrual basis as the model is replicated with other similar markets (i.e. SBDC). The Company’s actual results could differ materially from those anticipated in these forward-looking statements as a result of certain factors, including those set forth therein. Undue reliance should not be placed on these forward-looking statements, which speak only as of the date hereof. We undertake no obligation to update these forward-looking statements.
Based on the nature of our business, we anticipate incurring operating losses in the foreseeable future. We base this expectation, in part, on the fact that very few mineral properties in the exploration stage ultimately develop into producing and profitable mines. Our future financial results are also uncertain due to a number of factors, some of which are outside our control. These factors include, but are not limited to: (1) our ability to raise additional funding; - the market price for graphite, vanadium, gold and uranium; (2) the results of our exploration programs and metallurgy analysis on our mineral properties; (3) the political instability in Madagascar; and (4) our ability to find joint venture and/or off-take partners for the development of our property interests.
Any future equity financing will cause existing shareholders to experience dilution of their interest in our Company. In the event we are not successful in raising additional financing, we anticipate that we will not be able to proceed with our business plan. In such a case, we may decide to discontinue our current business plan and seek other business opportunities in the resource sector. Any business opportunity would require our management to perform diligence on possible acquisition of additional resource properties. Such due diligence would likely include purchase investigation costs such as professional fees by consulting geologists, preparation of geological reports on the properties, conducting title searches and travel costs for site visits. It is anticipated that such costs will not be sufficient to acquire any resource property and additional funds will be required to close any possible acquisition.
29
During this period, we will need to maintain our periodic filings with the appropriate regulatory authorities and will incur legal and accounting costs. In the event no other such opportunities are available and we cannot raise additional capital to sustain operations, we may be forced to discontinue business. We do not have any specific alternative business opportunities in mind and have not planned for any such contingency.
Due to our lack of operating history and present inability to generate revenues, our auditors have stated their opinion that there currently exists substantial doubt about our ability to continue as a going concern.
Estimated Geological Budget
From the date of this report, and subject to availability of capital, our plan is to incur anywhere between $6,250,000 - $16,250,000 on further studies, testing and permitting to advance the Molo Graphite Property and on further exploration and the creation of a pilot plant anticipated, but not guaranteed to be commenced on or before our Company’s fiscal year end of June 30, 2015, on our Madagascar properties and projected to be completed, subject to the availability of capital and any other unforeseen delays, by June 30, 2015. The following is a summary of the amounts budgeted to be incurred (presuming all $16,250,000 is required):
|
Bankable Feasibility Study (“BFS”)
|
$ | 2,000,000 | ||
|
Metallurgy
|
$ | 4,500,000 | ||
|
Detailed Engineering Study
|
$ | 4,000,000 | ||
|
Building of a pilot plant and creation of off-take samples
|
$ | 5,000,000 | ||
|
Permitting fees
|
$ | 750,000 | ||
|
Total
|
$ | 16,250,000 |
The above amounts may be updated based on actual costs and the timing may be delayed based on several factors, including the availability of capital to fund the budget. The source of funds required to complete the budgeted items disclosed above will come from private placements in the capital markets.
Although no assurances can be provided, the pilot plant is now projected to be built starting in early 2015. The BFS process is currently ongoing and will continue through to the end of December 31, 2015. The detailed engineering study will commence early in 2015. Metallurgical testing is ongoing and will continue through the end of the fiscal year ending June 30, 2015.
RESULTS OF OPERATIONS
We have had no operating revenues from inception on March 1, 2004 through to the year ended June 30, 2014. Our activities have been financed from the proceeds of securities subscriptions. The following are explanations for the material fluctuations/disparities during the year ended June 30, 2014 when compared to the year ended June 30, 2013:
|
·
|
Amounts spent on mineral properties totaled $7,343,541 (June 30, 2012: $3,720,735), which represents an increase of $3,622,806. Significant items expensed during the year ended June 30, 2014 include $1,500,000 on our BFS with DRA for the Molo Graphite Project, $1,000,000 in expenses relating to acquiring the remaining 25% interest in the Molo Graphite Project and additional mining claims, $1,100,000 in metallurgical testing and related, $600,000 on infill drilling and $400,000 on permitting plus a total of $2,300,000 on work for the Sagar property to go toward satisfying the Canada Revenue Agency flow-through commitment based on flow-through funds raised during the calendar year of 2013. During fiscal year ending June 30, 2013 expenses incurred primarily related to metallurgical tests and fees to consulting geologists..
|
|
·
|
Professional fees totaled $1,765,769, up $101,804 from the year ended June 30, 2013 total of $1,663,965. This represents a 5% increase in costs between periods which relates to higher legal costs incurred during the period for drafting confidentiality and related agreements for potential off-take partners, the acquisition of the remaining 25% interest in the Molo Graphite Property, costs relating to the Sagar Property divestiture and other agreements.
|
|
·
|
General and administration relates to fees associated with running the Toronto office and the Madagascar operations on the property and travel. These costs increased by $9,041 between periods (June 30, 2014: $1,357,682, and June 30, 2013: $1,348,641). The reason for this increase is travel costs for numerous trips to South Africa to liaise with DRA, Madagascar to meet government officials, and visit the property, Europe to meet with GMP and potential equity investors and debt providers and Asia to meet with potential financiers, potential joint venture partners and potential off-take partners.
|
|
·
|
Stock-based compensation decreased by $789,259 (June 30, 2014: $681,419 and June 30, 2013: $1,470,678). This expense is the Black-Scholes theoretical cost to issue stock options.
|
|
·
|
Depreciation increased from by $22,830 (June 30, 2014: $44,446, June 30, 2013: 21,616). This increase is due to the increase in fixed assets during the year.
|
|
·
|
Foreign currency translation was in a loss position for the year ended June 30, 2014 (loss $60,076) and a gain position during the first year ending June 30, 2013 (gain: $93,395). This item arises due to the fluctuations in foreign currency exchange rates at the time that transactions occur in a currency other than our functional currency of US dollars and due to the revaluation of balance sheet items from foreign currencies into US dollars as of the date of the balance sheet, namely June 30, 2014.
|
|
·
|
Investment income decreased by $211,900 from $307,992 for the year ended June 30, 2013 to $96,092 for the year ended June 30, 2014. Returns on our passive investments were the reason for this decrease.
|
30
Liquidity, Capital Resources and Foreign Currencies
As at June 30, 2014, we had cash on hand of $1,250,383. Our working capital was $29,145 which excludes the warrant liability and deferred premium on flow-through shares which are non-cash items reflected as liabilities. Subsequent to June 30, 2014 and as of the date of the report, we raised $4,800,000 by issuing 34,285,714 of the Company’s common shares. In connection with the closing, the Company paid compensation consisting of a cash fee of $260,132 and issued 2,018,442 broker common stock purchase warrants. Each compensation warrant entitles the holder to purchase one common share at $0.14 and expires 24 months from the date of issuance. We hold a significant portion of cash reserves in Canadian dollars. Due to foreign exchange rate fluctuations, the value of these Canadian dollar reserves can result in translation gains or losses in US dollar terms. If there was to be a significant decline in the Canadian dollar against the US dollar, the US dollar value of that Canadian dollar cash position presented on our balance sheet would also significantly decline. If the US dollar significantly declines relative to the Canadian dollar, our quoted US dollar cash position would also significantly decline. Such foreign exchange declines could cause us to experience losses. In addition to paying expenses in Canadian dollars, we also pay expenses in South African Rand, Madagascar Ariary and Australian Dollars. Therefore, we are subject to risks relating to movements in those currencies.
There are no assurances that we will be able to achieve further sales of common shares or any other form of additional financing. If we are unable to achieve the financing necessary to continue the plan of operations, then we will not be able to continue our exploration and our venture will fail.
Capital Financing
|
·
|
From inception through June 30, 2004, we raised $59,750 through the issuance of 9,585,000 common shares.
|
|
·
|
For the year ended June 30, 2005, we did not raise any capital from new financings.
|
|
·
|
For the year ended June 30, 2006, we raised $795,250 through the issuance of 2,750,000 common shares and 2,265,000 common share purchase warrants.
|
|
·
|
For the year ended June 30, 2007, we raised $17,300,000 through the issuance of 34,600,000 common shares and 29,000,250 common share purchase warrants.
|
|
·
|
For the year ended June 30, 2008, we did not raise any capital from new financings.
|
|
·
|
For the year ended June 30, 2009, we raised $680,000 through the issuance of 6,800,000 common shares and 3,400,000 common share purchase warrants.
|
|
·
|
For the year ended June 30, 2010, we raised $6,500,000 through the issuance of 21,666,667 common shares and 21,666,667 common share purchase warrants.
|
|
·
|
For the year ended June 30, 2011, we raised net proceeds of $13,178,708 through the issuance of 30,936,654 common shares and 15,468,328 common share purchase warrants and $886,501 (by issuing 4,549,500 common shares) through the exercise of common share purchase warrants.
|
|
·
|
For the year ended June 30, 2012, we raised proceeds of $635,000 (by issuing 2,540,000 common shares) through the issuance of common shares and $84,000 (by issuing 510,000 common shares) through the exercise of common stock purchase options.
|
|
·
|
For the year ended June 30, 2013, we raised net proceeds of $4,076,133 through the issuance of 18,157,142 common shares and 3,513,599 common share purchase warrants and $105,000, by issuing 700,000 common shares, through the exercise of common stock purchase options.
|
|
·
|
For the year ended June 30, 2014, we raised net proceeds of $9,559,926 through the issuance of 90,523,283 common shares and 39,312,130 common share purchase warrants.
|
We will require additional funding during fiscal 2015, which will likely be in the form of equity financing from the sale of our common shares. However, we cannot provide investors with any assurance that we will be able to raise sufficient funding from the sale of common shares for additional phases of exploration.
31
Issuances of Securities
We have funded our business to date from sales of our securities. From July 1, 2012 through June 30, 2014, the Company issued the following unregistered securities:
|
·
|
During July 2012, $105,000 was received through the exercise of 700,000 stock options at $0.15 per share.
|
|
·
|
On July 13, 2012, we issued 1,695,000 stock options to directors, officers and consultants of the Company.
|
|
·
|
During November 2012, we closed a brokered and non-brokered private placement raising $2,032,500. We issued 5,807,142 shares of common stock at $0.35 per share and 2,903,571 common share purchase warrants at an exercise price of $0.50, expiring 24 months from the date of issue. We also issued 340,028 compensation common share purchase warrants at $0.35.
|
|
·
|
On February 27, 2013, we issued 5,900,000 stock options to directors, officers and consultants of the Company.
|
|
·
|
During March 2013, we closed a private placement raising a total of $2,307,035 (CAD$2,358,000). We issued 12,350,000 common stock between $0.18 and $0.20 per share. In addition, we issued 270,000 compensation warrants at CAD$0.20.
|
|
·
|
On July 9, 2013, we issued 1,255,000 stock options to directors, officers and consultants at $0.11 per share.
|
|
·
|
Between July 26, 2013 and August 1, 2013, we closed a private placement raising $813,212 (CAD$837,500) and $1,230,000. We issued 16,950,001 common stock at prices of CAD$0.125 and $0.12 per share. We issued 402,000 compensation warrants at an exercise price of CAD$0.125 and 150,000 compensation warrants at an exercise price of $0.12.
|
|
·
|
On September 19, 2013, we issued 750,000 stock options to directors, officers and consultants at $0.15 per share.
|
|
·
|
On October 9, 2013, we issued 250,000 stock options to a director at $0.13 per share.
|
|
·
|
On December 18, 2013 we closed a non-brokered financing and raised $1,479,023 (CAD$1,566,490). We issued 11,189,215 common shares at CAD$0.14 per share. We also issued 671,353 compensation warrants at CAD$0.14 per share.
|
|
·
|
On January 10, 2014, we issued 4,625,000 stock options to directors and officers at $0.18 per share.
|
|
·
|
On January 15, 2014 and January 31, 2014, we closed a private placement raising a total of $6,906,008 (CAD$7,486,088). The Company issued 62,384,067 common shares at CAD$0.12 and 31,192,033 common share purchase warrants. We also issued 3,396,744 compensation warrants.
|
|
·
|
On February 6, 2014, we issued 250,000 stock options to a consultant at $0.18 per share.
|
|
·
|
On June 23, 2014, we issued 2,500,000 common stock to Malagasy at $0.13 per share for the Molo Graphite Project.
|
Off-balance sheet arrangements
We have no off-balance sheet arrangements including arrangements that would affect the liquidity, capital resources, market risk support and credit risk support or other benefits.
SIGNIFICANT ACCOUNTING POLICIES
Principals of Consolidation and Basis of Presentation
Our Company’s consolidated financial statements are presented in accordance with accounting principles generally accepted in the United States ("U.S. GAAP"), and are expressed in United States dollars. These consolidated financial statements include the accounts of Energizer Resources Inc. and its wholly-owned subsidiaries, Energizer Resources (Mauritius) Ltd., THB Ventures Ltd., Energizer Resources Madagascar Sarl, Energizer Resources Minerals Sarl, Madagascar-ERG Joint Venture (Mauritius) Ltd, ERG (Madagascar) Sarl and 2391938 Ontario Inc. These consolidated financial statements also include our proportionate share interest of 25% in Ampanihy Exploration Ltd and Ampex Sarl. All inter-company balances and transactions have been eliminated on consolidation.
32
Mineral Property Costs
Mineral property exploration costs are expensed as incurred. We have not yet realized any revenues from its mineral operations. When it has been determined that a mineral property can be economically developed as a result of establishing probable and proven reserves, the costs then incurred to develop such property will be capitalized. Such costs will be amortized using the units of production method over the estimated life of the probable reserve. If properties are abandoned or the carrying value is determined to be in excess of possible future recoverable amounts we will write off the appropriate amount.
Financial Instruments
The fair value of cash and cash equivalents, amounts receivable, marketable securities, loan to related parties and accounts payable and accrued liabilities were estimated to approximate their carrying values due to the immediate or short term maturity of these financial instruments. Our exploration operations are in Madagascar and Canada, which result in exposure to market risks from changes in foreign currency rates.
Foreign Currency Translation
Our functional and reporting currency is United States Dollars. Monetary assets and liabilities denominated in foreign currencies are translated using the exchange rate prevailing at the balance sheet date. Gains and losses arising on settlement of foreign currency denominated transactions or balances are included in the consolidated statements of operations and comprehensive loss.
Stock-Based Compensation
We have a stock option plan. All stock based awards granted, including those granted to directors not acting in their capacity as directors, are accounted for using the fair value based method, using the Black Scholes pricing model. The fair value of stock options granted is recognized as an expense within the consolidated statements of operations and comprehensive loss and a corresponding increase in additional paid in capital. Any consideration paid by eligible participants on the exercise of stock options is credited to common stock. The additional paid in capital amount associated with stock options is transferred to common stock upon exercise.
Flow-through shares
The Company has financed a portion of its exploration activities through the issuance of flow-through shares. Flow-through shares are a Canadian income tax incentive. Under the terms of the flow-through share agreements, the tax attributes of the related exploration expenditures are renounced by the Company to the benefit of flow-through share subscribers. Proceeds from the issuance of flow-through shares are allocated between the offering of shares and the sale of tax benefits. An allocation is made based on the difference between the quoted price of the existing shares and the amount that the investor paid for the shares. A liability is recognized for this difference. The liability is reduced and a reduction of the premium liability is recorded as other income as eligible expenditures are incurred and when the Company files the appropriate renunciation forms with Canadian tax authorities.
Use of Estimates
The preparation of our consolidated financial statements requires management to make estimates and assumptions that affect the reported amounts of assets and liabilities and disclosure of contingent assets and liabilities at the date of these consolidated financial statements and the reported amounts of revenues and expenses during the period. On an ongoing basis, management evaluates its judgments and estimates in relation to assets, liabilities, revenue and expenses. Management uses past experience and other factors as the basis for its judgments and estimates. Actual results may differ from those estimates. The impacts of estimates are pervasive throughout these consolidated financial statements, and may require accounting adjustments based on future occurrences. Revisions to accounting estimates are recognized in the period in which the estimate is revised and the revision affects current and future periods. Areas where significant estimates and assumptions are used include: the Black Scholes valuation of warrants and stock options issued and the valuation recorded for future income taxes.
RECENT ACCOUNTING PRONOUNCEMENTS
The following are recent FASB accounting pronouncements, which may have an impact on the Company's future consolidated financial statements.
|
-
|
"Income Taxes (ASC Topic 740): Presentation of an Unrecognized Tax Benefit when a Net Operating Loss Carry-forward, a Similar Tax Loss, or a Tax Credit Carry-forward Exists" ("ASU 2013-11") was issued during July 2013. FASB issued guidance on how to present an unrecognized tax benefit. The guidance is effective for annual periods beginning after December 15, 2014.
|
|
-
|
"Development Stage Entities (ASC Topic 915): Elimination of Certain Financial Reporting Requirements, Including an Amendment to Variable Interest Entities Guidance in Topic 810, Consolidation" ("ASU 2014-10") was issued during June 2014. FASB issued guidance to improve financial reporting by reducing the cost and complexity associated with the incremental reporting requirements for development stage entities. This guidance is effective for annual periods beginning after December 15, 2014 with early adoption allowed.
|
|
-
|
"Presentation of Financial Statements Going Concern (ASC Topic 205-40): Disclosure of Uncertainties about an Entity’s Ability to Continue as a Going Concern ("ASU 2014-15") was issued during August 2014. FASB issued guidance on how to account for and disclose going concern risks. This guidance is effective for annual periods beginning after December 15, 2016.
|
33
The Company is currently evaluating the impact of ASC Topic 740 and ASC Topic 205-40 FASB accounting pronouncements. The Company has elected to adopt the provisions of ASC 2014-10 into these consolidated financial statements. The adoption of ASC 2014-10 did not have a significant impact on the Company's results of operations, financial performance or cash flows.
ITEM 7A. QUANTITATIVE AND QUALITATIVE DISCLOSURES ABOUT MARKET RISK
We do not hold any derivative instruments and do not engage in any hedging activities. Most of our activity is the development and mining of our mineral properties in Madagascar and Canada.
ITEM 8. FINANCIAL STATEMENTS AND SUPPLEMENTARY DATA
The financial statements required by this Item, the accompanying notes thereto and the reports of independent accountants are included, as part of this Form 10-K immediately following the signature page.
ITEM 9. CHANGES IN AND DISAGREEMENTS WITH ACCOUNTANTS ON ACCOUNTING AND FINANCIAL DISCLOSURE
None noted.
ITEM 9A. CONTROLS AND PROCEDURES
(a) Evaluation of Disclosure Controls and Procedures
Our management team, under the supervision and with the participation of our principal executive officer and our principal financial officer, evaluated the effectiveness of the design and operation of our disclosure controls and procedures as such term is defined under Rule 13a-15(e) promulgated under the Securities Exchange Act of 1934, as amended (Exchange Act), as of the last day of the fiscal period covered by this report, June 30, 2014. The term disclosure controls and procedures means our controls and other procedures that are designed to ensure that information required to be disclosed by us in the reports that we file or submit under the Exchange Act is recorded, processed, summarized and reported, within the time periods specified in the SEC’s rules and forms. Disclosure controls and procedures include, without limitation, controls and procedures designed to ensure that information required to be disclosed by us in the reports that we file or submit under the Exchange Act is accumulated and communicated to management, including our principal executive and principal financial officer, or persons performing similar functions, as appropriate to allow timely decisions regarding required disclosure. Based on this evaluation and the deficiencies noted in our management’s report on internal controls and procedures over financial reporting, our principal executive officer and our principal financial officer concluded that, given the size of our Company and its finance department, our disclosure controls and procedures were not effective as of June 30, 2014.
Management’s report on internal control over financial reporting
Our principal executive officer and our principal financial officer, are responsible for establishing and maintaining adequate internal control over financial reporting, as such term is defined in Exchange Act Rules 13a-15(f). Management is required to base its assessment of the effectiveness of our internal control over financial reporting on a suitable, recognized control framework, such as the framework developed by the Committee of Sponsoring Organizations (COSO). The COSO framework, published in Internal Control-Integrated Framework, is known as the COSO Report. Our principal executive officer and our principal financial officer, have chosen the COSO framework on which to base its assessment. Based on this evaluation, we have concluded that, as of June 30, 2014, internal controls and procedures were not effective to detect the inappropriate application of US GAAP rules as described below.
34
The matters involving internal controls and procedures that the Company’s management considered to be material weaknesses under the standards of the Public Company Accounting Oversight Board were: (1) inadequate segregation of duties consistent with control objectives; (2) lack of a majority of independent directors on the Company’s board of directors, resulting in ineffective oversight in the establishment and monitoring of required internal controls and procedures; (3) insufficient written policies and procedures for accounting and financial reporting with respect to the requirements and application of US GAAP and SEC disclosure requirements; and (4) ineffective controls over period end financial disclosure and reporting processes.
Because of its inherent limitations, internal control over financial reporting may not prevent or detect misstatements. Therefore, even those systems determined to be effective can provide only reasonable assurance of achieving their control objectives. Furthermore, smaller reporting companies, like ours, face additional limitations. Smaller reporting companies employ fewer individuals and find it difficult to properly segregate duties. Often, only a few individuals control every aspect of the Company's operation and are in a position to override any system of internal control. Additionally, smaller reporting companies tend to utilize general accounting software packages that lack a rigorous set of software controls.
This annual report does not include an attestation report of our independent registered public accounting firm over management’s assessment regarding internal control over financial controls. Management’s report was not subject to attestation by our registered public accounting firm pursuant to an exemption for smaller reporting companies under Section 989G of the Dodd-Frank Wall Street Reform and Consumer Protection Act.
It should be noted that any system of controls, however well designed and operated, can provide only reasonable and not absolute assurance that the objectives of the system are met. In addition, the design of any control system is based in part upon certain assumptions about the likelihood of certain events. However, as noted, when the size of our Company and its finance department is materially increased, the deficiencies can be addressed. Once increased, we intend to create a new finance and accounting position that will allow for proper segregation of duties consistent with control objectives, and will increase our personnel resources and technical accounting expertise within the accounting function; and we will prepare and implement appropriate written policies and checklists which set forth procedures for accounting and financial reporting with respect to the requirements and application of US generally accepted accounting principles and SEC disclosure requirements. Because of these and other inherent limitations of control systems, there can be no assurance that any design will succeed in achieving its stated goals under all potential future conditions, regardless of how remote or when the size of our Company and our finance department will materially increase to address these issues.
(b) Changes in Internal Control over Financial Reporting
During the fiscal year ended June 30, 2014, no changes were made to our internal control over financial reporting that have materially affected, or are reasonably likely to materially affect, our internal control over financial reporting.
ITEM 9B. OTHER INFORMATION
None noted.
35
PART III
ITEM 10. DIRECTORS, EXECUTIVE OFFICERS AND CORPORATE GOVERNANCE
The following table sets forth the name, age, and position of each executive officer and director the Company as at September 19, 2014.
|
Name
|
Age
|
Position
|
|
V. Peter Harder
|
62
|
Chairman of the Board of Directors and Director
|
|
Richard E. Schler
|
61
|
Chief Executive Officer and Director
|
|
Craig Scherba
|
42
|
President, Chief Operating Officer and Director
|
|
John Sanderson
|
79
|
Vice Chairman and Director
|
|
Robin Borley
|
46
|
Senior Vice President of Mine Development and Director
|
|
Peter Liabotis
|
44
|
Chief Financial Officer
|
|
Quentin Yarie
|
49
|
Director
|
|
Johann de Bruin
|
44
|
Director
|
|
Albert A. Thiess, Jr.
|
67
|
Director
|
Directors of the Company hold their offices until the next annual meeting of the Company’s shareholders and until their successors have been duly elected and qualified or until their earlier resignation, removal of office or death. Executive officers of the Company are elected by the board of directors to serve until their successors are elected and qualified. There are no family relationships between any director or executive officer of the Company.
V. Peter Harder, LL.D, M.A., B.A. (Hons) (Manotick, Canada): Mr. Harder was appointed Chairman of the Board of Directors during September 2013 and has served as a director of our Company since July 2009. He is a Senior Policy Advisor to Denton Canada (“Dentons”), a Canadian national law firm and international affiliation. Prior to joining Dentons, Mr. Harder was a long-serving Deputy Minister in the Government of Canada. First appointed a Deputy Minister in 1991, he served as the most senior public servant in a number of federal departments including Treasury Board, Solicitor General, Citizenship and Immigration, Industry and Foreign Affairs and International Trade. At Foreign Affairs, Mr. Harder assumed the responsibilities of the Personal Representative of the Prime Minister to three G8 Summits (Sea Island, Gleneagles and St. Petersburg). Mr. Harder is also a director of Power Financial Corporation (TSX: PWF), IGM Financial Corporation (TSX: IGM), Telesat Canada, Northland Power Inc. (TSX: NPI), Timberwest Forest Company and Magna International Inc. (TSX: MG, NYSE: MGA). In 2008, Mr. Harder was elected the President of the Canada China Business Council (CCBC).
John Sanderson Q.C. (Vancouver, Canada): Mr. Sanderson has been the Company’s Vice Chairman of the Board since October 2009 and a director of our Company since January 2009. Mr. Sanderson was Chairman of the Board of the Company from January 2009 to September 2009. Mr. Sanderson is a chartered mediator, chartered arbitrator, consultant and lawyer called to the bar in the Canadian provinces of Ontario and British Columbia. Mr. Sanderson’s qualifications to serve as a director include his many years of legal and mediation experience in various industries. He has acted as mediator, facilitator and arbitrator across Canada, and internationally, in numerous commercial transactions, including insurance claims, corporate contractual disputes, construction matters and disputes, environmental disputes, inter-governmental disputes, employment matters, and in relation to aboriginal claims. He has authored and co-authored books on the use and value of dispute resolution systems as an alternative to the courts in managing business and legal issues.
Richard Schler, MBA (Toronto, Canada): Mr. Schler was appointed Chief Executive Officer in September 2013 and has been a director since April 2006. He has previously held other senior positions with the Company, including the roles of Executive Vice-President and Chief Financial Officer. Mr. Schler also currently serves as a director and Chief Executive Officer of MacDonald Mines Exploration Ltd., Honey Badger Exploration Inc. and Red Pine Exploration Inc, all of which are resource exploration companies trading on the TSX - Venture Exchange headquartered in Toronto, Canada. Before joining these companies, Mr. Schler held various senior management positions with noted corporations. He has over 25 years of experience in the manufacturing sector. Mr. Schler is experienced in financial management and business operations and has been successful in raising funds in the capital markets.
36
Craig Scherba, P.Geol. (Oakville, Canada): Mr. Scherba was appointed as our President and Chief Operating Officer during September 2012 and a director during January 2010. Mr. Scherba served as Vice President, Exploration of the Company from January 2010 to September 2012. Mr. Scherba has been a professional geologist (P. Geol.) since 2000, and his expertise includes supervising large Canadian and international exploration. Mr. Scherba also serves as Vice President, Exploration of MacDonald Mines Exploration Ltd, Red Pine Exploration Inc. and Honey Badger Exploration Inc which are resource exploration company trading on the TSX - Venture Exchange. In addition, Mr. Scherba was professional geologist with Taiga Consultants Ltd. (“Taiga”), a mining exploration consulting company from March 2003 to December 2009. He was a managing partner of Taiga between January 2006 and December 2009. Mr. Scherba was an integral member of the exploration team that developed Nevsun Resources’ high grade gold, copper and zinc Bisha project in Eritrea. While at Taiga, Mr. Scherba served as the Company's Country and Exploration Manager in Madagascar during its initial exploration stage.
Robin Borley (Johannesberg, South Africa): Mr. Borley was appointed our Senior Vice President (“SVP”) of Mine Development during December 2013. Mr. Borley is a Graduate mining engineering professional and a certified mine manager with more than 25 years of international mining experience building and operating mining ventures. He has held senior management positions both internationally and within the South African mining industry. Until October 2014, Mr. Borley served as Mining Director for DRA Mineral Projects. In addition, Mr. Borley was instrumental as the COO of Red Island Minerals in a developing a Madagascar coal venture. His diverse career has spanned resource project management, evaluation, exploration and mine development. Robin has completed several mine evaluations including operational and financial evaluations of new and existing operations across a diverse range of resource sectors. He has experience in the management of underground and surface mining operations from both the contractor and owner miner environments. From 2006 through to 2012, Robin participated in the BEE management buy-out transaction of the Optimum Colliery mining property from BHP, through its independent listing and its ultimate sale to Glencore in December 2012.
Peter Liabotis, CPA, CA (Oakville, Canada): Mr. Liabotis was appointed as our Chief Financial Officer (“CFO”) & SVP during September 2012 and prior to that was our Vice President – Finance from October 2009 to August 2012. Mr. Liabotis is currently the CFO & SVP of Red Pine Exploration Inc., MacDonald Mines Exploration Ltd., and Honey Badger Exploration Inc., all of which are resource exploration companies trading on the TSX - Venture Exchange. From August 2008 to September 2009 Mr. Liabotis worked as controller for EFG Wealth Management (Canada). From July 1998 through July 2008, Mr. Liabotis was the CFO & SVP of Olympia Capital, a Bermuda corporation leading the sale of this business to a French Bank. Prior to July 1998, Mr. Liabotis worked for two years at PriceWaterhouseCoopers in Bermuda and two years with KPMG in Canada Mr. Liabotis is a member of the Board of Directors of Honey Badger Exploration, Inc. Mr. Liabotis is a Chartered Professional Accountant (through the Chartered Professional Accountants of Ontario), received his Bachelor of Commerce, Honours from the University of Windsor and received his Bachelor of Arts from the Western University (in Ontario, Canada).
Quentin Yarie, P.Geol. (Toronto, Canada): Mr. Yarie has served as a director of our Company since 2008. Mr. Yarie is an experienced geophysicist and a successful entrepreneur with over 20 years’ experience in mining and environmental/engineering. Mr. Yarie has project management and business development experience as he has held positions of increasing responsibility with a number of Canadian-based geophysical service providers. Since January 2010, Mr. Yarie has been Senior Vice President Exploration for MacDonald Mines Exploration Ltd, Red Pine Exploration Inc. and Honey Badger Exploration Inc all listed on the TSX-Venture Exchange headquartered in Toronto, Canada. From October 2007 to December 2009, Mr. Yarie was a business development officer with Geotech Ltd, a geo-physical airborne survey company. From September 2004 to October 2007, Mr. Yarie was a senior representative of sales and business development for Aeroquest Limited. From 1992-2001, he was a partner of a specialized environmental and engineering consulting group where he managed a number of large projects including the ESA of the Sydney Tar Ponds, the closure of the Canadian Forces Bases in Germany and the Maritime and Northeast Pipeline project.
Johann de Bruin, Pr. Eng (Pretoria, South Africa): Mr. de Bruin, Pr. Eng, was appointed a Director during February 2012. Mr. de Bruin is a Director of DRA with a 15-year track record of bringing numerous greenfield mining projects throughout Africa to feasibility. He currently leads the initiative of business development in Africa for DRA and has acted as the primary liaison between DRA and the Company over the past four years. Mr. de Bruin brings considerable insight and skill into evolving the infrastructure components associated with new projects in developing countries.
Albert A. Thiess, Jr. (Bluffton, United States of America): Mr. Thiess was appointed a Director during May 2012. Mr. Thiess brings over 35 years of accounting, finance and management experience to the Company. Mr. Thiess served as an audit partner in Coopers & Lybrand, LLP and with PricewaterhouseCoopers LLP following the merger of those firms in 1998. He served clients in the automotive, banking, retail and manufacturing industries, as well as serving as the Managing Partner of the Detroit, Michigan and Los Angeles, California offices. He also was elected to the Governing Council of Coopers & Lybrand. Following the merger with PricewaterhouseCoopers, Mr. Thiess managed various global functions for the newly merged firm.
37
Involvement in Certain Legal Proceedings
To the best of the Company’s knowledge, during the past ten years, none of the following occurred with respect to a director or executive officer of the Company: (1) any bankruptcy petition filed by or against any business of which such person was a general partner or executive officer either at the time of the bankruptcy or within two years prior to that time; (2) any conviction in a criminal proceeding or being subject to a pending criminal proceeding (excluding traffic violations and other minor offenses); (3) being subject to any order, judgment or decree, not subsequently reversed, suspended or vacated, of any court of any competent jurisdiction, permanently or temporarily enjoining, barring, suspending or otherwise limiting his involvement in any type of business, securities or banking activities; (4) being found by a court of competent jurisdiction (in a civil action), the Securities and Exchange Commission or the commodities futures trading commission to have violated a Federal or state securities or commodities law, and the judgment has not been reversed, suspended or vacated; (5) being subject of, or a party to, any federal or state judicial or administrative order, judgment, decree, or finding, not subsequently reversed, suspended or vacated, relating to an alleged violation of any federal or state securities or commodities law or regulation or any law or regulation respecting financial institutions or insurance companies or prohibiting mail or wire fraud or fraud in connection with any business entity; or (6) being subject of, or a party to, any sanction or order, not subsequently reversed, suspended or vacated, of any self-regulatory organization, any registered entity of the Commodity Exchange Act, or any equivalent exchange, association, entity or organization that has disciplinary authority over its members or persons associated with a member.
Audit Committee and Audit Committee Financial Expert
The Company has an audit committee comprised of John Sanderson, Peter Harder and Albert A. Thiess, Jr., all of whom are financially literate. Each are independent directors as they do not have involvement in the day-to-day operations of the Company. The audit committee is a key component of the Company’s commitment to maintaining a higher standard of corporate responsibility.
The audit committee assists our board of directors in its oversight of the company’s accounting and financial reporting processes and the audits of the company’s financial statements, including (i) the quality and integrity of the company’s financial statements, (ii) the company’s compliance with legal and regulatory requirements, (iii) the independent auditors’ qualifications and independence and (iv) the performance of the company’s internal audit functions and independent auditors, as well as other matters which may come before it as directed by the board of directors. Further, the audit committee, to the extent it deems necessary or appropriate, among its several other responsibilities, shall:
|
·
|
be responsible for the appointment, compensation, retention, termination and oversight of the work of any independent auditor engaged for the purpose of preparing or issuing an audit report or performing other audit, review or attest services for the Company;
|
|
·
|
discuss the annual audited financial statements and the quarterly unaudited financial statements with management and, if necessary the independent auditor prior to their filing with the SEC in the Company’s Annual Report on Form 10-K and Quarterly Reports on Form 10-Q;
|
|
·
|
review with the company’s financial management on a periodic basis (a) issues regarding accounting principles and financial statement presentations, including any significant changes in the company’s selection or application of accounting principles, and (b) the effect of any regulatory and accounting initiatives, as well as off-balance sheet structures, on the financial statements of the company;
|
|
·
|
monitor the Company’s policies for compliance with federal, state, local and foreign laws and regulations and the Company’s policies on corporate conduct;
|
|
·
|
maintain open, continuing and direct communication between the board of directors, the committee and both the company’s independent auditors and its internal auditors; and
|
|
·
|
monitor our compliance with legal and regulatory requirements, with the authority to initiate any special investigations of conflicts of interest, and compliance with federal, state and local laws and regulations, including the Foreign Corrupt Practices Act.
|
Section 16(a) Beneficial Ownership Reporting Compliance
Section 16(a) of the Securities Exchange Act of 1934, as amended, requires the Company’s directors and executive officers, and persons who beneficially own more than 10% of a registered class of the Company’s equity securities, to file reports of beneficial ownership and changes in beneficial ownership of the Company’s securities with the SEC on Form 3 (Initial Statement of Beneficial Ownership), Form 4 (Statement of Changes of Beneficial Ownership of Securities) and Form 5 (Annual Statement of Beneficial Ownership of Securities). Directors, executive officers and beneficial owners of more than 10% of the Company’s Common Stock are required by SEC regulations to furnish the Company with copies of all Section 16(a) forms that they filed.
38
Except as otherwise set forth herein, based solely on review of the copies of such forms furnished to the Company, or written representations that no reports were required, the Company believes that for the fiscal year ended June 30, 2014, beneficial owners and executives complied with Section 16(a) filing requirements applicable to them.
Involvement in Certain Legal Proceedings
None of the following events have occurred during the past ten years and are material to an evaluation of the ability or integrity of any director or officer of the Company:
|
1.
|
A petition under the Federal bankruptcy laws or any state insolvency law was filed by or against, or a receiver, fiscal agent or similar officer was appointed by a court for the business or property of such person, or any partnership in which he was a general partner at or within two years before the time of such filing, or any corporation or business association of which he was an executive officer at or within two years before the time of such filing;
|
|
2.
|
Such person was convicted in a criminal proceeding or is a named subject of a pending criminal proceeding (excluding traffic violations and other minor offenses);
|
|
3.
|
Such person was the subject of any order, judgment, or decree, not subsequently reversed, suspended or vacated, of any court of competent jurisdiction, permanently or temporarily enjoining him from, or otherwise limiting, the following activities:
|
|
|
a.
|
Acting as a futures commission merchant, introducing broker, commodity trading advisor, commodity pool operator, floor broker, leverage transaction merchant, any other person regulated by the Commodity Futures Trading Commission, or an associated person of any of the foregoing, or as an investment adviser, underwriter, broker or dealer in securities, or as an affiliated person, director or employee of any investment company, bank, savings and loan association or insurance company, or engaging in or continuing any conduct or practice in connection with such activity;
|
|
|
b.
|
Engaging in any type of business practice; or
|
|
c.
|
Engaging in any activity in connection with the purchase or sale of any security or commodity or in connection with any violation of Federal or State securities laws or Federal commodities laws;
|
|
4.
|
Such person was the subject of any order, judgment or decree, not subsequently reversed, suspended or vacated, of any Federal or State authority barring, suspending or otherwise limiting for more than 60 days the right of such person to engage in any activity described in paragraph (f)(3)(i) of this section, or to be associated with persons engaged in any such activity;
|
|
5.
|
Such person was found by a court of competent jurisdiction in a civil action or by the Commission to have violated any Federal or State securities law, and the judgment in such civil action or finding by the Commission has not been subsequently reversed, suspended, or vacated;
|
|
6.
|
Such person was found by a court of competent jurisdiction in a civil action or by the Commodity Futures Trading Commission to have violated any Federal commodities law, and the judgment in such civil action or finding by the Commodity Futures Trading Commission has not been subsequently reversed, suspended or vacated;
|
|
7.
|
Such person was the subject of, or a party to, any Federal or State judicial or administrative order, judgment, decree, or finding, not subsequently reversed, suspended or vacated, relating to an alleged violation of:
|
|
a.
|
Any Federal or State securities or commodities law or regulation; or
|
|
b.
|
Any law or regulation respecting financial institutions or insurance companies including, but not limited to, a temporary or permanent injunction, order of disgorgement or restitution, civil money penalty or temporary or permanent cease-and-desist order, or removal or prohibition order; or
|
|
c.
|
Any law or regulation prohibiting mail or wire fraud or fraud in connection with any business entity; or
|
|
8.
|
Such person was the subject of, or a party to, any sanction or order, not subsequently reversed, suspended or vacated, of any self-regulatory organization (as defined in Section 3(a)(26) of the Exchange Act (15 U.S.C. 78c(a)(26))), any registered entity (as defined in Section 1(a)(29) of the Commodity Exchange Act (7 U.S.C. 1(a)(29)), or any equivalent exchange, association, entity or organization that has disciplinary authority over its members or persons associated with a member.
|
Code of Ethics
The Company has adopted a code of business conduct and ethics that applies to its directors, officers, and employees, including its principal executive officers, principal financial officer, principal accounting officer, controller or persons performing similar functions. The Financial Code of Business Conduct was filed as Exhibit 14.1 to our Annual Report on Form 10-QSB for June 30, 2004 as filed on May 19, 2004. If we make substantive amendments to the Code of Ethics for Senior Financial Officers or the Code of Business Conduct and Ethics or grant any waiver, including any implicit waiver, we will disclose the nature of such amendment or waiver on our website or in a report on Form 8-K within four days of such amendment or waiver.
39
ITEM 11. EXECUTIVE COMPENSATION
Summary Compensation
The table below sets forth certain summary information concerning the compensation paid or accrued during each of our last three completed fiscal years to our principal executive officer and four other most highly compensated executive officers who received compensation over $100,000 for the fiscal year ended June 30, 2013 (collectively, the “Named Executive Officers” or “NEO”):
|
Name and Principal Position
|
Fiscal Year
|
Salary
($)
|
Bonus
($)
|
Stock Award
($)
Note 6
|
Option Award ($)
|
Non Equity Inventive Plan Compens-aton ($)
|
Change in Pension Value and Non Qualified Deferred Compensation Earnings ($)
|
All Other Compens-ation
($)
NOTE 1
|
Total
($)
NOTE 1
|
|
Richard E. Schler, CEO and Director **
|
2014
|
218,955(3)
|
0
|
0
|
0
|
0
|
0
|
84,174 (1)
|
303,129 (1)
|
|
2013
|
197,008 (5)
|
0
|
0
|
0
|
0
|
0
|
280,428 (1)
|
477,438 (1)
|
|
|
2012
|
201,407 (4)
|
0
|
0
|
0
|
0
|
0
|
557,033 (1)
|
758,440 (1)
|
|
|
Craig Scherba
President, COO and Director
|
2014
|
167,305(3)
|
0
|
0
|
0
|
0
|
0
|
61,566 (1)
|
228,871 (1)
|
|
2013
|
130,000 (5)
|
0
|
0
|
0
|
0
|
0
|
134,700 (1)
|
264,700 (1)
|
|
|
2012
|
105,214 (4)
|
0
|
0
|
0
|
0
|
0
|
260,035 (1)
|
365,249 (1)
|
|
|
Robin Borley, SVP and Director***
|
2014
|
116,900(3)
|
0
|
0
|
0
|
0
|
0
|
26,820 (1)
|
143,720 (1)
|
|
2013
|
0
|
0
|
0
|
0
|
0
|
0
|
0
|
0
|
|
|
2012
|
0
|
0
|
0
|
0
|
0
|
0
|
0
|
0
|
|
|
Peter Liabotis, Chief Financial Officer
|
2014
|
210,055 (3)
|
0
|
0
|
0
|
0
|
0
|
58,755 (1)
|
268,810 (1)
|
|
2013
|
171,500 (5)
|
0
|
0
|
0
|
0
|
0
|
98,780 (1)
|
270,280 (1)
|
|
|
2012
|
168,764 (4)
|
0
|
0
|
0
|
0
|
0
|
247,975 (1)
|
416,739 (1)
|
|
|
Brent Nykoliation, SVP
|
2014
|
210,259 (3)
|
61,825 (1)
|
272,084 (1)
|
|||||
|
2013
|
190,009 (5)
|
0
|
0
|
0
|
0
|
0
|
125,720 (1)
|
315,729 (1)
|
|
|
2012
|
162,085 (4)
|
0
|
0
|
0
|
0
|
0
|
275,345 (1)
|
437,430 (1)
|
|
|
Kirk McKinnon, Former CEO and Director*
|
2014
|
496,574 (7)
|
0
|
0
|
0
|
0
|
0
|
44,932 (1)
|
541,506 (1)
|
|
2013
|
268,360 (5)
|
0
|
0
|
0
|
0
|
0
|
380,118 (1)
|
648,478 (1)
|
|
|
2012
|
248,207 (4)
|
0
|
0
|
0
|
0
|
0
|
739,062 (1)
|
987,269 (1)
|
|
* Mr. McKinnon resigned as Chief Executive Officer and Chairman of the Board of Directors on September 12, 2013.
|
|
** Mr. Schler was appointed Chief Executive Officer on September 19, 2013.
|
|
*** Mr. Borley was appointed Senior Vice President of Mine Development and a Director on December 1, 2013.
|
|
(1)
|
The values in the “All Other Compensation” above do not represent a cash payment of any kind. Rather these values represent the calculated Black-Scholes theoretical value of granted options. It is important to note that these granted options may or may not ever be exercised. Whether granted options are exercised or not will be based primarily, but not singularly, on the Company’s future stock price and whether the granted options become “in-the-money”. If these granted options are unexercised and expire, the cash value or benefit to the above noted individuals is $nil.
|
|
(2)
|
Shares valued at $0.17 per share based on quoted market price issued to these individuals and/or to companies controlled by them.
|
|
(3)
|
Salary and/or consulting fees paid and accrued for the fiscal year ended June 30, 2014.
|
|
(4)
|
Salary and/or consulting fees paid and accrued for the fiscal year ended June 30, 2012.
|
|
(5)
|
Salary and/or consulting fees paid and accrued for the fiscal year ended June 30, 2013.
|
|
(6)
|
The amounts, if any, in the “Stock Awards” column of the “Summary Compensation” table have been calculated based upon the aggregate grant date fair value computed in accordance with FASB ASC Topic 718 and there are no awards subject to performance conditions.
|
|
(6)
|
Includes full severance amount in fiscal 2014, of which $264,922 was due to be paid in fiscal 2015.
|
40
Employment Agreements
The Company does not have an employment agreement or consulting agreement with Messrs. Schler, Scherba, Liabotis or Nykoliation. Each receives consulting fees and/or monthly salaries. Mr. Schler was appointed Chief Executive Officer on September 19, 2013. Messrs. Schler and Borley receive approximately USD$17,000 per month. Messrs. Scherba, Liabotis and Nykoliation receive approximately CAD$12,000 per month. Compensation for these individuals varies from month to month depending on various factors.
Outstanding Stock Options and Stock Appreciation Rights Grants
Outstanding stock options granted to Named Executive Officers (“NEO’s”) and Directors as at June 30, 2014 are as follows:
|
Option Awards
|
|||||
|
Name
|
No. of Securities Underlying Unexercised
Options Exercisable (#)
|
No. of Securities Underlying
Unexercised Options
Unexercisable (#)
|
Equity Incentive Plan Awards: Number of Securities Underlying Unexercised Unearned Options (#)
|
Option Exercise Price ($)
|
Option Expiration Date
|
|
Richard E. Schler, NEO
|
600,000
225,000
200,000
1,340,000
675,000
650,000
170,000
200,000
475,000
|
0
|
0
|
0.30
0.20
0.21
0.28
0.29
0.21
0.11
0.15
0.18
|
July 1, 2016
Oct 24, 2016
Dec 1, 2016
March 7, 2017
July 13, 2016
Feb 27, 2018
July 9, 2018
Sept 19, 2018
Jan 10, 2019
|
|
Craig Scherba, NEO
|
350,000
200,000
200,000
400,000
750,000
180,000
500,000
|
0
|
0
|
0.30
0.20
0.21
0.28
0.21
0.11
0.18
|
July 1, 2016
Oct 24, 2016
Dec 1, 2016
March 7, 2017
Feb 27, 2018
July 9, 2018
Jan 10, 2019
|
|
Peter Liabotis, NEO
|
350,000
200,000
200,000
350,000
550,000
150,000
500,000
|
0
|
0
|
0.30
0.20
0.21
0.28
0.21
0.11
0.18
|
July 1, 2016
Oct 24, 2016
Dec 1, 2016
March 7, 2017
Feb 27, 2018
July 9, 2018
Jan 10, 2019
|
|
Robin Borley, NEO
|
125,000
75,000
300,000
|
0
|
0
|
0.28
0.21
0.18
|
March 7, 2017
Feb 27, 2018
Jan 10, 2019
|
|
Brent Nykoliation, NEO
|
450,000
200,000
200,000
350,000
700,000
175,000
75,000
400,000
|
0
|
0
|
0.30
0.20
0.21
0.28
0.21
0.11
0.15
0.18
|
July 1, 2016
Oct 24, 2016
Dec 1, 2016
March 7, 2017
Feb 27, 2018
July 9, 2018
Sept 19, 2018
Jan 10, 2019
|
|
Kirk McKinnon, Former NEO
|
675,000
575,000
650,000
1,420,000
975,000
800,000
170,000
225,000
|
0
|
0
|
0.30
0.20
0.21
0.28
0.29
0.21
0.11
0.15
|
July 1, 2016
Oct 24, 2016
Dec 1, 2016
March 7, 2017
July 13, 2016
Feb 27, 2018
July 9, 2018
Sept 19, 2018
|
The Company has no stock appreciation rights.
41
Outstanding Stock Awards at Year End
The outstanding equity awards as at June 30, 2014 are as follows:
|
Name
|
Stock awards
|
|||
|
Number of shares or units of stock that have not vested (#)
|
Market value of shares or units of stock that have not vested (#)
|
Equity incentive plan awards: number of unearned shares, units or other rights that have not vested (#)
|
Equity incentive plan awards: market or payout value of unearned shares, units or other rights that have not vested ($)
|
|
|
Richard E. Schler, NEO
|
0
|
0
|
0
|
0
|
|
Craig Scherba, NEO
|
0
|
0
|
0
|
0
|
|
Peter Liabotis, NEO
|
0
|
0
|
0
|
0
|
|
Robin Borley, NEO
|
0
|
0
|
0
|
0
|
|
Brent Nykoliation, NEO
|
0
|
0
|
0
|
0
|
|
Kirk McKinnon, Former NEO
|
0
|
0
|
0
|
0
|
Options Exercises and Stocks Vested
Options exercised and stocks vested as at June 30, 2014 are as follows:
|
Name
|
Option awards
|
Stock awards
|
||
|
Number of Shares Acquired on Exercise (#)
|
Value Realized on Exercise ($)
|
Number of Shares
Acquired on Vesting (#)
|
Value
Realized on Investing ($)
|
|
|
Richard E. Schler, NEO
|
0
|
0
|
0
|
0
|
|
Craig Scherba, NEO
|
0
|
0
|
0
|
0
|
|
Peter Liabotis, NEO
|
0
|
0
|
0
|
0
|
|
Robin Borley, NEO
|
0
|
0
|
0
|
0
|
|
Brent Nykoliation, NEO
|
0
|
0
|
0
|
0
|
|
Kirk McKinnon, Former NEO
|
0
|
0
|
0
|
0
|
Grants of Plan-Based Awards
Grants of plan-based awards are as follows:
|
Name
|
Grant date
|
Estimated future payouts under non-equity incentive plan awards
|
Estimated future payouts under equity incentive plan awards
|
All other stock awards: Number of shares of stock or units
(#)
|
All other option awards: Number of securities underlying options
(#)
|
Exercise or base price of option awards
($/Sh)
|
Grant date fair value of stock and option awards
|
||||
|
Threshold
($)
|
Target
($)
|
Maximum
($)
|
Threshold
(#)
|
Target
(#)
|
Maximum
(#)
|
||||||
|
Richard E. Schler, NEO
|
n/a
|
0
|
0
|
0
|
0
|
0
|
0
|
0
|
0
|
0
|
0
|
|
Craig Scherba, NEO
|
n/a
|
0
|
0
|
0
|
0
|
0
|
0
|
0
|
0
|
0
|
0
|
|
Peter Liabotis, NEO
|
n/a
|
0
|
0
|
0
|
0
|
0
|
0
|
0
|
0
|
0
|
0
|
|
Robin Borley, NEO
|
n/a
|
0
|
0
|
0
|
0
|
0
|
0
|
0
|
0
|
0
|
0
|
|
Brent Nykoliation, NEO
|
n/a
|
0
|
0
|
0
|
0
|
0
|
0
|
0
|
0
|
0
|
0
|
|
Kirk McKinnon, Former NEO
|
n/a
|
0
|
0
|
0
|
0
|
0
|
0
|
0
|
0
|
0
|
0
|
Reference – Grant Date - n/a = not applicable.
42
Non Qualified Deferred Compensation
As at June 30, 2014, the Company had no formalized deferred compensation plan.
|
Name
|
Executive contributions in last FY ($)
|
Registrant contributions in last FY ($)
|
Aggregate earnings in last FY ($)
|
Aggregate withdrawals/ distributions ($)
|
Aggregate balance at last FYE ($)
|
|
Richard E. Schler, NEO
|
0
|
0
|
0
|
0
|
0
|
|
Craig Scherba, NEO
|
0
|
0
|
0
|
0
|
0
|
|
Peter Liabotis, NEO
|
0
|
0
|
0
|
0
|
0
|
|
Robin Borley, NEO
|
0
|
0
|
0
|
0
|
0
|
|
Brent Nykoliation, NEO
|
0
|
0
|
0
|
0
|
0
|
|
Kirk McKinnon, Former NEO
|
0
|
0
|
0
|
0
|
0
|
Golden Parachute Compensation
As at June 30, 2014, the Company had no arrangements in place relating to the termination of employees.
|
Name
|
Cash
($)
|
Equity
($)
|
Pension/NQDC
($)
|
Perquisites/benefits
($)
|
Tax reimbursement
($)
|
Other
($)
|
Total
($)
|
|
Richard E. Schler, NEO
|
0
|
0
|
0
|
0
|
0
|
0
|
0
|
|
Craig Scherba, NEO
|
0
|
0
|
0
|
0
|
0
|
0
|
0
|
|
Peter Liabotis, NEO
|
0
|
0
|
0
|
0
|
0
|
0
|
0
|
|
Robin Borley, NEO
|
0
|
0
|
0
|
0
|
0
|
0
|
0
|
|
Brent Nykoliation, NEO
|
0
|
0
|
0
|
0
|
0
|
0
|
0
|
|
Kirk McKinnon, Former NEO
|
0
|
0
|
0
|
0
|
0
|
0
|
0
|
Long-Term Incentive Plan Awards Table
There are no Long-Term Incentive Plans in place at this time.
Aggregated Option Exercises and Fiscal Year-End Option Values
On March 9, 2006, the Company filed a Form S-8 registration statement in connection with its newly adopted 2006 Stock Option Plan (the "2006 Plan") allowing for the direct award of shares or granting of stock options to acquire up to a total of 2,000,000 common shares. On December 18, 2006, February 16, 2007, July 11, 2007, September 29, 2009, May 3, 2011, March 1, 2012, February 27, 2013, and December 23, 2013, the 2006 Plan was amended to increase the stock option pool by a total of 35,500,000 additional common shares. The following table summarizes the continuity of the Company’s stock options:
|
Number of Shares
|
Weighted average exercise price ($)
|
|
|
Outstanding June 30, 2012
|
23,690,000
|
0.29
|
|
Granted
|
7,595,000
|
0.23
|
|
Exercised
|
(700,000)
|
0.15
|
|
Expired
|
(1,695,000)
|
0.15
|
|
Cancelled
|
(1,750,000)
|
0.32
|
|
Outstanding, June 30, 2013
|
27,140,000
|
0.28
|
|
Granted
|
7,130,000
|
0.16
|
|
Expired
|
(5,600,000)
|
0.39
|
|
Cancelled
|
(200,000)
|
0.26
|
|
Outstanding, June 30, 2014
|
28,470,000
|
0.23
|
43
Additional information regarding options outstanding as at June 30, 2014 is as follows:
|
Outstanding
|
Exercisable
|
||||
|
Exercise Price
|
Number of shares
|
Weighted average life in years
|
Weighted average
exercise price
|
Number of shares
|
Weighted average exercise price
|
|
0.30
|
3,700,000
|
2.01
|
0.30
|
3,700,000
|
0.30
|
|
0.29
|
1,695,000
|
2.04
|
0.29
|
1,695,000
|
0.29
|
|
0.20
|
1,800,000
|
2.32
|
0.20
|
1,800,000
|
0.20
|
|
0.21
|
2,240,000
|
2.42
|
0.21
|
2,240,000
|
0.21
|
|
0.28
|
5,850,000
|
2.69
|
0.28
|
5,850,000
|
0.28
|
|
0.23
|
180,000
|
2.90
|
0.23
|
180,000
|
0.23
|
|
0.21
|
5,875,000
|
3.67
|
0.21
|
5,875,000
|
0.21
|
|
0.11
|
1,255,000
|
4.03
|
0.11
|
1,255,000
|
0.11
|
|
0.15
|
750,000
|
4.22
|
0.15
|
750,000
|
0.15
|
|
0.13
|
250,000
|
4.28
|
0.13
|
250,000
|
0.13
|
|
0.18
|
4,625,000
|
4.53
|
0.18
|
4,625,000
|
0.18
|
|
0.18
|
250,000
|
4.61
|
0.18
|
250,000
|
0.18
|
The following are changes in the number of stock options outstanding subsequent to the Company’s June 30, 2014 year end, and as of the date of this report:
|
·
|
On July 1, 2014, 200,000 stock options were cancelled.
|
|
·
|
On July 3, 2014, 4,800,000 stock options were issued at an exercise price of $0.15 for a term of 5 years.
|
As a result of these transactions, 33,070,000 stock options were outstanding as of the date of this report.
Compensation of Directors
Directors who provide services to the Company in other capacities has been previously reported under “Summary Compensation”. The following table summarizes compensation paid to or earned by our directors who are not Named Executive Officers for their service as directors of our company during the fiscal year ended June 30, 2014.
|
Name
|
Fees Earned or Paid in Cash ($)
|
Stock Awards ($)
|
Option Awards (1)
($)
|
Non-Equity Incentive Plan Compensation ($)
|
Change in Pension Value and Nonqualified Deferred Compensation Earnings ($)
|
All other Comp-ensation ($)
|
Total (1)
($)
|
|
John Sanderson, Director
|
0
|
0
|
44,548 (1)
|
0
|
0
|
0
|
44,548 (1)
|
|
Quentin Yarie, Director
|
154,296
|
0
|
53,810 (1)
|
0
|
0
|
0
|
208,106 (1)
|
|
V. Peter Harder, Director
|
0
|
0
|
52,243 (1)
|
0
|
0
|
0
|
52,243 (1)
|
|
Johann de Bruin, Director
|
0
|
0
|
11,175 (1)
|
0
|
0
|
0
|
11,175 (1)
|
|
Albert A. Thiess, Jr, Director
|
0
|
0
|
13,518 (1)
|
0
|
0
|
0
|
13,518 (1)
|
|
(1)
|
The values in the “Option Awards” and included within the “Total” columns above do not represent a cash payment of any kind. Rather these values represent the calculated Black-Scholes theoretical value of granted options. It is important to note that these granted options may or may not ever be exercised. Whether granted options are exercised or not will be based primarily, but not singularly, on the Company’s future stock price and whether the granted options become “in-the-money”. If these granted options are unexercised and expire, the cash value or benefit to the above noted individuals is $nil.
|
Pension Benefits
As of June 30, 2014, the Company had no pension or retirement plans.
|
Name
|
Plan name
|
Number of years credited service (#)
|
Present value of
accumulated benefit ($)
|
Payments during last fiscal year ($)
|
|
Richard E. Schler, NEO
|
not applicable
|
0
|
0
|
0
|
|
Craig Scherba, NEO
|
not applicable
|
0
|
0
|
0
|
|
Peter Liabotis, NEO
|
not applicable
|
0
|
0
|
0
|
|
Robin Borley, NEO
|
not applicable
|
0
|
0
|
0
|
|
Brent Nykoliation, NEO
|
not applicable
|
0
|
0
|
0
|
|
Kirk McKinnon, Former NEO
|
not applicable
|
0
|
0
|
0
|
44
Equity Compensation Plan Information
The following table sets forth information as of June 30, 2014 for all compensation plans not directly approved by the Company's security holders but issued pursuant to the shareholder approved Amended and Restated Stock Option Plan. Options reported below were issued under the Company's Plan.
|
Option Awards as of June 30, 2014
|
||||||
|
Name
|
No. of Shares of Common Stock Underlying Unexercised
Common Stock Purchase Options Exercisable (#)
|
Date of Grant
|
Additional Consideration to be Received Upon Exercise or Material Conditions required to Exercise
|
Option Exercise Price ($)
|
Value Realized if Exercised
($) *
|
Option Expiration Date
|
|
Richard Schler, NEO
|
600,000
225,000
200,000
1,340,000
675,000
650,000
170,000
200,000
475,000
|
July 1, 2011
Oct 24, 2011
Dec 1, 2011
March 7, 2012
July 13, 2012
Feb 27, 2013
July 9, 2013
Sept 19, 2013
Jan 10, 2014
|
None.
None.
None.
None.
None.
None.
None.
None.
None.
|
0.30
0.20
0.21
0.28
0.29
0.21
0.11
0.15
0.18
|
0
0
0
0
0
0
3,400
0
0
|
July 1, 2016
Oct 24, 2016
Dec 1, 2016
March 7, 2017
July 13, 2017
Feb 27, 2018
July 9, 2018
Sept 19, 2018
Jan 10, 2019
|
|
Craig Scherba, NEO
|
350,000
200,000
200,000
400,000
750,000
180,000
500,000
|
July 1, 2011
Oct 24, 2011
Dec 1, 2011
March 7, 2012
Feb 27, 2013
July 9, 2013
Jan 10, 2014
|
None.
None.
None.
None.
None.
None.
None.
|
0.30
0.20
0.21
0.28
0.21
0.11
0.18
|
0
0
0
0
0
3,600
0
|
July 1, 2016
Oct 24, 2016
Dec 1, 2016
March 7, 2017
Feb 27, 2018
July 9, 2018
Jan 10, 2019
|
|
Peter Liabotis, NEO
|
350,000
200,000
200,000
350,000
550,000
150,000
500,000
|
July 1, 2011
Oct 24, 2011
Dec 1, 2011
March 7, 2012
Feb 27, 2013
July 9, 2013
Jan 10, 2014
|
None.
None.
None.
None.
None.
None.
None.
|
0.30
0.20
0.21
0.28
0.21
0.11
0.18
|
0
0
0
0
0
3,000
0
|
July 1, 2016
Oct 24, 2016
Dec 1, 2016
March 7, 2017
Feb 27, 2018
July 9, 2018
Jan 10, 2019
|
|
Robin Borley, NEO
|
125,000
75,000
300,000
|
March 7, 2012
Feb 27, 2013
Jan 10, 2014
|
None.
None.
None.
|
0.28
0.21
0.18
|
0
0
0
|
March 7, 2017
Feb 27, 2018
Jan 10, 2019
|
|
Brent Nykoliation, NEO
|
450,000
200,000
200,000
350,000
700,000
175,000
75,000
400,000
|
July 1, 2011
Oct 24, 2011
Dec 1, 2011
March 7, 2012
Feb 27, 2013
July 9, 2013
Sept 19, 2013
Jan 10, 2014
|
None.
None.
None.
None.
None.
None.
None.
None.
|
0.30
0.20
0.21
0.28
0.21
0.11
0.15
0.18
|
0
0
0
0
0
3,500
0
0
|
July 1, 2016
Oct 24, 2016
Dec 1, 2016
March 7, 2017
Feb 27, 2018
July 9, 2018
Sept 19, 2018
Jan 10, 2019
|
|
Quentin Yarie, Director
|
300,000
50,000
150,000
300,000
300,000
100,000
50,000
425,000
|
July 1, 2011
Oct 24, 2011
Dec 1, 2011
March 7, 2012
Feb 27, 2013
July 9, 2013
Sept 19, 2013
Jan 10, 2014
|
None.
None.
None.
None.
None.
None.
None.
None.
|
0.30
0.20
0.21
0.28
0.21
0.11
0.15
0.18
|
0
0
0
0
0
2,000
0
0
|
July 1, 2016
Oct 24, 2016
Dec 1, 2016
March 7, 2017
Feb 27, 2018
July 9, 2018
Sept 19, 2018
Jan 10, 2019
|
|
V. Peter Harder, Director
|
225,000
25,000
75,000
100,000
275,000
25,000
250,000
250,000
|
July 1, 2011
Oct 24, 2011
Dec 1, 2011
March 7, 2012
Feb 27, 2013
July 9, 2013
Oct 9, 2013
Jan 10, 2014
|
None.
None.
None.
None.
None.
None.
None.
None.
|
0.30
0.20
0.21
0.28
0.21
0.11
0.13
0.18
|
0
0
0
0
0
500
0
0
|
July 1, 2016
Oct 24, 2016
Dec 1, 2016
March 7, 2017
Feb 27, 2018
July 9, 2018
Oct 9, 2018
Jan 10, 2019
|
|
John Sanderson, Director
|
125,000
50,000
50,000
100,000
100,000
25,000
50,000
400,000
|
July 1, 2011
Oct 24, 2011
Dec 1, 2011
March 7, 2012
Feb 27, 2013
July 9, 2013
Sept 19, 2013
Jan 10, 2014
|
None.
None.
None.
None.
None.
None.
None.
None.
|
0.30
0.20
0.21
0.28
0.21
0.11
0.15
0.18
|
0
0
0
0
0
500
0
0
|
July 1, 2016
Oct 24, 2016
Dec 1, 2016
March 7, 2017
Feb 27, 2018
July 9, 2018
Sept 19, 2018
Jan 10, 2019
|
|
Johann de Bruin, Director
|
200,000
100,000
125,000
|
March 7, 2012
Feb 27, 2013
Jan 10, 2014
|
None.
None.
None.
|
0.28
0.21
0.18
|
0
0
0
|
March 7, 2017
Feb 27, 2018
Jan 10, 2019
|
|
Albert A. Thiess, Jr., Director
|
180,000
100,000
25,000
125,000
|
May 23, 2012
Feb 27, 2013
July 9, 2013
Jan 10, 2014
|
None.
None.
None.
None.
|
0.23
0.21
0.11
0.18
|
0
0
500
0
|
May 23, 2017
Feb 27, 2018
July 9, 2018
Jan 10, 2019
|
|
Kirk McKinnon, Former NEO
|
675,000
575,000
650,000
1,420,000
975,000
800,000
170,000
225,000
|
July 1, 2011
Oct 24, 2011
Dec 1, 2011
March 7, 2012
July 13, 2012
Feb 27, 2013
July 9, 2013
Sept 19, 2013
|
None.
None.
None.
None.
None.
None.
None.
None.
|
0.30
0.20
0.21
0.28
0.29
0.21
0.11
0.15
|
0
0
0
0
0
0
3,400
0
|
July 1, 2016
Oct 24, 2016
Dec 1, 2016
March 7, 2017
July 13, 2017
Feb 27, 2018
July 9, 2018
Sept 19, 2018
|
*Based on a closing price of $0.13 on June 30, 2014 and presuming all options are exercised.
45
|
Option Awards as of June 30, 2014
|
|||||
|
Name
|
No. of Shares of Common Stock Underlying Unexercised
Common Stock Purchase Options Exercisable (#)
|
Date of Grant
|
Additional Consideration to be Received Upon Exercise or Material Conditions required to Exercise
|
Option Exercise Price ($)
|
Option Expiration Date
|
|
Current Named Executive Officers, as a group on June 30, 2014 (5 persons): Richard Schler**; Craig Scherba, Peter Liabotis, Robin Borley, Brent Nykoliation.
|
1,750,000
825,000
800,000
2,565,000
675,000
2,725,000
65,000
275,000
2,175,000
|
July 1, 2011
Oct 24, 2011
Dec 1, 2011
March 7, 2012
July 13, 2012
Feb 27, 2013
July 9, 2013
Sept 19, 2013
Jan 10, 2014
|
None.
None.
None.
None.
None.
None.
None.
None.
None.
|
0.30
0.20
0.21
0.28
0.29
0.21
0.11
0.15
0.18
|
July 1, 2016
Oct 24, 2016
Dec 1, 2016
March 7, 2017
July 13, 2017
Feb 27, 2018
July 9, 2018
Sept 19, 2018
Jan 10, 2019
|
|
Total NEO’s on June 30, 2014, as a group (5 persons)
|
12,465,000
|
||||
|
All current Directors who are not NEO’s or executive officers as a group on June 30, 2014 (5 persons) - V. Peter Harder, John Sanderson, Johann de Bruin, Albert A. Thiess, Jr., Quentin Yarie.
|
650,000
125,000
275,000
700,000
180,000
875,000
175,000
100,000
250,000
1,325,000
|
July 1, 2011
Oct 24, 2011
Dec 1, 2011
March 7, 2012
May 23, 2012
Feb 27, 2013
July 9, 2013
Sept 19, 2013
Oct 9, 2013
Jan 10, 2014
|
None.
None.
None.
None.
None.
None.
None.
None.
None.
None.
|
0.30
0.20
0.21
0.28
0.23
0.21
0.11
0.15
0.13
0.18
|
July 1, 2016
Oct 24, 2016
Dec 1, 2016
March 7, 2017
May 23, 2017
Feb 27, 2018
July 9, 2018
Sept 19, 2018
Oct 9, 2018
Jan 10, 2019
|
|
Total all current Directors who are not NEO’s or executive officers as a group on June 30, 2014 (5 persons)
|
4,655,000
|
||||
|
All Directors (8 persons) - V. Peter Harder, John Sanderson, Richard Schler, Craig Scherba, Robin Borley, Johann de Bruin, Albert A. Thiess, Jr., Quentin Yarie.
|
1,600,000
550,000
675,000
2,565,000
675,000
180,000
2,350,000
525,000
300,000
250,000
2,600,000
|
July 1, 2011
Oct 24, 2011
Dec 1, 2011
March 7, 2012
July 13, 2012
May 23, 2012
Feb 27, 2013
July 9, 2013
Sept 19, 2013
Oct 9, 2013
Jan 10, 2014
|
None.
None.
None.
None.
None.
None.
None.
None.
None.
None.
None.
|
0.30
0.20
0.21
0.28
0.29
0.23
0.21
0.11
0.15
0.13
0.18
|
July 1, 2016
Oct 24, 2016
Dec 1, 2016
March 7, 2017
July 13, 2017
May 23, 2017
Feb 27, 2018
July 9, 2018
Sept 19, 2018
Oct 9, 2018
Jan 10, 2019
|
|
Total All nominees for Directors on June 30, 2014 (8 persons)
|
12,270,000
|
||||
|
All employees (excluding all Named Executive Officers as they also serve as executive officers and/or directors), plus Kirk McKinnon, Former NEO as a group.
|
900,000
640,000
685,000
1,810,000
975,000
1,275,000
230,000
300,000
550,000
|
July 1, 2011
Oct 24, 2011
Dec 1, 2011
March 7, 2012
July 13, 2012
Feb 27, 2013
July 9, 2013
Sept 19, 2013
Jan 10, 2014
|
None.
None.
None.
None.
None.
None.
None.
None.
None.
|
0.30
0.20
0.21
0.28
0.29
0.21
0.11
0.15
0.18
|
July 1, 2016
Oct 24, 2016
Dec 1, 2016
March 7, 2017
July 13, 2017
Feb 27, 2018
July 9, 2018
Sept 19, 2018
Jan 10, 2019
|
|
Total employees (excluding all NEO’s as they serve as executive officers) as a group on June 30, 2014
|
7,365,000
|
||||
|
Outstanding Options - all parties
|
3,700,000
1,800,000
2,240,000
5,850,000
1,695,000
180,000
5,875,000
1,255,000
750,000
250,000
4,625,000
250,000
|
July 1, 2011
Oct 24, 2011
Dec 1, 2011
March 7, 2012
July 13, 2012
May 23, 2012
Feb 27, 2013
July 9, 2013
Sept 19, 2013
Oct 9, 2013
Jan 10, 2014
Feb 6, 2014
|
None.
None.
None.
None.
None.
None.
None.
None.
None.
None.
None.
None.
|
0.30
0.20
0.21
0.28
0.29
0.23
0.21
0.11
0.15
0.13
0.18
0.18
|
July 1, 2016
Oct 24, 2016
Dec 1, 2016
March 7, 2017
July 13, 2017
May 23, 2017
Feb 27, 2018
July 9, 2018
Sept 19, 2018
Oct 9, 2018
Jan 10, 2019
Feb 6, 2019
|
|
Total Options as of June 30, 2014 (all parties)
|
33,070,000
|
||||
* Mr. McKinnon resigned as Chief Executive Officer and Chairman of the Board of Directors on September 12, 2013.
** Mr. Schler was appointed Chief Executive Officer on September 19, 2013.
46
In addition, please note the following:
|
·
|
There are no associates of any such directors, executive officers, or nominees to that have or are to receive options or any other person who received or is to receive 5 percent of such options, warrants or rights
|
|
·
|
All of the stock options in the above noted table are convertible into common stock.
|
|
·
|
The exercise price of all of the stock options noted above were based on the closing price the date before the granting of the stock option.
|
|
·
|
There are no cashless or other provisions aside from the right for the holder of the stock option to exercise.
|
|
·
|
All NEO’s provide the Company services on an ongoing basis.
|
|
·
|
Messrs Harder, Sanderson, de Bruin, Yarie and Thiess provide director services on an ongoing basis.
|
ITEM 12. SECURITY OWNERSHIP OF CERTAIN BENEFITICAL OWNERS AND MANAGEMENT AND RELATED STOCKHOLDER MATTERS
Security Ownership of Certain Beneficial Owners and Management and Related Stockholder Matters
The following table sets forth certain information regarding beneficial ownership of our common shares as of September 19, 2014, by: (i) each person who is known by the Company to own beneficially more than 5% of our common shares; (ii) each director of the Company; (iii) each of the Named Executive Officers; and (iv) all directors and executive officers of the Company as a group.
The number and percentage of shares beneficially owned is determined in accordance with Rule 13d-3 under the Exchange Act, and the information is not necessarily indicative of beneficial ownership for any other purpose. The Company believes that each individual or entity named has sole investment and voting power with respect to the securities indicated as beneficially owned by them, subject to community property laws, where applicable, except where otherwise noted. The “Number of Common Shares Beneficially Owned” in calculated based on total shares held plus warrants held (plus stock options entitled to exercise). The aggregate of these items, which totals 343,701,331, will be used as the denominator for the percentage calculation below.
|
Name and Address of Beneficial Owner
|
Number of Common Shares Beneficially Owned
|
Percentage of Outstanding Common Shares Beneficially Owned(1)
|
|
V. Peter Harder, Chairman of the Board, Director
5538 Pattapiece Crescent
Manotick, Ontario, Canada (2) (13) (14)
|
1,825,000
|
0.5%
|
|
John Sanderson, Vice-Chairman of the Board & Director
1721 – 27th Street
West Vancouver, BC, Canada (3) (13) (14)
|
1,350,000
|
0.4%
|
|
Richard Schler, Chief Executive Officer & Director
80 Greybeaver Trail
Toronto, Ontario, Canada (4) (14)**
|
10,395,000
|
3.0%
|
|
Craig Scherba, President, COO & Director
1480 Willowdown Road,
Oakville, Ontario, Canada (5) (13) (14)
|
3,730,000
|
1.1%
|
|
Robin Borley, SVP Mine Development & Director
Waterfall Country Estate,
Gauteng, South Africa (6) (14)
|
300,000
|
0.1%
|
|
Peter Liabotis, Chief Financial Officer & SVP
2261 Rockingham Drive,
Oakville, Ontario, Canada (7) (14)
|
3,581,000
|
1.0%
|
|
Quentin Yarie, Director
196 McAllister Road
North York, Ontario (8) (14)
|
3,000,000
|
0.9%
|
|
Johann de Bruin, Director
1283 Dunwoodie Ave
Pretoria, South Africa (9) (14)
|
425,000
|
0.1%
|
|
Albert A. Thiess, Jr., Director
8 Lawson’s Pond Court
Bluffton, SC, USA (10) (13) (14)
|
530,000
|
0.2%
|
|
Brent Nykoliation, SVP
161 Fallingbrook Road
Toronto, Ontario, Canada (11) (14)
|
4,525,000
|
1.3%
|
|
Kirk McKinnon, Former Chairman, CEO & Director
46 Ferndale Crescent
Brampton, Ontario, Canada (12) (14)*
|
10,727,000
|
3.1%
|
|
All directors and executive officers as a group
(11 persons)
|
40,388,000
|
11.7%
|
* Mr. McKinnon resigned as Chief Executive Officer and Chairman of the Board of Directors on September 12, 2013.
** Mr. Schler was appointed Chief Executive Officer on September 19, 2013.
47
Sources – www.sedi.ca, U.S. regulatory filings, internal schedules and the Company’s registered shareholder list.
(1) Denominator used for calculation is 343,701,332. Based on total issued and outstanding common shares of 269,198,956 plus warrants outstanding of 41,438,376 plus common stock purchase options outstanding of 33,070,000 as of September 19, 2014.
(2) Total includes 350,000 common shares and 1,475,000 common stock purchase options exercisable between $0.11 and $0.30 per share with expiry dates between July 1, 2016 and July 3, 2019.
(3) Total includes 250,000 common shares and 1,100,000 common stock purchase options exercisable between $0.11 and $0.30 per share with expiry dates between July 1, 2016 and July 3, 2019.
(4) Total include items held by “Sarmat Resources Inc.”, a related company, plus certain family members holdings. Includes 4,460,000 common shares, 300,000 common share purchase warrants and 5,635,000 common stock purchase options exercisable between $0.11 and $0.30 per share with expiry dates between July 1, 2016 and July 3, 2019.
(5) Total includes 600,000 common shares, 300,000 common share purchase warrants and 2,830,000 common stock purchase options exercisable between $0.11 and $0.30 per share with expiry dates between July 1, 2016 and July 3, 2019.
(6) Total includes 300,000 common stock purchase options exercisable between $0.21 and $0.28 per share with expiry dates between March 7, 2017 and January 10, 2019.
(7) Total includes 731,000 common shares, 300,000 common share purchase warrants and 2,550,000 common stock purchase options exercisable between $0.11 and $0.30 per share with expiry dates between July 1, 2016 and July 3, 2019.
(8) Total includes 825,000 common shares, 250,000 common share purchase warrants and 1,925,000 common stock purchase options exercisable between $0.11 and $0.30 per share with expiry dates between July 1, 2016 and July 3, 2019.
(9) Total includes 425,000 common stock purchase options exercisable between $0.21 and $0.28 per share with expiry dates between March 7, 2017 and January 10, 2019.
(10) Total includes 100,000 common shares and 430,000 common stock purchase options exercisable between $0.11 and $0.23 per share with expiry dates between May 23, 2017 and January 10, 2019.
(11) Total includes 1,275,000 common shares, 300,000 common share purchase warrants and 2,950,000 common stock purchase options exercisable between $0.11 and $0.395 per share with expiry dates between July 1, 2016 and July 3, 2019.
(12) Total include items held by “Badger Resources Inc.”, a related company plus certain family members holdings. Includes 4,087,000 common shares and 6,640,000 common stock purchase options exercisable between $0.11 and $0.30 per share with expiry dates between July 1, 2016 and July 3, 2019.
(13) Members of the Audit Committee.
(14) Parties whose shareholdings are a part of the total of “All directors and executive officers as a group (11 persons)”.
Changes in Control
We are not aware of any arrangements that may result in a change in control of the Company.
Description of Capital Structure
General
Our authorized capital stock consists of 450,000,000 shares of common stock, par value $ 0.001.
Common Stock
The shares of our common stock presently outstanding, and any shares of our common stock issues upon exercise of common stock purchase options and/or warrants, will be fully paid and non-assessable. Each holder of common stock is entitled to one vote for each share owned on all matters voted upon by shareholders, and a majority vote is required for all actions to be taken by shareholders. In the event we liquidate, dissolve or wind-up our operations, the holders of the common stock are entitled to share equally and ratably in our assets, if any, remaining after the payment of all our debts and liabilities and the liquidation preference of any shares of preferred stock that may then be outstanding. The common stock has no preemptive rights, no cumulative voting rights, and no redemption, sinking fund, or conversion provisions. Holders of common stock are entitled to receive dividends, if and when declared by the Board of Directors, out of funds legally available for such purpose, subject to the dividend and liquidation rights of any preferred stock that may then be outstanding.
48
Voting Rights
Each holder of Common Stock is entitled to one vote for each share of Common Stock held on all matters submitted to a vote of stockholders.
Dividends
Subject to preferences that may be applicable to any then-outstanding securities with greater rights, if any, and any other restrictions, holders of Common Stock are entitled to receive ratably those dividends, if any, as may be declared from time to time by the Company’s board of directors out of legally available funds. The Company and its predecessors have not declared any dividends in the past and does not presently contemplate that there will be any future payment of any dividends on Common Stock.
ITEM 13. CERTAIN RELATIONSHIPS AND RELATED TRANSACTIONS, AND DIRECTOR INDEPENDENCE
Except as noted under the section entitled “Executive Compensation” and below, none of the following parties, has any material interest, direct or indirect, in any transaction with us or in any presently proposed transaction with us that has or will materially affect us: (1) any of our directors or officers; (2) any person proposed as a nominee for election as a director; (3) any person who beneficially owns, directly or indirectly, shares carrying more than 10% of the voting rights attached to our outstanding shares of common stock; (4) any of our promoters; and (5) any relative or spouse of any of the foregoing persons who has the same house as such person.
Parties are related if one party has the ability, directly or indirectly, to control the other party or exercise significant influence over the other party in making operating and financial decisions. Parties are also related if they are subject to common control or common significant influence. Related parties may be individuals or corporate entities. A transaction is considered to be a related party transaction when there is a transfer of resources or obligations between related parties. Related party transactions that are in the normal course of business and have commercial substance are measured at the exchange amount. The following directors were independent under the independence standards of both the Toronto Stock Exchange and the NYSE Amex during the past fiscal year: Albert A. Thiess, Jr., V. Peter Harder and John Sanderson.
Given the size of the Company, the only formal committee in place is an audit committee. The following independent directors serve on the audit committee: Albert A. Thiess, Jr. (Chair), V. Peter Harder and John Sanderson.
The following are the related party transactions of our Company for the year ended June 30, 2014:
|
a)
|
The Company incurred a total of $112,200 (June 30, 2013: $119,495) in office administration and rent expense from a public company related by common management, Red Pine Exploration Inc (TSX.V: "RPX"). (Source: www.sedi.ca as of September 4, 2014).
|
|
Name
|
Title at Energizer
|
Title at Red Pine
|
Shares Held in RPX
|
% Ownership of RPX
|
|
Richard Schler**
|
Director, CEO
|
Director, CEO
|
7,291,000
|
2.9%
|
|
Craig Scherba
|
Director, President & COO
|
SVP - Chief Geologist
|
1,590,000
|
0.6%
|
|
Peter Liabotis
|
CFO
|
CFO
|
2,270,000
|
0.9%
|
|
Brent Nykoliation
|
Senior VP
|
Director
|
1,870,952
|
0.8%
|
|
Kirk McKinnon*
|
Former Director, CEO & Chairman
|
Former Director, CEO & Chairman
|
7,587,500
|
3.0%
|
|
Total
|
20,609,452
|
8.2%
|
|
* Mr. McKinnon resigned as Chief Executive Officer and Chairman of the Board of Directors on September 12, 2013.
|
|
** Mr. Schler was appointed Chief Executive Officer on September 19, 2013.
|
49
|
b)
|
5,370,000 (June 30, 2013: 5,975,000) stock options were issued to related parties during the period with exercise prices between $0.11 and $0.18 (June 30, 2013: between $0.21 and $0.29). These stock options were valued at $513,364 (June 30, 2013: $1,178,813) using the Black-Scholes pricing model and were issued to directors and officers of the Company and included in stock-based compensation.
|
|
Date of Grant
|
09-Jul-13
|
19-Sep-13
|
09-Oct-13
|
10-Jan-14
|
|
|
Expiry Date
|
09-Jul-18
|
19-Sep-18
|
09-Oct-18
|
10-Jan-19
|
|
|
Exercise Price
|
$0.110
|
$0.150
|
$0.130
|
$0.180
|
TOTAL
|
|
Peter Harder
|
25,000
|
-
|
250,000
|
250,000
|
525,000
|
|
John Sanderson
|
25,000
|
50,000
|
-
|
400,000
|
475,000
|
|
Richard Schler
|
170,000
|
200,000
|
-
|
475,000
|
845,000
|
|
Craig Scherba
|
180,000
|
-
|
-
|
500,000
|
680,000
|
|
Peter Liabotis
|
150,000
|
-
|
-
|
500,000
|
650,000
|
|
Robin Borley
|
-
|
-
|
-
|
300,000
|
300,000
|
|
Brent Nykoliation
|
175,000
|
75,000
|
-
|
400,000
|
650,000
|
|
Quentin Yarie
|
100,000
|
50,000
|
-
|
425,000
|
575,000
|
|
Albert Thiess
|
25,000
|
-
|
-
|
125,000
|
150,000
|
|
Johann de Bruin
|
-
|
-
|
-
|
125,000
|
125,000
|
|
Kirk McKinnon
|
170,000
|
225,000
|
-
|
395,000
|
|
|
Total
|
1,020,000
|
600,000
|
250,000
|
3,500,000
|
5,370,000
|
|
c)
|
The Company incurred $1,190,585 (June 30, 2013: $995,877) in mineral exploration, administrative, management and consulting fees to directors and officers and paid or accrued directly to directors and officers or companies under their control.
|
|
d)
|
The Company incurred $1,533,953 (June 30, 2013: $928,982) in charges from a mining and engineering firm for which one of the Company's directors serves as a senior officer and a director which was included in mineral exploration expense.
|
|
e)
|
During the year ended June 30, 2014 the Company entered into an agreement to option a 75% interest in the Sagar Property to Honey Badger Exploration Inc. (TSX-V: "TUF"), a public company related by common management (see Note 7).
|
The following are the related party balances for the year ended June 30, 2014:
|
a)
|
Related party balances of $54,764 (June 30, 2013: $42,908) were included in accounts receivable and prepaid expenses and $33,019 (June 30, 2013: $Nil) included in accounts payable and accrued liabilities.
|
|
b)
|
The Company advanced a short-term loan to RPX totaling $26,216 (June 30, 2013: $136,999). This loan is interest bearing at a rate of 3%. CAD$300,000 was originally loaned during January 2012 and represents the highest outstanding balance. CAD$285,000 has been paid back up to June 30, 2013, all against the loan's principal balance. Accrued interest totaled CAD$11,216 as at June 30, 2014. During May 2014, the Company advanced a short-term loan to MacDonald Mines Exploration Ltd. (TSX-V: "BMK") totaling CAD$50,000 (June 30, 2013: $Nil). This loan is interest bearing at a rate of 5% and no amounts have been paid back up to June 30, 2014. Accrued interest due totaled CAD$285 as at June 30, 2014. The Company has advanced a short-term loan to TUF totaling CAD$25,000 (June 30, 2013: $Nil). This loan is interest bearing at a rate of 5% and no amounts have been paid back up to June 30, 2014. Accrued interest due totaled CAD$142 as at June 30, 2014. All of the above noted loans are expected to be paid back in full within the next 12 months and totaled $94,512.
|
|
c)
|
Of the $1,533,007 (June 30, 2013: $928,982) in charges from a mining and engineering firm for which one of the Company's directors serves as a senior officer and director, $633,418 (June 30, 2013: $6,867) is included in accounts payable and accrued liabilities.
|
|
d)
|
$264,922 (June 30, 2013: $Nil) is included within accounts payable and accrued liabilities as a committed amount due to the former Chief Executive Officer of the Company.
|
50
WHERE YOU CAN FIND MORE INFORMATION
We file annual, quarterly and current reports, proxy statements and other information with the SEC. Our SEC filings are available to the public over the Internet at the website at http://www.sec.gov. The public may also read and copy any document we file with the SEC at its Public Reference Room at 100 F Street, N.E., Washington, D.C. 20549, on official business days during the hours of 10:00 am to 3:00 pm. The public may obtain information on the operation of the Public Reference Room by calling the SEC at 1-800-SEC-0330. We maintain a website at http://www.energizerresources.com, (which website is expressly not incorporated by reference into this filing). Information contained on our website is not part of this report on Form 10-K.
DISCLOSURE OF COMMISSION POSITION ON INDEMNIFICATION FOR SECURITIES ACT LIABILITIES
Minnesota corporation law provides that:
|
·
|
a corporation may indemnify any person who was or is a party or is threatened to be made a party to any threatened, pending or completed action, suit or proceeding, whether civil, criminal, administrative or investigative, except an action by or in the right of the corporation, by reason of the fact that he is or was a director, officer, employee or agent of the corporation, or is or was serving at the request of the corporation as a director, officer, employee or agent of another corporation, partnership, joint venture, trust or other enterprise, against expenses, including attorneys' fees, judgments, fines and amounts paid in settlement actually and reasonably incurred by him in connection with the action, suit or proceeding if he acted in good faith and in a manner which he reasonably believed to be in or not opposed to the best interests of the corporation, and, with respect to any criminal action or proceeding, had no reasonable cause to believe his conduct was unlawful;
|
|
·
|
a corporation may indemnify any person who was or is a party or is threatened to be made a party to any threatened, pending or completed action or suit by or in the right of the corporation to procure a judgment in its favor by reason of the fact that he is or was a director, officer, employee or agent of the corporation, or is or was serving at the request of the corporation as a director, officer, employee or agent of another corporation, partnership, joint venture, trust or other enterprise against expenses, including amounts paid in settlement and attorneys' fees actually and reasonably incurred by him in connection with the defense or settlement of the action or suit if he acted in good faith and in a manner which he reasonably believed to be in or not opposed to the best interests of the corporation. Indemnification may not be made for any claim, issue or matter as to which such a person has been adjudged by a court of competent jurisdiction, after exhaustion of all appeals therefrom, to be liable to the corporation or for amounts paid in settlement to the corporation, unless and only to the extent that the court in which the action or suit was brought or other court of competent jurisdiction determines upon application that in view of all the circumstances of the case, the person is fairly and reasonably entitled to indemnity for such expenses as the court deems proper; and
|
|
·
|
to the extent that a director, officer, employee or agent of a corporation has been successful on the merits or otherwise in defense of any action, suit or proceeding, or in defense of any claim, issue or matter therein, the corporation shall indemnify him against expenses, including attorneys' fees, actually and reasonably incurred by him in connection with the defense.
|
Our articles of incorporation require us to indemnify our directors and officers against all damages incurred in connection with our business to the fullest extent provided or allowed by law.
Our bylaws provide that we will advance all expenses incurred to any person who was or is a party or is threatened to be made a party to any threatened, pending or completed action, suite or proceeding, whether civil, criminal, administrative or investigative, by reason of the fact that he is or was our director or officer, or is or was serving at our request as a director or executive officer of another company, partnership, joint venture, trust or other enterprise, prior to the final disposition of the proceeding, promptly following request. This advancement of expenses is to be made upon receipt of an undertaking by or on behalf of such person to repay said amounts should it be ultimately determined that the person was not entitled to be indemnified under our bylaws or otherwise.
51
Our bylaws also provide that no advance shall be made by us to any officer in any action, suit or proceeding, whether civil, criminal, administrative or investigative, if a determination is reasonably and promptly made: (a) by the board of directors by a majority vote of a quorum consisting of directors who were not parties to the proceeding; or (b) if such quorum is not obtainable, or, even if obtainable, a quorum of disinterested directors so directs, by independent legal counsel in a written opinion, that the facts known to the decision-making party at the time such determination is made demonstrate clearly and convincingly that such person acted in bad faith or in a manner that such person did not believe to be in or not opposed to our best interests.
Insofar as indemnification for liabilities arising under the Securities Act may be permitted to our directors, officers or controlling persons pursuant to the foregoing provisions, or otherwise, we have been advised that in the opinion of the Commission this indemnification is against public policy as expressed in the Securities Act and is, therefore, unenforceable.
ITEM 14. PRINCIPAL ACCOUNTING FEES AND SERVICES
Year ended June 30, 2014 and June 30, 2013
Audit Fees: The aggregate fees, including expenses, billed by the Company’s principal accountant in connection with the audit of our financial statements for the most recent fiscal year and for the review of our financial information included in our Annual Report on Form 10-K; and our quarterly reports on Form 10-Q during the fiscal year ending June 30, 2014 was CAD$69,960 (June 30, 2013: CAD$68,160).
Audit Related Fees: The aggregate fees, including expenses, billed by the Company’s principal accountant for services reasonably related to the audit for the year ended June 30, 2013 were CAD$7,500 (June 30, 2013: CAD$5,000).
All Other Fees: The aggregate fees, including expenses, billed for all other services rendered to the Company by its principal accountant during year ended June 30, 2014 was $Nil (June 30, 2013: $Nil).
Auditor Independence and Auditor’s Time on Task
Our Board of Directors considers that the work done for us in the year ended June 30, 2014 by our company’s auditors, MNP LLP (the surviving firm of our auditors, formerly MSCM LLP Chartered Accountants) is compatible with maintaining MNP LLP. All of the work expended by MNP LLP on our June 30, 2014 audit was attributed to work performed MNP LLP’s full-time, permanent employees.
52
ITEM 15. EXHIBITS AND FINANCIAL STATEMENT SCHEDULES
Exhibit Number & Description
|
3.1
|
Articles of Incorporation of Uranium Star Corp. (now known as Energizer Resources Inc.) (Incorporated by reference to Exhibit 3.1 to the registrant’s current report on Form 8-K as filed with the SEC on May 20, 2008)
|
|
3.2
|
Articles of Amendment to Articles of Incorporation of Uranium Star Corp. changing its name to Energizer Resources Inc. (Incorporated by reference to Exhibit 3.1 to the registrant’s current report on Form 8-K filed with the SEC on July 16, 2010)
|
|
3.3
|
Amended and Restated By-Laws of Energizer Resources Inc. (Incorporated by reference to Exhibit 3.2 to the registrant’s current report on Form 8-K as filed with the SEC on July 16, 2010)
|
|
3.4
|
Amendment to the By-Laws of Energizer Resources Inc. (Incorporated by reference to the registrant’s current report on Form 8-K as filed with the SEC on October 16, 2013)
|
|
4.1
|
Amended and Restated 2006 Stock Option Plan of Energizer Resources, Inc. (as of February 2009) (Incorporated by reference to Exhibit 4.1 to the registrant's Form S-8 registration statement as filed with the SEC on February 19, 2010)
|
|
4.2
|
Form of broker Subscription Agreement for Units (Canadian and Offshore Subscribers) (Incorporated by reference to Exhibit 4.1 to the registrant’s current report on Form 8-K as filed with the SEC on March 19, 2010)
|
|
4.3
|
Form of standard Subscription Agreement for Units (Canadian and Offshore Subscribers) (Incorporated by reference to Exhibit 4.2 to the registrant’s current report on Form 8-K as filed with the SEC on March 19, 2010)
|
|
4.4
|
Form of Warrant to Purchase common shares (Incorporated by reference to Exhibit 4.3 to the registrant’s current report on Form 8-K as filed with the SEC on March 19, 2010)
|
|
4.5
|
Form of Class A broker warrant to Purchase common shares (Incorporated by reference to Exhibit 4.4 to the registrant’s current report on Form 8-K as filed with the SEC on March 19, 2010)
|
|
4.6
|
Form of Class B broker warrant to Purchase common shares (Incorporated by reference to Exhibit 4.5 to the registrant’s current report on Form 8-K as filed with the SEC on March 19, 2010)
|
|
4.7
|
Agency Agreement, dated March 15, 2010, between Energizer Resources, Clarus Securities Inc. and Byron Securities Limited (Incorporated by reference to Exhibit 4.6 to the registrant’s current report on Form 8-K filed with the SEC on March 19, 2010)
|
|
4.8
|
Form of Warrant relating to private placement completed during November 2012.
|
|
4.9
|
Agency Agreement relating to private placement completed during November 2012.
|
|
4.10.
|
Amended and Restated Stock Option Plan of Energizer Resources, Inc. (Incorporated by reference to the registrant’s current report on Form 8-K as filed with the SEC on October 16, 2013)
|
|
10.1
|
Property Agreement effective May 14, 2004 between Thornton J. Donaldson and Thornton J. Donaldson, Trustee for Yukon Resources Corp. (Incorporated by reference to Exhibit 10.1 to the registrant's Form SB-2 registration statement as filed with the SEC on September 14, 2004)
|
|
10.2
|
Letter of Intent dated March 10, 2006 with Apofas Ltd. (Incorporated by reference to Exhibit 99.1 to the registrant's current report on Form 8-K as filed with the SEC on March 13, 2006)
|
|
10.3
|
Letter agreement effective May 12, 2006 between Yukon Resources Corp. and Virginia Mines Inc. (Incorporated by reference to Exhibit 99.1 to the registrant's current report on Form 8-K filed as with the SEC on May 9, 2006)
|
|
10.4
|
Joint Venture Agreement dated August 22, 2007 between Uranium Star Corp. & Madagascar Minerals and Resources Sarl (Incorporated by reference to Exhibit 10.1 to the registrant's Form 8-K as filed with SEC on September 11, 2007)
|
|
10.5
|
Share Purchase Agreement between Madagascar Minerals and Resources Sarl and THB Venture Limited (a subsidiary of Energizer Resources Inc.) dated July 9, 2009 (Incorporated by reference to Exhibit 10.5 to the registrant’s Form 10-K/A as filed on April 8, 2013)
|
|
10.6
|
Joint Venture Agreement between Malagasy Minerals Limited and Energizer Resources Inc. dated December 14, 2011 (Incorporated by reference to Exhibit 10.6 to the registrant’s Form 10-K/A as filed on April 8, 2013).
|
|
10.7
|
Agreement to Purchase Interest In Claims between Honey Badger Exploration Inc. and Energizer Resources Inc. dated February 28, 2014.(Incorporated by reference to Exhibit 10.7 to the registrant’s Form 10-Q as filed on May 14, 2014).
|
|
10.8
|
Sale and Purchase Agreement between Malagasy Minerals Limited and Energizer Resources Inc. dated April 16, 2014 (Incorporated by reference to Exhibit 10.8 to the registrant’s Form 10-Q as filed on May 14, 2014).
|
|
10.9
|
ERG Project Minerals Rights Agreement between Malagasy Minerals Limited and Energizer Resources Inc. dated April 16, 2014 (Incorporated by reference to Exhibit 10.9 to the registrant’s Form 10-Q as filed on May 14, 2014).
|
|
10.10
|
Green Giant Project Joint Venture Agreement between Malagasy Minerals Limited and Energizer Resources Inc. dated April 16, 2014 (Incorporated by reference to Exhibit 10.9 to the registrant’s Form 10-Q as filed on May 14, 2014).
|
|
21
|
Subsidiaries of the Registrant (Incorporated by reference to Exhibit 21.1 to the registrant’s annual report on Form 10-K filed with the SEC on September 21, 2009)
|
|
99.1
|
Canadian National Instrument 43-101 Technical Report Update for Green Giant Property, Fotadrevo, Province of Toliara, Madagascar (Incorporated by reference to Exhibit 99.1 to the registrant's report on Form 8-K filed with SEC on July 9, 2010)
|
53
SIGNATURES
Pursuant to the requirements of Section 13 or 15(d) of the Securities Exchange Act of 1934 the registrant has duly caused this report to be signed on its behalf by the undersigned, thereunto duly authorized.
| ENERGIZER RESOURCES INC. | ||
| Dated: September 25, 2014 | ||
|
By:
|
/s/ Richard E. Schler | |
| Name: Richard E. Schler | ||
| Title: Chief Executive Officer and Director | ||
| Dated: September 25, 2014 | ||
|
By:
|
/s/ Peter Liabotis | |
| Name: Peter Liabotis, CPA, CA | ||
| Title: Chief Financial Officer (Principal Accounting Officer) | ||
Pursuant to the requirements of the Securities Exchange Act of 1934, this report has been signed below by the following persons in the capacities and on the dates indicated.
|
Signatures
|
Title
|
Date
|
||
|
/s/ Richard E. Schler
|
Chief Executive Officer, Director
|
September 25, 2014
|
||
|
Richard Schler
|
||||
|
/s/ Craig Scherba
|
President & Chief Operating Officer, Director
|
September 25, 2014
|
||
|
Richard Schler
|
||||
|
/s/ V. Peter Harder
|
Chairman of the Board, Director
|
September 25, 2014
|
||
|
V. Peter Harder
|
||||
|
/s/ John Sanderson
|
Vice-Chairman, Director
|
September 25, 2014
|
||
|
John Sanderson
|
||||
|
/s/ Robin Borley
|
SVP, Mine Development, Director
|
September 25, 2014
|
||
|
Robin Borley
|
||||
|
/s/ Quentin Yarie
|
Director
|
September 25, 2014
|
||
|
Quentin Yarie
|
||||
|
/s/ Johann de Bruin
|
Director
|
September 25, 2014
|
||
|
Johann de Bruin
|
||||
|
/s/ Albert A. Thiess, Jr.
|
Director
|
September 25, 2014
|
||
|
Albert A. Thiess, Jr.
|
||||
|
/s/ Peter Liabotis
|
Chief Financial Officer (Principal Accounting Officer)
|
September 25, 2014
|
||
|
Peter Liabotis
|
54
ENERGIZER RESOURCES INC.
(An Exploration Stage Company)
Consolidated Financial Statements
For the years ended June 30, 2014 and 2013
(Expressed in US Dollars)
55

Report of Independent Registered Public Accounting Firm
To the Board or Directors and Shareholders of Energizer Resources Inc.
We have audited the accompanying consolidated balance sheets of Energizer Resources Inc. as of June 30, 2014 and 2013, and the related consolidated statements of operations and comprehensive loss, stockholders' equity, and cash flows for the years then ended. Energizer Resources Inc.’s management is responsible for these consolidated financial statements. Our responsibility is to express an opinion on these consolidated financial statements based on our audits.
We conducted our audits in accordance with the standards of the Public Company Accounting Oversight Board (United States). Those standards require that we plan and perform the audit to obtain reasonable assurance about whether the financial statements are free of material misstatement. Energizer Resources Inc. is not required to have, nor were we engaged to perform, an audit of its internal control over financial reporting. Our audit included consideration of internal control over financial reporting as a basis for designing audit procedures that are appropriate in the circumstances, but not for the purpose of expressing an opinion on the effectiveness of Energizer Resources Inc.’s internal control over financial reporting. Accordingly, we express no such opinion. An audit also includes examining, on a test basis, evidence supporting the amounts and disclosures in the consolidated financial statements, assessing the accounting principles used and significant estimates made by management, as well as evaluating the overall financial statement presentation. We believe that our audits provide a reasonable basis for our opinion.
In our opinion, the consolidated financial statements referred to above present fairly, in all material respects, the financial position of Energizer Resources Inc. as of June 30, 2014 and 2013, and the results of its operations and its cash flows for the years then ended in conformity with accounting principles generally accepted in the United States of America.
The accompanying consolidated financial statements have been prepared assuming the Company will continue as a going concern. As discussed in Note 1, the Company has experienced negative cash flows from operations since inception and has accumulated a significant deficit which raises substantial doubt about its ability to continue as a going concern. Management’s plans regarding these matters are also described in Note 1. The consolidated financial statements do not include any adjustments that might result from the outcome of this uncertainty.
 |
|
| Chartered Professional Accountants | |
| Licensed Public Accountants |
Toronto, Canada
September 25, 2014
56
Energizer Resources Inc.
Consolidated Balance Sheets
(Expressed in US Dollars)
|
June 30, 2014
|
June 30, 2013
|
|||||||
|
Assets
|
||||||||
|
Current Assets:
|
||||||||
|
Cash and cash equivalents
|
$ | 1,250,383 | $ | 825,100 | ||||
|
Amounts receivable and prepaid expenses (note 4)
|
430,596 | 209,520 | ||||||
|
Loan to related parties (note 4)
|
94,512 | 136,999 | ||||||
|
Marketable securities (note 5)
|
70,277 | 10,000 | ||||||
|
Total current assets
|
1,845,768 | 1,181,619 | ||||||
|
Equipment (note 6)
|
126,385 | 38,817 | ||||||
|
Total assets
|
$ | 1,972,153 | $ | 1,220,436 | ||||
|
Liabilities and Stockholders' Equity
|
||||||||
|
Liabilities
|
||||||||
|
Current Liabilities:
|
||||||||
|
Accounts payable and accrued liabilities (note 4)
|
$ | 1,816,623 | $ | 803,130 | ||||
|
Deferred premium on flow-through shares (note 8)
|
37,145 | - | ||||||
|
Warrant liability (note 11)
|
1,830,151 | - | ||||||
|
Total liabilities
|
3,683,919 | 803,130 | ||||||
|
Stockholders' Equity
|
||||||||
|
Common stock, 450,000,000 shares authorized, $0.001 par value,
|
||||||||
|
268,627,603 issued and outstanding (June 30, 2013 -
|
||||||||
|
175,604,320) (note 9)
|
268,627 | 175,604 | ||||||
|
Additional paid-in capital
|
84,265,060 | 75,378,192 | ||||||
|
Accumulated comprehensive loss
|
8,771 | (62,849 | ) | |||||
|
Accumulated deficit
|
(86,254,224 | ) | (75,073,641 | ) | ||||
|
Total stockholders' equity
|
(1,711,766 | ) | 417,306 | |||||
|
Total liabilities and stockholders' equity
|
$ | 1,972,153 | $ | 1,220,436 | ||||
The accompanying notes are an integral part of these consolidated financial statements.
Going concern (note 1)
Mineral Properties (note 7)
Commitments (note 14)
Subsequent Events (note
16)
57
Energizer Resources Inc.
Consolidated Statements of Operations and Comprehensive Loss
(Expressed in US Dollars)
|
Year Ended
|
Year Ended
|
|||||||
|
June 30, 2014
|
June 30, 2013
|
|||||||
|
Revenues
|
$ | - | $ | - | ||||
|
Expenses
|
||||||||
|
Mineral exploration expense (note 4, 7 and 15)
|
7,343,541 | 3,720,735 | ||||||
|
Stock-based compensation (notes 4, 9 and 10)
|
681,419 | 1,470,678 | ||||||
|
General and administrative (note 4)
|
1,357,682 | 1,348,641 | ||||||
|
Professional and consulting fees (note 4)
|
1,765,769 | 1,663,965 | ||||||
|
Depreciation (note 6)
|
44,446 | 21,616 | ||||||
|
Foreign currency translation loss / (gain)
|
60,076 | (93,395 | ) | |||||
|
Total expenses
|
11,252,933 | 8,132,240 | ||||||
|
Net loss from operations
|
(11,252,933 | ) | (8,132,240 | ) | ||||
|
Other Income
|
||||||||
|
Investment income
|
96,092 | 307,992 | ||||||
|
Sale of flow-through tax benefits
|
63,393 | - | ||||||
|
Impairment of marketable securities (note 5)
|
(63,849 | ) | - | |||||
|
Change in fair value of warrant liability (note 11)
|
(23,286 | ) | - | |||||
|
Net Loss
|
(11,180,583 | ) | (7,824,248 | ) | ||||
|
Unrealized gain/(loss) from investments in marketable securities
|
7,771 | (10,513 | ) | |||||
|
Recognition of other than temporary loss (note 5)
|
63,849 | - | ||||||
|
Comprehensive loss
|
$ | (11,108,963 | ) | $ | (7,834,761 | ) | ||
|
Loss per share - basic and diluted (note 13)
|
$ | (0.05 | ) | $ | (0.05 | ) | ||
|
Weighted average shares outstanding - basic and diluted (note 13)
|
225,907,700 | 164,458,880 | ||||||
The accompanying notes are an integral part of these consolidated financial statements.
58
Energizer Resources Inc.
Consolidated Statements of Cash Flows
(Expressed in US Dollars)
|
Year Ended
June 30, 2014 |
Year Ended
June 30, 2013 |
|||||||
|
Operating Activities
|
||||||||
|
Net loss
|
$ | (11,180,583 | ) | $ | (7,824,248 | ) | ||
|
Adjustments to reconcile net loss to net cash used in operating activities:
|
||||||||
|
Depreciation
|
44,446 | 21,616 | ||||||
|
Gain on sale of marketable securities
|
(4,545 | ) | - | |||||
|
Change in fair value of warrant liability
|
23,286 | - | ||||||
|
Non-cash amounts within mineral properties expense
|
1,110,101 | - | ||||||
|
Stock-based compensation
|
681,419 | 1,470,678 | ||||||
|
Impairment of marketable securities
|
63,849 | - | ||||||
|
Sale of flow-through tax benefits
|
(63,393 | ) | - | |||||
|
Change in operating assets and liabilities:
|
||||||||
|
Amounts receivable and prepaid expenses
|
(221,076 | ) | 228,356 | |||||
|
Accounts payable and accrued liabilities
|
1,013,493 | (843,556 | ) | |||||
|
Non-cash portion of marketable securities
|
- | 29 | ||||||
|
Net cash used in operating activities
|
(8,533,003 | ) | (6,947,125 | ) | ||||
|
Financing Activities
|
||||||||
|
Proceeds from issuance of common stock, net of costs
|
9,559,926 | 4,076,133 | ||||||
|
Exercise of warrants and stock options
|
- | 105,000 | ||||||
|
Net cash provided by financing activities
|
9,559,926 | 4,181,133 | ||||||
|
Investing Activities
|
||||||||
|
Mineral property acquisition costs
|
(463,774 | ) | - | |||||
|
Purchase of property and equipment
|
(132,014 | ) | (9,809 | ) | ||||
|
Loan to related party
|
42,487 | 121,417 | ||||||
|
Purchases of marketable securities, net of sales
|
(103,763 | ) | - | |||||
|
Proceeds on sale of marketable securities
|
55,424 | - | ||||||
|
Net cash (used in) provided by investing activities
|
(601,640 | ) | 111,608 | |||||
|
Increase (decrease) in cash and cash equivalents
|
425,283 | (2,654,384 | ) | |||||
|
Cash and cash equivalents - beginning of year
|
825,100 | 3,479,484 | ||||||
|
Cash and cash equivalents - end of year
|
$ | 1,250,383 | $ | 825,100 | ||||
|
Non-cash investing and financing activities:
|
||||||||
|
Issuance of common stock for mineral properties
|
$ | 645,950 | $ | - | ||||
|
Supplemental Disclosures:
|
||||||||
|
Interest received
|
$ | 8,327 | $ | - | ||||
|
Taxes received
|
$ | - | $ | 9,441 | ||||
The accompanying notes are an integral part of these consolidated financial statements.
59
Energizer Resources Inc.
Consolidated Statement of Stockholders' Equity
(Expressed in US Dollars)
|
Additional
|
Accumulated
|
|||||||||||||||||||||||
|
Paid-In
|
Comprehensive
|
Accumulated
|
||||||||||||||||||||||
|
Shares
#
|
Amount
$
|
Capital
$
|
Income (loss)
$
|
Deficit
$
|
Total
$
|
|||||||||||||||||||
|
Balance - June 30, 2012
|
156,747,178 | 156,747 | 69,745,238 | (52,336 | ) | (67,249,393 | ) | 2,600,256 | ||||||||||||||||
|
Private placement common shares subscribed
|
18,157,142 | 18,157 | 4,321,378 | - | - | 4,339,535 | ||||||||||||||||||
|
Cost of issue
|
- | - | (263,402 | ) | - | - | (263,402 | ) | ||||||||||||||||
|
Exercise of stock options
|
700,000 | 700 | 104,300 | - | - | 105,000 | ||||||||||||||||||
|
Stock-based compensation
|
- | - | 1,470,678 | - | - | 1,470,678 | ||||||||||||||||||
|
Accumulated comprehensive loss
|
- | - | - | (10,513 | ) | - | (10,513 | ) | ||||||||||||||||
|
Net loss for the year
|
- | - | - | - | (7,824,248 | ) | (7,824,248 | ) | ||||||||||||||||
|
Balance - June 30, 2013
|
175,604,320 | 175,604 | 75,378,192 | (62,849 | ) | (75,073,641 | ) | 417,306 | ||||||||||||||||
|
Private placement common shares subscribed
|
90,523,283 | 90,523 | 10,337,961 | - | - | 10,428,484 | ||||||||||||||||||
|
Cost of issue
|
- | - | (868,558 | ) | - | - | (868,558 | |||||||||||||||||
|
Fair value of warrant liability
|
- | - | (1,806,866 | ) | - | - | (1,806,866 | |||||||||||||||||
|
Issuance of common stock and warrants for mineral property
|
2,500,000 | 2,500 | 643,450 | - | - | 645,950 | ||||||||||||||||||
|
Stock-based compensation
|
- | - | 681,419 | - | - | 681,419 | ||||||||||||||||||
|
Deferred flow-through premium
|
- | - | (100,538 | ) | - | - | (100,538 | ) | ||||||||||||||||
|
Other than temporary loss on marketable securities
|
- | - | - | 63,849 | - | 63,849 | ||||||||||||||||||
|
Accumulated comprehensive loss
|
- | - | - | 7,771 | - | 7,771 | ||||||||||||||||||
|
Net loss for the year
|
- | - | - | - | (11,180,583 | ) | (11,180,583 | ) | ||||||||||||||||
|
Balance - June 30, 2014
|
268,627,603 | 268,627 | 84,265,060 | 8,771 | (86,254,224 | ) | (1,711,766 | ) | ||||||||||||||||
The accompanying notes are an integral part of these consolidated financial statements.
60
Energizer Resources Inc.
Notes to Consolidated Financial Statements
June 30, 2014 and 2013
(Expressed in US Dollars)
1. Nature of Operations and Going Concern
Energizer Resources Inc. (the "Company") was incorporated in the State of Nevada, United States of America on March 1, 2004 and reincorporated in the State of Minnesota on May 14, 2008. The Company's fiscal year end is June 30. The Company's principal business is the acquisition and exploration of mineral resources. During fiscal 2008, the Company incorporated Energizer Resources (Mauritius) Ltd., a Mauritius subsidiary and Energizer Resources Madagascar Sarl, a Madagascar subsidiary. During fiscal 2009, the Company incorporated THB Venture Ltd., a Mauritius subsidiary to hold the interest in Energizer Resources Minerals Sarl, a Madagascar subsidiary, which holds the Green Giant Property in Madagascar (see note 7). During fiscal 2012, the Company incorporated Madagascar-ERG Joint Venture (Mauritius) Ltd., a Mauritius subsidiary and ERG (Madagascar) Sarl, a Madagascar subsidiary. ERG (Madagascar) Sarl is 100% owned by Madagascar-ERG Joint Venture (Mauritius) Ltd. which is now owned 100% by Energizer Resources (Mauritius) Ltd. ERG (Madagascar) Sarl holds the Malagasy Joint Venture Ground (see note 7). During fiscal 2014, the Company incorporated 2391938 Ontario Inc. an Ontario, Canada subsidiary. In addition, the Company owns a 25% interest in Ampanihy Exploration Ltd, a Mauritius company who holds a 100% interest in Ampex Sarl, a Madagascar company. Ampex Sarl holds the non-industrial mineral rights on certain Green Giant permits (see note 7). The Company has not yet fully determined whether its properties contain mineral reserves that are economically recoverable.
These consolidated financial statements have been prepared on a going concern basis, which assumes that the Company will continue to realize its assets and discharge its liabilities in the normal course of business. The Company has yet to generate revenue from mining operations or pay dividends and is unlikely to do so in the immediate or foreseeable future. The continuation of the Company as a going concern is dependent upon the continued financial support from its shareholders, the ability of the Company to obtain necessary equity or debt financing to continue operations, the Company's ability to attract joint venture partners and off-take contracts and the attainment of profitable operations. As of June 30, 2014, the Company has accumulated losses of $86,254,224. As such, there is substantial doubt regarding the Company's ability to continue as a going concern. These consolidated financial statements do not include any adjustments to the recoverability and classification of recorded asset amounts and classification of liabilities that might be necessary should the Company be unable to continue as a going concern.
2. Significant Accounting Policies
Principals of Consolidation and Basis of Presentation
These consolidated financial statements are presented in accordance with accounting principles generally accepted in the United States ("U.S. GAAP"), and are expressed in United States dollars. These consolidated financial statements include the accounts of Energizer Resources Inc. and its wholly-owned subsidiaries, Energizer Resources (Mauritius) Ltd., THB Ventures Ltd., Energizer Resources Madagascar Sarl, Energizer Resources Minerals Sarl, Madagascar-ERG Joint Venture (Mauritius) Ltd, ERG (Madagascar) Sarl and 2391938 Ontario Inc. These consolidated financial statements also include our proportionate share interest of 25% in Ampanihy Exploration Ltd and Ampex Sarl. All inter-company balances and transactions have been eliminated on consolidation.
Use of Estimates
The preparation of these consolidated financial statements requires management to make estimates and assumptions that affect the reported amounts of assets and liabilities and disclosure of contingent assets and liabilities at the date of these consolidated financial statements and the reported amounts of revenues and expenses during the period. On an ongoing basis, management evaluates its judgments and estimates in relation to assets, liabilities, revenue and expenses. Management uses past experience and other factors as the basis for its judgments and estimates. Actual results may differ from those estimates. The impacts of estimates are pervasive throughout these consolidated financial statements, and may require accounting adjustments based on future occurrences. Revisions to accounting estimates are recognized in the period in which the estimate is revised and the revision affects current and future periods. Areas where significant estimates and assumptions are used include: the Binomial valuation of the warrant liability, the Black-Scholes valuation of warrants and stock options issued, the valuation recorded for future income taxes and the assumption that the Company will receive title to the properties after the Madagascar political situation stabilizes.
61
Energizer Resources Inc.
(An Exploration Stage Company)
Notes to Consolidated Financial Statements
June 30, 2014 and 2013
(Expressed in US Dollars)
2. Significant Accounting Policies - continued
Cash and Cash Equivalents
Cash and cash equivalents include money market investments that are readily convertible to known amounts of cash and have an original maturity of less than or equal to 90 days.
Marketable Securities
The Company classifies and accounts for debt and equity securities in accordance with ASC Topic - 320, "Accounting for Certain Investments in Debt and Equity Securities". The Company has classified all of its marketable securities as available-for-sale, thus securities are recorded at fair market value and any associated unrealized gain or loss, net of tax, are included as a separate component of stockholders’ equity, titled accumulated comprehensive loss. When an unrealized loss is classified as being other than temporary, it is expensed within the statement of operations and comprehensive loss.
Equipment
Equipment is recorded at cost, less accumulated depreciation, and consists of exploration equipment. Depreciation is computed on a straight-line basis over 3 years, which coincides with its estimated useful life..
Mineral Property Costs
Mineral property acquisition and exploration costs are expensed as incurred. The Company has not yet realized any revenues from its mineral operations. When it has been determined that a mineral property can be economically developed as a result of establishing probable and proven reserves, the costs then incurred to develop such property will be capitalized. Such costs will be amortized using the units of production method over the estimated life of the probable reserve. If properties are abandoned or the carrying value is determined to be in excess of possible future recoverable amounts the Company will write off the appropriate amount.
Warrant Liability
The Company accounts for its derivative instruments not indexed to its stock as either assets or liabilities and carries them at fair value. Derivatives that are not defined as hedges must be adjusted to fair value through earnings. The Company has issued stock purchase warrants with exercise prices denominated in a currency other than its functional currency of U.S. dollars. As a result, these warrants were no longer considered to be solely indexed to the Company's common stock. Therefore, these warrants are classified as liabilities under the caption "warrant liability" and recorded at estimated fair value at each reporting date, computed using the Binomial valuation method. Changes in the liability from period to period are recorded in the statements of operations under the caption "changes in fair value of warrant liability. The Company elected to record the change in fair value of the warrant liability as a component of other income and expense on the statement of operations as it is believed the amounts recorded relate to financing activities and not as a result of our operations.
Comprehensive Income / (Loss)
ASC Topic - 220, "Reporting Comprehensive Income", establishes standards for the reporting and display of comprehensive income, its components and accumulated balances. As at June 30, 2014, the Company's only component of other comprehensive income is unrealized losses on marketable securities.
Foreign Currency Translation
The Company's functional and reporting currency is United States Dollars. Monetary assets and liabilities denominated in foreign currencies are translated in accordance with ASC Topic - 830, "Foreign Currency Translation", using the exchange rate prevailing at the balance sheet date. Gains and losses arising on settlement of foreign currency denominated transactions or balances are included in the consolidated statements of operations and comprehensive loss.
62
Energizer Resources Inc.
(An Exploration Stage Company)
Notes to Consolidated Financial Statements
June 30, 2014 and 2013
(Expressed in US Dollars)
2. Significant Accounting Policies - continued
Basic and Diluted Net Income / (Loss) Per Share
The Company computes net earnings / (loss) per share in accordance with ASC Topic - 260, "Earnings per Share". ASC Topic - 260 requires presentation of basic and diluted earnings per share ("EPS") on the consolidated statement of operations and comprehensive loss. Basic EPS is computed by dividing net income / (loss) (numerator) by the weighted average number of shares outstanding (denominator) during the year. Diluted EPS gives effect to all dilutive potential common shares outstanding during the year using the treasury stock method and the "if converted" method for convertible instruments. In computing diluted EPS, the average stock price for the year is used in determining the number of shares assumed to be purchased from the exercise of stock options or warrants. Diluted EPS excludes all dilutive potential shares if their effect is anti-dilutive. Diluted EPS and the weighted average number of common shares exclude all dilutive potential shares since their effect is anti-dilutive.
Stock-Based Compensation
The Company has a stock option plan as described in note 10. All stock-based awards granted, including those granted to directors not acting in their capacity as directors, are accounted for using the fair value based method, using more reliable measure of value of services and Black-Scholes pricing model. The fair value of stock options granted is recognized as an expense within the consolidated statements of operations and comprehensive loss and a corresponding increase in additional paid-in capital. Any consideration paid by eligible participants on the exercise of stock options is credited to common stock. The additional paid-in capital amount associated with stock options is transferred to common stock upon exercise.
Income Taxes
The Company has adopted Topic - 740 "Accounting for Income Taxes" and therefore is required to compute tax asset benefits for net operating losses carried forward. Potential benefits of net operating losses have not been recognized in these consolidated financial statements as the Company cannot be assured it is more likely than not it will utilize the net operating losses carried forward in future years.
Management does not believe unrecognized tax benefits will significantly change within one year of the balance sheet date. Interest and penalties related to income tax matters are recognized in income tax expense. As of June 30, 2014, there was no accrued interest or penalties related to uncertain tax positions.
Flow-through shares
The Company has financed a portion of its exploration activities through the issuance of flow-through shares. Flow-through shares are a Canadian income tax incentive. Under the terms of the flow-through share agreements, the tax attributes of the related exploration expenditures are renounced by the Company to the benefit of flow-through share subscribers. Proceeds from the issuance of flow-through shares are allocated between the offering of shares and the sale of tax benefits. An allocation is made based on the difference between the quoted price of the existing shares and the amount that the investor paid for the shares. A liability is recognized for this difference. The liability is reduced and a reduction of the premium liability is recorded as other income as eligible expenditures are incurred and when the Company files the appropriate renunciation forms with Canadian tax authorities.
Asset Retirement Obligations
The operations of the Company are subject to regulations governing the environment, including future site restoration for mineral properties. The Company will recognize the fair value of a liability for an asset retirement obligation in the period in which it is incurred and when a reasonable estimate of fair value can be made. If a reasonable estimate of fair value cannot be made in the period the asset retirement is incurred, the liability is recognized when a reasonable estimate of fair value can be made. The Company has determined that there are no asset retirement obligations or any other environmental obligations currently existing with respect to its mineral properties and therefore no liability has been recognized.
63
Energizer Resources Inc.
(An Exploration Stage Company)
Notes to Consolidated Financial Statements
June 30, 2014 and 2013
(Expressed in US Dollars)
2. Significant Accounting Policies - continued
Long Lived Assets
In accordance with the ASC Topic - 360, "Accounting for Impairment or Disposal of Long Lived Assets", the carrying value of intangible assets and other long-lived assets is reviewed on a regular basis for the existence of facts or circumstances that may suggest impairment. The Company recognizes impairment when the sum of the expected undiscounted future cash flows is less than the carrying amount of the asset. Impairment losses, if any, are measured as the excess of the carrying amount of the asset over its estimated fair value.
Government Grants
The Company makes periodic applications for financial assistance under available government incentive programs and tax credits related to the mineral property expenditures. The Company recognizes government assistance on an accrual basis when all requirements to earn the assistance have been completed and receipt is reasonably assured. Government grants are recognized on the balance sheet and accrued as a reduction of mineral exploration expenses. Government grants relating to mineral expenditures are reflected as a reduction to mineral properties expense on the consolidated statement of operations and comprehensive income.
Financial Instruments
The fair value of cash and cash equivalents, amounts receivable, marketable securities, loan to related parties and accounts payable and accrued liabilities were estimated to approximate their carrying values due to the immediate or short-term maturity of these financial instruments. The Company's exploration operations are in Madagascar and Canada, which result in exposure to market risks from changes in foreign currency rates. Financial risk is the risk to the Company's operations that arise from movements in foreign exchange rates and the degree of volatility of these rates.
Fair Value of Financial Instruments Hierarchy
ASC Topic - 820 establishes a fair value hierarchy that prioritizes the inputs used to measure fair value. The hierarchy gives the highest priority to unadjusted quoted prices in active markets for identical assets or liabilities (Level 1) and the lowest priority to unobservable inputs (Level 3). Cash and cash equivalents and marketable securities were in Level 1 within the fair value hierarchy. The three levels are as follows:
Level 1 - Quoted prices are available in active markets for identical assets or liabilities as of the reporting date. Active markets are those in which transactions for the asset or liability occur in sufficient frequency and volume to provide pricing information on an ongoing basis. Level 1 includes marketable securities such as listed equities and U.S. government treasury securities.
Level 2 - Pricing inputs are other than quoted prices in active markets included in Level 1, which are either directly or indirectly observable as of the reporting date. Level 2 includes those financial instruments that are valued using industry-standard models or other valuation methodologies. These models consider various assumptions, including quoted forward prices for commodities, time value, volatility factors, current market and contractual prices for the underlying instruments as well as other relevant economic measures. Substantially all of these assumptions are observable in the marketplace throughout the term of the instrument, can be derived from observable data or are supported by observable levels at which transactions are executed in the marketplace. Instruments in this category include dual currency deposits, over the counter forwards, options and repurchase agreements.
Level 3 - Pricing inputs include significant inputs that are generally less observable from objective sources. These inputs may be used with internally developed methodologies that result in management's best estimate of fair value from the perspective of a market participant. Level 3 instruments include those that may be more structured or otherwise tailored to customers' needs. At each balance sheet date, the Company performs an analysis of all instruments subject to ASC Topic - 820 and includes in Level 3 all of those whose fair value is based on significant unobservable inputs.
Comparative Figures
Certain June 30, 2013 figures have been reclassified to conform to the current year's consolidated financial statement presentation.
64
Energizer Resources Inc.
(An Exploration Stage Company)
Notes to Consolidated Financial Statements
June 30, 2014 and 2013
(Expressed in US Dollars)
3. Recent Accounting Pronouncements Potentially Affecting The Company
The following are recent FASB accounting pronouncements, which may have an impact on the Company's future consolidated financial statements.
|
-
|
"Income Taxes (ASC Topic 740): Presentation of an Unrecognized Tax Benefit when a Net Operating Loss Carry-forward, a Similar Tax Loss, or a Tax Credit Carry-forward Exists" ("ASU 2013-11") was issued during July 2013. FASB issued guidance on how to present an unrecognized tax benefit. The guidance is effective for annual periods beginning after December 15, 2014.
|
|
-
|
"Development Stage Entities (ASC Topic 915): Elimination of Certain Financial Reporting Requirements, Including an Amendment to Variable Interest Entities Guidance in Topic 810, Consolidation" ("ASU 2014-10") was issued during June 2014. FASB issued guidance to improve financial reporting by reducing the cost and complexity associated with the incremental reporting requirements for development stage entities. This guidance is effective for annual periods beginning after December 15, 2014 with early adoption allowed.
|
|
-
|
"Presentation of Financial Statements Going Concern (ASC Topic 205-40): Disclosure of Uncertainties about an Entity’s Ability to Continue as a Going Concern ("ASU 2014-15") was issued during August 2014. FASB issued guidance on how to account for and disclose going concern risks. This guidance is effective for annual periods beginning after December 15, 2016.
|
The Company is currently evaluating the impact of ASC Topic 740 and ASC Topic 205-40 FASB accounting pronouncements. The Company has elected to adopt the provisions of ASC 2014-10 into these consolidated financial statements. The adoption of ASC 2014-10 did not have a significant impact on the Company's results of operations, financial performance or cash flows.
4. Related Party Transactions and Balances
Parties are related if one party has the ability, directly or indirectly, to control the other party or exercise significant influence over the other party in making operating and financial decisions. Parties are also related if they are subject to common control or common significant influence. Related parties may be individuals or corporate entities. A transaction is considered to be a related party transaction when there is a transfer of resources or obligations between related parties. Related party transactions that are in the normal course of business and have commercial substance are measured at the exchange amount, which is fair value.
The following are the related party transactions as at the year ended June 30, 2014:
|
a)
|
The Company incurred a total of $112,200 (June 30, 2013: $119,495) in office administration and rent expense from a public company related by common management, Red Pine Exploration Inc. (TSX.V: "RPX").
|
|
b)
|
5,370,000 (June 30, 2013: 5,975,000) stock options were issued to related parties during the period with exercise prices between $0.11 and $0.18 (June 30, 2013: between $0.21 and $0.29). These stock options were valued at $513,364 (June 30, 2013: $1,178,813) using the Black-Scholes pricing model and were issued to directors and officers of the Company and included in stock-based compensation.
|
|
c)
|
The Company incurred $1,190,585 (June 30, 2013: $995,877) in mineral exploration, administrative, management and consulting fees to directors and officers and paid or accrued directly to directors and officers or companies under their control.
|
|
d)
|
The Company incurred $1,533,953 (June 30, 2013: $928,982) in charges from a mining and engineering firm for which one of the Company's directors serves as a senior officer and a director which was included in mineral exploration expense.
|
|
e)
|
During the year ended June 30, 2014 the Company entered into an agreement to option a 75% interest in the Sagar Property to Honey Badger Exploration Inc. (TSX-V: "TUF"), a public company related by common management (see Note 7).
|
65
Energizer Resources Inc.
(An Exploration Stage Company)
Notes to Consolidated Financial Statements
June 30, 2014 and 2013
(Expressed in US Dollars)
4. Related Party Transactions and Balances - continued
The following are the related party balances for the year ended June 30, 2014:
|
a)
|
Related party balances of $54,764 (June 30, 2013: $42,908) were included in accounts receivable and prepaid expenses and $33,019 (June 30, 2013: $Nil) included in accounts payable and accrued liabilities.
|
|
b)
|
The Company advanced a short-term loan to RPX totaling $26,216 (June 30, 2013: $136,999). This loan is interest bearing at a rate of 3%. CAD$300,000 was originally loaned during January 2012 and represents the highest outstanding balance. CAD$285,000 has been paid back up to June 30, 2013, all against the loan's principal balance. Accrued interest totaled CAD$11,216 as at June 30, 2014. During May 2014, the Company advanced a short-term loan to MacDonald Mines Exploration Ltd. (TSX-V: "BMK") totaling CAD$50,000 (June 30, 2013: $Nil). This loan is interest bearing at a rate of 5% and no amounts have been paid back up to June 30, 2014. Accrued interest due totaled CAD$285 as at June 30, 2014. The Company has advanced a short-term loan to TUF totaling CAD$25,000 (June 30, 2013: $Nil). This loan is interest bearing at a rate of 5% and no amounts have been paid back up to June 30, 2014. Accrued interest due totaled CAD$142 as at June 30, 2014. All of the above noted loans are expected to be paid back in full within the next 12 months and totaled $94,512.
|
|
c)
|
Of the $1,533,007 (June 30, 2013: $928,982) in charges from a mining and engineering firm for which one of the Company's directors serves as a senior officer and director, $633,418 (June 30, 2013: $6,867) is included in accounts payable and accrued liabilities.
|
|
d)
|
$264,922 (June 30, 2013: $Nil) is included within accounts payable and accrued liabilities as a committed amount due to the former Chief Executive Officer of the Company.
|
5. Marketable Securities
Marketable securities consist of available-for-sale securities over which the Company does not have significant influence or control. $70,277 (June 30, 2013: $10,000) is invested in TSX-Venture listed entities. During year ended June 30, 2014, the Company determined that $63,849 of unrealized losses were other than temporary and as such were recognized as an "other expense" in net loss and removed from accumulated other comprehensive income.
6. Equipment
|
Accumulated
|
June 30, 2014
|
June 30, 2013
|
||||||||||||||
|
|
Cost
|
Depreciation
|
Net Book Value
|
Net Book Value
|
||||||||||||
|
Exploration equipment
|
$ | 195,561 | $ | 69,176 | $ | 126,385 | $ | 38,817 | ||||||||
For the year ended June 30, 2014, depreciation expense totaled $44,446 (June 30, 2013: $21,616). For the year ended June 30, 2014, the Company purchased exploration equipment totalling $132,014 (June 30, 2013: $9,809).
66
Energizer Resources Inc.
(An Exploration Stage Company)
Notes to Consolidated Financial Statements
June 30, 2014 and 2013
(Expressed in US Dollars)
7. Mineral Properties
Molo Graphite Project, Southern Madagascar, Africa
On December 14, 2011, the Company entered into a Definitive Joint Venture Agreement ("JVA") with Malagasy Minerals Limited ("Malagasy"), a public company on the Australian Stock Exchange, to acquire a 75% interest to explore and develop a group of industrial minerals, including graphite, vanadium and approximately 25 other minerals. The land position covers 2,119 permits and 827.7 square kilometres and is mostly adjacent to the south and east of the Company's 100% owned Green Giant Property. The Company paid $2,261,690 and issued 7,500,000 common shares valued at $1,350,000.
On April 16, 2014, the Company signed a Sale and Purchase Agreement and a Mineral Rights Agreement with Malagasy to acquire the remaining 25% interest. The Company made the following payments: $364,480 (CAD$400,000); issued 2,500,000 common shares subject to a 12 month voluntary vesting period and valued at $325,000; and issued 3,500,000 common share purchase warrants, valued at $320,950 using the Black-Scholes pricing model with an exercise price of $0.14 and an expiry date of April 15, 2019. The Company is required to make a cash payment of $655,922 (CAD$700,000) and issue 1,000,000 common shares within five days of completion of a bankable feasibility study (“BFS”) for the Molo Graphite Project or the formal announcement of a decision to mine; and a cash payment of $937,032 (CAD$1,000,000) within five days of the commencement of commercial production. Malagasy retains a 1.5% net smelter return royalty ("NSR"). The Company also acquired a 100% interest to the industrial mineral rights on approximately 1-1/2 additional claim blocks comprising 10,811 hectares immediately to the east and adjoining the Molo Graphite Project.
Green Giant Property, Southern Madagascar, Africa
During 2007 to acquire a 75% interest in the property, the Company paid $765,000, issued 2,500,000 common shares and 1,000,000 now expired common share purchase warrants to enter into a joint venture agreement for the Green Giant Property with Madagascar Minerals and Resources Sarl ("MMR").
On July 9, 2009, the Company acquired the remaining 25% interest for $100,000. MMR retains a 2% NSR. The NSR can be purchased, at the Company's option, for $500,000 in cash or common shares for the first 1% and at a price of $1,000,000 in cash or common shares for the second 1%.
On April 16, 2014, the Company signed a Joint Venture Agreement with Malagasy, whereby Malagasy acquired a 75% interest for non-industrial minerals on the Company's 100% owned Green Giant Property in Madagascar. The Company retains the remaining 25% and has a free carried interest through the BFS. No specific consideration was received for this transaction as it was part of the Molo Graphite Project transaction dated April 16, 2014.
Sagar Property - Romanet Horst, Labrador Trough, Quebec, Canada
During 2006, the Company purchased from Virginia Mines Inc. ("Virginia") a 100% interest in 382 claims located in northern Quebec, Canada. Virginia retains a 2% NSR on certain claims within this property with other unrelated vendors holding a 1% NSR on certain claims, and a 0.5% NSR on other claims. For the other vendor's NSR, the Company has the right to buy back half of the 1% NSR for $200,000 and half of the 0.5% NSR for $100,000.
On February 28, 2014, the Company signed an agreement to sell an interest in the Sagar property to TUF, a public company related by common management. On July 31, 2014, the Company revised the terms of this agreement. Under the revised agreement, in order for TUF to acquire an initial 35% interest in the property, the Company will receive CAD$150,000 and TUF will spend CAD$1,500,000 developing the property. TUF can earn further percentage interests up to 75% over a four year period by spending a total of CAD$9,000,000, paying the Company CAD$900,000 and issuing to the Company the lesser of 15% of its issued and outstanding shares or 35,000,000 shares. Once these commitments have been met, TUF can acquire the remaining interest by paying the Company an additional CAD$2,000,000 and issuing the lesser of 19.5% of TUF outstanding shares or up to 60,000,000 shares, including all previously issued shares.
67
Energizer Resources Inc.
(An Exploration Stage Company)
Notes to Consolidated Financial Statements
June 30, 2014 and 2013
(Expressed in US Dollars)
8. Deferred Premium on Flow-Through Shares
The premium paid for flow-through shares in excess of the market value of the shares without a flow-through feature is initially recognized as a liability. The liability is subsequently reduced and recorded in the consolidated statement of comprehensive loss on a pro-rata basis based on the corresponding eligible flow-through expenditures that have been incurred. The following summarizes the deferred premium liability on flow-through transactions for the year ended June 30, 2014.
|
Deferred premium on flow-through shares, beginning of year
|
$ | - | ||
|
Recognized on issuance of flow-through shares
|
100,538 | |||
|
Recorded to consolidated statement of comprehensive loss
|
(63,393 | ) | ||
|
Deferred premium on flow-through shares, end of year
|
$ | 37,145 |
9. Common Stock and Additional Paid-in Capital
|
a)
|
During July 2012, the Company issued 700,000 shares of common stock for consideration of $105,000. The shares were issued pursuant to the exercise of stock options.
|
|
b)
|
On July 13, 2012, the Company issued 1,695,000 stock options to directors, officers and consultants of the Company at an exercise price of $0.29. The stock options were valued at $411,038 using the Black-Scholes pricing model with the following assumptions: risk free interest rate - 1.25%; expected volatility - 138%; dividend yield - NIL; and expected life - 4 years. These stock options vested on the grant date.
|
|
c)
|
During November 2012, the Company closed a brokered and non-brokered private placement raising a total of $2,032,500. The Company issued 5,807,142 common stock at $0.35 per share and 2,903,571 common share purchase warrants at an exercise of $0.50 and an expiry date 24 months from the date of issue. In addition, the Company paid a fee of $119,010 and issued 340,028 compensation warrants. Each compensation warrant entitles the holder to purchase one common share at $0.35 and one half of one common share purchase warrant at an exercise price of $0.50.
|
|
d)
|
On February 27, 2013, the Company issued 5,900,000 stock options to directors, officers and consultants at an exercise price of $0.21. The stock options were valued at $1,059,640 using the Black-Scholes pricing model with the following assumptions: risk free interest rate - 1.40%; expected volatility - 129%; dividend yield - NIL; and expected life - 5 years. These stock options vested on the grant date.
|
|
e)
|
During March 2013, the Company closed a private placement raising a total of $2,307,035 (CAD$2,358,000). The Company issued 12,350,000 common stock at prices between $0.18 and $0.20 per share. In addition, the Company paid a fee of $84,176 (CAD$86,000) and issued 270,000 compensation warrants. Each compensation warrant entitles the holder to purchase one common share at CAD$0.20.
|
|
f)
|
On July 9, 2013, the Company issued 1,255,000 stock options to directors, officers and consultants at an exercise price of $0.11. The stock options were valued at $117,594 using the Black-Scholes pricing model with the following assumptions: risk free interest rate - 1.25%; expected volatility - 128%; dividend yield - NIL; and expected life - 5 years. These stock options vested on the grant date.
|
68
Energizer Resources Inc.
(An Exploration Stage Company)
Notes to Consolidated Financial Statements
June 30, 2014 and 2013
(Expressed in US Dollars)
9. Common Stock and Additional Paid-in Capital - continued
|
g)
|
Between July 26, 2013 and August 1, 2013, the Company closed a private placement raising $813,212 (CAD$837,500) and $1,230,000. The Company issued 16,950,001 common stock at prices of CAD$0.125 and $0.12 per share. The Company paid a fee of $120,674 and issued 402,000 compensation warrants at an exercise price of CAD$0.125 and 150,000 compensation warrants at an exercise price of $0.12. Each compensation warrant expires one year from the date of issue.
|
|
h)
|
On September 19, 2013, the Company issued 750,000 stock options to directors, officers and consultants at an exercise price of $0.15. The stock options were valued at $96,675 using the Black-Scholes pricing model with the following assumptions: risk free interest rate - 1.25%; expected volatility - 127%; dividend yield - NIL; and expected life - 5 years. These stock options vested on the grant date.
|
|
i)
|
On October 9, 2013, the Company issued 250,000 stock options to a director of the Company at an exercise of $0.13 and an expiry date of October 9, 2018. The stock options were valued at $27,550 using the Black-Scholes pricing model with the following assumptions: risk free interest rate - 1.25%; expected volatility - 126%; dividend yield - NIL; and expected life - 5 years. These stock options vested on the grant date.
|
|
j)
|
On December 18, 2013 the Company closed a private placement raising a total of $1,479,024 (CAD$1,566,490). The Company issued 11,189,215 common shares at a price of CAD$0.14. The Company paid fees of $98,176 and issued 671,353 compensation warrants at an exercise price of CAD$0.14. Each compensation warrant expires eighteen months from the date of issue.
|
|
k)
|
On January 10, 2014, the Company issued 4,625,000 stock options to directors and officers of the Company at an exercise of $0.18 and an expiry date of January 10, 2019. The stock options were valued at $413,475 using the Black-Scholes pricing model with the following assumptions: risk free interest rate - 1.50%; expected volatility - 110%; dividend yield - NIL; and expected life - 5 years. These stock options vested on the grant date.
|
|
l)
|
On January 15, 2014 and January 31, 2014, the Company closed a private placement raising a total of $6,906,008 (CAD$7,486,088). The Company issued 62,384,067 common shares at a price of CAD$0.12 and 31,192,033 common share purchase warrants with an exercise price of CAD$0.18. Of the 31,192,033 common share purchase warrants, 29,152,033 expire on January 14, 2017, 1,450,000 expire on June 14, 2015 and 590,000 expire on January 31, 2017. The Company paid fees, including commissions, legal fees and TSX fees of $649,707 and issued 3,396,744 compensation warrants at an exercise price of CAD$0.14. Each compensation warrant expires eighteen months from the date of issue.
|
|
m)
|
On February 6, 2014, the Company issued 250,000 stock options to a consultant of the Company at an exercise of $0.18 and an expiry date of February 6, 2019. The stock options were valued at $26,125 using the Black-Scholes pricing model with the following assumptions: risk free interest rate - 1.50%; expected volatility - 107%; dividend yield - NIL; and expected life - 5 years. These stock options vested on the grant date.
|
|
n)
|
On June 23, 2014, the Company issued 2,500,000 shares of common stock to Malagasy valued at $0.13 per share for total consideration of $325,000 and 3,500,000 common share purchase warrants valued at $320,950 using the Black-Scholes pricing model, with an exercise price of $0.122 and an expiry date of April 15, 2019 for the remaining 25% interest in the Molo Graphite Project. The Black-Scholes assumptions used were as follows: risk free interest rate - 1.53%; expected volatility - 105%; dividend yield - NIL; and expected life - 5 years.
|
69
Energizer Resources Inc.
(An Exploration Stage Company)
Notes to Consolidated Financial Statements
June 30, 2014 and 2013
(Expressed in US Dollars)
10. Stock Options
On March 9, 2006, the Company filed a Form S-8 registration statement in connection with its newly adopted 2006 Stock Option Plan (the "2006 Plan") allowing for the direct award of shares or granting of stock options to acquire up to a total of 2,000,000 common shares. On December 18, 2006, February 16, 2007, July 11, 2007, September 29, 2009, May 3, 2011, March 1, 2012, February 27, 2013, and December 23, 2013, the 2006 Plan was amended to increase the stock option pool by a total of 35,500,000 additional common shares.
The following is a continuity schedule of the Company's stock options, all of which vest on the grant date:
|
Number of
Stock Options |
Weighted-Average
Exercise Price ($) |
|||||||
|
Outstanding and exercisable, June 30, 2012
|
23,690,000 | 0.29 | ||||||
|
Issued
|
7,595,000 | 0.23 | ||||||
|
Exercised
|
(700,000 | ) | 0.15 | |||||
|
Expired
|
(1,695,000 | ) | 0.15 | |||||
|
Cancelled
|
(1,750,000 | ) | 0.32 | |||||
|
Outstanding and exercisable, June 30, 2013
|
27,140,000 | 0.28 | ||||||
|
Issued
|
7,130,000 | 0.16 | ||||||
|
Expired
|
(5,600,000 | ) | 0.39 | |||||
|
Cancelled
|
(200,000 | ) | 0.26 | |||||
|
Outstanding and exercisable, June 30, 2014
|
28,470,000 | 0.23 | ||||||
The following is a summary stock options outstanding as of June 30, 2014:
|
Exercise
|
Number of
|
Expiry
|
|||||||
|
Price ($)
|
Stock Options
|
Date
|
|||||||
| 0.30 | 3,700,000 |
July 1, 2016
|
|||||||
| 0.29 | 1,695,000 |
July 13, 2016
|
|||||||
| 0.20 | 1,800,000 |
October 24, 2016
|
|||||||
| 0.21 | 2,240,000 |
December 1, 2016
|
|||||||
| 0.28 | 5,850,000 |
March 7, 2017
|
|||||||
| 0.23 | 180,000 |
May 23, 2017
|
|||||||
| 0.21 | 5,875,000 |
February 27, 2018
|
|||||||
| 0.11 | 1,255,000 |
July 9, 2018
|
|||||||
| 0.15 | 750,000 |
September 19, 2018
|
|||||||
| 0.13 | 250,000 |
October 9, 2018
|
|||||||
| 0.18 | 4,625,000 |
January 10, 2019
|
|||||||
| 0.18 | 250,000 |
February 6, 2019
|
|||||||
| 28,470,000 | |||||||||
70
Energizer Resources Inc.
(An Exploration Stage Company)
Notes to Consolidated Financial Statements
June 30, 2014 and 2013
(Expressed in US Dollars)
11. Warrants
The following is a continuity schedule of the Company's common share purchase warrants:
|
Number
|
Exercise
|
|||||||
|
of Warrants
|
Price ($)
|
|||||||
|
Outstanding and exercisable, June 30, 2012
|
43,619,695 | 0.55 | ||||||
|
Issued
|
3,513,599 | 0.46 | ||||||
|
Expired
|
(43,619,695 | ) | 0.55 | |||||
|
Outstanding and exercisable, June 30, 2013
|
3,513,599 | 0.46 | ||||||
|
Issued
|
39,312,130 | 0.16 | * | |||||
|
Expired
|
(270,000 | ) | 0.19 | |||||
|
Outstanding and exercisable, June 30, 2014
|
42,555,729 | 0.16 | * | |||||
* Amount represents the converted USD exercise price
The following is a summary common share purchase warrants outstanding as of June 30, 2014:
|
Exercise
|
Number of
|
Expiry
|
|||||||
|
Price ($)
|
Warrants
|
Date
|
|||||||
| 0.12 | (a) | 402,000 |
July 26, 2014
|
||||||
| 0.12 | 150,000 |
August 1, 2014
|
|||||||
| 0.35 | 340,028 |
November 15, 2014
|
|||||||
| 0.13 | (b) | 671,353 |
June 19, 2015
|
||||||
| 0.13 | (b) | 3,396,744 |
July 14, 2015
|
||||||
| 0.17 | (c) | 1,450,000 |
July 14, 2015
|
||||||
| 0.18 | (d) | 2,903,571 |
November 15, 2016
|
||||||
| 0.17 | (c) | 29,152,033 |
January 14, 2017
|
||||||
| 0.17 | (c) | 590,000 |
January 31, 2017
|
||||||
| 0.14 | 3,500,000 |
April 15, 2019
|
|||||||
| 42,555,729 | |||||||||
(a) The exercise price is CAD$0.125.
(b) The exercise price is CAD$0.14.
(c) The exercise price is CAD$0.18.
(d) On December 24, 2013, the Company re-priced and extended the term of the common share purchase warrants from an expiry of November 15, 2015 and an exercise price of $0.23 to November 15, 2016 and $0.18, respectively
71
Energizer Resources Inc.
(An Exploration Stage Company)
Notes to Consolidated Financial Statements
June 30, 2014 and 2013
(Expressed in US Dollars)
11. Warrants - continued
The Company has accounted for the warrant liability in accordance with ASC Topic 815. These warrants are considered derivative instruments as they were issued in a currency other than the Company's functional currency of the US dollar. The estimated fair value of warrants accounted for as liabilities was determined on the date of issue and market to market at each financial reporting period. The change in fair value of the warrants is recorded in the consolidated statement of operations and comprehensive loss as a gain or loss and estimated using the Binomial model with the following weighted average inputs:
|
January 2014
|
June 30, 2014
|
|||||||
|
Exercise price
|
$ | 0.131 | $ | 0.134 | ||||
|
Risk free rate
|
1.14 | % | 1.19 | % | ||||
|
Expected volatility
|
88 | % | 88 | % | ||||
|
Expected Dividend yield
|
Nil
|
Nil
|
||||||
|
Expected life (in years)
|
2.93 | 2.48 | ||||||
The fair value of the derivative warrant liability was $1,830,151 as at June 30, 2014 (2013 - $Nil). The change in the fair value of the derivative warrant liability of $23,286 was recorded as a loss in the consolidated statement of operations and comprehensive loss for the year ended June 30, 2014.
|
June 30, 2014
|
June 30, 2013
|
|||||||
|
Beginning balance, derivative warrant liability
|
$ | - | $ | - | ||||
|
Origination of derivative warrant liability January 2014
|
1,806,865 | - | ||||||
|
Loss on change in fair value of derivative warrant liability, June 30, 2014
|
23,286 | - | ||||||
|
Ending balance, derivative warrants
|
||||||||
72
Energizer Resources Inc.
(An Exploration Stage Company)
Notes to Consolidated Financial Statements
June 30, 2014 and 2013
(Expressed in US Dollars)
12. Income Taxes
A reconciliation of the statutory Canadian federal income tax provision at the statutory rate of 35% to the actual provision for income taxes is as follows:
|
June 30, 2014
|
June 30, 2013
|
|||||||
|
Net loss
|
$ | (11,180,583 | ) | $ | (7,824,248 | ) | ||
|
Rate
|
35.00 | % | 35.00 | % | ||||
|
Expected income tax recovery
|
$ | (3,913,200 | ) | $ | (2,738,490 | ) | ||
|
Tax rate changes and other adjustments
|
(798,420 | ) | 492,230 | |||||
|
Stock-based compensation
|
238,500 | 514,740 | ||||||
|
Change in tax benefits not recognized
|
4,480,270 | 1,731,520 | ||||||
|
Non-deductible expenses
|
(7,150 | ) | - | |||||
|
Income tax recovery reflected in the Consolidated Statements of Operations and Comprehensive Loss
|
$ | - | $ | - | ||||
|
The Company's income tax (recovery) is allocated as follows:
|
||||||||
|
Current tax expense
|
$ | - | $ | - | ||||
|
Future tax recovery
|
- | - | ||||||
| $ | - | $ | - | |||||
Future Income Tax Assets
The Company’s future income tax assets and liabilities as at June 30, 2014 and 2013 are as follows:
|
June 30, 2014
|
June 30, 2013
|
|||||||
|
Future Income Tax Assets
|
||||||||
|
Non-capital losses - United States
|
$ | 8,786,110 | $ | 7,619,510 | ||||
|
Exploration expenditures
|
7,813,100 | 5,293,960 | ||||||
|
Other deductible temporary differences
|
10,900 | 12,110 | ||||||
| 16,610,110 | 12,925,580 | |||||||
|
Less: valuation allowance
|
(16,610,110 | ) | (12,925,580 | ) | ||||
|
Net future income tax assets
|
$ | - | $ | - | ||||
73
Energizer Resources Inc.
(An Exploration Stage Company)
Notes to Consolidated Financial Statements
June 30, 2014 and 2013
(Expressed in US Dollars)
12. Income Taxes - continued
The United States net operating loss carry forwards expire as noted below. The remaining deductible temporary differences may be carried forward indefinitely. Future tax assets have not been recognized in respect of these items because it is not probable that future taxable profit will be available against which the Company can utilize the benefits therefrom. The Company's United States net operating losses expire as follows:
|
2025
|
$ | 4,130 | ||
|
2026
|
29,460 | |||
|
2027
|
283,870 | |||
|
2028
|
909,180 | |||
|
2029
|
341,250 | |||
|
2030
|
3,435,600 | |||
|
2031
|
3,998,670 | |||
|
2032
|
5,264,970 | |||
|
2033
|
4,956,920 | |||
|
2034
|
5,879,120 | |||
| $ | 25,103,170 |
13. Loss Per Share
Basic and diluted loss per share is computed using the weighted average number of common stock outstanding. Diluted loss per share and the weighted average number of shares of common stock exclude all potentially dilutive shares since their effect is anti-dilutive. As at June 30, 2014, there were a total of 71,025,729 (June 30, 2013: 30,653,599) potentially dilutive stock options and common share purchase warrants outstanding.
14. Commitments
The Company raised CAD$4,761,990 during 2013 on a Canadian flow-through share tax basis. The Company is required to spend and renounce this amount on Canadian Exploration Expenditures before December 31, 2014. As at June 30, 2014, $3,079,930 has been spent. The Company expects to meet this commitment.
74
Energizer Resources Inc.
(An Exploration Stage Company)
Notes to Consolidated Financial Statements
June 30, 2014 and 2013
(Expressed in US Dollars)
15. Segmented Reporting
The Company operates one operating segment, that being the exploration and development of mineral properties. The Company's Chief Executive Officer, President and Chief Operating Officer and Chief Financial Officer have been identified as the chief operating decision-makers, and direct the allocation of resources to geographic segments. No revenue has been generated by these properties. A summary of the components of net loss by geographic area is as follows:
|
For the year ended June 30, 2014
|
Madagascar
|
Canada
|
Total
|
|||||||||
|
Mineral exploration expense
|
$ | 5,039,517 | $ | 2,304,024 | $ | 7,343,541 | ||||||
|
For the year ended June 30, 2013
|
Madagascar
|
Canada
|
Total
|
|||||||||
|
Mineral exploration expense
|
$ | 2,839,741 | $ | 880,994 | $ | 3,720,735 | ||||||
As at June 30, 2014, $58,110 (June 30, 2013 $52,073) in cash was held in Madagascar with the remaining $1,192,273 (June 30, 2013: $773,027) held in Canada. All of the Company's remaining assets were held in Canada.
16. Subsequent Events
Private Placement
On September xxxx, 2014, the Company closed a brokered private placement raising a total of $4,800,000. The Company issued 34,285,714 common stock at $0.14 per share. In addition, the Company paid a fee of $xxxxx260,132, legal fees approximating $120,000 and TSX fees approximating $25,000. In addition, the Company issued xxxx2,018,442 broker common stock purchase compensation warrants. Each compensation warrant entitles the holder to purchase one common share at $0.14 and expires 24 months from the date of issue.
Sagar Property Deal
As described in note 7, on July 31, 2014 the Company revised its February 28, 2014 agreement with TUF, a public company related by common management, to sell an interest in the Sagar Property.
Exercise of Warrants
On September 17, 2014, 571,353 warrants were exercised for total cash proceeds of $73,049 (CAD$79,989).
75