Attached files
| file | filename |
|---|---|
| 8-K - 8-K - Sunstone Hotel Investors, Inc. | a14-20666_18k.htm |
Exhibit 99.1
|
|
[staying the course] COMPANY PRESENTATION SEPTEMBER 2014 |
|
|
/ This presentation contains forward-looking statements that have been made pursuant to the provisions of the Private Securities Litigation Reform Act of 1995. These statements relate to future events or our future financial performance. In some cases, you can identify forward-looking statements by terminology such as “anticipate,” “believe,” “continue,” “could,” “estimate,” “expect,” “intend,” “may,” “plan,” “predict,” “project,” “should,” “will” or the negative of such terms and other comparable terminology. These statements are only predictions. Actual events or results may differ materially from those expressed or implied by these forward-looking statements. In evaluating these statements, you should specifically consider the risks outlined in detail under the heading “Risk Factors” in our Annual Report on Form 10-K, filed with the Securities and Exchange Commission (“SEC”) on February 25, 2014, including, but not limited to, the following factors: general economic and business conditions affecting the lodging and travel industry, internationally and locally, including a U.S. recession; the need to operate as a REIT and comply with other applicable laws and regulations; rising operating expenses; relationships with and requirements of franchisors and hotel brands; relationships with and the performance of the managers of our hotels; the ground, operating or air leases for 9 of the 30 hotels; our ability to complete acquisitions and dispositions; and competition for the acquisition of hotels. These factors may cause our actual events to differ materially from the expectations expressed or implied by any forward-looking statement. We do not undertake to update any forward-looking statement. Definitions of non-GAAP financial measures can be found on Form 10-Q filed August 8, 2014, and reconciliations to non-GAAP financial measures can be found on Forms 8-K furnished on August 7, 2014 and February 20, 2014. [Forward-Looking Statements] COMPANY PRESENTATION SUNSTONE HOTEL INVESTORS, INC. 2 |
|
|
/ Company Overview Sunstone Strategy Asset Management 2014 & Beyond [Table of Contents] COMPANY PRESENTATION SUNSTONE HOTEL INVESTORS, INC. 3 |
|
|
[Company Overview] Who we are. |
|
|
/ Our Profile We own 30 institutional-quality hotels (14,303 rooms). Our enterprise value is approximately $4.5 billion. [Company Overview] SUNSTONE HOTEL INVESTORS, INC. 5 High-Quality Diversified Portfolio EBITDA Concentrated in Top 25 MSAs Significant Balance Sheet Capacity Consistent Execution of Stated Strategy Best-in-Class Disclosure & Corporate Governance COMPANY PRESENTATION |
|
|
/ Valuation Our current portfolio quality, growth prospects and discount valuation imply meaningful upside in our share price. [Company Overview] SUNSTONE HOTEL INVESTORS, INC. 6 COMPANY PRESENTATION Capital Structure / Valuation Metrics Sunstone Portfolio Metrics Recent Stock Price 1 $14.76 Hotels 30 Shares Outstanding (MM) 205.4 Rooms 14,303 Equity Market Cap (MM) $3,032 2013 Comparable Hotel RevPAR $148.20 Total Mortgage Debt (MM) $1,335 2013 Industry Peer Hotel RevPAR 4 $142.32 Total Preferred Equity (MM) 115.0 Variance $5.88 Total Corporate Debt + Preferred (MM) $1,450 2014 Comparable Hotel RevPAR Guidance 2 +4.5% - 6.5% Total Enterprise Value (MM) $4,482 2014 Adjusted EBITDA Guidance (MM) 2 $296 - $307 Implied Value per Key $320,000 2014 Pro Forma Adjusted EBITDA (MM) 3 $308 - $319 Relative Valuation Valuation Sensitivity A change of: Would result in a share price 2014 Consensus SHO EBITDA Multiple 4 14.3x change of: 2014 Consensus Industry Peer EBITDA Multiple 4 15.2x $10,000 / key $0.68 Variance -0.9x 1.0x in EBITDA multiple $1.48 1 As of 9/5/2014 2 Data as provided in supplemental financial information reported on Form 8-K, furnished 8/7/2014. Includes partial year ownership of the Wailea Beach Marriott Resort & Spa. 3 Includes full-year estimated EBITDA of $19.3M for the Wailea Beach Marriott Resort & Spa, acquired 7/17/2014. 4 Based Source: SNL Financial, FactSet. Median figures. Data for Industry Peer group includes DRH, RHP, HST, LHO, PEB, FCH, AHT, HT, BEE, RLJ, CHSP. |
|
|
/ Recent Earnings Highlights [Company Overview] SUNSTONE HOTEL INVESTORS, INC. 7 • Q2 RevPAR Growth Guidance: 4.0% - 6.0% • Actual Q2 RevPAR Growth: 6.2% Q2 2014 RevPAR • Q2 Adjusted EBITDA Guidance: $89 - $92M • Actual Q2 Adjusted EBITDA: $95M Q2 2014 EBITDA • Q2 FFO per share Guidance: $0.37 - $0.39 • Actual Q2 FFO per share: $0.39 Q2 2014 FFO • Current 2014 Pace (Q2 2014): + 6.0% Strong Group Pace Our Q2 2014 results surpassed expectations. COMPANY PRESENTATION |
|
|
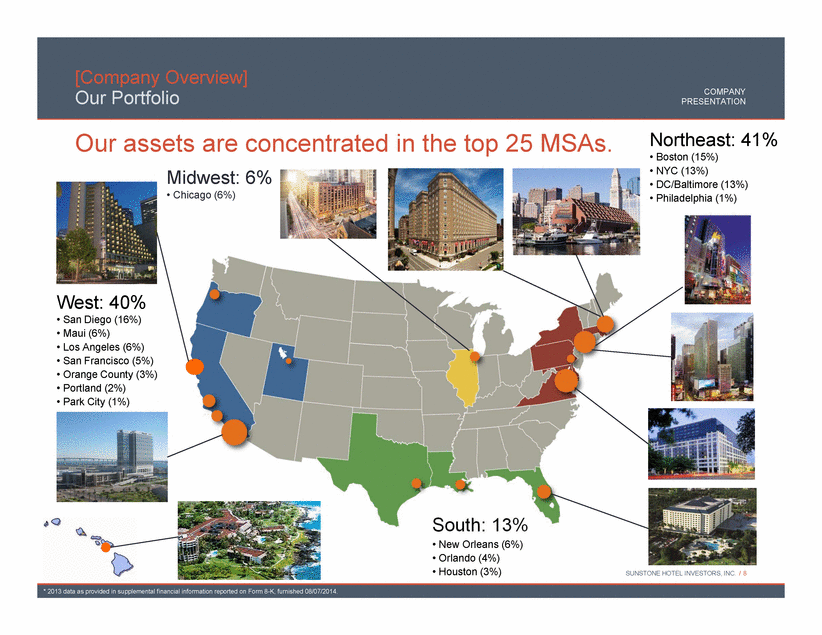
/ Our Portfolio [Company Overview] SUNSTONE HOTEL INVESTORS, INC. 8 West: 40% • San Diego (16%) • Maui (6%) • Los Angeles (6%) • San Francisco (5%) • Orange County (3%) • Portland (2%) • Park City (1%) Midwest: 6% • Chicago (6%) Northeast: 41% • Boston (15%) • NYC (13%) • DC/Baltimore (13%) • Philadelphia (1%) South: 13% • New Orleans (6%) • Orlando (4%) • Houston (3%) Our assets are concentrated in the top 25 MSAs. COMPANY PRESENTATION * 2013 data as provided in supplemental financial information reported on Form 8-K, furnished 08/07/2014. |
|
|
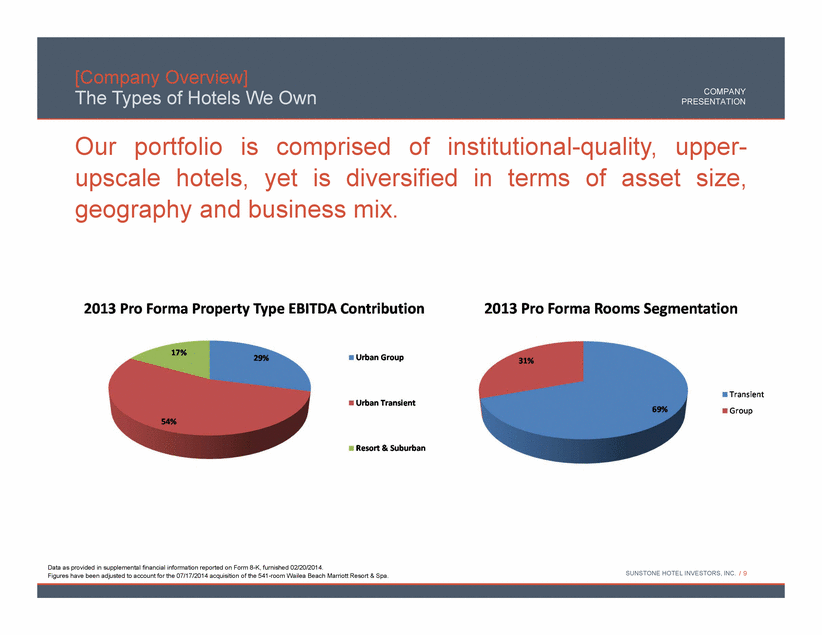
/ The Types of Hotels We Own Our portfolio is comprised of institutional-quality, upper-upscale hotels, yet is diversified in terms of asset size, geography and business mix. [Company Overview] SUNSTONE HOTEL INVESTORS, INC. 9 Data as provided in supplemental financial information reported on Form 8-K, furnished 02/20/2014. Figures have been adjusted to account for the 07/17/2014 acquisition of the 541-room Wailea Beach Marriott Resort & Spa. COMPANY PRESENTATION |
|
|
/ The Types of Hotels We Own [Company Overview] SUNSTONE HOTEL INVESTORS, INC. 10 803-room Hyatt Regency San Francisco Our Growth is Fueled by Strength in Business Transient . We are realizing strong growth from our Boston, San Francisco, Orange County and Chicago hotels. . In Q2, we increased both our premium rated room nights (+8.1%) and premium ADR (+2.7%), resulting in an 11.1% improvement in our premium revenues. * Data as provided in supplemental financial information reported on Form 8-K, furnished 02/25/2014. COMPANY PRESENTATION Urban Transient Hotels* Number of Hotels 17 Rooms 7,341 Q2 2014 RevPAR % Change Year-over-Year $197.53 6.1% Q2 2014 EBITDA ($MM) % Change Year-over-Year $60.0 13.2% Q2 2014 Sell-Out Nights % Change Year-over-Year 558 2% |
|
|
/ The Types of Hotels We Own [Company Overview] SUNSTONE HOTEL INVESTORS, INC. 11 1,190-room Hilton San Diego Bayfront Group Recovery is Increasing Our Compression Base . Our current 2014 group pace, for all 30 hotels is up +6%, driven largely by growth in occupied room nights. . Group production remains strong, with Q2 production coming in at its second highest level over the last seven years. COMPANY PRESENTATION Urban Group Hotels* Number of Hotels 4 Rooms 3,400 Q2 2014 RevPAR % Change Year-over-Year $164.40 2.0% Q2 2014 EBITDA ($MM) % Change Year-over-Year $29.5 5.0% Q2 2014 Sell-Out Nights % Change Year-over-Year 71 15% * Data as provided in supplemental financial information reported on Form 8-K, furnished 08/07/2014. |
|
|
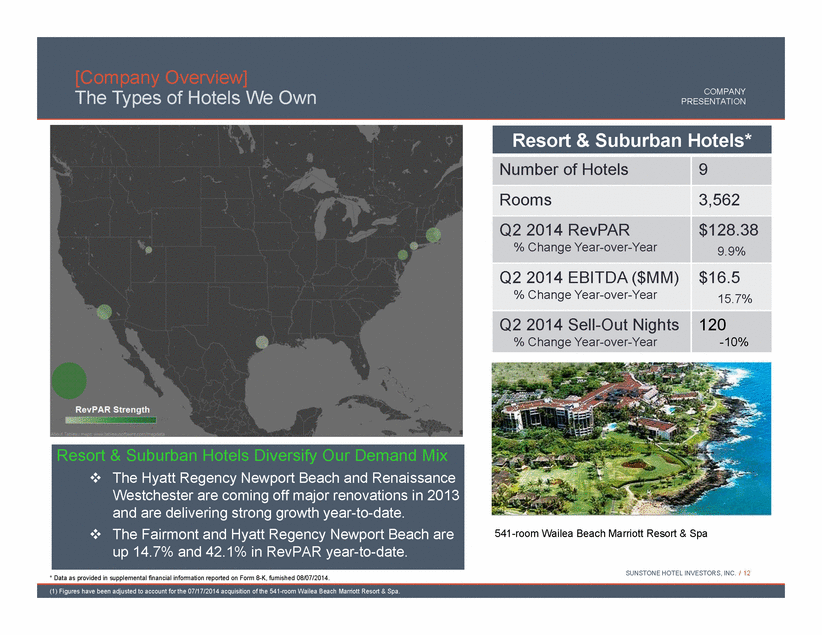
/ The Types of Hotels We Own [Company Overview] SUNSTONE HOTEL INVESTORS, INC. 12 541-room Wailea Beach Marriott Resort & Spa Resort & Suburban Hotels Diversify Our Demand Mix . The Hyatt Regency Newport Beach and Renaissance Westchester are coming off major renovations in 2013 and are delivering strong growth year-to-date. . The Fairmont and Hyatt Regency Newport Beach are up 14.7% and 42.1% in RevPAR year-to-date. COMPANY PRESENTATION Resort & Suburban Hotels* Number of Hotels 9 Rooms 3,562 Q2 2014 RevPAR % Change Year-over-Year $128.38 9.9% Q2 2014 EBITDA ($MM) % Change Year-over-Year $16.5 15.7% Q2 2014 Sell-Out Nights % Change Year-over-Year 120 -10% * Data as provided in supplemental financial information reported on Form 8-K, furnished 08/07/2014. (1) Figures have been adjusted to account for the 07/17/2014 acquisition of the 541-room Wailea Beach Marriott Resort & Spa. |
|
|
[Sunstone Strategy] How we compete. |
|
|
/ Strategic Pillars During the ongoing growth phase of the cycle, our plan is to drive meaningful returns for our shareholders by improving the quality and scale of our portfolio while maintaining balance sheet strength. We will continue to deliver on our plan by executing on a five pillar strategy: [Sunstone Strategy] SUNSTONE HOTEL INVESTORS, INC. 14 Proactive Portfolio Management Aggressive Asset Management Disciplined Capital Allocation Focused Cost of Capital Management Superior Corporate Governance 412-room Marriott Boston Long Wharf COMPANY PRESENTATION |
|
|
/ Proactive Portfolio Management Refining what we own, where we invest, and with whom we partner. [Sunstone Strategy] SUNSTONE HOTEL INVESTORS, INC. 15 • EBITDA Concentration • Geographic Diversity • Brand / Manager Relationships • Encumbrances / Optionality Quality Scale Growth Profile Risk & Relationships • RevPAR • EBITDA / Key • Market Orientation o Urban o Suburban o Resort • Target Growth Markets • Value-Add Potential • Operating Efficiency • CapEx Investments • “Complexing” Opportunities • Portfolio Size • Average Hotel Size • Market Clusters Proactive Portfolio Management COMPANY PRESENTATION |
|
|
/ Aggressive Asset Management [Sunstone Strategy] SUNSTONE HOTEL INVESTORS, INC. 16 Revenue Management • Optimizing Revenues Operational Efficiency • Minimizing Expenses Capital Investment • Maximizing Asset Value COMPANY PRESENTATION Maximizing the value of our individual hotels. |
|
|
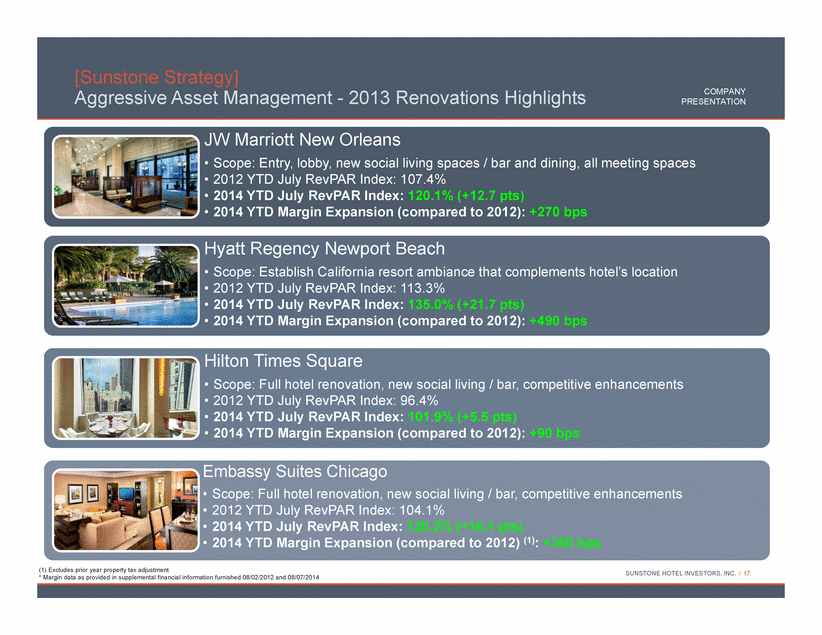
/ Aggressive Asset Management - 2013 Renovations Highlights [Sunstone Strategy] SUNSTONE HOTEL INVESTORS, INC. 17 JW Marriott New Orleans • Scope: Entry, lobby, new social living spaces / bar and dining, all meeting spaces • 2012 YTD July RevPAR Index: 107.4% • 2014 YTD July RevPAR Index: 120.1% (+12.7 pts) • 2014 YTD Margin Expansion (compared to 2012): +270 bps Hyatt Regency Newport Beach • Scope: Establish California resort ambiance that complements hotel’s location • 2012 YTD July RevPAR Index: 113.3% • 2014 YTD July RevPAR Index: 135.0% (+21.7 pts) • 2014 YTD Margin Expansion (compared to 2012): +490 bps Hilton Times Square • Scope: Full hotel renovation, new social living / bar, competitive enhancements • 2012 YTD July RevPAR Index: 96.4% • 2014 YTD July RevPAR Index: 101.9% (+5.5 pts) • 2014 YTD Margin Expansion (compared to 2012): +90 bps Embassy Suites Chicago • Scope: Full hotel renovation, new social living / bar, competitive enhancements • 2012 YTD July RevPAR Index: 104.1% • 2014 YTD July RevPAR Index: 120.2% (+16.1 pts) • 2014 YTD Margin Expansion (compared to 2012) (1): +360 bps COMPANY PRESENTATION (1) Excludes prior year property tax adjustment * Margin data as provided in supplemental financial information furnished 08/02/2012 and 08/07/2014 |
|
|
/ Aggressive Asset Management - Current Renovations [Sunstone Strategy] SUNSTONE HOTEL INVESTORS, INC. 18 Boston Park Plaza • Scope: Complete hotel repositioning including new retail space • Status: Phase I & II to be substantially complete by 1Q15 • YTD RevPAR: +10.7% through July (1) • 2014 Estimated Revenue Displacement: $500k - $1.0 million Hyatt Regency San Francisco • Scope: Rooms renovation and public space re-configuration • Status: Standard rooms renovation completed 2Q14 • YTD RevPAR: +3.2% through July (with displacement) (1) (2) • 2014 Estimated Revenue Displacement: $2.1 million (all in 1H14) Wailea Beach Marriott Resort & Spa • Scope: Complete resort re-imaging & experiential enhancements • Status: Design development in progress; start renovation 2015 COMPANY PRESENTATION (1) Source: Smith Travel Research (2) The Hyatt Regency’s running 3-month RevPAR growth through July is +10.5% |
|
|
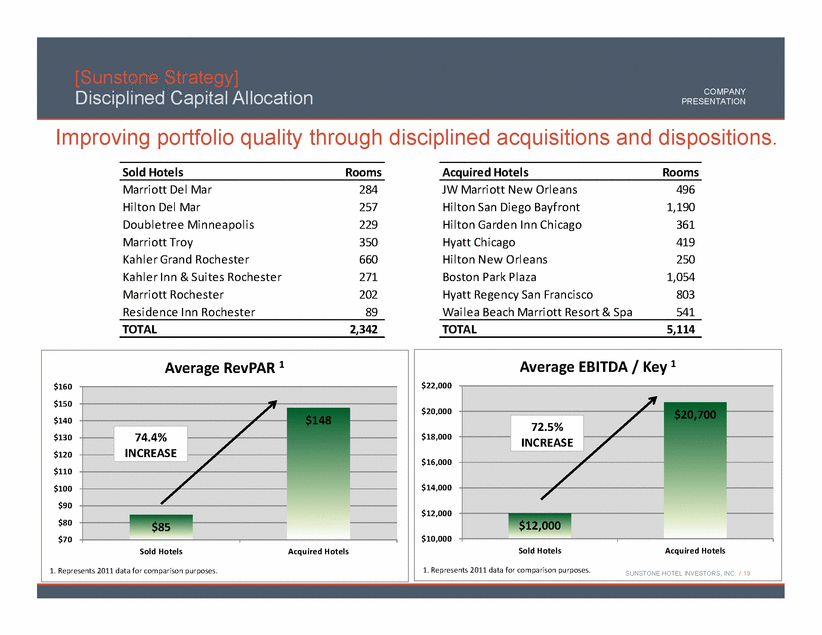
/ Disciplined Capital Allocation [Sunstone Strategy] SUNSTONE HOTEL INVESTORS, INC. 19 COMPANY PRESENTATION Improving portfolio quality through disciplined acquisitions and dispositions. $85 $148 $70 $80 $90 $100 $110 $120 $130 $140 $150 $160 Sold Hotels Acquired Hotels Average RevPAR 1 1. Represents 2011 data for comparison purposes. 74.4% INCREASE $12,000 $20,700 $10,000 $12,000 $14,000 $16,000 $18,000 $20,000 $22,000 Sold Hotels Acquired Hotels Average EBITDA / Key 1 1. Represents 2011 data for comparison purposes. 72.5% INCREASE Sold Hotels Rooms Acquired Hotels Rooms Marriott Del Mar 284 JW Marriott New Orleans 496 Hilton Del Mar 257 Hilton San Diego Bayfront 1,190 Doubletree Minneapolis 229 Hilton Garden Inn Chicago 361 Marriott Troy 350 Hyatt Chicago 419 Kahler Grand Rochester 660 Hilton New Orleans 250 Kahler Inn & Suites Rochester 271 Boston Park Plaza 1,054 Marriott Rochester 202 Hyatt Regency San Francisco 803 Residence Inn Rochester 89 Wailea Beach Marriott Resort & Spa 541 TOTAL 2,342 TOTAL 5,114 |
|
|
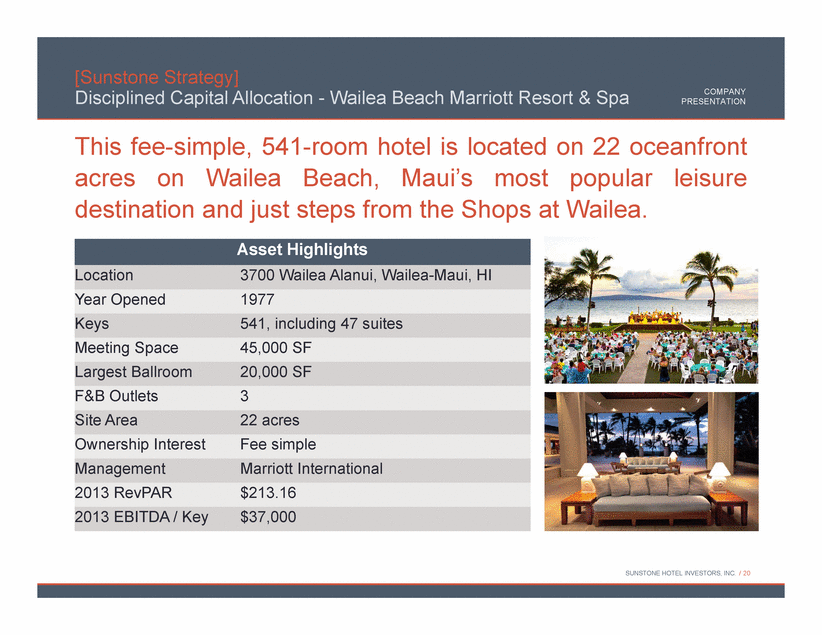
/ Disciplined Capital Allocation - Wailea Beach Marriott Resort & Spa [Sunstone Strategy] SUNSTONE HOTEL INVESTORS, INC. 20 Asset Highlights Location 3700 Wailea Alanui, Wailea-Maui, HI Year Opened 1977 Keys 541, including 47 suites Meeting Space 45,000 SF Largest Ballroom 20,000 SF F&B Outlets 3 Site Area 22 acres Ownership Interest Fee simple Management Marriott International 2013 RevPAR $213.16 2013 EBITDA / Key $37,000 This fee-simple, 541-room hotel is located on 22 oceanfront acres on Wailea Beach, Maui’s most popular leisure destination and just steps from the Shops at Wailea. COMPANY PRESENTATION |
|
|
/ Wailea Beach Marriott Resort & Spa [Sunstone Strategy] SUNSTONE HOTEL INVESTORS, INC. 21 We have developed a comprehensive plan to reposition the Marriott as a highly competitive destination resort in Maui by leveraging the hotel’s Wailea Beach address and spectacular grounds. COMPANY PRESENTATION Marriott Wailea Current Position Current RevPAR: $200 - $210 Premium Kaanapali Hotels Current RevPAR: $250 - $275 Wailea Beach Hotels (ex: Four Seasons) Current RevPAR: $350 - $400 Marriott Wailea Target Position (1) RevPAR: $290 - $325 (1) Represents expected post-renovation performance. |
|
|
/ Disciplined Capital Allocation - Wailea Beach Marriott Resort & Spa [Sunstone Strategy] SUNSTONE HOTEL INVESTORS, INC. 22 Our repositioning program is aimed at materially enhancing the resort’s long-term RevPAR and EBITDA. COMPANY PRESENTATION $175 $200 $225 $250 $275 $300 $325 $10,000 $15,000 $20,000 $25,000 $30,000 $35,000 2013 Stabilized Period Wailea Beach Marriott Resort & Spa: Projections EBITDA (000s) (L) RevPAR (R) Expected Post-Renovation EBITDA & RevPAR Range * 2013 data as provided in supplemental financial information reported on Form 8-K, furnished 08/07/2014. |
|
|
/ Focused Cost of Capital Management [Sunstone Strategy] SUNSTONE HOTEL INVESTORS, INC. 23 COMPANY PRESENTATION Source: SNL Financial, FactSet Total Return calculated from 12/31/2011 to 12/31/2013 Leverage (Net Debt plus Preferred to EBITDA) as of 12/31/2011 and 12/31/2013 65.7% 37.7% 28.1% 35.5% 20% 25% 30% 35% 40% 45% 50% 55% 60% 65% 70% 3.0x 4.0x 5.0x 6.0x 7.0x 8.0x 9.0x Sunstone Host DiamondRock LaSalle Relative Leverage & Total Returns (2011 - 2013) 2011 2013 Period Total Return (R-Axis) Deleveraging while delivering superior shareholder value! Managing our balance sheet in a consistently shareholder-friendly way. |
|
|
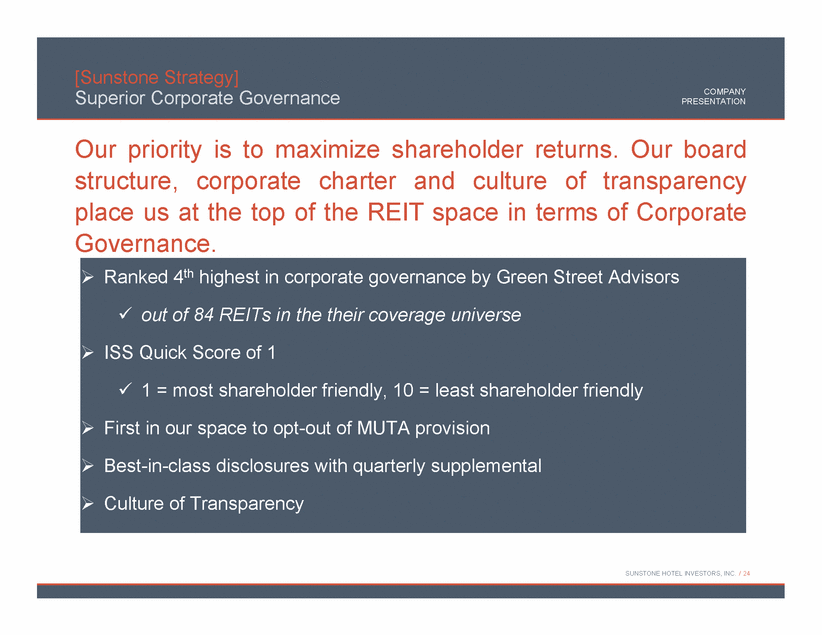
/ Superior Corporate Governance [Sunstone Strategy] SUNSTONE HOTEL INVESTORS, INC. 24 . Ranked 4th highest in corporate governance by Green Street Advisors . out of 84 REITs in the their coverage universe . ISS Quick Score of 1 . 1 = most shareholder friendly, 10 = least shareholder friendly . First in our space to opt-out of MUTA provision . Best-in-class disclosures with quarterly supplemental . Culture of Transparency Our priority is to maximize shareholder returns. Our board structure, corporate charter and culture of transparency place us at the top of the REIT space in terms of Corporate Governance. COMPANY PRESENTATION |
|
|
/ Execution [Sunstone Strategy] SUNSTONE HOTEL INVESTORS, INC. 25 SHO Stock Price Source: SNL Financial, FactSet COMPANY PRESENTATION $6 $7 $8 $9 $10 $11 $12 $13 $14 $15 $16 (6/4) Acquired 417-room Hyatt Chicago (7/19) Acquired 357-room Hilton Garden Inn Chicago (8/23) Sold 284-room Marriott Del Mar (9/14) Sold 350-room Marriott Troy, 257-room Hilton Del Mar, 229-room Doubletree Minneapolis (12/2) Acquired 802-room Hyatt San Francisco (11/1) Completion of followon equity offering with $271 million of net proceeds (5/31) Redeemed all $100 million outstanding 6.45% Series C Preferred Stock (1/25) Sold 1,222-room Rochester Portfolio (1/22) Redeemed all $58 million outstanding 4.6% Senior Exchangeable Notes (3/1) Redemption of all $176 million outstanding 8.00% Series A Preferred Stock (2/1 and 2/15) Completion of follow-on equity offering with $295 million of net proceeds (5/1) Acquired 250- room Hilton New Orleans St. Charles New Sunstone team in-place (6/19 and 7/17) Completion of follow-on equity offering and direct placement with $322.8 million of net proceeds, announced acquisition of 544-room Marriott Wailea Beach (7/2) Acquired 1,053-room Boston Park Plaza |
|
|
[2015 & Beyond] Poised to outperform. |
|
|
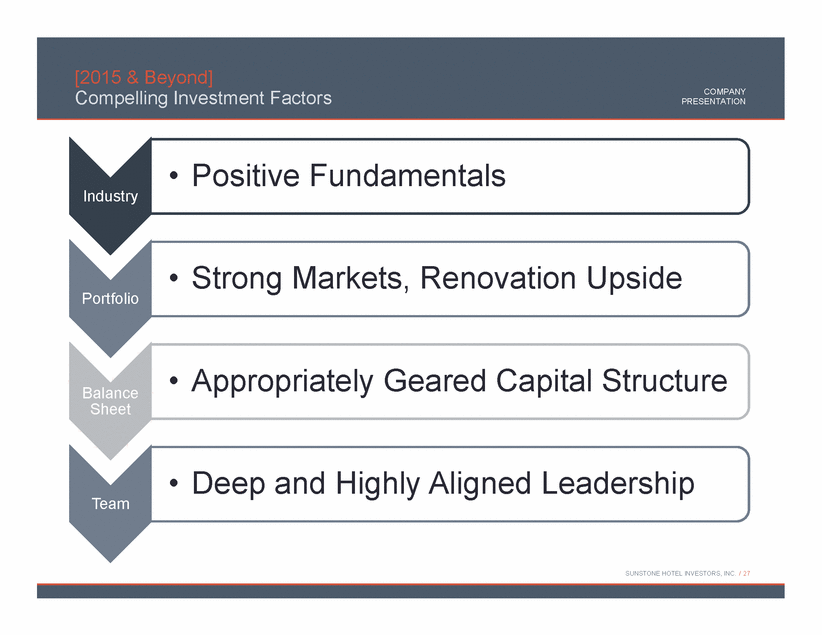
/ Compelling Investment Factors [2015 & Beyond] SUNSTONE HOTEL INVESTORS, INC. 27 Industry • Positive Fundamentals Portfolio • Strong Markets, Renovation Upside Balance Sheet • Appropriately Geared Capital Structure Team • Deep and Highly Aligned Leadership COMPANY PRESENTATION |
|
|
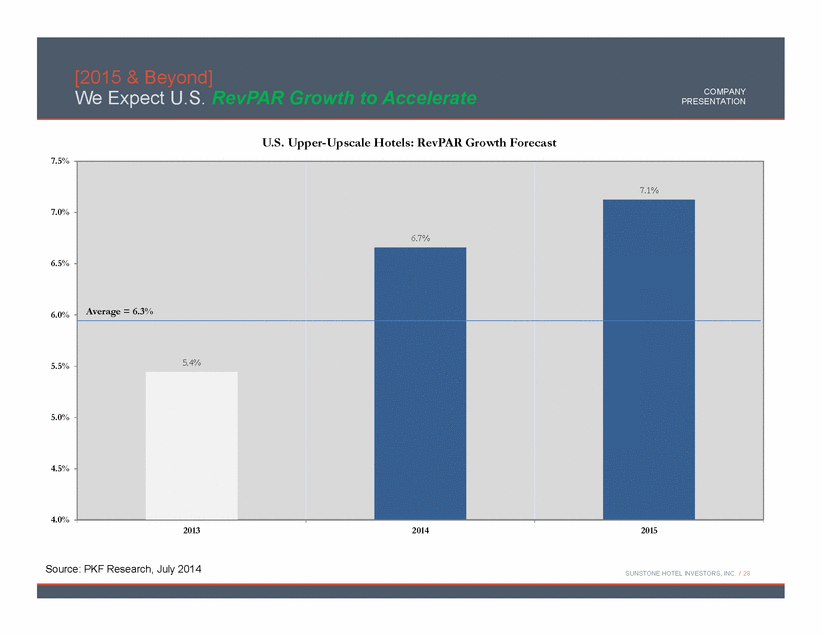
/ We Expect U.S. RevPAR Growth to Accelerate [2015 & Beyond] SUNSTONE HOTEL INVESTORS, INC. 28 Source: PKF Research, July 2014 COMPANY PRESENTATION 5.4% 6.7% 7.1% 4.0% 4.5% 5.0% 5.5% 6.0% 6.5% 7.0% 7.5% 2013 2014 2015 U.S. Upper-Upscale Hotels: RevPAR Growth Forecast Average = 6.3% |
|
|
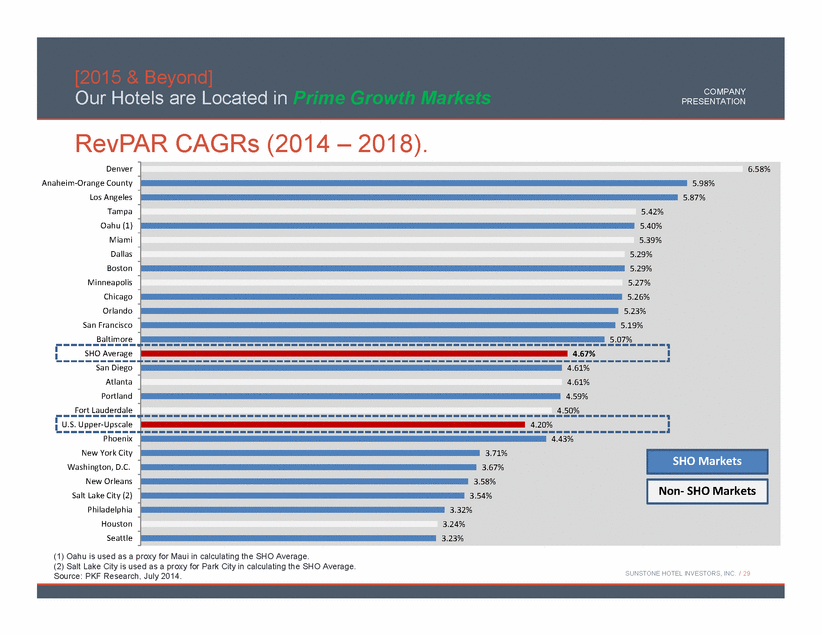
/ Our Hotels are Located in Prime Growth Markets [2015 & Beyond] SUNSTONE HOTEL INVESTORS, INC. 29 COMPANY PRESENTATION (1) Oahu is used as a proxy for Maui in calculating the SHO Average. (2) Salt Lake City is used as a proxy for Park City in calculating the SHO Average. Source: PKF Research, July 2014. RevPAR CAGRs (2014 – 2018). 6.58% 5.98% 5.87% 5.42% 5.40% 5.39% 5.29% 5.29% 5.27% 5.26% 5.23% 5.19% 5.07% 4.67% 4.61% 4.61% 4.59% 4.50% 4.20% 4.43% 3.71% 3.67% 3.58% 3.54% 3.32% 3.24% 3.23% Denver Anaheim-Orange County Los Angeles Tampa Oahu (1) Miami Dallas Boston Minneapolis Chicago Orlando San Francisco Baltimore SHO Average San Diego Atlanta Portland Fort Lauderdale U.S. Upper-Upscale Phoenix New York City Washington, D.C. New Orleans Salt Lake City (2) Philadelphia Houston Seattle SHO Markets Non- SHO Markets |
|
|
/ If History is a Guide, Lodging Stocks are Well Positioned for Growth [2015 & Beyond] SUNSTONE HOTEL INVESTORS, INC. 30 Source: MLV Equity Research 0 50 100 150 200 250 1 13 25 37 49 61 73 85 97 109 121 Months from Prior Peak Stock Returns Peak to Peak 90's Cycle Stock Index 2000's Cycle Stock Index Current Cycle Stock Index We are here COMPANY PRESENTATION |


