Attached files
| file | filename |
|---|---|
| EX-23.1 - EXHIBIT - SOLERA HOLDINGS, INC | exhibit231fy1410k.htm |
| EX-31.1 - EXHIBIT - SOLERA HOLDINGS, INC | exhibit311fy1410k.htm |
| EX-32.1 - EXHIBIT - SOLERA HOLDINGS, INC | exhibit321fy1410k.htm |
| EX-32.2 - EXHIBIT - SOLERA HOLDINGS, INC | exhibit322fy1410k.htm |
| EX-31.2 - EXHIBIT - SOLERA HOLDINGS, INC | exhibit312fy1410k.htm |
| EX-10.29 - EXHIBIT - SOLERA HOLDINGS, INC | exhibit1029amendmentno1top.htm |
| EX-10.28 - EXHIBIT - SOLERA HOLDINGS, INC | exhibit1028pgwispurchasean.htm |
| EX-21.1 - EXHIBIT - SOLERA HOLDINGS, INC | exhibit211fy1410k.htm |
| EXCEL - IDEA: XBRL DOCUMENT - SOLERA HOLDINGS, INC | Financial_Report.xls |
UNITED STATES
SECURITIES AND EXCHANGE COMMISSION
Washington, DC 20549
FORM 10-K
ý | ANNUAL REPORT PURSUANT TO SECTION 13 OR 15(d) OF THE SECURITIES EXCHANGE ACT OF 1934 |
For the fiscal year ended June 30, 2014
OR
¨ | TRANSITION REPORT PURSUANT TO SECTION 13 OR 15(d) OF THE SECURITIES EXCHANGE ACT OF 1934 |
For the transition period from to
COMMISSION FILE NUMBER: 001-33461
Solera Holdings, Inc.
(Exact name of registrant as specified in its charter)
Delaware | 26-1103816 | |
(State or other jurisdiction of incorporation organization) | (I.R.S. Employer Identification No.) | |
7 Village Circle, Suite 100 Westlake, Texas 76262 | (817) 961-2100 | |
(Address of Principal Executive Offices, including Zip Code) | (Registrant’s Telephone Number, Including Area Code) | |
Securities registered pursuant to Section 12(b) of the Act:
Title of each class | Name of exchange on which registered | |
Common Stock, par value $0.01 per share | New York Stock Exchange | |
Securities registered pursuant to Section 12(g) of the Act:
None
Indicate by check mark if the registrant is a well-known seasoned issuer, as defined in Rule 405 of the Securities Act. Yes ý No ¨
Indicate by check mark if the registrant is not required to file reports pursuant to Section 13 or Section 15(d) of the Act. Yes ¨ No ý
Indicate by check mark whether the Registrant (1) has filed all reports required to be filed by Section 13 or 15(d) of the Securities Exchange Act of 1934 during the preceding 12 months (or for such shorter period that it was required to file such reports), and (2) has been subject to such filing requirements for the past 90 days. Yes ý No ¨
Indicate by check mark whether the registrant has submitted electronically and posted on its corporate Web site, if any, every Interactive Data File required to be submitted and posted pursuant to Rule 405 of Regulation S-T (§232.405 of this chapter) during the preceding 12 months (or for such shorter period that the registrant was required to submit and post such files). Yes ý No ¨
Indicate by check mark if disclosure of delinquent filers pursuant to Item 405 of Regulation S-K (§229.405) is not contained herein, and will not be contained, to the best of the Registrant’s knowledge, in definitive proxy or information statements incorporated by reference in Part III of this Form 10-K or any amendment to this Form 10-K. ¨
Indicate by check mark whether the registrant is a large accelerated filer, an accelerated filer, a non-accelerated filer, or a smaller reporting company. See the definitions of “large accelerated filer,” “accelerated filer” and “smaller reporting company” in Rule 12b-2 of the Exchange Act. (Check one):
Large accelerated filer ý Accelerated filer ¨ Non-accelerated filer ¨ Smaller reporting company ¨
Indicate by check mark whether the registrant is a shell company (as defined in Rule 12b-2 of the Act). Yes ¨ No ý
The aggregate market value of voting stock held by non-affiliates of the Registrant was approximately $2,679,000,000 as of December 31, 2013 (based upon the closing sale price on The New York Stock Exchange for such date). For this purpose, all shares held by directors, executive officers and stockholders beneficially owning five percent or more of the registrant’s common stock have been treated as held by affiliates.
The number of shares of the registrant’s common stock outstanding as of August 21, 2014 was 68,608,932.
DOCUMENTS INCORPORATED BY REFERENCE
Portions of the registrant’s Proxy Statement to be delivered to stockholders in connection with registrants 2014 Annual Meeting of Stockholders are incorporated by reference into Part III of this Annual Report on Form 10-K to the extent stated herein.
TABLE OF CONTENTS
PART I | ||
Item 1. | ||
Item 2. | ||
Item 3. | ||
Item 4. | ||
PART II | ||
Item 5. | ||
Item 6. | ||
Item 7. | ||
Item 7A. | ||
Item 8. | ||
Item 9. | ||
PART III | ||
Item 10. | ||
Item 11. | ||
Item 12. | ||
Item 13. | ||
Item 14. | ||
PART IV | ||
Item 15. | ||
CAUTIONARY STATEMENT FOR PURPOSES OF THE SAFE HARBOR PROVISIONS OF
THE PRIVATE SECURITIES LITIGATION REFORM ACT OF 1995
This report contains forward-looking statements within the meaning of the federal securities laws. These forward-looking statements are identified by the use of terms and phrases such as “anticipate,” “believe,” “could,” “estimate,” “expect,” “intend,” “may,” “plan,” “predict,” “project,” and similar terms and phrases, including references to assumptions. However, these words are not the exclusive means of identifying such statements. These statements relate to analyses and other information that are based on forecasts of future results and estimates of amounts not yet determinable. These statements also relate to our future prospects, developments and business strategies and include, but are not limited to, statements about: increase in customer demand for our software and services; growth rates for the automobile insurance claims industry; growth rates for vehicle purchases and car parcs; customer adoption rates for automated claims processing software and services; increases in customer spending on automated claims processing software and services; efficiencies resulting from automated claims processing; performance and benefits of our products and services; development or acquisition of claims processing products and services in areas other than automobile insurance; our relationship with insurance company customers as they continue global expansion; revenue growth resulting from the launch of new software and services; growth and expansion in our service, maintenance and repair platform and customer’s customer platform; execution of our Mission 2020 strategy to grow our business to $2 billion in revenue and $840 million in Adjusted EBITDA by fiscal year 2020; execution of our Leverage, Diversity and Disruption growth strategy; execution of our Management, Margin and Core strategy related to acquisitions and joint ventures; our ability to acquire over time additional interests in our Service Repair Solutions, Inc. joint venture and to successfully integrate it into our existing businesses; improvements in operating margins resulting from operational efficiency initiatives; expectations regarding AudaExplore revenue; increased utilization of our software and services resulting from increased severity; our expectations regarding the growth rates for vehicle insurance; changes in the amount of our existing unrecognized tax benefits; our revenue mix; our income taxes; restructuring plans, potential restructuring charges and their impact on our revenues; our operating expense growth and operating expenses as a percentage of our revenues; stability of our development and programming costs; growth of our selling, general and administrative expenses; decrease of total depreciation and amortization expense; increase in interest expense and possible impact of future foreign currency fluctuations; growth of our acquisition and related costs; our ability to realize our U.S. and foreign deferred tax assets during the respective carryforward and reversal periods; our use of cash and liquidity position going forward; cash needs to service our debt; and our ability to grow in all types of markets.
Actual results could differ materially from those projected, implied or anticipated by our forward-looking statements. Some of the factors that could cause actual results to differ include: those set forth in “Risk Factors,” “Management’s Discussion and Analysis of Financial Condition and Results of Operations,” “Business” and elsewhere in this Annual Report on Form 10-K.
Although we believe that expectations reflected in the forward-looking statements are reasonable, we cannot guarantee future results, levels of activity, performance or achievements. All forward-looking statements included in this Annual Report on Form 10-K are based on information available to us as of the date of this report. All forward-looking statements are qualified in their entirety by this cautionary statement, and we undertake no obligation to revise or update this Annual Report on Form 10-K to reflect events or circumstances after the date hereof. You are advised, however, to consult any further disclosures that we make on related subjects in our Quarterly Reports on Form 10-Q and Periodic Reports on Form 8-K filed with the Securities and Exchange Commission (the “SEC”). You also should read the section titled “Use of Estimates” included in Note 2 of Notes to Consolidated Financial Statements included pursuant to Item 8 of this Annual Report on Form 10-K.
PART I
ITEM 1. | BUSINESS |
General
References and Fiscal Year
The terms “we,” “us,” “our,” “our company” and “our business” refer to the consolidated operations of Solera Holdings, Inc. Our fiscal year ends on June 30 of each year. Fiscal years are identified in this Annual Report on Form 10-K according to the calendar year in which they end. For example, the fiscal year ended June 30, 2014 is referred to as “fiscal year 2014.”
Our Company
Solera is the leading global provider of software and services for the automobile claims processing industry. We are expanding beyond our global-leading position in collision repair and U.S. based mechanical repair presence to bring data driven productivity and decision support solutions to other aspects of vehicle ownership such as vehicle validation, glass repair, driver violation monitoring, vehicle salvage and electronic titling. We are also taking our core competencies of data, software and connectivity from the auto to the home.
As of June 30, 2014, we served over 165,000 customers and were active in more than 70 countries across six continents with more than 3,600 employees. Our customers include more than 4,000 automobile insurance companies, 60,500 collision repair facilities, 12,500 independent assessors, 44,500 service, maintenance and repair facilities and 43,500 automotive recyclers, auto dealers and others. We derive revenues from many of the world’s largest automobile insurance companies, including the ten largest automobile insurance companies in Europe and eight of the ten largest automobile insurance companies in North America. No single customer accounted for more than 2.6% of our revenue for fiscal year ended June 30, 2014.
Our Vision
In the future, we believe the digital lifestyles of our customers-customers (we work with the end customer in mind but always offer our services through our business customers, hence the term, customers-customers) will require all aspects of auto and home ownership to be digitally enabled and connected .We believe that Solera, with its diverse data based platforms, will be uniquely positioned to serve this need. We will therefore serve the complete auto lifecycle needs and leverage our core competencies of data, software and networking to digitize property claims management as well.
Our History
Our operations began in 1966, when Swiss Re Corporation founded our predecessor, the Claims Services Group (“CSG”). Solera Holdings, LLC was founded in March 2005 by Tony Aquila, our Chairman of the Board, Chief Executive Officer and President; and affiliates of GTCR Golder Rauner II, L.L.C. (“GTCR”), a private equity firm. In April 2006, subsidiaries of Solera Holdings, LLC acquired CSG from Automatic Data Processing, Inc. (“ADP”) for approximately $1.0 billion (the “CSG Acquisition”). Prior to the CSG Acquisition, Solera Holdings, LLC’s operations consisted primarily of developing our business plan, recruiting personnel, providing consulting services, raising capital and identifying and evaluating operating assets for acquisition.
In connection with our initial public offering in May 2007, we converted from Solera Holdings, LLC, a Delaware limited liability company, into Solera Holdings, Inc., a Delaware corporation, and all of the Class A Common Units and Class B Preferred Units of Solera Holdings, LLC were converted into shares of our common stock.
Platforms
We currently operate three platforms - Auto, Customer’s Customer and Property. At the core of our software and services are our proprietary databases. Each of our databases has been adapted for use in our local markets. Over the last 5 years, we have invested over $100 million annually to maintain and expand our proprietary databases and related software applications. Our primary databases include our repair estimating database, our total loss database, our claims database, our vehicle validation database, our motor vehicle record database, our salvage parts database, our service maintenance and repair databases and our property database.
1
Auto Platform
Through our Auto Platform, we facilitate efficient, cost effective collision repair, vehicle maintenance and repair, glass repair, vehicle salvage and parts procurement.
Collision Repair
The Automobile Insurance Claims Process
An overview of the automobile insurance claims process and its complexities provides a framework for understanding how our customers can derive value from our software and services. The automobile insurance claims process generally begins following an automobile collision and consists of the following steps:
First Notice of Loss | • | The policyholder initiates the claim process with the insurance company. | |
• | The insurance company assigns the claim to an assessor and/or a collision repair facility. | ||
Investigation | • | The assessor conducts interviews, examines photos and reviews police reports. | |
• | The insurance company, assessor or collision repair facility estimates the cost to repair the vehicle. | ||
• | In the case of a heavily damaged vehicle, the assessor or collision repair facility may request a pre-accident vehicle valuation. | ||
Evaluation | • | The insurance company reviews the estimate and/or pre-accident valuation and confirms the results of the investigation. | |
• | The insurance company may request additional information and/or require follow-up investigation. | ||
Decision | • | The insurance company determines whether the vehicle should be repaired or declared a total loss. | |
• | Based on its evaluation, the insurance company determines who is liable for the claim and the repair or total loss amount it intends to pay. | ||
Settlement | • | The insurance company notifies the policyholder or the collision repair facility of the amount it intends to pay. | |
• | The policyholder or collision repair facility may negotiate the final payment amount with the insurance company. | ||
• | In some cases, two or more insurance companies may settle claims amongst themselves depending on fault or payment liability. | ||
Vehicle Repair | • | The collision repair facility repairs the vehicle if it is not a total loss. | |
• | The collision repair facility or the insurance company may periodically communicate the repair status to the insured policyholder. | ||
• | The collision repair facility purchases replacement parts from original equipment manufacturers, or OEMs, aftermarket parts makers or automotive recyclers. | ||
• | Further revisions to the claim payment amount may occur if additional damage or cost savings are identified. | ||
Payment | • | The insurance company pays the policyholder or the collision repair facility in the case of a repairable vehicle. | |
• | The insurance company pays the policyholder the pre-accident value (less the amount of the insurance deductible) of the vehicle in the case of a total loss. | ||
• | The insurance company is paid the actual cash value of the total loss vehicle by the buyer of the salvage vehicle. | ||
Each of these steps consists of multiple actions requiring significant and complex interaction among several parties. For example, the investigation step generally involves insurance companies, assessors, collision repair facilities and automotive recyclers and includes conducting interviews, taking and examining photographs, obtaining and reviewing police reports and estimating repair costs and salvage values. When performed manually, many of these tasks, such as the mailing of vehicle photographs or the estimating of vehicle repair costs, can be time-consuming. In addition, without an efficient means of communication that facilitates real-time access to data, claim-related negotiations can result in increased cycle times and unnecessary costs.
2
The Automobile Insurance Claims Processing Industry
The primary participants in the automobile insurance claims processing industry with whom we do business are automobile insurance companies, collision repair facilities, independent assessors and automotive recyclers. We believe that the principal drivers of demand for our software and services are:
Automobile Insurance Industry
We estimate that the global automobile insurance industry processes more than 100 million claims each year, representing more than $155 billion in repair, loss adjustment expense and other related costs. We believe the industry is relatively concentrated with a number of large automobile insurance companies accounting for the majority of global automobile insurance premiums. Over the past decade, the largest insurers in the U.S., as a group, have been steadily growing and increasing their market share (measured by the premiums written) so that today over half of all private passenger auto insurance in the United States is issued by just five companies, and in 2011, the top 15 companies issued more than 75 percent.
In 2013, global, non-life insurance premiums, which includes premiums for lines of business in addition to automobile insurance, grew by 2.8% compared to 2012. In 2013, approximately 80% of these premiums were generated in industrialized countries (of which North America grew by 2.8% and Western Europe declined by 1.2% compared to 2012) and 20% of the premium volumes were generated in emerging markets (of which Latin America grew by 9.0% and Emerging Asia grew by 11.7% compared to 2012).
Claims Database. Our claims database enables our customers to evaluate their internal claims process performance, as well as measure the performance of their business partners. Our employees also use this database to provide consulting services to our customers and develop new software and services. Customers use this database to benchmark their performance against their local peer group through detailed analyses of comprehensive industry data. Compiled over the past 15 years, this database contains approximately two billion data records representing over 340 million automobile repair claims and over $200 billion in claims payments. We update this database by incorporating more than 650,000 additional repair estimates every week.
Collision Repair Industry
The collision repair industry is highly fragmented. We estimate there are approximately 100,000 collision repair facilities in our markets. The operating costs of these facilities have increased substantially over the past decade due to continued increases in sophisticated technologies and advanced materials used in vehicle manufacture, inflation in collision repair labor rates and changes in environmental regulations. In addition, collision repair facilities have increasingly established preferred relationships with insurance companies. These arrangements, known in the U.S. as direct repair programs, allow collision repair facilities to generate increased repair volumes through insurance company referrals. Insurance companies benefit by establishing a trusted network of collision repair facilities across which they can negotiate labor rates and implement standard procedures and best practices. Insurance companies often require collision repair facilities to use specified automated claims processing software and related services to participate in their programs. We believe the combination of these factors will increase demand for software and services that help collision repair facilities manage their workflow and increase their efficiency.
Repair Estimating Database. We have developed our repair estimating database over 47 years through the development, collection, organization and management of automobile-related information. The data in this database enables our customers to estimate the cost to repair a damaged vehicle. This database:
• | contains detailed cost data for each part and the required labor operations needed to complete repairs on over 5,500 vehicle types; |
• | covers over 99% of the vehicle models in our core markets; |
• | includes vehicles data dating back to 1967; |
• | includes over 7.7 million parts for vehicles with multiple model years, editions, option packages and country-specific variations; |
• | includes over 6.5 million aftermarket parts; and, |
• | includes over 5.3 million graphics. |
3
We update this database with data provided to us by third parties, including original equipment manufacturers, or OEMs, and aftermarket part suppliers, and automotive recyclers, along with data we develop through our proprietary analyses of local labor repair times and damage repair techniques. The quality and accuracy of the database, which are very important to each of our customers, are continuously monitored and maintained using rigorous quality control processes, which include updating over 2.3 million data records every month.
Independent Assessors
Independent assessors are often used to estimate vehicle repair costs, particularly where automobile insurance companies have chosen not to employ their own assessors or do not have a sufficient number of employee assessors and where governments mandate the use of independent assessors.
In some markets, we believe changing government regulations and improved claims technology will result in a decrease in the number of independent assessors. However, in other markets, insurance companies are reducing their employee assessor staff to contain costs, which we believe will lead to a growth in the number of independent assessors. We believe the combination of these offsetting factors will result in a modest overall increase in the number of independent assessors and, therefore, the demand for automobile insurance claims processing software and services.
Automotive Recycling Industry
The automotive recycling industry is highly fragmented with over $25 billion in estimated U.S. annual sales by over 7,000 independent salvage and recycling facilities. Participants in the automotive recycling industry are a valuable source of economical and often hard-to-find used vehicle replacement parts. In addition, this industry has become more sophisticated and technology-driven in order to keep pace with more stringent fulfillment requirements. Additionally, insurance companies are increasingly mandating the use of aftermarket and recycled parts to lower the costs to repair damaged vehicles. We believe these factors will result in increased demand for salvage yard management software and services, as automotive recyclers seek to manage their workflows, maximize the value of their inventories and increase efficiency.
Recycled Parts Databases The Hollander Interchange™ is a part identification index of millions of auto parts and their interchangeable equivalents that spans over 80 years. The Hollander Interchange is the language used by parts buyers and sellers to inventory, locate and sell a significant percentage of recycled parts. EDEN® is a dynamic parts database that contains approximately 160 million unique automobile parts that are held in inventory at any given point by a network of approximately 3,000 automotive recyclers. EDEN is used by our customers to quickly find locally available automobile parts.
Salvage Vehicle Database. Our salvage vehicle database helps our customers buy, sell and estimate the value of salvage vehicles. Through our eSalvage exchange each year, our customers list approximately 1.2 million salvage vehicles for sale and more than 10,600 qualified bidders enter approximately 8 million bids for the purchase of salvage vehicles.
Key Drivers of Automobile Insurance Claims Processing Demand
We believe that the principal drivers of demand for our software and services are:
Claims process fragmentation. The automobile insurance claims process involves many parties and consists of many steps, which are often managed through paper, fax and other labor intensive processes. Our software and services simplify and streamline the claims process, allowing our customers to process claims faster and reduce their costs.
Asymmetrical information. Collision repair facilities typically have more information about vehicles in their shops than do insurance companies who often must make their damage estimates remotely or with limited information. Our databases provide insurance companies access to detailed information about vehicle damage, repair times and replacement costs, allowing them to more accurately estimate fair settlement values and reduce overpayment on claims.
Disparate claims data. Claims-related data generated by automobile insurance companies often is not stored, shared with other parties or captured in a format that is easily transferable to other applications. This, combined with the inability to transfer and manipulate data easily across multiple applications, hinders comparisons of repairs and claims. Our databases are constantly updated for actual claims data from industry participants. Having access to our databases helps insurance companies generate more accurate repair estimates and identify top-performing collision repair facilities.
Conflicting interests of industry participants. Collision repair facilities benefit from high repair costs, which increase their revenues. Conversely, insurance companies benefit from low repair costs, which reduce their expenses. This conflict can
4
result in high settlement costs and delays. Our software and services provide repair cost estimates that rely on common data sources which in turn reduce these costs and delays.
Inefficient collision repair facility workflow. Many collision repair facilities manage their complex workflows manually or without specialized software. Manual workflow management leads to increased processing time, higher costs and more errors, problems that generally intensify as vehicles become more technologically complex, the number of vehicle models proliferate and as repair facilities grow. Our claims processing software and services assist collision repair facilities in effectively managing their workflows and obtaining detailed part availability and pricing information.
Importance of communications between insurance and repair companies and their customers. Insurance policyholders and collision repair customers increasingly rank communications and access to information as critical factors in their satisfaction. These factors directly impact their decision-making process as well as their willingness to recommend body shops to their insureds. Our software and services enable our insurance and collision repair customers to provide transparent communications, increasing both customer retention and new customer acquisition.
Our Automotive Claims Platform and Solutions
Our software and services include the following general categories: estimating and workflow software, salvage, salvage disposition and recycling software, electronic titling, subrogation solutions, business intelligence and consulting services, vehicle validation, and insurance re-underwriting. The majority of our customers access our software and services through a standard Web browser utilizing a “software on demand” model. By subscribing to our services, our customers can reduce upfront investments in software, hardware, implementation services and IT staff that they would typically make with traditional software solutions.
Estimating and Workflow Software
Our core offering is our estimating and workflow software. Our estimating and workflow software helps our customers manage the overall claims process, estimate the cost to repair a damaged vehicle, and calculate the pre-collision fair market value of a vehicle. Key functions of our estimating and workflow software include: capturing first notice of loss information; assigning, managing and monitoring claims and claim-related events; accessing and exchanging claims-related information; calculating, submitting, tracking and storing repair and total loss estimates; reviewing, assessing and reporting estimate variations based upon pre-set rules; routing shop estimates for manual review; and scheduling repairs and automating parts ordering.
Salvage Disposition Software
Generally, if the estimated cost to repair a vehicle reaches a threshold or percentage of the actual cash value of the vehicle, it is declared a total loss. Our salvage disposition software and networks help insurers maximize the proceeds of disposing of the totaled vehicle by connecting buyers and sellers via an electronic auction network. Key functions of our salvage disposition software include: determining the value of a vehicle in real-time as the repair estimate is being written to determine the actual cash value as an aid in determining if a vehicle is a total loss; determining the actual cash value of a vehicle allowing the insurance company to maximize its yield; and connecting sellers with qualified buyers.
Vehicle Maintenance and Mechanical Repair
An overview of the automobile maintenance and repair process and its complexities provides a framework for understanding how our customers can derive value from our software and services.
Mechanical Repair Process
OEMS typically provide a warranty on new vehicles for a period of years or miles covered. These warranties cover specified repairs and sometimes maintenance during the warranty period and these services are typically performed at the automobile dealer. Motor vehicle service is a series of maintenance procedures carried out at a set time interval or after the vehicle has travelled a certain distance. The vehicle manufacturer specifies service intervals and some modern cars display the due date for the next service electronically on the instrument panel.
There are 18,700 automobile dealers in the U.S. According to the National Automobile Dealers Association ("NADA") in 2013 warranty worked performed by franchised dealers was valued at $14.4 billion in service and parts---all at no cost to the
5
vehicle owner. Additionally, NADA estimated Americans spent at franchised dealerships a total of $84.5 billion in 2013 on for repairs, maintenance, tires, batteries, oil and accessories for automobiles and light trucks used in personal transportation.
After the OEM warranty expires, vehicle owners typically have their vehicles serviced and maintained at either an automobile dealer or at chain or independent repair facility.
There are approximately 275,000 chain and independent repair facilities in the U.S. A National Highway Traffic Safety Administration ("NHTSA") analysis led to a primary estimate that approximately 40 percent of the costs associated with auto repair were unnecessary. The NHTSA reports that the consumer losses associated with improper repair and maintenance are attributable to (among other factors):
• | Unneeded repairs due to inadequate diagnosis; |
• | Unneeded repairs sold with possible fraudulent intent; |
• | Wasteful over-frequent preventive maintenance; |
• | Accidents due to under maintenance or faulty repairs; and |
• | Cars prematurely retired due to under maintenance or faulty repairs |
Our Service Maintenance & Repair Platform & Solutions
The automotive service and repair market is driven by a structural and growing imbalance between supply and demand. Supply is constrained by a diminishing number of highly qualified auto technicians (due to aging/retirement of the technician population and fewer technicians becoming certified) capable of efficiently diagnosing and servicing today’s increasingly complex vehicles. Demand, on the other hand, is increasing due to a confluence of several factors, including:
• | Near-record high of 240 million vehicles in operation in the U.S., and growing, with new-vehicle sales expected to reach pre-2008 recession levels of over 16.4 million units by 2014, according to NADA; |
• | The average age of vehicles on the road in the U.S. is at a record high of almost 11 years according to the Automotive Aftermarket Industry Association; |
• | Increasing vehicle complexity. |
One of the most efficient ways to bridge the growing gap between fewer and less experienced technicians servicing a greater number of more technologically complex vehicles, is to empower those technicians through the implementation and application of technology.
Vehicle service and repair generates the overwhelming majority of operating profits for both aftermarket shops and dealerships, reinforcing their imperative to meet growing market demand effectively. In this context, the ability to increase the quality and efficiency of automotive service and repair, and improve vehicle owner satisfaction and retention, represents a significant value proposition. Our Identifix and AutoPoint services play a unique, vital and growing role in the automotive ecosystem by helping to meet this high-value need with proprietary data, technology and workflow optimization solutions.
With proprietary data covering more than 750,000 real world vehicle issues and growing every day, our online subscription solutions deliver the most comprehensive, authoritative, accurate and reliable information for vehicle service and repair in the world.
The primary source of the original fix data is our Identifix Repair Hotline, a pay-per-call technical assistance service that connects professional automotive technicians across North America live with Automotive Service Excellence ("ASE") certified master mechanics who provide diagnostic services and repair guidance to service and repair professionals. The information from Identifix Repair Hotline calls, including more than 4 million inbound technical assistance calls over the last 25 years, is continually added to the database, providing an ongoing source of new proprietary data regarding vehicle problems and the best way to fix them, and further acting as a critical source of proprietary real-world fix data that keeps our solution current, highly relevant and uniquely valuable to our customers.
Supplementing the Identifix Repair Hotline data is content from a number of third party sources, including most notably OEMs. Our solution synthesizes and categorizes authentic OEM-authored information and factory manual content, and integrates this data to provide full 360-degree solutions for vehicle problems of any type. With over 15 million pages of content
6
from most major OEMs this authentic OEM information supplements the real-world diagnostic data with factory-accurate protocols, guidelines and diagrams governing how to repair diagnosed vehicle problems.
Additionally, we enhance the service ecosystem by offering comprehensive vehicle inspection workflow software with powerful data-driven tools and analytics, service center management and sales solutions, and a suite of customer relationship management products for service centers to manage and improve their relationships with vehicle owners. A core mission is to improve service center efficiency and vehicle owner loyalty to generate significant and measurable increases in revenue and profitability.
Our AutoPoint service center workflow software provides:
• | Proprietary data-driven solutions that leverage the power of over 150 million repair orders and completed inspections to deliver customer specific recommendations for maintenance and repair |
• | Proven and measurable customer return on investment for users of the data and software; and |
• | Dramatic and lasting impact on service center business processes. |
We drive behavioral change throughout a service center, from owners to managers to technicians to the parts department to consumer-facing service advisers, by institutionalizing transparency and standardization, both internally and externally. service center employees communicate with each other more efficiently and effectively utilizing automated workflow tools and communicate with vehicle owners more professionally and with more helpful context and personalized information, and service center managers gain enhanced and more actionable clarity into the performance of their business unit. The net result is rapid and long-lasting gains to vehicle service quality, vehicle owner’s satisfaction and loyalty, and service center top- and bottom-line performance.
Automotive Glass Repair
Overview
Claims involving the breakage of vehicle glass, are characterized as high-frequency, low-severity and have long been considered a burden in claim operations for many major insurance carriers. Since auto glass-only claims represent a small fraction of total auto severity, carriers often outsource these claims in order to focus on the higher dollar cases, such as total loss and auto/medical claims. There are about 14 million glass repair or replacements performed annually in the U.S. Approximately one-half of these are insured claims.
Our Solutions
Operating under the brand names of LYNX Services, GTS Services and GLAXIS, we provide software and business management tools, third-party claims administration, first notice of loss and network management services to the U.S. auto insurers, glass repair facilities and suppliers specializing in glass claims. Our services allow insurance companies to cost-effectively handle glass claims while providing high levels of customer service to their customers. In addition, through our software services, we allow glass repair facilities to operate more efficiently through enhanced workflow and scheduling. We also create efficiency within the supply chain by connecting glass repair facilities and suppliers.
Automotive Recycling Industry
Overview
The automotive recycling industry is highly fragmented. For example, in the US market there is $25 billion in estimated annual sales by more than 7,000 independent salvage and recycling facilities. These facilities play an important role in the ecological and economical disposal and recycling of inoperable motor vehicles. The automotive recycling industry is a valuable source of cost-effective and often hard-to-find used vehicle replacement parts. Solera serves the automotive recycling industry through Hollander and APU Solutions in North American and Hollander International in Australia and selected European countries.
Our data, software and services help customers to keep pace with more stringent buyer requirements, increased government regulations and complexity of new vehicles. Additionally, some insurance companies in some countries are mandating the use of aftermarket and recycled parts to lower the costs to repair damaged vehicles. For example, in the U.S., aftermarket and recycled parts make up approximately 37% of parts usage in collision repair. We believe these factors will
7
result in increased demand for automotive recycling software and services, as recyclers seek to manage their workflows, maximize the value of their inventories and increase efficiency. In many other countries, use of recycled parts is still in the early development stages. Foreign buyers now account for 32 percent of vehicles purchased at salvage auctions.
Recycling Summary
Although the process differs by country, an automobile generally has 80 percent of its parts and fluids recycled, making motor vehicles among the most efficient recyclable item. The recycling process begins with inoperable motor vehicles being taken to a salvage yard, where the hazardous and recyclable fluids are drained for proper disposal or reuse. The yard then disassembles undamaged parts of the vehicle. These parts are then cleaned, tested, inventoried and stored in a warehouse until they are sold for second life use. The remainder of the damaged vehicle is then sold to the scrapping industry that reprocesses the core elements.
The Process
Incoming cars are inspected for leaks as soon as they are brought in. Any leaks that are found will have drip pans placed underneath them to collect the remaining fluid from the damaged area. The fuel, refrigerants and battery are then removed shortly after, as well as the mercury switches from the hood and/or trunk and the anti-lock braking system sensors. Any remaining fluid in the car is then drained. Refrigerants are removed as required by the U.S. Environmental Protection Agency. These measures protect the environment and keep the operators safe. Once done, images are then taken of each part to facilitate online purchasing. These “second-life” parts are then posted through various online channels for sale, or are sold in the yard’s brick and mortar store. Recyclers can also communicate with others in the industry to buy parts for their customers using parts locating networks.
Our Salvage and Parts Solutions
Through our Hollander brand, we provide solutions that enable automotive recyclers to sell more parts to more customers. We facilitate part location and procurement with the Hollander Interchange™ - a part identification index of millions of auto parts and their interchangeable equivalents that spans over 80 years. The Hollander Interchange is the language used by parts buyers and sellers to inventory, locate and sell a significant percentage of recycled parts.
EDEN® is a dynamic parts database that contains approximately 160 million unique automobile parts that are held in inventory at any given point by a network of approximately 3,000 automotive recyclers. EDEN is used by our customers to quickly find locally available automobile parts.
Powerlink® is a software application used to manage salvage yard operations in North America, Pinnacle Professional is a software application used to manage salvage yard operations outside of North America. These applications are used by more than 3,000 salvage yards to operate more efficiently, make better decisions, open new markets and sell more parts.
PartsNetwork®, powered by APU, is a web-based solution that provides insurance adjusters and collision repair centers an automated process for sourcing, pricing and purchasing alternative parts (that is, second life, aftermarket, OEM surplus parts). Using PartsNetwork, our customers process more than 101 million parts quotes, representing approximately $19 billion in quotes, annually. PartsNetwork provides real-time results for parts availability, description, quality, and pricing thereby lowering costs for insurers, simplifying workflow for repairers, and driving sales for part suppliers.
eCommerce
Hollander’s ecommerce platform, HollanderParts.com, provides recycling yards solutions to sell parts to prospective buyers electronically, opening up new markets and profitable new channels of demand.
Our Customer’s Customer Platform
Our customer’s customer platform enables the digital auto and property ownership experience. We seek to empower the end user with our data and software tools so that their ownership experience is enhanced. We provide these tools while working with and through our insurance customers, hence customer’s customer. An example is the self-service tool, Go Time Driver, now available to the customers of some of our US customers. With this smart phone based application the customer’s customer is able to self-assess collision damage and begin the repair process at their convenience. Our insurance and Collision Repair Shops customers support the use of this self service capability as it enhances their customers experience and lifestyles (such as by lessening or eliminating the wait time for assessors) and saves assessor costs and cuts cycle time. In the future we envision
8
our data and software powering the total ownership experience for auto and property owners. Our customer’s customer platform consists of our vehicle insurance re-underwriting, electronic tilting, subrogation and vehicle validation businesses.
Vehicle Insurance Re-Underwriting
As a result of our acquisitions of Explore and LMI, we provide property and casualty insurers with driver violation reporting services for a substantial number of their insured drivers in the U.S. This cost-effective service allows insurance companies to re-assess their risk and, where appropriate, impose a premium surcharge on insured drivers to reflect such risk.
Driver Violation Database: Through Explore, in the U.S., we collect driver violation data from 129 sources in 46 states allowing for driver violation reporting on over 56 million insured drivers. This database collects over 34 million moving violation records annually.
Electronic Titling
Through TitleTec, we provide a driver information services platform that allows automotive dealerships in the U.S. to streamline operations and improve the customer purchasing experience by assembling and processing the data necessary to electronically register a vehicle, produce a title, and issue a permanent or temporary tag real-time at the point of sale.
Subrogation
Through HyperQuest, we provide web-based subrogation solutions that lower processing costs, automate processes for efficiency, provide objectivity, and increase accuracy for both subrogation claims and out-of-network claims in the U.S. This drives consumer satisfaction by allowing insurance companies, assessors, and collision repair shops to seamlessly process out-of-network claims, regardless of the estimating platform being used.
Vehicle Validation
Through HPI and CarweB, we provide private car buyers, car dealers, finance houses and the insurance industry with access to information on all registered vehicles in the United Kingdom. Through our databases, we can inform a customer if a vehicle has outstanding car finance, is recorded as stolen or has previously been written-off. Through our access to the National Mileage Register, the United Kingdom's largest database of mileages, we can alert car buyers and dealers to potential mileage discrepancies.
Vehicle Validation Database. Using our vehicle validation database, private car buyers, car dealers, finance companies and the insurance industry customers can verify who the owner is, whether there is a finance-related lien, whether the vehicle has been recorded as stolen or if it has been declared a total loss by an insurance company. We acquire data from a number of public and private data sources including the Great Britain Driver and Vehicle Licensing Agency, motor dealers and manufacturers and finance and insurance companies. The database contains information on approximately 108 million vehicles (including 42 million vehicles currently licensed for use in the United Kingdom) and approximately 179 million mileage readings. The database is updated daily, weekly or periodically depending on the specific data element and its source.
Our Property Platform
In addition to automobile insurance, many of our insurance customers also provide property insurance. Through the use of our products and services, we can now deliver efficiency, standardization and transparency to the property repair process. Insurers face many of the same the challenges in property insurance claims as in auto collision repair:
Claims process fragmentation. The property insurance claims process involves many parties and consists of many steps, which are often managed through paper, fax and other labor intensive processes. Our software and services simplify and streamline the claims process, allowing our customers to process claims faster and reduce their costs.
Asymmetrical information. Property repair contractors typically have more information about the repair process than do insurance companies who often must make their damage estimates remotely or with limited information. Our databases provide insurance companies access to detailed information about property damage, repair times and replacement costs, allowing them to more accurately estimate fair settlement values and reduce overpayment on claims.
Disparate claims data. Claims-related data generated by property insurance companies often is not stored, shared with other parties or captured in a format that is easily transferable to other applications. This, combined with the inability to transfer
9
and manipulate data easily across multiple applications, hinders comparisons of repairs and claims. Our databases are constantly updated for actual claims data from industry participants. Having access to our databases helps insurance companies generate more accurate repair estimates and identify top-performing property repair contractors.
Conflicting interests of industry participants. Property repair contractors benefit from high repair costs, which increase their revenues. Conversely, insurance companies benefit from low repair costs, which reduce their expenses. This conflict can result in high settlement costs and delays. Our software and services provide repair cost estimates that rely on common data sources which in turn reduce these costs and delays.
Through Sachcontrol, we now have a proprietary property database of approximately 160 million data points which delivers significant value to insurers by providing fast and accurate property claims invoice checking resulting in claims cost reduction. Sachcontrol’s data set, the most comprehensive of its kind in Germany and Austria, is localized across 3,700 zip codes and covers 19,000 repair steps and over 20 construction trades.
Our Growth Strategy
Our Leverage, Diversify and Disrupt ("LDD") growth strategy is a framework for innovation and sustained, scalable growth.
Leverage refers to expanding our geographic footprint to increase the number of claims we process, and, to increase the number of services we provide in each claim to drive incremental return on investment for our insurance customers. Once a new market begins to adopt our electronic claims processing solutions and as our revenue-per-claim increases as we provide higher returns on investment to our customers, we enjoy scale benefits associated with our business model.
As our penetration of electronic claims processing increases in a geography, we begin to diversify to add more services from in our auto platform as well as our customer’s customer and property platforms. These diversifications add to our growth opportunities while diversifying from a reliance on collision-related claims.
Longer term, our objective is to disrupt the market by connecting our platforms and enabling the digital lifestyles of our customer’s customer. Thus we envision the auto as another smart appliance within the home and with the owners looking to use digital tools to manage their auto and home ownership experiences including purchase, maintenance and accident repair.
Our Markets
We categorize each of the 70 countries in which we are active into one of the three following market types (from most digitized to least): (i) Advanced; (ii) Evolving; and (iii) Emerging.
10
Market Type | Market Characteristics | ||
Advanced Market | • | Automated claims processing is widespread among industry participants. | |
• | Vehicle insurance is generally government-mandated and a condition to obtaining vehicle financing. | ||
• | Number of cars on the road (“car parc”) growing at a lower rate relative to other market types. | ||
• | Advanced Markets include North America and Western Europe. | ||
Evolving Market | • | Increasing adoption from manual claims processing to digitized claims processing; limited use of automated claims processing by industry participants. | |
• | Higher accident frequencies than advanced markets. | ||
• | Growing adoption of government-mandated vehicle insurance and insurance as a condition to vehicle financing. | ||
• | Size of car parc increasing. | ||
• | Evolving Markets include Latin America and Central and Eastern Europe. | ||
Emerging Market | • | Insurance companies focused on underwriting policies and establishing market share. | |
• | Substantial majority of claims are manually processed; significant opportunity for industry participants to increase operational efficiency through the adoption of automated claims processing. | ||
• | Early stage adoption of government-mandated vehicle insurance and insurance as a condition to vehicle financing. | ||
• | The highest accident frequencies among the three market types. | ||
• | Size of car parc increasing at the fastest rate among the three market types. | ||
• | Emerging Markets include China, India and Morocco | ||
Growth in the Automobile Insurance Claims Processing Industry
One of the primary growth drivers for our industry is the number of insurance claims made. Insurance claims made is determined by several factors, including the size and growth of the car parc and the frequency of collisions. Another growth driver is the insurance industry focus on increasing claims processing efficiency and reducing claims cost severity. Each of these factors influences industry growth differently in our three market types.
Advanced Markets. In our Advanced Markets, automobile insurance is generally government-mandated and claims processing is generally automated. Automobile insurance companies achieve growth in these highly competitive markets by gaining additional market share and generally compete on price, quality and range of policyholder service. To remain competitive, insurance companies increasingly seek additional automated claims processing products and services to minimize costs and improve policyholder service. In these markets, the car parc is stable, for example, in the United States, the number of registered vehicles declined in 2010 and increased in 2011 and 2012, while the average vehicle age has been increasing.
Evolving Markets. In our Evolving Markets, the car parc is generally growing. Automobile insurance companies achieve growth in these markets by focusing on writing new vehicle insurance policies and increasing market share. A significant number of claims are processed manually in these markets, presenting opportunities for insurance companies to increase their operational efficiencies by automating claims processing.
Emerging Markets. In our Emerging Markets, the car parc is growing at the fastest rate among the three market types. Automobile insurance companies achieve growth in these markets by focusing on writing new vehicle insurance policies and increasing market share. The vast majority of claims are processed manually or using homegrown solutions in these markets, presenting opportunities for insurance companies to increase their operational efficiencies by digitizing claims processing and leveraging global OEM data and repair methods.
According to industry sources, global new vehicle sales grew by 3.7% in 2012 to 79.5 million units and by 4.2% in 2013 to 82.8 million units. In markets where automobile insurance is generally government-mandated and claims processing is automated (characterized as “advanced markets”), sales are projected to grow at 1.3% compound annual growth rate through 2020. In other markets, sales are projected to grow at 8.1% compound annual growth rate through 2020. Fewer new light vehicle sales can result in fewer insured vehicles on the road and fewer automobile accidents, which can reduce the transaction-based fees that we generate.
While automation of claims processing can result in significant cost savings for our insurance company customers, improving their competitive positioning and customer satisfaction, the cost of automated claims processing software and
11
services generally represents a relatively small portion of automobile insurance companies' claims costs. We believe automobile insurance companies will increase their spending on automated claims processing software and services that improve their customers experience because such incremental investments can result in significant cost reductions and customer satisfaction improvements.
Our Customers
The primary participants in the automobile insurance claims processing industry with whom we do business are automobile insurance companies, collision repair facilities, independent assessors and automobile dealers, service, maintenance and repair facilities, and automotive recyclers, salvage, and dealerships. We believe that the principal drivers of demand for our software and services are:
Automobile Insurance Companies
We estimate that the global automobile insurance industry processes more than 100 million claims each year, representing more than $155 billion in repair, loss adjustment expense and other related costs. We believe the industry is relatively concentrated with a number of large automobile insurance companies accounting for the majority of global automobile insurance premiums. Over the past decade, the largest insurers in the U.S., as a group, have been steadily growing and increasing their market share (measured by the premiums written) so that today 70.3% all private passenger auto insurance in the United States is issued by just ten companies, and in 2000, the top 10 companies issued more than 59.3% percent.
In 2013, global, non-life insurance premiums, which includes premiums for lines of business in addition to automobile insurance, grew by 2.8% compared to 2012. In 2013, approximately 80% of these premiums were generated in industrialized countries (of which North America grew by 2.8% and Western Europe declined by 1.2% compared to 2012) and 20% of the premium volumes were generated in emerging markets (of which Latin America grew by 9.0% and Emerging Asia grew by 11.7% compared to 2012).
Collision Repair Facilities
The collision repair industry is highly fragmented. We estimate there are approximately 100,000 collision repair facilities in our markets. The operating costs of these facilities have increased substantially over the past decade due to continued increases in sophisticated technologies and advanced materials used in vehicle manufacture, inflation in collision repair labor rates and changes in environmental regulations. In addition, collision repair facilities have increasingly established preferred relationships with insurance companies. These arrangements, known in the U.S. as direct repair programs, allow collision repair facilities to generate increased repair volumes through insurance company referrals. Insurance companies benefit by establishing a trusted network of collision repair facilities across which they can negotiate labor rates and implement standard procedures and best practices. Insurance companies often require collision repair facilities to use specified automated claims processing software and related services to participate in their programs. We believe the combination of these factors will increase demand for software and services that help collision repair facilities manage their workflow and increase their efficiency.
Independent Assessors
Independent assessors are often used to estimate vehicle repair costs, particularly where automobile insurance companies have chosen not to employ their own assessors or do not have a sufficient number of employee assessors and where governments mandate the use of independent assessors.
In some markets, we believe changing government regulations and improved claims technology will result in a decrease in the number of independent assessors. However, in other markets, insurance companies are reducing their employee assessor staff to contain costs, which we believe will lead to a growth in the number of independent assessors. We believe the combination of these offsetting factors will result in a modest overall increase in the number of independent assessors and, therefore, the demand for automobile insurance claims processing software and services.
Automobile Dealers
According to NADA, at the end of 2013, there were 17,635 new car dealerships in the U.S., down from 20,010 at the end of 2009, but up slightly from 17,540 at the end of 2012.
12
Service, Maintenance and Repair Facilities ("SMR")
According to the North American Industry Classification system, there are approximately 265,000 chain and independent automobile repair facilities in the U.S. These include service stations and independent garages, car and light truck dealers, specialty repair shops (i.e., muffler, brakes, and quick-lube shops), auto parts stores with bays, and discount stores/mass merchandisers.
Automotive Recyclers, Salvage, Dealerships and Others
The automotive recycling industry is highly fragmented with over $25 billion in estimated U.S. annual sales by over 7,000 independent salvage and recycling facilities. Participants in the automotive recycling industry are a valuable source of economical and often hard-to-find used vehicle replacement parts. Further this industry has become more sophisticated and technology-driven in order to keep pace with more stringent fulfillment requirements. Additionally, insurance companies are increasingly mandating the use of aftermarket and recycled parts to lower the costs to repair damaged vehicles. Recycled parts in particular represent an economic and environmental opportunity. In our company we call these recycled parts “second life” parts and we are working with insurers, recyclers and governments to ensure a win-win outcome for all. We believe these factors will result in increased demand for salvage yard management software and services, as automotive recyclers seek to manage their workflows, maximize the value of their inventories and increase efficiency.
Our Acquisitions
We have a disciplined acquisition strategy with an initial focus on Management, Margin and Core ("MMC") of the acquisition target followed by a Return on Invested Capital ("ROIC") analysis - targets must generally meet both criteria. We seek acquisition targets with strong, entrepreneurial management teams that can be incented to drive achievement of targets, often in conjunction with performance based earn-outs. We seek acquisition targets that can achieve acceptable margin levels within a reasonable amount of time. Finally, acquisition targets must have a strategic fit with our core operations. Acquisition targets that meet our MMC hurdles are then subject to achievement of certain ROIC thresholds.
In general, our acquisition targets fall into the leverage, diversification or disruption categories of our LDD strategy. Acquisition targets that fall into the leverage category generally either provide us a claims footprint in a new geography or bring new claims related products that we can distribute across our global claims platform. Acquisition targets that fall into the diversification category generally provide us entry into non-claims related businesses that build on our auto, customer’s customer or property platforms. Acquisition targets that fall into the disruption category provide us with abilities that disrupt the market by connecting our platforms and enabling the digital lifestyles of our customer’s customer.
We have completed numerous acquisitions, both domestically and abroad, which are detailed below:
Historical Acquisitions Prior to Fiscal Year 2014
Fiscal Year | Acquired Company | Company Description |
2009 | HPI, Ltd. (“HPI”) | Leading provider of used vehicle validation services in the United Kingdom |
2009 | UC Universal Consulting Software GmbH (“UCS”) | Leading provider of software and services to collision repair facilities in Germany |
2009 | Inpart Servicos Ltda. (“Inpart”) | Leading electronic exchange for the purchase and sale of vehicle replacement parts in Brazil and other markets in Latin America and Europe |
2010 | AUTOonline GmbH In-formationssysteme (“AUTOonline”) (1) | Provider of an eSalvage vehicle exchange platform in several European countries and Latin American countries as well as India |
2010 | Softwaresysteme GTLDATA GmbH (“GTLDATA”) | Leading assessor management system provider in Austria |
2010 | Market Scan Holding B.V. (“Market Scan”) | Leading data analytics and software company serving the Dutch insurance industry |
13
Historical Acquisitions Prior to Fiscal Year 2014 (continued)
Fiscal Year | Acquired Company | Company Description |
2011 | Explore Information Services, LLC (“Explore”) | Leading U.S. provider of innovative data and analytic tools used by automotive property and casualty insurers |
2011 | New Era Software LLC (“New Era”) | U.S.-based provider of body shop management systems |
2011 | Digidentity B.V (2) | Dutch provider of next-generation E-identification certificates for authentication of online identities |
2012 | See Progress, Inc. (“See Progress”) | Market-leading U.S.-based provider of vehicle repair status software applications |
2012 | Inventory Technology Systems, Inc. (“ITS”) (3) | U.S.-based provider of innovative solutions that enhance salvage yard profitability by managing recycled parts logistics and increasing inventory turnover |
2012 | K&S Beheer B.V. (“Commerce Delta”) | Leading Netherlands-based collision repair shop management system provider |
2012 | Sinexia Corporacion Tecnologica (“Sinexia”) (4) | Developer of a leading software application for processing property and casualty insurance claims in Spain |
2012 | Actual Systems companies (“Actual Systems”) (5) | Global provider of premier parts recycling yard management systems that are sold under the "Pinnacle" brand name |
2013 | License Monitor (“LMI”) | Provider of sophisticated driver violation monitoring solutions that enable operators of government and commercial vehicle fleets to quickly ascertain driver violation activity and license status change |
2013 | Title Technologies (“TitleTec”) | Provider of a proprietary web-based platform that allows automotive dealerships to streamline operations by assembling and processing the data necessary to electronically register a vehicle, produce a title, and issue a permanent or temporary tag real-time at the point of sale |
2013 | Mensaelect S.A. ("Mensaelect") | Provider of a proprietary, web-based solution that streamlines the invoicing process between Spanish body shops and insurers |
2013 | CarweB Limited ("CarweB") | Provider of vehicle history and vehicle-specific technical data products and services in the United Kingdom |
2013 | HyperQuest, Inc. ("HyperQuest") | Provider of proprietary, web-based subrogation solutions and software tools that lower processing costs and provide objectivity to both subrogation claims and out-of-network claims |
2013 | Eziworks Pty Ltd ("Eziworks") | Australian company that operates as Car Quote, a leading body shop management system, which forms a communication link between insurers and body shops that allows them to exchange collision data |
2013 | PS Holdings, L.L.C. (“APU”) (3) | A cloud-based locator of recycled, aftermarket, reconditioned and surplus original equipment parts for the U.S. vehicle repair industry |
(1) | Acquisition of 85% controlling ownership interest in fiscal year 2010. We subsequently acquired the remaining 15% noncontrolling ownership in fiscal years 2012 and 2013. |
(2) | Acquisition of noncontrolling ownership interest. |
(3) | Acquisition of substantially all operating assets. |
(4) | Acquisition of controlling ownership interest. |
(5) | Acquisition effected through a series of three interrelated transactions. In August 2013, we divested the United States and Canada business of Actual Systems. |
14
Fiscal Year 2014 Acquisitions
Fiscal Year | Acquired Company | Company Description |
2014 | Autosoft S.r.l. (“Autosoft”) | A leading platform that provides workflow, damage assessment and claims management for insurance companies, vehicle repairers and assessors in Italy |
2014 | Distribution Services Technologies, Inc. (“DST”) | A leading provider of B2B e-Commerce, ERP support and analytics solutions for automotive mechanical part distributors in North America |
2014 | Pusula Otomotiv Danýþmanlik Ekspertiz Hizmetleri Anonim Þirketi (“Pusula”) | A leading provider of vehicle disposition and titling services in Turkey |
2014 | Servicios Informaticos Serinfo S.A. (“Serinfo”) | The leading provider of dealership and bodyshop management systems software in Chile |
2014 | sachcontrol AG (“Sachcontrol”) | A leading property claims management provider in Germany |
2014 | Service Repair Solutions, Inc. (“SRS”) (1) | A leading provider in the U.S. service, maintenance and repair market with proprietary databases and workflow solutions |
2014 | Auto Point, LLC and Mobile Productivity, LLC (together, “AutoPoint”) | A software and services platform that leverages a proprietary database of more than 100 million repair orders and 55 million completed inspections to enhance drivers’ service, maintenance and repair experiences at over 1,000 North American auto dealers |
(1) | Acquisition of 50% of the outstanding equity interests in a parent entity of SRS. We have control of SRS as defined by accounting principles generally accepted in the United States and therefore consolidated its assets, liabilities, and financial results from the acquisition closing date. |
Acquisitions Subsequent to Fiscal Year 2014
Fiscal Year | Acquired Company | Company Description |
2015 | Claims related business of the Sherwood Group | A leading provider of innovative exchanges, settlement platforms, and data analytics focused on the insurance industry in the United Kingdom, including car rental billing services and pet insurance claims |
2015 | Insurance & Services Division of Pittsburgh Glass Works, LLC ("I&S") | A leading provider of software and business management tools, third-party claims administration, first notice of loss and network management services to the U.S. auto and property repair industries, specializing in glass claims |
Our Global Operations
We are active in 70 countries on six continents. We manage our business operations through two reportable segments: EMEA and Americas. Our EMEA reportable segment accounted for approximately 48% of our revenues during fiscal year 2014. EMEA comprises our activities in 52 countries in Europe, the Middle East, Africa, Asia and Australia. Our Americas reportable segment accounted for approximately 52% of our revenues during fiscal year 2014. Americas comprises our activities in 18 countries in North, Central and South America. For information regarding operating results and total assets of our segments, please see Note 16 to the consolidated financial statements included elsewhere in this Annual Report on Form 10-K.
15
The table below sets forth the revenues we derived from the following geographic areas, based on the location of the customer, during each of the previous three fiscal years:
Fiscal Years Ended June 30, | |||||||||||
2014 | 2013 | 2012 | |||||||||
(in thousands) | |||||||||||
United States | $ | 368,151 | $ | 269,165 | $ | 236,239 | |||||
United Kingdom | 116,334 | 101,815 | 98,673 | ||||||||
Germany | 95,799 | 85,035 | 84,832 | ||||||||
Rest of Europe (excluding United Kingdom and Germany) | 289,790 | 268,686 | 266,634 | ||||||||
Other | 117,185 | 113,402 | 103,829 | ||||||||
The increase in the revenues derived from the United States market is primarily due to revenue contributions from acquisitions, including SRS, acquired in November 2013.
Sales and Marketing
As of June 30, 2014, our sales and marketing staff included 545 professionals. Our sales and marketing personnel identify and target specific sales opportunities and manage customer relationships. They also design, plan, and launch strategies for new software and services, and plan and facilitate customer conferences and tradeshows. Our country managers are also involved in the sales and marketing process, though they are not counted as full-time sales professionals.
Customer Support and Training
We believe that providing high quality customer support and training services is critical to our success. As of June 30, 2014, we had 624 customer support and training personnel, who provide telephone support, as well as on- and off-site implementation and training. Our customer support and training staff generally consists of individuals with expertise in both our software and services and in the automobile insurance and/or collision repair industries.
Software and Database Development
We devote significant resources to the continued development of our software and databases. We have created sophisticated processes and tools to achieve high-quality software development and data accuracy. Our ability to maintain and grow our leading position in the automobile insurance claims processing industry is dependent upon our ability to enhance and broaden the scope of our software and services, as well as continuing to expand and improve our repair estimating, total loss, claims, vehicle validation, motor vehicle record and parts salvage databases. We often collaborate with our customers in the development process to focus on addressing their specific needs. We then incorporate what we have learned from our customers’ workflow experiences and needs to deliver quality, workflow-oriented software and services to the marketplace quickly. We believe these efforts provide a significant competitive advantage in the development of new software and services.
As of June 30, 2014, our software development staff consisted of 812 professionals across six international software development centers and our database staff consisted of 370 professionals across five international database development centers.
Competition
We compete primarily on the value and functionality of our software and services, the integrity and breadth of our data, customer service and price. The competitive dynamics of the global automobile insurance claims processing industry vary by region, and our competitors are present in a subset of markets in which we operate. In Europe, our largest competitors include DAT GmbH, EurotaxGlass’ Group and GT Motive Einsa Group, with whom we compete in multiple countries. In North America, our largest competitors include CCC Information Services Inc. in the U.S. and Mitchell International Inc. in the U.S. and Canada. We also encounter regional or country-specific competition in the markets for automobile insurance claims processing software and services and our complementary products and services. For example, Experian® is our principal competitor in the United Kingdom in the vehicle validation market, and car.tv is our principal competitor in Germany in the online salvage vehicle disposition market and, as a result of our acquisition of Explore, ChoicePoint is our principal competitor in the U.S. in the automobile re-underwriting solutions market. The principal competitors of SRS in the U.S. service, repair and maintenance software and solutions market are ALLDATA and the Mitchell1 repair manuals.
16
Intellectual Property and Licenses
We enter into license agreements with our customers, granting each customer a license to use our software and services while ensuring the protection of our ownership and the confidentiality of the embedded information and technology contained in our software. As a general practice, employees, contractors and other parties with access to our confidential information sign agreements that prohibit the unauthorized use or disclosure of our proprietary rights, information and technology.
We own registered trademarks and service marks that we use in connection with our software and services, including their advertising and marketing. For example, our trademark Audatex is registered in over 50 countries.
We license much of the data used in our software and services through short-term contracts with third parties, including contracts with OEMs, aftermarket parts suppliers, data aggregators, automobile dealerships and vehicle repair facilities, to whom we pay royalties.
Employees
As of June 30, 2014, we had 3,638 associates, including 1,735 employees in our EMEA reportable segment, 1,834 employees in our Americas reportable segment, and 69 employees in corporate roles. None of our employees are subject to a collective bargaining agreement.
Available Information
Our Internet website address is www.solerainc.com. Our Annual Reports on Form 10-K, Quarterly Reports on Form 10-Q, Current Reports on Form 8-K and amendments to those reports filed or furnished pursuant to Section 13 or 15(d) of the Exchange Act are available free of charge through our website as soon as reasonably practicable after they are electronically filed with, or furnished to, the SEC. Our website and the information contained or incorporated therein are not intended to be incorporated into this Annual Report on Form 10-K.
ITEM 1A. | RISK FACTORS |
In addition to the cautionary statement regarding forward-looking statements included above in this Annual Report on Form 10-K, we also provide the following cautionary discussion of risks and uncertainties relevant to our business. These risks and uncertainties, as well as other factors that we may not be aware of, could cause our actual results to differ materially from expected and historical results and could cause assumptions that underlie our business plans, expectations and statements in this Annual Report on Form 10-K to be inaccurate.
We depend on a limited number of customers for a substantial portion of our revenues, and the loss of, or a significant reduction in volume from, any of these customers would harm our financial results.
We derive a substantial portion of our revenues from sales to large insurance companies and collision repair facilities that have relationships with these insurance companies. During fiscal year 2014, we derived 15.6% of our revenues from our ten largest insurance company customers. The largest three of these customers accounted for 2.6%, 2.3%, and 2.1%, respectively, of our revenues during fiscal year 2014. A loss of one or more of these customers would result in a significant decrease in our revenues, including the business generated by collision repair facilities associated with those customers. Furthermore, many of our arrangements with European customers are terminable by them on short notice or at any time. In December 2011, we were notified by a U.S. insurance company customer that it will not renew its contract with us, and this customer transitioned to another provider during fiscal year 2013. This contract accounted for approximately 0.8% of our total revenues in fiscal year 2013. In addition, disputes with customers may lead to delays in payments to us, terminations of agreements or litigation. Additional terminations or non-renewals of customer contracts or reductions in business from our large customers would harm our business, financial condition and results of operations.
Our industry is highly competitive, and our failure to compete effectively could result in a loss of customers and market share, which could harm our revenues and operating results.
The markets for our automobile insurance claims processing software and services are highly competitive. In the United
States, our principal competitors are CCC Information Services Group Inc. and Mitchell International Inc. In Europe, our principal competitors are EurotaxGlass’s Group, DAT GmbH and GT Motive Einsa Group. Mitchell International recently
17
consummated a strategic relationship with GT Motive Enisa Group, including an equity investment. We also encounter regional or country-specific competition in the markets for automobile insurance claims processing software and services and our
other products and services. For example Experian® is our principal competitor in the United Kingdom in the vehicle validation market, car.tv is our principal competitor in Germany in the online salvage vehicle disposition market and ChoicePoint is our principal competitor in the United States in the automobile reunderwriting solutions market. The principal competitors of SRS in the U.S. service, repair and maintenance software and solutions market are ALLDATA and the Mitchell1 repair manuals. If one or more of our competitors develop software or services that are superior to ours or are more effective in marketing their software or services, our market share could decrease, thereby reducing our revenues. In addition, if one or more of our competitors retain existing or attract new customers for which we have developed new software or services, we may not realize expected revenues from these new offerings, thereby reducing our profitability.
Some of our current or future competitors may have or develop closer customer relationships, develop stronger brands, have greater access to capital, lower cost structures and/or more attractive system design and operational capabilities than we have. Consolidation within our industry could result in the formation of competitors with substantially greater financial, management or marketing resources than we have, and such competitors could utilize their substantially greater resources and economies of scale in a manner that affects our ability to compete in the relevant market or markets. As a result of consolidation, our competitors may be able to adapt more quickly to new technologies and customer needs, devote greater resources to promoting or selling their products and services, initiate and withstand substantial price competition, expand into new markets, hire away our key employees, change or limit access to key information and systems, take advantage of acquisition or other strategic opportunities more readily and develop and expand their product and service offerings more quickly than we can. In addition, our competitors may form strategic or exclusive relationships with each other, such as the equity interest in GT Motive purchased by Mitchell International, and with other companies in attempts to compete more successfully against us. These relationships may increase our competitors’ ability, relative to ours, to address customer needs with their software and service offerings, which may enable them to rapidly increase their market share.
Moreover, many insurance companies have historically entered into agreements with automobile insurance claims processing service providers like us and our competitors whereby the insurance company agrees to use that provider on an exclusive or preferred basis for particular products and services and agrees to require collision repair facilities, independent
assessors and other vendors to use that provider. If our competitors are more successful than we are at negotiating these exclusive or preferential arrangements, we may lose market share even in markets where we retain other competitive advantages.
In addition, our insurance company customers have varying degrees of in-house development capabilities, and one or more of them have expanded and may seek to further expand their capabilities in the areas in which we operate. Many of our customers are larger and have greater financial and other resources than we do and could commit significant resources to product development. Our software and services have been, and may in the future be, replicated by our insurance company customers in-house, which could result in our loss of those customers and their associated repair facilities, independent assessors and other vendors, resulting in decreased revenues and net income.
The time and expense associated with switching from our competitors’ software and services to ours may limit our growth.
The costs for an insurance company to switch providers of claims processing software and services can be significant and the process can sometimes take 12 to 18 months to complete. As a result, potential customers may decide that it is not worth the time and expense to begin using our software and services, even if we offer competitive and economic advantages. If we are unable to convince these customers to switch to our software and services, our ability to increase market share will be limited and could harm our revenues and operating results.
Our operating results may be subject to volatility as a result of exposure to foreign currency exchange risks.
We derive most of our revenues, and incur most of our costs, in currencies other than the U.S. dollar, mainly the Euro. In our historical financial statements, we translate our local currency financial results into U.S. dollars based on average exchange rates prevailing during a reporting period for our consolidated statement of income and certain components of stockholders’ equity or the exchange rate at the end of that period for the consolidated balance sheet. These translations resulted in a net foreign currency translation adjustment of $39.1 million and $8.4 million for fiscal years 2014 and 2013, respectively. Ongoing global economic conditions have impacted currency exchange rates.
Exchange rates between most of the major foreign currencies we use to transact our business and the U.S. dollar have fluctuated significantly over the last few years and we expect that they will continue to fluctuate. The majority of our revenues
18
and costs are denominated in Euros, Pound Sterling, Swiss francs, Canadian dollars and other foreign currencies. The following table provides the average quarterly exchange rates for the Euro and Pound Sterling since the beginning of fiscal year 2013:
Period | Average Euro-to-U.S. Dollar Exchange Rate | Average Pound Sterling-to-U.S. Dollar Exchange Rate | |||||
Quarter Ended September 30, 2012 | $ | 1.25 | $ | 1.58 | |||
Quarter Ended December 31, 2012 | 1.30 | 1.61 | |||||
Quarter Ended March 31, 2013 | 1.32 | 1.55 | |||||
Quarter Ended June 30, 2013 | 1.31 | 1.54 | |||||
Quarter Ended September 30, 2013 | 1.32 | 1.55 | |||||
Quarter Ended December 31, 2013 | 1.36 | 1.62 | |||||
Quarter Ended March 31, 2014 | 1.37 | 1.65 | |||||
Quarter Ended June 30, 2014 | 1.37 | 1.68 | |||||
During fiscal year 2014, as compared to fiscal year 2013, the U.S. dollar weakened against most major foreign currencies we use to transact our business. The average U.S. dollar weakened versus the Euro by 4.9% and the Pound Sterling by 3.7%, which increased our revenues and expenses during fiscal year 2014. A hypothetical 5% increase or decrease in the U.S. dollar versus other currencies in which we transact our business would have resulted in an increase or decrease, as the case may be, to our revenues of $31.0 million during fiscal year 2014.
In April 2012, in order to hedge our exposure to variability in the Euro-denominated cash flows associated with two intercompany loans, we entered into two pay fixed Euros / received fixed U.S. dollar cross-currency swaps in the aggregate notional amount of €109.0 million. These cross-currency swaps were designated, at inception, as cash flow hedges of the intercompany loans. We report the effective portion of the gain or loss on these hedges as a component of accumulated other comprehensive income (loss) in stockholders' equity and reclassify these gains or losses into earnings when the hedged transaction affects earnings. Accordingly, any foreign exchange gain or loss recognized in our consolidated statements of income resulting from the periodic re-measurement of the intercompany loans into U.S. dollars is mitigated by an offsetting gain or loss, as the case may be, resulting from the change in the fair value of the swaps. To date, there has been no hedge ineffectiveness.
In September 2013, in order to hedge our exposure to variability in the Euro-denominated cash flows associated with two intercompany loans, we entered into two pay floating Euros / received floating U.S. dollar cross-currency swaps in the aggregate notional amount of €141.1 million. These cross-currency swaps were not designated as hedges at inception. We recognize the change in the fair value of the swaps in other (income) expense, net in our consolidated statements of income.
During the fiscal years ended June 30, 2014, 2013, and 2012, we recognized net foreign currency transaction gains (losses) in our consolidated statements of income (loss) of $11.0 million, $(5.5) million, and $(8.0) million, respectively.
Further fluctuations in exchange rates against the U.S. dollar could decrease our revenues and associated profits and, therefore, harm our future operating results.
Current uncertainty in global economic conditions makes it particularly difficult to predict product demand, utilization and other related matters and makes it more likely that our actual results could differ materially from expectations.
Our operations and performance depend on worldwide economic conditions, which have deteriorated significantly in many countries where our products and services are sold, and may remain depressed for the foreseeable future. These conditions make it difficult for our customers and potential customers to accurately forecast and plan future business activities, and could cause our customers and potential customers to slow, reduce or refrain from spending on our products. In addition, external factors that affect our business have been and may continue to be impacted by the global economic slowdown. Examples include:
• | Number of Insurance Claims Made: In fiscal year 2014, the number of insurance claims made increased slightly versus fiscal year 2013. However, in several of our large western European markets, the number of insurance claims for vehicle damage submitted by owners to their insurance carriers declined slightly. The number of insurance claims made can be influenced by factors such as unemployment levels, the number of miles driven, rising gasoline prices, |
19
the number of uninsured drivers, rising insurance premiums and insured drivers opting for lower coverage or higher deductible levels, among other things. Fewer claims made can reduce the transaction-based fees that we generate.
• | Sales of New and Used Vehicles: According to industry sources, global new vehicle sales grew by 3.7% in 2012 to 79.5 million units and by 4.2% in 2013 to 82.8 million units. In markets where automobile insurance is generally government-mandated and claims processing is automated (“advanced markets”), sales are projected to grow at 1.3% compound annual growth rate through 2020. In other markets, sales are projected to grow at 8.1% compound annual growth rate through 2020. Fewer new light vehicle sales can result in fewer insured vehicles on the road and fewer automobile accidents, which can reduce the transaction-based fees that we generate. |
• | Used Vehicle Retail and Wholesale Values: Declines in retail and wholesale used vehicle values can impact vehicle owner and insurance carrier decisions about which damaged vehicles should be repaired and which should be declared a total loss. The lower the retail and wholesale used vehicle values, the more likely it is that a greater percentage of automobiles are declared a total loss versus a partial loss. The fewer number of vehicles that owners and insurance carriers decide to repair can reduce the transaction-based fees that we generate for partial-loss estimates, but may have a beneficial impact on the transaction-based fees that we generate for total-loss estimates. |
• | Automobile Usage—Number of Miles Driven: Several factors can influence miles driven, including gasoline prices and economic conditions. According to industry sources, miles driven in the United States remained flat from January through May of calendar year 2013 compared to the same period in prior year. For calendar year 2012, cumulative miles driven in the United States increased by 0.6% compared to the same period in the prior year. For calendar year 2011, cumulative miles driven in the United States declined compared to the same period in the prior year. In calendar year 2010, the number of miles driven in the United States increased compared to calendar years 2009 and 2008. Fewer miles driven can result in fewer automobile accidents, which can reduce the transaction-based fees that we generate. |
Many of our markets around the world continue to experience or have recently experienced volatility. Accordingly, we cannot predict the timing, strength or duration of any economic slowdown or subsequent economic recovery, worldwide or in particular economic markets. These and other economic factors could have a material adverse effect on demand for or utilization of our products and on our financial condition and operating results.
We may engage in acquisitions, joint ventures, dispositions or similar transactions that could disrupt our operations, cause us to incur substantial expenses, result in dilution to our stockholders and harm our business or results of operations.
Our growth is dependent upon market growth and our ability to enhance our existing products and introduce new products on a timely basis. We have addressed and will continue to address the need to introduce new products both through internal development and through acquisitions of other companies and technologies that would complement or extend our business or enhance our technological capability. In fiscal year 2011, we acquired two businesses, including Explore. The acquisition of Explore is our largest acquisition to date. In fiscal year 2012, we acquired three businesses, substantially all of the assets of another business and a majority of the outstanding shares of a fifth business. In fiscal year 2013, we acquired six businesses and substantially all of the assets of another business. In fiscal year 2014, we acquired six businesses as well as a 50% ownership interest in SRS.
Our ability to realize the anticipated benefits of our acquisitions will depend, to a varying extent, on our ability to continue to expand the acquired business' products and services and integrate them with our products and services. Our management will be required to devote significant attention and resources to these efforts, which may disrupt our core business, the acquired business or both and, if executed ineffectively, could preclude realization of the full benefits we expect. Failure to realize the anticipated benefits of our acquisitions could cause an interruption of, or a loss of momentum in, the operations of the acquired business. In addition, the efforts required to realize the benefits of our acquisitions may result in material unanticipated problems, expenses, liabilities, competitive responses, loss of customer relationships, and the diversion of management’s attention, and may cause our stock price to decline. The risks associated with our acquisitions and future acquisitions include:
• | adverse effects on existing customer or supplier relationships, such as cancellation of orders or the loss of key customers or suppliers; |
• | difficulties in integrating or retaining key employees of the acquired company; |
20
• | difficulties in integrating the operations of the acquired company, such as information technology resources, and financial and operational data; |
• | entering geographic or product markets in which we have no or limited prior experience; |
• | difficulties in assimilating product lines or integrating technologies of the acquired company into our products; |
• | disruptions to our operations; |
• | diversion of our management’s attention; |
• | potential incompatibility of business cultures; |
• | potential dilution to existing stockholders if we issue shares of common stock or other securities as consideration in an acquisition or if we issue any such securities to finance acquisitions; |
• | prohibitions against completing acquisitions as a result of regulatory restrictions or disruptions in connection with regulatory investigations of completed acquisitions; |
• | limitations on the use of net operating losses or tax benefits; |
• | negative market perception, which could negatively affect our stock price; |
• | the assumption of debt and other liabilities, both known and unknown; and |
• | additional expenses associated with the amortization of intangible assets or impairment charges related to purchased intangibles and goodwill, or write-offs, if any, recorded as a result of the acquisition. |
Many of these factors will be outside of our control, and any one of them could result in increased costs, decreases in the amount of expected revenues and diversion of management’s time and energy.
Our merger and acquisition activities are subject to antitrust and competition laws, which laws could impact our ability to pursue strategic transactions. If we were found to violate antitrust and competition laws, we would be subject to various remedies, including divestiture of the acquired businesses. For example, we recently announced that the U.S. Federal Trade Commission (the "FTC") closed its investigation into our acquisition of Actual Systems. Pursuant to the termination of the investigation, and without admitting any violation of the law, we agreed to enter into a consent order with the FTC relating to the salvage yard management system business and effected a voluntary divestiture of the United States and Canadian businesses of Actual Systems in August 2013 to a purchaser group substantially composed of the former shareholders of Actual Systems.
We (i) participate in our SRS joint venture with an affiliate of Welsh, Carson, Anderson & Stowe ("WCAS"), (ii) participate in joint ventures in some countries and, (iii) may participate in future joint ventures. Our partners in these ventures may have interests and goals that are inconsistent with or different from ours, which could result in the joint venture taking actions that negatively impact our growth in the local market and consequently harm our business or financial condition. If we are unable to find suitable partners or if suitable partners are unwilling to enter into joint ventures with us, our growth into new geographic markets may slow, which would harm our results of operations.
Additionally, we may finance future acquisitions and acquisitions of additional interests in our SRS joint venture and/or additional joint ventures with cash from operations, additional indebtedness and/or the issuance of additional securities, any of which may impair the operation of our business or present additional risks, such as reduced liquidity or increased interest expense. For example, we financed the purchase price for the Explore acquisition with a private offering of $450.0 million aggregate principal amount of senior unsecured notes, which resulted in a decrease of our ratio of earnings to fixed charges. We may also seek to restructure our business in the future by disposing of certain of our assets, which may harm our future operating results, divert significant managerial attention from our operations and/or require us to accept non-cash consideration, the market value of which may fluctuate. The ability of WCAS to require us to purchase its equity interests in our SRS joint venture is outside of our control and, as a result, we may be required to purchase such equity interests at a time in which we would otherwise want to use such funds for another purpose, including funding capital expenditures or other strategic initiatives.
21
Failure to implement our acquisition strategy, including successfully integrating acquired businesses or joint ventures, could have an adverse effect on our business, financial condition and results of operations.
Our operating results may vary widely from period to period due to the sales cycle, seasonal fluctuations and other factors.
Our contracts with insurance companies generally require time-consuming authorization procedures by the customer, which can result in additional delays between when we incur development costs and when we begin generating revenues from those software or service offerings. In addition, we incur significant operating expenses while we are researching and designing new software and related services, and we typically do not receive corresponding payments in those same periods. As a result, the number of new software and service offerings that we are able to implement, successfully or otherwise, can cause significant variations in our cash flow from operations, and we may experience a decrease in our net income as we incur the expenses necessary to develop and design new software and services. Accordingly, our quarterly and annual revenues and operating results may fluctuate significantly from period to period.
Our business is subject to seasonal and other fluctuations. In particular, we have historically experienced higher revenues during the second quarter and third quarter versus the first quarter and fourth quarter during each fiscal year. This seasonality is caused primarily by more days of inclement weather during the second quarter and third quarter in most of our markets, which contributes to a greater number of vehicle accidents and damage during these periods. In addition, our business is subject to fluctuations caused by other factors, including the occurrence of extraordinary weather events and the timing of certain public holidays. For example, the Easter holiday occurs during the third quarter in certain fiscal years and occurs during the fourth quarter in other fiscal years, resulting in a change in the number of business days during the quarter in which the holiday occurs.
We anticipate that our revenues will continue to be subject to seasonality and therefore our financial results will vary from period to period. However, actual results from operations may or may not follow these normal seasonal patterns in a given year leading to performance that is not in alignment with expectations.
We also may experience variations in our earnings due to other factors beyond our control, such as:
• | the introduction of new software or services by our competitors; |
• | customer acceptance of new software or services; |
• | the volume of usage of our offerings by existing customers; |
• | variations of vehicle accident rates due to factors such as changes in fuel prices, number of miles driven or new vehicle purchases and their impact on vehicle usage; |
• | competitive conditions, or changes in competitive conditions, in our industry generally; |
• | prolonged system failures during which time customers cannot submit or process transactions; or |
• | prolonged interruptions in our access to third-party data incorporated in our software and services. |
We may also incur significant or unanticipated expenses when contracts expire, are terminated or are not renewed. Any of these events could harm our financial condition and results of operations and cause our stock price to decline.
22
Our industry is subject to rapid technological changes, and if we fail to keep pace with these changes, our market share and revenues will decline.
Our industry is characterized by rapidly changing technology, evolving industry standards and frequent introductions of, and enhancements to, existing software and services, all with an underlying pressure to reduce cost. Industry changes could render our offerings less attractive or obsolete, and we may be unable to make the necessary adjustments to our offerings at a competitive cost, or at all. We also incur substantial expenses in researching, developing, designing, purchasing, licensing and marketing new software and services. The development or adaptation of these new technologies may result in unanticipated expenditures and capital costs that would not be recovered in the event that our new software or services are unsuccessful. The research, development, production and marketing of new software and services are also subject to changing market requirements, access to and rights to use third-party data, the satisfaction of applicable regulatory requirements and customers’ approval procedures and other factors, each of which could prevent us from successfully marketing any new software and services or responding to competing technologies. The success of new software in our industry also often depends on the ability to be first to market, and our failure to be first to market with any particular software project could limit our ability to recover the development expenses associated with that project. If we cannot develop or acquire new technologies, software and services or any of our existing software or services are rendered obsolete, our revenues and income could decline and we may lose market share to our competitors, which would impact our future operations and financial results.
We are currently making, and anticipate making additional, strategic decisions and investments to leverage and expand our product and service offerings, including offerings in addition to the automotive sector.
We have invested, and expect to continue to invest, significant management attention and financial resources to develop, integrate and implement new business strategies, products, services, features, applications, and functionality. Such endeavors may involve significant risks and uncertainties, including distraction of management from current core operations, insufficient revenues to offset liabilities assumed and expenses associated with these new investments, inadequate return of capital on our investments, and unanticipated issues or problems that arise during our implementation of such strategies and offerings. Because these new endeavors are inherently risky, our business strategies and product and service offerings may not be successful and may adversely affect our business, financial condition and results of operations.
Some of our strategies and offerings may be outside the insurance claims industry (such as our SRS joint venture), may be outside of the automotive sector (such as our property claims business), or may be consumer-based. We have limited historical experience directly serving consumers or customers outside of the automotive sector and our products and services may not be accepted or widely utilized by such consumers or customers. These offerings may also subject us to new or additional laws and regulations (including those relating to consumer protection) and may lead to increased legal and regulatory compliance, risk and liability.
Changes in or violations by us or our customers of applicable government regulations could reduce demand for or limit our ability to provide our software and services in those jurisdictions.
Our insurance company customers are subject to extensive government regulations, mainly at the state level in the United States and at the country level in our non-U.S. markets. Some of these regulations relate directly to our software and services, including regulations governing the use of total loss and estimating software. If our insurance company customers fail to comply with new or existing insurance regulations, including those applicable to our software and services, they could lose their certifications to provide insurance and/or reduce their usage of our software and services, either of which would reduce our revenues. Also, we are subject to direct regulation in some markets, and our failure to comply with these regulations could significantly reduce our revenues or subject us to government sanctions. In addition, future regulations could force us to implement costly changes to our software and/or databases or have the effect of prohibiting or rendering less valuable one or more of our offerings. Moreover, some states in the United States have changed and are contemplating changes to their regulations to permit insurance companies to use book valuations or public source valuations for total loss calculations, making our total loss software potentially less valuable to insurance companies in those states. Some states have adopted total loss regulations that, among other things, require insurers use a methodology deemed acceptable to the respective government agency.
We submit our methodology to such agencies, and if they do not approve our methodology, we will not be able to perform total loss valuations in their respective states. Other states are considering legislation that would limit the data that our software can provide to our insurance company customers. In the event that demand for or our ability to provide our software and services decreases in particular jurisdictions due to regulatory changes, our revenues and margins may decrease.
23
There is momentum to create a U.S. federal government oversight mechanism for the insurance industry. There is also legislation under consideration by the U.S. legislature relating to the vehicle repair industry. Federal regulatory oversight of or legislation relating to the insurance industry in the United States could result in a broader impact on our business versus similar oversight or legislation at the U.S. state level.
Regulatory developments could negatively impact our business.
We acquire and distribute personal, public and non-public information, store it in our some of our databases and provide it in various forms to certain of our customers in accordance with applicable law and contracts. We are subject to government regulation and, from time to time, companies in similar lines of business to us are subject to adverse publicity concerning the use of such data. We provide many types of data and services that are subject to regulation under the Fair Credit Reporting Act, Gramm-Leach-Bliley Act, Driver’s Privacy Protection Act, Health Insurance Portability and Accountability Act, the European Union’s Data Protection Directive, the United Kingdom's Financial Services and Markets Act 2000 Order 2001, and, to a lesser extent, various other international, federal, state and local laws and regulations. These laws and regulations are designed to protect the privacy of the public and to prevent the misuse of personal information. Our suppliers that provide us with protected and regulated data face similar regulatory requirements and, consequently, they may cease to be able to provide data to us or may substantially increase the fees they charge us for this data which may make it financially burdensome or impossible for us to acquire data that is necessary to offer our certain of our products and services. Additionally, many consumer advocates, privacy advocates, and government regulators believe that the existing laws and regulations do not adequately protect privacy of personal information. They have become increasingly concerned with the use of personal information, particularly social security numbers, department of motor vehicle data and dates of birth. As a result, they are lobbying for further restrictions on the dissemination or commercial use of personal information to the public and private sectors. The following legal and regulatory developments also could have a material adverse affect on our business, financial position, results of operations or cash flows:
• | amendment, enactment, or interpretation of laws and regulations which restrict the access, use and distribution of personal information and limit the supply of data available to customers; |
• | changes in cultural and consumer attitudes to favor further restrictions on information collection and sharing, which may lead to regulations that prevent full utilization of our services; |
• | failure of our services to comply with current or amended laws and regulations; and |
• | failure of our services to adapt to changes in the regulatory environment in an operational effective, efficient, cost-effective manner. |
We require a significant amount of cash to service our indebtedness, which reduces the cash available to finance our organic growth, make strategic acquisitions and enter into alliances and joint ventures; our bond indentures contain restrictive covenants that limit our ability to engage in certain activities.
We have a significant amount of indebtedness. As of June 30, 2014, our indebtedness, including current maturities, was $1.9 billion, which consists of $1.5 billion related to the 2021 Senior Notes and $340.0 million related to the 2023 Senior Notes. In July 2013, we completed a private offering of an additional $850.0 million aggregate principal amount of senior unsecured notes. A portion of the proceeds from the July 2013 issuance of senior unsecured notes were used to repay the outstanding term loans under a previously existing credit facility that was terminated subsequent to the repayment.
In November 2013, we completed a private offering of an additional $510.0 million aggregate principal amount of 2021 Senior Notes and $340.0 million in aggregate principal amount of 2023 Senior Notes. The proceeds from such offerings were used to redeem all of our outstanding 2018 Senior Notes.
In June 2014, we completed a private offering of an additional $150.0 million aggregate principal amount of senior unsecured notes.
During fiscal year 2014, our aggregate interest expense was $107.4 million and cash paid for interest was $117.0 million. As a result of our issuance of senior unsecured notes in July 2013, November 2013 and June 2014, we expect our interest expense and cash interest expense to increase in fiscal year 2015 as compared to previous periods.
Our indebtedness could:
24
• | make us more vulnerable to unfavorable economic conditions and reduce our revenues; |
• | make it more difficult to obtain additional financing in the future for working capital, capital expenditures or other general corporate purposes; |
• | require us to dedicate or reserve a large portion of our cash flow from operations for making payments on our indebtedness which would prevent us from using it for other purposes including product development; |
• | to the extent that we have variable rate debt that is not covered by interest rate derivative agreements, make us susceptible to fluctuations in market interest rates that affect the cost of our borrowings; and |
• | make it more difficult to pursue strategic acquisitions, joint ventures, alliances and collaborations. |
Our ability to service our indebtedness will depend on our future performance, which will be affected by prevailing economic conditions and financial, business, regulatory and other factors. Some of these factors are beyond our control. If we cannot generate sufficient cash flow from operations to service our indebtedness and to meet our other obligations and commitments, we may be required to refinance our debt, to dispose of assets or to repatriate foreign earnings to obtain funds for such purpose. We cannot assure you that debt refinancings or asset dispositions could be completed on a timely basis or on satisfactory terms, if at all, or would be permitted by the terms of our debt instruments. If we were to repatriate foreign earnings, we would incur incremental U.S. federal and state income taxes.
Our bond indentures contain covenants that restrict our and our subsidiaries' ability to incur certain liens, engage in sale and leaseback transactions and consolidate, merge with, or convey, transfer or lease substantially all of our or their assets to, another person, and, in the case of any of our subsidiaries that did not issue or guarantee our senior notes, incur indebtedness.
Our failure to comply with any of these covenants could result in the acceleration of our outstanding indebtedness. If acceleration occurs, we would not be able to repay our debt and it is unlikely that we would be able to borrow sufficient additional funds to refinance our debt. Even if new financing is made available to us, it may not be available on acceptable or reasonable terms. An acceleration of our indebtedness would impair our ability to operate as a going concern.
Pursuant to agreements entered into prior to the CSG Acquisition, the noncontrolling stockholders of certain of our majority-owned subsidiaries have the right to require us to redeem their shares at the then fair market value. For financial statement reporting purposes, the estimated fair market value of these redeemable noncontrolling interests was $86.0 million at June 30, 2014.
We are active in 70 countries, where we are subject to country-specific risks that could adversely impact our business and results of operations.
During fiscal year 2014 and 2013, we generated approximately 63% and 68% of our revenues, respectively, outside the U.S. and we expect revenues from non-U.S. markets to continue to represent a majority of our total revenues. Business and operations in individual countries are subject to changes in local government regulations and policies, including those related to tariffs and trade barriers, investments, taxation, currency exchange controls and repatriation of earnings. Our results are also subject to the difficulties of coordinating our activities across 70 different countries. Furthermore, our business strategy includes expansion of our operations into new and developing markets, which will require even greater international coordination, expose us to additional local government regulations and involve markets in which we do not have experience or established operations. In addition, our operations in each country are vulnerable to changes in socio-economic conditions and monetary and fiscal policies, intellectual property protection disputes, the settlement of legal disputes through foreign legal systems, the collection of receivables through foreign legal systems, exposure to possible expropriation or other governmental actions, unsettled political conditions, possible terrorist attacks and pandemic disease. These and other factors may harm our operations in those countries and therefore our business, financial condition and results of operations.
We have a large amount of goodwill and other intangible assets as a result of acquisitions. Our earnings will be harmed if we suffer an impairment of our goodwill or other intangible assets.
We have a large amount of goodwill and other intangible assets and are required to perform an annual, or in certain situations a more frequent, assessment for possible impairment for accounting purposes. At June 30, 2014, we had goodwill and other intangible assets of $2.2 billion, or approximately 64% of our total assets. If we do not achieve our planned operating results or other factors impair these assets, we may be required to incur a non-cash impairment charge. Any impairment charges in the future will adversely affect our results of operations.
25
We may incur significant restructuring and severance charges in future periods, which would harm our operating results and cash position or increase debt.
We incurred restructuring charges of $6.5 million and $5.4 million during fiscal years 2014 and 2013, respectively. These charges consist primarily of relocation and termination benefits paid or to be paid to employees, lease obligations associated with vacated facilities and other costs incurred related to our restructuring initiatives. As of June 30, 2014, our remaining restructuring and severance obligations associated with these restructuring initiatives were $1.3 million.
We regularly evaluate our existing operations and capacity, and we expect to incur additional restructuring charges as a result of future personnel reductions, related restructuring, and productivity and technology enhancements, which could exceed the levels of our historical charges. In addition, we may incur certain unforeseen costs as existing or future restructuring activities are implemented. Any of these potential charges could harm our operating results and significantly reduce our cash position.
Our software and services rely on information generated by third parties and any interruption of our access to such information could materially harm our operating results.
We believe that our success depends significantly on our ability to provide our customers access to data from many different sources. For example, a substantial portion of the data used in our repair estimating software is derived from parts and repair data provided by, among others, original equipment manufacturers, or OEMs, aftermarket parts suppliers, data aggregators, automobile dealerships, government organizations and vehicle repair facilities. We obtain much of our data about vehicle parts and components and collision repair labor and costs through license agreements with OEMs, automobile dealers, and other providers; and we obtain much of our data in our vehicle validation database and motor violation database from government organizations. EurotaxGlass’s Group, one of our primary competitors in Europe, provides us with valuation and paint data for use in our European markets pursuant to a similar arrangement, and Mitchell International, one of our primary competitors in the United States, provides us with vehicle glass data for use in our U.S. markets pursuant to a similar arrangement. In some cases, the data included in our products and services is licensed from sole-source suppliers. Many of the license agreements through which we obtain data are for terms of one year and may be terminated without cost to the provider on short notice.
We are in discussions with Mitchell International regarding the vehicle glass data license agreement following our receipt of a notice of termination of the agreement. We continue to investigate Mitchell International's claim that we have breached the agreement, and we cannot be certain about the outcome of these discussions or our continued access to the data.
If one or more of our licenses are terminated or if we are unable to renew one or more of these licenses on favorable terms or at all, we may be unable to access the information (in the case of information licensed from sole-service suppliers) or unable to access alternative data sources that would provide comparable information without incurring substantial additional costs. Some OEM sources have indicated to us that they intend to materially increase the licensing costs for their data. While we do not believe that our access to many of the individual sources of data is material to our operations, prolonged industry-wide price increases or reductions in data availability could make receiving certain data more difficult and could result in significant cost increases, which would materially harm our operating results.
System failures, delays and other problems could harm our reputation and business, cause us to lose customers and expose us to customer liability.
Our success depends on our ability to provide accurate, consistent and reliable services and information to our customers on a timely basis. Our operations could be interrupted by any damage to or failure of:
• | our computer software or hardware or our customers’ or third-party service providers’ computer software or hardware; |
• | our networks, our customers’ networks or our third-party service providers’ networks; and |
• | our connections to and outsourced service arrangements with third parties, such as Acxiom, which hosts data and applications for us and our customers. |
Our systems and operations are also vulnerable to damage or interruption from:
26
• | power loss or other telecommunications failures; |
• | earthquakes, fires, floods, hurricanes and other natural disasters; |
• | computer viruses or software defects; |
• | physical or electronic break-ins, sabotage, intentional acts of vandalism and similar events; and |
• | errors by our employees or third-party service providers. |
As part of our ongoing process improvements efforts, we have and will continue to migrate product and system platforms to next generation platforms and we may increase data and applications that we host ourselves, and the risks noted above will be exacerbated by these efforts. Because many of our services play a mission-critical role for our customers, any damage to or failure of the infrastructure we rely on (even if temporary), including those of our customers and vendors, could disrupt our ability to deliver information to and provide services for our customers in a timely manner, which could harm our reputation and result in the loss of current and/or potential customers or reduced business from current customers. In addition, we generally indemnify our customers to a limited extent for damages they sustain related to the unavailability of, or errors in, the software and services we provide; therefore, a significant interruption of, or errors in, our software and services could expose us to significant customer liability.
Fraudulent data access and other security breaches may negatively impact our business and harm our reputation.
Security breaches in our facilities, computer networks, and databases may cause harm to our business and reputation and result in a loss of customers and data suppliers. Our systems may be vulnerable to physical break-ins, computer viruses, attacks by hackers and similar disruptive problems. If users gain improper access to our databases, they may be able to steal, publish, delete or modify confidential third-party information that is stored or transmitted on our networks.
In addition, customers’ misuse of our information services could cause harm to our business and reputation and result in loss of customers. Any such misappropriation and/or misuse of our information could result in us, among other things, being in breach of certain data protection and related legislation.
A security or privacy breach may affect us in the following ways:
• | deterring customers from using our solutions; |
• | deterring data suppliers from supplying data to us; |
• | harming our reputation; |
• | exposing us to liability; |
• | increasing operating expenses to correct problems caused by the breach; |
• | affecting our ability to meet customers’ expectations; or |
• | causing inquiry from governmental authorities. |
We may detect incidents in which consumer data has been fraudulently or improperly acquired. The number of potentially affected consumers identified by any future incidents is obviously unknown. Any such incident could materially and adversely affect our business, reputation, financial condition, operating results and cash flows.
Privacy concerns could require us to exclude data from our software and services, which may reduce the value of our offerings to our customers, damage our reputation and deter current and potential users from using our software and services.
In the United States, European Union and other jurisdictions, there are significant restrictions on the use of personal and consumer data. Our violations of these laws could harm our business. In addition, these restrictions may place limits on the information that we can collect from and provide to our customers. Furthermore, concerns about our collection, use or sharing
27
of automobile insurance claims information, moving violation information or other privacy-related matters, even if unfounded, could damage our reputation and operating results.
We depend on a limited number of key personnel who would be difficult to replace. If we lose the services of these individuals, or are unable to attract new talent, our business will be adversely affected.
We depend upon the ability and experience of our key personnel, who have substantial experience with our operations, the rapidly changing automobile insurance claims processing industry and the markets in which we offer our software and services. The loss of the services of one or more of our senior executives or key employees, particularly our Chairman of the Board, Chief Executive Officer and President, Tony Aquila, could harm our business and operations.
Our success depends on our ability to continue to attract, manage and retain other qualified management, sales and technical personnel as we grow. We may not be able to continue to attract or retain such personnel in the future.
We may require additional capital in the future, which may not be available on favorable terms, or at all.
Our future capital requirements depend on many factors, including our ability to develop and market new software and services and to generate revenues at levels sufficient to cover ongoing expenses or possible acquisition or similar transactions. If we need to raise additional capital, equity or debt financing may not be available at all or may be available only on terms that are not favorable to us. In the case of equity financings, dilution to our stockholders could result, and in any case such securities may have rights, preferences and privileges that are senior to our outstanding common stock. In the case of debt financings, we may have to grant additional security interests in our assets to lenders and agree to restrictive business and operating covenants. If we cannot obtain adequate capital on favorable terms or at all, we may be unable to support future growth or operating requirements and, accordingly, our business, financial condition and results of operations could be harmed.
Our business depends on our brands, and if we are not able to maintain and enhance our brands, our business and operating results could be harmed.
We believe that the brand identity we have developed and acquired has significantly contributed to the success of our business. We also believe that maintaining and enhancing our brands, such as Audatex, ABZ, Hollander, Informex, Sidexa, HPI, AUTOonline, Market Scan, IMS, Identifix, AutoPoint and Explore, are critical to the expansion of our software and services to new customers in both existing and new markets. Maintaining and enhancing our brands may require us to make substantial investments and these investments may not be successful. If we fail to promote and maintain our brands or if we incur excessive expenses in this effort, our business, operating results and financial condition will be harmed. We anticipate that, as our markets become increasingly competitive, maintaining and enhancing our brands may become increasingly difficult and expensive. Maintaining and enhancing our brands will depend largely on our ability to be a technology innovator, to continue to provide high quality software and services and protect and defend our brand names and trademarks, which we may not do successfully. To date, we have not engaged in extensive direct brand promotion activities, and we may not successfully implement brand enhancement efforts in the future.
Third parties may claim that we are infringing upon their intellectual property rights, and we could be prevented from selling our software or suffer significant litigation expense even if these claims have no merit.
Our competitive position is driven in part by our intellectual property and other proprietary rights. Third parties, however, may claim that our software, products or technology, including claims data or other data, which we obtain from other parties, are infringing or otherwise violating their intellectual property rights. We may also develop software, products or technology, unaware of pending patent applications of others, which software products or technology may infringe a third party patent once that patent is issued. Any claims of intellectual property infringement or other violation, even claims without merit, could be costly and time-consuming to defend and could divert our management and key personnel from operating our business. In addition, if any third party has a meritorious or successful claim that we are infringing or violating its intellectual property rights, we may be forced to change our software or enter into licensing arrangements with third parties, which may be costly or impractical. These claims may also require us to stop selling our software and/or services as currently designed, which could harm our competitive position. We also may be subject to significant damages or injunctions that prevent the further development and sale of certain of our software or services and may result in a material loss in revenue. Currently, one of our trademarks is subject to a nullification proceeding in front of the Brazil trademark authority.
28
We may be unable to protect our intellectual property and property rights, either without incurring significant costs or at all, which would harm our business.
We rely on a combination of trade secrets, copyrights, know-how, trademarks, patents, license agreements and contractual provisions, as well as internal procedures, to establish and protect our intellectual property rights. The steps we have taken and will take to protect our intellectual property rights may not deter infringement, duplication, misappropriation or violation of our intellectual property by third parties. In addition, any of the intellectual property we own or license from third parties may be challenged, invalidated, circumvented or rendered unenforceable, or may not be of sufficient scope or strength to provide us with any meaningful information. Furthermore, because of the differences in foreign patent, trademark and other laws concerning proprietary rights, our software and other intellectual property rights may not receive the same degree of protection in foreign countries as they would in the U.S., if at all. We may be unable to protect our rights in trade secrets and unpatented proprietary technology in these countries. We may also be unable to prevent the unauthorized disclosure or use of our technical knowledge, trade secrets or other proprietary information by consultants, vendors, former employees or current employees, despite the existence of nondisclosure and confidentiality agreements, intellectual property assignments and other contractual restrictions. It is also possible that others will independently develop the technology that is the same or similar to ours. If our trade secrets and other proprietary information become known or we are unable to maintain the proprietary nature of our intellectual property, we may not receive any return on the resources expended to create the intellectual property or generate any competitive advantage based on it.
We rely on our brands to distinguish our products and services from the products and services of our competitors, and have registered or applied to register trademarks covering many of these brands. We cannot assure you that our trademark applications will be approved. Third parties may also oppose our trademark applications, or otherwise challenge our use of the trademarks. In the event that our trademarks are successfully challenged, we could be forced to rebrand our products and services, which could result in loss of brand recognition, and could require us to devote resources advertising and marketing new brands.
Third parties, including competitors, may infringe our intellectual property right and we may not have adequate resources to enforce our intellectual property rights. Pursuing infringers of our intellectual property could result in significant monetary costs and diversion of management resources, and any failure to pursue or successfully litigate claims against infringers or otherwise enforce our intellectual property rights could result in competitors using our technology and offering similar products and services, potentially resulting in loss of our competitive advantage and decreased revenues.
Currently, we believe that one or more of our customers in our EMEA segment may be infringing our intellectual property by making and distributing unauthorized copies of our software. We have also filed a trademark revocation application with the European Union trademark authority seeking revocation of a registered trademark held by a company in the United Kingdom that is similar to one of the trademarks we use. Enforcement of our intellectual property rights may be difficult and may require considerable resources.
Our lawsuit against Mitchell International, Inc. for patent infringement will be costly to litigate, could be decided adversely to us, and could adversely affect our intellectual property rights, distract our management and technical staff, and cause our stock price to decline.
On February 6, 2012, we filed a lawsuit against Mitchell International, Inc. in the United States District Court for the District of Delaware for infringement of one of our U.S. patents. We expect that our lawsuit, if we cannot resolve it before trial, could require several years to litigate, and at this stage we cannot predict the duration or cost of such litigation. We also expect that our lawsuit, even if it is determined in our favor or settled by us on favorable terms, will be costly to litigate, and that the cost of such litigation could have an adverse financial impact on our operating results. The litigation could also distract our management team and technical personnel from our other business operations, to the detriment of our business results. It is possible that we might not prevail in our lawsuit against Mitchell International, in which case our costs of litigation would not be recovered, and we could effectively lose some of our patent rights. It is also possible that Mitchell International might respond to our lawsuit by asserting counterclaims against us. Delays in the litigation, and any or all of these potential adverse results, could cause a substantial decline in our stock price.
Current or future litigation could have a material adverse impact on us.
We have been and continue to be involved in legal proceedings, claims and other litigation that arise in the ordinary course of business. For example, we have been involved in disputes with collision repair facilities, acting individually and as a group in some situations that claim that we have colluded with our insurance company customers to depress the repair time estimates generated by our repair estimating software. We have also been involved in litigation alleging that we have colluded
29
with our insurance company customers to cause the estimates of vehicle fair market value generated by our total loss estimation software to be unfairly low. On February 28, 2014, Solera, Explore, and Audatex North America, Inc. were each served with a civil complaint filed against them and another defendant by an insurance company third party claimant in Minnesota state court. The complaint seeks state-wide class action status for similarly situated claimants, claiming that the defendant’s methodology for determining the value of total loss vehicles violates Minnesota law. We filed a motion to dismiss on April 18, 2014. The complaint was subsequently removed to the U.S. District Court for the District of Minnesota and an amended complaint was filed on July 16, 2014. We and our co-defendant have moved to dismiss the amended complaint. Furthermore, we are also subject to assertions by our customers and strategic partners that we have not complied with the terms of our agreements with them or that the agreements are not enforceable against them, some of which are the subject of pending litigation and any of which could in the future lead to arbitration or litigation. While we do not expect the outcome of any such pending or threatened litigation to have a material adverse effect on our financial position, litigation is unpredictable and excessive verdicts, both in the form of monetary damages and injunction, could occur. In the future, we could incur judgments or enter into settlements of claims that could harm our financial position and results of operations.
We are subject to periodic changes in the amount of our income tax provision (benefit) and these changes could adversely affect our operating results; we may not be able to utilize all of our tax benefits before they expire.
Our effective tax rate could be adversely affected by our mix of earnings in countries with high versus low tax rates; by changes in the valuation of our deferred tax assets and liabilities; by a change in our assertion that our foreign earnings are indefinitely reinvested; by the outcomes of examinations, audits or disputes by or with relevant tax authorities; or by changes in tax laws and regulations.
For purposes of concluding our domestic deferred tax assets are more-likely-than-not realizable we currently rely on Subpart F income as a source of future taxable income. A change in U.S. tax law that would reduce Subpart F income, and accordingly future taxable income, would require us to assess the need for a valuation allowance against our domestic deferred tax assets.
Significant judgment is required to determine the recognition and measurement attributes prescribed in ASC Topic No. 740-10, Income Taxes. In addition, ASC Topic No. 740-10 applies to all income tax positions, including the potential recovery of previously paid taxes, which if settled unfavorably could adversely impact our provision for income taxes or additional paid-in capital.
We began paying dividends in fiscal year 2010 and we may not be able to pay dividends on our common stock and restricted stock units in the future; as a result, your only opportunity to achieve a return on your investment may be if the price of our common stock appreciates.
We began paying quarterly cash dividends to holders of our outstanding of common stock and restricted stock units in the quarter ended September 30, 2009. On August 26, 2014, we announced that our Board of Directors approved the payment of a quarterly cash dividend of $0.195 per outstanding share of common stock and per outstanding restricted stock unit. The Board of Directors also approved a quarterly stock dividend equivalent of $0.195 per outstanding restricted stock unit granted to certain of our executive officers since fiscal year 2011 in lieu of the cash dividend, which dividend equivalent will be paid to the restricted stock unit holders as the restricted stock unit vests. The dividends are payable on September 23, 2014 to stockholders and restricted stock unit holders of record at the close of business on September 9, 2014. Any determination to pay dividends in future periods will be at the discretion of our Board of Directors. Our ability to pay dividends to holders of our common stock and restricted stock units in future periods may be limited by restrictive covenants under our Amended Credit Facility and the indenture for the senior unsecured notes. As a result, your only opportunity to achieve a return on your investment in us could be if the market price of our common stock appreciates and you sell your shares at a profit. We cannot assure you that the market price for our common stock will ever exceed the price that you pay.
Requirements associated with being a public company increase our costs significantly, as well as divert significant company resources and management attention.
The expenses that are required as a result of being a public company are and will likely continue to be material. Compliance with the various reporting and other requirements applicable to public companies also require considerable time and attention of management. In addition, any changes we make may not be sufficient to allow us to satisfy our obligations as a public company on a timely basis.
We continue to work with our legal, independent accounting and financial advisors to identify those areas in which changes should be made to our financial and management control systems to manage our growth and our obligations as a
30
public company. These areas include corporate governance, corporate control, internal audit, disclosure controls and procedures and financial reporting and accounting systems. We have made, and will continue to make, changes in these and other areas. In addition, we are taking steps to address new U.S. federal legislation relating to corporate governance matters and are monitoring other proposed and recently-enacted U.S. federal and state legislation relating to corporate governance and other regulatory matters and how the legislation could affect our obligations as a public company.
In addition, being a public company could make it more difficult or more costly for us to obtain certain types of insurance, including directors’ and officers’ liability insurance, and we may be forced to accept reduced policy limits and coverage or incur substantially higher costs to obtain the same or similar coverage. The impact of these events could also make it more difficult for us to attract and retain qualified persons to serve on our board of directors, our board committees or as executive officers.
Our certificate of incorporation and by-laws contain provisions that could discourage another company from acquiring us and may prevent attempts by our stockholders to replace or remove our current management.
Some provisions of our certificate of incorporation and by-laws may have the effect of delaying, discouraging or preventing a merger or acquisition that our stockholders may consider favorable, including transactions in which stockholders may receive a premium for their shares. In addition, these provisions may frustrate or prevent any attempts by our stockholders to replace or remove our current management by making it more difficult for stockholders to replace or remove our board of directors. These provisions include:
• | authorization of the issuance of “blank check” preferred stock without the need for action by stockholders; |
• | the removal of directors only by the affirmative vote of the holders of two-thirds of the shares of our capital stock entitled to vote; |
• | any vacancy on the board of directors, however occurring, including a vacancy resulting from an enlargement of the board, may only be filled by vote of the directors then in office; |
• | inability of stockholders to call special meetings of stockholders and limited ability of stockholders to take action by written consent; and |
• | advance notice requirements for board nominations and proposing matters to be acted on by stockholders at stockholder meetings. |
We are monitoring proposed U.S. federal and state legislation relating to stockholder rights and related regulatory matters and how the legislation could affect, among other things, the nomination and election of directors and our charter documents.
ITEM 1B. | UNRESOLVED STAFF COMMENTS |
None.
ITEM 2. | PROPERTIES |
Our Corporate headquarters are located in Westlake, Texas, where we currently lease approximately 15,000 square feet of space.
Our principal leased EMEA facilities are located in Zurich, Switzerland and Zeist, the Netherlands. Our principal leased Americas facilities are located in San Diego, California; Ann Arbor, Michigan; Plymouth and Eagan, Minnesota; and Milwaukie, Oregon. We also lease a number of other facilities in countries where we operate. We own real estate in Brussels, Belgium; Reading, United Kingdom; Salisbury, United Kingdom; and Harrogate, United Kingdom.
We believe that our existing space is adequate for our current operations. We believe that suitable replacement and additional space, if necessary, will be available in the future on commercially reasonable terms.
ITEM 3. | LEGAL PROCEEDINGS |
In the normal course of business, various claims, charges and litigation are asserted or commenced against us, including:
31
• | We have been the subject of allegations that our repair estimating and total loss software and services produced results that favored our insurance company customers, one of which is the subject of pending litigation. |
• | We are subject to assertions by our customers, suppliers and strategic partners that we have not complied with the terms of our agreements with them or our agreements with them are not enforceable. |
We have and will continue to vigorously defend ourselves against these claims. We believe that final judgments, if any, which may be rendered against us in current litigation, are adequately reserved for, covered by insurance or would not have a material adverse effect on our financial position.
ITEM 4. | MINE SAFETY DISCLOSURES |
None.
32
PART II
ITEM 5. | MARKET FOR REGISTRANT’S COMMON EQUITY, RELATED STOCKHOLDER MATTERS AND ISSUER PURCHASES OF EQUITY SECURITIES |
Market Information
Our common stock has been traded on The New York Stock Exchange since May 16, 2007 under the symbol “SLH”. Prior to that time, there was no public market for our common stock. The following table sets forth the high and low sales prices for our common stock as reported on the New York Stock Exchange for the periods indicated.
Fiscal Year 2014: | High | Low | |||||
First Quarter | $ | 58.29 | $ | 51.00 | |||
Second Quarter | $ | 70.76 | $ | 52.66 | |||
Third Quarter | $ | 70.41 | $ | 62.55 | |||
Fourth Quarter | $ | 67.76 | $ | 61.71 | |||
Fiscal Year 2013: | |||||||
First Quarter | $ | 44.94 | $ | 36.81 | |||
Second Quarter | $ | 54.36 | $ | 43.03 | |||
Third Quarter | $ | 58.75 | $ | 52.87 | |||
Fourth Quarter | $ | 58.15 | $ | 51.13 | |||
Holders of Record
As of August 21, 2014, there were approximately 7 holders of record of our common stock, which is not reflective of the beneficial owners of our common stock.
Dividends
In fiscal years 2014 and 2013, we paid quarterly cash dividends of $0.17 and $0.125, respectively, per share outstanding of common stock and per outstanding restricted stock unit to stockholders and restricted stock unit holders of record. We also issued quarterly stock dividend equivalents of $0.17 per outstanding restricted stock unit granted to certain of our executive officers since fiscal year 2011 in lieu of the cash dividend, which dividend equivalent will be paid to the restricted stock unit holders as the restricted stock unit vests. Cash dividends paid in fiscal years 2014 and 2013 were as follows (in thousands, except per share data):
Fiscal Year 2014: | Per Share | Total | Cumulative by Fiscal Year | |||||||
First Quarter | 0.17 | $ | 11,800 | $ | 11,800 | |||||
Second Quarter | 0.17 | 11,825 | 23,625 | |||||||
Third Quarter | 0.17 | 11,813 | 35,438 | |||||||
Fourth Quarter | 0.17 | 11,769 | 47,207 | |||||||
0.68 | $ | 47,207 | ||||||||
Fiscal Year 2013: | ||||||||||
First Quarter | 0.125 | $ | 8,682 | $ | 8,682 | |||||
Second Quarter | 0.125 | 8,700 | 17,382 | |||||||
Third Quarter | 0.125 | 8,724 | 26,106 | |||||||
Fourth Quarter | 0.125 | 8,708 | 34,814 | |||||||
0.500 | $ | 34,814 | ||||||||
On August 26, 2014, we announced that our Board of Directors approved the payment of a quarterly cash dividend of $0.195 per outstanding share of common stock and per outstanding restricted stock unit. The Board of Directors also approved a quarterly stock dividend equivalent of $0.195 per outstanding restricted stock unit granted to certain of our executive officers
33
since fiscal year 2011 in lieu of the cash dividend, which dividend equivalent will be paid to the restricted stock unit holders as the restricted stock unit vests. Any determination to pay dividends in future periods will be at the discretion of our board of directors.
Unregistered Sales of Equity Securities
None.
Equity Compensation Plan Information
The following table sets forth certain information regarding our equity compensation plans as of June 30, 2014 (shares in thousands):
Plan Category | Number of securities to be issued upon exercise of outstanding options purchase rights and vesting of restricted stock units | Weighted-average exercise price of outstanding options and unvested restricted stock units | Number of securities remaining available for future issuance under equity compensation plans | ||||||
Equity compensation plans approved by stockholders: | |||||||||
2006 Securities Purchase Plan | — | $ | — | — | |||||
2007 Long-Term Equity Incentive Plan (1) | 152 | 22.72 | — | ||||||
2007 Employee Stock Purchase Plan | — | — | 1,403 | ||||||
2008 Omnibus Equity Incentive Plan (1) | 4,948 | (2) | 51.35 | 3,972 | (3) | ||||
Equity compensation plans not approved by stockholders | — | — | — | ||||||
Total | 5,100 | 5,375 | |||||||
(1) | Following our stockholders’ approval of the 2008 Omnibus Equity Incentive Plan (the “2008 Plan”) on November 12, 2008, we ceased granting equity awards under our 2007 Long-Term Equity Incentive Plan (the “2007 Plan”). All equity awards granted after November 12, 2008 have been granted pursuant to the 2008 Plan. Subject to certain exceptions, all outstanding equity awards under the 2007 Plan that are forfeited, expired or settled in cash will be returned to and made available for issuance under the 2008 Plan. Under the 2008 Plan, each award granted, other than stock options and stock appreciation rights, reduces the number of securities available for issuance under the 2008 Plan by 2.05 shares. |
(2) | Assumes the target amount of outstanding performance share units will be earned. |
(3) | Reflects the maximum amount of performance share units that could be earned. |
Performance Graph
The following graph compares our cumulative total stockholder return on our common stock with the cumulative total returns of the Russell 2000 Index and an aggregate of peer issuers in the information services industry. The peer issuers used for this graph are The Thomson Corporation, Equifax Inc., The Dun & Bradstreet Corporation, FactSet Research Systems Inc., Fair Isaac Corporation, DealerTrack Holdings, Inc. and CoStar Group, Inc. Each peer issuer was weighted according to its respective capitalization on May 16, 2007, the date our common stock began trading on the New York Stock Exchange.
34
The graph assumes that the value of the investment in our common stock and each index was $100 on May 16, 2007.
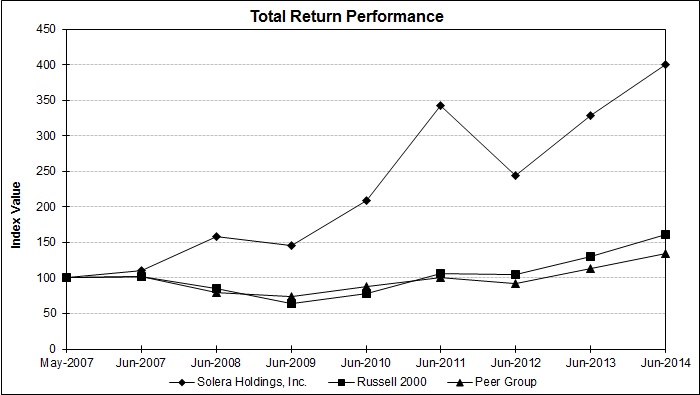
Cumulative Total Return | |||||||||||
Solera Holdings, Inc. | Russell 2000 Index | Information Service Peers | |||||||||
May 16, 2007 | $ | 100.00 | $ | 100.00 | $ | 100.00 | |||||
June 29, 2007 | $ | 110.74 | $ | 101.82 | $ | 101.97 | |||||
June 29, 2008 | $ | 158.06 | $ | 85.33 | $ | 79.75 | |||||
June 30, 2009 | $ | 145.14 | $ | 63.99 | $ | 73.38 | |||||
June 30, 2010 | $ | 208.44 | $ | 77.73 | $ | 87.56 | |||||
June 30, 2011 | $ | 342.72 | $ | 106.81 | $ | 101.20 | |||||
June 30, 2012 | $ | 244.06 | $ | 104.59 | $ | 92.38 | |||||
June 30, 2013 | $ | 328.27 | $ | 129.91 | $ | 113.72 | |||||
June 30, 2014 | $ | 400.51 | $ | 160.62 | $ | 134.98 | |||||
The information in the graph and table above is not “soliciting material,” is not deemed “filed” with the Securities and Exchange Commission and is not to be incorporated by reference in any of our filings under the Securities Act of 1933, as amended, or the Securities Exchange Act of 1934, as amended, whether made before or after the date of this Annual Report on Form 10-K, except to the extent that we specifically incorporate such information by reference.
Issuer Purchases of Equity Securities
In November 2011, our Board of Directors approved a share repurchase program for up to a total of $180.0 million of our common stock through November 2013. In October 2013, our Board of Directors approved a new share repurchase program, replacing the share repurchase program authorized in November 2011, for up to a total of $200.0 million of our common stock through November 10, 2015. Share repurchases are made from time to time, through an accelerated stock purchase agreement, in open market transactions at prevailing market prices or in privately negotiated transactions. The repurchase program does not require us to purchase any specific number or amount of shares, and the timing and amount of such purchases will be determined by management based upon market conditions and other factors. In addition, the program may be amended or terminated at the discretion of our Board of Directors. The following table provides the amount of shares repurchased under the new repurchase program during each month to date (in thousands, except per share amounts):
35
Total Number of Shares Purchased | Average Price Paid per Share | Total Number of Shares Purchased as Part of Publicly Announced Plans or Programs | Maximum Approximate Dollar Value of Shares that May Yet Be Purchased Under the Plans or Programs (in thousands) | ||||||||||
October 2013 | — | $ | — | — | $ | 200,000 | |||||||
November 2013 | 136 | $ | 64.73 | 136 | $ | 191,183 | |||||||
December 2013 | 14 | $ | 68.43 | 14 | $ | 190,236 | |||||||
January 2014 | — | $ | — | — | $ | 190,236 | |||||||
February 2014 | 250 | $ | 66.91 | 250 | $ | 173,503 | |||||||
March 2014 | 50 | $ | 66.74 | 50 | $ | 170,165 | |||||||
April 2014 | — | $ | — | — | $ | 170,165 | |||||||
May 2014 | 153 | $ | 66.45 | 153 | $ | 159,974 | |||||||
June 2014 | 195 | $ | 65.61 | 195 | $ | 147,171 | |||||||
Total | 798 | $ | 66.15 | 798 | $ | 147,171 | |||||||
ITEM 6. | SELECTED FINANCIAL DATA |
The following table sets forth selected historical financial information regarding our business and should be read in conjunction with Item 7. “Management’s Discussion and Analysis of Financial Condition and Results of Operations” and our consolidated financial statements and the related notes included elsewhere in this Annual Report on Form 10-K.
36
Our results of operations include the results of operations of acquired companies from the date of the respective acquisitions.
Fiscal Years Ended June 30, | |||||||||||||||||||
2014 (1) | 2013 (2) | 2012 (3) | 2011 (4) | 2010 (5) | |||||||||||||||
Statement of Income Data: | |||||||||||||||||||
Revenues | $ | 987,259 | $ | 838,103 | $ | 790,207 | $ | 684,697 | $ | 631,348 | |||||||||
Cost of revenues: | |||||||||||||||||||
Operating expenses | 222,262 | 181,448 | 171,763 | 134,649 | 130,852 | ||||||||||||||
Systems development and programming costs | 90,735 | 79,083 | 73,914 | 68,932 | 67,926 | ||||||||||||||
Total cost of revenues (excluding depreciation and amortization) | 312,997 | 260,531 | 245,677 | 203,581 | 198,778 | ||||||||||||||
Selling, general and administrative expenses | 259,786 | 208,989 | 188,245 | 174,122 | 160,955 | ||||||||||||||
Share-based compensation expense | 37,515 | 25,753 | 18,394 | 13,579 | 9,607 | ||||||||||||||
Depreciation and amortization | 122,283 | 103,239 | 103,510 | 83,088 | 88,978 | ||||||||||||||
Restructuring charges, asset impairments, and other costs associated with exit and disposal activities | 6,527 | 5,435 | 7,057 | 7,093 | 5,910 | ||||||||||||||
Acquisition and related costs | 41,512 | 26,945 | 7,962 | 9,687 | 4,032 | ||||||||||||||
Interest expense | 107,422 | 69,511 | 53,593 | 31,102 | 32,782 | ||||||||||||||
Other expense, net (6) | 63,991 | 1,860 | 1,665 | 7,815 | 3,964 | ||||||||||||||
952,033 | 702,263 | 626,103 | 530,067 | 505,006 | |||||||||||||||
Income before provision for income taxes | 35,226 | 135,840 | 164,104 | 154,630 | 126,342 | ||||||||||||||
Income tax provision (benefit) | 30,058 | 30,797 | 45,718 | (14,427 | ) | 32,171 | |||||||||||||
Net income | 5,168 | 105,043 | 118,386 | 169,057 | 94,171 | ||||||||||||||
Less: Net income attributable to noncontrolling interests | 13,878 | 11,159 | 11,398 | 11,680 | 9,739 | ||||||||||||||
Net income (loss) attributable to Solera Holdings, Inc. | (8,710 | ) | 93,884 | 106,988 | 157,377 | 84,432 | |||||||||||||
Net income (loss) attributable to Solera Holdings, Inc. per common share: | |||||||||||||||||||
Basic | $ | (0.13 | ) | $ | 1.35 | $ | 1.52 | $ | 2.23 | $ | 1.20 | ||||||||
Diluted | $ | (0.13 | ) | $ | 1.35 | $ | 1.51 | $ | 2.22 | $ | 1.20 | ||||||||
Dividends paid per share | $ | 0.68 | $ | 0.50 | $ | 0.40 | $ | 0.30 | $ | 0.25 | |||||||||
37
Fiscal Years Ended June 30, | |||||||||||||||||||
2014 (1) | 2013 (2) | 2012 (3) | 2011 (4) | 2010 (5) | |||||||||||||||
Weighted average common shares used in the calculation of net (loss) income attributable to Solera Holdings, Inc. per common share: | |||||||||||||||||||
Basic | 68,817 | 68,843 | 70,178 | 70,349 | 69,587 | ||||||||||||||
Diluted | 68,817 | 69,139 | 70,527 | 70,683 | 69,763 | ||||||||||||||
Cash Flow Data: | |||||||||||||||||||
Cash flows provided by (used in): | |||||||||||||||||||
Operating activities | $ | 248,526 | $ | 226,708 | $ | 222,992 | $ | 211,531 | $ | 190,284 | |||||||||
Investing activities (7) | (417,578 | ) | (181,485 | ) | (47,819 | ) | (543,558 | ) | (111,287 | ) | |||||||||
Financing activities (8) | 542,147 | (88,517 | ) | (17,966 | ) | 410,901 | (28,927 | ) | |||||||||||
Balance Sheet Data (as of the end of period): | |||||||||||||||||||
Cash and cash equivalents | $ | 837,751 | $ | 464,239 | $ | 371,101 | $ | 371,101 | $ | 240,522 | |||||||||
Total assets (9) | 3,400,086 | 2,257,541 | 2,169,135 | 2,169,135 | 1,356,653 | ||||||||||||||
Long-term debt, net of current portion (10) | 1,867,808 | 1,144,462 | 1,020,383 | 1,020,383 | 538,018 | ||||||||||||||
Total stockholders’ equity | 697,500 | 748,239 | 785,109 | 785,109 | 512,815 | ||||||||||||||
(1) | The results of operations of Pusula, Serinfo, SRS, DST, AutoPoint, Autosoft, and Sachcontrol AG, acquired in fiscal year 2014, are included from the respective dates of the acquisitions, which are not the first day of fiscal year 2014. |
(2) | The results of operations of LMI, TitleTec, APU, Mensaelect, CarweB, HyperQuest and Eziworks, acquired in fiscal year 2013, are included from the respective dates of the acquisitions, which are not the first day of fiscal year 2013. |
(3) | The results of operations of See Progress, Commerce Delta, Sinexia and Actual Systems, acquired in fiscal year 2012, are included from the respective dates of the acquisitions, which are not the first day fiscal year 2012. |
(4) | The results of operations of Explore and New Era, acquired in fiscal year 2011, are included from the respective dates of the acquisitions, which are not the first day of fiscal year 2011. |
(5) | The results of operations of AUTOonline, GTLDATA and Market Scan, acquired in fiscal year 2010, are included from the respective dates of the acquisitions, which are not the first day of fiscal year 2010. |
(6) | Other expense, net for fiscal year 2014 includes a $63.3 million loss on debt extinguishment consisting of the redemption premium on our senior unsecured notes due 2018 of $58.4 million and the write-off of unamortized debt issuance costs associated with the repayment of the outstanding term loans under our senior credit facility in July 2013 and our senior unsecured notes due 2018. |
(7) | Cash flows used in investing activities primarily consists of cash used to acquire businesses. The significant increases in cash flows used in investing activities in fiscal year 2014 and fiscal year 2011 are due to our acquisitions of SRS in November 2013 and Explore in June 2011, respectively. |
(8) | Cash flows from financing activities primarily consists of the net proceeds from the issuance of our senior unsecured notes. Cash flows from financing activities in fiscal year 2014 primarily reflect the $661.9 million of net proceeds from our issuance of senior unsecured notes in July 2013, November 2013, and June 2014, net of the repayment of the remaining $289.5 million of the outstanding term loans under our senior credit facility and the $850 million principal balance of the senior unsecured notes due 2018. Cash flows from financing activities in fiscal year 2011 primarily reflect the $444.3 million of net proceeds from our issuance of senior unsecured notes in June 2011. |
(9) | The increase in total assets in fiscal year 2014 primarily reflects the goodwill and acquired intangible assets from our acquisition of SRS. |
(10) | The increases in long-term debt, net of current portion primarily reflect our issuance of senior unsecured notes. |
ITEM 7. | MANAGEMENT’S DISCUSSION AND ANALYSIS OF FINANCIAL CONDITION AND RESULTS OF OPERATIONS |
You should read the following discussion and analysis of our financial condition and results of operations in conjunction with our consolidated financial statements and the notes to those statements included elsewhere in this Annual Report on Form 10-K.
All percentage amounts and ratios were calculated using the underlying data in thousands. Operating results for fiscal years 2014, 2013 and 2012 are not necessarily indicative of the results that may be expected for any future period. We describe
38
the effects on our results that are attributed to the change in foreign currency exchange rates by measuring the incremental difference between translating the current and prior period results at the monthly average rates for the same period from the prior year.
Overview of the Business
Solera is the leading global provider of software and services for the automobile claims processing industry. We are expanding beyond our global-leading position in collision repair and U.S. based mechanical repair presence to bring data driven productivity and decision support solutions to other aspects of vehicle ownership such as vehicle validation, glass repair, driver violation monitoring, vehicle salvage and electronic titling. We are also taking our core competencies of data, software and connectivity from the auto to the home.
We help our customers:
• | estimate the costs to repair damaged vehicles and determine pre-collision fair market values for damaged vehicles for which the repair costs exceed the vehicles’ value; |
• | automate and outsource steps of the claims process that insurance companies have historically performed internally; and |
• | improve their ability to monitor and manage their businesses through data reporting and analysis. |
We serve over 165,000 customers and are active in 70 countries across six continents with more than 3,600 employees. Our customers include more than 4,000 automobile insurance companies, 60,500 collision repair facilities, 12,500 independent assessors, 44,500 service, maintenance and repair facilities and 43,500 automotive recyclers, auto dealers and others. We derive revenues from many of the world’s largest automobile insurance companies, including the ten largest automobile insurance companies in Europe and eight of the ten largest automobile insurance companies in North America.
At the core of our software and services are our proprietary databases, which are localized to each geographical market we serve. Our insurance claims processing software and services are typically integrated into our customers’ systems, operations and processes, making it costly and time consuming to switch to another provider. This customer integration, along with our products and long-standing customer relationships, has contributed to our very high customer retention rate.
Segments
We have aggregated our operating segments into two reportable segments: EMEA and Americas. Our EMEA reportable segment encompasses our operations in Europe, the Middle East, Africa, Asia and Australia, while our Americas reportable segment encompasses our operations in North, Central and South America.
Our chief operating decision maker is our Chief Executive Officer. We evaluate the performance of our reportable segments based on revenues, income before provision for income taxes and adjusted EBITDA, a non-GAAP financial measure that represents GAAP net income excluding interest expense, provision for income taxes, depreciation and amortization, share-based compensation expense, restructuring charges, asset impairments and other costs associated with exit and disposal activities, acquisition and related costs, litigation related expenses and other (income) expense, net. We do not allocate certain costs to reportable segments, including costs related to our financing activities, business development and oversight, and tax, audit and other professional fees, to our reportable segments. Instead, we manage these costs at the Corporate level.
The table below sets forth our revenues by reportable segment and as a percentage of our total revenues for the periods indicated (dollars in millions):
Fiscal Years Ended June 30, | ||||||||||||||||||||
2014 | 2013 | 2012 | ||||||||||||||||||
EMEA | $ | 517.8 | 52.4 | % | $ | 471.2 | 56.2 | % | $ | 464.4 | 58.8 | % | ||||||||
Americas | 469.5 | 47.6 | 366.9 | 43.8 | 325.8 | 41.2 | ||||||||||||||
Total | $ | 987.3 | 100.0 | % | $ | 838.1 | 100.0 | % | $ | 790.2 | 100.0 | % | ||||||||
For fiscal year 2014, the United States and the United Kingdom were the only countries that individually represented more than 10% of total revenues.
39
Components of Revenues and Expenses
Revenues
We generate revenues from the sale of software and services to our customers pursuant to negotiated contracts or pricing agreements. Pricing for our software and services is set forth in these agreements and negotiated with each customer. We generally bill our customers monthly under one or more of the following bases:
• | price per transaction; |
• | fixed monthly amount for a prescribed number of transactions; |
• | fixed monthly subscription rate; |
• | price per set of services rendered; and |
• | price per system delivered. |
Our software and services are often sold as packages, without individual pricing for each component. Our revenues are reflected net of customer sales allowances, which we estimate based on both our examination of a subset of customer accounts and historical experience.
Our core offering is our estimating and workflow software, which is used by our insurance company, collision repair facility and independent assessor customers, representing the majority of our revenues. Our salvage and recycling software, business intelligence and consulting services, vehicle data validation, salvage disposition, driver violation reporting services, service, maintenance and repair solutions and other offerings represent in the aggregate a smaller portion of our revenues. We believe that our estimating and workflow software will continue to represent the majority of our revenue for the foreseeable future.
Cost of revenues (excluding depreciation and amortization)
Our costs and expenses applicable to revenues represent the total of operating expenses and systems development and programming costs, which are discussed below.
Operating expenses
Our operating expenses primarily include: compensation and benefit costs for our operations, database development and customer service personnel; other costs related to operations, database development and customer support functions; third-party data and royalty costs; costs related to computer software and hardware used in the delivery of our software and services; and the costs of purchased data from state departments of motor vehicles.
Systems development and programming costs
Systems development and programming costs primarily include: compensation and benefit costs for our product development and product management personnel; other costs related to our product development and product management functions; and costs related to external software consultants involved in systems development and programming activities.
Selling, general and administrative expenses
Our selling, general and administrative expenses primarily include: compensation and benefit costs for our sales, marketing, administration and corporate personnel; costs related to our facilities; and professional and legal fees.
Share-based compensation expense
Our share-based compensation expense represents the recognition of the grant-date fair value of stock awards granted to employees, officers, members of our board of directors and others pursuant to our equity compensation plans. We recognize the grant date fair value as share-based compensation expense over the requisite service period.
40
Depreciation and amortization
Depreciation includes depreciation attributable to buildings, leasehold improvements, data processing and computer equipment, purchased software, and furniture and fixtures. Amortization includes amortization attributable to software developed or obtained for internal use and intangible assets acquired in business combinations, particularly our acquisitions of Claims Services Group, Inc. ("CSG"), Explore and SRS.
Restructuring charges, asset impairments and other costs associated with exit and disposal activities
Restructuring charges, asset impairments and other costs associated with exit and disposal activities primarily represent costs incurred in relation to our restructuring initiatives. Restructuring charges primarily include employee termination benefits charges and charges related to the lease and vendor contract liabilities that we do not expect to provide future economic benefits due to the implementation of our restructuring initiatives.
Acquisition and related costs
Acquisition and related costs include legal and other professional fees and other transaction costs associated with completed and contemplated business combinations and asset acquisitions, costs associated with integrating acquired businesses, including costs incurred to eliminate workforce redundancies and for product rebranding, and other charges incurred as a direct result of our acquisition efforts. These other charges include changes to the fair value of contingent purchase consideration, acquired assets and assumed liabilities subsequent to the completion of the purchase price allocation, purchase consideration that is deemed to be compensatory in nature, and incentive compensation arrangements with continuing employees of acquired companies. Acquisitions and related costs include the legal and other professional fees associated with the Federal Trade Commission's investigation of our acquisition of Actual Systems and the divestiture of Actual Systems' U.S. and Canadian Businesses.
Interest expense
Interest expense consists primarily of interest on our debt and amortization of related debt issuance costs, net of premium amortization.
Other expense, net
Other expense, net consists of foreign exchange gains and losses on notes receivable and notes payable to affiliates, changes in the fair value of derivative instruments, losses on debt extinguishment, investment income and other miscellaneous income and expense.
Income tax provision
Income taxes have been provided for all items included in the statements of income (loss) included herein, regardless of when such items were reported for tax purposes or when the taxes were actually paid or refunded.
Net income attributable to noncontrolling interests
Several of our customers and other entities own noncontrolling interests in six of our operating subsidiariesas well as SRS. Net income attributable to noncontrolling interests reflect such owners’ proportionate interest in the earnings of such subsidiaries.
Factors Affecting Our Operating Results
Below is a summary description of several external factors that have or may have an effect on our operating results.
Foreign currency. During fiscal years 2014, 2013 and 2012, we generated approximately 63%, 68% and 70% of our revenues, respectively, and incurred a majority of our costs, in currencies other than the U.S. dollar, primarily the Euro. We translate our local currency financial results into U.S. dollars based on average exchange rates prevailing during a reporting period for our consolidated statement of income and certain components of stockholders’ equity and the exchange rate at the end of that period for the consolidated balance sheet. These translations resulted in foreign currency translation adjustments of $39.1 million and $8.4 million for fiscal years 2014 and 2013, respectively, which are recorded as a component of accumulated other comprehensive income (loss) in stockholders’ equity. Foreign currency transaction losses recognized in our consolidated
41
statements of income (loss) were $11.0 million, $(5.5) million, $(8.0) million during fiscal years 2014, 2013, and 2012, respectively.
Exchange rates between most of the major foreign currencies we use to transact our business and the U.S. dollar have fluctuated significantly over the last few years and we expect that they will continue to fluctuate. The majority of our revenues and costs are denominated in Euros, Pound Sterling, Swiss francs, Canadian dollars and other foreign currencies. The following table provides the average quarterly exchange rates for the Euro and Pound Sterling since the beginning of fiscal year 2013:
Period | Average Euro-to-U.S. Dollar Exchange Rate | Average Pound Sterling-to-U.S. Dollar Exchange Rate | |||||
Quarter Ended September 30, 2012 | $ | 1.25 | $ | 1.58 | |||
Quarter Ended December 31, 2012 | 1.30 | 1.61 | |||||
Quarter Ended March 31, 2013 | 1.32 | 1.55 | |||||
Quarter Ended June 30, 2013 | 1.31 | 1.54 | |||||
Quarter Ended September 30, 2013 | 1.32 | 1.55 | |||||
Quarter Ended December 31, 2013 | 1.36 | 1.62 | |||||
Quarter Ended March 31, 2014 | 1.37 | 1.65 | |||||
Quarter Ended June 30, 2014 | 1.37 | 1.68 | |||||
During fiscal year 2014, as compared to fiscal year 2013, the U.S. dollar weakened against most major foreign currencies we use to transact our business. The average U.S. dollar weakened versus the Euro by 4.9% and the Pound Sterling by 3.7%, which increased our revenues and expenses during fiscal year 2014. A hypothetical 5% increase or decrease in the U.S. dollar versus other currencies in which we transact our business would have resulted in an increase or decrease, as the case may be, to our revenues of $31.0 million during fiscal year 2014.
Factors that affect business volume. The following external factors have or may have an effect on the number of claims that are submitted and/or our volume of transactions, any of which can affect our revenues:
• | Number of insurance claims made. In fiscal year 2014, the number of insurance claims made increased slightly versus fiscal year 2013. In several of our large western European markets, the number of insurance claims for vehicle damage submitted by owners to their insurance carriers declined slightly. The number of insurance claims made can be influenced by factors such as unemployment levels, the number of miles driven, rising gasoline prices, the number of uninsured drivers, rising insurance premiums and insured opting for lower coverage or higher deductible levels, among other things. Fewer claims made can reduce the transaction-based fees that we generate. |
• | Sales of new and used vehicles. According to industry sources, global new vehicle sales grew by 3.7% in 2012 to 79.5 million units and by 4.2% in 2013 to 82.8 million units. In markets where automobile insurance is generally government-mandated and claims processing is automated (“advanced markets”), sales are projected to grow at 1.3% compound annual growth rate through 2020. In other markets, sales are projected to grow at 8.1% compound annual growth rate through 2020. Fewer new light vehicle sales can result in fewer insured vehicles on the road and fewer automobile accidents, which can reduce the transaction-based fees that we generate. |
• | Damaged vehicle repair costs. The cost to repair damaged vehicles, also known as severity, includes labor, parts and other related costs. Severity has steadily risen for a number of years. According to industry sources, from 2001 through 2010, the price index for body work has increased by 30.5% compared with a 23.2% increase in the general cost of living index. Insurance companies purchase our products and services to help standardize the cost of repair. Should the cost of labor, parts and other related items continue to increase over time, insurance companies may seek to purchase and utilize an increasing number of our products and services to help improve the standardization of the cost of repair. |
• | Penetration Rate of Vehicle Insurance. An increasing rate of procuring vehicle insurance will result in an increase in the number of insurance claims made for damaged vehicles. An increasing number of insurance claims submitted can increase the transaction-based fees that we generate for partial-loss and total-loss estimates. This is due in part to both increased regulation and increased use of financing in the purchase of new and used vehicles. We expect that the rate of vehicle insurance in our less mature international markets will continue to increase during the next eighteen months. |
42
• | Automobile usage—number of miles driven. Several factors can influence miles driven including gasoline prices and economic conditions. According to industry sources, miles driven in the United States remained flat from January through May of calendar year 2013 compared to the same period in prior year. Fewer miles driven can result in fewer automobile accidents, which can reduce the transaction-based fees that we generate. |
• | Seasonality. Our business is subject to seasonal and other fluctuations. In particular, we have historically experienced higher revenues during the second quarter and third quarter versus the first quarter and fourth quarter during each fiscal year. This seasonality is caused primarily by more days of inclement weather during the second quarter and third quarter in most of our markets, which contributes to a greater number of vehicle accidents and damage during these periods. In addition, our business is subject to fluctuations caused by other factors, including the occurrence of extraordinary weather events and the timing of certain public holidays. For example, the Easter holiday occurs during the third quarter in certain fiscal years and occurs during the fourth quarter in other fiscal years, resulting in a change in the number of business days during the quarter in which the holiday occurs. |
Share-based compensation expense. We incurred pre-tax, non-cash share-based compensation charges of $37.5 million, $25.8 million and $18.4 million during fiscal years 2014, 2013, and 2012, respectively. We expect to recognize additional pre-tax, non-cash share-based compensation charges related to share-based awards outstanding at June 30, 2014. The estimated total remaining unamortized share-based compensation expense, net of forfeitures, was $57.5 million which we expect to recognized over a weighted-average period of 2.7 years.
Restructuring charges. We have incurred restructuring charges in each period presented and also expect to incur additional restructuring charges, primarily relating to severance costs, over the next several quarters as we work to improve efficiencies in our business. We do not expect reduced revenues or an increase in other expenses as a result of continued implementation of our restructuring initiatives.
Other factors. Other factors that have or may have an effect on our operating results include:
• | gain and loss of customers; |
• | pricing pressures; |
• | acquisitions, joint ventures or similar transactions; |
• | expenses to develop new software or services; and |
• | expenses and restrictions related to indebtedness. |
We do not believe inflation has had a material effect on our financial condition or results of operations in recent years.
Results of Operations
Our results of operations include the results of operations of acquired companies from the date of the respective acquisitions.
43
The table below sets forth our results of operations data, including the amount and percentage changes for the periods indicated:
Fiscal Years Ended June 30, | Fiscal Year 2014 to Fiscal Year 2013 Change | Fiscal Year 2013 to Fiscal Year 2012 Change | |||||||||||||||||||||||
2014 | 2013 | 2012 | $ | % | $ | % | |||||||||||||||||||
(dollars in thousands) | |||||||||||||||||||||||||
Revenues | $ | 987,259 | $ | 838,103 | $ | 790,207 | $ | 149,156 | 17.8 | % | $ | 47,896 | 6.1 | % | |||||||||||
Cost of revenues: | |||||||||||||||||||||||||
Operating expenses | 222,262 | 181,448 | 171,763 | 40,814 | 22.5 | 9,685 | 5.6 | ||||||||||||||||||
Systems development and programming costs | 90,735 | 79,083 | 73,914 | 11,652 | 14.7 | 5,169 | 7.0 | ||||||||||||||||||
Total cost of revenues (excluding depreciation and amortization) | 312,997 | 260,531 | 245,677 | 52,466 | 20.1 | 14,854 | 6.0 | ||||||||||||||||||
Selling, general and administrative expenses | 259,786 | 208,989 | 188,245 | 50,797 | 24.3 | 20,744 | 11.0 | ||||||||||||||||||
Share-based compensation expense | 37,515 | 25,753 | 18,394 | 11,762 | 45.7 | 7,359 | 40.0 | ||||||||||||||||||
Depreciation and amortization | 122,283 | 103,239 | 103,510 | 19,044 | 18.4 | (271 | ) | (0.3 | ) | ||||||||||||||||
Restructuring charges, asset impairments, and other costs associated with exit and disposal activities | 6,527 | 5,435 | 7,057 | 1,092 | 20.1 | (1,622 | ) | (23.0 | ) | ||||||||||||||||
Acquisition and related costs | 41,512 | 26,945 | 7,962 | 14,567 | 54.1 | 18,983 | 238.4 | ||||||||||||||||||
Interest expense | 107,422 | 69,511 | 53,593 | 37,911 | 54.5 | 15,918 | 29.7 | ||||||||||||||||||
Other expense, net | 63,991 | 1,860 | 1,665 | 62,131 | 3,340.4 | 195 | 11.7 | ||||||||||||||||||
952,033 | 702,263 | 626,103 | 249,770 | 35.6 | 76,160 | 12.2 | |||||||||||||||||||
Income before provision for income taxes | 35,226 | 135,840 | 164,104 | (100,614 | ) | (74.1 | ) | (28,264 | ) | (17.2 | ) | ||||||||||||||
Income tax provision | 30,058 | 30,797 | 45,718 | (739 | ) | (2.4 | ) | (14,921 | ) | (32.6 | ) | ||||||||||||||
Net income | 5,168 | 105,043 | 118,386 | (99,875 | ) | (95.1 | ) | (13,343 | ) | (11.3 | ) | ||||||||||||||
Less: Net income attributable to noncontrolling interests | 13,878 | 11,159 | 11,398 | 2,719 | 24.4 | (239 | ) | (2.1 | ) | ||||||||||||||||
Net income (loss) attributable to Solera Holdings, Inc. | $ | (8,710 | ) | $ | 93,884 | $ | 106,988 | $ | (102,594 | ) | (109.3 | )% | $ | (13,104 | ) | (12.2 | )% | ||||||||
Amounts and percentages in the above table and throughout our discussion and analysis of financial conditions and results of operations may reflect rounding adjustments.
44
The table below sets forth our results of operations data expressed as a percentage of revenues for the periods indicated:
Fiscal Years Ended June 30, | ||||||||
2014 | 2013 | 2012 | ||||||
Revenues | 100.0 | % | 100.0 | % | 100.0 | % | ||
Cost of revenues: | ||||||||
Operating expenses | 22.5 | 21.6 | 21.7 | |||||
Systems development and programming costs | 9.2 | 9.4 | 9.4 | |||||
Total cost of revenues (excluding depreciation and amortization) | 31.7 | 31.1 | 31.1 | |||||
Selling, general and administrative expenses | 26.3 | 24.9 | 23.8 | |||||
Share-based compensation expense | 3.8 | 3.1 | 2.3 | |||||
Depreciation and amortization | 12.4 | 12.3 | 13.1 | |||||
Restructuring charges, asset impairments, and other costs associated with exit and disposal activities | 0.7 | 0.6 | 0.9 | |||||
Acquisition and related costs | 4.2 | 3.2 | 1.0 | |||||
Interest expense | 10.9 | 8.3 | 6.8 | |||||
Other expense, net | 6.5 | 0.2 | 0.2 | |||||
96.4 | 83.8 | 79.2 | ||||||
Income before provision for income taxes | 3.6 | 16.2 | 20.8 | |||||
Income tax provision | 3.0 | 3.7 | 5.8 | |||||
Net income | 0.6 | 12.5 | 15.0 | |||||
Less: Net income attributable to noncontrolling interests | 1.4 | 1.3 | 1.4 | |||||
Net income (loss) attributable to Solera Holdings, Inc. | (0.8 | )% | 11.2 | % | 13.6 | % | ||
Revenues
Fiscal Year 2014 vs. Fiscal Year 2013. During fiscal year 2014, revenues increased $149.2 million, or 17.8% and include revenues from SRS of $74.0 million. After adjusting for changes in foreign currency exchange rates and excluding revenues from SRS, revenues increased $66.5 million, or 7.9%, during fiscal year 2014.
Our EMEA revenues increased $46.6 million, or 9.9%, to $517.8 million. After adjusting for changes in foreign currency exchange rates, EMEA revenues increased $30.2 million, or 6.4%, during fiscal year 2014 resulting from growth in transaction revenues in several countries from sales to new customers and increased transaction volume from and sales of new software and services to existing customers and incremental revenue contributions from recently-acquired businesses.
Our Americas revenues increased $102.6 million, or 28.0%, to $469.5 million and include revenues from SRS of $74.0 million. After adjusting for changes in foreign currency exchange rates and excluding revenues from SRS, Americas revenues increased $36.4 million, or 9.9%, during fiscal year 2014 resulting from incremental revenue contributions from recently-acquired businesses other than SRS, revenue growth in our AudaExplore re-underwriting business due to an increase in drivers and households monitored, and growth in transaction and subscription revenues from sales to new customers and increased transaction volume from and sales of new software and services to existing customers.
Fiscal Year 2013 vs. Fiscal Year 2012. During fiscal year 2013, revenues increased $47.9 million, or 6.1%. After adjusting for changes in foreign currency exchange rates, revenues increased $67.3 million, or 8.5%, during fiscal year 2013 due to revenue growth in both our EMEA and Americas segments.
Our EMEA revenues increased $6.8 million, or 1.5%, to $471.2 million. After adjusting for changes in foreign currency exchange rates, EMEA revenues increased $21.6 million, or 4.6%, during fiscal year 2013 resulting from growth in transaction revenues in several countries from sales to new customers and increased transaction volume from and sales of new software and services to existing customers, and incremental revenue contributions from recently-acquired businesses.
Our Americas revenues increased $41.1 million, or 12.6%, to $366.9 million. After adjusting for changes in foreign currency exchange rates, Americas revenues increased $45.7 million, or 14.0%, during fiscal year 2013 resulting from
45
incremental revenue contributions from recently-acquired businesses, revenue growth in our AudaExplore re-underwriting business due to an increase in drivers and households monitored, and growth in transaction and subscription revenues from sales to new customers and increased transaction volume from and sales of new software and services to existing customers in Latin America and Canada, offset by a decline in revenue in our AudaExplore claims-related business due to the non-renewal of a customer agreement with a top U.S. insurance company, as previously announced in December 2011, that completed its transition to a new provider in December 2012.
We expect AudaExplore to continue to expand its Explore re-underwriting offerings into additional U.S. states, and we expect AudaExplore's revenues to increase in connection with this expansion.
Set forth below is our revenues from each of our principal customer categories and as a percentage of revenues for the periods indicated (dollars in millions):
Fiscal Years Ended June 30, | ||||||||||||||||||||
2014 | 2013 | 2012 | ||||||||||||||||||
Insurance companies | $ | 385.5 | 39.0 | % | $ | 374.0 | 44.6 | % | $ | 359.9 | 45.5 | % | ||||||||
Collision repair facilities | 292.7 | 29.6 | 266.3 | 31.8 | 257.5 | 32.6 | ||||||||||||||
Independent assessors | 78.5 | 8.0 | 72.9 | 8.7 | 74.4 | 9.4 | ||||||||||||||
Service, maintenance and repair facilities | 74.0 | 7.5 | — | — | — | — | ||||||||||||||
Automotive recyclers, salvage, dealerships and others | 156.6 | 15.9 | 124.9 | 14.9 | 98.4 | 12.5 | ||||||||||||||
Total | $ | 987.3 | 100.0 | % | $ | 838.1 | 100.0 | % | $ | 790.2 | 100.0 | % | ||||||||
Revenue growth for each of our customer categories was as follows (dollars in millions):
Fiscal Year 2014 vs Fiscal Year 2013 | Fiscal Year 2013 vs Fiscal Year 2012 | |||||||||||||
Customer category | Revenue Growth | Percentage Change | Revenue Growth | Percentage Change | ||||||||||
Insurance companies | $ | 11.5 | 3.1 | % | $ | 14.1 | 3.9 | % | ||||||
Collision repair facilities | 26.4 | 9.9 | 8.8 | 3.4 | ||||||||||
Independent assessors | 5.6 | 7.7 | (1.5 | ) | (2.0 | ) | ||||||||
Service, maintenance and repair facilities | 74.0 | 100.0 | — | — | ||||||||||
Automotive recyclers, salvage, dealerships and others | 31.7 | 25.4 | 26.5 | 26.9 | ||||||||||
Total | $ | 149.2 | 17.8 | % | $ | 47.9 | 6.1 | % | ||||||
Revenue growth for each of our customer categories after adjusting for changes in foreign currency exchange rates was as follows (dollars in millions):
Fiscal Year 2014 vs Fiscal Year 2013 | Fiscal Year 2013 vs Fiscal Year 2012 | |||||||||||||
Customer category | Revenue Growth | Percentage Change | Revenue Growth | Percentage Change | ||||||||||
Insurance companies | $ | 11.1 | 3.0 | % | $ | 22.5 | 6.3 | % | ||||||
Collision repair facilities | 22.6 | 8.5 | 15.5 | 6.0 | ||||||||||
Independent assessors | 3.4 | 4.6 | 1.6 | 2.1 | ||||||||||
Service, maintenance and repair facilities | 74.0 | 100.0 | — | — | ||||||||||
Automotive recyclers, salvage, dealerships and others | 29.5 | 23.6 | 27.7 | 28.1 | ||||||||||
Total | $ | 140.6 | 16.8 | % | $ | 67.3 | 8.5 | % | ||||||
Revenues from service, maintenance and repair facilities represent revenue contributions from our acquisition of SRS. The increase in revenues from automotive recyclers, salvage and others in fiscal year 2014 and 2013 is primarily due to revenue contributions from recently-acquired businesses.
46
Operating expenses
Fiscal Year 2014 vs. Fiscal Year 2013. During fiscal year 2014, operating expenses increased $40.8 million, or 22.5% and include operating expenses of SRS of $16.5 million. After adjusting for changes in foreign currency exchange rates and excluding operating expenses from SRS, operating expenses increased $22.3 million, or 12.3%, during fiscal year 2014.
Our EMEA operating expenses increased $12.2 million, or 14.3%. After adjusting for changes in foreign currency exchange rates, EMEA operating expenses increased $8.9 million, or 10.5%, during fiscal year 2014 primarily due to an increase in personnel related expenses due to increased headcount and incremental operating expenses contributions from recently-acquired businesses, mainly personnel related expenses.
Our Americas operating expenses increased $29.1 million or 30.3% and include operating expenses from SRS of $16.5 million. After adjusting for changes in foreign currency exchange rates and excluding operating expenses of SRS, Americas operating expenses increased $13.8 million, or 14.3%, during fiscal year 2014 primarily due to incremental operating expenses contributions from recently-acquired businesses other than SRS, mainly personnel related expenses and purchased data costs and an increase in the costs of data purchased from state departments of motor vehicles consistent with the revenue growth in our AudaExplore re-underwriting business.
Fiscal Year 2013 vs. Fiscal Year 2012. During fiscal year 2013, operating expenses increased $9.7 million, or 5.6%. After adjusting for changes in foreign currency exchange rates, operating expenses increased $13.0 million, or 7.6%, during fiscal year 2013 primarily due to an increase in operating expenses in our Americas segment.
Our EMEA operating expenses decreased $3.2 million, or 3.7%. After adjusting for changes in foreign currency exchange rates, EMEA operating expenses decreased $0.5 million, or 0.6%, during fiscal year 2013 primarily due to ongoing waste reduction and cost containment initiatives, partially offset by incremental operating expenses contributions from recently-acquired businesses, primarily personnel related expenses and third party license fees.
Our Americas operating expenses increased $12.9 million or 15.4%. After adjusting for changes in foreign currency exchange rates, Americas operating expenses increased $13.5 million, or 16.1%, during fiscal year 2013 primarily due to incremental operating expenses contributions from recently-acquired businesses, primarily personnel related expenses and purchased data costs, and an increase in the costs of data purchased from state departments of motor vehicles consistent with the revenue growth in our AudaExplore re-underwriting business.
We expect AudaExplore's operating expenses, primarily relating to costs for data utilized in Explore's re-underwriting offerings, to increase in absolute dollars as AudaExplore expands its offerings into additional U.S. states.
Systems development and programming costs
Fiscal Year 2014 vs. Fiscal Year 2013. During fiscal year 2014, systems development and programming costs (“SD&P”) increased $11.7 million, or 14.7% and include SD&P from SRS of $7.1 million. After adjusting for changes in foreign currency exchange rates and excluding SD&P from SRS, SD&P increased $2.9 million, or 3.7%, during fiscal year 2014 due to increases in SD&P expenses in our Americas segment.
Our EMEA SD&P increased $1.1 million, or 2.2%. After adjusting for changes in foreign currency exchange rates, EMEA SD&P decreased $0.9 million, or 1.9%, during fiscal year 2014 primarily due to a decrease in external programming costs resulting from ongoing expense reduction initiatives.
Our Americas SD&P increased $10.6 million, or 33.6% and include SD&P from SRS of $7.1 million. After adjusting for changes in foreign currency exchange rates and excluding SD&P from SRS, Americas SD&P increased $3.8 million, or 12.1%, during fiscal year 2014 primarily due to an increase in personnel related expenses due to increased product development investment and incremental SD&P contributions from recently-acquired businesses other than SRS, primarily personnel related expenses and increased professional fees.
Fiscal Year 2013 vs. Fiscal Year 2012. During fiscal year 2013, systems development and programming costs (“SD&P”) increased $5.2 million, or 7.0%. After adjusting for changes in foreign currency exchange rates, SD&P increased $7.1 million, or 9.6%, during fiscal year 2013 due to increases in SD&P expenses in both our EMEA and Americas segments.
Our EMEA SD&P decreased $1.6 million, or 3.2%. After adjusting for changes in foreign currency exchange rates, EMEA SD&P increased $0.2 million, or 0.4%, during fiscal year 2013 primarily due to incremental SD&P contributions from
47
recently-acquired businesses, partially offset by a decrease in personnel related expenses resulting from ongoing waste reduction and cost containment initiatives.
Our Americas SD&P increased $6.8 million, or 27.2%. After adjusting for changes in foreign currency exchange rates, Americas SD&P increased $6.9 million, or 27.6%, during fiscal year 2013 primarily due to an increase in personnel related expenses resulting from increased investment in new product development at AudaExplore, and incremental SD&P contributions from recently-acquired businesses, primarily personnel related expenses.
Selling, general and administrative expenses
Fiscal Year 2014 vs. Fiscal Year 2013. During fiscal year 2014, selling, general and administrative expenses (“SG&A”) increased $50.8 million, or 24.3% and include SG&A from SRS of $20.6 million. After adjusting for changes in foreign currency exchange rates and excluding SG&A from SRS, SG&A increased $28.0 million, or 13.4%, primarily due to: incremental SG&A contributions from recently-acquired businesses other than SRS of $4.5 million; a $15.6 million increase in personnel related expenses in our EMEA and Americas segments due to continued growth in our business; $1.8 million increase in facilities expenses; $1.0 million increase in bad debt expense; $2.9 million increase in personnel, travel and recruiting expenses; a $0.8 million increase in advertising and marketing expenses; a $0.5 million increase in professional fees.
Fiscal Year 2013 vs. Fiscal Year 2012. During fiscal year 2013, selling, general and administrative expenses (“SG&A”) increased $20.7 million, or 11.0%. After adjusting for changes in foreign currency exchange rates, SG&A increased $25.3 million, or 13.4%, primarily due to: incremental SG&A contributions from recently-acquired businesses of $7.8 million; a $6.3 million increase in personnel, travel and recruiting expenses in our Corporate function to support continued organizational growth; a $5.7 million increase in personnel related expenses in our EMEA and Americas segments due to continued growth in our business; a $1.5 million increase in advertising and marketing expenses; a $1.4 million increase in professional fees; a $1.4 million increase in legal fees incurred in connection with our patent infringement lawsuit against Mitchell International; and a $1.1 million increase in other administrative expenses.
Share-based compensation expense
Fiscal Year 2014 vs. Fiscal Year 2013 and Fiscal Year 2013 vs. Fiscal Year 2012. During fiscal years 2014, 2013, and 2013, we incurred share-based compensation expense of $37.5 million, $25.8 million and $18.4 million. The increase in share-based compensation expense in fiscal year 2014 is primarily due to share-based compensation expense associated with the long-term incentive awards granted to our executive officers in March 2013 and more extensive use of equity-based incentive compensation in our compensation plans to incent personnel for continued contributions to increasing our profitability and value during the first phase of our previously-announced strategic mission, Mission 2020.
The increase in share-based compensation expense in fiscal year 2013 is primarily due to more extensive use of equity-based incentive compensation in our compensation plans to incent personnel for continued contributions to increasing our profitability and value during the first phase of our previously-announced strategic mission, Mission 2020.
Depreciation and amortization
Fiscal Year 2014 vs. Fiscal Year 2013. During fiscal year 2014, depreciation and amortization increased by $19.0 million, or 18.4%, and include depreciation and amortization contributions from SRS of $17.9 million. After adjusting for changes in foreign currency exchange rates and excluding depreciation and amortization from SRS, depreciation and amortization decreased $0.7 million, or 0.7%, during fiscal year 2014 primarily due to the continued decrease in amortization expense related to the intangible assets acquired in the CSG Acquisition and the acquisition of Explore since these intangible assets are being amortized on an accelerated basis.
Fiscal Year 2013 vs. Fiscal Year 2012. During fiscal year 2013, depreciation and amortization decreased by $0.3 million, or 0.3%. After adjusting for changes in foreign currency exchange rates, depreciation and amortization increased $1.5 million, or 1.4%, during fiscal year 2013 primarily due to the additional intangibles amortization expense associated with businesses acquired during fiscal year 2013, partially offset by the continued decrease in amortization expense related to the intangible assets acquired in the CSG Acquisition and the acquisition of Explore since these intangible assets are being amortized on an accelerated basis.
We generally amortize intangible assets on an accelerated basis to reflect the pattern in which the economic benefits of the intangible assets are realized. Accordingly, notwithstanding the impact of fluctuations in the value of the U.S. dollar versus
48
certain foreign currencies in which we transact business and absent future significant acquisitions, we anticipate that our annual depreciation and amortization expense will decrease over the next several years.
Restructuring charges, asset impairments and other costs associated with exit or disposal activities
Fiscal Year 2014 vs. Fiscal Year 2013 and Fiscal Year 2013 vs. Fiscal Year 2012. During fiscal years 2014, 2013 and 2012, we incurred restructuring charges, asset impairments and other costs associated with exit or disposal activities of $6.5 million, $5.4 million and $7.1 million, respectively.
The restructuring charges, asset impairments and other costs associated with exit and disposal activities incurred in fiscal years 2014, 2013 and 2012 consist primarily of employee termination benefits and other costs incurred in relation to ongoing restructuring initiatives.
We expect to incur additional restructuring charges in future years as we continue to undertake additional efforts to improve efficiencies in our business.
Acquisition and related costs
Fiscal Year 2014 vs. Fiscal Year 2013 and Fiscal Year 2013 vs. Fiscal Year 2012. During fiscal years 2014, 2013 and 2012 we incurred acquisition and related costs of $41.5 million, $26.9 million and $8.0 million, respectively.
Acquisition and related costs incurred in fiscal year 2014 primarily consists of contingent purchase consideration that is deemed compensatory in nature of $25.4 million, $7.1 million of legal and professional fees incurred in connection with completed and contemplated business combinations and $9.0 million in other acquisition related costs.
Acquisition and related costs incurred in fiscal year 2013 primarily consists of contingent purchase consideration that is deemed compensatory in nature of $15.7 million, $5.8 million of legal and professional fees incurred in connection with completed and contemplated business combinations and associated with the Federal Trade Commission's investigation of our acquisition of Actual Systems and the subsequent divestiture of Actual Systems' businesses in the U.S. and Canada in August 2013, and other costs associated with completed acquisitions of $5.4 million.
Acquisition and related costs incurred in fiscal year 2012 primarily consists of legal and professional fees incurred in connection with completed and contemplated business combinations of $2.1 million and contingent purchase consideration that is deemed compensatory in nature and other costs associated with completed acquisitions of $5.9 million.
We expect to incur additional acquisition and related costs in future years as we continue to pursue potential business combinations and asset acquisitions as part of our plan to grow our business.
Interest expense
Fiscal Year 2014 vs. Fiscal Year 2013 and Fiscal Year 2013 vs. Fiscal Year 2012. During fiscal year 2014, interest expense increased $37.9 million, or 54.5%, due primarily to the increase in our total outstanding debt to approximately $1.9 billion resulting from the issuance of additional senior unsecured notes in fiscal year 2014.
During fiscal year 2013, interest expense increased $15.9 million, or 29.7%, due primarily to interest expense related to the senior unsecured notes issued in April 2012.
During fiscal year 2012, interest expense increased $22.5 million, or 72.3%, due primarily to interest expense related to the senior unsecured notes issued in June 2011 and April 2012, partially offset by a decrease in interest expense resulting from the expiration of our interest rate swaps in June 2011.
We expect that our annual interest expense will increase in fiscal year 2015, as compared to fiscal year 2014, as a result of the issuance of additional senior unsecured notes in fiscal year 2014.
Other expense, net
Fiscal Year 2014 vs. Fiscal Year 2013 and Fiscal Year 2013 vs. Fiscal Year 2012. During fiscal year 2014, other expense, net increased by $62.1 million primarily due to a $63.3 million loss on debt extinguishment associated with the redemption of our senior unsecured notes due 2018 in November 2013 and the repayment of the outstanding term loans under our senior
49
secured credit facility in July 2013 offset by an $18.0 million increase in gains on derivative instruments, a $16.5 million increase in net foreign currency transaction gains on transactions denominated in a currency other than the functional currency of the local company and a $3.0 million increase in gains on asset sales.
During fiscal years 2013 and 2012, other expense, net increased by $0.2 million and decreased by $6.2 million, respectively, primarily due to net foreign currency transaction losses on transactions denominated in a currency other than the functional currency of the local company.
Income tax provision
Fiscal Year 2014 vs. Fiscal Year 2013 and Fiscal Year 2013 vs. Fiscal Year 2012. During fiscal years 2014, 2013 and 2012, we recorded an income tax provision of $30.1 million, $30.8 million and $45.7 million, respectively, which resulted in an effective tax rate of 85.3%, 22.7% and 27.9%, respectively. The increase in the effective tax rate was primarily attributable to the recognition of a $24.8 million valuation allowance on our U.S. deferred tax assets, partially offset by earnings in jurisdictions with lower income tax rates which are indefinitely reinvested.
Factors that impact our income tax provision include, but are not limited to, the mix of jurisdictional earnings and varying jurisdictional income tax rates, establishment and release of valuation allowances in certain jurisdictions, permanent differences resulting from the book and tax treatment of certain items, and discrete items. Future changes in tax laws or tax rulings may have a significant adverse impact on our effective tax rate.
As of June 30, 2014, the management concluded that it was not more-likely-than-not that all of our U.S. net deferred tax assets will be realized in accordance with U.S. GAAP. Accordingly, we established a valuation allowance against our U.S. net deferred tax assets of $24.8 million due to the limitation in our ability to utilize foreign tax credit carryforwards prior to the expiration of the carryforward periods.
Liquidity and Capital Resources
Our principal sources of cash have included cash generated from operations, proceeds from our May 2007 initial public offering and our November 2008 secondary public stock offering, borrowings under our senior secured credit facilities and the proceeds from the issuance of the senior unsecured notes. Our principal uses of cash have been, and we expect them to continue to be, for business combinations, debt service, dividends, stock repurchases, capital expenditures and working capital.
In July 2013, we issued senior unsecured notes due 2021 in the aggregate principal amount of $850.0 million (“2021 Senior Notes”), resulting in net proceeds of $845.6 million. The 2021 Senior Notes accrue interest at 6.000% per annum, payable semi-annually, and become due and payable on June 15, 2021. We used $289.5 million of the net proceeds from the issuance of the 2021 Senior Notes to repay in full all of the outstanding term loans under our Amended and Restated First Lien Credit and Guaranty Agreement (the “Amended Credit Facility”), including accrued unpaid interest through the repayment
date. Upon repayment of the outstanding term loans, the Amended Credit Facility was terminated. We intend to use the remainder of the net proceeds for working capital and other general corporate purposes, including strategic initiatives such as future acquisitions, joint ventures, investments or other business development opportunities.
In November 2013, we issued additional 2021 Senior Notes in the aggregate principal amount of $510.0 million under the indenture governing the 2021 Senior Notes that were issued in July 2013. The 2021 Senior Notes issued in November 2013 were issued at an original issue price of 101.75% plus accrued interest from July 2013.
In June 2014, we issued additional 2021 Senior Notes in the aggregate principal amount of $150.0 million under the indenture governing the 2021 Senior Notes that were issued in July 2013. The 2021 Senior Notes in June 2014 were issued at an original issue price of 106.50% plus accrued interest from December 2013.
The 2021 Senior Notes include redemption provisions that allow us, at our option, to redeem all or a portion of the aggregate principal amount of the 2021 Senior Notes as follows:
• | At any time prior to June 15, 2016, we may redeem up to 35% of the aggregate principal amount of the 2021 Senior Notes at a redemption price equal to 106.000% of the principal amount of the notes redeemed, plus accrued and unpaid interest, if any, through the date of redemption. |
• | At any time prior to June 15, 2017, we may redeem the 2021 Senior Notes, in whole or in part, at a redemption price equal to 100% of the principal amount of the notes redeemed plus a premium and accrued and unpaid interest to the |
50
redemption date. The premium at the applicable redemption date is the greater of: (1) 1.0% of the then outstanding principal amount of the notes; or (2) the excess of: (a) the present value at such redemption date of the sum of the redemption price of the notes at June 15, 2017 plus all required interest payments due on the notes through June 15, 2017 (excluding accrued but unpaid interest to the redemption date), computed using a discount rate equal to the Treasury Rate as of such redemption date plus 50 basis points; over (b) the then outstanding principal amount of the notes.
• | At any time on or after June 15, 2017, we may redeem the 2021 Senior Notes, in whole or in part, at the following redemption prices, plus accrued and unpaid interest, if any, through the date of redemption: (i) if the redemption occurs on or after June 15, 2017 but prior to June 15, 2018, the redemption price is 103.000% of the principal amount of the notes; (ii) if the redemption occurs on or after June 15, 2018 but prior to June 15, 2019, the redemption price is 101.500% of the principal amount of the notes; and (iii) if the redemption occurs on or after June 15, 2019, the redemption price is 100.000% of the principal amount of the notes. |
In November 2013, we also issued senior unsecured notes due 2023 in the aggregate principal amount of $340.0 million (the “2023 Senior Notes”). The 2023 Senior Notes accrue interest at 6.125% per annum, payable semi-annually, and become due and payable on November 1, 2023.
The 2023 Senior Notes include redemption provisions that allow us, at our option, to redeem all or a portion of the aggregate principal amount of the 2023 Senior Notes as follows:
• | At any time prior to November 1, 2016, we may redeem up to 35% of the aggregate principal amount of the 2023 Senior Notes at a redemption price equal to 106.125% of the principal amount of the notes redeemed, plus accrued and unpaid interest, if any, through the date of redemption. |
• | At any time prior to November 1, 2018, we may redeem the 2023 Senior Notes, in whole or in part, at a redemption price equal to 100% of the principal amount of the notes redeemed plus a premium and accrued and unpaid interest to the redemption date. The premium at the applicable redemption date is the greater of: (1) 1.0% of the then outstanding principal amount of the notes; or (2) the excess of: (a) the present value at such redemption date of the sum of the redemption price of the notes at November 1, 2018 plus all required interest payments due on the notes through November 1, 2018 (excluding accrued but unpaid interest to the redemption date), computed using a discount rate equal to the Treasury Rate as of such redemption date plus 50 basis points; over (b) the then outstanding principal amount of the notes. |
• | At any time on or after November 1, 2018, we may redeem the 2023 Senior Notes, in whole or in part, at the following redemption prices, plus accrued and unpaid interest, if any, through the date of redemption: (i) if the redemption occurs on or after November 1, 2018 but prior to November 1, 2019, the redemption price is 103.063% of the principal amount of the notes; (ii) if the redemption occurs on or after November 1, 2019 but prior to November 1, 2020, the redemption price is 102.042% of the principal amount of the notes; (iii) if the redemption occurs on or after November 1, 2020 but prior to November 1, 2021, the redemption price is 101.021% of the principal amount of the notes; and (iv) if the redemption occurs on or after November 1, 2021, the redemption price is 100.000% of the principal amount of the notes. |
Upon the occurrence of a change of control, we are required to offer to redeem the 2021 Senior Notes and the 2023 Senior Notes at a redemption price equal to 101% of the principal amount of the notes redeemed, plus accrued and unpaid interest, if any, through the redemption date.
We used the net proceeds from the November 2013 issuance of the 2021 Senior Notes and the 2023 Senior Notes of $855.4 million, together with existing cash on hand, to redeem the outstanding senior unsecured notes due June 2018 (the “2018 Senior Notes”). The redemption price for the 2018 Senior Notes was $932.8 million, consisting of (i) the unpaid principal amount of the 2018 Senior Notes of $850.0 million, (ii) accrued unpaid interest through the redemption date of $24.4 million, and (iii) a redemption premium of $58.4 million.
The indentures governing the 2021 Senior Notes and the 2023 Senior Notes contain limited covenants, including those restricting our and our subsidiaries’ ability to incur certain liens, engage in sale and leaseback transactions and consolidate, merge with, or convey, transfer or lease substantially all of our or their assets to, another person, and, in the case of any of our subsidiaries that did not issue or guarantee such notes, incur indebtedness. We are in compliance with the specified covenants of the 2021 Senior Notes and the 2023 Senior Notes at June 30, 2014.
51
In April 2012, in order to mitigate the variability of the Euro-denominated cash flows associated with two intercompany loans, we entered into two pay fixed Euros / received fixed U.S. dollar cross-currency swaps in the aggregate notional amount of €109.0 million. We pay Euro fixed coupon payments at 6.99% and receive U.S. dollar fixed coupon payments at 6.75% on the notional amount. The maturity date of the swaps is June 15, 2018.
In September 2013, in order to hedge our exposure to variability in the Euro-denominated cash flows associated with two intercompany loans, we entered into two pay floating Euros / received floating U.S. dollar cross-currency swaps in the aggregate notional amount of €141.1 million. We pay Euro floating coupon payments at 6-month EURIBOR plus 35 basis points and receive U.S. dollar floating coupon payments at 6-month LIBOR on the notional amount. The maturity date of the swaps is June 15, 2018. In June 2014, we settled one of the intercompany loans and the associated pay floating Euros / receive floating U.S. dollar cross-currency swaps.
The noncontrolling stockholders of certain of our subsidiaries have the right to require us to redeem their shares. We do not have any indication that the exercise of any remaining redemption rights is probable within the next twelve months. Further, we do not believe the occurrence of conditions precedent to the exercise of certain of these redemption rights is probable within the next twelve months. If the stockholders exercise their redemption rights within the next twelve months, we believe that we have sufficient liquidity to fund such redemptions.
In November 2011, our Board of Directors approved a share repurchase program for up to a total of $180.0 million of our common stock through November 20, 2013. In October 2013, our Board of Directors approved a new share repurchase program, replacing the share repurchase program authorized in November 2011, for up to a total of $200.0 million of our common stock through November 10, 2015. Share repurchases are made from time to time, through an accelerated stock purchase agreement, in open market transactions at prevailing market prices or in privately negotiated transactions. The repurchase program does not require us to purchase any specific number or amount of shares, and the timing and amount of such purchases will be determined by management based upon market conditions and other factors. In addition, the program may be amended or terminated at the discretion of our Board of Directors. Through September 30, 2013, we repurchased approximately 2.9 million shares for $136.6 million under the share repurchase program that was authorized in November 2011. Through June 30, 2014, we have repurchased approximately 0.8 million shares for $52.8 million under the share repurchase program that was authorized in October 2013.
In fiscal year 2014, we paid quarterly cash dividends with a value of $0.17 per outstanding share of common stock and per outstanding restricted stock unit to our stockholders and restricted stock unit holders of record. The aggregate dividend payments for fiscal year 2014 were $47.2 million. On August 26, 2014, we announced that our Board of Directors approved the payment of a cash dividend of $0.195 per share of outstanding common stock and per outstanding restricted stock unit. The Board of Directors also approved a quarterly stock dividend equivalent of $0.195 per outstanding restricted stock unit granted to certain of our executive officers during fiscal years 2013 and 2014 in lieu of the cash dividend, which dividend equivalent will be paid to the restricted stock unit holders as the restricted stock unit vests. The dividends are payable on September 23, 2014 to stockholders and restricted stock unit holders of record at the close of business on September 9, 2014. Any determination to pay dividends in future periods will be at the discretion of our Board of Directors. The bond indentures include restrictions on our ability to pay dividends on our common stock.
As of June 30, 2014 and 2013, we had cash and cash equivalents of $837.8 million and $464.2 million, respectively. At June 30, 2014, our total current and long-term debt obligations were approximately $1.9 billion, consisting of $1.5 billion related to the 2021 Senior Notes and $340.0 million related to the 2023 Senior Notes.
On May 12, 2014, we signed a definitive agreement to acquire the Insurance and Services Division of Pittsburgh Glass Works, LLC ("I&S"). On July 29, 2014, we completed our acquisition of I&S for cash consideration of approximately $280 million.
We believe that our existing cash on hand and cash flow from operations will be sufficient to fund currently anticipated working capital and debt service requirements, as well as investment in acquisition and other strategic opportunities, including the investment of capital pursuant to Phase I of our Mission 2020 goal, for at least the next twelve months.
Our management believes that our cash is best utilized by investing in the future growth of our business to support the achievement of our Mission 2020 goal, either through acquisitions or penetration of new geographic markets and other strategic opportunities, and maximizing stockholder return through the payment of cash dividends and stock repurchases. We regularly review acquisition and other strategic opportunities, which may require additional debt or equity financing. If we raise additional funds by issuing equity securities, further dilution to our then-existing stockholders may result. Additional debt financing may include covenants limiting or restricting our ability to take specific actions, such as incurring additional debt,
52
making capital expenditures or declaring dividends. Any equity or debt financing may contain terms, such as liquidation and other preferences, that are not favorable to us or our stockholders.
We consider the undistributed earnings of our foreign subsidiaries as of June 30, 2014 to be indefinitely reinvested and, accordingly, no U.S. income taxes have been provided thereon. At June 30, 2014, the amount of cash associated with permanently reinvested foreign earnings was approximately $288.9 million. We have not, nor do we anticipate the need to, repatriate funds to the U.S. in order to satisfy domestic liquidity needs arising in the ordinary course of business, including liquidity needs associated with our domestic debt service requirements. If we were to repatriate such foreign earnings in the future, we would incur incremental U.S. federal and state income taxes. However, our intent is to continue to indefinitely reinvest our foreign earnings and our current plans do not demonstrate a need to repatriate foreign earnings to fund our U.S. operations.
The following summarizes our primary sources and uses of cash in the periods presented:
Fiscal Years Ended June 30, | Amount Changed from | ||||||||||||||||||
2014 | 2013 | 2012 | 2013 to 2014 | 2012 to 2013 | |||||||||||||||
(in thousands) | |||||||||||||||||||
Operating activities | $ | 248.5 | $ | 226.7 | $ | 223.0 | $ | 21.8 | $ | 3.7 | |||||||||
Investing activities | $ | (417.6 | ) | $ | (181.5 | ) | $ | (47.8 | ) | $ | (236.1 | ) | $ | (133.7 | ) | ||||
Financing activities | $ | 542.1 | $ | (88.5 | ) | $ | (18.0 | ) | $ | 630.6 | $ | (70.5 | ) | ||||||
Operating activities. The $21.8 million increase in cash provided by operating activities during fiscal year 2014 was primarily attributable to operating cash flows generated by business acquired during fiscal year 2014, including SRS.
Investing activities. The $236.1 million increase in cash used in investing activities in fiscal year 2014 was primarily attributable to an increase in cash used in business combinations, net of cash acquired, of $220.0 million, due to the acquisition of six businesses during fiscal year 2014, an increase in acquisitions and capitalization of intangible assets of $13.8 million and an increase in capital expenditures of $1.2 million.
Financing activities. The $630.6 million increase in cash provided by financing activities in fiscal year 2014 was primarily attributable to the proceeds from the issuance of the 2021 Senior Notes and the 2023 Senior Notes, net of the repayment of the outstanding term loans under the Amended Credit Facility and the redemption of the 2018 Senior Notes, including the payment of the redemption premium, of $661.9 million. The increase in cash provided by financing activities is offset by a $30.0 million increase in stock repurchases due to the adoption of a new share repurchase program in October 2013 and a $12.4 million increase in dividend payments due to the increase in our annual dividend to $0.68 per share in fiscal year 2014.
Contractual Obligations
The following table reflects our cash contractual obligations as of June 30, 2014:
Payments Due by Period | |||||||||||||||||||
Total | Less than 1 Year | 1-3 Years | 3-5 Years | More than 5 Years | |||||||||||||||
(in thousands) | |||||||||||||||||||
Long-term debt obligations (1) | $ | 2,664,437 | $ | 111,425 | $ | 222,850 | $ | 222,850 | $ | 2,107,312 | |||||||||
Contingent purchase consideration obligations (2) | 128,724 | 37,060 | 80,864 | 10,800 | — | ||||||||||||||
Purchase obligations | 19,920 | 6,078 | 7,854 | 5,981 | 7 | ||||||||||||||
Lease obligations (3) | 35,350 | 9,737 | 14,888 | 8,028 | 2,697 | ||||||||||||||
Total | $ | 2,848,431 | $ | 164,300 | $ | 326,456 | $ | 247,659 | $ | 2,110,016 | |||||||||
(1) | Represents principal and interest payments due on our senior unsecured notes. |
(2) | Represents the maximum potential future contingent cash consideration associated with business combinations and asset acquisitions as of June 30, 2014. The amount and timing of future payments are based on the achievement of specific targets. |
(3) | Lease obligations include operating and capital leases and are net of sublease income. |
53
In addition to the contractual obligations identified in the preceding table, the noncontrolling owners of certain of our majority-owned subsidiaries have the right to require us to redeem their shares at the then fair market value. As of June 30, 2014, we estimate that the aggregate fair value of these redeemable noncontrolling interests was approximately $86.0 million. Pursuant to the terms of our SRS joint venture, WCAS has the right to require that we purchase its equity ownership interest in SRS up to four times per year, subject to an annual cap of $250 million and a $25 million per exercise minimum (the “Annual Put Right”) at a price based on SRS’s trailing twelve month EBITDA. In addition, WCAS has additional rights to require that we purchase either half or all (depending on the triggering event) of their equity ownership interest of SRS at a price, subject to certain adjustments, equal to a specified multiple of WCAS's cost basis of such equity ownership interest (the “Special Put Right”). The triggering events for the Special Put Right include, among others, a drop in our corporate credit rating below certain specified levels or if SRS is required to become a guarantor of any of the indebtedness of Solera or its subsidiaries (other than SRS) or at any time beginning on August 1, 2018 and ending on the earlier of (x) December 31, 2018 and (y) the consummation of any Annual Put Right after August 1, 2018. The redemption of these noncontrolling interests is not within our control and the timing is uncertain.
Excluded from the table above is a liability for unrecognized tax benefits of $13.2 million as of June 30, 2014. The timing and amount of the future cash flows related to this liability is uncertain and cannot be practically determined.
Off-Balance Sheet Arrangements and Related Party Transactions
As of June 30, 2014, we did not have any relationships with unconsolidated entities or financial partnerships, such as entities often referred to as structured finance or special purpose entities, which would have been established for the purpose of facilitating off-balance sheet arrangements or other contractually narrow or limited purposes.
Certain minority stockholders of our international subsidiaries are also commercial purchasers and users of our software and services. Revenue transactions with all of the minority stockholders in the aggregate were less than 10% of our consolidated revenue for fiscal years 2014, 2013 and 2012, respectively, and aggregate accounts receivable from the noncontrolling stockholders represent less than 10% of consolidated accounts receivable at June 30, 2014 and 2013, respectively.
On February 12, 2013, we entered into a Facilities Use Agreement with Aquila Guest Ranch, LLC (“AGR"), an entity owned by the family of our Chief Executive Officer, Tony Aquila, pursuant to which we shall pay AGR a fixed annual fee of $140,000 in exchange for our use during calendar year 2013 of certain guest ranch facilities in Wyoming (the "Wyoming Facility"). On December 26, 2013, we entered into an amendment to the Facilities Use Agreement with AGR and Chaparral Lane Investment, LLC ("CLI"), an entity owned by our Chief Executive Officer and his family, to (i) add an additional facility in Roanoke, Texas (the "Roanoke Facility") to the Facilities Use Agreement and (ii) increase the fixed annual fee to $170,000 in exchange for our use during calendar year 2014 of the Wyoming Facility. This fee increase is due to increased operating expenses of the Wyoming Facility and an increase in the number of days during which we use the Wyoming Facility.
Critical Accounting Policies and Estimates
Our consolidated financial statements included in this Annual Report on Form 10-K have been prepared in accordance with generally accepted accounting principles. The preparation of these financial statements requires us to make estimates and judgments that affect the amounts reported in our consolidated financial statements. On an ongoing basis, we evaluate estimates. We base our estimates and judgments on historical experience and on various other assumptions that we believe are reasonable under the circumstances. Actual results could differ from our estimates under different assumptions or conditions. Our significant accounting policies, which may be affected by our estimates and assumptions, are more fully described in Note 2 to the consolidated financial statements included elsewhere in this Annual Report on Form 10-K. We believe that the following significant accounting policies and assumptions may involve a higher degree of judgment and complexity than others.
Goodwill and Indefinite-Lived Intangible Assets. Goodwill and intangible assets with indefinite useful lives are not amortized, but instead are tested for impairment annually or more frequently if impairment indicators arise. Impairment indicators arise when events or changes in circumstances indicate that the carrying value of the asset may not be recoverable, such as a significant downturn in industry or economic trends with a direct impact on the business, an expectation that a reporting unit will be sold or otherwise disposed of for less than the carrying value, loss of key personnel, or a significant decline in the market price of an asset or asset group.
54
We test goodwill for impairment annually at a reporting unit level using a two-step process. The first step of the impairment test involves comparing the fair values of the applicable reporting units with their aggregate carrying values, including goodwill. If the carrying amount of a reporting unit exceeds the reporting unit’s fair value, we then perform the second step of the goodwill impairment test to determine the amount of the potential impairment loss. The second step of the goodwill impairment test involves comparing the implied fair value of the affected reporting unit’s goodwill with the carrying value of that goodwill. If the carrying amount of goodwill exceeds the implied fair value of that goodwill, an impairment loss is recognized in an amount equal to that excess.
We determine the fair value of our reporting units through a combination of an income approach, utilizing a discounted cash flow model, and a market approach, which considers comparable companies and transactions. Under the income approach, the discounted cash flow model determines the fair value of each reporting unit based on the present value of projected reporting unit cash flows over a specific projection period and a residual value related to future cash flows beyond the projection period. Both values are discounted to reflect the degree of risk inherent in an investment in the reporting unit and achieving the projected cash flows. A weighted average cost of capital of a market participant is used as the discount rate. The residual value is generally determined by applying a constant terminal growth rate to the estimated reporting unit net cash flows at the end of the projection period. Alternatively, the present value of the residual value may be determined by applying a market multiple at the end of the projection period. In addition to the projected reporting unit cash flows, the key assumptions in the discounted cash flow model include a discount rate and a long-term growth rate. The discount rate used in the determination of the estimated fair value of the reporting units as of June 30, 2014 using the income approach ranged between 10.5% and 15.5%, with a weighted average discount rate of 11.4%. The long-term growth rate used in the determination of the estimated fair value of the reporting units as of June 30, 2014 using the income approach ranged between 1.5% and 6.0%, with a weighted average long-term growth rate of 3.8%.
Under the market approach, the fair value of each reporting unit is determined based on multiples of revenues and earnings before interest, taxes, depreciation and amortization for each reporting unit. The multiples were determined based on a selection of comparable companies and acquisition transactions, discounted for each reporting unit to reflect the relative size, diversification and risk of the reporting unit in comparison to the indexed companies and transactions.
In our annual goodwill impairment assessment for fiscal year 2014, we concluded that the fair values of the reporting units to which goodwill was assigned exceeded their respective carrying values by at least 32% and by over 126% on average. Accordingly, we did not identify any goodwill impairment.
Our estimates of the fair value of our reporting units can be affected by many assumptions that require significant judgment. For example, the projected reporting unit cash flows used in the discounted cash flow model under the income approach reflect assumptions related to existing customer penetration, new customer acquisition, product innovation and development, total addressable market, pricing, market share, competition and technology obsolescence. Our estimates of fair value may differ materially from that determined by others who use different assumptions. New information may arise in the future that affects our fair value estimates and could result in adjustments to our estimates in the future, which could have an adverse impact on our results of operations.
We test indefinite-lived intangible assets at the unit of accounting level by making a determination of the fair value of the intangible asset. If the fair value of the intangible asset is less than its carrying value, an impairment loss is recognized in an amount equal to the difference. We also evaluate the remaining useful life of our intangible assets that are not subject to amortization on an annual basis to determine whether events and circumstances continue to support an indefinite useful life. If an intangible asset that is not being amortized is subsequently determined to have a finite useful life, that asset is tested for impairment. After recognition of the impairment, if any, the asset is amortized prospectively over its estimated remaining useful life and accounted for in the same manner as other intangible assets that are subject to amortization.
We determine the fair value of our indefinite-lived intangible assets under an income approach using the relief from royalty method, which assumes value to the extent that the acquired company is relieved of the obligation to pay royalties for the benefits received from the assets. In our annual indefinite-lived intangible asset impairment assessment for fiscal year 2014, we concluded that the fair value of our indefinite-lived intangible assets exceeded their respective carrying value and, accordingly, we did not identify any impairment of indefinite-lived intangible assets.
Long-Lived Assets. We review long-lived assets, including intangible assets with finite lives and property and equipment, for impairment whenever events or changes in circumstances indicate that the carrying amount of an asset may not be recoverable. Conditions that would necessitate an impairment assessment include a significant decline in the market price of an asset or asset group, a significant adverse change in the extent or manner in which an asset or asset group is being used, the loss of legal ownership or title to the asset, significant negative industry or economic trends or the presence of other factors that
55
would indicate that the carrying amount of an asset or asset group is not recoverable. We consider a long-lived asset to be impaired if the estimated undiscounted future cash flows resulting from the use of the asset and its eventual disposition are not sufficient to recover the carrying value of the asset. If we deem an asset to be impaired, the amount of the impairment loss represents the excess of the asset’s carrying value compared to its estimated fair value.
Revenue Recognition. Revenues are recognized only after services are provided, when persuasive evidence of an arrangement exists, the fee is fixed and determinable, and when collectability is probable. Our multiple element arrangements primarily include a combination of software licenses, hosted database and other services, installation and set-up services, hardware, maintenance services and transaction-based deliverables.
We generate a significant majority of our revenue from subscription-based contracts (where a monthly fee is charged), transaction-based contracts (where a fee per transaction is charged) and subscription-based contracts with additional transaction-based fees (where a monthly fee and a fee per transaction are charged).
Subscription-based and transaction-based contracts generally include the delivery of software, access to our database through a hosted service, upfront fees for the implementation and set-up activities necessary for the client to use/access the software and maintenance. Under a subscription arrangement, we consider delivery of software, access to the hosted database and maintenance to be a combined unit of accounting and recognize related revenues at the end of each month upon the completion of the monthly service. A transaction-based fee represents a payment for the right to use the software, access to the hosted database and maintenance. We consider the fee to be fixed and determinable only at the time actual usage occurs, and, accordingly, we recognize revenue at the time of actual usage.
Implementation services and set-up activities are necessary for the client to receive services/software. We defer up-front fees billed during the implementation/set-up phase and recognize such revenues on a straight-line basis over the estimated customer life. Recognition of this deferred revenue will commence upon the start of the monthly service. Implementation and set-up costs that are direct and incremental to the contract are capitalized and amortized on a straight-line basis over the estimated customer life.
Revenues are reflected net of customer sales allowances, which are based on both specific identification of certain accounts and a predetermined percentage of revenue based on historical experience.
Share-Based Compensation. We expense share-based payment awards made to employees and directors, including stock options, restricted stock units and performance share units. We estimate the value of stock options with vesting contingent upon the achievement of service conditions as of the date the award was granted using the Black-Scholes option pricing model. The Black-Scholes option-pricing model requires the use of certain input variables, as follows:
Expected Volatility. Volatility is a measure of the amount the stock price will fluctuate during the expected life of an award. We determine the expected volatility based on the historical volatility of our stock price.
Risk-Free Interest Rate. Our assumption of the risk-free interest rate is based on the implied yield available on U.S. constant rate treasury securities in effect at the time of the grant with remaining terms equivalent to the respective expected terms of the share-based award.
Expected Dividend Yield. Our assumption of the dividend yield is based on our history and expectation of future dividend payouts and may be subject to substantial change in the future.
Expected Award Life. Because we have a limited history of stock option exercises, we determine the expected award life using the simplified method, which defines the life as the average of the contractual term and the vesting period.
In addition to the variables above, we are also required to estimate at the grant date the likelihood that the award will ultimately vest (the “pre-vesting forfeiture rate”), and revise the estimate, if necessary, in future periods if the actual forfeiture rate differs. We determine the pre-vesting forfeiture rate of an award based on industry and employee turnover data as well as historical pre-vesting forfeitures occurring over the previous year. We recognize additional share-based compensation expense if the actual forfeiture rate is lower than estimated and a recovery of previously recognized share-based compensation expense if the actual forfeiture rate is higher than estimated.
The fair value of restricted stock units with vesting contingent upon the achievement of service conditions and performance share units with vesting contingent upon the achievement of performance conditions equals the intrinsic value on the date the award was granted.
56
To estimate the grant date fair value of performance share units and stock options with vesting contingent upon the achievement of market conditions, we utilize a Monte-Carlo simulation model which simulates a range of possible future stock prices for us and the identified peer companies.
Income Taxes. Income tax expenses or benefits are recognized for the amount of taxes payable or refundable for the current year and for deferred tax liabilities and assets for the future tax consequences of events that have been recognized in our consolidated financial statements or tax returns. The measurement of current and deferred tax assets and liabilities are based on provisions of currently enacted tax laws. The effects of future enactments of changes in tax laws or rates are not contemplated.
In addition, the calculation of our tax liabilities involves dealing with uncertainties in the application of complex tax regulations. We recognize liabilities for anticipated tax audit issues in the United States and other tax jurisdictions based on our estimate of whether, and the extent to which, additional tax liabilities are more likely than not to be assessed. If we ultimately determine that the obligation is unwarranted, we reverse the liability and recognize a tax benefit during the period in which we determine that the liability is no longer necessary. This may occur for a variety of reasons, such as the expiration of the statute of limitations with respect to a particular tax return or the signing of a final settlement agreement with the respective tax authority. We record an additional charge in our provision for taxes in the period in which we determine that the recorded tax liability is less than we expect the ultimate assessment to be.
As part of the process of preparing consolidated financial statements, we are required to estimate our income taxes and tax contingencies in each of the jurisdictions in which we operate prior to the completion and filing of tax returns for such periods. This process involves estimating actual current tax expense together with assessing temporary differences, or reversing book-tax differences, resulting from differing treatment of items, such as amortization of intangibles, for tax and accounting purposes. These differences result in net deferred tax assets and liabilities.
We regularly assess the likelihood that our deferred tax assets will be realizable using the more-likely-than-not standard. In our assessment, we consider all available evidence, both positive and negative, including historical levels of income, expectations and risks associated with estimates of future taxable income and ongoing prudent and feasible tax planning strategies. If we determine that our deferred tax assets do not meet the more-likely-than-not standard, we establish a valuation allowance. We exercise significant judgment relating to the projection of future taxable income. If judgments regarding recoverability of deferred tax assets change in future periods, we may need to adjust our valuation allowances, which could impact our results of operations in the period in which such determination is made.
During fiscal year 2014, management concluded that it was not more-likely-than-not that all of our U.S. net deferred tax assets will be realized in accordance with U.S. GAAP. Accordingly, we established a valuation allowance against our U.S. net deferred tax assets of $24.8 million due to the limitation in our ability to utilize foreign tax credit carryforwards prior to the expiration of the carryforward periods.
In assessing the future realization of our U.S. deferred tax assets, all available evidence was considered, including our U.S. cumulative income or loss position over the 12 quarters ended June 30, 2014 which included recent increases to interest expense. The U.S. cumulative loss position reduced the weight given to subjective evidence such as projections for future growth. As of each reporting date, our management considers new evidence, both positive and negative, that could impact management’s view with regards to future realization of deferred tax assets. The Company relies heavily on Subpart F income as a future source of taxable income to support the conclusion that the domestic deferred tax assets were more-likely-than-not realizable. We believe that our estimate of future taxable income is reasonable but inherently uncertain, and if our current or future operations and investments generate taxable income different than the anticipated amounts or US tax law changes reduce future Subpart F income, adjustments to the valuation allowance are possible.
Derivative Financial Instruments. Derivative financial instruments are used principally in the management of foreign currency and interest rate exposures and are recorded in the consolidated balance sheets at fair value. If the derivative is designated as a fair value hedge, the changes in the fair value of the derivative and of the hedged item attributable to the hedged risk are recognized as a charge or credit to earnings. If the derivative is designated as a cash flow hedge, the effective portions of the changes in the fair value of the derivative are initially recorded in accumulated other comprehensive income (loss) and are subsequently reclassified into earnings when the hedged transactions occur and affect earnings. Ineffective portions of changes in the fair value of cash flow hedges are recognized as a charge or credit to earnings. Derivative instruments not designated as hedges are marked-to-market at the end of each accounting period with the results included in results of operations.
57
In April 2012, in order to hedge our exposure to variability in the Euro-denominated cash flows associated with two intercompany loans, we entered into two pay fixed Euros / receive fixed U.S. dollar cross-currency swaps in the aggregate notional amount of €109.0 million. These cross-currency swaps were designated, at inception, as cash flow hedges of the intercompany loans.
The effective portion of the gain or loss on these hedges is reported as a component of accumulated other comprehensive income (loss) in stockholders’ equity and reclassified into earnings when the hedged transaction affects earnings. Accordingly, any foreign exchange gains or losses recognized in our consolidated statements of income resulting from the periodic re-measurement of the intercompany loans into U.S. dollars is mitigated by an offsetting gain or loss, as the case may be, resulting from the change in the fair value of the swaps.
In September 2013, in order to hedge our exposure to variability in the Euro-denominated cash flows associated with two intercompany loans, we entered into two pay floating Euros / receive floating U.S. dollar cross-currency swaps in the aggregate notional amount of €141.1 million. These cross-currency swaps were not designated as hedges at inception. We recognize the change in the fair value of the swaps in other (income) expense, net in our consolidated statements of income. In June 2014, we settled one of the intercompany loans and the associated pay floating Euros / receive floating U.S. dollar cross-currency swaps.
We determined the estimated fair value of our derivatives using an income approach and standard valuation techniques that utilize market-based observable inputs including spot and forward interest and foreign currency exchange rates, volatilities and interest rate curves at observable intervals. Our estimate of fair value also considers the risk that the swap contracts will not be fulfilled.
Redeemable Noncontrolling Interests. Certain of the ownership interests in our consolidated subsidiaries held by noncontrolling owners are considered redeemable outside of our control. Accordingly, we have presented these redeemable noncontrolling interests as a mezzanine item in our consolidated balance sheet.
If redeemable at fair value, the redeemable noncontrolling interests are reported at their fair value with any adjustment of the carrying value to fair value recorded to common shares in stockholders’ equity. We estimate the fair value of our noncontrolling interests through an income approach, utilizing a discounted cash flow model, and a market approach, which considers comparable companies and transactions.
Under the income approach, the discounted cash flow model determines fair value based on the present value of projected cash flows over a specific projection period and a residual value related to future cash flows beyond the projection period. Both values are discounted to reflect the degree of risk inherent in an investment in the reporting unit and achieving the projected cash flows. A weighted average cost of capital of a market participant is used as the discount rate. The residual value is generally determined by applying a constant terminal growth rate to the estimated net cash flows at the end of the projection period. Alternatively, the present value of the residual value may be determined by applying a market multiple at the end of the projection period.
Under the market approach, fair value is determined based on multiples of revenues and earnings before interest, taxes, depreciation and amortization for each reporting unit. The multiples were determined based on a selection of comparable companies and acquisition transactions, discounted for each reporting unit to reflect the relative size, diversification and risk of the reporting unit in comparison to the indexed companies and transactions.
Although we considered the fair value under both the income and market approaches, we ultimately determined the fair value of our redeemable noncontrolling interests based solely upon the income approach, which utilizes a discounted cash flow as we believe this is the best indicator of fair value. The key assumptions in the discounted cash flow model include a discount rate and a long-term growth rate. The discount rate used in the determination of the estimated fair value of the redeemable noncontrolling interests as of June 30, 2014 using the income approach ranged between 13.7% and 15.7%, with a weighted average discount rate of 13.8%, reflecting a market participant's perspective as a noncontrolling shareholder in a privately-held subsidiary. The long-term growth rate used in the determination of the estimated fair value of the redeemable noncontrolling interests as of June 30, 2014 using the income approach ranged between 3.0% and 4.0%, with a weighted average long-term growth rate of 3.9%.
Recent Accounting Pronouncements Not Yet Adopted
In July 2013, the FASB issued ASU Topic No. 2013-11, Presentation of an Unrecognized Tax Benefit When a Net Operating Loss Carryforward, a Similar Tax Loss, or a Tax Credit Carryforward Exists, which requires an entity to present
58
certain unrecognized tax benefits as reductions to deferred tax assets rather than as liabilities in balance sheets when a net operating loss carryforward, a similar tax loss, or a tax credit carryforward exists. The ASU does not affect the recognition or measurement of uncertain tax positions under ASC 740. ASU Topic No. 2013-11 is effective for our fiscal year 2015, although
early adoption is permitted.
In May 2014, the FASB issued ASU Topic No. 2014-09, Revenue from Contracts with Customers, which supersedes the revenue recognition requirements in ASC Topic No. 605, Revenue Recognition, and most industry-specific guidance. This guidance primarily requires an entity to recognize revenue to depict the transfer of promised goods or services to customers in an amount that reflects the consideration to which the entity expects to be entitled in exchange for those goods or services. ASU 2014-09 is effective for our fiscal year 2017.
ITEM 7A. | QUANTITATIVE AND QUALITATIVE DISCLOSURES ABOUT MARKET RISK |
Foreign Currency Risk
We conduct operations in many countries around the world. Our results of operations are subject to both currency transaction risk and currency translation risk. We incur currency transaction risk when we enter into either a purchase or sale transaction using a currency other than the local functional currency. With respect to currency translation risk, our financial condition and results of operations are measured and recorded in the relevant local functional currency and then translated into U.S. dollars for inclusion in our consolidated financial statements.
Exchange rates between most of the major foreign currencies we use to transact our business and the U.S. dollar have fluctuated significantly over the last few years and we expect that they will continue to fluctuate. The majority of our revenues and costs are denominated in Euros, Pound Sterling, Swiss francs, Canadian dollars and other foreign currencies. The following table provides the average quarterly exchange rates for the Euro and Pound Sterling since the beginning of fiscal year 2013:
Period | Average Euro-to-U.S. Dollar Exchange Rate | Average Pound Sterling-to-U.S. Dollar Exchange Rate | |||||
Quarter Ended September 30, 2012 | $ | 1.25 | $ | 1.58 | |||
Quarter Ended December 31, 2012 | 1.30 | 1.61 | |||||
Quarter Ended March 31, 2013 | 1.32 | 1.55 | |||||
Quarter Ended June 30, 2013 | 1.31 | 1.54 | |||||
Quarter Ended September 30, 2013 | 1.32 | 1.55 | |||||
Quarter Ended December 31, 2013 | 1.36 | 1.62 | |||||
Quarter Ended March 31, 2014 | 1.37 | 1.65 | |||||
Quarter Ended June 30, 2014 | 1.37 | 1.68 | |||||
During fiscal year 2014, as compared to fiscal year 2013, the U.S. dollar weakened against many of the foreign currencies we use to transact our business. The average U.S. dollar weakened versus the Euro by 4.9% and the Pound Sterling by 3.7%, which increased our revenues and expenses during fiscal year 2014. A hypothetical 5% increase or decrease in the U.S. dollar versus other currencies in which we transact our business would have resulted in an increase or decrease, as the case may be, to our revenues of $31.0 million during fiscal year 2014.
In April 2012, in order to hedge our exposure to variability in the Euro-denominated cash flows associated with two intercompany loans, we entered into two pay fixed Euros / receive fixed U.S. dollar cross-currency swaps in the aggregate notional amount of €109.0 million. These cross-currency swaps were designated, at inception, as cash flow hedges of the intercompany loans. We report the effective portion of the gain or loss on these hedges as a component of accumulated other comprehensive income (loss) in stockholders' equity and reclassify these gains or losses into earnings when the hedged transaction affects earnings. Accordingly, any foreign exchange gain or loss recognized in our consolidated statements of income resulting from the periodic re-measurement of the intercompany loans into U.S. dollars is mitigated by an offsetting gain or loss, as the case may be, resulting from the change in the fair value of the swaps. To date, there has been no hedge ineffectiveness.
In September 2013, in order to hedge our exposure to variability in the Euro-denominated cash flows associated with two intercompany loans, we entered into two pay floating Euros / receive floating U.S. dollar cross-currency swaps in the
59
aggregate notional amount of €141.1 million. These cross-currency swaps were not designated as hedges at inception. We recognize the change in the fair value of the swaps in other expense, net in our consolidated statements of income. In June 2014, we settled one of the intercompany loans and the associated pay floating Euros / receive floating U.S. dollar cross-currency swaps.
During the fiscal years ended June 30, 2014, 2013, and 2012, we recognized net foreign currency transaction gains (losses) in our consolidated statements of income (loss) of $11.0 million, $(5.5) million, and $(8.0) million, respectively.
Interest Rate Risk
Our outstanding long-term debt as of June 30, 2014 consists entirely of senior unsecured notes that bear interest at a fixed interest rate. Accordingly, we are not subject to interest rate risk.
ITEM 8. | FINANCIAL STATEMENTS AND SUPPLEMENTARY DATA |
We incorporate the information required for this item by reference to the financial statements listed in Item 15(a) of Part IV of this Annual Report on Form 10-K.
ITEM 9. | CHANGES IN AND DISAGREEMENTS WITH ACCOUNTANTS ON ACCOUNTING AND FINANCIAL DISCLOSURE |
None.
60
ITEM 9A. | CONTROLS AND PROCEDURES |
Conclusion Regarding the Effectiveness of Disclosure Controls and Procedures
We maintain disclosure controls and procedures, as such term is defined in Rules 13a-15(e) and 15d-15(e) under the Securities Exchange Act of 1934, as amended (the “Exchange Act”), that are designed to provide reasonable assurance that information required to be disclosed by us in the reports that we file or submit under the Exchange Act is recorded, processed, summarized and reported within the time periods specified in the SEC rules and forms, and that such information is accumulated and communicated to our management, including our principal executive officer and principal financial officer, as appropriate, to allow timely decisions regarding required financial disclosures. Under the supervision and with the participation of our management, including our principal executive officer and principal financial officer, we conducted an evaluation of our disclosure controls and procedures and, based on this evaluation, our principal executive officer and principal financial officer concluded that our disclosure controls and procedures were effective as of June 30, 2014.
Our management, including our principal executive officer and principal financial officer, does not expect that our disclosure controls and procedures will prevent all error or all fraud. A control system can provide only reasonable, not absolute, assurance that the objectives of the control system are met. Further, the design of a control system must reflect the fact that there are resource constraints, and the benefits of controls must be considered relative to their costs. Because of the inherent limitations in all control systems, no evaluation of controls can provide absolute assurance that all control issues and instances of fraud, if any, within Solera have been detected. These inherent limitations include the realities that judgments in decision-making can be faulty, and that breakdowns can occur because of simple error or mistake. Additionally, controls can be circumvented by the individual acts of some persons, by collusion of two or more people or by management override of the control. Because of the inherent limitations in a cost-effective control system, misstatements due to error or fraud may occur and not be detected.
Management’s Report on Internal Control over Financial Reporting
Our management is responsible for establishing and maintaining adequate internal control over financial reporting, as such term is defined in Exchange Act Rules 13a-15(f) and 15d-15(f). Our internal control over financial reporting is a process designed to provide reasonable assurance regarding the reliability of financial reporting and the preparation of the financial statements for external purposes in accordance with generally accepted accounting principles. Because of its inherent limitations, internal control over financial reporting may not prevent or detect misstatements. Also, projections of any evaluation of effectiveness to future periods are subject to the risk that internal controls may become inadequate because of changes in conditions, or that the degree of compliance with policies and procedures may deteriorate.
Under the supervision and with the participation of our management, including our principal executive officer and principal financial officer, we conducted an evaluation of the effectiveness of our internal control over financial reporting based on the framework set forth in Internal Control—Integrated Framework issued by the Committee of Sponsoring Organizations of the Treadway Commission. Based on our evaluation under the framework in Internal Control—Integrated Framework, our management concluded that our internal control over financial reporting was effective as of June 30, 2014.
Management’s assessment of and conclusion on the effectiveness of internal control over financial reporting did not include the internal controls of SRS, an entity in which we acquired a 50% controlling interest in November 2013 and constituted 19.1% of our total assets, 5.3% of our total revenues and 53.6% of our net income as of and for the year ended June 30, 2014. Due to the timing of the acquisition, management did not assess the effectiveness of internal control over financial reporting at SRS.
Deloitte & Touche LLP, the independent registered public accounting firm that audited the consolidated financial statements included in this Annual Report on Form 10-K, has also audited the effectiveness of our internal control over financial reporting as of June 30, 2014, as stated in their report which is included herein.
Changes in Internal Controls
There were no changes in our internal control over financial reporting identified in connection with the evaluation of such internal control that occurred during the fourth quarter of fiscal year 2014, that have materially affected, or are reasonably likely to materially affect, our internal control over financial reporting.
61
ITEM 9B. | OTHER INFORMATION |
Not applicable.
62
PART III
ITEM 10. | DIRECTORS, EXECUTIVE OFFICERS AND CORPORATE GOVERNANCE |
Information required by this Item 10 will be set forth in our proxy statement to be filed with the SEC in connection with our 2014 annual meeting of stockholders (the “Proxy Statement”) or in a future amendment to this Annual Report on Form 10-K and is incorporated herein by reference.
We have adopted a Conflict of Interest and Code of Conduct Policy that applies to all officers, directors and employees. The Conflict of Interest and Code of Conduct Policy is available for free on our website at www.solerainc.com under “Investor Relations.” If we make any substantive amendments to the Conflict of Interest and Code of Conduct Policy or grant any waivers from a provision of the Conflict of Interest and Code of Conduct Policy to our principal executive officer, principal financial officer, principal accounting officer or controller, or persons performing similar functions, we will promptly disclose the nature of the amendment or waiver on our website or in a Current Report on Form 8-K.
ITEM 11. | EXECUTIVE COMPENSATION |
Information required by this Item 11 will be set forth in our Proxy Statement or in a future amendment to this Annual Report on Form 10-K and is incorporated herein by reference.
ITEM 12. | SECURITY OWNERSHIP OF CERTAIN BENEFICIAL OWNERS AND MANAGEMENT AND RELATED STOCKHOLDER MATTERS |
Information required by this Item 12 will be set forth in our Proxy Statement or in a future amendment to this Annual Report on Form 10-K and is incorporated herein by reference.
ITEM 13. | CERTAIN RELATIONSHIPS AND RELATED TRANSACTIONS, AND DIRECTOR INDEPENDENCE |
Information required by this Item 13 will be set forth in our Proxy Statement or in a future amendment to this Annual Report on Form 10-K and is incorporated herein by reference.
ITEM 14. | PRINCIPAL ACCOUNTANT FEES AND SERVICES |
Information required by this Item 14 will be set forth in our Proxy Statement or in a future amendment to this Annual Report on Form 10-K and is incorporated herein by reference.
63
PART IV
ITEM 15. | EXHIBITS AND FINANCIAL STATEMENT SCHEDULES |
(a) (1) Financial Statements.
Page | ||
Solera Holdings, Inc.—Consolidated Financial Statements | ||
(a) (2) Financial Statement Schedules. Financial statements schedules, other than the schedule appearing on page F-41, are omitted because they are not required or applicable or the information is included in the consolidated financial statements or notes thereto. | ||
(a) (3) Exhibits. The list of exhibits in the Exhibit Index to this Annual Report on Form 10-K is incorporated herein by reference.
64
SIGNATURES
Pursuant to the requirements of Section 13 or 15(d) of the Securities Exchange Act of 1934, the registrant has duly caused this report to be signed on its behalf by the undersigned, thereunto duly authorized on August 29, 2014.
SOLERA HOLDINGS, INC. | |
/s/ Tony Aquila | |
By: Tony Aquila | |
Its: Chief Executive Officer | |
POWER OF ATTORNEY
KNOW ALL PERSONS BY THESE PRESENTS, that each person whose signature appears below constitutes and appoints Tony Aquila and Renato Giger, and each of them, his true and lawful attorneys-in-fact, each with full power of substitution, for him in any and all capacities, to sign any amendments to this report on Form 10-K and to file the same, with exhibits thereto and other documents in connection therewith, with the Securities and Exchange Commission, hereby ratifying and confirming all that each of said attorneys-in-fact or their substitute or substitutes may do or cause to be done by virtue hereof.
Pursuant to the requirements of the Securities Exchange Act of 1934, this report has been signed by the following persons on behalf of the registrant and in the capacities and on the dates indicated below.
Signatures | Date | |||
/s/ Tony Aquila | Chairman of the Board, Chief Executive Officer and President (principal executive officer) | August 29, 2014 | ||
Tony Aquila | ||||
/s/ Renato Giger | Chief Financial Officer (principal financial and accounting officer) | August 29, 2014 | ||
Renato Giger | ||||
/s/ Kenneth A. Viellieu | Director | August 29, 2014 | ||
Kenneth A. Viellieu | ||||
/s/ Stuart J. Yarbrough | Director | August 29, 2014 | ||
Stuart J. Yarbrough | ||||
/s/ Thomas C. Wajnert | Director | August 29, 2014 | ||
Thomas C. Wajnert | ||||
/s/ Arthur F. Kingsbury | Director | August 29, 2014 | ||
Arthur F. Kingsbury | ||||
/s/ Thomas A. Dattilo | Director | August 29, 2014 | ||
Tom Dattilo | ||||
/s/ Kurt J. Lauk | Director | August 29, 2014 | ||
Kurt J. Lauk | ||||
65
SOLERA HOLDINGS, INC.
INDEX TO THE CONSOLIDATED FINANCIAL STATEMENTS
Page | |
Solera Holdings, Inc.—Consolidated Financial Statements | |
F-1
REPORT OF INDEPENDENT REGISTERED PUBLIC ACCOUNTING FIRM
To the Board of Directors and Stockholders of
Solera Holdings, Inc.
Westlake, Texas
We have audited the accompanying consolidated balance sheets of Solera Holdings, Inc. and subsidiaries (the "Company") as of June 30, 2014 and 2013, and the related consolidated statements of income (loss), comprehensive income (loss), stockholders' equity and redeemable noncontrolling interests and cash flows for each of the three years in the period ended June 30, 2014. Our audits also included the financial statement schedule listed in the Index at Item 15(a). We also have audited the Company's internal control over financial reporting as of June 30, 2014, based on criteria established in Internal Control - Integrated Framework (1992) issued by the Committee of Sponsoring Organizations of the Treadway Commission. The Company's management is responsible for these financial statements and financial statement schedule, for maintaining effective internal control over financial reporting, and for its assessment of the effectiveness of internal control over financial reporting, included in the accompanying management's report on internal control over financial reporting. Our responsibility is to express an opinion on these financial statements and financial statement schedule and an opinion on the Company's internal control over financial reporting based on our audits.
As described in Management’s Report on Internal Control over Financial Reporting, management excluded from its assessment the internal control over financial reporting at Service Repair Solutions, Inc., an entity in which 50% of equity ownership was acquired on November 13, 2013 and whose financial statements constitute 19.1 % of total assets, 5.3 % of revenues, and 53.6% of net loss of the consolidated financial statement amounts as of and for the year ended June 30, 2014. Accordingly, our audit did not include the internal control over financial reporting at Service Repair Solutions, Inc.
We conducted our audits in accordance with the standards of the Public Company Accounting Oversight Board (United States). Those standards require that we plan and perform the audit to obtain reasonable assurance about whether the financial statements are free of material misstatement and whether effective internal control over financial reporting was maintained in all material respects. Our audits of the financial statements included examining, on a test basis, evidence supporting the amounts and disclosures in the financial statements, assessing the accounting principles used and significant estimates made by management, and evaluating the overall financial statement presentation. Our audit of internal control over financial reporting included obtaining an understanding of internal control over financial reporting, assessing the risk that a material weakness exists, and testing and evaluating the design and operating effectiveness of internal control based on the assessed risk. Our audits also included performing such other procedures as we considered necessary in the circumstances. We believe that our audits provide a reasonable basis for our opinions.
A company's internal control over financial reporting is a process designed by, or under the supervision of, the company's principal executive and principal financial officers, or persons performing similar functions, and effected by the company's board of directors, management, and other personnel to provide reasonable assurance regarding the reliability of financial reporting and the preparation of financial statements for external purposes in accordance with generally accepted accounting principles. A company's internal control over financial reporting includes those policies and procedures that (1) pertain to the maintenance of records that, in reasonable detail, accurately and fairly reflect the transactions and dispositions of the assets of the company; (2) provide reasonable assurance that transactions are recorded as necessary to permit preparation of financial statements in accordance with generally accepted accounting principles and that receipts and expenditures of the company are being made only in accordance with authorizations of management and directors of the company; and (3) provide reasonable assurance regarding prevention or timely detection of unauthorized acquisition, use, or disposition of the company's assets that could have a material effect on the financial statements.
Because of the inherent limitations of internal control over financial reporting, including the possibility of collusion or improper management override of controls, material misstatements due to error or fraud may not be prevented or detected on a timely basis. Also, projections of any evaluation of the effectiveness of the internal control over financial reporting to future periods are subject to the risk that the controls may become inadequate because of changes in conditions, or that the degree of compliance with the policies or procedures may deteriorate.
In our opinion, the consolidated financial statements referred to above present fairly, in all material respects, the financial position of Solera Holdings, Inc. and subsidiaries as of June 30, 2014 and 2013, and the results of their operations and their cash flows for each of the three years in the period ended June 30, 2014, in conformity with accounting principles generally accepted in the United States of America. Also, in our opinion, such financial statement schedule, when considered in relation to the basic consolidated financial statements taken as a whole, present fairly, in all material respects, the information set forth therein. Also, in our opinion, the Company maintained, in all material respects, effective internal control over financial
F-2
reporting as of June 30, 2014, based on the criteria established in Internal Control - Integrated Framework (1992) issued by the Committee of Sponsoring Organizations of the Treadway Commission.
/s/ DELOITTE & TOUCHE LLP
Dallas, Texas
August 28, 2014
F-3
SOLERA HOLDINGS, INC.
CONSOLIDATED BALANCE SHEETS
(In thousands, except per share data)
As of June 30, | |||||||
2014 | 2013 | ||||||
ASSETS | |||||||
Current assets: | |||||||
Cash and cash equivalents | $ | 837,751 | $ | 464,239 | |||
Accounts receivable, net of allowance for doubtful accounts of $5,098 and $3,005 at June 30, 2014 and 2013, respectively | 153,150 | 140,395 | |||||
Other receivables | 23,002 | 18,014 | |||||
Other current assets | 35,594 | 28,296 | |||||
Deferred income tax assets | 8,184 | 7,108 | |||||
Total current assets | 1,057,681 | 658,052 | |||||
Property and equipment, net | 76,977 | 61,739 | |||||
Goodwill | 1,574,937 | 1,099,221 | |||||
Intangible assets, net | 584,756 | 352,589 | |||||
Other noncurrent assets | 13,012 | 23,633 | |||||
Noncurrent deferred income tax assets | 92,723 | 62,307 | |||||
Total assets | $ | 3,400,086 | $ | 2,257,541 | |||
LIABILITIES AND STOCKHOLDERS’ EQUITY | |||||||
Current liabilities: | |||||||
Accounts payable | $ | 37,413 | $ | 28,068 | |||
Accrued expenses and other current liabilities | 216,828 | 174,081 | |||||
Income taxes payable | 15,179 | 7,628 | |||||
Deferred income tax liabilities | 13,332 | 3,925 | |||||
Current portion of long-term debt | — | 2,924 | |||||
Total current liabilities | 282,752 | 216,626 | |||||
Long-term debt | 1,867,808 | 1,144,462 | |||||
Other noncurrent liabilities | 63,433 | 42,634 | |||||
Noncurrent deferred income tax liabilities | 106,295 | 20,843 | |||||
Total liabilities | 2,320,288 | 1,424,565 | |||||
Redeemable noncontrolling interests | 382,298 | 84,737 | |||||
Stockholders’ equity: | |||||||
Solera Holdings, Inc. stockholders’ equity: | |||||||
Common shares, $0.01 par value: 150,000 shares authorized; 68,552 and 68,764 issued and outstanding as of June 30, 2014 and 2013, respectively | 629,247 | 602,613 | |||||
Retained earnings | 71,417 | 177,335 | |||||
Accumulated other comprehensive loss | (12,688 | ) | (43,147 | ) | |||
Total Solera Holdings, Inc. stockholders’ equity | 687,976 | 736,801 | |||||
Noncontrolling interests | 9,524 | 11,438 | |||||
Total stockholders’ equity | 697,500 | 748,239 | |||||
Total liabilities and stockholders’ equity | $ | 3,400,086 | $ | 2,257,541 | |||
See accompanying notes to consolidated financial statements.
F-4
SOLERA HOLDINGS, INC.
CONSOLIDATED STATEMENTS OF INCOME (LOSS)
(In thousands, except per share data)
Fiscal Years Ended June 30, | |||||||||||
2014 | 2013 | 2012 | |||||||||
Revenues | $ | 987,259 | $ | 838,103 | $ | 790,207 | |||||
Cost of revenues: | |||||||||||
Operating expenses | 222,262 | 181,448 | 171,763 | ||||||||
Systems development and programming costs | 90,735 | 79,083 | 73,914 | ||||||||
Total cost of revenues (excluding depreciation and amortization) | 312,997 | 260,531 | 245,677 | ||||||||
Selling, general and administrative expenses | 259,786 | 208,989 | 188,245 | ||||||||
Share-based compensation expense | 37,515 | 25,753 | 18,394 | ||||||||
Depreciation and amortization | 122,283 | 103,239 | 103,510 | ||||||||
Restructuring charges, asset impairments, and other costs associated with exit and disposal activities | 6,527 | 5,435 | 7,057 | ||||||||
Acquisition and related costs | 41,512 | 26,945 | 7,962 | ||||||||
Interest expense | 107,422 | 69,511 | 53,593 | ||||||||
Other expense, net | 63,991 | 1,860 | 1,665 | ||||||||
952,033 | 702,263 | 626,103 | |||||||||
Income before provision for income taxes | 35,226 | 135,840 | 164,104 | ||||||||
Income tax provision | 30,058 | 30,797 | 45,718 | ||||||||
Net income | 5,168 | 105,043 | 118,386 | ||||||||
Less: Net income attributable to noncontrolling interests | 13,878 | 11,159 | 11,398 | ||||||||
Net income (loss) attributable to Solera Holdings, Inc. | $ | (8,710 | ) | $ | 93,884 | $ | 106,988 | ||||
Net income (loss) attributable to Solera Holdings, Inc. per common share: | |||||||||||
Basic | $ | (0.13 | ) | $ | 1.35 | $ | 1.52 | ||||
Diluted | $ | (0.13 | ) | $ | 1.35 | $ | 1.51 | ||||
Dividends paid per share | $ | 0.68 | $ | 0.50 | $ | 0.40 | |||||
Weighted-average shares used in the calculation of net income (loss) attributable to Solera Holdings, Inc. per common share: | |||||||||||
Basic | 68,817 | 68,843 | 70,178 | ||||||||
Diluted | 68,817 | 69,139 | 70,527 | ||||||||
See accompanying notes to consolidated financial statements.
F-5
SOLERA HOLDINGS, INC.
CONSOLIDATED STATEMENTS OF COMPREHENSIVE INCOME (LOSS)
(In thousands)
Fiscal Years Ended June 30, | |||||||||||
2014 | 2013 | 2012 | |||||||||
Net income | $ | 5,168 | $ | 105,043 | $ | 118,386 | |||||
Other comprehensive income (loss): | |||||||||||
Foreign currency translation adjustments, net of income tax expense of $1,482, $137 and $2,909, respectively | 43,594 | 11,872 | (86,162 | ) | |||||||
Unrealized losses on derivative financial instruments, net of income tax expense (benefit) of $853, $(504) and $(1,613), respectively | (3,200 | ) | (936 | ) | (2,818 | ) | |||||
Change in funded status of defined benefit pension plans, net of income tax benefit of $(2,001), $(665) and $(1,480), respectively | (5,473 | ) | (3,333 | ) | (7,364 | ) | |||||
Total other comprehensive income (loss) | 34,921 | 7,603 | (96,344 | ) | |||||||
Total comprehensive income | 40,089 | 112,646 | 22,042 | ||||||||
Comprehensive income (loss) attributable to noncontrolling interests | 18,340 | 14,636 | (1,260 | ) | |||||||
Comprehensive income attributable to Solera Holdings, Inc. | $ | 21,749 | $ | 98,010 | $ | 23,302 | |||||
See accompanying notes to consolidated financial statements.
F-6
SOLERA HOLDINGS, INC.
CONSOLIDATED STATEMENTS OF STOCKHOLDERS’ EQUITY
AND REDEEMABLE NONCONTROLLING INTERESTS
(In thousands)
Common Shares | Retained Earnings | Accumulated Other Comprehensive Income (Loss) | Total Solera Holdings, Inc. Stockholders’ Equity | Noncontrolling Interests | Total Stockholders’ Equity | Redeemable Noncontrolling Interests | ||||||||||||||||||||||||
Shares | Amount | |||||||||||||||||||||||||||||
Balance at June 30, 2011 | 70,795 | $ | 587,265 | $ | 151,366 | $ | 36,413 | $ | 775,044 | $ | 10,065 | $ | 785,109 | $ | 94,841 | |||||||||||||||
Net income attributable to Solera Holdings, Inc. and noncontrolling interests | — | — | 106,988 | — | 106,988 | 4,240 | 111,228 | 7,158 | ||||||||||||||||||||||
Total comprehensive income | — | — | — | (83,686 | ) | (83,686 | ) | (827 | ) | (84,513 | ) | (11,831 | ) | |||||||||||||||||
Stock-based compensation | — | 18,394 | — | — | 18,394 | — | 18,394 | — | ||||||||||||||||||||||
Purchases of Solera Holdings, Inc. common shares | (2,202 | ) | (18,491 | ) | (85,005 | ) | — | (103,496 | ) | — | (103,496 | ) | — | |||||||||||||||||
Issuance of common shares under employee stock award plans, net | 302 | 3,009 | — | — | 3,009 | — | 3,009 | — | ||||||||||||||||||||||
Dividends paid on common stock and participating securities ($0.40 per share) | — | — | (28,284 | ) | — | (28,284 | ) | — | (28,284 | ) | — | |||||||||||||||||||
Dividends paid to noncontrolling owners | — | — | — | — | — | (3,433 | ) | (3,433 | ) | (4,837 | ) | |||||||||||||||||||
Sale of shares of majority-owned subsidiary | — | 2,037 | — | — | 2,037 | 102 | 2,139 | — | ||||||||||||||||||||||
Acquisition of additional ownership interest in majority-owned subsidiary | — | — | 137 | — | 137 | — | 137 | (9,628 | ) | |||||||||||||||||||||
Revaluation of and additions to noncontrolling interests | — | (9,521 | ) | (3,388 | ) | — | (12,909 | ) | — | (12,909 | ) | 12,900 | ||||||||||||||||||
Balance at June 30, 2012 | 68,895 | 582,693 | 141,814 | (47,273 | ) | 677,234 | 10,147 | 687,381 | 88,603 | |||||||||||||||||||||
Net income attributable to Solera Holdings, Inc. and noncontrolling interests | — | — | 93,884 | — | 93,884 | 4,688 | 98,572 | 6,471 | ||||||||||||||||||||||
Total comprehensive loss | — | — | — | 4,126 | 4,126 | 626 | 4,752 | 2,851 | ||||||||||||||||||||||
Stock-based compensation | — | 25,753 | — | — | 25,753 | — | 25,753 | — | ||||||||||||||||||||||
Purchases of Solera Holdings, Inc. common shares | (550 | ) | (4,618 | ) | (23,330 | ) | — | (27,948 | ) | — | (27,948 | ) | — | |||||||||||||||||
Issuance of common shares under employee stock award plans, net | 419 | 5,732 | — | — | 5,732 | — | 5,732 | — | ||||||||||||||||||||||
Dividends paid on common stock and participating securities ($0.50 per share) | — | — | (34,814 | ) | — | (34,814 | ) | — | (34,814 | ) | — | |||||||||||||||||||
Dividends paid to noncontrolling owners | — | — | — | — | — | (4,023 | ) | (4,023 | ) | (6,261 | ) | |||||||||||||||||||
Acquisition of additional ownership interest in majority-owned subsidiary | — | — | — | — | — | — | — | (14,093 | ) | |||||||||||||||||||||
Revaluation of and additions to noncontrolling interests | — | (6,947 | ) | (219 | ) | — | (7,166 | ) | — | (7,166 | ) | 7,166 | ||||||||||||||||||
Balance at June 30, 2013 | 68,764 | 602,613 | 177,335 | (43,147 | ) | 736,801 | 11,438 | 748,239 | 84,737 | |||||||||||||||||||||
(continued on next page)
F-7
SOLERA HOLDINGS, INC.
CONSOLIDATED STATEMENTS OF STOCKHOLDERS’ EQUITY
AND REDEEMABLE NONCONTROLLING INTERESTS
(In thousands)
(continued from previous page)
Common Shares | Retained Earnings | Accumulated Other Comprehensive Income (Loss) | Total Solera Holdings, Inc. Stockholders’ Equity | Noncontrolling Interests | Total Stockholders’ Equity | Redeemable Noncontrolling Interests | ||||||||||||||||||||||||
Shares | Amount | |||||||||||||||||||||||||||||
Balance at June 30, 2013 | 68,764 | 602,613 | 177,335 | (43,147 | ) | 736,801 | 11,438 | 748,239 | 84,737 | |||||||||||||||||||||
Net income (loss) attributable to Solera Holdings, Inc. and noncontrolling interests | — | — | (8,710 | ) | — | (8,710 | ) | 5,524 | (3,186 | ) | 8,354 | |||||||||||||||||||
Total comprehensive income | — | — | — | 30,459 | 30,459 | 363 | 30,822 | 4,099 | ||||||||||||||||||||||
Stock-based compensation | — | 37,515 | — | — | 37,515 | — | 37,515 | — | ||||||||||||||||||||||
Purchases of Solera Holdings, Inc. common shares | (898 | ) | (7,953 | ) | (50,001 | ) | — | (57,954 | ) | (57,954 | ) | — | ||||||||||||||||||
Issuance of common shares under employee stock award plans, net | 686 | 8,302 | — | — | 8,302 | — | 8,302 | — | ||||||||||||||||||||||
Dividends paid on common stock and participating securities ($0.68 per share) | — | — | (47,207 | ) | — | (47,207 | ) | — | (47,207 | ) | — | |||||||||||||||||||
Dividends and other distributions paid to noncontrolling owners | — | — | — | — | — | (7,801 | ) | (7,801 | ) | (15,298 | ) | |||||||||||||||||||
Acquisition of additional ownership interest in majority-owned subsidiary | — | — | — | — | — | — | — | 289,176 | ||||||||||||||||||||||
Revaluation of and additions to noncontrolling interests | — | (11,230 | ) | — | — | (11,230 | ) | — | (11,230 | ) | 11,230 | |||||||||||||||||||
Balance at June 30, 2014 | 68,552 | $ | 629,247 | $ | 71,417 | $ | (12,688 | ) | $ | 687,976 | $ | 9,524 | $ | 697,500 | $ | 382,298 | ||||||||||||||
See accompanying notes to consolidated financial statements.
F-8
SOLERA HOLDINGS, INC.
CONSOLIDATED STATEMENTS OF CASH FLOWS
(In thousands)
Fiscal Years Ended June 30, | |||||||||||
2014 | 2013 | 2012 | |||||||||
Cash flows from operating activities: | |||||||||||
Net income | $ | 5,168 | $ | 105,043 | $ | 118,386 | |||||
Adjustments to reconcile net income to net cash provided by operating activities: | |||||||||||
Depreciation and amortization | 122,283 | 103,239 | 103,510 | ||||||||
Provision for doubtful accounts | 4,579 | 3,371 | 2,278 | ||||||||
Share-based compensation | 37,515 | 25,753 | 18,394 | ||||||||
Deferred income taxes | (25,245 | ) | (25,387 | ) | (2,111 | ) | |||||
Change in fair value of derivative financial instruments | 6,897 | 4,400 | (6,628 | ) | |||||||
Loss on extinguishment of debt | 63,328 | — | — | ||||||||
Other | (3,822 | ) | 1,100 | 2,919 | |||||||
Changes in operating assets and liabilities, net of effects from acquisitions of businesses: | |||||||||||
Increase in accounts receivable | (4,852 | ) | (9,869 | ) | (8,268 | ) | |||||
Decrease (increase) in other assets | (1,806 | ) | 6,245 | (10,253 | ) | ||||||
Increase (decrease) in accounts payable | 2,963 | 112 | (3,062 | ) | |||||||
Increase in accrued expenses and other liabilities | 41,518 | 12,701 | 7,827 | ||||||||
Net cash provided by operating activities | 248,526 | 226,708 | 222,992 | ||||||||
Cash flows from investing activities: | |||||||||||
Capital expenditures | (34,374 | ) | (33,174 | ) | (29,690 | ) | |||||
Acquisitions and capitalization of intangible assets | (21,423 | ) | (7,670 | ) | (2,497 | ) | |||||
Proceeds from sale of property and equipment | — | — | 1,128 | ||||||||
Acquisitions of businesses, net of cash acquired | (362,126 | ) | (142,100 | ) | (16,961 | ) | |||||
Decrease in restricted cash | 345 | 1,459 | 201 | ||||||||
Net cash used in investing activities | (417,578 | ) | (181,485 | ) | (47,819 | ) | |||||
Cash flows from financing activities: | |||||||||||
Proceeds from debt issuance, net of payments of debt issuance costs | 1,859,606 | (859 | ) | 401,697 | |||||||
Repayments of long-term debt | (1,197,691 | ) | (2,913 | ) | (272,321 | ) | |||||
Payment of contingent purchase consideration | (2,267 | ) | (2,219 | ) | (220 | ) | |||||
Proceeds from sale of shares in a majority-owned subsidiary | — | — | 2,139 | ||||||||
Acquisition of additional shares in majority-owned subsidiary | — | (14,093 | ) | (9,491 | ) | ||||||
Principal payments on financed asset acquisitions | (145 | ) | (893 | ) | (2,297 | ) | |||||
Cash dividends paid on common shares and participating securities | (47,207 | ) | (34,814 | ) | (28,284 | ) | |||||
Cash dividends and other distributions paid to noncontrolling interests | (23,099 | ) | (10,284 | ) | (8,270 | ) | |||||
Cash paid to repurchase common stock | (57,954 | ) | (27,948 | ) | (103,496 | ) | |||||
Proceeds from stock purchase plan and exercise of stock options | 10,904 | 5,506 | 2,577 | ||||||||
Net cash provided by (used in) financing activities | 542,147 | (88,517 | ) | (17,966 | ) | ||||||
Effect of foreign currency exchange rate changes on cash and cash equivalents | 417 | (713 | ) | (20,062 | ) | ||||||
Net change in cash and cash equivalents | 373,512 | (44,007 | ) | 137,145 | |||||||
Cash and cash equivalents, beginning of period | 464,239 | 508,246 | 371,101 | ||||||||
Cash and cash equivalents, end of period | $ | 837,751 | $ | 464,239 | $ | 508,246 | |||||
Supplemental cash flow information: | |||||||||||
Cash paid for interest | $ | 117,019 | $ | 67,596 | $ | 60,619 | |||||
Cash paid for income taxes | $ | 53,635 | $ | 52,458 | $ | 42,383 | |||||
Supplemental disclosure of non-cash investing and financing activities: | |||||||||||
Capital assets financed | $ | 3,331 | $ | 1,368 | $ | 1,435 | |||||
Accrued contingent purchase consideration | $ | 1,469 | $ | 21,051 | $ | 3,735 | |||||
See accompanying notes to consolidated financial statements.
F-9
SOLERA HOLDINGS, INC.
NOTES TO CONSOLIDATED FINANCIAL STATEMENTS
1. | Organization and Basis of Presentation |
Nature of Operations
Solera Holdings, Inc. and subsidiaries (the “Company”, “Solera”, “we”, “us” or “our”) is a leading global provider of software and services to the automobile insurance claims processing and decision support industries. Our software and services help our customers: estimate the costs to repair damaged vehicles; determine pre-collision fair market values for vehicles damaged beyond repair; automate steps of the claims process; outsource steps of the claims process that insurance companies have historically performed internally; and monitor and manage their businesses through data reporting and analysis. We are active in 70 countries and derive most of our revenues from our estimating and workflow software. Through our acquisitions of HPI, Ltd. (“HPI”) in December 2008 and AUTOonline GmbH In-formationssysteme (“AUTOonline”) in October 2009, we also provide used vehicle validation services in the United Kingdom and operate an eSalvage vehicle exchange platform in several European and Latin American countries as well as India. Through our acquisition of Explore Information Services, LLC (“Explore”) in June 2011, we also provide data and analytics services used by automotive property and casualty insurers in the United States (“U.S.”). In November 2013, we entered into the Service Repair Solutions, Inc. ("SRS") joint venture with Welsh, Carson, Anderson & Stowe ("WCAS") to provide solutions for the service, maintenance and repair market in the U.S. and Canada.
Principles of Consolidation and Basis of Presentation
The accompanying consolidated financial statements have been prepared in accordance with United States generally accepted accounting principles as set forth in the Financial Accounting Standards Board’s Accounting Standards Codification and applicable regulations of the Securities and Exchange Commission (“SEC”). Our operating results for the fiscal year ended June 30, 2014 are not necessarily indicative of the results that may be expected for any future periods.
The consolidated financial statements include the accounts of the Company and its wholly-owned and majority-owned subsidiaries as well as SRS. Our consolidated, majority-owned subsidiaries include our subsidiaries located in Belgium, France and Portugal, and certain of our subsidiaries in Spain and Mexico. All intercompany accounts and transactions have been eliminated in consolidation.
2. | Summary of Significant Accounting Policies |
Use of Estimates
The preparation of the accompanying consolidated financial statements and related disclosures in conformity with accounting principles generally accepted in the United States requires management to make judgments, assumptions and estimates that affect the amounts reported in the consolidated financial statements and accompanying notes. We base our estimates and judgments on historical experience and on various other assumptions that we believe are reasonable under the circumstances. Actual results could differ from those estimates. The reported amounts of assets, liabilities, revenues and expenses are affected by estimates and assumptions which are used for, but not limited to, the accounting for sales allowances, allowance for doubtful accounts, fair value of derivatives, valuation of goodwill and intangible assets, amortization of intangibles, restructurings, liabilities under defined benefit plans, share-based compensation, redeemable noncontrolling interests and income taxes.
Cash and Cash Equivalents
We consider all highly liquid investments with original maturities of 90 days or less at the time of purchase to be cash equivalents. Cash equivalents at June 30, 2014 and 2013 consisted primarily of money market funds and bank certificates of deposit. The carrying amounts approximate fair value due to the short maturities of these instruments.
Accounts Receivable and Allowance for Doubtful Accounts
Accounts receivable are recorded according to contractual agreements. Credit terms for payment of products and services are extended to customers in the normal course of business and no collateral is required. The allowance for doubtful accounts is estimated based on our historical losses, the existing economic conditions, and the financial stability of our customers. Receivables are written-off in the period that they are deemed uncollectible.
F-10
Property and Equipment
Property and equipment is stated at cost and depreciated over the estimated useful lives of the assets using the straight-line method. The estimated useful lives of assets are as follows:
Buildings | 20 to 40 years | |
Building improvements | 5 to 15 years | |
Leasehold improvements | Lesser of 10 years or remaining lease term | |
Data processing equipment | 3 years | |
Furniture and fixtures | 4 to 7 years | |
Machinery and equipment | 3 to 6 years | |
Software licenses | 3 years | |
Internal Use Software
We capitalize the direct and incremental costs incurred in developing or obtaining internal use computer software as well as certain payroll and payroll-related costs of employees who are directly associated with internal use computer software projects. The amount of capitalized payroll costs with respect to these employees is limited to the time directly spent on such projects. The costs associated with preliminary project stage activities, training, maintenance and all other post-implementation stage activities are expensed as incurred. Additionally, we expense internal costs related to minor upgrades and enhancements, as it is impractical to separate these costs from normal maintenance activities.
Contingent Purchase Consideration
Contingent future cash payments related to acquisitions are recognized at fair value as of the acquisition date and included in the determination of the acquisition date purchase price. Subsequent changes in the fair value of the contingent future cash payments are recognized in earnings in the period that the change occurs.
Goodwill and Intangible Assets
Goodwill and intangible assets with indefinite useful lives are not amortized, but instead are tested for impairment annually or more frequently if impairment indicators arise. We perform our annual goodwill and indefinite-lived intangible assets impairment assessment on April 1 of each fiscal year. Impairment indicators arise when events or changes in circumstances indicate that the carrying value of the asset may not be recoverable, such as a significant downturn in industry or economic trends with a direct impact on the business, an expectation that a reporting unit will be sold or otherwise disposed of for less than the carrying value, loss of key personnel, or a significant decline in the market price of an asset or asset group.
We test goodwill for impairment annually at a reporting unit level using a two-step process. The first step of the impairment test involves comparing the fair values of the applicable reporting units with their aggregate carrying
values, including goodwill. If the carrying amount of a reporting unit exceeds the reporting unit’s fair value, we then perform the second step of the goodwill impairment test to determine the amount of the potential impairment loss. The second step of the goodwill impairment test involves comparing the implied fair value of the affected reporting unit’s goodwill with the carrying value of that goodwill. If the carrying amount of goodwill exceeds the implied fair value of that goodwill, an impairment loss is recognized in an amount equal to that excess.
In our annual goodwill impairment assessment for fiscal year 2014, we concluded that the fair values of the reporting units to which goodwill was assigned exceeded their respective carrying values and, accordingly, we did not identify any goodwill impairment.
We test indefinite-lived intangible assets at the unit of accounting level by making a determination of the fair value of the intangible asset. If the fair value of the intangible asset is less than its carrying value, an impairment loss is recognized in an amount equal to the difference. We also evaluate the remaining useful life of our intangible assets that are not subject to amortization on an annual basis to determine whether events and circumstances continue to support an indefinite useful life. If an intangible asset that is not being amortized is subsequently determined to have a finite useful life, that asset is tested for impairment. After recognition of the impairment, if any, the asset is amortized prospectively over its estimated remaining useful life and accounted for in the same manner as other intangible assets that are subject to amortization.
F-11
In our annual indefinite-lived intangible asset impairment assessment for fiscal year 2014, we concluded that the fair value of our indefinite-lived intangible assets exceeded their respective carrying value and, accordingly, we did not identify any impairment of indefinite-lived intangible assets.
Intangible assets with finite lives primarily consist of intangible assets acquired in business combinations and the costs associated with software developed for internal use. We amortize intangible assets with finite lives acquired in business combinations on an accelerated basis to reflect the pattern in which the economic benefits of the intangible asset are consumed. Costs associated with software developed for internal use are amortized over three- to five- years on a straight-line basis.
Impairment of Long-Lived Assets
We review long-lived assets, including intangible assets with finite lives and property and equipment, for impairment whenever events or changes in circumstances indicate that the carrying amount of an asset may not be recoverable. Conditions that would necessitate an impairment assessment include a significant decline in the market price of an asset or asset group, a significant adverse change in the extent or manner in which an asset or asset group is being used, the loss of legal ownership or title to the asset, significant negative industry or economic trends or the presence of other factors that would indicate that the carrying amount of an asset or asset group is not recoverable. We consider a long-lived asset to be impaired if the estimated undiscounted future cash flows resulting from the use of the asset and its eventual disposition are not sufficient to recover the carrying value of the asset. If we deem an asset to be impaired, the amount of the impairment loss represents the excess of the asset’s carrying value compared to its estimated fair value.
Net Income (Loss) Attributable to Solera Holdings, Inc. Per Share
Our restricted stock units have the right to receive non-forfeitable dividends on an equal basis with common stock and therefore are considered participating securities that must be included in the calculation of net income per share using the two-class method. Under the two-class method, basic and diluted net income per share is determined by calculating net income per share for common stock and participating securities based on the cash dividends paid and participation rights in undistributed earnings. Diluted net income per share also considers the dilutive effect of in-the-money stock options and unvested restricted stock units and performance share units that have the right to forfeitable dividends, calculated using the treasury stock method. Under the treasury stock method, the amount of assumed proceeds from unexercised stock options and unvested restricted stock units includes the amount of compensation cost attributable to future services not yet recognized, proceeds from the exercise of the options, and any excess income tax benefit or liability.
F-12
The computation of basic and diluted net income (loss) attributable to Solera Holdings, Inc. per common share using the two-class method is as follows (in thousands, except per share amounts):
Fiscal Years Ended June 30, | |||||||||||
2014 | 2013 | 2012 | |||||||||
Basic net income (loss) attributable to Solera Holdings, Inc. per common share | |||||||||||
Net income (loss) attributable to Solera Holdings, Inc. | $ | (8,710 | ) | $ | 93,884 | $ | 106,988 | ||||
Less: Dividends paid and undistributed earnings allocated to participating securities | (289 | ) | (756 | ) | (548 | ) | |||||
Net income (loss) attributable to common shares—basic | $ | (8,999 | ) | $ | 93,128 | $ | 106,440 | ||||
Weighted-average number of common shares used to compute basic net income (loss) attributable to Solera Holdings, Inc. per common share | 68,817 | 68,843 | 70,178 | ||||||||
Basic net income (loss) attributable to Solera Holdings, Inc. per common share | $ | (0.13 | ) | $ | 1.35 | $ | 1.52 | ||||
Diluted net income (loss) attributable to Solera Holdings, Inc. per common share | |||||||||||
Net income (loss) attributable to Solera Holdings, Inc. | $ | (8,710 | ) | $ | 93,884 | $ | 106,988 | ||||
Less: Dividends paid and undistributed earnings allocated to participating securities | (289 | ) | (754 | ) | (547 | ) | |||||
Net income (loss) attributable to common shares—diluted | $ | (8,999 | ) | $ | 93,130 | $ | 106,441 | ||||
Weighted-average number of common shares used to compute basic net income (loss) attributable to Solera Holdings, Inc. per common share | 68,817 | 68,843 | 70,178 | ||||||||
Diluted effect of options to purchase common stock, restricted stock units and performance share units | — | 296 | 349 | ||||||||
Weighted-average number of common shares used to compute diluted net income (loss) attributable to Solera Holdings, Inc. per common share | 68,817 | 69,139 | 70,527 | ||||||||
Diluted net income (loss) attributable to Solera Holdings, Inc. per common share | $ | (0.13 | ) | $ | 1.35 | $ | 1.51 | ||||
The following securities that could potentially dilute earnings per share in the future are not included in the determination of diluted net income (loss) attributable to Solera Holdings, Inc. per common share (in thousands):
Fiscal Years Ended June 30, | ||||||||
2014 | 2013 | 2012 | ||||||
Antidilutive options to purchase common stock and restricted stock units | 17 | 224 | 761 | |||||
Revenue Recognition
Revenues are recognized only after services are provided, when persuasive evidence of an arrangement exists, the fee is fixed and determinable, and when collectability is probable. Our multiple element arrangements primarily include a combination of software licenses, hosted database and other services, installation and set-up services, hardware, maintenance services and transaction-based deliverables.
We generate a significant majority of our revenue from subscription-based contracts (where a monthly fee is charged), transaction-based contracts (where a fee per transaction is charged) and subscription-based contracts with additional transaction-based fees (where a monthly fee and a fee per transaction are charged).
Subscription-based and transaction-based contracts generally include the delivery of software, access to our database through a hosted service, upfront fees for the implementation and set-up activities necessary for the client to use/access the software and maintenance. Under a subscription arrangement, we consider delivery of software, access to the hosted database and maintenance to be a combined unit of accounting and recognize related revenues at the end of each month upon the completion of the monthly service. A transaction-based fee represents a payment for the right to use the software, access to the hosted database and maintenance. We consider the fee to be fixed and determinable only at the time actual usage occurs, and, accordingly, we recognize revenue at the time of actual usage.
F-13
Implementation services and set-up activities are necessary for the client to receive services/software. We defer up-front fees billed during the implementation/set-up phase and recognize such revenues on a straight-line basis over the estimated customer life. Recognition of this deferred revenue will commence upon the start of the monthly service. Implementation and set-up costs that are direct and incremental to the contract are capitalized and amortized on a straight-line basis over the estimated customer life.
Revenues are reflected net of customer sales allowances, which are based on both specific identification of certain accounts and a predetermined percentage of revenue based on historical experience.
Sales and Related Taxes Collected
Sales and related taxes collected from customers and remitted to various governmental agencies are excluded from reported revenues in our consolidated statements of income.
Cost of Revenues (Excluding Depreciation and Amortization)
Our costs and expenses applicable to revenues represent the total of operating expenses and systems development and programming costs as presented on our consolidated statements of income. Operating expenses include compensation and benefits costs for operations, database development and customer service personnel, other costs related to operations, database development and customer support functions, as well as third-party data and royalty costs, the cost of computer software and hardware used directly in the delivery of our products and services and the costs of purchased data from state departments of motor vehicles. Systems development and programming costs include compensation and benefit costs for our product development and product management personnel, other costs related to our product development and product management functions and costs related to external software consultants involved in systems development and programming activities.
Software Development Costs
Costs for the development of new software products and substantial enhancements to existing software products are expensed as incurred until technological feasibility has been established, at which time any additional costs would be capitalized. The costs to develop such software have not been capitalized as we believe our current software development process is essentially completed concurrent with the establishment of technological feasibility.
Acquisition and Related Costs
Acquisition and related costs include legal and other professional fees and other transaction costs associated with completed and contemplated business combinations and asset acquisitions, costs associated with integrating acquired businesses, including costs incurred to eliminate workforce redundancies and for product rebranding, and other charges incurred as a direct result of our acquisition efforts. These other charges include changes to the fair value of contingent purchase consideration, acquired assets, and assumed liabilities subsequent to the completion of the purchase price allocation, purchase consideration that is deemed to be compensatory in nature, and incentive compensation arrangements with continuing employees of acquired companies. Acquisition and related costs also include the legal and other professional fees associated with the Federal Trade Commission's investigation of our acquisition of Actual Systems of America, Inc. (“ASA”) and the subsequent divestiture of ASA in August 2013.
Foreign Currency Translation
We translate our local currency financial results into U.S. dollars based on average exchange rates prevailing during the reporting period for our consolidated statement of income and certain components of stockholders’ equity, and the exchange rate at the end of that period for our consolidated balance sheet. For each of our foreign subsidiaries, the local currency is its functional currency. These translations resulted in net foreign currency translation adjustments of $39.1 million and $8.4 million in fiscal years 2014 and 2013, respectively, which are recorded as a component of accumulated other comprehensive income (loss) in stockholders’ equity. The foreign currency translation adjustment in fiscal year 2014 was caused by a weakening in the value of the U.S. dollar versus certain foreign currencies, including the Euro, during the period. Generally, this weakening of the U.S. dollar resulted in increases to the U.S. dollar value of certain of our assets and liabilities from June 30, 2013 to June 30, 2014, as presented in the accompanying consolidated balance sheets, although the corresponding local currency balances may have increased only slightly, decreased or remain unchanged.
During the fiscal years ended June 30, 2014, 2013, and 2012, we recognized net foreign currency transaction gains (losses) in other expense, net in our consolidated statements of income (loss) of $11.0 million, $(5.5) million, and $(8.0)
F-14
million, respectively. Functional currencies of significant foreign subsidiaries include Euros, British Pounds, Swiss francs, Canadian dollars, Brazilian reals, and Mexican pesos.
Income Taxes
The provision for income taxes, income taxes payable and deferred income taxes are determined using the asset and liability method. Deferred tax assets and liabilities are determined based on differences between the financial reporting and tax basis of assets and liabilities and are measured by applying enacted tax rates and laws to taxable years in which such differences are expected to reverse.
As part of the process of preparing consolidated financial statements, we are required to estimate our income taxes and tax contingencies in each of the jurisdictions in which we operate prior to the completion and filing for tax returns for such periods. This process involves estimating actual current tax expense together with assessing temporary differences, or reversing book-tax differences, resulting from differing treatment of items, such as deferred revenue, for tax and accounting purposes. These differences result in net deferred tax assets and liabilities.
We regularly assess the likelihood that our deferred tax assets will be realizable using the more-likely-than-not standard. In our assessment, we consider all available evidence, both positive and negative, including historical levels of income, expectations and risks associated with estimates of future taxable income and ongoing prudent and feasible tax planning strategies. If we determine that our deferred tax assets do not meet the more-likely-than-not standard, we establish a valuation allowance. We exercise significant judgment relating to the projection of future taxable income. If judgments regarding recoverability of deferred tax assets change in future periods, we may need to adjust our valuation allowances, which could impact our results of operations in the period in which such determination is made.
Derivative Financial Instruments
We utilize derivative financial instruments to manage interest rate and foreign currency exposures. Derivative financial instruments are recorded in the consolidated balance sheets at fair value. If the derivative is designated as a fair value hedge, the changes in the fair value of the derivative and of the hedged item attributable to the hedged risk are recognized as a charge or credit to earnings. If the derivative is designated as a cash flow hedge, the effective portions of the changes in the fair value of the derivative are initially recorded in accumulated other comprehensive income (loss) and are subsequently reclassified into earnings when the hedged transactions occur and affect earnings. Ineffective portions of changes in the fair value of cash flow hedges are recognized as a charge or credit to earnings. Derivative instruments not designated as hedges are marked-to-market at the end of each period with changes in fair value recognized in earnings.
Advertising Costs
Advertising costs are expensed when incurred and are included in selling, general and administrative expenses. Total advertising costs were $11.2 million, $9.1 million and $7.2 million for the fiscal years ended June 30, 2014, 2013 and 2012, respectively.
Share-Based Compensation
We expense share-based payment awards in the period to which the services rendered for these awards relate. These awards include stock options, restricted stock units and performance share units. We estimate the grant date fair value of stock options with vesting contingent upon the achievement of service conditions using the Black-Scholes option pricing model. The grant date fair value of restricted stock units with vesting contingent upon the achievement of service conditions and performance share units with vesting contingent upon the achievement of performance conditions equals the intrinsic value on the grant date. We estimate the grant date fair value of performance share units and stock options with vesting contingent upon the achievement of market conditions using the Monte-Carlo model, a generally accepted statistical technique used to simulate a range of possible future stock prices.
Share-based compensation expense associated with stock options and restricted stock units with vesting contingent upon the achievement of service conditions is recognized on a straight-line basis over the requisite service period of the award, which generally equals the vesting period. Share-based compensation expense associated with performance share units with vesting contingent upon the achievement of performance conditions and performance share units and stock options with vesting contingent upon the achievement of market conditions is recognized on an accelerated basis over the derived service period. Share-based compensation expense associated with our employee stock purchase plan is recognized over the applicable offering period on a straight-line basis. The amount of share-based compensation expense recognized for share-based awards is
F-15
net of estimated forfeitures of unvested awards. No compensation cost is recorded for awards that do not vest, other than performance share units and stock options with vesting contingent upon the achievement of market conditions.
Accumulated Other Comprehensive Income (Loss)
Accumulated other comprehensive income (loss) includes foreign currency translation adjustments, unrealized gains and losses on derivative instruments related to the effective portion of cash flow hedges, net of the related income tax effect, and changes in the funded status of defined benefit pension plans, net of the related income tax effect, that are excluded from the consolidated statements of income (loss) and are reported as a separate component in stockholders’ equity.
Accumulated other comprehensive income (loss) consists of the following (in thousands):
Fiscal Year Ended June 30, | |||||||
2014 | 2013 | ||||||
Cumulative foreign currency translation adjustments | $ | 11,154 | $ | (27,978 | ) | ||
Unrealized losses on derivative financial instruments, net of tax | (6,954 | ) | (3,754 | ) | |||
Change in funded status of defined benefit pension plans, net of tax | (16,888 | ) | (11,415 | ) | |||
Accumulated other comprehensive loss | $ | (12,688 | ) | $ | (43,147 | ) | |
Guarantees
We recognize, at the inception of a guarantee, a liability for the fair value of any guarantees.
Reclassifications
Share-based compensation expense for the previously reported periods has been reclassified from selling, general and administrative expenses to a separate line item in the accompanying consolidated statement of income (loss) to conform with the current period presentation.
Recently Adopted Accounting Pronouncements
In February 2013, the Financial Accounting Standards Board ("FASB") issued ASU Topic No. 2013-02, Reporting of Amounts Reclassified Out of Accumulated Other Comprehensive Income, which requires entities to report the effect of significant reclassifications out of accumulated other comprehensive income on the respective line items in net income if the amount being reclassified is required to be reclassified in its entirety to net income. For other amounts that are not required to be reclassified in their entirety from accumulated other comprehensive income to net income in the same reporting period, an entity is required to cross-reference other disclosures required that provide additional detail about those amounts. We adopted ASU Topic No. 2013-02 in the first quarter of our fiscal year 2014. Please refer to Note 7 for disclosure of reclassifications out of accumulated other comprehensive income (loss).
In July 2012, the FASB issued ASU Topic No. 2012-02, Intangibles-Goodwill and Other (Topic 350), which amends the guidance on testing indefinite-lived intangible assets, other than goodwill, for impairment to provide entities with the option of performing a qualitative assessment before calculating the fair value of the asset. If it is determined that the fair value of the asset is more likely than not less than the carrying amount based on qualitative factors, the two-step impairment test would be required. We adopted ASU Topic No. 2012-02 in the first quarter of our fiscal year 2014. The adoption of ASU Topic No. 2012-02 did not impact our financial condition, results of operations or cash flows.
New Accounting Pronouncements Not Yet Adopted
In July 2013, the FASB issued ASU Topic No. 2013-11, Presentation of an Unrecognized Tax Benefit When a Net Operating Loss Carryforward, a Similar Tax Loss, or a Tax Credit Carryforward Exists, which requires an entity to present certain unrecognized tax benefits as reductions to deferred tax assets rather than as liabilities in balance sheets when a net operating loss carryforward, a similar tax loss, or a tax credit carryforward exists. ASU Topic No. 2013-11 does not affect the recognition or measurement of uncertain tax positions under ASC 740. ASU Topic No. 2013-11 is effective for our fiscal year 2015, although early adoption is permitted.
In May 2014, the FASB issued ASU Topic No. 2014-09, Revenue from Contracts with Customers, which supersedes the revenue recognition requirements in ASC Topic No. 605, Revenue Recognition, and most industry-specific guidance. This
F-16
guidance primarily requires an entity to recognize revenue to depict the transfer of promised goods or services to customers in an amount that reflects the consideration to which the entity expects to be entitled in exchange for those goods or services. ASU 2014-09 is effective for our fiscal year 2017.
3. | Business Combinations |
Fiscal Year 2014
On November 13, 2013, we acquired a 50% equity ownership interest in SRS and its subsidiaries from WCAS, which was the sole owner, for $289.2 million in cash paid at closing. SRS is a leading U.S. provider in the service, maintenance and repair market with proprietary databases and workflow solutions used by mechanical repair shops and auto dealers. Upon the closing of the SRS transaction, we had control of SRS as defined by accounting principles generally accepted in the United States and therefore consolidated its assets, liabilities, and financial results from the closing date. The acquisition of SRS allows us to expand our reach deeper into household decisions related to the total cost of automobile ownership. SRS has been included in our Americas segment. We have included the results of operations of SRS in our consolidated statements of income (loss) from the acquisition date. Revenues earned and net income reported by SRS were $74.0 million and $3.3 million, respectively, for the period from the acquisition date through June 30, 2014.
We have the right to acquire the remaining 50% equity ownership interest of SRS (the "Call Right") at a price, subject to certain adjustments, equal to the greater of (a) a specified multiple of WCAS’s cost basis of such equity ownership interest, and (b) a per share equity value based on a specified multiple of SRS’s trailing twelve month EBITDA (the “TTM EBITDA”), as defined in the stockholders agreement between us, WCAS and the other parties thereto (the "Stockholders Agreement").
In addition, under the Stockholders Agreement, we had the right to acquire 100% ownership interest in two subsidiaries of SRS, AutoPoint, LLC and Mobile Productivity, LLC. (together, "AutoPoint"), from SRS. We exercised our right and completed the acquisition of AutoPoint in April 2014. The acquisition resulted in tax deductible goodwill of $6.2 million.
WCAS has the right to require that we purchase its equity ownership interest in SRS up to four times per year, subject to an annual cap of $250 million and a $25 million per exercise minimum (the “Annual Put Right”) at a price based on the TTM EBITDA. In addition, WCAS has additional rights to require that we purchase either half or all (depending on the triggering event) of their equity ownership interest of SRS at a price, subject to certain adjustments, equal to a specified multiple of WCAS's cost basis of such equity ownership interest (the “Special Put Right”). The triggering events for the Special Put Right include, among others, a drop in our corporate credit rating below certain specified levels or if SRS is required to become a guarantor of any of the indebtedness of Solera or its subsidiaries (other than SRS) or at any time beginning on August 1, 2018 and ending on the earlier of (x) December 31, 2018 and (y) the consummation of any Annual Put Right after August 1, 2018.
On the acquisition date, we determined the fair value of the 50% noncontrolling ownership interest in SRS to be $289.2 million based primarily on our purchase price for 50% controlling ownership interest. Because the SRS noncontrolling interest is redeemable at other than fair value, we are accreting the carrying value to the redemption value at each reporting period through the earliest redemption date. Accordingly, at any point in time, the carrying value of the SRS noncontrolling interest represents the acquisition-date fair value, adjusted to reflect the noncontrolling owner’s share of net income, dividends paid to the noncontrolling owner, and acquisition of additional equity ownership interest in SRS by us, plus periodic accretion to the redemption value. Since the currently redeemable portion of the SRS noncontrolling interest is capped at $250 million, which is less than the acquisition-date fair value of the noncontrolling interest, we are accreting the carrying value to the redemption value pursuant to the Special Put Right through August 1, 2018.
Additionally, if the redemption value of the SRS noncontrolling interest were to exceed the fair value, the excess would result in an adjustment to the numerator in our calculation of net income per common share attributable to Solera Holdings, Inc. which could result in a decrease in our net income per share. The fair value of the SRS noncontrolling interest exceeded its redemption value at June 30, 2014.
We have accounted for the acquisition of SRS under the acquisition method of accounting and, accordingly, the total purchase price has been allocated to the acquired tangible and identifiable intangible assets and assumed liabilities based on their estimated fair values on the acquisition date. The excess of the purchase price over the aggregate fair values was recorded as goodwill. Of the purchase price for SRS, we have preliminarily allocated $398.8 million to goodwill and $248.4 million to identifiable intangible assets. The goodwill recorded in the acquisition represents future enhancements to the software and database, future customer relationships and markets, and the workforce.
F-17
The following table summarizes the preliminary purchase price allocation for the acquisition of SRS (in thousands):
Goodwill | $ | 398,838 | |
Intangible assets | 248,370 | ||
Cash | 7,458 | ||
Accounts receivable | 1,844 | ||
Other assets acquired | 3,858 | ||
Fair value of redeemable noncontrolling interest | (289,176 | ) | |
Assumed deferred revenue | (3,939 | ) | |
Net deferred tax liabilities | (71,672 | ) | |
Other assumed liabilities | (6,428 | ) | |
Total | $ | 289,153 | |
Identifiable intangible assets acquired from SRS were as follows:
Value (in thousands) | Weighted Average Amortizable Life (in years) | ||||
Customer relationships | $ | 126,470 | 15 | ||
Technology | 71,420 | 10 | |||
Trademarks - indefinite-lived | 49,230 | indefinite | |||
Trademarks - amortizable | 1,250 | 5 | |||
Total | $ | 248,370 | 13 | ||
We are amortizing the acquired identifiable intangible assets on an accelerated basis to reflect the pattern in which the economic benefits of the intangible assets are consumed.
We valued the purchased trademark and technology assets under the income approach using the relief from royalty method, which assumes value to the extent that the acquired company is relieved of the obligation to pay royalties for the benefits received from them. We valued the purchased customer relationships asset under the income approach using the excess earnings methodology based upon estimated future discounted cash flows attributable to revenues projected to be generated from those customers.
In connection with the acquisition of SRS, we incurred direct and incremental costs of $2.7 million, consisting of legal and professional fees, which are included in acquisition and related costs in our consolidated statements of income (loss). Pursuant to the terms of our acquisition of SRS, we received a $2.5 million cash payment from SRS at closing which was intended to reimburse us for a portion of the direct and incremental costs we incurred related to the acquisition. This payment is also included in acquisition and related costs in our consolidated statements of income (loss) for the fiscal year ended June 30, 2014.
The following table presents the unaudited pro forma combined results of the Company and SRS as though the acquisition of SRS occurred at the beginning of fiscal year 2013. The unaudited pro forma financial information is presented for informational purposes only and is not necessarily indicative of the results of operations that would have been achieved if the acquisition had taken place at the beginning of fiscal year 2013. The unaudited pro forma financial information reflects all material, recurring adjustments directly attributable to the acquisition of SRS, including amortization of acquired intangible assets and any related tax effects. Amounts are in thousands, except per share data.
F-18
2014 | 2013 | |||||||
(unaudited) | ||||||||
Revenues | $ | 1,029,119 | $ | 947,181 | ||||
Net income (loss) attributable to Solera Holdings, Inc. | (7,807 | ) | 100,286 | |||||
Net income (loss) attributable to Solera Holdings, Inc. per common share—basic | (0.11 | ) | 1.46 | |||||
Net income (loss) attributable to Solera Holdings, Inc. per common share—diluted | (0.11 | ) | 1.45 | |||||
In addition to SRS, we acquired six businesses during fiscal year 2014, including AutoPoint, for approximately $106.4 million in cash paid at closing and additional future cash payments of up to $51.7 million contingent upon the achievement of certain financial performance, product-related, integration and other objectives. The acquisitions completed in fiscal year 2014 were immaterial both individually and in the aggregate.
Fiscal Year 2013
During fiscal year 2013, we acquired six businesses and substantially all of the assets of another business for approximately $149.6 million in cash paid at closing and additional future cash payments of up to $79.1 million contingent upon the achievement of certain financial performance, product-related, integration and other objectives. The acquisitions completed in fiscal year 2013 were immaterial both individually and in the aggregate.
Fiscal Year 2012
During fiscal year 2012, we acquired three businesses, substantially all of the assets of another business and a majority of the outstanding shares of a fifth business for approximately $10.2 million in cash paid at closing and additional future cash payments of up to $17.5 million contingent upon the achievement of certain financial performance, product-related, integration and other objectives. The acquisitions completed in fiscal year 2012 were immaterial both individually and in the aggregate.
All acquired entities have been included in our consolidated statements of income (loss) from the respective acquisition dates.
At June 30, 2014, the maximum aggregate amount of remaining contingent cash payments associated with our business combinations is $128.7 million which are payable through fiscal year 2018.
F-19
4. | Goodwill and Intangible Assets |
Intangible Assets
Intangible assets, net consists of the following (in thousands):
June 30, 2014 | June 30, 2013 | ||||||||||||||||||||||
Gross Carrying Amount | Accumulated Amortization | Intangible Assets, net | Gross Carrying Amount | Accumulated Amortization | Intangible Assets, net | ||||||||||||||||||
Amortized intangible assets: | |||||||||||||||||||||||
Internally developed software | $ | 60,330 | $ | (22,349 | ) | $ | 37,981 | $ | 37,881 | $ | (16,384 | ) | $ | 21,497 | |||||||||
Purchased customer relationships | 518,483 | (224,305 | ) | 294,178 | 352,408 | (180,412 | ) | 171,996 | |||||||||||||||
Purchased tradenames and trademarks | 39,662 | (30,766 | ) | 8,896 | 35,947 | (26,015 | ) | 9,932 | |||||||||||||||
Purchased software and database technology | 540,803 | (381,478 | ) | 159,325 | 441,060 | (324,480 | ) | 116,580 | |||||||||||||||
Other | 6,021 | (5,776 | ) | 245 | 5,776 | (5,381 | ) | 395 | |||||||||||||||
$ | 1,165,299 | $ | (664,674 | ) | $ | 500,625 | $ | 873,072 | $ | (552,672 | ) | $ | 320,400 | ||||||||||
Intangible assets not subject to amortization: | |||||||||||||||||||||||
Purchased tradenames and trademarks with indefinite lives | 84,131 | — | 84,131 | 32,189 | — | 32,189 | |||||||||||||||||
$ | 1,249,430 | $ | (664,674 | ) | $ | 584,756 | $ | 905,261 | $ | (552,672 | ) | $ | 352,589 | ||||||||||
Amortization of intangible assets totaled $94.2 million, $77.8 million and $79.4 million for the fiscal years ended June 30, 2014, 2013 and 2012, respectively. Estimated future amortization expense related to intangible assets subject to amortization at June 30, 2014 is as follows (in thousands):
2015 | $ | 106,282 | |
2016 | 93,916 | ||
2017 | 79,664 | ||
2018 | 53,010 | ||
2019 | 40,480 | ||
Thereafter | 127,273 | ||
Total | $ | 500,625 | |
Goodwill
The following table summarizes the activity in goodwill for the fiscal years ended June 30, 2014 and 2013 (in thousands):
Balance at Beginning of Year | Current Year Acquisitions | Other | Foreign Currency Translation Effect | Balance at End of Year | |||||||||||||||
Year Ended June 30, 2014: | |||||||||||||||||||
EMEA | $ | 577,042 | $ | 25,676 | $ | — | $ | 29,983 | $ | 632,701 | |||||||||
Americas | 522,179 | 419,639 | 253 | 165 | 942,236 | ||||||||||||||
Total | $ | 1,099,221 | $ | 445,315 | $ | 253 | $ | 30,148 | $ | 1,574,937 | |||||||||
Year Ended June 30, 2013: | |||||||||||||||||||
EMEA | $ | 546,782 | $ | 11,874 | $ | — | $ | 18,386 | $ | 577,042 | |||||||||
Americas | 453,110 | 69,696 | 5 | (632 | ) | 522,179 | |||||||||||||
Total | $ | 999,892 | $ | 81,570 | $ | 5 | $ | 17,754 | $ | 1,099,221 | |||||||||
F-20
We have not recognized any goodwill impairment losses to date.
5. | Redeemable Noncontrolling Interests |
The noncontrolling stockholders of certain of our majority-owned subsidiaries have the right to require us to redeem their shares at the then fair market value. Accordingly, we have presented these redeemable noncontrolling interests as a mezzanine item in our consolidated balance sheets. If redeemable at fair value, the redeemable noncontrolling interests are reported at their fair value with any adjustment of the carrying value to fair value recorded to common shares in stockholders’ equity. We estimate the fair value of our redeemable noncontrolling interests through an income approach, utilizing a discounted cash flow model, and a market approach, which considers comparable companies and transactions, including transactions with the noncontrolling stockholders of our majority-owned subsidiaries.
We do not have any indication that the exercise of the redemption rights is probable within the next twelve months. Further, we do not believe the occurrence of conditions precedent to the exercise of certain of these redemption rights is probable within the next twelve months. If the stockholders exercise their redemption rights, we believe that we have sufficient liquidity to fund such redemptions.
6. | Restructuring Initiatives |
The objectives of our restructuring initiatives and other exit and disposal activities have primarily been to eliminate waste and improve operational efficiencies. The liabilities associated with our restructuring initiatives and other exit and disposal activities are included in accrued expenses and other current liabilities and in other noncurrent liabilities in the accompanying consolidated balance sheets. We report all amounts incurred in connection with our restructuring initiatives and other exit and disposal activities in restructuring charges, asset impairments and other costs associated with exit and disposal activities in the accompanying consolidated statements of income (loss).
The following table summarizes the activity in the restructuring reserves for fiscal years 2014 and 2013 (in thousands):
Employee Termination Benefits | Leases | Other | Total | ||||||||||||
Balance at June 30, 2012 | $ | 5,757 | $ | 2,888 | $ | — | $ | 8,645 | |||||||
Restructuring charges (1) | 4,252 | 13 | 1,170 | 5,435 | |||||||||||
Cash payments | (9,863 | ) | (2,943 | ) | (1,170 | ) | (13,976 | ) | |||||||
Other | — | 42 | — | 42 | |||||||||||
Effect of foreign exchange | 203 | — | — | 203 | |||||||||||
Balance at June 30, 2013 | 349 | — | — | 349 | |||||||||||
Restructuring charges (2) | 4,700 | 694 | 1,133 | 6,527 | |||||||||||
Cash payments | (4,134 | ) | (284 | ) | (1,133 | ) | (5,551 | ) | |||||||
Effect of foreign exchange | (4 | ) | — | — | (4 | ) | |||||||||
Balance at June 30, 2014 | $ | 911 | $ | 410 | $ | — | $ | 1,321 | |||||||
(1) | Of the restructuring charges incurred in fiscal year 2013, $3.3 million, $1.1 million and $1.0 million relates to restructuring initiatives implemented in our EMEA, Corporate and Americas reportable segments, respectively. |
(2) | Of the restructuring charges incurred in fiscal year 2014, $3.6 million, $0.6 million and $2.3 million relates to restructuring initiatives implemented in our EMEA, Corporate and Americas reportable segments, respectively. |
In fiscal year 2014, we initiated various individually insignificant restructuring plans in our EMEA and Americas segments intended to better align the skill sets and capabilities of certain of our business units with our core mission and promote efficiency and profitable innovation throughout the organization.
F-21
The following table summarizes restructuring charges, asset impairments and other costs associated with exit and disposal activities for the periods indicated (in thousands):
Fiscal Year 2014 | Fiscal Year 2013 | Fiscal Year 2012 | |||||||||
Restructuring charges | $ | 6,527 | $ | 5,435 | $ | 7,057 | |||||
Asset impairments | — | — | — | ||||||||
Other costs associated with exit and disposal activities | — | — | — | ||||||||
Total restructuring charges, asset impairments, and other costs associated with exit and disposal activities | $ | 6,527 | $ | 5,435 | $ | 7,057 | |||||
7. | Other Financial Statement Captions |
Property and equipment
Property and equipment, net consists of the following (in thousands):
June 30, | |||||||
2014 | 2013 | ||||||
Land and buildings | $ | 16,243 | $ | 14,695 | |||
Machinery and equipment | 10,218 | 5,664 | |||||
Furniture and fixtures | 8,234 | 5,955 | |||||
Data processing equipment | 63,264 | 52,007 | |||||
Leasehold improvements | 26,073 | 20,922 | |||||
Software licenses | 47,960 | 35,114 | |||||
Capitalized leases of machinery and equipment | 5,145 | 2,482 | |||||
177,137 | 136,839 | ||||||
Less: Accumulated depreciation | (100,160 | ) | (75,100 | ) | |||
Property and equipment, net | $ | 76,977 | $ | 61,739 | |||
Depreciation expense was $28.1 million, $25.4 million and $24.1 million for fiscal years 2014, 2013 and 2012, respectively.
Accrued expenses and other current liabilities
Accrued expenses and other current liabilities consists of the following (in thousands):
June 30, | |||||||
2014 | 2013 | ||||||
Accrued payroll and benefits | $ | 30,777 | $ | 26,582 | |||
Accrued incentive compensation | 34,033 | 21,575 | |||||
Accrued non-income based taxes | 21,440 | 19,003 | |||||
Deferred revenue, customer deposits and advance payments | 30,077 | 20,677 | |||||
Accrued contingent purchase consideration | 45,918 | 37,050 | |||||
Other | 54,583 | 49,194 | |||||
Accrued expenses and other current liabilities | $ | 216,828 | $ | 174,081 | |||
F-22
Other expense, net
Other expense, net consists of the following (in thousands):
Fiscal Years Ended June 30, | |||||||||||
2014 | 2013 | 2012 | |||||||||
Investment income | $ | (396 | ) | $ | (537 | ) | $ | (870 | ) | ||
Losses on equity method investments | 732 | 660 | 689 | ||||||||
Foreign exchange (gains) losses | (11,011 | ) | 5,457 | 8,002 | |||||||
(Gains) losses on derivative instruments designated as hedges | 6,897 | (4,400 | ) | (6,628 | ) | ||||||
Losses on derivative instruments not designated as hedges | 6,700 | — | — | ||||||||
(Gains) losses on asset sales | (2,420 | ) | 560 | — | |||||||
Loss on debt extinguishment | 63,328 | — | — | ||||||||
Other expense | 161 | 120 | 472 | ||||||||
Other expense, net | $ | 63,991 | $ | 1,860 | $ | 1,665 | |||||
Accumulated other comprehensive loss
The following table summarizes the changes in accumulated other comprehensive income (loss) during fiscal year 2014 (in thousands):
Foreign Currency Translation Adjustment | Unrealized Losses on Derivative Financial Instruments | Change in Funded Status of Defined Benefit Pension Plans | Accumulated Other Comprehensive Loss | ||||||||||||
Balance at June 30, 2012 | $ | (36,373 | ) | $ | (2,818 | ) | $ | (8,082 | ) | $ | (47,273 | ) | |||
Other comprehensive income (loss) before reclassifications, net of tax | $ | 8,395 | $ | (5,336 | ) | $ | (3,333 | ) | $ | (274 | ) | ||||
Amounts reclassified from accumulated other comprehensive income (loss) | $ | — | $ | 4,400 | $ | — | $ | 4,400 | |||||||
Balance at June 30, 2013 | $ | (27,978 | ) | $ | (3,754 | ) | $ | (11,415 | ) | $ | (43,147 | ) | |||
Other comprehensive income (loss) before reclassifications, net of tax | 39,132 | (10,097 | ) | (5,473 | ) | 23,562 | |||||||||
Amounts reclassified from accumulated other comprehensive income (loss) | — | 6,897 | — | 6,897 | |||||||||||
Balance at June 30, 2014 | $ | 11,154 | $ | (6,954 | ) | $ | (16,888 | ) | $ | (12,688 | ) | ||||
8. | Fair Value Measurements |
Assets and Liabilities Measured at Fair Value on a Recurring Basis
The following table summarizes our assets and liabilities that require fair value measurements on a recurring basis and their respective input levels based on the fair value hierarchy (in thousands):
Fair Value Measurements at June 30, 2014 Using: | |||||||||||||||
Fair Value at June 30, 2014 | Quoted Market Prices for Identical Assets (Level 1) | Significant Other Observable Inputs (Level 2) | Significant Unobservable Inputs (Level 3) | ||||||||||||
Cash and cash equivalents | $ | 837,751 | $ | 837,751 | $ | — | $ | — | |||||||
Restricted cash (1) | 317 | 317 | — | — | |||||||||||
Derivative financial instruments classified as liabilities (3) | 13,898 | — | 13,898 | — | |||||||||||
Accrued contingent purchase consideration (3) | 20,784 | — | — | 20,784 | |||||||||||
Redeemable noncontrolling interests | 85,958 | — | — | 85,958 | |||||||||||
F-23
Fair Value Measurements at June 30, 2013 Using: | |||||||||||||||
Fair Value at June 30, 2013 | Quoted Market Prices for Identical Assets (Level 1) | Significant Other Observable Inputs (Level 2) | Significant Unobservable Inputs (Level 3) | ||||||||||||
Cash and cash equivalents | $ | 464,239 | $ | 464,239 | $ | — | $ | — | |||||||
Restricted cash (1) | 1,797 | 1,797 | — | — | |||||||||||
Derivative financial instruments classified as assets (2) | 632 | — | 632 | — | |||||||||||
Derivative financial instruments classified as liabilities (3) | 4,286 | — | 4,286 | — | |||||||||||
Accrued contingent purchase consideration (3) | 23,334 | — | — | 23,334 | |||||||||||
Redeemable noncontrolling interests | 84,737 | — | — | 84,737 | |||||||||||
(1) | Included in other current assets and other noncurrent assets in the accompanying consolidated balance sheets. Restricted cash primarily relates to funds held in escrow for the benefit of customers and the sellers of acquired businesses, and facility lease deposits. |
(2) | Included in other noncurrent assets in the accompanying consolidated balance sheet. |
(3) | Included in accrued expenses and other current liabilities, and other noncurrent liabilities in the accompanying consolidated balance sheet. |
Cash and cash equivalents and restricted cash. Our cash and cash equivalents and restricted cash, primarily consist of bank deposits, money market funds and bank certificates of deposit. The fair value of our cash and cash equivalents and restricted cash are determined using quoted market prices for identical assets (Level 1 inputs).
Derivative financial instruments. We estimate the fair value of our cross-currency swaps using industry standard valuation techniques that utilize market-based observable inputs to extrapolate future reset rates from period-end yield curves and standard valuation models based on a discounted cash flow model. Market-based observable inputs including spot and forward rates, volatilities and interest rate curves at observable intervals are used as inputs to the models (Level 2 inputs). Our estimate of fair value also considers the risk that the swap contracts will not be fulfilled.
Accrued contingent purchase consideration. Contingent future cash payments related to business combinations that are not deemed to be compensatory are accrued at fair value as of the acquisition date. We re-assess the fair value measurement at each reporting date. Fair value is determined by estimating the present value of potential future cash payments that would be earned upon achievement by the acquired business of certain financial performance, product-related, integration and other objectives. Our estimate of fair value considers a range of possible cash payment scenarios using information available as of the reporting date, including the recent financial performance of the acquired businesses (Level 3 inputs).
The following table summarizes the activity in accrued contingent purchase consideration which is measured at fair value on a recurring basis using significant unobservable inputs (Level 3 inputs) (in thousands):
Fiscal Year Ended June 30, | |||||||
2014 | 2013 | ||||||
Balance at beginning of period | $ | 23,334 | $ | 4,941 | |||
Current period acquisitions | 969 | 21,090 | |||||
Change in fair value | (1,500 | ) | (629 | ) | |||
Payments | (2,224 | ) | (2,011 | ) | |||
Effect of foreign exchange | 205 | (57 | ) | ||||
Balance at end of period | $ | 20,784 | $ | 23,334 | |||
Redeemable noncontrolling interests. We estimate the fair value of our redeemable noncontrolling interests through an income approach, utilizing a discounted cash flow model, and a market approach, which considers comparable companies and transactions, including transactions with the noncontrolling stockholders of our majority-owned subsidiaries.
Under the income approach, the discounted cash flow model determines fair value based on the present value of projected cash flows over a specific projection period and a residual value related to future cash flows beyond the projection period. Both values are discounted to reflect the degree of risk inherent in an investment in the reporting unit and achieving the projected
F-24
cash flows. A weighted average cost of capital of a market participant, which is an unobservable input, is used as the discount rate. The residual value is generally determined by applying a constant terminal growth rate to the estimated net cash flows at the end of the projection period. Alternatively, the present value of the residual value may be determined by applying a market multiple at the end of the projection period.
Under the market approach, fair value is determined based on multiples of revenues and earnings before interest, taxes, depreciation and amortization for each reporting unit. For our calculation, we determined the multiples based on a selection of comparable companies and acquisition transactions, discounted for each reporting unit to reflect the relative size, diversification and risk of the reporting unit in comparison to the indexed companies and transactions.
Although we considered the fair value under both the income and market approaches, we estimated the fair value of our redeemable noncontrolling interests based solely upon the income approach, which utilizes a discounted cash flow model, a Level 3 input, as we believe this is the best indicator of fair value. The significant unobservable inputs in the discounted cash flow model include a discount rate and a long-term growth rate. The discount rate used in the determination of the estimated fair value of the redeemable noncontrolling interests as of June 30, 2014 using the income approach ranged between 13.7% and 15.7%, with a weighted average discount rate of 13.8%, reflecting a market participant's perspective as a noncontrolling shareholder in a privately-held subsidiary. The long-term growth rate used in the determination of the estimated fair value of the redeemable noncontrolling interests as of June 30, 2014 using the income approach ranged between 3.0% and 4.0%, with a weighted average long-term growth rate of 3.9%.
The following table summarizes the activity in redeemable noncontrolling interests which are measured at fair value on a recurring basis using significant unobservable inputs (Level 3 inputs) (in thousands):
Fiscal Year Ended June 30, | |||||||
2014 | 2013 | ||||||
Balance at beginning of period | $ | 84,737 | $ | 74,118 | |||
Net income attributable to redeemable noncontrolling interests | 6,968 | 6,201 | |||||
Dividends paid to noncontrolling owners | (6,298 | ) | (5,587 | ) | |||
Change in fair value | (3,549 | ) | 6,937 | ||||
Effect of foreign exchange | 4,100 | 3,068 | |||||
Balance at end of period | $ | 85,958 | $ | 84,737 | |||
Assets and Liabilities Measured at Fair Value on a Nonrecurring Basis
We performed our fiscal year 2014 annual goodwill and indefinite-lived intangible asset impairment assessment on April 1, 2014.
We test goodwill for impairment at a reporting unit level. We determine the fair value of our reporting units through a combination of an income approach, utilizing a discounted cash flow model, and a market approach, which considers comparable companies and transactions.
Under the income approach, the discounted cash flow model determines the fair value of each reporting unit based on the present value of projected reporting unit cash flows over a specific projection period and a residual value related to future cash flows beyond the projection period. Both values are discounted to reflect the degree of risk inherent in an investment in the reporting unit and achieving the projected cash flows. A weighted average cost of capital of a market participant is used as the discount rate. The residual value is generally determined by applying a constant terminal growth rate to the estimated net cash flows at the end of the projection period. Alternatively, the present value of the residual value may be determined by applying a market multiple at the end of the projection period.
Under the market approach, the fair value of each reporting unit is determined based on multiples of revenues and earnings before interest, taxes, depreciation and amortization for each reporting unit. The multiples were determined based on a selection of comparable companies and acquisition transactions, discounted for each reporting unit to reflect the relative size, diversification and risk of the reporting unit in comparison to the indexed companies and transactions.
In our annual goodwill impairment assessment for fiscal year 2014, we concluded that the fair values of the reporting units to which goodwill was assigned exceeded their respective carrying values and, accordingly, we did not identify any goodwill impairment.
F-25
We determine fair value of our indefinite-lived intangible assets under an income approach using the relief from royalty method, which assumes value to the extent that the acquired company is relieved of the obligation to pay royalties for the benefits received from the assets. In our annual indefinite-lived intangible asset impairment assessment for fiscal year 2014, we concluded that the fair value of our indefinite-lived intangible assets exceeded their respective carrying value and, accordingly, we did not identify any impairment of indefinite-lived intangible assets.
Fair Value of Other Financial Instruments
The carrying amounts of certain of our financial instruments, including accounts receivable, accounts payable and accrued expenses, approximate fair value due to their short-term nature. Based on the original issue price of the senior unsecured notes that we issued in July 2013, November 2013 and June 2014 (Note 10), a Level 2 input, we believe that the fair value of our senior unsecured notes approximates its carrying value at June 30, 2014.
9. | Derivative Financial Instruments |
In the normal course of business, we are exposed to variability in interest rates and foreign currency exchange rates. We use derivatives to mitigate risks associated with this variability. We do not use derivatives for speculative purposes.
In April 2012, in order to hedge our exposure to variability in the Euro-denominated cash flows associated with two intercompany loans, we entered into two pay fixed Euros / receive fixed U.S. dollar cross-currency swaps in the aggregate notional amount of €109.0 million. We pay Euro fixed coupon payments at 6.99% and receive U.S. dollar fixed coupon payments at 6.75% on the notional amount. The maturity date of the swaps is June 15, 2018. These cross-currency swaps were designated, at inception, as cash flow hedges of the intercompany loans and we evaluate the swaps for effectiveness quarterly. We report the effective portion of the gain or loss on these hedges as a component of accumulated other comprehensive income (loss) in stockholders' equity and reclassify these gains or losses into earnings when the hedged transaction affects earnings. Accordingly, any foreign exchange gain or loss recognized in our consolidated statements of income resulting from the periodic re-measurement of the intercompany loans into U.S. dollars is mitigated by an offsetting gain or loss, as the case may be, resulting from the change in the fair value of the swaps. To date, there has been no hedge ineffectiveness.
In July 2013, as a result of the repayment of the terms loans under the Amended Credit Facility, we terminated the two pay fixed / receive fixed interest rate swaps that were outstanding at June 30, 2013.
In September 2013, in order to hedge our exposure to variability in the Euro-denominated cash flows associated with two intercompany loans, we entered into two pay floating Euros / receive floating U.S. dollar cross-currency swaps in the aggregate notional amount of €141.1 million. We pay Euro floating coupon payments at 6-month EURIBOR plus 35 basis points and receive U.S. dollar floating coupon payments at 6-month LIBOR on the notional amount. The maturity date of the swaps is June 15, 2018. These cross-currency swaps were not designated as hedges at inception. We recognize the change in the fair value of the swaps in other expense, net in our consolidated statements of income.
In June 2014, we settled one of the intercompany loans and the associated pay floating Euros / receive floating U.S. dollar cross-currency swaps.
We determined the estimated fair value of our derivatives using an income approach and standard valuation techniques that utilize market-based observable inputs including spot and forward interest and foreign currency exchange rates, volatilities and interest rate curves at observable intervals. Our estimate of fair value also considers the risk that the swap contracts will not be fulfilled.
F-26
The following table summarizes the fair value of our derivative financial instruments, which are included in other noncurrent assets, accrued expenses and other current liabilities, and other noncurrent liabilities in the accompanying condensed consolidated balance sheets (in thousands):
June 30, 2014 | June 30, 2013 | ||||||
Derivative financial instruments classified as assets | |||||||
U.S. dollar interest rate swap | — | 632 | |||||
Total | $ | — | $ | 632 | |||
Derivative financial instruments classified as liabilities | |||||||
Fixed rate cross-currency swaps | $ | 12,900 | $ | 4,102 | |||
Floating rate cross-currency swaps | 998 | — | |||||
Euro interest rate swap | — | 184 | |||||
Total | $ | 13,898 | $ | 4,286 | |||
The following table summarizes the effect of our derivative financial instruments, designated as cash flow hedges, on the consolidated statements of income and accumulated other comprehensive income (loss) (“AOCI”) (in thousands):
Derivative Financial Instruments | Gain (Loss) Recognized in AOCI on Derivatives (1) | Location of Gain (Loss) Reclassified from AOCI into Income (1) | Gain (Loss) Reclassified from AOCI into Income (1) | Location of Gain (Loss) Recognized in Income on Derivatives (2) | Gain (Loss) Recognized in Income on Derivatives (2) | ||||||||||
Fiscal year Ended June 30, 2014: | |||||||||||||||
Cross-currency swaps | $ | (9,503 | ) | Interest Expense | $ | (705 | ) | N/A | $ | — | |||||
Other Expense, net | (7,401 | ) | N/A | — | |||||||||||
U.S. dollar interest rate swap | — | Interest Expense | (3 | ) | Interest Expense | 549 | |||||||||
Euro interest rate swap | — | Interest Expense | (3 | ) | Interest Expense | (364 | ) | ||||||||
Total | $ | (9,503 | ) | $ | (8,112 | ) | $ | 185 | |||||||
Fiscal year Ended June 30, 2013: | |||||||||||||||
Cross-currency swaps | $ | 6,293 | Interest Expense | $ | 234 | N/A | $ | — | |||||||
Other Expense, net | 4,742 | N/A | — | ||||||||||||
U.S dollar interest rate swap | (265 | ) | Interest Expense | 366 | Interest Expense | 26 | |||||||||
Euro interest rate swap | 607 | Interest Expense | 423 | Interest Expense | 6 | ||||||||||
Total | $ | 6,635 | $ | 5,765 | $ | 32 | |||||||||
Fiscal Year Ended June 30, 2012: | |||||||||||||||
Cross-currency swaps | $ | 1,986 | Interest Expense | $ | 28 | N/A | $ | — | |||||||
Other Expense, net | 6,628 | N/A | — | ||||||||||||
Total | $ | 1,986 | $ | 6,656 | $ | — | |||||||||
(1) | Effective portion. |
(2) | Ineffective portion and amount excluded from effectiveness testing. |
F-27
10. | Long-Term Debt |
Long-term debt consists of the following (in thousands):
June 30, | |||||||
2014 | 2013 | ||||||
Senior unsecured notes due June 2018 (1) | $ | — | $ | 858,683 | |||
Senior unsecured notes due June 2021 (2) | 1,527,808 | — | |||||
Senior unsecured notes due November 2023 | 340,000 | — | |||||
Senior secured domestic term loan due May 2017 | — | 105,171 | |||||
Senior secured European term loan due May 2017 | — | 183,532 | |||||
Total debt | 1,867,808 | 1,147,386 | |||||
Less: Current portion | — | 2,924 | |||||
Long-term portion | $ | 1,867,808 | $ | 1,144,462 | |||
(1) The balance as of June 30, 2013 includes unamortized premium of $8.7 million.
(2) The balance as of June 30, 2014 includes unamortized premium of $17.8 million.
Future minimum principal payments on our outstanding debt as of June 30, 2014 are as follows (in thousands):
2015 | $ | — | |
2016 | — | ||
2017 | — | ||
2018 | — | ||
2019 | — | ||
Thereafter | 1,850,000 | ||
Total (1) | $ | 1,850,000 | |
(1) | Excludes the unamortized premium on the senior unsecured notes of $17.8 million as of June 30, 2014. |
In July 2013, we issued senior unsecured notes due 2021 in the aggregate principal amount of $850.0 million (the “2021 Senior Notes”), resulting in net proceeds of $845.6 million. The 2021 Senior Notes accrue interest at 6.000% per annum, payable semi-annually, and become due and payable on June 15, 2021. We used $289.5 million of the net proceeds from the issuance of the 2021 Senior Notes to repay in full all of the outstanding term loans under our Amended and Restated First Lien Credit and Guaranty Agreement (the “Amended Credit Facility”), including accrued unpaid interest through the repayment date. We intend to use the remainder of the net proceeds for working capital and other general corporate purposes, including strategic initiatives such as future acquisitions, joint ventures, investments or other business development opportunities.
Upon repayment of the outstanding term loans, the Amended Credit Facility was terminated. In connection with the termination of the Amended Credit Facility, we wrote-off the remaining unamortized debt issuance costs related to the term loans of $3.1 million, which is included in other expense, net in our consolidated statement of income (loss) for fiscal year 2014.
In November 2013, we issued additional 2021 Senior Notes in the aggregate principal amount of $510.0 million under the indenture governing the 2021 Senior Notes that were issued in July 2013. The 2021 Senior Notes issued in November 2013 were issued at an original issue price of 101.75% plus accrued interest from July 2013.
In June 2014, we issued additional 2021 Senior Notes in the aggregate principal amount of $150.0 million under the indenture governing the 2021 Senior Notes that were issued in July 2013. The 2021 Senior Notes issued in June 2014 were issued at an original issue price of 106.50% plus accrued interest from December 2013.
The 2021 Senior Notes include redemption provisions that allow us, at our option, to redeem all or a portion of the aggregate principal amount of the 2021 Senior Notes as follows:
• | At any time prior to June 15, 2016, we may redeem up to 35% of the aggregate principal amount of the 2021 Senior Notes at a redemption price equal to 106.000% of the principal amount of the notes redeemed, plus accrued and unpaid interest, if any, through the date of redemption. |
F-28
• | At any time prior to June 15, 2017, we may redeem the 2021 Senior Notes, in whole or in part, at a redemption price equal to 100% of the principal amount of the notes redeemed plus a premium and accrued and unpaid interest to the redemption date. The premium at the applicable redemption date is the greater of: (1) 1.0% of the then outstanding principal amount of the notes; or (2) the excess of: (a) the present value at such redemption date of the sum of the redemption price of the notes at June 15, 2017 plus all required interest payments due on the notes through June 15, 2017 (excluding accrued but unpaid interest to the redemption date), computed using a discount rate equal to the Treasury Rate as of such redemption date plus 50 basis points; over (b) the then outstanding principal amount of the notes. |
• | At any time on or after June 15, 2017, we may redeem the 2021 Senior Notes, in whole or in part, at the following redemption prices, plus accrued and unpaid interest, if any, through the date of redemption: (i) if the redemption occurs on or after June 15, 2017 but prior to June 15, 2018, the redemption price is 103.000% of the principal amount of the notes; (ii) if the redemption occurs on or after June 15, 2018 but prior to June 15, 2019, the redemption price is 101.500% of the principal amount of the notes; and (iii) if the redemption occurs on or after June 15, 2019, the redemption price is 100.000% of the principal amount of the notes. |
In November 2013, we also issued senior unsecured notes due 2023 in the aggregate principal amount of $340.0 million (the “2023 Senior Notes”). The 2023 Senior Notes accrue interest at 6.125% per annum, payable semi-annually, and become due and payable on November 1, 2023.
The 2023 Senior Notes include redemption provisions that allow us, at our option, to redeem all or a portion of the aggregate principal amount of the 2023 Senior Notes as follows:
• | At any time prior to November 1, 2016, we may redeem up to 35% of the aggregate principal amount of the 2023 Senior Notes at a redemption price equal to 106.125% of the principal amount of the notes redeemed, plus accrued and unpaid interest, if any, through the date of redemption. |
• | At any time prior to November 1, 2018, we may redeem the 2023 Senior Notes, in whole or in part, at a redemption price equal to 100% of the principal amount of the notes redeemed plus a premium and accrued and unpaid interest to the redemption date. The premium at the applicable redemption date is the greater of: (1) 1.0% of the then outstanding principal amount of the notes; or (2) the excess of: (a) the present value at such redemption date of the sum of the redemption price of the notes at November 1, 2018 plus all required interest payments due on the notes through November 1, 2018 (excluding accrued but unpaid interest to the redemption date), computed using a discount rate equal to the Treasury Rate as of such redemption date plus 50 basis points; over (b) the then outstanding principal amount of the notes. |
• | At any time on or after November 1, 2018, we may redeem the 2023 Senior Notes, in whole or in part, at the following redemption prices, plus accrued and unpaid interest, if any, through the date of redemption: (i) if the redemption occurs on or after November 1, 2018 but prior to November 1, 2019, the redemption price is 103.063% of the principal amount of the notes; (ii) if the redemption occurs on or after November 1, 2019 but prior to November 1, 2020, the redemption price is 102.042% of the principal amount of the notes; (iii) if the redemption occurs on or after November 1, 2020 but prior to November 1, 2021, the redemption price is 101.021% of the principal amount of the notes; and (iv) if the redemption occurs on or after November 1, 2021, the redemption price is 100.000% of the principal amount of the notes. |
Upon the occurrence of a change of control, we are required to offer to redeem the 2021 Senior Notes and the 2023 Senior Notes at a redemption price equal to 101% of the principal amount of the notes redeemed, plus accrued and unpaid interest, if any, through the redemption date.
We used the net proceeds from the November 2013 issuance of the 2021 Senior Notes and the 2023 Senior Notes of $855.4 million, together with existing cash on hand, to redeem the outstanding senior unsecured notes due June 2018 (the “2018 Senior Notes”). The redemption price for the 2018 Senior Notes was $932.8 million, consisting of (i) the unpaid principal amount of $850.0 million, (ii) accrued unpaid interest through the redemption date of $24.4 million, and (iii) a redemption premium of $58.4 million. The redemption premium of $58.4 million, as well as the remaining unamortized debt issuance costs related to the 2018 Senior Notes, net of the unamortized premium, of $1.8 million, were charged against earnings at the redemption date and are included in other expense, net in our consolidated statement of income (loss) for fiscal year 2014.
F-29
The costs associated with the issuance of the 2021 Senior Notes and the 2023 Senior Notes of $9.1 million were deferred and are included in other noncurrent assets in our consolidated balance sheet. We are amortizing these debt issuance costs to interest expense over the term of the 2021 Senior Notes and the 2023 Senior Notes using the effective interest method.
The indentures governing the 2021 Senior Notes and the 2023 Senior Notes contain limited covenants, including those restricting our and our subsidiaries’ ability to incur certain liens, engage in sale and leaseback transactions and consolidate, merge with, or convey, transfer or lease substantially all of our or their assets to, another person, and, in the case of any of our subsidiaries that did not issue or guarantee such notes, incur indebtedness. We are in compliance with the specified covenants of the 2021 Senior Notes and the 2023 Senior Notes at June 30, 2014.
11. | Share-Based Compensation |
We grant stock awards pursuant to our 2008 Omnibus Equity Incentive Plan (the “2008 Plan”), which was approved by our stockholders in November 2008. Upon stockholder approval of the 2008 Plan, we ceased granting awards under the 2007 Long-Term Equity Incentive Plan (the “2007 Plan”) and the remaining shares available for grant under the 2007 Plan were added to the shares authorized for grant under the 2008 Plan. Additionally, any awards previously granted under the 2007 Plan that expire unexercised or are forfeited are added to the shares authorized for grant under the 2008 Plan.
During fiscal year 2014, we granted stock awards under the 2008 Plan in the form of stock options, restricted stock units and performance share units. Stock options are granted at exercise prices equal to the fair market value of our common stock on the date of grant, generally vest ratably over four years and have a term of seven years. Restricted stock unit grants generally vest ratably over four years. Each performance share unit represents the right to receive one share of our common stock based on our total stockholder return (“TSR”) and/or the achievement of certain financial performance targets during applicable performance periods.
At June 30, 2014, 4.0 million shares remain available for future grant of awards under the 2008 Plan.
We also have an employee stock purchase plan (the "ESPP”) that allows eligible employees to purchase shares of our common stock at a price equal to 95% of the lower of the fair market value of the common stock at the beginning or end of each six-month offering period. We have reserved for issuance 1.5 million shares of our common stock under the ESPP. During fiscal years 2014 and 2013, we awarded approximately 11,000 shares and 14,000 shares, respectively, of our common stock under the ESPP. At June 30, 2014, approximately 1.4 million shares remain available for future grant of awards under the ESPP.
Share-Based Award Activity
The following table summarizes restricted stock unit and performance share unit activity during fiscal year 2014 (shares in thousands):
Number of Shares | Weighted Average Grant Date Fair Value per Share | |||||
Nonvested at June 30, 2013 | 891 | $ | 49.91 | |||
Granted | 571 | $ | 64.42 | |||
Vested | (395 | ) | $ | 47.57 | ||
Forfeited | (230 | ) | $ | 45.03 | ||
Nonvested at June 30, 2014 | 837 | $ | 62.27 | |||
F-30
The following table summarizes stock option activity during fiscal year 2014:
Number of Shares (in thousands) | Weighted Average Exercise Price per Share | Weighted Average Remaining Contractual Term (in years) | Aggregate Intrinsic Value (in thousands) | |||||||||
Outstanding at June 30, 2013 | 4,483 | $ | 49.40 | |||||||||
Granted | 157 | $ | 55.21 | |||||||||
Exercised | (327 | ) | $ | 40.00 | ||||||||
Canceled | (49 | ) | $ | 49.28 | ||||||||
Outstanding at June 30, 2014 | 4,264 | $ | 50.33 | 4.26 | $ | 54,608 | ||||||
Exercisable at June 30, 2014 | 1,536 | $ | 41.34 | 3.78 | $ | 39,655 | ||||||
Of the stock options outstanding at June 30, 2014, approximately 2.3 million are vested and expected to vest.
Cash received from the exercise of stock options was $13.1 million during fiscal year 2014. The intrinsic value of stock options exercised during fiscal years 2014, 2013, and 2012 totaled $8.1 million, $5.7 million, and $2.9 million, respectively.
Valuation of Share-Based Awards
We utilized the Black-Scholes option pricing model for estimating the grant date fair value of stock options with the following assumptions:
Risk-Free Interest Rate | Expected Term (in years) | Weighted Average Expected Stock Price Volatility | Expected Dividend Yield | Weighted Average Per Share Grant Date Fair Value | ||||||||||
Fiscal year 2014 | 1.6 | % | 4.6 | 26.3 | % | 1.2 | % | $ | 11.93 | |||||
Fiscal year 2013 | 0.7 | % | 4.8 | 32.8 | % | 1.0 | % | $ | 12.96 | |||||
Fiscal year 2012 | 1.0 | % | 4.6 | 33.0 | % | 0.7 | % | $ | 15.01 | |||||
We based the risk-free interest rates on the implied yield available on U.S. Treasury constant maturities in effect at the time of the grant with remaining terms equivalent to the respective expected terms of the stock options. Because we have a limited history of stock option exercises, we calculated the expected award life as the average of the contractual term and the vesting period. We determined the expected volatility based on a combination of implied market volatilities, our historical stock price volatility and other factors. The dividend yields for fiscal years 2014, 2013 and 2012 are based on our quarterly cash dividends of $0.17, $0.125 and $0.10 per share, respectively.
The weighted average grant date fair value of restricted stock units granted in fiscal years 2014, 2013 and 2012 was $64.42, $47.14 and $52.60, respectively, determined based on the market price of our common stock on the date of grant, which approximates the intrinsic value.
To estimate the grant date fair value of performance share units and stock options that are earned based on our relative TSR, we utilized a Monte-Carlo simulation model which simulates a range of our possible future stock prices and certain peer companies and assumes that the performance share units and stock options will be earned at target. Based on the Monte-Carlo simulation model, the grant date fair value of performance share units and stock options granted during fiscal year 2013 that are earned based on our relative TSR was $18.89 per share.
Share-Based Compensation Expense
Share-based compensation expense in the accompanying consolidated statements of income (loss), was $37.5 million, $25.8 million and $18.4 million for fiscal years 2014, 2013 and 2012, respectively. At June 30, 2014, the estimated total remaining unamortized share-based compensation expense, net of forfeitures, was $57.5 million which is expected to be recognized over a weighted-average period of 2.7 years.
F-31
12. | Employee Benefit Plans |
Defined Benefit Pension Plans
Our foreign subsidiaries sponsor various defined benefit pension plans and individual defined benefit arrangements covering certain eligible employees. The benefits under these pension plans are based on years of service and compensation levels. Funding is limited to statutory requirements. The measurement date for all plans is June 30 of each fiscal year.
The change in plan assets and benefit obligations as well as the funded status of our foreign pension plans were as follows (in thousands):
June 30, | |||||||
2014 | 2013 | ||||||
Change in plan assets: | |||||||
Fair value of plan assets—beginning of year | $ | 77,758 | $ | 72,734 | |||
Actual return on plan assets | 2,913 | 3,306 | |||||
Employer contributions | 4,021 | 3,852 | |||||
Participant contributions | 1,252 | 1,080 | |||||
Benefits and expenses paid | (4,486 | ) | (5,151 | ) | |||
Settlements | (8,591 | ) | — | ||||
Foreign currency exchange rate changes | 4,080 | 1,937 | |||||
Fair value of plan assets—end of year | $ | 76,947 | $ | 77,758 | |||
Change in benefit obligations: | |||||||
Benefit obligations—beginning of year | $ | 106,722 | $ | 95,965 | |||
Service cost | 4,229 | 3,967 | |||||
Interest cost | 3,177 | 3,224 | |||||
Participant contributions | 1,252 | 1,080 | |||||
Actuarial losses | 9,548 | 5,531 | |||||
Benefits and expenses paid | (4,486 | ) | (5,151 | ) | |||
Settlements, amendments and curtailments | (9,105 | ) | (424 | ) | |||
Foreign currency exchange rate changes | 5,563 | 2,530 | |||||
Projected benefit obligations—end of year | $ | 116,900 | $ | 106,722 | |||
Funded status—plan assets less benefit obligations | $ | (39,953 | ) | $ | (28,964 | ) | |
Unrecognized net actuarial (gains) losses due to experience different than assumed | — | — | |||||
Accrued pension liability | $ | (39,953 | ) | $ | (28,964 | ) | |
The accrued pension liability is included in noncurrent liabilities in the consolidated balance sheets as of June 30, 2014 and 2013, respectively. Changes recognized in accumulated other comprehensive income (loss) is as follows (in thousands):
June 30, | |||||||
2014 | 2013 | ||||||
Accumulated other comprehensive loss—beginning of year | $ | (15,268 | ) | $ | (11,078 | ) | |
Actuarial losses, net | (8,931 | ) | (4,229 | ) | |||
Foreign currency exchange rate changes | (731 | ) | (388 | ) | |||
Amortization or settlement recognition of net losses (1) | 878 | 427 | |||||
Net loss | (8,784 | ) | (4,190 | ) | |||
Accumulated other comprehensive loss—end of year | $ | (24,052 | ) | $ | (15,268 | ) | |
(1) | Represents amounts recognized as components of net pension expense. |
The accumulated benefit obligation for all defined benefit pension plans was $106.4 million and $98.0 million at June 30, 2014 and 2013, respectively.
F-32
In fiscal year 2015, amortization of net actuarial losses is expected to be $1.3 million. We do not expect to amortize any unrecognized prior service cost in fiscal year 2015.
Information for our pension plans with accumulated benefit obligations in excess of plan assets were as follows (in thousands):
June 30, | |||||||
2014 | 2013 | ||||||
Projected benefit obligation | $ | 116,900 | $ | 106,722 | |||
Accumulated benefit obligation | 106,427 | 98,021 | |||||
Fair value of plan assets | 76,947 | 77,758 | |||||
The components of net pension expense were as follows (in thousands):
Fiscal Years Ended June 30, | |||||||||||
2014 | 2013 | 2012 | |||||||||
Service cost—benefits earned during the period | $ | 4,229 | $ | 3,967 | $ | 3,955 | |||||
Interest cost on projected benefits | 3,177 | 3,224 | 3,741 | ||||||||
Expected return on plan assets | (2,301 | ) | (2,428 | ) | (2,633 | ) | |||||
Amortization or settlement recognition of net losses | 878 | 427 | 99 | ||||||||
Net pension expense | $ | 5,983 | $ | 5,190 | $ | 5,162 | |||||
The general assumptions used to determine the actuarial present value of benefit obligations and net pension expense were as follows:
Fiscal Years Ended June 30, | ||||||||
2014 | 2013 | 2012 | ||||||
Assumptions used to determine benefit obligations: | ||||||||
Discount rate | 2.58 | % | 3.12 | % | 3.33 | % | ||
Rate of compensation increase | 2.16 | 2.15 | 2.14 | |||||
Assumptions used to determine net pension expense: | ||||||||
Discount rate | 3.12 | 3.33 | 4.31 | |||||
Expected long-term rate of return on assets | 3.12 | 3.22 | 3.53 | |||||
Rate of compensation increase | 2.15 | 2.14 | 2.12 | |||||
We base the discount rate upon published rates for high quality fixed income investments that produce cash flows that approximate the timing and amount of expected future benefit payments. We determine the weighted-average long-term expected rate of return on assets based on historical and expected future rates of return on plan assets considering the target asset mix and the long-term investment strategy.
The plan assets of the pension plans consist entirely of insurance contracts, which fully insure the benefit payments. The insurance companies invest the plan assets in accordance with the terms of the insurance companies’ guidelines which include a guaranteed minimum rate of return. The fair values of the insurance contracts and their input levels based on the fair value hierarchy are as follows (in thousands):
Fair Value | Fair Value Measurements Using: | ||||||||||
Quoted Market Prices for Identical Assets (Level 1) | Significant Other Observable Inputs (Level 2) | Significant Unobservable Inputs (Level 3) | |||||||||
At June 30, 2014 | 76,947 | — | 76,947 | — | |||||||
At June 30, 2013 | 77,758 | — | 77,758 | — | |||||||
F-33
We estimate the fair value of the insurance contracts based on vested plan benefits, which considers the contributions made to date and the historical rate of return on the plan assets as guaranteed by the insurance contracts.
The contributions for the fiscal years ended June 30, 2014, 2013 and 2012 were $4.0 million, $3.9 million and $4.0 million, respectively. The minimum required contributions and expected contributions to our pension plans are $4.1 million for fiscal year 2015.
Expected future benefit payments as of June 30, 2014 are as follows (in thousands):
2015 | $ | 2,071 | |
2016 | 2,210 | ||
2017 | 2,156 | ||
2018 | 2,459 | ||
2019 | 2,806 | ||
2020 to 2024 | 20,365 | ||
The expected benefits to be paid are based on the same assumptions used to measure our pension plans’ benefit obligation at June 30, 2014 and include estimated future employee service.
Defined Contribution Retirement and Savings Plans
We have a qualifying 401(k) defined contribution plan that covers most of our domestic employees and provides matching contributions under various formulas. For the fiscal years ended June 30, 2014, 2013 and 2012, we incurred $1.8 million, $1.5 million and $1.5 million, respectively, in costs related to the 401(k) plan company matching contributions.
Our foreign subsidiaries have defined contribution plans that cover certain international employees and provide matching contributions under various formulas. For the fiscal years ended June 30, 2014, 2013 and 2012, we incurred $3.4 million, $4.2 million and $4.7 million, respectively, in costs related to our foreign defined contribution plans company matching contributions.
13. | Related Party Transactions |
Certain noncontrolling stockholders of our international subsidiaries are also commercial purchasers and users of our software and services. Revenue transactions with all of the individual noncontrolling stockholders in the aggregate represent less than 10% of consolidated revenue for fiscal years ended June 30, 2014, 2013, and 2012, respectively, and aggregate accounts receivable from the noncontrolling stockholders represent less than 10% of consolidated accounts receivable at June 30, 2014 and 2013, respectively.
On February 12, 2013, we entered into a Facilities Use Agreement with Aquila Guest Ranch LLC (“AGR"), an entity owned by the family of our Chief Executive Officer, Tony Aquila, pursuant to which we shall pay (i) AGR a fixed annual fee of $140,000 in exchange for our use during calendar year 2013 of certain guest ranch facilities in Wyoming and (ii) out-of-pocket costs incurred in connection with, and replenish expendable goods used as a result of, our use of such facility. In connection with the Facilities Use Agreement, we also entered into an Indemnification Agreement with AGR providing that we will indemnify AGR and certain other indemnitees for any claims, demands, causes of action and damages that may arise out of our use of such facility. On December 26, 2013, we entered into an amendment to the Facilities Use Agreement with AGR and Chaparral Lane Investment, LLC ("CLI"), an entity owned by our Chief Executive Officer and his family, to (i) add an additional facility in Roanoke, Texas (the "Roanoke Facility") to the Facilities Use Agreement and (ii) increase the fixed annual fee to $170,000 in exchange for our use during calendar year 2014 of the Wyoming Facility. This fee increase is due to increased operating expenses of the Wyoming Facility and an increase in the number of days during which we use the Wyoming Facility.
F-34
14. | Income Taxes |
Income Before Provision for Income Taxes
The components of income before income taxes attributable to domestic and foreign operations are as follows (in thousands):
Fiscal Years Ended June 30, | |||||||||||
2014 | 2013 | 2012 | |||||||||
Domestic | $ | (136,545 | ) | $ | (23,467 | ) | $ | 538 | |||
Foreign | 171,771 | 159,307 | 163,566 | ||||||||
$ | 35,226 | $ | 135,840 | $ | 164,104 | ||||||
The income tax provision (benefit) by jurisdiction is as follows (in thousands):
Fiscal Years Ended June 30, | |||||||||||
2014 | 2013 | 2012 | |||||||||
Current: | |||||||||||
Federal | $ | 2,273 | $ | 5,984 | $ | 3,447 | |||||
Foreign | 52,197 | 48,947 | 43,108 | ||||||||
State | 833 | 1,253 | 1,274 | ||||||||
Total current | 55,303 | 56,184 | 47,829 | ||||||||
Deferred: | |||||||||||
Federal | (18,796 | ) | (8,603 | ) | 2,637 | ||||||
Foreign | (4,175 | ) | (16,350 | ) | (5,318 | ) | |||||
State | (2,274 | ) | (434 | ) | 570 | ||||||
Total deferred | (25,245 | ) | (25,387 | ) | (2,111 | ) | |||||
Total income tax provision (benefit) | $ | 30,058 | $ | 30,797 | $ | 45,718 | |||||
Effective Tax Rate Reconciliation
A reconciliation between our effective tax rate on income before income tax provision and the U.S. federal statutory rate is as follows (amounts in thousands):
Fiscal Years ended June 30, | ||||||||||||||||||||
2014 | 2013 | 2012 | ||||||||||||||||||
Amount | Percent | Amount | Percent | Amount | Percent | |||||||||||||||
Income tax provision at U.S. statutory rate | $ | 12,329 | 35.0 | % | $ | 47,544 | 35.0 | % | $ | 57,436 | 35.0 | % | ||||||||
(Increase) decrease in provision from: | ||||||||||||||||||||
State taxes, net of federal tax benefit | (1,668 | ) | (4.7 | )% | 381 | 0.3 | % | 2,115 | 1.3 | % | ||||||||||
Foreign tax rate differential | (14,889 | ) | (42.3 | )% | (16,050 | ) | (11.8 | )% | (18,894 | ) | (11.5 | )% | ||||||||
Nondeductible/nontaxable items | 3,851 | 10.9 | % | 1,876 | 1.4 | % | 2,366 | 1.4 | % | |||||||||||
Change in valuation allowance | 26,144 | 74.2 | % | (9,481 | ) | (7.0 | )% | (2,157 | ) | (1.3 | )% | |||||||||
Other non-income based taxes | 2,637 | 7.5 | % | 2,270 | 1.7 | % | 2,528 | 1.5 | % | |||||||||||
Nondeductible stock-based compensation | 2,595 | 7.4 | % | 2,210 | 1.6 | % | 2,056 | 1.3 | % | |||||||||||
Foreign tax credits | — | — | % | (177 | ) | (0.1 | )% | (691 | ) | (0.4 | )% | |||||||||
Unrecognized tax benefits | 1,142 | 3.2 | % | 465 | 0.3 | % | 4,092 | 2.5 | % | |||||||||||
Other | (2,083 | ) | (5.9 | )% | 1,759 | 1.3 | % | (3,133 | ) | (1.9 | )% | |||||||||
Total income tax provision | $ | 30,058 | 85.3 | % | $ | 30,797 | 22.7 | % | $ | 45,718 | 27.9 | % | ||||||||
F-35
Deferred Taxes
The significant components of deferred income tax assets and liabilities are as follows (in thousands):
June 30, | |||||||
2014 | 2013 | ||||||
Deferred income tax assets: | |||||||
Accrued expenses not currently deductible | $ | 13,373 | $ | 11,572 | |||
Depreciation and amortization | 3,754 | 4,190 | |||||
Net operating losses and tax credit carryforwards | 61,972 | 25,509 | |||||
Intangible assets | 3,257 | 4,632 | |||||
Foreign tax credits | 24,150 | 28,941 | |||||
Stock-based compensation | 16,036 | 9,552 | |||||
Pension | 10,337 | 7,830 | |||||
Other | 23,602 | 7,591 | |||||
156,481 | 99,817 | ||||||
Less: Valuation allowances | (40,653 | ) | (13,899 | ) | |||
Deferred income tax assets, net | 115,828 | 85,918 | |||||
Deferred income tax liabilities: | |||||||
Intangible assets | 128,455 | 34,302 | |||||
Other | 6,093 | 6,970 | |||||
Deferred income tax liabilities | 134,548 | 41,272 | |||||
Net deferred income tax assets (liabilities) | $ | (18,720 | ) | $ | 44,646 | ||
Net Operating Losses, Tax Credit Carryforwards and Valuation Allowances
As of June 30, 2014, we have $104.1 million of U.S. federal net operating loss carryforwards that will begin to expire in 2033, $73.4 million of U.S. state net operating loss carryforwards that will begin to expire in 2014, and $93.7 million of foreign net operating loss carryforwards that will begin to expire in 2014. We also have $3.2 million of U.S. federal and $2.5 million of U.S. state research and development tax credit carryforwards that will begin to expire in 2021, and $32.3 million of foreign tax credit carryforwards that will begin to expire in 2016. Utilization of our U.S. federal and state net operating losses and U.S. federal and state tax credit carryforwards may be subject to annual limitation due to the ownership change limitations provided by the Internal Revenue Code and similar state provisions. Such an annual limitation could result in the expiration of the net operating loss carryforwards before utilization.
Of the $36.4 million deferred tax asset related to our federal net operating loss carryforwards, $2.4 million is excluded from deferred income tax assets and liabilities as that amount relates to excess tax benefits of stock based compensation deduction for which a tax benefit has not yet been realized, as described below. In addition, $6.1 million related to the foreign tax credit carryforward, $0.6 million related to the U.S. federal research and development tax credit carryforward, and $0.4 million related to the U.S. state research and development tax credit carryforward are excluded from deferred income tax assets and liabilities as those amounts also relate to excess tax benefits on stock-based compensation deductions for which a tax benefit has not yet been realized.
We have not recorded excess tax benefits of $9.5 million as of June 30, 2014 from excess stock-based compensation deductions for which a benefit has not yet been realized. Excess tax benefits represent stock compensation deductions in excess of expenses recognized for financial reporting purposes and are realized when they reduce taxes payable, as determined using a “with and without” method.
We have recorded valuation allowances for deferred tax assets of $40.7 million and $13.9 million at June 30, 2014 and 2013, respectively.
As of June 30, 2014, management concluded that it was not more-likely-than-not that all of our U.S. net deferred tax assets will be realized in accordance with U.S. GAAP. Accordingly, we established a valuation allowance against our U.S. net
F-36
deferred tax assets of $24.8 million due to the limitation in our ability to utilize foreign tax credit carryforwards prior to the expiration of the carryforward periods.
Unremitted Earnings
We consider the undistributed earnings of our foreign subsidiaries as of June 30, 2014 to be indefinitely reinvested and, accordingly, no U.S. income taxes have been provided thereon. Our undistributed earnings in significant jurisdictions were approximately $936.1 million as of June 30, 2014. If we distributed those earnings in the form of dividends or otherwise, we could be subject to both U.S. income taxes and withholding taxes payable to various foreign countries. It is currently not practicable to compute the residual taxes due on such earnings.
Uncertain Tax Positions
A reconciliation of the beginning and ending amount of total unrecognized tax benefits is as follows (in thousands):
Fiscal Years Ended June 30, | |||||||||||
2014 | 2013 | 2012 | |||||||||
Gross unrecognized tax benefits balance at beginning of period | $ | 12,500 | $ | 9,599 | $ | 6,218 | |||||
Increase related to prior year tax positions | 127 | 236 | 1,588 | ||||||||
Decrease related to prior year tax positions | (401 | ) | (509 | ) | — | ||||||
Increase related to current year tax positions | 2,217 | 3,825 | 1,981 | ||||||||
Decrease related to settlements | (384 | ) | (96 | ) | — | ||||||
Decrease related to lapse of statute of limitations | (824 | ) | (555 | ) | (188 | ) | |||||
Gross unrecognized tax benefits balance at end of period | $ | 13,235 | $ | 12,500 | 9,599 | ||||||
Of the unrecognized tax benefits reflected above, the amounts that, if recognized, would impact the effective tax rate were $13.4 million, $12.7 million and $9.9 million for fiscal years 2014, 2013 and 2012, respectively. The amount of unrecognized tax benefits expected to be recognized in the next twelve months is not significant.
We recognize accrued interest and penalties, if incurred, related to unrecognized tax benefits as a component of income tax expense. We had approximately $1.2 million, $1.1 million and $1.2 million of accrued interest expense and penalties related to unrecognized tax benefits for fiscal years 2014, 2013 and 2012, respectively.
We file U.S. federal income tax returns as well as income tax returns in various states and foreign jurisdictions and, as such, are subject to examination in various jurisdictions. The material jurisdictions that are subject to examination by tax authorities primarily include the United States, Canada, France, Germany, Spain, Switzerland and the United Kingdom, covering tax years 2005 through 2013.
Pursuant to the terms of the acquisition agreements, the sellers in our business combinations have indemnified us for all tax liabilities related to the pre-acquisition periods. We are liable for any tax assessments for the post-acquisition periods for our U.S. and foreign jurisdictions.
15. | Contractual Commitments and Contingencies |
Leases and Other Contractual Commitments
We lease office space and equipment under various operating and capital leases. Additionally, we have contractual obligations under software license agreements and other purchase commitments. Total expense incurred under these agreements was approximately $18.0 million, $14.0 million and $13.4 million for the fiscal years 2014, 2013 and 2012, respectively. Obligations under capital leases totaled $0.2 million as of June 30, 2014 and 2013, respectively.
F-37
Future minimum contractual commitments at June 30, 2014 are as follows (in thousands):
2015 | $ | 15,814 | |
2016 | 12,646 | ||
2017 | 10,096 | ||
2018 | 8,280 | ||
2019 | 5,729 | ||
Thereafter | 2,705 | ||
Total | $ | 55,270 | |
In addition to fixed rentals, certain leases require payment of maintenance and real estate taxes and contain escalation provisions based on future adjustments in price indices.
Contingencies
In the normal course of business, we are subject to various claims, charges and litigation. In particular, we have been the subject of allegations that our repair estimating and total loss software and services produced results that favored our insurance company customers, one of which is the subject of pending litigation. In addition, we are subject to assertions by our customers and strategic partners that we have not complied with the terms of our agreements with them or our agreements with them are not enforceable. We have and will continue to vigorously defend ourselves against these claims. We believe that final judgments, if any, which may be rendered against us in current litigation, are adequately reserved for, covered by insurance or would not have a material adverse effect on our financial position.
Guarantees
In the normal course of business, we enter into contracts in which we makes representations and warranties that guarantee the performance of our products and services. Losses related to such guarantees were not significant during any of the periods presented.
16. | Segment and Geographic Information |
Segment Information
We have aggregated our operating segments into two reportable segments: EMEA and Americas. Our EMEA reportable segment encompasses our operations in Europe, the Middle East, Africa, Asia and Australia, while our Americas reportable segment encompasses our operations in North, Central and South America.
Our chief operating decision maker is our Chief Executive Officer. We evaluate the performance of our reportable segments based on revenues, income before provision for income taxes and adjusted EBITDA, a non-GAAP financial measure that represents GAAP net income attributable to Solera Holdings, Inc. excluding interest expense, provision for income taxes, depreciation and amortization, stock-based compensation expense, restructuring charges, asset impairments and other costs associated with exit and disposal activities, acquisition and related costs, litigation related expenses and other (income) expense, net. We do not allocate certain costs to reportable segments, including costs related to our financing activities, business development and oversight, and tax, audit and other professional fees, to our reportable segments. Instead, we manage these costs at the Corporate level.
F-38
(in thousands) | EMEA | Americas | Corporate | Total | |||||||||||
Fiscal Year Ended June 30, 2014 | |||||||||||||||
Revenues | $ | 517,751 | $ | 469,508 | $ | — | $ | 987,259 | |||||||
Income (loss) before provision for income taxes | 188,196 | 111,634 | (264,604 | ) | 35,226 | ||||||||||
Significant items included in income (loss) before provision for income taxes: | |||||||||||||||
Depreciation and amortization | 46,198 | 75,531 | 554 | 122,283 | |||||||||||
Interest expense | 91 | 209 | 107,122 | 107,422 | |||||||||||
Other (income) expense, net | 1,586 | (615 | ) | 63,020 | 63,991 | ||||||||||
Total assets at end of period | 1,328,348 | 1,556,323 | 515,415 | 3,400,086 | |||||||||||
Capital expenditures | 17,609 | 16,765 | — | 34,374 | |||||||||||
Fiscal Year Ended June 30, 2013 | |||||||||||||||
Revenues | $ | 471,182 | $ | 366,921 | $ | — | $ | 838,103 | |||||||
Income (loss) before provision for income taxes | 170,003 | 115,114 | (149,277 | ) | 135,840 | ||||||||||
Significant items included in income (loss) before provision for income taxes: | |||||||||||||||
Depreciation and amortization | 47,541 | 55,359 | 339 | 103,239 | |||||||||||
Interest expense | 67 | — | 69,444 | 69,511 | |||||||||||
Other (income) expense, net | 614 | 147 | 1,099 | 1,860 | |||||||||||
Total assets at end of period | 1,275,982 | 855,821 | 125,738 | 2,257,541 | |||||||||||
Capital expenditures | 18,282 | 14,892 | — | 33,174 | |||||||||||
Fiscal Year Ended June 30, 2012 | |||||||||||||||
Revenues | $ | 464,395 | $ | 325,812 | $ | — | $ | 790,207 | |||||||
Income (loss) before provision for income taxes | 163,959 | 117,633 | (117,488 | ) | 164,104 | ||||||||||
Significant items included in income (loss) before provision for income taxes: | |||||||||||||||
Depreciation and amortization | 51,716 | 51,685 | 109 | 103,510 | |||||||||||
Interest expense | 715 | 15 | 52,863 | 53,593 | |||||||||||
Other (income) expense, net | 454 | 94 | 1,117 | 1,665 | |||||||||||
Total assets at end of period | 1,150,287 | 738,725 | 262,804 | 2,151,816 | |||||||||||
Capital expenditures | 20,541 | 9,149 | — | 29,690 | |||||||||||
Geographic Information
Geographic revenue information is based on the location of the customer. No single country other than the United States, the United Kingdom, and Germany accounted for 10% or more of our consolidated revenue and/or property and equipment.
(in thousands) | Europe * | United States | United Kingdom | Germany | All Other | Total | |||||||||||||||||
Revenues: | |||||||||||||||||||||||
Fiscal Year Ended June 30, 2014 | $ | 289,790 | $ | 368,151 | $ | 116,334 | $ | 95,799 | $ | 117,185 | $ | 987,259 | |||||||||||
Fiscal Year Ended June 30, 2013 | 268,686 | 269,165 | 101,815 | 85,035 | 113,402 | 838,103 | |||||||||||||||||
Fiscal Year Ended June 30, 2012 | 266,634 | 236,239 | 98,673 | 84,832 | 103,829 | 790,207 | |||||||||||||||||
Property and equipment, net: | |||||||||||||||||||||||
At June 30, 2014 | 22,954 | 26,460 | 15,810 | 6,909 | 4,844 | 76,977 | |||||||||||||||||
At June 30, 2013 | 18,043 | 16,471 | 16,588 | 6,666 | 3,971 | 61,739 | |||||||||||||||||
* Excludes the United Kingdom and Germany.
F-39
Concentration of Risks
We offer a broad range of services to a diverse group of customers throughout North, Central and South America, Europe, the Middle East, Africa and Asia. We perform periodic credit evaluations of its customers and monitor their financial condition and developing business news. No customers accounted for more than 10% of consolidated revenues or accounts receivable for any of the periods presented.
17. | Share Repurchase Program |
In November 2011, our Board of Directors approved a share repurchase program for up to a total of $180.0 million of our common stock through November 20, 2013. In October 2013, our Board of Directors approved a new share repurchase program, replacing the share repurchase program authorized in November 2011, for up to a total of $200.0 million of our common stock through November 10, 2015. Share repurchases are made from time to time, through an accelerated stock purchase agreement, in open market transactions at prevailing market prices or in privately negotiated transactions. The repurchase program does not require us to purchase any specific number or amount of shares, and the timing and amount of such purchases will be determined by management based upon market conditions and other factors. In addition, the program may be amended or terminated at the discretion of our Board of Directors. Through September 30, 2013, we repurchased approximately 2.9 million shares for $136.6 million under the share repurchase program that was authorized in November 2011. Through June 30, 2014, we have repurchased approximately 0.8 million shares for $52.8 million under the share repurchase program that was authorized in October 2013.
18. | Subsequent Events |
On July 8, 2014, we acquired the claims-related business from the Sherwood Group of companies in the United Kingdom. We renamed the acquired business Valexa Technologies Limited and it is a leading provider of innovative exchanges, settlement platforms, and data analytics focused on the insurance industry in the United Kingdom, including car rental billing services and pet insurance claims.
On July 29, 2014, we completed our acquisition of the insurance and services division of Pittsburgh Glass Works, LLC for cash consideration of approximately $280 million. Due to the proximity of the acquisition closing date, completion of the purchase price allocation prior to the filing date of our Annual Report on Form 10-K was impracticable.
On August 26, 2014, we announced that our Board of Directors approved the payment of a cash dividend of $0.195 per share of outstanding common stock and per outstanding restricted stock unit. The Board of Directors also approved a quarterly stock dividend equivalent of $0.195 per outstanding restricted stock unit granted to certain of our executive officers since fiscal year 2011 in lieu of the cash dividend, which dividend equivalent will be paid to the restricted stock unit holders as the restricted stock unit vests. The dividends are payable on September 23, 2014 to stockholders and restricted stock unit holders of record at the close of business on September 9, 2014. Any determination to pay dividends in future periods will be at the discretion of our Board of Directors.
F-40
19. | Quarterly Financial Results (Unaudited) |
Summarized unaudited quarterly results of operations for the fiscal years ended June 30, 2014 and 2013 are as follows (amounts in thousands, except per share data):
Fiscal Year Ended June 30, 2014 (1)(2) | First Quarter | Second Quarter | Third Quarter | Fourth Quarter | ||||||||||||
Revenues | $ | 218,028 | $ | 238,915 | $ | 262,416 | $ | 267,900 | ||||||||
Cost of revenues (excluding depreciation and amortization) | 69,323 | 76,394 | 82,618 | 84,662 | ||||||||||||
Net income (loss) attributable to Solera Holdings, Inc. (4) | 13,691 | (51,053 | ) | 19,893 | 8,759 | |||||||||||
Net income (loss) attributable to Solera Holdings Inc. per common share (4): | ||||||||||||||||
Basic | $ | 0.20 | $ | (0.74 | ) | $ | 0.29 | $ | 0.13 | |||||||
Diluted | $ | 0.20 | $ | (0.74 | ) | $ | 0.28 | $ | 0.13 | |||||||
Fiscal Year Ended June 30, 2013 (1)(3) | First Quarter | Second Quarter | Third Quarter | Fourth Quarter | ||||||||||||
Revenues | $ | 195,719 | $ | 209,232 | $ | 214,625 | $ | 218,527 | ||||||||
Cost of revenues (excluding depreciation and amortization) | 60,197 | 65,645 | 66,837 | 67,852 | ||||||||||||
Net income attributable to Solera Holdings, Inc. (5) | 33,641 | 19,768 | 21,476 | 18,999 | ||||||||||||
Net income attributable to Solera Holdings Inc. per common share (5): | ||||||||||||||||
Basic | $ | 0.49 | $ | 0.28 | $ | 0.31 | $ | 0.27 | ||||||||
Diluted | $ | 0.48 | $ | 0.28 | $ | 0.31 | $ | 0.27 | ||||||||
(1) | Our business is subject to seasonal and other fluctuations. In particular, we have historically experienced higher revenues during the second quarter and third quarter versus the first quarter and fourth quarter during each fiscal year. This seasonality is caused primarily by more days of inclement weather during the second quarter and third quarter in most of our markets, which contributes to a greater number of vehicle accidents and damage during these periods. In addition, our business is subject to fluctuations caused by other factors, including the occurrence of extraordinary weather events and the timing of certain public holidays. For example, the Easter holiday occurs during the third quarter in certain fiscal years and occurs during the fourth quarter in other fiscal years, resulting in a change in the number of business days during the quarter in which the holiday occurs. |
(2) | The results of operations of Pusula Otomotiv Danýþmanlik Ekspertiz Hizmetleri Anonim Þirketi, Servicios Informaticos Serinfo S.A., SRS, Distribution Services Technologies, Inc, AutoPoint, Autosoft S.r.l., and sachcontrol AG, acquired in fiscal year 2014, are included from the respective dates of the acquisitions, which are not the first day of fiscal year 2014. |
(3) | The results of operations of License Monitor, Inc., Title Technologies, Inc, Mensaelect S.A., CarweB Limited, HyperQuest, Inc., Eziworks Pty Ltd, and substantially all of the assets of PS Holdings, L.L.C., acquired in fiscal year 2013, are included from the respective dates of the acquisitions, which are not the first day of the applicable fiscal year. |
(4) | Net income (loss) attributable to Solera Holdings, Inc. and net income (loss) attributable to Solera Holdings, Inc. per common share for the second quarter of fiscal year 2014 reflects one-time charges associated with the redemption of our 2018 Senior Notes in November 2013 of $60.2 million. |
(5) | Net income attributable to Solera Holdings, Inc. and net income attributable to Solera Holdings, Inc. per common share for the fourth quarter of fiscal year 2013 reflect a fiscal year-to-date reduction of pre-tax stock compensation expense of approximately $3.5 million related to performance share units with vesting contingent upon the achievement of certain performance conditions. |
F-41
SOLERA HOLDINGS, INC.
Schedule II—Valuation and Qualifying Accounts
(in thousands) | Balance at Beginning of Period | Net Additions Charged (Credited) to Expense | Deductions (1) | Other (2) | Balance at End of Period | |||||||||||||
Allowance for doubtful accounts: | ||||||||||||||||||
Year Ended June 30, 2014 | $ | 3,005 | $ | 4,579 | $ | (3,250 | ) | 764 | $ | 5,098 | ||||||||
Year Ended June 30, 2013 | $ | 2,356 | $ | 3,371 | $ | (2,912 | ) | 190 | $ | 3,005 | ||||||||
Year Ended June 30, 2012 | $ | 2,769 | $ | 2,278 | $ | (3,062 | ) | 371 | $ | 2,356 | ||||||||
(1) | Deductions for allowance for doubtful accounts primarily consists of accounts receivable written-off, net of recoveries. |
(2) | Represents balances acquired in connection with business combinations and changes in foreign currency. |
F-42
EXHIBIT INDEX
Exhibit Number | Description | |
3.1* | Amended and Restated Certificate of Incorporation of the Registrant (filed as Exhibit 3.1 to Solera Holdings, Inc.’s Form S-1/A filed with the SEC on May 9, 2007). | |
3.2* | Amended and Restated By-laws of the Registrant (filed as Exhibit 3.1 to Solera Holdings, Inc.’s Form 8-K filed with the SEC on November 18, 2008). | |
4.1* | Specimen Common Stock Certificate (filed as Exhibit 4.1 to Solera Holdings, Inc.’s Form S-1/A filed with the SEC on May 9, 2007). | |
4.2* | Indenture, dated as of July 2, 2013, among Audatex North America, Inc., Solera Holdings, Inc., the other guarantors party thereto and U.S. Bank National Association, as trustee (filed as Exhibit 4.1 to Solera Holdings, Inc.’s Form 8-K filed with the SEC on July 9, 2013). | |
4.3* | Form of 6.000% Senior Note due 2021 (included as Exhibit A to Exhibit 4.2). | |
4.4* | Indenture, dated as of April 13, 2012, among Audatex North America, Inc., Solera Holdings, Inc., the other guarantors named therein and U.S. Bank National Association, as trustee (filed as Exhibit 4.1 to Solera Holdings, Inc.'s Form 8-K filed with the SEC on April 16, 2012). | |
4.5* | Form of 6.75% Senior Note due 2018 (included as Exhibit A to Exhibit 4.4). | |
4.6* | Supplemental Indenture, dated as of November 5, 2013, supplementing the Indenture, dated as of July 2, 2013, among Audatex North America, Inc., Solera Holdings, Inc., the other guarantors named therein and U.S. Bank National Association, as trustee (filed as Exhibit 4.1 to Solera Holdings, Inc.’s Form 8-K filed with the SEC on November 5, 2013). | |
4.7* | Indenture, dated as of November 5, 2013, among Audatex North America, Inc., Solera Holdings, Inc., the other guarantors named therein and U.S. Bank National Association, as trustee (filed as Exhibit 4.2 to Solera Holdings, Inc.’s Form 8-K filed with the SEC on November 5, 2013). | |
4.8* | Supplemental Indenture, dated as of June 2, 2014, supplementing the Indenture, dated as of July 2, 2013, among Audatex North America, Inc., Solera Holdings, Inc., the other guarantors named therein and U.S. Bank National Association, as trustee (filed as Exhibit 4.1 to Solera Holdings, Inc.’s Form 8-K filed with the SEC on June 2, 2014). | |
10.1* | Transaction Agreement, dated as of February 8, 2006, by and among Solera, Inc., Automatic Data Processing, Inc., ADP Atlantic Inc., ADP Nederland B.V., ADP International B.V., ADP Canada Co. and ADP Private Limited (filed as Exhibit 10.1 to Solera Holdings, Inc.’s Form S-1 filed with the SEC on February 12, 2007). | |
10.2* | Amendment No. 1 to Transaction Agreement, dated as of March 28, 2006, by and among Solera, Inc., Automatic Data Processing, Inc., ADP Atlantic Inc., ADP Nederland B.V., ADP International B.V., ADP Canada Co. and ADP Private Limited (filed as Exhibit 10.2 to Solera Holdings, Inc.’s Form S-1 filed with the SEC on February 12, 2007). | |
10.3* | Amendment No. 2 to Transaction Agreement, dated as of April 13, 2006, by and among Solera, Inc., Automatic Data Processing, Inc., ADP Atlantic Inc., ADP Nederland B.V., ADP International B.V., ADP Canada Co. and ADP Private Limited (filed as Exhibit 10.3 to Solera Holdings, Inc.’s Form S-1 filed with the SEC on February 12, 2007). | |
10.4*# | Solera Holdings, Inc. 2007 Long-Term Equity Incentive Plan (filed as Exhibit 10.5 to Solera Holdings, Inc.’s Form S-1/A filed with the SEC on May 9, 2007). | |
10.5*# | Form of Option Agreement issued under 2007 Long-Term Equity Incentive Plan (filed as Exhibit 10.6 to Solera Holdings, Inc.’s Form S-1/A filed with the SEC on April 30, 2007). | |
10.6*# | Solera Holdings, Inc. 2007 Employee Stock Purchase Plan (filed as Exhibit 10.8 to Solera Holdings, Inc.’s Form S-1/A filed with the SEC on May 9, 2007). | |
10.7* | Share Purchase Agreement among RAC plc, HPI Holding Limited and Solera Holdings, Inc. dated December 19, 2008 (filed as Exhibit 10.1 to Solera Holdings, Inc.’s Form 10-Q filed with the SEC on February 9, 2009). | |
10.8* | Share Purchase Agreement among ArgeMu Holding GmbH, a German limited liability company and an indirect wholly owned subsidiary of the registrant, Solera Holdings, Inc., “Cuss-GmbH” Computerunterstützte Sachverständigen Systeme, a German limited liability company, DEKRA Automobil GmbH, a German limited liability company, and AWG Abfallwirtschaftsgesellschaft mbH, a German limited liability company dated September 16/17, 2009 (filed as Exhibit 10.1 to Solera Holdings, Inc.’s Form 10-Q filed with the SEC on November 6, 2009). | |
10.9* | Form of Restricted Stock Unit Grant Agreement, 2008 Omnibus Incentive Plan (filed as Exhibit 10.1 to Solera Holdings, Inc.'s Form 10-Q filed with the SEC on November 4, 2010). | |
10.10* | Form of Stock Option Agreement, 2008 Omnibus Incentive Plan (filed as Exhibit 10.2 to Solera Holdings, Inc.'s Form 10-Q filed with the SEC on November 4, 2010). | |
10.11*# | Non-Employee Director Compensation Program (filed as Exhibit 10.1 to Solera Holdings, Inc.'s Form 10-Q filed with the SEC on February 8, 2011). | |
10.12* | Purchase Agreement, dated as of April 23, 2011, among Claims Services Group, Inc., Solera Holdings, Inc., HireRight Solutions, Inc. and Altegrity, Inc. (filed as Exhibit 10.20 to Solera Holdings, Inc.’s Form 10-K filed with the SEC on August 26, 2011). | |
10.13*# | Executive Employment Agreement, dated June 6, 2011, between Solera Holdings, Inc. and Tony Aquila (filed as Exhibit 10.21 to Solera Holdings, Inc.’s Form 10-K filed with the SEC on August 26, 2011). | |
10.14*# | Purchase Agreement, dated as of April 23, 2011, among Claims Services Group, Inc., Solera Holdings, Inc., HireRight Solutions, Inc. and Altegrity, Inc. (filed as Exhibit 10.20 to Solera Holdings, Inc.’s Form 10-K filed with the SEC on August 26, 2011). | |
10.15*# | Form of Performance Share Unit Grant Agreement, 2008 Omnibus Incentive Plan (filed as Exhibit 99.1 to Solera Holdings, Inc.'s Form 8-K filed with the SEC on September 21, 2011). | |
10.16* | Facilities Use Agreement and Indemnification Agreement between Solera Holdings, Inc. and Aquila Family Ventures LLC, dated February 12, 2013 (filed as Exhibit 10.1 to Solera Holdings, Inc.'s Form 10-Q filed with the SEC on May 9, 2013). | |
10.17*# | Form of Stock Option Agreement with Time-Based Vesting entered into between Solera Holdings, Inc. and certain of its named executive officers in March 2013 (filed as Exhibit 10.2 to Solera Holdings, Inc.'s Form 10-Q filed with the SEC on May 9, 2013). | |
10.18*# | Form of Stock Option Agreement with Performance-Based Vesting entered into between Solera Holdings, Inc. and certain of its named executive officers in March 2013 (filed as Exhibit 10.3 to Solera Holdings, Inc.'s Form 10-Q filed with the SEC on May 9, 2013). | |
10.19*# | Executive Employment Agreement between Solera Holdings, Inc. and Renato Giger effective September 2012 (filed as Exhibit 10.1 to Solera Holdings, Inc.'s Form 10-Q filed with the SEC on November 6, 2012). | |
10.20*# | Executive Employment Agreement between Solera Holdings, Inc. and Abilio Gonzalez effective September 2012 (filed as Exhibit 10.2 to Solera Holdings, Inc.'s Form 10-Q filed with the SEC on November 6, 2012). | |
10.21*# | Executive Employment Agreement between Solera Holdings, Inc. and Jason Brady effective September 2012 (filed as Exhibit 10.3 to Solera Holdings, Inc.'s Form 10-Q filed with the SEC on November 6, 2012). | |
10.22*# | Solera Holdings, Inc. 2008 Omnibus Incentive Plan (filed as Appendix A to Solera Holdings, Inc.’s Definitive Proxy Statement filed with the SEC on October 4, 2013). | |
10.23* | Recapitalization Agreement, dated October 3, 2013, by and among Claims Services Group, Inc., WCAS SRS Co-Invesment, L.P, WCAS SRS Holdings, Inc., Service Repair Solutions, Inc., Welsh, Carson, Anderson & Stowe XI, L.P., and solely for the purposes of Section 7.14, Solera Holdings, Inc. (filed as Exhibit 10.1 to Solera Holdings, Inc.’s Form 10-Q filed with the SEC on February 10, 2014). | |
10.24* | Registration Rights Agreement, dated November 13, 2013, by and among SRS Investment Holdings, Inc., WCAS SRS Co-Investment, L.P., Claims Services Group, Inc., and other the parties set forth on the signature pages thereto from time to time (filed as Exhibit 10.2 to Solera Holdings, Inc.’s Form 10-Q filed with the SEC on February 10, 2014). | |
10.25* | Stockholders Agreement, dated November 13, 2013, by and among SRS Investment Holdings Inc., WCAS SRS Co-Investment, L.P., Claims Services Group, Inc., solely for the purposes set forth therein, Solera Holdings, Inc., solely for the purposes set forth therein, Audatex North America, Inc., and each other holder of Acquired Securities on or after the date of this Agreement (filed as Exhibit 10.3 to Solera Holdings, Inc.’s Form 10-Q filed with the SEC on February 10, 2014). | |
10.26* | Amendment to Facilities Use Agreement, dated December 26, 2013, by and between Aquila Family Ventures LLC, Chaparral Lane Investment, LLC and Solera Holdings, Inc. (filed as Exhibit 10.4 to Solera Holdings, Inc.’s Form 10-Q filed with the SEC on February 10, 2014). | |
10.27*# | Form of Indemnity Agreement (filed as Exhibit 10.1 to Solera Holding, Inc.’s Form 10-Q filed with the SEC on May 8, 2014). | |
10.28 | Purchase and Sale Agreement, dated May 10, 2014, by and among LYNX Services, L.L.C., GTS Services, LLC, Pittsburgh Glass Works, LLC, Claims Services Group, Inc., and solely for purposes set forth therein, Solera Holdings, Inc. | |
10.29 | Amendment No. 1 to Purchase and Sale Agreement, dated May 10, 2014, by and among LYNX Services, L.L.C., GTS Services, LLC, Pittsburgh Glass Works, LLC, Claims Services Group, Inc., and solely for purposes set forth therein, Solera Holdings, Inc. | |
21.1 | List of subsidiaries of the Registrant. | |
23.1 | Consent of Deloitte & Touche LLP, independent registered public accounting firm. | |
31.1 | Certification of Chief Executive Officer pursuant to Rule 13a-14(a) and 15d-14(a) of the Exchange Act. | |
31.2 | Certification of Chief Financial Officer pursuant to Rule 13a-14(a) and 15d-14(a) of the Exchange Act. | |
32.1 | Certification of Chief Executive Officer pursuant to 18 U.S.C. Section 1350, as adopted pursuant to Section 906 of the Sarbanes-Oxley Act of 2002. | |
32.2 | Certification of Chief Financial Officer pursuant to 18 U.S.C. Section 1350, as adopted pursuant to Section 906 of the Sarbanes-Oxley Act of 2002. | |
101.INS+ | XBRL Instance Document. | |
101.SCH+ | XBRL Taxonomy Extension Schema Document. | |
101.CAL+ | XBRL Taxonomy Extension Calculation Linkbase Document. | |
101.DEF+ | XBRL Taxonomy Extension Definition Linkbase Document. | |
101.LAB+ | XBRL Taxonomy Extension Label Linkbase Document. | |
101.PRE+ | XBRL Taxonomy Extension Presentation Linkbase Document. | |
* | Incorporated by reference. |
# | Management contract or compensatory plan or arrangement. |
+ | These exhibits are not deemed “filed” for purposes of Section 18 of the Securities Exchange Act of 1934, or otherwise subject to the liability of that section. Such exhibits will not be deemed to be incorporated by reference into any filing under the Securities Act of 1933 or the Securities Exchange Act of 1934, except to the extent that we incorporate them by reference. |