Attached files
| file | filename |
|---|---|
| 8-K - 8-K - MANITOWOC CO INC | mtw-20140828x8k.htm |

Focused On Value Creation for Our Shareholders A U G U S T 2 0 1 4

1 Safe Harbor Statement Any statements contained in this presentation that are not historical facts are “forward- looking statements”. These statements are based on the current expectations of the management of the company, only speak as of the date on which they are made, and are subject to uncertainty and changes in circumstances. We undertake no obligation to update or revise forward-looking statements, whether as a result of new information, future events, or otherwise. Forward-looking statements include, without limitation, statements typically containing words such as “intends,” “expects,” “anticipates,” “targets,” “estimates,” and words of similar import. By their nature, forward-looking statements are not guarantees of future performance or results and involve risks and uncertainties because they relate to events and depend on circumstances that will occur in the future. There are a number of factors that could cause actual results and developments to differ materially from those expressed or implied by such forward-looking statements. These factors include (but are not limited to) those relating to revenue growth of the company, future market strength of the company’s business segments and products, market acceptance of existing products and new product introductions and technology, economic conditions, successful acquisitions, manufacturing and facility utilization efficiencies, risks relating to actions of activist shareholders, and other factors listed in the company’s annual report on Form 10-K for the year ended December 31, 2013. Any “forward-looking statements” in this presentation are intended to qualify for the safe harbor from liability under the Private Securities Litigation Reform Act of 1995.

2 Agenda Manitowoc Today Track Record of Execution Complementary Business Portfolio Significant Shareholder Value Through Operational Improvements and Driving Growth Approach to Capital Allocation
T O D A Y
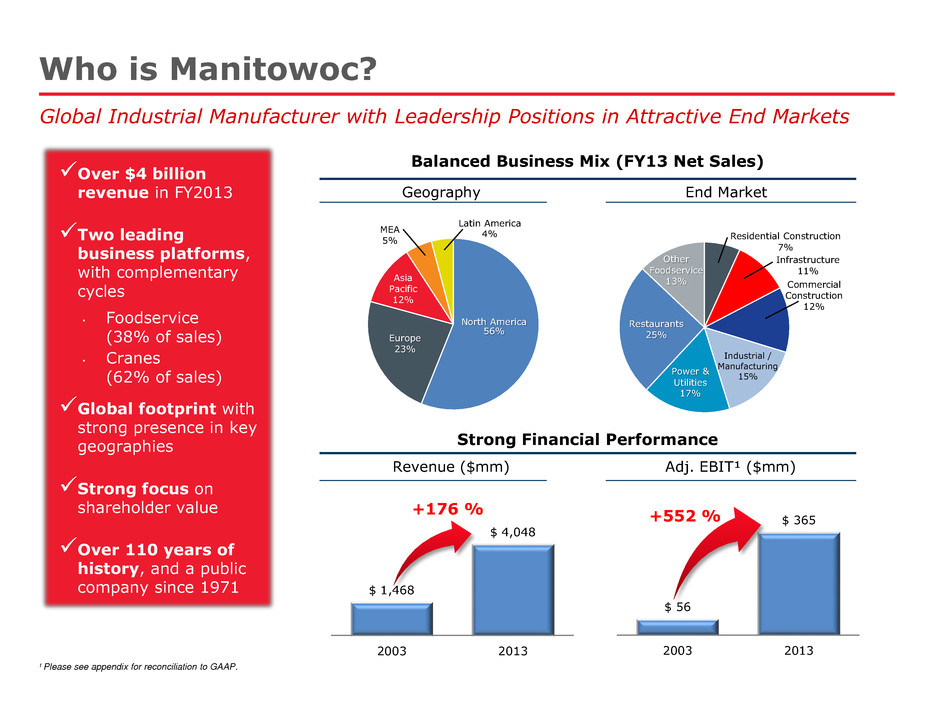
Who is Manitowoc? Global Industrial Manufacturer with Leadership Positions in Attractive End Markets Over $4 billion revenue in FY2013 Two leading business platforms, with complementary cycles • Foodservice (38% of sales) • Cranes (62% of sales) Global footprint with strong presence in key geographies Strong focus on shareholder value Over 110 years of history, and a public company since 1971 Balanced Business Mix (FY13 Net Sales) Strong Financial Performance ¹ Please see appendix for reconciliation to GAAP. Geography End Market Revenue ($mm) Adj. EBIT¹ ($mm) North America 56% Europe 23% Asia Pacific 12% MEA 5% Latin America 4% Residential Construction 7% Infrastructure 11% Commercial Construction 12% Industrial / Manufacturing 15% Power & Utilities 17% Restaurants 25% Other Foodservice 13% $ 1,468 $ 4,048 2003 2013 +176 % $ 56 $ 365 2003 2013 +552 %

5 A Compelling Value Proposition Industry Leader with Global Scale, Growth, and Discipline ¹ Please see appendix for reconciliation to GAAP. • Over 100 manufacturing, sales, and customer service facilities worldwide • Strong presence in high-growth emerging markets • Foodservice: 24 industry-leading brands • Cranes: Leading products across multiple platforms Global Market Leadership • Exposure to diverse, attractive end markets with complementary cycles • Recovery in key end markets drives demand • Secular demand from developing economies and growing middle class • New product initiatives Strong Growth Drivers Significant Operational Leverage • Benefit from restructuring efforts and investments made over the cycle • Gain from implementation of Lean, Six Sigma, and procurement initiatives • Strong free cash flow generation and capital structure back to normalized level • Significant deleveraging allows for financial flexibility going forward

6 Industry-Leading Brands and Products Leading Positions Across Major Foodservice and Crane Categories High-capacity Lattice-Boom Crawler Cranes Boom Trucks Ice-cube Machines Rapid Cook and Combination Ovens Commercial Fryers Ranges, Grills & Induction Rough-terrain Cranes VPC Crawler Crane Top-slewing & Self- Erecting Tower Cranes Refrigeration and Fabrication All-terrain Cranes Beverage Dispensing

7 Global Footprint with Presence in Key Geographies Geographic Footprint Provides Opportunity to Leverage International Growth Foodservice Operations Crane Operations Common Infrastructure and Regional Expertise Across Enterprise

8 Global Operations Building products as close as possible to intended end markets Targeting emerging markets by leveraging developed market strengths Foodservice Over 55% of revenue from replacement of existing equipment Unique value proposition with new technology and menu roll-out support Cranes Over 65% of revenue generated from energy and infrastructure Improving residential and non-residential construction markets Attractive Global Trends

9 Continue to Build Upon Our Longstanding and Diverse Customer Base Focus on the Customer Edge Extensive manufacturing, sales, and customer service networks worldwide to serve a global customer base Highly innovative, high-quality products meeting customers’ changing needs Strategic and flexible business partner to customers Work closely with customers to develop products they need most KitchenCare and Crane Care support offerings speed response times, especially benefiting customers in emerging markets Improved customer service and satisfaction

10 Long Track Record of Product Innovation Drives Our Demand Touch screen and customization options Automated cleaning system Ethernet / LAN interface Uniquely mounted luffing mechanism and hoist ensures space for operation, even in tight jobsites Variable Position Counterweight (VPC) VPC-MAX attachments increase the capacity and optimal boom and jib lengths Auto- calibration of platen for gapping precision, consistent quality, and self-diagnostics Internal history data log Software driven, variable blend/mix profiles Enhanced speed of service with simultaneous dispense and blending Industry’s most powerful six-axle crane Self-rigging MegaWingLift™ attachment 54% of Manitowoc’s Total Sales Come from Products Launched in Past 5 Years 52 New Products Premiered in 2013 Drive Our Culture of Innovation

T R A C K R E C O R D O F E X E C U T I O N
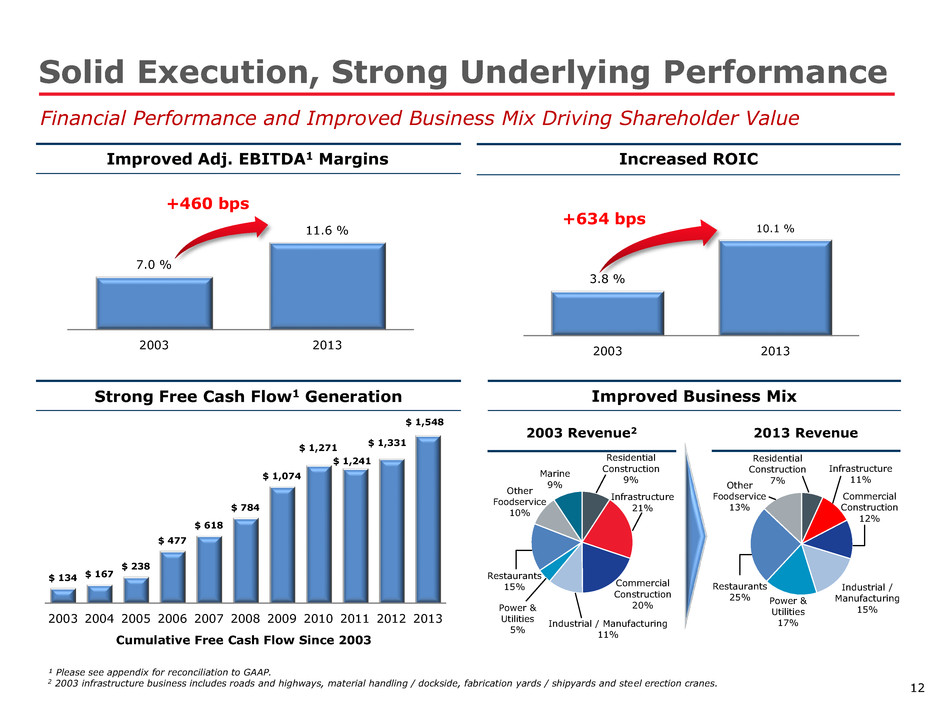
12 Solid Execution, Strong Underlying Performance Financial Performance and Improved Business Mix Driving Shareholder Value Improved Adj. EBITDA1 Margins Increased ROIC Strong Free Cash Flow1 Generation Improved Business Mix 2003 Revenue2 2013 Revenue Cumulative Free Cash Flow Since 2003 ¹ Please see appendix for reconciliation to GAAP. 2 2003 infrastructure business includes roads and highways, material handling / dockside, fabrication yards / shipyards and steel erection cranes. Residential Construction 9% Infrastructure 21% Commercial Construction 20% Industrial / Manufacturing 11% Power & Utilities 5% Restaurants 15% Other Foodservice 10% Marine 9% Residential Construction 7% Infrastructure 11% Commercial Construction 12% Industrial / Manufacturing 15% Power & Utilities 17% Restaurants 25% Other Foodservice 13% 3.8 % 10.1 % 2003 2013 +634 bps 7.0 % 11.6 % 2003 2013 +460 bps $ 134 $ 167 $ 238 $ 477 $ 618 $ 784 $ 1,074 $ 1,271 $ 1,241 $ 1,331 $ 1,548 2003 2004 2005 2006 2007 2008 2009 2010 2011 2012 2013

13 Significantly Improved Credit Profile Financial Performance Improvements Delivered While Strengthening Balance Sheet Total Debt / Adjusted EBITDA1 Interest Coverage1 ¹ Please see appendix for reconciliation to GAAP. Note: 2009 represents first full year following Enodis acquisition. Interest coverage defined as Adj. EBITDA/gross interest expense. 5.7 x 5.8 x 5.4 x 4.4 x 3.3 x 4.0 x 2009 2010 2011 2012 2013 LTM 2Q 2014 2.2 x 2.0 x 2.4 x 3.0 x 3.7 x 4.2 x 2009 2010 2011 2012 2013 LTM 2Q 2014
C O M P L E M E N T A R Y B U S I N E S S P O R T F O L I O

15 Significant Momentum From Operational Improvements • Operational efficiencies, further cost initiatives and operating leverage are expected to drive margins • Recovery in key end markets should drive further growth • Successful deleveraging is expected to allow for more capital allocation flexibility, including increased return of capital to shareholders and M&A • Continued focus on innovation and new products • Focus on aftermarket services to build customer loyalty • Further international growth • Continued strong focus on shareholder value in everything we do Increased the size of Foodservice business by 5x with the acquisition of Enodis in 2008 − Transaction balanced our portfolio and further reduced enterprise volatility Strengthened Crane business by making investments over the cycle Divested legacy Marine segment Increased international footprint From 2009 to June 2014, generated cumulative free cash flow of $532 million and reduced leverage from 5.7x to 4.0x1 Introduced 52 innovative new products in 2013, with 27 new products expected in 2014 (16 in Foodservice and 11 in Cranes) Strengthened integration and efficiency by implementing Lean and Six Sigma processes Business is Gaining Momentum While Regaining Balance Sheet Strength What We Expect Going Forward Accomplishments 1 Please see appendix for reconciliation to GAAP.

16 Two Core Businesses Create A Stronger Enterprise Significant reduction in earnings volatility Ability to invest over the cycle is key competitive advantage Benefits of global scale across portfolio Operating synergies Common processes Growth model focused on innovation and operational excellence HR, talent and benefits synergies Scale, Core Competencies, and Complementary Cycles Make Manitowoc Stronger • Global Presence: Serves top 100 restaurant chains • Broadest Product Portfolio: Added international manufacturing and distribution • Innovation: Award-winning products • Operational Excellence: Cultural adoption of Lean & Six Sigma principles • Aftermarket Support: KitchenCare services and solutions • Global Presence: 31 facilities in 16 countries • Diverse Product Portfolio: Adding scale and scope • Innovation: Leading positions driven by new product initiatives • Operational Excellence: Infusing Lean manufacturing & Six Sigma • Aftermarket Support: Crane Care allows 24/7/365 access to crane support Foodservice Cranes
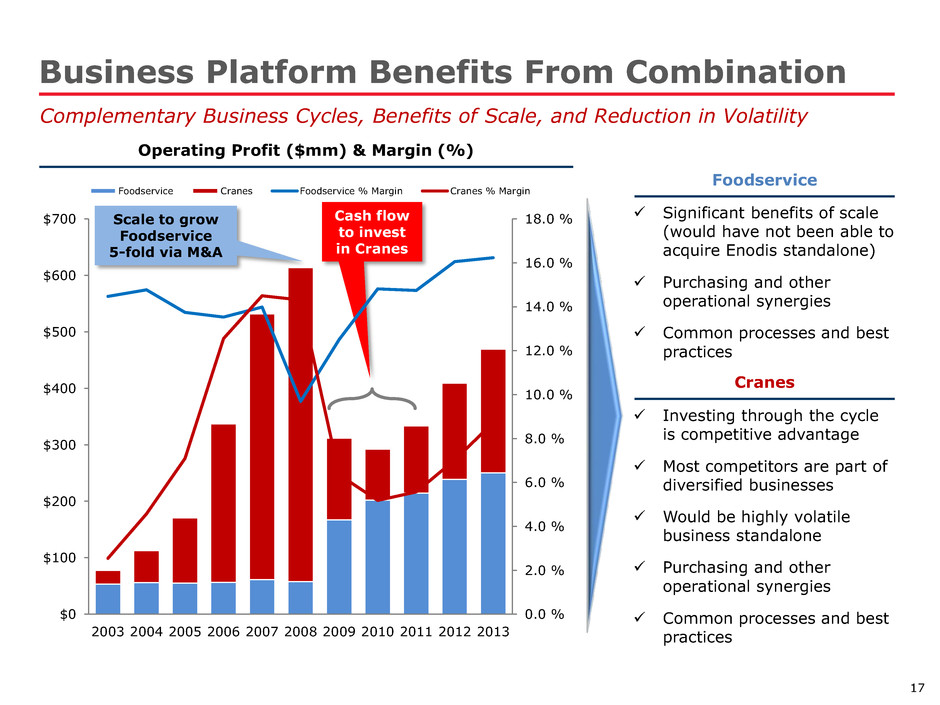
17 Foodservice Significant benefits of scale (would have not been able to acquire Enodis standalone) Purchasing and other operational synergies Common processes and best practices Business Platform Benefits From Combination Complementary Business Cycles, Benefits of Scale, and Reduction in Volatility Operating Profit ($mm) & Margin (%) Cranes Investing through the cycle is competitive advantage Most competitors are part of diversified businesses Would be highly volatile business standalone Purchasing and other operational synergies Common processes and best practices Scale to grow Foodservice 5-fold via M&A Cash flow to invest in Cranes 0.0 % 2.0 % 4.0 % 6.0 % 8.0 % 10.0 % 12.0 % 14.0 % 16.0 % 18.0 % $0 $100 $200 $300 $400 $500 $600 $700 2003 2004 2005 2006 2007 2008 2009 2010 2011 2012 2013 Foodservice Cranes Foodservice % Margin Cranes % Margin
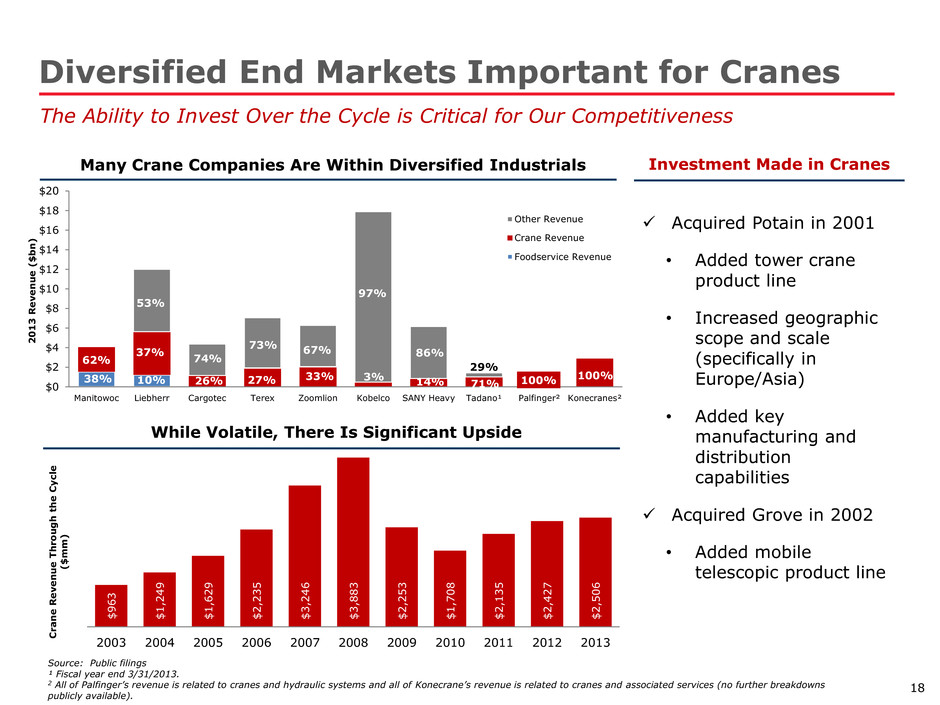
18 Diversified End Markets Important for Cranes The Ability to Invest Over the Cycle is Critical for Our Competitiveness Many Crane Companies Are Within Diversified Industrials Investment Made in Cranes While Volatile, There Is Significant Upside Acquired Potain in 2001 • Added tower crane product line • Increased geographic scope and scale (specifically in Europe/Asia) • Added key manufacturing and distribution capabilities Acquired Grove in 2002 • Added mobile telescopic product line Source: Public filings ¹ Fiscal year end 3/31/2013. 2 All of Palfinger’s revenue is related to cranes and hydraulic systems and all of Konecrane’s revenue is related to cranes and associated services (no further breakdowns publicly available). 62% 26% 27% 33% 3% 74% 73% 67% 97% 100% 100% $0 $2 $4 $6 $8 $10 $12 $14 $16 $18 $20 Manitowoc Liebherr Cargotec Terex Zoomlion Kobelco SANY Heavy Tadano¹ Palfinger² Konecranes² 2 0 1 3 R e v e n u e ( $ b n ) Other Revenue Crane Revenue Foodservice Revenue 14% 86% 71% 29% 38% 53% 37% 10% $ 9 6 3 $ 1 ,2 4 9 $ 1 ,6 2 9 $ 2 ,2 3 5 $ 3 ,2 4 6 $ 3 ,8 8 3 $ 2 ,2 5 3 $ 1 ,7 0 8 $ 2 ,1 3 5 $ 2 ,4 2 7 $ 2 ,5 0 6 2003 2004 2005 2006 2007 2008 2009 2010 2011 2012 2013 C ra n e R e v e n u e T h ro u g h t h e C y cl e ( $ m m )

S I G N I F I C A N T S H A R E H O L D E R V A L U E T H R O U G H O P E R A T I O N A L I M P R O V E M E N T S A N D D R I V I N G G R O W T H
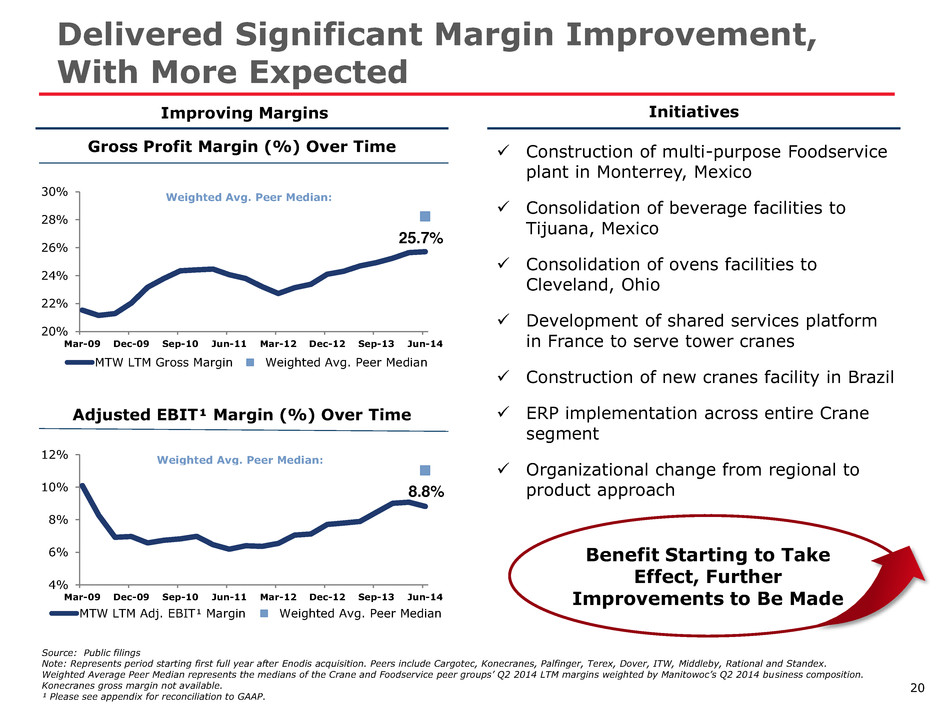
20 Delivered Significant Margin Improvement, With More Expected Improving Margins Initiatives Construction of multi-purpose Foodservice plant in Monterrey, Mexico Consolidation of beverage facilities to Tijuana, Mexico Consolidation of ovens facilities to Cleveland, Ohio Development of shared services platform in France to serve tower cranes Construction of new cranes facility in Brazil ERP implementation across entire Crane segment Organizational change from regional to product approach Gross Profit Margin (%) Over Time Adjusted EBIT¹ Margin (%) Over Time Source: Public filings Note: Represents period starting first full year after Enodis acquisition. Peers include Cargotec, Konecranes, Palfinger, Terex, Dover, ITW, Middleby, Rational and Standex. Weighted Average Peer Median represents the medians of the Crane and Foodservice peer groups’ Q2 2014 LTM margins weighted by Manitowoc’s Q2 2014 business composition. Konecranes gross margin not available. ¹ Please see appendix for reconciliation to GAAP. 20% 22% 24% 26% 28% 30% Mar-09 Dec-09 Sep-10 Jun-11 Mar-12 Dec-12 Sep-13 Jun-14 MTW LTM Gross Margin Weighted Avg. Peer Median Weighted Avg. Peer Median: 25.7% 4% 6% 8% 10% 12% Mar-09 Dec-09 Sep-10 Jun-11 Mar-12 Dec-12 Sep-13 Jun-14 MTW LTM Adj. EBIT¹ Margin Weighted Avg. Peer Median Weighted Avg. Peer Median: 8.8% Benefit Starting to Take Effect, Further Improvements to Be Made
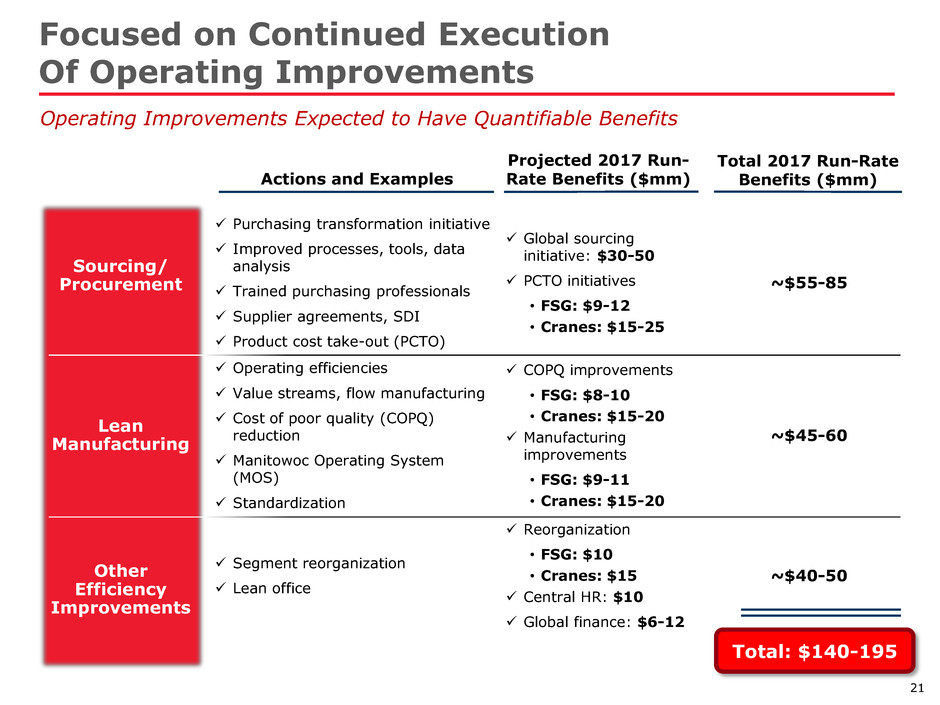
21 Sourcing/ Procurement Focused on Continued Execution Of Operating Improvements Operating Improvements Expected to Have Quantifiable Benefits Lean Manufacturing Other Efficiency Improvements Actions and Examples Total 2017 Run-Rate Benefits ($mm) Purchasing transformation initiative Improved processes, tools, data analysis Trained purchasing professionals Supplier agreements, SDI Product cost take-out (PCTO) Global sourcing initiative: $30-50 PCTO initiatives • FSG: $9-12 • Cranes: $15-25 ~$55-85 Operating efficiencies Value streams, flow manufacturing Cost of poor quality (COPQ) reduction Manitowoc Operating System (MOS) Standardization COPQ improvements • FSG: $8-10 • Cranes: $15-20 Manufacturing improvements • FSG: $9-11 • Cranes: $15-20 ~$45-60 Segment reorganization Lean office Reorganization • FSG: $10 • Cranes: $15 Central HR: $10 Global finance: $6-12 ~$40-50 Projected 2017 Run- Rate Benefits ($mm) Total: $140-195

22 Synergies Across the Business Purchasing Common Resources and Best Practices Support Services (e.g. Treasury, Tax, HR, IT) Corporate and Governance Functions Balance Sheet Capacity Regional Infrastructure Optimizing Long-term shareholder value Multiple Operational Synergies Across Both Platforms
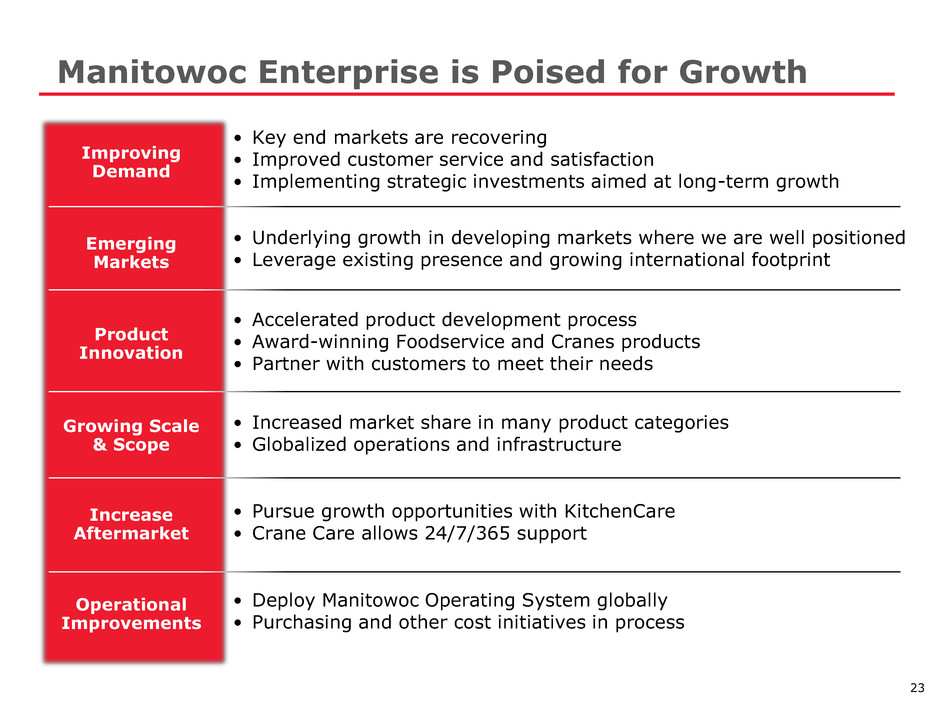
23 Manitowoc Enterprise is Poised for Growth • Key end markets are recovering • Improved customer service and satisfaction • Implementing strategic investments aimed at long-term growth Improving Demand • Underlying growth in developing markets where we are well positioned • Leverage existing presence and growing international footprint Emerging Markets • Accelerated product development process • Award-winning Foodservice and Cranes products • Partner with customers to meet their needs Product Innovation • Increased market share in many product categories • Globalized operations and infrastructure Growing Scale & Scope • Pursue growth opportunities with KitchenCare • Crane Care allows 24/7/365 support Increase Aftermarket • Deploy Manitowoc Operating System globally • Purchasing and other cost initiatives in process Operational Improvements

24 Driving Growth Through Geographic Expansion Continue to Leverage Strong Position in Developing Markets to Drive Growth Significant Growth Already Achieved (% of Total Revenue) Actions Taken Globalized operations with more than 100 facilities in 24 countries Targeted products toward specific needs of local markets Built Foodservice facility in Monterrey in 2014 Constructed Cranes facility in Brazil in 2013 to leverage energy and infrastructure opportunities as well as natural resource development Implemented successful model of innovation and operational effectiveness in developing markets, including in Chinese and Indian factories 2003 2013 Example Manufacturing Facilities Hangzhou, China (Foodservice) 260,000 sq. ft. Foshan, China (Foodservice) 40,000 sq. ft. Pune, India (Cranes) 190,000 sq. ft. Zhangjiagang, China (Cranes) 800,000 sq. ft. US 54% RoW 46% US 49% RoW 51% $ 668 $ 2,070 2003 2013 International Revenue +210 % Strong Presence in High Growth Geographies

25 Further Building Aftermarket Business Increase Revenue and Customer Loyalty through Aftermarket Support Delivering a Superior Aftermarket Service Provides a key competitive advantage Reduces volatility across the enterprise via recurring revenue stream Successfully established KitchenCare based on successful Crane Care precedent Investments made to accelerate response times, broaden global capabilities, and strengthen technical support, including KitchenCare parts warehouse Supports growing chain customers, with programs touching nearly 15,000 chain locations in the U.S. to date Identified service programs such as installation and planned maintenance as major elements of aftermarket growth strategy Foodservice and Crane Support Programs Provide Customers with Total Lifecycle Support for Every Manitowoc Product They Operate

A P P R O A C H T O C A P I T A L A L L O C A T I O N
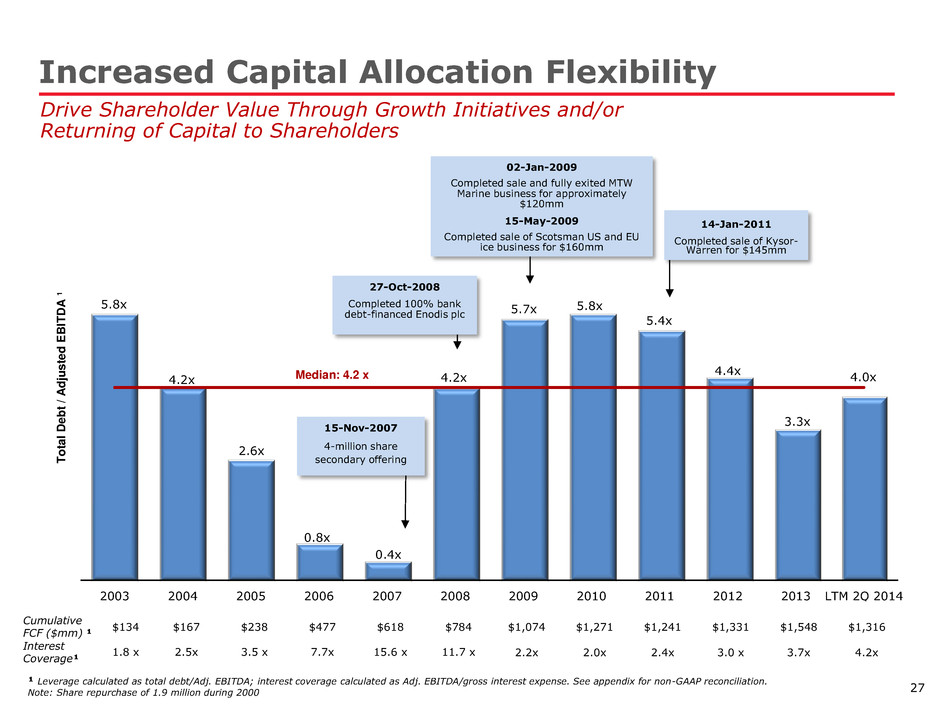
27 Cumulative FCF ($mm) ¹ $134 $167 $238 $477 $618 $784 $1,074 $1,271 $1,241 $1,331 $1,548 $1,316 Interest Coverage¹ 1.8 x 2.5x 3.5 x 7.7x 15.6 x 11.7 x 2.2x 2.0x 2.4x 3.0 x 3.7x 4.2x Increased Capital Allocation Flexibility Drive Shareholder Value Through Growth Initiatives and/or Returning of Capital to Shareholders ¹ Leverage calculated as total debt/Adj. EBITDA; interest coverage calculated as Adj. EBITDA/gross interest expense. See appendix for non-GAAP reconciliation. Note: Share repurchase of 1.9 million during 2000 5.8x 4.2x 2.6x 0.8x 0.4x 4.2x 5.7x 5.8x 5.4x 4.4x 3.3x 4.0x 2003 2004 2005 2006 2007 2008 2009 2010 2011 2012 2013 LTM 2Q 2014 T o ta l De b t / A d ju s te d EBITD A ¹ 27-Oct-2008 Completed 100% bank debt-financed Enodis plc 02-Jan-2009 Completed sale and fully exited MTW Marine business for approximately $120mm 15-May-2009 Completed sale of Scotsman US and EU ice business for $160mm 14-Jan-2011 Completed sale of Kysor- Warren for $145mm Median: 4.2 x 15-Nov-2007 4-million share secondary offering
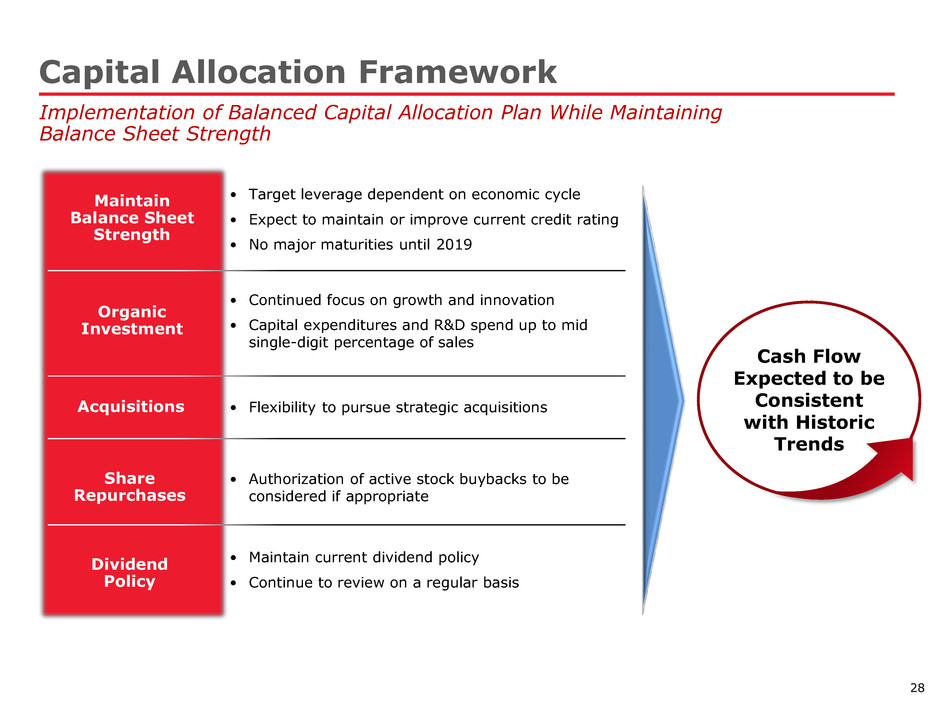
28 Capital Allocation Framework Implementation of Balanced Capital Allocation Plan While Maintaining Balance Sheet Strength Maintain Balance Sheet Strength Organic Investment Acquisitions Share Repurchases Dividend Policy • Target leverage dependent on economic cycle • Expect to maintain or improve current credit rating • No major maturities until 2019 • Continued focus on growth and innovation • Capital expenditures and R&D spend up to mid single-digit percentage of sales • Authorization of active stock buybacks to be considered if appropriate • Maintain current dividend policy • Continue to review on a regular basis • Flexibility to pursue strategic acquisitions Cash Flow Expected to be Consistent with Historic Trends

29 A Compelling Value Proposition Industry Leader with Global Scale, Growth, and Discipline ¹ Please see appendix for reconciliation to GAAP. • Over 100 manufacturing, sales, and customer service facilities worldwide • Strong presence in high-growth emerging markets • Foodservice: 24 industry-leading brands • Cranes: Leading products across multiple platforms Global Market Leadership • Exposure to diverse, attractive end markets with complementary cycles • Recovery in key end markets drives demand • Secular demand from developing economies and growing middle class • New product initiatives Strong Growth Drivers Significant Operational Leverage • Benefit from restructuring efforts and investments made over the cycle • Gain from implementation of Lean, Six Sigma, and procurement initiatives • Strong free cash flow generation and capital structure back to normalized level • Significant deleveraging allows for financial flexibility going forward
Focused On Value Creation for Our Shareholders A U G U S T 2 0 1 4
A P P E N D I X
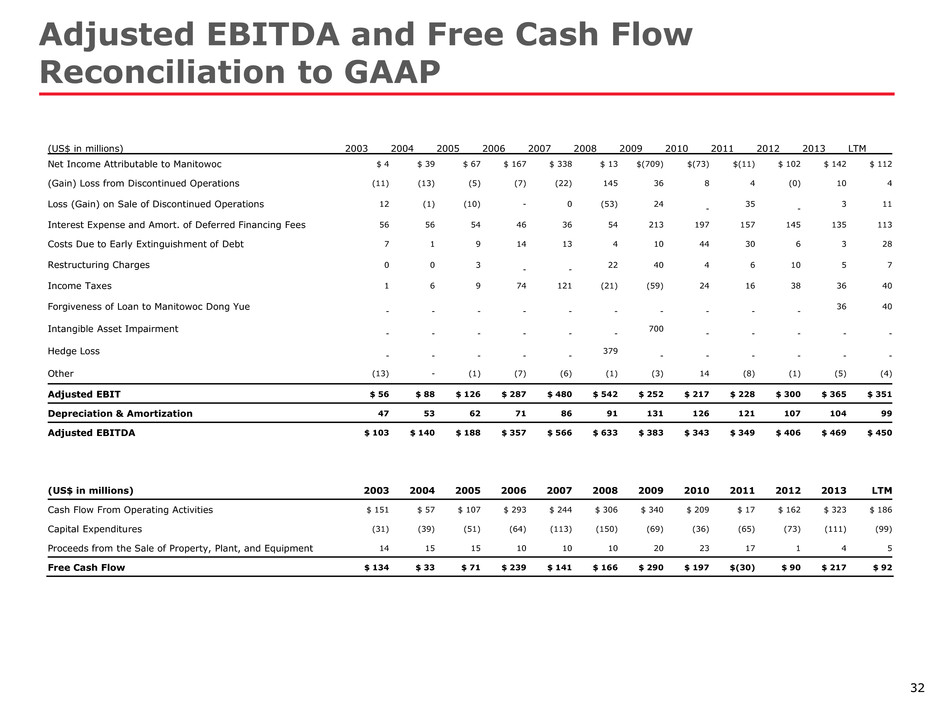
32 Adjusted EBITDA and Free Cash Flow Reconciliation to GAAP (US$ in millions) 2003 2004 2005 2006 2007 2008 2009 2010 2011 2012 2013 LTM Net Income Attributable to Manitowoc $ 4 $ 39 $ 67 $ 167 $ 338 $ 13 $(709) $(73) $(11) $ 102 $ 142 $ 112 (Gain) Loss from Discontinued Operations (11) (13) (5) (7) (22) 145 36 8 4 (0) 10 4 Loss (Gain) on Sale of Discontinued Operations 12 (1) (10) - 0 (53) 24 - 35 - 3 11 Interest Expense and Amort. of Deferred Financing Fees 56 56 54 46 36 54 213 197 157 145 135 113 Costs Due to Early Extinguishment of Debt 7 1 9 14 13 4 10 44 30 6 3 28 Restructuring Charges 0 0 3 - - 22 40 4 6 10 5 7 Income Taxes 1 6 9 74 121 (21) (59) 24 16 38 36 40 Forgiveness of Loan to Manitowoc Dong Yue - - - - - - - - - - 36 40 Intangible Asset Impairment - - - - - - 700 - - - - - Hedge Loss - - - - - 379 - - - - - - Other (13) - (1) (7) (6) (1) (3) 14 (8) (1) (5) (4) Adjusted EBIT $ 56 $ 88 $ 126 $ 287 $ 480 $ 542 $ 252 $ 217 $ 228 $ 300 $ 365 $ 351 Depreciation & Amortization 47 53 62 71 86 91 131 126 121 107 104 99 Adjusted EBITDA $ 103 $ 140 $ 188 $ 357 $ 566 $ 633 $ 383 $ 343 $ 349 $ 406 $ 469 $ 450 (US$ in millions) 2003 2004 2005 2006 2007 2008 2009 2010 2011 2012 2013 LTM Cash Flow From Operating Activities $ 151 $ 57 $ 107 $ 293 $ 244 $ 306 $ 340 $ 209 $ 17 $ 162 $ 323 $ 186 Capital Expenditures (31) (39) (51) (64) (113) (150) (69) (36) (65) (73) (111) (99) Proceeds from the Sale of Property, Plant, and Equipment 14 15 15 10 10 10 20 23 17 1 4 5 Free Cash Flow $ 134 $ 33 $ 71 $ 239 $ 141 $ 166 $ 290 $ 197 $(30) $ 90 $ 217 $ 92
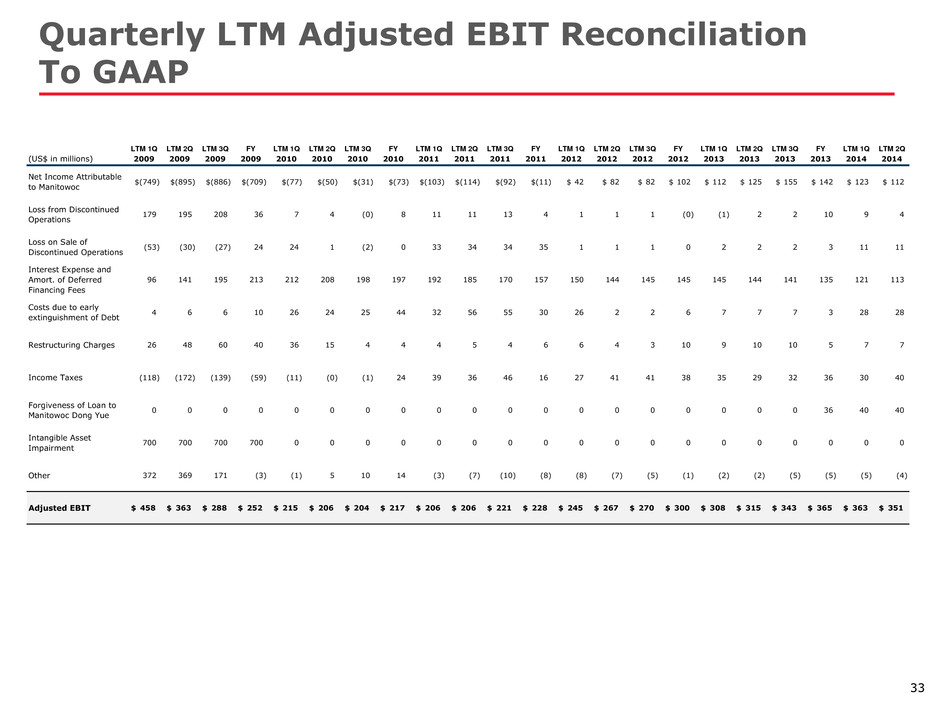
33 Quarterly LTM Adjusted EBIT Reconciliation To GAAP LTM 1Q LTM 2Q LTM 3Q FY LTM 1Q LTM 2Q LTM 3Q FY LTM 1Q LTM 2Q LTM 3Q FY LTM 1Q LTM 2Q LTM 3Q FY LTM 1Q LTM 2Q LTM 3Q FY LTM 1Q LTM 2Q (US$ in millions) 2009 2009 2009 2009 2010 2010 2010 2010 2011 2011 2011 2011 2012 2012 2012 2012 2013 2013 2013 2013 2014 2014 Net Income Attributable to Manitowoc $(749) $(895) $(886) $(709) $(77) $(50) $(31) $(73) $(103) $(114) $(92) $(11) $ 42 $ 82 $ 82 $ 102 $ 112 $ 125 $ 155 $ 142 $ 123 $ 112 Loss from Discontinued Operations 179 195 208 36 7 4 (0) 8 11 11 13 4 1 1 1 (0) (1) 2 2 10 9 4 Loss on Sale of Discontinued Operations (53) (30) (27) 24 24 1 (2) 0 33 34 34 35 1 1 1 0 2 2 2 3 11 11 Interest Expense and Amort. of Deferred Financing Fees 96 141 195 213 212 208 198 197 192 185 170 157 150 144 145 145 145 144 141 135 121 113 Costs due to early extinguishment of Debt 4 6 6 10 26 24 25 44 32 56 55 30 26 2 2 6 7 7 7 3 28 28 Restructuring Charges 26 48 60 40 36 15 4 4 4 5 4 6 6 4 3 10 9 10 10 5 7 7 Income Taxes (118) (172) (139) (59) (11) (0) (1) 24 39 36 46 16 27 41 41 38 35 29 32 36 30 40 Forgiveness of Loan to Manitowoc Dong Yue 0 0 0 0 0 0 0 0 0 0 0 0 0 0 0 0 0 0 0 36 40 40 Intangible Asset Impairment 700 700 700 700 0 0 0 0 0 0 0 0 0 0 0 0 0 0 0 0 0 0 Other 372 369 171 (3) (1) 5 10 14 (3) (7) (10) (8) (8) (7) (5) (1) (2) (2) (5) (5) (5) (4) Adjusted EBIT $ 458 $ 363 $ 288 $ 252 $ 215 $ 206 $ 204 $ 217 $ 206 $ 206 $ 221 $ 228 $ 245 $ 267 $ 270 $ 300 $ 308 $ 315 $ 343 $ 365 $ 363 $ 351
