Attached files
| file | filename |
|---|---|
| EX-31.2 - EX-31.2 - Paylocity Holding Corp | a14-14198_1ex31d2.htm |
| EX-14.1 - EX-14.1 - Paylocity Holding Corp | a14-14198_1ex14d1.htm |
| EX-23.1 - EX-23.1 - Paylocity Holding Corp | a14-14198_1ex23d1.htm |
| EX-31.1 - EX-31.1 - Paylocity Holding Corp | a14-14198_1ex31d1.htm |
| EXCEL - IDEA: XBRL DOCUMENT - Paylocity Holding Corp | Financial_Report.xls |
| EX-32.2 - EX-32.2 - Paylocity Holding Corp | a14-14198_1ex32d2.htm |
| EX-32.1 - EX-32.1 - Paylocity Holding Corp | a14-14198_1ex32d1.htm |
|
|
UNITED STATES
SECURITIES AND EXCHANGE COMMISSION
Washington, D.C. 20549
FORM 10-K
x ANNUAL REPORT PURSUANT TO SECTION 13 OR 15(d) OF THE SECURITIES EXCHANGE ACT OF 1934
For the fiscal year ended June 30, 2014
OR
o TRANSITION REPORT PURSUANT TO SECTION 13 OR 15(d) OF THE SECURITIES EXCHANGE ACT OF 1934
For the Transition Period from to
Commission File Number 001- 36348
PAYLOCITY HOLDING CORPORATION
(Exact name of registrant as specified in its charter)
|
Delaware |
|
46-4066644 |
|
(State or other jurisdiction of incorporation or organization) |
|
(I.R.S. Employer Identification Number) |
3850 N. Wilke Road
Arlington Heights, Illinois 60004
(Address of principal executive offices and zip code)
(847) 463-3200
(Registrant’s telephone number, including area code)
Securities registered pursuant to Section 12(b) of the Act:
|
Title of each class |
|
Name of each exchange on which registered |
|
Common Stock, par value $0.001 per share |
|
The NASDAQ Global Select Market LLC |
Securities registered pursuant to Section 12(g) of the Act:
None
Indicate by check mark if the registrant is a well-known seasoned issuer, as defined in Rule 405 of the Securities Act. Yes o No x
Indicate by check mark if the registrant is not required to file reports pursuant to Section 13 or Section 15(d) of the Act. Yes o No x
Indicate by check mark whether the registrant (1) has filed all reports required to be filed by Section 13 or 15(d) of the Securities Exchange Act of 1934 during the preceding 12 months (or for such shorter period that the registrant was required to file such reports), and (2) has been subject to such filing requirements for the past 90 days. Yes x No o
Indicate by check mark whether the registrant has submitted electronically and posted on its corporate Web site, if any, every Interactive Data File required to be submitted and posted pursuant to Rule 405 of Regulation S-T (§ 232.405 of this chapter) during the preceding 12 months (or for such shorter period that the registrant was required to submit and post such files). Yes x No o
Indicate by check mark if disclosure of delinquent filers pursuant to Item 405 of Regulation S-K (§ 229.405 of this chapter) is not contained herein, and will not be contained, to the best of registrant’s knowledge, in definitive proxy or information statements incorporated by reference in Part III of this Form 10-K or any amendment to this Form 10-K. x
Indicate by check mark whether the registrant is a large accelerated filer, an accelerated filer, a non-accelerated filer, or a smaller reporting company. See the definitions of “large accelerated filer,” “accelerated filer” and “smaller reporting company” in Rule 12b-2 of the Exchange Act.
|
Large accelerated filer |
o |
Accelerated filer |
o |
|
|
|
|
|
|
Non-accelerated filer |
x (Do not check if a smaller reporting company) |
Smaller reporting company |
o |
Indicate by check mark whether the registrant is a shell company (as defined in Rule 12b-2 of the Act). Yes o No x
The registrant was not a public company as of December 31 2013, the last day of the registrant’s most recently completed second fiscal quarter, and therefore cannot calculate the aggregate market value of its common stock held by non-affiliates as of such date.
As of August 15, 2014, there were 49,563,736 shares of the registrant’s common stock issued and outstanding.
DOCUMENTS INCORPORATED BY REFERENCE:
The information required by Part III of this Report, to the extent not set forth herein, is incorporated herein by reference from the Proxy Statement relating to the registrant’s 2014 annual meeting of stockholders, which shall be filed with the Securities and Exchange Commission within 120 days after the end of the fiscal year to which this Report relates.
|
|
PAYLOCITY HOLDING CORPORATION
Form 10-K
For the Year Ended June 30, 2014
TABLE OF CONTENTS
Forward Looking Statements
Except for the historical financial information contained herein, the matters discussed in this report on Form 10-K (as well as documents incorporated herein by reference) may be considered “forward-looking” statements within the meaning of Section 27A of the Securities Act of 1933, as amended, and Section 21E of the Securities Exchange Act of 1934, as amended. All statements, other than statements of historical fact, are statements that could be deemed forward-looking statements, including, but not limited to, statements regarding our future financial position, business strategy and plans and objectives of management for future operations. When used in this Annual Report, the words “believe,” “may,” “could,” “will,” “estimate,” “continue,” “intend,” “expect,” “anticipate,” “plan,” “project” and similar expressions are intended to identify forward-looking statements.
We have based these forward-looking statements largely on our current expectations and projections about future events and financial trends that we believe may affect our financial condition, results of operations, business strategy, short-term and long-term business operations and objectives, and financial needs. These forward-looking statements are subject to certain risks and uncertainties that could cause our actual results to differ materially from those reflected in the forward-looking statements. Factors that could cause or contribute to such differences include, but are not limited to, those discussed in this report, and in particular, the risks discussed under Part 1, Item 1A:”Risk Factors” and those discussed in other documents we file with the Securities and Exchange Commission. Except as required by law, we do not intend to update these forward-looking statements publicly or to update the reasons actual results could differ materially from those anticipated in these forward-looking statements, even if new information becomes available in the future.
In light of these risks, uncertainties and assumptions, the forward-looking events and circumstances discussed in this report and in the documents incorporated in this report may not occur and actual results could differ materially and adversely from those anticipated or implied in the forward-looking statements. Accordingly, readers are cautioned not to place undue reliance on such forward-looking statements.
Overview
We are a cloud-based provider of payroll and human capital management, or HCM, software solutions for medium-sized organizations, which we define as those having between 20 and 1,000 employees. Our comprehensive and easy-to-use solutions enable our clients to manage their workforces more effectively. As of June 30, 2014, we served approximately 8,500 clients across the U.S., which on average had over 100 employees. Our solutions help drive strategic human capital decision-making and improve employee engagement by enhancing the human resource, payroll and finance capabilities of our clients.
Our multi-tenant software platform is highly configurable and includes a unified suite of payroll and HCM applications, such as time and labor tracking, benefits and talent management. Our solutions have been organically developed from our core payroll solution, which we believe is the most critical system of record for medium-sized organizations and an essential gateway to other HCM functionality. Our payroll and HCM applications use a unified database and provide robust on-demand reporting and analytics. Our platform provides intuitive self-service functionality for employees and managers combined with seamless integration across all our solutions. We supplement our comprehensive software platform with an integrated implementation and client service organization, all of which are designed to meet the needs of medium-sized organizations.
Effective management of human capital is a core function in all organizations and requires a significant commitment of resources. Organizations are faced with complex and ever-changing requirements, including diverse federal, state and local regulations across multiple jurisdictions. In addition, the workplace operating environment is rapidly changing as employees increasingly become mobile, work remotely and expect an end user experience similar to that of consumer-oriented Internet applications. Medium-sized organizations operating without the infrastructure, expertise or personnel of larger enterprises are uniquely pressured in this complex and dynamic environment. Existing solutions offered by third-party payroll service providers can have limited capabilities and configurability while enterprise-focused software vendors can be expensive and time-consuming to implement and manage. We believe that medium-sized organizations are better served by solutions designed to meet their unique needs.
Our solutions provide the following key benefits to our clients:
· Comprehensive cloud-based platform optimized to meet the payroll and HCM needs of medium-sized organizations;
· Modern, intuitive user experience and self-service capabilities that significantly increase employee engagement;
· Flexible and configurable platform that aligns with business processes and centralizes payroll and HCM data;
· Software as a service, or SaaS, delivery model that reduces total cost of ownership for our clients; and
· Seamless data integration with our extensive partner ecosystem that saves time and expense and reduces the risk of errors.
We market and sell our products primarily through our direct sales force. We generate sales leads through a variety of focused marketing initiatives and by referrals from our extensive referral network of 401(k) advisors, benefits administrators, insurance brokers, third-party administrators and HR consultants. We derive revenue from a client based on the solutions purchased by the client, the number of client employees and the amount, type and timing of services provided in respect of those client employees. Our annual revenue retention rate was greater than 92% in each of the fiscal years 2012, 2013 and 2014. Our total revenues increased from $55.1 million in fiscal 2012 to $77.3 million in fiscal 2013, representing a 40% year-over-year increase and to $108.7 million in fiscal 2014, representing a 41% year-over-year increase. Our recurring revenues increased from $52.5 million in fiscal 2012 to $72.8 million in fiscal 2013, representing a 39% year-over-year increase, and to $101.9 million in fiscal 2014, representing a 40% year-over-year increase. Although we do not have long-term contracts with our clients and our agreements with clients are generally terminable on 60 days’ or less notice, our recurring revenue model provides significant visibility into our future operating results.
Industry Background
Effective management of human capital is a core function for all organizations and requires a significant commitment of resources. Identifying, acquiring and retaining talent is a priority at all levels of an organization. In today’s increasingly complex business and regulatory environment, organizations are being pressured to manage critical payroll and HCM functions more effectively, automate manual processes and decrease their operating costs.
Complex and Dynamic Tax and Regulatory Environment
The tax and regulatory environment in the United States is complex and dynamic. Organizations are subject to a myriad of tax, benefit, workers compensation, healthcare and other rules, regulations and reporting obligations. In addition to U.S. federal taxing and regulatory authorities, there are more than 10,000 state and local tax codes in the United States. Further, federal, state and local government agencies continually enact and amend the rules, regulations and reporting requirements with which organizations must comply.
Growing Demand for Mobility and Enhanced User Experience
Connectivity and mobility are enabling employees to spend less time in traditional office environments and more time working remotely. This trend increases the demand for advanced and intuitive solutions that improve collaboration and foster employee engagement, such as remote self-service access to payroll and timesheet reporting, HR and benefits portals and other talent management applications. Given the prominence of consumer-oriented Internet applications, employees expect the user experience and accessibility of internal systems to be similar to those of the latest Internet applications, such as LinkedIn, Amazon and Facebook.
Medium-Sized Organizations Face Unique Challenges
Medium-sized organizations functioning without the infrastructure, expertise or personnel of larger enterprises are uniquely pressured in the current complex and dynamic environment. Employees in these medium-sized organizations often perform multiple job functions, and many medium-sized organizations have limited financial, technical and other resources needed to effectively manage their critical business requirements and to build and maintain the systems required to do so.
Large Market Opportunity for Payroll and HCM Solutions
According to market analyses published by International Data Corporation, or IDC, titled Worldwide and U.S. Human Capital Management Applications 2013-2017 Forecast: The Cloud Spurs Continued Growth (May 2013) and U.S. Payroll Outsourcing Services 2013-2017 Forecast and Analysis (October 2013), the U.S. market for HCM applications and payroll outsourcing services is estimated to be $22.5 billion in 2014. The market opportunity is driven by the importance of payroll and HCM solutions to the successful management of organizations.
To estimate our addressable market, we focus our analysis on the number of U.S. medium-sized organizations and the number of their employees. According to the U.S. Census Bureau, there were over 565,000 firms with 20 to 999 employees in the U.S. in 2010, employing over 40 million persons. We estimate that if clients were to buy our entire suite of existing solutions at list prices, they would spend approximately $220 per employee annually. Based on this analysis, we believe our current target addressable market is approximately $8.8 billion. Our existing clients do not typically buy our entire suite of solutions, and as we continue to expand our
product offerings, we believe that we have an opportunity to increase the amount clients spend on payroll and HCM solutions per employee and to expand our addressable market.
Organizations Are Increasingly Transitioning to SaaS Solutions
SaaS solutions are easier and more affordable to implement and operate than those offered by traditional software providers. SaaS solutions also enable software updates with greater frequency and without new hardware investments, enabling organizations to better react to changes in their environments. Many organizations are transitioning to SaaS solutions for front-office business applications such as salesforce management. Similarly, we believe organizations are adopting back-office SaaS applications, such as payroll and HCM, with increasing frequency. According to a market analysis published by IDC, titled Worldwide SaaS and Cloud Software 2013-2017 Forecast and 2012 Vendor Shares (December 2013), the U.S. SaaS market is estimated to be $20 billion in 2014 and is projected to grow at a 14% compound annual growth rate from 2012 to 2017.
Limitations of Existing Solutions
We believe that existing payroll and HCM solutions have limitations that cause them to underserve the unique needs of medium-sized organizations. Existing payroll and HCM solutions include:
· Traditional Payroll Service Providers. Traditional payroll service providers are primarily focused on delivery of a variety of payroll processing services, insurance products and HR business process outsourcing solutions. Many of these solutions offer limited capabilities and integration beyond traditional payroll processing. The lack of a unified and configurable payroll and HCM suite can diminish the effectiveness of a system, detract from user experience and limit integration with other solutions. In addition, we believe that certain traditional payroll service providers often do not provide a high-quality client service experience.
· Enterprise-Focused Payroll and HCM Software Vendors. Enterprise-focused software vendors offer solutions and services that are designed for the complex needs and structures of large enterprises. As a result, their solutions can be expensive, complex and time-consuming to implement, operate and maintain.
· HCM Point Solution Providers. Many HCM point solutions lack integrated payroll functionality. The implementation and management of multiple point solutions and the reliance on multiple service organizations can be challenging and expensive for medium-sized organizations.
· Manual Processes for Payroll and HCM Functions. Manual payroll and HCM processes require increased HR, payroll and finance personnel involvement, resulting in higher costs, slower processing and greater risks of data entry errors.
Given the challenges medium-sized organizations face operating in complex and dynamic environments and the limited ability of traditional offerings to address these challenges, we believe there is a significant market opportunity for a comprehensive, unified SaaS solution designed to serve the payroll and HCM needs of medium-sized organizations.
Segment Information
Our chief operating decision maker reviews our financial results in total when evaluating financial performance and for purposes of allocating resources. We have thus determined that we operate in a single cloud-based software solution reporting segment.
Our Solution
We are a cloud-based provider of payroll and HCM software solutions for medium-sized organizations. Our solutions enable medium-sized organizations to more efficiently manage payroll and human capital in their complex and dynamic operating environments. As of June 30, 2014, we served approximately 8,500 clients across the U.S., which on average had over 100 employees.
The key benefits of our solution include the following:
· Comprehensive Platform Optimized for Medium-Sized Organizations. Our solutions empower finance and HR professionals in medium-sized organizations to drive strategic human capital decisions by providing enterprise-grade payroll and HCM applications, including robust reporting and analytics. Our unified platform fully automates payroll and HCM processes, enabling our clients to focus on core business activities. Our solutions help our clients attract, retain and manage their employees within a single, comprehensive system.
· Modern, Intuitive User Experience. Our intuitive, easy-to-use interface is based on current technology and automatically adapts to users’ devices, including mobile platforms, thereby significantly increasing accessibility of our solutions and decreasing the need for training. Our platform’s self-service functionality and performance management applications provide employees with an engaging experience. Our performance management applications include peer-to-peer employee recognition and social employee profiles that create a reward and recognition environment resulting in greater employee engagement.
· Flexible and Configurable Platform. We design our solutions to be flexible and configurable, allowing our clients to match their use of our software with their specific business processes and workflows. Our platform has been organically developed from a common code base, data structure and user interface, providing a consistent user experience with powerful features that are easily adaptable to our clients’ needs. Our systems centralize payroll and HCM data, minimizing inconsistent and incomplete information that can be produced when using multiple databases.
· Highly-Attractive SaaS Solution for Medium-Sized Organizations. Our solutions are cloud-based and offered on a subscription basis, making them easier and more affordable to implement, operate and update and enabling our clients to focus less on their IT infrastructure and more on their core businesses. Our cloud-based software can be operated by a single administrator without the support of an in-house information technology department. Our multi-tenant and modern architecture allows for frequent software enhancements thereby enabling our clients to react to a rapidly changing and complex operating environment. Our cloud-based platform enables our clients to scale their businesses without having to acquire additional hardware or to resolve the integration challenges that often result from traditional outsourcing solutions.
· Seamless Integration with Extensive Ecosystem of Partners. Our platform offers our clients automated data integration with over 200 related third-party partner systems, such as 401(k), benefits and insurance provider systems. This integration reduces the complexity and risk of error of manual data transfers and saves time for our clients and their employees. We integrate data with these related systems through a secure connection, which significantly decreases the risk of unauthorized third-party access and other security breaches. Our direct and automated data transmission improves the accuracy of data and facilitates data collection in our partners’ systems. We believe having automated data integration with a payroll and HCM provider like us differentiates our partners’ product offerings, strengthening their competitive positioning in their own markets.
Our Strategy
We intend to strengthen and extend our position as a provider of cloud-based payroll and HCM software solutions to medium-sized organizations. Key elements of our strategy include:
· Grow Our Client Base. We believe that our current client base represents only a small portion of the medium-sized organizations that could benefit from our solutions. While we served approximately 8,500 clients across the U.S. as of June 30, 2014, there were over 565,000 firms with 20 to 999 employees in the United States, employing more than 40 million persons, according to the U.S. Census Bureau in 2010. In order to acquire new clients, we plan to continue to grow our sales organization aggressively across all U.S. geographies.
· Expand Our Product Offerings. We believe that our leadership position is in significant part the result of our investment and innovation in our product offerings designed for medium-sized organizations. Therefore, we plan to increase investment in software development to continue to advance our platform and expand our product offerings. For example, we recently introduced new onboarding functionality that enables payroll and HR departments to deliver a highly intuitive, mobile-responsive onboarding experience to new hires.
· Increase Average Revenue Per Client. Our average revenue per client has consistently increased in each of the last three years as we have broadened our product offerings. We plan to further grow average revenue per client by selling a broader selection of products to new and existing clients.
· Extend Technological Leadership. We believe that our organically developed cloud-based multi-tenant software platform, combined with our unified database architecture, enhances the experience and usability of our products, providing what we believe to be a competitive advantage over alternative solutions. Our modern, intuitive user interface utilizes features found on many popular consumer Internet sites, enabling users to use our solutions with limited training. We plan to continue our technology innovation, as we have done with our mobile applications, social features and analytics capabilities.
· Further Develop Our Referral Network. We have developed a strong network of referral participants, such as 401(k) advisors, benefits administrators, insurance brokers, third-party administrators and HR consultants that recommend our
solutions and provide referrals. We believe that our platform’s automated data integration with over 200 related third-party partner systems is valuable to our referral participants, as they are able to access payroll and HR data through a single system which decreases complexity and cost and complements their own product offerings. We plan to increase integration with third-party providers and expand our referral network to grow our client base and lower our client acquisition costs.
Our Products
Our cloud-based platform features a suite of unified payroll and HCM applications. Our solutions are highly configurable and easy to use, implement, update and maintain.
Paylocity Web Pay
Paylocity Web Pay is designed to provide enterprise-grade payroll processing and administration.
|
Feature |
|
Functionality |
|
Company-Level Configuration |
|
· Real time ability to add, delete and modify client-specific payroll settings, including departments, job codes, earnings, deductions, taxes and garnishments |
|
|
|
· Ability to create customized payroll earning or deduction code calculations, 401(k) match calculations and labor cost allocations |
|
|
|
· Ability to configure payroll audits that identify potential errors prior to finishing payroll, such as paying the same employee twice |
|
Configurable Templates |
|
· Combination of standard and modifiable templates powered by highly-flexible drag-and-drop technology |
|
|
|
· Standard templates such as new hire, job change, leave of absence and termination templates |
|
|
|
· Enables users to configure user interface to efficiently align to organizations’ business processes |
|
|
|
· Ability to require additional data, add default values and insert new custom fields increases accuracy and consistency of data across the platform |
|
Custom Checklists |
|
· Allows users to track critical steps in hiring and other processes |
|
|
|
· Triggers reports and notification emails to track critical steps and informs users when tasks are complete |
|
Advanced Reporting |
|
· Easy-to-use, powerful reporting dashboard enables users to design and create ad-hoc reports or rely on over 100 standard reports |
|
|
|
· Ability to generate a variety of pre-process reports via report library and report writer |
|
|
|
· Real-time report generation, including the ability to automatically schedule reports to run on a user-defined frequency |
|
|
|
· Point-in-time reporting, including comparative analysis over multiple periods, allowing users to view data from any time in history |
|
HR Insight and Analytics |
|
· Provides a dashboard view into critical HR metrics such as headcount and employee turnover |
|
|
|
· Users can choose between different types of graphical display or export the information to spreadsheets or other documents |
|
Affordable Care Act Compliance |
|
· Allows for modeling of all affordability safe harbor methods |
|
|
|
· Simultaneous measurement of initial and standard measurement periods for new hire employees |
|
|
|
· Reporting that provides multiple views allowing brokers and clients to make better informed benefit decisions |
|
|
|
· Advanced search and query capabilities provide ability for administrators to easily access key employee information |
Paylocity HR
Paylocity HR provides a set of core HR capabilities designed to improve HR compliance, enhance reporting capabilities and reduce the amount of time necessary to manage employee information.
|
Feature |
|
Functionality |
|
Employee Record Management |
|
· Manage payroll deductions for employee benefit plans such as health and 401(k) |
|
|
|
· Automated employee time-off requests |
|
|
|
· Track employee skills, events, education and prior employment |
|
|
|
· Store employee documentation electronically |
|
|
|
· Record and track company property issued to employees |
|
|
|
· Ability to add custom fields to track additional employee related information |
|
HR Compliance and Reporting |
|
· Interactive employee organizational chart |
|
|
|
· Family Medical Leave Act (FMLA) tracking |
|
|
|
· Equal Employment Opportunity (EEO) reporting |
|
|
|
· Occupational Safety & Health Administration (OSHA) tracking |
|
|
|
· Consolidated Omnibus Budget Reconciliation Act (COBRA) tracking |
|
|
|
· VETS 100/100A reporting |
|
|
|
· Workers’ compensation tracking and reporting |
|
|
|
· I-9 verification |
Paylocity Impressions
Paylocity Impressions is our advanced social media feature designed to integrate peer-to-peer collaboration and recognition into our solution, giving employees the ability to recognize each other and provide immediate feedback through virtually any device having Internet access. Paylocity Impressions helps to provide timely, meaningful recognition and promotes repeat positive behaviors among employees. Administrators have the ability to give their employees the option to post their accomplishments on their employee profiles to share with co-workers and other members of the organization. Employees can also be given the option to self-manage their profiles as well as update images and link to social sites such as LinkedIn, Twitter and Facebook. We believe that this functionality delivers a unique and modern solution to managing employee recognition programs.
Performance Management
Performance Management is designed to bring ease and convenience to the employee performance appraisal process and to give employees the opportunity to participate in their performance review and be more engaged in their professional development. Employee reviews and appraisals throughout the organization are stored and analyzed in a single system. Key features of Performance Management include:
|
Feature |
|
Functionality |
|
Reviews |
|
· Provides the ability for employees and managers to complete online reviews, add comments and sign off on completed reviews |
|
|
|
· Includes automated workflow at each step of the review process with ability for HR administrators to review and provide feedback prior to final approval |
|
360° Feedback |
|
· Provides the ability to access feedback from employees across the organization to receive input on employee performance and accomplishments |
|
|
|
· Enables year-round or point-in-time 360° feedback |
|
Goals Management |
|
· Manages employee goals and appraisals in a single place to reduce the time required to navigate between screens |
|
|
|
· Allows specific goals to be displayed on the performance review for increased employee focus and development |
|
|
|
· Assigns goals specific to employees based on skill level and other factors |
|
Self-Service Set-Up |
|
· Provides the ability to determine and control key success factors |
|
|
|
· Provides the ability to create review forms and set review notification date reminders |
Self-Service HR Portals
Self-Service HR Portals are designed to extend our solutions’ functionality by giving employees and managers secure and real-time access to critical payroll and HR information. Self-Service HR Portals help to improve communication within clients’ organizations with such tasks as reviewing time-off requests, scheduling and benefits enrollment. Self-Service HR Portals also provide the ability to post and manage company news items, add reminders, create custom web pages, view organizational charts and download videos.
|
Feature |
|
Functionality |
|
Employee Self-Service Portal |
|
· Full online and mobile access through virtually any device having Internet access to individual payroll, HR and benefits information |
|
|
|
· Provides the ability for administrators to communicate company news, policy changes, such as handbook revisions, and to post documents, create custom web pages to communicate with employees |
|
|
|
· Administrators can configure portal to link to third-party websites or embed videos |
|
|
|
· Allows employees to independently take actions such as clock in and out, make direct deposit changes, email check information, access tax forms, request time off, view time-off balances, access the company directory, manage contact information |
|
Manager Self-Service Portal |
|
· Improves communication among managers and HR and payroll and finance departments |
|
|
|
· Provides a single view for managers where they can approve employee changes and requests, manage outstanding tasks and easily access employee information |
|
|
|
· A workflow engine allows managers to initiate pay rate changes and automatically route changes for approval to various levels of the organization |
|
|
|
· Allows managers to assign supervisors to both direct and indirect reports |
Paylocity Web Onboarding
Web Onboarding delivers a seamless approach to new hire onboarding and events management. The new solution enables payroll and HR departments to deliver a highly intuitive, mobile-responsive onboarding experience to new hires. For administrators, Web Onboarding reduces the manual effort and processes generally associated with onboarding a new hire. Paylocity’s Onboarding features include:
· Seamless integration with Paylocity payroll and HCM modules reduces manual entry of new hire data
· Mobile responsive design and attractive, intuitive interface, engaging new hires in the process
· Robust events management capabilities, empowering administrators to proactively manage the onboarding process
· High level of customization, allowing administrators to tailor tasks and overall experience for new hire
· Withholding forms wizard, simplifying the process of completing important tax-related paperwork
· Ability to add customized content including welcome message, documents, videos and other company specific information.
Administrators can also build workflows to provide alerts and tasks to other parts of the organization involved in the new hire process.
Paylocity Web Time
Paylocity Web Time is a time and attendance solution designed to automate manual processes, improve productivity and help organizations control labor costs. Paylocity Web Time handles such tasks as managing schedules, tracking time and attendance, including overtime, rounding rules, payroll policies, labor allocation and time-off accruals. Paylocity Web Time also notes exceptions such as tardiness, absenteeism and misuse of break or meal periods. Paylocity Web Time is fully integrated with Paylocity Web Pay giving supervisors and employees a single point of entry into the system and automatic set-up of employee records and policies. Paylocity Web Time also provides the ability to select from a wide variety of biometric and bar code hardware options to track employees’ time. We believe this integration helps organizations reduce redundant processes, improve data accuracy, reduce leave liability and improve tracking capabilities.
Paylocity Web Benefits and Paylocity Enterprise Benefits, Powered by bswift
Paylocity Web Benefits and Paylocity Enterprise Benefits, Powered by bswift are benefit management solutions that integrate with insurance carrier systems to provide automated administrative processes and allows users to choose benefit elections and make life event changes online, summarize benefit elections and perform other similar benefit-related tasks. These solutions also enable premium reconciliation, management of voluntary benefits and advanced reporting. Both Web Benefits and Paylocity Enterprise Benefits integrate seamlessly with Paylocity’s Web Pay. Web Benefits features include:
· Employee Self-Service Enrollment Portal, designed to perform on mobile devices as well as desktops and laptops
· Automated employee deductions updates in Web Pay
· Customizable enrollment portal content (text, links, documents, logos)
· Reporting on employee enrollment status and enrollment summary
· Configurable Medical, Dental and Vision benefit plans, Reimbursement benefit plans (HAS, DCRA, HCRA), Life benefits plans (Basic, Voluntary, AD&D), Long-term and Short-term disability
· Electronic Data Interchange (EDI) support for insurance carriers
Paylocity Web Benefits features an intuitive design to make benefits enrollment a simple and straightforward activity for the employee and reduce the overall time and energy payroll and HR administrators spend managing benefits enrollment.
Implementation and Client Services
Delivering our clients a positive experience is an essential element of our ability to sell our solutions and retain our clients. We provide our clients with a single point-of-contact supplemented by teams with deep technical and subject matter expertise. The single point of contact allows our account managers to better understand our clients’ needs, which we believe strengthens our client relationships.
Implementation and Training Services
Our clients are medium-sized organizations that are typically migrating to our platform from a competitive solution or are adopting an online payroll and HCM solution for the first time. These organizations often have limited internal resources and generally rely on us to implement our solutions.
We typically implement our Paylocity Web Pay product within only three to four weeks, and any additional products thereafter, as requested by the client. Each client is guided through the implementation process by an implementation consultant who serves as a single point-of-contact for all implementation matters. We believe our ability to rapidly implement our solutions is principally due to the combination of our emphasis on engagement with the client, our standardized methodology, our cloud-based architecture and our highly-configurable, easy-to-use products.
We offer our clients the opportunity to participate in formal training designed to increase their ability to further utilize the functionality of our products within their organizations. Our training courses are designed to enable selected employees of our clients to develop expertise in our solutions and act as a first-level support resource for their colleagues.
In order to ensure client satisfaction, a team of client service representatives conducts a comprehensive audit of a client’s account after the client has completed the implementation process. Thereafter, the client is transitioned to our client service team.
Client Service
Our client service model is designed to serve the needs of medium-sized organizations and to build loyalty by developing strong relationships with our clients. We strive to achieve high revenue retention, in part, by delivering high-quality service. Our revenue retention was greater than 92% in each of fiscal 2012, 2013 and 2014.
Each client is assigned an account manager who serves as the central point-of-contact for any questions or support needs. We believe this approach enhances our client service by providing each client with a single person who understands the client’s business, responds quickly and is accountable for the client experience. Our account managers are supplemented by teams with deep technical and subject matter expertise who help to expediently and effectively address client needs. We also proactively solicit client feedback through ongoing surveys from which we receive actionable feedback that we use to enhance our client service processes.
Tax and Regulatory Services
Our software contains a rules engine designed to make accurate tax calculations that is continually updated to support all pertinent legislative changes across all U.S. jurisdictions. Our tax filing service provides a variety of solutions to our clients including processing payroll tax deposits, preparing and filing quarterly and annual tax returns and amendments and resolving client tax notices.
Clients
As of June 30, 2014, we provided our solutions to approximately 8,500 clients in all U.S. states. Although many clients have multiple divisions, segments or locations, we only count such clients once for these purposes.
Our clients include for-profit and non-profit organizations across industries including business services, financial services, healthcare, manufacturing, restaurants, retail, technology and others. For each of the three years ended June 30, 2012, 2013 and 2014, no client accounted for more than 1% of our revenues.
Sales and Marketing
We market and sell our products and services primarily through our direct sales force. Our direct sales force includes sales representatives who have defined geographic territories throughout the U.S. We seek to hire experienced sales representatives wherever they are located, and believe we have room to grow the number of sales representatives in each of our territories. In addition, we have contractual arrangements with third-party resellers who also sell subscriptions to our payroll and HCM solutions.
The sales cycle begins with a sales lead generated by the sales representative through our third-party referral network, a client referral, our telemarketing team, our external website, e-mail marketing or territory- based activities. Through one or more on-site visits, phone-based sales calls, or web demonstrations, sales representatives perform in-depth analysis of prospective clients’ needs and demonstrate our solutions. We employ sophisticated software to track, classify and manage our sales representatives’ pipeline of potential clients. We support our sales force with a marketing program that includes seminars and webinars, email marketing, social media marketing, broker events and web marketing.
Referral Network
As a core element of our business strategy, we have developed a referral network of third-party service providers, including 401(k) advisors, benefits administrators, insurance brokers, third-party administrators and HR consultants, that recommend our solutions and provide referrals. Our referral network has become an increasingly important component of our sales process, and in fiscal 2014, greater than 25% of our new client revenue originated by referrals from participants in our referral network.
We believe participants in our referral network refer potential clients to us because we do not provide services that compete with their own and because we offer third parties the ability to integrate their systems with our platform. Unlike other payroll and HCM solution providers who also provide retirement plans, health insurance and other products and services competitive with the offerings of the participants in our referral network, we focus only on our core business of providing cloud-based payroll and HCM solutions. In some cases we have formalized relationships in which we are a recommended vendor of these participants. In other cases, our relationships are informal. We typically do not compensate these participants for referrals.
Partner Ecosystem
We have developed a partner ecosystem of third-party systems, such as 401(k), benefits and insurance provider systems, with whom we provide automated data integration for our clients. These third-party providers require certain financial information from their clients in order to efficiently provide their respective services. After securing authorization from the client, we exchange payroll data with these providers. In turn, these third-party providers supply data to us, which allows us to deliver comprehensive benefit management services to our clients. We believe our ability to integrate our systems with those of these partners adds value to our mutual clients and to our partners.
We have also developed our solutions to integrate with a variety of other systems used by our clients, such as accounting, point of sale, banking, expense management, recruiting, background screening and skills assessment solutions. We believe our clients benefit from an integrated and seamless solution.
Technology
We offer our solutions on a cloud-based platform that leverages a unified database architecture and a common code base that we organically developed. Clients do not need to install our software in their data centers and can access our solutions through any mobile device or web browser with Internet access.
· Multi-Tenant Architecture. Our software solutions were designed with a multi-tenant architecture. This architecture gives us an advantage over many disparate traditional systems which are less flexible and require longer and more costly development and upgrade cycles.
· Mobile Focused. We employ mobile-centric principles in our solution design and development. We believe that the increasing mobility of employees heightens the importance of access to our solutions through mobile devices, including smart phones and tablets. Our mobile experience provides our clients and their employees with access to our solutions through virtually any device having Internet access. We bring the flexibility of a secure, cloud-based solution to users without the need to access a traditional desktop or laptop computer.
· Security. We maintain comprehensive security programs designed to ensure the security and integrity of client and employee data, protect against security threats or data breaches and prevent unauthorized access. We regulate and limit all access to servers and networks at our data centers. Our systems are monitored for irregular or suspicious activity, and we have dedicated internal staff perform security assessments for each release. Our systems undergo regular penetration testing and source code reviews by an independent third-party security firm.
We host our solutions at our primary data center at our corporate headquarters in Arlington Heights, Illinois. We utilize a secondary data center through a third-party in Kenosha, Wisconsin for backup and disaster recovery. We supply the hardware infrastructure and are responsible for the ongoing maintenance of our equipment at both data center locations.
Competition
The market for payroll and HCM solutions is fragmented, highly competitive and rapidly changing. Our competitors vary for each of our solutions and include enterprise-focused software providers, such as Ultimate Software Group, Inc., Workday, Inc., SAP AG, Oracle Corporation and Ceridian Corporation; payroll service providers, such as Automatic Data Processing, Inc., Paychex, Inc., Paycom Software, Inc. and other regional providers; and HCM point solutions providers, such as Cornerstone OnDemand, Inc.
We believe the principal competitive factors on which we compete in our market include the following:
· Focus on medium-sized organizations;
· Breadth and depth of product functionality;
· Configurability and ease of use of our solutions;
· Modern, intuitive user experience;
· Benefits of a cloud-based technology platform;
· Ability to innovate and respond to client needs rapidly;
· Domain expertise in payroll and HCM;
· Quality of implementation and client service;
· Ease of implementation;
· Real-time web-based payroll processing; and
· Integration with a wide variety of third-party applications and systems.
We believe that we compete favorably on these factors within the medium-sized organization market. We believe our ability to remain competitive will largely depend on the success of our continued investment in sales and marketing, research and development and implementation and client services.
Research and Development
We invest heavily in research and development to continuously introduce new applications, technologies, features and functionality. We are organized in small product-centric teams that utilize an agile development methodology. We focus our efforts on developing new applications and core technologies and on further enhancing the usability, functionality, reliability, performance and flexibility of existing applications.
Research and development costs, including research and development costs that were capitalized, were $5.5 million, $8.8 million and $15.0 million for the years ended June 30, 2012, 2013 and 2014, respectively. Our research and development personnel are principally located at our headquarters, although we seek to hire highly experienced personnel wherever they are located.
Intellectual Property
Our success is dependent, in part, on our ability to protect our proprietary technology and other intellectual property rights. We rely on a combination of trade secrets, copyrights and trademarks, as well as contractual protections to establish and protect our intellectual property rights. We require our employees, consultants and other third parties to enter into confidentiality and proprietary rights agreements and control access to software, documentation and other proprietary information. Although we rely on laws respecting intellectual property rights, including trade secret, copyright and trademark laws, as well as contractual protections to establish and protect our intellectual property rights, we believe that factors such as the technological and creative skills of our personnel, creation of new modules, features and functionality and frequent enhancements to our applications are more essential to establishing and maintaining our technology leadership position.
Despite our efforts to protect our proprietary technology and our intellectual property rights, unauthorized parties may attempt to misappropriate our rights or to copy or obtain and use our proprietary technology to develop applications with the same functionality as our applications. Policing unauthorized use of our technology and intellectual property rights is very difficult.
We expect that providers of payroll and HCM solutions such as ours may be subject to third-party infringement claims as the market and the number of competitors grows and the functionality of applications in different industry segments overlaps. Any of these or other third parties might make a claim of infringement against us at any time.
Employees
As of June 30, 2014, we had approximately 968 full-time employees, of which 308 were in client services and operations, 242 were in client implementation, 126 were in research and development, 213 were in sales and marketing and 79 were in general and administrative. None of our employees is represented by a union or is party to a collective bargaining agreement, and we have not experienced any work stoppages. We believe we have good relations with our employees and that our culture benefits our clients and supports our growth. Our management team is committed to maintaining and improving our culture even as we grow rapidly.
Available Information
Our Internet address is www.paylocity.com and our investor relations website is located at http://investors.paylocity.com. We make available free of charge on our investor relations website under the heading “Financials and Filings” our Annual Reports on Form 10-K, Quarterly Reports on Form 10-Q, Current Reports on Form 8-K and amendments to those reports as soon as reasonably practicable after such materials are electronically filed with (or furnished to) the SEC. Information contained on our websites is not incorporated by reference into this Annual Report on Form 10-K. In addition, the public may read and copy materials we file with the SEC at the SEC’s Public Reference Room at 100 F Street, NE, Washington, DC 20549. The public may obtain information on the operation of the Public Reference Room by calling the SEC at 1-800-SEC-0330. In addition, the SEC maintains an Internet site, www.sec.gov, that includes filings of and information about issuers that file electronically with the SEC.
Our business, prospects, financial condition or operating results could be materially adversely affected by any of these risks, as well as other risks not currently known to us or that are currently considered immaterial. The trading price of our common stock could decline due to any of the risks and uncertainties described below, and you may lose all or part of your investment. In assessing these risks, you should also refer to the other information contained in this Annual Report on Form 10-K, including our consolidated financial statements and related notes.
We have incurred losses in the past, and we may not be able to achieve or sustain profitability for the foreseeable future.
We have incurred net losses from time to time. We incurred net losses of $130,000 and $7,110,000 in fiscal 2011 and fiscal 2014, respectively. We have been growing our number of clients rapidly, and as we do so, we incur significant sales and marketing, services and other related expenses. Our profitability will be significantly influenced by our ability to attain sufficient scale and productivity to achieve recurring revenues that are sufficient to support the incremental costs to obtain and support new clients. We intend for the foreseeable future to continue to focus predominately on adding new clients, and we cannot predict when we will achieve sustained profitability, if at all. We also expect to make other significant expenditures and investments in research and development to expand and improve our product offerings and technical infrastructure. In addition, as a public company, we will incur significant legal, accounting and other expenses that we do not incur as a private company. These increased expenditures will make it harder for us to achieve and maintain profitability. We also may incur losses in the future for a number of other unforeseen reasons. Accordingly, we may not be able to maintain profitability, and we may incur losses for the foreseeable future.
Our quarterly operating results have fluctuated in the past and may continue to fluctuate, causing the value of our common stock to decline substantially.
Our quarterly operating results may fluctuate due to a variety of factors, many of which are outside of our control. As a result, comparing our operating results on a period-to-period basis may not be meaningful. Moreover, our stock price might be based on expectations of future performance that are unrealistic or that we might not meet and, if our revenue or operating results fall below such expectations, the price of our common stock could decline substantially.
Our number of new clients increases more during our third fiscal quarter ending March 31 than during the rest of our fiscal year, primarily because many new clients prefer to start using our payroll and human capital management, or HCM, solutions at the beginning of a calendar year. In addition, client funds and year-end activities are traditionally higher during our third fiscal quarter. As a result of these factors, our total revenue and expenses have historically grown disproportionately during our third fiscal quarter as compared to other quarters.
In addition to other risk factors listed in this section, some of the important factors that may cause fluctuations in our quarterly operating results include:
· The extent to which our products achieve or maintain market acceptance;
· Our ability to introduce new products and enhancements and updates to our existing products on a timely basis;
· Competitive pressures and the introduction of enhanced products and services from competitors;
· Changes in client budgets and procurement policies;
· The amount and timing of our investment in research and development activities and whether such investments are capitalized or expensed as incurred;
· The number of our clients’ employees;
· Timing of recognition of revenues and expenses;
· Client renewal rates;
· Seasonality in our business;
· Technical difficulties with our products or interruptions in our services;
· Our ability to hire and retain qualified personnel;
· Changes in the regulatory requirements and environment related to the products and services which we offer; and
· Unforeseen legal expenses, including litigation and settlement costs.
We do not have long-term agreements with clients, and our standard agreements with clients are generally terminable by our clients upon 60 or fewer days’ notice. If a significant number of clients elected to terminate their agreements with us, our operating results and our business would be adversely affected.
In addition, a significant portion of our operating expenses are related to compensation and other items which are relatively fixed in the short-term, and we plan expenditures based in part on our expectations regarding future needs and opportunities. Accordingly, changes in our business or revenue shortfalls could decrease our gross and operating margins and could cause significant changes in our operating results from period to period. If this occurs, the trading price of our common stock could fall substantially, either suddenly or over time.
Our operating results for previous fiscal quarters are not necessarily indicative of our operating results for the full fiscal years or for any future periods. We believe that, due to the underlying factors for quarterly fluctuations, quarter-to-quarter comparisons of our operations are not necessarily meaningful and that such comparisons should not be relied upon as indications of future performance.
Failure to manage our growth effectively could increase our expenses, decrease our revenue, and prevent us from implementing our business strategy.
We have been rapidly growing our revenue and number of clients, and we will seek to do the same for the foreseeable future. However, the growth in our number of clients puts significant strain on our business, requires significant capital expenditures and increases our operating expenses. To manage this growth effectively, we must attract, train, and retain a significant number of qualified sales, implementation, client service, software development, information technology and management personnel. We also must maintain and enhance our technology infrastructure and our financial and accounting systems and controls. If we fail to effectively manage our growth or we over-invest or under-invest in our business, our business and results of operations could suffer from the resultant weaknesses in our infrastructure, systems or controls. We could also suffer operational mistakes, a loss of business opportunities and employee losses. If our management is unable to effectively manage our growth, our expenses might increase more than expected, our revenue could decline or might grow more slowly than expected, and we might be unable to implement our business strategy.
The markets in which we participate are highly competitive, and if we do not compete effectively, our operating results could be adversely affected.
The market for payroll and HCM solutions is fragmented, highly competitive and rapidly changing. Our competitors vary for each of our solutions, and include enterprise-focused software providers, such as Ultimate Software Group, Inc., Workday, Inc., SAP AG, Oracle Corporation and Ceridian Corporation, payroll service providers, such as Automatic Data Processing, Inc., Paychex, Inc. and other regional providers, and HCM point solutions, such as Cornerstone OnDemand, Inc.
Several of our competitors are larger, have greater name recognition, longer operating histories and significantly greater resources than we do. Many of these competitors are able to devote greater resources to the development, promotion and sale of their products and services. Furthermore, our current or potential competitors may be acquired by third parties with greater available resources and the ability to initiate or withstand substantial price competition. As a result, our competitors may be able to develop products and services better received by our markets or may be able to respond more quickly and effectively than we can to new or changing opportunities, technologies, regulations or client requirements.
In addition, current and potential competitors have established, and might in the future establish, partner or form other cooperative relationships with vendors of complementary products, technologies or services to enable them to offer new products and services, to compete more effectively or to increase the availability of their products in the marketplace. New competitors or relationships might emerge that have greater market share, a larger client base, more widely adopted proprietary technologies, greater marketing expertise, greater financial resources, and larger sales forces than we have, which could put us at a competitive disadvantage. In light of these advantages, current or potential clients might accept competitive offerings in lieu of purchasing our offerings. We expect intense competition to continue for these reasons, and such competition could negatively impact our sales, profitability or market share.
If we do not continue to innovate and deliver high-quality, technologically advanced products and services, we will not remain competitive and our revenue and operating results could suffer.
The market for our solutions is characterized by rapid technological advancements, changes in client requirements, frequent new product introductions and enhancements and changing industry standards. The life cycles of our products are difficult to estimate. Rapid technological changes and the introduction of new products and enhancements by new or existing competitors could undermine our current market position.
Our success depends in substantial part on our continuing ability to provide products and services that medium-sized organizations will find superior to our competitors’ offerings and will continue to use. We intend to continue to invest significant resources in research and development in order to enhance our existing products and services and introduce new high-quality products that clients will want. If we are unable to predict user preferences or industry changes, or if we are unable to modify our products and services on a timely basis or to effectively bring new products to market, our sales may suffer.
In addition, we may experience difficulties with software development, industry standards, design, or marketing that could delay or prevent our development, introduction or implementation of new solutions and enhancements. The introduction of new solutions by competitors, the emergence of new industry standards or the development of entirely new technologies to replace existing offerings could render our existing or future solutions obsolete.
We may not have sufficient resources to make the necessary investments in software development and we may experience difficulties that could delay or prevent the successful development, introduction or marketing of new products or enhancements. In addition, our products or enhancements may not meet the increasingly complex client requirements of the marketplace or achieve market acceptance at the rate we expect, or at all. Any failure by us to anticipate or respond adequately to technological advancements, client requirements and changing industry standards, or any significant delays in the development, introduction or availability of new products or enhancements, could undermine our current market position.
If we are unable to release periodic updates on a timely basis to reflect changes in tax, benefit and other laws and regulations that our products help our clients address, the market acceptance of our products may be adversely affected and our revenues could decline.
Our solutions are affected by changes in tax, benefit and other laws and regulations and generally must be updated regularly to maintain their accuracy and competitiveness. Although we believe our SaaS platform provides us with flexibility to release updates in response to these changes, we cannot be certain that we will be able to make the necessary changes to our solutions and release updates on a timely basis, or at all. Failure to do so could have an adverse effect on the functionality and market acceptance of our solutions. In addition, significant changes in tax, benefit and other laws and regulations could require us to make significant modifications to our products, which could result in substantial expenses.
Because of the way we recognize our revenue and our expenses over varying periods, changes in our business may not be immediately reflected in our financial statements.
We recognize our revenue as services are performed. The amount of revenue we recognize in any particular period is derived in significant part based on the number of employees of our clients served by our solutions. As a result, our revenue is dependent in part on the success of our clients. The effect on our revenue of significant changes in sales of our solutions or in our clients’ businesses may not be fully reflected in our results of operations until future periods.
We recognize our expenses over varying periods based on the nature of the expense. In particular, we recognize implementation costs and sales commissions as they are incurred even though we recognize revenue as we perform services over extended periods. When a client terminates its relationship with us, we may not have derived enough revenue from that client to cover associated implementation costs. As a result, we may report poor operating results due to higher implementation costs and sales commissions in a period in which we experience strong sales of our solutions. Alternatively, we may report better operating results due to lower implementation costs and sales commissions in a period in which we experience a slowdown in sales. As a result, our expenses fluctuate as a percentage of revenue, and changes in our business generally may not be immediately reflected in our results of operations.
If our security measures are breached or unauthorized access to client data or funds is otherwise obtained, our solutions may be perceived as not being secure, clients may reduce the use of or stop using our solutions and we may incur significant liabilities.
Our solutions involve the storage and transmission of our clients’ and their employees’ proprietary and confidential information. This information includes bank account numbers, tax return information, social security numbers, benefit information, retirement account information, payroll information and system passwords. In addition, we collect and maintain personal information
on our own employees in the ordinary course of our business. Finally, our business involves the storage and transmission of funds from the accounts of our clients to their employees, taxing and regulatory authorities and others. As a result, unauthorized access or security breaches of our systems or the systems of our clients could result in the unauthorized disclosure of confidential information, theft, litigation, indemnity obligations and other significant liabilities. Because the techniques used to obtain unauthorized access or sabotage systems change frequently and generally are not identified until they are employed, we may be unable to anticipate these techniques or to implement adequate preventative measures in advance. While we have security measures and controls in place to protect confidential information, prevent data loss, theft and other security breaches, including penetration tests of our systems by independent third parties, if our security measures are breached, our business could be substantially harmed and we could incur significant liabilities. Any such breach or unauthorized access could negatively affect our ability to attract new clients, cause existing clients to terminate their agreements with us, result in reputational damage and subject us to lawsuits, regulatory fines or other actions or liabilities which could materially and adversely affect our business and operating results.
There can be no assurance that the limitations of liability in our contracts would be enforceable or adequate or would otherwise protect us from any such liabilities or damages with respect to any particular claim related to a breach or unauthorized access. We also cannot be sure that our existing general liability insurance coverage and coverage for errors or omissions will continue to be available on acceptable terms or will be available in sufficient amounts to cover one or more large claims, or that the insurer will not deny coverage as to any future claim. The successful assertion of one or more large claims against us that exceed available insurance coverage, or the occurrence of changes in our insurance policies, including premium increases or the imposition of large deductible or co-insurance requirements, could have a material adverse effect on our business, financial condition and results of operations.
If we fail to adequately expand our direct sales force with qualified and productive persons, we may not be able to grow our business effectively.
We primarily sell our products and implementation services through our direct sales force. To grow our business, we intend to focus on growing our client base for the foreseeable future. Our ability to add clients and to achieve revenue growth in the future will depend upon our ability to grow and develop our direct sales force and on their ability to productively sell our solutions. Identifying and recruiting qualified personnel and training them in the use of our software require significant time, expense and attention. The amount of time it takes for our sales representatives to be fully-trained and to become productive varies widely. In addition, if we hire sales representatives from competitors or other companies, their former employers may attempt to assert that these employees have breached their legal obligations, resulting in a diversion of our time and resources.
If our sales organization does not perform as expected, our revenues and revenue growth could suffer. In addition, if we are unable to hire, develop and retain talented sales personnel, if our sales force becomes less efficient as it grows or if new sales representatives are unable to achieve desired productivity levels in a reasonable period of time, we may not be able to grow our client base and revenues and our sales and marketing expenses may increase.
If our referral network participants reduce their referrals to us, we may not be able to grow our client base or revenues in the future.
Referrals from third-party service providers, including 401(k) advisors, benefits administrators, insurance brokers, third-party administrators and HR consultants, represent a significant source of potential clients for our products and implementation services. For example, we estimate that greater than 25% of our new sales in fiscal 2014 were referred to us from our referral network participants, and our referral network may become an even more significant source of client referrals in the future. In most cases, our relationships with referral network participants are informal, although in some cases, we have formalized relationships where we are a recommended vendor for their client.
Participants in our referral network are generally under no contractual obligation to continue to refer business to us, and we do not intend to seek contractual relationships with these participants. In addition, these participants are generally not compensated for referring potential clients to us, and may choose to instead refer potential clients to our competitors. Our ability to achieve revenue growth in the future will depend, in part, upon continued referrals from our network.
There can be no assurance that we will be successful in maintaining, expanding or developing our referral network. If our relationships with participants in our referral network were to deteriorate or if any of our competitors enter into strategic relationships with our referral network participants, sales leads from these participants could be reduced or cease entirely. If we are not successful, we may lose sales opportunities and our revenues and profitability could suffer.
If the market for cloud-based payroll and HCM solutions among medium-sized organizations develops more slowly than we expect or declines, our business could be adversely affected.
We believe that the market for cloud-based payroll and HCM solutions is not as mature among medium-sized organizations as the market for outsourced services or on-premise software and services. It is not certain that cloud-based solutions will achieve and sustain high levels of client demand and market acceptance. Our success will depend to a substantial extent on the widespread adoption by medium-sized organizations of cloud-based computing in general, and of payroll and other HCM applications in particular. It is difficult to predict client adoption rates and demand for our solutions, the future growth rate and size of the cloud-based market or the entry of competitive solutions. The expansion of the cloud-based market depends on a number of factors, including the cost, performance, and perceived value associated with cloud-based computing, as well as the ability of cloud-based solutions to address security and privacy concerns. If other cloud-based providers experience security incidents, loss of client data, disruptions in delivery or other problems, the market for cloud-based applications as a whole, including our solutions, may be negatively affected. If cloud-based payroll and HCM solutions do not achieve widespread adoption among medium-sized organizations, or there is a reduction in demand for cloud-based computing caused by a lack of client acceptance, technological challenges, weakening economic conditions, security or privacy concerns, competing technologies and products, decreases in corporate spending or otherwise, it could result in a loss of clients, decreased revenues and an adverse impact on our business.
We typically pay employees and may pay taxing authorities amounts due for a payroll period before a client’s electronic funds transfers are finally settled to our account. If client payments are rejected by banking institutions or otherwise fail to clear into our accounts, we may require additional sources of short-term liquidity and our operating results could be adversely affected.
Our payroll processing business involves the movement of significant funds from the account of a client to employees and relevant taxing authorities. For example, in fiscal 2014 we processed almost $39 billion in payroll transactions. Though we debit a client’s account prior to any disbursement on its behalf, due to Automated Clearing House, or ACH, banking regulations, funds previously credited could be reversed under certain circumstances and timeframes after our payment of amounts due to employees and taxing and other regulatory authorities. There is therefore a risk that the employer’s funds will be insufficient to cover the amounts we have already paid on its behalf. While such shortage and accompanying financial exposure has only occurred in very limited instances in the past, should clients default on their payment obligations in the future, we might be required to advance substantial amounts of funds to cover such obligations. In such an event, we may be required to seek additional sources of short-term liquidity, which may not be available on reasonable terms, if at all, and our operating results and our liquidity could be adversely affected and our banking relationships could be harmed.
Adverse changes in economic or political conditions could adversely affect our operating results and our business.
Our recurring revenues are based in part on the number of our clients’ employees. As a result, we are subject to risks arising from adverse changes in economic and political conditions. The state of the economy and the rate of employment, which deteriorated in the recent broad recession, may deteriorate further in the future. If weakness in the economy continues or worsens, many clients may reduce their number of employees and delay or reduce technology purchases. This could also result in reductions in our revenues and sales of our products, longer sales cycles, increased price competition and clients’ purchasing fewer solutions than they have in the past. Any of these events would likely harm our business, results of operations, financial condition and cash flows from operations.
Trade, monetary and fiscal policies, and political and economic conditions may substantially change, and credit markets may experience periods of constriction and volatility. When there is a slowdown in the economy, employment levels and interest rates may decrease with a corresponding impact on our businesses. Clients may react to worsening conditions by reducing their spending on payroll and other HCM solutions or renegotiating their contracts with us. We have agreements with various large banks to execute ACH and wire transfers as part of our client payroll and tax services. While we have contingency plans in place for bank failures, a failure of one of our banking partners or a systemic shutdown of the banking industry could result in the loss of client funds or impede us from accessing and processing funds on our clients’ behalf, and could have an adverse impact on our business and liquidity.
If the banks that currently provide ACH and wire transfers fail to properly transmit ACH or terminate their relationship with us or limit our ability to process funds or we are not able to increase our ACH capacity with our existing and new banks, our ability to process funds on behalf of our clients and our financial results and liquidity could be adversely affected.
We currently have agreements with nine banks to execute ACH and wire transfers to support our client payroll and tax services. If one or more of the banks fails to process ACH transfers on a timely basis, or at all, then our relationship with our clients could be harmed and we could be subject to claims by a client with respect to the failed transfers. In addition, these banks have no obligation to renew their agreements with us on commercially reasonable terms, if at all. If these banks terminate their relationships with us or restrict the dollar amounts of funds that they will process on behalf of our clients, their doing so may impede our ability to process funds and could have an adverse impact on our financial results and liquidity.
We depend on our senior management team and other key employees, and the loss of these persons or an inability to attract and retain highly skilled employees could adversely affect our business.
Our success depends largely upon the continued services of our key executive officers, including Steven R. Beauchamp, our President and Chief Executive Officer. We also rely on our leadership team in the areas of research and development, sales, services and general and administrative functions. From time to time, there may be changes in our executive management team resulting from the hiring or departure of executives, which could disrupt our business. While we have employment agreements with certain of our executive officers, including Mr. Beauchamp, these employment agreements do not require them to continue to work for us for any specified period and, therefore, they could terminate their employment with us at any time. The loss of one or more of our executive officers or key employees could have an adverse effect on our business.
If we are unable to recruit and retain highly-skilled product development and other technical persons, our ability to develop and support widely-accepted products could be impaired and our business could be harmed.
We believe that to grow our business and be successful, we must continue to develop products that are technologically-advanced, are highly integrable with third-party services, provide significant mobility capabilities and have pleasing and intuitive user experiences. To do so, we must attract and retain highly qualified personnel, particularly employees with high levels of experience in designing and developing software and Internet-related products and services. Competition for these personnel in the greater Chicago area and elsewhere is intense. If we fail to attract new personnel or fail to retain and motivate our current personnel, our business and future growth prospects could be severely harmed. We follow a practice of hiring the best available candidates wherever located, but as we grow our business, the productivity of our product development and other research and development may be adversely affected. In addition, if we hire employees from competitors or other companies, their former employers may attempt to assert that these employees have breached their legal obligations, resulting in a diversion of our time and resources.
The sale and support of products and the performance of related services by us entail the risk of product or service liability claims, which could significantly affect our financial results.
Clients use our products in connection with the preparation and filing of tax returns and other regulatory reports. If any of our products contain errors that produce inaccurate results upon which users rely, or cause users to misfile or fail to file required information, we could be subject to liability claims from users. Our agreements with our clients typically contain provisions intended to limit our exposure to such claims, but such provisions may not be effective in limiting our exposure. Contractual limitations we use may not be enforceable and may not provide us with adequate protection against product liability claims in certain jurisdictions. A successful claim for product or service liability brought against us could result in substantial cost to us and divert management’s attention from our operations.
Privacy concerns and laws or other domestic regulations may reduce the effectiveness of our applications and adversely affect our business.
Our clients collect, use and store personal or identifying information regarding their employees and their family members in our solutions. Federal and state government bodies and agencies have adopted, are considering adopting, or may adopt laws and regulations regarding the collection, use, storage and disclosure of such personal information. The costs of compliance with, and other burdens imposed by, such laws and regulations that are applicable to our clients’ businesses may limit the use and adoption of our applications and reduce overall demand, or lead to significant fines, penalties or liabilities for any noncompliance with such privacy laws. Even the perception of privacy concerns, whether or not valid, may inhibit market adoption of our solutions.
All of these legislative and regulatory initiatives may adversely affect our clients’ ability to process, handle, store, use and transmit demographic and personal information regarding their employees and family members, which could reduce demand for our solutions.
In addition to government activity, privacy advocacy groups and the technology and other industries are considering various new, additional or different self-regulatory standards that may place additional burdens on us. If the processing of personal information were to be curtailed in this manner, our products would be less effective, which may reduce demand for our applications and adversely affect our business.
Our business could be adversely affected if we do not effectively implement our solutions or our clients are not satisfied with our implementation services.
Our ability to deliver our payroll and HCM solutions depends on our ability to effectively implement and to transition to, and train our clients on, our solutions. We do not recognize revenue from new clients until they process their first payroll. Further, our agreements with our clients are generally terminable by the clients on 60 days’ notice. If a client is not satisfied with our
implementation services, the client could terminate its agreement with us before we have recovered our costs of implementation services, which would adversely affect our results of operations and cash flows. In addition, negative publicity related to our client relationships, regardless of its accuracy, may further damage our business by affecting our ability to compete for new business with current and prospective clients.
Our business could be affected if we are unable to accommodate increased demand for our implementation services resulting from growth in our business.
We may be unable to respond quickly enough to accommodate increased client demand for implementation services driven by our growth. The implementation process is the first substantive interaction with a new client. As a predicate to providing knowledgeable implementation services, we must have a sufficient number of personnel dedicated to that process. In order to ensure that we have sufficient employees to implement our solutions, we must closely coordinate hiring of personnel with our projected sales for a particular period. Because our sales cycle is typically only three to six weeks long, we may not be successful in coordinating hiring of implementation personnel to meet increased demand for our implementation services. Increased demand for implementation services without a corresponding staffing increase of qualified personnel could adversely affect the quality of services provided to new clients, and our business and our reputation could be harmed.
Any failure to offer high-quality client services may adversely affect our relationships with our clients and our financial results.
Once our applications are deployed, our clients depend on our client service organization to resolve issues relating to our solutions. Our clients are medium-sized organizations with limited personnel and resources to address payroll and other HCM related issues. These clients rely on us more so than larger companies with greater internal resources and expertise. High-quality client services are important for the successful marketing and sale of our products and for the retention of existing clients. If we do not help our clients quickly resolve issues and provide effective ongoing support, our ability to sell additional products to existing clients would suffer and our reputation with existing or potential clients would be harmed.
In addition, our sales process is highly dependent on our applications and business reputation and on positive recommendations from our existing clients. Any failure to maintain high-quality client services, or a market perception that we do not maintain high-quality client services, could adversely affect our reputation, our ability to sell our solutions to existing and prospective clients, and our business, operating results and financial position.
If we fail to manage our technical operations infrastructure, our existing clients may experience service outages and our new clients may experience delays in the deployment of our applications.
We have experienced significant growth in the number of users, transactions and data that our operations infrastructure supports. We seek to maintain sufficient excess capacity in our data center and other operations infrastructure to meet the needs of all of our clients. We also seek to maintain excess capacity to facilitate the rapid provision of new client deployments and the expansion of existing client deployments. In addition, we need to properly manage our technological operations infrastructure in order to support version control, changes in hardware and software parameters and the evolution of our applications. However, the provision of new hosting infrastructure requires significant lead time. We have experienced, and may in the future experience, website disruptions, outages and other performance problems. These problems may be caused by a variety of factors, including infrastructure changes, human or software errors, viruses, security attacks, fraud, spikes in client usage and denial of service issues. In some instances, we may not be able to identify the cause or causes of these performance problems within an acceptable period of time. If we do not accurately predict our infrastructure requirements, our existing clients may experience service outages that may subject us to financial penalties, financial liabilities and client losses. If our operations infrastructure fails to keep pace with increased sales, clients may experience delays as we seek to obtain additional capacity, which could adversely affect our reputation and our revenues.
In addition, our ability to deliver our cloud-based applications depends on the development and maintenance of Internet infrastructure by third parties. This includes maintenance of a reliable network backbone with the necessary speed, data capacity, bandwidth capacity, and security. Our services are designed to operate without interruption. However, we have experienced and expect that we will experience future interruptions and delays in services and availability from time to time. In the event of a catastrophic event with respect to one or more of our systems, we may experience an extended period of system unavailability, which could negatively impact our relationship with clients. To operate without interruption, both we and our clients must guard against:
· Damage from fire, power loss, natural disasters and other force majeure events outside our control;
· Communications failures;
· Software and hardware errors, failures and crashes;
· Security breaches, computer viruses, hacking, denial-of-service attacks and similar disruptive problems; and
· Other potential interruptions.
We also rely on computer hardware purchased or leased and software licensed from third parties in order to offer our services. These licenses and hardware are generally commercially available on varying terms. However, it is possible that this hardware and software might not continue to be available on commercially reasonable terms, or at all. Any loss of the right to use any of this hardware or software could result in delays in the provisioning of our services until equivalent technology is either developed by us, or, if available, is identified, obtained and integrated.
Furthermore, our payroll application is essential to our clients’ timely payment of wages to their employees. Any interruption in our service may affect the availability, accuracy or timeliness of these programs and could damage our reputation, cause our clients to terminate their use of our application, require us to indemnify our clients against certain losses due to our own errors and prevent us from gaining additional business from current or future clients.
Any disruption in the operation of our data centers could adversely affect our business.
We host our applications and serve all of our clients from data centers located at our company headquarters in Arlington Heights, Illinois with a backup data center at a third-party facility in Kenosha, Wisconsin. We also may decide to employ additional offsite data centers in the future to accommodate growth.
Problems faced by our data center locations, with the telecommunications network providers with whom we or they contract, or with the systems by which our telecommunications providers allocate capacity among their clients, including us, could adversely affect the availability and processing of our solutions and related services and the experience of our clients. If our data centers are unable to keep up with our growing needs for capacity, this could have an adverse effect on our business and cause us to incur additional expense. In addition, any financial difficulties faced by our third-party data center’s operator or any of the service providers with whom we or they contract may have negative effects on our business, the nature and extent of which are difficult to predict. Any changes in service levels at our third-party data center or any errors, defects, disruptions or other performance problems with our applications could adversely affect our reputation and may damage our clients’ stored files or result in lengthy interruptions in our services. Interruptions in our services might reduce our revenues, subject us to potential liability or other expenses or adversely affect our renewal rates.
In addition, while we own, control and have access to our servers and all of the components of our network that are located in our backup data center, we do not control the operation of this facility. The operator of our Wisconsin data center facility has no obligation to renew its agreement with us on commercially reasonable terms, or at all. If we are unable to renew this agreement on commercially reasonable terms, or if the data center operator is acquired, we may be required to transfer our servers and other infrastructure to a new data center facility, and we may incur costs and experience service interruption in doing so.
Our software might not operate properly, which could damage our reputation, give rise to claims against us, or divert application of our resources from other purposes, any of which could harm our business and operating results.
Our payroll and HCM software is complex and may contain or develop undetected defects or errors, particularly when first introduced or as new versions are released. Despite extensive testing, from time to time we have discovered defects or errors in our products. In addition, because changes in employer and legal requirements and practices relating to benefits are frequent, we discover defects and errors in our software and service processes in the normal course of business compared against these requirements and practices. Material performance problems or defects in our products and services might arise in the future, which could have an adverse impact on our business and client relationship and subject us to claims.
Moreover, software development is time-consuming, expensive and complex. Unforeseen difficulties can arise. We might encounter technical obstacles, and it is possible that we discover problems that prevent our products from operating properly. If they do not function reliably or fail to achieve client expectations in terms of performance, clients could cancel their agreements with us and/or assert liability claims against us. This could damage our reputation, impair our ability to attract or maintain clients and harm our results of operations.
Defects and errors and any failure by us to identify and address them could result in delays in product introductions and updates, loss of revenue or market share, liability to clients or others, failure to achieve market acceptance or expansion, diversion of development and other resources, injury to our reputation, and increased service and maintenance costs. Defects or errors in our product or service processes might discourage existing or potential clients from purchasing from us. Correction of defects or errors could prove to be impossible or impracticable. The costs incurred in correcting any defects or errors or in responding to resulting claims or liability might be substantial and could adversely affect our operating results.
Because of the large amount of data that we collect and manage, it is possible that hardware failures or errors in our systems could result in data loss or corruption, or cause the information that we collect to be incomplete or contain inaccuracies that our clients, their employees and taxing and other regulatory authorities regard as significant. The costs incurred in correcting any errors or in responding to regulatory authorities or to resulting claims or liability might be substantial and could adversely affect our operating results.
We maintain insurance, but our insurance may be inadequate or may not be available in the future on acceptable terms, or at all. In addition, our policy may not cover all claims made against us and defending a suit, regardless of its merit, could be costly and divert management’s attention.
Our clients might assert claims against us in the future alleging that they suffered damages due to a defect, error, or other failure of our product or service processes. A product liability claim and errors or omissions claim could subject us to significant legal defense costs and adverse publicity regardless of the merits or eventual outcome of such a claim.
Client funds that we hold are subject to market, interest rate, credit and liquidity risks. The loss of these funds could have an adverse impact on our business.
We invest funds held for our clients in liquid, investment-grade marketable securities, money market securities, and other cash equivalents. Nevertheless, our client fund assets are subject to general market, interest rate, credit, and liquidity risks. These risks may be exacerbated, individually or in unison, during periods of unusual financial market volatility. Any loss of or inability to access client funds could have an adverse impact on our cash position and results of operations and could require us to obtain additional sources of liquidity.
In addition, these funds are held in consolidated trust accounts, and as a result the aggregate amounts in the accounts exceed the applicable federal deposit insurance limits. We believe that since such funds are deposited in trust on behalf of our clients, the Federal Deposit Insurance Corporation, or the FDIC, would treat those funds as if they had been deposited by each of the clients themselves and insure each client’s funds up to the applicable deposit insurance limits. If the FDIC were to take the position that it is not obligated to provide deposit insurance for our clients’ funds or if the reimbursement of these funds were delayed, our business and our clients could be materially harmed.
If we are required to collect sales and use taxes in additional jurisdictions, we might be subject to liability for past sales and our future sales may decrease. Adverse tax laws or regulations could be enacted or existing laws could be applied to us or our clients, which could increase the costs of our services and adversely impact our business.
The application of federal, state, and local tax laws to services provided electronically is evolving. New income, sales, use or other tax laws, statutes, rules, regulations or ordinances could be enacted at any time (possibly with retroactive effect), and could be applied solely or disproportionately to services provided over the Internet. These enactments could adversely affect our sales activity due to the inherent cost increase the taxes would represent and ultimately result in a negative impact on our operating results and cash flows.
In addition, existing tax laws, statutes, rules, regulations or ordinances could be interpreted, changed, modified or applied adversely to us (possibly with retroactive effect), which could require us or our clients to pay additional tax amounts, as well as require us or our clients to pay fines or penalties and interest for past amounts.
For example, we might lose sales or incur significant expenses if states successfully impose broader guidelines on state sales and use taxes. A successful assertion by one or more states requiring us to collect sales or other taxes on the licensing of our software or provision of our services could result in substantial tax liabilities for past transactions and otherwise harm our business. Each state has different rules and regulations governing sales and use taxes, and these rules and regulations are subject to varying interpretations that change over time. We review these rules and regulations periodically and, when we believe we are subject to sales and use taxes in a particular state, we may voluntarily engage state tax authorities in order to determine how to comply with that state’s rules and regulations. We cannot assure you that we will not be subject to sales and use taxes or related penalties for past sales in states where we currently believe no such taxes are required.
Vendors of services, like us, are typically held responsible by taxing authorities for the collection and payment of any applicable sales and similar taxes. If one or more taxing authorities determines that taxes should have, but have not, been paid with respect to our services, we might be liable for past taxes in addition to taxes going forward. Liability for past taxes might also include substantial interest and penalty charges. Our clients typically pay us for applicable sales and similar taxes. Nevertheless, our clients might be reluctant to pay back taxes and might refuse responsibility for interest or penalties associated with those taxes. If we are required to collect and pay back taxes and the associated interest and penalties, and if our clients fail or refuse to reimburse us for all
or a portion of these amounts, we will incur unplanned expenses that may be substantial. Moreover, imposition of such taxes on us going forward will effectively increase the cost of our software and services to our clients and might adversely affect our ability to retain existing clients or to gain new clients in the areas in which such taxes are imposed.
Any future litigation against us could be costly and time-consuming to defend.
We may become subject, from time to time, to legal proceedings and claims that arise in the ordinary course of business such as claims brought by our clients in connection with commercial disputes or employment claims made by our current or former employees. Litigation might result in substantial costs and may divert management’s attention and resources, which might seriously harm our business, overall financial condition, and operating results. Insurance might not cover such claims, might not provide sufficient payments to cover all the costs to resolve one or more such claims and might not continue to be available on terms acceptable to us. A claim brought against us that is uninsured or underinsured could result in unanticipated costs, thereby harming our operating results and leading analysts or potential investors to lower their expectations of our performance, which could reduce the trading price of our stock.
Any failure to protect our intellectual property rights could impair our ability to protect our proprietary technology and our brand.
Our success is dependent, in part, upon protecting our proprietary technology. We rely on a combination of copyrights, trademarks, service marks, trade secret laws and contractual restrictions to establish and protect our proprietary rights in our products and services. Our proprietary technologies are not covered by any patent or patent application. However, the steps we take to protect our intellectual property may be inadequate. We will not be able to protect our intellectual property if we are unable to enforce our rights or if we do not detect unauthorized use of our intellectual property. Despite our precautions, it may be possible for unauthorized third parties to copy our products and use information that we regard as proprietary to create products and services that compete with ours. Some license provisions protecting against unauthorized use, copying, transfer and disclosure of our products may be unenforceable under the laws of certain jurisdictions and foreign countries.
We enter into confidentiality and invention assignment agreements with our employees and consultants and enter into confidentiality agreements with the parties with whom we have strategic relationships and business alliances. No assurance can be given that these agreements will be effective in controlling access to and distribution of our products and proprietary information. The confidentiality agreements on which we rely to protect certain technologies may be breached and may not be adequate to protect our proprietary technologies. Further, these agreements do not prevent our competitors from independently developing technologies that are substantially equivalent or superior to our solutions. In addition, we depend, in part, on technology of third parties licensed to us for our solutions, and the loss or inability to maintain these licenses or errors in the software we license could result in increased costs, reduced service levels or delayed sales of our solutions.
In order to protect our intellectual property rights, we may be required to spend significant resources to monitor and protect these rights. Litigation may be necessary in the future to enforce our intellectual property rights and to protect our trade secrets. Litigation brought to protect and enforce our intellectual property rights could be costly, time consuming and distracting to management and could result in the impairment or loss of portions of our intellectual property. Furthermore, our efforts to enforce our intellectual property rights may be met with defenses, counterclaims and countersuits attacking the validity and enforceability of our intellectual property rights. Our inability to protect our proprietary technology against unauthorized copying or use, as well as any costly litigation or diversion of our management’s attention and resources, could delay further sales or the implementation of our solutions, impair the functionality of our solutions, delay introductions of new solutions, result in our substituting inferior or more costly technologies into our solutions, or injure our reputation. In addition, we may be required to license additional technology from third parties to develop and market new solutions, and we cannot assure you that we could license that technology on commercially reasonable terms, or at all. Although we do not expect that our inability to license this technology in the future would have a material adverse effect on our business or operating results, our inability to license this technology could adversely affect our ability to compete.
We may be sued by third parties for alleged infringement of their proprietary rights.
There is considerable patent and other intellectual property development activity in our industry. Our success depends, in part, upon our not infringing upon the intellectual property rights of others. Our competitors, as well as a number of other entities and individuals, may own or claim to own intellectual property relating to our industry. From time to time, third parties may claim that we are infringing upon their intellectual property rights, and we may be found to be infringing upon such rights. In the future, others may claim that our applications and underlying technology infringe or violate their intellectual property rights. However, we may be unaware of the intellectual property rights that others may claim cover some or all of our technology or services. Any claims or litigation could cause us to incur significant expenses and, if successfully asserted against us, could require that we pay substantial damages or ongoing royalty payments, prevent us from offering our services, or require that we comply with other unfavorable terms. We may also be obligated to indemnify our clients or business partners or pay substantial settlement costs, including royalty
payments, in connection with any such claim or litigation and to obtain licenses, modify applications, or refund fees, which could be costly. Even if we were to prevail in such a dispute, any litigation regarding our intellectual property could be costly and time-consuming and divert the attention of our management and key personnel from our business operations.
The use of open source software in our products and solutions may expose us to additional risks and harm our intellectual property rights.
Some of our products and solutions use or incorporate software that is subject to one or more open source licenses. Open source software is typically freely accessible, usable and modifiable. Certain open source software licenses require a user who intends to distribute the open source software as a component of the user’s software to disclose publicly part or all of the source code to the user’s software. In addition, certain open source software licenses require the user of such software to make any derivative works of the open source code available to others on potentially unfavorable terms or at no cost.
The terms of many open source licenses to which we are subject have not been interpreted by U.S. or foreign courts. Accordingly, there is a risk that those licenses could be construed in a manner that imposes unanticipated conditions or restrictions on our ability to commercialize our solutions. In that event, we could be required to seek licenses from third parties in order to continue offering our products or solutions, to re-develop our products or solutions, to discontinue sales of our products or solutions, or to release our proprietary software code under the terms of an open source license, any of which could harm our business. Further, given the nature of open source software, it may be more likely that third parties might assert copyright and other intellectual property infringement claims against us based on our use of these open source software programs.
While we monitor the use of all open source software in our products, solutions, processes and technology and try to ensure that no open source software is used in such a way as to require us to disclose the source code to the related product or solution when we do not wish to do so, it is possible that such use may have inadvertently occurred in deploying our proprietary solutions. In addition, if a third-party software provider has incorporated certain types of open source software into software we license from such third party for our products and solutions without our knowledge, we could, under certain circumstances, be required to disclose the source code to our products and solutions. This could harm our intellectual property position and our business, results of operations and financial condition.
If third-party software used in our products is not adequately maintained or updated, our business could be materially adversely affected.
Our products utilize certain software of third-party software developers. For example, we license technology from bswift as part of our Paylocity Web Benefits solution. Although we believe that there are alternatives for these products, any significant interruption in the availability of such third-party software could have an adverse impact on our business unless and until we can replace the functionality provided by these products at a similar cost. Additionally, we rely, to a certain extent, upon such third parties’ abilities to enhance their current products, to develop new products on a timely and cost-effective basis and to respond to emerging industry standards and other technological changes. We may be unable to replace the functionality provided by the third-party software currently offered in conjunction with our products in the event that such software becomes obsolete or incompatible with future versions of our products or is otherwise not adequately maintained or updated.
Changes in laws and regulations related to the Internet or changes in the Internet infrastructure itself may diminish the demand for our applications, and could have a negative impact on our business.
The future success of our business depends upon the continued use of the Internet as a primary medium for commerce, communication and business applications. Federal, state or foreign government bodies or agencies have in the past adopted, and may in the future adopt, laws or regulations affecting the use of the Internet as a commercial medium. Changes in these laws or regulations could require us to modify our applications in order to comply with these changes. In addition, government agencies or private organizations may begin to impose taxes, fees or other charges for accessing the Internet or commerce conducted via the Internet. These laws or charges could limit the growth of Internet-related commerce or communications generally, resulting in reductions in the demand for Internet-based applications such as ours.
In addition, the use of the Internet as a business tool could be adversely affected due to delays in the development or adoption of new standards and protocols to handle increased demands of Internet activity, security, reliability, cost, ease of use, accessibility, and quality of service. The performance of the Internet and its acceptance as a business tool has been adversely affected by “viruses,” “worms” and similar malicious programs, and the Internet has experienced a variety of outages and other delays as a result of damage to portions of its infrastructure. If the use of the Internet is adversely affected by these issues, demand for our applications could suffer.
Furthermore, the availability or performance of our applications could be adversely affected by a number of factors, including clients’ inability to access the Internet, the failure of our network or software systems, security breaches or variability in user traffic for our services. For example, our clients access our solutions through their Internet service providers. If a service provider fails to provide sufficient capacity to support our applications or otherwise experiences service outages, such failure could interrupt our clients’ access to our solutions, adversely affect their perception of our applications’ reliability and reduce our revenues. In addition to potential liability, if we experience interruptions in the availability of our applications, our reputation could be adversely affected and we could lose clients.
Regulatory requirements placed on our software and services could impose increased costs on us, delay or prevent our introduction of new products and services, and impair the function or value of our existing products and services.
Our products and services may become subject to increasing regulatory requirements, and as these requirements proliferate, we may be required to change or adapt our products and services to comply. Changing regulatory requirements might render our products and services obsolete or might block us from developing new products and services. This might in turn impose additional costs upon us to comply or to further develop our products and services. It might also make introduction of new products and services more costly or more time-consuming than we currently anticipate. It might even prevent introduction by us of new products or services or cause the continuation of our existing products or services to become more costly.
We might require additional capital to support business growth, and this capital might not be available.
We intend to continue to make investments to support our business growth and might require additional funds to respond to business challenges or opportunities, including the need to develop new products and services or enhance our existing services, enhance our operating infrastructure, and acquire complementary businesses and technologies. Accordingly, we might need to engage in equity or debt financings to secure additional funds. In addition, we will need to expand our ACH capacity as we grow our business. If we raise additional funds through further issuances of equity or convertible debt securities, our existing stockholders could suffer significant dilution, and any new equity securities we issue could have rights, preferences and privileges superior to those of holders of our common stock. Any debt financing or ACH facility secured by us in the future could involve restrictive covenants relating to our capital-raising activities and other financial and operational matters, which might make it more difficult for us to obtain additional capital and to pursue business opportunities and to grow our business. In addition, we might not be able to obtain additional financing on terms favorable to us, if at all. If we are unable to obtain adequate financing or financing on terms satisfactory to us when we require it, our ability to continue to support our business growth and to respond to business challenges could be significantly limited.
Our services present the potential for embezzlement, identity theft, or other similar illegal behavior by our associates with respect to third parties.
Certain services offered by us involve collecting payroll information from individuals, and this frequently includes information about their checking accounts. Our services also involve the use and disclosure of personal and business information that could be used to impersonate third parties, commit identity theft, or otherwise gain access to their data or funds. If any of our associates take, convert, or misuse such funds, documents or data, we could be liable for damages, and our business reputation could be damaged or destroyed. Moreover, if we fail to adequately prevent third parties from accessing personal and/or business information and using that information to commit identity theft, we might face legal liabilities and other losses than can have a negative impact on our business.
We rely on a third-party shipping provider to deliver printed checks to our clients, and therefore our business could be negatively impacted by disruptions in the operations of this third-party provider.
We rely on third-party couriers such as the United Parcel Service, or UPS, to ship printed checks to our clients. Relying on UPS and other third-party couriers puts us at risk from disruptions in their operations, such as employee strikes, inclement weather and their ability to perform tasks on our behalf. If UPS or other third-party couriers fail to perform their tasks, we could incur liability or suffer damages to our reputation, or both. If we are forced to use other third-party couriers, our costs could increase and we may not be able to meet shipment deadlines. Moreover, we may not be able to obtain terms as favorable as those we currently use, which could further increase our costs. These circumstances may negatively impact our business, financial condition and results of operations.
Our reported financial results may be adversely affected by changes in accounting principles generally accepted in the United States.
Generally accepted accounting principles in the United States are subject to interpretation by the Financial Accounting Standards Board, or FASB, the Securities and Exchange Commission, and various bodies formed to promulgate and interpret appropriate accounting principles. A change in these principles or interpretations could have a significant effect on our reported financial results, and could affect the reporting of transactions completed before the announcement of a change.
We may acquire other companies or technologies, which could divert our management’s attention, result in additional dilution to our stockholders and otherwise disrupt our operations and adversely affect our operating results.
We may in the future seek to acquire or invest in other businesses or technologies. The pursuit of potential acquisitions or investments may divert the attention of management and cause us to incur various expenses in identifying, investigating and pursuing suitable acquisitions, whether or not they are consummated.
In addition, we have limited experience in acquiring other businesses. If we acquire additional businesses, we may not be able to integrate the acquired personnel, operations and technologies successfully, or effectively manage the combined business following the acquisition. We also may not achieve the anticipated benefits from the acquired business due to a number of factors, including:
· Inability to integrate or benefit from acquired technologies or services in a profitable manner;
· Unanticipated costs or liabilities associated with the acquisition;
· Incurrence of acquisition-related costs;
· Difficulty integrating the accounting systems, operations and personnel of the acquired business;
· Difficulties and additional expenses associated with supporting legacy products and hosting infrastructure of the acquired business;
· Difficulty converting the clients of the acquired business onto our applications and contract terms, including disparities in the revenues, licensing, support or professional services model of the acquired company;
· Diversion of management’s attention from other business concerns;
· Adverse effects to our existing business relationships with business partners and clients as a result of the acquisition;
· The potential loss of key employees;
· Use of resources that are needed in other parts of our business; and
· Use of substantial portions of our available cash to consummate the acquisition.
In addition, a significant portion of the purchase price of companies we acquire may be allocated to acquired goodwill and other intangible assets, which must be assessed for impairment at least annually. In the future, if our acquisitions do not yield expected returns, we may be required to take charges to our operating results based on this impairment assessment process, which could adversely affect our results of operations.
Acquisitions could also result in dilutive issuances of equity securities or the incurrence of debt, which could adversely affect our operating results. In addition, if an acquired business fails to meet our expectations, our operating results, business and financial position may suffer.
Risks Related to Ownership of Our Common Stock
Insiders have substantial control over us, which may limit our stockholders’ ability to influence corporate matters and delay or prevent a third party from acquiring control over us.
As of August 15th, our directors, executive officers and holders of more than 5% of our common stock, together with their respective affiliates, beneficially owned, in the aggregate, approximately 79.0% of our outstanding common stock. This significant concentration of ownership may adversely affect the trading price for our common stock because investors often perceive disadvantages in owning stock in companies with controlling stockholders. In addition, these stockholders will be able to exercise influence over all matters requiring stockholder approval, including the election of directors and approval of corporate transactions, such as a merger or other sale of our company or its assets. This concentration of ownership could limit the ability of our other stockholders to influence corporate matters and may have the effect of delaying or preventing a change in control, including a merger, consolidation, or other business combination involving us, or discouraging a potential acquirer from making a tender offer or otherwise attempting to obtain control, even if that change in control would benefit our other stockholders.
Our stock price may be subject to wide fluctuations.
The trading price of our common stock could be subject to wide fluctuations in response to various factors, some of which are beyond our control. These factors include those discussed in this “Risk Factors” section of this Annual Report on Form 10-K and others such as:
· Our operating performance and the operating performance of similar companies;
· Announcements by us or our competitors of acquisitions, business plans or commercial relationships;
· Any major change in our board of directors or senior management;
· Publication of research reports or news stories about us, our competitors, or our industry, or positive or negative recommendations or withdrawal of research coverage by securities analysts;
· The public’s reaction to our press releases, our other public announcements and our filings with the SEC;
· Sales of our common stock by our directors and executive officers;
· Adverse market reaction to any indebtedness we may incur or securities we may issue in the future;
· Short sales, hedging and other derivative transactions in our common stock;
· The market’s reaction to our reduced disclosure as a result of being an emerging growth company under the JOBS Act;
· Threatened or actual litigation; and
· Other events or factors, including changes in general conditions in the United States and global economies or financial markets (including those resulting from ongoing budget negotiations and intermittent government shutdowns in the United States, acts of God, war, incidents of terrorism, or responses to such events).
In addition, the stock market in general and the market for Internet-related companies in particular, have experienced extreme price and volume fluctuations that have often been unrelated or disproportionate to the operating performance of those companies. Securities class action litigation has often been instituted against companies following periods of volatility in the overall market and in the market price of a company’s securities. This litigation, if instituted against us, could result in substantial costs, divert our management’s attention and resources, and harm our business, operating results, and financial condition.
We do not currently intend to pay dividends on our common stock and, consequently, your ability to achieve a return on your investment will depend on appreciation in the price of our common stock.
We have only declared or paid cash dividends on our common stock once since 2008 and do not currently intend to do so for the foreseeable future. We currently intend to invest our future earnings, if any, to fund our growth. Therefore, you are not likely to receive any dividends on your common stock for the foreseeable future, and the success of an investment in shares of our common stock will depend upon future appreciation in its value, if any. There is no guarantee that shares of our common stock will appreciate in value or even maintain the price at which our stockholders purchased their shares.
Future sales of shares of our common stock by existing stockholders could depress the market price of our common stock.
As of August 15, 2014, we had an aggregate of 49,563,736 outstanding shares of common stock. The shares sold in our IPO were immediately tradable without restriction. The remaining 41,455,742 shares, or approximately 83.6% of our outstanding shares are currently restricted as a result of lock-up agreements. These shares will be available for sale into the public market on September 15, 2014, subject to certain exceptions and also to potential extensions under certain circumstances, and will be subject to volume and other sale restrictions. The representatives of the underwriters may, in their sole discretion and at any time without notice, release all or any portion of the securities subject to lock-up agreements.
Also, in the future, we may issue additional securities in connection with investments and acquisitions. The amount of our common stock issued in connection with an investment or acquisition could constitute a material portion of our then outstanding stock. Due to these factors, sales of a substantial number of shares of our common stock in the public market could occur at any time. These
sales, or the perception in the market that the holders of a large number of shares intend to sell shares, could reduce the market price of our common stock.
If we are unable to implement and maintain effective internal controls over financial reporting in the future, investors may lose confidence in the accuracy and completeness of our financial reports and the market price of our common stock may be negatively affected.
As a public company, we are required to maintain internal controls over financial reporting and to report any material weaknesses in such internal controls. Section 404 of the Sarbanes-Oxley Act of 2002, or the Sarbanes-Oxley Act, requires that we evaluate and determine the effectiveness of our internal controls over financial reporting and, beginning with our annual report for the fiscal year ending June 30, 2015, provide a management report on the internal controls over financial reporting, which must be attested to by our independent registered public accounting firm to the extent we are no longer an “emerging growth company,” as defined by the Jumpstart Our Business Startups Act of 2012, or the JOBS Act. If we have a material weakness in our internal controls over financial reporting, we may not detect errors on a timely basis and our financial statements may be materially misstated. We are in the process of designing and implementing the internal controls over financial reporting required to comply with this obligation, which process will be time consuming, costly and complicated. If we identify material weaknesses in our internal controls over financial reporting, if we are unable to comply with the requirements of Section 404 in a timely manner, if we are unable to assert that our internal controls over financial reporting are effective, or if our independent registered public accounting firm is unable to express an opinion as to the effectiveness of our internal controls over financial reporting, investors may lose confidence in the accuracy and completeness of our financial reports and the market price of our common stock could be negatively affected, and we could become subject to investigations by the stock exchange on which our securities are listed, the SEC or other regulatory authorities, which could require additional financial and management resources.
We have incurred and will continue to incur significantly increased costs and devote substantial management time as a result of operating as a public company.
As a public company, we have incurred and will continue to incur significant legal, accounting and other expenses that we did not incur as a private company. For example, we are now subject to the reporting requirements of the Securities Exchange Act of 1934, as amended, or the Exchange Act, and will be required to comply with the applicable requirements of the Sarbanes-Oxley Act and the Dodd-Frank Wall Street Reform and Consumer Protection Act, as well as rules and regulations subsequently implemented by the SEC and the NASDAQ Global Select Market including the establishment and maintenance of effective disclosure and financial controls and changes in corporate governance practices. We expect that compliance with these requirements will increase our legal and financial compliance costs and will make some activities more time consuming and costly. In addition, we expect that our management and other personnel will need to divert attention from operational and other business matters to devote substantial time to these public company requirements. In particular, we expect to incur significant expenses and devote substantial management effort toward ensuring compliance with the requirements of Section 404 of the Sarbanes-Oxley Act, which will increase when we are no longer an emerging growth company, as defined by the JOBS Act. We will need to hire additional accounting and financial staff with appropriate public company experience and technical accounting knowledge and may need to establish an internal audit function. We cannot predict or estimate the amount of additional costs we may incur as a result of becoming a public company or the timing of such costs.
If securities or industry analysts do not continue to publish research or publish unfavorable or misleading research about our business, our stock price and trading volume could decline.
The trading market for our common stock depends in part on the research and reports that securities or industry analysts publish about us or our business. If one or more of the analysts who covers us downgrades our stock or publishes unfavorable or misleading research about our business, our stock price would likely decline. If one or more of these analysts ceases coverage of our company or fails to publish reports on us regularly, we could lose visibility in the market for our stock and demand for our stock could decrease, which could cause our stock price or trading volume to decline.
Anti-takeover provisions in our charter documents and Delaware law could discourage, delay, or prevent a change in control of our company and may affect the trading price of our common stock.
We are a Delaware corporation and the anti-takeover provisions of the Delaware General Corporation Law, which apply to us, may discourage, delay or prevent a change in control by prohibiting us from engaging in a business combination with an interested stockholder for a period of three years after the stockholder becomes an interested stockholder, even if a change in control would be beneficial to our existing stockholders. In addition, our restated certificate of incorporation and amended and restated bylaws may discourage, delay or prevent a change in our management or control over us that stockholders may consider favorable. Our amended and restated certificate of incorporation and bylaws:
· Authorize the issuance of “blank check” convertible preferred stock that could be issued by our board of directors to thwart a takeover attempt;
· Establish a classified board of directors, as a result of which the successors to the directors whose terms have expired will be elected to serve from the time of election and qualification until the third annual meeting following their election;
· Require that directors only be removed from office for cause and only upon a supermajority stockholder vote;
· Provide that vacancies on the board of directors, including newly-created directorships, may be filled only by a majority vote of directors then in office rather than by stockholders;
· Prevent stockholders from calling special meetings; and
· Prohibit stockholder action by written consent, requiring all actions to be taken at a meeting of the stockholders.
We are an emerging growth company and we cannot be certain if the reduced disclosure requirements applicable to emerging growth companies will make our common stock less attractive to investors.
We are an emerging growth company. Under the JOBS Act, emerging growth companies can delay adopting new or revised accounting standards until such time as those standards apply to private companies.
For as long as we continue to be an emerging growth company, we intend to take advantage of certain other exemptions from various reporting requirements that are applicable to other public companies including, but not limited to, reduced disclosure obligations regarding executive compensation in our periodic reports and proxy statements, exemptions from the requirements of holding a nonbinding advisory vote on executive compensation and stockholder approval of any golden parachute payments not previously approved, and exemptions from the requirements of auditor attestation reports on the effectiveness of our internal control over financial reporting. We cannot predict if investors will find our common stock less attractive because we will rely on these exemptions. If some investors find our common stock less attractive as a result, there may be a less active trading market for our common stock and our stock price may be more volatile.
Although we are eligible under the JOBS Act to delay adoption of new or revised financial accounting standards until they are applicable to private companies, we have elected not to avail ourselves of this exclusion. This election by us is irrevocable.
We will remain an emerging growth company until the earliest of (i) the end of the fiscal year in which the market value of our common stock that is held by non-affiliates exceeds $700 million as of December 31 of that fiscal year, (ii) the end of the fiscal year in which we have total annual gross revenue of $1 billion or more during such fiscal year, (iii) the date on which we issue more than $1 billion in non-convertible debt in a three-year period or (iv) five years from March 19, 2014.
Item 1B. Unresolved Staff Comments.
None.
As of June 30, 2014, our corporate headquarters occupied approximately 117,000 square feet in Arlington Heights, Illinois under a lease expiring in August 2020. As of June 30, 2014, we also leased facilities in New York, New York, Lake Mary, Florida and Oakland, California.
For additional information regarding obligations under operating leases, see Note 10 of the Notes to Consolidated Financial Statements included in Part II, Item 8: “Financial Statements and Supplementary Data” of this Annual Report on Form 10-K.
From time to time, we may become involved in litigation related to claims arising from the ordinary course of our business. We believe that there are no claims or actions pending or threatened against us, the ultimate disposition of which would have a material adverse effect on us.
Item 4. Mine Safety Disclosures.
Not applicable.
Item 5. Market for Registrant’s Common Equity, Related Stockholder Matters and Issuer Purchases of Equity Securities
Market Information
Our common stock has been listed on the NASDAQ Global Select Market under the symbol “PCTY” since March 19, 2014. Prior to that date, there was no public trading market for our common stock. Our common stock priced at $17.00 per share in our initial public offering on March 18, 2014. The following table sets forth for the periods indicated the high and low intra-day sale prices per share of our common stock as reported on the NASDAQ Global Select Market:
|
|
|
|
|
| ||
|
Year ended June 30, 2014 |
|
High |
|
Low | ||
|
|
|
|
|
|
|
|
|
Third Quarter (from March 19, 2014) |
|
$ |
31.00 |
|
$ |
22.11 |
|
Fourth Quarter |
|
$ |
25.07 |
|
$ |
15.24 |
On August 15, 2014, the last reported sale price of our common stock on the NASDAQ Global Select Market was $24.34 per share, and there were 17 holders of record of our common stock. The actual number of holders of common stock is greater than these numbers of record holders and includes stockholders who are beneficial owners, but whose shares are held in street name by brokers and nominees. The number of holders of record also does not include stockholders whose shares may be held in trust by other entities.
Use of Proceeds from Initial Public Offering of Common Stock
On March 24, 2014, we completed our initial public offering, or IPO, of 8,101,750 shares of common stock, at a price of $17.00 per share, before underwriting discounts and commissions. We sold 5,366,667 of such shares and existing stockholders sold an aggregate of 2,735,083 of such shares, including 366,667 shares sold by us and 690,083 shares sold by selling stockholders as a result of the underwriters’ exercise of their over-allotment option to purchase additional shares. The offer and sale of all of the shares in the IPO were registered under the Securities Act pursuant to a registration statement on Form S-1 (File No. 333-193661), which was declared effective by the SEC on March 18, 2014. Following the sale of the shares in connection with the closing of our IPO, the offering terminated. Deutsche Bank Securities Inc., Merrill Lynch, Pierce, Fenner & Smith Incorporated, William Blair & Company, L.L.C., JMP Securities LLC, Raymond James & Associates, Inc. and Needham & Company, LLC acted as the underwriters. The IPO generated net proceeds to us of $81.9 million, after deducting underwriting discounts. Expenses incurred by us for the IPO were $2.9 million and were recorded against the proceeds received from the IPO. We did not receive any proceeds from the sale of shares by the selling stockholders in the IPO.
Of the expenses incurred by us in connection with our IPO, $75,000 were paid to the underwriters for private air travel.
With the proceeds of the IPO, we repaid amounts outstanding under a note issued by us to Commerce Bank & Trust Company on March 9, 2011, which totaled $1.1 million; paid the $6.5 million required at closing on May 23, 2014 on the purchase of certain assets of BFKMS Inc.; and paid $2.3 million upon finalization on July 21, 2014 of the purchase price on the purchase of certain assets of BFKMS Inc.
There have been no material changes in the planned use of proceeds from our IPO from that described in the final prospectus filed with the SEC pursuant to Rule 424(b) on March 19, 2014.
Dividend Policy
We declared and paid a one-time, special cash dividend on our common stock in the aggregate amount of $3,500,000 in May 2008. Neither Delaware law nor our amended and restated certificate of incorporation requires our board of directors to declare dividends on our common stock. Any future determination to declare cash dividends on our common stock will be made at the discretion of our board of directors and will depend on our financial condition, results of operations, capital requirements, general business conditions and other factors that our board of directors may deem relevant. We do not anticipate paying cash dividends on our common stock for the foreseeable future.
Equity Compensation Plan Information
Information regarding the securities authorized for issuance under our equity compensation plans will be included in our Proxy Statement relating to our 2014 annual meeting of stockholders to be filed with the SEC within 120 days after the end of our fiscal year ended June 30, 2014, and is incorporated herein by reference.
Performance Graph
Notwithstanding any statement to the contrary in any of our filings with the SEC, the following information shall not be deemed “filed” with the SEC or “soliciting material” under the Securities Exchange Act of 1934 and shall not be incorporated by reference into any such filings irrespective of any general incorporation language contained in such filing.
The following graph compares the total cumulative stockholder return on our common stock with the total cumulative return of the S&P 500 Index and the S&P 1500 Application Software Index during the period commencing on March 19, 2014, the initial trading day of our common stock, and ending on June 30, 2014. The graph assumes that $100 was invested at the beginning of the period in our common stock and in each of the comparative indices, and the reinvestment of any dividends. Historical stock price performance should not be relied upon as an indication of future stock price performance.
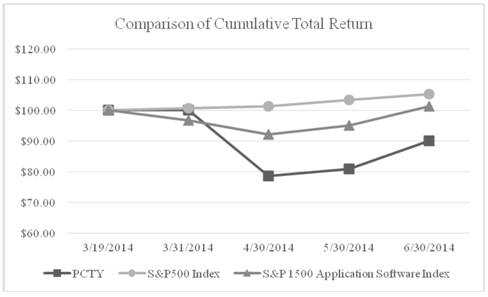
|
|
|
Base |
|
|
|
|
|
|
|
|
|
|
|
Period |
|
|
|
|
|
|
|
|
|
|
|
3/19/2014 |
|
3/31/2014 |
|
4/30/2014 |
|
5/30/2014 |
|
6/30/2014 |
|
|
|
|
|
|
|
|
|
|
|
|
|
Company/Index |
|
|
|
|
|
|
|
|
|
|
|
Paylocity Holding Corporation |
|
$100 |
|
$100.04 |
|
$78.66 |
|
$80.99 |
|
$89.98 |
|
S&P 500 Index |
|
$100 |
|
$100.62 |
|
$101.25 |
|
$103.37 |
|
$105.35 |
|
S&P 1500 Application Software Index |
|
$100 |
|
$96.71 |
|
$92.25 |
|
$95.16 |
|
$101.23 |
Item 6. Selected Financial Data.
Consolidated Selected Financial Data
You should read the following selected consolidated financial data together with our consolidated financial statements and related notes included elsewhere in this Annual Report on Form 10-K and the information under the section titled “Management’s Discussion and Analysis of Financial Condition and Results of Operations.” Our fiscal year ends on June 30. The statements of operations data presented below for each of the three fiscal years ended June 30, 2012, 2013, and 2014 and the balance sheet data as of June 30, 2013 and 2014 has been derived from our audited consolidated financial statements. Historical results are not necessarily indicative of future results.
|
|
|
Year Ended June 30, | ||||||
|
|
|
2011 |
|
2012 |
|
2013 |
|
2014 |
|
|
|
(in thousands, except per share data) | ||||||
|
Consolidated Statements of Operations Data: |
|
|
|
|
|
|
|
|
|
Revenues: |
|
|
|
|
|
|
|
|
|
Recurring fees |
|
$36,443 |
|
$51,211 |
|
$71,309 |
|
$100,362 |
|
Interest income on funds held for clients |
|
1,100 |
|
1,263 |
|
1,459 |
|
1,582 |
|
Total recurring revenues |
|
37,543 |
|
52,474 |
|
72,768 |
|
101,944 |
|
Implementation services and other |
|
1,941 |
|
2,622 |
|
4,526 |
|
6,743 |
|
Total revenues |
|
39,484 |
|
55,096 |
|
77,294 |
|
108,687 |
|
Cost of revenues: |
|
|
|
|
|
|
|
|
|
Recurring revenues |
|
16,329 |
|
22,054 |
|
28,863 |
|
37,319 |
|
Implementation services and other |
|
5,416 |
|
7,040 |
|
10,803 |
|
17,775 |
|
Total cost of revenues |
|
21,745 |
|
29,094 |
|
39,666 |
|
55,094 |
|
Gross profit |
|
17,739 |
|
26,002 |
|
37,628 |
|
53,593 |
|
Operating expenses: |
|
|
|
|
|
|
|
|
|
Sales and marketing |
|
9,293 |
|
12,828 |
|
18,693 |
|
28,276 |
|
Research and development |
|
1,565 |
|
1,788 |
|
6,825 |
|
10,355 |
|
General and administrative |
|
6,868 |
|
8,618 |
|
12,079 |
|
21,980 |
|
Total operating expenses |
|
17,726 |
|
23,234 |
|
37,597 |
|
60,611 |
|
Operating income (loss) |
|
13 |
|
2,768 |
|
31 |
|
(7,018) |
|
Other income (expense) |
|
(179) |
|
(196) |
|
(16) |
|
163 |
|
Income (loss) before income taxes |
|
(166) |
|
2,572 |
|
15 |
|
(6,855) |
|
Income tax (benefit) expense |
|
(36) |
|
884 |
|
(602) |
|
255 |
|
Net income (loss) |
|
$(130) |
|
$1,688 |
|
$617 |
|
$(7,110) |
|
Net income (loss) attributable to common stockholders |
|
$(774) |
|
$998 |
|
$(2,291) |
|
$(9,392) |
|
Net income (loss) per share attributable to common stockholders: |
|
|
|
|
|
|
|
|
|
Basic |
|
$(0.02) |
|
$0.02 |
|
$(0.07) |
|
$(0.26) |
|
Diluted |
|
$(0.02) |
|
$0.02 |
|
$(0.07) |
|
$(0.26) |
|
Weighted average shares used in computing net income (loss) per share attributable to common stockholders: |
|
|
|
|
|
|
|
|
|
Basic |
|
37,539 |
|
43,873 |
|
31,988 |
|
36,707 |
|
Diluted |
|
37,539 |
|
44,317 |
|
31,988 |
|
36,707 |
|
Other Financial Data: |
|
|
|
|
|
|
|
|
|
Adjusted Gross Profit(1) |
|
$19,962 |
|
$28,729 |
|
$40,695 |
|
$57,029 |
|
Adjusted Recurring Gross Profit(1) |
|
$23,437 |
|
$33,147 |
|
$46,972 |
|
$67,458 |
|
Adjusted EBITDA(1) |
|
$4,028 |
|
$7,660 |
|
$6,301 |
|
$5,448 |
|
|
|
As of June 30, | ||||||
|
|
|
2011 |
|
2012 |
|
2013 |
|
2014 |
|
|
|
(in thousands) | ||||||
|
Consolidated Balance Sheet Data: |
|
|
|
|
|
|
|
|
|
Cash and cash equivalents |
|
$7,990 |
|
$9,031 |
|
$7,594 |
|
$78,848 |
|
Working capital(2) |
|
4,488 |
|
2,786 |
|
2,305 |
|
67,137 |
|
Funds held for clients |
|
298,979 |
|
263,255 |
|
355,905 |
|
417,261 |
|
Total assets |
|
316,492 |
|
284,943 |
|
377,916 |
|
528,151 |
|
Debt, current portion |
|
312 |
|
1,625 |
|
625 |
|
— |
|
Client fund obligations |
|
298,979 |
|
263,255 |
|
355,905 |
|
417,261 |
|
Long-term debt, net of current portion |
|
3,188 |
|
1,563 |
|
938 |
|
— |
|
Redeemable convertible preferred stock |
|
9,339 |
|
36,573 |
|
36,573 |
|
— |
|
Stockholders’ equity (deficit) |
|
(2,254) |
|
(27,646) |
|
(26,592) |
|
91,134 |
(1) We use Adjusted Gross Profit, Adjusted Recurring Gross Profit, and Adjusted EBITDA to evaluate our operating results. We prepare Adjusted Gross Profit, Adjusted Recurring Gross Profit and Adjusted EBITDA to eliminate the impact of items we do not consider indicative of our ongoing operating performance. However, Adjusted Gross Profit, Adjusted Recurring Gross Profit and Adjusted EBITDA are not measurements of financial performance under generally accepted accounting principles in the United States, or GAAP, and these metrics may not be comparable to similarly-titled measures of other companies.
We define Adjusted Gross Profit as gross profit before amortization of capitalized internal-use software, stock-based compensation expenses and one-time founder funded bonus pay-outs, if any. We define Adjusted Recurring Gross Profit as total recurring revenues after cost of recurring revenues and before amortization of capitalized internal-use software, stock-based compensation expenses and one-time founder funded bonus pay-outs, if any. We define Adjusted EBITDA as net income (loss) before interest expense (income), income tax expense (benefit), depreciation and amortization, stock-based compensation expenses and one-time founder funded bonus pay-outs.
We disclose Adjusted Gross Profit, Adjusted Recurring Gross Profit and Adjusted EBITDA, which are non-GAAP measures, because we believe these metrics assist investors and analysts in comparing our performance across reporting periods on a consistent basis by excluding items that we do not believe are indicative of our core operating performance. We believe these metrics are commonly used in the financial community to aid in comparisons of similar companies, and we present them to enhance investors’ understanding of our operating performance and cash flows.
Adjusted Gross Profit, Adjusted Recurring Gross Profit and Adjusted EBITDA have limitations as analytical tools. Some of these limitations are:
· Adjusted EBITDA does not reflect our cash expenditures, or future requirements, for capital expenditures;
· Adjusted EBITDA does not reflect changes in, or cash requirements for, our working capital needs;
· Adjusted EBITDA does not reflect our income tax expense or the cash requirement to pay our taxes;
· Although depreciation and amortization are non-cash charges, the assets being depreciated and amortized may have to be replaced in the future, and Adjusted EBITDA does not reflect any cash requirements for such replacements; and
· Other companies in our industry may calculate Adjusted Gross Profit, Adjusted Recurring Gross Profit and Adjusted EBITDA differently than we do, limiting their usefulness as a comparative measure.
Additionally, stock-based compensation will be an element of our overall compensation strategy, although we exclude it from Adjusted Gross Profit, Adjusted Recurring Gross Profit and Adjusted EBITDA as an expense when evaluating our ongoing operating performance for a particular period.
Because of these limitations, you should not consider Adjusted Gross Profit as an alternative to gross profit, Adjusted Recurring Gross Profit as an alternative to total recurring revenues, or Adjusted EBITDA as an alternative to net income (loss) or cash provided by operating activities, in each case as determined in accordance with GAAP. We compensate for these limitations by relying primarily on our GAAP results, and we use Adjusted Gross Profit, Adjusted Recurring Gross Profit and Adjusted EBITDA only as supplemental information.
Directly comparable GAAP measures to Adjusted Gross Profit, Adjusted Recurring Gross Profit and Adjusted EBITDA are gross profit and net income (loss), respectively. We reconcile Adjusted Gross Profit, Adjusted Recurring Gross Profit and Adjusted EBITDA as follows:
|
|
|
Year Ended June 30, | ||||||
|
|
|
2011 |
|
2012 |
|
2013 |
|
2014 |
|
|
|
(in thousands) | ||||||
|
Reconciliation from Gross Profit to Adjusted Gross Profit |
|
|
|
|
|
|
|
|
|
Gross profit |
|
$17,739 |
|
$26,002 |
|
$37,628 |
|
$53,593 |
|
Amortization of capitalized research and development costs |
|
2,223 |
|
2,727 |
|
3,067 |
|
2,195 |
|
Stock-based compensation expense |
|
— |
|
— |
|
— |
|
920 |
|
One-time founder funded bonus pay-outs |
|
— |
|
— |
|
— |
|
321 |
|
Adjusted Gross Profit |
|
$19,962 |
|
$28,729 |
|
$40,695 |
|
$57,029 |
|
|
|
Year Ended June 30, | ||||||
|
|
|
2011 |
|
2012 |
|
2013 |
|
2014 |
|
|
|
(in thousands) | ||||||
|
Reconciliation from Total Recurring Revenues to Adjusted Recurring Gross Profit |
|
|
|
|
|
|
|
|
|
Total recurring revenues |
|
$37,543 |
|
$52,474 |
|
$72,768 |
|
$101,944 |
|
Cost of recurring revenues |
|
(16,329) |
|
(22,054) |
|
(28,863) |
|
(37,319) |
|
Total recurring revenues |
|
21,214 |
|
30,420 |
|
43,905 |
|
64,625 |
|
Amortization of capitalized research and development costs |
|
2,223 |
|
2,727 |
|
3,067 |
|
2,195 |
|
Stock-based compensation expense |
|
— |
|
— |
|
— |
|
496 |
|
One-time founder funded bonus pay-outs |
|
— |
|
— |
|
— |
|
142 |
|
Adjusted Recurring Gross Profit |
|
$23,437 |
|
$33,147 |
|
$46,972 |
|
$67,458 |
|
|
|
Year Ended June 30, | ||||||
|
|
|
2011 |
|
2012 |
|
2013 |
|
2014 |
|
|
|
(in thousands) | ||||||
|
Reconciliation from Net Income (Loss) to Adjusted EBITDA |
|
|
|
|
|
|
|
|
|
Net income (loss) |
|
$(130) |
|
$1,688 |
|
$617 |
|
$(7,110) |
|
Interest expense |
|
238 |
|
261 |
|
192 |
|
67 |
|
Income tax (benefit) expense |
|
(36) |
|
884 |
|
(602) |
|
255 |
|
Depreciation and amortization |
|
3,779 |
|
4,624 |
|
5,571 |
|
6,336 |
|
EBITDA |
|
3,851 |
|
7,457 |
|
5,778 |
|
(452) |
|
Stock-based compensation expense |
|
177 |
|
203 |
|
523 |
|
4,929 |
|
One-time founder funded bonus pay-outs |
|
— |
|
— |
|
— |
|
971 |
|
Adjusted EBITDA |
|
$4,028 |
|
$7,660 |
|
$6,301 |
|
$5,448 |
(2) Working capital is defined as current assets minus current liabilities.
Item 7. Management’s Discussion and Analysis of Financial Condition and Results of Operations.
The statements included herein that are not based solely on historical facts are “forward looking statements.” Such forward-looking statements are based on current expectations and assumptions that are subject to risks and uncertainties. Our actual results could differ materially from those anticipated by us in these forward-looking statements as a result of various factors, including those discussed below and elsewhere in this prospectus, particularly under the section titled “Risk Factors.”
Overview
We are a cloud-based provider of payroll and human capital management or HCM software solutions for medium-sized organizations, which we define as those having between 20 and 1,000 employees. Our comprehensive and easy-to-use solutions enable our clients to manage their workforces more effectively. Our solutions help drive strategic human capital decision-making and improve employee engagement by enhancing the HR, payroll and finance capabilities of our clients.
Effective management of human capital is a core function in all organizations and requires a significant commitment of resources. Medium-sized organizations operating without the infrastructure, expertise or personnel of larger enterprises are uniquely pressured to manage their human capital effectively.
Our solutions were specifically designed to meet the payroll and HCM needs of medium-sized organizations. We designed our cloud-based platform to provide a unified suite of applications using a multi-tenant architecture. Our solutions are highly flexible and configurable and feature a modern, intuitive user experience. Our platform offers automated data integration with over 200 related third-party systems, such as 401(k), benefits and insurance provider systems.
Our Paylocity Web Pay product is our core payroll solution and was the first of our current offerings introduced into the market. We believe payroll is the most critical system of record for medium-sized organizations and an essential gateway to other HCM functionality. We have invested in, and we intend to continue to invest in, research and development to expand our product offerings and advance our platform.
We believe there is a significant opportunity to grow our business by increasing our number of clients and we intend to invest in our business to achieve this purpose. We market and sell our solutions primarily through our direct sales force. We have increased our sales and marketing expenses as we have added sales representatives and related sales and marketing personnel. We intend to continue to grow our sales and marketing organization across new and existing geographic territories. In addition to growing our number of clients, we intend to grow our revenue over the long term by increasing the number and quality of products that clients purchase from us. To do so, we must continue to enhance and grow the number of solutions we offer to advance our platform.
We believe that delivering a positive service experience is an essential element of our ability to sell our solutions and retain our clients. We seek to develop deep relationships with our clients through our unified service model, which has been designed to meet the service needs of medium-sized organizations. We expect to continue to invest in and grow our implementation and client service organization as our client base grows.
We believe we have the opportunity to continue to grow our business over the long term, and to do so we have invested, and intend to continue to invest, across our entire organization. These investments include increasing the number of personnel across all functional areas, along with improving our solutions and infrastructure to support our growth. The timing and amount of these investments vary based on the rate at which we add new clients, add new personnel and scale our application development and other activities. Many of these investments will occur in advance of experiencing any direct benefit from them which will make it difficult to determine if we are effectively allocating our resources. We expect these investments to increase our costs on an absolute basis, but as we grow our number of clients and our related revenues, we anticipate that we will gain economies of scale and increased operating leverage. As a result, we expect our gross and operating margins will improve over the long term.
As our business has grown, we have become increasingly subject to the risks arising from adverse changes in domestic and global economic conditions. If general economic conditions were to deteriorate further, including declines in private sector employment growth and business productivity, increases in the unemployment rate and changes in interest rates, we may experience delays in our sales cycles, increased pressure from prospective customers to offer discounts and increased pressure from existing customers to renew expiring recurring revenue agreements for lower amounts. Our interest income on funds held for clients continues to be negatively impacted by historically low interest rates.
Our operating subsidiary Paylocity Corporation was incorporated in July 1997 as an Illinois corporation. In November 2013, we formed Paylocity Holding Corporation, a Delaware corporation, of which Paylocity Corporation is now a wholly-owned subsidiary. Paylocity Holding Corporation had no operations prior to the restructuring. All of our business operations have historically been, and are currently, conducted by Paylocity Corporation, and the financial results presented herein are entirely attributable to the results of its operations.
Key Metrics
We regularly review a number of metrics, including the following key metrics, to evaluate our business, measure our performance, identify trends affecting our business, formulate financial projections and make strategic decisions.
Recurring Revenue Growth
Our recurring revenue model and high annual revenue retention rates provide significant visibility into our future operating results and cash flow from operations. This visibility enables us to better manage and invest in our business. Recurring revenue, which is comprised of recurring fees and interest income on funds held for clients, increased from $52.5 million in fiscal 2012 to $72.8 million in fiscal 2013, representing a 39% year-over-year increase. Recurring revenue increased from $72.8 million in fiscal 2013 to $101.9 million in fiscal 2014, representing a 40% year-over-year increase. Recurring revenue represented 95%, 94% and 94% of total revenue in fiscal 2012, 2013, and 2014, respectively.
Client Count Growth
We believe there is a significant opportunity to grow our business by increasing our number of clients. We have increased our number of clients from approximately 5,500 as of June 30, 2012 to approximately 8,500 as of June 30, 2014, representing a compound annual growth rate of approximately 24%. The table below sets forth our client count for the periods indicated, rounded to the nearest fifty.
|
|
|
Year Ended June 30, |
| ||||
|
|
|
2012 |
|
2013 |
|
2014 |
|
|
Client Count |
|
5,500 |
|
6,850 |
|
8,500 |
|
The rate at which we add clients is highly variable period-to-period and highly seasonal as many clients switch solutions during the first calendar quarter of each year. Although many clients have multiple divisions, segments or locations, we only count such clients once for these purposes.
Annual Revenue Retention Rate
Our annual revenue retention rate has been in excess of 92% during each of the past three fiscal years. We calculate our annual revenue retention rate as our total revenue for the preceding 12 months, less the annualized value of revenue lost during the preceding 12 months, divided by our total revenue for the preceding 12 months. We calculate the annualized value of revenue lost by summing the recurring fees paid by lost clients over the previous twelve months prior to their termination if they have been a client for a minimum of twelve months. For those lost clients who became clients within the last twelve months, we sum the recurring fees for the period that they have been a client and then annualize the amount. We exclude interest income on funds held for clients from the revenue retention calculation. We believe that our annual revenue retention rate is an important metric to measure overall client satisfaction and the general quality of our product and service offerings.
Recurring Fees From New Clients
We calculate recurring fees from new clients as the percentage of year-to-date recurring fees from all clients on our solutions which had not been on or used any of our solutions for a full year as of the start of the current fiscal year. We believe recurring fees from new clients is an important metric to measure the expansion of our existing client base as well as the growth in our client base. Our recurring fees from new clients for both fiscal 2013 and 2014 were 44%.
Adjusted Gross Profit, Adjusted Recurring Gross Profit and Adjusted EBITDA
We disclose Adjusted Gross Profit, Adjusted Recurring Gross Profit and Adjusted EBITDA because we use them to evaluate our performance, and we believe Adjusted Gross Profit, Adjusted Recurring Gross Profit and Adjusted EBITDA assist in the comparison of our performance across reporting periods by excluding certain items that we do not believe are indicative of our core operating performance. We believe these metrics are used in the financial community, and we present it to enhance investors’ understanding of our operating performance and cash flows.
Adjusted Gross Profit, Adjusted Recurring Gross Profit and Adjusted EBITDA are not measurements of financial performance under generally accepted accounting principles in the United States, or GAAP, and you should not consider Adjusted Gross Profit as an alternative to gross profit, Adjusted Recurring Gross Profit as an alternative to total recurring revenues, or Adjusted EBITDA as an alternative to net income (loss) or cash provided by operating activities, in each case as determined in accordance with GAAP. In addition, our definition of Adjusted Gross Profit, Adjusted Recurring Gross Profit and Adjusted EBITDA may be different than the definition utilized for similarly-titled measures used by other companies.
We define Adjusted Gross Profit as gross profit before amortization of capitalized internal-use software, stock-based compensation expenses and one-time founder funded bonus pay-outs, if any. We define Adjusted Recurring Gross Profit as total recurring revenues after cost of recurring revenues and before amortization of capitalized internal-use software, stock-based compensation expense and one-time founder funded bonus payouts. We define Adjusted EBITDA as net income (loss) before interest expense (income), income tax expense (benefit), depreciation and amortization, stock-based compensation expenses and one-time founder funded bonus pay-outs. The table below sets forth our Adjusted Gross Profit, Adjusted Recurring Gross Profit and Adjusted EBITDA for the periods presented.
|
|
|
Year Ended June 30, |
| ||||
|
|
|
2012 |
|
2013 |
|
2014 |
|
|
|
|
(in thousands) |
| ||||
|
Adjusted Gross Profit |
|
$28,729 |
|
$40,695 |
|
$57,029 |
|
|
Adjusted Recurring Gross Profit |
|
$33,147 |
|
$46,972 |
|
$67,458 |
|
|
Adjusted EBITDA |
|
$7,660 |
|
$6,301 |
|
$5,448 |
|
For a further discussion of Adjusted Gross Profit, Adjusted Recurring Gross Profit and Adjusted EBITDA, including a reconciliation of Adjusted Gross Profit, Adjusted Recurring Gross Profit and Adjusted EBITDA to GAAP, see Part II, Item 6: “Consolidated Selected Financial Data.”
Basis of Presentation
Revenues
Recurring Fees
We derive the majority of our revenues from recurring fees attributable to our cloud-based payroll and HCM software solutions. Recurring fees for each client generally include a base fee in addition to a fee based on the number of client employees and the number of products a client uses. We also charge fees attributable to our preparation of W-2 documents and annual required filings on behalf of our clients. Over the past three years, our clients have consistently had on average between 95 and 115 employees. We derive revenue from a client based on the solutions purchased by the client, the number of client employees as well as the amount, type and timing of services provided in respect of those client employees. As such, the number of client employees on our system is not a good indicator of our financial results in any period. Recurring fees attributable to our cloud-based payroll and HCM solutions accounted for approximately 93%, 92% and 92% of our total revenues during the years ended June 30, 2012, 2013 and 2014, respectively.
Our agreements with clients do not have a specified term and are generally cancellable by the client on 60 days’ or less notice. Our agreements do not include general rights of return and do not provide clients with the right to take possession of the software supporting the services being provided. We recognize recurring fees in the period in which services are provided and when collection of fees is reasonably assured and the amount of fees is fixed or determinable.
Interest Income on Funds Held for Clients
We earn interest income on funds held for clients. We collect funds for employee payroll payments and related taxes in advance of remittance to employees and taxing authorities. Prior to remittance to employees and taxing authorities, we earn interest on these funds through financial institutions with which we have automated clearing house, or ACH, arrangements.
Implementation Services and Other
Implementation services and other revenues primarily consist of implementation fees charged to new clients for professional services provided to implement and configure our payroll and HCM solutions. Implementations of our payroll solutions typically require only three to four weeks at which point the new client’s payroll is first run using our solution, our implementation services are deemed completed, and we recognize the related revenue. We implement additional HCM products as requested by clients and leverage the data within our payroll solution to accelerate our implementation processes. Implementation services and other revenues may fluctuate significantly from quarter to quarter based on the number of new clients, pricing and the product utilization.
Cost of Revenues
Cost of Recurring Revenues
Costs of recurring revenues are generally expensed as incurred, and include costs to provide our payroll and other HCM solutions primarily consisting of employee-related expenses, including wages, stock-based compensation, bonuses and benefits, relating to the provision of ongoing client support, payroll tax filing and distribution of printed checks and other materials. These costs also include third-party reseller costs, delivery costs, computing costs and amortization of capitalized software costs, as well as bank fees associated with client fund transfers. We expect to realize cost efficiencies over the long term as our business scales, resulting in improved operating leverage and increased margins.
We capitalize a portion of our costs for software developed for internal use, which are then all amortized as a cost of recurring revenues. We amortized $2.7 million, $3.1 million and $2.2 million of capitalized internal-use software costs in fiscal 2012, 2013 and 2014, respectively.
Cost of Implementation Services and Other
Cost of implementation services and other consists almost entirely of employee-related expenses involved in the implementation of our payroll and other HCM solutions for new clients. Implementation costs are generally fixed in the short-term and exceed associated implementation revenue charged to each client. We intend to grow our business through acquisition of new clients, and doing so will require increased personnel to implement our solutions. Therefore our cost of implementation services and other is expected to increase in absolute dollars for the foreseeable future.
Operating Expenses
Sales and Marketing
Sales and marketing expenses consist primarily of employee-related expenses for our direct sales and marketing staff, including wages, commissions, stock-based compensation, bonuses and benefits, marketing expenses and other related costs. Commissions are primarily earned and recognized in the month when implementation is complete and the client first utilizes a service, typically by running its first payroll. Bonuses paid to sales staff for attainment of certain performance criteria are accrued in the fiscal year in which they are earned and are subsequently paid annually in the first fiscal quarter of the following year.
We will seek to grow our number of clients for the foreseeable future and therefore our sales and marketing expense is expected to continue to increase in absolute dollars as we grow our sales organization and expand our marketing activities.
Research and Development
Research and development expenses consist primarily of employee-related expenses for our research and development and product management staff, including wages, stock-based compensation, benefits and bonuses. Additional expenses include costs related to the development, maintenance, quality assurance and testing of new technologies and ongoing refinement of our existing solutions. Research and development expenses, other than software development expenses qualifying for capitalization, are expensed as incurred.
We capitalize a portion of our development costs related to internal-use software. The timing of our capitalized development projects may affect the amount of development costs expensed in any given period. The table below sets forth the amounts of capitalized and expensed research and development expenses for each of fiscal 2012, 2013 and 2014.
|
|
|
Year Ended June 30, |
| ||||
|
|
|
2012 |
|
2013 |
|
2014 |
|
|
|
|
(in thousands) |
| ||||
|
Capitalized portion of research and development |
|
$3,716 |
|
$1,967 |
|
$4,674 |
|
|
Expensed portion of research and development |
|
1,788 |
|
6,825 |
|
10,355 |
|
|
Total research and development |
|
$5,504 |
|
$8,792 |
|
$15,029 |
|
We expect to grow our research and development efforts as we continue to broaden our product offerings and extend our technological leadership by investing in the development of new technologies and introducing them to new and existing clients. We expect research and development expenses to continue to increase in absolute dollars but to vary as a percentage of total revenue on a period-to-period basis.
General and Administrative
General and administrative expenses consist primarily of other employee-related costs, including wages, benefits, stock-based compensation and bonuses for our administrative, finance, accounting, and human resources departments. Additional expenses include consulting and professional fees, insurance and other corporate expenses.
We expect our general and administrative expenses to increase in absolute dollars as a result of our operation as a public company. These expenses will also include costs associated with regulations governing public companies, increased costs of directors’ and officers’ liability insurance and increased professional services expenses.
Other Income (Expense)
Other income (expense) consists primarily of interest income and expense. Interest income represents interest received on our cash and cash equivalents. Interest expense consists primarily of the interest incurred on outstanding borrowings under our note payable prior to its retirement in March 2014 using proceeds of our initial public offering.
Results of Operations
The following table sets forth our statements of operations data for each of the periods indicated.
|
|
|
Year Ended June 30, |
| ||||
|
|
|
2012 |
|
2013 |
|
2014 |
|
|
|
|
(in thousands) |
| ||||
|
Consolidated Statements of Operations Data: |
|
|
|
|
|
|
|
|
Revenues: |
|
|
|
|
|
|
|
|
Recurring fees |
|
$51,211 |
|
$71,309 |
|
$100,362 |
|
|
Interest income on funds held for clients |
|
1,263 |
|
1,459 |
|
1,582 |
|
|
Total recurring revenues |
|
52,474 |
|
72,768 |
|
101,944 |
|
|
Implementation services and other |
|
2,622 |
|
4,526 |
|
6,743 |
|
|
Total revenues |
|
55,096 |
|
77,294 |
|
108,687 |
|
|
Cost of revenues: |
|
|
|
|
|
|
|
|
Recurring revenues |
|
22,054 |
|
28,863 |
|
37,319 |
|
|
Implementation services and other |
|
7,040 |
|
10,803 |
|
17,775 |
|
|
Total costs of revenues |
|
29,094 |
|
39,666 |
|
55,094 |
|
|
Gross profit |
|
26,002 |
|
37,628 |
|
53,593 |
|
|
Operating expenses: |
|
|
|
|
|
|
|
|
Sales and marketing |
|
12,828 |
|
18,693 |
|
28,276 |
|
|
Research and development |
|
1,788 |
|
6,825 |
|
10,335 |
|
|
General and administrative |
|
8,618 |
|
12,079 |
|
21,980 |
|
|
Total operating expenses |
|
23,234 |
|
37,597 |
|
60,611 |
|
|
Operating income (loss) |
|
2,768 |
|
31 |
|
(7,018) |
|
|
Other income (expense) |
|
(196) |
|
(16) |
|
163 |
|
|
Income (loss) before income taxes |
|
2,572 |
|
15 |
|
(6,855) |
|
|
Income tax (benefit) expense |
|
884 |
|
(602) |
|
255 |
|
|
Net income (loss) |
|
$1,688 |
|
$617 |
|
$(7,110) |
|
The following table sets forth our statements of operations data as a percentage of revenue for each of the periods indicated.
|
|
|
Year Ended June 30, |
| ||||
|
|
|
2012 |
|
2013 |
|
2014 |
|
|
Consolidated Statements of Operations Data: |
|
|
|
|
|
|
|
|
Revenues: |
|
|
|
|
|
|
|
|
Recurring fees |
|
93% |
|
92% |
|
92% |
|
|
Interest income on funds held for clients |
|
2% |
|
2% |
|
2% |
|
|
Total recurring revenues |
|
95% |
|
94% |
|
94% |
|
|
Implementation services and other |
|
5% |
|
6% |
|
6% |
|
|
Total revenues |
|
100% |
|
100% |
|
100% |
|
|
Cost of revenues: |
|
|
|
|
|
|
|
|
Recurring revenues |
|
40% |
|
37% |
|
34% |
|
|
Implementation services and other |
|
13% |
|
14% |
|
17% |
|
|
Total costs of revenues |
|
53% |
|
51% |
|
51% |
|
|
Gross profit |
|
47% |
|
49% |
|
49% |
|
|
Operating expenses: |
|
|
|
|
|
|
|
|
Sales and marketing |
|
23% |
|
24% |
|
26% |
|
|
Research and development |
|
3% |
|
9% |
|
10% |
|
|
General and administrative |
|
16% |
|
16% |
|
20% |
|
|
Total operating expenses |
|
42% |
|
49% |
|
56% |
|
|
Operating income (loss) |
|
5% |
|
0% |
|
(7)% |
|
|
Other income (expense) |
|
(0)% |
|
0% |
|
0% |
|
|
Income (loss) before income taxes |
|
5% |
|
0% |
|
(7)% |
|
|
Income tax (benefit) expense |
|
2% |
|
(1)% |
|
0% |
|
|
Net income (loss) |
|
3% |
|
1% |
|
(7)% |
|
Comparison of Fiscal Years Ended June 30, 2012, 2013 and 2014
Revenues
|
|
|
Year Ended June 30, |
|
Change from |
|
Change from |
| ||||||||
|
|
|
2012 |
|
2013 |
|
2014 |
|
$ |
|
% |
|
$ |
|
% |
|
|
Recurring fees |
|
$51,211 |
|
$71,309 |
|
$100,362 |
|
$20,098 |
|
39% |
|
$29,053 |
|
41% |
|
|
Percentage of total revenues |
|
93% |
|
92% |
|
92% |
|
|
|
|
|
|
|
|
|
|
Interest income on funds held for clients |
|
$1,263 |
|
$1,459 |
|
$1,582 |
|
$196 |
|
16% |
|
$123 |
|
8% |
|
|
Percentage of total revenues |
|
2% |
|
2% |
|
2% |
|
|
|
|
|
|
|
|
|
|
Implementation services and other |
|
$2,622 |
|
$4,526 |
|
$6,743 |
|
$1,904 |
|
73% |
|
$2,217 |
|
49% |
|
|
Percentage of total revenues |
|
5% |
|
6% |
|
6% |
|
|
|
|
|
|
|
|
|
Recurring Fees
Recurring fees for the year ended June 30, 2014 increased by $29.1 million, or 41%, to $100.4 million from $71.3 million for the year ended June 30, 2013. Recurring fees increased primarily as a result of the continued growth of our client base in fiscal 2014, as well as increased revenue per client. Our client count at June 30, 2014 increased by 24% to approximately 8,500 from approximately 6,850 at June 30, 2013.
Recurring fees for the year ended June 30, 2013 increased by $20.1 million, or 39%, to $71.3 million from $51.2 million for the year ended June 30, 2012. Recurring fees increased primarily as a result of the continued growth of our client base in fiscal 2013, as well as increased revenue per client. Our client count at June 30, 2013 increased by 25% to approximately 6,850 from approximately 5,500 at June 30, 2012.
Interest Income on Funds Held for Clients
Interest income on funds held for clients for the year ended June 30, 2014 increased by $0.1 million, or 8%, to $1.6 million from $1.5 million for the year ended June 30, 2013. Interest income increased primarily as a result of an increased average daily balance of funds held due to the addition of new clients to our client base partially offset by declining interest crediting rates during fiscal 2014.
Interest income on funds held for clients for the year ended June 30, 2013 increased by $0.2 million, or 16%, to $1.5 million from $1.3 million for the year ended June 30, 2012. Interest income increased primarily as a result of an increased average daily balance of funds held due to the addition of new clients to our client base during fiscal 2013.
Implementation Services and Other
Implementation services and other revenue for the year ended June 30, 2014 increased by $2.2 million, or 49%, to $6.7 million from $4.5 million for the year ended June 30, 2013. Implementation services and other revenue increased primarily as a result of the continued growth of our new client base during fiscal 2014.
Implementation services and other revenue for the year ended June 30, 2013 increased by $1.9 million, or 73%, to $4.5 million from $2.6 million for the year ended June 30, 2012. Implementation services and other revenue increased primarily as a result of the continued growth of our new client base during fiscal 2013.
Cost of Revenues
|
|
|
Year Ended June 30, |
|
Change from |
|
Change from |
| ||||||||
|
|
|
2012 |
|
2013 |
|
2014 |
|
$ |
|
% |
|
$ |
|
% |
|
|
Cost of recurring revenues |
|
$22,054 |
|
$28,863 |
|
$37,319 |
|
$6,809 |
|
31% |
|
$8,456 |
|
29% |
|
|
Percentage of recurring revenues |
|
42% |
|
40% |
|
37% |
|
|
|
|
|
|
|
|
|
|
Recurring gross margin |
|
58% |
|
60% |
|
63% |
|
|
|
|
|
|
|
|
|
|
Cost of implementation services and other |
|
$7,040 |
|
$10,803 |
|
$17,775 |
|
$3,763 |
|
53% |
|
$6,972 |
|
65% |
|
|
Percentage of implementation services and other |
|
268% |
|
239% |
|
264% |
|
|
|
|
|
|
|
|
|
|
Implementation gross margin |
|
(168)% |
|
(139)% |
|
(164)% |
|
|
|
|
|
|
|
|
|
Cost of Recurring Revenues
Cost of recurring revenues for the year ended June 30, 2014 increased by $8.5 million, or 29%, to $37.3 million from $28.9 million for the year ended June 30, 2013. Cost of recurring revenues increased primarily as a result of the continued growth of our business, in particular $4.0 million in additional employee-related costs resulting from additional personnel to provide services to new and existing clients, $0.5 million stock-based compensation associated with our broad based IPO grant to all employees, $0.4 million of additional costs attributable to resellers, and $3.5 million other processing-related fees. Recurring gross margin increased by 3% from 60% in fiscal 2013 to 63% in fiscal 2014 primarily due to a 2% reduction in amortization expense as a percentage of total recurring revenue and a 1% reduction in costs attributable to resellers as a percentage of total recurring revenue.
Cost of recurring revenues for the year ended June 30, 2013 increased by $6.8 million, or 31%, to $28.9 million from $22.1 million for the year ended June 30, 2012. Cost of recurring revenues increased primarily as a result of the continued growth of our business, in particular $2.9 million in additional employee-related costs resulting from additional personnel to provide services to new and existing clients, $1.2 million of additional costs attributable to resellers, and $2.4 million of other processing-related fees. Recurring gross margin increased by 2% from 58% in fiscal 2012 to 60% in fiscal 2013 primarily due to a 1% reduction in amortization expense as a percentage of total recurring revenue and a 1% reduction in personnel-related and other costs as a percentage of total recurring revenue.
Cost of Implementation Services and Other
Cost of implementation services and other for the year ended June 30, 2014 increased by $7.0 million, or 65%, to $17.8 million from $10.8 million for the year ended June 30, 2013. Cost of implementation services and other increased primarily due to an increase in new clients during fiscal 2014, and a corresponding increase of $5.4 million in employee-related and other costs to implement our solutions for new clients and $0.4 million stock-based compensation associated with our broad based IPO grant to all employees.
Cost of implementation services and other for the year ended June 30, 2013 increased by $3.8 million, or 53%, to $10.8 million from $7.0 million for the year ended June 30, 2012. Cost of implementation services and other increased primarily due to an increase in new clients during fiscal 2013, and a corresponding increase of $3.0 million in employee-related and other costs to implement our solutions for new clients.
Operating Expenses
Sales and Marketing
|
|
|
Year Ended June 30, |
|
Change from |
|
Change from |
| ||||||||
|
|
|
2012 |
|
2013 |
|
2014 |
|
$ |
|
% |
|
$ |
|
% |
|
|
Sales and marketing |
|
$12,828 |
|
$18,693 |
|
$28,276 |
|
$5,865 |
|
46% |
|
$9,583 |
|
51% |
|
|
Percentage of total revenues |
|
23% |
|
24% |
|
26% |
|
|
|
|
|
|
|
|
|
Sales and marketing expenses for the year ended June 30, 2014 increased by $9.6 million, or 51%, to $28.3 million from $18.7 million for the year ended June 30, 2013. The increase in sales and marketing expenses in fiscal 2014 was primarily the result of $8.5 million of additional employee-related costs from the expansion of our sales team including management, direct sales and sales administration personnel by 62 personnel, the addition of 24 sales lead generation personnel, whose function was previously outsourced and recorded in sales and marketing as lead generation expense rather than employee-related expense in prior periods and other miscellaneous sales and marketing related expenses. The increase was also attributable to $0.8 million of stock-based compensation associated with our broad based IPO grant to all employees.
Sales and marketing expenses for the year ended June 30, 2013 increased by $5.9 million, or 46%, to $18.7 million from $12.8 million for the year ended June 30, 2012. The increase in sales and marketing expenses in fiscal 2013 was primarily the result of $5.2 million of additional employee-related costs from the expansion of our direct sales force by 23 personnel, the hiring of additional sales management and administrative personnel to support our growing business and other miscellaneous sales and marketing related expenses.
Research and Development
|
|
|
Year Ended June 30, |
|
Change from |
|
Change from |
| ||||||||
|
|
|
2012 |
|
2013 |
|
2014 |
|
$ |
|
% |
|
$ |
|
% |
|
|
Research and development |
|
$1,788 |
|
$6,825 |
|
$10,355 |
|
$5,037 |
|
282% |
|
$3,530 |
|
52% |
|
|
Percentage of total revenues |
|
3% |
|
9% |
|
10% |
|
|
|
|
|
|
|
|
|
Research and development for the year ended June 30, 2014 increased by $3.5 million, or 52%, to $10.4 million from $6.8 million for the year ended June 30, 2013. Research and development costs increased in fiscal 2014 primarily due to $5.1 million of additional employee-related expenses related to 27 additional development personnel, $0.6 million of stock-based compensation associated with our broad based IPO grant to all employees and $0.5 million related to the one-time founder funded bonus pay-outs. This was offset by an increase of $2.7 million in our capitalized internally developed software costs as we developed significant additional functionality in our human capital management applications during the year.
Research and development for the year ended June 30, 2013 increased by $5.0 million, or 282%, to $6.8 million from $1.8 million for the year ended June 30, 2012. Research and development costs increased in fiscal 2013 primarily due to $3.3 million of additional employee-related expenses related to 39 additional development personnel. Additionally, in fiscal 2013 one of our core payroll applications transitioned beyond the development stage into the maintenance and incremental improvements stage, and therefore our capitalized internally developed software costs decreased by $1.7 million in fiscal 2013 as compared to fiscal 2012.
General and Administrative
|
|
|
Year Ended June 30, |
|
Change from |
|
Change from |
| ||||||||
|
|
|
2012 |
|
2013 |
|
2014 |
|
$ |
|
% |
|
$ |
|
% |
|
|
General and administrative |
|
$8,618 |
|
$12,079 |
|
$21,980 |
|
$3,461 |
|
40% |
|
$9,901 |
|
82% |
|
|
Percentage of total revenues |
|
16% |
|
16% |
|
20% |
|
|
|
|
|
|
|
|
|
General and administrative expenses for the year ended June 30, 2014 increased by $9.9 million, or 82%, to $22.0 million from $12.1 million for the year ended June 30, 2013. General and administrative expenses increased primarily as a result of $4.3 million of additional employee-related expenses relating to 18 additional personnel, $2.1 million of additional stock-based compensation costs associated with IPO related grants of options and restricted stock units, $1.7 million in additional professional fees and $0.6 million of increased occupancy costs incurred as a result of our requirement for additional office space.
General and administrative expenses for the year ended June 30, 2013 increased by $3.5 million, or 40%, to $12.1 million from $8.6 million for the year ended June 30, 2012. General and administrative expenses increased primarily as a result of $2.2 million of additional employee-related expenses relating to 17 additional personnel, as well as $0.7 million of increased occupancy costs incurred as a result of our requirement for additional office space.
Other Income (Expense)
|
|
|
Year Ended June 30, |
|
Change from |
|
Change from |
| ||||||||
|
|
|
2012 |
|
2013 |
|
2014 |
|
$ |
|
% |
|
$ |
|
% |
|
|
Other income (expense) |
|
$(196) |
|
$(16) |
|
$163 |
|
$180 |
|
* |
|
$179 |
|
* |
|
|
Percentage of total revenues |
|
* |
|
* |
|
* |
|
|
|
|
|
|
|
|
|
* Not Meaningful
Other income (expense) for the year ended June 30, 2014 increased by $0.2 million as compared to the year ended June 30, 2013. Other income for the year ended June 30, 2014 primarily consists of interest income earned on our cash and cash equivalents, partially offset by interest expense incurred on our note payable and other debt, which was repaid in full in March 2014.
Other income (expense) for the year ended June 30, 2013 increased by $0.2 million as compared to the year ended June 30, 2012. Other expense for the year ended June 30, 2013 primarily consists of interest expense incurred on our note payable and other debt, which was reduced as compared to the year ended June 30, 2012 due to increased principal payments in fiscal 2013.
Income Tax (Benefit) Expense
|
|
|
Year Ended June 30, |
|
Change from |
|
Change from |
| ||||||||
|
|
|
2012 |
|
2013 |
|
2014 |
|
$ |
|
% |
|
$ |
|
% |
|
|
Effective tax rate |
|
34% |
|
* |
|
(4)% |
|
|
|
|
|
|
|
|
|
|
Income tax (benefit) expense |
|
884 |
|
(602) |
|
255 |
|
(1,486) |
|
* |
|
(857) |
|
* |
|
|
Percentage of total revenues |
|
2% |
|
(1)% |
|
* |
|
|
|
|
|
|
|
|
|
* Not Meaningful
Income tax (benefit) expense for the year ended June 30, 2014 increased by $0.9 million, as compared to the year ended June 30, 2013 primarily due to the expiration of federal research and development tax credit allowances resulting in a $0.5 million decline in amount claimed and an increase in non-deductible expenses as a result of our growing business. The Company also recognized a valuation allowance as of June 30, 2014 on substantially all of its net deferred tax assets, many of which were generated in the three month period ended June 30, 2014, given its determination that it was more likely than not that the Company would not recognize the benefits of its net operating loss carryforwards prior to their expiration.
Income tax (benefit) expense for the year ended June 30, 2013 decreased by $1.5 million, as compared to the year ended June 30, 2012. The decrease in income tax provision was primarily the result of income before taxes of $0 for the year ended June 30, 2013, as compared to income before taxes of $2.6 million for the year ended June 30, 2012. Additionally, our income tax provision for the year ended June 30, 2013 was reduced by $0.7 million due to the application of various research and development tax credits.
Critical Accounting Policies and Significant Judgments and Estimates
In preparing our financial statements and accounting for the underlying transactions and balances in accordance with GAAP, we apply various accounting policies that require our management to make estimates, judgments and assumptions that affect the amounts reported in our financial statements. We consider the policies discussed below as critical to understanding our financial statements, as their application places the most significant demands on management’s judgment. Management bases its estimates, judgments and assumptions on historical experience, current economic and industry conditions and on various other factors deemed to be reasonable under the circumstances, the results of which form the basis for making judgments about the carrying values of assets and liabilities that are not readily apparent from other sources. Because the use of estimates is an integral part of the financial reporting process, actual results could differ and such differences could be material.
Revenue Recognition
We derive revenues predominantly from recurring revenues associated with our cloud-based payroll and HCM software applications and one-time service fees for implementation of our solutions. Our agreements with clients do not include general rights
of return and do not provide clients with the right to take possession of the software supporting the services being provided. As such, revenue is recognized as services are performed.
We recognize revenue when all of the following criteria are achieved:
· There is persuasive evidence of an agreement;
· The service has been provided to the client;
· Collection of the fees is reasonably assured; and
· The amount of fees to be paid by the client is fixed or determinable.
For arrangements with multiple-elements, we recognize revenues in accordance with Accounting Standards Update (ASU) 2009-13, Multiple-Deliverable Revenue Arrangements. For each agreement, we evaluate whether the individual deliverables qualify as separate units of accounting. If one or more of the deliverables does not have standalone value upon delivery, the deliverables that do not have standalone value are generally combined and treated as a single unit of accounting. Revenue for arrangements treated as a single unit of accounting is generally recognized within the same month that the services are rendered given that the agreements are cancellable with 60 days’ or less notice.
In determining whether revenues from implementation services can be accounted for separately from recurring revenues, we consider the nature of the implementation services and the availability of the implementation services from other vendors. We established standalone value for implementation primarily due to the number of partners that perform these services and account for such implementation services separate from the recurring revenues.
If we determine that the services have standalone value upon delivery, we account for each separately and revenues are recognized as the services are delivered with allocation of consideration based on the relative selling price method. That method requires the selling price of each element in a multiple deliverable arrangement to be based on, in descending order: (i) vendor- specific objective evidence of fair value, or VSOE, (ii) third-party evidence of fair value, or TPE, or (iii) management’s best estimate of the selling price, or BESP.
We are not able to demonstrate VSOE of selling price with respect to our recurring fees paid for our solutions because the deliverables are sold across an insufficiently narrow range of prices on a stand-alone basis. We are also not able to demonstrate TPE for subscription fees because no third-party offerings are reasonably comparable to our product offerings. We thus establish BESP by service offering, requiring the use of significant estimates and judgment. To determine BESP, we consider numerous factors, including the nature of the deliverables themselves, the geography for the sale, internal costs, and pricing and discounting practices utilized by our direct sales force. Arrangement consideration is allocated to each deliverable based on the established BESP and subject to the limitation that because the arrangements are cancellable with 60 days’ or less notice, recurring revenue is not allocated to any deliverable until the consideration has been earned, typically with each payroll cycle or monthly, depending on the service.
Property and Equipment and Long-Lived Assets
We state property and equipment at cost. We calculate depreciation on property and equipment using a straight-line method over the estimated useful lives of the assets, generally three to seven years for most classes of assets, or over the term of the related lease for leasehold improvements. We recognized depreciation expense of $1.9 million, $2.5 million and $4.1 million during the years ended June 30, 2012, 2013, and 2014, respectively.
We review long-lived assets, such as property and equipment, for impairment whenever events or changes in circumstances indicate that the carrying amount of an asset may not be recoverable. If circumstances require a long-lived asset or asset group be tested for possible impairment, we first compare the undiscounted cash flows expected to be generated by that asset or asset group to its carrying amount. If the carrying amount of the long-lived asset or asset group is not recoverable on an undiscounted cash flow basis, we recognize impairment to the extent that the carrying amount exceeds its fair value. We determine fair value through various valuation techniques including discounted cash flow models, quoted market values and third-party independent appraisals, as considered necessary.
Capitalized Internal-Use Software Costs
We apply ASC 350-40, Intangibles—Goodwill and Other—Internal-Use Software, to the accounting for costs of internal-use software. Software development costs are capitalized when application development begins, it is probable that the project will be completed, and the software will be used as intended. Costs associated with preliminary project stage activities, training, maintenance and all other post implementation stage activities are expensed as incurred. We also capitalize certain costs related to specific upgrades and enhancements when it is probable the expenditures will result in significant additional functionality. The capitalization policy provides for the capitalization of certain payroll costs for employees who are directly associated with developing internal-use software as well as certain external direct costs. Capitalized employee costs are limited to the time directly spent on such projects.
Internal-use software is amortized on a straight-line basis over 18 to 24 months. We evaluate the useful lives of these assets on an annual basis and tests for impairments whenever events or changes in circumstances occur that could impact the recoverability of these assets. There were no impairments to capitalized software developed for internal use during the years ended June 30, 2012, 2013 or 2014. We capitalized $3.7 million, $2.0 million, and $4.7 million of software development costs for the years ended June 30, 2012, 2013 and 2014, respectively including stock-based compensation costs of $0.3 million in the year ended June 30, 2014. We amortized $2.7 million, $3.1 million, and $2.2 million of capitalized research and development costs for the years ended June 30, 2012, 2013 and 2014, respectively. In fiscal 2014, we developed significant additional functionality in several of our applications. This development resulted in an increase in capitalized internally-developed software costs in fiscal 2014 as compared to fiscal 2013. In fiscal 2013, one of our solutions transitioned beyond the development stage into the maintenance and incremental improvements stage, which resulted in lower capitalized internally-developed software costs in fiscal 2013 as compared to fiscal 2012.
Goodwill and Intangible Assets
Goodwill is an asset representing the future economic benefits arising from other assets acquired in a business combination that are not individually identified and separately recognized. We have recorded goodwill in connection with the acquisition of BFKMS, Inc. Goodwill is not amortized, but instead is tested for impairment at least annually. ASU 2011-08, Testing Goodwill for Impairment provides an entity the option to perform a qualitative assessment to determine whether it is more-likely-than-not that the fair value of a reporting unit is less than its carrying amount prior to performing the two-step impairment test. If it is the case that the estimated fair value of a reporting unit is less than its carrying amount, including goodwill, the two-step goodwill impairment test is required. Otherwise no further analysis is required.
If the two-step goodwill impairment test is required, first the fair value of the reporting unit is compared with its carrying amount, including goodwill. If the fair value of the reporting unit is less than its carrying amount, an indication of goodwill impairment exists for the reporting unit and we perform step two of the impairment test. Under step two, an impairment loss is recognized for any excess of the carrying amount of the reporting unit’s goodwill over the implied fair value of the goodwill. The implied fair value of goodwill is determined by allocating the fair value of the reporting unit in a manner similar to a purchase price allocation and the residual fair value after this allocation is the implied fair value of the reporting unit goodwill. Fair value of the reporting unit is determined using a discounted cash flow analysis. If the fair value of the reporting unit exceeds its carrying amount, step two does not need to be performed.
We will perform its annual impairment review of goodwill in our fiscal fourth quarter and when a triggering event occurs between annual impairment tests. However, given that we did not have recorded goodwill until its fiscal fourth quarter of 2014, no impairment tests were required to be completed.
Intangible assets are comprised primarily of client list acquisitions and are reported net of accumulated amortization on the Consolidated Balance Sheets. Client relationships use the straight-line method of amortization over an accelerated nine year time frame, while the non-solicitation agreement uses the straight-line method of amortization over the three year life of the agreement. Amortization expense associated with our intangible assets was $0, $0, and $80 during the years ended June 30, 2012, 2013 and 2014, respectively. We test intangible assets for potential impairment when events or changes in circumstances indicate that the carrying value of such assets may not be recoverable. There were no such events or changes in circumstances during the years ended June 30, 2012, 2013 and 2014.
Income Taxes
We account for federal income taxes under the asset and liability method. Deferred tax assets and liabilities are recognized for the future tax consequences attributable to differences between the financial statement carrying amounts of existing assets and liabilities and their respective tax bases and operating loss and tax credit carryforwards. Deferred tax assets and liabilities are measured using enacted tax rates expected to apply to taxable income in the years in which those temporary differences are expected to be recovered or settled. The effect on deferred tax assets and liabilities of a change in tax rates is recognized in income in the period that includes the enactment date.
Deferred tax assets may be reduced by a valuation allowance to the extent we determine it is more likely than not that some portion or all of the deferred tax assets will not be realized. The valuation of deferred tax assets requires judgment in assessing the likely future tax consequences of events that have been recognized in our financial statements or tax returns and future profitability. Our accounting for deferred tax consequences represents the best estimate of those future events. Changes in current estimates, due to unanticipated events or otherwise, could have an adverse impact on our financial condition and results of operations.
In assessing the need for a valuation allowance, we consider both positive and negative evidence related to the likelihood of realization of the deferred tax assets. The weight given to positive and negative evidence is commensurate with the extent to which the
evidence may be objectively verified. As such, it is generally difficult for positive evidence regarding projected future taxable income exclusive of reversing taxable temporary differences to outweigh objective negative evidence of recent financial reporting losses. Cumulative losses in recent years are significant negative evidence that is difficult to overcome in determining that a valuation allowance is not needed against deferred tax assets.
We recognize the effect of income tax positions only if those positions are more likely than not of being sustained. Recognized income tax positions are measured at the largest amount that is greater than 50% likely of being realized. Changes in recognition or measurement are reflected in the period in which the change in judgment occurs.
Stock-Based Compensation
We maintain a 2008 Equity Incentive Plan (the “2008 Plan”) and a 2014 Equity Incentive Plan (the “2014 Plan”) pursuant to which we have issued options to purchase shares of our common stock and grants of restricted stock awards to employees, officers, directors and consultants. The 2014 Plan serves as the successor to the 2008 Plan and permits the granting of options to purchase common stock and other equity incentives at the discretion of the compensation committee of our board of directors. We will not grant any additional awards under our 2008 Plan, though our 2008 Plan will continue to govern the terms and conditions of all outstanding equity awards granted under the 2008 Plan.
As of June 30, 2014, options to purchase 4,387,722 shares of our common stock were outstanding, 101,764 restricted stock units were outstanding and 2,581,513 shares of our common stock were reserved for future grant.
The following table presents data related to stock options granted on the dates indicated:
|
|
|
Aug. 21, |
|
Sept. 17, |
|
July 8, |
|
Aug. 26, |
|
Mar. 18, |
|
|
Options granted |
|
893,332 |
|
33,333 |
|
466,663 |
|
50,000 |
|
2,065,541 | |
|
Fair value of stock |
|
$4.88 |
|
$4.88 |
|
$7.04 |
|
$7.04 |
|
$17.00 | |
|
Exercise price |
|
$4.88 |
|
$4.88 |
|
$7.04 |
|
$7.04 |
|
$17.00 | |
|
Fair value of option |
|
$1.22 |
|
$1.22 |
|
$1.71 |
|
$1.71 |
|
$7.62 | |
Equity-classified awards are measured at the grant date fair value of the award and expense is recognized, net of assumed forfeitures, on a straight-line basis over the requisite service period for each separately vesting portion of the award. We estimate grant date fair value using the Black-Scholes Option-Pricing Model, or Black-Scholes, which requires the use of certain subjective assumptions. Below is a table of the key weighted-average assumptions used in the option valuation calculation for options issued on the dates indicated. We did not grant stock options in fiscal 2012.
|
|
|
Aug. 21, |
|
Sept. 17, |
|
July 8, |
|
Aug. 26, |
|
Mar. 18, |
|
|
Valuation assumptions: |
|
|
|
|
|
|
|
|
|
|
|
|
Weighted average expected dividend yield |
|
— |
|
— |
|
— |
|
— |
|
— |
|
|
Weighted average expected volatility |
|
30.7% |
|
30.7% |
|
29.5% |
|
29.5% |
|
44.5% |
|
|
Weighted average expected term (years) |
|
4.0 |
|
4.0 |
|
4.0 |
|
4.0 |
|
6.0 |
|
|
Weighted average risk-free interest rate |
|
0.6% |
|
0.6% |
|
0.5% |
|
0.5% |
|
1.94% |
|
We use a dividend yield assumption of zero as we have not paid regular cash dividends on our common stock and presently have no intention of paying any such cash dividends. Since our shares were not publicly traded prior to March 2014, expected volatility is estimated based on the average historical volatility of similar entities with publicly traded shares. We calculate the expected term using company specific historical data, such as employee option exercise and employee post-vesting departure behavior. Separate groups of employees that have similar historical exercise behavior are considered separately for valuation purposes. The risk-free rate for the expected term of the option is based on the U.S. Treasury yield curve at the date of grant.
Stock-based compensation expense was $0.2 million, $0.5 million and $4.9 million for the years ended June 30, 2012, 2013 and 2014, respectively. If factors change and we employ different assumptions, stock-based compensation expense may differ from what we have recorded in the past. If there is a difference between the assumptions used in determining stock-based compensation expense and the actual factors which become known over time, we may change the input factors used in determining stock-based compensation costs for future grants. These changes, if any, may adversely impact our results of operations in the period such changes are made. We expect to continue to grant stock options in the future, and to the extent that we do, our actual stock-based compensation expense recognized in future periods will likely increase.
One significant factor in determining the fair value of our options granted through August 2013, when using Black-Scholes, is the fair value of the common stock underlying those stock options. Prior to March 2014, we were a private company with no active public market for our common stock. Therefore, the fair value of the common stock underlying our stock options was determined by our board of directors, which considered in making its determination of fair value a variety of factors including contemporaneous periodic valuation studies from an independent and unrelated third-party valuation firm. Now that we have a public market for our stock, we observe the fair value of our common stock on the date of grant in accordance with the terms of the award.
Based on the closing stock price on June 30, 2014 of $21.63, the aggregate intrinsic value of outstanding options to purchase shares of our common stock as of June 30, 2014 was $51.0 million, of which $20.9 million related to vested options and $30.1 million to unvested options. The aggregate intrinsic value of outstanding restricted stock units as of June 30, 2014 was $2.2 million, of which all were unvested.
Third-Party Valuation Methodology
In performing its analysis, the valuation firm engaged in discussions with management, analyzed historical and forecasted financial statements, and reviewed our corporate documents. The valuation consultant utilized the guidelines outlined in the American Institute of Certified Public Accountants Practice Aid, Valuation of Privately-Held-Company Equity Securities Issued as Compensation. The valuation study was prepared using a combination of four generally accepted approaches to determining the fair market value of a business: the discounted cash flows, or DCF, method, the guideline public company method, the prior transaction method and the market transactions method. The discounted cash flows method forecasted future cash flows utilizing a terminal value based on our expectation of long-term growth to arrive at a valuation. The guideline public company method utilizes a market approach which estimates the fair value of a company by applying to that company the market multiples of publicly-traded companies to arrive at a valuation. The prior transaction method looks to recent arms-length transactions in a company’s capital stock to arrive at a valuation. The market transactions method utilizes a market approach which estimates the fair value of a company by applying to that company the market multiples of publicly-traded and private companies to arrive at a valuation.
Fiscal 2013
The independent third-party valuation as of June 30, 2012 was performed using the DCF method, the guideline public company method and the prior transaction method. The valuation firm considered our nature and history, the condition and outlook of the industry in which we operate, our financial condition, our current operations and earning capacity, our relative position within the industry in which we operate, prior transactions involving our stock, our strategic direction and management and our goodwill and intangible value. The valuation firm took into account our financial statements for fiscal 2007 through 2012.
In applying the guideline public company method, the valuation firm analyzed the prices that investors are willing to pay for the publicly-traded common stock of companies that are comparable to us. The valuation firm then calculated total market value of invested capital multiples based on each of (i) TTM earnings before interest, taxes, depreciation and amortization, (ii) TTM earnings before interest and taxes, (iii) TTM net sales and (iv) book value. The valuation firm applied the average of the public companies’ TTM net sales multiple to our TTM net sales. The valuation firm then adjusted the resulting value downward by 35% to reflect our smaller size, limited access to capital, historical and future growth expectations, and differences in liquidity, profitability and leverage among the guideline companies.
In applying the DCF method, the valuation firm analyzed financial projections prepared by our management for fiscal 2013 through 2016. The valuation firm calculated our net cash flows to invested capital by taking our debt-free net income, as estimated by management, adding depreciation expenses and subtracting both capital expenditures, as estimated by management, and incremental working capital needs, which were estimated based on a review of an industry average. For the terminal year, the valuation firm applied a revenue multiple, calculated using the guideline public company method. A discount rate of 35% was then applied. To determine the discount rate, the valuation firm reviewed published investment hurdle rates typically required by institutional investors for companies of comparable size and risk.
In applying the prior transaction method, the valuation firm reviewed three arms-length transaction in our capital stock. The most recent transaction occurred on June 28, 2012, two days prior to the date of the valuation, in which we sold shares of Series B preferred stock for approximately $4.88 per share.
Our value was then allocated among our shares of Series A preferred stock, our shares of Series B preferred stock and our shares of common stock using the option pricing equity allocation method, using Black-Scholes. In utilizing the Black-Scholes method, our volatility was estimated at 31% which was based on the average volatility of the guideline public companies over one-year, two-year and five-year period. The assumed time to expiration was three years, which was based on the estimated timing of a potential liquidity event. Finally, the valuation firm applied a marketability discount of 10% to reflect the lack of an active market in shares of our common stock, which resulted in a fair market value of $4.88 per share.
Our board of directors considered this third party valuation and the other factors discussed above in determining that the fair market value of our common stock was $4.88 on August 21, 2012 and September 17, 2012.
Fiscal 2014
The independent third-party valuation as of May 31, 2013 was performed using the DCF method, the guideline public company method and the market transactions method. The valuation firm considered our nature and history, the condition and outlook of the industry in which we operate, the book value of our stock and our financial condition, the earning capacity of our business, the dividend-paying capacity of our business, prior transactions involving our stock, the market price of public traded stock of companies engage in the same or a similar line of business and our goodwill and intangible value. The valuation firm took into account our financial statements for fiscal 2009 through 2012, as well as interim financial statements for the eleven months ended May 31, 2013 and May 31, 2012.
In applying the guideline public company method, the valuation firm analyzed the prices that investors are willing to pay for the publicly-traded common stock of companies that are comparable to us. The valuation firm then calculated total market value of invested capital multiples based on TTM earnings before interest, taxes, depreciation and amortization and TTM revenues. The valuation firm considered our smaller size, limited access to capital, historical and future growth expectations, and differences in liquidity, profitability and leverage among the guideline companies before selecting a TTM multiple that was slightly above the average of the TTM revenues multiples for the companies determined to be most comparable to us.
In applying the DCF method, the valuation firm analyzed financial projections prepared by our management for a five year period. The valuation firm calculated our net cash flows to invested capital by taking our debt-free net income, as estimated by management, adding depreciation expenses and subtracting both capital expenditures, as estimated by management, and incremental working capital needs, which were estimated based on a review of an industry average. For the terminal year, the valuation firm applied a revenue multiple, calculated using the guideline public company method. A discount rate of 35% was then applied. To determine the discount rate, the valuation firm reviewed published investment hurdle rates typically required by institutional investors for companies of comparable size and risk. The 35% discount rate was equal to the discount rate applied in the DCF analysis conducted as of June 30, 2012.
In applying the market transactions method, the valuation firm reviewed publicly available data regarding transactions that have occurred in the industry, as well as prior arms-length transactions in our capital stock. The valuation firm applied a revenue multiple that was slightly above the median revenue multiple of all transactions and in-line with the sale of our Series B preferred stock in June 2012.
Our value was then allocated among our shares of Series A preferred stock, our shares of Series B preferred stock and our shares of common stock using the option pricing equity allocation method, using Black-Scholes. In utilizing the Black-Scholes method, our volatility was estimated at 31% which was based on the average volatility of the guideline public companies over a five-year period. The assumed time to expiration was four years, which was based on the estimated timing of a potential liquidity event. Finally, the valuation firm applied a marketability discount to reflect the lack of an active market in shares of our common stock, which resulted in a fair market value of $6.90 per share.
Our board of directors considered this third-party valuation and the other factors discussed above in determining that the fair market value of our common stock was $7.04 on July 8, 2013 and August 26, 2013.
Reverse Stock Split
On March 5, 2014, we effected a three-for-two reverse stock split on our Common Stock.
Initial Public Offering
In March 2014, we completed our initial public offering or IPO in which we issued and sold 5,367 shares of common stock and existing shareholders sold 2,735 shares of common stock at a public offering price of $17 per share. We did not receive any proceeds from the sale of common stock by the existing shareholders. We received net proceeds of $81.9 million after deducting underwriting discounts and commissions of $6.4 million and other offering expenses of $2.9 million.
Liquidity and Capital Resources
Our primary liquidity needs are related to the funding of general business requirements, including working capital requirements, research and development, and capital expenditures. As of June 30, 2014, our principal sources of liquidity were $78.8 million of cash and cash equivalents.
In order to grow our business, we intend to increase our personnel and related expenses and to make significant investments in our platform, data centers and infrastructure generally. The timing and amount of these investments will vary based on the rate at which we can add new clients and new personnel and the scale of our application development, data center and other activities. Many of these investments will occur in advance of our experiencing any direct benefit from them which could negatively impact our liquidity and cash flows during any particular period and may make it difficult to determine if we are effectively allocating our resources. However, we expect to fund our operations, capital expenditures and other investments principally with cash flows from operations, and to the extent that our liquidity needs exceed our cash from operations, we would look to our cash on hand and available borrowings to satisfy those needs.
Our cash flows from investing activities and our cash flows from financing activities are influenced by the amount of funds held for clients which varies significantly from quarter to quarter. The balance of the funds we hold depends on our clients’ payroll calendar, and therefore such balance changes from period to period in accordance with the timing with each payroll cycle. Funds held for clients are restricted solely for the repayment of client fund obligations.
We believe our current cash and cash equivalents and cash flow from operations will be sufficient to meet our working capital, capital expenditure and other investment requirements for at least the next 12 months.
Cash Flows
The following table sets forth data regarding cash flows for the periods indicated:
|
|
|
Year Ended June 30, | ||||
|
|
|
2012 |
|
2013 |
|
2014 |
|
Net cash provided by operating activities |
|
$8,564 |
|
$6,228 |
|
$7,199 |
|
Cash flows from investing activities: |
|
|
|
|
|
|
|
Capitalized internally-developed software costs |
|
(3,716) |
|
(1,967) |
|
(4,349) |
|
Purchases of property and equipment |
|
(3,446) |
|
(3,987) |
|
(6,667) |
|
Payments for acquisitions |
|
— |
|
— |
|
(6,450) |
|
Net change in funds held for clients |
|
35,724 |
|
(92,650) |
|
(61,356) |
|
Net cash provided by (used in) investing activities |
|
28,562 |
|
(98,604) |
|
(78,822) |
|
Cash flows from financing activities: |
|
|
|
|
|
|
|
Net change in client funds obligation |
|
(35,724) |
|
92,650 |
|
61,356 |
|
Principal payments on long-term debt |
|
(312) |
|
(1,625) |
|
(1,563) |
|
Proceeds from IPO, net of issuance costs |
|
— |
|
— |
|
82,032 |
|
Capital contribution |
|
— |
|
— |
|
1,052 |
|
Proceeds from issuance of redeemable convertible Series B preferred stock |
|
27,234 |
|
— |
|
— |
|
Proceeds from exercise of stock options |
|
88 |
|
76 |
|
— |
|
Payments for redemption of common stock |
|
(27,371) |
|
(162) |
|
— |
|
Net cash provided by (used in) financing activities |
|
(36,085) |
|
90,939 |
|
142,877 |
|
Net increase (decrease) in cash and cash equivalents |
|
$1,041 |
|
$(1,437) |
|
$71,254 |
Operating Activities
Net cash provided by operating activities was $8.6 million, $6.2 million and $7.2 million for the years ended June 30, 2012, 2013 and 2014, respectively.
The increase in net cash provided by operating activities from fiscal 2013 to fiscal 2014 was the primarily the result of the change of $2.3 million in working capital partially offset by the increase in net loss and increases in non-cash items including stock-based compensation and depreciation and amortization. The decline in net cash provided by operating activities from fiscal 2012 to fiscal 2013 was primarily the result of a decrease of $1.1 million in net income, as well as a decline of $0.9 million in working capital, partially offset by increased depreciation and amortization.
Investing Activities
Changes in net cash (used in) provided by investing activities are significantly influenced by the amount of funds held for clients at the end of a reporting period. Changes in the amount of funds held for client from period to period will vary substantially. Our payroll processing activities involves the movement of significant funds from the account of an employer to employees and relevant taxing authorities. During the year ended June 30, 2014 we processed almost $39 billion in payroll transactions. Though we debit a client’s account prior to any disbursement on its behalf, there is a delay between our payment of amounts due to employees and taxing and other regulatory authorities and when the incoming funds from the client to cover these amounts payable actually clear into our operating accounts. We currently have agreements with nine banks to execute ACH and wire transfers to support our client payroll and tax services. We believe we have sufficient capacity under these ACH arrangements to handle our transactions for the foreseeable future.
Other investing activities that influence our net cash (used in) provided by investing activities are our capitalization of internally developed software costs and purchases of property and equipment.
Net cash (used in) provided by investing activities was $28.6 million, $(98.6) million and $(78.9) million, for the years ended June 30, 2012, 2013 and 2014, respectively.
Excluding the net change in funds held for clients, our net cash (used in) provided by investing activities was $(7.2) million, $(6.0) million and $(17.5) million, for the years ended June 30, 2012, 2013 and 2014, respectively.
The decrease in net cash used by investing activities of $19.7 from fiscal 2013 to fiscal 2014 was primarily due to the timing of receipts and disbursements of cash and cash equivalents held to satisfy client funds obligations of $31.3 million partially offset by payments of $6.5 million to acquire certain assets of one of our resellers, increased purchases of property and equipment by $2.7 million and increased capitalization of internally developed software costs by $2.4 million.
The increase of $127.2 million in net cash used in investing activities from fiscal 2012 to fiscal 2013 was primarily the result of the timing of receipts and disbursements of cash and cash equivalents held to satisfy client fund obligations of $128.4 million partially offset by a decrease of $1.7 million in capitalized internally developed software costs.
Financing Activities
Net cash provided by (used in) financing activities was $(36.1) million, $90.9 million and $142.9 million for the years ended June 30, 2012, 2013 and 2014, respectively.
The increase in net cash provided by financing activities from fiscal 2013 to fiscal 2014 was primarily the result of the $82.0 million in proceeds received from our IPO, net of issuance costs. This was partially offset by the $31.3 million change on the net change in funds held for clients. The decrease in net cash used in financing activities from fiscal 2012 to fiscal 2013 was primarily the result of a $128.4 million change in the net change in funds held for clients, partially offset by a net increase of $1.3 million of principal payments on long-term debt.
Contractual Obligations and Commitments
Our principal commitments consist of operating lease obligations and consideration due to one of our resellers to complete the purchase of certain of its assets. The following table summarizes our contractual obligations at June 30, 2014:
|
|
|
Payment Due By Period | ||||||||
|
|
|
Total |
|
Less than |
|
1 - 3 Years |
|
3 - 5 Years |
|
More than |
|
Operating lease obligations |
|
$17,350 |
|
$3,353 |
|
$6,749 |
|
$5,611 |
|
$1,637 |
|
Unconditional purchase obligations |
|
1,224 |
|
406 |
|
818 |
|
— |
|
— |
|
Consideration related to acquisition |
|
2,985 |
|
2,985 |
|
— |
|
— |
|
— |
|
|
|
$21,559 |
|
$6,744 |
|
$7,567 |
|
$5,611 |
|
$1,637 |
Each of our two reseller agreements provided that we are required upon a termination of the agreement to acquire the assets of the reseller. One of the agreements provided that either party may terminate the agreement by electing not to renew the agreement beyond its original term ending in February 2016 unless renewed. We, but not the reseller, also had the right to terminate the agreement at any time following the completion of an initial public offering by the Company. We paid this reseller $1.7 million, $2.4 million and $2.5 million for the full fiscal years 2012, 2013 and 2014, respectively. We exercised our right to terminate the agreement in April 2014 and closed on the purchase of the reseller’s client base in May 2014 at a total purchase price of $9.4 million.
The second reseller agreement provides that the reseller may terminate the agreement by providing nine months’ prior notice or upon an initial public offering by the Company. We amended this agreement in December of 2013 to provide that the reseller may not give a nine-month termination notice until after the earlier of (i) six months following the closing of an initial public offering by us or (ii) December 31, 2014. In addition, we, but not the reseller, now have the right to terminate the agreement at any time after the date that is six months following the completion of an initial public offering by us. If a termination were to occur, the purchase price of the assets would be equal to 3.3 times the net revenues of the reseller for the 12 months preceding the termination effective date. We paid this reseller $1.3 million, $1.8 million and $2.1 million for the full fiscal years 2012, 2013 and 2014, respectively.
Capital Expenditures
We expect to increase capital spending as we continue to grow our business and expand and enhance our data centers and technical infrastructure. Future capital requirements will depend on many factors, including our rate of sales growth. In the event that our sales growth or other factors do not meet our expectations, we may eliminate or curtail capital projects in order to mitigate the impact on our use of cash. Capital expenditures were $3.4 million, $4.0 million and $6.7 million for the years ended June 30, 2012, 2013 and 2014, respectively, exclusive of capitalized internally developed software costs of $3.7 million, $2.0 million, and $4.3 million for the same periods, respectively.
Off-Balance Sheet Arrangements
We do not have any off-balance sheet arrangements that have or are reasonably likely to have a current or future effect on our financial condition, changes in financial condition, revenues or expenses, results of operations, liquidity, capital expenditures or capital resources that may be material to investors.
New Accounting Pronouncements
In May 2014, the Financial Accounting Standard Board (FASB) issued ASU 2014-09, Revenue from Contracts with Customers (Topic 606) (“ASU 2014-09”). ASU 2014-09 supersedes a majority of existing revenue recognition guidance under US GAAP, and requires companies to recognize revenue when it transfers goods or services to a customer in an amount that reflects the consideration to which a company expects to be entitled. Companies may need to apply more judgment and estimation techniques or methods while recognizing revenue, which could result in additional disclosures to the financial statements. Topic 606 allows for either a “full retrospective” adoption or a “modified retrospective” adoption. The Company is currently evaluating which adoption method it will use. Early application is not permitted. The Company plans on adopting ASU 2014-09 beginning July 1, 2017 and is currently assessing the potential effects of these changes to its consolidated financial statements.
Although we are eligible under the JOBS Act to delay adoption of new or revised financial accounting standards until they are applicable to private companies, we have elected not to avail ourselves of this exclusion. This election by us is irrevocable.
Item 7A. Quantitative and Qualitative Disclosures about Market Risk.
We have operations solely in the United States and are exposed to market risks in the ordinary course of our business. These risks primarily include interest rate and certain exposure as well as risks relating to changes in the general economic conditions in the United States. We have not used, nor do we intend to use, derivatives to mitigate the impact of interest rate or other exposure or for trading or speculative purposes.
Interest Rate Risk
Funds held for clients are held in interest-bearing accounts at financial institutions. As a result of our investing activities, we are exposed to changes in interest rates that may materially affect our results of operations. In a falling rate environment, a decline in interest rates would decrease our interest income.
Inflation Risk
We do not believe that inflation has had a material effect on our business, financial condition or results of operations. Nonetheless, if our costs were to become subject to significant inflationary pressures, we may not be able to fully offset such higher costs through price increases. Our inability or failure to do so could harm our business, financial condition and results of operations.
Item 8. Financial Statements and Supplementary Data.
The information required by this item is incorporated by reference to the consolidated financial statements and accompanying notes set forth on pages F-1 through F-23 of this Annual Report on Form 10-K.
Item 9. Changes in and Disagreements With Accountants on Accounting and Financial Disclosure.
None.
Item 9A. Controls and Procedures.
Disclosure Controls and Procedures
The term “disclosure controls and procedures,” as defined in Rules 13a-15(e) and 15d-15(e) under the Exchange Act refers to controls and procedures that are designed to ensure that information required to be disclosed by a company in the reports that it files or submits under the Exchange Act is recorded, processed, summarized and reported, within the time periods specified in the SEC’s rules and forms. Disclosure controls and procedures include, without limitation, controls and procedures designed to ensure that such information is accumulated and communicated to a company’s management, including its principal executive and principal financial officers, as appropriate to allow timely decisions regarding required disclosure.
Our management, with the participation of our Chief Executive Officer and Chief Financial Officer, has evaluated the effectiveness of our disclosure controls and procedures as of June 30, 2014, the end of the period covered by this Annual Report on Form 10-K. Based upon such evaluation, our Chief Executive Officer and Chief Financial Officer have concluded that our disclosure controls and procedures were effective as of such date.
Management’s Report on Internal Control Over Financial Reporting and Attestation Report of the Registered Public Accounting Firm
This Annual Report on Form 10-K does not include a report of management’s assessment regarding internal control over financial reporting or an attestation report of our registered public accounting firm due to a transition period established by rules of the SEC for newly public companies and our status as an “emerging growth company” under the JOBS Act.
Changes in Internal Control Over Financial Reporting
There were no changes in our internal control over financial reporting during the quarter ended June 30, 2014, which were identified in connection with management’s evaluation required by Rules 13a-15(d) and 15d-15(d) under the Exchange Act, that have materially affected, or are reasonably likely to materially affect, our internal control over financial reporting.
Limitations on Controls
Our disclosure controls and procedures and internal control over financial reporting are designed to provide reasonable assurance of achieving their objectives as specified above. Management does not expect, however, that our disclosure controls and procedures or our internal control over financial reporting will prevent or detect all error and fraud. Any control system, no matter how well designed and operated, is based upon certain assumptions and can provide only reasonable, not absolute, assurance that its objectives will be met. Further, no evaluation of controls can provide absolute assurance that misstatements due to error or fraud will not occur or that all control issues and instances of fraud, if any, within the Company have been detected.
None.
Item 10. Directors, Executive Officers and Corporate Governance
Information required by Part III, Item 10, will be included in our Proxy Statement relating to our 2014 annual meeting of stockholders to be filed with the SEC within 120 days after the end of our fiscal year ended June 30, 2014, and is incorporated herein by reference.
Item 11. Executive Compensation
Information required by Part III, Item 11, will be included in our Proxy Statement relating to our 2014 annual meeting of stockholders to be filed with the SEC within 120 days after the end of our fiscal year ended June 30, 2014, and is incorporated herein by reference.
Item 12. Security Ownership of Certain Beneficial Owners and Management and Related Stockholder Matters.
Information required by Part III, Item 12, will be included in our Proxy Statement relating to our 2014 annual meeting of stockholders to be filed with the SEC within 120 days after the end of our fiscal year ended June 30, 2014, and is incorporated herein by reference.
Item 13. Certain Relationships and Related Transactions, and Director Independence.
Information required by Part III, Item 13, will be included in our Proxy Statement relating to our 2014 annual meeting of stockholders to be filed with the SEC within 120 days after the end of our fiscal year ended June 30, 2014, and is incorporated herein by reference.
Item 14. Principal Accounting Fees and Services.
Information required by Part III, Item 14, will be included in our Proxy Statement relating to our 2014 annual meeting of stockholders to be filed with the SEC within 120 days after the end of our fiscal year ended June 30, 2014, and is incorporated herein by reference.
Item 15. Exhibits and Financial Statement Schedules
(a) Documents Filed with Report
(1) Financial Statements.
|
|
|
|
|
|
Report of Independent Registered Public Accounting Firm |
|
F-2 |
|
|
|
|
|
|
|
Consolidated Balance Sheets as of June 30, 2013 and 2014 |
|
F-3 |
|
|
|
|
|
|
|
Consolidated Statements of Operations for the years ended June 30, 2012, 2013 and 2014 |
|
F-4 |
|
|
|
|
|
|
|
Consolidated Statements of Changes in Redeemable Convertible Preferred Stock and Stockholders’ Equity (Deficit) for the years ended June 30, 2012, 2013 and 2014 |
|
F-5 |
|
|
|
|
|
|
|
Consolidated Statements of Cash Flows for the years ended June 30, 2012, 2013 and 2014 |
|
F-6 |
|
|
|
|
|
|
|
Notes to Consolidated Financial Statements |
|
F-7 |
|
(2) Exhibits.
The information required by this Item is set forth on the exhibit index that follows the signature page of this Annual Report on Form 10-K.
Pursuant to the requirements of Section 13 or 15(d) of the Securities Exchange Act of 1934, the registrant has duly caused this report to be signed on its behalf by the undersigned, thereunto duly authorized.
Date: August 22, 2014
|
|
|
| |
|
|
PAYLOCITY HOLDING CORPORATION | ||
|
|
|
| |
|
|
By: |
/s/ Steven R. Beauchamp | |
|
|
|
Steven R. Beauchamp | |
|
|
|
President and Chief Executive Officer | |
SIGNATURES AND POWER OF ATTORNEY
Each person whose individual signature appears below hereby authorizes and appoints Steven R. Beauchamp and Peter J. McGrail, and each of them, with full power of substitution and resubstitution and full power to act without the other, as his or her true and lawful attorney-in-fact and agent to act in his or her name, place and stead and to execute in the name and on behalf of each person, individually and in each capacity stated below, and to file any and all amendments to this Annual Report on Form 10-K, and to file the same, with all exhibits thereto, and other documents in connection therewith, with the Securities and Exchange Commission, granting unto said attorneys-in-fact and agents, and each of them, full power and authority to do and perform each and every act and thing, ratifying and confirming all that said attorneys-in-fact and agents or any of them or their or his substitute or substitutes may lawfully do or cause to be done by virtue thereof.
Pursuant to the requirements of the Securities Exchange Act of 1934, this report has been signed below by the following persons on behalf of the registrant and in the capacities indicated.
|
Signature |
|
Title |
|
Date |
|
|
|
|
|
|
|
/s/ Steven R. Beauchamp |
|
President, Chief Executive Officer (Principal Executive Officer) and Director |
|
August 22, 2014 |
|
Steven R. Beauchamp |
|
|
|
|
|
|
|
|
|
|
|
/s/ Peter J. McGrail |
|
Chief Financial Officer (Principal Financial Officer) |
|
August 22, 2014 |
|
Peter J. McGrail |
|
|
|
|
|
|
|
|
|
|
|
/s/ Steven I. Sarowitz |
|
Chairman of the Board of Directors |
|
August 22, 2014 |
|
Steven I. Sarowitz |
|
|
|
|
|
|
|
|
|
|
|
/s/ Jeffrey T. Diehl |
|
Director |
|
August 22, 2014 |
|
Jeffrey T. Diehl |
|
|
|
|
|
|
|
|
|
|
|
/s/ Mark H. Mishler |
|
Director |
|
August 22, 2014 |
|
Mark H. Mishler |
|
|
|
|
|
|
|
|
|
|
|
/s/ Ronald V. Waters, III |
|
Director |
|
August 22, 2014 |
|
Ronald V. Waters, III |
|
|
|
|
INDEX TO CONSOLIDATED FINANCIAL STATEMENTS
|
|
Page |
|
Consolidated Financial Statements: |
|
|
F-2 | |
|
F-3 | |
|
Consolidated Statements of Operations for the years ended June 30, 2012, 2013 and 2014 |
F-4 |
|
F-5 | |
|
Consolidated Statements of Cash Flows for the years ended June 30, 2012, 2013 and 2014 |
F-6 |
|
F-7 |
REPORT OF INDEPENDENT REGISTERED PUBLIC ACCOUNTING FIRM
The Board of Directors and Stockholders
Paylocity Holding Corporation:
We have audited the accompanying consolidated balance sheets of Paylocity Holding Corporation (the “Company”) and subsidiary as of June 30, 2013 and 2014, and the related consolidated statements of operations, changes in redeemable convertible stock and stockholders’ equity (deficit), and cash flows for each of the years in the three-year period ended June 30, 2014. These consolidated financial statements are the responsibility of the Company’s management. Our responsibility is to express an opinion on these consolidated financial statements based on our audits.
We conducted our audits in accordance with the standards of the Public Company Accounting Oversight Board (United States). Those standards require that we plan and perform the audit to obtain reasonable assurance about whether the financial statements are free of material misstatement. An audit includes examining, on a test basis, evidence supporting the amounts and disclosures in the financial statements. An audit also includes assessing the accounting principles used and significant estimates made by management, as well as evaluating the overall financial statements presentation. We believe that our audits provide a reasonable basis for our opinion.
In our opinion, the consolidated financial statements referred to above present fairly, in all material respects, the financial position of Paylocity Holding Corporation and subsidiary as of June 30, 2013 and 2014, and the results of their operations and their cash flows for each of the years in the three-year period ended June 30, 2014, in conformity with U.S. generally accepted accounting principles.
|
|
/s/ KPMG LLP |
Chicago, Illinois
August 22, 2014
PAYLOCITY HOLDING CORPORATION
(in thousands, except share and per share data)
|
|
|
As of June 30, |
| ||
|
Assets |
|
2013 |
|
2014 |
|
|
Current assets: |
|
|
|
|
|
|
Cash and cash equivalents |
|
$7,594 |
|
$78,848 |
|
|
Accounts receivable, net |
|
740 |
|
756 |
|
|
Prepaid expenses and other |
|
1,875 |
|
2,694 |
|
|
Deferred income tax assets, net |
|
602 |
|
706 |
|
|
|
|
|
|
|
|
|
Total current assets before funds held for clients |
|
10,811 |
|
83,004 |
|
|
Funds held for clients |
|
355,905 |
|
417,261 |
|
|
|
|
|
|
|
|
|
Total current assets |
|
366,716 |
|
500,265 |
|
|
|
|
|
|
|
|
|
Long-term prepaid expenses |
|
— |
|
313 |
|
|
Capitalized software, net |
|
2,614 |
|
5,093 |
|
|
Property and equipment, net |
|
8,586 |
|
13,125 |
|
|
Intangible assets, net |
|
— |
|
6,320 |
|
|
Goodwill |
|
— |
|
3,035 |
|
|
|
|
|
|
|
|
|
Total assets |
|
$377,916 |
|
$528,151 |
|
|
|
|
|
|
|
|
|
Liabilities, Redeemable Convertible Preferred Stock and Stockholders’ Equity (Deficit) |
|
|
|
|
|
|
|
|
|
|
|
|
|
Current liabilities: |
|
|
|
|
|
|
|
|
|
|
|
|
|
Current portion of long-term debt |
|
$625 |
|
$— |
|
|
Accounts payable |
|
880 |
|
2,133 |
|
|
Taxes payable |
|
207 |
|
5 |
|
|
Consideration related to acquisition |
|
— |
|
2,985 |
|
|
Accrued expenses |
|
6,794 |
|
10,744 |
|
|
|
|
|
|
|
|
|
Total current liabilities before client fund obligations |
|
8,506 |
|
15,867 |
|
|
Client fund obligations |
|
355,905 |
|
417,261 |
|
|
|
|
|
|
|
|
|
Total current liabilities |
|
364,411 |
|
433,128 |
|
|
Long-term debt, net of current portion |
|
938 |
|
— |
|
|
Deferred rent |
|
2,317 |
|
3,175 |
|
|
Deferred income tax liabilities, net |
|
269 |
|
714 |
|
|
|
|
|
|
|
|
|
Total liabilities |
|
$367,935 |
|
$437,017 |
|
|
|
|
|
|
|
|
|
Redeemable convertible preferred stock, $0.001 par value, 18,000 authorized as of June 30, 2013 and no shares authorized as of June 30, 2014 |
|
|
|
|
|
|
Series A, 6% cumulative dividend, 9,500 shares issued and outstanding at June 30, 2013 and no shares issued and outstanding at June 30, 2014 |
|
$9,339 |
|
$— |
|
|
Series B, 8% cumulative dividend, 8,400 shares issued and outstanding at June 30, 2013 and no shares issued and outstanding at June 30, 2014 |
|
27,234 |
|
— |
|
|
|
|
|
|
|
|
|
Stockholders’ equity (deficit) |
|
|
|
|
|
|
Common stock, $0.001 par value, 66,667 shares authorized, 31,988 shares issued and outstanding at June 30, 2013; and 155,000 shares authorized, 49,564 shares issued and outstanding at June 30, 2014 |
|
32 |
|
50 |
|
|
Preferred stock, $0.001 par value, no shares authorized, issued and outstanding at June 30, 2013 and 5,000 authorized, no shares issued and outstanding at June 30, 2014 |
|
— |
|
— |
|
|
Additional paid-in capital |
|
437 |
|
125,255 |
|
|
Accumulated deficit |
|
(27,061) |
|
(34,171) |
|
|
Total stockholders’ equity (deficit) |
|
(26,592) |
|
$91,134 |
|
|
Total liabilities, redeemable convertible preferred stock, and stockholders’ equity (deficit) |
|
$377,916 |
|
$528,151 |
|
See accompanying notes to consolidated financial statements.
PAYLOCITY HOLDING CORPORATION
Consolidated Statements of Operations
(in thousands, except share and per share data)
|
|
|
For the Years Ended June 30, |
| ||||
|
|
|
2012 |
|
2013 |
|
2014 |
|
|
Revenues |
|
|
|
|
|
|
|
|
Recurring fees |
|
$51,211 |
|
$71,309 |
|
$100,362 |
|
|
Interest income on funds held for clients |
|
1,263 |
|
1,459 |
|
1,582 |
|
|
|
|
|
|
|
|
|
|
|
Total recurring revenues |
|
52,474 |
|
72,768 |
|
101,944 |
|
|
Implementation services and other |
|
2,622 |
|
4,526 |
|
6,743 |
|
|
|
|
|
|
|
|
|
|
|
Total revenues |
|
55,096 |
|
77,294 |
|
108,687 |
|
|
Cost of revenues |
|
|
|
|
|
|
|
|
Recurring revenues |
|
22,054 |
|
28,863 |
|
37,319 |
|
|
Implementation services and other |
|
7,040 |
|
10,803 |
|
17,775 |
|
|
|
|
|
|
|
|
|
|
|
Total cost of revenues |
|
29,094 |
|
39,666 |
|
55,094 |
|
|
|
|
|
|
|
|
|
|
|
Gross profit |
|
26,002 |
|
37,628 |
|
53,593 |
|
|
Operating expenses |
|
|
|
|
|
|
|
|
Sales and marketing |
|
12,828 |
|
18,693 |
|
28,276 |
|
|
Research and development |
|
1,788 |
|
6,825 |
|
10,355 |
|
|
General and administrative |
|
8,618 |
|
12,079 |
|
21,980 |
|
|
|
|
|
|
|
|
|
|
|
Total operating expenses |
|
23,234 |
|
37,597 |
|
60,611 |
|
|
|
|
|
|
|
|
|
|
|
Operating income (loss) |
|
2,768 |
|
31 |
|
(7,018) |
|
|
Other income (expense) |
|
(196) |
|
(16) |
|
163 |
|
|
|
|
|
|
|
|
|
|
|
Income (loss) before income taxes |
|
2,572 |
|
15 |
|
(6,855) |
|
|
Income tax (benefit) expense |
|
884 |
|
(602) |
|
255 |
|
|
|
|
|
|
|
|
|
|
|
Net income (loss) |
|
$1,688 |
|
$617 |
|
$(7,110) |
|
|
|
|
|
|
|
|
|
|
|
Net income (loss) attributable to common stockholders |
|
$998 |
|
$(2,291) |
|
$(9,392) |
|
|
|
|
|
|
|
|
|
|
|
Net income (loss) per share attributable to common stockholders: |
|
|
|
|
|
|
|
|
Basic |
|
$0.02 |
|
$(0.07) |
|
$(0.26) |
|
|
Diluted |
|
$0.02 |
|
$(0.07) |
|
$(0.26) |
|
|
|
|
|
|
|
|
|
|
|
Weighted-average shares used in computing net income (loss) per share attributable to common stockholders: |
|
|
|
|
|
|
|
|
Basic |
|
43,873 |
|
31,988 |
|
36,707 |
|
|
Diluted |
|
44,317 |
|
31,988 |
|
36,707 |
|
See accompanying notes to consolidated financial statements.
PAYLOCITY HOLDING CORPORATION
Consolidated Statements of Changes in Redeemable Convertible Preferred Stock and Stockholders’ Equity (Deficit)
(in thousands)
|
|
|
Redeemable Convertible |
|
Stockholders’ Equity (Deficit) |
| ||||||||||||||
|
|
|
Preferred— |
|
Preferred— |
|
Common Stock |
|
Additional |
|
Accumulated |
|
Total |
| ||||||
|
|
|
Shares |
|
Amount |
|
Shares |
|
Amount |
|
Shares |
|
Amount |
|
Capital |
|
Deficit |
|
(Deficit) |
|
|
Balances at June 30, 2011 |
|
9,500 |
|
$9,339 |
|
— |
|
$— |
|
37,539 |
|
$38 |
|
$4,304 |
|
$(6,596) |
|
$(2,254) |
|
|
Stock-based compensation expense |
|
— |
|
— |
|
— |
|
— |
|
— |
|
— |
|
203 |
|
— |
|
203 |
|
|
Stock options exercised |
|
— |
|
— |
|
— |
|
— |
|
67 |
|
— |
|
88 |
|
— |
|
88 |
|
|
Issuance of Preferred Series B Shares |
|
— |
|
— |
|
8,400 |
|
27,234 |
|
— |
|
— |
|
— |
|
— |
|
— |
|
|
Redemption of Common Stock |
|
— |
|
— |
|
— |
|
— |
|
(5,618) |
|
(6) |
|
(4,595) |
|
(22,770) |
|
(27,371) |
|
|
Net income |
|
— |
|
— |
|
— |
|
— |
|
— |
|
— |
|
— |
|
1,688 |
|
1,688 |
|
|
Balances at June 30, 2012 |
|
9,500 |
|
9,339 |
|
8,400 |
|
27,234 |
|
31,988 |
|
32 |
|
— |
|
(27,678) |
|
(27,646) |
|
|
Stock-based compensation expense |
|
— |
|
— |
|
— |
|
— |
|
— |
|
— |
|
523 |
|
— |
|
523 |
|
|
Stock options exercised |
|
— |
|
— |
|
— |
|
— |
|
33 |
|
— |
|
76 |
|
— |
|
76 |
|
|
Redemption of Common Stock |
|
— |
|
— |
|
— |
|
— |
|
(33) |
|
— |
|
(162) |
|
— |
|
(162) |
|
|
Net income |
|
— |
|
— |
|
— |
|
— |
|
— |
|
— |
|
— |
|
617 |
|
617 |
|
|
Balances at June 30, 2013 |
|
9,500 |
|
$9,339 |
|
8,400 |
|
$27,234 |
|
31,988 |
|
$32 |
|
$437 |
|
$(27,061) |
|
$(26,592) |
|
|
Initial public offering, net of issuance costs |
|
— |
|
— |
|
— |
|
— |
|
5,367 |
|
6 |
|
81,921 |
|
— |
|
81,927 |
|
|
Conversion of redeemable convertible preferred stock |
|
(9,500) |
|
(9,339) |
|
(8,400) |
|
(27,234) |
|
11,933 |
|
12 |
|
36,561 |
|
— |
|
36,573 |
|
|
Capital contribution |
|
— |
|
— |
|
— |
|
— |
|
— |
|
— |
|
1,052 |
|
— |
|
1,052 |
|
|
Vesting of restricted shares |
|
— |
|
— |
|
— |
|
— |
|
276 |
|
— |
|
— |
|
— |
|
— |
|
|
Stock-based compensation expense |
|
— |
|
— |
|
— |
|
— |
|
— |
|
— |
|
5,284 |
|
— |
|
5,284 |
|
|
Net loss |
|
— |
|
— |
|
— |
|
— |
|
— |
|
— |
|
— |
|
(7,110) |
|
(7,110) |
|
|
Balances at June 30, 2014 |
|
— |
|
$— |
|
— |
|
$— |
|
49,564 |
|
$50 |
|
$125,255 |
|
$(34, 171) |
|
$91,134 |
|
See accompanying notes to consolidated financial statements.
PAYLOCITY HOLDING CORPORATION
Consolidated Statements of Cash Flows
(in thousands)
|
|
|
For the Years Ended June 30, |
| ||||
|
|
|
2012 |
|
2013 |
|
2014 |
|
|
Cash flows provided by operating activities: |
|
|
|
|
|
|
|
|
|
|
|
|
|
|
|
|
|
Net income (loss) |
|
$1,688 |
|
$617 |
|
$(7,110) |
|
|
Adjustments to reconcile net income to net cash provided by operating activities: |
|
|
|
|
|
|
|
|
Stock-based compensation |
|
203 |
|
523 |
|
4,929 |
|
|
Depreciation and amortization |
|
4,624 |
|
5,571 |
|
6,336 |
|
|
Deferred income tax (benefit) expense |
|
838 |
|
(822) |
|
341 |
|
|
Provision for doubtful accounts |
|
60 |
|
60 |
|
62 |
|
|
Loss on disposal of equipment |
|
— |
|
— |
|
98 |
|
|
Changes in operating assets and liabilities: |
|
|
|
|
|
|
|
|
Accounts receivable |
|
287 |
|
(295) |
|
(78) |
|
|
Prepaid expenses |
|
(247) |
|
(1,061) |
|
(1,132) |
|
|
Trade accounts payable |
|
102 |
|
138 |
|
465 |
|
|
Accrued expenses |
|
1,009 |
|
1,497 |
|
3,288 |
|
|
Net cash provided by operating activities |
|
8,564 |
|
6,228 |
|
7,199 |
|
|
|
|
|
|
|
|
|
|
|
Cash flows from investing activities: |
|
|
|
|
|
|
|
|
Capitalized internally developed software costs |
|
(3,716) |
|
(1,967) |
|
(4,349) |
|
|
Purchases of property and equipment |
|
(3,446) |
|
(3,987) |
|
(6,667) |
|
|
Payments for acquisition |
|
— |
|
— |
|
(6,450) |
|
|
Net change in funds held for clients |
|
35,724 |
|
(92,650) |
|
(61,356) |
|
|
Net cash provided by (used in) investing activities |
|
28,562 |
|
(98,604) |
|
(78,822) |
|
|
|
|
|
|
|
|
|
|
|
Cash flows from financing activities: |
|
|
|
|
|
|
|
|
Net change in client funds obligation |
|
(35,724) |
|
92,650 |
|
61,356 |
|
|
Principal payments on long-term debt |
|
(312) |
|
(1,625) |
|
(1,563) |
|
|
Proceeds from initial public offering, net of issuance costs |
|
— |
|
— |
|
82,032 |
|
|
Capital contribution |
|
— |
|
— |
|
1,052 |
|
|
Proceeds from issuance of Redeemable Convertible Preferred Series B Shares |
|
27,234 |
|
— |
|
— |
|
|
Proceeds from exercise of stock options |
|
88 |
|
76 |
|
— |
|
|
Payments for redemption of Common Shares |
|
(27,371) |
|
(162) |
|
— |
|
|
Net cash (used in) provided by financing activities |
|
(36,085) |
|
90,939 |
|
142,877 |
|
|
Net Change in Cash and Cash Equivalents |
|
1,041 |
|
(1,437) |
|
71,254 |
|
|
Cash and Cash Equivalents—Beginning of Year |
|
7,990 |
|
9,031 |
|
7,594 |
|
|
Cash and Cash Equivalents—End of Year |
|
$9,031 |
|
$7,594 |
|
$78,848 |
|
|
Supplemental Disclosure of Non-Cash Investing and Financing Activities |
|
|
|
|
|
|
|
|
|
|
|
|
|
|
|
|
|
Build-out allowance received from landlord |
|
$333 |
|
$325 |
|
$1,162 |
|
|
Purchase of property and equipment, accrued but not paid |
|
$392 |
|
$27 |
|
$896 |
|
|
Unpaid initial offering costs |
|
— |
|
— |
|
$75 |
|
|
Supplemental disclosure of cash flow information |
|
|
|
|
|
|
|
|
Cash paid for income taxes |
|
$7 |
|
$69 |
|
$106 |
|
|
Cash paid for interest |
|
$161 |
|
$385 |
|
$70 |
|
See accompanying notes to consolidated financial statements.
PAYLOCITY HOLDING CORPORATION
Notes to the Consolidated Financial Statements
(all amounts in thousands, except per share data)
(1) Organization and Description of Business
Paylocity Holding Corporation (the “Company”) is a cloud-based provider of payroll and human capital management software solutions for medium-sized organizations. Services are provided in a Software-as-a-Service (“SaaS”) delivery model utilizing the Company’s cloud-based platform. Payroll services include collection, remittance and reporting of payroll liabilities to the appropriate federal, state and local authorities.
The Company was formed on November 6, 2013 at which time Paylocity Corporation became a wholly-owned subsidiary resulting in the inclusion of Paylocity Corporation in the consolidated financial statements of Paylocity Holding Corporation. All holders of Paylocity Corporation equity instruments at the time were issued Paylocity Holding Corporation equity instruments with identical rights and obligations in exchange for their Paylocity Corporation equity instruments. Upon the completion of these transactions, Paylocity Holding Corporation became the sole stockholder of Paylocity Corporation.
In March 2014, the Company amended its Certificate of Incorporation to execute a reverse three for two stock split on its common stock. All share and per share amounts in the Company’s audited consolidated financial statements and notes to the financial statement reflect the impact of this change on the number of shares authorized, issued, and outstanding and earnings per share.
Initial Public Offering
In March 2014, the Company completed its initial public offering (“IPO”) in which it issued and sold 5,367 shares of common stock and existing shareholders sold 2,735 shares of common stock at a public offering price of $17 per share. The Company did not receive any proceeds from the sale of common stock by the existing shareholders. The Company received net proceeds of $81,927 after deducting underwriting discounts and commissions of $6,387 and other offering expenses of $2,925. Upon the closing of the IPO, all shares of the Company’s then-outstanding redeemable convertible preferred stock automatically converted into 11,933 shares of its $0.001 par value common stock.
In connection with the IPO, in March 2014, the Company amended its Certificate of Incorporation to increase the number of authorized common stock to 155,000 and reduce the number of authorized preferred stock to 5,000.
(2) Summary of Significant Accounting Policies
(a) Basis of Presentation, Consolidation, and Use of Estimates
The accompanying consolidated financial statements of the Company have been prepared pursuant to the rules and regulations of the United States Securities and Exchange Commission (the “SEC”).
The preparation of consolidated financial statements in conformity with U.S. generally accepted accounting principles (“GAAP”) requires management to make estimates and assumptions that affect the reported amounts of assets and liabilities and disclosure of contingent assets and liabilities at the date of the consolidated financial statements and the reported amounts of revenues and expenses during the reporting period. Actual results could differ from those estimates. Significant items subject to such estimates and assumptions include the allowance for doubtful accounts, software developed for internal use, valuation and useful lives of long-lived assets, definite-lived intangibles, goodwill, stock-based compensation, valuation of net deferred income tax assets and the best estimate of selling price for revenue recognition purposes. Future events and their effects cannot be predicted with certainty; accordingly, accounting estimates require the exercise of judgment. Accounting estimates used in the preparation of these consolidated financial statements change as new events occur, as more experience is acquired, as additional information is obtained and as the operating environment changes.
The consolidated financial statements reflect the financial position and operating results of Paylocity Holding Corporation and include its wholly-owned subsidiary Paylocity Corporation. Intercompany accounts and transactions have been eliminated in consolidation.
(b) Concentrations of Risk
The Company regularly maintains cash balances that exceed Federal Depository Insurance Corporation limits. No individual client represents 10% or more of total revenues. For all periods presented, 100% of total revenues were generated by clients in the United States.
(c) Cash and Cash Equivalents
The Company considers all highly liquid investments with a maturity of three months or less when purchased to be cash equivalents.
(d) Accounts Receivable
Accounts receivable are recorded at the invoiced amount and do not bear interest. Amounts collected on trade accounts receivable are included in net cash provided by operating activities in the statements of cash flows. The Company maintains an allowance for doubtful accounts reflecting estimated potential losses in its accounts receivable portfolio. In establishing the required allowance, management considers historical losses adjusted to take into account current market conditions and our clients’ financial conditions, the amount of receivables in dispute, the current receivables aging and current payment patterns. The Company reviews its allowance for doubtful accounts quarterly. Past due balances over 60 days and over a specified amount are reviewed individually for collectability. All other balances are reviewed on a pooled basis. Account balances are charged off against the allowance after all commercially reasonable means of collection have been exhausted and the potential for recovery is considered remote. The Company does not have any off-balance-sheet credit exposure related to its clients.
Activity in the allowance for doubtful accounts was as follows:
|
|
|
For the Years Ended June 30, | ||||
|
|
|
2012 |
|
2013 |
|
2014 |
|
Balance at the beginning of the year |
|
$80 |
|
$114 |
|
$118 |
|
Charged to expense |
|
60 |
|
60 |
|
62 |
|
Write-offs |
|
(26) |
|
(56) |
|
(54) |
|
Balance at the end of the year |
|
$114 |
|
$118 |
|
$126 |
(e) Prepaid expenses and other assets
Prepaid expenses and other current assets consist of office space security deposits, deposits with vendors, prepaid licensing fees, supplies, and time clocks available for sale or lease.
(f) Property and Equipment and Long-Lived Assets
Property and equipment are stated at cost. Depreciation on property and equipment is calculated on the straight-line method over the estimated useful lives of the assets, generally three to seven years for most classes of assets, or over the term of the related lease for leasehold improvements.
Long-lived assets, such as property and equipment, are reviewed for impairment whenever events or changes in circumstances indicate that the carrying amount of an asset may not be recoverable. If circumstances require a long-lived asset or asset group be tested for possible impairment, the Company first compares the undiscounted cash flows expected to be generated by that asset or asset group to its carrying amount. If the carrying amount of the long-lived asset or asset group is not recoverable on an undiscounted cash flow basis, an impairment is recognized to the extent that the carrying amount exceeds its fair value. Fair value is determined through various valuation techniques including discounted cash flow models, quoted market values and third-party independent appraisals, as considered necessary.
(g) Internal-Use Software
The Company applies ASC 350-40, Intangibles—Goodwill and Other—Internal-Use Software, to the accounting for costs of internal-use software. Software development costs are capitalized when application development begins, it is probable that the project will be completed, and the software will be used as intended. Costs associated with preliminary project stage activities, training, maintenance and all other post implementation stage activities are expensed as incurred. The Company also capitalizes certain costs related to specific upgrades and enhancements when it is probable the expenditures will result in significant additional functionality. The capitalization policy provides for the capitalization of certain payroll costs for employees who are directly associated with developing internal-use software as well as certain external direct costs. Capitalized employee costs are limited to the time directly spent on such projects.
Capitalized internal-use software costs are amortized on a straight-line basis over the estimated useful lives, generally 18 to 24 months, depending on the expected life of the application enhancement. Management evaluates the useful lives of these assets on an annual basis and tests for impairment whenever events or changes in circumstances occur that could impact the recoverability of these assets.
(h) Goodwill and other intangible assets, net of accumulated amortization
Goodwill is an asset representing the future economic benefits arising from other assets acquired in a business combination that are not individually identified and separately recognized. As described in Note 5, the Company has recorded goodwill in connection with the acquisition of BFKMS, Inc. Goodwill is not amortized, but instead is tested for impairment at least annually. ASU 2011-08, Testing Goodwill for Impairment provides an entity the option to perform a qualitative assessment to determine whether it is more-likely-than-not that the fair value of a reporting unit is less than its carrying amount prior to performing the two-step impairment test. If it is the case that the estimated fair value of a reporting unit is less than its carrying amount, including goodwill, the two-step goodwill impairment test is required. Otherwise no further analysis is required.
If the two-step goodwill impairment test is required, first the fair value of the reporting unit is compared with its carrying amount, including goodwill. If the fair value of the reporting unit is less than its carrying amount, an indication of goodwill impairment exists for the reporting unit and the Company must perform step two of the impairment test. Under step two, an impairment loss is recognized for any excess of the carrying amount of the reporting unit’s goodwill over the implied fair value of the goodwill. The implied fair value of goodwill is determined by allocating the fair value of the reporting unit in a manner similar to a purchase price allocation and the residual fair value after this allocation is the implied fair value of the reporting unit goodwill. Fair value of the reporting unit is determined using a discounted cash flow analysis. If the fair value of the reporting unit exceeds its carrying amount, step two does not need to be performed.
The Company will perform its annual impairment review of goodwill in its fiscal fourth quarter and when a triggering event occurs between annual impairment tests. However, given that the Company did not have recorded goodwill until its fiscal fourth quarter of 2014, no impairment tests were required to be completed.
Intangible assets are comprised primarily of client list acquisitions and are reported net of accumulated amortization on the Consolidated Balance Sheets. Client relationships use the straight-line method of amortization over an accelerated nine year time frame, while the non-solicitation agreement uses the straight-line method of amortization over the three year life of the agreement. The Company tests intangible assets for potential impairment when events or changes in circumstances indicate that the carrying value of such assets may not be recoverable.
(i) Deferred Rent
The Company has operating lease agreements for its office space, which contain provisions for future rent increases, periods of rent abatement and build-out allowances. The Company records monthly rent expense for each lease equal to the total payments due over the lease term, divided by the number of months of the lease term. Build-out allowances are recorded as part of leasehold improvements and the incentive is amortized over the lease term against depreciation. The difference between recorded rent expense and the amount paid is reflected as “Deferred Rent” in the accompanying balance sheets.
(j) Income Taxes
Income taxes are accounted for under the asset and liability method. Deferred tax assets and liabilities are recognized for the future tax consequences attributable to differences between the financial statement carrying amounts of existing assets and liabilities and their respective tax bases and operating loss and tax credit carryforwards. Deferred tax assets and liabilities are measured using enacted tax rates expected to apply to taxable income in the years in which those temporary differences are expected to be recovered or settled.
The effect on deferred tax assets and liabilities of a change in tax rate is recognized in income in the period that includes the enactment date. Accordingly, the impact of the American Taxpayer Relief Act of 2012, which was enacted on January 2, 2013, on deferred tax assets and liabilities and current taxes for the last six months of the fiscal year ended June 30, 2012 was recognized in the year ended June 30, 2013. Research and development tax credits are recognized using the flow-through method in the year the credit arises.
Valuation allowances are provided when necessary to reduce deferred tax assets to the amount more likely than not to be realized. Significant management judgment is required in determining the period in which the reversal of a valuation allowance should occur. The Company is required to consider all available evidence, both positive and negative, such as historical levels of income and future forecasts of taxable income among other items, in determining whether a full or partial release of its valuation allowance is required. The Company is also required to schedule future taxable income in accordance with accounting standards that address income taxes to assess the appropriateness of a valuation allowance, which further requires the exercise of significant management judgment.
The Company recognizes the effect of income tax positions only if those positions are more likely than not of being sustained. Recognized income tax positions are measured at the largest amount that is greater than 50% likely of being realized. Changes in recognition or measurement are reflected in the period in which the change in judgment occurs. The Company records interest and penalties as an element of income tax expense.
(k) Revenue Recognition
The Company recognizes revenue in accordance with Financial Accounting Standards Board (FASB) Accounting Standards Codification (ASC) 605-25, Revenue Recognition—Multiple Element Arrangements, Accounting Standards Update No. 2009-13, Multiple-Deliverable Revenue Arrangements (“ASU 2009-13”), and Staff Accounting Bulletin 104, Revenue Recognition. Revenue is recognized when there is persuasive evidence that an arrangement exists, delivery has occurred, the fee is fixed or determinable and collection of the revenue is probable.
The Company derives its revenue predominantly from recurring fees and non-recurring service fees. Recurring fees are collected under agreements for payroll, timekeeping, HR-related cloud-based computing services and monthly time clock rentals, all of which are generally cancellable by the client on 60 days’ notice or less. Non-recurring service fees consist mainly of implementation and custom reporting services. Such fees are billed to clients and revenue is recorded upon completion of the service. The Company’s agreements do not include general rights of return and do not provide clients with the right to take possession of the software supporting the services being provided. As such, the agreements are accounted for as service contracts.
Interest income collected on funds held for clients is recognized in recurring revenues when earned as the collection, holding and remittance of these funds are critical components of providing these services.
Most multiple-element arrangements include a short implementation services phase which involves establishing the client within and loading data into the Company’s cloud-based applications. Such activities are performed by either the Company or a third party vendor. Major recurring fees included in multiple-element arrangements include:
· Payroll processing and related services, including payroll reporting and tax filing services delivered on a weekly, biweekly, semi-monthly, or monthly basis depending upon the payroll frequency of the client and on an annual basis if a client selects W-2 preparation and processing services,
· Time and attendance reporting services, including time clock rentals, delivered on a monthly basis, and
· Cloud-based HR software solutions, including employee administration and benefits enrollment and administration, delivered on a monthly basis.
For each agreement, the Company evaluates whether the individual deliverables qualify as separate units of accounting. If one or more of the deliverables does not have standalone value upon delivery, which is typical of the payroll and human capital management (“HCM”) services our customers contract for, the deliverables that do not have standalone value are generally combined and treated as a single unit of accounting by frequency of occurrence for the product category involved such as biweekly payroll or monthly timekeeping services. Revenues for arrangements treated as a single unit of accounting are generally recognized within the same month that the services are rendered given that the agreements are cancellable with 60 days’ or less notice.
In determining whether implementation services can be accounted for separately from recurring revenues, the Company considers the nature of the implementation services and the availability of the implementation services from other vendors. The Company was able to establish standalone value for implementation activities based on the activity of third-party vendors that perform these services and accounts for such implementation services separate from the recurring revenues.
If the recurring services have standalone value upon delivery, the Company accounts for each separately and revenues are recognized as services are delivered with allocation of consideration based on the relative selling price method as established in ASU 2009-13. That method requires the selling price of each element in a multiple-deliverable arrangement to be based on, in descending order: (i) vendor specific objective evidence of fair value (“VSOE”), (ii) third-party evidence of fair value (“TPE”) or (iii) management’s best estimate of the selling price (“BESP”).
The Company is not able to establish VSOE because the deliverables are sold across an insufficiently narrow range of prices on a stand-alone basis and is also not able to establish TPE because no third-party offerings are reasonably comparable to the Company’s offerings. The Company thus established its BESP by service offering, requiring the use of significant estimates and judgment. The Company considers numerous factors, including the nature of the deliverables themselves; the geography of the sale; and pricing and discounting practices utilized by the Company’s sales force. Arrangement consideration is allocated to each deliverable based on the established BESP and subject to the limitation that because the arrangements are cancellable with 60 days’ or
less notice, recurring revenue is not allocated to any deliverable until the consideration has been earned, typically with each payroll cycle or monthly, depending on the service.
Revenues generated from sales through partners or utilizing partner services are recognized in accordance with the appropriate accounting guidance of Accounting Standards Codification 605-45, Principal Agent Considerations. The Company reports revenue generated through partners or utilizing partner services at the gross amount billed to clients when (i) the Company is the primary obligor, (ii) the Company has latitude to establish the price charged and (iii) the Company bears the credit risk in the transaction.
Sales taxes collected from clients and remitted to governmental authorities where applicable are accounted for on a net basis and therefore are excluded from revenues in the statements of operations.
(l) Cost of Revenues
Cost of revenues consists primarily of the cost of recurring revenues and implementation services which are expensed when incurred. Cost of revenues for recurring revenues consists primarily of costs to provide recurring services and support to our clients, and includes amortization of capitalized software. Cost of revenues for implementation services and other consists primarily of costs to provide implementation services and costs related to sales of payroll-related forms and time clocks.
(m) Advertising
Advertising costs are expensed as incurred. Advertising costs amounted to $32, $27 and $24 for the years ended June 30, 2012, 2013 and 2014, respectively.
(n) Equity Incentive Plan
The Company recognizes all employee stock-based compensation as a cost in the financial statements. Equity-classified awards are measured at the grant date fair value of the award and expense is recognized, net of assumed forfeitures, on a straight-line basis over the requisite service period for each separately vesting portion of the award. The Company estimates grant date fair value using the Black-Scholes option-pricing model and periodically updates the assumed forfeiture rates for actual experience over their vesting terms.
Excess tax benefits of awards that are recognized in equity related to stock option exercises are reflected as financing cash inflows. The total excess income tax benefits recognized for stock-based compensation arrangements was $206 and $63 for the years ended June 30, 2012 and 2013, respectively. There were no excess income tax benefits recognized for stock-based compensation arrangements for the year ended June 30, 2014.
(o) Commitments and Contingencies
Liabilities for loss contingencies arising from claims, assessments, litigation, fines, and penalties and other sources are recorded when it is probable that a liability has been incurred and the amount can be reasonably estimated. Legal costs incurred in connection with loss contingencies are expensed as incurred.
(p) Segment Information
The Company’s chief operating decision maker reviews the financial results of the Company in total when evaluating financial performance and for purposes of allocating resources. The Company has thus determined that it operates in a single cloud-based software solution reporting segment.
(q) Recently Issued Accounting Standards
In May 2014, the Financial Accounting Standard Board (FASB) issued ASU 2014-09, Revenue from Contracts with Customers (Topic 606) (“ASU 2014-09”). ASU 2014-09 supersedes a majority of existing revenue recognition guidance under US GAAP, and requires companies to recognize revenue when it transfers goods or services to a customer in an amount that reflects the consideration to which a company expects to be entitled. Companies may need to apply more judgment and estimation techniques or methods while recognizing revenue, which could result in additional disclosures to the financial statements. Topic 606 allows for either a “full retrospective” adoption or a “modified retrospective” adoption. The Company is currently evaluating which adoption method it will use. Early application is not permitted. The Company plans on adopting ASU 2014-09 beginning July 1, 2017 and is currently assessing the potential effects of these changes to its consolidated financial statements.
From time to time, new accounting pronouncements are issued by the FASB or other standard setting bodies that are adopted by the Company as of the specified effective date. Unless otherwise discussed, the Company believes that the impact of recently issued standards that are not yet effective will not have a material impact on the Company’s consolidated financial statements upon adoption.
(3) Funds Held for Clients and Client Fund Obligations
The Company obtains funds from clients in advance of performing payroll and payroll tax filing services on behalf of those clients. Funds held for clients represent assets that are used solely for the purposes of satisfying the obligations to remit funds relating to payroll and payroll tax filling services. Funds held for clients are held in demand deposit and money market accounts at major financial institutions. The Company has classified funds held for clients as a current asset since these funds are held solely for the purposes of satisfying the client fund obligations.
Client fund obligations represent the Company’s contractual obligations to remit funds to satisfy clients’ payroll and tax payment obligations and are recorded in the accompanying balance sheets at the time that the Company obtains funds from clients. The client fund obligations represent liabilities that will be repaid within one year of the balance sheet date.
(4) Fair Value Measures
The Company applies the fair value measurement and disclosure provisions of ASC 820, Fair Value Measurements and Disclosures, and ASU 2011-04, Fair Value Measurement (Topic 820): Amendments to Achieve Common Fair Value Measurement and Disclosure Requirements in U.S. GAAP and IFRS. Fair value is defined as the price that would be received to sell an asset or paid to transfer a liability in an orderly transaction between market participants at the measurement date. A three-level fair value hierarchy prioritizes the inputs used to measure fair value. The hierarchy requires entities to maximize the use of observable inputs and minimize the use of unobservable inputs. The three levels of inputs used to measure fair value are as follows:
· Level 1—Quoted prices in active markets for identical assets and liabilities.
· Level 2—Quoted prices in active markets for similar assets and liabilities, or other inputs that are observable for the asset or liability, either directly or indirectly, for substantially the full term of the financial instrument.
· Level 3—Unobservable inputs that are supported by little or no market activity and that are significant to the fair value of the assets and liabilities. This includes certain pricing models, discounted cash flow methodologies and similar techniques that use significant unobservable inputs.
Substantially all of the Company’s assets that are measured at fair value on a recurring basis are measured using Level 1 inputs. The Company considers the recorded value of its financial assets and liabilities, which consist primarily of cash and cash equivalents, accounts receivable, and accounts payable, to approximate the fair value of the respective assets and liabilities at June 30, 2013 and 2014 based upon the short-term nature of the assets and liabilities.
(5) Business Combinations
On May 23, 2014, the Company closed on the acquisition of certain assets sufficient to sell the Company’s products in the Southern California marketplace of one of its resellers described in Note 16, BFKMS Inc., as part of the Company’s long term strategy of simplifying its sales channels. The total consideration, all to be paid in cash, was $9,435 of which $6,450 has been paid as of June 30, 2014. Of the remaining amount, $2,385 was paid in July 2014 with two further payments due in November 2014 and February 2015 or upon settlement of any indemnification related issues, totaling $600. The following table summarizes the provisional fair value of the assets acquired at the date of acquisition:
|
|
|
At May 23, 2014 |
|
Intangible assets |
|
$6,400 |
|
Goodwill |
|
3,035 |
|
Total purchase price |
|
$9,435 |
The Company recorded the acquisition using the acquisition method of accounting and recognized assets at their fair value as of the date of acquisition. The $6,400 of amortizable intangible assets consists of $6,180 in client relationships and $220 in a non-solicitation agreement. The fair value of the client relationships has been estimated using the excess earnings method, a form of the income approach, and cash flow projections. The non-solicitation agreement has been estimated using an avoided loss of income method, which is a form of the income approach. Goodwill will be amortized over a period of 15 years for income tax purposes. The total purchase price and allocation of the purchase price to assets acquired are provisional pending conclusion of the indemnification period and receipt of the final valuation report from a third party valuation expert.
The balance of the acquired intangibles, net of amortization, is stated separately on the consolidated balance sheet. Direct costs related to the acquisition were recorded as general and administrative expense as incurred.
(6) Software Developed for Internal Use
Capitalized software and accumulated amortization were as follows:
|
|
|
Year ended June 30, | ||
|
|
|
2013 |
|
2014 |
|
Internally developed software |
|
$15,189 |
|
$19,863 |
|
Accumulated amortization |
|
(12,575) |
|
(14,770) |
|
Capitalized software, net |
|
$2,614 |
|
$5,093 |
There were no impairments to software developed for internal use in any of the periods covered in these financial statements. Amortization of capitalized internal-use software costs amounted to $2,727, $3,067 and $2,195 for the years ended June 30, 2012, 2013 and 2014, respectively and is included in Cost of Revenues—Recurring Revenues.
(7) Property and Equipment
The major classes of property and equipment are as follows as of June 30:
|
|
|
Year ended June 30, | ||
|
|
|
2013 |
|
2014 |
|
Office equipment |
|
$1,350 |
|
$1,449 |
|
Computer equipment |
|
4,665 |
|
7,726 |
|
Furniture and fixtures |
|
1,433 |
|
2,317 |
|
Automobiles |
|
36 |
|
— |
|
Software |
|
3,791 |
|
4,963 |
|
Leasehold improvements |
|
3,917 |
|
6,059 |
|
Time clocks rented by clients |
|
1,649 |
|
2,360 |
|
|
|
16,841 |
|
24,874 |
|
Accumulated depreciation and amortization |
|
(8,255) |
|
(11,749) |
|
Property and equipment, net |
|
$8,586 |
|
$13,125 |
There were no impairments to property and equipment in any of the periods covered in these financial statements. Depreciation expense amounted to $1,897, $2,504 and $4,061, for the years ended June 30, 2012, 2013 and 2014, respectively.
(8) Goodwill and Intangible Assets
Goodwill represents the excess of cost over the net tangible and identifiable intangible assets of acquired businesses. Goodwill amounts are not amortized, but rather tested for impairment at least annually. Identifiable intangible assets acquired in business combinations are recorded based on fair value at the date of acquisition and amortized over their estimated useful lives. See Note 5 for further information regarding the acquisition completed in 2014.
The Company had $0 and $3,035 of goodwill recorded as of June 30, 2013 and 2014 respectively.
The Company’s amortizable intangible assets, before amortization expense, have estimated useful lives as follows:
|
|
|
As of June |
|
Weighted |
|
Client relationships |
|
$6,180 |
|
9 years |
|
Non-solicitation agreement |
|
220 |
|
3 years |
|
Total |
|
6,400 |
|
|
|
Accumulated amortization |
|
(80) |
|
|
|
Intangible assets, net |
|
$6,320 |
|
|
There was no amortization expense for acquired intangible assets for the years ended June 30, 2012 and 2013. Amortization expense for acquired intangible assets was $80 for the year ended June 30, 2014. Future amortization expense for acquired intangible is as follows, as of June 30, 2014:
|
Year ending June 30: |
|
|
|
2015 |
|
$760 |
|
2016 |
|
760 |
|
2017 |
|
752 |
|
2018 |
|
687 |
|
2019 |
|
687 |
|
Thereafter |
|
2,674 |
|
Total |
|
$6,320 |
(9) Accrued Expenses
The components of accrued expenses are as follows:
|
|
|
Year ended June 30, | ||
|
|
|
2013 |
|
2014 |
|
Accrued payroll and personnel costs |
|
$5,549 |
|
$8,781 |
|
Reseller fees |
|
259 |
|
6 |
|
Current portion of deferred rent |
|
230 |
|
577 |
|
Other |
|
756 |
|
1,380 |
|
Total Accrued Expenses |
|
$6,794 |
|
$10,744 |
(10) Leases
The Company leases office space in Illinois, California, Florida and New York under non-cancelable operating leases expiring on various dates from August 2014 through July 2022. The leases provide for increasing annual base rents and oblige the Company to fund proportionate share of operating expenses and, in certain cases, real estate taxes.
In July 2013, the Company leased sales office space in New York, New York, commencing in the first fiscal quarter of 2014. The Company extended this lease in the fourth fiscal quarter of 2014 through June 2015.
In June 2014, the Company leased approximately 6,000 square feet of additional office space at its headquarters in Arlington Heights, Illinois commencing in the third fiscal quarter of 2015 through July 2022. The lease calls for a phase of construction build-out with leasehold improvements to be amortized over the life of the lease. Upon the completion of the project, the Company receives a seven month rent holiday.
The Company leases various types of office and production related equipment under non-cancellable operating leases expiring on various dates from June 2015 through May 2019.
Minimum rent payments under operating leases are recognized on a straight-line basis over the term of the lease including any periods of free rent. Rental expense for operating leases, including amortization of leasehold improvements, was $1,519, $2,347 and $3,035 for the years ended June 30, 2012, 2013 and 2014, respectively.
Future minimum lease payments under non-cancellable operating leases (with initial or remaining lease terms in excess of one year) as of June 30, 2013 are:
|
Year ending June 30: |
|
|
|
|
2015 |
|
$3,353 |
|
|
2016 |
|
3.549 |
|
|
2017 |
|
3,200 |
|
|
2018 |
|
3,117 |
|
|
2019 |
|
2,494 |
|
|
Later years, through 2023 |
|
1,637 |
|
|
Total minimum lease payments |
|
$17,350 |
|
(11) Line of Credit and Long-Term Debt
The Company maintained a line of credit agreement with a bank. Under this agreement, the Company had access of up to $2,500 of which $166 was earmarked for a letter of credit. Interest was payable monthly at the bank’s base rate (3.25% at June 30, 2013) plus 1.50%, with a floor of 5.50%. A commitment fee on the average daily undisbursed amount was assessed quarterly at a rate of 0.375% per anum. The line of credit was collateralized by all of the Company’s assets and a personal guarantee of a Company stockholder and was cross-collateralized to the Company’s note payable—bank (see below). The line of credit was due to expire on December 31, 2013, but it was increased to $3,500 and extended until December 31, 2015. The Company terminated the line of credit on March 31, 2014. There were no outstanding borrowings under this line of credit as of June 30, 2013.
Long-term debt at June 30, 2013 and 2014 consisted of the following:
|
|
|
Year ended June 30, |
| ||
|
|
|
2013 |
|
2014 |
|
|
|
|
|
|
|
|
|
Note payable—bank |
|
$1,563 |
|
— |
|
|
Note payable—related parties |
|
— |
|
— |
|
|
Total long-term debt |
|
1,563 |
|
— |
|
|
Less current installments |
|
625 |
|
— |
|
|
Long-term debt, excluding current installments |
|
$938 |
|
— |
|
The note payable—bank agreement called for payments of interest payable monthly at 6.50% with monthly principal payments in the amount of $52 commencing January 31, 2012 through maturity. The note was collateralized by substantially all of the Company assets and a personal guarantee of a Company stockholder. The note was cross-collateralized to the line of credit. The note was subject to certain prepayment penalties, as defined in the agreement. The Company repaid this note on March 31, 2014 as part of its intended use of IPO proceeds, and no prepayment penalties were assessed in accordance with the terms of the agreement. Interest expense related to this agreement was $175, $123 and $67 for the three years ended June 30, 2012, 2013 and 2014, respectfully.
In accordance with the terms of the line of credit and note payable—bank agreements, the Company was required to comply with certain financial and non-financial covenants. The Company was in compliance with all covenants for the year ended June 30, 2013.
The notes payable—related parties bore interest at 8.00%. Principal and interest were paid in full in March of 2013. The notes were unsecured and were subordinated to the line of credit and note payable—bank. Interest expense on these notes was $87 and $69 for the years ended June 30, 2012 and 2013, respectively.
(12) Income Taxes
(a) Income Taxes
Income tax (benefit) expense for the years ended June 30, 2012, 2013 and 2014 consists of the following:
|
|
|
Year ended June 30, |
| ||||
|
|
|
2012 |
|
2013 |
|
2014 |
|
|
Current taxes |
|
|
|
|
|
|
|
|
U.S. federal |
|
$12 |
|
$126 |
|
$(125) |
|
|
State and local |
|
34 |
|
94 |
|
39 |
|
|
Deferred taxes: |
|
|
|
|
|
|
|
|
U.S. federal |
|
738 |
|
(516) |
|
160 |
|
|
State and local |
|
100 |
|
(306) |
|
181 |
|
|
Total income tax (benefit) expense |
|
$884 |
|
$(602) |
|
$255 |
|
(b) Tax Rate Reconciliation
Income tax (benefit) expense differed from the amounts computed by applying the U.S. federal income tax rate of 34% to pretax income from continuing operations as a result of the following:
|
|
|
Year ended June 30, |
| ||||
|
|
|
2012 |
|
2013 |
|
2014 |
|
|
Income tax provision at statutory federal rate |
|
$875 |
|
$6 |
|
$(2,331) |
|
|
Increase (reduction) in income taxes resulting from: |
|
|
|
|
|
|
|
|
Research and development credit, net of federal income tax benefit |
|
(173) |
|
(650) |
|
(189) |
|
|
Non-deductible expenses |
|
25 |
|
53 |
|
284 |
|
|
Change in valuation allowance |
|
— |
|
— |
|
2,878 |
|
|
State and local income taxes, net of federal income tax benefit |
|
157 |
|
(11) |
|
(387) |
|
|
|
|
$884 |
|
$(602) |
|
$255 |
|
(c) Components of Deferred Tax Assets and Liabilities
The tax effects of temporary differences that give rise to significant portions of the deferred tax assets and deferred tax liabilities at June 30, 2013 and 2014 are presented below.
|
|
|
Year ended June 30, |
| ||
|
|
|
2013 |
|
2014 |
|
|
Deferred tax assets: |
|
|
|
|
|
|
Deferred rent |
|
$438 |
|
$569 |
|
|
Allowance for doubtful accounts |
|
46 |
|
48 |
|
|
Accrued expenses |
|
583 |
|
761 |
|
|
Stock-based compensation |
|
333 |
|
2,149 |
|
|
Net operating loss carryforwards |
|
359 |
|
1,641 |
|
|
Research and development credit |
|
832 |
|
1,116 |
|
|
AMT Credits |
|
138 |
|
11 |
|
|
Intangible assets |
|
— |
|
5 |
|
|
Total deferred tax assets |
|
2,729 |
|
6,300 |
|
|
Valuation allowance |
|
— |
|
(2,878) |
|
|
Net deferred tax assets |
|
2,729 |
|
3,422 |
|
|
Deferred tax liabilities: |
|
|
|
|
|
|
Research and development costs |
|
(1,024) |
|
(1,950) |
|
|
Prepaid expenses |
|
(66) |
|
(74) |
|
|
Depreciation |
|
(1,306) |
|
(1,406) |
|
|
Total deferred liabilities |
|
(2,396) |
|
(3,430) |
|
|
Net deferred tax asset (liability) |
|
$333 |
|
$(8) |
|
In assessing the realizability of deferred tax assets, management considers whether it is more likely than not that some portion or all of the deferred tax assets will not be realized through the generation of future taxable income. The ultimate realization of deferred tax assets is dependent upon the generation of future taxable income during the periods in which those temporary differences become deductible. Management considers the scheduled reversal of deferred tax liabilities (including the impact of available carryback and carryforward periods), projected future taxable income and tax-planning strategies in making this assessment. Taxable income (loss) for the years ended June 30, 2012, 2013 and 2014 was approximately $842, $1,941 and $(3,817), respectively, prior to utilization or establishment of net operating loss carryforwards. Based upon the same three year period pre-tax book income, the Company is in a three-year cumulative loss position. As a result of this and other assessments in the year ended June 30, 2014, management concluded that a full valuation allowance is required for all deferred tax assets and liabilities except for deferred tax liabilities associated with indefinite-lived intangible assets.
At June 30, 2014, the Company has net operating loss carryforwards for Federal income tax purposes of approximately $3,967 which are available to offset future Federal taxable income, if any, through 2034, excluding excess tax benefits from stock option exercises of approximately $331 which will be credited to additional paid-in capital when realized. The Company also has gross federal and state research and development tax credit carryforwards of approximately $1,116 which expire between 2017 and 2034. In addition, the Company has alternative minimum tax credit carryforwards of approximately $11, which are available to reduce future Federal regular income taxes, if any, over an indefinite period.
The Company had no unrecognized tax benefits as of June 30, 2012, 2013 and 2014, respectively.
The Company files income tax returns with the United States federal government and various state jurisdictions. Certain tax years remain open for federal and state tax reporting jurisdictions in which the Company does business due to net operating loss carryforwards and tax credits unutilized from such years or utilized in a period remaining open for audit under normal statute of limitations relating to income tax liabilities. The Company’s tax years ended June 30, 2008 to June 30, 2014 remain open for federal purposes. The Company’s tax returns filed in states in which it is required to do so remain open for a range of tax years including those ended June 30, 2008 to June 30, 2014 depending upon the jurisdiction and the applicable statute of limitations.
(13) Stockholders’ Equity (Deficit)
Common Stock
Holders of common stock are entitled to one vote per share and to receive dividends. The holders have no preemptive or other subscription rights and there are no redemption or sinking fund provisions with respect to such shares. Common stock was subordinate to the redeemable convertible preferred stock with respect to dividend rights and rights upon liquidation, winding up and dissolution of the Company.
(14) Redeemable Convertible Preferred Stock
Prior to its IPO, the Company had two series of Redeemable Convertible Preferred Stock, Series A and Series B.
Upon the closing of the IPO, the Series A and Series B Redeemable Convertible Preferred Stock automatically converted into 11,933 shares of the Company’s $0.001 par value common stock.
(15) Benefit Plans
(a) Equity Incentive Plan
The Company maintains a 2008 Equity Incentive Plan (the “2008 Plan”) and a 2014 Equity Incentive Plan (the ‘2014 Plan”) pursuant to which the Company has reserved 7,071 shares of its common stock for issuance to its employees, directors and non-employee third parties. The 2014 Plan serves as the successor to the 2008 plan and permits the granting of options to purchase common stock and other equity incentives at the discretion the compensation committee of the Company’s board of directors. No new awards will be issued under the 2008 Plan as of the effective date of the 2014 Plan. Outstanding awards under the 2008 Plan continue to be subject to the terms and conditions of the 2008 Plan.
Under the 2008 and 2014 Plans, the exercise price of each option is not less than the fair value of a share of common stock on the grant date. As of June 30, 2014, the Company had 2,581 shares allocated to the 2014 Plan, but not yet issued or subject to outstanding options or awards. Generally, the Company issues previously unissued shares for the exercise of stock options; however, previously acquired shares may be reissued to satisfy future issuances. The options typically vest ratably over a three or four year period and expire 10 years from the grant date. Compensation expense for the fair value of the options at their grant date is recognized ratably over the vesting schedule.
Stock-based compensation expense related to stock options and the vesting of restricted stock awards (“RSAs”) and restricted stock units (“RSUs”) is included in the following line items in the accompanying audited consolidated statements of operations:
|
|
|
Year ended June 30, |
| ||||
|
|
|
2012 |
|
2013 |
|
2014 |
|
|
Cost of revenue - recurring |
|
$— |
|
$— |
|
$496 |
|
|
Cost of revenue – non-recurring |
|
— |
|
— |
|
424 |
|
|
Sales and marketing |
|
— |
|
— |
|
765 |
|
|
Research and development |
|
— |
|
— |
|
615 |
|
|
General and administrative |
|
203 |
|
523 |
|
2,629 |
|
|
Total stock-based compensation |
|
$203 |
|
$523 |
|
$4,929 |
|
In addition, the Company capitalized $325 of stock compensation costs in its internal use software in the year ended June 30, 2014. No such amounts were capitalized in internal use software in years ended June 30, 2012 and 2013.
The Company values stock options using the Black-Scholes option-pricing model, which requires the input of subjective assumptions, including the risk-free rate, expected life, expected stock price volatility and dividend yield. The risk-free interest rate assumption is based upon observed interest rates for U.S. Treasury securities consistent with the expected term of the Company’s employee stock options. The expected life represents the period of time the stock options are expected to be outstanding and is based on the simplified method. Under the simplified method, the expected life of an option is presumed to be the mid-point between the vesting date and the end of the contractual term. The Company utilizes the simplified method due to the lack of sufficient historical exercise data to provide a reasonable basis upon which to otherwise estimate the expected life of the stock options. The Company has a limited history of trading as a public company. Therefore, the expected volatility is based on historical volatilities for publicly traded stock of comparable companies over the estimated expected life of the stock options. The Company assumed no dividend yield because it does not expect to pay dividends in the near future, which is consistent with the Company’s history of not paying dividends.
The following table summarizes the assumptions used for estimating the fair value of stock options granted for the years ended June 30:
|
|
|
Year ended June 30, |
| ||||
|
|
|
2012 |
|
2013 |
|
2014 |
|
|
Valuation assumptions: |
|
|
|
|
|
|
|
|
Expected dividend yield |
|
N/A—no grants |
|
0% |
|
0% |
|
|
Expected volatility |
|
N/A—no grants |
|
30.7% |
|
29.5% - 44.5% |
|
|
Expected term (years) |
|
N/A—no grants |
|
4.0 |
|
4.0 - 6.0 |
|
|
Risk-free interest rate |
|
N/A—no grants |
|
0.61% |
|
0.52% - 1.94% |
|
Stock option activity during the periods indicated is as follows:
|
|
|
|
|
Outstanding Options |
| ||||||
|
|
|
Shares |
|
Number of |
|
Weighted |
|
Weighted |
|
Aggregate |
|
|
Balance at June 30, 2013 |
|
812 |
|
1,859 |
|
$3.25 |
|
8.22 |
|
$7,028 |
|
|
Additional shares authorized, net |
|
4,406 |
|
— |
|
|
|
|
|
|
|
|
RSU’s granted |
|
(108) |
|
— |
|
|
|
|
|
|
|
|
Options granted |
|
(2,582) |
|
2,582 |
|
15.01 |
|
9.58 |
|
|
|
|
Options forfeited |
|
53 |
|
(53) |
|
17.00 |
|
— |
|
|
|
|
Exercised |
|
— |
|
— |
|
— |
|
— |
|
|
|
|
Balance at June 30, 2014 |
|
2,581 |
|
4,388 |
|
$10.00 |
|
8.58 |
|
$51,017 |
|
|
Options exercisable at June 30, 2014 |
|
|
|
1,083 |
|
$2.29 |
|
6.65 |
|
$20,947 |
|
|
Options vested and expected to vest at June 30, 2014 |
|
|
|
3,853 |
|
$10.17 |
|
8.53 |
|
$44,162 |
|
The weighted average grant date fair value of options granted during the years ended June 30, 2013 and 2014 was $1.22 and $6.39, respectively. There were no options granted in fiscal 2012. The total intrinsic value of options exercised during the years ended June 30, 2012 and 2013 was $241 and $87, respectively. There were no options exercised in the year ended June 30, 2014.
The Company may also grant RSAs and RSUs under the Plan with terms determined at the discretion of the Compensation Committee of the Company’s Board of Directors. Prior to the IPO, the Company had 269 RSAs outstanding to certain employees. The RSAs vested and were issued as common shares as a result of the satisfaction of the vesting criteria upon the completion of the IPO in March 2014 at which time the Company recorded compensation expense in the amount of $351 which is included in the compensation expense recognition table above. Concurrent with the IPO in March 2014, the Company granted 108 RSUs primarily to certain employees and members of its Board of Directors of which 93 vest over a period of six months commencing on the date of the IPO, 6 vested immediately, 4 vest one year from the date of the IPO, and 5 vest two years from the date of the IPO. Compensation expense related to these newly issued RSUs is reflected in general and administrative expense, included in the compensation expense table above, is based on the fair value of the instruments on the date of grant and is recognized in the period between the date of grant and the date of vesting as the vesting is based on the passage of time. In addition, approximately 2 of the 6 RSUs that vested immediately were issued to consultants that provided professional services directly related to the IPO and, thus, the Company recognized the $30 cost associated with those RSUs as an offering cost offsetting the net proceeds from the IPO.
At June 30, 2014, there was $11,231 of total unrecognized compensation cost, net of estimated forfeitures, related to unvested stock option and restricted stock awards granted under the Plan. That cost is expected to be recognized over a weighted average period of 1.62 years.
(b) 401(k) Plan
The Company maintains a 401(k) plan with a safe harbor matching provision that covers all eligible employees. The Company matches 50% of the employees’ contributions up to 6% of their gross pay. Contributions were approximately $514, $720 and $1,122 for the years ended June 30, 2012, 2013 and 2014, respectively.
(16) Commitments and Contingencies
(a) Employment Agreements
The Company has employment agreements with certain of its key officers. The agreements allow for minimum annual compensation increases, participation in equity incentive plans and bonuses for annual performance as well as certain change of control events as defined in the agreements.
(b) Litigation
From time to time, the Company is subject to litigation arising in the ordinary course of business. Many of these proceedings are covered in whole or in part by insurance. In the opinion of the Company’s management, the ultimate disposition of any matters currently outstanding or threatened will not have a material adverse effect on the Company’s financial position, results of operations, or liquidity.
(c) Reseller Agreements
The Company had agreements with two resellers, one of which was terminated in March 2014. The initial term of the first reseller agreement commenced in February 2007 and was set to expire in February 2016 unless renewed. The initial term of the second reseller agreement commenced in June 2009 and is set to expire in June 2016 unless renewed. Each of the Company’s reseller agreements provides that the Company is required upon a termination of the agreement to acquire the assets of the reseller.
The first reseller agreement provided that either party may terminate the agreement by electing not to renew the agreement beyond its original term. The Company, but not the reseller, also had the right to terminate the agreement at any time following the completion of an initial public offering by the Company. The Company exercised its right to terminate the agreement in April 2014 and closed on the purchase of the reseller’s client base in May 2014. See Note 5 for further information. The Company paid the first reseller $1,693, $2,377 and $2,495 during fiscal years 2012, 2013 and 2014, respectively.
The second reseller agreement provided that the reseller may terminate the agreement by providing nine months’ prior notice or upon an initial public offering by the Company. The Company amended this agreement in December of 2013 to provide that the reseller may not give a nine-month termination notice until after the earlier of (i) six months following the closing of an initial public offering by the Company or (ii) December 31, 2014. In addition, the Company, but not the reseller, now has the right to terminate the agreement at any time after the date that is six months following the completion of an initial public offering by the Company. If a
termination were to occur, the purchase price of the resellers assets to be acquired would be equal to 3.3 times the net revenues of the reseller for the 12 months preceding the termination effective date. The Company paid the second reseller $1,324, $1,783 and $2,081 during fiscal years 2012, 2013 and 2014, respectively.
(17) Earnings Per Share
For the periods presented prior to the Company’s IPO, basic and diluted net income (loss) per common share is presented in conformity with the two-class method required for participating securities. Concurrently with the closing of the Company’s IPO on March 24, 2014, all shares of outstanding Preferred Stock automatically converted into 11,933 shares of the Company’s common stock. Following the date of the IPO, the two-class method was no longer required as the Company has one class of securities issued and outstanding.
Prior to the conversion of the Redeemable Convertible Preferred Stock, holders of Series A and Series B Preferred Stock each were entitled to liquidation preferences payable prior and in preference to any dividends on any shares of the Company’s common stock. In the event a dividend was paid on common stock, the holders of Preferred Stock were entitled to a proportionate share of any such dividend as if they were holders of common stock (on an as-if converted basis). The holders of the Company’s Preferred Stock did not have a contractual obligation to share in the losses of the Company. The Company considered its Preferred Stock to be participating securities and, in accordance with the two-class method, earnings allocated to Preferred Stock and the related number of outstanding shares of Preferred Stock have been excluded from the computation of basic and diluted net income (loss) per common share.
Under the two-class method, net income (loss) attributable to common stockholders is determined by allocating undistributed earnings, calculated as net income less current period Redeemable Convertible Preferred Stock cumulative dividends, between common stock and Redeemable Convertible Preferred Stock. In computing diluted net income (loss) attributable to common stockholders, undistributed earnings are re-allocated to reflect the potential impact of dilutive securities.
Basic net loss per common share is computed using the weighted-average number of common shares outstanding during the period. Since the Series A and Series B Redeemable Convertible Preferred Stock were entitled to participate should any common stock dividends have been declared but were not obligated to participate in any losses generated by the Company, basic net income per share is computed using the weighted-average number of common shares outstanding during the period plus the Series A and Series B Redeemable Convertible Preferred Stock on a weighted-average basis.
Diluted net loss per share is computed using the weighted-average number of common shares outstanding during the period and, if dilutive, potential common shares outstanding during the period. Since the Series A and Series B Redeemable Convertible Preferred Stock were entitled to participate should any common stock dividends be declared but were not obligated to participate in any losses generated by the Company, diluted net income per share is computed using the weighted-average number of common shares plus the Series A and Series B Redeemable Convertible Preferred Stock on a weighted-average basis and, if dilutive, potential common shares outstanding during the period. The Company’s potential common shares consist of the incremental common shares issuable upon the exercise of stock options. The dilutive effect of outstanding stock options is reflected in diluted earnings per share by application of the treasury stock method.
The following table presents the calculation of basic and diluted net income (loss) per share:
|
|
|
Year ended June 30, |
| ||||
|
|
|
2012 |
|
2013 |
|
2014 |
|
|
Basic net income (loss) per share: |
|
|
|
|
|
|
|
|
Numerator: |
|
|
|
|
|
|
|
|
Net Income (Loss) |
|
$1,688 |
|
$617 |
|
$(7,110) |
|
|
Less: Preferred dividend rights attributable to participating securities |
|
(690) |
|
(2,908) |
|
(2,282) |
|
|
Net income (loss) attributable to common stockholders |
|
$998 |
|
$(2,291) |
|
$(9,392) |
|
|
|
|
|
|
|
|
|
|
|
Denominator: |
|
|
|
|
|
|
|
|
Weighted-average shares used in computing net income (loss) per share attributable to common stockholders: |
|
|
|
|
|
|
|
|
Basic (in thousands) |
|
43,873 |
|
31,988 |
|
36,707 |
|
|
Weighted-average effect of potentially dilutive shares: |
|
|
|
|
|
|
|
|
Employee stock options (in thousands) |
|
444 |
|
— |
|
— |
|
|
Diluted (in thousands) |
|
44,317 |
|
31,988 |
|
36,707 |
|
|
Net income (loss) per share attributable to common stockholders: |
|
|
|
|
|
|
|
|
Basic |
|
$0.02 |
|
$(0.07) |
|
$(0.26) |
|
|
Diluted |
|
$0.02 |
|
$(0.07) |
|
$(0.26) |
|
The following table summarizes the outstanding employee stock options, restricted stock units, and redeemable convertible preferred stock that were excluded from the diluted per share calculation for the periods presented because to include them would have been anti-dilutive:
|
|
|
Year ended June 30, 2014 |
| ||||
|
|
|
2012 |
|
2013 |
|
2014 |
|
|
|
|
|
|
|
|
|
|
|
Redeemable convertible preferred stock |
|
— |
|
11,933 |
|
— |
|
|
Restricted stock units |
|
— |
|
— |
|
102 |
|
|
Employee stock options |
|
— |
|
1,859 |
|
4,388 |
|
|
Total |
|
— |
|
13,792 |
|
4,490 |
|
Restricted Stock Awards were excluded from both basic and diluted earnings per share calculations for the years ended June 30, 2012 and 2013 as the vesting conditions had not been met.
(18) Related Party Transactions
Blue Marble
The Company entered into a Memorandum of Understanding (“Memorandum”) and a Non-Competition and Non-Solicitation Agreement (“Non-Compete”) with its Chairman Steve Sarowitz and Blue Marble, a separate legal entity owned by Mr. Sarowitz, in June 2014.
As stipulated in the Memorandum, Mr. Sarowitz resigned as an employee of Paylocity but continues to serve the Company as the non-executive Chairman of the board of directors. The Memorandum establishes the ongoing market based terms between the Company and Blue Marble for services provided to or on behalf of each other. In addition, Paylocity obtained a right of first refusal on the sale of Blue Marble, an option exercisable starting three years from the date of the Memorandum to purchase Blue Marble, and the right of first refusal to purchase any acquisition target of Blue Marble outside the United States of America, all at fair market value. The Memorandum requires Blue Marble to obtain written consent from Paylocity should Blue Marble intend to acquire an entity that provides or partners with other service providers to provide products and services to clients located in the United States of America. The Company provides no management guidance to the entity, has no equity interest in the entity, no obligation or intention to fund any of the entity’s operational shortfalls, and no right to any operational surpluses generated by the entity.
The Non-Compete agreement outlines the permissible activities and ongoing responsibilities of Mr. Sarowitz and Blue Marble including an obligation not to compete with services offered by Paylocity and an obligation not to solicit employees of Paylocity.
Elite Sales
The Company purchased sales leads from an entity owned by one of the stockholders in the amount of approximately $404, $893 and $231 for the years ended June 30, 2012, 2013 and 2014, respectively. The Company provided no management guidance to the entity and had no equity interest in the entity, had no obligation or intention to fund any of the entity’s operational shortfalls, and had no right to any operational surpluses generated by the entity. Accounts payable to this entity were approximately $65 and $0 as of June 30, 2013 and 2014, respectively. On October 14, 2013, the Company hired substantially all of the employees of the sales lead generation entity described above.
Principal Stockholder Contribution for Cash Bonuses
In May 2014, the Company’s Chairman paid approximately $1,052 to the Company for the express purpose of paying a cash bonus to long-term employees in recognition of their past service. The Company recorded a capital contribution to additional paid-in capital for the amount received from the Chairman and compensation expense for the amount paid to employees, accordingly. The Company paid the employer portion of employment taxes and will receive any income tax related benefits from the payments to employees and resulting taxes.
(19) Subsequent Events
The Company has evaluated subsequent events from the balance sheet date through August 22, 2014, the date at which the financial statements were available to be issued.
In August 2014, the Board of Directors granted restricted stock units for 340,875 shares of common stock which vest annually over four years and stock options to purchase 321,700 shares of commons stock at a weighted-average exercise price of $24.80 per share which vest over four years.
(20) Selected Quarterly Financial Data (unaudited)
The following tables set forth selected unaudited quarterly statements of operations data for each of the eight quarters in the years ended June 30, 2013 and 2014.
|
|
|
Quarter Ended | ||||||
|
|
|
September 30, |
|
December 31, |
|
March 31, 2013 |
|
June 30, 2013 |
|
Consolidated States of Operations Data |
|
|
|
|
|
|
|
|
|
Revenues |
|
$15,826 |
|
$17,200 |
|
$24,006 |
|
$20,262 |
|
Gross profit |
|
$7,307 |
|
$7,663 |
|
$13,272 |
|
$9,386 |
|
Operating income (loss) |
|
$(616) |
|
$(1,088) |
|
$2,604 |
|
$(869) |
|
Net income (loss) |
|
$(405) |
|
$(627) |
|
$2,021 |
|
$(372) |
|
Net income (loss) per share attributable to common stockholders, basic and diluted: |
|
$(0.04) |
|
$(0.04) |
|
$0.03 |
|
$(0.03) |
|
Weighted-average shares used in computing net income (loss) per share attributable to common stockholders: |
|
|
|
|
|
|
|
|
|
Basic |
|
31,988 |
|
31,988 |
|
43,921 |
|
31,988 |
|
Diluted |
|
31,988 |
|
31,988 |
|
44,407 |
|
31,988 |
|
|
|
|
|
|
|
|
|
|
|
|
|
|
|
|
|
|
|
|
|
|
|
|
|
|
|
|
|
|
|
|
|
|
|
|
|
|
|
|
|
|
|
Quarter Ended | ||||||
|
|
|
September 30, |
|
December 31, |
|
March 31, 2014 |
|
June 30, 2014 |
|
Consolidated States of Operations Data |
|
|
|
|
|
|
|
|
|
Revenues |
|
$22,369 |
|
$23,905 |
|
$33,766 |
|
$28,647 |
|
Gross profit |
|
$10,622 |
|
$10,587 |
|
$18,841 |
|
$13,543 |
|
Operating income (loss) |
|
$(434) |
|
$(2,411) |
|
$2,133 |
|
$(6,306) |
|
Net income (loss) |
|
$(44) |
|
$(1,512) |
|
$1,150 |
|
$(6,704) |
|
Net income (loss) per share attributable to common stockholders, basic and diluted: |
|
$(0.03) |
|
$(0.07) |
|
$0.01 |
|
(0.14) |
|
Weighted-average shares used in computing net income (loss) per share attributable to common stockholders: |
|
|
|
|
|
|
|
|
|
Basic |
|
31,988 |
|
31,988 |
|
44,360 |
|
49,564 |
|
Diluted |
|
31,988 |
|
31,988 |
|
44,870 |
|
49,564 |
EXHIBIT INDEX
|
Exhibit |
|
|
|
|
Incorporated by Reference | |||||||
|
Number |
|
|
Exhibit Description |
|
Form |
|
File No. |
|
Exhibit |
|
Filing Date |
|
|
|
|
|
|
|
|
|
|
|
|
|
|
|
|
|
|
|
|
|
|
|
|
|
|
| ||
|
2.1 |
|
Share Exchange Agreement, dated November 7, 2013. |
|
S-1 |
|
333-193661 |
|
2.1 |
|
January 30, 2014 | ||
|
|
|
|
|
|
|
|
|
|
|
| ||
|
3.1 |
|
First Amended and Restated Certificate of Incorporation of the Registrant. |
|
S-1/A |
|
333-193661 |
|
3.2 |
|
February 14, 2014 | ||
|
|
|
|
|
|
|
|
|
|
|
| ||
|
3.2 |
|
Amended and Restated By-Laws of the Registrant. |
|
S-1/A |
|
333-193661 |
|
3.4 |
|
February 14, 2014 | ||
|
|
|
|
|
|
|
|
|
|
|
| ||
|
4.1 |
|
Amended and Restated Investor Rights Agreement, dated June 29, 2012. |
|
S-1 |
|
333-193661 |
|
4.1 |
|
January 30, 2014 | ||
|
|
|
|
|
|
|
|
|
|
|
| ||
|
4.3.1 |
|
Revolving Line of Credit Note, dated March 9, 2011, payable to Commerce Bank & Trust Company. |
|
S-1 |
|
333-193661 |
|
4.5.1 |
|
January 30, 2014 | ||
|
|
|
|
|
|
|
|
|
|
|
| ||
|
4.3.2 |
|
Allonge to Revolving Line of Credit Note, dated November 27, 2013. |
|
S-1 |
|
333-193661 |
|
4.5.2 |
|
January 30, 2014 | ||
|
|
|
|
|
|
|
|
|
|
|
| ||
|
10.1 |
|
Loan and Security Agreement by and among Commerce Bank & Trust Company and Paylocity Corporation, dated May 5, 2009. |
|
S-1 |
|
333-193661 |
|
10.1 |
|
January 30, 2014 | ||
|
|
|
|
|
|
|
|
|
|
|
| ||
|
10.1.1 |
|
First Amendment to Loan and Security Agreement, dated March 9, 2011. |
|
S-1 |
|
333-193661 |
|
10.1.1 |
|
January 30, 2014 | ||
|
|
|
|
|
|
|
|
|
|
|
| ||
|
10.2 |
|
Form of Indemnification Agreement for directors and officers. |
|
S-1 |
|
333-193661 |
|
10.2 |
|
January 30, 2014 | ||
|
|
|
|
|
|
|
|
|
|
|
| ||
|
10.3† |
|
2008 Equity Incentive Plan and forms of agreement thereunder. |
|
S-1 |
|
333-193661 |
|
10.3 |
|
January 30, 2014 | ||
|
|
|
|
|
|
|
|
|
|
|
| ||
|
10.3.1† |
|
First Amendment to the 2008 Equity Incentive Plan, dated August 5, 2010. |
|
S-1 |
|
333-193661 |
|
10.3.1 |
|
January 30, 2014 | ||
|
|
|
|
|
|
|
|
|
|
|
| ||
|
10.3.2† |
|
Second Amendment to the 2008 Equity Incentive Plan, dated June 29, 2012. |
|
S-1 |
|
333-193661 |
|
10.3.2 |
|
January 30, 2014 | ||
|
|
|
|
|
|
|
|
|
|
|
| ||
|
10.4† |
|
2014 Equity Incentive Plan and forms of agreement thereunder. |
|
S-1/A |
|
333-193661 |
|
10.4 |
|
February 14, 2014 | ||
|
|
|
|
|
|
|
|
|
|
|
| ||
|
10.5† |
|
Third Amended and Restated Executive Employment Agreement between Paylocity Corporation and Steven R. Beauchamp, dated February 7, 2014. |
|
S-1/A |
|
333-193661 |
|
10.5 |
|
February 14, 2014 | ||
|
|
|
|
|
|
|
|
|
|
|
| ||
|
10.6† |
|
Second Amended and Restated Executive Employment Agreement between Paylocity Corporation and Michael R. Haske, dated February 7, 2014. |
|
S-1/A |
|
333-193661 |
|
10.7 |
|
February 14, 2014 | ||
|
|
|
|
|
|
|
|
|
|
|
| ||
|
10.7 |
|
Office Lease between 3850 Wilke LLC and Paylocity Corporation, dated January 12, 2007. |
|
S-1 |
|
333-193661 |
|
10.8 |
|
January 30, 2014 | ||
|
|
|
|
|
|
|
|
|
|
|
| ||
|
10.8.1 |
|
Amendment to Office Lease, dated January 5, 2011. |
|
S-1 |
|
333-193661 |
|
10.8.1 |
|
January 30, 2014 | ||
|
|
|
|
|
|
|
|
|
|
|
| ||
|
10.8.2 |
|
Amendment to Office Lease, dated May 6, 2013. |
|
S-1 |
|
333-193661 |
|
10.8.2 |
|
January 30, 2014 | ||
|
Exhibit |
|
|
|
|
Incorporated by Reference | |||||||
|
Number |
|
|
Exhibit Description |
|
Form |
|
File No. |
|
Exhibit |
|
Filing Date |
|
|
|
|
|
|
|
|
|
|
|
|
|
|
|
|
|
|
|
|
|
|
|
|
|
|
| ||
|
10.9† |
|
2014 Employee Stock Purchase Plan. |
|
S-1/A |
|
333-193661 |
|
10.9 |
|
February 14, 2014 | ||
|
|
|
|
|
|
|
|
|
|
|
| ||
|
14.1 |
|
Code of Business Conduct and Ethics. |
|
|
|
|
|
|
|
| ||
|
|
|
|
|
|
|
|
|
|
|
| ||
|
21.1 |
|
List of Subsidiaries of the Registrant. |
|
S-1 |
|
333-193661 |
|
21.1 |
|
January 30, 2014 | ||
|
|
|
|
|
|
|
|
|
|
|
| ||
|
23.1 |
|
Consent of KPMG LLP, Independent Registered Public Accounting Firm. |
|
|
|
|
|
|
|
| ||
|
|
|
|
|
|
|
|
|
|
|
| ||
|
24.1 |
|
Power of Attorney (see page 54 to this Annual Report on Form 10-K). |
|
|
|
|
|
|
|
| ||
|
|
|
|
|
|
|
|
|
|
|
| ||
|
31.1 |
|
Certification of Principal Executive Officer Required Under Rule 13a-14(a) and 15d-14(a) of the Securities Exchange Act of 1934, as amended. |
|
|
|
|
|
|
|
| ||
|
|
|
|
|
|
|
|
|
|
|
| ||
|
31.2 |
|
Certification of Principal Financial Officer Required Under Rule 13a-14(a) and 15d-14(a) of the Securities Exchange Act of 1934, as amended. |
|
|
|
|
|
|
|
| ||
|
|
|
|
|
|
|
|
|
|
|
| ||
|
32.1 |
|
Certification of Chief Executive Officer Required Under Rule 13a-14(a) and 15d-14(a) of the Securities Exchange Act of 1934, as amended, and 18 U.S.C. §1350 as adopted pursuant to Section 906 of The Sarbanes-Oxley Act of 2002. |
|
|
|
|
|
|
|
| ||
|
|
|
|
|
|
|
|
|
|
|
| ||
|
32.2 |
|
Certification of Chief Financial Officer Required Under Rule 13a-14(a) and 15d-14(a) of the Securities Exchange Act of 1934, as amended, and 18 U.S.C. §1350 as adopted pursuant to Section 906 of The Sarbanes-Oxley Act of 2002. |
|
|
|
|
|
|
|
| ||
|
|
|
|
|
|
|
|
|
|
|
| ||
|
101.INS* |
|
XBRL Instance Document. |
|
|
|
|
|
|
|
| ||
|
|
|
|
|
|
|
|
|
|
|
| ||
|
101.SCH* |
|
XBRL Taxonomy Extension Schema. |
|
|
|
|
|
|
|
| ||
|
|
|
|
|
|
|
|
|
|
|
| ||
|
101.CAL* |
|
XBRL Taxonomy Extension Calculation Linkbase. |
|
|
|
|
|
|
|
| ||
|
|
|
|
|
|
|
|
|
|
|
| ||
|
101.LAB* |
|
XBRL Taxonomy Extension Label Linkbase. |
|
|
|
|
|
|
|
| ||
|
|
|
|
|
|
|
|
|
|
|
| ||
|
101.PRE* |
|
XBRL Taxonomy Extension Presentation Linkbase. |
|
|
|
|
|
|
|
| ||
|
|
|
|
|
|
|
|
|
|
|
| ||
|
101.DEF* |
|
XBRL Taxonomy Extension Definition Linkbase. |
|
|
|
|
|
|
|
| ||
|
|
|
|
|
* |
XBRL(Extensible Business Reporting Language) information is furnished and not filed for purposes of Sections 11 and 12 of the Securities Act of 1933 and Section 18 of the Securities Exchange Act of 1934, and is not subject to liability under those sections, is not part of any registration statement or prospectus to which it relates and is not incorporated or deemed to be incorporated by reference into any registration statement, prospectus or other document. |
|
|
† |
Management contract, compensatory plan or arrangement. |
|