Attached files
| file | filename |
|---|---|
| EXCEL - IDEA: XBRL DOCUMENT - MICROS SYSTEMS INC | Financial_Report.xls |
| EX-31.(A) - EXHIBIT 31(A) - MICROS SYSTEMS INC | fy201410-k31a.htm |
| EX-21 - EXHIBIT 21 - MICROS SYSTEMS INC | fy2014exhibit21.htm |
| EX-32.(A) - EXHIBIT 32(A) - MICROS SYSTEMS INC | fy201410-k32a.htm |
| EX-23 - EXHIBIT 23 - MICROS SYSTEMS INC | exhibit23.htm |
| EX-31.(B) - EXHIBIT 31(B) - MICROS SYSTEMS INC | fy201410-k31b.htm |
| EX-32.(B) - EXHIBIT 32(B) - MICROS SYSTEMS INC | fy201410-k32b.htm |
UNITED STATES
SECURITIES AND EXCHANGE COMMISSION
WASHINGTON, D.C. 20549
FORM 10-K
xANNUAL REPORT PURSUANT TO SECTION 13 OR 15(d) OF THE SECURITIES EXCHANGE ACT OF 1934
For the Fiscal Year Ended June 30, 2014
OR
¨ TRANSITION REPORT PURSUANT TO SECTION 13 OR 15(d) OF THE SECURITIES EXCHANGE ACT OF 1934 For the Transition Period From ____________to__________
Commission File Number 0-9993
MICROS SYSTEMS, INC.
(Exact name of registrant as specified in its charter)
Maryland | 52-1101488 |
(State of Incorporation) | (I.R.S. Employer Identification No.) |
7031 Columbia Gateway Drive, Columbia, Maryland 21046-2289
(Address of Principal Executive Offices) (Zip Code)
443-285-6000
(Registrant’s telephone number, including area code)
Securities registered pursuant to Section 12(b) of the Act:
Title of Each Class | Name of Exchange |
Common Stock, par value $0.025 per share | The NASDAQ Stock Market |
Securities registered pursuant to Section 12(g) of the Act: None
Indicate by check mark if the registrant is a well-known seasoned issuer, as defined in Rule 405 of the Securities Act.
YES þ NO ¨
Indicate by check mark if the registrant is not required to file reports pursuant to Section 13 or Section 15(d) of the Act.
YES ¨ NO þ
Indicate by check mark whether the Registrant (1) has filed all reports required to be filed by Section 13 or 15(d) of the Securities Exchange Act of 1934 during the preceding 12 months (or for such shorter period that the Registrant was required to file such reports), and (2) has been subject to such filing requirements for the past 90 days.
YES þ NO ¨
Indicate by check mark whether the registrant has submitted electronically and posted on its corporate Web site, if any, every Interactive Data File required to be submitted and posted pursuant to Rule 405 of Regulation S-T during the preceding 12 months (or for such shorter period that the registrant was required to submit and post such files).
YES þ NO ¨
Indicate by check mark if disclosure of delinquent filers pursuant to Item 405 of Regulation S-K is not contained herein, and will not be contained, to the best of registrant’s knowledge, in definitive proxy or information statements incorporated by reference in Part III of this Form 10-K or any amendment to this Form 10-K.
¨
Indicate by check mark whether the registrant is a large accelerated filer, an accelerated filer, a non-accelerated filer, or a smaller reporting company. See the definitions of “large accelerated filer,” “accelerated filer,” and “smaller reporting company” in Rule 12b-2 of the Exchange Act.
Large accelerated filer þ | Accelerated filer ¨ |
Non-accelerated filer ¨ | Smaller Reporting Company ¨ |
Indicate by check mark whether the registrant is a shell company (as defined in Rule 12b-2 of the Act).
YES ¨ NO þ
The aggregate market value of the common equity (all of which is voting) held by non-affiliates computed by reference to the price at which the common equity was last sold as of December 31, 2013, was $4,294,691,293.
At the close of business on July 31, 2014, there were issued and outstanding 74,932,869 shares of registrant’s Common Stock at $0.025 par value.
DOCUMENTS INCORPORATED BY REFERENCE
TABLE OF CONTENTS
Page No. | ||
PART I | ||
Item 1. | Business | |
Item 1A. | Risk Factors | |
Item 1B. | Unresolved Staff Comments | |
Item 2. | Properties | |
Item 3. | Legal Proceedings | |
Item 4 | Mine Safety Disclosures | |
PART II | ||
Item 5. | Market for the Registrant’s Common Equity, Related Stockholder Matters and Issuer Purchases of Equity Securities | |
Item 6. | Selected Financial Data | |
Item 7. | Management’s Discussion and Analysis of Financial Condition and Results of Operations | |
Item 7A. | Quantitative and Qualitative Disclosures About Market Risk | |
Item 8. | Financial Statements and Supplementary Data | |
Item 9. | Changes in and Disagreements With Accountants on Accounting and Financial Disclosure | |
Item 9A. | Controls and Procedures | |
Item 9B. | Other Information | |
PART III | ||
Item 10. | Directors, Executive Officers and Corporate Governance | |
Item 11. | Executive Compensation | |
Item 12. | Security Ownership of Certain Beneficial Owners and Management and Related Stockholder Matters | |
Item 13. | Certain Relationships and Related Transactions, and Director Independence | |
Item 14. | Principal Accountant Fees and Services | |
PART IV | ||
Item 15. | Exhibits, Financial Statement Schedules | |
Signatures | ||
Exhibit Index | ||
2
PART I
ITEM 1. | BUSINESS |
3
INTRODUCTION
Recent Developments
On June 22, 2014, MICROS Systems, Inc. (the "Company," "MICROS," "we" or "us"), a Maryland corporation, OC Acquisition LLC, a Delaware limited liability company ("Parent"), Rocket Acquisition Corporation, a Maryland corporation and a wholly-owned subsidiary of Parent ("Purchaser"), and solely for certain limited purposes, Oracle Corporation, a Delaware corporation and the parent of Parent and Purchaser ("Oracle") entered into an Agreement and Plan of Merger ("Merger Agreement").
Under the Merger Agreement, Parent and Purchaser agreed to commence a cash tender offer (the “Offer”) to acquire all of the shares of the Company’s common stock, par value $0.025 per share for a purchase price of $68.00 per share, payable net to the sellers in cash (the "Offer Price"), without interest thereon and subject to any required withholding of taxes. The aggregate purchase price represents a fully-diluted equity value of approximately $5.3 billion, or $4.6 billion net of cash.
The Merger Agreement provides, among other things, that as soon as practicable following the completion of the Offer and satisfaction or waiver of all other applicable conditions set forth in the Merger Agreement, Purchaser will merge with and into MICROS (the "Merger"), with the Comapny surviving the Merger as a wholly-owned subsidiary of Oracle.
At the effective time of the Merger (“Effective Time”), each outstanding share (other than (i) shares that are owned by Oracle, Parent or Purchaser or any other direct or indirect subsidiary of Oracle or Parent and (ii) shares that are owned by the Company or any of the Company’s direct or indirect wholly-owned subsidiaries) will be converted into the right to receive an amount per share equal to the Offer Price paid in the Offer (“Merger Consideration”). In connection with the Merger, the unvested portion of each Company stock option (the “Company Compensatory Award”) that is outstanding immediately prior to the Effective Time and held by a person who is an employee of, or a consultant to, the Company or any of its subsidiaries immediately prior to the Effective Time will be assumed by Oracle and converted automatically at the Effective Time into an option denominated in shares of Oracle's common stock. Notwithstanding the foregoing, (i) the vested portion (including any portion that pursuant to its terms becomes vested solely as a result of the transactions contemplated by the Merger Agreement) of each outstanding Company Compensatory Award immediately prior to the Effective Time, and (ii) the vested and unvested portion of each outstanding Company Compensatory Award held by a person who is not an employee of, or consultant to, the Company or any of its subsidiaries immediately prior to the Effective Time (each such award, or vested portion thereof, as the case may be, a “Cashed Out Compensatory Award”), will not be assumed by Oracle and will, immediately prior to the Effective Time, be cancelled and extinguished and in exchange therefor, each former holder of such Cashed Out Compensatory Award will have the right to receive an amount in cash equal to the product of (x) the aggregate number of shares of common stock subject to such Cashed Out Compensatory Award (or relevant portion thereof) immediately prior to the Effective Time and (y) the Offer Price less any per share exercise or purchase price of such Cashed Out Compensatory Award (or relevant portion thereof) immediately prior to such cancellation.
Under the Merger Agreement, the obligation for Purchaser to accept for payment shares of common stock of the Company validly tendered and not withdrawn in the Offer will be conditioned on (i) at least a majority of the shares of the common stock (calculated on a fully diluted basis in accordance with the Merger Agreement) having been validly tendered into and not withdrawn from the Offer, (ii) receipt of certain regulatory approvals, including expiration of the waiting period under the Hart-Scott-Rodino Antitrust Improvements Act of 1976, as amended (the “HSR Act”) and certain foreign antitrust laws, (iii) the accuracy of the representations and warranties and compliance with the covenants contained in the Merger Agreement, subject to qualifications, and (iv) other customary conditions.
The consummation of the Merger is subject to certain closing conditions. In connection with the Offer and Merger, certain stockholders of the Company have entered into a Tender and Support Agreement agreeing to tender their shares of common stock pursuant to the Offer and to support the Offer and the Merger. A form of the Tender and Support Agreement is provided as Exhibit A to the Merger Agreement, which is attached as Exhibit 2.1 to this Annual Report on Form 10-K and is incorporated herein by reference.
The closing of the Merger is subject to approval of the Merger by holders of the outstanding shares remaining after Purchaser accepts for payment shares of common stock of the Company validly tendered and not withdrawn in the Offer. However, the parties have agreed that if after the purchase of shares pursuant to the Offer and any subsequent offering period, and after giving effect to any shares purchased pursuant to the option described in the next paragraph, Purchaser owns at least 90% of the outstanding Shares, then once the other conditions to completion of the Merger are satisfied or waived, Purchaser will then merge with and into the Company in a “short-form” merger pursuant to applicable Maryland law, which will not require a vote of the Company’s stockholders.
4
In the Merger Agreement, the Company also granted Purchaser the option (the “Top-Up Option”) to purchase at the Offer Price, a number of newly issued shares of common stock equal to the lesser of (i) the number of shares that, when added to the number shares of common stock already directly or indirectly owned by Oracle, Parent and Purchaser following consummation of the Offer, constitutes 90% of the total amount of shares outstanding on a fully diluted basis immediately after taking into account the issuance of the shares pursuant to the Top-Up Option or (ii) the aggregate number of shares of common stock that the Company is authorized to issue under its Articles of Incorporation but that are not issued and outstanding (and are not subscribed for or otherwise committed to be issued or reserved for issuance) at the time of exercise of the Top-Up Option. If Parent, Purchaser, and any of their respective affiliates acquire at least 90% of the outstanding shares of common stock, including through exercise of the Top-Up Option, the parties have agreed to take all necessary and appropriate action to complete the Merger through the “short form” procedures available under Maryland law.
The foregoing description of the Merger Agreement is not complete and is qualified in its entirety by reference to the Merger Agreement, which is attached as Exhibit 2.1 to this Annual Report on Form 10-K and is incorporated herein by reference.
Parent and Purchaser commenced the Offer on July 3, 2014, and they extended the deadline for responding to the Offer to September 2, 2014. On July 16, 2014, the waiting period under the HSR Act applicable to the Offer expired. Because both MICROS and Oracle do significant business in the European Union, under the ECM Regulations, the purchase of shares pursuant to the Offer and the Merger may not be completed until the expiration of a 25 business day waiting period following the filing of a notification (Form CO) concerning the Offer and the Merger with the European Commission (the “Commission”), unless the waiting period is earlier terminated. On July 24, 2014, the Form CO was submitted by Oracle, which began the 25 business day review period. The review period is scheduled to terminate on August 29, 2014, unless extended by the Commission.
Additional information regarding the Merger, the Offer, and related matters, may be found in the Solicitation/Recommendation Statement on 14D-9, as amended, and the Tender Offer Statement on Schedule TO, as amended, as filed by MICROS and Oracle respectively with the U.S. Securities & Exchange Commission.
General
MICROS Systems, Inc. is a leading worldwide designer, manufacturer, marketer, and servicer of enterprise applications solutions for the global food and beverage, hotel, and retail industries. MICROS Systems, Inc. was incorporated in the State of Maryland in 1977 as Picos Manufacturing, Inc. and in 1978, changed its name to MICROS Systems, Inc.
References to “MICROS,” the “Company,” “we,” “us,” and “our” herein include the operations of MICROS Systems, Inc. and also our subsidiaries on a consolidated basis, unless the context indicates otherwise. Our fiscal year runs from July 1 through June 30. Accordingly, references to a fiscal year mean the 12-month period ending June 30 of that year; i.e., fiscal year 2014 means the 12-month period ending June 30, 2014.
We operate in two reportable segments for financial reporting purposes: U.S./Canada and International. You can find financial information for each reportable segment, as well as certain financial information about geographic areas, in Note 18 “Segment Information” in our Notes to Consolidated Financial Statements included in this Annual Report on Form 10-K. In each of our two reportable segments, we have developed an infrastructure through which we license and sell all of our products and services. While the products and services that are sold may be configured for each segment to address local laws, tax requirements, and client preferences, the products and services are substantially similar worldwide.
Our clients are in the food and beverage industry, the hotel industry, and the retail industry. We define these industries as follows:
The food and beverage industry encompasses numerous defined markets, including the following:
• | table service and quick service restaurants (including chains, franchisees of chains, and independent businesses) |
• | food and beverage operations within hotels |
• | entertainment venues (including, for example, stadiums, arenas, and theme parks) |
• | business food service operations |
• | casinos |
• | transportation food service |
5
• | government operations providing foodservice |
• | cruise ships |
The hotel industry consists of operations providing lodging related service to consumers. The hotel industry includes enterprises consisting of hotels, resorts, motels, casinos, cruise ships, bed and breakfasts, and campgrounds.
The retail industry consists of retail operations selling directly to businesses and consumer goods and services such as clothing, food, hardware, jewelry, shoe, convenience store, grocery, and other items.
Our enterprise application information solutions comprise three major areas: (1) food and beverage information systems, (2) hotel information systems, and (3) retail information systems. The food and beverage information systems consist of hardware and software for point-of-sale ("POS") and operational applications, ecommerce, back office applications (including inventory, labor and financial management), gift cards, and certain centrally hosted enterprise applications. The hotel information systems consist of software encompassing room reservation management systems, sales and catering, revenue management, ecommerce, business analytics, central reservations, and interfaces to third party applications. The retail information systems consist of software encompassing point-of-sale, loss prevention, ecommerce, business analytics, customer gift cards, electronic payments and enterprise applications. We market our products and services globally. We also sell hardware to our hotel and retail clients and provide field and remote support.
ENTERPRISE APPLICATIONS
Food and Beverage Enterprise Applications
Our food and beverage systems include enterprise applications, kitchen product applications, mobile applications, marketing and loyalty applications, and hardware. Most of the software products are designed to operate on industry standard computers, POS workstations, and mobile devices.
Hardware
The workstations that we designed, market, and support are the Workstation 5A and PC Workstation 2015. We also integrate other hardware devices (e.g., printers, cash drawers, credit card remote payment terminals, mobile devices, digital menu boards, kitchen control systems, and pole displays) into our complete product offerings.
The Workstation 5A is an industry standard POS workstation. Key design elements of MICROS’s workstations, which Workstation 5A builds upon, are the encased nature of the screen, special materials to withstand various levels of temperature and humidity, passive cooling, solid state storage, highly efficient energy use, and sound capabilities.
The MICROS PC Workstation 2015 is a high-performance workstation designed to operate our food and beverage applications and other third party software applications. It can be configured to accommodate various memory and storage requirements.
MICROS offers a family of tablet solutions named the mTablet R-Series. These tablets are designed to provide users with a mobile POS device with similar functionality to MICROS workstations. The mTablet R-Series can be placed into the MICROS mStation allowing the tablet to act as a workstation.
The Protégé Customer Display System and MICROS Order Confirmation Systems are designed primarily for the quick service restaurant market, and provide detailed information to a restaurant’s clients regarding their order, ensuring order accuracy and improving speed of service. The Protégé Customer Display System is connected directly to a MICROS Workstation. The MICROS Order Confirmation System provides order detail via a remote 15” daylight viewable, environmentally protected display.
We also market a product named the Keyboard Workstation 270. This product enables orders to be entered through the MICROS Simphony and 9700 HMS (software products which are described below) via a lower cost, durable workstation with a keyboard interface. The Keyboard Workstation is used primarily in institutional food service environments, convention centers, and sports complexes.
Through our JTECH subsidiary, we offer pagers, wireless systems, alert software, and related products (all manufactured for us by third party contract manufacturers) for use in food and beverage operations, retail, medical, and other environments.
Additionally, we resell various other hardware products, including personal computers, servers, printers, network cards, and other related computer equipment.
6
Software
Our main food and beverage enterprise applications software systems are Simphony, the MICROS Restaurant Enterprise Series (RES) system, the MICROS 9700 Hospitality Management System (HMS), and the MICROS e7 Series. These systems provide transaction control for table service, quick service, and large food service and entertainment venues. The products architecture enable users of many MICROS products to access third party software applications. In addition, many MICROS restaurant information system products interface with various back office accounting and property management systems, including our hotel products.
The Simphony family of software solutions is designed to be a comprehensive software application suite for use by table service restaurants, quick service restaurants, and large enterprise food and beverage operations. It is capable of operating at large, single site venues such as airport and other travel-related food service concessions, casinos, theme parks, and resorts as well multi-unit quick service and table service restaurant operations.
Simphony enterprise solutions are implemented either through a central hosted model or as an on-premise platform. The centralized configuration allows for a flexible deployment model that can be configured to meet the client’s requirements.
When deployed as an enterprise solution, Simphony enables clients to reduce significantly the costs associated with a traditional multiple property solution. The Simphony services can be run from a site’s workstations, eliminating the need to manage a back office server. In addition, software deployment for new properties and upgrades is controlled and managed at the enterprise level, thus eliminating the need to send staff to every store for these tasks.
The MICROS Restaurant Enterprise Series (RES) is designed for table service and quick service restaurants. The MICROS RES software solutions include POS transaction control, restaurant operations, data analysis, and communications. The restaurant operations modules include inventory, product forecasting, labor management, financial management, gift cards, customer loyalty, and enterprise data management. One of the modules is the Kitchen Display System, which displays food orders and offers additional reporting capabilities on restaurant service. Other components include Mobile MICROS and MICROS RES Kiosk, which enables customer information and self-ordering on third-party kiosks or directly through the use of smart phones and tablets.
For management of multiple restaurants, MICROS RES includes a suite of software products called Enterprise Management. This suite enables data to be transmitted to a remote site (e.g., the headquarters of a restaurant chain) for data collection and analysis. Additionally, pricing and menu changes can be made from a remote site and downloaded to specified restaurant locations.
The MICROS 9700 HMS is designed for larger leisure and entertainment venues, which include resorts, casinos, airport and other travel-related food service concessions, stadiums/arenas, theme parks, table service and quick service restaurants in hotels, and larger stand-alone restaurants. The product can be deployed on site in a client-server configuration or on a multi-property configuration where a remote server can address multiple food and beverage site operations.
We also market the MICROS e7 system to small restaurants globally.
Cloud Solution
We developed and market a web based product named “mymicros.net.” The mymicros.net product posts restaurant transaction detail to a centralized data warehouse in near real time. This product enables the customer to view reports and charts for a single site, a group of restaurants, or the entire enterprise from any location that has an Internet connection. In addition, mymicros.net incorporates additional products for inventory management, labor scheduling and control, gift cards, loyalty cards, and other marketing programs. The mymicros.net software product can either be purchased via a perpetual use license or by annual or multi-year software as a service ("SaaS") subscription contract.
Hosting
MICROS maintains an extensive collection of data center assets throughout the world to service our major markets. Simphony, mymicros.net, myCentral, myInventory, MyLabor and iCare make up the foundation of the hosted food and beverage product portfolio. For these software applications, MICROS provides full application lifecycle management including planning, operational readiness and deployment. MICROS hosting is a turn-key solution for the food and beverage market.
7
Food and Beverage Enterprise Application Products | Description |
Software | |
Simphony | An enterprise application family for table service restaurants, quick service restaurants, and for large food service, leisure and entertainment venues |
MICROS 9700 HMS | An enterprise application for large food service, leisure and entertainment venues |
Restaurant Enterprise Series (RES) | An enterprise application for table service and quick service restaurants |
MICROS e7 | An enterprise application for small restaurants |
Kitchen Display System | Component of RES, providing additional reporting capabilities and information |
RES Kiosk | Component of RES, for self-ordering and customer information via a kiosk |
mycentral | A web based product enabling on-line ordering from restaurants |
mymicros.net | A suite of web based products for use with food and beverage enterprise application products |
myreservations | A web based restaurant reservation service |
Hardware | |
MICROS Workstation 5A | A POS workstation for food and beverage operations |
MICROS PC Workstation 2015 | A high performance workstation for use in food and beverage operations |
MICROS mTablet R-Series | A tablet with a modular design |
MICROS mStation | A companion device to the mTablet which holds and connects to the tablet. The mStation provides connectivity to peripherals, power, battery, and network communications |
MICROS Protégé Customer Display | Interactive customer display providing order confirmation and marketing content |
MICROS Order Confirmation System | A display system used in quick service restaurant drive-through facilities |
Keyboard Workstation 270 | A lower cost, durable workstation with a keyboard interface |
JTECH Paging Products | A suite of paging products |
Our food and beverage enterprise application systems are installed worldwide. Major table service restaurant chain clients include the following:
• Bertucci’s | • Friendly’s | • Mimi’s Cafe |
• Buffalo Wild Wings | • Groupe Le Duff | • Perkins |
• Cara | • Hard Rock Café | • Pizza Express |
• Cracker Barrel | • HMS Host | • Ruby Tuesday’s |
• Costa Coffee | • IHOP | • Ruth’s Chris Steakhouse |
• Del Friscos | • Johnny Carinos | • T.G.I. Friday’s |
• Eat N’Park | • La Madeleine | • VIPS |
• Fazer Amica | • Lone Star | • Wagamama |
• Famous Dave’s | • Manchu Wok | • Whitbread |
8
Major quick service chain restaurant clients (including clients who are franchisees of the chains listed below), include the following:
• Atlanta Bread | • Extreme Brandz | • Starbucks | ||
• Arby’s | • Five Guys | • Tropical Smoothie Café | ||
• Auntie Anne’s | • Krispy Kreme | • Wagamama’s | ||
• Baja Fresh | • Ovation Brands | • Wendy’s | ||
• Ben & Jerry’s | • Pinkberry | • Wingstop | ||
• Burger King | • Popeye’s | • Yum! Brands | ||
• Coffee Club | • Retail Brand Group | • Zaxby's | ||
• El Pollo Loco | • Sonic | |||
Our food and beverage enterprise application systems are also installed in hotel restaurants in various hotel chains, including the following:
• Accor | • Hyatt | • Omni |
• Boyd Gaming | • InterContinental Hotels | • Pan Pacific |
• Camino Real | • Kempinski | • Peninsula |
• Danubius | • Mandarin Oriental | • Radisson |
• Fairmont | • Marriott International | • Starwood International |
• Four Seasons | • MGM Resort | • Wyndham |
• Hilton | • Millennium | |
Additional significant markets for our food and beverage enterprise application systems include complex food service environments such as casinos, cruise ships, sports arenas, airport concourses, theme parks, recreational centers, institutional food service organizations, and specialty retail shops. Clients for our systems that serve these environments include Aramark, Centerplate, Compass, Delaware North, HMS Host, Sodexho, and various government entities. We have also installed large food and beverage enterprise application systems for the following clients:
• Citi Field | • Levi Stadium | • Target Field |
• Emirates Stadium | • MetLife Stadium | • The Venetian Resort |
• Fenway Park | • MGM Grand Casino | • Washington Nationals |
• Grand Casino | • M&T Bank Stadium | • Wembley Stadium |
• Harrah’s Casinos | • Raymond James Field | • Wynn Resorts |
We supply and service enterprise application systems for users in the complex food service environments identified above both directly and through distribution channels, including through specialty reseller relationships with Blackboard Inc. and The CBORD Group Inc.
Hotel Enterprise Applications
For the hotel industry, we develop, distribute, and support a comprehensive line of hotel enterprise application software products and services. Globally, there are approximately 30,000 MICROS hotel property management applications installed. Approximately 90% of these sites have installed our OPERA software suite or Fidelio Suite8, products which we continue to develop.
Our OPERA suite includes property management, sales and catering, central room reservations, customer information system, revenue management, sales support, data mining, financial statements, condominium reservations and accounting, golf reservations, spa management, and quality management. OPERA’s software architecture enables the product to be deployed either on-premise or hosted in a data center.
The OPERA software provides for hotel room reservations, guest accounting, travel agent accounting, sales and catering, revenue management, and engineering management. The OPERA software also interfaces to central reservation systems, whether MICROS or third parties, to on-line travel services (e.g., Expedia, Priceline and Hotels.com), and to global distribution systems (e.g., Sabre, Galileo, Amadeus and WorldSpan). The OPERA Sales and Catering software enables hotel
9
sales staff to evaluate, reserve and invoice meetings, banquets, and related events for a property. The OPERA Reservation software enables hotels to coordinate, process, track, and analyze hotel room reservations at a central facility for electronic distribution to the appropriate lodging site. The OPERA Customer Information system software enables hotels to efficiently capture and track relevant guest information. The OPERA Revenue Management software enables hotels to manage room rates, occupancy, and the mix of business between corporate and transient clients. We also offer an Internet-based hotel reservation service via our myfidelio.net service. This service enables corporations, tourist representation services, and consumers to reserve rooms and manage reservations directly with designated hotels. This service also enables those hotel properties without internal reservation capabilities to outsource to us the maintenance of their connectivity to the global distribution systems and certain alternative distribution systems.
We also offer limited versions of the OPERA room reservation system called OPERAXpress, OPERALite, and Operetta. These products enable smaller properties to deploy the OPERA at a lower price, but with fewer features and functions than the full OPERA suite.
We believe that the OPERA software suite is an important product line for our continued growth in the hotel information systems market, because it has been a material source of our revenue growth within the hotel industry and because we continue to devote a significant portion of our research and development efforts toward further technological improvement of the software.
We also market a hotel software product under the name Fidelio Suite8. The product is designed to meet the needs of chain hotels, independent hotel operators, resorts, campgrounds, and seasonal lodging sites.
Hosting / SaaS
We offer SaaS products and hosting services for hotel clients in several of our hosting centers around the world. OPERA is the core of the hosted hotel product portfolio. For hosted OPERA, MICROS provides full application lifecycle management starting with infrastructure design and sizing, infrastructure delivery, load testing, operational readiness, go-live and complete day-two managed services of the application.
Cruise
Through our subsidiary Fidelio Cruise, we market the Ship's Property Management System (“SPMS”) suite of applications, which includes software products designed for use by the cruise industry. The SPMS application enables cruise operators to manage passenger, visitor, group, and crew information at various stages from check-in to check-out, invoicing, credit card handling with online functionality, safety and security, and automated check-in with picture taking for passengers, crew, and visitors. Through the SPMS software, cruise lines can monitor all financial transactions on board and operate a central accounting and invoicing system for each passenger and crew member. Furthermore, the software maintains the count of passengers and staff on-board, as required by international industry regulations. Additional SPMS modules support the operation of on-board health spas, on-board MICROS point-of-sale systems, on-board business centers, on-board medical centers, and on-board casinos, as well as shore excursions.
We also market the Fidelio Cruise Crew Management System, which supports the shoreside and shipboard crew resource operations for a cruise ship, the Fidelio Cruise Fleet Management System, which enables fleet-wide data analysis for cruise ship operators, and the Fidelio Cruise Materials Management System, which provides a real-time fleet-wide inventory of consumables at an individual shipboard level and at a cruise ship headquarters.
10
Hotel Enterprise Application Products | Description | |
Software | ||
OPERA Property Management | Room reservation software for hotels, targeted to full service hotels | |
OPERAXpress | Room reservation software for hotels, targeted to limited service hotels | |
OPERALite | Room reservation software for hotels, targeted to smaller hotels | |
Operetta | Room reservation software and hardware bundle for hotels, targeted to smaller hotels | |
OPERA Mobile | A mobile application for hotel room reservations and other applications | |
OPERA Revenue Management System | Software that helps hotels develop and manage pricing strategies | |
OPERA Reservation System | Software that manages central hotel reservations for hotel chains or hotel groups | |
OPERA Customer Information System | Software that manages customer information and loyalty programs | |
OPERA Vacation Ownership System | Software that manages reservations for hotel condominiums and related condominium management | |
OPERA Web Booking Suite System | Software that enables OPERA to receive Internet reservations | |
OPERA Sales and Catering | Software that helps hotels manage client on-site meeting needs | |
OPERA Sales Force Automation | Software that manages sales leads, meeting agendas, and contracting, and provides other support to the national and regional sales teams for hotel chains | |
OPERA Activity Scheduler | Software that manages the scheduling and billing for hotel resort recreational activities, such as golf, tennis, spas, etc. | |
OPERA Kiosk | Enables guest check-in and check-out at a stand-alone kiosk, and includes other interactive features | |
OPERA Business Intelligence | Software that provides analytics for financial and operations analyses | |
Fidelio Suite 8 | Room reservation software for hotels, generally smaller chains and independents | |
myfidelio.net | An Internet based hotel reservation service and network | |
Fidelio Cruise Systems | A suite of software products that manages reservations, food and beverage applications and other activities for the cruise industry | |
Our hotel room reservations applications are installed worldwide in leading hotel chains including the following:
• Accor | • Hilton Hotels | • Omni |
• Best Western | • Hyatt Hotels & Resorts | • Peninsula |
• Camino Real | • InterContinental Hotels Group | • Scandic |
• Carlson Hotels | • ITC Welcome Group | • Shangri-La |
• Danubius | • Kempinski | • Sol Melia |
• Delta Hotels | • Loews | • Solare |
• Dusit Thani | • Louvre Hotels | • Starwood International |
• Fairmont | • MGM Resorts | • Steigenberger |
• Federal | • Marriott International | • Travelodge |
• Four Seasons | • Millennium | • Wyndham Worldwide |
• Hard Rock Hotels | • Mövenpick | • Wynn Resorts |
11
The MICROS OPERA Reservation System is installed in numerous hotel chains, including the following:
• Boscolo | • MGM Resorts | • Starhotels | ||
• Constellation | • Omni | • Sun International | ||
• Delta Hotels | • Pan Pacific | • Tarsadia Hotels | ||
• Fairmont | • Red Lion | • Thon | ||
• Four Seasons | • Restel | • Thistle | ||
• Great Wolf Resorts | • Rydges | • Travelodge | ||
• Hong Kong & Shanghai Hotels Ltd. | • Scandic Hotels | • Westmark | ||
• Loews Hotels | • Shangri-La | • Wyndham Worldwide | ||
• Louvre Hotels | • Shell Hospitality | • Wynn Resorts | ||
• MacDonalds | • Shila Hotel Group | • Xanterra | ||
• Millennium & Copthorne | • Sokos | |||
Fidelio Cruise software is installed on approximately 220 cruise ships. Clients include the following:
Ÿ | Aida Cruises | Ÿ | MSC Cruises | Ÿ | Royal Caribbean International |
Ÿ | Carnival | Ÿ | Norwegian Cruise Line | Ÿ | Sea Cloud |
Ÿ | Celebrity Cruise | Ÿ | P&O Cruises UK | Ÿ | Seabourn |
Ÿ | Cunard Line | Ÿ | Princess Cruises | Ÿ | Silversea Cruises |
Ÿ | Fred Olsen Line | Ÿ | Pullmantur | ||
Ÿ | Holland America Line | Ÿ | Regent Seven Seas Cruises | ||
Retail Enterprise Applications
We market retail enterprise software applications encompassing store based systems, cloud based applications for business intelligence, and ecommerce solutions.
Xstore Store Management System (“Xstore”) is a store based software application designed for the retail industry. Xstore provides a wide array of functionality aimed to support in-store operations including point-of-sale, omni-channel orders, CRM and clienteling, inventory management, cash management, timekeeping and payroll functions, employee scheduling, and in-store reporting. It has a full SOA (service oriented architecture) compliant architecture with a highly flexible configuration capability, making it possible for clients to customize the application.
We also support other retail store based software applications, including Retail J, Lucas, and Store21 Store Management System (“Store21”), Tradewind and C2. The Retail J software provides point-of-sale, inventory control, mobile applications, payment solutions, business analytics, customer sales vouchers, and human capital management. Lucas is a retail software system designed for use in the fuel and convenience store industry and specialty retail. Store21 is a product designed for specialty retailers while Tradewind is a product targeted at larger format stores and at high transaction volume stores. C2 is a new retail based store application which is offered for Latin America.
We also offer the MICROS Home Office Business Intelligence Suite for retail stores, which includes loss prevention (marketed under the trade names “XBR” and “XBRi Ingenium”), customer relationship management, gift cards (marketed under the trade name “Relate”), and audit control (marketed under the trade name “Balance”).
We offer an ecommerce platform with extensive features, marketed under the trade name the MICROS Commerce Platform, as well as creative and design services to help clients create custom websites.
We also offer order management and order broker software and services (marketed under the trade names “CW Serenade” and “Locate,” respectively) that enable a retailer to manage customer purchase transactions through multiple sources, including a store, the Internet, catalog phone-in orders, call centers, kiosks, and wireless devices. The solutions enable the merchant to provide the customer with full transparency through the purchasing process, e.g., research from one channel, purchasing from a second channel and implementing a return or exchange through a third channel.
12
In addition, we develop, support, and distribute software solutions which provide for collaborative end-to-end product and supplier lifecycle management and ingredient legal compliance tracking under the names “Creations” and “myCreations.” These products, which may be deployed either as client server applications or as web based applications, offer retailers the ability to track and manage product ingredients and finished inventory from the manufacturer through the point of distribution.
Hosting
We host the MICROS Commerce Platform, client web sites, XBR Ingenium, a loss prevention SaaS platform, and MyCreations.
Retail Enterprise Application Products | Description | |
Software | ||
XStore Management System | Java-based retail software | |
Retail J | A software enterprise platform encompassing point of sales, inventory control and reporting | |
Lucas | A software enterprise platform for specialty retail and fuel and convenience stores | |
Store 21 Store Management System | Software targeted for specialty retailers | |
Tradewind Store Management System | Software targeted for stores with high volume transactions | |
ARS POS | Software developed, supported, and marketed primarily in Mexico and Central America | |
C2 | A retail based store application for accounts in Latin America | |
Home Office Business Intelligence Suite | Suite of software products that analyzes, manages and reports on business activities at the store level for corporate control (which includes XBR and XBRi Ingenium Loss Prevention) | |
Relate | Software that manages a retailer’s gift card loyalty program | |
CWSerenade | A fully integrated suite of modules for effective management of all aspects of direct commerce | |
CWLocate Merchandise Location System | Software that enables a retailer to locate inventory across multiple locations | |
CWCollaborate | Software that connects retailers with suppliers to efficiently manage inventory and reorder levels | |
MICROS Commerce Platform | Web site development, management, hosting and ecommerce applications | |
MICROS Creations and myCreations | Software that provides for collaborative supply chain management, for both the private label and branded consumer goods market | |
Multi-Channel Hub | Software which enables retailers to manage various channels of purchasing with order fulfillment | |
Merchandising Planning | Software which allows the user to plan, forecast and manage inventory | |
13
Our retail store clients include the following retail chains:
• Adidas | • Hannaford Brothers | • Sainsbury’s |
• Advance Auto Parts | • H.E. Butt | • Sobeys |
• Armani Exchange | • Hugo Boss | • Sony of Canada |
• Ashley Stewart | • Hudson Group | • Starbucks |
• Barney’s New York | • Ikea | • Steve Madden Retail |
• Belk | • Jones Apparel | • Stonewall Kitchen |
• Blain’s Farm and Feed | • Jos. A. Banks Clothiers | • Sur La Table |
• Bostonian | • Kingfisher | • Swatch |
• BP | • Kodak | • Tesco |
• Burberry Limited | • Martin McColls | • Tommy Hilfiger |
• C & A | • Metro | • Urban Brands |
• Chelsea and Scott | • Nike Mexico | • Wm. Morrison |
• Dixons | • Pendleton | • Whirlpool |
• Fresh and Easy | • Polo Ralph Lauren | • Zales |
• Furla | • PPG | |
• Garnet Hill | • Reebok Retail | |
SERVICES
Services are a critical component of our business. We provide a wide range of services to our clients, including:
Ÿ | system installation | Ÿ | professional consulting |
Ÿ | operator and manager training | Ÿ | software hosting |
Ÿ | on-site hardware maintenance | Ÿ | software as a service (SaaS) |
Ÿ | customized software development | Ÿ | hotel reservation transaction services |
Ÿ | application software support | Ÿ | web site development |
Ÿ | credit card software support | Ÿ | portal management |
Ÿ | systems configuration | Ÿ | web-based marketing services |
Ÿ | network support | ||
Service revenue constituted approximately 65.4% ($919.4 million) of our total revenue in fiscal year 2014 compared to approximately 67.5% ($855.4 million) of our total revenue in fiscal year 2013 and approximately 65.6% ($727.0 million) in fiscal year 2012.
Maintenance service contracts, which include on-site and depot hardware maintenance, application software support, and credit card software support are a significant component of our service offerings. Revenues for recurring service maintenance contracts were approximately $505.2 million for fiscal year 2014, approximately $482.4 million for fiscal year 2013 and approximately $366.2 million for fiscal year 2012. Our hosting services and SaaS products are also a growing and increasingly significant part of our service offerings. Revenues generated from these services in aggregate were approximately $100.0 million for fiscal year 2014, approximately $86.0 million for fiscal year 2013, and approximately $74.8 million for fiscal year 2012.
Support
We provide on-site hardware maintenance and software support mainly via a combination of direct channels (our branch offices and subsidiaries) and indirect channels (our authorized independent dealers and distributors). The on-site hardware maintenance is provided mainly to clients using MICROS hardware and software systems. Depot field maintenance is also provided. We sometimes contract with computer manufacturers to provide either first or second line support for servers for food and beverage, hotel and retail clients.
14
We operate numerous help desk support centers around the world. Our corporate customer support center in Columbia, Maryland also provides support for the United States and Canadian clients and back-up support for our primary regional centers in Buenos Aires, Argentina; Galway, Ireland, and Singapore. The regional support centers also provide back-up support and guidance for local and in-country support providers. Our help desk operations receive support calls from clients and either address them via phone or on-line, and when appropriate, dispatch a service call to the appropriate local service provider. Internationally, in-country support is provided by the local sales entity, which may be a MICROS subsidiary or an authorized independent distributor.
We also maintain other regional and product-specific help desks in the following locations:
• | Ann Arbor, Michigan – for certain of our web site development and portal management products |
• | Boca Raton, Florida – for the JTech paging family of products |
• | Bogata, Colombia - support for hotel and food and beverage clients in Latin America |
• | Buenos Aires, Argentina – primarily for clients in Latin America and Spain |
• | Dunstable, Bolton and Milton Keynes, England – primarily for Retail J, Lucas, and related products and services. |
• | Galway, Ireland – primarily for clients in Ireland and the U.K. and secondary support for MICROS’ Europe, Africa and Middle East ("EAME") region |
• | Hamburg, Germany and Ft. Lauderdale, Florida-for cruise clients |
• | Scottsdale, Arizona – for a legacy restaurant software product |
• | Singapore – primarily for clients in the Asia-Pacific region |
• | Solon, Ohio – for retail software products |
• | Westborough, Massachusetts – for retail back office and business intelligence products |
Hosting Centers
We operate co-located data centers in Ashburn and Manassas, Virginia; Buenos Aires, Argentina; Chicago, Illinois; Denver, Colorado; Frankfurt, Germany; Nottingham, England; Queretero, Mexico; Sao Paulo, Brazil; and Singapore in conjunction with third-party vendors to serve as hosting centers for clients deploying our various hosted and SaaS application service products. We view hosting and SaaS as an important component of our business as demand shifts from applications being deployed on the premises of clients to cloud based solutions.
Web eCommerce Services
We offer website design and portal management services for hotels, food and beverage operations and retail companies. These include the development and management a client’s web site for ordering, sales promotion, and marketing. We also offer web based marketing services to hotels, food and beverage operations and retail companies.
SALES, MARKETING AND DISTRIBUTION
We believe our direct and indirect global distribution network is a major strength and a competitive advantage. Our distribution channel enables MICROS to provide sales and support to clients globally.
Our food and beverage products and services are sold primarily through three channels: (i) the direct sales channel, (ii) the MICROS major accounts program, which markets to designated regional, national, and international clients; and (iii) the indirect sales channel, a global independent sales and service istribution network.
Our hotel products and services are sold mainly through our direct sales force in the United States/Canada, international subsidiaries and international distributors.
Our retail products and services are sold primarily through our direct sales force in the United States/Canada and through our international subsidiaries.
15
RESEARCH AND DEVELOPMENT
Our products are subject to technological change. Accordingly, we must continually devote our efforts toward upgrading our existing products and developing innovative systems incorporating new technologies. Over the past several years, our products, as well as those of our competitors, have offered an increasingly wider range of features and capabilities. In addition, to maintain and enhance our competitive position, we monitor and evaluate software and hardware products and designs created by third parties, and we have acquired and may in the future acquire ownership, licensing, or distribution rights to some of those products and designs. We also maintain close relationships with major software operating and database companies. These relationships augment our ability to incorporate software changes from these companies into our products. Our international offices may also conduct specific product enhancement activities to meet specific interface needs, local requirements, and specific customer requests.
Research and Development Facilities
The following table summarizes several locations of our main research and development facilities and the products addressed at each facility:
Location | Products |
Columbia, Maryland | Food and beverage enterprise application software and hardware and related cloud-based applications |
Ann Arbor, Michigan | Retail web site and ecommerce development |
Berlin, Germany | Lucas and related products and services |
Boca Raton, Florida | Paging software and hardware development |
Bolton, England | Retail J, Lucas and related products and services |
Dunstable, England | Retail J, Lucas and related products and services |
Ft, Lauderdale, Florida | Fidelio Cruise software development |
Hamburg, Germany | Fidelio Cruise software development |
Monterrey, Mexico | ARS and C2 retail software development |
Naples, Florida | Hotel software, CRS software, and other modules, also cloud-based hotel applications (e.g., myfidelio.net) |
Neuss, Germany | Additional food and beverage software development; Fidelio Version 8. |
Nottingham, England | Retail life cycle management and supply chain traceability products |
Solon, Ohio | Retail application software development |
Westborough, Massachusetts | Retail Loss Prevention software and cross-vertical software development |
Additional Locations
In addition to the locations listed above where we conduct software and hardware development, we also conduct software development in our regional offices in Buenos Aires, Argentina and Singapore to facilitate rapid responses for various local and regional needs.
We contract the manufacturing of our workstations to the Venture Corporation Limited of Singapore ("Venture"). Venture also provides certain hardware design services to us. Our internal hardware design team also participates in the design and development of these units, and provides oversight of the manufacturing process to ensure the manufacturer’s adherence to our quality standards. See also “Manufacturing and Supplies,” below.
Research and Development Expenses
Research and development (“R&D”) expenses consist primarily of labor costs less capitalized software development costs. A summary of R&D expenditures for the fiscal years ended June 30, 2014, 2013 and 2012 is set forth in the following table:
Fiscal Year Ended June 30, | |||||||||
(in thousands) | 2014 | 2013 | 2012 | ||||||
Total R&D incurred | $ | 91,746 | $ | 76,892 | $ $59,228 | ||||
Capitalized software development costs | (9,718) | (4,290) | (7,197) | ||||||
Total R&D expenses | $ | 82,028 | $ | 72,602 | $ | 52,031 | |||
16
COMPETITION
The markets in which we operate are highly competitive. We believe that there are at least 20 significant competitors worldwide that offer some form of sophisticated food and beverage software system, at least 10 that offer competitive hardware platforms, over 15 significant hotel systems competitors, and more than 10 significant retail systems competitors. We compete on various bases, including product functionality, service capabilities, price, and geography. We believe that our competitive strengths include our established global distribution and service network, our ability to offer a broad array of hardware, software, and service products to the food and beverage, hotel, and retail industries, and our corporate focus on providing specialized information systems solutions.
Competitors in the food and beverage marketplace include: (i) full service providers (i.e., hardware, software, and services) such as NCR, Panasonic, and Par Technology; (ii) suppliers that mainly provide software, such as Agilysys, Positouch, and Xpient Solutions; (iii) providers that mainly provide hardware such as Sharp, Casio, Dell, HP, and Toshiba and (iv) cloud-based software companies.
In the hotel marketplace, we compete with companies that have several hotel related software products, as well as companies that offer a single product or service aimed at a particular niche. These competitors include Agilysys, Amadeus (Newmarket - primarily a sales and catering product), MSI, Northwinds, Par Technology (under the SMS brand name), Protel, Sabre, SkyTouch (a division of Choice Hotels International), and Softbrands (an affiliate of Infor). Internationally, we generally face smaller, regionally-oriented competitors. Our products and services also compete with room reservation systems developed and marketed by major hotel chains for their corporate-owned operations and franchisees.
The central reservation system market is highly fragmented and competitive. Many hotel chains and allied reservation groups use their own customized central reservation systems. In addition to these internally developed products, our central reservation system competes with those offered by some of our hotel competitors, e.g., Northwinds and Sabre, and with those offered by specialized central reservation providers, e.g., Amadeus, Pegasus, Trust International/TravelPort and Vantis.
Our competitors in web marketing services in U.S./Canada region include Synxis (a subsidiary of Sabre) and TravelClick.
Competitors in the retail market include Cegid, Epicor, Escalate Retail, Oracle, PCMS UK, Red Prairie, and SAP among many others. There are many smaller retail enterprise application companies, especially internationally. With respect to ecommerce website development and management, we compete against several companies, including ATG (a subsidiary of Oracle), Demandware, Ebay Enterprise and IBM (mainly under the Websphere Commerce brand).
MANUFACTURING AND SUPPLIES
Our manufacturing program seeks to maintain flexibility and reduce costs by outsourcing key products and sub-assemblies. Our primary terminal hardware platforms (Workstation 5A, PC Workstation 2015, mTablet R-Series, and Keyboard Workstation 270) are manufactured for us by Venture.
Our contract with Venture is subject to automatic annual renewal unless either party elects to terminate the agreement at the end of the term then in effect by providing notice to the other party at least three months before the end of the term. In addition to other termination rights specified in the contract, either party may terminate the contract for convenience (i.e., with or without cause) by providing 365 days prior notice of termination to the other party. While historically we have enjoyed good relations with Venture, if it were to exercise its non-renewal or termination rights under the agreement or otherwise cease to manufacture our products, we believe we could readily replace Venture with other contract manufacturers or resell appropriate third party hardware products.
Venture performs certain warranty and post-warranty repairs on equipment that it manufactures for us at its facilities in Singapore, Anaheim, California, and at a partner location in Scotland. In addition, we maintain repair capability for certain products in our distribution facility in Hanover, Maryland. We also perform repairs at certain of our direct and subsidiary offices worldwide, and additionally we contract with third parties to provide repair services, however expenses related to this activity has not been material.
Our paging and related products are largely manufactured by several contract manufacturers in China and by Venture. We conduct final assembly of our paging and related products, including the installation of the applicable software, in our Boca Raton, Florida facility.
We operate a factory in Germany which manufactures cash drawers.
Material sourcing is based on availability, service, cost, delivery, and quality of the purchased items from domestic and international suppliers. Some items are custom manufactured to our design specifications. We believe that the loss of our
17
current sources for components would not have a material adverse effect on our business since other sources of supply are generally available. We believe that we maintain good relationships with our suppliers.
ASSOCIATES
As of June 30, 2014, we employed 6,809 full-time associates. The table below presents associates by geographical region, expressed both as a headcount and as a percentage of total associates:
By Geographical Region | U.S./ Canada | Europe/Africa Middle East | Asia/ Pacific | Latin America | Total |
Associates | 2,675 | 3,043 | 690 | 401 | 6,809 |
As a % of total | 39% | 45% | 10% | 6% | 100% |
Approximately 960 of the U.S./Canada associates (approximately 36% of the U.S./Canadian associates) work out of our four Maryland locations: our headquarters building in Columbia, Maryland; our Hanover, Maryland distribution center; our Salisbury, Maryland regional food and beverage sales and service office; and our MICROS ecommerce office in Chevy Chase, Maryland.
We are not a party to any collective bargaining agreements, and none of our associates are represented by a labor union, except in those countries where representation is mandated by law, such as France, Germany and Spain. We use certain suppliers whose associates may be represented by labor unions. We believe that we maintain good relations with our associates.
EXECUTIVE OFFICERS OF THE REGISTRANT
Officers of the Company are elected at the regular annual meeting of the Company's Board of Directors following the Annual Meeting of Stockholders and hold office until the Annual Meeting of the Board of Directors next following his or her election, and until his or her successor has been duly elected and qualified, or until his or her death, resignation, or removal. A vacancy may be filled for the unexpired portion of the term by the Board of Directors.
The following are the executive officers of the Company.
Name | Position | |
Peter A. Altabef | President and Chief Executive Officer | |
Bernard Jammet | Executive Vice President, North America Region | |
Kaweh Niroomand | Executive Vice President, Europe-Africa-Middle East Region | |
Thomas L. Patz | Executive Vice President, Strategic Initiatives and General Counsel | |
Gabriel Pestalardo | Senior Vice President, Latin America and Caribbean Region | |
Peter J. Rogers, Jr. | Executive Vice President, Investor Relations and Business Development | |
Cynthia A. Russo | Executive Vice President and Chief Financial Officer | |
Nirmal Singh | Senior Vice President, Asia-Pacific Region | |
Peter A. Altabef, 55, has been the Company’s President and Chief Executive Officer, and a member of the Company’s Board of Directors, since January 2013. Mr. Altabef previously served as President and Chief Executive Officer of Perot Systems from 2004 until 2009, when Perot Systems was acquired by Dell, Inc. Thereafter, Mr. Altabef served as President of Dell Services (a subsidiary of Dell, Inc.) until his departure in March 2011. Mr. Altabef also serves on the Board of Managers of Merit Energy Company, LLC, and the Advisory Board of Petrus Trust Company, L.T.A. He previously served as Senior Advisor to 2M Companies, Inc. from January to December 2012, and served as a director of Belo Corporation from July 2011 through December 2013. Mr. Altabef is a graduate of Binghamton University, SUNY, and the University of Chicago Law School.
Bernard Jammet, 56, has been MICROS’s Executive Vice President, North America Region, since July 1, 2014. From January 2001 until June 30, 2014, he served as Executive Vice President, Latin American Region. Previously, Mr. Jammet served MICROS in various capacities. He first joined MICROS in July 1984. Before joining MICROS, Mr. Jammet was employed with the former MICROS distributor for France. Mr. Jammet is a graduate of the Hotel School of Lausanne, Switzerland, with a Masters degree in Hotel Administration.
18
Kaweh Niroomand, 61, has been MICROS’s Executive Vice President, Europe-Africa-Middle East Region since August 2009. From 2005 until August 2009, Mr. Niroomand was President of MICROS’ EAME region. Earlier, Mr. Niroomand was Executive Vice President, EAME and Managing Director of MICROS-Fidelio Software Deutschland GmbH. Mr. Niroomand first started with Fidelio Software GmbH in 1993 (acquired by MICROS in 1995). Mr. Niroomand is a graduate of the Technical University in Berlin with a degree in Civil Engineering.
Thomas L. Patz, 53, has been MICROS’s Executive Vice President, Strategic Initiatives, and General Counsel since January 2000. Previously, Mr. Patz served MICROS in various legal capacities. Mr. Patz first joined MICROS in August 1995. Mr. Patz is a graduate of Brown University and the University of Virginia School of Law. Mr. Patz is a member of the Maryland Bar.
Gabriel Pestalardo, 52, has been MICROS’s Senior Vice President, Latin America and Caribbean Region since July 1, 2014. From 2005 through June 30 2014, Mr. Pestalardo served as Vice President of South America. Mr. Pestalardo first joined MICROS in 2000 as a result of the acquisition by MICROS of Hospitality Technologies S.A., formerly the MICROS authorized dealer in Argentina. Mr. Pestalardo held the position of Managing Director at Hospitality Technologies S.A. Prior to 1999, Mr. Pestalardo served as a Director of Siemens S.A in Argentina where he led the MICROS dealership business, among others. Mr. Pestalardo holds an Engineering degree from Buenos Aires Institute of Technology (ITBA) and engaged in postgraduate studies in Corporate Finance at New York University.
Peter J. Rogers, Jr., 59, has been MICROS’s Executive Vice President of Investor Relations and Business Development since November 2007. From 1996 through November 2007, Mr. Rogers was MICROS’s Senior Vice President of Investor Relations and Business Development. Previously, Mr. Rogers served MICROS in various marketing and business management capacities. Mr. Rogers joined MICROS in 1987. Mr. Rogers is a graduate of the University of Pennsylvania (B. A. Economics) and New York University Stern Graduate School of Business (M.B.A. Corporate Finance).
Cynthia A. Russo, 44, has been MICROS’s Executive Vice President and Chief Financial Officer since April 2010. From November 2007 until April 2010, Ms. Russo was MICROS’s Senior Vice President and Corporate Controller. Ms. Russo previously served MICROS in various capacities. Ms. Russo first joined MICROS in January 1996. Ms. Russo is a graduate of James Madison University. She is a Certified Public Accountant and a Certified Internal Auditor.
Nirmal Singh, 54, has been MICROS’s Senior Vice President, Asia-Pacific Region since July 1, 2014. From 1999 until June 30, 2014, Mr. Singh was the Chief Financial Officer for the Asia-Pacific Region. Mr. Singh previously served MICROS in various capacities. Mr. Singh first joined MICROS in 1996. Before joining MICROS, Mr. Singh was a partner of N.M. Raiji & Co, Chartered Accountants, Bombay (India). Mr. Singh received a Bachelor of Commerce degree from University of Bombay. He is a Chartered Accountant and also a Cost and Works Accountant.
FOREIGN SALES AND FOREIGN MARKET RISK
We recorded foreign sales, including exports from the United States, of approximately $822.9 million during fiscal year 2014 to clients located primarily in Europe, Asia, and Latin America. Foreign sales in fiscal years 2013 and 2012 were approximately $770.1 million and $586.3 million, respectively. See Note 18 “Segment Information” in the Notes to Consolidated Financial Statements as well as Item 7 "Management’s Discussion and Analysis of Financial Condition and Results of Operations" in this report for additional geographic data.
Our international business and presence expose us to certain risks, such as currency, interest rate and political risks. With respect to currency risk, we transact business in different currencies primarily through our foreign subsidiaries. The fluctuation of currencies impacts sales and profitability. Frequently, sales and the costs associated with those sales are not denominated in the same currency.
19
We transacted business in 41 currencies in the three fiscal years ended June 30, 2014, 2013 and 2012. The relative currency mix over the past three fiscal years was as follows:
% of Reported Revenues Fiscal Year Ended June 30, | Exchange Rates to U.S. Dollar as of June 30, | |||||||||||||||||
Revenues by currency (1): | 2014 | 2013 | 2012 | 2014 | 2013 | 2012 | ||||||||||||
United States Dollar | 43 | % | 41 | % | 49 | % | 1.0000 | 1.0000 | 1.0000 | |||||||||
European Euro | 22 | % | 25 | % | 23 | % | 1.3693 | 1.3010 | 1.2661 | |||||||||
British Pound Sterling | 15 | % | 14 | % | 8 | % | 1.7106 | 1.5211 | 1.5704 | |||||||||
Australian Dollar | 3 | % | 2 | % | 3 | % | 0.9433 | 0.9140 | 1.0245 | |||||||||
Brazilian Real | 1 | % | 1 | % | 1 | % | 0.4521 | 0.4483 | 0.4978 | |||||||||
Canadian Dollar | 1 | % | 1 | % | 1 | % | 0.9372 | 0.9508 | 0.9835 | |||||||||
Mexican Peso | 1 | % | 1 | % | 1 | % | 0.0771 | 0.0772 | 0.0748 | |||||||||
Singapore Dollar | 2 | % | 1 | % | 1 | % | 0.8022 | 0.7887 | 0.7904 | |||||||||
Sweden Krona | 1 | % | 1 | % | 1 | % | 0.1496 | 0.1493 | 0.1444 | |||||||||
Swiss Franc | 1 | % | 1 | % | 2 | % | 1.1276 | 1.0584 | 1.0541 | |||||||||
All Other Currencies (2) | 10 | % | 12 | % | 10 | % | 0.1360 | 0.1365 | 0.1399 | |||||||||
Total | 100 | % | 100 | % | 100 | % | ||||||||||||
(1) | Calculated using weighted average exchange rates for the fiscal year. |
(2) | The “% of Reported Revenue” for “All Other Currencies” is calculated based on the weighted average twelve month exchange rates for all other currencies. The “Exchange Rates to U.S. Dollar” for ‘All Other Currencies’ represents the weighted average June 30 exchange rates for the currencies. Weighting is based on the twelve month fiscal year revenue for each country or region whose currency is included in the “All Other Currencies” category. Revenues from each currency included in “All Other Currencies” were less than 1% of our total revenues for the period. |
A 10% increase or decrease in the value of both the Euro and British Pound Sterling in relation to the U.S. dollar in fiscal year 2014 would have affected total revenues by an aggregate of approximately $50.6 million, or 3.7%. The sensitivity analysis assumes a weighted average 10% change in the exchange rate during the year with all other variables being held constant. This sensitivity analysis does not consider the effect of exchange rate changes on either cost of sales, operating expenses, or income taxes, and accordingly, is not an indicator of the effect of potential exchange rate changes on our net income attributable to MICROS Systems, Inc. common shareholders.
We also are subject to interest rate fluctuations in foreign countries to the extent that we elect to borrow in the local foreign currency. In the past, this has not been an issue of concern as we have the capacity to elect to borrow in other jurisdictions with more favorable interest rates. We will continue to evaluate the need to invest in financial instruments designed to protect against interest rate fluctuations.
Finally, we are subject to, among others, those environmental and geopolitical risks, and economic, pricing, financial, and other risks described in Item 1A, “Risk Factors.”
PATENTS AND TRADEMARKS
We hold six patents through our JTECH subsidiary. We also acquired an additional 18 patents as part of our acquisition of Torex Retail Holdings, Ltd. (“Torex”) in May 2012. In general, we believe that, historically, our competitive position has not been materially dependent upon patent protection. The technology used in the design and manufacture of most of our hardware products is largely licensed or purchased from third parties. With respect to our software products, we have historically relied on nondisclosure agreements and applicable U.S. and foreign copyright and trademark laws for protection. In the U.S. and in most other countries, we believe that applicable law has provided and will continue to provide us with sufficient protection.
“MICROS”, “Fidelio”, “Datavantage”, “CommercialWare”, “JTECH”, “OPERA”, "Simphony", "9700", "RES", “e7”, “Store21”, “Tradewind”, “Xstore”, "Retail J", "Lucas",“XBR”, “ServAlert”, “GuestAlert”, “HostAlert”, “CommPass”, “CWSerenade”, “CWCollaborate”, “CWStore”, “CWLocate”, “CWAnalytics”, “CWData”, “CWIntegrate”, “MICROS Commerce Platform”, and “Torex”, are registered or unregistered trademarks or servicemarks of the Company or its subsidiaries. We also own numerous other trademarks and servicemarks. This Annual Report on Form 10-K also contains trademarks, trade names and servicemarks of other companies that are the property of their respective owners.
There are risks that third party entities, including competitors, could attempt to misappropriate our intellectual property. Given these potential risks, we have implemented procedures to monitor misappropriation of our intellectual property. If a misappropriation is detected, we pursue appropriate legal action when we determine that such action is appropriate.
20
EFFECT OF POLITICAL UNCERTAINTY, INTERNATIONAL EVENTS, AND ECONOMIC CONDITIONS ON OUR BUSINESS; FLUCTUATIONS IN QUARTERLY OPERATING RESULTS; CLIENTS
Our operating results have varied in the past and may vary in the future depending upon various factors, including the timing of new product introductions, changes in our pricing and promotion policies and those of our competitors, market acceptance of new products and enhanced versions of existing products, and the capital expenditure budgets of our clients. Political uncertainty and international events that often are unpredictable, e.g., terrorist attacks, natural disasters, and the volatile and unpredictable political climate in the Middle East, are expected to continue to adversely impact travel and tourism and therefore our operating results. In addition, over the last several fiscal years, world macroeconomic conditions and tightened credit markets have resulted in reduced demand from clients generally. These conditions have made it harder for, and, in some cases, may have prevented, some clients from obtaining financing for intended purchases. We believe that these economic conditions may have resulted in reduced demand for our products and services.
Historically, our business has been affected by seasonal trends. For example, the European summer holidays tend to lower our sales volume in the European countries during our first fiscal quarter, as compared to other quarters. We also experience a stronger than average sales volume for the retail products and services in our second fiscal quarter due to the holiday season. Additionally, with the relative slowdown in corporate buying at the beginning of each calendar year, which is our third fiscal quarter, seasonal weakness for the third quarter ending March 31 has been experienced. Therefore, we believe that sequential quarter-to-quarter historic comparisons of our results are not necessarily meaningful or indicative of future performance.
No single customer accounts for 10% or more of our consolidated revenues. During fiscal years 2014, 2013 and 2012, we have been a party, directly and indirectly, to certain contracts with the U.S. Federal Government, which contracts contained standard termination for convenience clauses. Our U.S. Government related revenue for fiscal years 2014, 2013 and 2012 constituted less than 1% of our total consolidated revenue for each of those fiscal years. We do not anticipate any material adverse financial impact if the U.S. Government elected to exercise its rights under a termination for convenience clause.
ENVIRONMENTAL MATTERS
We believe that we are in compliance in all material respects with applicable environmental laws and do not anticipate that environmental compliance will have a material effect on our future capital expenditures, earnings or competitive position with respect to any of our operations.
BACKLOG
We generally have an order backlog equal to approximately three months revenue. Substantially all orders in the backlog are cancellable at any time before shipment of hardware and software or rendering of services.
As of June 30, 2014, 2013 and 2012, our total backlog, including both the order backlog and maintenance backlog, was approximately $636.1 million, $561.0 million and $469.7 million, respectively. Historically, only an immaterial portion of the backlog existing as of the first day of the fiscal year does not result in recognizable revenue in that fiscal year.
AVAILABLE INFORMATION
We file with the U.S. Securities and Exchange Commission (“SEC”) annual reports on Form 10-K, quarterly reports on Form 10-Q, current reports on Form 8-K, proxy statements, and other documents as required by applicable law and regulations. The public may read and copy any materials that we file with the SEC at the SEC’s Public Reference Room at 100 F Street, N. E., Washington, DC 20549. The public may obtain information on the operation of the Public Reference Room by calling the SEC at 1-800-SEC-0330 (1-800-732-0330). The SEC maintains an Internet site (http://www.sec.gov) that contains reports, proxy and information statements, and other information regarding issuers that file electronically with the SEC. We also maintain an Internet site (http://www.micros.com). We make available free of charge on or through our Internet website our annual reports on Form 10-K, quarterly reports on Form 10-Q, current reports on Form 8-K, proxy statements and any amendments to these reports, as soon as reasonably practicable after electronically filing such documents with or furnishing it to the SEC. The information on our website is not incorporated into and is not a part of this report.
21
ITEM 1A. | RISK FACTORS |
There are a number of risks to which we are subject. These risks include the following:
1. | ENVIRONMENTAL AND GEOPOLITICAL RISKS. |
•While we do not sell our products and services directly to consumers, changes in consumer habits in response to environmental or geopolitical risks affect demand for our products and services by the hospitality and tourism industries.
•Our business is very sensitive to the threat of terrorism and political uncertainty. As the hospitality and tourism industries we serve are highly sensitive to consumer sentiments caused by world events, we are very vulnerable to downturns in customer buying habits associated with the threat of terrorist attacks and uncertain political climates such as those existing in the Middle East and parts of Asia.
•Our business is very sensitive to environmental, natural, and health disasters. Actual, anticipated or perceived environmental events, natural disasters, and epidemics, including for example, hurricanes, tsunamis, and disease, will deter and delay purchases of our products by clients, as concerns about potential or anticipated instances of environmental events, natural disasters, or health disasters tend to suppress travel and tourism. Environmental disasters also adversely affect our operations in the distressed areas.
•Higher oil and gas prices worldwide could have a material adverse impact on the travel and tourism industries, and indirectly, on our business. Material increases in oil and gas prices tend to reduce discretionary spending by consumers, such as on travel and dining, as well as on retail spending generally. Reductions in discretionary spending by consumers adversely affect our clients and, indirectly, our business. Moreover, increases in oil and gas prices also directly adversely affect our customer base in other ways. For example, oil and gas price increases can result in higher ingredient and food costs for our food and beverage clients.
•We maintain offices and rely on distributors in parts of the world that are subject to economic instability, political unrest, and terrorism, such as the Middle East. The performance of our offices (or distributors) in these areas likely will be adversely affected if countries in these regions remain for a prolonged period or become subject to economic decline, political strife or episodes of terrorism. For example, because of political and social unrest in Greece and Egypt, among others, our local dealers’ respective businesses have been materially adversely impacted.
2. | ECONOMIC, PRICING AND FINANCIAL RISKS. |
•We are subject to the variability of world economies. Since a majority of our business is conducted in foreign countries, a downturn in the economies of foreign countries would adversely affect our financial results. While, under certain circumstances, reliance on foreign operations can have a moderating impact (as one region’s improving conditions may offset another region’s declining conditions), our foreign businesses nonetheless add a degree of uncertainty to our planning and forecasting processes.
•We are subject to the global economic crisis. In the summer of 2008, global economic conditions materially worsened. While there has been subsequent improvement, economic conditions in certain parts of the world continue to languish. We believe these economic conditions resulted in reduced demand from clients and the inability of some clients to secure financing for intended purchases. The current economic stagnation in certain economies may continue to result in the reduced demand for our products and services. Slowdown of worldwide economic growth has resulted in reduced consumer spending, which has adversely impacted our clients. These economic conditions may also increase our uncollectable receivables.
•Our financial results are dependent upon the timing and size of customer orders and the shipment of products for large orders. Large software orders from clients may account for a meaningful portion of earnings in any period. We expect the clients with whom we do the largest amount of business to vary from year to year as a result of the timing of the rollout of each client’s systems. Further, if a customer delays or accelerates its delivery requirements, or if a product’s completion is delayed or accelerated, our results for a particular period could be materially impacted.
•Our ability to establish pricing is subject to rapidly changing market and competitive conditions. To be competitive and to avoid losing business on the basis of price, we must evaluate our pricing routinely. There are instances where we may have to reduce our prices to obtain business. Market forces have and will continue to increase pressure on our gross margins and overall profitability. This is especially true with hardware, where prices continue to decline.
•Our gross margins will vary from quarter to quarter based upon product mix. Product mix affects our operating results. For example, as we enjoy a higher gross margin on software than on hardware, our overall gross margin will vary
22
depending upon the percentage of software licensed and the percentage of hardware sold each quarter. The difficulty in predicting product mix on a quarter-to-quarter basis results in uncertainty in projecting gross margin, and we have experienced a degree of variability in our gross margins on a quarter-to-quarter basis as a result of changes in product mix.
•Our non-major account business is difficult to predict. Our major account clients (generally those clients who operate 50 or more locations) have longer sales cycles and deployments; our non-major account sales have shorter sales cycles and shorter deployments. As a significant portion of our business involves non-major accounts, there is inherent difficulty in predicting buying patterns. Accordingly, it is much harder to appropriately staff and prepare for fluctuations in buying demand for non-major-account clients. This can result in inefficiencies that adversely affect our operating results.
•Some of the advanced systems we sell are very complex and require a high level of technical sophistication, which may result in increased costs that adversely affect our operating results. The costs of the implementation and operation of an effective service structure capable of addressing increasingly complex software systems in wildly diverse locations is high and may require us to engage contractors, for whom we generally incur higher costs than we incur with respect to our own associates. We also face additional costs due to the complexity of open systems, which generally incorporate third party software products that may entail difficult and costly support and service, and due to the difficulty in implementing, operating, maintaining and supporting centrally hosted systems, such as central reservation systems, and centrally-hosted property management systems and reporting systems.
•We are subject to certain material cost increases that may be out of our control. While we attempt to control third party costs, we have little or no control over certain significant expenses, such as health care costs (which are generally experience-based) and costs of compliance with new legislation. Significant increases in any of these expenses could adversely affect our operating results.
•We are subject to fluctuations in foreign currencies and exchange rates. Because we conduct significant portions of our business in foreign currencies, we experience exchange rate fluctuations that can have a significant impact on our reported results. For example, as much of our European business is transacted in Euros, our revenue on a consolidated basis will decline if the Euro weakens relative to the U.S. Dollar and increase if the Euro strengthens relative to the U.S. Dollar.
•We have a large exposure in Europe. MICROS has historically had a large presence in Europe, with offices in most major European cities. With the acquisition of Torex in June 2012, our presence in Europe increased. Given the uncertain economy of several member nations in the European Union, and with mounting debt in certain European countries such as Greece, Spain, Italy and Portugal, we confront increased risk of customer defaults and decreased demand for our products.
•As a publicly traded company, our stock price is subject to certain market trends that are out of our control and that may not reflect our actual operating performance. We can experience short-term increases and declines in our stock price due to factors other than those specific to our business, such as economic news or other events generally affecting the trading markets.
•We have encountered risks associated with maintaining large cash balances. While we have attempted to invest our cash balances in investments generally considered to be relatively safe, we nevertheless confront credit and liquidity risks. For example, we previously invested some of our cash in auction rate securities, which proved to be illiquid when the financial resale markets contracted in February 2008. While we eventually were able to liquidate our entire remaining portfolio of auction rate securities in fiscal year 2013 without any material adverse effect on our business, we lost money on the disposition and our experience with these securities underscores the potential risks related to our investments. In addition, bank failures could result in reduced liquidity or the actual loss of money held in deposit accounts in excess of federally insured amounts, if any.
•Our internal control over financial reporting cannot provide absolute assurance that all fraud will be detected. While we believe our internal control over financial reporting is effective, a controls system cannot provide absolute assurance that the objectives of the controls system are met, and no evaluation of controls can provide absolute assurance that control issues and instances of fraud, if any, within our company have been detected.
•We may have additional tax liabilities. We are subject to income and sales taxes in the U.S. and many foreign jurisdictions. Significant judgment is required in determining our worldwide provision for income and sales taxes. In the ordinary course of our business, there are many transactions and calculations where the ultimate tax determination is uncertain. We are routinely under audit by multiple tax authorities throughout the world. Although we believe our tax estimates are reasonable, the final determination of tax audits and any related litigation could be materially different from our historical tax provisions and accruals. The results of an audit or litigation could have a material effect on our financial statements in the period or periods for which that determination is made. Further, any changes to the U.S. or any foreign
23
jurisdictions’ tax laws or tax rates could significantly impact how U.S. multinational corporations are taxed. Although we cannot predict whether or in what form any legislation changes may pass, if enacted it could have a material adverse impact on our tax expense, deferred tax assets and cash flows.
3. | RISKS RELATING TO THE OFFER AND THE MERGER. On June 22, 2014, MICROS entered into the Merger Agreement with Parent, Purchaser and, solely for certain limited purposes, Oracle. For additional information regarding the Merger Agreement, the Offer and the Merger, see Part I, Item 1, “Business - Introduction - Recent Developments.” |
•The Offer and the Merger are subject to a number of conditions which, if not fulfilled, may result in termination of the Merger Agreement. The Merger Agreement contains certain conditions to Purchaser's obligation to accept for payment shares of common stock of the Company validly tendered and not withdrawn in the Offer including, without limitation, (i) at least a majority of the shares of the common stock (calculated on a fully diluted basis in accordance with the Merger Agreement) having been validly tendered into and not withdrawn from the Offer, (ii) receipt of certain regulatory approvals, including expiration of the waiting period under the HSR Act and certain foreign antitrust laws, (iii) the accuracy of the representations and warranties and compliance with the covenants contained in the Merger Agreement and (iv) other customary conditions. In addition, consummation of the Merger is also subject to certain conditions, including, without limitation, approval of the Merger by holders of the outstanding Company shares remaining after the completion of the Offer to the extent that the Parent and Purchaser do not complete the Merger through a “short-form merger” pursuant to applicable Maryland law. On July 16, 2014, the waiting period under the HSR Act applicable to the Offer expired. Many of the conditions to consummation of the Offer and the Merger are not within our control or the control of Parent, Purchaser or Oracle and none of us can predict when or if these conditions will be satisfied. If any of these conditions are not satisfied or waived, it is possible that the Merger will not be consummated in the expected time frame or that the Merger Agreement may be terminated.
•Five class action complaints relating to the Merger Agreement have been filed and any adverse ruling may prevent the Merger from being completed. Five class action complaints relating to the Merger Agreement have been filed, see Part I, Item 3, “Legal Proceedings.” Additional lawsuits may be filed relating to the Merger. One of the conditions to the closing of the Merger is that no temporary restraining order, preliminary or permanent injunction or other order preventing the Offer or the consummation of the Merger shall have been issued by any court or other governmental authority of competent jurisdiction and remain in effect, and there shall not be any applicable law enacted or deemed applicable to the Merger that makes the Offer or the consummation of the Merger illegal. Consequently, if a settlement or other resolution is not reached in the current and potential lawsuits referenced here and the plaintiffs secure injunctive or other relief prohibiting, delaying, or otherwise adversely affecting the defendants’ ability to complete the Merger, then such injunctive or other relief may prevent the Merger from becoming effective within the expected time frame or at all.
•Any delay in completing the Merger could delay the benefits expected to be achieved thereunder. The need to satisfy conditions and obtain consents, clearances, and approvals for the Merger, as well as any lawsuits related to the Merger, and other events, could delay the consummation of the Merger for a significant period of time or prevent it from occurring. Any delay in consummation of the Merger could cause the combined company to be delayed in realizing some of the synergies and other benefits that the parties anticipate if the Merger is successfully completed within its expected time frame.
•Failure to complete the Merger could negatively impact our stock price and our future business and financial results. If the Merger is not completed, our ongoing business may be adversely affected, and we will be subject to several risks, including the following:
• | we may be required to pay a termination fee of approximately $157.8 million under certain circumstances provided in the Merger Agreement; |
• | unless and until it is terminated, we will be prohibited by the Merger Agreement from seeking certain strategic alternatives, such as transactions with third parties other than Oracle, and could therefore miss attractive alternatives to the Merger; |
• | prior to any termination of the Merger Agreement, certain aspects of our operations will be restricted by the terms of the Merger Agreement, which may cause us to forgo otherwise attractive business opportunities; |
• | we may be required to pay certain costs relating to the Merger, whether or not it is consummated, such as legal, accounting, financial adviser and printing fees, which costs could be substantial; and |
• | our management will have focused its attention on negotiating and preparing for the Merger instead of on pursuing other opportunities that could have been beneficial to us. |
24
If the Merger is not completed, we cannot be assured that these risks will not materialize and will not materially and adversely affect our business, financial results, and stock price. In this regard, in the event of a termination of the Merger Agreement by Oracle, our business, financial results, and stock price will likely be materially and adversely affected, even if it is ultimately determined by a judicial decision that the termination violated the Merger Agreement.
•The Merger Agreement contains customary restrictions on our ability to seek other strategic alternatives. The Merger Agreement contains “no shop” provisions that restrict our ability to initiate, solicit, or knowingly encourage or facilitate competing third-party proposals for any business combination transaction involving a merger of us with another entity or the acquisition of a significant portion of our stock or assets, although we may consider competing, unsolicited proposals and enter into discussions or negotiations regarding such proposals if our Board of Directors determines that any such acquisition proposal constitutes, or is reasonably likely to lead to, a superior proposal and that the failure to take such action is reasonably likely to be inconsistent with the fiduciary duties of the Board of Directors to us and our stockholders under applicable law. In addition, Oracle generally has an opportunity to offer to modify the terms of the Merger in response to any competing acquisition proposal. If we were to terminate the Merger Agreement to accept a superior proposal, we would be required to pay a termination fee of approximately $157.8 million to Oracle.
These provisions, although customary for these types of transactions, could discourage a potential third-party acquirer that might have an interest in acquiring all or a significant portion of our company from proposing any such acquisition, even if the potential third-party acquirer were prepared to pay consideration with a higher cash or market value than the market value proposed to be received or realized in the Merger or might result in a potential third-party acquirer proposing to pay a lower consideration to our stockholders than it might otherwise have proposed to pay because of the added expense of the $157.8 million termination fee that would become payable in connection with the termination of the Merger Agreement by us.
If the Merger Agreement is terminated and we decide to seek another business combination, we may not be able to negotiate a transaction with another party on terms comparable to, or better than, the terms of the Merger.
4. | TECHNOLOGY RISKS. |
•Our clients’ requirements are increasingly sophisticated. To continue to offer competitive products and meet our clients’ requirements, we must continually develop and update our products. Unexpected costs and delays in development and implementation, and the need to address our commitments to various customers, could adversely affect our financial results.
•The development of software is an inherently difficult process that may result in software bugs that adversely impact a client’s business. While we have testing and beta programs and protocols that we implement before the general release of any product, such processes cannot guarantee that the released software will not have any bugs. Our business could be adversely affected if these problems are significant and cannot readily be resolved.
•The manufacturing of our hardware platforms is performed primarily by a Singapore-based third party contract manufacturer, Venture Group. While we believe we have a good relationship with Venture Group, and have not experienced any material manufacturing problems with Venture Group, we cannot be certain that the relationship will remain in force, nor can we be certain that Venture Group will not experience labor or manufacturing challenges in the future, which may include claims of patent infringement with respect to key product components. Additionally, Venture Group procures many of its components from other third parties that could experience manufacturing or labor issues. We believe that, if our relationship with Venture Group were to terminate, we could replace Venture Group with other contract manufacturers or resell appropriate third-party hardware products in lieu of those manufactured for us by Venture Group. However, any disruption or interruption of the supply of hardware products from Venture Group could materially adversely affect our business in the short run.
•Large customized deployments may be difficult and may result in cost overruns that are not recoverable. We have some contracts under which we are required to provide systems and services at a fixed price. We may be contractually required to absorb costs that may not be recoverable if we underestimate the amount of work required or if we encounter unanticipated technical issues or delays. This risk can be pronounced given the complexity of some of the systems we install and the size and scope of some of the deployments. Unanticipated costs that are not recoverable could adversely affect our operations.
•Our investment in certain technologies may prove to be unsuccessful and may delay our focus on more promising technologies. We make significant investments in research and development. Our investments entail a risk that we will pursue technologies that we ultimately determine are not marketable or do not achieve the desired solution. In such
25
an event, we may be required to write off our investment, which could have an adverse impact on our operating income. Moreover, if we are delayed in deploying viable technologies, our business also could be adversely affected.
•Actual or perceived security vulnerabilities in our software products may result in reduced sales or liabilities. Our software may be used in connection with processing sensitive data (e.g., credit card numbers or personally identifiable information), and is sometimes used to store such data. It may be possible for the data to be compromised if our customer does not maintain appropriate security procedures. In those instances, the customer may attempt to seek damages from us. Further, while we believe that all of our current software complies with applicable industry security requirements and that we take appropriate security measures to reduce the possibility of breach through our support and other systems, we cannot assure that our customers’ systems will not be breached, or that all unauthorized access can be prevented. If a customer, or other person, seeks redress from us as a result of a security breach, our business could be adversely affected.
•Hosting of software applications presents increased security risks. As we expand our software hosting capabilities and offer more of our software applications to our customers on a hosted or Software-as-a-Service (“SaaS”) basis, our responsibility for data, system security and system performance increases significantly. While we believe that our current software applications comply with applicable laws and industry security requirements, and that we use appropriate security measures to reduce the possibility of unauthorized access or misuse of data in the hosting center, we cannot provide absolute assurance that our hosted systems will not be breached, or that all unauthorized access can be prevented. If a security breach were to occur, a customer, regulatory agency, or other person could seek redress from us, which could adversely affect our business.
•Hosting of software applications presents other liability risks. Additionally, as we expand our software hosting and SaaS capabilities and offer more of our software applications to our customers on a hosted or SaaS basis, our potential liability increases significantly. Specifically, an outage in our data centers can affect literally thousands of customers, resulting in losses to both MICROS and the impacted customers. While we believe that our data centers have been designed and engineered to reduce the likelihood of outages, we cannot provide assurance that our hosted systems will not suffer from unanticipated outages, performance degradation or disruptions. If an unanticipated outage were to occur or if the performance of our data centers is deficient, one or more customers could suffer economic damages and seek redress from us, which could adversely affect our business.
•Rapidly evolving mobile technologies present both opportunities and risks. There has been a marked advancement in mobile technologies over the several years. While this evolution offers us the opportunity to develop and sell new mobile products for the benefit of our customers, it also creates certain risks. For example, some of the new mobile technology is untested and may cause unanticipated business interruption or unforeseen security risks. Additionally, there are many new entrants into the markets we serve, which may create confusion and additional competitive pressures.
•Newly marketed and packaged payment processing offerings present both opportunities and risks. There has been a marked proliferation of newly packaged payment processing offerings, some of which purportedly include point of sale processing capabilities. While we have integrated many of our products with some of these new payment processing offerings, this trend also creates some confusion and uncertainty, especially with smaller customers who are in search of inexpensive solutions and require only basic transaction capabilities.
5. | PERSONNEL RISKS. |
•We could be adversely affected by vendor labor difficulties. Some of our vendors may have associates who are protected by labor laws or who may be members of unions. We could experience unanticipated manufacturing or supply shortages if any of our key vendors are subject to labor difficulties or work slow-downs or stoppages.
•We could be adversely affected by other labor difficulties. In those countries where certain of our associates are members of unions, we could experience unanticipated interruptions or delays in our operations if we become subject to labor difficulties or work slow-downs or stoppages.
•Our inability to hire qualified personnel, including particularly research and development personnel, could adversely affect our ability to satisfy customer requirements on an efficient basis. Finding qualified technical personnel in all the localities where our research and development facilities are located is an ongoing challenge. If we cannot find appropriate personnel, we risk delays in satisfying customer demands, or may even lose the opportunity to provide software to the customer. If we are required to retain a consultant because we do not have available personnel, development costs would increase. In general, our inability to recruit and retain appropriate personnel would adversely affect our business, and would result in delayed or lost business, and increased costs.
26
6. | LEGAL RISKS. |
•Although we attempt to protect our proprietary technology, these protections do not preclude competitors from developing products with features similar to our products. We cannot guarantee that we can effectively preserve the proprietary nature and competitive advantages of our products, despite our efforts to do so through a combination of trade secrets, copyright, trademark law, non-disclosure agreements, and technical measures. Others could attempt to copy what we have developed, either through legal or illegal means. Moreover, others have been able to develop competitive products and services that do not violate our proprietary rights.
•We are subject to litigation, which may be costly. As a company that does business with many customers, associates, and vendors throughout the world, we are subject to litigation, including claims made by or against us relating to intellectual property rights and intellectual property licenses. While we generally take steps to reduce the likelihood that disputes will result in litigation and damages, litigation is very commonplace and could have an adverse effect on our business. As part of the litigation risk, we could be subject to potentially material adverse judgments.
•We are subject to claims by others that we are infringing their intellectual property rights. From time to time we receive letters from entities that assert that we are infringing a patent. In those instances, we assess the validity of the claims and the purported patent, and determine whether a license is appropriate or necessary. If we conclude that a license is not necessary, there is a risk that we will be sued; we may also face indirect liability as a result of infringement claims brought against our customers. While we do not believe that our products and services infringe any patents or other intellectual property rights, we have from time to time and may continue to become involved in infringement litigation. When that occurs, we may incur significant legal expenses and, if we are found liable, we could be obligated to pay significant damages or enter into unfavorable license agreements.
•Credit card issuers have promulgated credit card security guidelines as part of their ongoing effort to battle identity theft and credit card fraud, which may substantially increase our expenses; breaches of our customers’ credit card security may adversely affect us. We continue to work with credit card issuers and associations to assure that our products and services comply with the credit card associations’ security regulations and best practices applicable to our products and services. We cannot assure, however, that our products and services are invulnerable to unauthorized access or hacking. Additionally, we cannot assure that our customers will implement all of the credit card security features that we introduce, or all of the protections and procedures required by the credit card issuers. Our customers may not establish and maintain appropriate levels of firewall protection and other security measures. If there is unauthorized access to credit card data that results in financial loss, there is a potential that parties could seek damages from us. Additionally, changes in the security guidelines and laws relating to consumer privacy could require significant, unanticipated, and costly development efforts.
•Privacy legislation may increase our development expenses and make us vulnerable to claims. More and more jurisdictions (both domestic and international) are enacting legislation that is designed to protect the privacy of certain Personally Identifiable Information (“PII”), such as names, dates of birth, home addresses, social security numbers and employment information. We must continue to modify our products and systems to comply with such legislation, and to take additional steps to protect against the unauthorized disclosure of PII. If there is unauthorized access to or disclosure of PII, there is a potential that affected parties could seek damages from us.
ITEM 1B. | UNRESOLVED STAFF COMMENTS |
Not applicable.
ITEM 2. | PROPERTIES |
Our worldwide corporate headquarters, including our executive offices, are located in Columbia, Maryland and consist of 247,624 square feet. We also conduct sales, marketing, customer support, and product development activities at this location. During fiscal year 2014, we occupied this building pursuant to a lease. Effective July 1, 2014, we closed on the purchase of the building and the lease accordingly terminated. We sublease a portion of one of the five floors, consisting of 39,459 square feet, to Motorola, Inc. The sublease expires March 10, 2015.
27
In addition to over 100 smaller offices and facilities, we lease the following larger properties (defined, for purposes of this filing, as those locations in which we lease approximately 20,000 square feet or more), and regional office locations:
Location | Size (Square Feet) | Use | Expiration Date | Additional Comments | ||||
Bielefeld, Germany | 91,278 | Warehouse, distribution, manufacturing, sales | June 30, 2019 | |||||
Hanover, Maryland | 87,600 | Warehouse, distribution, light assembly, configuration, manufacturing, repair | July 31, 2015 | |||||
Solon,Ohio | 69,199 | Sales, marketing, support, product development | February 28, 2019 | Headquarters for MICROS’s US retail operation | ||||
Neuss, Germany | 45,809 | Sales, marketing, product development, and customer support | December 31, 2015 | Also serves as a regional headquarters for our Europe, Africa, and Middle East region | ||||
Bolton, England (three sites) | 40,518 | Product development, customer support, and administration | Ranges from May 31, 2015 to September 30, 2015 | Approximately half of this space is sublet to an unrelated third party and not used by MICROS | ||||
Amersfoort, Netherlands | 39,827 | Sales, marketing, support | June 30, 2023 (we have early termination rights in June 2018) | |||||
Berlin, Germany | 38,514 | Sales, marketing, support | October 31, 2017 (we have early termination rights in October, 2015) | |||||
Milton Keynes, England | 29,272 | Sales, marketing, customer support, product development and product support | October 26, 2021 | |||||
Slough, England (three sites) | 28,876 | Sales, marketing, support | Ending January 1, 2017, July 17, 2021, and December 24, 2021 | |||||
Westborough, Massachusetts | 27,234 | Sales, marketing, customer support, product development and product support | November 30, 2017 | MICROS eCommerce maintains this office for its XBR loss prevention products, as well as for its CommercialWare products and services | ||||
Chevy Chase, Maryland | 26,744 | Sales, web development services | November 15, 2017 | Headquarters for MICROS’s eCommerce operation | ||||
Naples, Florida | 24,718 | Software development | December 31, 2016 | Naples is the main site for the development of MICROS hotel products | ||||
Ann Arbor, Michigan | 24,269 | Sales, marketing, customer support, product development and product support | July 31, 2017 | |||||
28
Dunstable, England | 23,247 | Sales, marketing, customer support, product development and product support | April 13, 2015 | |||||
Galway, Ireland | 18,025 | Customer support, sales and marketing | May 31, 2022 (we have early termination rights in 2017) | Also serves as a regional headquarters for the Europe, Africa, and Middle East region | ||||
Singapore | 9,367 | Sales, marketing, support | September 30, 2016 | Regional headquarters for the Asia-Pacific region | ||||
Buenos Aires, Argentina | 5,397 | Sales, marketing, support | December 31, 2014 | Regional headquarters for the Latin America region. | ||||
To satisfy other sales, service and support, and product development needs, we and our subsidiaries lease space in other U.S. and overseas locations. In general, we believe that additional space will be available as needed.
ITEM 3. | LEGAL PROCEEDINGS |
On October 21, 2013, we entered into a final settlement with the plaintiff in Roth Cash Register v. MICROS Systems, Inc., et al., a case initially filed in 2000 in the Court of Common Pleas of Allegheny County, Pennsylvania based on the plaintiff's allegation that we and certain of our subsidiaries and employees entered into a plan to eliminate the plaintiff as an authorized dealer and improperly interfere with the plaintiff's relationships with its existing and future clients without compensation to the plaintiff. Following an adverse jury verdict, reduced on appeal, we paid approximately $2.5 million to the plaintiff on June 7, 2012 in payment of the portion of the verdict that was no longer in dispute plus applicable post-judgment interest. Upon the conclusion of post-appeal proceedings in the Court of Common Pleas with regard to the remaining amount of the verdict, the Court entered an order reducing the remaining judgment in favor of the plaintiff from $4.5 million to approximately $2.8 million. We appealed this judgment, which was affirmed by the Superior Court on October 4, 2013. During the three months ended September 30, 2013, we accrued a charge of approximately $2.8 million in selling, general and administrative expenses with respect to the judgment, and also accrued interest of $0.9 million, reflecting the 6% per annum interest payable on the judgment. Pursuant to the settlement agreement, we made a full and final payment of approximately $3.7 million to the plaintiff on October 21, 2013, and, on October 31, 2013, the case was closed.
On November 26, 2013, a complaint was filed against the Company in the United States District Court for the Middle District of Tennessee by Kristy Wilson, Darren Moore and Kisha Ulysse, three former employees of MICROS, individually and on behalf of a purported class of all persons who worked for MICROS as an Implementation Specialist or performed substantially similar job duties (each, an "Implementation Specialist") within the period beginning three years prior to the filing of the complaint through the date of judgment and who worked for more than 40 hours in one or more weeks without receiving overtime compensation allegedly required by the Fair Labor Standards Act ("FLSA"). In addition, the complaint was brought by plaintiff Ulysse individually and collectively on behalf of a purported class (the "Purported California Class") of all persons who were employed by MICROS in an Implementation Specialist position in California and/or performed work in any Implementation Specialist position in California, and who did not receive the overtime and premium wages allegedly required by the overtime pay and restitution laws of California at any time during the four years prior to the date of the filing of the complaint. The complaint alleges, among other things, that we willfully violated the FLSA by willfully classifying the plaintiffs as exempt and thereby failing to pay them the legally required amount of overtime compensation for all hours worked in excess of 40 hours. With respect to the Purported California Class, the complaint alleges, among other things, violations of the California Labor Code and California Unfair Competition law due to our failure to pay all wages required by the California Labor Code, the failure to timely provide accurate itemized wage statements, and the failure to provide required meal and rest periods. The complaint seeks, among other things, damages equal to unpaid overtime wages, an equal amount to the overtime wages as liquidated damages, interest, attorneys' fees and other costs and, with respect to the Purported California Class, in addition to unpaid overtime wages, the complaint seeks unpaid meal and rest premiums, statutory penalties, attorneys' fees and other costs provided under California law, interest, injunctive relief, and other equitable relief. We filed an answer to the complaint on January 17, 2014, denying the allegations of the complaint, denying that the putative classes are appropriate, and asserting a number of affirmative defenses, including, among others, that the claims, in whole or in part, are barred because the FLSA overtime obligations are inapplicable to the plaintiffs under the FLSA or similar state law. On May 2, 2014, the parties stipulated to the dismissal without prejudice of the claims for injunctive relief under California law. On May 27, 2014, the District Court entered a scheduling order providing for limited discovery, and a court-sponsored early mediation in September 2014. We intend to vigorously contest this action.
29
Five class action complaints related to the Merger Agreement have been filed in the Circuit Court for Howard County, Maryland by purported stockholders of MICROS. The actions are docketed as Boudreaux v. Micros Systems, Inc., et al., (“Boudreaux”) (filed June 26, 2014, amended July 9, 2014); Stein v. Micros Systems, Inc., et al. (“Stein”) (filed June 27, 2014, amended July 9, 2014); Rosenfeld IRA v. Micros Systems, Inc. et al. (“Rosenfeld”) (filed July 2, 2014, amended July 9, 2014); Newspaper and Magazine Employees Union and Phila. Publishers’ Pension Fund, v. Micros Systems, Inc., et al. (“Publishers”) (filed July 10, 2014); and Scott v. Micros Systems, Inc., et al. (“Scott”) (filed July 10, 2014). The Boudreaux, Stein and Scott actions are brought against MICROS, Oracle, Parent, Purchaser, and MICROS’s Board of Directors (the “Individual Defendants”), and purport to be brought individually and on behalf of all public stockholders of MICROS. The Boudreaux, Stein, and Scott actions allege that the Individual Defendants breached their fiduciary duties to MICROS’s stockholders by, among other things, approving a merger that they claim provides for inadequate consideration for MICROS’s stockholders and that the Merger Agreement includes allegedly preclusive deal protection provisions; and that Oracle, Parent and Purchaser aided and abetted such alleged breach of fiduciary duties. The Boudreaux, Stein, and Scott actions also assert that the Individual Defendants breached their fiduciary duties by allegedly omitting certain material information concerning the sales process, financial valuation, and financial projections from the Schedule 14D-9 Recommendation Statement filed on July 3, 2014. Additionally, the Boudreaux, Stein, and Scott actions each seek a declaratory judgment against all defendants. Based on these allegations, the Boudreaux, Stein, and Scott actions seek, among other relief, an order declaring the action to be a class action, that the Individual Defendants have breached their fiduciary duties owed to the stockholders, and that Oracle, Parent and Purchaser aided and abetted such alleged breaches. Finally, the Boudreaux, Stein, and Scott actions also seek to enjoin the acquisition from being consummated, awarding plaintiffs the costs of the actions including a reasonable allowance for the expenses of plaintiff’s attorneys and experts, and granting further equitable relief as the court deems just and proper. Although the claims asserted and relief requested in Rosenfeld are identical to the claims asserted and relief requested in Boudreaux, Stein, and Scott, the Rosenfeld action is brought only against MICROS and the Individual Defendants. The Publishers action is also brought against MICROS, Oracle, Parent, Purchaser, and the Individual Defendants, but also names MICROS’s Chief Financial Officer as a Defendant. Similar to the other complaints filed, the Publishers action alleges that the Individual Defendants, including MICROS’s Chief Financial Officer, breached their fiduciary duties to MICROS’s stockholders by, among other things, approving a merger that the plaintiff claims provides for inadequate consideration for MICROS’s stockholders and that the Merger Agreement includes allegedly preclusive deal protection provisions; and that Oracle, Parent and Purchaser aided and abetted such alleged breach of fiduciary duties. The Publishers action seeks, among other relief, an order declaring the action to be a class action, to enjoin the acquisition from being consummated, damages, awarding plaintiff the costs of the action including a reasonable allowance for the expenses of plaintiff’s attorneys and experts, and granting further equitable relief as the court deems just and proper.
On July 11, 2014, plaintiffs in the Boudreaux, Stein, Rosenfeld, and Scott cases filed motions to expedite discovery and shorten the time to respond to the motions. On July 16, 2014, all five class action complaints described above (i.e. the Boudreaux, Stein, Rosenfeld, Scott, and Publishers cases) were consolidated by order of the Circuit Court into a single action under the caption Scott v. MICROS Systems, Inc. et al. Also, on July 16, 2014, the plaintiff in the Boudreaux case filed a motion for a temporary restraining order (“TRO”) to prevent proceeding with the Offer and a motion to shorten the time to respond to the TRO. On July 21, 2014, the defendants in the actions filed their oppositions to the motions to expedite and the motion for a TRO. On July 22, 2014, the Circuit Court held a hearing on the four plaintiffs’ motions for expedited discovery and the one plaintiff’s motion for a TRO. The Circuit Court denied the plaintiffs’ motions for expedited discovery and continued the motion for TRO until a hearing scheduled for July 31, 2014, to address both the TRO and a preliminary injunction. The plaintiffs did not move for a preliminary injunction and, on July 25, 2014, withdrew their request for a TRO and requested that the scheduled July 31, 2014 hearing be canceled. On July 30, 2014, the plaintiffs and the defendants in the consolidated action Scott v. MICROS Systems, Inc., et al., Consolidated Case No. 13C14099672 (the "Consolidated Action") filed a joint motion for an order to stay all proceedings in the Consolidated Action until the closing of the Offer. On August 1, 2014, the Circuit Court granted the motion to stay. Following the closing of the Offer, the Plaintiffs in the Consolidated Action will have 30 days to file a consolidated amended complaint or notify the Circuit Court that they are no longer pursuing their claims. During the pendency of the stay, defendants are not required to respond to any of the complaints or discovery. The stay applies to third party discovery. We intend to vigorously contest these actions.
Subject to the foregoing, we are and have been involved in legal proceedings arising in the normal course of business, and we are of the opinion, based upon presently available information and the advice of counsel concerning pertinent legal matters, that any resulting liability should not have a material adverse effect on our results of operations, financial position, or cash flows. However, litigation is subject to many uncertainties, and the outcome of litigation is not predictable with assurance. An adverse outcome in current or future litigation could have a material adverse effect on our business, financial condition, results of operations, and liquidity.
30
ITEM 4. | MINE SAFETY DISCLOSURES |
Not applicable.
PART II
ITEM 5. | MARKET FOR THE REGISTRANT’S COMMON EQUITY, RELATED STOCKHOLDER MATTERS, AND ISSUER PURCHASES OF EQUITY SECURITIES |
STOCK PERFORMANCE GRAPH
The following line graph compares the cumulative total shareholder return on the Company’s common stock during the past five fiscal years with the cumulative total yearly return of the S&P 500 Index and with the S&P Application Software composite index. The graph assumes $100 invested on June 30, 2009 in MICROS Systems, Inc. common stock, and an identical amount invested in the S&P 500 Index and the S&P 500 Application Software composite index, and assumes the reinvestment of dividends.
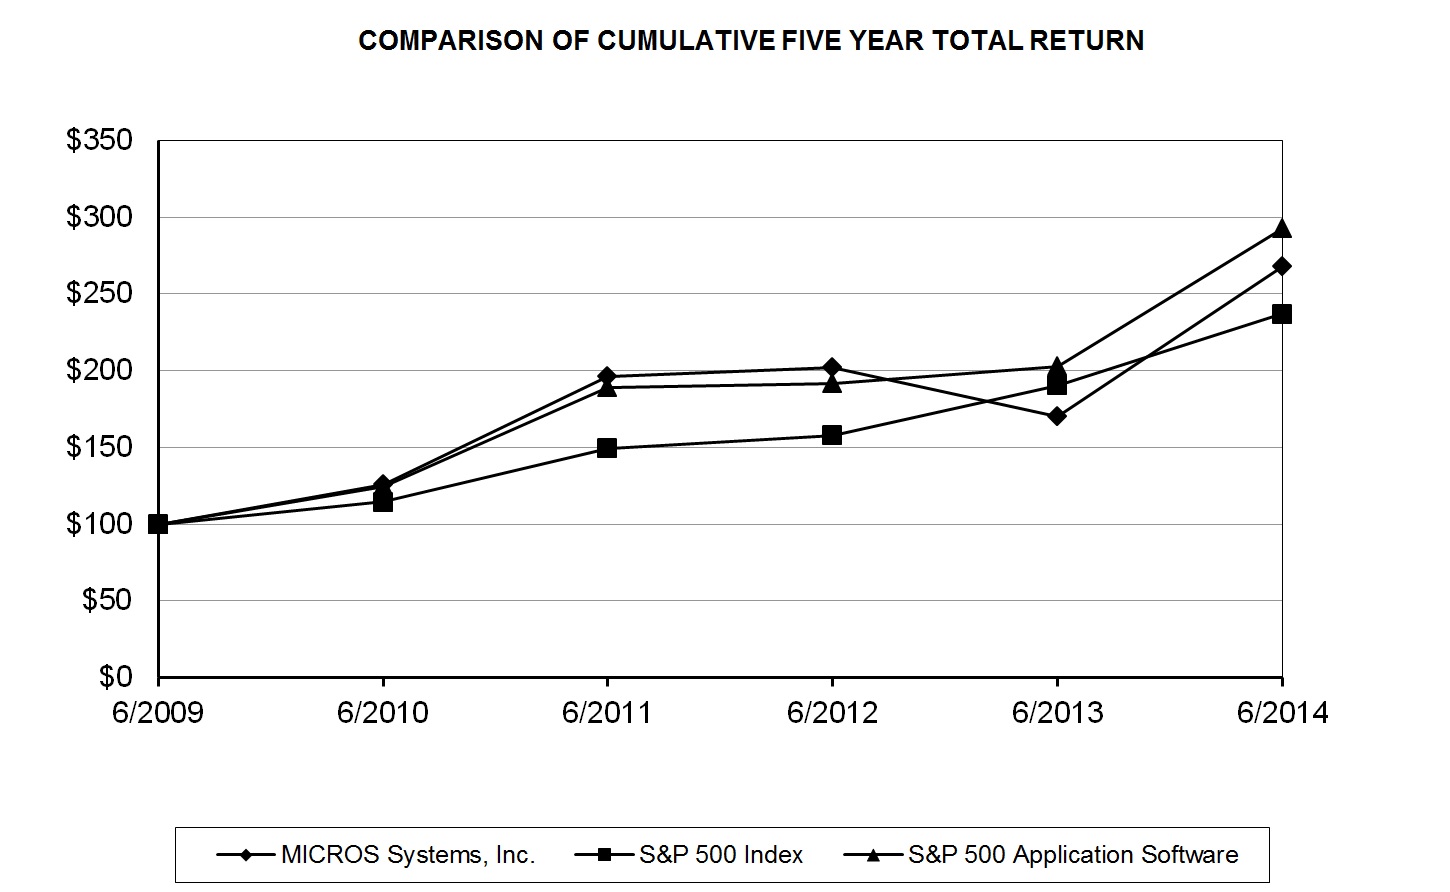
Company/Index | June 2009 | June 2010 | June 2011 | June 2012 | June 2013 | June 2014 | ||||||||||||||||||
MICROS Systems, Inc. | $ | 100.00 | $ | 125.87 | $ | 196.33 | $ | 202.21 | $ | 170.42 | $ | 268.17 | ||||||||||||
S&P 500 Index | $ | 100.00 | $ | 114.43 | $ | 149.55 | $ | 157.70 | $ | 190.18 | $ | 236.98 | ||||||||||||
S&P 500 Application Software | $ | 100.00 | $ | 124.24 | $ | 188.93 | $ | 191.52 | $ | 202.96 | $ | 292.66 | ||||||||||||
31
PRICE RANGE OF COMMON STOCK
The Company’s common stock is traded on the NASDAQ Stock Market under the symbol MCRS. As of August 13, 2014, there were 36,864 record holders of the Company’s common stock, $0.025 par value.
The following table shows the range of high and low stock prices for the periods indicated, as reported by NASDAQ:
1st Quarter | 2nd Quarter | 3rd Quarter | 4th Quarter | |||||||||||||
Fiscal Year Ended June 30, 2014 | ||||||||||||||||
High | $ | 51.91 | $ | 57.43 | $ | 59.46 | $ | 70.24 | ||||||||
Low | $ | 43.19 | $ | 47.80 | $ | 50.81 | $ | 50.65 | ||||||||
Fiscal Year Ended June 30, 2013 | ||||||||||||||||
High | $ | 53.21 | $ | 49.95 | $ | 48.20 | $ | 46.09 | ||||||||
Low | $ | 46.00 | $ | 39.31 | $ | 41.00 | $ | 40.25 | ||||||||
The Company has never paid a cash dividend and has no current intention to pay any cash dividends. Its current policy is to retain earnings and to use those funds for the operation and expansion of its business as well as the repurchase of the Company’s common stock. In addition, the Company is a party to a credit agreement which restricts the payment of cash dividends. See Item 7, “Management’s Discussion and Analysis of Financial Condition and Results of Operations – Liquidity and Capital Resources” and Note 8, “Line of Credit,” in the Notes to the Consolidated Financial Statements included in this report.
PURCHASES OF COMPANY STOCK
On January 28, 2014, the Company’s Board of Directors authorized the purchase of up to $200 million of the Company’s common stock, to be purchased from time to time over the ensuing three years depending on market conditions and other corporate considerations as determined by management. As of July 31, 2014, approximately $191.5 million remains available under the January 2014 authorization. During the fourth quarter of fiscal year 2014, our stock purchases were as follows:
Issuer Purchases of Equity Securities | ||||||||||||||
Total Number of Shares Purchased | Average Price Paid per Share | Total Number of Shares Purchased as Part of Publicly Announced Plan or Program | Maximum Amount that May Yet be Purchased Under the Plan or Program (1) | |||||||||||
04/01/14 – 04/30/14 | 500,000 | $ | 51.45 | 500,000 | $ | 210,889,410 | ||||||||
05/01/14 – 05/31/14 | 375,000 | $ | 51.68 | 375,000 | $ | 191,508,420 | ||||||||
06/01/14 – 06/30/14 | — | $ | — | — | $ | 191,508,420 | ||||||||
875,000 | 875,000 | |||||||||||||
(1) | Maximum amount that may yet be purchased under the January 23, 2014 stock repurchase plan. |
32
ITEM 6. | SELECTED FINANCIAL DATA |
Fiscal Year Ended June 30, | ||||||||||||||||||||
(in thousands, except per share data) | 2014 (1),(2),(3),(5),(6) | 2013 (1),(3),(4),(5),(6),(7) | 2012 (1),(4),(5).(6) | 2011 (1),(2),(4),(6) | 2010 (1),(4) | |||||||||||||||
Statement of Operations Data: | ||||||||||||||||||||
Revenue | $ | 1,405,397 | $ | 1,268,085 | $ | 1,107,531 | $ | 1,007,859 | $ | 914,319 | ||||||||||
Income from operations | $ | 258,610 | $ | 227,010 | $ | 234,520 | $ | 210,459 | $ | 167,973 | ||||||||||
Net income attributable to MICROS Systems, Inc. | $ | 182,014 | $ | 171,418 | $ | 166,983 | $ | 144,059 | $ | 114,353 | ||||||||||
Net income per share attributable to MICROS Systems, Inc. common shareholders: | ||||||||||||||||||||
Basic | $ | 2.42 | $ | 2.16 | $ | 2.08 | $ | 1.78 | $ | 1.44 | ||||||||||
Diluted | $ | 2.37 | $ | 2.12 | $ | 2.03 | $ | 1.74 | $ | 1.41 | ||||||||||
Balance Sheet Data: | ||||||||||||||||||||
Working capital (8) | $ | 645,171 | $ | 565,653 | $ | 500,127 | $ | 697,012 | $ | 468,047 | ||||||||||
Total assets | $ | 1,752,644 | $ | 1,589,038 | $ | 1,566,020 | $ | 1,433,018 | $ | 1,138,291 | ||||||||||
Line of credit outstanding | $ | — | $ | 1,757 | $ | — | $ | — | $ | 1,442 | ||||||||||
MICROS Systems, Inc. shareholders’ equity | $ | 1,226,199 | $ | 1,115,056 | $ | 1,092,645 | $ | 1,016,711 | $ | 783,380 | ||||||||||
Book value per share (9) | $ | 16.39 | $ | 14.53 | $ | 13.61 | $ | 12.59 | $ | 9.79 | ||||||||||
Additional Data: | ||||||||||||||||||||
Weighted average number of common shares outstanding: | ||||||||||||||||||||
Basic | 75,217 | 79,247 | 80,300 | 80,726 | 79,856 | |||||||||||||||
Diluted | 76,803 | 80,772 | 82,238 | 82,672 | 81,448 | |||||||||||||||
(1) | Fiscal years 2014, 2013, 2012, 2011 and 2010 include approximately $22.1 million ($15.1 million, net of tax or $0.20 per diluted share), $21.1 million ($14.4 million, net of tax or $0.18 per diluted share), $16.5 million ($11.3 million, net of tax or $0.14 per diluted share), $12.4 million ($8.0 million, net of tax or $0.10 per diluted share) and $12.4 million ($8.1 million, net of tax or $0.10 per diluted share), respectively, in non-cash share-based compensation expense. See Note 4 “Share-based Compensation” in the Notes to Consolidated Financial Statements. |
(2) | Fiscal years 2014 and 2011 include litigation charges and related interest expense of $3.7 million and $3.4 million, respectively. Fiscal year 2014 also includes Oracle Merger related expenses of approximately $2.1 million. |
(3) | Fiscal years 2014 and 2013 include approximately $1.5 million ($1.1 million, net of tax) and $5.5 million ($4.0 million, net of tax) in charges reflecting the restructuring of Torex. |
(4) | Fiscal years 2013, 2012, 2011 and 2010 include other-than-temporary impairments of approximately $0.6 million, $4.0 million, $4.3 million, $4.8 million and $1.3 million, respectively, for long-term investments (auction rate securities). See Note 3 “Financial Instruments and Fair Value Measurements” in the Notes to Consolidated Financial Statements. |
(5) | The results include activities from the acquisition of Torex which occurred on May 31, 2012. See Note 5 “Acquisitions” in the Notes to Consolidated Financial Statements. |
(6) | Fiscal years 2014, 2013, 2012 and 2011 include approximately $0.3 million, $4.1 million, $0.5 million and $0.4 million, respectively, in gains from sales/settlement of our investments in auction rate securities. |
(7) | Fiscal year 2013 includes $2.0 million in an insurance settlement related to a fraud that occurred in Japan during fiscal year 2010. |
(8) | Current assets less current liabilities. |
(9) | Calculated as shareholders’ equity divided by common stock outstanding at June 30. |
ITEM 7. | MANAGEMENT’S DISCUSSION AND ANALYSIS OF FINANCIAL CONDITION AND RESULTS OF OPERATIONS |
We are a leading worldwide designer, manufacturer, marketer, and servicer of enterprise applications for the global food and beverage, hotel, and retail industries. Our enterprise solutions comprise three major areas: hotel information systems, food and beverage information systems, and retail information systems. We also offer a wide range of related services. We distribute our products and services directly and through a network of independent dealers and distributors.
On June 22, 2014, MICROS entered into the Merger Agreement with Purchaser, Parent and, solely for certain limited purposes, Oracle. Pursuant to the Merger Agreement and subject to the terms and conditions of the Merger Agreement, Purchaser commenced the Offer to acquire all of the shares of the Company’s common stock for a purchase price of $68.00 per
33
share, payable net to the sellers in cash, without interest thereon and subject to any required withholding of taxes. The Merger Agreement provides, among other things, that as soon as practicable following the Purchaser's acceptance for payment shares of common stock of the Company validly tendered and not withdrawn in the Offer and satisfaction or waiver of all other applicable conditions set forth in the Merger Agreement, MICROS and Purchaser will complete the Merger with the Company surviving the Merger as a wholly-owned subsidiary of Oracle. For additional information regarding the Merger Agreement, the Offer and the Merger, see Part I, Item 1, “Business - Introduction - Recent Developments.”
We are organized and operate in four operating segments: U.S./Canada, EAME (Europe, Africa and Middle East), the Asia-Pacific, and Latin America regions. We have identified our U.S./Canada operating segment as a separate reportable segment and we have aggregated our three international operating segments into one reportable segment, international, as the three international operating segments share many similar economic characteristics. Our management views the U.S./Canada and international segments separately in operating our business, although the products and services are substantially similar for each segment.
CRITICAL ACCOUNTING ESTIMATES
Our discussion and analysis of our financial condition and results of operations are based on our consolidated financial statements, which have been prepared in accordance with accounting principles generally accepted in the United States of America. The preparation of these financial statements requires us to make estimates and judgments that affect the reported amounts of assets, liabilities, revenues, and expenses. We base our estimates on historical experience and on various other assumptions that we believe are reasonable under the circumstances, and which form the basis for making judgments about the carrying values of assets and liabilities that are not readily apparent from other sources. Actual results may differ from these estimates. We reevaluate our estimates periodically.
The following comprise the critical accounting estimates that we used in the preparation of our consolidated financial statements:
Revenue recognition
Revenue is generated from the sale of software licenses, hardware, services and support (including software as a service) and is recognized when persuasive evidence of an arrangement exists, delivery has occurred, or services have been rendered, the arrangement fee is fixed or determinable and collectability of the related receivable is probable. In making judgments regarding revenue recognition, we analyze various factors, including the nature and terms of the specific transaction, the nature and terms of comparable transactions, the creditworthiness of our customers, our historical experience, accuracy of prior estimates, and overall market and economic conditions. Moreover, in connection with sales of a number of products and services under a single contractual arrangement (a multiple element arrangement), we make judgments as to whether there is sufficient vendor specific objective evidence to enable the allocation of fair value among the various elements in software arrangements that contain multiple elements and as to relative selling prices for multiple element arrangements that contain hardware or other non-software elements. In determining relative selling prices for products and services, we consider, among other things, the client’s geographic location, customer concentrations, our use of discounts from list prices, prices we charge for similar offerings and our historical pricing practices. Changes in judgments related to these items, or a deterioration in market or economic conditions, could materially impact the timing and amount of revenue and costs recognized.
Allowance for doubtful accounts
We maintain an allowance for doubtful accounts for estimated losses that may result from the inability of our customers to make required payments. Our methodology for determining this allowance requires estimates and is based on the age of the receivable, customer payment practices and history, inquiries regarding the customer, credit reports from third parties and other financial information. If the financial condition of our customers were to deteriorate, resulting in an impairment of their ability to make payments, additional allowances may be required which could affect our financial results in future periods. As of June 30, 2014 and 2013, accounts receivable totaled approximately $287.6 million and $228.5 million, net of an allowance for doubtful accounts of approximately $28.6 million and $30.4 million, respectively. Additionally, bad debt expense for fiscal years 2014, 2013 and 2012 was approximately $1.5 million, $3.6 million and $7.1 million, respectively.
Inventory
Inventory is stated at the lower of cost or market. Cost is determined principally by the first-in, first-out pricing method. We regularly compare inventory quantities on hand against historical usage or forecasts related to specific items to evaluate obsolescence and excessive quantities. Nevertheless, changes in business trends, competition and other factors not apparent when, or occurring after, we make our estimates of inventory obsolescence could result in the need to undertake additional
34
inventory write downs in future periods. We wrote down our inventory by approximately $13.8 million and $12.8 million as of June 30, 2014 and 2013, respectively.
Capitalized software development costs
Costs incurred in the research and development of new software products to be licensed to others, primarily consisting of salaries, employee benefits and administrative costs, are expensed as incurred and included in research and development expenses until technological feasibility is established. The capitalization of software development costs on a product-by-product basis starts when a product’s technological feasibility has been established and ends when the product is available for general release to customers, at which time amortization of the capitalized software development costs begins. Technological feasibility is established when the product reaches the working model stage. The cost of purchased software is also capitalized.
Annual amortization of capitalized software development costs is either included in software cost of sales or service cost of sales. For each capitalized software product, the annual amortization is equal to the greater of: (i) the amount computed using the ratio that the software product’s current fiscal year gross revenue bears to the total current fiscal year and anticipated future gross revenues for that product or (ii) the amount computed based on the straight-line method over the remaining estimated economic life of the product. If we incorrectly estimate the remaining economic life of a product or the anticipated future gross revenues of a product, we may in the future be required to take a significant write off of capitalized software development costs or to accelerate amortization, either of which could materially affect our future financial results. Amortization expenses for fiscal years 2014, 2013 and 2012 were approximately $6.5 million, $5.2 million and $7.1 million, respectively.
Valuation of long-lived assets and intangible assets
We evaluate long-lived assets, including finite-lived purchased intangible assets, for impairment whenever events and changes in circumstances indicate that the carrying amount of an asset may not be fully recoverable. When indicators of impairment are present, we compare the fair value of the relevant asset groups, based on the undiscounted cash flows the asset groups are expected to generate (or market value, if available), to the net book value of the asset groups. If the fair value is less than the net book value, the asset group is impaired and we recognize an impairment loss equal to the excess of the net book value over the fair value.
The process of evaluating the potential impairment of long-lived assets including finite-lived purchased intangible assets is subjective and requires significant judgment at many points during the analysis. In estimating the fair value of the asset groups for the purposes of our analyses, we make estimates and judgments about the future cash flows of these asset groups. The cash flow forecasts are based on assumptions that are consistent with the plans and estimates used to manage the Company. A change in assumptions and estimates in future periods could cause us to determine that asset groups are impaired, resulting in a significant charge in future periods.
Goodwill and indefinite-lived intangible assets
We do not amortize goodwill and indefinite-lived intangible assets. We assess annually, in the first quarter of the fiscal year, whether goodwill and certain of our trademarks, which are our only indefinite-lived purchased intangible assets, are impaired. Goodwill is evaluated for impairment by comparing the fair value of each of our reporting units (our four operating segments consisting of U.S./Canada, EAME, the Asia-Pacific and Latin America) to their book value. We first determine, based on a qualitative assessment, whether it is more likely than not that the fair value of the reporting unit is less than its carrying amount. If we conclude that it is more likely than not that the fair value of a reporting unit is less than its carrying value, then we determine the fair value of the reporting unit based on a weighting of future income approach (i.e., discounted future income) and market approach (i.e., a comparison to the purchase and sale of similar assets in the relevant industry). If the fair value of the reporting unit exceeds the book value of the net assets assigned to that unit, goodwill is not impaired. If goodwill is impaired, we recognize an impairment loss based on the amount by which the book value of goodwill exceeds its implied fair value. The implied fair value of goodwill is determined by deducting the fair value of a reporting unit’s identifiable assets and liabilities from the fair value of the reporting unit as a whole, as if that reporting unit had just been acquired and the fair value of the individual assets acquired and liabilities assumed were being determined initially.
Additional impairment assessments may be performed on an interim basis if we encounter events or changes in circumstances indicating that it is more likely than not that the book value of goodwill and/or indefinite-lived trademarks has been impaired.
The process of evaluating the potential impairment of goodwill is highly subjective and requires significant judgment at many points during the analysis. Qualitative assessments regarding goodwill involve a high degree of judgment and can entail subjective considerations. Our estimates of the fair value of the reporting units for the purposes of our annual or interim analyses require estimates and judgments about the future cash flows of these businesses. The cash flow forecasts are based on
35
assumptions that are consistent with the plans and estimates used to manage the underlying reporting units and factor in assumptions on revenue and expense growth rates. These estimates are based upon our historical experience and projections of future activity, including assumptions relating to customer demand, changes in technology and the cost structure necessary to achieve the related revenues. Additionally, these cash flow analyses factor in expected amounts of working capital and weighted average cost of capital. Changes in judgments on any of these factors could materially impact the value of the reporting unit. We also consider our market capitalization on the date the analysis is performed. A determination that goodwill or intangible assets are impaired (which could result from a change in our assumptions) could have a significant impact on our operating results. As of June 30, 2014 and 2013, goodwill totaled approximately $458.8 million and $432.9, respectively. See Note 10, “Goodwill” in the Notes to Consolidated Financial Statements.
Share-based compensation
We account for our option awards granted under our stock option program by estimating fair value of option awards as of the date of grant. Non-cash share-based compensation expenses, which are based on the estimated value of the option awards adjusted for expected pre-vesting forfeitures, are recognized ratably over the requisite service (i.e. vesting) period of options in the consolidated statement of operations.
We value stock options using the Black-Scholes option pricing model, which was developed for use in estimating the fair value of traded options that are fully transferable and have no vesting restrictions. Therefore, we are required to input highly subjective assumptions about volatility rates, expected term of options, dividend yields and applicable interest rates in determining the estimated fair value. Expected volatility is based on historical stock prices. The expected term of options granted is based on historical option activities, adjusted for the remaining option life cycle by assuming ratable exercise of any unexercised vested options over the remaining term. For this purpose, we separate groups of associates that have historically exhibited similar behavior with regard to option exercises and post-vesting cancellations. The risk-free interest rate is based on the U.S. Treasury yield curve in effect at the time of grant. Total share-based compensation expense recorded from period to period can be significantly different depending on several variables, including the number of options granted, any changes to assumptions such as pre-vesting cancellations and the estimated fair value of those vested awards. However, unlike all of the other accounting estimates described in this section, changes in estimates regarding stock options affect only newly granted options; they do not result in a change in previously recorded amounts.
Income taxes
Income taxes are accounted for under the asset and liability method. Deferred tax assets and liabilities are recognized for the expected future tax consequences attributable to the differences between the financial statement carrying amounts and the tax basis of assets and liabilities. Deferred tax assets and liabilities are measured using the enacted tax rates in effect for the year in which those temporary differences are expected to be recovered or settled. The effect on the deferred tax assets and liabilities of a change in tax rate is recognized in income in the period that includes the enactment date. Valuation allowances are established when necessary to reduce deferred tax assets to the amounts more likely than not to be realized. If we determine that we will not be able to realize all or part of our net deferred tax asset in the future, an adjustment to the deferred tax asset would be charged to income in the period in which the determination is made. Our deferred tax assets and liabilities could be materially affected if, based on subsequent events, we determine that we must derecognize or recognize a tax position.
In connection with the fiscal year 2012 acquisition of Torex, we established a deferred tax asset (net of valuation allowances) related to the Torex U.K.’s net operating loss carryforwards. As of June 30, 2014 and 2013 the Torex U.K,'s net operating loss carryforwards were approximately $32.2 million and $34.3 million, respectively. We continued to recognize taxable income in the U.K., utilizing a portion of these net operating loss carryforwards. The future realization of the deferred tax asset is based on recent profitability and our current forecast of the acquired businesses’ operations. However, if those operations experience a significant change, whether due to future operational integration and reorganization or otherwise, we may not be able to fully utilize the net operating loss carryforwards. To the extent that we are unable to use some portion of the loss carryforwards in future periods, we would be required to recognize an increase to tax expense, which could materially affect our annual tax rate in the year in which the change occurs.
Although we are profitable on a consolidated basis, we have incurred losses in certain foreign jurisdictions. We applied valuation allowances in some circumstances where the prospects of realizing the benefit of net operating loss carryforwards and other deferred taxes are subject to uncertainty. The determination of the likelihood of realizing this tax benefit requires significant judgment in some instances, and actual results of our operating subsidiaries, particularly certain international subsidiaries, could require material adjustments to our deferred tax assets or liabilities, and changes in our annual tax rate and net income in the year in which the adjustments occur.
36
We review our uncertain income tax positions and apply a “more likely than not” threshold to the recognition and derecognition of tax positions. Our net unrecognized income tax benefits were approximately $45.4 million and $35.0 million, including interest and penalties of approximately $3.0 million and $2.7 million at June 30, 2014 and 2013, respectively. Significant judgment is required in determining our tax positions and evaluating uncertainties relating to these positions. Changes in estimates regarding our tax positions, or government determinations resulting from tax audits, could have an effect on our deferred tax assets and liabilities, as well as our annual tax rate in the year in which the changes or determinations occur.
RESULTS OF OPERATIONS
During the three fiscal years ended June 30, 2014, we acquired several businesses, including Torex in 2012, and accordingly, our results include activities from the acquired businesses from their respective acquisition dates. As Torex was acquired on May 31, 2012, close to the end of our fiscal year 2012, the results of these acquisitions did not have a material effect on our overall results during the fiscal year ended June 30, 2012. See Note 5 “Acquisitions” in the Notes to Consolidated Financial Statements for further detail on acquisitions.
Comparison of Fiscal Year 2014 to Fiscal Year 2013
Revenue
The following table provides information regarding the sales mix by reportable segments in fiscal years 2014 and 2013 (amounts are net of intersegment eliminations, based on location of the customer):
Fiscal Year Ended June 30, | ||||||||||||||||||||||||
U.S./Canada | International | Total | ||||||||||||||||||||||
(in thousands) | 2014 | 2013 | 2014 | 2013 | 2014 | 2013 | ||||||||||||||||||
Hardware | $ | 154,977 | $ | 118,426 | $ | 164,543 | $ | 151,225 | $ | 319,520 | $ | 269,651 | ||||||||||||
Software | 59,750 | 48,733 | 106,766 | 94,301 | 166,516 | 143,034 | ||||||||||||||||||
Service | 367,750 | 330,822 | 551,611 | 524,578 | 919,361 | 855,400 | ||||||||||||||||||
Total Revenue | $ | 582,477 | $ | 497,981 | $ | 822,920 | $ | 770,104 | $ | 1,405,397 | $ | 1,268,085 | ||||||||||||
The following table provides information regarding the total sales mix as a percent of total revenue in fiscal years 2014 and 2013:
Fiscal Year Ended June 30, | ||||||
2014 | 2013 | |||||
Hardware | 22.7 | % | 21.2 | % | ||
Software | 11.8 | % | 11.3 | % | ||
Service | 65.5 | % | 67.5 | % | ||
Total | 100.0 | % | 100.0 | % | ||
For fiscal year 2014, total revenue was approximately $1.4 billion, an increase of approximately $137.3 million, or 10.8% compared to fiscal year 2013, principally due to the following factors:
• | Hardware, software and service revenue increased by 18.5%, 16.4% and 7.5%, respectively, compared to fiscal year 2013. |
• | The increase in hardware revenue was largely attributable to an increase, principally in the U.S./Canada and EAME regions, in the sales of our proprietary hardware products, including our more traditional Workstation products and our newer products, the mTablet and the mStation, and an increase in sales of third party computer equipment. |
• | The increase in software revenue was primarily due to increase in the sales of our proprietary OPERA, Simphony and retail software products and two large sales of our payment gateway software to international customers during the three months ended December 31, 2013. |
• | The increase in service revenue was primarily due to increases in recurring maintenance services and SaaS/hosting services, and professional and implementation services, which typically accompany the higher hardware and software sales. |
37
• | Favorable foreign currency exchange rate fluctuations, primarily for the Euro and British Pound Sterling against the U.S. dollar, partially offset by unfavorable foreign currency exchange rate fluctuation, primarily for the Australian Dollar against the U.S. dollar, positively affected total revenue by approximately $8.9 million. |
International segment revenue for the fiscal year ended June 30, 2014 increased by approximately $52.8 million, or 6.9% compared to fiscal year 2013, principally due to the following factors:
• | Hardware, software and service revenue increased by 8.8%, 13.2% and 5.2%, respectively, compared to fiscal year 2013. |
• | The increase in hardware revenue was primarily due to an increase in the sales of our proprietary hardware products, including our more traditional Workstation products and our newer products, the mTablet and the mStation. |
• | The increase in software revenue was primarily due to increases in the sales of our proprietary OPERA, Simphony, retail software products and two large sales of our payment gateway software during the three months ended December 31, 2013. |
• | The increase in services revenue was primarily due to an increase in recurring maintenance services, SaaS/hosting services and implementation and professional services. |
• | Favorable foreign currency exchange rate fluctuations, primarily for the Euro and British Pound Sterling against the U.S. dollar, partially offset by unfavorable foreign currency exchange rate fluctuation, primarily for the Australian Dollar against the U.S. dollar, positively affected total international revenue by approximately $9.9 million. |
U.S./Canada segment revenue for the fiscal year ended June 30, 2014 increased by approximately $84.5 million, or 17.0% compared to fiscal year 2013, principally due to the following factors:
• | Hardware, software and service revenue increased by 30.9%, 22.6% and 11.2%, respectively, compared to fiscal year 2013. |
• | The increase in hardware revenue was largely attributable to increases in the sales of our proprietary hardware products, including our more traditional Workstation products and our newer products, the mTablet and the mStation, and an increase in the sales of third party computer equipment . |
• | The increase in software revenue was primarily due to increases in the sales of our proprietary OPERA and Simphony software. |
• | The increase in service revenue was primarily due to increases in implementation and professional services, SaaS/hosting services and recurring maintenance services. |
• | Unfavorable foreign currency exchange rate fluctuation between the Canadian dollar and the U.S. dollar, negatively affected total revenue by approximately $1.1 million. |
Cost of Sales
The following table provides information regarding our cost of sales in fiscal years 2014 and 2013:
Fiscal Year Ended June 30, | ||||||||||||||
2014 | 2013 | |||||||||||||
(in thousands) | Cost of Sales | % of Related Revenue | Cost of Sales | % of Related Revenue | ||||||||||
Hardware | $ | 204,351 | 64.0 | % | $ | 175,248 | 65.0 | % | ||||||
Software | 24,752 | 14.9 | % | 22,178 | 15.5 | % | ||||||||
Service | 440,190 | 47.9 | % | 406,767 | 47.6 | % | ||||||||
Total Cost of Sales | $ | 669,293 | 47.6 | % | $ | 604,193 | 47.6 | % | ||||||
For fiscal years 2014 and 2013, cost of sales as a percent of revenue was 47.6%.
Hardware cost of sales as a percent of hardware revenue for fiscal year 2014 decreased 1.0% compared to the same period last year. This decrease in hardware cost of sales was primarily due to a favorable product mix between the sales of our proprietary hardware products and the sales of third party hardware products, and improved margins realized on the sales of our proprietary hardware products. These decreases were partially offset by lower margins realized on the sales of third party hardware products and higher freight costs.
38
Software cost of sales as a percent of software revenue for fiscal year 2014 decreased 0.6% compared to the same period last year. This decrease in software cost of sales was primarily due to a favorable product mix between the sales of our proprietary software products and the sales of third party software products, partially offset by lower margins realized on the sales of software products.
Service costs as a percent of service revenue for fiscal year 2014 increased slightly by 0.3% compared to the same period last year.
Foreign currency exchange rate fluctuations increased overall cost of sales by approximately $2.8 million or 0.2% of total revenue.
Selling, General and Administrative (“SG&A”) Expenses
For fiscal year 2014, SG&A expenses as a percent of revenue decreased 0.3% to 26.6% compared to 26.9% in fiscal year 2013. The decrease is primarily due to lower fixed expenses as a percent to revenue (a function of favorable leveraging of fixed costs against higher revenue in fiscal year 2014) and a decrease in bad debt expense as compared to the same period last year. While the global economic conditions are still uncertain, we believe the decrease in bad debt expense reflects some stabilization in global economic conditions and the results of our continued focus on collection efforts related to aged receivables that previously were included in our allowance for doubtful accounts. These decreases were partially offset by an increase in incentive based compensation expense as compared to the same period last year.
Fiscal year 2014 SG&A expenses includes a litigation charge of $2.8 million, Merger related expenses of approximately $2.1 million and approximately $1.5 million in restructuring charges related to the substantial completion of our efforts to merge the acquired Torex operations into our existing global infrastructure.
Fiscal year 2013 SG&A expenses includes a restructuring charge related to restructuring Torex of approximately $5.5 million. In addition, we received $2.0 million in an insurance settlement.
Foreign currency exchange rate fluctuations increased overall SG&A expenses by approximately $1.9 million or 0.1% of total revenue.
Research and Development (“R&D”)
R&D expenses consist primarily of labor costs less capitalized software development costs. The following table provides information regarding our R&D expenses in fiscal years 2014 and 2013:
Fiscal Year Ended June 30, | ||||||||
(in thousands) | 2014 | 2013 | ||||||
R&D labor and other costs | $ | 91,746 | $ | 76,892 | ||||
Capitalized software development costs | (9,718 | ) | (4,290 | ) | ||||
Total R&D expenses | $ | 82,028 | $ | 72,602 | ||||
% of Revenue | 5.8 | % | 5.7 | % | ||||
The increase in capitalized software development costs is primarily related to the development of the next version of Simphony, our primary food and beverage enterprise information application. The increase in total R&D expenses is primarily related to our OPERA and Simphony software.
Foreign currency exchange rate fluctuations increased overall R&D expenses by approximately $1.6 million or 0.1% of total revenue.
Depreciation and Amortization Expenses
Depreciation and amortization expenses for fiscal year 2014 was approximately $22.1 million, comparable to fiscal year 2013 of approximately $22.6 million.
Share-Based Compensation Expenses
The following table provides information regarding our recognition of non-cash share-based compensation expense, which was included in the SG&A expenses, R&D expenses and cost of sales for fiscal years 2014 and 2013, as indicated below:
39
Fiscal Year Ended June 30, | ||||||||
(in thousands, except per share data) | 2014 | 2013 | ||||||
SG&A | $ | 19,652 | $ | 19,124 | ||||
R&D | 2,031 | 1,640 | ||||||
Cost of sales | 374 | 338 | ||||||
Total non-cash share-based compensation expense | 22,057 | 21,102 | ||||||
Income tax benefit | (6,912 | ) | (6,721 | ) | ||||
Total non-cash share-based compensation expense, net of tax benefit | $ | 15,145 | $ | 14,381 | ||||
Impact on diluted net income per share attributable to MICROS Systems, Inc. common shareholders | $ | 0.20 | $ | 0.18 | ||||
As of June 30, 2014, approximately $33.7 million in non-cash share-based compensation cost related to non-vested awards was not yet recognized in our consolidated statements of operations. This cost is expected to be recognized over a weighted-average period of 1.87 years.
Income from Operations
Income from operations for fiscal year 2014 increased approximately $31.6 million, or 13.9%, to approximately $258.6 million, compared to fiscal year 2013. The increase is primarily due to an increase in total revenue of approximately $137.3 million or 10.8%, at comparable gross margins to fiscal year 2013, partially offset by increased operating expenses of approximately $40.6 million.
Non-operating Income (Expense)
Net non-operating income for fiscal year 2014 was approximately $2.8 million compared to net non-operating income of approximately $6.8 million for fiscal year 2013. This decrease is primarily due to realized gains of approximately $4.1 million on sale of our investments in auction rate securities during fiscal year 2013, partially offset by $0.9 million in interest expense in fiscal year 2014 related to a litigation charge.
Income Tax Expense
The effective tax rates for fiscal years 2014 and 2013 were 30.3% and 26.5%, respectively. The effective tax rates for the fiscal years 2014 and 2013 were less than the 35.0% U.S. statutory federal income tax rate, mainly due to earnings from non-U.S. jurisdictions that have a lower statutory tax rate than the U.S., in conjunction with our continued determination to permanently reinvest overseas these cumulative unremitted earnings. Tax benefits realized upon settlements with tax authorities, the expiration of statutes of limitations and domestic manufacturing deductions also serve to lower our effective tax rate as compared to the U.S. statutory rate.
The increase in the effective tax rate for fiscal year 2014 as compared to fiscal year 2013 was primarily attributable to increases resulting from the following:
(i) The change in our uncertain tax positions increased the effective tax rate and tax expense for the fiscal year 2014 by 2.9% and approximately $7.5 million, respectively, as compared to fiscal year 2013. This increase primarily reflects the tax benefit resulting from the settlements with tax authorities during fiscal year 2013;
(ii) An unfavorable change in earnings mix among jurisdictions increased the effective tax rate and tax expense for the fiscal year 2014 by 1.3% and approximately $3.4 million, respectively, as compared to fiscal year 2013; and,
(ii) The effect of the reduction in the U.K. tax rate to 20% increased the effective tax rate and income tax expense for the fiscal year 2014 by 1.0% and approximately $2.7 million, respectively, as compared to fiscal year 2013. The rate reduction caused the effective tax rate to increase by reducing the carrying value of our U.K. net deferred tax assets.
We recorded net non-current unrecognized income tax benefits of approximately $45.4 million and $35.0 million, including accrued interest and penalties of approximately $3.0 million and $2.7 million at June 30, 2014 and 2013, respectively. We have recognized approximately $0.3 million of net interest expense in fiscal year 2014 compared to $0.5 million of interest benefit in fiscal year 2013. The net interest benefit 2013 was due to the interest associated with the settlements with tax authorities and the expiration of statues of limitations. The net non-current unrecognized income tax benefits represents
40
benefits with respect to which we do not anticipate making a payment within 12 months of the balance sheet date. If recognized, substantially all of the change in the net unrecognized income tax benefit would be recognized as a reduction of income tax expense, affecting the effective income tax rate.
In the ordinary course of the Company’s business, transactions occur for which the ultimate tax outcome may be uncertain. Under applicable accounting guidance, the Company is unable to recognize the effects of a tax position in its financial statements unless the position satisfies a minimum recognition threshold mandated by the guidance. We have recognized a net increase in unrecognized tax benefits for the fiscal year ended June 30, 2014 as compared to fiscal year 2013. This increase was partially offset by a reduction in the effective tax rate of 1.4% and income tax expense by approximately $3.7 million, due to the expiration of statutes of limitations.
We estimate that within the next 12 months, we will decrease the unrecognized income tax benefits by between approximately $5.0 million to $7.0 million due to the expiration of statues of limitations and settlement of issues with tax authorities, which we believe would increase earnings as a result of a reduction in tax expense. However, audit outcomes and the timing of audit settlements are subject to significant uncertainty. Over the next 12 months, it is reasonably possible that our tax positions will continue to generate liabilities for uncertain tax positions.
We currently have no plans to repatriate to the U.S. our cumulative unremitted foreign earnings, as we intend to permanently reinvest such earnings internationally. If we change our strategy in the future and repatriate such funds, the amount of any U.S. taxes due on the repatriation of such funds, which could be significant, and the application of any tax credits, would be determined based on the appropriate jurisdictional income tax laws at the time of such repatriation. Due to the extent of uncertainty as to which remittance structure would be used should a decision be made in the future to repatriate, the availability and the complexity of calculating foreign tax credits, and the implications of indirect taxes, including withholding taxes, determination of the unrecognized deferred income tax liability related to these unremitted earnings is not practicable.
Based on currently available information, we expect that our effective tax rate for fiscal year 2015 will be comparable to fiscal year 2014. We believe that due to changes in the mix of earnings among jurisdictions and the impact of discrete items recognized within a financial period, there may be some degree of volatility to the quarterly tax rate.
Net Income Attributable to MICROS Systems, Inc. and Diluted Net Income per Share Attributable to MICROS Systems, Inc. Common Shareholders
The net income attributable to MICROS Systems, Inc. for fiscal year 2014 increased approximately $10.6 million, or 6.2%, to approximately $182.0 million, compared to fiscal year 2013. The increase primarily reflects increase in total revenue and our continued cost cutting efforts, partially offset by an increase in our effective tax rate. Foreign currency exchange rate fluctuations increased the net income attributable to MICROS Systems, Inc. for fiscal year 2014 by approximately $1.4 million compared to fiscal year 2013.
Diluted net income per share attributable to our shareholders for fiscal year 2014 and 2013 was $2.37 and $2.12 per diluted share, respectively. Fiscal year 2014 diluted net income per share reflects approximately 4.0 million lower weighted-average number of shares outstanding (the denominator used to calculate net income per share) compared to fiscal year 2013 primarily due to approximately 4.2 million shares of our common stock we purchased during the year. Foreign currency exchange rate fluctuations increased the diluted net income per share for fiscal year 2014 by $0.02 per diluted share compared to fiscal year 2013.
Comparison of Fiscal Year 2013 to Fiscal Year 2012
Revenue
The following table provides information regarding the sales mix by reportable segments in fiscal years 2013 and 2012 (amounts are net of intersegment eliminations, based on location of the customer):
Fiscal Year Ended June 30, | ||||||||||||||||||||||||
U.S./Canada | International | Total | ||||||||||||||||||||||
(in thousands) | 2013 | 2012 | 2013 | 2012 | 2013 | 2012 | ||||||||||||||||||
Hardware | $ | 118,426 | $ | 126,940 | $ | 151,225 | $ | 110,980 | $ | 269,651 | $ | 237,920 | ||||||||||||
Software | 48,733 | 55,039 | 94,301 | 87,578 | 143,034 | 142,617 | ||||||||||||||||||
Service | 330,822 | 339,296 | 524,578 | 387,698 | 855,400 | 726,994 | ||||||||||||||||||
Total Revenue | $ | 497,981 | $ | 521,275 | $ | 770,104 | $ | 586,256 | $ | 1,268,085 | $ | 1,107,531 | ||||||||||||
41
The following table provides information regarding the total sales mix as a percent of total revenue in fiscal years 2013 and 2012:
Fiscal Year Ended June 30, | ||||||
2013 | 2012 | |||||
Hardware | 21.2 | % | 21.5 | % | ||
Software | 11.3 | % | 12.9 | % | ||
Service | 67.5 | % | 65.6 | % | ||
Total | 100.0 | % | 100.0 | % | ||
For fiscal year 2013, total revenue was approximately $1.3 billion, an increase of approximately $160.6 million, or 14.5% compared to fiscal year 2012, principally due to the following factors:
• | Hardware, software and service revenue increased by 13.3%, 0.3% and 17.7%, respectively, compared to fiscal year 2012. The increases were largely attributable to the approximately $170.6 million of additional revenue generated by the acquired Torex businesses during fiscal year 2013 as compared to fiscal year 2012. This increase was comprised of hardware revenue of approximately $41.2 million, software revenue of approximately $8.2 million and services revenue of approximately $121.1 million. |
• | Current global economic uncertainty continued to have an adverse impact on revenues. |
• | Unfavorable foreign currency exchange rate fluctuations, primarily for the Euro, Brazilian Real, Japanese Yen, and British Pound Sterling against the U.S. dollar, negatively affected total revenue by approximately $12.2 million. |
International segment revenue for the fiscal year ended June 30, 2013 increased by approximately $183.8 million, or 31.4% compared to fiscal year 2012, principally due to the following factors:
• | Hardware, software and service revenue increased by 36.3%, 7.7% and 35.3%, respectively, compared to fiscal year 2012. The increases were largely attributable to the approximately $167.3 million of additional revenue generated by the acquired Torex businesses during fiscal year 2013 as compared to fiscal year 2012. This increase was comprised of hardware revenue of approximately $40.8 million, software revenue of approximately $8.1 million and services revenue of approximately $118.4 million. |
• | Unfavorable foreign currency exchange rate fluctuations, primarily for the Euro, Brazilian Real, Japanese Yen, and British Pound Sterling against the U.S. dollar, negatively affected total revenue by approximately $12.2 million. |
U.S./Canada segment revenue for the fiscal year ended June 30, 2013 decreased by approximately $23.3 million, or 4.5% compared to fiscal year 2012, principally due to the following factors:
• | Hardware, software and service revenue decreased by 6.7%, 11.5% and 2.5%, respectively, compared to fiscal year 2012. We believe these changes reflect a continued negative impact from macro-economic conditions. |
• | The decrease in hardware revenue was primarily due to decreased sales of our Workstation products compared to fiscal year 2012. |
• | The decrease in software revenue was primarily due to decreased sales of our food and beverage and hotel software products. These decreases were partially offset by an increase in sales of our retail software products. |
• | The decrease in service revenue was primarily due to decreases in professional services and web based marketing services, partially offset by an increase in maintenance services, reflecting the continued expansion of our customer base and new products and services offerings including hosting and software-as-a-service. |
42
Cost of Sales
The following table provides information regarding our cost of sales in fiscal years 2013 and 2012:
Fiscal Year Ended June 30, | ||||||||||||||
2013 | 2012 | |||||||||||||
(in thousands) | Cost of Sales | % of Related Revenue | Cost of Sales | % of Related Revenue | ||||||||||
Hardware | $ | 175,248 | 65.0 | % | $ | 152,242 | 64.0 | % | ||||||
Software | 22,178 | 15.5 | % | 20,779 | 14.6 | % | ||||||||
Service | 406,767 | 47.6 | % | 319,900 | 44.0 | % | ||||||||
Total Cost of Sales | $ | 604,193 | 47.6 | % | $ | 492,921 | 44.5 | % | ||||||
For fiscal year 2013, cost of sales as a percent of revenue increased 3.1% to 47.6% compared to 44.5% in fiscal year 2012. Hardware cost of sales as a percent of hardware revenue for fiscal year 2013 increased 1.0% compared to the same period last year. Software cost of sales as a percent of software revenue for fiscal year 2013 increased 0.9% compared to the same period last year. Service costs as a percent of service revenue for fiscal year 2013 increased by 3.6% compared to the same period last year. These increases primarily reflect margins generated by Torex. When compared to our other businesses, Torex generally has higher sales of non-proprietary hardware, and realizes lower margins from its products and services.
Excluding the impact of the Torex acquisition, the hardware cost of sales as a percent of related revenue for fiscal year 2013 was comparable to fiscal year 2012. The software cost of sales as a percent of related revenue for fiscal year 2013 decreased by 1.0% compared to the same period last year primarily due to lower software amortization expense (included in software cost of sales) for fiscal year 2013 both in amount and as a percent of revenue as compared to fiscal year 2012. The lower software amortization expense primarily reflects the full year amortization in fiscal year 2012 of capitalized software development related to one of our hotel application products and one of our e-commerce solutions. The service cost of sales as a percent of related revenue for fiscal year 2013 increased by 1.1% due to unfavorable product mix between professional services and maintenance services. MICROS generally realizes higher margins on installation and professional services than it does on maintenance services.
Foreign currency exchange rate fluctuations decreased overall cost of sales by approximately $5.5 million or 0.4% of total revenue.
Selling, General and Administrative (“SG&A”) Expenses
For fiscal year 2013, SG&A expenses as a percent of revenue decreased 1.3% to 26.9% compared to 28.2% in fiscal year 2012, primarily due to decreases in incentive based compensation expense and bad debt expense as compared to the same period last year. While the global economic conditions are still uncertain, we believe the decrease in bad debt expense reflects some stabilization in global economic conditions and the results of our continued focus on collection efforts related to aged receivables that previously were included in our allowance for doubtful accounts. In addition, we received $2.0 million in an insurance settlement. These decreases were partially offset by approximately $5.5 million in restructuring charges related to our continued effort to merge the acquired Torex operations into our existing global infrastructure.
Although the SG&A expenses as a percent of revenue for fiscal year 2013 decreased as compared to fiscal year 2012, the amount of fiscal year 2013 SG&A expenses increased by approximately $29.8 million compared to fiscal year 2012, primarily due to an increase in total compensation expenses of approximately $16.9 million, related primarily to new associates who joined our company as a result of the Torex acquisition in May 2012.
Foreign currency exchange rate fluctuations decreased overall SG&A expenses by approximately $3.6 million or 0.3% of total revenue.
43
Research and Development (“R&D”)
R&D expenses consist primarily of labor costs less capitalized software development costs. The following table provides information regarding our R&D expenses in fiscal years 2013 and 2012:
Fiscal Year Ended June 30, | ||||||||
(in thousands) | 2013 | 2012 | ||||||
R&D labor and other costs | $ | 76,892 | $ | 59,228 | ||||
Capitalized software development costs | (4,290 | ) | (7,197 | ) | ||||
Total R&D expenses | $ | 72,602 | $ | 52,031 | ||||
% of Revenue | 5.7 | % | 4.7 | % | ||||
The decrease in capitalized software development costs is primarily related to the completion of the development of C3G, our supply chain and life cycle management tool software, during the three months ended September 30, 2012, and XBRi Ingenium, our next generation loss prevention reporting and business analytics solution, during the three months ended March 31, 2013. The increase in total R&D expenses is primarily associated with Torex R&D expenses.
Depreciation and Amortization Expenses
Depreciation and amortization expenses for fiscal year 2013 increased approximately $6.4 million compared to fiscal year 2012 to approximately $22.6 million. This increase is primarily due to additional depreciation and amortization expenses related to our acquisition of Torex.
Share-Based Compensation Expenses
The following table provides information regarding our recognition of non-cash share-based compensation expense, which was included in the SG&A expenses, R&D expenses and cost of sales for fiscal years 2013 and 2012, as indicated below:
Fiscal Year Ended June 30, | ||||||||
(in thousands, except per share data) | 2013 | 2012 | ||||||
SG&A | $ | 19,124 | $ | 15,067 | ||||
R&D | 1,640 | 1,239 | ||||||
Cost of sales | 338 | 195 | ||||||
Total non-cash share-based compensation expense | 21,102 | 16,501 | ||||||
Income tax benefit | (6,721 | ) | (5,163 | ) | ||||
Total non-cash share-based compensation expense, net of tax benefit | $ | 14,381 | $ | 11,338 | ||||
Impact on diluted net income per share attributable to MICROS Systems, Inc. common shareholders | $ | 0.18 | $ | 0.14 | ||||
As of June 30, 2013, approximately $30.1 million in non-cash share-based compensation cost related to non-vested awards was not yet recognized in our consolidated statements of operations. This cost is expected to be recognized over a weighted-average period of 1.89 years.
Income from Operations
Income from operations for fiscal year 2013 decreased approximately $7.5 million, or 3.2%, to approximately $227.0 million, compared to fiscal year 2012. The decrease reflects lower margins (as a percent of revenue) generated by Torex, which generally has higher sales of non-proprietary hardware compared to our other business, and realizes lower margins from its products and services, and an increase in costs associated with our research and development efforts, primarily related to Torex R&D expenses. Foreign currency exchange rate fluctuations also contributed to the decrease in our income from operations for fiscal year 2013 by approximately $2.4 million compared to fiscal year 2012. These decreases were partially offset by our continued cost cutting efforts.
Non-operating Income (Expense)
Net non-operating income for fiscal year 2013 was approximately $6.8 million compared to net non-operating income of approximately $2.7 million for fiscal year 2012. This increase is primarily due to realized gains of approximately $4.1 million on sale of our investments in auction rate securities during fiscal year 2013. Fiscal years 2013 and 2012 also include credit based impairment losses related to our investments in auction rates securities of approximately $0.6 million and $4.0 million,
44
respectively. The net favorable fiscal year 2013 changes were partially offset by a decrease in interest income of approximately $2.8 million, primarily due to lower funds available during fiscal year 2013 as a result of our use of available cash to acquire Torex in May 2012.
Income Tax Expense
The effective tax rates for fiscal years 2013 and 2012 were 26.5% and 29.5%, respectively. The effective tax rates for the fiscal years 2013 and 2012 were less than the 35.0% U.S. statutory federal income tax rate, mainly due to earnings from jurisdictions that have a lower statutory tax rate than the U.S., our continued determination to permanently reinvest overseas the cumulative unremitted earnings of our significant non-US affiliates, tax benefits realized upon settlements with tax authorities, the expiration of statutes of limitations and the domestic manufacturing deductions.
The decrease in the effective tax rate for fiscal year 2013 as compared to fiscal year 2012 was mainly due to a decrease in net unrecognized tax benefits due to favorable settlements with tax authorities in fiscal year 2013 and the favorable mix of earnings from jurisdictions that have a lower statutory tax rate than the U.S. The international segment represents a larger portion of our consolidated earnings compared to fiscal year 2012 due to the acquisition of Torex business in May 2012.
We recorded net non-current unrecognized income tax benefits of approximately $35.0 million and $34.7 million, including accrued interest and penalties of approximately $2.7 million and $3.2 million at June 30, 2013 and 2012, respectively. We have recognized approximately $0.5 million of net interest benefit in fiscal year 2013 compared to $0.6 million of interest expense in fiscal year 2012. The net interest benefit in fiscal year 2013 was due to the interest associated with the settlements with tax authorities and the expiration of statues of limitations. The net non-current unrecognized income tax benefits represents benefits with respect to which we do not anticipate making a payment within 12 months of the balance sheet date. If recognized, the net unrecognized income tax benefit would be recognized as a reduction of income tax expense, affecting the effective income tax rate.
In the ordinary course of the Company’s business, transactions occur for which the ultimate tax outcome may be uncertain. Under applicable accounting guidance, the Company is unable to recognize the effects of a tax position in its financial statements unless the position satisfies a minimum recognition threshold mandated by the guidance. We have recognized a net decrease in unrecognized tax benefits for the fiscal year ended June 30, 2013 as compared to fiscal year 2012, which includes a reduction in the effective tax rate of 4.5% and income tax expense by approximately $10.6 million, primarily due to favorable settlements with the tax authorities and the expiration of statutes of limitations. We estimate that within the next 12 months, we will decrease the unrecognized income tax benefits by between approximately $2.8 million to $4.8 million due to the expiration of statues of limitations and settlement of issues with tax authorities, which we believe would increase earnings as a result of a reduction in tax expense. However, audit outcomes and the timing of audit settlements are subject to significant uncertainty. Over the next 12 months, it is reasonably possible that our tax positions will continue to generate liabilities for uncertain tax positions.
We currently have no plans to repatriate to the U.S. our cumulative unremitted foreign earnings, as we intend to permanently reinvest such earnings internationally. If we change our strategy in the future and repatriate such funds, the amount of any U.S. taxes due on the repatriation of such funds, which could be significant, and the application of any tax credits, would be determined based on the appropriate jurisdictional income tax laws at the time of such repatriation. Due to the extent of uncertainty as to which remittance structure would be used should a decision be made in the future to repatriate, the availability and the complexity of calculating foreign tax credits, and the implications of indirect taxes, including withholding taxes, determination of the unrecognized deferred income tax liability related to these unremitted earnings is not practicable.
Based on currently available information, we estimate that our effective tax rate for fiscal year 2014 will be approximately 32.5% compared to 26.5% for fiscal year 2013. The projected increase is primarily attributable to the following (i) fiscal year 2013’s favorable tax settlements with tax authorities and (ii) a decrease in interest expense deductions in fiscal year 2014 due to changes in foreign income tax law and a reduction in the U.K. income tax rate from 23% to 20% (enacted in July 2013), which will be reflected as a reduction in the carrying value of our deferred tax assets during our first quarter ending September 30, 2013.
We believe that due to changes in the mix of earnings among jurisdictions and the impact of discrete items recognized within a financial period, there may be some degree of volatility to the quarterly tax rate.
45
Net Income Attributable to MICROS Systems, Inc. and Diluted Net Income per Share Attributable to MICROS Systems, Inc. Common Shareholders
The net income attributable to MICROS Systems, Inc. for fiscal year 2013 increased approximately $4.4 million, or 2.7%, to approximately $171.4 million, compared to fiscal year 2012. The increase primarily reflects lower effective income tax rate, increase in total revenue and our continued cost cutting efforts. These increases were partially offset by lower margins generated by Torex, which generally has higher sales of non-proprietary hardware compared to our other business, and realizes lower margins from its products and services, and additional R&D expenses associated with the acquired Torex operations. Foreign currency exchange rate fluctuations also decreased the net income attributable to MICROS Systems, Inc. for fiscal year 2013 by approximately $2.1 million compared to fiscal year 2012.
Diluted net income per share attributable to our shareholders for fiscal year 2013 and 2012 was $2.12 and $2.03 per diluted share, respectively. Fiscal year 2013 diluted net income per share reflects approximately 1.5 million lower weighted-average number of shares outstanding (the denominator used to calculate net income per share) compared to fiscal year 2012 primarily due to approximately 4.1 million shares of our common stock we purchased during the year. Foreign currency exchange rate fluctuations decreased the diluted net income per share for fiscal year 2013 by $0.03 per diluted share compared to fiscal year 2012.
RECENT ACCOUNTING STANDARDS
See Note 2 “Description of Business and Summary of Significant Accounting Policies,” in the Notes to the Consolidated Financial Statements included in this report for further information about recently adopted accounting guidance and recent accounting guidance not yet adopted.
LIQUIDITY AND CAPITAL RESOURCES
Sources and Uses of Cash
The following table summarizes the Company’s consolidated statement of cash flows:
Fiscal Year Ended June 30, | ||||||||||||
(in thousands) | 2014 | 2013 | 2012 | |||||||||
Net cash provided by (used in): | ||||||||||||
Operating activities | $ | 239,461 | $ | 203,525 | $ | 179,949 | ||||||
Investing activities | 31,162 | (115,051 | ) | (183,880 | ) | |||||||
Financing activities | (139,475 | ) | (163,108 | ) | (43,884 | ) | ||||||
Operating activities:
Net cash provided by operating activities for fiscal year 2014 increased approximately $35.9 million compared to fiscal year 2013. The improvement was largely attributable to an increase in net income and a year over year improvement in working capital. The improvement was largely attributable to lower payments for annual incentive compensation and income tax in fiscal year 2014.
Net cash provided by operating activities for fiscal year 2013 increased approximately $23.6 million compared to fiscal year 2012, due principally to better collections of receivables in comparison to fiscal year 2012, partially offset by prepayments of taxes.
Investing activities:
Net cash flows provided by investing activities for fiscal year 2014 was approximately $31.2 million primarily reflecting approximately $76.7 million received from the maturities of investments, net of funds used to purchase investments, partially offset by approximately $44.1 million used to purchase property, plant and equipment and to develop and purchase software to be licensed to others.
Net cash used in investing activities for fiscal year 2013 was approximately $115.1 million primarily reflecting approximately $87.6 million used to purchase investments, net of proceeds from sales of investments (including approximately $42.1 million received from the sale of auction rate securities.) We also used approximately $27.6 million to purchase property, plant and equipment and to develop software to be licensed to others.
46
Net cash used in investing activities for fiscal year 2012 was approximately $183.9 million primarily due to approximately $258.2 million we used (net of cash acquired) in connection with the acquisition of Torex in May 2012. We also used approximately $24.7 million to purchase property, plant and equipment and to develop software to be licensed to others. These amounts were partially offset by approximately $99.7 million in proceeds from sales of investments (including approximately $5.0 million received from the sale of auction rate securities), net of funds used to purchase investments.
Financing activities:
Net cash used in financing activities for fiscal year 2014 was approximately $139.5 million, principally reflecting approximately $215.7 million used to purchase our stock and a payment under our former line of credit by our Japanese subsidiary of approximately $ 1.8 million. Our use of funds for financing activities was partially offset by proceeds from stock option exercises of approximately $74.0 million and realized tax benefits from stock option exercises of approximately $3.8 million.
Net cash used in financing activities for fiscal year 2013 was approximately $163.1 million, principally reflecting approximately $176.6 million used to purchase our stock. Our use of funds for financing activities was partially offset by proceeds from stock option exercises of approximately $9.1 million, realized tax benefits from stock option exercises of approximately $3.3 million, and approximately $2.0 million in proceeds from an advance on our line of credit, net of a principal payment during the year.
Net cash used in financing activities for fiscal year 2012 was approximately $43.9 million, principally reflecting approximately $59.2 million used to purchase our stock and approximately $4.2 million we used to acquire a noncontrolling interest, partially offset by proceeds from stock option exercises of approximately $14.9 million and realized tax benefits from stock option exercises of approximately $4.7 million.
Capital Resources
In the ordinary course of the Company’s business, transactions occur for which the ultimate tax outcome may be uncertain. Under applicable accounting guidance, the Company is unable to recognize the effects of a tax position in its financial statements unless the position satisfies a minimum recognition threshold mandated by the guidance. At June 30, 2014, our cash and cash equivalents and short-term investment balance was approximately $699.8 million, of which approximately $447.5 million was held internationally. We currently have no plans to repatriate to the U.S. our cumulative unremitted foreign earnings, as we intend to permanently reinvest such earnings internationally. If we change our strategy in the future and repatriate such funds, the amount of any U.S. taxes due on the repatriation of such funds, which could be significant, and the application of any tax credits, would be determined based on the appropriate jurisdictional income tax laws at the time of such repatriation. Due to the extent of uncertainty as to which remittance structure would be used should a decision be made in the future to repatriate, the availability and the complexity of calculating foreign tax credits, and the implications of indirect taxes, including withholding taxes, determination of the unrecognized deferred income tax liability related to these unremitted earnings is not practicable. All cash and cash equivalents and short-term investments are being retained for operations, expansion of the business and the repurchase of our stock.
We had two credit agreements (the "Former Credit Agreements") that expired on September 30, 2013. The Former Credit Agreements provided an aggregate $50.0 million multi-currency committed line of credit. We paid the approximately $1.8 million outstanding under the Former Credit Agreements on the expiration date.
We entered into a new credit agreements (the “Credit Agreement”), dated March 28, 2014 and effective upon closing on April 10, 2014, with Wells Fargo Bank, National Association and J.P. Morgan Chase Bank, N.A. The Credit Agreement provides a $50.0 million multi-currency committed line of credit and replaces the Former Credit Agreements. The interest rate varies depending on the form of the draw, and is calculated based on prime rate, federal funds, or an alternative rate (as defined in the Credit Agreement). The Credit Agreement also contains certain financial covenants and restrictions on our ability to assume additional debt, purchase our stock, sell subsidiaries, or acquire companies. The Credit Agreement expires on March 28, 2019. While the Credit Agreement provides an additional source of liquidity for the Company, we currently intend to rely principally on available cash and short term investments, and cash generated from operations to address our working capital needs.
We also have a credit relationship with a European bank in the amount of EUR 1.0 million (approximately $1.4 million at the June 30, 2014 exchange rate). As of June 30, 2014, there were no balances outstanding on this credit facility, but approximately EUR 0.1 million (approximately $0.2 million at the June 30, 2014 exchange rate) of the credit facility had been used for guarantees.
47
As of June 30, 2014, we had approximately $51.2 million borrowing capacity available under all of the credit facilities described above.
We do not currently invest in financial instruments designed to protect against interest rate fluctuations, although we will continue to evaluate the need to do so in the future.
We believe that our cash and cash equivalents, short-term investments, cash generated from operations and our available lines of credit are sufficient to provide our working capital needs for the foreseeable future, even if the Merger is not completed. In light of current economic conditions generally and in light of the overall performance of the stock market in recent periods, we cannot assume that funds would be available from other sources if we were required to fund significant acquisitions or any unanticipated and substantial cash needs. We currently anticipate that our property, plant and equipment expenditures for fiscal year 2015 will be approximately $90 million, including approximately $59.5 million of U.S. cash we used to purchase our worldwide Corporate headquarters building located in Columbia, Maryland in July 2014. See Note 7, “Property, Plant and Equipment” in the Notes to Consolidated Financial Statements included in this report.
The following table provides information regarding certain financial indicators of our liquidity and capital resources:
As of June 30, | ||||||||
(in thousands, except ratios) | 2014 | 2013 | ||||||
Cash and cash equivalents and short-term investments | $ | 699,808 | $ | 634,069 | ||||
Available credit facilities | $ | 51,369 | $ | 51,301 | ||||
Outstanding credit facilities | — | (1,757 | ) | |||||
Outstanding guarantees | (169 | ) | (1,125 | ) | ||||
Unused credit facilities | $ | 51,200 | $ | 48,419 | ||||
Working capital (1) | $ | 645,171 | $ | 565,653 | ||||
MICROS Systems, Inc. shareholders’ equity | $ | 1,226,199 | $ | 1,115,056 | ||||
Current ratio (2) | 2.40 | 2.35 | ||||||
(1) | Current assets less current liabilities. |
(2) | Current assets divided by current liabilities. The Company does not have any long-term debt. |
Inflation
We have not experienced any significant impact as a result of inflation.
Contractual Obligations
The following table summarizes our contractual arrangements at June 30, 2014:
Payments due by period | ||||||||||||||||||||
(in thousands) | Total | Less than 1 year | 1-3 years | 3-5 years | More than 5 years | |||||||||||||||
Operating lease obligations | $ | 66,806 | $ | 25,698 | $ | 28,446 | $ | 9,720 | $ | 2,942 | ||||||||||
Pension obligations* | 6,176 | 985 | 1,519 | 1,302 | 2,370 | |||||||||||||||
Purchase obligations | 3,010 | 2,545 | 465 | — | — | |||||||||||||||
Capital lease obligations | 88 | 26 | 42 | 20 | — | |||||||||||||||
Total | $ | 76,080 | $ | 29,254 | $ | 30,472 | $ | 11,042 | $ | 5,312 | ||||||||||
* Includes obligations under our Supplemental Executive Retirement Plan and a plan that we sponsor related to our acquisition of Torex. See Note 17, “Employee Benefit Plans” in the Notes to Consolidated Financial Statements.
Due to the uncertainty with respect to the timing of future cash flows associated with our unrecognized income tax benefits at June 30, 2014, we are unable to reasonably estimate settlements with taxing authorities. The above contractual obligations table therefore does not reflect unrecognized income tax benefits of approximately $45.4 million. See Note 15 “Income Taxes” in the Notes to Consolidated Financial Statements included in this report.
48
FORWARD-LOOKING STATEMENTS
The preceding management’s discussion and analysis of financial condition and results of operations should be read in conjunction with the consolidated financial statements and the related notes and other financial information included elsewhere in this Annual Report on Form 10-K. Certain statements contained in this Annual Report on Form 10-K that are not historical facts are forward looking statements within the meaning of Section 27A of the Securities Act of 1933, as amended (the “Securities Act”), and Section 21E of the Securities Exchange Act of 1934, as amended (the “Exchange Act”). Our actual results may differ materially from those anticipated in these forward-looking statements.
Examples of such forward-looking statements in this Annual Report on Form 10-K include the following:
• | Item 1, “Business,” statements regarding the Merger, growth of and our efforts to further develop the OPERA suite of products; demand shift toward hosted applications; our global distribution network; our intentions to acquire rights in third party products or designs; our plans regarding product development and deployment; our expectations regarding sourcing of manufacturing capability, materials and equipment; our expectations regarding labor relations and employment, our expectations regarding interest rate and foreign exchange rate fluctuations; the appropriateness of reliance on statutory and common law protections for our intellectual property; the risks associated with third party misappropriation of our intellectual property; the anticipated effect of the U.S. Government exercising a termination for convenience under one or more contracts that we have with the U.S. Government; our belief that compliance with environmental laws and regulations will not have a material effect on expenditures, earnings, or our competitive position; and, our expectations regarding whether backlog will result in recognizable revenue, |
• | Item 1A, “Risk Factors,” regarding the anticipated or potential impact on our business, financial results, or competitive position of the various risks described in that section; |
• | Item 2, “Properties,” regarding the anticipated availability of additional space; |
• | Item 3, “Legal Proceedings,” regarding the likely effect of litigation on our results of operations or financial position; |
• | Item 5 “Market for the Registrant’s Common Equity, Related Stockholder Matters, and Issuer Purchases of Equity Securities,” regarding our intentions for use of retained earnings and our intention not to pay cash dividends; |
• | Item 7A, “Quantitative and Qualitative Disclosures about Market Risk,” regarding our exposure to interest rate risk; and |
• | Item 12, "Security Ownership of Certain Beneficial Owners and Management," regarding Changes in Control. |
Additional forward-looking statements are contained elsewhere in this report, including in the preceding Management’s Discussion and Analysis of Financial Condition and Results of Operations. Such statements include the following:
(i) | our statements about the trends in our clients’ industries generally and in various sectors within those industries; |
(ii) | our statements regarding the effects of foreign currency rate fluctuations (in particular, Euro and British Pound Sterling) on our financial performance; |
(iii) | our expectations that the clients with whom we do the largest amount of business will fluctuate from year to year, and our statements about the effects of large customer orders on our quarterly earnings, revenues, and total revenues; |
(iv) | our statements regarding the impact on financial results in future periods if we determine that the financial condition of clients has deteriorated; |
(v) | our statements regarding the impact on financial results in future periods if we misjudge the remaining economic life of a product; |
(vi) | our statements concerning the impact of changes in our business judgment, market conditions, macro-economic conditions, financial conditions of our clients, competition, business trends, and government activity on the application of our critical accounting estimates; |
(vii) | our statements concerning the fluctuations in the market price of our common stock, whether as a result of variations in our quarterly operating results or other factors; |
(viii) | our beliefs about our competitive strengths; |
(ix) | our expectations regarding effective tax rates in future periods; |
49
(x) | our expectations regarding a decrease in unrecognized tax benefits and the effect of the decrease on earnings; |
(xi) | our expectations regarding the impact or lack of impact on our financial position and results of operations of the application of recent accounting standards; |
(xii) | our expectations about the adequacy of our cash flows and our available lines of credit to meet our working capital needs, and our ability to raise additional funds if and when needed; |
(xiii) | our expectations about our capital expenditures for future periods; |
(xiv) | our expectations that our exposure to interest rate risk will not materially change in the future; |
(xv) | our expectation that we will evaluate our need to invest in instruments to protect against interest rate fluctuations and our exposure to such interest rate risk; |
(xvi) | our statements about the effects on our revenue recognition as a result of changes to a clients’ delivery requirements or a products’ completion; |
(xvii) | our statements regarding our ability to increase sales of our higher margin products; |
(xviii) | our expected costs associated with modifying our products to comply with applicable legal rules, regulations, and guidelines, including the credit card associations’ security and data protection rules. |
There are a number of important factors that could cause actual results to differ materially from those in the forward looking statements. These may include: changes in applicable laws and regulations, other activities of governments, governmental agencies, or other regulatory bodies that affect our products, services, or business operations, changes in accounting and auditing rules (and changes in the interpretations of those rules), as well as those matters described in Item 1A, “Risk Factors.”
ITEM 7A. QUANTITATIVE AND QUALITATIVE DISCLOSURES ABOUT MARKET RISK
We are exposed to interest rate risk and to foreign currency exchange rate risk. See Foreign Sales and Foreign Market Risks in Part 1 “Business,” and “Management’s Discussion and Analysis of Financial Condition and Results of Operations,” above for information regarding foreign currency exchange risks. Our committed lines of credit bear interest at a floating rate, which exposes us to interest rate risks. We manage our exposure to this risk by minimizing, to the extent feasible, overall borrowing and monitoring available financing alternatives. At June 30, 2014, we had no borrowings under our lines of credit and had not entered into any instruments to hedge the resulting exposure to interest-rate risk. Our exposure to fluctuations in interest rates may increase in the future with increases in the outstanding amount under the line of credit. As we did not have any borrowings as of June 30, 2014, a 1% change in interest rate would not have any impact on our consolidated financial position, results of operations, and cash flows. Our cash equivalents and our portfolio of marketable securities are subject to market risk due to changes in interest rates. The market value of fixed interest rate securities may be adversely affected by a rise in interest rates, while floating rate securities may produce less income than expected if interest rates fall. Assuming that our cash, cash equivalents and short term investment balances as of June 30, 2014, remained constant throughout fiscal year 2014, a 1% change in interest rates would have affected our interest income for fiscal year 2014 by approximately $7.0 million. To minimize our exposure to credit risk associated with financial instruments, we place our temporary cash investments with high-credit-quality institutions, generally with bond rating of “A” and above.
ITEM 8. FINANCIAL STATEMENTS AND SUPPLEMENTARY DATA
See the Index to Consolidated Financial Statements on page 77 of this report.
ITEM 9. | CHANGES IN AND DISAGREEMENTS WITH ACCOUNTANTS ON ACCOUNTING AND FINANCIAL DISCLOSURE |
Not applicable.
50
ITEM 9A. | CONTROLS AND PROCEDURES |
Evaluation of Disclosure Controls and Procedures
Our management, with the participation of our Chief Executive Officer and Chief Financial Officer, evaluated the effectiveness of our disclosure controls and procedures as of the end of the period covered by this report. Based on that evaluation, the Chief Executive Officer and Chief Financial Officer concluded that our disclosure controls and procedures as of the end of the period covered by this report are effective to provide reasonable assurance that the information required to be disclosed by us in reports filed under the Securities Exchange Act of 1934 is (i) recorded, processed, summarized and reported within the time periods specified in the SEC's rules and forms and (ii) accumulated and communicated to our management, including the Chief Executive Officer and Chief Financial Officer, as appropriate to allow timely decisions regarding disclosure.
Management’s Annual Report on Internal Control Over Financial Reporting
Our management’s report on internal control over financial reporting is set forth on page 78 of this annual report on Form 10-K and is incorporated by reference herein.
Change in Internal Control over Financial Reporting
No change in our internal control over financial reporting occurred during our most recent fiscal quarter that has materially affected, or is reasonably likely to materially affect, our internal control over financial reporting.
ITEM 9B. OTHER INFORMATION
The Company's executive officers' bonus information for fiscal year 2014, as approved by the Company's Compensation Committee on August 19, 2014, is being provided in this Form 10-K under Item 10, "Executive Compensation". We previously disclosed in the Schedule 14D-9, Amendment No. 4 filed with the Securities and Exchange Commission on July 23, 2014, that this information, when determined, would be disclosed in a current report on Form 8-K.
PART III
ITEM 10. | DIRECTORS, EXECUTIVE OFFICERS, AND CORPORATE GOVERNANCE |
See Part I, Item 1 "Business - Executive Officers of the Registrant" for information regarding the Company’s Executive Officers.
BOARD OF DIRECTORS OF MICROS SYSTEMS, INC.
Directors are elected by the stockholders at each annual meeting to serve until the next annual meeting and until their successors are elected and qualified. Any vacancy may be filled for the unexpired portion of the term by majority vote of the remaining directors. Currently, the Board of Directors has seven members. Certain biographical information regarding the current directors is set forth below.
Directors | Director Since | Positions Currently Held |
A. L. Giannopoulos | 1992 | Chairman |
Peter A. Altabef | 2013 | President and Chief Executive Officer, Director |
Louis M. Brown, Jr. | 1977 | Director |
B. Gary Dando | 2003 | Director |
F. Suzanne Jenniches | 2008 | Director |
John G. Puente | 1996 | Director |
Dwight S. Taylor | 1997 | Director |
51
A. L. Giannopoulos, 74, has been the Company’s Chairman of the Board since April 2001 and a director of the Company since March 1992. Mr. Giannopoulos was the Company’s President and Chief Executive Officer from May 1993 to December 2012. Mr. Giannopoulos retired as an employee of MICROS effective June 30, 2013. Before joining MICROS in 1992, Mr. Giannopoulos served in a variety of positions for Westinghouse, most recently as General Manager of the Westinghouse Information and Security Systems Divisions. Mr. Giannopoulos is a graduate of Lamar University with a Bachelor of Science degree in Electrical Engineering.
Peter A. Altabef, See Part I, Item 1 "Business - Executive Officers of the Registrant" for biographical information regarding Mr. Altabef.
Louis M. Brown, Jr., 71, has been a director of the Company since 1977. Mr. Brown held the position of President and Chief Executive Officer of the Company from January 1986 until his appointment as Chairman of the Board in January 1987. Mr. Brown served as Chairman of the Board until April 2001. Mr. Brown currently also serves as Chairman of Precision Auto Care, Inc., and as President and a director of IDEAS, Inc., a company he founded in 1970 to develop, implement, and support complex information and telecommunication systems. Mr. Brown is a graduate of the Johns Hopkins University (B.E.S.-E.E.).
B. Gary Dando, 72, has been a director of the Company since November 2003. Mr. Dando worked for Ernst & Young LLP for 37 years, the last 25 of which as a partner, until his retirement in June 2001. Additionally, Mr. Dando is currently a member of the Board of Trustees, University System of Maryland Foundation, Inc., where he serves as Treasurer, and from July 2001 to June 2007 was a member of the Board of Trustees of the University of Maryland College Park Foundation, where he was a member of the Budget and Audit Committee. Mr. Dando is a graduate of the University of Maryland, with a Bachelor of Science degree in Accounting.
F. Suzanne Jenniches, 66, was, before her retirement in 2010, Vice President and General Manager of Northrop Grumman Corporation’s Government Systems Division in Linthicum, Maryland. The Division designs and develops advanced electro-mechanical and networking systems for both government and commercial applications and includes the businesses for Postal Automation Systems; International Air Defense and Command and Control Infrastructure Systems; and Homeland Defense. Ms. Jenniches is past president of the National Society of Women Engineers and served as a Member of the United States Army Science Board from 1999 to 2005. Ms. Jenniches is a graduate of Clarion College and holds a Masters degree in Environmental Engineering from the Johns Hopkins University. Ms. Jenniches previously served on the MICROS Board of Directors from October 1996 to November 2003.
John G. Puente, 84, has been a director of the Company since May 1996. Previously, Mr. Puente served as Chairman of Telogy Networks, Inc., Chairman and Chief Executive Officer of Orion Network Systems, and Vice Chairman of M/A-Com. In June 2010, Mr. Puente retired from his position as Chairman of the Board of Trustees for Capitol College, a position he held for thirty years. Mr. Puente was also a founder and Chairman of Digital Communications Corporation (now Hughes Network Systems) and SouthernNet. Mr. Puente is a graduate of Polytechnic Institute of New York, and holds a Masters degree from Stevens Institute of Technology.
Dwight S. Taylor, 69, has been a director of the Company since 1997. Mr. Taylor currently also serves on the Board of Trustees of the Baltimore Polytechnic Institute Foundation, Teach for America-Baltimore, the Y of Central Maryland and Lincoln University, and is a member of the Board of Directors of T. Rowe Price Group, Inc. (where he serves on the Audit Committee and is Chairman of the Compensation Committee). From 1999 until April 2009, Mr. Taylor had served as President of COPT Development & Construction Services, LLC, a subsidiary of Corporate Offices Properties Trust, a publicly held real estate investment trust. From 1984 to 1998, Mr. Taylor was employed by Constellation Real Estate, Inc. as Senior Vice President. Mr. Taylor is also past President of the Maryland Chapter of the National Association of Industrial and Office Properties (“NAIOP”), and is a member of the NAIOP National Board. Mr. Taylor is a graduate of Lincoln University with a Bachelor of Arts degree in Economics.
SECTION 16(a) BENEFICIAL OWNERSHIP REPORTING COMPLIANCE
Section 16(a) of the Securities Exchange Act of 1934 requires the Company’s executive officers and directors, and persons who own more than 10% of the Company’s common stock, to file reports of ownership and changes in ownership with the SEC. To our knowledge, based on information provided to us, our officers and directors (we are not aware of any person that owns more than 10% of our common stock), satisfied applicable filing requirements during fiscal year 2014.
52
CORPORATE GOVERNANCE
Corporate Governance Guidelines and Other Corporate Governance Documents
Our Corporate Governance Guidelines, including board membership criteria and guidelines for board meetings, board committees, succession planning, and other matters, are available at www.micros.com/companyinformation/investorrelations/corporategovernance. Also available at that web address are the charters of the Audit Committee and the Compensation and Nominating Committee, as well as our Code of Ethics and Business Practices.
Board Meetings and Director Attendance
During the fiscal year ended June 30, 2014, the Board held ten meetings. Each of our current directors attended all of the meetings of the Board and committees of the Board of which he or she was a member.
Audit Committee
The Audit Committee of the Board of Directors is comprised of Mr. Dando, who is the Audit Committee Chairman, Mr. Puente, and Ms. Jenniches. The Board of Directors has determined that Mr. Dando is an “audit committee financial expert,” as that term is defined in SEC regulations. The Audit Committee met four times during the fiscal year ended June 30, 2014. The Audit Committee selects the firm to be engaged as our independent registered public accounting firm, and reviews and approves the engagement of the firm to perform permissible non-audit services. The Chairman of the Audit Committee may act on behalf of the Audit Committee to approve the engagement of the firm to perform such non-audit services, in which case the Chairman’s determination will be presented to the full Audit Committee at its next scheduled meeting.
In addition, the Audit Committee is responsible for overseeing our accounting and financial reporting process and the audits of our consolidated financial statements. In this regard, the Audit Committee reviews our SEC filings, and reviews with management and the independent auditors any significant financial reporting issues and practices affecting MICROS. In addition, the Audit Committee: (i) addresses with the independent auditors and financial management the scope of the audit; (ii) discusses with the independent auditors any audit problems or difficulties; (iii) reviews with the independent auditors their independence; (iv) reviews with the independent auditors significant financial reporting issues and practices affecting the Company; (v) assesses steps management has taken to minimize significant risks and exposures; (vi) reviews with the independent auditors and our accounting personnel the adequacy and effectiveness of our internal controls; (vii) reviews the adequacy of our internal audit function, and (viii) reviews, if appropriate, with the Company’s counsel the Company’s compliance with applicable laws and regulations. The Audit Committee has a charter, which is available at the website address provided above.
Compensation and Nominating Committee
The Compensation and Nominating Committee of the Board of Directors is comprised of Mr. Puente, who is the Compensation and Nominating Committee Chairman, and Mr. Taylor and Ms. Jenniches. The Compensation and Nominating Committee met four times during the fiscal year ended June 30, 2014. The Compensation and Nominating Committee reviews and approves annual salary, bonuses, and stock option grants for our senior executive officers. Among other things, it establishes the performance objectives for our executive officers and evaluates the performance of our President and Chief Executive Officer and, in conjunction with its consideration of our President and Chief Executive Officer’s recommendations, other executive officers. Additionally, the Compensation and Nominating Committee is responsible for evaluating potential directors and recommending nominees for election as Board members, periodically assessing the adequacy of our Corporate Governance Guidelines, and overseeing the evaluation of the Board and Board Committees. The Compensation and Nominating Committee has a charter that is available at the website address listed above.
Our Corporate Governance Guidelines provide that the Compensation and Nominating Committee is responsible for recommending to the Board the appropriate background, skills and attributes of Board members, so that the Board as a whole collectively possesses a broad range of skills, expertise, industry and other knowledge, and business and other experience useful to the effective oversight of the Company’s business. In making such a recommendation, the Compensation and Nominating Committee considers the Board culture, prominence, diversity, age and other factors deemed relevant. With respect to diversity, the Compensation and Nominating Committee endeavors to have a Board of Directors reflecting a range of backgrounds, experience, and other qualities relevant to our business operations. In this regard, the Compensation and Nominating Committee will consider each candidate’s professional experience, education, skills, and other attributes. The Compensation and Nominating Committee will also consider recommendations for director candidates from stockholders. Stockholder recommendations of candidates should be submitted in writing to: MICROS Systems, Inc., 7031 Columbia Gateway Drive, Columbia, Maryland 21046-2289, Attention: Corporate Secretary. To enable consideration of a candidate, a stockholder must have submitted the following information: (i) the name of the candidate and information about the candidate
53
that would be required to be included in a proxy statement under the rules of the SEC; (ii) information about the relationship between the candidate and the recommending stockholder; (iii) the consent of the candidate to serve as a director; and (iv) proof of the number of shares of Company common stock that the recommending stockholder owns and the length of time the shares have been owned. In considering any candidate proposed by a stockholder, the Compensation and Nominating Committee will reach its conclusion based on the same criteria as are applied to other candidates. The Compensation and Nominating Committee may seek additional information regarding the candidate, and will notify the stockholder proponent once it has made a determination.
During fiscal year 2014, management engaged Mercer ("Mercer") principally to provide guidance on board compensation, long term equity plans for the Company, and executive compensation, including an assessment of our change of control and severance programs and advice regarding our Executive Severance Plan, which was adopted in May 2014 and is described under "Executive Compensation - Compensation Discussion and Analysis”. Mercer was hired by our management, but its recommendations were considered by our Compensation and Nominating Committee in recommending adoption of the Executive Severance Plan by our Board of Directors. Aside from its advice regarding our change of control and severance programs, and the Executive Severance Plan, our fiscal year 2014 executive compensation was not influenced by Mercer’s activities. Mercer did not provide any services to us other than described above.
Correspondence to the Board
Stockholders may send correspondence to the Board of Directors or to any individual director at the following address: MICROS Systems, Inc., 7031 Columbia Gateway Drive, Columbia, Maryland 21046, Attention: Corporate Secretary. The communication should indicate that the sender is a stockholder. The Corporate Secretary will review and log all communications. Based on procedures approved by the Board of Directors, the Corporate Secretary will retain and not send to directors any communications that are purely promotional or commercial in nature, or that address topics that clearly are unrelated to Board of Director responsibilities. All other communications will be delivered to the appropriate directors.
Board Leadership Structure and Risk Oversight
Currently, Mr. Giannopoulos serves as our Chairman of the Board and Mr. Altabef serves as our President and Chief Executive Officer. Prior to Mr. Altabef's commencement of service as our President and Chief Executive Officer, Mr. Giannopoulos served both as our Chairman and as our President and Chief Executive Officer for more than 10 years. We believe that Mr. Giannopoulos' long and successful experience with MICROS, which provided him with extensive knowledge regarding our Company’s operations and institutional history, makes it appropriate for him to continue to serve as our Chairman. However, the Board may determine to once again have the same person serve both as Chairman of the Board and Chief Executive Officer in the future.
In addition, the following corporate governance practices enhance the Board’s independent oversight: (i) a majority (five of seven) of our directors are independent; (ii) all of the members of our Audit Committee and our Compensation and Nominating Committee are independent directors; and (iii) the Board meets at regularly scheduled executive sessions outside the presence of management.
Our senior management team is responsible for assessing and managing our exposure to risk on a day-to-day basis. In fulfilling this responsibility, senior management has established several risk management programs, policies, and limits on exercise of authority. The Board of Directors is responsible for overseeing management in the execution of its responsibilities and for assessing our approach to risk management. The Board of Directors addresses risk management matters periodically during its scheduled meetings. In addition, the Audit Committee is responsible for oversight of, among other things, our various accounting and reporting controls and procedures, and the Compensation and Nominating Committee is responsible for oversight of compensation practices and policies, including risk assessments with regard to incentive programs.
Code of Ethics and Business Practices
We have a Code of Ethics and Business Practices which applies to all directors, officers, and U.S.-based employees (foreign employees are subject to similar codes that have some variations designed to address local law). Among other things, the Code of Ethics and Business Practices is designed to deter wrongdoing and to promote honest and ethical conduct, including the ethical handling of actual or apparent conflicts of interest between personal and professional relationships; to promote full, fair, accurate, timely, and understandable disclosure in periodic reports we are required to file; and to promote compliance with applicable governmental laws, rules and regulations. The Code of Ethics and Business Practices, which is available at the website address listed above, provides for the prompt internal reporting of violations of the Code to an appropriate person identified in the Code and contains provisions regarding accountability for adherence to the Code.
54
Insider Trading Guidelines
The Company maintains “Insider Trading and Confidentiality Policies” which, among other things, prohibit any named executive officer from buying or selling any of our securities without obtaining prior written approval from our Compliance Officer. This policy seeks to assure that the named executive officers will not trade in our securities at a time when they are in possession of material non-public information. Additionally, the Board of Directors and our named executive officers are prohibited from hedging their ownership of MICROS stock, including trading in publicly-traded options, puts, calls, or other derivative instruments related to MICROS stock.
MICROS Stock Ownership Goal for Directors and Chief Executive Officer
To encourage stock ownership by our directors and Chief Executive Officer so as to further align their interests with the interests of MICROS’ stockholders, the Board of Directors had established the following ownership goals: (i) each director must own shares of MICROS stock within three years after joining the Board valued at three times his or her annual base retainer fee; and (ii) Mr. Altabef, as Chief Executive Officer, must own shares of MICROS stock with a value equal to his annual base pay; this goal was to be applied to Mr. Altabef following a phase-in period of five years after the commencement of his employment.
As of June 30, 2014, and based on the average share price of MICROS stock during the 2014 fiscal year, each director (other than Mr. Altabef, who is subject to the five-year phase in period) owned sufficient shares to comply with his or her goal. While Mr. Giannopoulos does not own any Shares, he receives no retainer fee for his service on the Board, and he holds 690,000 options to purchase Shares. The Compensation and Nominating Committee annually reassesses share ownership to determine whether all of the directors and the Chief Executive Officer satisfy the stock ownership goals based on the average share price in the immediately preceding fiscal year. If an individual does not meet his or her goal on the measurement date each year, a phased plan will be implemented, designed to enable the individual to satisfy the ownership goal based on his or her retainer fee (or base salary) and the then current stock price. Additionally, as was the case for Mr. Altabef, multi-year phase-in guidelines may be used for any newly-elected directors or a newly-appointed Chief Executive Officer.
AUDIT COMMITTEE REPORT
Management is responsible for the Company’s financial statements and the financial reporting process, including the Company’s internal control over financial reporting. PricewaterhouseCoopers LLP, the Company’s independent registered public accounting firm, is responsible for performing an independent audit of the Company’s consolidated financial statements and internal control over financial reporting in accordance with the standards of the Public Company Accounting Oversight Board and for issuing a report thereon. The Audit Committee’s responsibility is to monitor and oversee these processes.
Accordingly, the Audit Committee has reviewed and discussed with management and with PricewaterhouseCoopers LLP the audited consolidated financial statements for the fiscal year ended June 30, 2014. The Audit Committee has also discussed with the Company’s internal auditors and with PricewaterhouseCoopers LLP the overall scope of and plans for their respective audits.
The Audit Committee has met with the internal auditors and with PricewaterhouseCoopers LLP, separately and together, with and without management present, to discuss the Company’s financial reporting process and internal accounting controls in addition to the other matters required to be discussed by the Public Company Accounting Oversight Board Standards, AU Section 380, “Communication with Audit Committees.”
The Audit Committee has received the written disclosures and the letter from PricewaterhouseCoopers LLP required by applicable requirements of the Public Company Accounting Oversight Board regarding PricewaterhouseCoopers LLP’s communications with the Audit Committee concerning independence, and has discussed with PricewaterhouseCoopers LLP that firm's independence.
Based upon the review and discussions referred to above, the Audit Committee recommended to the Board of Directors that the Company’s audited consolidated financial statements for the fiscal year ended June 30, 2014, be included in the Company’s Annual Report on Form 10-K, for filing with the Securities and Exchange Commission.
B. GARY DANDO (Chairman)
JOHN G. PUENTE and F. SUZANNE JENNICHES
Members of the Audit Committee
55
ITEM 11. | EXECUTIVE COMPENSATION |
EXECUTIVE COMPENSATION
COMPENSATION DISCUSSION AND ANALYSIS
In this Compensation Discussion and Analysis, we discuss the compensation provided to our principal executive officer, our principal financial officer, and our three other most highly compensated executive officers. We refer to these officers as our “named executive officers.”
Introduction
Our compensation programs are designed to fairly compensate our executive officers and enable us to attract and retain highly qualified managers. The Compensation and Nominating Committee determines the compensation to be paid to our executive officers, and its determination is based to a large extent on its evaluation of the individual performance of our executive officers, the financial results achieved by the business units that they manage, and our overall financial results for the period. In most respects, the process used by the Compensation and Nominating Committee is qualitative rather than quantitative. Except with regard to certain elements of our annual incentive bonus payout, the Compensation and Nominating Committee does not use quantitative measures in determining compensation levels. In addition, we subscribe to various compensation surveys (including Business and Legal Reports, and various online resources, such as Salary.com and the Department of Labor Bureau of Labor Statistics) and from time to time we consider other publicly available compensation information such as the proxy statements of other publicly-traded companies. However, these surveys are used only as a point of reference by the Compensation and Nominating Committee. In making its compensation determinations, the Compensation and Nominating Committee does not benchmark the executive compensation of other companies’ executives.
During fiscal year 2014, management engaged Mercer principally to provide guidance on board compensation, long term equity plans for the Company, and executive compensation, including an assessment of our change of control and severance programs and advice regarding our Executive Severance Plan, which was adopted in May 2014 and is described below in this Compensation Discussion and Analysis, under “Executive Compensation - Retirement and Other Post-Employment Plans and Agreements - Executive Severance Plan” and also described under “Executive Compensation - Potential Payments upon Termination- Executive Severance Plan”. Mercer was hired by our management, but its recommendations were considered by our Compensation and Nominating Committee in recommending adoption of the Executive Severance Plan by our Board of Directors. Aside from its advice regarding our change of control and severance programs, and the Executive Severance Plan, our fiscal year 2014 executive compensation was not influenced by Mercer’s activities.
Fiscal Year 2014 Compensation
As described below, the principal elements of fiscal year 2014 compensation for our named executive officers were base salary, bonus, and long-term incentives in the form of stock options.
Base Salary
We determine salary increases for our executive officers, including our named executive officers, based on three discrete objectives: rewarding individual performance, protecting against inflation, and retaining our executive officers. Accordingly, the Compensation and Nominating Committee considers overall corporate performance and, for those executives with management responsibility for particular business units, the financial results for those business units. The Compensation and Nominating Committee also generally considers the impact of increases in the cost of living. The Compensation and Nominating Committee does not use a mathematical formula to determine increases, but makes a qualitative assessment in consultation with Mr. Altabef, our President and Chief Executive Officer (other than with respect to increases for Mr. Altabef).
56
For fiscal year 2014, the Compensation and Nominating Committee authorized the following salary increases:
Name | Salary Increase (%) | Fiscal Year 2014 Annual Base Salary ($) |
Peter A. Altabef | 4.0 | 988,000 |
Kaweh Niroomand (1) | 4.0 | 1,009,249 |
Thomas L. Patz | 4.0 | 901,801 |
Stefan Piringer (1)(2) | 4.0 | 787,366 |
Cynthia A. Russo | 9.0 | 397,666 |
(1) | Mr. Niroomand’s salary is denominated and paid in Euros and Mr. Piringer’s salary is denominated and paid 90% in Singapore Dollars and 10% Thai Baht. For purposes of this table, the salary amounts were converted to U.S. dollars using 12-month average exchange rates for the respective currencies during fiscal year 2014. |
(2) | Mr. Piringer retired from the Company effective June 30, 2014. |
Bonus
The objective of our incentive bonus program is to provide additional motivation to the named executive officers to improve performance on a company-wide or business-unit-wide basis, as appropriate, thereby enhancing the prospects for increased stockholder return.
The Compensation and Nominating Committee establishes target bonuses for each of the named executive officers, based on the named executive officer’s position and responsibilities. For fiscal year 2014, the target bonuses were set at amounts equal to 100% of the base salary for each of the named executive officers.
As described more fully below, the amount of a named executive officer’s annual incentive bonus (sometimes referred to below as a “formula bonus”) for fiscal year 2014 is based on the Company’s (and, in some cases, a region’s) performance in fiscal year 2014 with respect to revenues and pre-tax income, adjusted to eliminate the effect of certain items (see below for further detail). We selected revenues as a performance measure for our incentive bonuses because we believe revenue growth is a principal indicator of our ability to compete effectively, increase market share, and realize economies of scale that can enhance margins. We selected pre-tax income, adjusted, as the other performance measure because we believe that it provides a fundamental, “bottom line” indication of executive performance. We use pre-tax income, rather than after-tax income, because tax rate fluctuations often are related to factors that are out of control of management, and we believe that bonus awards should not be affected positively or negatively by these fluctuations.
In computing the bonus payout amounts for named executive officers with company-wide responsibilities (i.e., Messrs. Altabef and Patz, and Ms. Russo), we compute a “Corporate Success Ratio Percentage,” which is the average of (A) the Company’s actual revenue for the fiscal year as a percentage of the target revenue for the fiscal year (the “Corporate Revenue Factor Ratio”), and (B) the Company’s pre-tax income, adjusted to eliminate the effect of stock-based compensation expense, amortization of intangibles of Torex (which was acquired by us in May 2012), charges related to the restructuring of Torex, a litigation charge related to a previously reported adverse judgment, a gain on the sale of auction rate securities and the costs related to the transaction contemplated by the Merger Agreement for the fiscal year as a percentage of the target pre-tax income, as adjusted, for the fiscal year (the “Corporate Income Factor Ratio”).
If the Corporate Success Ratio Percentage is equal to or greater than 100%, then the bonus for each executive will equal the Corporate Success Ratio Percentage multiplied by the stated fiscal year 2014 target bonus for each executive, subject to the limitation discussed below under “Cap on Annual Bonus.” If the Corporate Success Ratio Percentage is greater than or equal to 95%, but less than 100%, the bonus will be calculated according to the following formula: (100%-5 X (100%-Corporate Success Ratio Percentage)) X the target bonus. If the Corporate Success Ratio Percentage is less than 95%, then the executive will not receive a formula bonus. In other words, the minimum payout (if the Corporate Success Ratio Percentage is 95%) is 75% of the target bonus. However, if either the Corporate Revenue Factor Ratio or the Corporate Income Factor Ratio is less than 90%, or the Corporate Success Ratio Percentage is less than 95%, then the executive will not receive a formula bonus.
For each named executive officer with regional responsibilities (i.e., Messrs. Niroomand and Piringer) the bonus payout amount is calculated similarly but in a manner that includes consideration of each executive’s respective region’s performance. The formula bonus for such executives is calculated as 75% based on a Business Unit Target Formula, and 25% based on a Corporate Target Formula.
57
The Corporate Target Formula for executives with regional responsibilities is computed in a similar manner to the formula used for named executive officers with company-wide responsibilities described above; the resulting bonus will equal the Corporate Success Ratio Percentage multiplied by 25% of the executive’s target bonus amount. For the Business Unit Target Formula, we compute a “Business Unit Success Ratio Percentage,” which is the average of (A) the applicable region’s revenue for the fiscal year as a percentage of the region’s target revenue for the fiscal year (the “Business Unit Revenue Factor Ratio”), and (B) the applicable region’s pre-tax income for the fiscal year, adjusted to eliminate the effect of stock-based compensation expense, amortization of intangibles of Torex, charges related to the restructuring of Torex, as a percentage of the target pre-tax income, as adjusted, for the fiscal year (the “Business Unit Income Factor Ratio”). If the Business Unit Success Ratio Percentage is greater than or equal to 100%, then the bonus for the executive will equal the Business Unit Success Ratio Percentage multiplied by 75% of the target bonus for the executive. If the Business Unit Success Ratio Percentage is greater than or equal to 95%, but less than 100%, the bonus will be calculated according to the following formula: (100%-5 X (100%-Business Unit Success Ratio)) X 75% of the target bonus. If the Business Unit Success Ratio Percentage or the Corporate Success Ratio Percentage is less than 95%, then the executive will not receive a formula bonus with respect to the Business Unit Target Formula. Additionally, if either the Business Unit Revenue Factor Ratio or the Business Unit Income Factor Ratio is less than 90%, then the executive will not receive a formula bonus with respect to the Business Unit Target Formula, although the executive may receive the formula bonus with respect to the Corporate Target Formula, provided that the condition to payment with respect to the Corporate Success Ratio Percentage is otherwise satisfied.
In addition to the bonus payable on account of the Corporate Target Formula as described in the paragraph immediately above, both categories of executive are also eligible to receive an additional bonus called the “Extraordinary Corporate Performance” bonus if the Corporate Success Ratio Percentage exceeds 100% (but not if the Corporate Success Ratio Percentage is at or below 100%). In that event, the Extraordinary Corporate Performance bonus for each recipient will be determined, subject to the additional requirement for executives with regional responsibilities, based on the extent to which the Corporate Income Factor Ratio exceeds 100%, with a maximum payment equal to 100% of the formula bonus to be provided if the Corporate Income Factor Ratio equals or exceeds 105%. For example (and disregarding the additional requirement for those executives with primarily regional responsibilities) (1) if the Corporate Income Factor Ratio equals 103%, the recipient will receive an Extraordinary Corporate Performance Bonus equal to 60% of his or her target bonus, and (2) if the Corporate Income Factor Ratio equals 105%, recipient will receive an Extraordinary Corporate Performance Bonus equal to 100% of his or her target bonus. The Extraordinary Corporate Performance bonus cannot exceed the formula bonus calculated as described in the preceding paragraph, and will not be paid if the Corporate Revenue Factor Ratio is less than 100%. In addition, for those executives with regional responsibilities, if their Business Unit Success Ratio percentage is less than 95%, the Extraordinary Corporate Performance bonus will be paid at 50% of the amount otherwise payable as an Extraordinary Corporate Performance bonus. The Extraordinary Corporate Performance bonus is subject to the limitation set forth below under “Cap on Annual Bonus.”
For fiscal year 2014, our target revenue for the Company was $1.31 billion, and our target pre-tax income, as adjusted, was $280.0 million. For the EAME region (applicable to Mr. Niroomand), our target business unit revenue and pre-tax income, as adjusted, was $503.5 million and $92.5 million, respectively (converted to U.S. dollar at certain predetermined exchange rates reflecting the compilation of multiple currencies in the region). For the Asia-Pacific region (applicable to Mr. Piringer), our target business unit revenue was $175.7 million, and our target business unit pre-tax income, as adjusted, was $46.4 million.
In fiscal year 2014, our actual revenue for the Company was 107.3% of budgeted revenue and our actual pre-tax income, as adjusted, was 104.9% of budgeted pre-tax income, as adjusted, resulting in the Corporate Success Ratio Percentage of 106.1%. Accordingly the incentive bonuses for Messrs. Altabef and Patz and Ms. Russo equaled 106.1% of their respective target bonuses. For the EAME business unit, our actual revenue and pre-tax income, as adjusted, were 101.3% and 110.4% of budgeted revenue and budgeted pre-tax income, as adjusted, resulting in EAME Business Unit Success Ratio Percentage of 105.9%. Accordingly, the incentive bonus for Mr. Niroomand equaled 105.9% of his Business Unit target bonus and 106.1% of Corporate target bonus. For the Asia-Pacific business unit, our actual revenue and pre-tax income, as adjusted, were 92.7% and 100.2% of budgeted revenue and budgeted pre-tax income, as adjusted, resulting in Asia-Pacific Business Unit Success Ratio Percentage of 96.4%. Accordingly, the incentive bonus for Mr. Piringer equaled 96.4% of his Business Unit target bonus and 106.1% of Corporate target bonus.
In addition to the bonus payable on account of the Target Formula as described in the paragraph immediately above, both categories of executive were also eligible to receive the Extraordinary Corporate Performance bonus of 97.7% of his or her target bonus.
In addition to the formula bonuses described above, we sometimes have awarded discretionary bonuses to the named executive officers. We believe a discretionary bonus under certain circumstances may be appropriate, especially given the strict nature of the formula bonus methodology, under which no bonus is payable if the indicated minimums are not achieved, even if the shortfall is insignificant. The amounts of the discretionary bonuses may be based on or take account of the target bonus, the
58
shortfall relative to financial metric targets used under the formula bonus, or a variety of other measures, including currency fluctuations, corporate gross margins, operating expenses as a percentage of total sales, cash generation and balance sheet measures, such as cash, debt, and days sales outstanding. For fiscal year 2014, no discretionary bonuses were awarded to the named executive officers.
The following table provides information regarding our bonus awards in fiscal 2014:
Name | Target Bonus Based on Budgeted Measures ($) | Target Bonus as a percentage of Salary (%) | Annual Incentive Plan Bonus Awarded ($) | Discretionary Bonus Awarded ($) | Total Bonus ($) | ||||||||
Peter A. Altabef | $ | 988,000 | 100.00 | $ | 2,013,548 | $ | 0 | $ | 2,013,548 | ||||
Kaweh Niroomand (1) | 1,009,249 | 100.00 | 2,055,345 | 0 | 2,055,345 | ||||||||
Thomas L. Patz | 901,801 | 100.00 | 1,837,874 | 0 | 1,837,874 | ||||||||
Stefan Piringer (1)(2) | 787,366 | 100.00 | 1,462,413 | 0 | 1,462,413 | ||||||||
Cynthia A. Russo | 397,666 | 100.00 | 810,445 | 0 | 810,445 | ||||||||
(1) | Messrs. Niroomand’s and Piringer's bonuses are denominated and paid in Euros and Singapore Dollars, respectively. For purposes of this table, the bonus amounts were converted to U.S. dollars using 12-month average exchange rates for the respective currencies during fiscal year 2014. |
(2) | Mr. Piringer retired from the Company effective June 30, 2014. |
Cap on Annual Bonus
The Compensation and Nominating Committee has a policy providing that no executive officer will receive bonuses in any fiscal year that, in the aggregate, exceed 250% of his or her base salary.
Stock Options
The principal objective of our stock option grants is to align the interests of our executives and our stockholders. We believe that stock options are directly linked to stockholder value, since the value of stock options is dependent on increases in the market price of our stock. In addition, our stock option awards are designed to serve as an incentive for continued employment, since they typically vest over a period of three years.
The Compensation and Nominating Committee’s grant of stock options in fiscal year 2014 was not based on objective or mathematical criteria. Mr. Altabef recommended to the Committee the number of shares underlying stock options to be granted to our employees, including the named executive officers. He recommended that the named executive officers with company-wide authority throughout the fiscal year, namely Mr. Patz and Ms. Russo, be granted options to purchase 120,000 shares and 90,000 shares, respectively; he further recommended that Messrs. Niroomand and Piringer be granted options to purchase 110,000 shares and 100,000 shares, respectively. The principal factors underlying the recommendations included our overall financial performance, the responsibilities and performance of each named executive officer, and an evaluation of the strategic assignments on which the named executive officer actively works. The factors were not weighted, and the number of shares underlying granted options was not based on any arithmetic formula. For fiscal year 2014, the Compensation and Nominating Committee approved the recommendations made by Mr. Altabef, and further authorized the grant to Mr. Altabef of options to purchase 140,000 shares. In all cases, the exercise price per share of options granted to our named executive officers was equal to the closing price of a share of our common stock on the NASDAQ Stock Market on the date of grant.
The number of shares underlying stock options granted to the named executive officers are set forth below in the Grants of Plan Based Awards table under the column heading, “All Other Option Awards: Number of Securities Underlying Options.” For additional information regarding stock option terms, see the narrative accompanying the Grants of Plan Based Awards table.
Other
We do not provide perquisites or personal benefits to the named executive officers other than standard health benefits available to all employees. For example, we do not offer to the named executive officers any reimbursement for financial services, air travel (other than reimbursement for business travel), car allowance, or country club memberships.
Stock Option Grant Practices
While the Compensation and Nominating Committee generally makes decisions regarding the grant of options throughout the year, it limits the effective dates of any grant to the next succeeding “authorized grant date.” There are five authorized grant dates each year: (i) the day of the annual meeting of stockholders; (ii) the third business day after the public release of the quarterly earnings for the quarter ending December 31; (iii) the third business day after the public release of the quarterly earnings for the quarter ending March 31; (iv) the third business day after the public release of the annual earnings for the fiscal
59
year ending June 30; and (v) the third business day after the public release of the quarterly earnings for the quarter ending September 30. We believe that our stock option grant practices are appropriate and eliminate questions regarding “timing” of grants in anticipation of material events.
Retirement and Other Post-Employment Plans and Agreements
We provide retirement benefits to our named executive officers, other than Messrs. Niroomand and Piringer, under our 401(k) Retirement Plan. As required under applicable law, we contribute to the Central Provident Fund of Singapore on behalf of Mr. Piringer; the Central Provident Fund is a social security savings plan operated and managed by the government of Singapore, to which the employers of Singapore-based employees are required to contribute. Some of the named executive officers also have provisions in their employment agreements that provide severance benefits upon certain types of employment termination events. In addition, all of the executive officers listed above who do not have employment agreements participate in our Executive Severance Plan. See “Potential Payments Upon Termination” below for additional information. These plans and agreements have been designed to be a part of a competitive compensation package.
The MICROS Systems Inc. 401(k) Retirement Plan
This plan is a tax-qualified defined contribution plan available to all of our U.S.-based employees. All of the named executive officers other than Messrs. Niroomand and Piringer may participate in this plan. Under the plan, an employee may contribute up to a maximum of 100% of his or her eligible compensation on a pre-tax basis, subject to Internal Revenue Code limitations (which, among other things, limited annual contributions in 2014 to $17,500 for employees under age 50, and $23,000 for employees age 50 and over). The plan does not permit after-tax contributions. We provide matching contributions targeted at 50% of the first 5% of eligible compensation contributed by the employee. Amounts credited to an employee’s account in the plan may be invested among a number of funds. MICROS Systems, Inc. common stock is not currently offered as an investment. A participant’s account is adjusted to reflect the rate of return, positive or negative, of the investment.
Change in Control and Severance Provisions in Employment Agreements with Messrs. Altabef and Patz
Our employment agreements with Messrs. Altabef and Patz provide for payments upon termination from MICROS other than for “good cause”. Additionally, the employment agreements with Messrs. Altabef and Patz each provide for payments upon termination following a “change in control” in the event their employment terminates. We included the change-in-control payment provisions to provide some financial security to the executives, which we believe should enhance management stability during a period where there may be uncertainty associated with a change in control. These change-in-control arrangements also are designed to assure that the covered executives consider fully and support, if appropriate, any proposed corporate transaction involving a change in control that may be in the best interests of our stockholders. The termination payment provisions also provide clear statements of the rights of the executive officers, and protect against a change in employment and other terms that would be unfavorable to the executive officer.
Executive Severance Plan
In May 2014, we adopted the Executive Severance Plan, in which Ms. Russo and Mr. Niroomand participate. We adopted the change in control provisions of the Executive Severance Plan for the same reasons as described above with respect to our inclusion of change of control and severance provisions in Messrs. Altabef’s and Patz’s employment agreements, described above. We adopted the severance provisions (outside of the context of a change of control) to provide guidance as to discretionary payments that may be made by the Compensation and Nominating Committee at its discretion.
The Executive Severance Plan provides for payments and other benefits if, within two years following a change of control, the executive’s employment is terminated for any reason other than on account of “good cause,” (as defined in the Executive Severance Plan) death or disability, or if the executive terminates employment for “good reason” (as defined in the Executive Severance Plan). In effect, the change in control provisions with respect to termination payments require what is sometimes called a “double trigger,” namely both a change in control and a specified termination event before payment is made. The Executive Severance Plan also provides for lesser payments at the discretion of the Compensation and Nominating Committee if these types of terminations occur outside of the context of a change in control.
No Provision for Tax Gross Up Payments
None of the named executive officers has any contractual entitlement to receive tax gross-up payments in connection with a change of control payment. Under the Executive Severance Plan, in the event that payments to a participating executive upon a change of control would be subject to the excise tax under Section 4999 of the Internal Revenue Code, the payments will be reduced to the maximum amount that could be paid without giving rise to the excise tax if, following the reduction, the
60
executive would retain a greater amount of the after-tax payments than if no reduction were made. If no reduction is made, the executive will be responsible for the applicable excise tax.
“Claw-Back” Policy
The Compensation and Nominating Committee has a policy providing that if MICROS is required to file an accounting restatement due to its material noncompliance, as a result of gross misconduct, with any financial reporting requirement under the securities laws, the Chief Executive Officer and the Chief Financial Officer shall each reimburse MICROS for: (i) any bonus or other incentive-based or equity-based compensation received by that person which arose as a result of the financial misstatement in the 12-month period following the first public issuance or filing with the SEC (whichever first occurs) of the financial document embodying such financial reporting requirement; and (ii) any excess profits realized from the sale by such person of securities of MICROS during that 12-month period.
Tax Considerations
Section 162(m) of the Internal Revenue Code limits to $1 million the deductibility for federal income tax purposes of annual compensation paid by a publicly held company to its chief executive officer and other highly paid executive officers, unless certain conditions are met. To the extent feasible, we structure executive compensation to preserve deductibility for federal income tax purposes. In this regard, our stock option plan is designed to preserve, to the extent otherwise available, the deductibility of income realized upon the exercise of stock options. However, the availability of tax deductions is not a factor that the Compensation and Nominating Committee considers in determining the amounts or types of compensation offered.
Role of Chief Executive Officer in Compensation Determinations
As noted above, in connection with fiscal year 2014 compensation for executive officers, Mr. Altabef made recommendations to the Compensation and Nominating Committee. While the Compensation and Nominating Committee considered Mr. Altabef’s recommendations, the Compensation and Nominating Committee made the ultimate decisions regarding executive compensation.
COMPENSATION AND NOMINATING COMMITTEE REPORT
The Company’s Compensation and Nominating Committee has reviewed and discussed with management the foregoing Compensation Discussion and Analysis. Based on its review and discussions, the Compensation and Nominating Committee has recommended to the Board that the foregoing Compensation Discussion and Analysis be included in this Form 10-K.
JOHN G. PUENTE (Chairman)
DWIGHT S. TAYLOR
F. SUZANNE JENNICHES
Members of the Compensation and Nominating Committee
61
Summary Compensation Table (Fiscal Year 2014)
The following table provides information on the compensation paid to each of the five named executive officers during fiscal years 2014, 2013 and 2012, except as otherwise indicated:
Name and Principal Position | Fiscal Year | Salary ($) | Bonus ($) (1) | Option Awards ($) (2) | Non-Equity Incentive Plan Compen- sation ($) (3) | Change in Pension Value and Non- qualified Deferred Compen- sation Earnings ($) | All Other Compen- sation ($) (4) | Total ($) | |
Peter A. Altabef, President and Chief Executive Officer (5) | 2014 | 988,000 | — | 2,708,916 | 2,013,548 | N/A | 6,500 | 5,716,964 | |
2013 | 475,000 | 393,775 | 2,032,272 | 0 | N/A | 0 | 2,901,047 | ||
Kaweh Niroomand, Executive Vice President Europe-Africa-Middle East Region (6) | 2014 | 1,009,249 | — | 2,128,434 | 2,055,345 | N/A | 0 | 5,193,028 | |
2013 | 924,568 | 766,467 | 1,608,520 | 0 | N/A | 0 | 3,299,555 | ||
2012 | 908,446 | 976,215 | 1,630,300 | 976,215 | N/A | 0 | 4,491,176 | ||
Thomas L. Patz, Executive Vice President, Strategic Initiatives, General Counsel and Corporate Secretary | 2014 | 901,801 | — | 2,321,928 | 1,837,874 | N/A | 6,500 | 5,068,103 | |
2013 | 867,116 | 762,195 | 1,769,372 | 0 | N/A | 7,125 | 3,405,808 | ||
2012 | 825,825 | 842,176 | 1,793,330 | 842,176 | N/A | 6,250 | 4,309,757 | ||
Stefan Piringer, Executive Vice President, Asia-Pacific Region (6)(7) | 2014 | 787,366 | — | 1,934,940 | 1,462,413 | N/A | 7,621 | 4,192,340 | |
2013 | 769,536 | 753,376 | 1,608,520 | 0 | N/A | 10,983 | 3,142,415 | ||
2012 | 721,320 | 900,863 | 1,630,300 | 900,863 | N/A | 10,435 | 4,163,781 | ||
Cynthia A. Russo, Executive Vice President and Chief Financial Officer | 2014 | 397,666 | — | 1,741,446 | 810,445 | N/A | 6,709 | 2,956,266 | |
2013 | 364,831 | 302,445 | 1,286,816 | 0 | N/A | 6,147 | 1,960,239 | ||
2012 | 339,378 | 346,097 | 1,304,240 | 346,097 | N/A | 5,954 | 2,341,766 | ||
(1) | Represents the additional discretionary bonus paid to the named executive officers in those years in which an additional discretionary bonus was awarded. |
(2) | Represents the grant date fair value of stock options granted to each of the named executive officers calculated in accordance with Financial Accounting Standards Board Accounting Standards Codification Topic 718 (“ASC Topic 718”). For additional information on the assumptions underlying the valuation of these awards, see Note 4, "Share-Based Compensation" to our consolidated financial statements in our Annual Report on Form 10-K for the fiscal year ended June 30, 2013, filed with the SEC. |
(3) | Represents the annual incentive bonus (sometimes referred to herein as the “formula bonus”). For further information regarding the annual incentive bonus, see “Compensation Discussion and Analysis – Fiscal Year 2014 Compensation—Bonus.” |
(4) | Represents the Company’s contributions to our 401(k) Retirement Plan for the named executive officers (other than Messrs. Niroomand and Piringer). For Mr. Piringer, the amount represents our contributions to the Central Provident Fund of Singapore, which is described under “Compensation Discussion and Analysis – Retirement and Other Post-Employment Plans and Agreements.” |
(5) | Mr. Altabef’s compensation for fiscal year 2013 represents his annual compensation prorated from the January 2, 2013, effective date of his appointment to the end of fiscal year 2013. |
(6) | Messrs. Niroomand’s compensation is denominated and paid in Euros. Mr. Piringer’s compensation is denominated and paid 90% in Singapore Dollars and 10% in Thai Baht. For purposes of this table, their compensation has been converted to U.S. dollars using 12-month average exchange rates for the respective currencies during fiscal year 2014. |
(7) | Mr. Piringer retired from the Company effective June 30, 2014. |
Each of Messrs. Altabef and Patz has an employment agreement with us.
Mr. Altabef’s employment agreement is currently in effect until December 31, 2016. On January 1 of each year, the term of Mr. Altabef’s agreement automatically is extended for an additional 12 months from the end of the then-applicable term (so that on January 1 of each year the agreement is for a term of 36 months), unless either party provides prior written notice that the party elects not to renew the agreement for the additional period. Mr. Altabef’s agreement specifies his starting annual salary and initial target bonus. Although the agreement does not specify his base salary or a target bonus for fiscal year 2014 or any subsequent period, it does provide that Mr. Altabef’s salary and target bonus amount cannot subsequently be reduced, and will be increased in a manner no less favorably and at increments no less frequently than those increases accorded to similarly situated MICROS executives. Actual bonus payments, if any, will be based on the extent to which the applicable performance measures are met. Subject to the limitation on reduction of salary and target bonus, the determination of future increases in salary and target bonus each year for Mr. Altabef is left to the discretion of the Compensation and Nominating Committee.
62
Mr. Patz’s employment agreement currently is in effect until September 30, 2017. Each year, the term of the agreement automatically is extended for an additional 12 months from the end of the then-applicable term (so that the term of the agreement extends through the third anniversary of the effective date of the renewal), unless either party provides 120 days’ prior written notice that the party elects not to renew the agreement for the additional period. While Mr. Patz’s agreement does not specify an annual salary, or a target bonus for any particular fiscal year, the agreement provides that Mr. Patz’s salary and target bonus for a particular fiscal year cannot be reduced from the amounts set for the prior fiscal year, although actual bonus payments, if any, will be based on the extent to which the applicable performance measures are met. Subject to the limitation on reduction of salary and target bonus, the determination of salary and target bonus each year for Mr. Patz is left to the discretion of the Compensation and Nominating Committee.
See “Compensation Discussion and Analysis-fiscal year 2014 Compensation-Base Salary” and “-Bonus” above for additional information on the determination of salary and bonus for the named executive officers. See “Potential Payments Upon Termination” for information regarding provisions of the employment agreements applicable to specified events of termination.
Grants of Plan-Based Awards (Fiscal Year 2014)
The following table provides information regarding plan-based awards granted to the named executive officers during fiscal year 2014:
Name | Grant Date | Estimated Future Payouts Under Non- Equity Incentive Plan Awards ($) | All Other Option Awards; Number of Securities Underlying Options (#) | Exercise or Base Price of Option Awards ($/Sh) | Grant Date Fair Value of Stock and Option Awards ($) (2) | ||||||||
Threshold | Target | Maximum (1) | |||||||||||
Peter A. Altabef | 6/30/2014 | 740,900 | 988,000 | 2,470,000 | — | — | — | ||||||
11/22/2013 | — | — | 140,000 | 53.95 | 2,708,916 | ||||||||
Kaweh Niroomand | 6/30/2014 | 189,234 | 1,009,249 | 2,523,123 | — | — | — | ||||||
11/22/2013 | — | — | 110,000 | 53.95 | 2,128,434 | ||||||||
Thomas L. Patz | 6/30/2014 | 676,351 | 901,801 | 2,254,503 | — | — | — | ||||||
11/22/2013 | — | — | 120,000 | 53.95 | 2,321,928 | ||||||||
Stefan Piringer(3) | 6/30/2014 | 147,631 | 787,366 | 1,968,415 | — | — | — | ||||||
11/22/2013 | — | — | 100,000 | 53.95 | 1,934,940 | ||||||||
Cynthia A. Russo | 6/30/2014 | 298,250 | 397,666 | 994,165 | — | — | — | ||||||
11/22/2013 | — | — | 90,000 | 53.95 | 1,741,446 | ||||||||
(1) | As noted above in “Compensation Discussion and Analysis – Fiscal Year 2014 Compensation – Cap on Annual Bonus,” no executive officer will receive bonuses in any fiscal year that exceed 250% of the individual’s base salary. |
(2) | The grant date fair value is computed in accordance with ASC Topic 718. |
(3) | Upon his retirement from the Company effective June 30, 2014, all unvested options then held by Mr. Piringer were forfeited. |
Except (1) as described in Messrs. Altabef’s and Patz’s option agreements with Company (providing for accelerated vesting for unvested stock options for Messrs. Altabef and Patz in certain circumstances, including a change in control), (2) as indicated in the Company Stock Option Plan, which provides for acceleration of unvested options upon retirement at or after age 62, and (3) as described in the Executive Severance Plan (providing for accelerated vesting upon the change in control), all stock options vest in three equal installments over a three-year period commencing on the first anniversary of the date of grant. See “Potential Payments Upon Termination,” below for additional information regarding circumstances under which acceleration of unvested options may occur. The exercise price per share is equal to the closing price per share of our Common Stock on the NASDAQ Stock Market on the date of the grant.
63
Outstanding Equity Awards at Fiscal Year 2014 Year End
The following table provides information concerning all of the unexercised stock options held by the named executive officers as of June 30, 2014.
Option Awards | |||||||||
Option Grant Date | Number of Securities Underlying Unexercised Options | Option Exercise Price ($) | Option Expiration Date | ||||||
Name | (#) Exercisable | (#) Unexercisable(1) | |||||||
Peter A. Altabef | 11/22/13 | 0 | 140,000 | 53.95 | 11/22/23 | ||||
01/29/13 | 40,000 | 80,000 | 45.64 | 01/29/23 | |||||
40,000 | 220,000 | ||||||||
Kaweh Niroomand | 11/16/07 | 120,000 | 0 | 35.28 | 11/16/17 | ||||
11/20/09 | 100,000 | 0 | 28.63 | 11/20/19 | |||||
11/19/10 | 100,000 | 0 | 43.94 | 11/19/20 | |||||
11/18/11 | 66,666 | 33,334 | 45.41 | 11/18/21 | |||||
11/16/12 | 33,334 | 66,666 | 43.82 | 11/16/22 | |||||
11/22/13 | 0 | 110,000 | 53.95 | 11/22/23 | |||||
420,000 | 210,000 | ||||||||
Thomas L. Patz | 11/18/05 | 105,784 | 0 | 23.71 | 11/18/15 | ||||
11/17/06 | 130,000 | 0 | 25.91 | 11/17/16 | |||||
11/16/07 | 160,000 | 0 | 35.28 | 11/16/17 | |||||
11/20/09 | 110,000 | 0 | 28.63 | 11/20/19 | |||||
11/19/10 | 110,000 | 0 | 43.94 | 11/19/20 | |||||
11/18/11 | 73,333 | 36,667 | 45.41 | 11/18/21 | |||||
11/16/12 | 36,667 | 73,333 | 43.82 | 11/16/22 | |||||
11/22/13 | 0 | 120,000 | 53.95 | 11/22/23 | |||||
725,784 | 230,000 | ||||||||
Stefan Piringer(2) | 11/18/11 | 0 | 33,334 | 45.41 | 11/18/21 | ||||
11/16/12 | 0 | 66,666 | 43.82 | 11/16/22 | |||||
11/22/13 | 0 | 100,000 | 53.95 | 11/22/23 | |||||
0 | 200,000 | ||||||||
Cynthia A. Russo | 11/16/07 | 80,000 | 0 | 35.28 | 11/16/17 | ||||
11/21/08 | 55,000 | 0 | 14.67 | 11/21/18 | |||||
11/20/09 | 65,000 | 0 | 28.63 | 11/20/19 | |||||
11/19/10 | 80,000 | 0 | 43.94 | 11/19/20 | |||||
11/18/11 | 53,333 | 26,667 | 45.41 | 11/18/21 | |||||
11/16/12 | 26,667 | 53,333 | 43.82 | 11/16/22 | |||||
11/22/13 | 0 | 90,000 | 53.95 | 11/22/23 | |||||
360,000 | 170,000 | ||||||||
(1) | All options, including unvested options, are exercisable for 30 days before the termination of the 1991 Stock Option Plan as a result of our dissolution or liquidation or upon a reorganization, merger or consolidation in which we are not the surviving corporation, or upon the sale of substantially all of our property to another corporation. The individual option agreements with Messrs. Altabef and Patz and the Executive Severance Plan in which Ms. Russo and Mr. Niroomand participate provide for acceleration of the unvested options upon a change of control. See “Potential Payments upon Termination – Provisions Related to Stock Options” for additional information. |
(2) | Upon his retirement from the Company effective June 30, 2014, all unvested options then held by Mr. Piringer were forfeited. |
64
Option Exercises and Stock Vested (Fiscal Year 2014)
The following table provides information concerning stock options that were exercised during fiscal year 2014 by the named executive officers:
Option Awards | |||
Name | Number of Shares Acquired on Exercise (#) | Value Realized on Exercise ($)(1) | |
Peter A. Altabef | 0 | 0 | |
Kaweh Niroomand | 250,000 | 7,264,193 | |
Thomas L. Patz | 50,000 | 1,522,338 | |
Stefan Piringer | 570,000 | 10,401,699 | |
Cynthia A. Russo | 69,788 | 1,987,390 | |
(1) | Represents the difference between the exercise price and the market price on the date of exercise, multiplied by the number of option shares exercised. |
Nonqualified Defined Contribution and Other Nonqualified Deferred Compensation Plans
We do not currently offer any nonqualified defined contribution or other nonqualified deferred compensation plans.
Potential Payments upon Termination
In this section, we describe payments that may be made to our named executive officers upon several events of termination, including termination in connection with a change in control. The information in this section does not include information relating to the following: (i) payments and benefits provided on a nondiscriminatory basis to salaried employees generally upon termination of employment, including under our 401(k) Retirement Plan; and (ii) options that vested on or before June 30, 2014 – see the Outstanding Equity Awards at Fiscal Year 2014 Year End table.
Termination Payments under Messrs. Altabef’s and Patz’s Employment Agreements
Mr. Altabef is entitled to certain benefits upon termination in accordance with the terms of his employment agreement. If Mr. Altabef is terminated other than for “good cause” or if he resigns for “good reason,” he would receive his base salary for the remaining term of his agreement plus three times his target bonus for the fiscal year in which he is terminated, in a lump sum payment.
Mr. Patz is entitled to certain benefits upon termination in accordance with the terms of his employment agreement. If Mr. Patz is terminated other than for “good cause” or if he resigns for “good reason,” he would receive his base salary and target bonus for the remaining term of his agreement in a lump sum payment.
Under these employment agreements, “good cause” is generally defined as (i) criminal acts which result in being charged with and convicted of a felony and which are intended to result directly or indirectly in substantial gain or personal enhancement at the expense of the Company, (ii) the determination by a court of competent jurisdiction that there has been a willful or intentional breach of the restrictive covenants contained in the employment agreement in a manner which results in material and substantial direct economic harm or damage to the Company, or (iii) material, repeated and documented failure over a 6 consecutive month period to perform substantially duties and responsibilities in accordance with reasonable business practices and expectations, which failure is not cured within a specified notice-and-cure period. “Good reason” is generally defined as (i) an assignment by the Company to employee of any material duties which are inconsistent with employee’s position, duties, responsibilities and status, (ii) any action taken by the Company or the Board to reduce employee’s salary, target bonus, or fringe benefits, or (iii) the Company’s failure to obtain the agreement of any successor-in-interest to assume its obligations under the agreement.
Termination Payments in Connection with a Change in Control for Messrs. Altabef and Patz
Mr. Altabef’s employment agreement provides for a “double trigger” lump sum cash termination payment equal to 2.99 multiplied by the sum of (i) Mr. Altabef’s highest annual base salary prior to his date of termination and (ii) Mr. Altabef’s eligible target bonus for the fiscal year of his termination, if during the two-year period following a change in control he is terminated by the Company for other than “good cause” or voluntarily resigns for “good reason.” In addition, if the “double trigger” conditions are met, Mr. Altabef, his spouse, and his dependents are eligible to continue to receive the medical and dental coverage in effect as of the date of his termination (or generally comparable coverage) for a period of 36 months
65
following termination at the same premium rates as the Company charges active employees. Mr. Altabef’s employment agreement contains one-year post-termination non-competition, confidential information, non-solicitation of clients/customers and non-solicitation of Company employee restrictive covenants.
Mr. Patz’s employment agreement provides for a "single trigger" lump sum cash termination payment equal to 2.99 multiplied by the sum of (i) Mr. Patz’s highest annual base salary prior to his date of termination and (ii) Mr. Patz’s eligible target bonus for the fiscal year of his termination, if Mr. Patz terminates employment for any reason or no reason within 30 days following the change in control. In addition, if Mr. Patz terminates employment for any reason or no reason within 30 days following the change in control, Mr. Patz, his spouse, and his dependents are eligible to continue to receive the medical and dental coverage in effect as of the date of his termination (or generally comparable coverage) for a period of 36 months following termination at the same premium rates as the Company charges active employees. Mr. Patz’s employment agreement contains one-year post-termination non-competition, confidential information, non-solicitation of clients/customers and non-solicitation of Company employee restrictive covenants.
Under their employment agreements, a “Change in Control” generally occurs (a) when a person or entity owns at least 40% or more of the voting power of our outstanding securities, but a change in control will not be deemed to occur as a result of a transaction in which MICROS becomes a subsidiary of another corporation and in which our stockholders immediately before the transaction beneficially own, immediately after the transaction, more than 60% of the voting power of the parent company, (b) the consummation of a merger or consolidation of MICROS with another corporation where the stockholders of MICROS immediately before the transaction will not beneficially own, immediately after the transaction, at least 60% of the voting power of the surviving company or where the members of the Board of Directors immediately before the transaction would not constitute a majority of the board immediately after the transaction, (c) a sale or other disposition of all or substantially all of our assets, or our liquidation or dissolution, or (d) directors are elected such that a majority of the new members of the board are different than the directors who were members before the election or nomination, unless the election or nomination of each new director was approved by a vote of at least two-thirds of the directors then still in office who were directors at the beginning of such period.
Executive Severance Plan
The Executive Severance Plan provides for payments and other benefits if specified termination events occur following a change of control. The Executive Severance Plan provides that upon the occurrence of a change of control all equity-based awards granted to participating executive officers and outstanding immediately prior to the date of the change in control will immediately vest (a so-called “single trigger”). Additionally, the Executive Severance Plan provides for payments to participating executive officers after a change of control if a specified termination event occurs (a so-called “double trigger”). Specifically, if during the two-year period commencing on the date of a change of control either (i) the participating executive officer’s employment is terminated by the Company for any reason other than on account of “good cause” or death or disability, or (ii) the participating executive officer voluntarily terminates employment with the Company for “good reason,” the Company or its successor must pay to the participating executive officer an amount equal to (i) 1.5 times the sum of the participating executive officer’s highest annual base salary prior to the date of the participating executive officer’s termination, and stated annual target bonus for the fiscal year in effect as of the participating executive officer’s termination date, plus (ii) the participating executive officer’s stated annual target bonus, prorated based on the portion of the fiscal year prior to the date of the participating executive officer’s termination, plus (iii) the cost of continuing coverage under the Company’s medical and dental plans for 18 months pursuant to the Consolidated Omnibus Budget Reconciliation Act of 1985 (“COBRA”), less the amount that the participating executive officer would be required to contribute for such coverage if the participating executive officer were an active employee of the Company, provided that the participating executive officer is eligible for and timely elects COBRA continuation coverage. “Good cause” is generally defined as (i) criminal acts which result in being charged with and convicted of a felony and which are intended to result directly or indirectly in substantial gain or personal enhancement of the participating executive officer at the expense of the Company, (ii) the determination by a court of competent jurisdiction that there has been a willful or intentional breach by the participating executive officer of the Executive Severance Plan’s restrictive covenants or an agreement between such executive officer and the Company which results in material and substantial direct economic harm or damage to the Company, or (iii) the participating executive officer’s material, repeated and documented failure to perform the participating executive officer’s duties that is not cured within a specified notice-and-cure period. “Good reason” is generally defined as (i) a material diminution in the participating executive officer’s authority, responsibilities, duties, or status; provided, that a mere change in reporting lines or other changes to the participating executive officer’s role solely as a result of the Company ceasing to be publicly traded shall not constitute “good reason” unless such cessation fundamentally and significantly affects the nature of the participating executive officer’s duties and responsibilities, (ii) a reduction of more than 10% of the participating executive officer’s salary or target bonus, other than a one-time reduction of not more than 10% that is also applied to other executive officers, or (iii) a material change in the geographic location where the participating executive officer must provide services (i.e. more than 50 miles from the participating executive officer’s employment location as of the date of a change of control); provided, in each case, that such failure is not cured within a
66
specified notice-and-cure period. For participating executive officers, the Executive Severance Plan supersedes all prior severance pay plans, policies, and arrangements.
In addition, under the Executive Severance Plan, the Compensation and Nominating Committee may provide, at its sole discretion, for payments to a participating executive if the executive’s employment is involuntarily terminated by us other than on account of Good Cause, death, or disability, in each case prior to a change of control. The payments will include: (a) the executive’s base salary during a period of between six to 18 months, as designated by the Committee (the “Severance Period”); (b) the executive’s Target Bonus, prorated based on the portion of the fiscal year prior to the executive’s termination; and (c) the COBRA reimbursement for the Severance Period.
The payments under the Executive Severance Plan are conditioned upon the Company’s receipt of a standard release from the participating executive officer, including the participating executive officer’s affirmation of continuing compliance with non-solicitation of clients/customers, confidentiality and non-recruitment of Company employee covenants contained in the Executive Severance Plan. The Executive Severance Plan’s non-solicitation of clients/customers and non-recruitment of Company employee covenants are of a 12 month duration following termination of employment, and its confidentiality covenant is of an 18 month duration following termination of employment. The Executive Severance Plan does not include “tax gross-up” provisions. If (i) any payments or benefits paid by the Company, its successor or their affiliates would otherwise be subject to the excise tax under Section 4999 of the Code and (ii) the reduction of such payments or benefits below the participating executive officer’s safe harbor amount (i.e. the maximum amount payable to the executive without giving rise to such excise tax) would provide such executive officer with a greater after-tax amount than if they were not so reduced, the payments and benefits shall be so reduced. If no reduction is made, the executive will be responsible for the applicable excise tax.
Under the Executive Severance Plan, “Change of Control” generally is defined similarly to the definitions of the term “Change in Control” in Mr. Altabef’s and Mr. Patz’s employment agreements.
Provisions Related to Stock Options
Under the terms of the 1991 Stock Option Plan, except as noted below, all options, including unvested options, are exercisable for 30 days before the termination of the plan as a result of our dissolution or liquidation, upon a reorganization, merger or consolidation in which we are not the surviving corporation, or upon the sale of substantially all of our property to another corporation. This provision will not apply if an arrangement is made in connection with the transaction for assumption of the options by, or exchange of options for options of a successor employer, subject to appropriate adjustments. Acceleration of the unvested options upon a change in control, as defined, is also provided in the individual option agreements with Messrs. Altabef and Patz. The Executive Severance Plan similarly provides that upon a Change of Control, as defined in the Executive Severance Plan, all unvested Company equity-based awards granted to the executive participant and outstanding immediately prior to the date of the Change of Control will be immediately vested on the date of the Change of Control.
None of the named executive officers has any contractual entitlement to receive tax gross-up payments in connection with a change in control payment.
The following table shows the amounts that would be paid, under the employment and option agreements for Messrs. Altabef and Patz and the Executive Severance Plan for Ms. Russo and Mr. Niroomand, upon the occurrence of specified termination of employment events, assuming for calculation purposes only that the termination occurred on June 30, 2014, as well as amounts that would be realized by each named executive officer other than Mr. Piringer upon accelerated vesting of options following a change in control. Because Mr. Piringer retired on June 30, 2014, he is not entitled to any such payments.
Termination by Company Without Good Cause ($) | Resignation for Good Reason ($) | Resignation or Termination In Connection With a Change in Control | ||
Name | Cash Payment ($) (1) | Vesting of Options ($) (2) | ||
Peter A. Altabef (3) | 5,434,000 | 5,434,000 | 5,955,445 | 3,733,800 |
Kaweh Niroomand (4) | 2,523,123 | 0 | 4,036,996 | 3,889,499 |
Thomas L. Patz (5) | 4,734,455 | 4,734,455 | 5,421,596 | 4,264,499 |
Cynthia A. Russo (4) | 1,017,768 | 0 | 1,614,267 | 3,139,499 |
67
(1) | The amounts shown in the table are estimates only, as the actual amounts that may be paid upon an individual’s termination of employment can only be determined at the actual time of such termination. The table estimates the value of benefits payable to such individual pursuant to the arrangements described above as if a change of control occurred on June 30, 2014 and each individual incurred a termination of his or her employment without “good cause” or for “good reason” (or, in the case of Mr. Patz, he terminated his employment for any reason or no reason) immediately following the change of control. If instead the change of control and subsequent terminations were assumed to occur on September 1, 2014, the estimated cash severance amounts would be as follows: Mr. Altabef: $6,144,570; Mr. Patz: $5,608,481; Ms. Russo: $1,336,180; Mr. Niroomand: $3,327,148. The amount for Mr. Niroomand is based on his salary, which is denominated and paid in Euros, and was converted to U.S. dollars using the 12-month average exchange rates for the Euro during fiscal year 2014. |
(2) | The amounts in this column represent the value of unvested options that would vest in connection with a change in control, as described above. For each individual, the aggregate value of the unvested options is equal to the product of the excess of the closing price of our Common Stock as of June 30, 2014 over the option exercise price multiplied by the number of shares underlying the unvested portion of the options as of June 30, 2014. |
(3) | Under his employment agreement, Mr. Altabef is also eligible to receive certain continuing medical and dental benefits for 36 months, as described above. The amount in the table above reflects the value of this benefit as $47,205, which equals the difference between the total value of the benefit over a 36-month period less amounts Mr. Altabef is required to contribute for such coverage if he was an active employee of the Company, assuming that premium rates as of June 30, 2014 remain in effect. Upon his death or disability, Mr. Altabef or his estate, as applicable, will receive the proceeds of a $250,000 life insurance policy or payments under disability insurance policies (with a maximum payment of $1,185,000 assuming a disability date of June 30, 2014), as applicable, maintained by the Company for his benefit. |
(4) | For Mr. Niroomand and Ms. Russo, payments under the Executive Severance Plan, described above, in connection with specified termination events outside of the context of Change of Control are at the discretion of the Compensation and Nominating Committee and can range from six to 18 months as designed by the committee. For presentation purposes, the amount included in the table assumes payment for the maximum 18 month severance period. Ms. Russo is also eligible to receive certain continuing medical and dental benefits as described above. |
(5) | Under his employment agreement, Mr. Patz is also eligible to receive certain continuing medical and dental benefits for 36 months, as described above. The amount in the table above reflects the value of this benefit as $28,826, which equals the difference between the total value of the benefit over a 36-month period less amounts he is required to contribute for such coverage if he was an active employee of the Company, assuming that premium rates as of June 30, 2014 remain in effect. Upon his death or disability, Mr. Patz or his estate, as applicable, will receive the proceeds of a $250,000 life insurance policy or payments under disability insurance policies (with a maximum payment of $4,066,500 assuming a disability date of June 30, 2014), as applicable, maintained by the Company for his benefit. |
ITEM 12. | SECURITY OWNERSHIP OF CERTAIN BENEFICIAL OWNERS AND MANAGEMENT AND RELATED STOCKHOLDER MATTERS |
EQUITY COMPENSATION PLAN INFORMATION
As of June 30, 2014 | ||||||||||
Plan category | Number of securities to be issued upon exercise of outstanding options, warrants | Weighted-Average exercise price of outstanding options, warrants and rights | Number of securities remaining available for future issuance under equity compensation plans (excluding securities reflected in column (a)) | |||||||
Equity compensation plans approved by security holders | 6,766,175 | $ | 42.07 | 3,051,035 | ||||||
Equity compensation plans not approved by security holders | N/A | N/A | N/A | |||||||
Total | 6,766,175 | $ | 42.07 | 3,051,035 | ||||||
SECURITY OWNERSHIP OF CERTAIN BENEFICIAL OWNERS AND MANAGEMENT
The following table lists the number of Shares beneficially owned as of June 30, 2014, unless otherwise noted, by (1) all stockholders known by the Company to beneficially own more than five percent of the outstanding Shares, (2) each of the directors, (3) each executive officer of the Company named in the Summary Compensation Table that is included in the “Executive Compensation” section of this Form 10-K, and (4) all directors and executive officers of the Company as a group.
Beneficial ownership is determined in accordance with SEC regulations, and means voting or investment power with regard to the Shares. The percentage ownership shown in the table below is based on the 74,829,614 Shares outstanding on June 30, 2014. In addition, Shares subject to options held by a person listed in the table that were exercisable on June 30, 2014 (or that would become exercisable within 60 days of June 30, 2014) are deemed outstanding for purposes of computing the percentage ownership of the person holding the options, but are not deemed outstanding for the purposes of computing the percentage ownership of any other person.
68
Individual or Group | Number of Shares of Common Stock Beneficially Owned (1) | Percent of Class | ||
A. L. Giannopoulos, Chairman of the Board of Directors | 690,000 | (2) | Less than 1% | |
Peter A. Altabef, President and Chief Executive Officer, Director | 40,000 | (3) | Less than 1% | |
Louis M. Brown, Jr., Director | 87,000 | Less than 1% | ||
B. Gary Dando, Director | 3,334 | (4) | Less than 1% | |
F. Suzanne Jenniches, Director | 15,621 | (5) | Less than 1% | |
John G. Puente, Director | 27,334 | (6) | Less than 1% | |
Dwight S. Taylor, Director | 7,384 | (7) | Less than 1% | |
Kaweh Niroomand, Executive Vice President, Europe-Africa-Middle East Region | 420,000 | (8) | Less than 1% | |
Thomas L. Patz, Executive Vice President, Strategic Initiatives, General Counsel and Corporate Secretary | 775,852 | (9) | Less than 1% | |
Stefan Piringer, Executive Vice President, Asia-Pacific Region | 0 | (10) | Less than 1% | |
Cynthia A. Russo, Executive Vice President and Chief Financial Officer | 370,768 | (11) | Less than 1% | |
Directors and Executive Officers as a group (13 persons) | 2,818,546 | (12) | 3.8 | % |
BlackRock Inc - 40 East 52nd Street New York, NY 10022 | 4,769,794 | (13) | 6.3 | % |
Neuberger Berman Group LLC - 605 Third Avenue, New York, NY 10158 | 4,538,242 | (14) | 6.0 | % |
The Vanguard Group - 100 Vanguard Blvd., Malvern, PA 19355 | 4,249,019 | (15) | 5.6 | % |
69
(1) | Information with respect to beneficial ownership is based on information furnished to the Company by the beneficial owner. Unless otherwise noted, the beneficial owner has sole voting and sole investment power with respect to the listed shares. |
(2) | Includes options to purchase 690,000 shares that are currently exercisable. |
(3) | Includes options to purchase 40,000 shares that are currently exercisable. |
(4) | Includes 3,000 shares of Common Stock jointly owned with his wife. Includes options to purchase 334 shares that are currently exercisable. |
(5) | Includes options to purchase 333 shares that are currently exercisable. |
(6) | Includes 4,000 shares of Common Stock held by Mr. Puente’s wife, with respect to which Mr. Puente does not have investment power. Includes options to purchase 334 shares that are currently exercisable. |
(7) | Includes options to purchase 334 shares that are currently exercisable. |
(8) | Includes options to purchase 420,000 shares that are currently exercisable. |
(9) | Includes options to purchase 725,784 shares that are currently exercisable. |
(10) | Mr. Piringer retired from the Company effective June 30, 2014. |
(11) | Includes options to purchase 360,000 shares that are currently exercisable. |
(12) | Includes options to purchase 2,510,453 shares that are currently exercisable; does not include Mr. Piringer, who retired from the Company effective June 30, 2014. |
(13) | The information in the table is as of December 31, 2013. BlackRock Inc. is a holding company of subsidiaries that hold the shares listed in the table, including BlackRock Advisors (UK) Limited, BlackRock Advisors, LLC, BlackRock Asset Management Canada Limited, BlackRock Financial Management, Inc., BlackRock Fund Advisors, BlackRock Fund Management Ireland Limited, BlackRock Institutional Trust Company, N.A., BlackRock International Limited, BlackRock Investment Management (Australia) Limited, BlackRock Investment Management (UK) Ltd, BlackRock Investment Management, LLC, and BlackRock Japan Co Ltd. BlackRock Inc. holds sole investment power with respect to all of the shares listed in the table, and sole voting power with respect to 4,458,386 shares. The information in the table and this footnote is derived from an amendment to Schedule 13G filed with the SEC on January 30, 2014 by BlackRock, Inc. |
(14) | The information in the table is as of December 31, 2013. Neuberger Berman Group LLC may be deemed to be the beneficial owner of the shares listed in the table because certain affiliated persons have shared power to retain, dispose of and, in most cases, vote the securities. In addition to the holdings of individual advisory clients, each of Neuberger Berman LLC and Neuberger Berman Management LLC serve as a sub-adviser and investment manager, respectively, of Neuberger Berman Group LLC’s various registered mutual funds which hold such shares. The holdings belonging to clients to Neuberger Berman Trust Co N.A., Neuberger Berman Trust Co of Delaware N.A., NB Alternatives Advisers LLC and Neuberger Berman Fixed Income LLC, affiliates of Neuberger Berman LLC, are also aggregated to comprise the holdings referenced in the table. Of the shares listed in the table, Neuberger Berman Group LLC and Neuberger Berman LLC each have shared voting power with respect to 4,529,442 shares, and shared investment power with respect to 4,538,242 shares; Neuberger Berman Management LLC has shared voting and investment power with respect to 4,162,714 shares; and Neuberger Berman Equity Funds have shared voting and investment power with respect to 3,602,742 shares. The information in the table and this footnote is derived from an amendment to Schedule 13G filed with the SEC on February 12, 2014 by Neuberger Berman Group, Neuberger Berman LLC, Neuberger Berman Management LLC and Neuberger Berman Equity Funds. |
(15) | The information in the table is as of December 31, 2013. The Vanguard Group has sole voting power with respect to 47,628 shares, sole investment power with respect to 4,206,491 shares, and shared investment power with respect to 42,528 shares. Two wholly-owned subsidiaries of the Vanguard Group beneficially own an aggregate of 47,628 shares listed in the table. The information in the table and this footnote is derived from a Schedule 13G filed with the SEC on February 11, 2014 by The Vanguard Group. |
CHANGES IN CONTROL
On June 22, 2014, MICROS entered into the Merger Agreement with Purchaser, Parent and, solely for certain limited purposes, Oracle. Pursuant to the Merger Agreement and subject to the terms and conditions of the Merger Agreement, Parent and Purchaser commenced the Offer to acquire all of the shares of the Company’s common stock for a purchase price of $68.00 per share, payable net to the sellers in cash, without interest thereon and subject to any required withholding of taxes. The Merger Agreement provides, among other things, that as soon as practicable following the completion of the Offer and satisfaction or waiver of all other applicable conditions set forth in the Merger Agreement, MICROS and Purchaser will complete the Merger with the Company surviving the Merger as a wholly-owned subsidiary of Oracle. For additional information regarding the Merger Agreement, the Offer and the Merger, see Part I, Item 1, “Business - Introduction - Recent Developments.”
ITEM 13. | CERTAIN RELATIONSHIPS AND RELATED TRANSACTIONS |
The Board has adopted a written policy for review and approval, ratification, or rejection of related person transactions. Related person transactions are transactions (i) involving an amount exceeding $120,000, (ii) in which MICROS or any of its controlled subsidiaries participates and (iii) in which a director, director nominee, executive officer, holder of more than 5% of the Shares, or any immediate family member of any of the foregoing, has a direct or indirect material interest. The policy includes procedures under which directors, director nominees, and executive officers must provide information to the Company’s General Counsel before entry into a related person transaction. If the transaction is subject to the policy, it is considered by the Audit Committee, which may approve or reject the transaction. The policy also has procedures for Audit Committee consideration of ratification of related person transactions that occur without its prior approval as well as inquiries designed to minimize the possibilities of future occurrences without prior Audit Committee approval. The Audit Committee will approve a related person transaction only if it determines that the transaction is in, or not inconsistent with, the best interests of the Company.
70
Director Independence
The Board of Directors has determined that each of Louis M. Brown, Jr., B. Gary Dando, F. Suzanne Jenniches, John G. Puente, and Dwight S. Taylor is an independent director within the meaning of the rules of the NASDAQ Stock Market. The Board has determined that each of the members of the two standing Board committees, the Audit Committee and the Compensation and Nominating Committee, is independent within the meaning of the rules of the NASDAQ Stock Market, including additional NASDAQ Stock Market requirements relating to audit committee and compensation committee members.
In making its independence determinations, the Board of Directors considered Mr. Brown’s past service to the Company. However, Mr. Brown has not been employed by MICROS during the past 10 years, his consulting arrangement with MICROS terminated in 2008, and the only monies he receives from the Company are pursuant to his participation in the Company’s Supplemental Executive Retirement Plan (“SERP”). Payments under the SERP were fixed in accordance with the terms of the SERP and are not contingent on Mr. Brown’s continued service to the Company. See “Director Compensation (Fiscal Year 2014)” below for further information.
In addition, the Board of Directors considered Mr. Taylor's service on the board of directors of T. Rowe Price Group, Inc., a financial services holding company whose subsidiaries provide investment advisory services to T. Rowe Price sponsored mutual funds and other advisory clients. In prior years, the T. Rowe Price Group reported that its mutual funds and clients held over five percent of the Company’s common stock, although, as reported in an amendment to Schedule 13G filed by T. Rowe Price on February 12, 2013, as of December 31, 2012 the T. Rowe Price mutual funds and clients ceased to hold over five percent of the Company's common stock. In any event, Mr. Taylor does not participate in any voting or investment determinations by T. Rowe Price with respect to MICROS stock.
Director Compensation (Fiscal Year 2014)
In fiscal year 2014, directors other than Messrs. Giannopoulos, Altabef, and Brown received a base fee of $5,000 per quarter for Board service, and $1,500 for each Board meeting attended. In addition, each member of a Board committee received an additional $1,500 for each committee meeting attended, and the Chairman of the Audit Committee received an additional fee of $3,000 per quarter because he has additional review responsibilities and participates in financial review meetings with our Finance Department and PricewaterhouseCoopers LLP, our independent registered public accounting firm.
The table below provides information regarding director compensation in fiscal year 2014, which reflects the standard compensation described above. The table does not include compensation for reimbursement of travel expenses related to attending board and board committee meetings, or other reasonable out-of-pocket expenses arising from Board service.
Any director who is not “independent,” as defined by the rules of the NASDAQ Stock Market, or who is receiving any retirement payments from the Company, is not entitled to receive any fees or stock option grants for service on the Board of Directors, or any of its committees, other than reimbursement for actual and usual costs and expenses associated with Board service. Accordingly, Messrs. Altabef and Giannopoulos did not receive additional compensation for serving as a director during fiscal year 2014. While the Board has determined that Mr. Brown is independent, the Board also has determined that in light of his continued receipt of retirement benefits, he will not receive any fees or stock option grants for service on the Board of Directors, other than reimbursement for actual and usual costs and expenses associated with Board service.
The grant of stock options to the Board in fiscal year 2014 was not based on objective or mathematical criteria. Mr. Altabef recommended to the non-recipient Board members the number of shares underlying stock options to be granted to each director other than himself, Messrs. Giannopoulos and Brown. He recommended that each director be granted options to purchase 1,000 shares, consistent with the grant for fiscal year 2013. For fiscal year 2014, the non-recipient Board members approved the recommendations made by Mr. Altabef.
See the Summary Compensation Table and other tables above for information regarding the compensation of Mr. Altabef.
71
Name | Fees Earned ($) | Stock Awards ($) | Option Awards ($)(1) | Non-Equity Incentive Plan Compensation ($) | Change in Pension Value and Non- qualified Deferred Compensation Earnings ($) | All Other Compensation ($) | Total ($) |
Louis M. Brown, Jr. | 0 | N/A | N/A | N/A | (48,378) (2) | 60,000 (3) | 11,622 |
B. Gary Dando | 48,500 | N/A | 18,748 | N/A | N/A | N/A | 67,248 |
A.L. Giannopoulos | 0 | N/A | 0 | N/A | (390,074) (4) | 600,000 (5) | 209,926 |
F. Suzanne Jenniches | 44,000 | N/A | 18,748 | N/A | N/A | N/A | 62,748 |
John G. Puente | 44,000 | N/A | 18,748 | N/A | N/A | N/A | 62,748 |
Dwight S. Taylor | 38,000 | N/A | 18,748 | N/A | N/A | N/A | 56,748 |
(1) | Represents the grant date fair value of stock options granted to each of the directors calculated in accordance with ASC Topic 718. |
(2) | We remain obligated to pay retirement benefits to Mr. Brown, a former President and Chief Executive Officer of MICROS, of $60,000 per year through June 30, 2018. The present value of accumulated and unpaid retirement benefits for Mr. Brown as of June 30, 2014, was $215,756, which we calculated using a discount rate of 4.40%. |
(3) | Constitutes retirement benefits paid to Mr. Brown, based on 24% of the annual fee received by Mr. Brown under a consulting agreement with MICROS that expired at the end of fiscal 2008. |
(4) | We remain obligated to pay retirement benefits to Mr. Giannopoulos, a former President and Chief Executive Officer of MICROS, of $600,000 per year through June 30, 2023. The present value of accumulated and unpaid retirement benefits for Mr. Giannopoulos as of June 30, 2014, was $4,380,987, which we calculated using a discount rate of 4.40%. |
(5) | Constitutes retirement benefits paid to Mr. Giannopoulos, based on 30% of the annual compensation received by Mr. Giannopoulos prior to his retirement on June 30, 2013. |
In accordance with the terms of his employment agreement in effect while he served as our President and Chief Executive Officer, Mr. Giannopoulos and his spouse are entitled to receive medical coverage through the Company (or generally comparable coverage) for a period ending on June 30, 2023, provided that Mr. Giannopoulos (or, upon his death, his spouse) pays to the Company an amount equal to the full COBRA premiums in effect at that time.
Only Messrs. Brown and Giannopoulos participate in our Supplemental Executive Retirement Plan (“SERP”), under which the retirement benefits described above are paid. The SERP is closed to new participants, and no other Board member and none of the named executive officers are participants.
Director Cash Compensation Detail
The following table provides information regarding the nature of fees earned or paid in cash for each director who received such fees.
Name | Base Fees ($) | Board Meeting Fees ($) | Audit Committee Fees ($) | Compensation and Nominating Committee Fees ($) | Total ($)(2) | |
B. Gary Dando | 20,000 | 10,500 | 18,000 | (1) | N/A | 48,500 |
F. Suzanne Jenniches | 20,000 | 10,500 | 6,000 | 7,500 | 44,000 | |
John G. Puente | 20,000 | 10,500 | 6,000 | 7,500 | 44,000 | |
Dwight S. Taylor | 20,000 | 10,500 | N/A | 7,500 | 38,000 | |
(1) | Mr. Dando’s Audit Committee fees consist of $1,500 for each of the four regular meetings held during fiscal year 2014, and the additional fee of $3,000 per quarter for his service as the Chairman of the Audit Committee. |
(2) | As noted above, Messrs. Altabef, Brown and Giannopoulos were not eligible to receive fees for Board or Committee service. |
72
ITEM 14. | PRINCIPAL ACCOUNTANT FEES AND SERVICES |
PricewaterhouseCoopers LLP (“PwC”) was the independent registered public accounting firm for the Company for the fiscal year ending June 30, 2014. The following is a summary of PwC fees incurred by the Company for fiscal years 2014 and 2013 for audit and other professional services:
($ in thousands) | 2014 | 2013 | ||||
AUDIT FEES include fees for the annual audit of the consolidated financial statements and of the effectiveness of the company's internal control over financial reporting, the review of interim consolidated financial statements, required statutory audits of certain foreign subsidiaries, and assistance with SEC filings | $ | 4,151 | $ | 3,967 | ||
TAX FEES include fees for tax compliance, and tax advice, including tax return preparation | 328 | 340 | ||||
ALL OTHER FEES include assistance with system implementation and license fees for online financial reporting and assurance literature | 92 | 2 | ||||
TOTAL FEES | $ | 4,571 | $ | 4,309 | ||
PART IV
ITEM 15. EXHIBITS, FINANCIAL STATEMENT SCHEDULES
(a) Exhibits, Financial Statement Schedule:
(1) Financial Statements – See the Index to Consolidated Financial Statements on page 77.
(2) Schedule II – See the Index to Consolidated Financial Statements on page 77.
(3) Exhibits:
2.1 | Agreement and Plan of Merger, dated as of June 22, 2014, by and among MICROS Systems, Inc., OC Acquisition LLC, Rocket Acquisition Corporation, and Oracle Corporation is incorporated herein by reference to Exhibit 2.1 to the Current Report on Form 8-K/A filed on July 3, 2014 | |
3(i) | Restated Articles of Incorporation of the Company are incorporated herein by reference to Exhibit 3(a) to the Quarterly Report on Form 10-Q of the Company for the period ended September 30, 2013 | |
3(ii)(a) | By-laws of the Company, as amended, are incorporated herein by reference to Exhibit 99.2 to the Form 8-K filed on September 18, 2013. | |
3(ii)(b) | Amendment to the By-laws, are incorporated herein by reference to Exhibit 3.1 to the Form 8-K filed on June 24, 2014 | |
10(a)* | MICROS Systems, Inc. 1991 Stock Option Plan as amended, is incorporated herein by reference to Exhibit A to the Proxy Statement of the Company for the 2013 Annual Meeting of Shareholders. | |
10(b)* | Employment Agreement dated June 1, 1995 between MICROS Systems, Inc. and A. L. Giannopoulos is incorporated herein by reference to Exhibit 10e to the Annual Report on Form 10-K of the Company for the fiscal year ended June 30, 1995. | |
10(b)(1)* | First Amendment to Employment Agreement dated February 6, 1997 between MICROS Systems, Inc. and A. L. Giannopoulos is incorporated herein by reference to Exhibit 10 to the Quarterly Report on Form 10-Q of the Company for the period ended December 31, 1996. | |
10(b)(2)* | Second Amendment to Employment Agreement dated February 1, 1998 between MICROS Systems, Inc. and A. L. Giannopoulos is incorporated herein by reference to Exhibit 10 to the Quarterly Report on Form 10-Q of the Company for the period ended December 31, 1997. | |
10(b)(3)* | Third Amendment to Employment Agreement dated September 8, 1999 between MICROS Systems, Inc. and A. L. Giannopoulos is incorporated herein by reference to Exhibit 10g to the Annual Report on Form 10-K of the Company for the fiscal year ended June 30, 1999. | |
10(b)(4)* | Fourth Amendment to Employment Agreement dated November 19, 2001 between MICROS Systems, Inc. and A. L. Giannopoulos is incorporated herein by reference to Exhibit 10 to the Quarterly Report on Form 10-Q of the Company for the period ended December 31, 2001. | |
73
10(b)(5)* | Fifth Amendment to Employment Agreement dated November 15, 2002 between MICROS Systems, Inc. and A. L. Giannopoulos is incorporated herein by reference to Exhibit 10 to the Quarterly Report on Form 10-Q of the Company for the period ended December 31, 2002. | |
10(b)(6)* | Sixth Amendment to Employment Agreement dated January 28, 2004 between MICROS Systems, Inc. and A. L. Giannopoulos is incorporated herein by reference to Exhibit 10 to the Quarterly Report on Form 10-Q of the Company for the period ended December 31, 2003. | |
10(b)(7)* | Seventh Amendment to Employment Agreement dated August 9, 2005 between MICROS Systems, Inc. and A. L. Giannopoulos is incorporated herein by reference to Exhibit 10 to the Current Report on Form 8-K filed on August 11, 2005. | |
10(b)(8)* | Eighth Amendment to Employment Agreement dated June 6, 2006, between MICROS Systems, Inc. and A.L. Giannopoulos is incorporated herein by reference to Exhibit 10 to the Current Report on Form 8-K filed on June 8, 2006. | |
10(b)(9)* | Ninth Amendment to Employment Agreement dated November 17, 2006, between MICROS Systems, Inc. and A. L. Giannopoulos is incorporated herein by reference to Exhibit 10 to the Current Report on Form 8-K filed on November 21, 2006. | |
10(b)(10)* | Tenth Amendment to Employment Agreement dated June 12, 2008, between MICROS Systems, Inc. and A.L. Giannopoulos is incorporated herein by reference to Exhibit 10 to the Current Report on Form 8-K filed on June 13, 2008. | |
10(b)(11)* | Eleventh Amendment to Employment Agreement dated November 21, 2008, between MICROS Systems, Inc. and A.L. Giannopoulos is incorporated herein by reference to Exhibit 10.1 to the Current Report on Form 8-K filed on November 24, 2008. | |
10(b)(12)* | Twelfth Amendment to Employment Agreement dated August 27, 2010, between MICROS Systems, Inc. and A. L. Giannopoulos is incorporated herein by reference to Exhibit 10.1 to the Current Report on Form 8-K filed on August 26, 2010. | |
10(b)(13)* | Thirteenth Amendment to Employment Agreement dated December 3, 2012, between MICROS Systems, Inc. and A.L. Giannopoulos is incorporated herein by reference to Exhibit 10(a) to the Quarterly Report on Form 10-Q of the Company for the period ended December 31, 2012. | |
10(c)* | Employment Agreement dated December 3, 2012 between MICROS Systems, Inc. and Peter A. Altabef is incorporated herein by reference to Exhibit 10.1 to the Current Report on Form 8-K filed on December 23, 2012. | |
10(c)(1)* | First Amendment to Employment Agreement, dated September 17, 2013, between MICROS Systems, Inc. and Peter A. Altabef is incorporated herein by reference to Exhibit 99.1 to the Current Report on Form 8-K filed on September 18, 2013 | |
10(d)* | Employment Agreement dated May 28, 1997 between MICROS Systems, Inc. and Thomas L. Patz is incorporated herein by reference to Exhibit 10.2 to the Quarterly Report on Form 10-Q of the Company for the period ended December 31, 2012. | |
10(d)(1)* | First Amendment to Employment Agreement dated October 1, 1998 between MICROS Systems, Inc. and Thomas L. Patz is incorporated herein by reference to Exhibit 10(c)(1) to the Annual Report on Form 10-K for the fiscal year ended June 30, 2010. | |
10(d)(2)* | Second Amendment to Employment Agreement dated November 17, 2006 between MICROS Systems, Inc. and Thomas L. Patz is incorporated herein by reference to Exhibit 10 to the Current Report on Form 8-K filed on November 21, 2006. | |
10(d)(3)* | Third Amendment to Employment Agreement dated December 3, 2012, between MICROS Systems, Inc. and Thomas L. Patz is incorporated herein by reference to Exhibit 10.3 to the Quarterly Report on Form 10-Q of the Company for the period ended December 31, 2012. | |
10(e)* | Restated Supplemental Executive Retirement Plan, as approved by the Board of Directors on April 27, 2005, is incorporated herein by reference to Exhibit 10 to the Annual Report on Form 10-K for the fiscal year ended June 30, 2006. | |
10(f)* | Executive Severance Plan is incorporated herein by reference to Exhibit 99.1 to the Current Report on Form 8-K filed on May 20, 2014 | |
74
10(g) | Amended and Restated Credit Agreement, effective as of July 29, 2005, among MICROS Systems, Inc., DV Technology Holdings Corporation, Datavantage Corporation, MICROS Fidelio Nevada, LLC, MSI Delaware, LLC, MICROS-Fidelio Worldwide, Inc., and JTECH Communications, Inc. as Borrower, Bank of America, N.A., as administrative agent, swing line lender and L/C issuer, and Wachovia Bank, N.A., and US Bank, N.A., and Banc of America Securities LLC, as sole lead arranger and book manager, is incorporated herein by reference to Exhibit 10 to the Annual Report on Form 10-K for the fiscal year ended June 30, 2005. | |
10(g)(1) | First Amendment to Credit Agreements, dated December 11, 2008 among MICROS Systems, Inc. DV Technology Holdings Corporation, Datavantage Corporation, MICROS Fidelio Nevada, LLC, MSI Delaware, LLC, MICROS-Fidelio Worldwide, Inc., JTECH Communications, Inc., MICROS-Fidelio (Ireland) Ltd. as Guarantor, Bank of America, N.A., as Administrative Agent, and Bank of America, N.A., Wachovia Bank, N.A., and U.S. Bank, N.A., as Lenders is incorporated herein by reference to Exhibit 10(b) to the Quarterly Report on Form 10-Q of the Company for the period ended December 31, 2008. | |
10(g)(2) | Second Amendment to Credit Agreements, dated July 30, 2010 among MICROS Systems, Inc., DV Technology Holdings Corporation, Datavantage Corporation, TIG Global LLC (now named MICROS eCommerce LLC), Fry, Inc., JTECH Communications, Inc., and MICROS-Fidelio Worldwide, Inc., MICROS-Fidelio (Ireland) Ltd. as Guarantor, Bank of America, N.A., as Administrative Agent, and Bank of America, N.A., Wells Fargo, N.A., and U.S. Bank, N.A., as Lenders is incorporated herein by reference to Exhibit 10(g)(2) to the Annual Report on Form 10-K for the fiscal year ended June 30, 2010. | |
10(g)(3) | Third Amendment to Credit Agreements, dated July 30, 2013, among MICROS Systems, Inc., DV Technology Holdings Corporation, Datavantage Corporation, TIG Global LLC (now named MICROS eCommerce LLC), Fry, Inc., JTECH Communications, Inc., and MICROS-Fidelio Worldwide, Inc., MICROS-Fidelio (Ireland) Ltd. as Guarantor, Bank of America, N.A., as Administrative Agent, and Bank of America, N.A., Wells Fargo, N.A., and U.S. Bank, N.A., as Lenders is incorporated herein by reference to Exhibit 10.1 to the Annual Report on Form 10-K for the fiscal year ended June 30, 2013. | |
10(h) | Amended and Restated Credit Agreement, effective as of July 29, 2005, among MICROS-Fidelio (Ireland) Ltd., MICROS-Fidelio Systems (U.K.) Ltd., MICROS-Fidelio España S.L., MICROS-Fidelio (Canada), Ltd., MICROS-Fidelio Brazil, Ltda., MICROS-Fidelio France S.A.S., Hospitality Technologies, S.A., MICROS-Fidelio Mexico S.A. de C.V., MICROS Systems Holding GmbH, MICROS-Fidelio GmbH, MICROS-Fidelio Software Portugal Unipessoal Lda, MICROS-Fidelio (Thailand) Co., Ltd., MICROS-Fidelio Singapore Pte Ltd., MICROS-Fidelio Software (Philippines), Inc., MICROS-Fidelio Japan Ltd., MICROS-Fidelio Australia Pty. Ltd., MICROS-Fidelio Hong Kong, Ltd., Fidelio Nordic Norway A/S, Fidelio Nordic Oy, Fidelio Nordic Sverige, A.B., Hotelbk, A.B., as Borrower, Bank Of America, N.A., as Administrative Agent, swing line lender, and L/C issuer, and Wachovia Bank N.A. and US Bank N.A., and Banc of America Securities LLC, as sole lead arranger and book manager is incorporated herein by reference to Exhibit 10(y) to the Annual Report on Form 10-K for the fiscal year ended June 30, 2005. | |
10(h)(1) | Second Amendment to Credit Agreements, dated July 30, 2010 among MICROS-Fidelio (Ireland) Ltd., MICROS-Fidelio Systems (U.K.) Ltd., MICROS-Fidelio España S.L., MICROS-Fidelio (Canada), Ltd., MICROS-Fidelio Brazil, Ltda., MICROS-Fidelio France S.A.S., Hospitality Technologies, S.A., MICROS-Fidelio Mexico S.A. de C.V., MICROS Systems Holding GmbH, MICROS-Fidelio GmbH, MICROS-Fidelio Software Portugal Unipessoal Lda, MICROS-Fidelio (Thailand) Co., Ltd., MICROS-Fidelio Singapore Pte Ltd., MICROS-Fidelio Software (Philippines), Inc., MICROS-Fidelio Japan Ltd., MICROS-Fidelio Australia Pty. Ltd., MICROS-Fidelio Hong Kong, Ltd., MICROS-Fidelio Norway A/S, MICROS-Fidelio Finland Oy, MICROS-Fidelio Sverige, A.B., Hotelbk, A.B., as Borrower, Bank Of America, N.A., as Administrative Agent, swing line lender, and L/C issuer, and Wells Fargo N.A. and US Bank N.A., and Banc of America Securities LLC, as sole lead arranger and book manager is incorporated herein by reference to Exhibit 10(h)(1) to the Annual Report on Form 10-K for the fiscal year ended June 30, 2010. | |
10(h)(2) | Third Amendment to Credit Agreements, dated July 30, 2013, among MICROS-Fidelio (Ireland) Ltd., MICROS-Fidelio Systems (U.K.) Ltd., MICROS-Fidelio España S.L., MICROS-Fidelio (Canada), Ltd., MICROS-Fidelio Brazil, Ltda., MICROS-Fidelio France S.A.S., Hospitality Technologies, S.A., MICROS-Fidelio Mexico S.A. de C.V., MICROS Systems Holding GmbH, MICROS-Fidelio GmbH, MICROS-Fidelio Software Portugal Unipessoal Lda, MICROS-Fidelio (Thailand) Co., Ltd., MICROS-Fidelio Singapore Pte Ltd., MICROS-Fidelio Software (Philippines), Inc., MICROS-Fidelio Japan Ltd., MICROS-Fidelio Australia Pty. Ltd., MICROS-Fidelio Hong Kong, Ltd., MICROS-Fidelio Norway A/S, MICROS-Fidelio Finland Oy, MICROS-Fidelio Sverige, A.B., Hotelbk, A.B., as Borrower, Bank Of America, N.A., as Administrative Agent, swing line lender, and L/C issuer, and Wells Fargo N.A. and US Bank N.A. is incorporated herein by reference to Exhibit 10.2 to the Annual Report on Form 10-K for the fiscal year ended June 30, 2013. | |
10(i) | Lease Agreement by and between Orix Columbia, Inc. and MICROS Systems, Inc., dated August 17, 1998, with respect to the Company’s corporate headquarters located at 7031 Columbia Gateway Dr., Columbia MD 21046-2289, as amended by a First Amendment to Lease, dated October 27, 1999, a Second Amendment to Lease, dated December 26, 2001, and a Third Amendment to Lease, dated March 1, 2006 and by and between MICROS Systems, Inc. and Columbia Gateway Office Corporation as successor in interest to Orix Columbia, Inc. is incorporated herein by reference to Exhibit 10 to the Quarterly Report on Form 10-Q of the Company for the period ended March 31, 2009. | |
75
10(j) | Manufacturing Agreement, by and between MICROS Systems, Inc., and GES Singapore Pte Ltd. (now known as Venture Group of Singapore), with an effective date of November 6, 2002 (incorporated herein by reference to Exhibit 10(j) to the Annual Report on Form 10-K for the fiscal year ended June 30, 2009). | |
14 | Code of Ethics and Business Practices is incorporated herein by reference to Exhibit 14 to the Annual Report on Form 10-K of the Company for the fiscal year ended June 30, 2004. | |
21 | Subsidiaries of the Company (filed herewith) | |
23 | Consent of PricewaterhouseCoopers LLP (filed herewith) | |
31(a) | Certification of Principal Executive Officer pursuant to Rule 13a-14(a) under the Securities Exchange Act of 1934 (filed herewith) | |
31(b) | Certification of Principal Financial Officer pursuant to Rule 13a-14(a) under the Securities Exchange Act of 1934 (filed herewith) | |
32(a) | Certification of Principal Executive Officer pursuant to Rule 13a-14(b) under the Securities Exchange Act of 1934 and 18 U.S.C. 1350 (furnished herewith) | |
32(b) | Certification of Principal Financial Officer pursuant to Rule 13a-14(b) under the Securities Exchange Act of 1934 and 18 U.S.C. 1350 (furnished herewith) | |
* Management contract or compensatory plan or arrangement.
76
MICROS Systems, Inc.
INDEX TO CONSOLIDATED FINANCIAL STATEMENTS
Page No. | |
Management’s Annual Report on Internal Control Over Financial Reporting | |
Financial Statements: | |
Report of Independent Registered Public Accounting Firm | |
Consolidated balance sheets as of June 30, 2014 and 2013 | |
Consolidated statements of operations for the fiscal years ended June 30, 2014, 2013 and 2012 | |
Consolidated statements of comprehensive income for the fiscal years ended June 30, 2014, 2013 and 2012 | |
Consolidated statements of cash flows for the fiscal years ended June 30, 2014, 2013 and 2012 | |
Consolidated statements of shareholders’ equity for the fiscal years ended June 30, 2014, 2013 and 2012 | |
Notes to consolidated financial statements | |
Financial Statement Schedule: | |
Schedule II – Valuation and qualifying accounts and reserves | |
All other schedules are omitted because they are not applicable, not required, or the required information is included in the financial statements or notes thereto.
77
MANAGEMENT’S ANNUAL REPORT ON INTERNAL CONTROL OVER FINANCIAL REPORTING
Management of MICROS Systems, Inc. (the “Company”) is responsible for establishing and maintaining adequate internal control over financial reporting. Internal control over financial reporting is a process designed to provide reasonable assurance regarding the reliability of financial reporting and the preparation of financial statements for external purposes in accordance with generally accepted accounting principles. A company’s internal control over financial reporting includes those policies and procedures that pertain to the maintenance of records that, in reasonable detail, accurately and fairly reflect the transactions and dispositions of the assets of the company, provide reasonable assurance that transactions are recorded as necessary to permit preparation of financial statements in accordance with generally accepted accounting principles, and that receipts and expenditures of the company are being made only in accordance with authorizations of management and directors of the company; and provide reasonable assurance regarding prevention or timely detection of unauthorized acquisition, use, or disposition of the company’s assets that could have a material effect on the financial statements.
Because of its inherent limitations, internal control over financial reporting may not prevent or detect misstatements. Also, projections of any evaluation of effectiveness to future periods are subject to the risk that controls may become inadequate because of changes in conditions, or that the degree of compliance with the policies or procedures may deteriorate.
Management evaluated the Company’s internal control over financial reporting as of June 30, 2014. In making this assessment, management used the framework established in Internal Control-Integrated Framework (1992) issued by the Committee of Sponsoring Organizations of the Treadway Commission (“COSO”). As a result of this assessment and based on the criteria in the COSO 1992 framework, management has concluded that, as of June 30, 2014, the Company’s internal control over financial reporting was effective.
The Company’s independent registered public accounting firm, PricewaterhouseCoopers LLP, has audited the Company’s internal control over financial reporting. Their opinion on the effectiveness of the Company’s internal control over financial reporting and on the Company’s financial statements is included in this Annual Report on Form 10-K.
78
Report of Independent Registered Public Accounting Firm
To the Board of Directors and Shareholders of MICROS Systems, Inc.:
In our opinion, the consolidated financial statements listed in the accompanying index present fairly, in all material respects, the financial position of MICROS Systems, Inc. and its subsidiaries (the “Company”) at June 30, 2014 and June 30, 2013, and the results of their operations and their cash flows for each of the three years in the period ended June 30, 2014 in conformity with accounting principles generally accepted in the United States of America. In addition, in our opinion, the financial statement schedule listed in the accompanying index presents fairly, in all material respects, the information set forth therein when read in conjunction with the related consolidated financial statements. Also in our opinion, the Company maintained, in all material respects, effective internal control over financial reporting as of June 30, 2014, based on criteria established in Internal Control - Integrated Framework (1992) issued by the Committee of Sponsoring Organizations of the Treadway Commission (COSO). The Company's management is responsible for these financial statements and financial statement schedule, for maintaining effective internal control over financial reporting and for its assessment of the effectiveness of internal control over financial reporting, included in Management's Annual Report on Internal Control over Financial Reporting appearing under Item 9A. Our responsibility is to express opinions on these financial statements, on the financial statement schedule, and on the Company's internal control over financial reporting based on our integrated audits. We conducted our audits in accordance with the standards of the Public Company Accounting Oversight Board (United States). Those standards require that we plan and perform the audits to obtain reasonable assurance about whether the financial statements are free of material misstatement and whether effective internal control over financial reporting was maintained in all material respects. Our audits of the financial statements included examining, on a test basis, evidence supporting the amounts and disclosures in the financial statements, assessing the accounting principles used and significant estimates made by management, and evaluating the overall financial statement presentation. Our audit of internal control over financial reporting included obtaining an understanding of internal control over financial reporting, assessing the risk that a material weakness exists, and testing and evaluating the design and operating effectiveness of internal control based on the assessed risk. Our audits also included performing such other procedures as we considered necessary in the circumstances. We believe that our audits provide a reasonable basis for our opinions.
A company’s internal control over financial reporting is a process designed to provide reasonable assurance regarding the reliability of financial reporting and the preparation of financial statements for external purposes in accordance with generally accepted accounting principles. A company’s internal control over financial reporting includes those policies and procedures that (i) pertain to the maintenance of records that, in reasonable detail, accurately and fairly reflect the transactions and dispositions of the assets of the company; (ii) provide reasonable assurance that transactions are recorded as necessary to permit preparation of financial statements in accordance with generally accepted accounting principles, and that receipts and expenditures of the company are being made only in accordance with authorizations of management and directors of the company; and (iii) provide reasonable assurance regarding prevention or timely detection of unauthorized acquisition, use, or disposition of the company’s assets that could have a material effect on the financial statements.
Because of its inherent limitations, internal control over financial reporting may not prevent or detect misstatements. Also, projections of any evaluation of effectiveness to future periods are subject to the risk that controls may become inadequate because of changes in conditions, or that the degree of compliance with the policies or procedures may deteriorate.
/s/PricewaterhouseCoopers LLP
Baltimore, Maryland
August 22, 2014
79
MICROS SYSTEMS, INC. AND SUBSIDIARIES
CONSOLIDATED BALANCE SHEETS
June 30, | ||||||||
(in thousands, except par value data) | 2014 | 2013 | ||||||
ASSETS | ||||||||
Current Assets: | ||||||||
Cash and cash equivalents | $ | 626,371 | $ | 486,023 | ||||
Short-term investments | 73,437 | 148,046 | ||||||
Accounts receivable, net of allowance for doubtful accounts of $28,565 at June 30, 2014 and $30,418 at June 30, 2013 | 287,616 | 228,455 | ||||||
Inventory | 57,583 | 49,273 | ||||||
Income taxes receivable | 1,619 | 12,771 | ||||||
Deferred income taxes | 13,715 | 15,022 | ||||||
Prepaid expenses and other current assets | 46,129 | 44,648 | ||||||
Total current assets | 1,106,470 | 984,238 | ||||||
Property, plant and equipment, net | 57,966 | 44,127 | ||||||
Deferred income taxes, non-current | 44,661 | 50,186 | ||||||
Goodwill | 458,820 | 432,950 | ||||||
Intangible assets, net | 35,140 | 37,754 | ||||||
Purchased and internally developed software costs, net of accumulated amortization of $102,598 at June 30, 2014 and $93,307 at June 30, 2013 | 40,669 | 32,543 | ||||||
Other assets | 8,918 | 7,240 | ||||||
Total assets | $ | 1,752,644 | $ | 1,589,038 | ||||
LIABILITIES AND SHAREHOLDERS' EQUITY | ||||||||
Current Liabilities: | ||||||||
Bank lines of credit | $ | 0 | $ | 1,757 | ||||
Accounts payable | 78,231 | 73,099 | ||||||
Accrued expenses and other current liabilities | 180,973 | 155,491 | ||||||
Income taxes payable | 8,198 | 11,002 | ||||||
Deferred revenue | 193,897 | 177,236 | ||||||
Total current liabilities | 461,299 | 418,585 | ||||||
Income taxes payable, non-current | 45,429 | 35,019 | ||||||
Deferred income taxes, non-current | 543 | 1,157 | ||||||
Other non-current liabilities | 15,915 | 16,007 | ||||||
Total liabilities | 523,186 | 470,768 | ||||||
Commitments and contingencies (Note 12) | ||||||||
Equity: | ||||||||
MICROS Systems, Inc. Shareholders’ Equity: | ||||||||
Common stock, $0.025 par value authorized 120,000 shares; issued and outstanding 74,830 at June 30, 2014 and 76,732 at June 30, 2013 | 1,871 | 1,918 | ||||||
Retained earnings | 1,203,030 | 1,136,763 | ||||||
Accumulated other comprehensive income (loss) | 21,298 | (23,625 | ) | |||||
Total MICROS Systems, Inc. shareholders' equity | 1,226,199 | 1,115,056 | ||||||
Noncontrolling interest | 3,259 | 3,214 | ||||||
Total equity | 1,229,458 | 1,118,270 | ||||||
Total liabilities and equity | $ | 1,752,644 | $ | 1,589,038 | ||||
The accompanying notes are an integral part of the consolidated financial statements.
80
MICROS SYSTEMS, INC. AND SUBSIDIARIES
CONSOLIDATED STATEMENTS OF OPERATIONS
Fiscal Year Ended June 30, | ||||||||||||
(in thousands, except per share data) | 2014 | 2013 | 2012 | |||||||||
Revenue: | ||||||||||||
Hardware | $ | 319,520 | $ | 269,651 | $ | 237,920 | ||||||
Software | 166,516 | 143,034 | 142,617 | |||||||||
Service | 919,361 | 855,400 | 726,994 | |||||||||
Total revenue | 1,405,397 | 1,268,085 | 1,107,531 | |||||||||
Cost of sales: | ||||||||||||
Hardware | 204,351 | 175,248 | 152,242 | |||||||||
Software | 24,752 | 22,178 | 20,779 | |||||||||
Service | 440,190 | 406,767 | 319,900 | |||||||||
Total cost of sales | 669,293 | 604,193 | 492,921 | |||||||||
Gross margin | 736,104 | 663,892 | 614,610 | |||||||||
Selling, general and administrative expenses (1) | 373,380 | 341,707 | 311,882 | |||||||||
Research and development expenses | 82,028 | 72,602 | 52,031 | |||||||||
Depreciation and amortization | 22,086 | 22,573 | 16,177 | |||||||||
Total operating expenses | 477,494 | 436,882 | 380,090 | |||||||||
Income from operations | 258,610 | 227,010 | 234,520 | |||||||||
Non-operating income (expense): | ||||||||||||
Interest income | 3,914 | 4,593 | 7,354 | |||||||||
Interest expense | (1,313 | ) | (335 | ) | (566 | ) | ||||||
Other income (expense), net (2) | 165 | 2,537 | (4,117 | ) | ||||||||
Total non-operating income, net | 2,766 | 6,795 | 2,671 | |||||||||
Income before taxes | 261,376 | 233,805 | 237,191 | |||||||||
Income tax provision | 79,197 | 61,958 | 70,090 | |||||||||
Net income | 182,179 | 171,847 | 167,101 | |||||||||
Less: Net income attributable to non-controlling interest | (165 | ) | (429 | ) | (118 | ) | ||||||
Net income attributable to MICROS Systems, Inc. | $ | 182,014 | $ | 171,418 | $ | 166,983 | ||||||
Net income per share attributable to MICROS Systems, Inc. common shareholders: | ||||||||||||
Basic | $ | 2.42 | $ | 2.16 | $ | 2.08 | ||||||
Diluted | $ | 2.37 | $ | 2.12 | $ | 2.03 | ||||||
Weighted-average number of shares outstanding: | ||||||||||||
Basic | 75,217 | 79,247 | 80,300 | |||||||||
Diluted | 76,803 | 80,772 | 82,238 | |||||||||
The details of total other-than-temporary impairment losses (“OTTI”) of long-term investments included in other non-operating income (expense) are as follows (2):
Fiscal Year Ended June 30, | ||||||||||||
(in thousands) | 2014 | 2013 | 2012 | |||||||||
Credit based OTTI recognized in non-operating income/(expense) | $ | 0 | $ | 600 | $ | 4,000 | ||||||
(1) See Note 12 “Contingencies” in Notes to Consolidated Financial Statements.
(2) See Note 3 “Financial Instruments and Fair Value Measurements” in Notes to Consolidated Financial Statements.
The accompanying notes are an integral part of the consolidated financial statements.
81
MICROS SYSTEMS, INC. AND SUBSIDIARIES
CONSOLIDATED STATEMENTS OF COMPREHENSIVE INCOME
Fiscal Year Ended June 30, | ||||||||||||
(in thousands) | 2014 | 2013 | 2012 | |||||||||
Net income | $ | 182,179 | $ | 171,847 | $ | 167,101 | ||||||
Other comprehensive income (loss), net of taxes: | ||||||||||||
Foreign currency translation adjustments, net of tax of $0 | 45,892 | (8,879 | ) | (67,913 | ) | |||||||
Change in unrealized gains on long-term investments, net of tax of $0, $1,652 and $741 | — | 2,683 | 1,203 | |||||||||
Change in unrealized (losses) gains related to pension plans, net of tax (benefit) of ($50), $105 and $0 | (979 | ) | 366 | — | ||||||||
Total other comprehensive income (loss), net of taxes | 44,913 | (5,830 | ) | (66,710 | ) | |||||||
Comprehensive income | 227,092 | 166,017 | 100,391 | |||||||||
Comprehensive (income) loss attributable to non-controlling interest | (155 | ) | (377 | ) | 422 | |||||||
Comprehensive income attributable to MICROS Systems, Inc. | $ | 226,937 | $ | 165,640 | $ | 100,813 | ||||||
The accompanying notes are an integral part of the consolidated financial statements.
82
MICROS SYSTEMS, INC. AND SUBSIDIARIES
CONSOLIDATED STATEMENTS OF CASH FLOWS
Fiscal Year Ended June 30, | ||||||||||||
(in thousands) | 2014 | 2013 | 2012 | |||||||||
Cash flows from operating activities: | ||||||||||||
Net income | $ | 182,179 | $ | 171,847 | $ | 167,101 | ||||||
Adjustments to reconcile net income to net cash provided by operating activities: | ||||||||||||
Depreciation and amortization | 22,086 | 22,573 | 16,177 | |||||||||
Share-based compensation | 22,057 | 21,102 | 16,501 | |||||||||
Amortization of capitalized software | 6,483 | 5,208 | 7,148 | |||||||||
Provision for losses on accounts receivable | 1,540 | 3,563 | 7,137 | |||||||||
Gain on sales of auction rate securities | 0 | (4,094 | ) | 0 | ||||||||
Other-than-temporary impairment losses on investments, net | 0 | 600 | 4,000 | |||||||||
Deferred income taxes | 7,310 | (2,702 | ) | (3,436 | ) | |||||||
Other | 134 | 0 | 978 | |||||||||
Changes in operating assets and liabilities (net of impact of acquisitions): | ||||||||||||
(Increase) decrease in accounts receivable | (53,237 | ) | 2,430 | (40,095 | ) | |||||||
Increase in inventory | (6,982 | ) | (5,302 | ) | (1,751 | ) | ||||||
Decrease (increase) in prepaid expenses and other assets | 1,191 | (7,833 | ) | (1,790 | ) | |||||||
Increase in accounts payable | 3,198 | 3,163 | 2,507 | |||||||||
Increase (decrease) in accrued expenses and other current liabilities | 24,061 | (13,682 | ) | 2,551 | ||||||||
Increase (decrease) in income tax assets and liabilities | 17,951 | (2,587 | ) | (1,755 | ) | |||||||
Increase in deferred revenue | 11,490 | 9,239 | 4,676 | |||||||||
Net cash flows provided by operating activities | 239,461 | 203,525 | 179,949 | |||||||||
Cash flows from investing activities: | ||||||||||||
Proceeds from maturities of investments | 187,636 | 56,620 | 158,819 | |||||||||
Proceeds from sales of investments | 0 | 42,119 | 19,655 | |||||||||
Purchases of short-term investments | (110,984 | ) | (186,371 | ) | (78,816 | ) | ||||||
Purchases of property, plant and equipment | (31,627 | ) | (23,282 | ) | (17,468 | ) | ||||||
Internally developed software costs | (12,448 | ) | (4,290 | ) | (7,197 | ) | ||||||
Net cash paid for acquisitions, net of cash acquired | 0 | (4 | ) | (258,940 | ) | |||||||
Other | (1,415 | ) | 157 | 67 | ||||||||
Net cash flows provided by (used in) investing activities | 31,162 | (115,051 | ) | (183,880 | ) | |||||||
Cash flows from financing activities: | ||||||||||||
Repurchases of common stock | (215,721 | ) | (176,603 | ) | (59,199 | ) | ||||||
Proceeds from stock option exercises | 74,026 | 9,056 | 14,933 | |||||||||
Realized tax benefits from stock option exercises | 3,763 | 3,323 | 4,717 | |||||||||
Proceeds from line of credit | 539 | 4,014 | 0 | |||||||||
Principal payments on line of credit and short term loan | (1,893 | ) | (2,061 | ) | 0 | |||||||
Cash paid for acquisition of non-controlling interest | 0 | (846 | ) | (4,212 | ) | |||||||
Other | (189 | ) | 9 | (123 | ) | |||||||
Net cash flows used in financing activities | (139,475 | ) | (163,108 | ) | (43,884 | ) | ||||||
Effect of exchange rate changes on cash and cash equivalents | 9,200 | (2,129 | ) | (50,658 | ) | |||||||
Net increase (decrease) in cash and cash equivalents | 140,348 | (76,763 | ) | (98,473 | ) | |||||||
Cash and cash equivalents at beginning of year | 486,023 | 562,786 | 661,259 | |||||||||
Cash and cash equivalents at end of year | $ | 626,371 | $ | 486,023 | $ | 562,786 | ||||||
Supplemental disclosures of cash flow information: | ||||||||||||
Cash paid during the fiscal year for: | ||||||||||||
Interest | $ | 1,082 | $ | 80 | $ | 290 | ||||||
Income taxes | $ | 41,823 | $ | 60,522 | $ | 61,612 | ||||||
The accompanying notes are an integral part of the consolidated financial statements.
83
MICROS SYSTEMS, INC. AND SUBSIDIARIES
CONSOLIDATED STATEMENTS OF SHAREHOLDERS’ EQUITY
MICROS Systems, Inc. Shareholders | |||||||||||||||||||||||||||
Common Stock | Capital in Excess of Par | Retained Earnings | Accumulated Other Comprehensive Income (Loss) | Non- controlling Interest | |||||||||||||||||||||||
(in thousands) | Shares | Amount | Total | ||||||||||||||||||||||||
Balance, June 30, 2011 | 80,805 | $ | 2,020 | $ | 132,529 | $ | 833,839 | $ | 48,323 | $ | 6,540 | $ | 1,023,251 | ||||||||||||||
Net income | 0 | 0 | 0 | 166,983 | 0 | 118 | 167,101 | ||||||||||||||||||||
Foreign currency translation adjustments, net of tax of $0 | 0 | 0 | 0 | 0 | (67,373 | ) | (540 | ) | (67,913 | ) | |||||||||||||||||
Change in unrealized losses on long-term investments, net of tax benefit of $741 | 0 | 0 | 0 | 0 | 1,203 | 0 | 1,203 | ||||||||||||||||||||
Non-controlling interest put arrangement | 0 | 0 | 0 | 0 | 0 | 0 | 0 | ||||||||||||||||||||
Acquisition of non-controlling interest | 0 | 0 | (2,069 | ) | 0 | 0 | (2,632 | ) | (4,701 | ) | |||||||||||||||||
Dividends to non-controlling interest | 0 | 0 | 0 | 0 | 0 | 0 | 0 | ||||||||||||||||||||
Share-based compensation | 0 | 0 | 16,501 | 0 | 0 | 0 | 16,501 | ||||||||||||||||||||
Stock issued upon exercise of options | 792 | 20 | 14,913 | 0 | 0 | 0 | 14,933 | ||||||||||||||||||||
Repurchases of stock | (1,288 | ) | (32 | ) | (59,167 | ) | 0 | 0 | 0 | (59,199 | ) | ||||||||||||||||
Income tax benefit from options exercised | 0 | 0 | 4,955 | 0 | 0 | 0 | 4,955 | ||||||||||||||||||||
Balance, June 30, 2012 | 80,309 | 2,008 | 107,662 | 1,000,822 | (17,847 | ) | 3,486 | 1,096,131 | |||||||||||||||||||
Net income | 0 | 0 | 0 | 171,418 | 0 | 429 | 171,847 | ||||||||||||||||||||
Foreign currency translation adjustments, net of tax of $0 | 0 | 0 | 0 | 0 | (8,827 | ) | (52 | ) | (8,879 | ) | |||||||||||||||||
Change in unrealized gains on long-term investments, net of tax of $1,652 | 0 | 0 | 0 | 0 | 2,683 | 0 | 2,683 | ||||||||||||||||||||
Change in unrealized gains related to pension plans, net of tax of $105 | 0 | 0 | 0 | 0 | 366 | 0 | 366 | ||||||||||||||||||||
Acquisition of non-controlling interest | 0 | 0 | (197 | ) | 0 | 0 | (649 | ) | (846 | ) | |||||||||||||||||
Share-based compensation | 0 | 0 | 21,102 | 0 | 0 | 0 | 21,102 | ||||||||||||||||||||
Stock issued upon exercise of options | 480 | 11 | 9,045 | 0 | 0 | 0 | 9,056 | ||||||||||||||||||||
Repurchases of stock | (4,057 | ) | (101 | ) | (141,025 | ) | (35,477 | ) | 0 | 0 | (176,603 | ) | |||||||||||||||
Income tax benefit from options exercised | 0 | 0 | 3,413 | 0 | 0 | 0 | 3,413 | ||||||||||||||||||||
Balance, June 30, 2013 | 76,732 | 1,918 | 0 | 1,136,763 | (23,625 | ) | 3,214 | 1,118,270 | |||||||||||||||||||
Net income | 0 | 0 | 0 | 182,014 | 0 | 165 | 182,179 | ||||||||||||||||||||
Foreign currency translation adjustments, net of tax of $0 | 0 | 0 | 0 | 0 | 45,902 | (10 | ) | 45,892 | |||||||||||||||||||
Change in unrealized gains related to pension plans, net of tax benefit of $50 | 0 | 0 | 0 | 0 | (979 | ) | 0 | (979 | ) | ||||||||||||||||||
Dividends to non-controlling interest | 0 | 0 | 0 | 0 | 0 | (110 | ) | (110 | ) | ||||||||||||||||||
Share-based compensation | 0 | 0 | 0 | 22,057 | 0 | 0 | 22,057 | ||||||||||||||||||||
Stock issued upon exercise of options | 2,310 | 58 | 0 | 73,968 | 0 | 0 | 74,026 | ||||||||||||||||||||
Repurchases of stock | (4,212 | ) | (105 | ) | 0 | (215,616 | ) | 0 | 0 | (215,721 | ) | ||||||||||||||||
Income tax benefit from options exercised | 0 | 0 | 0 | 3,844 | 0 | 0 | 3,844 | ||||||||||||||||||||
Balance, June 30, 2014 | 74,830 | $ | 1,871 | $ | 0 | $ | 1,203,030 | $ | 21,298 | $ | 3,259 | $ | 1,229,458 | ||||||||||||||
The accompanying notes are an integral part of the consolidated financial statements.
84
MICROS SYSTEMS, INC. AND SUBSIDIARIES
NOTES TO CONSOLIDATED FINANCIAL STATEMENTS
1. | PLAN OF MERGER: |
On June 22, 2014, MICROS entered into the Merger Agreement with Purchaser, Parent and, solely for certain limited purposes, Oracle. Pursuant to the Merger Agreement and subject to the terms and conditions of the Merger Agreement, Parent and Purchaser commenced the Offer to acquire all of the shares of the Company’s common stock for a purchase price of $68.00 per share, payable net to the sellers in cash, without interest thereon and subject to any required withholding of taxes. The Merger Agreement provides, among other things, that as soon as practicable following the completion of the Offer and satisfaction or waiver of all other applicable conditions set forth in the Merger Agreement, MICROS and Purchaser will complete the Merger with the Company surviving the Merger as a wholly-owned subsidiary of Oracle.
Parent and Purchaser commenced the Offer on July 3, 2014, and they extended the deadline for responding to the Offer to September 2, 2014. On July 16, 2014, the waiting period under the HSR Act applicable to the Offer expired. Because both MICROS and Oracle do significant business in the European Union, under the ECM Regulations, the purchase of shares pursuant to the Offer and the Merger may not be completed until the expiration of a 25 business day waiting period following the filing of a notification (Form CO) concerning the Offer and the Merger with the European Commission (the “Commission”), unless the waiting period is earlier terminated. On July 24, 2014, the Form CO was submitted by Oracle, which began the 25 business day review period. The review period is scheduled to terminate on August 29, 2014, unless extended by the Commission.
For additional information regarding the Merger Agreement, the Offer and the Merger, see Part I, Item 1, “Business - Introduction - Recent Developments.”
2. | DESCRIPTION OF BUSINESS AND SUMMARY OF SIGNIFICANT ACCOUNTING POLICIES: |
DESCRIPTION OF BUSINESS
MICROS Systems, Inc. is a leading worldwide designer, manufacturer, marketer and servicer of enterprise applications for the global food and beverage, hotel, and retail industries. The Company’s solutions consist of application specific software and hardware systems, supplemented by a wide range of services. The food and beverage and hotel industries (sometimes referred to collectively as the hospitality industry) include numerous defined markets such as lodging (including individual hotel sites and hotel chains), table service restaurants, quick service restaurants, entertainment venues such as stadiums and arenas, business food service operations, casinos, transportation food service, government operations, and cruise ships. The retail industry consists of retail operations selling to consumers both general and specific products, such as clothing, shoes, food, hardware, jewelry, and other specialty items. (References to “MICROS” or the “Company” in these notes include the operations of MICROS Systems, Inc. and its subsidiaries on a consolidated basis, unless the context indicates otherwise.)
BASIS OF PREPARATION AND USE OF ESTIMATES
The preparation of consolidated financial statements in accordance with accounting principles generally accepted in the United States of America requires management to make estimates and assumptions that affect the amounts reported in the Company’s consolidated financial statements and accompanying notes. Although these estimates are based on assumptions that management believes are reasonable and management’s knowledge of current matters pertaining to the Company and activities that management anticipates the Company may undertake in the future, actual results may differ from these estimates.
PRINCIPLES OF CONSOLIDATION
The consolidated financial statements include the accounts of the Company and its majority-owned subsidiaries. The net income attributable to MICROS Systems, Inc. is recorded net of non-controlling interest. Investments in 20% through 50% owned affiliated companies and any investments in other companies in which the Company exercises significant influence over operating and financial affairs, are accounted for under the equity method. Otherwise, investments are recorded at cost. All intercompany accounts and transactions have been eliminated.
FOREIGN CURRENCY TRANSLATION
The financial statements of the Company’s non-U.S. operations are translated into U.S. dollars for financial reporting purposes. The assets and liabilities of non-U.S. operations whose functional currencies are not the U.S. dollar are translated at the fiscal year-end exchange rates, while revenues and expenses are translated at month-end exchange rates during the fiscal year which approximate weighted average exchange rates. Specifically, the applicable exchange rates used in the financial
85
statements are based on the exchange rates in effect on the last business day of each month. The cumulative translation effects are reported in accumulated other comprehensive income, a separate component of shareholders’ equity. Gains and losses on monetary transactions denominated in other than the functional currency of an operation are reflected in other income (expense).
REVENUE RECOGNITION
The Company’s revenue is generated from the sale of software licenses, hardware, professional services and maintenance support.
Software
The Company’s proprietary software consists of hotel, food and beverage, and retail software systems. The Company also resells various third party software products. All software products are offered on a stand-alone basis, and can be used either with third party hardware products or the Company’s hardware products.
Revenue from software licenses is recognized when the following four basic criteria are met as follows:
• | Persuasive evidence of an arrangement exists: The Company requires a contract signed by both parties to the agreement or a purchase order received from the customer as persuasive evidence of an arrangement. |
• | Delivery has occurred or services have been rendered: Delivery occurs when risk of ownership has passed to the buyer or in the case of electronic delivery, when the customer is given access to the licensed programs. The Company deems its OPERA software to be delivered when ready to “go live” (i.e., the software is ready to be used in the ordinary course of the client’s business). |
• | Fixed or determinable fee: The Company considers the license fee to be fixed or determinable if the fee is not subject to refund or adjustment and is payable within its normal payment terms, generally within 90 days of delivery, with generally no more than 20% of the contract price due at the end of the payment term. If a software license arrangement contains significant customer acceptance criteria or a cancellation right, recognition of the software revenue is deferred until the earlier of customer acceptance or the expiration of the acceptance period or cancellation right. If the arrangement fee is not fixed or determinable, the Company recognizes the revenue as amounts become due and payable. |
• | Collection is probable: The Company performs a credit review to determine the creditworthiness of the customer. Collection is deemed probable if the Company expects that the customer will be able to pay amounts under the arrangement as they become due. If the Company determines collection is not probable, revenue is recognized as collection occurs. |
Hardware
The Company’s main proprietary hardware is point-of-sale terminals. The Company also sells other proprietary hardware devices, such as cash drawers, handheld order entry terminals and pole displays and also resells various non-proprietary hardware products, including personal computers, servers, printers, credit card processing network cards and other related computer equipment. Hardware revenue is recognized when persuasive evidence of an arrangement exists, delivery has occurred, the fee is fixed or determinable, and collectability is reasonably assured. If these four criteria have not been satisfied at the time of shipment, recognition of the hardware revenue is deferred until the Company determines that all four criteria have been met.
The Company’s hardware includes certain embedded system software which is used solely in connection with the operation of the hardware and is incidental to the hardware product as a whole; once installed, the embedded system software is not updated for new versions that are subsequently developed.
Generally, when the Company is primarily obligated in a transaction, subject to inventory risk, has latitude in establishing prices and selecting suppliers, or has some but not all of these indicators, revenue is recorded at the gross sales price.
Services
The Company also provides maintenance, support, and professional services, such as implementation, customer specific development, software hosting, software as a service and ecommerce design and development. Revenue from maintenance support, software-hosting services and software as a service contracts is initially recorded as deferred revenue and is recognized ratably over the contract term. Customer setup fees in hosting and software as a service arrangements are recognized over the
86
estimated customer relationship period and have not been significant to date. Revenue related to professional services is recognized as the service is rendered provided all the other criteria for revenue recognition have been met.
The Company’s software is ready for use by the customer upon receipt. While many clients’ may choose to tailor the software to fit their specific needs or request the Company’s assistance activating the programs, the Company’s implementation services do not typically involve significant customization to, or development of, the underlying source code. Accordingly, while revenue from implementation services is recognized as the service is rendered, provided all the other criteria for revenue recognition have been met, the provision of implementation services does not generally change when software revenue is recognized as set forth above in “Software;” however, in those instances where the Company does provide significant customization to or further development of the underlying software as part of implementation, software revenue recognition is deferred until delivery (or, where applicable, customer acceptance) of the customized software has occurred.
Revenue from fixed price ecommerce design and development contracts, where the software product is designed, developed or modified to the client’s specifications is recognized on a percentage of completion basis based on the estimated costs incurred compared to total estimated costs. This method is used because reasonably dependable estimates of the revenues and the project progress applicable to various states of an arrangement can be made, based on historical experience and milestones set in the contract. The Company defers the recognition of all revenue if the Company’s ability to estimate its progress is not reasonably dependable.
Multiple Element Arrangements
The Company accounts for multiple element arrangements that consist of software and software-related services, collectively referred to as “software elements” in accordance with industry specific accounting guidance for software and software-related transactions. For such transactions, the fee is allocated to the various elements based on vendor-specific objective evidence of fair value, which is either the price charged when the same element is sold separately or, if the element is not sold separately, the price established by management having the relevant authority, if it is probable that the price, once established, will not change before the separate introduction of the element into the marketplace. Except as set forth in the following sentence, if sufficient vendor-specific objective evidence of fair value does not exist, all revenue from the arrangement is deferred until all elements of the arrangement have been delivered or, if earlier, such sufficient vendor-specific objective evidence of fair value does exist. However, when the fair value of a delivered element has not been established, but fair value exists for the undelivered elements, the Company uses the residual method to recognize revenue. Under the residual method, the fair value of the undelivered elements is deferred and the remaining portion of the arrangement fee is allocated to the delivered elements and is recognized as revenue upon delivery, provided the other revenue recognition criteria are met.
For multiple element arrangements that include tangible products with incidental embedded software and other related services, collectively referred to as “non-software elements”, the Company allocates revenue to all deliverables based on their relative selling prices. In such circumstances, the Company uses the following hierarchy to determine the selling price to be used for allocating revenue to deliverables: (i) vendor-specific objective evidence of fair value, (ii) third-party evidence of selling price, and (iii) best estimate of the selling price. Best estimate of selling price reflects the Company’s estimates of what the selling prices of elements would be if they were sold regularly on a stand-alone basis. Factors considered by the Company in developing relative selling prices for products and services include the clients' geographical region, customer concentrations, the use of typical discounts from list prices, prices charged by the Company for similar offerings and the Company’s historical pricing practices.
For multiple element arrangements that include a combination of software elements and non-software elements, the Company first allocates the arrangement revenue to the software elements as a group and the non-software elements as a group based on each group’s relative selling prices. In such circumstances, the Company uses the hierarchy described above to determine the relative selling price to be used to allocating revenue to each the group. After this initial allocation has occurred, the Company allocates revenue to any separate deliverables within each group using the methodology described above.
Other
Costs related to shipping and handling and billable travel expenses are included in cost of sales.
FINANCIAL INSTRUMENTS AND FAIR VALUE MEASUREMENTS
The fair market values of cash and cash equivalents, marketable securities, accounts receivable, accounts payable, accrued expenses and income taxes payable at both June 30, 2014 and 2013 approximate their carrying amounts.
The Company considers all highly liquid investments with a maturity of generally three months or less at the date of purchase to be cash equivalents. These investments are recorded at cost which approximates fair value. Investments with
87
original maturities of greater than three months and remaining maturities of less than one year are classified as short-term investments. These investments are classified as available-for-sale securities and are recorded at fair value which approximates cost.
The Company periodically reviews each investment to identify any unrealized losses and evaluates whether the losses are temporary in nature. Unrealized losses that are determined to be temporary in nature are reported, net of tax, in accumulated other comprehensive income. Other-than-temporary “credit loss” (loss due to the security issuer’s credit risk) is recognized, net of tax and valuation allowances, in the consolidated statements of operations, while other-than-temporary impairment losses related to factors other than credit loss is recognized, net of tax, in accumulated other comprehensive income.
ALLOWANCE FOR DOUBTFUL ACCOUNTS
The Company maintains allowances for doubtful accounts for estimated losses that may result from the inability of the Company’s clients to make required payments. The Company’s methodology for determining this allowance requires estimates and is based on the age of the receivable, actual collection experience, the client’s payment practices and history, inquiries, credit reports from third parties and other financial information.
INVENTORY
Inventory is stated at the lower of cost or market. Cost is determined principally on a first-in, first-out basis. Inventory quantities on hand, future purchase commitments provided to the Company’s suppliers and the estimated utility of the Company’s inventory is reviewed regularly. If the review indicates a reduction in utility of inventory below carrying value, the inventory is adjusted and a charge to cost of sales is recorded in an amount equal to the adjustment.
PROPERTY, PLANT AND EQUIPMENT
Property, plant and equipment are stated at cost and depreciated using the straight-line method over their estimated useful lives, ranging from three to ten years. Leasehold improvements are amortized over the life of the lease or estimated useful lives, whichever is shorter. Maintenance and repairs are charged to expense as incurred, and the costs of additions and improvements are capitalized. Any gain or loss from the retirement or sale of an asset is credited or charged to operations in the current period. Internally used computer software is amortized on a straight-line basis over the estimated life of the software ranging up to seven years.
PURCHASED AND INTERNALLY DEVELOPED SOFTWARE COSTS
Costs incurred in the research and development of new software products to be licensed to others, primarily consisting of salaries, employee benefits and administrative costs, are expensed as incurred and included in research and development expenses until technological feasibility is established. The capitalization of software development costs on a product-by-product basis starts when a product’s technological feasibility has been established and ends when the product is available for general release to clients, at which time amortization of the capitalized software development costs begins. Technological feasibility is established when the product reaches the working model stage. The fair values of software purchased with acquisitions are also included in capitalized software development costs.
Annual amortization of purchased and internally developed software costs is either included in software cost of sales or services cost of sales. For each capitalized software product, the annual amortization is equal to the greater of: (i) the amount computed using the ratio that the software product’s current fiscal year gross revenue bears to the total current fiscal year and anticipated future gross revenues for that product or (ii) the amount computed based on straight-line method over the remaining estimated economic life of the product. Amortization expenses for fiscal years 2014, 2013 and 2012 were approximately $6.5 million, $5.2 million and $7.1 million, respectively.
LONG-LIVED ASSETS INCLUDING FINITE-LIVED PURCHASED INTANGIBLE ASSETS
The Company evaluates long-lived assets, including finite-lived purchased intangible assets, for impairment whenever events and changes in circumstances indicate that the carrying amount of an asset may not be fully recoverable. The Company compares the fair value of the assets based on the undiscounted cash flows the assets are expected to generate (or market value, if available) to the net book value of the assets. If the fair value is less than net book value, the asset is impaired and the Company recognizes an impairment loss equal to the excess of the net book value over the fair value.
During the fiscal years ended June 30, 2014, 2013 and 2012, the Company recorded approximately $0.1 million, $0.7 million and $1.3 million, respectively, in accelerated amortization expenses related to finite-lived customer relationship intangible assets due to increased attrition of customer relationships. During fiscal years 2014, 2013 and 2012, the Company did not recognize any impairment losses on long-lived assets, including finite-lived purchased intangible assets.
88
GOODWILL AND INDEFINITE-LIVED PURCHASED INTANGIBLE ASSETS
The Company assesses annually, in the first quarter of the fiscal year, whether goodwill and certain of its trademarks, which are the Company’s only indefinite-lived purchased intangible assets, are impaired. Goodwill is evaluated for impairment by comparing the fair value of each of the Company’s reporting units (U.S./Canada, EAME, the Asia-Pacific, and Latin America) to its respective book value. The Company first determines, based on a qualitative assessment, whether it is more likely than not that the fair value of the reporting unit is less than its carrying amount. If the Company concludes that it is more likely than not that the fair value of a reporting unit is less than its carrying value, then the Company determines the fair value of the reporting unit based on a weighting of future income approach (i.e., discounted future income) and market approach (i.e., a comparison to the purchase and sale of similar assets in the relevant industry). If the fair value of the reporting unit exceeds the book value of the net assets assigned to that unit, goodwill is not impaired. If goodwill is impaired, the Company recognizes an impairment loss based on the amount by which the book value of goodwill exceeds its implied fair value. The implied fair value of goodwill is determined by deducting the fair value of a reporting unit’s identifiable assets and liabilities from the fair value of the reporting unit as a whole, as if that reporting unit had just been acquired and the fair value of the individual assets acquired and liabilities assumed were being determined initially.
Additional impairment assessments may be performed on an interim basis if the Company encounters events or changes in circumstances indicating that it is more likely than not that the book value of goodwill and/or indefinite-lived trademarks has been impaired.
The process of evaluating the potential impairment of goodwill and/or indefinite-lived trademarks is subjective and requires judgment at many points during the analysis. In estimating the fair value of the reporting units with recognized goodwill for the purposes of its annual or interim analyses, the Company makes estimates and judgments about the future cash flows of these reporting units. The cash flow forecasts are based on assumptions that are consistent with the plans and estimates used to manage the underlying reporting units. The Company also considers its market capitalization on the date the analysis is performed which, in the three years ended June 30, 2014 has been significantly in excess of its carrying value.
ADVERTISING COSTS
Advertising costs are charged to expense as incurred. Advertising expenses for fiscal years 2014, 2013 and 2012 were approximately $6.2 million, $5.5 million and $5.0 million, respectively.
RESEARCH AND DEVELOPMENT COSTS
Research and development costs, primarily consisting of salaries, employee benefits (including shared-based compensation expenses) and administrative costs (other than capitalized software development costs) are charged to operations as incurred.
SHARE-BASED COMPENSATION
The Company estimates the fair value of its option awards granted under its stock option program as of the date of grant, and recognizes non-cash share-based compensation expense, adjusted for expected pre-vesting forfeitures, ratably over the requisite service (i.e. vesting) period of options in the consolidated statement of operations. The Company values stock options using the Black-Scholes option pricing model, which was developed for use in estimating the fair value of traded options that are fully transferable and have no vesting restrictions. Therefore, the Company is required to make assumptions about volatility rates, expected term of options, dividend yields and applicable interest rates in determining the estimated fair value. Expected volatility is based on historical stock prices. The expected term of options granted is based on historical option activities, adjusted for the remaining option life cycle by assuming ratable exercise of any unexercised vested options over the remaining term. The risk-free interest rate is based on the U.S. Treasury yield curve in effect at the time of grant. See Note 4, “Share-Based Compensation” for further detail.
WARRANTIES
The Company’s hardware products are sold under warranty for defects in material and workmanship for a period ranging generally from three to 48 months. The Company establishes an accrual for estimated warranty costs at the time of sale. Historically, the Company’s warranty expense has not been material.
INCOME TAXES
Income taxes are accounted for under the asset and liability method. Deferred tax assets and liabilities are recognized for the expected future tax consequences attributable to the differences between the financial statement carrying amounts and the tax basis of assets and liabilities. Deferred tax assets and liabilities are measured using the enacted tax rates in effect for the year in which those temporary differences are expected to be recovered or settled. The effect on the deferred tax assets and
89
liabilities of a change in tax rate is recognized in the results of operations in the period that includes the enactment date of the change. Valuation allowances are established when necessary to reduce deferred tax assets to the amounts more likely than not to be realized. If the Company determines that it will not be able to realize all or part of its net deferred tax asset in the future, an adjustment to the deferred tax asset is charged to the deferred income tax provision in the period such determination is made.
The Company reviews its uncertain income tax positions and applies a “more likely than not” threshold to the recognition and derecognition of tax positions in the financial statements.
NET INCOME PER SHARE ATTRIBUTABLE TO MICROS SYSTEMS, INC. COMMON SHAREHOLDERS
Basic net income per share attributable to MICROS Systems, Inc. common shareholders is computed by dividing net income available to MICROS Systems, Inc. by the weighted-average number of shares outstanding. Diluted net income per share attributable to MICROS Systems, Inc. common shareholders includes additional dilution from potential common stock issuable upon the exercise of outstanding stock options.
The following table provides a reconciliation of the net income attributable to MICROS Systems, Inc. to basic and diluted net income per share:
Fiscal Year Ended June 30, | ||||||||||||
(in thousands, except per share data) | 2014 | 2013 | 2012 | |||||||||
Net income attributable to MICROS Systems, Inc. | $ | 182,014 | $ | 171,418 | $ | 166,983 | ||||||
Average common shares outstanding | 75,217 | 79,247 | 80,300 | |||||||||
Dilutive effect of outstanding stock options | 1,586 | 1,525 | 1,938 | |||||||||
Average common shares outstanding assuming dilution | 76,803 | 80,772 | 82,238 | |||||||||
Basic net income per share attributable to MICROS Systems, Inc. common shareholders | $ | 2.42 | $ | 2.16 | $ | 2.08 | ||||||
Diluted net income per share attributable to MICROS Systems, Inc. common shareholders | $ | 2.37 | $ | 2.12 | $ | 2.03 | ||||||
Anti-dilutive weighted shares excluded from reconciliation | 1,820 | 2,498 | 1,702 | |||||||||
Fiscal years 2014, 2013 and 2012 include approximately $22.1 million ($15.1 million, net of tax), $21.1 million ($14.4 million, net of tax) and $16.5 million ($11.3 million, net of tax), respectively, in non-cash share-based compensation expense. These non-cash share-based compensation expenses reduced diluted net income per share attributable to MICROS Systems, Inc. common shareholders by $0.20, $0.18 and $0.14 for fiscal years 2014, 2013 and 2012, respectively. See Note 4 “Share-based Compensation” for further detail.
RECENT ACCOUNTING STANDARDS
Recently Adopted Accounting Pronouncements
On July 1, 2013, the Company adopted Financial Accounting Standards Board (“FASB”) revised guidance on how an entity tests indefinite-lived intangible assets for impairment. Under the new guidance, an entity is no longer required to calculate the fair value of the indefinite-lived intangible assets and perform the quantitative impairment test unless the entity determines, based on a qualitative assessment, that it is more likely than not that the fair value of an indefinite-lived intangible asset is less than its carrying amount. The adoption of this guidance did not have an impact on the Company's consolidated financial statements.
On July 1, 2013, the Company adopted FASB guidance on disclosure requirements for items reclassified out of Accumulated Other Comprehensive Income (“AOCI”). This new guidance requires entities to present (either on the face of the income statement or in the notes to the financial statements) the effects on the line items of the income statement when amounts are reclassified out of AOCI. The adoption of this guidance did not have a significant impact on the Company's consolidated financial statements.
90
Recent Accounting Guidance Not Yet Adopted
In May 2014, the FASB issued a new guidance related to revenue recognition. Under the new guidance, recognition of revenue occurs when a customer obtains control of promised goods or services in an amount that reflects the consideration to which the entity expects to receive in exchange for those goods or services. In addition, the guidance requires disclosure of the nature, amount, timing, and uncertainty of revenue and cash flows arising from contracts with customers. The guidance will be effective for the Company beginning on July 1, 2017 and early adoption is not permitted. The Company is currently evaluating the effects that the adoption of this guidance will have on the Company’s consolidated financial statements.
In July 2013, the FASB issued guidance on the financial statement presentation of an unrecognized tax benefit when a net operating loss carryforward, a similar tax loss, or a tax credit carryforward exists. The guidance requires that an unrecognized tax benefit should be presented in the financial statements as a reduction to a deferred tax asset for a net operating loss carryforward, a similar tax loss, or a tax credit carryforward. However, to the extent that the deferred tax asset is not available at the reporting date under the tax law of the applicable jurisdiction to settle any additional income taxes that would result from the disallowance of the tax position, or if the tax law of the jurisdiction does not require the entity to use, and the entity does not intend to use, the deferred tax asset for such purpose, the unrecognized tax benefit should be presented in the financial statements as a liability. This guidance is effective for the Company beginning in its fiscal year ending June 30, 2015, and will result only in presentation changes in the consolidated balance sheet, which we do not expect to be significant.
3. | FINANCIAL INSTRUMENTS AND FAIR VALUE MEASUREMENTS |
Short-term and long-term investments consist of the following:
As of June 30, 2014 | As of June 30, 2013 | |||||||||||||||
(in thousands) | Amortized Cost Basis | Aggregate Fair Value | Amortized Cost Basis | Aggregate Fair Value | ||||||||||||
Time deposit – U.S. | $ | 0 | $ | 0 | $ | 53,862 | $ | 53,862 | ||||||||
Time deposit – international | 73,437 | 73,437 | 28,832 | 28,832 | ||||||||||||
U.S. government debt securities | — | — | 65,352 | 65,352 | ||||||||||||
Total investments | $ | 73,437 | $ | 73,437 | $ | 148,046 | $ | 148,046 | ||||||||
Fair value is the price that would be received to sell an asset or paid to transfer a liability in an orderly transaction between market participants at the measurement date (exit price). The following hierarchy prioritizes the inputs (generally, assumptions that market participants use in pricing an asset or liability) used to measure fair value based on the quality and reliability of the information provided by the inputs:
• | Level 1 - Unadjusted quoted prices in active markets that are accessible at the measurement date for identical, unrestricted assets or liabilities. The Company considers active markets as those in which transactions for the assets or liabilities occur with sufficient frequency and volume to provide pricing information on an ongoing basis. |
• | Level 2 - Quoted prices for similar assets or liabilities in active markets; quoted prices for identical assets or liabilities in markets that are not active; inputs that are observable, either directly or indirectly, for substantially the full term of the asset or liability; inputs that are derived principally from or corroborated by observable market data or other means. |
• | Level 3 - Measured based on prices or valuation models using unobservable inputs to the extent relevant observable inputs are not available (i.e., where there is little or no market activity for the asset or liability). |
91
The following table provides information regarding the financial assets accounted for at fair value on a recurring basis and the type of inputs used to value the assets:
(in thousands) | Level 1 | Level 2 | Level 3 | Total | ||||||||||||
Balance, June 30, 2014: | ||||||||||||||||
Short-term investments: | ||||||||||||||||
Time deposit – international | $ | — | $ | 73,437 | $ | — | $ | 73,437 | ||||||||
Total short-term investments | $ | — | $ | 73,437 | $ | — | $ | 73,437 | ||||||||
Balance, June 30, 2013: | ||||||||||||||||
Short-term and long-term investments: | ||||||||||||||||
Time deposit - U.S. | $ | — | $ | 53,862 | $ | — | $ | 53,862 | ||||||||
Time deposit – international | — | 28,832 | — | 28,832 | ||||||||||||
U.S. government debt securities | 60,352 | 5,000 | — | 65,352 | ||||||||||||
Total short-term and long-term investments | $ | 60,352 | $ | 87,694 | $ | — | $ | 148,046 | ||||||||
At June 30, 2014 and 2013, the Company’s investments were recognized at fair value determined based upon observable input information provided by the Company’s pricing service vendors for identical or similar assets. For these investments, cost approximated fair value. During fiscal years 2013, 2012 and 2011, the Company did not recognize any gains or losses on its investments, other than those related to the Company’s investments in auction rate securities. See “Auction Rate Securities” below for further discussion on the valuation of the Company’s investments in auction rate securities.
The contractual maturities of investments held at June 30, 2014 are as follows:
(in thousands) | Amortized Cost Basis | Aggregate Fair Value | ||||||
Due within one year | $ | 73,437 | $ | 73,437 | ||||
Total short-term investments | $ | 73,437 | $ | 73,437 | ||||
AUCTION RATE SECURITIES
Auction rate securities are long-term debt instruments with variable interest rates that are designed to reset to prevailing market interest rates every 7 to 35 days through the auction process.
During the fiscal year ended June 30, 2013, the Company sold its remaining holdings of auction rate securities, which had cost bases of approximately $52.6 million and carrying values of approximately $38.0 million. As a result of the transactions, the Company recognized a gain of approximately $4.1 million for the fiscal year ended June 30, 2013. The auction rate securities were the Company’s only assets valued on the basis of Level 3 inputs.
Information relating to the sales of auction rate securities during fiscal 2014, 2013 and 2012 is set forth below:
Fiscal Year Ended June 30, | ||||||||||||
(in thousands) | 2014 | 2013 | 2012 | |||||||||
Original cost, par value | $ | — | $ | 52,625 | $ | 5,000 | ||||||
Impairment losses previously recorded in: | ||||||||||||
Accumulated other comprehensive income | — | — | (540 | ) | ||||||||
Consolidated statement of operations | — | (14,600 | ) | — | ||||||||
Carrying value | — | 38,025 | 4,460 | |||||||||
Proceeds from redemption/sale | — | 42,119 | 5,000 | |||||||||
Gain from redemption/sale | $ | — | $ | 4,094 | $ | 540 | ||||||
92
The following table contains a reconciliation of changes in the fair value of auction rate securities, and the related unrealized losses for the fiscal years ended June 30, 2013 and 2012:
(in thousands) | Cost | Temporary Impairment Loss (1) | OTTI – Non-Credit Loss (1) | OTTI – Credit Loss (2) | Fair Value | |||||||||||||||
Balance, June 30, 2012 | $ | 52,625 | $ | (4,336 | ) | $ | — | $ | (14,000 | ) | $ | 34,289 | ||||||||
Changes in losses related to investments | — | 512 | — | (600 | ) | (88 | ) | |||||||||||||
Changes in losses related to sale | (52,625 | ) | 3,824 | — | 14,600 | (34,201 | ) | |||||||||||||
Balance, June 30, 2013 | $ | — | $ | — | $ | — | $ | — | $ | — | ||||||||||
(1) | OTTI means “other-than-temporary impairment.” The amounts in this column are recorded, net of tax, in the accumulated other comprehensive income (loss) component of stockholders’ equity. |
(2) | The changes in losses related to investments of $0.6 million was recorded in the consolidated statement of operations for fiscal year 2013. |
4. | SHARE-BASED COMPENSATION: |
The Company has incentive and non-qualified stock options outstanding that were granted to directors, officers, and other associates pursuant to authorization by the Board of Directors. The exercise price per share of each option equals the market value of a share of the Company’s common stock on the date of the grant. Substantially all of the options granted become exercisable in equal increments on the first three anniversaries of the date of grant. All outstanding options expire ten years from the date of grant. Since its inception in 1991, the Company has authorized approximately 41.2 million shares for issuance upon exercise of options. At June 30, 2014, approximately 9.8 million shares were available for issuance, of which approximately 6.8 million shares are reserved for the exercise of outstanding options and approximately 3.1 million shares remain available for grant.
The non-cash share-based compensation expenses included in the consolidated statements of operations are as follows:
Fiscal Year Ended June 30, | ||||||||||||
(in thousands, except per share data) | 2014 | 2013 | 2012 | |||||||||
Selling, general and administrative | $ | 19,652 | $ | 19,124 | $ | 15,067 | ||||||
Research and development | 2,031 | 1,640 | 1,239 | |||||||||
Cost of sales | 374 | 338 | 195 | |||||||||
Total non-cash share-based compensation expense | 22,057 | 21,102 | 16,501 | |||||||||
Income tax benefit | (6,912 | ) | (6,721 | ) | (5,163 | ) | ||||||
Total non-cash share-based compensation expense, net of tax benefit | $ | 15,145 | $ | 14,381 | $ | 11,338 | ||||||
Impact on diluted net income per share attributable to MICROS Systems, Inc. common shareholders | $ | 0.20 | $ | 0.18 | $ | 0.14 | ||||||
No non-cash share-based compensation expense has been capitalized for fiscal years 2014, 2013 and 2012.
Estimates of fair values of options granted were made on the date of grant using the following assumptions:
Fiscal Year Ended June 30, | |||||||||
2014 | 2013 | 2012 | |||||||
Weighted-average expected volatility | 36 | % | 40 | % | 40 | % | |||
Expected volatility | 33% - 38% | 39% - 40% | 39% - 41% | ||||||
Expected term | 5.4 – 5.8 years | 5.4 – 5.8 years | 4.8 – 5.7 years | ||||||
Expected dividend yield | 0 | % | 0 | % | 0 | % | |||
Risk-free interest rate | 1.5% - 1.8% | 0.7% - 1.1% | 0.9% - 1.1% | ||||||
93
The following is a summary of option activity during fiscal year 2014:
(in thousands, except per share data and number of years) | Number of Shares | Weighted- Average Exercise Price | Weighted- Average Remaining Contractual Term (in years) | Aggregate Intrinsic Value | |||||||||
Outstanding at June 30, 2013 | 7,792 | $ | 37.21 | 5.8 | $ | 46,317 | |||||||
Granted | 1,444 | $ | 53.25 | ||||||||||
Exercised | (2,310 | ) | $ | 32.05 | |||||||||
Forfeited or expired | (160 | ) | $ | 49.45 | |||||||||
Outstanding at June 30, 2014 | 6,766 | $ | 42.07 | 6.8 | $ | 174,779 | |||||||
Exercisable at June 30, 2014 | 4,163 | $ | 37.23 | 5.4 | $ | 127,686 | |||||||
The weighted-average grant-date estimated fair value per share of options granted during fiscal years 2014, 2013 and 2012 was $19.00, $16.66, and $17.67, respectively. The total intrinsic value, which is the difference between the exercise price and the market price on the date of exercise, of options exercised during fiscal years 2014, 2013 and 2012 was approximately $50.6 million, $13.7 million, and $24.3 million, respectively.
As of June 30, 2014, there were approximately $33.7 million (net of estimated forfeitures) in non-cash share-based compensation costs related to non-vested options that are expected to be recognized in the Company’s consolidated statements of operations over a weighted-average period of 1.87 years.
Cash received from options exercised during fiscal years 2014, 2013 and 2012 was approximately $74.0 million, $9.1 million and $14.9 million, respectively.
5. | ACQUISITIONS: |
FY 2012:
On May 31, 2012, the Company acquired all of the outstanding shares of capital stock of Torex for a purchase price of approximately £119.9 million (approximately $184.7 million at the May 31, 2012 exchange rate). Headquartered in Dunstable, England, Torex was a provider of point-of-sale systems and back office products for retailers, gas stations, convenience stores, pubs and restaurants in the United Kingdom and Europe. The Company, through one of its subsidiaries, also purchased certain assets of Torex located in the U.S. for a purchase price of £2.5 million (approximately $3.9 million). These amounts excluded cash acquired of approximately £5.8 million (approximately $8.9 million). The Company also assumed third party debt valued at £45.2 million (approximately $69.6 million), which was immediately repaid as part of the acquisition. Of the purchase price, £19.4 million (approximately $29.9 million) was paid into escrow upon closing to provide for payment of post-closing indemnification obligations of the Torex selling stockholders, if any. In June 2013, per the terms of the stock purchase agreement, approximately £10.4 million was released from escrow. As of June 30, 2014, approximately £9.0 million (approximately $15.5 million at June 30, 2014 exchange rate) remained in escrow, of which approximately £6.7 million was released from escrow in August 2014 per the terms of the stock purchase agreement. A portion of the remaining escrowed amounts will be released over the next year, subject to the resolution of a pending indemnification claim. The remaining escrowed amount will be released on the seventh anniversary of the closing date, subject to indemnification claims, if any. The Company entered into this transaction to increase its presence in the Europe retail market and to reduce costs through economies of scale and synergies.
94
The following table summarizes the consideration paid for Torex, the amounts of the assets acquired and liabilities assumed as initially recognized, and the useful lives of identifiable intangible assets as of the date of the Torex acquisition (in thousands):
Consideration: | |||
Cash (net of cash acquired) | $ | 188,579 | |
Debt assumed | 69,613 | ||
Fair value of total cash consideration transferred | $ | 258,192 | |
Acquisition-related costs | $ | 1,580 | |
Initially recognized amounts of identifiable assets acquired and liabilities assumed: | |||
Current assets | $ | 48,658 | |
Property, plant and equipment | 3,654 | ||
Net deferred income taxes - noncurrent | 31,899 | ||
Intangible assets | 30,735 | ||
Purchased software technology | 15,899 | ||
Other assets | 183 | ||
Current liabilities | (72,984 | ) | |
Net deferred income tax liabilities - noncurrent | (1,402 | ) | |
Other noncurrent liabilities | (1,620 | ) | |
Total identifiable net assets | 55,022 | ||
Goodwill | 203,170 | ||
Fair value of total consideration transferred | $ | 258,192 | |
Initially recognized fair value of intangible assets subject to amortization | Useful Life (in years) | |||||
Customer lists | $ | 28,223 | 10 | |||
Software license technology (recorded as purchased software costs) | 15,899 | 1 – 7 | ||||
Service revenue backlog | 2,326 | 1 | ||||
Other technology | 602 | 3 | ||||
Fair value of intangible assets subject to amortization | $ | 47,050 | ||||
During fiscal year 2013, the Company finalized its purchase price allocation and also received from the seller approximately $1.5 million of proceeds related to settlement of a working capital adjustment. These immaterial allocation adjustments primarily resulted in an increase in intangible assets of approximately $2.5 million, a decrease in goodwill of approximately $7.8 million, a decrease in current liabilities of approximately $3.8 million and an increase in deferred taxes of approximately $0.7 million. Substantially all of the goodwill of approximately $196.2 million (after recording the allocation adjustments and reflecting foreign currency translation) recorded in connection with the acquisition was included in the International segment and primarily reflects the anticipated synergies and economies of scale arising from the combination of the Company and Torex operations. None of the goodwill recognized is expected to be deductible for income tax purposes. See Note 10 “Goodwill.”
The pro forma consolidated revenue for the fiscal year ended June 30, 2012, assuming the date of the Torex acquisition was July 1, 2011, was approximately as follows:
(in thousands) | Revenue (unaudited) | |||
Fiscal year 2012 supplemental pro forma from 7/1/2011 – 6/30/2012 | $ | 1,291,343 | ||
For fiscal year 2012, the difference in pro forma net income including the effect of Torex was immaterial to the Company’s consolidated net income, that is, the difference between pro forma net income (including Torex) and historical net income would not have been material. The above unaudited pro forma results presented do not necessarily reflect the results of operations that would have resulted had the acquisition been completed at the beginning of the applicable periods presented, nor do they indicate the results of operations in the future periods. Additionally, the unaudited pro forma results do not include
95
the impact of possible business model changes, potential cost savings from synergies nor does it consider any potential impacts of current market conditions on revenues or other factors.
6. | INVENTORY |
The following table provides information on the components of inventory:
As of June 30, | ||||||||
(in thousands) | 2014 | 2013 | ||||||
Raw materials | $ | 1,534 | $ | 1,065 | ||||
Finished goods | 56,049 | 48,208 | ||||||
Total inventory | $ | 57,583 | $ | 49,273 | ||||
7. | PROPERTY, PLANT AND EQUIPMENT: |
The following table provides information on the components of property, plant and equipment:
As of June 30, | ||||||||||
(in thousands, except for number of years) | 2014 | 2013 | Useful Life (in years) | |||||||
Leasehold improvements | $ | 15,984 | $ | 14,864 | Shorter of useful life or lease term | |||||
Machinery and equipment | 15,717 | 14,362 | 3-10 | |||||||
Furniture and fixtures | 22,168 | 21,711 | 5-10 | |||||||
Computer hardware and software | 131,173 | 107,641 | 3-7 | |||||||
Total property, plant and equipment | 185,042 | 158,578 | ||||||||
Accumulated depreciation and amortization | (127,076 | ) | (114,451 | ) | ||||||
Net property, plant and equipment | $ | 57,966 | $ | 44,127 | ||||||
Depreciation expense for fiscal years 2014, 2013 and 2012 was approximately $16.3 million, $13.2 million, and $11.0 million, respectively.
On July 1, 2014, the Company closed on the purchase of the Company's worldwide corporate headquarters building located in Columbia, Maryland for cash consideration of approximately $59.5 million.
8. | LINE OF CREDIT: |
The Company had two credit agreements (the “Former Credit Agreements”) that expired on September 30, 2013. The Former Credit Agreements provided an aggregate $50.0 million multi-currency committed line of credit. The Company paid the approximately $1.8 million outstanding under the Former Credit Agreements on the expiration date.
The Company entered into a new credit agreement (the “Credit Agreement”), dated March 28, 2014 and effective upon closing on April 10, 2014, with Wells Fargo Bank, National Association and J.P. Morgan Chase Bank, N.A. The Credit Agreement provides a $50.0 million multi-currency committed line of credit and replaces the Former Credit Agreements. The interest rate varies depending on the form of the draw, and is calculated based on prime rate, federal funds, or an alternative rate (as defined in the Credit Agreement). The Credit Agreement also contains certain financial covenants and restrictions on the Company's ability to assume additional debt, purchase our stock, sell subsidiaries or acquire companies. The Credit Agreement expires on March 28, 2019.
As of June 30, 2014, the Company did not have any borrowings under the Credit Agreement and had the full $50.0 million available for future borrowings.
The Company also has a credit relationship with a European bank in the amount of EUR 1.0 million (approximately $1.4 million at the June 30, 2014 exchange rate). Under the terms of this facility, the Company may borrow in the form of either a line of credit or term debt. As of June 30, 2014, there were no balances outstanding on this credit facility, but approximately EUR 0.1 million (approximately $0.2 million at the June 30, 2014 exchange rate) of the credit facility has been used for guarantees.
As of June 30, 2014, the Company had approximately $51.2 million borrowing capacity available under all of the credit facilities described above.
96
9. | ACCRUED EXPENSES AND OTHER CURRENT LIABILITIES: |
The components of accrued expenses and other current liabilities are as follows:
As of June 30, | ||||||||
(in thousands) | 2014 | 2013 | ||||||
Compensation, benefits and related taxes | $ | 83,667 | $ | 71,408 | ||||
Deposits received from clients | 38,056 | 31,385 | ||||||
VAT and sales taxes | 16,434 | 14,646 | ||||||
Professional services | 12,917 | 14,331 | ||||||
Product related | 10,576 | 7,038 | ||||||
Property related | 5,855 | 4,515 | ||||||
Customer related | 4,697 | 2,673 | ||||||
Insurance | 1,354 | 703 | ||||||
Deferred income taxes - current | — | 1,398 | ||||||
Other | 7,417 | 7,394 | ||||||
Total accrued expenses and other current liabilities | $ | 180,973 | $ | 155,491 | ||||
10. | GOODWILL |
Goodwill allocated to the Company’s reportable segments and changes in the carrying amount of goodwill are as follows:
(in thousands) | U.S./Canada | International | Total | |||||||||
Balance, June 30, 2012 | $ | 167,304 | $ | 276,813 | $ | 444,117 | ||||||
Goodwill adjustments on prior years' acquisitions: | ||||||||||||
Torex | (47 | ) | (7,775 | ) | (7,822 | ) | ||||||
Others | 117 | 24 | 141 | |||||||||
Foreign currency translation | (157 | ) | (3,329 | ) | (3,486 | ) | ||||||
Balance, June 30, 2013 | 167,217 | 265,733 | 432,950 | |||||||||
Goodwill adjustments for prior years’ acquisitions: | ||||||||||||
Foreign currency translation | (91 | ) | 25,961 | 25,870 | ||||||||
Balance, June 30, 2014 | $ | 167,126 | $ | 291,694 | $ | 458,820 | ||||||
During fiscal year 2013, the Company finalized its purchase price allocation and also received approximately $1.5 million from the seller for working capital adjustments related to Torex. These adjustments resulted in an immaterial decrease in goodwill of approximately $7.8 million.
Based on the results of its annual impairment tests, the Company determined that no impairment of goodwill existed as of the end of and for fiscal years 2014, 2013 and 2012. Subsequent to the fiscal year 2014 annual impairment analysis date of July 1, 2013, there have been no events or circumstances that would have caused the Company to determine that it is more likely than not that the fair values of the Company’s reporting units are less than their respective carrying values.
97
11. | INTANGIBLE ASSETS: |
Purchased intangible assets are amortized over the estimated useful lives of the respective asset category unless such lives are deemed indefinite. The following table provides information on the Company’s intangible assets:
(in thousands, except for number of years) | Gross Carrying Amount | Accumulated Amortization | Net Carrying Amount | Useful Life (in years) | ||||||||||
As of June 30, 2014: | ||||||||||||||
Customer lists | $ | 69,963 | $ | (36,638 | ) | $ | 33,325 | 5 – 10 | ||||||
Product lines | 486 | (424 | ) | 62 | 3 | |||||||||
Trademarks | 1,377 | (350 | ) | 1,027 | 10 – 25 | |||||||||
Finite-lived purchased intangible assets | 71,826 | (37,412 | ) | 34,414 | ||||||||||
Trademarks | 726 | — | 726 | |||||||||||
Total intangible assets | $ | 72,552 | $ | (37,412 | ) | $ | 35,140 | |||||||
As of June 30, 2013: | ||||||||||||||
Customer lists | $ | 65,735 | $ | (29,884 | ) | $ | 35,851 | 2 – 10 | ||||||
Product lines | 464 | (347 | ) | 117 | 3 | |||||||||
Trademarks | 1,359 | (282 | ) | 1,077 | 10 – 25 | |||||||||
Finite-lived purchased intangible assets | 67,558 | (30,513 | ) | 37,045 | ||||||||||
Trademarks | 709 | — | 709 | |||||||||||
Total intangible assets | $ | 68,267 | $ | (30,513 | ) | $ | 37,754 | |||||||
Certain of the Company’s trademarks are deemed to have indefinite lives and therefore are not amortized. Amortization expense related to finite-lived purchased intangible assets was approximately $5.8 million, $9.4 million, and $5.2 million in fiscal years 2014, 2013 and 2012, respectively. During each of fiscal years 2014, 2013 and 2012, the Company recorded approximately $0.1 million, $0.7 million, and $1.3 million, respectively, in accelerated amortization expenses related to finite-lived customer related intangible assets due to greater than anticipated attrition of customer relationships.
Subsequent to the annual impairment analysis date of July 1, 2013, there have been not been any events or circumstances that would have caused the Company to determine that it is more likely than not that indefinite-lived trademarks have been impaired.
Estimated amortization expense with respect to intangible assets in future fiscal years ending June 30 is as follows (in thousands):
2015 | $ | 5,536 | |
2016 | 5,153 | ||
2017 | 4,773 | ||
2018 | 4,261 | ||
2019 | 3,849 | ||
Later years | 10,842 | ||
Total | $ | 34,414 | |
98
12. | COMMITMENTS AND CONTINGENCIES: |
LEASES
The Company and its subsidiaries lease office space under operating leases expiring at various dates through fiscal year 2022 and lease equipment under both operating and capital leases. Rent expense under the operating leases was as follows:
Fiscal Year Ended June 30, (in thousands) | Rent Expense | Sublease Income | Net Rent Expense | |||||||||
2014 | $ | 35,226 | $ | (1,001 | ) | $ | 34,225 | |||||
2013 | $ | 34,601 | $ | (931 | ) | $ | 33,670 | |||||
2012 | $ | 30,990 | $ | (972 | ) | $ | 30,018 | |||||
As of June 30, 2014, future minimum lease payments for those leases having an initial or remaining non-cancelable lease term in excess of one year are as follows:
Fiscal Year Ended June 30, (in thousands) | Operating Leases | Less Sublease Rentals | Net Operating Leases | Capital Leases | |||||||||
2015 | 25,698 | (796 | ) | 24,902 | 26 | ||||||||
2016 | 17,130 | — | 17,130 | 21 | |||||||||
2017 | 11,316 | — | 11,316 | 21 | |||||||||
2018 | 6,402 | — | 6,402 | 20 | |||||||||
2019 | 3,318 | — | 3,318 | — | |||||||||
2020 and thereafter | 2,942 | — | 2,942 | — | |||||||||
66,806 | (796 | ) | 66,010 | 88 | |||||||||
Less: current portion | (26 | ) | |||||||||||
Long-term obligations under capital lease | $ | 62 | |||||||||||
The above table reflects the lease termination of the Company's worldwide corporate headquarters building located in Columbia, Maryland as it was purchased by the Company on July 1, 2014. See Note 7, "Property, Plant and Equipment."
LEGAL PROCEEDINGS
On October 21, 2013, the Company entered into a final settlement with the plaintiff in Roth Cash Register v. MICROS Systems, Inc., et al., a case initially filed in 2000 in the Court of Common Pleas of Allegheny County, Pennsylvania based on the plaintiff's allegation that the Company and certain of its subsidiaries and employees entered into a plan to eliminate the plaintiff as an authorized dealer and improperly interfere with the plaintiff's relationships with its existing and future clients without compensation to the plaintiff. Following an adverse jury verdict, reduced on appeal, the Company paid approximately $2.5 million to the plaintiff on June 7, 2012 in payment of the portion of the verdict that was no longer in dispute plus applicable post-judgment interest. Upon the conclusion of post-appeal proceedings in the Court of Common Pleas with regard to the remaining amount of the verdict, the Court entered an order reducing the remaining judgment in favor of the plaintiff from $4.5 million to approximately $2.8 million. The Company appealed this judgment, which was affirmed by the Superior Court on October 4, 2013. During the three months ended September 30, 2013, the Company accrued a charge of approximately $2.8 million in selling, general and administrative expenses with respect to the judgment, and also accrued interest of $0.9 million, reflecting the 6% per annum interest payable on the judgment. Pursuant to the settlement agreement, the Company made a full and final payment of approximately $3.7 million to the plaintiff on October 21, 2013, and, on October 31, 2013, the case was closed.
On November 26, 2013, a complaint was filed against the Company in the United States District Court for the Middle District of Tennessee by Kristy Wilson, Darren Moore and Kisha Ulysse, three former employees of the Company, individually and on behalf of a purported class of all persons who worked for the Company as an Implementation Specialist or performed substantially similar job duties (each, an "Implementation Specialist") within the period beginning three years prior to the filing of the complaint through the date of judgment and who worked for more than 40 hours in one or more weeks without receiving overtime compensation allegedly required by the Fair Labor Standards Act ("FLSA"). In addition, the complaint was brought by plaintiff Ulysse individually and collectively on behalf of a purported class (the "Purported California Class") of all persons who were employed by the Company in an Implementation Specialist position in California and/or performed work in any Implementation Specialist position in California, and who did not receive the overtime and premium wages allegedly required
99
by the overtime pay and restitution laws of California at any time during the four years prior to the date of the filing of the complaint. The complaint alleges, among other things, that the Company willfully violated the FLSA by willfully classifying the plaintiffs as exempt and thereby failing to pay them the legally required amount of overtime compensation for all hours worked in excess of 40 hours. With respect to the Purported California Class, the complaint alleges, among other things, violations of the California Labor Code and California Unfair Competition law due to the Company's failure to pay all wages required by the California Labor Code, the failure to timely provide accurate itemized wage statements, and the failure to provide required meal and rest periods. The complaint seeks, among other things, damages equal to unpaid overtime wages, an equal amount to the overtime wages as liquidated damages, interest, attorneys' fees and other costs and, with respect to the Purported California Class, in addition to unpaid overtime wages, the complaint seeks unpaid meal and rest premiums, statutory penalties, attorneys' fees and other costs provided under California law, interest, injunctive relief, and other equitable relief. The Company filed an answer to the complaint on January 17, 2014 denying the allegations of the complaint, denying that the putative classes are appropriate, and asserting a number of affirmative defenses, including, among others, that the claims, in whole or in part, are barred because the FLSA overtime obligations are inapplicable to the plaintiffs under the FLSA or similar state law. On May 2, 2014, the parties stipulated to the dismissal without prejudice of the claims for injunctive relief under California law. On May 27, 2014, the Court entered a scheduling order providing for limited discovery, and a court-sponsored early mediation in September 2014. The Company intends to vigorously contest this action.
Five class action complaints related to the Merger Agreement have been filed in the Circuit Court for Howard County, Maryland by purported stockholders of MICROS. The actions are docketed as Boudreaux v. Micros Systems, Inc., et al., (“Boudreaux”) (filed June 26, 2014, amended July 9, 2014); Stein v. Micros Systems, Inc., et al. (“Stein”) (filed June 27, 2014, amended July 9, 2014); Rosenfeld IRA v. Micros Systems, Inc. et al. (“Rosenfeld”) (filed July 2, 2014, amended July 9, 2014); Newspaper and Magazine Employees Union and Phila. Publishers’ Pension Fund, v. Micros Systems, Inc., et al. (“Publishers”) (filed July 10, 2014); and Scott v. Micros Systems, Inc., et al. (“Scott”) (filed July 10, 2014). The Boudreaux, Stein and Scott actions are brought against MICROS, Oracle, Parent, Purchaser, and MICROS's Board of Directors (the “Individual Defendants”), and purport to be brought individually and on behalf of all public stockholders of MICROS. The Boudreaux, Stein, and Scott actions allege that the Individual Defendants breached their fiduciary duties to MICROS’s stockholders by, among other things, approving a merger that they claim provides for inadequate consideration for MICROS’s stockholders and that the Merger Agreement includes allegedly preclusive deal protection provisions; and that Oracle, Parent and Purchaser aided and abetted such alleged breach of fiduciary duties. The Boudreaux, Stein, and Scott actions also assert that the Individual Defendants breached their fiduciary duties by allegedly omitting certain material information concerning the sales process, financial valuation, and financial projections from the Schedule 14D-9 Recommendation Statement filed on July 3, 2014. Additionally, the Boudreaux, Stein, and Scott actions each seek a declaratory judgment against all defendants. Based on these allegations, the Boudreaux, Stein, and Scott actions seek, among other relief, an order declaring the action to be a class action, that the Individual Defendants have breached their fiduciary duties owed to the stockholders, and that Oracle Parent, and Purchaser aided and abetted such alleged breaches. Finally, the Boudreaux, Stein, and Scott actions also seek to enjoin the acquisition from being consummated, awarding plaintiffs the costs of the actions including a reasonable allowance for the expenses of plaintiff’s attorneys and experts, and granting further equitable relief as the court deems just and proper. Although the claims asserted and relief requested in Rosenfeld are identical to the claims asserted and relief requested in Boudreaux, Stein, and Scott, the Rosenfeld action is brought only against MICROS and the Individual Defendants. The Publishers action is also brought against the Company, Oracle, Parent, Purchaser, and the Individual Defendants, but also names MICROS’s Chief Financial Officer as a Defendant. Similar to the other complaints filed, the Publishers action alleges that the Individual Defendants, including MICROS’s Chief Financial Officer, breached their fiduciary duties to MICROS’s stockholders by, among other things, approving a merger that the plaintiff claims provides for inadequate consideration for MICROS’s stockholders and that the Merger Agreement includes allegedly preclusive deal protection provisions; and that Oracle and its involved subsidiaries aided and abetted such alleged breach of fiduciary duties. The Publishers action seeks, among other relief, an order declaring the action to be a class action, to enjoin the acquisition from being consummated, damages, awarding plaintiff the costs of the action including a reasonable allowance for the expenses of plaintiff’s attorneys and experts, and granting further equitable relief as the court deems just and proper.
On July 11, 2014, plaintiffs in the Boudreaux, Stein, Rosenfeld, and Scott cases filed motions to expedite discovery and shorten the time to respond to the motions. On July 16, 2014, all five class action complaints described above (i.e. the Boudreaux, Stein, Rosenfeld, Scott, and Publishers cases) were consolidated by order of the Circuit Court into a single action under the caption Scott v. MICROS Systems, Inc. et al. Also, on July 16, 2014, the plaintiff in the Boudreaux case filed a motion for a temporary restraining order (“TRO”) to prevent proceeding with the Offer and a motion to shorten the time to respond to the TRO. On July 21, 2014, the defendants in the actions filed their oppositions to the motions to expedite and the motion for a TRO. On July 22, 2014, the Circuit Court held a hearing on the four plaintiffs’ motions for expedited discovery and the one plaintiff’s motion for a TRO. The Circuit Court denied the plaintiffs’ motions for expedited discovery and continued the motion for TRO until a hearing scheduled for July 31, 2014 to address both the TRO and a preliminary injunction. The plaintiffs did not move for a preliminary injunction and, on July 25, 2014, withdrew their request for a TRO and
100
requested that the scheduled July 31, 2014 hearing be canceled. On July 30, 2014, the plaintiffs and the defendants in the consolidated action Scott v. MICROS Systems, Inc. et al. Consolidated Case, No. 13C14099672 (the "Consolidated Action")filed a joint motion for an order to stay all proceedings in the Consolidated Action until the closing of the Offer. On August 1, 2014, the Circuit Court granted the motion to stay. Following the closing of the Offer, the plaintiffs in the Consolidated Action will have 30 days to file a consolidated amended complaint or notify the Circuit Court that they are no longer pursuing their claims. During the pendency of the stay, defendants are not required to respond to any of the complaints or discovery. The stay also applied to third party discovery. The Company intends to vigorously contest these actions.
Subject to the foregoing, the Company is and has been involved in legal proceedings arising in the normal course of business, and the Company is of the opinion, based upon presently available information and the advice of counsel concerning pertinent legal matters, that any resulting liability should not have a material adverse effect on the Company’s results of operations, financial position, or cash flows. However, litigation is subject to many uncertainties, and the outcome of litigation is not predictable with assurance. An adverse outcome in current or future litigation could have a material adverse effect on the Company’s business, financial condition, results of operations, and liquidity.
Pursuant to the terms and conditions of the Merger Agreement, if the Merger is not completed due to the Company's acceptance of a superior merger proposal, the Company would be required to pay a termination fee of approximately $157.8 million.
13. | SHAREHOLDERS’ EQUITY: |
On April 23, 2013, the Company’s Board of Directors authorized the purchase of up to $225 million of the Company’s common stock, to be purchased from time to time over the ensuing three years depending on market conditions and other corporate considerations as determined by management. As of June 30, 2014, all of the amounts authorized to be purchased under the April 2013 authorization have been repurchased.
Additionally, on January 28, 2014, the Company's Board of Directors authorized the purchase of up to an additional $200 million of the Company's common stock, to be purchased from time to time over the ensuing three years depending on market conditions and other corporate considerations as determined by management. As of June 30, 2014, approximately $191.5 million remains available under the January 2014 authorization.
The following table summarizes the cumulative number of shares purchased under the January 2014 and previous purchase authorizations. All of the purchased shares were retired and reverted to the status of authorized but unissued shares:
(in thousands, except per share data) | Number of Shares | Average Purchase Price per Share | Total Purchase Value | ||||||||
Total shares purchased: | |||||||||||
As of June 30, 2011 | 13,072 | $ | 22.10 | $ | 288,867 | ||||||
Fiscal year 2012 | 1,288 | $ | 45.96 | 59,199 | |||||||
As of June 30, 2012 | 14,360 | $ | 24.24 | 348,066 | |||||||
Fiscal year 2013 | 4,057 | $ | 43.53 | 176,603 | |||||||
As of June 30, 2013 | 18,417 | $ | 28.49 | 524,669 | |||||||
Fiscal year 2014 | 4,212 | $ | 51.21 | 215,721 | |||||||
As of June 30, 2014 | 22,629 | $ | 740,390 | ||||||||
101
14. | ACCUMULATED OTHER COMPREHENSIVE INCOME: |
The following table summarizes the changes in accumulated other comprehensive income by component:
Fiscal Year Ended June 30, | ||||||||||||
(in thousands) | 2014 | 2013 | 2012 | |||||||||
Investments: | ||||||||||||
Accumulated other comprehensive income (loss), beginning of period | $ | — | $ | (2,683 | ) | $ | (3,886 | ) | ||||
Change in unrealized gains, net of tax effects of $0, $1,652 and $741 | — | 2,683 | 1,203 | |||||||||
Accumulated other comprehensive income (loss), end of period | — | $ | — | (2,683 | ) | |||||||
Pension: | ||||||||||||
Accumulated other comprehensive income (loss), beginning of period | 366 | $ | — | — | ||||||||
Change in unrealized gains (losses), net of tax (benefit) effects of ($50), $105 and $0 | (979 | ) | 366 | — | ||||||||
Accumulated other comprehensive income (loss), end of period | (613 | ) | 366 | — | ||||||||
Translation Adjustments and Other: | ||||||||||||
Accumulated other comprehensive income (loss), beginning of period | (23,991 | ) | (15,164 | ) | 52,209 | |||||||
Translation adjustments, net of tax effects of $0 | 45,902 | (8,827 | ) | (67,373 | ) | |||||||
Accumulated other comprehensive income (loss), end of period | 21,911 | (23,991 | ) | (15,164 | ) | |||||||
Accumulated other comprehensive income (loss), end of period | $ | 21,298 | $ | (23,625 | ) | $ | (17,847 | ) | ||||
The amounts reclassified from accumulated other comprehensive income (loss) to net income for he fiscal years ending June 30, 3014, 2013 and 2012 were not significant.
15. | INCOME TAXES: |
Income before taxes was taxed as indicated in the following jurisdictions:
Fiscal Year Ended June 30, | ||||||||||||
(in thousands) | 2014 | 2013 | 2012 | |||||||||
U.S./Canada | $ | 136,486 | $ | 109,131 | $ | 124,860 | ||||||
International | 124,890 | 124,674 | 112,331 | |||||||||
Total income before taxes | $ | 261,376 | $ | 233,805 | $ | 237,191 | ||||||
The components of income tax expense were as follows:
Fiscal Year Ended June 30, | ||||||||||||
(in thousands) | 2014 | 2013 | 2012 | |||||||||
Current: | ||||||||||||
Federal | $ | 41,085 | $ | 33,032 | $ | 46,991 | ||||||
State | 4,863 | 2,896 | 4,153 | |||||||||
Foreign | 25,939 | 28,732 | 22,382 | |||||||||
Total current income tax expense | 71,887 | 64,660 | 73,526 | |||||||||
Deferred: | ||||||||||||
Federal | 3,045 | (688 | ) | (2,650 | ) | |||||||
State | 371 | (60 | ) | (235 | ) | |||||||
Foreign | 3,894 | (1,954 | ) | (551 | ) | |||||||
Total deferred income tax expense (benefit) | 7,310 | (2,702 | ) | (3,436 | ) | |||||||
Total income tax expense | $ | 79,197 | $ | 61,958 | $ | 70,090 | ||||||
102
The total tax provision is different from the amount that would have been recorded by applying the U.S. statutory federal income tax rate to income before taxes. The reconciliation of these differences is as follows:
Fiscal Year Ended June 30, | |||||||||
2014 | 2013 | 2012 | |||||||
Statutory rate | 35.0 | % | 35.0 | % | 35.0 | % | |||
Increase (decrease) resulting from: | |||||||||
State taxes, net of federal tax benefit | 1.2 | 1.4 | 1.6 | ||||||
Effect of tax rates in foreign jurisdictions | (13.4 | ) | (14.7 | ) | (11.4 | ) | |||
Share-based and other compensation | 0.6 | 0.5 | 1.4 | ||||||
Non-deferred foreign income | 0.1 | 0.2 | 0.3 | ||||||
Domestic manufacturing deduction | (1.2 | ) | (1.0 | ) | (1.0 | ) | |||
Valuation allowances | 1.0 | 0.5 | 0.3 | ||||||
Net uncertain tax positions | 3.2 | 0.3 | 1.4 | ||||||
Foreign withholding taxes | 1.5 | 1.0 | 0.8 | ||||||
Non-deductible items | 1.7 | 1.9 | 0.0 | ||||||
Other differences | 0.6 | 1.4 | 1.1 | ||||||
Effective tax rate | 30.3 | % | 26.5 | % | 29.5 | % | |||
The Company’s cumulative unremitted foreign earnings were approximately $1.0 billion, $864 million, and $751 million for fiscal years 2014, 2013 and 2012, respectively. The Company currently has no plans to repatriate to the U.S. its cumulative unremitted foreign earnings, as it intends to permanently reinvest such earnings internationally. If the Company changes its strategy in the future and repatriates such funds, the amount of any taxes, which could be significant, and the application of any tax credits, would be determined based on the appropriate jurisdictional income tax laws at the time of such repatriation. Due to the extent of uncertainty as to which remittance structure would be used should a decision be made in the future to repatriate, the availability and the complexity of calculating foreign tax credits, and the implications of indirect taxes, including withholding taxes, determination of the unrecognized deferred income tax liability related to these unremitted earnings is not practicable.
The Company operates in various non-U.S. tax jurisdictions where “tax holiday” income tax incentives have been granted for a specified period. These tax benefits are not material to the Company’s consolidated financial statements. Deferred income taxes reflect the net tax effects of temporary differences between the carrying amounts of assets and liabilities for financial reporting purposes and the amounts used for income tax purposes. The significant components of the Company’s deferred tax assets and liabilities were as follows:
103
As of June 30, | ||||||||
(in thousands) | 2014 | 2013 | ||||||
Deferred tax assets: | ||||||||
Share-based compensation | $ | 26,410 | $ | 25,712 | ||||
Net operating loss carryforwards | 68,238 | 60,027 | ||||||
Accruals | 12,895 | 11,571 | ||||||
Accounts receivable reserves | 6,032 | 6,795 | ||||||
Capital losses | 3,833 | 4,008 | ||||||
Intercompany profit eliminations | 3,501 | 3,545 | ||||||
Deferred revenues and customer deposits | 1,239 | 580 | ||||||
Inventory | 2,440 | 2,760 | ||||||
Benefit related accruals | 2,492 | 2,552 | ||||||
Accrued interest | 1,684 | — | ||||||
Other | 1,944 | 2,194 | ||||||
Total deferred tax assets | 130,708 | 119,744 | ||||||
Deferred tax liabilities: | ||||||||
Intangible assets amortization | (28,130 | ) | (28,249 | ) | ||||
Capitalized software development costs | (7,512 | ) | (2,365 | ) | ||||
Depreciation | (1,148 | ) | (1,246 | ) | ||||
Other | (98 | ) | (549 | ) | ||||
Total deferred tax liabilities | (36,888 | ) | (32,409 | ) | ||||
Valuation allowance: | ||||||||
Capital losses | (3,833 | ) | (4,008 | ) | ||||
Other | (32,180 | ) | (20,673 | ) | ||||
Total valuation allowance | (36,013 | ) | (24,681 | ) | ||||
Net deferred tax assets | $ | 57,807 | $ | 62,654 | ||||
The tax affected net operating loss carryforwards and related valuation allowance are as follows:
As of June 30, | ||||||||
(in thousands) | 2014 | 2013 | ||||||
Net operating loss carryforwards: | ||||||||
U.S./Canada | $ | 2,417 | $ | 2,861 | ||||
International | 65,821 | 57,166 | ||||||
Total net operating loss carryforwards | 68,238 | 60,027 | ||||||
Net operating loss carryforward valuation allowance: | ||||||||
U.S./Canada | — | (42 | ) | |||||
International | (30,497 | ) | (17,692 | ) | ||||
Total net operating loss carryforward valuation allowance | (30,497 | ) | (17,734 | ) | ||||
Net operating loss carryforwards, net of valuation allowance | $ | 37,741 | $ | 42,293 | ||||
The Company is profitable on a consolidated basis. However, it has incurred losses in certain jurisdictions. A valuation allowance has been provided at June 30, 2014 and 2013 to offset the related deferred tax assets in these jurisdictions due to uncertainty of realizing the benefit of the net operating loss carryforwards and other deferred tax assets.
104
The Company’s net operating loss carryforwards and tax credit carryforwards as of June 30, 2014 expire as follows:
Fiscal Year Ending June 30, | ||||||||||||||||||||
(in thousands) | 2015 | 2016 | Thereafter | No Expiration | Total | |||||||||||||||
U.S./Canada: | ||||||||||||||||||||
Net operating loss carryforwards | $ | 0 | $ | 0 | $ | 2,417 | $ | 0 | $ | 2,417 | ||||||||||
Valuation allowances | 0 | 0 | — | 0 | — | |||||||||||||||
Total U.S. | 0 | 0 | 2,417 | 0 | 2,417 | |||||||||||||||
International: | ||||||||||||||||||||
Net operating loss carryforwards | 7 | 217 | 9,315 | 56,282 | 65,821 | |||||||||||||||
Valuation allowances | (7 | ) | (213 | ) | (9,192 | ) | (21,085 | ) | (30,497 | ) | ||||||||||
Total International | 0 | 4 | 123 | 35,197 | 35,324 | |||||||||||||||
Net operating loss carryforwards, net of valuation allowances | $ | 0 | $ | 4 | $ | 2,540 | $ | 35,197 | $ | 37,741 | ||||||||||
In the ordinary course of the Company’s business, transactions occur for which the ultimate tax outcome may be uncertain. Under applicable accounting guidance, the Company is unable to recognize the effects of a tax position in its financial statements unless the position satisfies a minimum recognition threshold mandated by the guidance. The Company’s net unrecognized income tax benefits were approximately $45.4 million and $35.0 million, including interest and penalties of approximately $3.0 million and $2.7 million, at June 30, 2014 and 2013, respectively. The Company has recognized approximately $0.3 million of interest expense and approximately $0.5 million of interest benefit for the fiscal years ending June 30, 2014 and 2013, respectively. The interest and penalties related to unrecognized income tax benefits are classified as a component of income tax expense. Components of the previously unrecognized income tax benefits were recorded as non-current to the extent that the Company does not anticipate making a payment within 12 months of the balance sheet date. To the extent ultimately recognized, substantially all of the previously unrecognized income tax benefit would be recognized as a reduction of income tax expense, impacting the effective income tax rate. The Company has recognized a net increase in income tax expenses with respect to previously unrecognized tax benefits, including interest and penalties for the fiscal year ended June 30, 2014. This increase was partially offset by a reduction in the effective tax rate of 1.4% and income tax expense by approximately $3.7 million, due to the expiration of statutes of limitations.
Tax authorities periodically audit the Company’s income tax returns. These audits include examination of the Company’s significant tax filing positions, including the timing and amounts of deductions and the allocation of income and expenses among tax jurisdictions. The Company files income tax returns with tax authorities in the U.S. as well as with various foreign tax jurisdictions. The Company currently considers its major taxing jurisdictions to include the U.S., the United Kingdom, Germany and Ireland.
The Company’s income tax returns are no longer subject to examination by the U.S. tax authorities for tax years ending before June 2011, by the U.K. tax authorities for tax years ending before June 2011, the German tax authorities for tax years ending before June 2007 and the Irish tax authorities for tax years ending before June 2010. Certain periods prior to these dates, however, could typically be subject to adjustment due to the impact of items such as competent authority or carryback or carryforward claims.
The Company estimates that within the next 12 months, it will decrease unrecognized income tax benefits, including interest and penalties by between approximately $5.0 million to $7.0 million due to the expiration of statutes of limitations and settlement of issues with tax authorities, which would increase earnings as a result of a reduction in tax expense. However, audit outcomes and the timing of audit settlements are subject to significant uncertainty. Over the next 12 months, it is reasonably possible that the Company will continue to generate liabilities for uncertain tax positions. The statute of limitations associated with our significant tax jurisdictions generally expires with respect to a particular tax year in the Company’s third fiscal quarter.
105
The significant components of the Company’s gross unrecognized tax benefits are as follows:
As of June 30, | ||||||||
(in thousands) | 2014 | 2013 | ||||||
Balance, beginning of year | $ | 33,071 | $ | 32,079 | ||||
Current year uncertain tax positions: | ||||||||
Gross increases | 11,303 | 9,404 | ||||||
Prior year uncertain tax positions: | ||||||||
Gross increases | 1,670 | 1,025 | ||||||
Gross decreases | — | (471 | ) | |||||
Settlements with tax authorities | — | (5,993 | ) | |||||
Expiration of statute of limitations | (2,827 | ) | (2,973 | ) | ||||
Balance, end of year | $ | 43,217 | $ | 33,071 | ||||
16. | OTHER INCOME (EXPENSE), NET: |
The following table provides information regarding the components of other income (expense):
Fiscal Year Ended June 30, | ||||||||||||
(in thousands) | 2014 | 2013 | 2012 | |||||||||
Credit based impairment losses on investments | $ | — | $ | (600 | ) | $ | (4,000 | ) | ||||
Gain from sale or settlement of auction rate securities | 338 | 4,094 | — | |||||||||
Foreign exchange loss, net | (593 | ) | (1,351 | ) | (661 | ) | ||||||
Other income, net | 420 | 394 | 544 | |||||||||
Total other income (expense), net | $ | 165 | $ | 2,537 | $ | (4,117 | ) | |||||
17. | EMPLOYEE BENEFIT PLANS: |
Defined contribution plans
The Company sponsors an employee savings plan (the “Plan”), which conforms to the provisions of Section 401(k) of the Internal Revenue Code. The Plan covers substantially all full-time and part-time associates in the U.S. and enables associates to voluntarily defer their eligible compensation through contributions to the Plan, up to the maximum amount per year permitted under the Internal Revenue Code. The Company matches 50% of the first 5% in eligible compensation deferred by each participating employee.
During fiscal years 2014, 2013 and 2012, the Company’s matching contributions to the Plan were approximately $2.4 million, $2.2 million, and $2.1 million, respectively. The Company does not have any material obligations to past or present associates related to post-employment benefits under the Plan.
Defined benefit plans
The Company currently sponsors two defined benefit plans: a Supplemental Executive Retirement Plan (“SERP”), and pension plans that were acquired as a result of the Company's acquisition of Torex (the “Former Torex Plans”). The SERP provides designated officers and executives of the Company or their designated beneficiaries with benefits upon retirement or death. The Company funds the benefits under the SERP with corporate owned life insurance policies held by a segregated trust (known as a “Rabbi Trust”), whose assets are subject to the claims of creditors of the Company. As of June 30, 2014, there are three participants in the SERP, all of whom are all fully vested and the Former Torex Plans participants are fully vested and the plan was fully funded. As of June 30, 2014 and 2013, total accumulated benefit obligations of approximately $7.1 million and $7.5 million, respectively, were included in Other Non-Current Liabilities on the consolidated balance sheets.
106
The following tables provide information regarding the Former Torex Plans for the fiscal years ended June 30, 2014 and 2013 (in thousands):
Fiscal Year Ended June 30, | ||||||||
2014 | 2013 | |||||||
Change in Projected Benefit Obligation (“PBO”): | ||||||||
PBO at the beginning of year | $ | 38,452 | $ | 40,546 | ||||
Interest cost | 1,979 | 1,715 | ||||||
Service cost | 17 | 29 | ||||||
Benefit payments | (1,889 | ) | (1,331 | ) | ||||
Actuarial loss (gain) | 2,381 | (1,248 | ) | |||||
Foreign currency translation gain | 4,686 | (1,259 | ) | |||||
PBO at the end of year | $ | 45,626 | $ | 38,452 | ||||
Fair Value of Plan Assets: | ||||||||
Fair value at the beginning of year | $ | 39,305 | $ | 40,179 | ||||
Return on assets | 3,455 | 1,489 | ||||||
Company contributions | 397 | 291 | ||||||
Benefit payments | (1,889 | ) | (1,331 | ) | ||||
Actuarial (loss) gain | 5 | (72 | ) | |||||
Foreign currency translation loss | 4,789 | (1,251 | ) | |||||
Fair value at the end of year | $ | 46,062 | $ | 39,305 | ||||
Funded Status of the Plan: | ||||||||
Funded status of PBO | $ | 436 | $ | 853 | ||||
Unrecognized prior service cost | N/A | N/A | ||||||
Unrecognized net actuarial (gain) losses | N/A | N/A | ||||||
Prepaid benefit cost | $ | 436 | $ | 853 | ||||
Accumulated prepaid benefit | $ | 436 | $ | 853 | ||||
Amount recognized in the consolidated balance sheet: | ||||||||
Other non-current assets | $ | 439 | $ | 879 | ||||
Other non-current liabilities | (3 | ) | (26 | ) | ||||
Prepaid benefit cost | $ | 436 | $ | 853 | ||||
Assumptions used to measure benefit obligation at June 30, 2014 and 2013: | ||||
Discount rate | 4.0% - 4.3% | 3.9% - 4.7% | ||
Return on plan assets | 4.4% | 4.0% - 4.6% | ||
Plan Assets by asset category as of June 30, 2014 and 2013: | ||||||
Bonds | 60 | % | 60 | % | ||
Government debt securities | 21 | % | 21 | % | ||
Equities | 18 | % | 17 | % | ||
Cash and other | 1 | % | 2 | % | ||
Total plan assets | 100 | % | 100 | % | ||
The total periodic pension costs for the fiscal years ended June 30, 2014, 2013 and 2012 for the Former Torex Plans were immaterial.
107
As of June 30, 2014, the projected benefit payments to be paid from the Company’s defined benefit plans are as follows for the fiscal years ending June 30 (in thousands):
2015 | $ | 3,098 | |
2016 | 2,719 | ||
2017 | 2,862 | ||
2018 | 2,985 | ||
2019 | 3,082 | ||
2020 – 2024 | 14,108 | ||
18. | SEGMENT INFORMATION: |
The Company is organized and operates in four operating segments: U.S./Canada, EAME (Europe, Africa and Middle East), the Asia-Pacific, and Latin America regions. The Company has identified U.S./Canada as a separate reportable segment and has aggregated its three international operating segments into one reportable segment, international, as the three international operating segments share many similar economical characteristics. Management views the U.S./Canada and international segments separately in operating its business, although the products and services are similar for each segment. The Company’s chief operating decision maker is the Company’s Chief Executive Officer.
Historically, all of the Company’s new business acquisitions have been incorporated into the existing operating segments, based on their respective geographical locations, and are subsequently operated and managed as part of that operating segment. The Company has substantially completed it's integration of the Torex businesses into its International segment based on the physical locations of its operations.
A summary of certain financial information regarding the Company’s reportable segments is as follows:
Fiscal Year Ended June 30, | ||||||||||||
(in thousands) | 2014 | 2013 | 2012 | |||||||||
Revenues (1): | ||||||||||||
U.S./Canada | $ | 632,407 | $ | 546,878 | $ | 565,731 | ||||||
International | 829,025 | 772,084 | 589,850 | |||||||||
Intersegment eliminations (2) | (56,035 | ) | (50,877 | ) | (48,050 | ) | ||||||
Total revenues | $ | 1,405,397 | $ | 1,268,085 | $ | 1,107,531 | ||||||
Income before taxes (1): | ||||||||||||
U.S./Canada | $ | 139,735 | $ | 128,232 | $ | 136,485 | ||||||
International | 161,619 | 142,785 | 136,355 | |||||||||
Intersegment eliminations (2) | (39,978 | ) | (37,212 | ) | (35,649 | ) | ||||||
Total income before taxes | $ | 261,376 | $ | 233,805 | $ | 237,191 | ||||||
Capital expenditures (3): | ||||||||||||
U.S./Canada | $ | 19,164 | $ | 12,750 | $ | 7,628 | ||||||
International | 12,463 | 10,532 | 9,840 | |||||||||
Total capital expenditures | $ | 31,627 | $ | 23,282 | $ | 17,468 | ||||||
Depreciation and amortization (3): | ||||||||||||
U.S./Canada | $ | 10,595 | $ | 9,877 | $ | 10,104 | ||||||
International | 11,491 | 12,696 | 6,073 | |||||||||
Total depreciation and amortization | $ | 22,086 | $ | 22,573 | $ | 16,177 | ||||||
108
As of June 30, | ||||||||
(in thousands) | 2014 | 2013 | ||||||
Identifiable assets (3): | ||||||||
U.S./Canada | $ | 644,429 | $ | 664,607 | ||||
International | 1,108,215 | 924,431 | ||||||
Total identifiable assets | $ | 1,752,644 | $ | 1,589,038 | ||||
Goodwill (3): | ||||||||
U.S./Canada | $ | 167,126 | $ | 167,217 | ||||
International | 291,694 | 265,733 | ||||||
Total goodwill | $ | 458,820 | $ | 432,950 | ||||
(1) | Amounts based on the location of the selling entity. |
(2) | Amounts primarily represent elimination of U.S./Canada and Ireland’s intercompany business. |
(3) | Amounts based on the physical location of the asset. |
The Company’s products are distributed in the U.S./Canada and internationally, primarily in EAME, the Asia-Pacific, and Latin America through its subsidiaries, independent dealers/distributors and Company-owned sales and service offices. The Company’s principal customers are lodging, food service-related businesses, specialty retail, and entertainment venues. No single customer accounts for 10% or more of the Company’s consolidated revenues.
Revenues from unaffiliated customers by geographic location are as follows (amounts are net of intersegment eliminations, based on location of the customer):
Fiscal Year Ended June 30, | ||||||||||||
(in thousands) | 2014 | 2013 | 2012 | |||||||||
U.S./Canada | $ | 582,477 | $ | 497,981 | $ | 521,275 | ||||||
International | 822,920 | 770,104 | 586,256 | |||||||||
Total revenue | $ | 1,405,397 | $ | 1,268,085 | $ | 1,107,531 | ||||||
Except for the U.K., no single foreign country accounted for more than 10% of the Company’s revenue during the fiscal years ended June 30, 2014, 2013, and 2012. The Company’s U.K. revenues were approximately $198.5 million, $175.9 million and $89.7 million for the fiscal years ended June 30, 2014, 2013 and 2012, respectively. The increases in fiscal years 2014 and 2013 revenue for the U.K. were primarily due to additional revenue generated by the acquired Torex businesses.
Long-lived assets (property, plant, and equipment) organized by geographic locations are as follows:
As of June 30, | ||||||||
(in thousands) | 2014 | 2013 | ||||||
U.S./Canada | $ | 28,824 | $ | 18,852 | ||||
International | 29,142 | 25,275 | ||||||
Total long-lived assets | $ | 57,966 | $ | 44,127 | ||||
Foreign countries with material long-lived assets (property, plant, and equipment) are as follows:
As of June 30, | ||||||||
(in thousands) | 2014 | 2013 | ||||||
Ireland | $ | 16,010 | $ | 12,541 | ||||
U.K. | 3,155 | 3,145 | ||||||
There were no other individual foreign countries in which the Company has material long-lived assets. The above chart does not include intangible assets.
109
19. | QUARTERLY FINANCIAL INFORMATION (UNAUDITED): |
Quarterly financial information is as follows:
Fiscal Year 2014 (1), (2),(4) | ||||||||||||||||
(in thousands, except per share data) | 1st Quarter | 2nd Quarter | 3rd Quarter | 4th Quarter | ||||||||||||
Revenue | $ | 314,715 | $ | 345,569 | $ | 348,968 | $ | 396,145 | ||||||||
Gross margin | 162,328 | 182,215 | 181,644 | 209,917 | ||||||||||||
Income from operations | 52,348 | 64,003 | 64,325 | 77,933 | ||||||||||||
Net income attributable to MICROS Systems, Inc. | 32,271 | 43,415 | 50,294 | 56,034 | ||||||||||||
Income from operations per common share: | ||||||||||||||||
Basic | $ | 0.69 | $ | 0.85 | $ | 0.86 | $ | 1.05 | ||||||||
Diluted | 0.67 | 0.83 | 0.84 | 1.03 | ||||||||||||
Net income per share attributable to MICROS Systems, Inc. common shareholders: | ||||||||||||||||
Basic | $ | 0.42 | $ | 0.58 | $ | 0.67 | $ | 0.75 | ||||||||
Diluted | 0.42 | 0.57 | 0.66 | 0.74 | ||||||||||||
Stock prices (range of sales prices): | ||||||||||||||||
High | $ | 51.91 | $ | 57.43 | $ | 59.46 | $ | 70.24 | ||||||||
Low | 43.19 | 47.80 | 50.81 | 50.65 | ||||||||||||
Fiscal Year 2013 (1),(3),(4) | ||||||||||||||||
(in thousands, except per share data) | 1st Quarter | 2nd Quarter | 3rd Quarter | 4th Quarter | ||||||||||||
Revenue | $ | 299,851 | $ | 324,520 | $ | 315,105 | $ | 328,609 | ||||||||
Gross margin | 153,260 | 172,119 | 165,488 | 173,025 | ||||||||||||
Income from operations | 53,187 | 61,591 | 58,151 | 54,080 | ||||||||||||
Net income attributable to MICROS Systems, Inc. | 41,064 | 44,086 | 44,264 | 42,005 | ||||||||||||
Income from operations per common share: | ||||||||||||||||
Basic | $ | 0.66 | $ | 0.77 | $ | 0.74 | $ | 0.69 | ||||||||
Diluted | 0.65 | 0.76 | 0.72 | 0.68 | ||||||||||||
Net income per share attributable to MICROS Systems, Inc. common shareholders: | ||||||||||||||||
Basic | $ | 0.51 | $ | 0.55 | $ | 0.56 | $ | 0.54 | ||||||||
Diluted | 0.50 | 0.54 | 0.55 | 0.53 | ||||||||||||
Stock prices (range of sales prices): | ||||||||||||||||
High | $ | 53.21 | $ | 49.95 | $ | 48.20 | $ | 46.09 | ||||||||
Low | 46.00 | 39.31 | 41.00 | 40.25 | ||||||||||||
(1) | Fiscal years ended June 30, 2014 and 2013 include approximately $22.1 million ($15.1 million, net of tax, or $0.20 per diluted share) and $21.1 million ($14.4 million, net of tax, or $0.18 per diluted share), respectively, in non-cash share-based compensation expenses. See Note 4 “Share-based Compensation.” Fiscal year 2013 also include other-than-temporary impairment losses of approximately $0.6 million, respectively, for auction rate securities gains of approximately $4.1 million from sales of auction rate securities. See Note 3 “Financial Instruments and Fair Value Measurements.” |
(2) | Fiscal year 2014 includes approximately $3.7 million in a litigation charge and related interest expense, approximately $2.1 million in Merger related expenses and approximately $1.5 million in charges related to restructuring of Torex. |
(3) | Fiscal year 2013 includes approximately $5.5 million in charges reflecting the restructuring of Torex, approximately $3.5 million in gains from sales of our investments in auction rate securities, and $2.0 million in an insurance settlement. |
(4) | The sum of quarterly amounts does not equal the sum of as reported amounts for the respective fiscal years due to rounding differences. |
110
MICROS SYSTEMS, INC. AND SUBSIDIARIES
SCHEDULE II - VALUATION AND QUALIFYING ACCOUNTS AND RESERVES
Description (in thousands) | Balance at beginning of period | Charged To expense | Deductions (1) | Other (2) | Balance at end of period | |||||||||||||||
Year ended June 30, 2014: | ||||||||||||||||||||
Allowance for doubtful accounts | $ | 30,418 | $ | 1,634 | $ | (4,360 | ) | $ | 873 | $ | 28,565 | |||||||||
Income taxes - valuation allowance | 24,681 | 2,614 | — | 8,718 | 36,013 | |||||||||||||||
Year ended June 30, 2013: | ||||||||||||||||||||
Allowance for doubtful accounts | $ | 31,753 | $ | 3,563 | $ | (4,962 | ) | $ | 64 | $ | 30,418 | |||||||||
Income taxes - valuation allowance | 23,647 | 1,169 | — | (135 | ) | 24,681 | ||||||||||||||
Year ended June 30, 2012: | ||||||||||||||||||||
Allowance for doubtful accounts | $ | 32,282 | $ | 7,137 | $ | (5,285 | ) | $ | (2,381 | ) | $ | 31,753 | ||||||||
Income taxes - valuation allowance | 17,500 | 782 | — | 5,365 | 23,647 | |||||||||||||||
(1) | Charge offs, net of recoveries. |
(2) | Primarily related to foreign currency translation. For income taxes valuation allowance, also related to purchase accounting adjustments. |
111
SIGNATURES
Pursuant to the requirements of Section 13 or 15(d) of the Securities Exchange Act of 1934, the Registrant has duly caused this report to be signed on its behalf by the undersigned, thereunto duly authorized.
Date: August 22, 2014 | /s/ Peter A. Altabef |
President, Chief Executive Officer | |
Pursuant to the requirements of the Securities Exchange Act of 1934, this report has been signed below by the following persons on behalf of the Registrant, and in the capacities and on the dates indicated.
Name | Title | |||
/s/A. L. Giannopoulos | Chairman | August 22, 2014 | ||
A. L. Giannopoulos | ||||
/s/Peter A. Altabef | Director and President, Chief Executive Officer | August 22, 2014 | ||
Peter A. Altabef | ||||
/s/Louis M. Brown, Jr. | Director and Vice Chairman of the Board | August 22, 2014 | ||
Louis M. Brown, Jr. | ||||
/s/B. Gary Dando | Director | August 22, 2014 | ||
B. Gary Dando | ||||
/s/F. Suzanne Jenniches | Director | August 22, 2014 | ||
F. Suzanne Jenniches | ||||
/s/John G. Puente | Director | August 22, 2014 | ||
John G. Puente | ||||
/s/Cynthia A. Russo | Executive Vice President and Chief Financial Officer | August 22, 2014 | ||
Cynthia A. Russo | ||||
/s/Michael P. Russo | Vice President and Corporate Controller and, Principal Accounting Officer | August 22, 2014 | ||
Michael P. Russo | ||||
/s/Dwight S. Taylor | Director | August 22, 2014 | ||
Dwight S. Taylor | ||||
112
EXHIBIT INDEX
(a) Exhibits, Financial Statement Schedule:
(1) Financial Statements – See the Index to Consolidated Financial Statements on page 77
(2) Schedule II – See the Index to Consolidated Financial Statements on page 77
(3) Exhibits:
2.1 | Agreement and Plan of Merger, dated as of June 22, 2014, by and among MICROS Systems, Inc., OC Acquisition LLC, Rocket Acquisition Corporation, and Oracle Corporation is incorporated herein by reference to Exhibit 2.1 to the Current Report on Form 8-K/A filed on July 3, 2014 | |
3(i) | Restated Articles of Incorporation of the Company are incorporated herein by reference to Exhibit 3(a) to the Quarterly Report on Form 10-Q of the Company for the period ended September 30, 2013 | |
3(ii)(a) | By-laws of the Company, as amended, are incorporated herein by reference to Exhibit 99.2 to the Form 8-K filed on September 18, 2013. | |
3(ii)(b) | Amendment to the By-laws, are incorporated herein by reference to Exhibit 3.1 to the Form 8-K filed on June 24, 2014. | |
10(a)* | MICROS Systems, Inc. 1991 Stock Option Plan as amended, is incorporated herein by reference to Exhibit A to the Proxy Statement of the Company for the 2013 Annual Meeting of Shareholders. | |
10(b)* | Employment Agreement dated June 1, 1995 between MICROS Systems, Inc. and A. L. Giannopoulos is incorporated herein by reference to Exhibit 10e to the Annual Report on Form 10-K of the Company for the fiscal year ended June 30, 1995. | |
10(b)(1)* | First Amendment to Employment Agreement dated February 6, 1997 between MICROS Systems, Inc. and A. L. Giannopoulos is incorporated herein by reference to Exhibit 10 to the Quarterly Report on Form 10-Q of the Company for the period ended December 31, 1996. | |
10(b)(2)* | Second Amendment to Employment Agreement dated February 1, 1998 between MICROS Systems, Inc. and A. L. Giannopoulos is incorporated herein by reference to Exhibit 10 to the Quarterly Report on Form 10-Q of the Company for the period ended December 31, 1997. | |
10(b)(3)* | Third Amendment to Employment Agreement dated September 8, 1999 between MICROS Systems, Inc. and A. L. Giannopoulos is incorporated herein by reference to Exhibit 10g to the Annual Report on Form 10-K of the Company for the fiscal year ended June 30, 1999. | |
10(b)(4)* | Fourth Amendment to Employment Agreement dated November 19, 2001 between MICROS Systems, Inc. and A. L. Giannopoulos is incorporated herein by reference to Exhibit 10 to the Quarterly Report on Form 10-Q of the Company for the period ended December 31, 2001. | |
10(b)(5)* | Fifth Amendment to Employment Agreement dated November 15, 2002 between MICROS Systems, Inc. and A. L. Giannopoulos is incorporated herein by reference to Exhibit 10 to the Quarterly Report on Form 10-Q of the Company for the period ended December 31, 2002. | |
10(b)(6)* | Sixth Amendment to Employment Agreement dated January 28, 2004 between MICROS Systems, Inc. and A. L. Giannopoulos is incorporated herein by reference to Exhibit 10 to the Quarterly Report on Form 10-Q of the Company for the period ended December 31, 2003. | |
10(b)(7)* | Seventh Amendment to Employment Agreement dated August 9, 2005 between MICROS Systems, Inc. and A. L. Giannopoulos is incorporated herein by reference to Exhibit 10 to the Current Report on Form 8-K filed on August 11, 2005. | |
10(b)(8)* | Eighth Amendment to Employment Agreement dated June 6, 2006, between MICROS Systems, Inc. and A.L. Giannopoulos is incorporated herein by reference to Exhibit 10 to the Current Report on Form 8-K filed on June 8, 2006. | |
10(b)(9)* | Ninth Amendment to Employment Agreement dated November 17, 2006, between MICROS Systems, Inc. and A. L. Giannopoulos is incorporated herein by reference to Exhibit 10 to the Current Report on Form 8-K filed on November 21, 2006. | |
10(b)(10)* | Tenth Amendment to Employment Agreement dated June 12, 2008, between MICROS Systems, Inc. and A.L. Giannopoulos is incorporated herein by reference to Exhibit 10 to the Current Report on Form 8-K filed on June 13, 2008. | |
113
10(b)(11)* | Eleventh Amendment to Employment Agreement dated November 21, 2008, between MICROS Systems, Inc. and A.L. Giannopoulos is incorporated herein by reference to Exhibit 10.1 to the Current Report on Form 8-K filed on November 24, 2008. | |
10(b)(12)* | Twelfth Amendment to Employment Agreement dated August 27, 2010, between MICROS Systems, Inc. and A. L. Giannopoulos is incorporated herein by reference to Exhibit 10.1 to the Current Report on Form 8-K filed on August 26, 2010. | |
10(b)(13)* | Thirteenth Amendment to Employment Agreement dated December 3, 2012, between MICROS Systems, Inc. and A.L. Giannopoulos is incorporated herein by reference to Exhibit 10(a) to the Quarterly Report on Form 10-Q of the Company for the period ended December 31, 2012. | |
10(c)* | Employment Agreement dated December 3, 2012 between MICROS Systems, Inc. and Peter A. Altabef is incorporated herein by reference to Exhibit 10.1 to the Current Report on Form 8-K filed on December 23, 2012. | |
10(c)(1)* | First Amendment to Employment Agreement, dated September 17, 2013, between MICROS Systems, Inc. and Peter A. Altabef is incorporated herein by reference to Exhibit 99.1 to the Current Report on Form 8-K filed on September 18, 2013 | |
10(d)* | Employment Agreement dated May 28, 1997 between MICROS Systems, Inc. and Thomas L. Patz is incorporated herein by reference to Exhibit 10.2 to the Quarterly Report on Form 10-Q of the Company for the period ended December 31, 2012. | |
10(d)(1)* | First Amendment to Employment Agreement dated October 1, 1998 between MICROS Systems, Inc. and Thomas L. Patz is incorporated herein by reference to Exhibit 10(c)(1) to the Annual Report on Form 10-K for the fiscal year ended June 30, 2010. | |
10(d)(2)* | Second Amendment to Employment Agreement dated November 17, 2006 between MICROS Systems, Inc. and Thomas L. Patz is incorporated herein by reference to Exhibit 10 to the Current Report on Form 8-K filed on November 21, 2006. | |
10(d)(3)* | Third Amendment to Employment Agreement dated December 3, 2012, between MICROS Systems, Inc. and Thomas L. Patz is incorporated herein by reference to Exhibit 10.3 to the Quarterly Report on Form 10-Q of the Company for the period ended December 31, 2012. | |
10(e)* | Restated Supplemental Executive Retirement Plan, as approved by the Board of Directors on April 27, 2005, is incorporated herein by reference to Exhibit 10 to the Annual Report on Form 10-K for the fiscal year ended June 30, 2006. | |
10(f)* | Executive Severance Plan is incorporated herein by reference to Exhibit 99.1 to the Current Report on Form 8-K filed on May 20, 2014. | |
10(g) | Amended and Restated Credit Agreement, effective as of July 29, 2005, among MICROS Systems, Inc., DV Technology Holdings Corporation, Datavantage Corporation, MICROS Fidelio Nevada, LLC, MSI Delaware, LLC, MICROS-Fidelio Worldwide, Inc., and JTECH Communications, Inc. as Borrower, Bank of America, N.A., as administrative agent, swing line lender and L/C issuer, and Wachovia Bank, N.A., and US Bank, N.A., and Banc of America Securities LLC, as sole lead arranger and book manager, is incorporated herein by reference to Exhibit 10 to the Annual Report on Form 10-K for the fiscal year ended June 30, 2005. | |
10(g)(1) | First Amendment to Credit Agreements, dated December 11, 2008 among MICROS Systems, Inc. DV Technology Holdings Corporation, Datavantage Corporation, MICROS Fidelio Nevada, LLC, MSI Delaware, LLC, MICROS-Fidelio Worldwide, Inc., JTECH Communications, Inc., MICROS-Fidelio (Ireland) Ltd. as Guarantor, Bank of America, N.A., as Administrative Agent, and Bank of America, N.A., Wachovia Bank, N.A., and U.S. Bank, N.A., as Lenders is incorporated herein by reference to Exhibit 10(b) to the Quarterly Report on Form 10-Q of the Company for the period ended December 31, 2008. | |
10(g)(2) | Second Amendment to Credit Agreements, dated July 30, 2010 among MICROS Systems, Inc., DV Technology Holdings Corporation, Datavantage Corporation, TIG Global LLC (now named MICROS eCommerce LLC), Fry, Inc., JTECH Communications, Inc., and MICROS-Fidelio Worldwide, Inc., MICROS-Fidelio (Ireland) Ltd. as Guarantor, Bank of America, N.A., as Administrative Agent, and Bank of America, N.A., Wells Fargo, N.A., and U.S. Bank, N.A., as Lenders is incorporated herein by reference to Exhibit 10(g)(2) to the Annual Report on Form 10-K for the fiscal year ended June 30, 2010. | |
10(g)(3) | Third Amendment to Credit Agreements, dated July 30, 2013, among MICROS Systems, Inc., DV Technology Holdings Corporation, Datavantage Corporation, TIG Global LLC (now named MICROS eCommerce LLC), Fry, Inc., JTECH Communications, Inc., and MICROS-Fidelio Worldwide, Inc., MICROS-Fidelio (Ireland) Ltd. as Guarantor, Bank of America, N.A., as Administrative Agent, and Bank of America, N.A., Wells Fargo, N.A., and U.S. Bank, N.A., as Lenders is incorporated herein by reference to Exhibit 10.1 to the Annual Report on Form 10-K for the fiscal year ended June 30, 2013. | |
114
10(h) | Amended and Restated Credit Agreement, effective as of July 29, 2005, among MICROS-Fidelio (Ireland) Ltd., MICROS-Fidelio Systems (U.K.) Ltd., MICROS-Fidelio España S.L., MICROS-Fidelio (Canada), Ltd., MICROS-Fidelio Brazil, Ltda., MICROS-Fidelio France S.A.S., Hospitality Technologies, S.A., MICROS-Fidelio Mexico S.A. de C.V., MICROS Systems Holding GmbH, MICROS-Fidelio GmbH, MICROS-Fidelio Software Portugal Unipessoal Lda, MICROS-Fidelio (Thailand) Co., Ltd., MICROS-Fidelio Singapore Pte Ltd., MICROS-Fidelio Software (Philippines), Inc., MICROS-Fidelio Japan Ltd., MICROS-Fidelio Australia Pty. Ltd., MICROS-Fidelio Hong Kong, Ltd., Fidelio Nordic Norway A/S, Fidelio Nordic Oy, Fidelio Nordic Sverige, A.B., Hotelbk, A.B., as Borrower, Bank Of America, N.A., as Administrative Agent, swing line lender, and L/C issuer, and Wachovia Bank N.A. and US Bank N.A., and Banc of America Securities LLC, as sole lead arranger and book manager is incorporated herein by reference to Exhibit 10(y) to the Annual Report on Form 10-K for the fiscal year ended June 30, 2005. | |
10(h)(1) | Second Amendment to Credit Agreements, dated July 30, 2010 among MICROS-Fidelio (Ireland) Ltd., MICROS-Fidelio Systems (U.K.) Ltd., MICROS-Fidelio España S.L., MICROS-Fidelio (Canada), Ltd., MICROS-Fidelio Brazil, Ltda., MICROS-Fidelio France S.A.S., Hospitality Technologies, S.A., MICROS-Fidelio Mexico S.A. de C.V., MICROS Systems Holding GmbH, MICROS-Fidelio GmbH, MICROS-Fidelio Software Portugal Unipessoal Lda, MICROS-Fidelio (Thailand) Co., Ltd., MICROS-Fidelio Singapore Pte Ltd., MICROS-Fidelio Software (Philippines), Inc., MICROS-Fidelio Japan Ltd., MICROS-Fidelio Australia Pty. Ltd., MICROS-Fidelio Hong Kong, Ltd., MICROS-Fidelio Norway A/S, MICROS-Fidelio Finland Oy, MICROS-Fidelio Sverige, A.B., Hotelbk, A.B., as Borrower, Bank Of America, N.A., as Administrative Agent, swing line lender, and L/C issuer, and Wells Fargo N.A. and US Bank N.A., and Banc of America Securities LLC, as sole lead arranger and book manager is incorporated herein by reference to Exhibit 10(h)(1) to the Annual Report on Form 10-K for the fiscal year ended June 30, 2010. | |
10(h)(2) | Third Amendment to Credit Agreements, dated July 30, 2013, among MICROS-Fidelio (Ireland) Ltd., MICROS-Fidelio Systems (U.K.) Ltd., MICROS-Fidelio España S.L., MICROS-Fidelio (Canada), Ltd., MICROS-Fidelio Brazil, Ltda., MICROS-Fidelio France S.A.S., Hospitality Technologies, S.A., MICROS-Fidelio Mexico S.A. de C.V., MICROS Systems Holding GmbH, MICROS-Fidelio GmbH, MICROS-Fidelio Software Portugal Unipessoal Lda, MICROS-Fidelio (Thailand) Co., Ltd., MICROS-Fidelio Singapore Pte Ltd., MICROS-Fidelio Software (Philippines), Inc., MICROS-Fidelio Japan Ltd., MICROS-Fidelio Australia Pty. Ltd., MICROS-Fidelio Hong Kong, Ltd., MICROS-Fidelio Norway A/S, MICROS-Fidelio Finland Oy, MICROS-Fidelio Sverige, A.B., Hotelbk, A.B., as Borrower, Bank Of America, N.A., as Administrative Agent, swing line lender, and L/C issuer, and Wells Fargo N.A. and US Bank N.A. is incorporated herein by reference to Exhibit 10.2 to the Annual Report on Form 10-K for the fiscal year ended June 30, 2013. | |
10(i) | Lease Agreement by and between Orix Columbia, Inc. and MICROS Systems, Inc., dated August 17, 1998, with respect to the Company’s corporate headquarters located at 7031 Columbia Gateway Dr., Columbia MD 21046-2289, as amended by a First Amendment to Lease, dated October 27, 1999, a Second Amendment to Lease, dated December 26, 2001, and a Third Amendment to Lease, dated March 1, 2006 and by and between MICROS Systems, Inc. and Columbia Gateway Office Corporation as successor in interest to Orix Columbia, Inc. is incorporated herein by reference to Exhibit 10 to the Quarterly Report on Form 10-Q of the Company for the period ended March 31, 2009. | |
10(j) | Manufacturing Agreement, by and between MICROS Systems, Inc., and GES Singapore Pte Ltd. (now known as Venture Group of Singapore), with an effective date of November 6, 2002 (incorporated herein by reference to Exhibit 10(j) to the Annual Report on Form 10-K for the fiscal year ended June 30, 2009) | |
14 | Code of Ethics and Business Practices is incorporated herein by reference to Exhibit 14 to the Annual Report on Form 10-K of the Company for the fiscal year ended June 30, 2004. | |
21 | Subsidiaries of the Company (filed herewith) | |
23 | Consent of PricewaterhouseCoopers LLP (filed herewith) | |
31(a) | Certification of Principal Executive Officer pursuant to Rule 13a-14(a) under the Securities Exchange Act of 1934 (filed herewith) | |
31(b) | Certification of Principal Financial Officer pursuant to Rule 13a-14(a) under the Securities Exchange Act of 1934 (filed herewith) | |
32(a) | Certification of Principal Executive Officer pursuant to Rule 13a-14(b) under the Securities Exchange Act of 1934 and 18 U.S.C. 1350 (furnished herewith) | |
32(b) | Certification of Principal Financial Officer pursuant to Rule 13a-14(b) under the Securities Exchange Act of 1934 and 18 U.S.C. 1350 (furnished herewith) | |
* Management contract or compensatory plan or arrangement.
115